Ultra Series Fund | December 31, 2010
Table of Contents
| | Page |
| Management’s Discussion of Fund Performance | |
| Economic Overview | 2 |
| Outlook | 2 |
| Conservative Allocation Fund | 4 |
| Moderate Allocation Fund | 6 |
| Aggressive Allocation Fund | 8 |
| Money Market Fund | 10 |
| Bond Fund | 12 |
| High Income Fund | 14 |
| Diversified Income Fund | 16 |
| Equity Income Fund | 18 |
| Large Cap Value Fund | 20 |
| Large Cap Growth Fund | 22 |
| Mid Cap Fund | 24 |
| Small Cap Fund | 26 |
| International Stock Fund | 28 |
| Target Retirement 2020 Fund | 30 |
| Target Retirement 2030 Fund | 32 |
| Target Retirement 2040 Fund | 34 |
| Notes to Management’s Discussion of Fund Performance | 36 |
| Portfolios of Investments | |
| Conservative Allocation Fund | 38 |
| Moderate Allocation Fund | 39 |
| Aggressive Allocation Fund | 40 |
| Money Market Fund | 41 |
| Bond Fund | 42 |
| High Income Fund | 45 |
| Diversified Income Fund | 48 |
| Equity Income Fund | 51 |
| Large Cap Value Fund | 53 |
| Large Cap Growth Fund | 54 |
| Mid Cap Fund | 55 |
| Small Cap Fund | 56 |
| International Stock Fund | 58 |
| Target Retirement 2020 Fund | 60 |
| Target Retirement 2030 Fund | 61 |
| Target Retirement 2040 Fund | 62 |
| Financial Statements | |
| Statements of Assets and Liabilities | 63 |
| Statements of Operations | 66 |
| Statements of Changes in Net Assets | 69 |
| Financial Highlights | 75 |
| Notes to Financial Statements | 91 |
| Report of Independent Registered Public Accounting Firm | 109 |
| Other Information | 110 |
| Trustees and Officers | 115 |
Nondeposit investment products are not federally insured, involve investment risk, may lose value and are not obligations of or guaranteed by any financial institution. For more complete information about Ultra Series Fund, including charges and expenses, request a prospectus from your financial advisor or from CUNA Mutual Insurance Society, 2000 Heritage Way, Waverly, IA 50677. Consider the investment objectives, risks, and charges and expenses of any fund carefully before investing. The prospectus contains this and other information about the investment company. For more current Ultra Series Fund performance information, please call 1-800-670-3600. Current performance may be lower or higher than the performance data quoted within. Past performance does not guarantee future results. Nothing in this report represents a recommendation of a security by the investment adviser. Portfolio holdings may have changed since the date of this report.
Ultra Series Fund | December 31, 2010
Management’s Discussion of Fund Performance
ECONOMIC OVERVIEW
With returns of all the major U.S. stock indices up strongly, 2010 will be remembered as a good year for stock investors. The S&P 500 finished with a total return of 15.1% and mid-cap and small-cap indices outpaced the broader indices, with returns well above 20%. But these returns were mostly a late-year phenomenon and it is easy to forget how rocky returns were for much of the period. After a rally in March and April, investors began to get nervous. The spreading sovereign debt crisis in Europe helped generate widespread fears of a double-dip recession. Throughout much of the summer the S&P 500, widely regarded as the best proxy for the U.S. stock market in general, was showing negative returns for the year.
Within the bond markets, we began this one-year period with a welcome calm. The yield curve was relatively stable, market volatility had moderated, and long-term yields marched higher. In this environment investors turned their attention to debating economic fundamentals while weighing the sustainability of the recent economic upturn. This atmosphere of calm belied persistent and fundamental economic challenges. The housing market continued to struggle, unemployment was persistently high, and European governments came under pressure. Despite these clouds, higher-risk U.S. bonds continued to lead the market.
Fear reemerged in the financial markets during the second quarter of 2010. After nearly a year of consistent gains from risk sectors (stocks, corporate bonds), turmoil in the European Union among sovereign bond issuers and the banks that finance them caused investors to seek the relative safety of the highest quality investments. In the U.S., that meant a sharp rally in Treasury yields, widening risk premiums on corporate bonds and declines in the broad equity indices. Just as the opening mood of the year had dissipated, this atmosphere of fear proved to be short lived as well.
In the year’s final quarter, just as economic indicators began to allay fears of a double-dip recession, the Federal Reserve Board sparked additional confidence with another round of quantitative easing, which became known as QEII. Bernanke essentially linked the Fed’s considerable monetary easing to an anticipated (or at least hoped for) rise in stock prices, which would in turn boost consumer confidence and ultimately spending. It seemed to work in the latter part of 2010, with the S&P 500 advancing 10.8% during the fourth quarter of 2010.
While the economy was not actually strong by historic norms, and the recovery remained sub-par, the probability of recession and deflation became increasingly unlikely. In addition, Europe was straddled with sovereign debt concerns, Japan remained mired in a weak growth/high deficit environment, and China was putting on the economic brakes to contain emerging inflation which provided further support for U.S. financial assets. From the lows in long-term yields in early October, interest rates rose nearly a full percentage point, driving down the value of existing bonds and muting bond returns for the one-year period.
OUTLOOK
Looking forward, we are encouraged by recent economic data. It would appear that moderate economic growth is in the cards for at least the first half of 2011. Generally, this would be considered a good backdrop for investors. Nonetheless, significant and cautionary macroeconomic issues
Ultra Series Fund | Management’s Discussion of Fund Performance | December 31, 2010
Outlook (concluded)
persist. Housing market data continues to disappoint. European sovereign debt issues remain while domestically, state and local governments struggle to meet their financial obligations. As with past economic recoveries, the economic data will likely be volatile and capital markets will respond similarly. Ironically, one of our current concerns is the level of investor complacency that has returned to financial markets. Current stock sentiment is strongly bullish, while volatility has declined to near three-year lows; from our perspective, this is cause for some short-term caution. Despite the jump in bond yields during the fourth quarter, long-term interest rates remain well below our estimate of fair value and we enter 2011 with a conservative bias.
Ultra Series Fund | Management’s Discussion of Fund Performance | December 31, 2010
CONSERVATIVE ALLOCATION FUND
INVESTMENT STRATEGY HIGHLIGHTS
The Ultra Series Conservative Allocation Fund invests primarily in shares of registered investment companies (the "underlying funds"). The fund will be diversified among a number of asset classes and its allocation among underlying funds will be based on an asset allocation model developed by Madison Asset Management, LLC ("Madison"), the fund’s investment adviser.
The team may use multiple analytical approaches to determine the appropriate asset allocation:
| | •Asset allocation optimization analysis – considers the degree to which returns in different asset classes do or do not move together, and the fund’s aim to achieve a favorable overall risk profile for any targeted portfolio return. |
| | •Scenario analysis – historical and expected return data is analyzed to model how individual asset classes and combinations of asset classes would affect the fund under different economic and market conditions. |
| | •Fundamental analysis – draws upon Madison’s investment teams to judge each asset class against current and forecasted market condi-tions. Economic, industry and security analysis is used to develop return and risk expectations that may influence asset class selection. |
In addition, Madison employs a risk management sleeve within the fund for the purpose of risk reduction when and if conditions exist that require reduction of equity exposure.
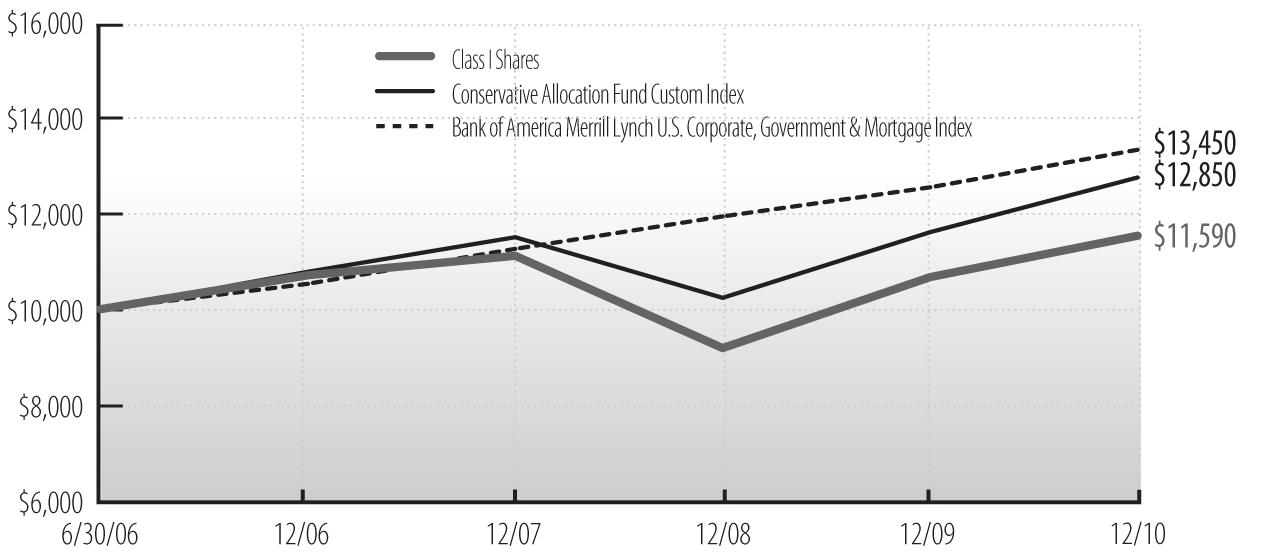
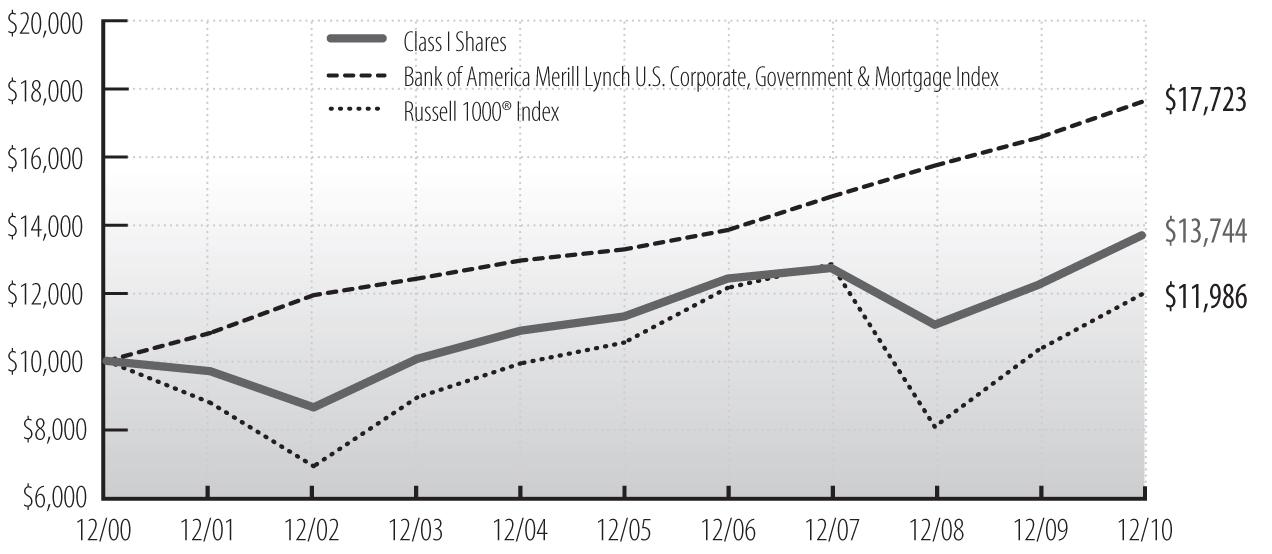
Cumulative Performance of $10,000 Investment Since Inception1,2
Average Annual Total Return through December 31, 20101 |
| | | | | |
| Class I Shares | 8.37% | 1.28% | 3.33% | — |
| Class II Shares | 8.10 | — | — | 13.86% |
| Conservative Allocation Fund Custom Index | 10.15 | 3.60 | 5.72 | 14.52 |
| Bank of America Merrill Lynch U.S. Corporate, Government & Mortgage Index | 6.43 | 5.96 | 6.79 | 6.85 |
See accompanying Notes to Management’s Discussion of Fund Performance.
Ultra Series Fund | Management’s Discussion of Fund Performance | December 31, 2010
Conservative Allocation Fund (concluded)
2010 proved to be a very positive year for asset allocation funds. Returns for the year across asset classes were far from uniform. U.S. stocks, as measured by the Russell 3000¨ Index, finished the year up 16.9%, the international equity MSCI EAFE Index returned 8.2%, and the Barclays U.S. Aggregate Bond Index gained 6.5%. However, within each of these asset classes the underlying returns where largely skewed in favor of the riskier stocks and bonds. Here in the U.S., high beta stocks outgained lower beta and high quality stocks by a very wide margin. The same was true for capitalization size where small caps, generally regarded as lower in quality, outpaced large caps by over 11%. In bond land, "junk" bonds returned nearly 9% more than the investment grade Barclays U.S. Aggregate Bond Index. In short, it was a risk takers market in asset allocation for 2010.
PORTFOLIO ALLOCATION AS A PERCENTAGE OF NET ASSETS AS OF 12/31/10 |
| Bond Funds | 59% |
| Foreign Bond Funds | 8% |
| Stock Funds | 26% |
| Foreign Stock Funds | 5% |
| Money Market Funds and Other Net Assets | 2% |
For the twelve-month period ended December 31, 2010, the Ultra Series Conservative Allocation Fund returned 8.37% (Class I shares), underperforming our Conservative Allocation Custom Index return of 10.15%. The fund’s relative underperformance was attributed to our risk aware posturing and preference for higher quality large cap equities. Despite our preference for higher quality investments, the fund was boosted by moderate positions in some higher risk bond funds with Templeton Global Bond Fund up 13.0% for the year, MEMBERS High Yield Bond Fund Class Y up 11.7%, and PIMCO Investment Grade Corporate Bond Fund up 11.7%. Detractors from performance relative to the index included Madison Mosaic Institutional Bond Fund which returned 4.4% for the year, MEM BERS Bond Fund Class Y which returned 4.9%, and MEMBERS International Stock Fund Class Y which returned 6.5%.
Overall, despite the fund’s relative underperformance, we were pleased with the fund’s absolute return given the moderate level of risk taken. In short, we believe the fund is well-positioned for the economic environment that we are encountering – an economy showing emerging signs of gaining some sustainable traction combined with atypically elevated downside risk potential.
Notable additions to the fund’s holdings this year were: PIMCO Investment Grade Corporate Bond Fund and Madison Mosaic Disciplined Equity Fund. Sold from the portfolio during 2010 were: Dodge & Cox Income Fund and Fairholme Fund.
Ultra Series Fund | Management’s Discussion of Fund Performance | December 31, 2010
MODERATE ALLOCATION FUND
INVESTMENT STRATEGY HIGHLIGHTS
The Ultra Series Moderate Allocation Fund invests primarily in shares of registered investment companies (the "underlying funds"). The fund will be diversified among a number of asset classes and its allocation among underlying funds will be based on an asset allocation model developed by Madison Asset Management, LLC ("Madison"), the fund’s investment adviser.
The team may use multiple analytical approaches to determine the appropriate asset allocation:
| | •Asset allocation optimization analysis – considers the degree to which returns in different asset classes do or do not move together, and the fund’s aim to achieve a favorable overall risk profile for any targeted portfolio return. |
| | •Scenario analysis – historical and expected return data is analyzed to model how individual asset classes and combinations of asset classes would affect the fund under different economic and market conditions. |
| | •Fundamental analysis – draws upon Madison’s investment teams to judge each asset class against current and forecasted market conditions. Economic, industry and security analysis is used to develop return and risk expectations that may influence asset class selection. |
In addition, Madison employs a risk management sleeve within the fund for the purpose of risk reduction when and if conditions exist that require reduction of equity exposure.
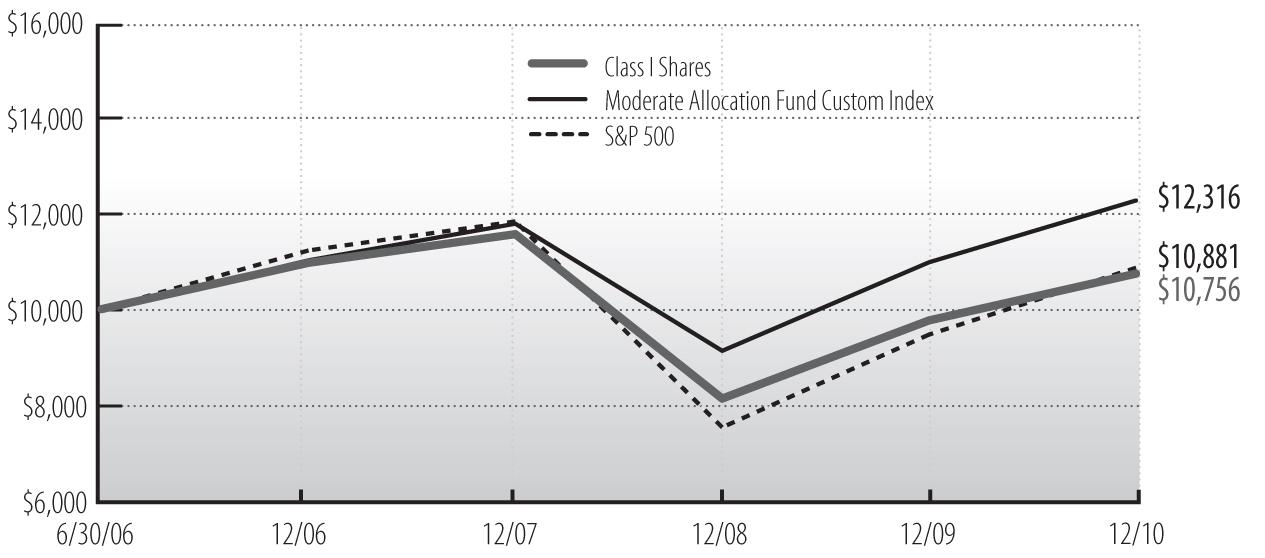
Cumulative Performance of $10,000 Investment Since Inception1,2
Average Annual Total Return through December 31, 20101 |
| | | | | |
| Class I Shares | 10.22% | -2.48% | 1.63% | — |
| Class II Shares | 9.94 | — | — | 17.34% |
| Moderate Allocation Fund Custom Index | 11.97 | 1.38 | 4.73 | 20.16 |
| S&P 500 Index | 15.06 | -2.86 | 1.89 | 27.07 |
See accompanying Notes to Management’s Discussion of Fund Performance.
Ultra Series Fund | Management’s Discussion of Fund Performance | December 31, 2010
Moderate Allocation Fund (concluded)
2010 proved to be a very positive year for asset allocation funds. Returns for the year across asset classes were far from uniform. U.S. stocks, as measured by the Russell 3000¨ Index, finished the year up 16.9%, the international equity MSCI EAFE Index returned 8.2%, and the Barclays U.S. Aggregate Bond Index gained 6.5%. However, within each of these asset classes the underlying returns where largely skewed in favor of the riskier stocks and bonds. Here in the U.S., high beta stocks outgained lower beta and high quality stocks by a very wide margin. The same was true for capitalization size where small caps, generally regarded as lower in quality, outpaced large caps by over 11%. In bond land, "junk" bonds returned nearly 9% more than the investment grade Barclays U.S. Aggregate Bond Index. In short, it was a risk takers market in asset allocation for 2010.
PORTFOLIO ALLOCATION AS A PERCENTAGE OF NET ASSETS AS OF 12/31/10 |
| Bond Funds | 34% |
| Foreign Bond Funds | 5% |
| Stock Funds | 49% |
| Foreign Stock Funds | 10% |
| Money Market Funds and Other Net Assets | 2% |
For the twelve-month period ended December 31, 2010, the Ultra Series Moderate Allocation Fund returned 10.22% (Class I shares), underperforming our Moderate Allocation Custom Index return of 11.97%. The fund’s relative underperformance was attributed to our risk aware posturing and preference for higher quality large cap equities. Despite our preference for higher quality investments, the fund was boosted by modest positions in small and mid caps with MEMBERS Small Cap Fund Class Y up 25.6% for the year and MEMBERS Mid Cap Fund Class Y up 19.6%. Detractors from relative performance included Madison Mosaic Institutional Bond Fund which returned 4.4% for the year, MEMBERS Bond Fund Class Y which returned 4.9%, MEMBERS International Stock Fund Class Y whic h returned 6.5%, and MEMBERS Large Cap Value Fund Class Y which returned 8.3%.
Overall, despite the fund’s relative underperformance, we were pleased with the fund’s absolute return given the moderate level of risk taken. In short, we believe the fund is well-positioned for the economic environment that we are encountering – an economy showing emerging signs of gaining some sustainable traction combined with atypically elevated downside risk potential.
Notable additions to the fund’s holdings this year were: PIMCO Investment Grade Corporate Bond Fund, T. Rowe Price New Era Fund, Matthews Asian Growth & Income Fund, and Yacktman Fund. Sold from the portfolio during 2010 were: Dodge & Cox Income Fund and Fairholme Fund.
Ultra Series Fund | Management’s Discussion of Fund Performance | December 31, 2010
AGGRESSIVE ALLOCATION FUND
INVESTMENT STRATEGY HIGHLIGHTS
The Ultra Series Aggressive Allocation Fund invests primarily in shares of registered investment companies (the "underlying funds"). The fund will be diversified among a number of asset classes and its allocation among underlying funds will be based on an asset allocation model developed by Madison Asset Management, LLC ("Madison"), the fund’s investment adviser.
The team may use multiple analytical approaches to determine the appropriate asset allocation:
| | •Asset allocation optimization analysis – considers the degree to which returns in different asset classes do or do not move together, and the fund’s aim to achieve a favorable overall risk profile for any targeted portfolio return. |
| | •Scenario analysis – historical and expected return data is analyzed to model how individual asset classes and combinations of asset classes would affect the fund under different economic and market conditions. |
| | •Fundamental analysis – draws upon Madison’s investment teams to judge each asset class against current and forecasted market conditions. Economic, industry and security analysis is used to develop return and risk expectations that may influence asset class selection. |
In addition, Madison employs a risk management sleeve within the fund for the purpose of risk reduction when and if conditions exist that require reduction of equity exposure.
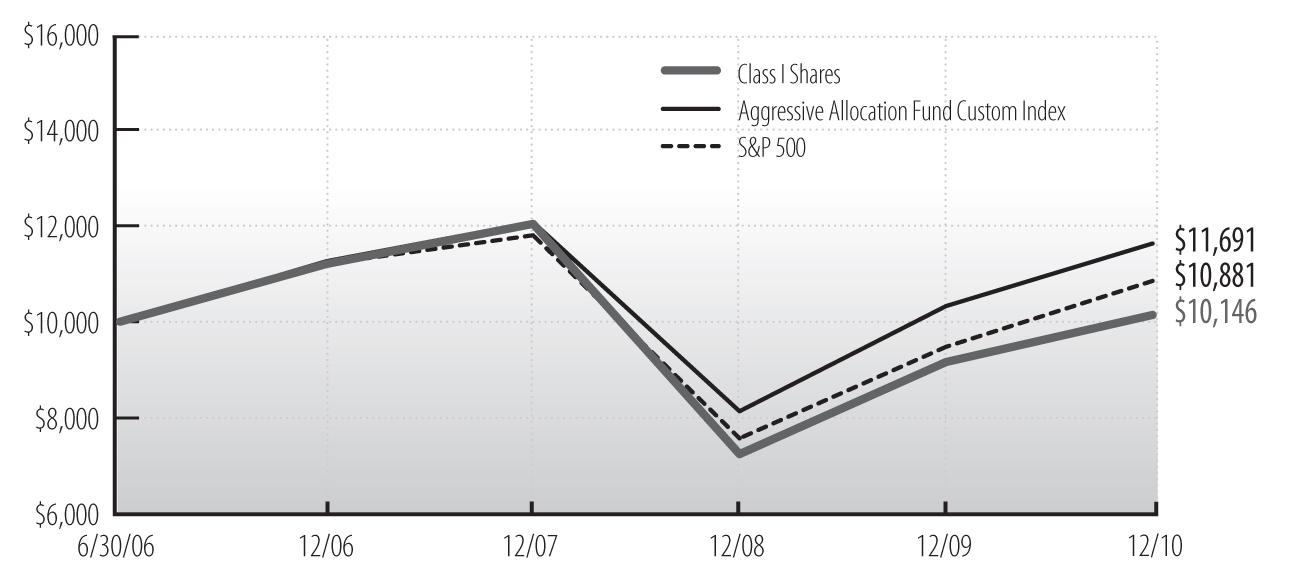
Cumulative Performance of $10,000 Investment Since Inception1,2
Average Annual Total Return through December 31, 20101 |
| | | | | |
| Class I Shares | 11.15% | -5.74% | 0.32% | — |
| Class II Shares | 10.87 | — | — | 21.62% |
| Aggressive Allocation Fund Custom Index | 13.09 | -1.28 | 3.53 | 25.89 |
| S&P 500 Index | 15.06 | -2.86 | 1.89 | 27.07 |
See accompanying Notes to Management’s Discussion of Fund Performance.
Ultra Series Fund | Management’s Discussion of Fund Performance | December 31, 2010
Aggressive Allocation Fund (concluded)
2010 proved to be a very positive year for asset allocation funds. Returns for the year across asset classes were far from uniform. U.S. stocks, as measured by the Russell 3000¨ Index, finished the year up 16.9%, the international equity MSCI EAFE Index returned 8.2%, and the Barclays U.S. Aggregate Bond Index gained 6.5%. However, within each of these asset classes the underlying returns where largely skewed in favor of the riskier stocks and bonds. Here in the U.S., high beta stocks outgained lower beta and high quality stocks by a very wide margin. The same was true for capitalization size where small caps, generally regarded as lower in quality, outpaced large caps by over 11%. In bond land, "junk" bonds returned nearly 9% more than the investment grade Barclays U.S. Aggregate Bond Index. In short, it was a risk takers market in asset allocation for 2010.
PORTFOLIO ALLOCATION AS A PERCENTAGE OF NET ASSETS AS OF 12/31/10 |
| Bond Funds | 7% |
| Foreign Bond Funds | 3% |
| Stock Funds | 74% |
| Foreign Stock Funds | 14% |
| Money Market Funds and Other Net Assets | 2% |
For the twelve-month period ended December 31, 2010, the Ultra Series Aggressive Allocation Fund returned 11.15% (Class I shares), underperforming our Aggressive Allocation Custom Index return of 13.09%. The fund’s relative underperformance was attributed to our risk aware posturing and preference for higher quality large cap equities. Despite our preference for relatively higher quality investments, the fund was boosted by modest positions in small and mid caps with MEMBERS Small Cap Fund Class Y up 25.6% for the year and MEMBERS Mid Cap Fund Class Y up 19.6%. Also contributing positively to the fund’s return was our dedicated energy and natural resources position, T. Rowe Price New Era Fund which returned 21.0%. Detractors from relative performan ce included Hussman Strategic Growth Fund which returned -3.6% for the year, MEMBERS Bond Fund Class Y which returned 4.9%, MEMBERS International Stock Fund Class Y which returned 6.5%, and MEMBERS Large Cap Value Fund Class Y which returned 8.3%.
Overall, despite the fund’s relative underperformance, we were pleased with the fund’s absolute return given the moderate level of risk taken for an aggressive fund. In short, we believe the fund is well-positioned for the economic environment that we are encountering – an economy showing emerging signs of gaining some sustainable traction combined with atypically elevated downside risk potential.
Notable additions to the fund’s holdings this year were: PIMCO Investment Grade Corporate Bond Fund, T. Rowe Price New Era Fund, Matthews Asian Growth & Income Fund, and Yacktman Fund. Fairholme Fund was sold from the portfolio during 2010.
Ultra Series Fund | Management’s Discussion of Fund Performance | December 31, 2010
INVESTMENT STRATEGY HIGHLIGHTS
The Ultra Series Money Market Fund invests exclusively in U.S. dollar-denominated money market securities maturing in thirteen months or less from the date of purchase. These securities will be obligations of the U.S. Government and its agencies and instrumentalities, but may also include securities issued by U.S. and foreign financial institutions, corporations, municipalities, foreign governments, and multi-national organizations, such as the World Bank. The fund may invest in mortgage-backed and asset-backed securities, including those representing pools of mortgage, commercial, or consumer loans originated by credit unions or other financial institutions.
PORTFOLIO ALLOCATION AS A PERCENTAGE OF NET ASSETS AS OF 12/31/10 |
| Fannie Mae | 27% |
| Federal Home Loan Bank | 26% |
| Freddie Mac | 24% |
| U.S. Treasury Bills | 8% |
| Commercial Paper | 13% |
| Cash and Other Net Assets | 2% |
Ultra Series Fund | Management’s Discussion of Fund Performance | December 31, 2010
This page was intentionally left blank.
Ultra Series Fund | Management’s Discussion of Fund Performance | December 31, 2010
INVESTMENT STRATEGY HIGHLIGHTS
Under normal circumstances, the Ultra Series Bond Fund invests at least 80% of its assets in bonds. To keep current income relatively stable and to limit share price volatility, the fund emphasizes investment grade securities and maintains an intermediate (typically 3-6 year) average portfolio duration (a measure of a security’s price sensitivity to changes in interest rates). The fund also strives to minimize risk in the portfolio by making strategic decisions relating to credit risk and yield curve outlook. The fund may invest in corporate debt securities, U.S. Government debt securities, foreign government debt securities, non-rated debt securities, and asset-backed, mortgage-backed and commercial mortgage-backed securities.
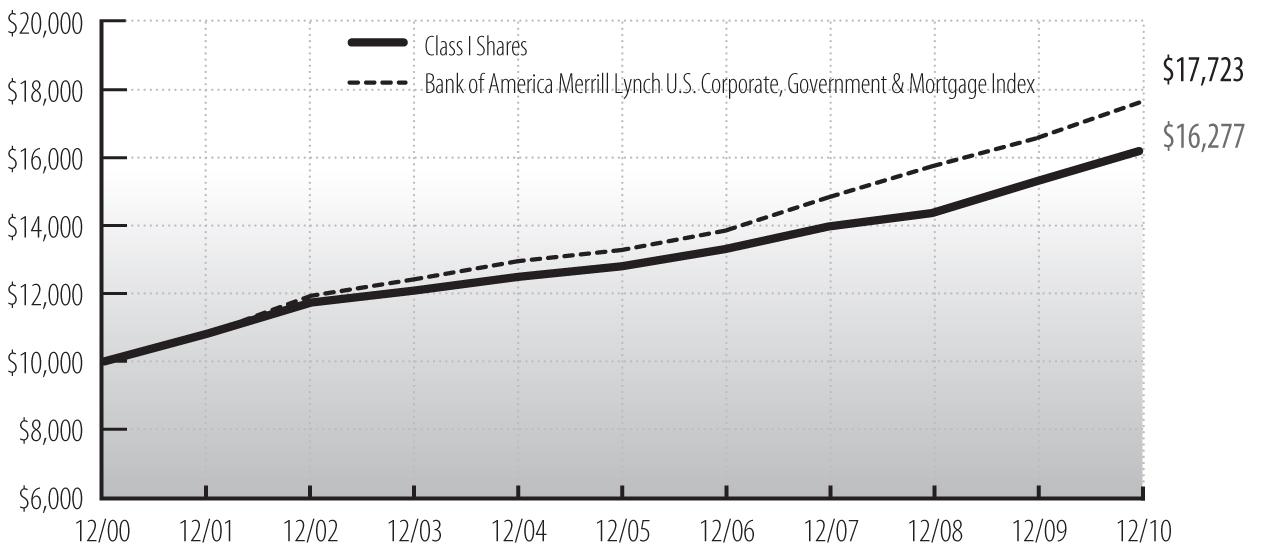
Cumulative Performance of $10,000 Investment Since Inception1
Average Annual Total Return through December 31, 20101 |
| | | | | | |
| Class I Shares | 5.92% | 5.08% | 4.86% | 4.99% | — |
| Class II Shares | 5.66 | — | — | — | 6.74% |
| Bank of America Merrill Lynch U.S. Corporate, Government & Mortgage Index | 6.43 | 5.96 | 5.87 | 5.89 | 6.85 |
See accompanying Notes to Management’s Discussion of Fund Performance.
During the twelve-month period ended December 31, 2010, at times it seemed as if the bond market was playing a game of "gotcha." During much of the middle of the period, the market built in an increased probability of a very soft economy and possible double dip recession. Interest rates rallied and spread products such as mortgage pass-throughs and corporate bonds showed some signs of spread widening. During the fourth quarter of 2010 that largely reversed as data appeared to gradually erase those concerns. We seemed to be more in a range trade that might broadly be defined by yields on the ten year Treasury of 2½ to 4%.
Ultra Series Fund | Management’s Discussion of Fund Performance | December 31, 2010
Bond Fund (concluded)
In the final quarter of the period, we believed three events affected market perceptions the most. The first being the November elections. We believed the market interpreted the results causing the government to adopt a more business and economy friendly posture. The ultimate manifestation of that was the agreement in December to extend the "Bush" tax cuts, thereby removing concerns that tax policy would act as a deterrent to growth in the near term. Second, at almost the same time the Fed officially announced it would implement what has become known as QEII, a program to purchase an additional $600 billion of Treasury securities. This clearly signaled a ‘risk on’ trade for risk assets in the mind of the market. It may well have also caused the mar kets to expect increasing inflation expectations which are to some degree evident in the pricing of TIPS (Treasury inflation protected securities). Broadly speaking, both of these events therefore drove interest rates higher. There was an offsetting force: the turmoil in Europe. The bailouts of banking systems in both Ireland and previously Greece raised doubts with regard to the longer term sustainability of the economic and monetary union and European Union. This to a degree capped the risk trade and reminded investors of the safe(r) haven status of the dollar and U.S. Treasuries.
With all the twists and turns, 2010 still turned in a decent year for the portfolio and the market. During the course of the year ten-year Treasury yields declined from 3.84% to 3.29% while two-year Treasuries experienced a similar yield decline from 1.13% to 0.59%. Additionally, spread sectors such as corporate and mortgage securities benefitted from both their incremental yield and yield spread compression to meaningfully outperform Treasuries. As was the case in 2009, the further down the quality spectrum, the better the performance. High yield earned 9.8% in excess of what Treasuries of comparable duration earned. With BBB rated securities, the excess return was 4% while AA rated corporate securities earned ‘only’ 1.5% more than Treasuries. As noted above, the Fed yelled ‘risk on’ and the markets bought it. We do not believe this can be maintained indefinitely and anticipate some correction during 2011.
PORTFOLIO ALLOCATION AS A PERCENTAGE OF NET ASSETS AS OF 12/31/10 |
| Asset Backed | 2% |
| Corporate Notes and Bonds | 26% |
| Mortgage Backed | 24% |
| U.S. Government and Agency Obligations | 44% |
| Cash and Other Net Assets | 4% |
For the twelve-month period ended December 31, 2010 the Ultra Series Bond Fund returned 5.92% (Class I shares) while the Bank of America Merrill Lynch U.S. Corporate, Government & Mortgage Index returned 6.43%. For the year, performance was negatively impacted the most by factors including the fund’s shorter duration, i.e., less interest rate risk, and to a lesser extent having an underweight position versus the index in mortgage securities and financials. These factors were somewhat offset from having an overweight position versus the index in both corporate bonds in general and BBB rated bonds in particular.
Ultra Series Fund | Management’s Discussion of Fund Performance | December 31, 2010
INVESTMENT STRATEGY HIGHLIGHTS
The Ultra Series High Income Fund invests primarily in lower-rated, higher-yielding income bearing securities, such as "junk" bonds. Because the performance of these securities has historically been strongly influenced by economic conditions, the fund may emphasize security selection in business sectors that favor the economic outlook. Under normal market conditions, the fund invests at least 80% of its assets in bonds rated lower than investment grade (BBB/Baa) and their unrated equivalents or other high-yielding securities.
Cumulative Performance of $10,000 Investment Since Inception1
Average Annual Total Return through December 31, 20101 |
| | | | | | | |
| Class I Shares | 11.73% | 8.55% | 7.37% | 7.24% | 7.12% | — |
| Class II Shares | 11.45 | — | — | — | — | 17.50% |
| Bank of America Merrill Lynch U.S. High Yield Master II Constrained Index | 15.07 | 10.36 | 8.83 | 8.75 | 8.37 | 29.93 |
See accompanying Notes to Management’s Discussion of Fund Performance.
The high yield market generated solid returns for the twelve-month period ended December 31, 2010, as the Bank of America Merrill Lynch U.S. High Yield Master II Constrained Index gained 15.07%. The combination of lower default rates, significant refinancing activity and investor focus on yield enhancing strategies were key ingredients to the high yield market’s rally. Over the past twelve months, the U.S. economy has slowly begun to heal as GDP growth turned positive. Moreover, during the last month of the reporting period it became clear that investor sentiment has rotated from a period of "post recession anxiety" to a focus on "post recession recovery."
Ultra Series Fund | Management’s Discussion of Fund Performance | December 31, 2010
High Income Fund (concluded)
The technical underpinnings of the high yield market remained solid for most of the past twelve months as record new issuance was readily absorbed by investors’ near insatiable demand for income producing assets. During the reporting period, high yield new issue supply set an all-time record as 653 new issues, totaling $302 billion, flooded the market. The vast majority of the new issuance was used to refinance existing debt. The significant access to capital for high yield issuers was a key contributor to lower default expectations. In fact, default rates declined further during the reporting period with Moody’s calculating a latest twelve month trailing default rate of 3.1% as of December 31, 2010.
SECTOR ALLOCATION AS A PERCENTAGE OF NET ASSETS |
Consumer Discretionary | 30% |
| Consumer Staples | 6% |
| Energy | 8% |
| Financials | 2% |
| Health Care | 8% |
| Industrials | 17% |
| Information Technology | 6% |
| Materials | 6% |
| Telecommunication Services | 7% |
| Utilities | 5% |
| Cash and Other Net Assets | 5% |
Consumer Discretionary includes securities in the following industries: Auto Components; Consumer Finance; Hotels, Restaurants & Leisure; Household Durables; Leisure Equipment & Products; Media;Multiline Retail; Specialty Retail; and Textiles, Apparel & Luxury Goods. |
The Ultra Series High Income Fund gained 11.73% (Class I shares) for the twelve-month period ended December 31, 2010. For the same time period, the Bank of America Merrill Lynch U.S. High Yield Master II Constrained Index returned 15.07%. Detracting from the fund’s relative performance versus the index was the portfolio’s significant underweight position in the Financial sector (2.1% vs. 11.4%), and significant underweight position in Discount Bonds (0.5% vs. 5.6%), as these two sectors were among the best performing sectors within the Bank of America Merrill Lynch U.S. High Yield Master II Constrained Index. Also detracting from the performance was the fund’s average cash weighting of approximately 2.6% during the period. Key contributors to the fund’s strong absolute performance during the reporting period were the fund’s bond holdings in the automotive, gaming, industrial and broadcast areas. Each of these industry holdings gained over 14.5% during the period. The fund’s convertible holdings also generated strong returns during the period, in excess of 19%.
Over the last twelve months, the fund was an active participant in the new issue market by adding 46 new issues to the portfolio. The fund also increased its weighting in convertible bonds during the reporting period and its exposure to the Health Care, Media and Energy sectors. During the reporting period, the average price of the fund’s securities increased from $100.25 to $103.66, while the average credit rating remained at B/B2. At period end, the portfolio had no securities with a price less than $89. The top five industry weightings as of December 31, 2010 were Support Services, Health Care, Telecom, Diversified Media and Energy.
Ultra Series Fund | Management’s Discussion of Fund Performance | December 31, 2010
INVESTMENT STRATEGY HIGHLIGHTS
The Ultra Series Diversified Income Fund seeks income by investing in a broadly diversified array of securities including bonds, common stocks, real estate securities, foreign market bonds and stocks and money market instruments. Bonds, stock and cash components will vary, reflecting the portfolio managers’ judgments of the relative availability of attractively yielding and priced stocks and bonds. Generally, however, bonds will constitute up to 80% of the fund’s assets, stocks will constitute up to 60% of the fund’s assets, real estate securities will constitute up to 25% of the fund’s assets, foreign stocks and bonds will constitute up to 25% of the fund’s assets and money market instruments may constitute up to 25% of the fund& #8217;s assets. The fund intends to limit the investment in lower credit quality bonds to less than 50% of the fund’s assets. The balance between the two strategies of the fund (fixed income and equity investing) is determined after reviewing the risks associated with each type of investment, with the goal of meaningful risk reduction as market conditions demand. The fund typically sells a stock when the fundamental expectations for producing competitive yields at an acceptable level of price risk no longer apply, the price exceeds the intrinsic value or other stocks appear more attractive.
Cumulative Performance of $10,000 Investment Since Inception1
Average Annual Total Return through December 31, 20101 |
| | | | | | |
| Class I Shares | 12.04% | 2.48% | 3.95% | 3.23% | — |
| Class II Shares | 11.77 | — | — | — | 15.86% |
| Bank of America Merrill Lynch U.S. Corporate, Government & Mortgage Index | 6.43 | 5.96 | 5.87 | 5.89 | 6.85 |
| Russell 1000¨ Index | 16.10 | -2.37 | 2.59 | 1.83 | 28.07 |
See accompanying Notes to Management’s Discussion of Fund Performance.
Ultra Series Fund | Management’s Discussion of Fund Performance | December 31, 2010
Diversified Income Fund (concluded)
2010 was a year that can be divided into thirds. During the first third of the year, the Russell 1000¨ Index rose at its high by about 10%. Riskier assets were greatly sought after as the "risk-on" trade was in favor. During the second third, or middle of the year, the Russell 1000¨ Index corrected by over 15% at its low as the economy faltered, and the "risk-off" trade was back in favor. In the final third of the year, when the Fed’s QE2 program was put into action, the Russell 1000¨ Index rallied by 25% through year-end, as the "risk-on" trade was once again back in favor.
PORTFOLIO ALLOCATION AS A PERCENTAGE OF NET ASSETS AS OF 12/31/10 |
| Asset Backed | 1% |
| Common Stocks | 52% |
| Corporate Notes and Bonds | 19% |
| Mortgage Backed | 11% |
| U.S. Government and Agency Obligations | 13% |
| Cash and Other Net Assets | 4% |
For the twelve-month period ended December 31, 2010, the Ultra Series Diversified Income Fund returned 12.04% (Class I shares), while the Bank of America Merrill Lynch U.S. Corporate, Government & Mortgage Index (the fund’s bond portion index) returned 6.43% and the Russell 1000¨ Index (the fund’s stock portion index) returned 16.10% . The fund’s representative market index is represented by these two separate indexes as a better reflection of the types of stocks and bonds typically held by the fund as described in the prospectus. For the period, we are pleased that the stock portion of the fund outperformed its index due to strong stock selection in most sectors and that, combined with strong bond performance, the fund’s overa ll performance reflects its blend of investments.
Within the stock portion of the fund (approximately 52% on December 31, 2010), Health Care sector holdings detracted from performance, while performance was boosted by our significant weighting and strong performance in the Consumer Staples, Financials, Energy, and Information Technology sectors. The fund’s higher quality stock holdings lagged during the risk-taking rallies while low quality stocks led the market, but held up much better during the correction period. Specifically, performance was led by Boeing Co., ConocoPhillips, Philip Morris International Inc., Microsoft Corp., and Honeywell International Inc.. Detracting from performance were Health Care stocks Pfizer Inc., Johnson & Johnson, and Merck & Co. Inc., which saw their earnings fal l short of expectations. In addition, Utility firm FirstEnergy Corp. saw its profits slip due to lower natural gas prices, and Lockheed Martin Corp. fell short of profit potential as it had large pension expenses.
The performance of the bond portion of the fund was significantly bolstered by its income orientation. More specifically, its overweighted allocation relative to the market to BBB rated securities and corporate bonds in general added both income and relative price appreciation in excess of the bond market.
During 2010 the stock portion of the fund increased its weight in Energy and Information Technology, while decreasing its weight in the rallying Industrial sector. A midyear bond market rally gave us the opportunity to reduce the weights in the Utilities and Telecom sectors.
Ultra Series Fund | Management’s Discussion of Fund Performance | December 31, 2010
INVESTMENT STRATEGY HIGHLIGHTS
The Ultra Series Equity Income Fund invests primarily in common stocks of large-and mid-capitalization companies that are, in the view of the fund’s investment adviser, selling at a reasonable price in relation to their long-term earnings growth rates. The portfolio managers will allocate the fund’s assets among stocks in sectors of the economy based upon their expected earnings growth rates, adjusted to reflect their views on economic and market conditions and sector risk factors.
The fund will seek to generate current earnings from option premiums by writing (selling) covered call options on a substantial portion of its portfolio securities. The fund seeks to produce a high level of current income and current gains generated from option writing premiums and, to a lesser extent, from dividends. The extent of option writing activity will depend upon market conditions and the portfolio manager’s ongoing assessment of the attractiveness of writing call options on the fund’s stock holdings. In addition to providing income, covered call writing helps to reduce the volatility (and risk profile) of the fund by providing downside protection.
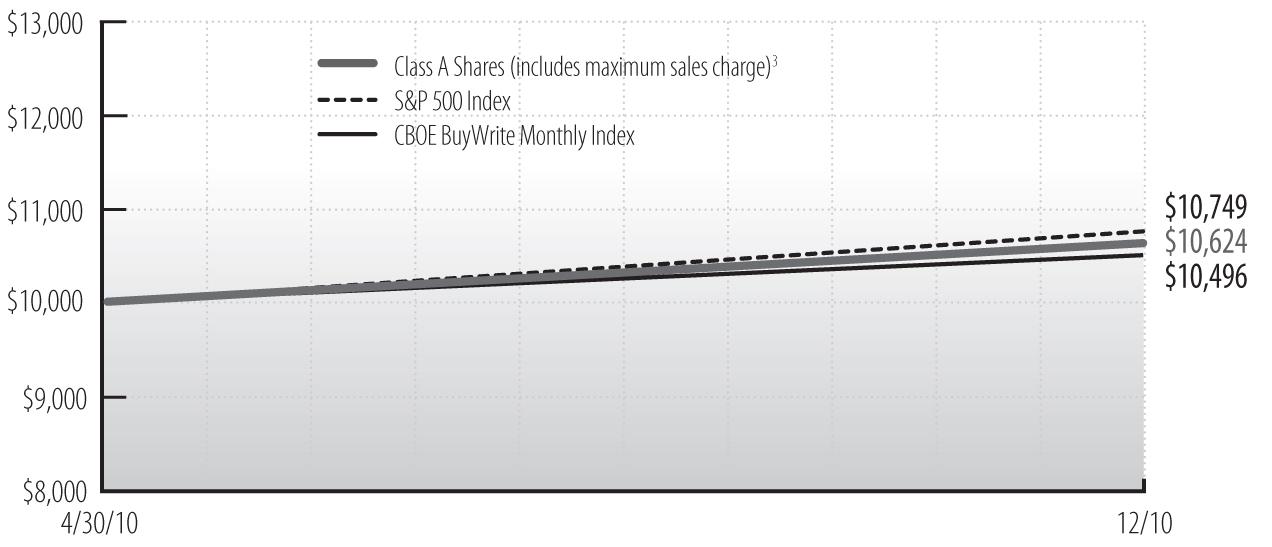
Cumulative Performance of $10,000 Investment Since Inception1,2
Average Annual Total Return through October 31, 20102 |
| | |
| Class I Shares | 6.24% |
| Class II Shares | 6.07 |
| S&P 500 Index | 7.49 |
| CBOE BuyWrite Monthly Index | 4.96 |
See accompanying Notes to Management’s Discussion of Fund Performance.
Ultra Series Fund | Management’s Discussion of Fund Performance | December 31, 2010
Equity Income Fund (concluded)
The Ultra Series Equity Income Fund began its existence on April 30, 2010 and the subsequent correction in equity prices, which lasted through the end of June, provided an opportunity to become fully invested at attractive levels. Following the correction, equities recovered quite strongly through year end. The upward surge, particularly during the fourth quarter, hindered the ability of the fund to keep pace as many underlying stock positions moved above the strike prices on their call options (the prices at which the holder of a stock option may purchase the stock) . In addition, as stocks moved higher, a number of stock positions were called away on option expirations. This led to an increase in the fund’s cash position which was reinvested in a cauti ously opportunistic fashion but proved to be a head wind in a fast rising market. These factors primarily attributed to the fund underperforming the S&P 500 from the inception day through year end.
SECTOR ALLOCATION AS A PERCENTAGE OF NET ASSETS |
| | Fund | S&P 500 |
| Consumer Discretionary | 13% | 10% |
| Consumer Staples | – | 11% |
| Energy | 11% | 12% |
| Financials | 19% | 16% |
| Health Care | 18% | 11% |
| Industrials | 2% | 11% |
| Information Technology | 22% | 19% |
| Materials | – | 4% |
| Telecommunication Services | – | 3% |
| Utilities | – | 3% |
| Exchange-Traded Fund | 4% | – |
| Cash and Other Net Assets | 11% | – |
For the period ended December 31, 2010, the fund outperformed the CBOE Buy-Write Index (BXM) which is the passive benchmark for a covered call strategy on the S&P 500. From inception through period end, the fund rose 6.24% versus a 4.96% return for the CBOE Buy-Write Index and a 7.49% return for the S&P 500 Index.
In 2010, the fund benefitted from the strong moves in many underlying holdings as call options were written (sold) meaningfully out-of-the-money (option’s strike price is higher than the market price of the underlying stock) in the early portion of the period. Although not fully capturing the entirety of stock’s gains, significantly more upside was captured relative to a strategy focusing only on achieving the highest premium income. Many fund positions achieved returns greater that the S&P 500 Index despite having call option strike prices which limited their upside potential. Such holdings included, Varian Semiconductor, Google, Mylan Labs, Goldman Sachs and Morgan Stanley. These positions also benefitted from option premium income in additio n to the gains in stock price. Some weakness was observed in holdings which had disappointing earnings releases such as Best Buy, EOG Resources and Cisco Systems. Similarly, the downside of weaker holdings was buffeted by the presence of call options written.
The primary change to the fund during the period was to increase the percentage of the fund covered by call options as the stock market moved higher. As of year-end, 89.2% of the fund’s holding were covered by call options as opposed to 68.9% at the end of June. In addition, call options most recently have been written closer-to-the-money (when the price of the underlying stock surpasses the strike price) in observance of the strong rally which we have witnessed over the past five months. At year-end, the fund was conservatively positioned in advance of what we believe will be a more volatile period ahead.
Ultra Series Fund | Management’s Discussion of Fund Performance | December 31, 2010
INVESTMENT STRATEGY HIGHLIGHTS
The Ultra Series Large Cap Value Fund will, under normal market conditions, invest primarily in large cap stocks. The fund follows a "value" approach, meaning the portfolio managers seek to invest in stocks at prices below their perceived intrinsic value as estimated based on fundamental analysis of the issuing company and its prospects. By investing in value stocks, the fund attempts to limit the downside risk over time but may also produce smaller gains than other stock funds if their intrinsic values are not realized by the market or if growth-oriented investments are favored by investors. The fund will diversify its holdings among various industries and among companies within those industries. The fund typically sells a stock when the fundamental expectati ons for buying it no longer apply, the price exceeds its intrinsic value or other stocks appear more attractively priced relative to their intrinsic values.
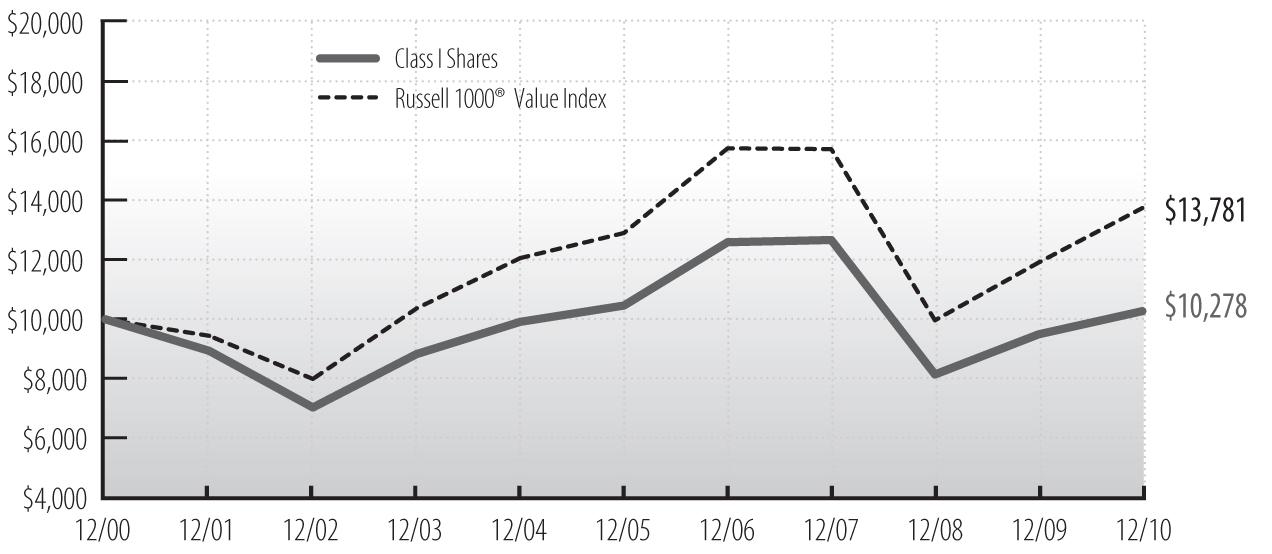
Cumulative Performance of $10,000 Investment Since Inception1
Average Annual Total Return through December 31, 20101 |
| | | | | | |
| Class I Shares | 8.29% | -6.80% | -0.37% | 0.27% | — |
| Class II Shares | 8.02 | — | — | — | 20.31% |
| Russell 1000¨ Value Index | 15.51 | -4.42 | 1.28 | 3.26 | 27.47 |
See accompanying Notes to Management’s Discussion of Fund Performance.
Ultra Series Fund | Management’s Discussion of Fund Performance | December 31, 2010
Large Cap Value Fund (concluded)
2010 was a year that can be viewed in thirds. During the first third of 2010 the Russell 1000¨ Value Index rose by over 10%. Riskier assets such as stocks of highly levered firms rallied sharply, and the "risk-on" trade was rewarded. During the second third, or middle of the year, the Value Index experienced a 15% correction, and the "risk-off" trade outperformed riskier assets. In the final third of the year, when the Fed’s QE2 program was put into action, the Value Index rallied by over 20% from its midyear low, and the "risk-on" trade was once again rewarded.
SECTOR ALLOCATION AS A PERCENTAGE OF NET ASSETS |
| | Fund | Russell 1000¨ Value Index |
| Consumer Discretionary | 6% | 8% |
| Consumer Staples | 10% | 10% |
| Energy | 16% | 13% |
| Financials | 20% | 28% |
| Health Care | 15% | 12% |
| Industrials | 9% | 9% |
| Information Technology | 13% | 5% |
| Materials | 3% | 3% |
| Telecommunication Services | 3% | 5% |
| Utilities | 3% | 7% |
| Cash and Other Net Assets | 2% | – |
For the twelve-month period ended December 31, 2010, the Ultra Series Large Cap Value Fund return of 8.29% lagged the Russell 1000¨ Value Index return 15.51%. Much of the fund’s lag versus the benchmark built up during the early portion of the year, and the fund was unable to completely close the gap during the subsequent midyear correction when the market shifted to higher quality stocks. The fund’s underperformance gap further increased during the last third of the year when riskier assets once again found favor.
Energy stocks were the biggest detriment to performance during the period. While the fund’s larger oil related issues performed well, its holdings in natural gas related firms, as well as energy equipment and services stocks underperformed. The largest individual detractors from fund performance included the Energy firms Southwestern Energy Co. and Noble Corp. An abundance of industry-wide production kept natural gas prices low, which crimped Southwestern Energy Co.’s profits, while the disruption in drilling activity in the Gulf of Mexico hurt Noble Corp.’s profits. The Utility firm Exelon Corp. also detracted from performance, as lower natural gas prices brought profits down in their wholesale business. In addition, fund performance versus the index was weak in the Industrial, Financial, and Information Technology sectors.
Offsetting some of the losses include strong performance from several fund holdings. Stocks which aided performance included Berkshire Hathaway Inc. Class B, and the mid-sized firms AutoZone, Inc., KeyCorp, and Darden Restaurants Inc.
During the period the fund reduced its sector weight in the Energy and Consumer Discretionary sectors. Conversely, the fund increased its sector weight in Information Technology and Consumer Staples. Although Treasury interest rates fell and dividend yields generally fell as stock prices rose, the fund found many attractive above average dividend yield stocks to purchase, and the dividend yield on the fund’s stocks rose from 2.3% to 2.6% during 2010.
Ultra Series Fund | Management’s Discussion of Fund Performance | December 31, 2010
INVESTMENT STRATEGY HIGHLIGHTS
The Ultra Series Large Cap Growth Fund invests primarily in common stocks of larger companies and will, under normal market conditions, maintain at least 80% of its assets in large cap stocks. The fund follows a "growth" approach, meaning the portfolio managers seek stocks that have low market prices relative to their perceived growth capabilities as estimated based on fundamental analysis of the issuing companies and their prospects. The fund typically seeks higher earnings growth capabilities in the stocks it purchases, and may include some companies undergoing more significant changes in their operations or experiencing significant changes in their markets. The fund will diversify its holdings among various industries and among companies within those indust ries. The fund has an active trading strategy which will lead to more portfolio turnover than a more passively-managed fund. The fund typically sells a stock when the fundamental expectations for buying it no longer apply, the price exceeds its perceived value or other stocks appear more attractively priced relative to their prospects.
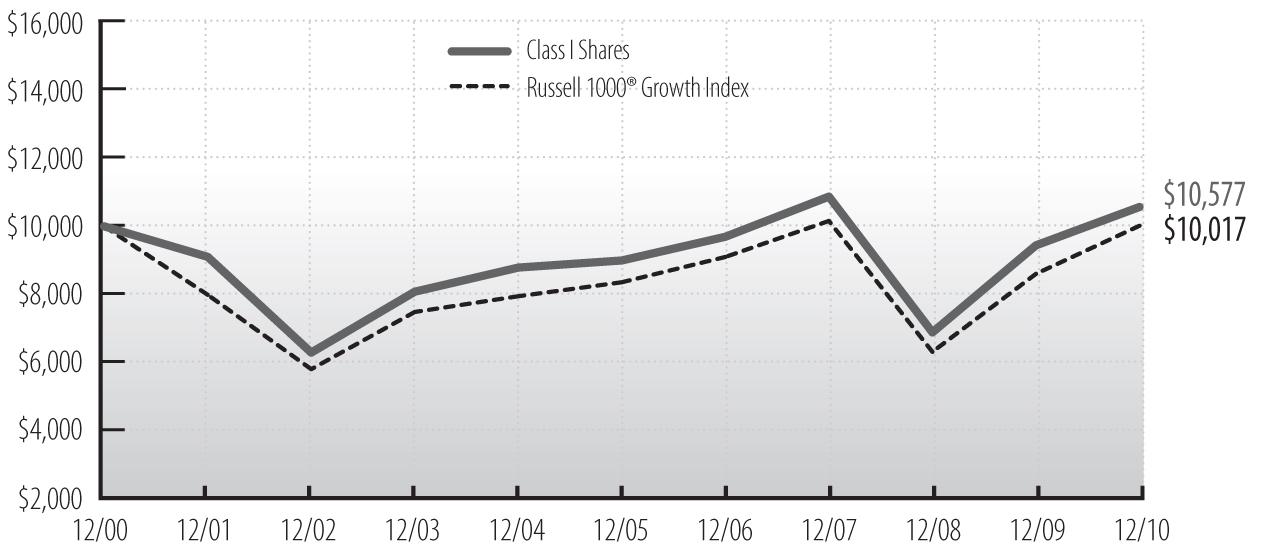
Cumulative Performance of $10,000 Investment Since Inception1
Average Annual Total Return through December 31, 20101 |
| | | | | | |
| Class I Shares | 12.13% | -0.96% | 3.32% | 0.56% | — |
| Class II Shares | 11.85 | — | — | — | 22.91% |
| Russell 1000¨ Growth Index | 16.71 | -0.47 | 3.75 | 0.02 | 28.67 |
See accompanying Notes to Management’s Discussion of Fund Performance.
Ultra Series Fund | Management’s Discussion of Fund Performance | December 31, 2010
Large Cap Growth Fund (concluded)
"Risk on, Risk off, Risk on again" best describes the 2010 stock market environment. Large, macroeconomic issues were key drivers of stock prices last year: sovereign debt crisis, foreclosures, saber rattling, regulatory reform, QE2, and elections dominated headlines. While the market ended up for the year, insight into how these large factors influenced individual companies was often limited. Generally, lower quality, more cyclical stocks led the advance.
SECTOR ALLOCATION AS A PERCENTAGE OF NET ASSETS |
| | Fund | Russell 1000¨ Growth Index |
| Consumer Discretionary | 6% | 15% |
| Consumer Staples | 10% | 9% |
| Energy | 16% | 11% |
| Financials | 20% | 5% |
| Health Care | 15% | 10% |
| Industrials | 9% | 13% |
| Information Technology | 13% | 31% |
| Materials | 3% | 5% |
| Telecommunication Services | 3% | 1% |
| Utilities | 3% | – |
| Cash and Other Net Assets | 2% | – |
We had positive returns in excess of 10%, but a disappointment relative to benchmark returns exceeding 15%. For the twelve-month period ended December 31, 2010 the Ultra Series Large Cap Growth Fund returned 12.13% (Class I shares), trailing the Russell 1000 Growth Index return of 16.71%. Not owning any gold or copper stocks within the fund was a detriment as was our modest commitment to the consumer. Commodities by definition are highly cyclical and difficult to analyze correctly. Generally we avoid areas of the market where we have little meaningful insight. The strength in consumer stocks surprised many market participants given the high unemployment rate and reduced home equity. As a growth manager, generally we seek investments with strong fundamental dri vers of earnings.
Individually, performance was impeded by the fund’s significant investment in Visa. The stock was down in an up market in reaction to surprisingly negative federal regulatory reform. We believe Visa will be able to successfully manage through the imposed changes and therefore remain committed to the stock.
Stock selection in financial services helped performance. We sought to avoid credit problems by investing in Axis Holdings, an insurance company. The stock rose more than 25% last year. We also correctly anticipated a shift in the flow of funds out of bonds and into stocks. Our investment in TRowe Price rose more than 25% for the year.
We believe consumer spending will continue to be limited due to credit constraints. Consequently we are retaining only modest portfolio exposure in the Consumer sectors. Alternatively, many corporations have large cash balances which we think will begin to be deployed in 2011. Consequently, we tend to favor stocks related more to business spending over those related to consumer spending. We also are favoring the Energy and Industrial sectors given our perception of the durability of the global economic recovery as well as the absence of onerous regulation in many of these industries. Lastly, we are interested in many areas of innovation in technology. Profitable growth opportunities appear likely in some internet related businesses as social network ing and mobile computing continue to develop.
Ultra Series Fund | Management’s Discussion of Fund Performance | December 31, 2010
INVESTMENT STRATEGY HIGHLIGHTS
The Ultra Series Mid Cap Fund generally invests in common stocks of midsize companies and will, under normal market conditions, maintain at least 80% of its assets in mid cap securities. However, the fund will not automatically sell a stock because its market capitalization has changed and such positions may be increased through additional purchases. The fund seeks attractive long-term returns through bottom-up security selection based on fundamental analysis in a diversified portfolio of high-quality growth companies with attractive valuations. These will typically be industry leading companies in niches with strong growth prospects. The fund’s portfolio managers believe in selecting stocks for the fund that show steady, sustainable growth and reasonabl e valuations. As a result, stocks of issuers that are believed to have a blend of both value and growth potential will be selected for investment. Stocks are generally sold when target prices are reached, company fundamentals deteriorate or more attractive stocks are identified.
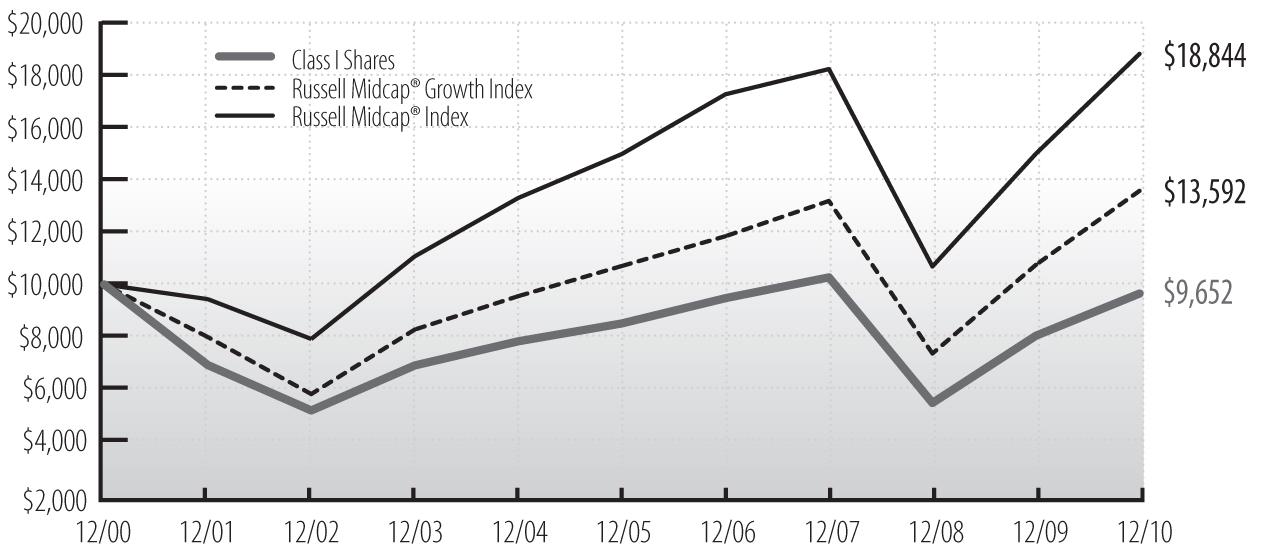
Cumulative Performance of $10,000 Investment Since Inception1
Average Annual Total Return through December 31, 20101 |
| | | | | | |
| Class I Shares | 20.12% | -2.06% | 2.56% | -0.35% | — |
| Class II Shares | 19.82 | — | — | — | 28.03% |
| Russell Midcap¨ Growth Index | 26.38 | 0.97 | 4.88 | 3.12 | 36.17 |
| Russell Midcap¨ Index | 25.48 | 1.05 | 4.66 | 6.54 | 36.33 |
See accompanying Notes to Management’s Discussion of Fund Performance.
During the twelve-month period ended December 31, 2010, mid cap stocks performed well despite a multi-month correction that occurred over the summer. The period began with a continuation of the 2009 rally where investors embraced prospects of an economic recovery. That rally paused as a correction began in April. Investors worried about the sovereign debt crisis in Europe, the scope of financial reform and the tragic oil spill in the Gulf
Ultra Series Fund | Management’s Discussion of Fund Performance | December 31, 2010
Mid Cap Fund (concluded)
of Mexico. These issues were put on the back burner in September as the Federal Reserve announced its intentions to provide another round of quantitative easing. With the Fed once again likely to print money, investors embraced riskier cyclical assets including securities with volatile earnings histories, and stock markets rallied strongly to finish the year.
SECTOR ALLOCATION AS A PERCENTAGE OF NET ASSETS |
| | Fund | Russell Midcap¨ Index |
| Consumer Discretionary | 14% | 15% |
| Consumer Staples | 4% | 6% |
| Energy | 9% | 9% |
| Financials | 22% | 19% |
| Health Care | 13% | 9% |
| Industrials | 14% | 13% |
| Information Technology | 12% | 14% |
| Materials | 6% | 6% |
| Telecommunication Services | 2% | 3% |
| Utilities | 0% | 6% |
| Cash and Other Net Assets | 4% | – |
For the twelve-month period ended December 31, 2010, the Ultra Series Mid Cap Fund increased 20.12% (Class I shares), underperforming the Russell Midcap¨ Index return of 25.48%. Even though we produced strong absolute returns, the period was challenging for the fund as cyclical stocks performed better than stocks with more consistent earnings profiles.
Our holdings in the Energy and Industrial sectors accounted for almost all of the fund’s relative underperformance. Low natural gas prices hurt exploration & production companies Southwestern Energy Co. and EOG Resources Inc. The Deepwater Horizon oil spill and the subsequent drilling moratorium negatively impacted Noble Corp., which has assets in the Gulf of Mexico. Used construction equipment auctioneer Ritchie Bros Auctioneers, Inc., engineering and construction firm Jacobs Engineering Group, Inc. and used car auctioneer Copart, Inc. were notable underperformers in the Industrial sector. Our assessments of these companies remains positive, and we added to many of the aforementioned underperformers.
Partially offsetting the underperformance, our Financial and Consumer stocks performed well relative to the index. Commercial real estate operating company Brookfield Properties Corp. and global infrastructure asset manager Brookfield Asset Management, Inc., Class A contributed nicely to performance. Consumer Staples stock picking was another area of strength as retail pharmacy Walgreen, spice manufacturer McCormick & Co., Inc. and Brown-Forman Corp., a multi-national spirits company, were additive to returns.
Our exposure to Financial stocks increased during the period, particularly in insurance and asset management. We added to insurance broker Brown & Brown, Inc., and specialty insurer Markel Corp. Other additions included Brookfield Asset Management, Inc., Class A and SEI Investments Co. We maintain an overweight position in Financials as we believe valuations are attractive.
The combination of rising valuations and heightened investor expectations caused us to reduce our exposure to more cyclical sectors such as Industrials and Consumer Discretionary stocks during the period.
Ultra Series Fund | Management’s Discussion of Fund Performance | December 31, 2010
INVESTMENT STRATEGY HIGHLIGHTS
The Ultra Series Small Cap Fund invests primarily in a diversified mix of common stocks of small cap U.S. companies that are believed to be undervalued by various measures and offer sound prospects for capital appreciation. The portfolio managers employ a value-oriented investment approach in selecting stocks, using proprietary fundamental research to identify securities of companies they believe have attractive valuations. The portfolio managers focus on companies with a record of above average rates of profitability that sell at a discount relative to the overall small cap market. Through fundamental research, the portfolio managers seek to identify those companies that possess one or more of the following characteristics: sustainable competitive advantages within a market niche; strong profitability and free cash flows; strong market share positions and trends; quality of and share ownership by management; and financial structures that are more conservative than the relevant industry average.
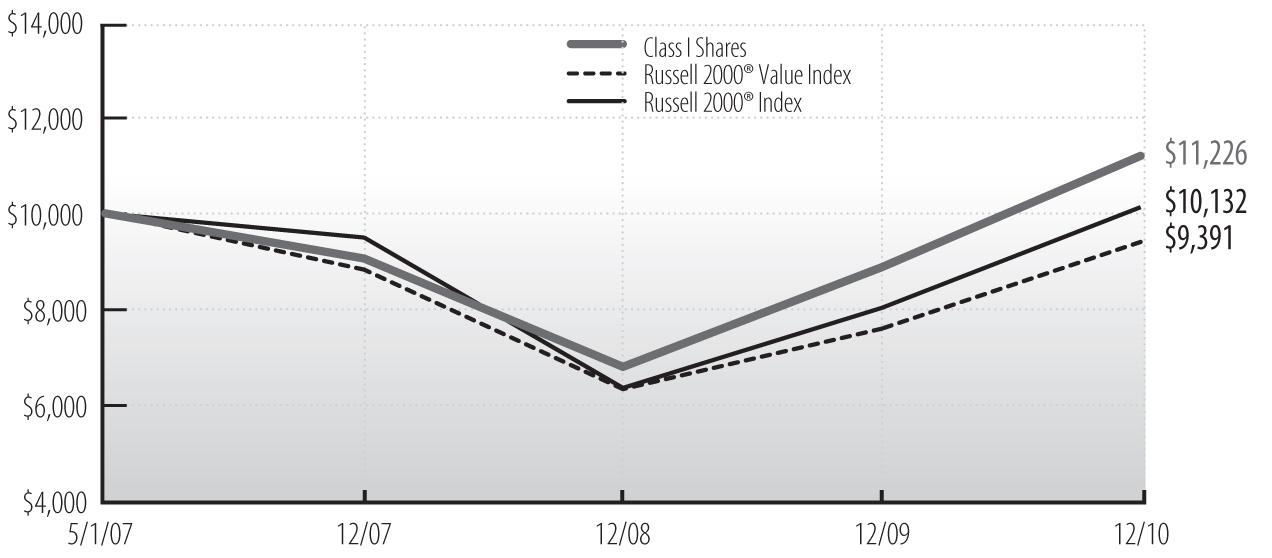
Cumulative Performance of $10,000 Investment Since Inception1
Average Annual Total Return through December 31, 20101 |
| | | | | |
| Class I Shares | 26.80% | 7.49% | 3.20% | — |
| Class II Shares | 26.48 | — | — | 35.63% |
| Russell 2000¨ Value Index | 24.50 | 2.19 | -1.70 | 33.08 |
| Russell 2000¨ Index | 26.85 | 2.22 | 0.36 | 34.59 |
See accompanying Notes to Management’s Discussion of Fund Performance.
U.S. equities were volatile during the twelve-month period ended December 31, 2010, moving higher early in the period on strong corporate earnings and generally favorable economic data before succumbing in the second quarter to escalating global growth concerns and sovereign debt challenges in Europe. Equity markets rebounded in the third quarter and continued their ascent through the end of the year as investors shrugged off sovereign debt fears in Europe and embraced strong earnings growth, generally improving
Ultra Series Fund | Management’s Discussion of Fund Performance | December 31, 2010
Small Cap Fund (concluded)
economic data, the extension of US tax cuts, and continued high levels of global liquidity. Returns were strong across capitalizations and styles. Growth stocks (+29.1%) outperformed value (+24.5%), while small cap stocks (+26.9%) led their larger peers (+15.1%), as measured by the Russell 2000 Growth, Russell 2000 Value, Russell 2000, and S&P 500 indices, respectively. Sector performance was strong, with all sectors of the benchmark posting double-digit gains for the period. Information Technology, Materials, and Consumer Discretionary led the market higher while Health Care and Telecommunication Services posted more modest gains.
SECTOR ALLOCATION AS A PERCENTAGE OF NET ASSETS AS OF 12/31/10 |
| | Fund | Russell 2000¨ Index |
| Consumer Discretionary | 17% | 14% |
| Consumer Staples | 3% | 3% |
| Energy | 4% | 6% |
| Financials | 23% | 20% |
| Health Care | 8% | 12% |
| Industrials | 23% | 16% |
| Information Technology | 8% | 19% |
| Materials | 5% | 6% |
| Telecommunication Services | 0% | 1% |
| Utilities | 5% | 3% |
| Cash and Other Net Assets | 4% | – |
For the twelve-month period ended December 31, 2010, the Ultra Series Small Cap Fund returned 26.80% (Class I shares), in-line with the Russell 2000¨ Index, which returned 26.85%.
The Fund benefited from strong security selection among our Consumer Staples and Industrials holdings. Positive results in the Consumer Staples sector were driven by investments in Herbalife, a direct marketer of health and nutrition products, and Midwest convenience store operator Casey’s General Stores. In Industrials, Belden, a producer of electronic cables and connectivity products for the specialty electronics and data-networking markets, was a leading contributor to relative performance. Radio ratings firm Arbitron (Consumer Discretionary) was also among the Fund’s top performers.
Among the largest sources of relative weakness were the fund’s Materials and Information Technology holdings. In both sectors relative performance suffered due to not holding several benchmark names that outperformed, and due to a position that gained but trailed its sector peers. In Materials the holding was cleaning products company Zep; in Information Technology it was ATM provider Diebold. Health Care was another source of underperformance. Investments in ICU Medical, a manufacturer of safety medical systems to prevent bloodstream infections and accidental needlesticks, and health care facilities firm Amsurg had a negative impact. Other sources of relative weakness included Penn Virginia (Energy), MB Financial (Financials), and Lance (Consumer Staple s).
Relative performance also was negatively impacted by relative sector exposures, a residual of our bottom-up stock selection process. A below-benchmark weight in the Information Technology sector and an above-benchmark weight in the Financials sectors detracted from relative results.
The fund’s investment approach emphasizes individual stock selection; sector weights are a residual of our bottom-up investment process. We do, however, carefully consider diversification across economic sectors to limit risk. Based on bottom-up stock decisions, exposure to Financials increased and exposure to Information Technology fell. In Financials, we established new positions in Northwest Bancshares and Amerisafe and added to our position in Reinsurance Group of America. Exposure to Information Technology declined as we eliminated Xyratex and trimmed our investments in Maximus and Electronics for Imaging.
Ultra Series Fund | Management’s Discussion of Fund Performance | December 31, 2010
INVESTMENT STRATEGY HIGHLIGHTS
The Ultra Series International Stock Fund will invest, under normal market conditions, primarily in foreign equity securities. Typically, a majority of the fund’s assets are invested in relatively large capitalization stocks of companies located or operating in developed countries. The fund may also invest up to 30% of its assets in securities of companies whose principal business activities are located in emerging market countries. The portfolio managers typically maintain this segment of the fund’s portfolio in such stocks which it believes have a low market price relative to their perceived value based on fundamental analysis of the issuing company and its prospects. The fund may also invest in foreign debt and other income bearing securities at times when it believes that income bearing securities have greater capital appreciation potential than equity securities.
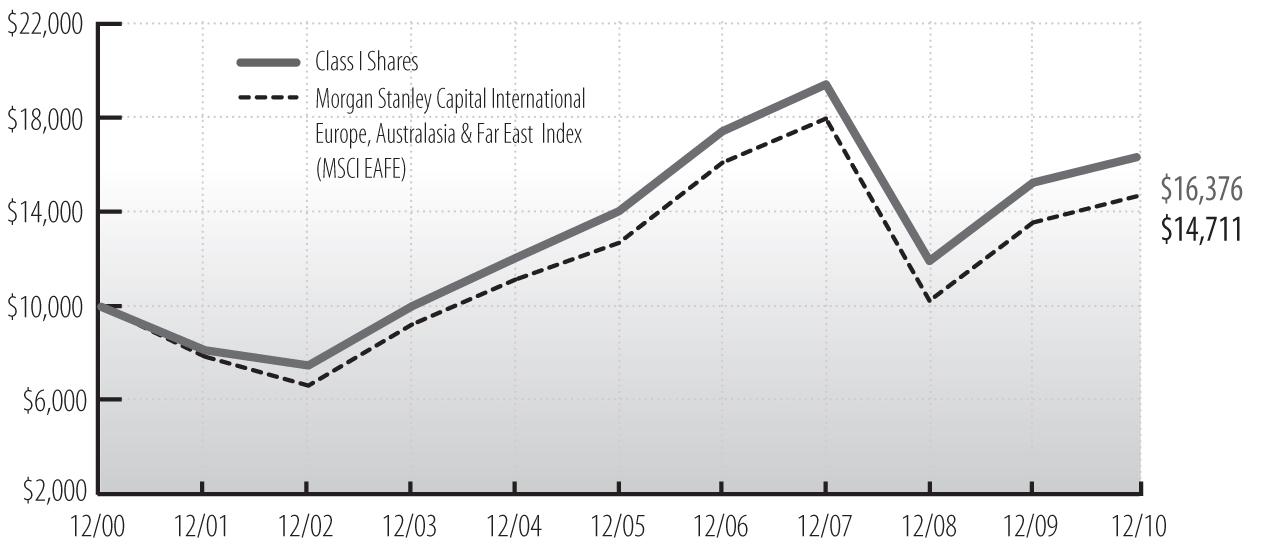
Cumulative Performance of $10,000 Investment Since Inception1
Average Annual Total Return through December 31, 20101 |
| | | | | | |
| Class I Shares | 7.09% | -5.62% | 3.07% | 5.06% | — |
| Class II Shares | 6.83 | — | — | — | 23.00% |
| MSCI EAFE Index | 8.21 | -6.55 | 2.94 | 3.94 | 26.07 |
See accompanying Notes to Management’s Discussion of Fund Performance.
International equity markets followed the strong rebound of 2009 with another strong rise in 2010. The economic environment was broadly stable in most developed markets, while growth in emerging markets remained strong. Low equity valuations were sufficient to drive shares up during the year, especially in the fourth quarter, as macroeconomic concerns eased and we saw continued unconventional policy measures from the U.S. Federal Reserve.
In Europe, governments began to address their weak fiscal position. In the United Kingdom and in a number of Eurozone countries, notably Greece, Ireland, and Spain, the proposals have been aggressive. The year saw increasing
Ultra Series Fund | Management’s Discussion of Fund Performance | December 31, 2010
International Stock Fund (concluded)
pressure on the Eurozone, as the lack of a common fiscal policy exposed deep divisions on how to respond to a debt crisis within one of its members. So far, the response has been one of crisis management, as Greece and then Ireland received financial assistance, but a permanent solution is still required.
In this environment, the strongest performers of 2010 were many emerging market stocks, and the more cyclical stocks in developed markets. In emerging markets, the focus was on low-valued consumer stocks. In developed markets, industrials, materials, and automobile stocks rose strongly, especially in the later part of the year. Less cyclical sectors, such as health care and utilities, made little progress. Despite low valuations, banks were generally weak during 2010, especially if they had exposure to the Eurozone.
GEOGRAPHICAL ALLOCATION AS A PERCENTAGE OF NET ASSETS |
| Europe (excluding United Kingdom) | 35% |
| Japan | 18% |
| Latin America | 4% |
| Pacific Basin | 6% |
| United Kingdom | 28% |
| Other Countries | 6% |
| Cash and Other Net Assets | 3% |
For the twelve-month period ended December 31, 2010, the Ultra Series International Stock Fund returned 7.09%, slightly underperforming the MSCI EAFE Index which returned 8.21%.
The largest drag on the fund’s performance over the year was low exposure to and stock selection in the Industrials sector, which performed well on improved global demand and capital expenditure growth. Within the sector, positions in Atlantia and TNT hurt performance. Additionally, the fund’s low exposure to the Materials sector detracted from returns, as the sector performed well on renewed demand and commodity price strength. Stock selection partially offset the negative allocation effect as positions in Xstrata and Potash Corp. of Saskatchewan, which were purchased at the beginning of the year, performed well. Potash’s performance was due partly to receiving a take-out bid from BHP.
Although Financials generally performed poorly, partly due to concerns over sovereign debt, stock selection in this sector helped performance. Stock selection in the banks and real estate industries were among the drivers of positive performance. Positions in U.K. banks Barclays and Lloyds, emerging markets bank Banco do Brasil, and Japanese real estate company Daito Trust Construction contributed to positive returns. Stock selection in the Energy sector also contributed to positive relative returns. Selling BP, soon after the oil spill in the Gulf of Mexico, proved to be a wise decision. Positions in oil services companies Aker Solutions and Technip were also beneficial, as they benefited from increased confidence i n expected capital spending.
Throughout the year, the biggest changes in our active sector weights were increases in Consumer Discretionary and Information Technology and decreases in Industrials and Telecom Services. The biggest changes in our active regional weights were increases in the U.K. and in Japan and decreases in Continental Europe and Asia ex-Japan. Both sets of changes were the result of our bottom-up stock selection process as positions were bought and sold, based on our fundamental analysis of individual securities. Examples include purchases of automobile parts company Valeo and Japanese retailer Don Quijote and sales of Swiss bank Credit Suisse and Turkish telecom services company Turkcell.
Ultra Series Fund | Management’s Discussion of Fund Performance | December 31, 2010
TARGET RETIREMENT 2020 FUND
INVESTMENT STRATEGY HIGHLIGHTS
The Ultra Series Target Retirement 2020 Fund invests primarily in shares of registered investment companies (the "underlying funds") according to an asset allocation strategy developed by Madison Asset Management, LLC ("Madison"), the fund’s investment adviser, for investors planning to retire in or within a few years of 2020. Over time, the fund’s asset allocation will become more conservative until it reaches approximately 15-30% in stock funds and 70-85% in bond funds. The asset allocation strategy is designed to reduce the volatility of investment returns in the later years while still providing the potential for higher total returns over the target period.
On a periodic basis, Madison will evaluate and sometimes revise the fund’s asset allocations, including revising the asset class weightings and adding and/or removing underlying funds. Madison will also monitor the underlying funds on an ongoing basis and may increase or decrease the fund’s investment in one or several underlying funds. The underlying fund selections are made based on several considerations, including the fund’s style or asset class exposures, portfolio characteristics, risk profile, and investment process.
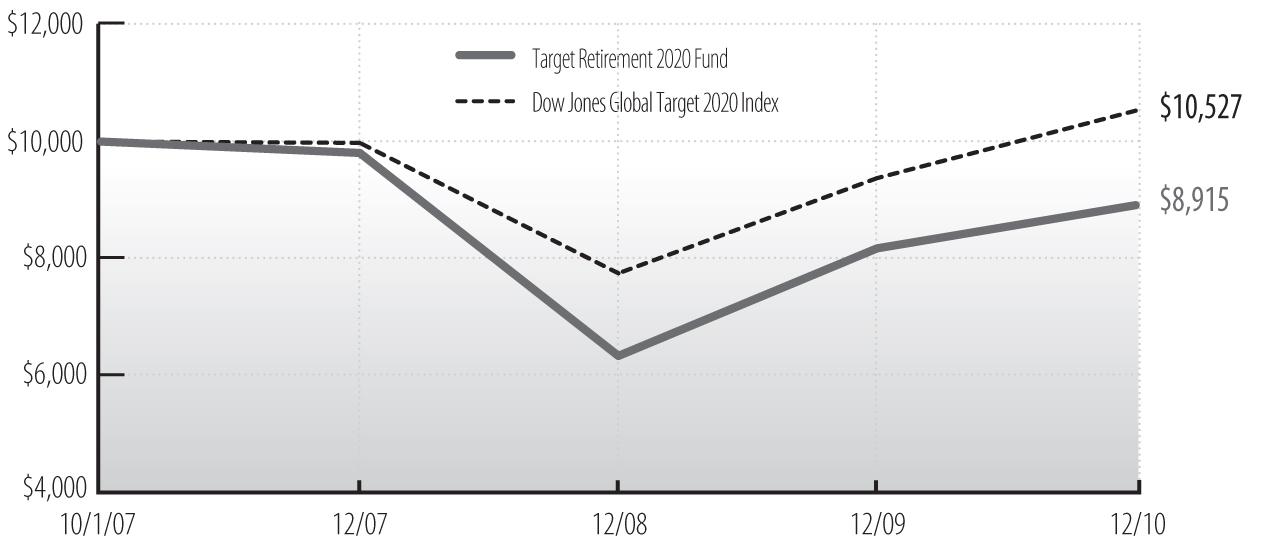
Cumulative Performance of $10,000 Investment Since Inception1
Average Annual Total Return through December 31, 20101 |
| | | | |
| Ultra Series Target Retirement 2020, Class I | 9.01% | -3.13% | -3.47% |
| Dow Jones Global Target 2020 Index | 12.26 | 1.80 | 1.59 |
See accompanying Notes to Management’s Discussion of Fund Performance.
Ultra Series Fund | Management’s Discussion of Fund Performance | December 31, 2010
Target Retirement 2020 Fund (concluded)
2010 proved to be a very positive year for asset allocation funds. However, returns for the year across asset classes were far from uniform. U.S. stocks, as measured by the Russell 3000¨ Index, finished the year up 16.9%, the international equity MSCI EAFE Index returned 8.2%, and the Barclays U.S. Aggregate Bond Index gained 6.5%. However, within each of these asset classes the underlying returns where largely skewed in favor of the riskier stocks and bonds. Here in the U.S., high beta stocks outgained lower beta and high quality stocks by a very wide margin. The same was true for capitalization size where small caps, generally regarded as lower in quality, outpaced large caps by over 11%. In bond land, "junk" bonds returned nearly 9% more than the inves tment grade Barclays U.S. Aggregate Bond Index. In short, it was a risk takers market in asset allocation for 2010.
SECTOR ALLOCATION AS A PERCENTAGE OF NET ASSETS |
| Bond Funds | 35% |
| Foreign Bond Funds | 7% |
| Stock Funds | 47% |
| Foreign Stock Funds | 8% |
| Money Market Funds and Other Net Assets | 3% |
For twelve-month period ended December 31, 2010, the Ultra Series Target Retirement 2020 Fund returned 9.01% (Class I shares), underperforming the Dow Jones Global Target 2020 Index return of 12.26%. The fund’s relative underperformance was attributed to our risk aware posturing, conservative glide path, and preference for higher quality large cap equities. Despite our preference for higher quality investments, the fund was boosted by modest positions in small caps with MEMBERS Small Cap Fund Class Y up 25.6% for the year, in addition to our energy and natural resources position in T. Rowe Price New Era which returned 21.0%. Detractors from performance relative to the index included Hussman Strategic Growth which returned -3.6% for the year, MEMBERS Bond Fund Class Y which returned 4.9%, MEMBERS International Stock Fund Class Y which returned 6.5%, and MEMBERS Large Cap Value Fund Class Y which returned 8.3%.
Overall, despite the fund’s relative underperformance, we were pleased with the fund’s absolute return given the moderate level of risk taken. In short, we believe the fund is well-positioned for the economic environment that we are encountering – an economy showing emerging signs of gaining some sustainable traction combined with atypically elevated downside risk potential.
Notable additions to the fund’s holdings this year were: PIMCO Investment Grade Corporate Bond Fund, Madison Mosaic Disciplined Equity Fund, T. Rowe Price New Era Fund, Matthews Asian Growth & Income Fund, and Yacktman Fund. Sold from the portfolio during 2010 were: Dodge & Cox Income Fund and Fairholme Fund.
Ultra Series Fund | Management’s Discussion of Fund Performance | December 31, 2010
TARGET RETIREMENT 2030 FUND
INVESTMENT STRATEGY HIGHLIGHTS
The Ultra Series Target Retirement 2030 Fund invests primarily in shares of registered investment companies (the "underlying funds") according to an asset allocation strategy developed by Madison Asset Management, LLC ("Madison"), the fund’s investment adviser, for investors planning to retire in or within a few years of 2030. Over time, the fund’s asset allocation will become more conservative until it reaches approximately 15-30% in stock funds and 70-85% in bond funds. The asset allocation strategy is designed to reduce the volatility of investment returns in the later years while still providing the potential for higher total returns over the target period.
On a periodic basis, Madison will evaluate and sometimes revise the fund’s asset allocations, including revising the asset class weightings and adding and/or removing underlying funds. Madison will also monitor the underlying funds on an ongoing basis and may increase or decrease the fund’s investment in one or several underlying funds. The underlying fund selections are made based on several considerations, including the fund’s style or asset class exposures, portfolio characteristics, risk profile, and investment process.
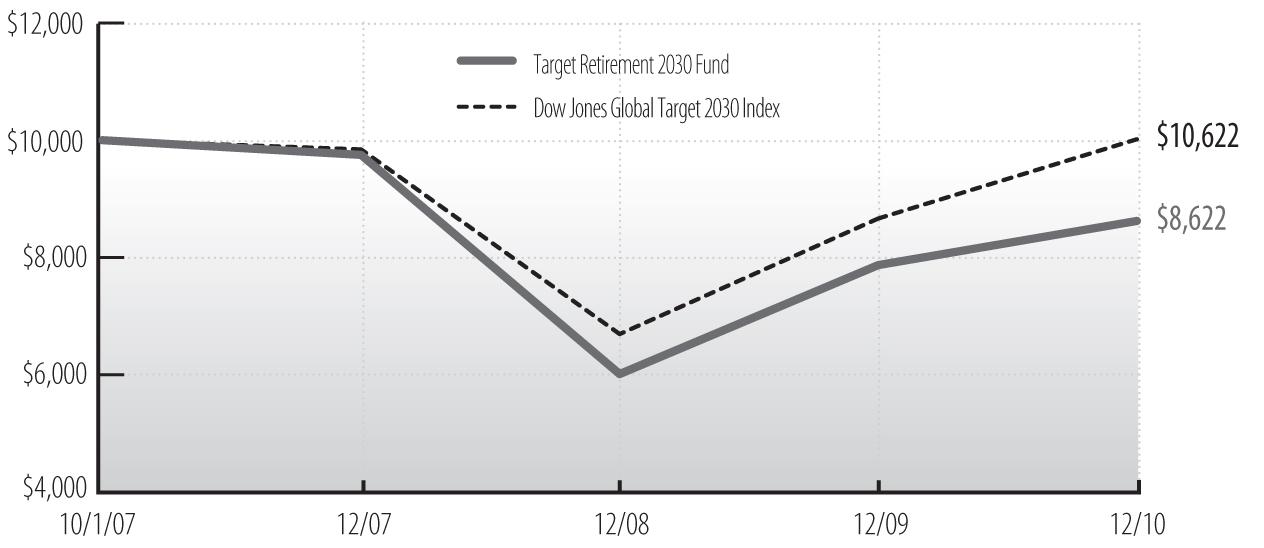
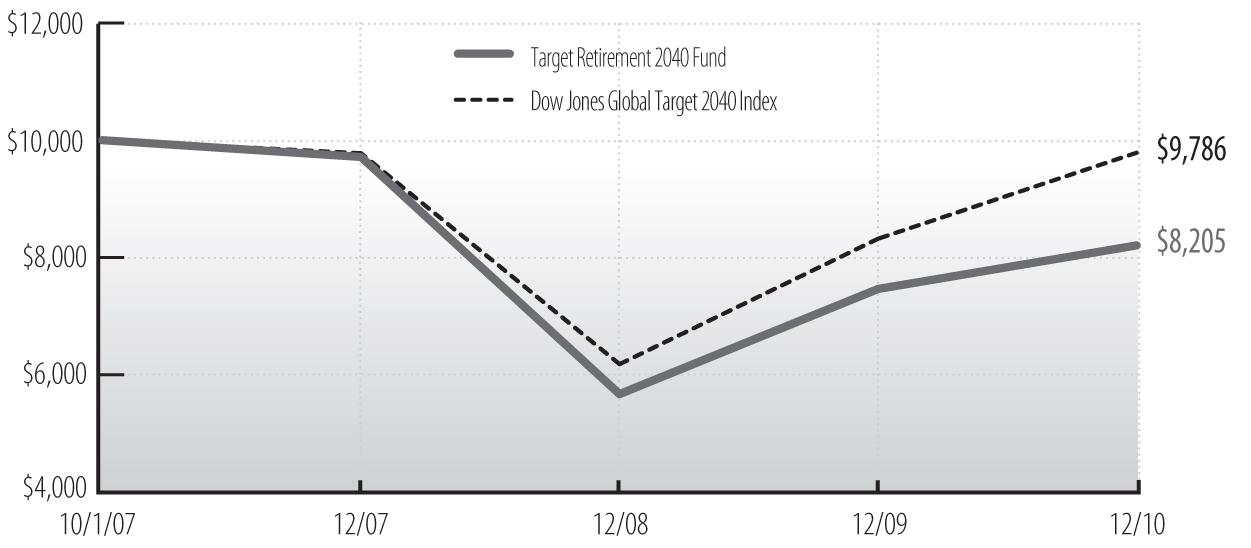
Cumulative Performance of $10,000 Investment Since Inception1
Average Annual Total Return through December 31, 20101 |
| | | | |
| Ultra Series Target Retirement 2030, Class I | 9.56% | -4.01% | -4.46% |
| Dow Jones Global Target 2030 Index | 15.60 | 0.58 | 0.05 |
See accompanying Notes to Management’s Discussion of Fund Performance.
Ultra Series Fund | Management’s Discussion of Fund Performance | December 31, 2010
Target Retirement 2030 Fund (concluded)
2010 proved to be a very positive year for asset allocation funds. However, returns for the year across asset classes were far from uniform. U.S. stocks, as measured by the Russell 3000¨ Index, finished the year up 16.9%, the international equity MSCI EAFE Index returned 8.2%, and the Barclays U.S. Aggregate Bond Index gained 6.5%. However, within each of these asset classes the underlying returns where largely skewed in favor of the riskier stocks and bonds. Here in the U.S., high beta stocks outgained lower beta and high quality stocks by a very wide margin. The same was true for capitalization size where small caps, generally regarded as lower in quality, outpaced large caps by over 11%. In bond land, "junk" bonds returned nearly 9% more than the inves tment grade Barclays U.S. Aggregate Bond Index. In short, it was a risk takers market in asset allocation for 2010.
SECTOR ALLOCATION AS A PERCENTAGE OF NET ASSETS |
| Bond Funds | 26% |
| Foreign Bond Funds | 6% |
| Stock Funds | 54% |
| Money Market Funds and Other Net Assets | 3% |
| Foreign Stock Funds | 11% |
For twelve-month period ended December 31, 2010, the Ultra Series Target Retirement 2030 Fund returned 9.56% (Class I shares), underperforming the Dow Jones Global Target 2030 Index return of 15.60%. The fund’s relative underperformance was attributed to our risk aware posturing, conservative glide path, and preference for higher quality large cap equities. Despite our preference for higher quality investments, the fund was boosted by modest positions in small caps with MEMBERS Small Cap Fund Class Y up 25.6% for the year, in addition to our energy and natural resources position in T. Rowe Price New Era which returned 21.0%. Detractors included Hussman Strategic Growth Fund which returned -3.6% for the year, MEMBERS Bond Fund Class Y which returned 4.9%, MEMBERS International Stock Fund Class Y which returned 6.5%, and MEMBERS Large Cap Value Fund Class Y which returned 8.3%.
Overall, despite the fund’s relative underperformance, we were pleased with the fund’s absolute return given the moderate level of risk taken. In short, we believe the fund is well-positioned for the economic environment that we are encountering – an economy showing emerging signs of gaining some sustainable traction combined with atypically elevated downside risk potential.
Notable additions to the fund’s holdings this year were: PIMCO Investment Grade Corporate Bond Fund, Madison Mosaic Disciplined Equity Fund, T. Rowe Price New Era Fund, Matthews Asian Growth & Income Fund, and Yacktman Fund. Sold from the portfolio during 2010 were: Dodge & Cox Income Fund, Fairholme Fund, and Principal Emerging Markets Fund.
Ultra Series Fund | Management’s Discussion of Fund Performance | December 31, 2010
TARGET RETIREMENT 2040 FUND
INVESTMENT STRATEGY HIGHLIGHTS
The Ultra Series Target Retirement 2040 Fund invests primarily in shares of registered investment companies (the "underlying funds") according to an asset allocation strategy developed by Madison Asset Management, LLC ("Madison"), the fund’s investment adviser, for investors planning to retire in or within a few years of 2040. Over time, the fund’s asset allocation will become more conservative until it reaches approximately 15-30% in stock funds and 70-85% in bond funds. The asset allocation strategy is designed to reduce the volatility of investment returns in the later years while still providing the potential for higher total returns over the target period.
On a periodic basis, Madison will evaluate and sometimes revise the fund’s asset allocations, including revising the asset class weightings and adding and/or removing underlying funds. Madison will also monitor the underlying funds on an ongoing basis and may increase or decrease the fund’s investment in one or several underlying funds. The underlying fund selections are made based on several considerations, including the fund’s style or asset class exposures, portfolio characteristics, risk profile, and investment process.
Cumulative Performance of $10,000 Investment Since Inception1
Average Annual Total Return through December 31, 20101 |
| | | | |
| Ultra Series Target Retirement 2040, Class I | 9.97% | -5.47% | -5.90% |
| Dow Jones Global Target 2040 Index | 17.64 | 0.04 | -0.66 |
See accompanying Notes to Management’s Discussion of Fund Performance.
Ultra Series Fund | Management’s Discussion of Fund Performance | December 31, 2010
Target Retirement 2040 Fund (concluded)
2010 proved to be a very positive year for asset allocation funds. However, returns for the year across asset classes were far from uniform. U.S. stocks, as measured by the Russell 3000¨ Index, finished the year up 16.9%, the international equity MSCI EAFE Index returned 8.2%, and the Barclays U.S. Aggregate Bond Index gained 6.5%. However, within each of these asset classes the underlying returns where largely skewed in favor of the riskier stocks and bonds. Here in the U.S., high beta stocks outgained lower beta and high quality stocks by a very wide margin. The same was true for capitalization size where small caps, generally regarded as lower in quality, outpaced large caps by over 11%. In bond land, "junk" bonds returned nearly 9% more than the inves tment grade Barclays U.S. Aggregate Bond Index. In short, it was a risk takers market in asset allocation for 2010.
SECTOR ALLOCATION AS A PERCENTAGE OF NET ASSETS |
| Bond Funds | 17% |
| Foreign Bond Funds | 5% |
| Stock Funds | 63% |
| Foreign Stock Funds | 13% |
| Money Market Funds and Other Net Assets | 2% |
For the twelve-month period ended December 31, 2010, the Ultra Series Target Retirement 2040 Fund returned 9.97% (Class I shares), underperforming the Dow Jones Global Target 2040 Index return of 17.6%. The fund’s relative underperformance was attributed to our risk aware posturing, conservative glide path, and preference for higher quality large cap equities. Despite our preference for higher quality investments, the fund was boosted by modest positions in small caps with MEMBERS Small Cap Fund Class Y up 25.6% for the year, in addition to our energy and natural resources position in T. Rowe Price New Era Fund which returned 21.0%. Detractors from performance relative to the index included Hussman Strategic Growth which returned -3.6% for the year, MEMB ERS Bond Fund Class Y which returned 4.9%, MEMBERS International Stock Fund Class Y which returned 6.5%, and MEMBERS Large Cap Value Fund Class Y which returned 8.3%.
Overall, despite the fund’s relative underperformance, we were pleased with the fund’s absolute return given the moderate level of risk taken. In short, we believe the fund is well-positioned for the economic environment that we are encountering – an economy showing emerging signs of gaining some sustainable traction combined with atypically elevated downside risk potential.
Notable additions to the fund’s holdings this year were: PIMCO Investment Grade Corporate Bond Fund, Madison Mosaic Disciplined Equity Fund, T. Rowe Price New Era Fund, Matthews Asian Growth & Income Fund, and Yacktman Fund. Sold from the portfolio during 2010 were: Dodge & Cox Income Fund, Fairholme Fund, and Principal Emerging Markets Fund.
Ultra Series Fund | December 31, 2010
Notes to Management’s Discussion of Fund Performance
| | 1Fund returns are calculated after fund level expenses have been subtracted, but do not include any separate account fees, charges or expenses imposed by the variable annuity and variable life insurance contracts that invest in the fund, as described in the Prospectus. If these fees, charges, or expenses were included, fund returns would have been lower. Fund returns also assume that dividends and capital gains are reinvested in additional shares of the fund. Investment return and principal value will fluctuate, so an investor’s shares, when redeemed, may be worth more or less than when purchased. Further information relating to the fund’s performance is contained in the Prospectus and elsewhere in this report. The fund’s past performance is not indicative of future performance. Current performance may be lower or highe r than the performance data cited. For Ultra Series Fund performance data current to the most recent month-end, please call 1-800-670-3600. Indices are unmanaged and investors cannot invest in them directly. Index returns do not reflect fees or expenses. |
| | 2MEMBERS Capital Advisors, Inc., the then acting fund adviser, reduced its management fee for the Conservative, Moderate, and Aggressive Allocation Funds (the "Target Allocation Funds") from June 30, 2006-April 30, 2008. Madison Asset Management, LLC reduced its management fee for the Target Retirement 2020, 2030 and 2040 Funds from 0.40% to 0.20% (the "Target Retirement Date Funds") since October 1, 2009. This waiver is contractual until April 30, 2011. If the management fees had not been reduced, returns would have been lower. |
BENCHMARK DESCRIPTIONS
Allocation Fund Indexes
The Conservative Allocation Fund Custom Index consists of 65% Merrill Lynch U.S. Corporate, Government and Mortgage Index, 30% Russell 3000¨ Index and 5% MSCI EAFE Index. See market indexes descriptions below.
The Moderate Allocation Fund Custom Index consists of 40% Merrill Lynch U.S. Corporate, Government and Mortgage Index, 45% Russell 3000¨ Index and 15% MSCI EAFE Index. See market indexes descriptions below.
The Aggressive Allocation Fund Custom Index consists of 15% Merrill Lynch U.S. Corporate, Government and Mortgage Index, 55% Russell 3000¨ Index and 30% MSCI EAFE Index. See market indexes descriptions below.
Market Indexes
The Bank of America Merrill Lynch U.S. Corporate, Government & Mortgage Index is a broad-based measure of the total rate of return performance of the U.S. investment-grade bond markets. The index is a capitalization-weighted aggregation of outstanding U.S. treasury, agency and supranational mortgage pass-through, and investment-grade corporate bonds meeting specified selection criteria.
The Bank of America Merrill Lynch U.S. High Yield Master II Constrained Index tracks the performance of below investment grade U.S. dollar denominated corporate bonds publicly issued in the U.S. domestic market, but limits any individual issuer to a maximum weighting of 2%.
The CBOE BuyWrite Monthly Index (BXM) is a benchmark index designed to track the performance of a hypothetical buy-write strategy (ie. holding a long position in and selling covered call options on that position) on the S&P 500 Index.
The Dow Jones Global Target 2020 Index is a benchmark for multi-asset class portfolios with risk profiles that become more conservative as the year 2020 approaches. The index is a composite of other indexes that represent stocks, bonds and cash.
Ultra Series Fund | Notes to Management’s Discussion of Fund Performance | December 31, 2010
Benchmark Descriptions (concluded)
The Dow Jones Global Target 2030 Index is a benchmark for multi-asset class portfolios with risk profiles that become more conservative as the year 2030 approaches. The index is a composite of other indexes that represent stocks, bonds and cash.
The Dow Jones Global Target 2040 Index is a benchmark for multi-asset class portfolios with risk profiles that become more conservative as the year 2040 approaches. The index is a composite of other indexes that represent stocks, bonds and cash.
The MSCI EAFE (Europe, Australasia & Far East) Index is a free float-adjusted market capitalization index that is designed to measure developed market equity performance, excluding the U.S. and Canada.
The Russell 1000¨ Index is a large-cap market index which measures the performance of the 1,000 largest companies in the Russell 3000¨ Index (see definition below).
The Russell 1000¨ Growth Index is a large-cap market index which measures the performance of those Russell 1000 companies with higher price-to-book ratios and higher forecasted growth values.
The Russell 1000¨ Value Index is a large-cap market index which measures the performance of those Russell 1000 companies with lower price-to-book ratios and lower forecasted growth values.
The Russell 2000¨ Index is a small-cap market index which measures the performance of the smallest 2,000 companies in the Russell 3000¨ Index (see definition below.)
The Russell 2000¨ Value Index is a small-cap market index which measures the performance of those Russell 2000 companies with lower price-to-book ratios and lower forecasted growth values.
The Russell 3000¨ Index measures the performance of the 3,000 largest U.S. companies based on total market capitalization, which represents 98% of the investable U.S. equity market.
The Russell Midcap¨ Growth Index is a mid-cap market index which measures the performance of those Russell Midcap companies with higher price-to-book ratios and higher forecasted growth values.
The S&P 500 Index is a large-cap market index which measures the performance of a representative sample of 500 leading companies in leading industries in the U.S.
Ultra Series Fund | December 31, 2010
Conservative Allocation Fund Portfolio of Investments
| | | |
| INVESTMENT COMPANIES - 99.3% | | |
| Bond Funds - 59.6% | | |
| Franklin Floating Rate Daily Access Fund Advisor Class | 568,306 | $ 5,211,366 |
| Madison Mosaic Institutional Bond Fund (A) | 1,699,579 | 18,593,391 |
| MEMBERS Bond Fund Class Y (A) | 4,029,639 | 41,182,910 |
| MEMBERS High Income Fund Class Y (A) | 3,521,269 | 24,578,459 |
| PIMCO Investment Grade Corporate Bond Fund Institutional Class | 2,353,462 | 24,664,280 |
| PIMCO Total Return Fund Institutional Class | 2,168,936 | |
| | | 137,763,357 |
| Foreign Bond Funds - 7.8% | | |
| Templeton Global Bond Fund Advisor Class | 1,340,594 | |
| Foreign Stock Funds - 4.9% | | |
| MEMBERS International Stock Fund Class Y (A) | 1,065,676 | |
| Money Market Funds - 1.1% | | |
| State Street Institutional U.S. Government Money Market Fund | 2,533,985 | |
| | | |
| Stock Funds - 25.9% | | |
| Calamos Growth and Income Fund Class I | 266,773 | $ 8,189,933 |
| Madison Mosaic Disciplined Equity Fund (A) | 1,133,295 | 14,370,182 |
| MEMBERS Equity Income Fund Class Y (A) | 585,893 | 5,958,534 |
| MEMBERS Large Cap Growth Fund Class Y (A) | 1,002,072 | 16,023,137 |
| MEMBERS Large Cap Value Fund Class Y (A) | 1,274,218 | |
| | | |
TOTAL INVESTMENTS - 99.3% ( Cost $220,460,642** ) | 229,532,082 |
| NET OTHER ASSETS AND LIABILITIES - 0.7% | |
| TOTAL NET ASSETS - 100.0% | |
| ** | Aggregate cost for Federal tax purposes was $223,258,002. |
| (A) | Affiliated Company (see Note 11). |
See accompanying Notes to Financial Statements.
Ultra Series Fund | December 31, 2010
Moderate Allocation Fund Portfolio of Investments
| | | |
| INVESTMENT COMPANIES - 99.0% | | |
| Bond Funds - 34.3% | | |
| Franklin Floating Rate Daily Access Fund Advisor Class | 622,951 | $ 5,712,459 |
| Madison Mosaic Institutional Bond Fund (A) | 1,491,757 | 16,319,818 |
| MEMBERS Bond Fund Class Y (A) | 3,647,154 | 37,273,918 |
| MEMBERS High Income Fund Class Y (A) | 4,319,368 | 30,149,187 |
| PIMCO Investment Grade Corporate Bond Fund Institutional Class | 2,076,478 | 21,761,490 |
| PIMCO Total Return Fund Institutional Class | 1,905,925 | |
| | | 131,896,155 |
| Foreign Bond Funds - 5.2% | | |
| Templeton Global Bond Fund Advisor Class | 1,474,024 | |
| Foreign Stock Funds - 10.0% | | |
| Matthews Asian Growth and Income Fund Institutional Shares | 659,315 | 11,894,036 |
| MEMBERS International Stock Fund Class Y (A) | 2,500,243 | |
| | | 38,346,607 |
| Money Market Funds - 0.9% | | |
| State Street Institutional U.S. Government Money Market Fund | 3,500,266 | |
| | | |
| Stock Funds - 48.6% | | |
| Calamos Growth and Income Fund Class I | 390,383 | $ 11,984,773 |
| Madison Mosaic Disciplined Equity Fund (A) | 2,713,986 | 34,413,338 |
| MEMBERS Equity Income Fund Class Y (A) | 1,157,056 | 11,767,256 |
| MEMBERS Large Cap Growth Fund Class Y (A) | 2,354,535 | 37,649,016 |
| MEMBERS Large Cap Value Fund Class Y (A) | 2,855,497 | 34,151,748 |
| MEMBERS Mid Cap Fund Class Y (A) | 1,925,389 | 12,438,010 |
| MEMBERS Small Cap Fund Class Y (A) | 1,301,695 | 14,344,676 |
| T Rowe Price New Era Fund | 126,762 | 6,611,923 |
| Yacktman Fund/The | 1,414,601 | |
| | | |
TOTAL INVESTMENTS - 99.0% ( Cost $356,006,918** ) | 380,489,042 |
| NET OTHER ASSETS AND LIABILITIES - 1.0% | |
| TOTAL NET ASSETS - 100.0% | |
| ** | Aggregate cost for Federal tax purposes was $362,253,196. |
| (A) | Affiliated Company (see Note 11). |
See accompanying Notes to Financial Statements.
Ultra Series Fund | December 31, 2010
Aggressive Allocation Fund Portfolio of Investments
| | | |
| INVESTMENT COMPANIES - 98.9% | | |
| Bond Funds - 6.7% | | |
| MEMBERS Bond Fund Class Y (A) | 59,161 | $ 604,620 |
| MEMBERS High Income Fund Class Y (A) | 943,557 | 6,586,028 |
| PIMCO Investment Grade Corporate Bond Fund Institutional Class | 135,703 | |
| | | 8,612,818 |
| Foreign Bond Funds - 2.7% | | |
| Templeton Global Bond Fund Advisor Class | 252,879 | 3,429,042 |
| Foreign Stock Funds - 14.5% | | |
| Matthews Asian Growth and Income Fund Institutional Shares | 338,254 | 6,102,106 |
| MEMBERS International Stock Fund Class Y (A) | 1,178,483 | |
| | | 18,570,456 |
| Money Market Funds - 1.2% | | |
| State Street Institutional U.S. Government Money Market Fund | 1,472,326 | |
| | | |
| Stock Funds - 73.8% | | |
| Calamos Growth and Income Fund Class I | 175,498 | $ 5,387,777 |
| Hussman Strategic Growth Fund | 463,452 | 5,695,829 |
| Madison Mosaic Disciplined Equity Fund (A) | 1,350,320 | 17,122,058 |
| MEMBERS Equity Income Fund Class Y (A) | 379,732 | 3,861,874 |
| MEMBERS Large Cap Growth Fund Class Y (A) | 909,744 | 14,546,805 |
| MEMBERS Large Cap Value Fund Class Y (A) | 1,143,737 | 13,679,090 |
| MEMBERS Mid Cap Fund Class Y (A) | 1,298,512 | 8,388,388 |
| MEMBERS Small Cap Fund Class Y (A) | 606,010 | 6,678,232 |
| T Rowe Price New Era Fund | 151,589 | 7,906,890 |
| Yacktman Fund/The | 659,077 | |
| | | |
TOTAL INVESTMENTS - 98.9% ( Cost $112,716,685** ) | 126,252,714 |
| NET OTHER ASSETS AND LIABILITIES - 1.1% | |
| TOTAL NET ASSETS - 100.0% | |
| ** | Aggregate cost for Federal tax purposes was $115,807,560. |
| (A) | Affiliated Company (see Note 11). |
See accompanying Notes to Financial Statements.
Ultra Series Fund | December 31, 2010
Money Market Fund Portfolio of Investments
| | | |
U.S. GOVERNMENT AND AGENCY OBLIGATIONS - 85.1% | |
| Fannie Mae (A) - 26.7% | | |
| 0.16%, 1/5/11 | $1,500,000 | $ 1,499,973 |
| 0.175%, 1/12/11 | 2,250,000 | 2,249,880 |
| 0.155%, 1/18/11 | 1,000,000 | 999,927 |
| 0.135%, 1/26/11 | 1,000,000 | 999,906 |
| 0.155%, 2/1/11 | 3,000,000 | 2,999,600 |
| 0.14%, 2/4/11 | 1,500,000 | 1,499,802 |
| 0.16%, 2/9/11 | 1,500,000 | 1,499,740 |
| 0.12%, 2/28/11 | 3,000,000 | 2,999,420 |
| 0.1%, 3/8/11 | 2,000,000 | 1,999,633 |
| 0.16%, 3/9/11 | 2,000,000 | |
| | | 18,747,285 |
| Federal Home Loan Bank (A) - 25.6% | | |
| 0.1%, 1/3/11 | 190,000 | 189,999 |
| 0.14%, 1/6/11 | 1,000,000 | 999,981 |
| 0.08%, 1/11/11 | 2,000,000 | 1,999,956 |
| 0.16%, 1/19/11 | 2,000,000 | 1,999,840 |
| 0.14%, 1/26/11 | 500,000 | 499,951 |
| 0.12%, 1/27/11 | 1,000,000 | 999,913 |
| 0.165%, 2/2/11 | 1,000,000 | 999,853 |
| 0.155%, 2/16/11 | 3,000,000 | 2,999,406 |
| 0.12%, 2/22/11 | 1,250,000 | 1,249,783 |
| 0.17%, 2/24/11 | 3,500,000 | 3,499,108 |
| 0.16%, 3/23/11 | 1,000,000 | 999,640 |
| 0.1%, 3/25/11 | 1,500,000 | |
| | | 17,937,084 |
| Freddie Mac (A) - 24.3% | | |
| 0.15%, 1/13/11 | 1,500,000 | 1,499,925 |
| 0.135%, 1/18/11 | 2,500,000 | 2,499,841 |
| 0.14%, 1/25/11 | 3,500,000 | 3,499,667 |
| 0.13%, 1/31/11 | 2,000,000 | 1,999,783 |
| 0.14%, 2/7/11 | 1,500,000 | 1,499,784 |
| 0.18%, 2/22/11 | 1,000,000 | 999,740 |
| 0.155%, 3/7/11 | 2,300,000 | 2,299,356 |
| 0.16%, 3/14/11 | 1,500,000 | 1,499,520 |
| 0.16%, 3/21/11 | 1,250,000 | |
| | | 17,047,177 |
| | | |
| U.S. Treasury Bills (A) - 8.5% | | |
| 0.114%, 1/20/11 | 3,000,000 | $ 2,999,819 |
| 0.13%, 2/17/11 | 3,000,000 | |
| | | |
Total U.S. Government and Agency Obligations ( Cost $59,730,856 ) | 59,730,856 |
| SHORT-TERM INVESTMENTS - 12.8% | | |
| Financial - 4.3% | | |
| National Rural Utilities Cooperative Finance Corp. (A), 0.213%, 1/18/11 | 3,000,000 | |
| Industrials - 8.5% | | |
| General Electric Capital Services Inc. (A), 0.203%, 2/14/11 | 3,000,000 | 2,999,262 |
| United Parcel Service Inc. (A), 0.152%, 1/11/11 | 3,000,000 | |
| | | |
Total Short-Term Investments ( Cost $8,998,840 ) | 8,998,840 |
| | | |
| INVESTMENT COMPANY - 2.2% | | |
| State Street Institutional U.S. Government Money Market Fund | 1,529,834 | |
Total Investment Company ( Cost $1,529,834 ) | |
TOTAL INVESTMENTS - 100.1% ( Cost $70,259,530** ) | 70,259,530 |
| NET OTHER ASSETS AND LIABILITIES - (0.1%) | |
| TOTAL NET ASSETS - 100.0% | |
| ** | Aggregate cost for Federal tax purposes was $70,259,530 |
| (A) | Rate noted represents annualized yield at time of purchase. |
See accompanying Notes to Financial Statements.
Ultra Series Fund | December 31, 2010
Bond Fund Portfolio of Investments
| | | |
| ASSET BACKED SECURITIES - 1.8% | | |
| ABSC Long Beach Home Equity Loan Trust, Series 2000-LB1, Class AF5 (A), 8.55%, 9/21/30 | $ 652,045 | $ 664,224 |
| Chase Issuance Trust, Series 2007-A17, Class A, 5.12%, 10/15/14 | 3,820,000 | 4,102,615 |
| New Century Home Equity Loan Trust, Series 2003-5, Class AI5 (B), 5.5%, 11/25/33 | 3,500,000 | |
Total Asset Backed Securities ( Cost $7,989,798 ) | | 8,321,492 |
| CORPORATE NOTES AND BONDS - 25.8% | | |
| Consumer Discretionary - 1.9% | | |
| American Association of Retired Persons (C) (D), 7.5%, 5/1/31 | 2,500,000 | 3,159,540 |
| DR Horton Inc., 5.25%, 2/15/15 | 1,140,000 | 1,128,600 |
| ERAC USA Finance LLC (C) (D), 6.7%, 6/1/34 | 4,400,000 | |
| | | 8,847,715 |
| Consumer Staples - 1.0% | | |
| PepsiCo Inc./NC, 4.65%, 2/15/13 | 1,165,000 | 1,254,480 |
| WM Wrigley Jr. Co. (C) (D), 3.05%, 6/28/13 | 3,170,000 | |
| | | 4,492,378 |
| Energy - 2.0% | | |
| Hess Corp., 7.875%, 10/1/29 | 2,460,000 | 3,087,349 |
| Transocean Inc., 6%, 3/15/18 | 1,400,000 | 1,470,409 |
| Transocean Inc., 7.5%, 4/15/31 | 2,310,000 | 2,475,280 |
| Valero Energy Corp., 7.5%, 4/15/32 | 2,275,000 | |
| | | 9,435,181 |
| Financials - 4.1% | | |
| American General Finance Corp., 5.85%, 6/1/13 | 2,885,000 | 2,618,137 |
| Goldman Sachs Group Inc./The, 5.7%, 9/1/12 | 2,750,000 | 2,935,237 |
| HCP Inc., 6.7%, 1/30/18 | 2,725,000 | 2,923,590 |
| Lehman Brothers Holdings Inc. * (E), 5.75%, 1/3/17 | 3,135,000 | 314 |
| Simon Property Group L.P., 5.875%, 3/1/17 | 1,060,000 | 1,163,574 |
| Swiss Re Solutions Holding Corp., 7%, 2/15/26 | 1,250,000 | 1,295,080 |
| UBS AG/Stamford CT, 5.75%, 4/25/18 | 750,000 | 815,048 |
| US Bank NA/Cincinnati OH, 6.3%, 2/4/14 | 2,000,000 | 2,231,264 |
| Wells Fargo & Co., 5.25%, 10/23/12 | 2,735,000 | 2,932,133 |
| Western Union Co./The, 5.93%, 10/1/16 | 2,065,000 | |
| | | 19,226,219 |
| Food & Drug Retailers - 0.2% | | |
| New Albertsons Inc., 7.5%, 2/15/11 | 1,055,000 | 1,056,319 |
| Health Care - 4.2% | | |
| Eli Lilly & Co., 6.57%, 1/1/16 | 2,600,000 | 3,055,726 |
| Genentech Inc., 5.25%, 7/15/35 | 1,740,000 | 1,764,050 |
| Medco Health Solutions Inc., 7.25%, 8/15/13 | 3,450,000 | 3,918,710 |
| | | |
| Merck & Co. Inc., 5.75%, 11/15/36 | $3,960,000 | $ 4,357,469 |
| Quest Diagnostics Inc./DE, 5.45%, 11/1/15 | 3,500,000 | 3,766,308 |
| Wyeth, 6.5%, 2/1/34 | 2,370,000 | |
| | | 19,632,748 |
| Industrials - 3.8% | | |
| Boeing Co./The, 8.625%, 11/15/31 | 760,000 | 1,031,441 |
| Boeing Co./The, 6.875%, 10/15/43 | 1,380,000 | 1,633,200 |
| Burlington Northern Santa Fe LLC, 8.125%, 4/15/20 | 2,925,000 | 3,698,583 |
| EI du Pont de Nemours & Co., 5%, 1/15/13 | 195,000 | 209,443 |
| General Electric Co., 5%, 2/1/13 | 3,200,000 | 3,420,713 |
| Lockheed Martin Corp., 7.65%, 5/1/16 | 1,450,000 | 1,764,804 |
| Norfolk Southern Corp., 5.59%, 5/17/25 | 1,268,000 | 1,310,043 |
| Norfolk Southern Corp., 7.05%, 5/1/37 | 1,400,000 | 1,673,034 |
| Southwest Airlines Co. 1994-A Pass Through Trust, Series A3, 8.7%, 7/1/11 | 3,148 | 3,243 |
| Waste Management Inc., 7.125%, 12/15/17 | 2,465,000 | |
| | | 17,635,434 |
| Information Technology - 1.2% | | |
| Cisco Systems Inc., 5.5%, 2/22/16 | 2,400,000 | 2,738,673 |
| Xerox Corp., 6.875%, 8/15/11 | 2,640,000 | |
| | | 5,469,278 |
| Materials - 1.2% | | |
| Westvaco Corp., 8.2%, 1/15/30 | 2,250,000 | 2,372,708 |
| Weyerhaeuser Co., 7.375%, 3/15/32 | 3,000,000 | |
| | | 5,405,366 |
| Telecommunication Services - 1.6% | | |
| Comcast Cable Communications Holdings Inc., 9.455%, 11/15/22 | 3,080,000 | 4,261,430 |
| Rogers Communications Inc. (F), 6.25%, 6/15/13 | 3,000,000 | |
| | | 7,596,419 |
| Utilities - 4.6% | | |
| Indianapolis Power & Light Co. (C) (D), 6.05%, 10/1/36 | 3,445,000 | 3,572,668 |
| Interstate Power & Light Co., 6.25%, 7/15/39 | 2,925,000 | 3,216,017 |
| Sierra Pacific Power Co., Series M, 6%, 5/15/16 | 3,250,000 | 3,681,038 |
| Southern Power Co., Series B, 6.25%, 7/15/12 | 3,500,000 | 3,762,994 |
| Southwestern Electric Power Co., Series E, 5.55%, 1/15/17 | 2,165,000 | 2,301,072 |
| Virginia Electric and Power Co., Series C, 5.1%, 11/30/12 | 1,165,000 | 1,252,085 |
| Wisconsin Electric Power Co., 6.5%, 6/1/28 | 3,000,000 | |
| | | |
Total Corporate Notes and Bonds ( Cost $116,461,022 ) | | 120,025,458 |
See accompanying Notes to Financial Statements.
Ultra Series Fund | December 31, 2010
Bond Fund Portfolio of Investments
| | | |
| MORTGAGE BACKED SECURITIES - 23.8% | | |
| Fannie Mae - 20.1% | | |
| 4%, 4/1/15 Pool # 255719 | 1,184,567 | $ 1,226,129 |
| 5.5%, 4/1/16 Pool # 745444 | 1,658,303 | 1,790,627 |
| 6%, 5/1/16 Pool # 582558 | 108,422 | 118,028 |
| 5.5%, 9/1/17 Pool # 657335 | 300,640 | 324,175 |
| 5.5%, 2/1/18 Pool # 673194 | 642,437 | 692,727 |
| 5%, 5/1/20 Pool # 813965 | 2,163,068 | 2,320,229 |
| 4.5%, 9/1/20 Pool # 835465 | 1,970,688 | 2,079,075 |
| 6%, 5/1/21 Pool # 253847 | 252,998 | 275,965 |
| 7%, 12/1/29 Pool # 762813 | 128,766 | 145,576 |
| 7%, 11/1/31 Pool # 607515 | 118,168 | 134,622 |
| 6.5%, 3/1/32 Pool # 631377 | 235,164 | 264,422 |
| 7%, 4/1/32 Pool # 641518 | 5,091 | 5,803 |
| 7%, 5/1/32 Pool # 644591 | 267,008 | 304,187 |
| 6.5%, 6/1/32 Pool # 545691 | 1,958,759 | 2,202,459 |
| 5.5%, 4/1/33 Pool # 690206 | 2,889,111 | 3,114,168 |
| 5%, 10/1/33 Pool # 254903 | 3,800,539 | 4,019,644 |
| 5.5%, 11/1/33 Pool # 555880 | 3,400,379 | 3,665,262 |
| 5%, 5/1/34 Pool # 782214 | 84,488 | 89,253 |
| 5%, 6/1/34 Pool # 778891 | 973,486 | 1,028,392 |
| 5.5%, 6/1/34 Pool # 780384 | 3,752,665 | 4,039,127 |
| 7%, 7/1/34 Pool # 792636 | 82,740 | 94,789 |
| 5.5%, 8/1/34 Pool # 793647 | 415,896 | 449,854 |
| 5.5%, 3/1/35 Pool # 810075 | 1,863,028 | 2,003,497 |
| 5.5%, 3/1/35 Pool # 815976 | 2,208,618 | 2,377,013 |
| 5.5%, 7/1/35 Pool # 825283 | 2,475,185 | 2,663,518 |
| 5%, 8/1/35 Pool # 829670 | 2,981,461 | 3,147,755 |
| 5.5%, 8/1/35 Pool # 826872 | 986,947 | 1,061,580 |
| 5%, 9/1/35 Pool # 820347 | 2,635,571 | 2,812,223 |
| 5%, 9/1/35 Pool # 835699 | 2,453,014 | 2,617,431 |
| 5%, 10/1/35 Pool # 797669 | 4,074,867 | 4,332,709 |
| 5.5%, 10/1/35 Pool # 836912 | 488,875 | 525,735 |
| 5%, 11/1/35 Pool # 844809 | 2,645,429 | 2,792,981 |
| 5%, 12/1/35 Pool # 850561 | 2,590,414 | 2,734,897 |
| 5.5%, 2/1/36 Pool # 851330 | 1,010,999 | 1,088,284 |
| 5.5%, 10/1/36 Pool # 896340 | 986,718 | 1,060,190 |
| 5.5%, 10/1/36 Pool # 901723 | 4,797,714 | 5,144,460 |
| 6.5%, 10/1/36 Pool # 894118 | 2,387,019 | 2,662,368 |
| 6%, 11/1/36 Pool # 902510 | 3,364,246 | 3,719,730 |
| 5.5%, 2/1/37 Pool # 905140 | 3,091,005 | 3,343,380 |
| 5.5%, 5/1/37 Pool # 899323 | 2,350,408 | 2,525,421 |
| 5.5%, 5/1/37 Pool # 928292 | 1,829,229 | 1,978,583 |
| 6%, 10/1/37 Pool # 947563 | 3,176,491 | 3,512,136 |
| 5.5%, 7/1/38 Pool # 986973 | 4,128,317 | 4,448,615 |
| 5%, 8/1/38 Pool # 988934 | 4,086,210 | 4,309,015 |
| 6.5%, 8/1/38 Pool # 987711 | 3,673,702 | |
| | | 93,331,247 |
| | | |
| Freddie Mac - 3.6% | | |
| 5%, 5/1/18 Pool # E96322 | 1,764,388 | $ 1,881,554 |
| 8%, 6/1/30 Pool # C01005 | 77,114 | 90,164 |
| 7%, 3/1/31 Pool # C48129 | 259,461 | 295,666 |
| 5%, 7/1/33 Pool # A11325 | 2,660,613 | 2,808,717 |
| 6%, 10/1/34 Pool # A28439 | 478,390 | 523,505 |
| 6%, 10/1/34 Pool # A28598 | 351,466 | 384,610 |
| 5.5%, 11/1/34 Pool # A28282 | 4,329,315 | 4,675,835 |
| 5%, 4/1/35 Pool # A32314 | 440,846 | 467,590 |
| 5%, 4/1/35 Pool # A32315 | 1,032,085 | 1,098,568 |
| 5%, 4/1/35 Pool # A32316 | 1,210,946 | 1,288,949 |
| 5%, 4/1/35 Pool # A32509 | 283,782 | 302,062 |
| 5%, 1/1/37 Pool # A56371 | 3,002,222 | |
| | | 16,971,550 |
| Ginnie Mae - 0.1% | | |
| 8%, 10/20/15 Pool # 2995 | 52,983 | 57,665 |
| 6.5%, 2/20/29 Pool # 2714 | 181,684 | 205,554 |
| 6.5%, 4/20/31 Pool # 3068 | 143,291 | |
| | | |
Total Mortgage Backed Securities ( Cost $102,183,351 ) | | 110,728,120 |
| U.S. GOVERNMENT AND AGENCY OBLIGATIONS - 44.7% | | |
| Fannie Mae - 1.5% | | |
| 5.25%, 8/1/12 | 2,400,000 | 2,563,918 |
| 4.625%, 10/15/14 | 3,905,000 | |
| | | 6,907,164 |
| Federal Farm Credit Bank - 1.0% | | |
| 5.875%, 10/3/16 | 4,000,000 | |
| Freddie Mac - 1.9% | | |
| 4.875%, 11/15/13 | 2,500,000 | 2,771,123 |
| 4.5%, 1/15/14 | 5,500,000 | |
| | | 8,817,157 |
| U.S. Treasury Bonds - 2.9% | | |
| 6.625%, 2/15/27 | 7,350,000 | 9,667,543 |
| 4.5%, 5/15/38 | 4,000,000 | |
| | | 13,788,791 |
| U.S. Treasury Notes - 37.4% | | |
| 0.875%, 1/31/11 | 3,000,000 | 3,001,524 |
| 4.75%, 3/31/11 | 1,485,000 | 1,501,184 |
| 1%, 7/31/11 | 5,000,000 | 5,022,265 |
| 4.625%, 12/31/11 | 23,100,000 | 24,078,146 |
| 1.375%, 2/15/12 | 11,400,000 | 11,528,250 |
| 4.625%, 2/29/12 | 6,425,000 | 6,739,472 |
| 1.375%, 5/15/12 | 2,625,000 | 2,659,863 |
| 4.875%, 6/30/12 | 6,000,000 | 6,396,330 |
| 3.625%, 5/15/13 | 4,000,000 | 4,276,248 |
See accompanying Notes to Financial Statements.
Ultra Series Fund | December 31, 2010
Bond Fund Portfolio of Investments
| | | |
U.S. GOVERNMENT AND AGENCY OBLIGATIONS (continued) | | |
U.S. Treasury Notes (continued) | | |
| 3.125%, 8/31/13 | 2,710,000 | $ 2,874,928 |
| 4%, 2/15/14 | 9,500,000 | 10,349,062 |
| 1.875%, 2/28/14 | 10,000,000 | 10,240,620 |
| 4.25%, 8/15/14 | 11,200,000 | 12,355,000 |
| 2.375%, 9/30/14 | 3,600,000 | 3,728,812 |
| 2.625%, 12/31/14 | 20,000,000 | 20,854,680 |
| 2.5%, 3/31/15 | 1,750,000 | 1,811,390 |
| 4.25%, 8/15/15 | 8,900,000 | 9,854,667 |
| 4.25%, 11/15/17 | 9,100,000 | 10,032,040 |
| 2.75%, 2/15/19 | 19,750,000 | 19,495,403 |
| 3.375%, 11/15/19 | 1,000,000 | 1,020,859 |
| 2.625%, 11/15/20 | 6,500,000 | |
| | | |
Total U.S. Government and Agency Obligations ( Cost $198,882,485 ) | | 208,161,197 |
| | | |
| INVESTMENT COMPANY - 3.1% | | |
| State Street Institutional U.S. Government Money Market Fund | 14,230,708 | |
Total Investment Company ( Cost $14,230,708 ) | | |
TOTAL INVESTMENTS - 99.2% ( Cost $439,747,364** ) | 461,466,975 |
| NET OTHER ASSETS AND LIABILITIES - 0.8% | |
| TOTAL NET ASSETS - 100.0% | |
| * | Non-income producing. |
| ** | Aggregate cost for Federal tax purposes was $439,784,418 |
| (A) | Stated interest rate is contingent upon sufficient collateral market value. If collateral market value falls below a stated level, the issuer will either initiate a clean-up call or increase the stated interest rate. |
| (B) | Floating rate or variable rate note. Rate shown is as of December 31, 2010. |
| (C) | Security sold within terms of a private placement memorandum exempt from registration under section 144A of the Securities Act of 1933, as amended, and may be sold only to dealers in that program or other "qualified institutional investors." |
| (D) | Illiquid security (See Note 2). |
| (E) | In default. Issuer is bankrupt. |
| (F) | Notes and bonds, issued by foreign entities, denominated in U.S. dollars. The aggregate of these securities is 0.72% of total net assets. |
See accompanying Notes to Financial Statements.
Ultra Series Fund | December 31, 2010
High Income Fund Portfolio of Investments
| | | |
| CORPORATE NOTES AND BONDS - 95.3% | | |
| Consumer Discretionary - 30.2% | | |
| Auto Components - 1.7% | | |
| American Axle & Manufacturing Holdings Inc. (A), 9.25%, 1/15/17 | $ 500,000 | $ 558,750 |
| American Axle & Manufacturing Inc., 7.875%, 3/1/17 | 200,000 | 204,750 |
| Goodyear Tire & Rubber Co./The, 10.5%, 5/15/16 | 500,000 | 570,000 |
| Tenneco Inc., 8.125%, 11/15/15 | 350,000 | |
| | | 1,704,500 |
| Consumer Finance - 0.5% | | |
| Ally Financial Inc. (A), 7.5%, 9/15/20 | 500,000 | 524,375 |
| Hotels, Restaurants & Leisure - 5.1% | | |
| Ameristar Casinos Inc., 9.25%, 6/1/14 | 500,000 | 535,000 |
| Boyd Gaming Corp., 6.75%, 4/15/14 | 200,000 | 196,500 |
| Isle of Capri Casinos Inc., 7%, 3/1/14 | 500,000 | 490,000 |
| MCE Finance Ltd. (A) (B), 10.25%, 5/15/18 | 500,000 | 573,125 |
| MGM Resorts International, 8.375%, 2/1/11 | 500,000 | 502,500 |
| MGM Resorts International, 6.75%, 9/1/12 | 500,000 | 497,500 |
| MGM Resorts International, 6.75%, 4/1/13 | 150,000 | 149,100 |
| Penn National Gaming Inc., 6.75%, 3/1/15 | 300,000 | 304,500 |
| Penn National Gaming Inc., 8.75%, 8/15/19 | 250,000 | 275,625 |
| Pinnacle Entertainment Inc., 8.625%, 8/1/17 | 500,000 | 545,000 |
| Pinnacle Entertainment Inc., 8.75%, 5/15/20 | 300,000 | 310,500 |
| Scientific Games International Inc. (A), 7.875%, 6/15/16 | 750,000 | |
| | | 5,127,475 |
| Household Durables - 1.1% | | |
| Jarden Corp., 7.5%, 5/1/17 | 500,000 | 526,875 |
| Spectrum Brands Holdings Inc. (A), 9.5%, 6/15/18 | 500,000 | |
| | | 1,076,250 |
| Leisure Equipment & Products - 0.3% | | |
| Easton-Bell Sports Inc., 9.75%, 12/1/16 | 250,000 | |
| Media - 14.3% | | |
| Allbritton Communications Co., 8%, 5/15/18 | 950,000 | 959,500 |
| Belo Corp., 8%, 11/15/16 | 500,000 | 538,750 |
| Cablevision Systems Corp., 7.75%, 4/15/18 | 250,000 | 261,875 |
| Cablevision Systems Corp., 8%, 4/15/20 | 250,000 | 267,500 |
| CCO Holdings LLC / CCO Holdings Capital Corp. (A), 8.125%, 4/30/20 | 1,000,000 | 1,052,500 |
| Cenveo Corp., 8.875%, 2/1/18 | 500,000 | 483,750 |
| Gray Television Inc., 10.5%, 6/29/15 | 500,000 | 503,750 |
| Hughes Network Systems LLC/HNS Finance Corp., 9.5%, 4/15/14 | 1,000,000 | 1,031,250 |
| Intelsat Jackson Holdings S.A. (B), 11.25%, 6/15/16 | 500,000 | 538,750 |
| | | |
| Intelsat Luxembourg S.A. (B), 11.25%, 2/4/17 | $1,250,000 | $ 1,362,500 |
| Interpublic Group of Cos. Inc./The (C), 4.25%, 3/15/23 | 125,000 | 139,219 |
| Lamar Media Corp., 6.625%, 8/15/15 | 250,000 | 256,250 |
| Lamar Media Corp., Series C, 6.625%, 8/15/15 | 500,000 | 507,500 |
| Liberty Media LLC (C) (D), 3.125%, 3/30/23 | 250,000 | 280,312 |
| LIN Television Corp., 6.5%, 5/15/13 | 950,000 | 952,375 |
| Mediacom Broadband LLC / Mediacom Broadband Corp., 8.5%, 10/15/15 | 500,000 | 502,500 |
| Nielsen Finance LLC / Nielsen Finance Co. (A), 7.75%, 10/15/18 | 500,000 | 517,500 |
| Quebecor Media Inc. (B), 7.75%, 3/15/16 | 500,000 | 516,250 |
| Sirius XM Radio Inc. (C), 3.25%, 10/15/11 | 250,000 | 249,063 |
| Unitymedia Hessen GmbH & Co. KG / Unitymedia NRW GmbH (A) (B), 8.125%, 12/1/17 | 1,000,000 | 1,045,000 |
| Viasat Inc., 8.875%, 9/15/16 | 500,000 | 532,500 |
| Virgin Media Finance PLC (B), 9.125%, 8/15/16 | 850,000 | 905,250 |
| XM Satellite Radio Inc. (A) (C), 7%, 12/1/14 | 250,000 | 306,875 |
| XM Satellite Radio Inc. (A), 7.625%, 11/1/18 | 500,000 | |
| | | 14,226,969 |
| Multiline Retail - 1.1% | | |
| Neiman Marcus Group Inc./The, PIK, 9%, 10/15/15 | 250,000 | 261,875 |
| Sears Holding Corp. (A), 6.625%, 10/15/18 | 850,000 | |
| | | 1,054,500 |
| Specialty Retail - 4.0% | | |
| KAR Auction Services Inc., 8.75%, 5/1/14 | 500,000 | 520,000 |
| Ltd. Brands Inc., 6.9%, 7/15/17 | 250,000 | 265,625 |
| Michaels Stores Inc., 11.375%, 11/1/16 | 1,500,000 | 1,635,000 |
| Penske Automotive Group Inc., 7.75%, 12/15/16 | 750,000 | 765,000 |
| Yankee Acquisition Corp./MA, Series B, 8.5%, 2/15/15 | 750,000 | |
| | | 3,965,625 |
| Textiles, Apparel & Luxury Goods - 2.2% | | |
| Hanesbrands Inc. (A), 6.375%, 12/15/20 | 250,000 | 237,500 |
| Iconix Brand Group Inc. (C), 1.875%, 6/30/12 | 900,000 | 904,500 |
| Levi Strauss & Co., 7.625%, 5/15/20 | 500,000 | 516,250 |
| Phillips-Van Heusen Corp., 7.375%, 5/15/20 | 500,000 | |
| | | 2,189,500 |
| Consumer Staples - 6.2% | | |
| ACCO Brands Corp., 10.625%, 3/15/15 | 250,000 | 281,250 |
| ACCO Brands Corp., 7.625%, 8/15/15 | 500,000 | 500,000 |
| Central Garden and Pet Co., 8.25%, 3/1/18 | 500,000 | 506,250 |
| Dole Food Co. Inc. (A), 8%, 10/1/16 | 200,000 | 211,000 |
| Ingles Markets Inc., 8.875%, 5/15/17 | 750,000 | 802,500 |
| NBTY Inc. (A), 9%, 10/1/18 | 1,000,000 | 1,067,500 |
See accompanying Notes to Financial Statements.
Ultra Series Fund | December 31, 2010
High Income Fund Portfolio of Investments
| | | |
CORPORATE NOTES AND BONDS (continued) | |
Consumer Staples (continued) | | |
| Pinnacle Foods Finance LLC / Pinnacle Foods Finance Corp. (A), 9.25%, 4/1/15 | $ 500,000 | $ 520,625 |
| Pinnacle Foods Finance LLC / Pinnacle Foods Finance Corp. (A), 8.25%, 9/1/17 | 500,000 | 511,250 |
| Sealy Mattress Co., 8.25%, 6/15/14 | 250,000 | 255,625 |
| Stater Brothers Holdings, 7.75%, 4/15/15 | 500,000 | 513,750 |
| SUPERVALU Inc., 8%, 5/1/16 | 500,000 | 478,750 |
| Tops Markets LLC (A), 10.125%, 10/15/15 | 500,000 | |
| | | 6,162,250 |
| Energy - 8.4% | | |
| Complete Production Services Inc., 8%, 12/15/16 | 750,000 | 776,250 |
| Continental Resources Inc./OK, 8.25%, 10/1/19 | 250,000 | 277,500 |
| EXCO Resources Inc., 7.5%, 9/15/18 | 750,000 | 735,000 |
| Exterran Holdings Inc. (A), 7.25%, 12/1/18 | 500,000 | 497,500 |
| Ferrellgas Partners L.P. / Ferrellgas Partners Finance Corp., 8.625%, 6/15/20 | 750,000 | 806,250 |
| Helix Energy Solutions Group Inc. (A), 9.5%, 1/15/16 | 150,000 | 154,125 |
| Helix Energy Solutions Group Inc. (C), 3.25%, 12/15/25 | 1,000,000 | 965,000 |
| Key Energy Services Inc., 8.375%, 12/1/14 | 750,000 | 791,250 |
| MarkWest Energy Partners L.P. / MarkWest Energy Finance Corp., Series B, 8.75%, 4/15/18 | 1,000,000 | 1,082,500 |
| Penn Virginia Corp., 4.5%, 11/15/12 | 1,000,000 | 990,000 |
| Petroplus Finance Ltd. (A) (B), 7%, 5/1/17 | 250,000 | 221,250 |
| Plains Exploration & Production Co., 10%, 3/1/16 | 500,000 | 558,750 |
| Regency Energy Partners LP/Regency Energy Finance Corp., 6.875%, 12/1/18 | 500,000 | |
| | | 8,361,625 |
| Financials - 2.2% | | |
| CIT Group Inc., 7%, 5/1/16 | 600,000 | 602,250 |
| Nuveen Investments Inc., 10.5%, 11/15/15 | 1,000,000 | 1,022,500 |
| Trans Union LLC/TransUnion Financing Corp. (A), 11.375%, 6/15/18 | 500,000 | |
| | | 2,194,750 |
| Health Care - 8.1% | | |
| AMGH Merger Sub Inc. (A), 9.25%, 11/1/18 | 500,000 | 525,000 |
| Biomet Inc., 10%, 10/15/17 | 250,000 | 273,125 |
| Biomet Inc., 11.625%, 10/15/17 | 750,000 | 828,750 |
| Capella Healthcare Inc. (A), 9.25%, 7/1/17 | 250,000 | 265,000 |
| DaVita Inc., 6.375%, 11/1/18 | 500,000 | 497,500 |
| Endo Pharmaceuticals Holdings Inc. (A), 7%, 12/15/20 | 500,000 | 510,000 |
| | | |
| HCA Inc., 5.75%, 3/15/14 | 250,000 | $ 246,250 |
| Hologic Inc. (C) (D), 2%, 12/15/37 | 500,000 | 468,125 |
| IASIS Healthcare LLC / IASIS Capital Corp., 8.75%, 6/15/14 | 500,000 | 513,125 |
| LifePoint Hospitals Inc., 3.5%, 5/15/14 | 1,000,000 | 1,008,750 |
| Omega Healthcare Investors Inc. (A), 6.75%, 10/15/22 | 500,000 | 495,625 |
| Stewart Enterprises Inc. (D) (E), 6.25%, 2/15/13 | 500,000 | 500,625 |
| Tenet Healthcare Corp. (A), 8%, 8/1/20 | 1,000,000 | 1,015,000 |
| Valeant Pharmaceuticals International (A), 7%, 10/1/20 | 1,000,000 | |
| | | 8,134,375 |
| Industrials - 17.4% | | |
| Affinion Group Inc., 11.5%, 10/15/15 | 750,000 | 780,000 |
| ARAMARK Corp., 8.5%, 2/1/15 | 1,750,000 | 1,828,750 |
| Avis Budget Car Rental LLC / Avis Budget Finance Inc. (D), 7.625%, 5/15/14 | 267,000 | 273,675 |
| Avis Budget Car Rental LLC / Avis Budget Finance Inc. (A), 8.25%, 1/15/19 | 500,000 | 505,000 |
| Baldor Electric Co., 8.625%, 2/15/17 | 750,000 | 840,000 |
| Bristow Group Inc., 7.5%, 9/15/17 | 750,000 | 791,250 |
| Casella Waste Systems Inc., 9.75%, 2/1/13 | 1,000,000 | 1,000,000 |
| FTI Consulting Inc., 7.75%, 10/1/16 | 750,000 | 772,500 |
| Gulfmark Offshore Inc. (D), 7.75%, 7/15/14 | 255,000 | 258,825 |
| Hertz Corp./The, 8.875%, 1/1/14 | 500,000 | 511,250 |
| Hertz Corp./The, 10.5%, 1/1/16 | 200,000 | 211,000 |
| Iron Mountain Inc., 7.75%, 1/15/15 | 268,000 | 268,670 |
| Mac-Gray Corp., 7.625%, 8/15/15 | 500,000 | 491,250 |
| Moog Inc., 7.25%, 6/15/18 | 500,000 | 522,500 |
| Pinafore LLC/Pinafore Inc. (A), 9%, 10/1/18 | 1,000,000 | 1,080,000 |
| RBS Global Inc./Rexnord LLC, 8.5%, 5/1/18 | 500,000 | 531,250 |
| RSC Equipment Rental Inc./RSC Holdings III LLC, 9.5%, 12/1/14 | 900,000 | 945,000 |
| ServiceMaster Co./The, PIK (A), 10.75%, 7/15/15 | 1,000,000 | 1,070,000 |
| Terex Corp., 8%, 11/15/17 | 550,000 | 555,500 |
| Texas Industries Inc. (A), 9.25%, 8/15/20 | 400,000 | 425,000 |
| Trinity Industries Inc. (C), 3.875%, 6/1/36 | 1,000,000 | 948,750 |
| United Rentals North America Inc., 10.875%, 6/15/16 | 250,000 | 285,625 |
| United Rentals North America Inc., 8.375%, 9/15/20 | 500,000 | 508,750 |
| USG Corp. (D), 9.75%, 1/15/18 | 500,000 | 485,000 |
| WCA Waste Corp. (E), 9.25%, 6/15/14 | 1,000,000 | 1,035,000 |
| West Corp./Old, 11%, 10/15/16 | 450,000 | |
| | | 17,412,795 |
See accompanying Notes to Financial Statements.
Ultra Series Fund | December 31, 2010
High Income Fund Portfolio of Investments
| | | |
CORPORATE NOTES AND BONDS (continued) | |
| Information Technology - 6.0% | | |
| ADC Telecommunications Inc. (D), 0.831%, 6/15/13 | $ 500,000 | $ 498,750 |
| Advanced Micro Devices Inc. (C), 6%, 5/1/15 | 477,000 | 480,578 |
| Advanced Micro Devices Inc., 8.125%, 12/15/17 | 250,000 | 265,000 |
| Advanced Micro Devices Inc. (A), 7.75%, 8/1/20 | 500,000 | 518,750 |
| Alcatel-Lucent USA Inc., Series B (C) (D), 2.875%, 6/15/25 | 1,100,000 | 1,038,125 |
| Buccaneer Merger Sub Inc. (A), 9.125%, 1/15/19 | 250,000 | 258,125 |
| SanDisk Corp., 1%, 5/15/13 | 500,000 | 481,250 |
| Sanmina-SCI Corp., 8.125%, 3/1/16 | 900,000 | 909,000 |
| SunGard Data Systems Inc., 10.625%, 5/15/15 | 750,000 | 826,875 |
| Syniverse Technologies Inc., Series B (E), 7.75%, 8/15/13 | 750,000 | |
| | | 6,041,453 |
| Materials - 5.6% | | |
| Cascades Inc. (B), 7.875%, 1/15/20 | 250,000 | 261,250 |
| Ferro Corp., 7.875%, 8/15/18 | 500,000 | 527,500 |
| FMG Resources August 2006 Pty Ltd. (A), 7%, 11/1/15 | 1,000,000 | 1,025,000 |
| Graham Packaging Co. LP/GPC Capital Corp. I (A), 8.25%, 1/1/17 | 500,000 | 520,000 |
| Graphic Packaging International Inc., 9.5%, 6/15/17 | 350,000 | 381,938 |
| Hexion US Finance Corp. / Hexion Nova Scotia Finance ULC, 8.875%, 2/1/18 | 250,000 | 267,188 |
| Huntsman International LLC, 5.5%, 6/30/16 | 500,000 | 483,750 |
| Reynolds Group Issuer Inc. / Reynolds Group Issuer LLC (A), 7.75%, 10/15/16 | 1,000,000 | 1,057,500 |
| Reynolds Group Issuer Inc. / Reynolds Group Issuer LLC (A), 8.5%, 5/15/18 | 250,000 | 251,250 |
| Reynolds Group Issuer Inc. / Reynolds Group Issuer LLC (A), 9%, 4/15/19 | 750,000 | |
| | | 5,552,563 |
| Telecommunication Services - 6.7% | | |
| Level 3 Communications Inc. (C), 3.5%, 6/15/12 | 850,000 | 807,500 |
| PAETEC Holding Corp., 8.875%, 6/30/17 | 900,000 | 960,750 |
| Qwest Communications International Inc. (D), 7.5%, 2/15/14 | 500,000 | 506,250 |
| Qwest Communications International Inc., Series B, 7.5%, 2/15/14 | 500,000 | 506,250 |
| Sprint Nextel Corp., 8.375%, 8/15/17 | 1,000,000 | 1,072,500 |
| | | |
| tw telecom holdings, Inc., 8%, 3/1/18 | $ 500,000 | $ 531,250 |
| Wind Acquisition Finance S.A. (A) (B), 11.75%, 7/15/17 | 1,000,000 | 1,127,500 |
| Windstream Corp., 8.625%, 8/1/16 | 600,000 | 631,500 |
| Windstream Corp., 7.875%, 11/1/17 | 250,000 | 262,812 |
| Windstream Corp., 7%, 3/15/19 | 250,000 | |
| | | 6,652,562 |
| Utilities - 4.5% | | |
| AES Corp./The, 8%, 6/1/20 | 500,000 | 530,000 |
| Calpine Corp. (A), 7.25%, 10/15/17 | 910,000 | 910,000 |
| Mirant Americas Generation LLC, 8.3%, 5/1/11 | 750,000 | 761,250 |
| Mirant Americas Generation LLC, 8.5%, 10/1/21 | 500,000 | 500,000 |
| Mirant North America LLC, 7.375%, 12/31/13 | 250,000 | 254,710 |
| NRG Energy Inc., 7.375%, 2/1/16 | 750,000 | 768,750 |
| NRG Energy Inc. (A), 8.25%, 9/1/20 | 250,000 | 256,250 |
| RRI Energy Inc., 7.625%, 6/15/14 | 500,000 | |
| | | |
Total Corporate Notes and Bonds ( Cost $89,402,564 ) | | 95,148,152 |
| | | |
| INVESTMENT COMPANY - 3.5% | | |
| State Street Institutional U.S. Government Money Market Fund | 3,495,898 | |
Total Investment Company ( Cost $3,495,898 ) | | |
TOTAL INVESTMENTS - 98.8% ( Cost $92,898,462** ) | 98,644,050 |
| NET OTHER ASSETS AND LIABILITIES - 1.2% | |
| TOTAL NET ASSETS - 100.0% | |
| ** | Aggregate cost for Federal tax purposes was $93,039,812 |
| (A) | Security sold within terms of a private placement memorandum exempt from registration under section 144A of the Securities Act of 1933, as amended, and may be sold only to dealers in that program or other "qualified institutional investors." |
| (B) | Notes and bonds, issued by foreign entities, denominated in U.S. dollars. The aggregate of these securities is 6.56% of total net assets. |
| (C) | Convertible. |
| (D) | Floating rate or variable rate note. Rate shown is as of December 31, 2010. |
| (E) | Illiquid security (See Note 2). |
| PIK | Payment in Kind. |
| PLC | Public Limited Company. |
| ULC | Unlimited Limited Company. |
See accompanying Notes to Financial Statements.
Ultra Series Fund | December 31, 2010
Diversified Income Fund Portfolio of Investments
| | | |
| COMMON STOCKS - 52.1% | | |
| Consumer Discretionary - 3.2% | | |
| McDonald’s Corp. | 42,000 | $ 3,223,920 |
| Omnicom Group Inc. | 83,000 | 3,801,400 |
| Time Warner Inc. | 68,000 | 2,187,560 |
| VF Corp. | 46,500 | |
| | | 13,220,250 |
| Consumer Staples - 8.3% | | |
| Altria Group Inc. | 85,000 | 2,092,700 |
| Avon Products Inc. | 112,000 | 3,254,720 |
| Coca-Cola Co./The | 81,900 | 5,386,563 |
| Diageo PLC, ADR | 29,000 | 2,155,570 |
| Kraft Foods Inc., Class A | 169,018 | 5,325,757 |
| PepsiCo Inc./NC | 81,000 | 5,291,730 |
| Philip Morris International Inc. | 87,200 | 5,103,816 |
| Procter & Gamble Co./The | 49,000 | 3,152,170 |
| Sysco Corp. | 74,000 | |
| | | 33,938,626 |
| Energy - 7.4% | | |
| Chevron Corp. | 124,500 | 11,360,625 |
| ConocoPhillips | 123,000 | 8,376,300 |
| Ensco PLC, ADR | 53,000 | 2,829,140 |
| Marathon Oil Corp. | 129,000 | 4,776,870 |
| Spectra Energy Corp. | 114,500 | |
| | | 30,204,290 |
| Financials - 6.2% | | |
| Axis Capital Holdings Ltd. | 88,000 | 3,157,440 |
| Bank of New York Mellon Corp./The | 109,100 | 3,294,820 |
| NYSE Euronext | 77,000 | 2,308,460 |
| Travelers Cos. Inc./The | 78,000 | 4,345,380 |
| US Bancorp | 165,000 | 4,450,050 |
| Wells Fargo & Co. | 149,000 | 4,617,510 |
| Willis Group Holdings PLC | 88,000 | |
| | | 25,221,100 |
| Health Care - 9.2% | | |
| Baxter International Inc. | 55,500 | 2,809,410 |
| Johnson & Johnson | 135,000 | 8,349,750 |
| Medtronic Inc. | 107,000 | 3,968,630 |
| Merck & Co. Inc. | 222,000 | 8,000,880 |
| Novartis AG, ADR | 80,000 | 4,716,000 |
| Pfizer Inc. | 540,019 | |
| | | 37,300,403 |
| Industrials - 5.3% | | |
| 3M Co. | 50,500 | 4,358,150 |
| Honeywell International Inc. | 43,000 | 2,285,880 |
| Illinois Tool Works Inc. | 87,000 | 4,645,800 |
| Lockheed Martin Corp. | 53,500 | 3,740,185 |
| | | |
| United Technologies Corp. | 26,800 | $ 2,109,696 |
| Waste Management Inc. | 117,400 | |
| | | 21,468,249 |
| Information Technology - 6.8% | | |
| Automatic Data Processing Inc. | 58,600 | 2,712,008 |
| Broadridge Financial Solutions Inc. | 146,000 | 3,201,780 |
| Intel Corp. | 346,000 | 7,276,380 |
| International Business Machines Corp. | 22,200 | 3,258,072 |
| Linear Technology Corp. | 66,000 | 2,282,940 |
| Microsoft Corp. | 201,000 | 5,611,920 |
| Paychex Inc. | 105,000 | |
| | | 27,588,650 |
| Materials - 1.6% | | |
| Air Products & Chemicals Inc. | 40,000 | 3,638,000 |
| Nucor Corp. | 65,000 | |
| | | 6,486,300 |
| Telecommunication Services - 2.4% | | |
| AT&T Inc. | 255,015 | 7,492,341 |
| Vodafone Group PLC, ADR | 82,000 | |
| | | 9,659,601 |
| Utilities - 1.7% | | |
| Duke Energy Corp. | 122,000 | 2,172,820 |
| Exelon Corp. | 60,000 | 2,498,400 |
| FirstEnergy Corp. | 67,000 | |
| | | |
Total Common Stocks ( Cost $182,320,005 ) | | 212,239,029 |
| | | |
| ASSET BACKED SECURITIES - 1.2% | | |
| ABSC Long Beach Home Equity Loan Trust, Series 2000-LB1, Class AF5 (A), 8.55%, 9/21/30 | $ 599,648 | 610,849 |
| CarMax Auto Owner Trust, Series 2007-2, Class B, 5.37%, 3/15/13 | 1,975,000 | 2,012,096 |
| Chase Issuance Trust, Series 2007-A17, Class A, 5.12%, 10/15/14 | 2,045,000 | |
Total Asset Backed Securities ( Cost $4,636,595 ) | | 4,819,241 |
| CORPORATE NOTES AND BONDS - 18.7% | | |
| Consumer Discretionary - 1.6% | | |
| American Association of Retired Persons (B) (C), 7.5%, 5/1/31 | 2,000,000 | 2,527,632 |
| DR Horton Inc., 5.25%, 2/15/15 | 515,000 | 509,850 |
| ERAC USA Finance LLC (B) (C), 6.7%, 6/1/34 | 1,850,000 | 1,917,094 |
| Royal Caribbean Cruises Ltd. (D), 7.25%, 6/15/16 | 1,600,000 | |
| | | 6,678,576 |
See accompanying Notes to Financial Statements.
Ultra Series Fund | December 31, 2010
Diversified Income Fund Portfolio of Investments
| | | |
CORPORATE NOTES AND BONDS (continued) | |
| Consumer Staples - 1.0% | | |
| Kraft Foods Inc., 6.5%, 11/1/31 | $2,025,000 | $ 2,252,503 |
| PepsiCo Inc./NC, 4.65%, 2/15/13 | 620,000 | 667,620 |
| WM Wrigley Jr. Co. (B) (C), 3.05%, 6/28/13 | 1,310,000 | |
| | | 4,258,182 |
| Energy - 1.3% | | |
| ConocoPhillips, 6.65%, 7/15/18 | 1,500,000 | 1,801,311 |
| Hess Corp., 7.875%, 10/1/29 | 1,150,000 | 1,443,273 |
| Transocean Inc., 6%, 3/15/18 | 750,000 | 787,719 |
| Transocean Inc., 7.5%, 4/15/31 | 1,030,000 | |
| | | 5,135,999 |
| Financials - 4.3% | | |
| American General Finance Corp., 5.85%, 6/1/13 | 1,115,000 | 1,011,862 |
| HCP Inc., 6.7%, 1/30/18 | 1,450,000 | 1,555,672 |
| Lehman Brothers Holdings Inc. * (E), 5.75%, 1/3/17 | 1,735,000 | 174 |
| National Rural Utilities Cooperative Finance Corp., Series C, 7.25%, 3/1/12 | 2,400,000 | 2,572,790 |
| Nationwide Health Properties Inc., Series D, 8.25%, 7/1/12 | 2,400,000 | 2,580,329 |
| Nissan Motor Acceptance Corp. (B) (C), 5.625%, 3/14/11 | 3,240,000 | 3,270,074 |
| Simon Property Group L.P., 5.875%, 3/1/17 | 530,000 | 581,787 |
| Swiss Re Solutions Holding Corp., 7%, 2/15/26 | 1,000,000 | 1,036,064 |
| US Bank NA/Cincinnati OH, 6.3%, 2/4/14 | 2,000,000 | 2,231,264 |
| Wells Fargo & Co., 5.25%, 10/23/12 | 1,450,000 | 1,554,513 |
| Western Union Co./The, 5.93%, 10/1/16 | 935,000 | |
| | | 17,441,295 |
| Food & Drug Retailers - 0.1% | | |
| New Albertsons Inc., 7.5%, 2/15/11 | 430,000 | 430,538 |
| Health Care - 3.1% | | |
| Amgen Inc., 5.85%, 6/1/17 | 3,950,000 | 4,508,917 |
| Eli Lilly & Co., 6.57%, 1/1/16 | 1,200,000 | 1,410,335 |
| Genentech Inc., 5.25%, 7/15/35 | 740,000 | 750,228 |
| Medco Health Solutions Inc., 7.25%, 8/15/13 | 1,550,000 | 1,760,580 |
| Merck & Co. Inc., 5.75%, 11/15/36 | 1,320,000 | 1,452,490 |
| Quest Diagnostics Inc./DE, 5.45%, 11/1/15 | 1,500,000 | 1,614,132 |
| Wyeth, 6.5%, 2/1/34 | 1,100,000 | |
| | | 12,782,561 |
| Industrials - 1.9% | | |
| Boeing Co./The, 8.625%, 11/15/31 | 350,000 | 475,006 |
| Boeing Co./The, 6.875%, 10/15/43 | 620,000 | 733,756 |
| Burlington Northern Santa Fe LLC, 8.125%, 4/15/20 | 1,365,000 | 1,726,005 |
| EI du Pont de Nemours & Co., 5%, 1/15/13 | 103,000 | 110,629 |
| | | |
| Lockheed Martin Corp., 7.65%, 5/1/16 | $ 780,000 | $ 949,343 |
| Norfolk Southern Corp., 5.59%, 5/17/25 | 957,000 | 988,731 |
| Norfolk Southern Corp., 7.05%, 5/1/37 | 1,050,000 | 1,254,775 |
| Waste Management Inc., 7.125%, 12/15/17 | 1,150,000 | |
| | | 7,586,955 |
| Information Technology - 0.3% | | |
| Cisco Systems Inc., 5.5%, 2/22/16 | 960,000 | 1,095,469 |
| Materials - 0.3% | | |
| Westvaco Corp., 8.2%, 1/15/30 | 1,025,000 | 1,080,900 |
| Telecommunication Services - 1.0% | | |
| Comcast Cable Communications Holdings Inc., 9.455%, 11/15/22 | 1,780,000 | 2,462,774 |
| Rogers Communications Inc. (D), 6.25%, 6/15/13 | 1,315,000 | |
| | | 3,924,611 |
| Utilities - 3.8% | | |
| Indianapolis Power & Light Co. (B) (C), 6.05%, 10/1/36 | 1,555,000 | 1,612,627 |
| Interstate Power & Light Co., 6.25%, 7/15/39 | 1,365,000 | 1,500,808 |
| MidAmerican Energy Co., 5.65%, 7/15/12 | 4,000,000 | 4,273,828 |
| Nevada Power Co., Series R, 6.75%, 7/1/37 | 1,600,000 | 1,816,019 |
| Sierra Pacific Power Co., Series M, 6%, 5/15/16 | 474,000 | 536,865 |
| Southern Power Co., Series B, 6.25%, 7/15/12 | 1,500,000 | 1,612,711 |
| Southwestern Electric Power Co., Series E, 5.55%, 1/15/17 | 835,000 | 887,481 |
| Virginia Electric and Power Co., Series C, 5.1%, 11/30/12 | 620,000 | 666,346 |
| Westar Energy Inc., 6%, 7/1/14 | 2,400,000 | |
| | | |
Total Corporate Notes and Bonds ( Cost $72,814,171 ) | | 75,993,859 |
| MORTGAGE BACKED SECURITIES - 11.4% | | |
| Fannie Mae - 9.7% | | |
| 4%, 4/1/15 Pool # 255719 | 556,135 | 575,647 |
| 5.5%, 4/1/16 Pool # 745444 | 640,864 | 692,001 |
| 6%, 5/1/16 Pool # 582558 | 198,774 | 216,385 |
| 5%, 12/1/17 Pool # 672243 | 1,188,616 | 1,271,262 |
| 4.5%, 9/1/20 Pool # 835465 | 1,211,488 | 1,278,120 |
| 6%, 5/1/21 Pool # 253847 | 215,237 | 234,776 |
| 7%, 12/1/29 Pool # 762813 | 60,302 | 68,174 |
| 7%, 11/1/31 Pool # 607515 | 118,168 | 134,622 |
| 7%, 4/1/32 Pool # 641518 | 2,727 | 3,108 |
| 7%, 5/1/32 Pool # 644591 | 146,792 | 167,231 |
| 5.5%, 10/1/33 Pool # 254904 | 1,017,836 | 1,097,123 |
| 5.5%, 11/1/33 Pool # 555880 | 3,400,379 | 3,665,262 |
| 5%, 5/1/34 Pool # 780890 | 3,385,991 | 3,576,965 |
| 7%, 7/1/34 Pool # 792636 | 39,603 | 45,370 |
See accompanying Notes to Financial Statements.
Ultra Series Fund | December 31, 2010
Diversified Income Fund Portfolio of Investments
| | | |
MORTGAGE BACKED SECURITIES (continued) | |
Fannie Mae (continued) | | |
| 5.5%, 8/1/34 Pool # 793647 | $ 401,798 | $ 434,604 |
| 5.5%, 3/1/35 Pool # 815976 | 2,142,850 | 2,306,230 |
| 5.5%, 7/1/35 Pool # 825283 | 1,029,037 | 1,107,335 |
| 5.5%, 8/1/35 Pool # 826872 | 433,088 | 465,838 |
| 5%, 9/1/35 Pool # 820347 | 1,077,171 | 1,149,369 |
| 5%, 9/1/35 Pool # 835699 | 1,026,802 | 1,095,625 |
| 5%, 10/1/35 Pool # 797669 | 1,276,464 | 1,357,234 |
| 5.5%, 10/1/35 Pool # 836912 | 1,068,302 | 1,148,850 |
| 5%, 12/1/35 Pool # 850561 | 1,083,639 | 1,144,081 |
| 5.5%, 12/1/35 Pool # 844583 | 2,479,328 | 2,667,201 |
| 5.5%, 2/1/36 Pool # 851330 | 454,079 | 488,791 |
| 5.5%, 9/1/36 Pool # 831820 | 1,985,932 | 2,161,733 |
| 6%, 9/1/36 Pool # 831741 | 912,243 | 1,002,019 |
| 5.5%, 10/1/36 Pool # 896340 | 443,955 | 477,012 |
| 5.5%, 10/1/36 Pool # 901723 | 1,799,143 | 1,929,173 |
| 5.5%, 12/1/36 Pool # 902853 | 1,880,090 | 2,025,958 |
| 5.5%, 12/1/36 Pool # 903059 | 1,754,028 | 1,901,626 |
| 5.5%, 12/1/36 Pool # 907512 | 1,589,499 | 1,707,855 |
| 5.5%, 12/1/36 Pool # 907635 | 1,900,084 | |
| | | 39,653,940 |
| Freddie Mac - 1.6% | | |
| 8%, 6/1/30 Pool # C01005 | 61,691 | 72,131 |
| 6.5%, 1/1/32 Pool # C62333 | 227,439 | 255,736 |
| 5%, 7/1/33 Pool # A11325 | 2,660,613 | 2,808,717 |
| 6%, 10/1/34 Pool # A28439 | 221,862 | 242,785 |
| 6%, 10/1/34 Pool # A28598 | 162,999 | 178,370 |
| 5%, 4/1/35 Pool # A32314 | 238,394 | 252,856 |
| 5%, 4/1/35 Pool # A32315 | 460,872 | 490,559 |
| 5%, 4/1/35 Pool # A32316 | 416,261 | 443,074 |
| 5%, 4/1/35 Pool # A32509 | 188,472 | 200,613 |
| 5%, 1/1/37 Pool # A56371 | 1,501,111 | |
| | | 6,522,006 |
| Ginnie Mae – 0.0% | | |
| 6.5%, 4/20/31 Pool # 3068 | 118,004 | |
Total Mortgage Backed Securities ( Cost $42,918,598 ) | | 46,309,443 |
| U.S. GOVERNMENT AND AGENCY OBLIGATIONS - 13.2% | | |
| U.S. Treasury Bond - 1.0% | | |
| 6.625%, 2/15/27 | 3,270,000 | 4,301,070 |
| U.S. Treasury Notes - 12.2% | | |
| 4.75%, 3/31/11 | 500,000 | 505,449 |
| 4.875%, 4/30/11 | 3,900,000 | 3,958,956 |
| 1%, 7/31/11 | 3,000,000 | 3,013,359 |
| 4.625%, 12/31/11 | 3,150,000 | 3,283,384 |
| | | |
| 1.375%, 2/15/12 | $1,125,000 | $ 1,137,656 |
| 4.625%, 2/29/12 | 3,400,000 | 3,566,413 |
| 1.375%, 5/15/12 | 1,312,000 | 1,329,425 |
| 4%, 11/15/12 | 2,500,000 | 2,661,522 |
| 3.625%, 5/15/13 | 1,980,000 | 2,116,743 |
| 3.125%, 8/31/13 | 1,175,000 | 1,246,509 |
| 4%, 2/15/14 | 4,810,000 | 5,239,894 |
| 4.25%, 8/15/14 | 4,965,000 | 5,477,016 |
| 2.375%, 9/30/14 | 1,400,000 | 1,450,093 |
| 2.5%, 3/31/15 | 795,000 | 822,889 |
| 4.5%, 2/15/16 | 3,550,000 | 3,975,169 |
| 4.25%, 11/15/17 | 5,100,000 | 5,622,352 |
| 2.75%, 2/15/19 | 1,300,000 | 1,283,242 |
| 3.375%, 11/15/19 | 1,000,000 | 1,020,859 |
| 2.625%, 11/15/20 | 1,900,000 | |
| | | |
Total U.S. Government and Agency Obligations ( Cost $51,330,589 ) | | 53,804,234 |
| | | |
| INVESTMENT COMPANY - 2.8% | | |
| State Street Institutional U.S. Government Money Market Fund | 11,588,883 | |
Total Investment Company ( Cost $11,588,883 ) | | |
TOTAL INVESTMENTS - 99.4% ( Cost $365,608,841** ) | 404,754,689 |
| NET OTHER ASSETS AND LIABILITIES - 0.6% | |
| TOTAL NET ASSETS - 100.0% | |
| * | Non-income producing. |
| ** | Aggregate cost for Federal tax purposes was $366,458,530. |
| (A) | Stated interest rate is contingent upon sufficient collateral market value. If collateral market value falls below a stated level, the issuer will either initiate a clean-up call or increase the stated interest rate. |
| (B) | Security sold within terms of a private placement memorandum exempt from registration under section 144A of the Securities Act of 1933, as amended, and may be sold only to dealers in that program or other "qualified institutional investors." |
| (C) | Illiquid security (See Note 2). |
| (D) | Notes and bonds, issued by foreign entities, denominated in U.S. dollars. The aggregate of these securities is 0.8% of total net assets. |
| (E) | In default. Issuer is bankrupt. |
| ADR | American Depositary Receipt. |
| PLC | Public Limited Company. |
See accompanying Notes to Financial Statements
Ultra Series Fund | December 31, 2010
Equity Income Fund Portfolio of Investments
| | | |
| COMMON STOCK - 84.1% | | |
| Consumer Discretionary - 12.7% | | |
| American Eagle Outfitters Inc. | 2,700 | $ 39,501 |
| Bed Bath & Beyond Inc.* | 1,000 | 49,150 |
| Best Buy Co. Inc. | 1,500 | 51,435 |
| Coach Inc. | 800 | 44,248 |
| Kohl’s Corp.* | 1,000 | 54,340 |
| TJX Cos. Inc. | 1,000 | |
| | | 283,064 |
| Energy - 10.8% | | |
| EOG Resources Inc. | 600 | 54,846 |
| Noble Corp.* | 1,600 | 57,232 |
| Petrohawk Energy Corp.* | 2,300 | 41,975 |
| Southwestern Energy Co.* | 1,200 | 44,916 |
| Weatherford International Ltd.* | 1,800 | |
| | | 240,009 |
| Financials - 18.5% | | |
| American Express Co. | 1,400 | 60,088 |
| Bank of New York Mellon Corp./The | 1,500 | 45,300 |
| Capital One Financial Corp. | 1,400 | 59,584 |
| Goldman Sachs Group Inc./The | 300 | 50,448 |
| IntercontinentalExchange Inc.* | 500 | 59,575 |
| Morgan Stanley | 1,600 | 43,536 |
| State Street Corp. | 1,000 | 46,340 |
| Wells Fargo & Co. | 1,500 | |
| | | 411,356 |
| Health Care - 18.1% | | |
| Celgene Corp.* | 1,000 | 59,140 |
| Community Health Systems Inc.* | 1,200 | 44,844 |
| Gilead Sciences Inc.* | 1,500 | 54,360 |
| Merck & Co.. Inc.c. | 1,500 | 54,060 |
| Mylan Inc./PA* | 1,900 | 40,147 |
| St Jude Medical Inc.* | 1,000 | 42,750 |
| Teva Pharmaceutical Industries Ltd. | 1,000 | 52,130 |
| UnitedHealth Group Inc. | 1,500 | |
| | | 401,596 |
| Industrials - 2.1% | | |
| Jacobs Engineering Group Inc.* | 1,000 | |
| | | |
| Information Technology - 21.9% | | |
| Adobe Systems Inc.* | 1,800 | $ 55,404 |
| Cisco Systems Inc.* | 3,500 | 70,805 |
| eBay Inc.* | 2,200 | 61,226 |
| Google Inc., Class A* | 100 | 59,397 |
| Hewlett-Packard Co. | 1,200 | 50,520 |
| Intel Corp. | 1,900 | 39,957 |
| Varian Semiconductor Equipment Associates Inc.* | 800 | 29,576 |
| Visa Inc., Class A | 1,000 | 70,380 |
| Yahoo! Inc.* | 3,000 | |
| | | |
Total Common Stock (Cost $1,764,607) | 1,869,030 |
| INVESTMENT COMPANIES - 4.3% | | |
| iPATH S&P 500 VIX Short-Term Futures ETN* | 1,500 | 56,385 |
| Powershares QQQ Nasdaq 100 | 700 | |
Total Investment Companies (Cost $92,149) | 94,514 |
| Repurchase Agreement - 21.0% | | |
| With U.S. Bank National Association issued 12/31/10 at 0.01%, due 1/3/11, collateralized by $475,509 in Freddie Mac Pool #E99143 due 9/1/18. Proceeds at maturity are $466,030 (Cost $466,030) | |
| | | |
TOTAL INVESTMENTS - 109.4% (Cost $2,322,785**) | 2,429,574 |
| NET OTHER ASSETS AND LIABILITIES - (4.0%) | (88,385) |
| Total Call Options Written - (5.4%) | |
| TOTAL ASSETS - 100.0% | |
| * | Non-income producing |
| ** | Aggregate cost for Federal tax purposes was $2,323,102. |
| ETN | Exchange Traded Note |
See accompanying Notes to Financial Statements.
Ultra Series Fund | December 31, 2010
Equity Income Fund Portfolio of Investments
| | | | |
| Adobe Systems Inc. | 10 | April 2011 | 32.00 | $ 1,735 |
| Adobe Systems Inc. | 8 | April 2011 | 34.00 | 836 |
| American Eagle Outfitters Inc. | 27 | May 2011 | 15.50 | 2,565 |
| American Express Co. | 14 | April 2011 | 44.00 | 2,954 |
| Bank of New York Mellon Corp./The | 15 | March 2011 | 29.00 | 3,217 |
| Bed Bath & Beyond Inc. | 10 | January 2011 | 45.00 | 4,300 |
| Best Buy Co. Inc. | 15 | June 2011 | 36.00 | 3,300 |
| Capital One Financial Corp. | 14 | March 2011 | 43.00 | 3,374 |
| Celgene Corp. | 7 | January 2011 | 62.50 | 329 |
| Coach Inc. | 8 | January 2011 | 40.00 | 12,280 |
| Community Health Systems Inc. | 12 | January 2011 | 33.00 | 5,580 |
| eBay Inc. | 22 | April 2011 | 29.00 | 2,937 |
| EOG Resources Inc. | 4 | January 2011 | 100.00 | 74 |
| Gilead Sciences Inc. | 10 | May 2011 | 40.00 | 1,195 |
| Goldman Sachs Group Inc./The | 2 | April 2011 | 170.00 | 1,720 |
| Goldman Sachs Group Inc./The | 1 | January 2011 | 160.00 | 968 |
| Google Inc. | 1 | January 2011 | 530.00 | 6,625 |
| Hewlett-Packard Co. | 7 | February 2011 | 44.00 | 486 |
| Intel Corp. | 19 | April 2011 | 20.00 | 3,078 |
| IntercontinentalExchange Inc. | 5 | January 2011 | 110.00 | 4,900 |
| iPATH S&P 500 VIX Short-Term Futures ETN | 15 | February 2011 | 40.00 | 3,675 |
| Jacobs Engineering Group Inc. | 10 | January 2011 | 41.00 | 4,950 |
| Kohl’s Corp. | 6 | February 2011 | 55.00 | 930 |
| Kohl’s Corp. | 4 | January 2011 | 55.00 | 330 |
| Merck & Co.. Inc. | 15 | April 2011 | 37.00 | 1,605 |
| Morgan Stanley | 16 | April 2011 | 27.00 | 2,992 |
| Mylan Inc./PA | 19 | April 2011 | 21.00 | 2,574 |
| Noble Corp. | 12 | March 2011 | 40.00 | 666 |
| Petrohawk Energy Corp. | 23 | March 2011 | 19.00 | 2,599 |
| Powershares QQQ Nasdaq 100 | 7 | January 2011 | 50.00 | 3,210 |
| Southwestern Energy Co. | 12 | March 2011 | 39.00 | 1,860 |
| St Jude Medical Inc. | 10 | April 2011 | 40.00 | 4,000 |
| State Street Corp. | 10 | January 2011 | 40.00 | 6,550 |
| TJX Cos. Inc. | 10 | April 2011 | 46.00 | 1,400 |
| UnitedHealth Group Inc. | 10 | March 2011 | 37.00 | 1,435 |
| UnitedHealth Group Inc. | 5 | January 2011 | 35.00 | 808 |
| Varian Semiconductor Equipment Associates Inc. | 8 | January 2011 | 35.00 | 1,980 |
| Visa Inc. | 4 | June 2011 | 75.00 | 1,560 |
| Visa Inc. | 6 | January 2011 | 75.00 | 189 |
| Weatherford International Ltd. | 18 | January 2011 | 17.50 | 9,585 |
| Wells Fargo & Co. | 15 | January 2011 | 30.00 | 2,370 |
| Yahoo! Inc. | 30 | February 2011 | 17.00 | |
TOTAL CALL OPTIONS WRITTEN (Premiums received $84,813) | | | | |
See accompanying Notes to Financial Statements.
Ultra Series Fund | December 31, 2010
Large Cap Value Fund Portfolio of Investments
| | | |
| COMMON STOCKS - 98.3% | | |
| Consumer Discretionary - 6.0% | | |
| Lowe’s Cos. Inc. | 265,000 | $ 6,646,200 |
| Omnicom Group Inc. | 200,000 | 9,160,000 |
| Time Warner Inc. | 165,000 | 5,308,050 |
| TJX Cos. Inc. | 120,000 | 5,326,800 |
| Viacom Inc. | 135,000 | |
| | | 31,788,400 |
| Consumer Staples - 10.2% | | |
| Avon Products Inc. | 180,000 | 5,230,800 |
| Diageo PLC, ADR | 57,000 | 4,236,810 |
| Kraft Foods Inc., Class A | 388,000 | 12,225,880 |
| PepsiCo Inc./NC | 195,000 | 12,739,350 |
| Philip Morris International Inc. | 100,000 | 5,853,000 |
| Procter & Gamble Co./The | 140,000 | 9,006,200 |
| Sysco Corp. | 170,000 | |
| | | 54,290,040 |
| Energy - 15.6% | | |
| Chevron Corp. | 195,046 | 17,797,948 |
| ConocoPhillips | 170,000 | 11,577,000 |
| Marathon Oil Corp. | 307,000 | 11,368,210 |
| Noble Corp. | 330,000 | 11,804,100 |
| Occidental Petroleum Corp. | 180,000 | 17,658,000 |
| Southwestern Energy Co. * | 328,000 | |
| | | 82,482,298 |
| Financials - 19.7% | | |
| American Express Co. | 193,000 | 8,283,560 |
| Arch Capital Group Ltd. * | 100,000 | 8,805,000 |
| Bank of New York Mellon Corp./The | 530,000 | 16,006,000 |
| JPMorgan Chase & Co. | 343,088 | 14,553,793 |
| NYSE Euronext | 185,000 | 5,546,300 |
| Travelers Cos. Inc./The | 173,500 | 9,665,685 |
| US Bancorp | 645,000 | 17,395,650 |
| Wells Fargo & Co. | 560,000 | 17,354,400 |
| Willis Group Holdings PLC | 205,000 | |
| | | 104,709,538 |
| Health Care - 14.8% | | |
| Baxter International Inc. | 120,000 | 6,074,400 |
| Johnson & Johnson | 320,000 | 19,792,000 |
| Medtronic Inc. | 265,000 | 9,828,850 |
| Merck & Co. Inc. | 448,500 | 16,163,940 |
| Novartis AG, ADR | 94,000 | 5,541,300 |
| Pfizer Inc. | 1,210,000 | |
| | | 78,587,590 |
| | | |
| Industrials - 9.5% | | |
| 3M Co. | 97,500 | $ 8,414,250 |
| General Electric Co. | 318,000 | 5,816,220 |
| Illinois Tool Works Inc. | 195,000 | 10,413,000 |
| Lockheed Martin Corp. | 141,000 | 9,857,310 |
| United Technologies Corp. | 68,000 | 5,352,960 |
| Waste Management Inc. | 284,000 | |
| | | 50,324,820 |
| Information Technology - 13.1% | | |
| Broadridge Financial Solutions Inc. | 270,000 | 5,921,100 |
| Cisco Systems Inc. * | 535,000 | 10,823,050 |
| Intel Corp. | 850,000 | 17,875,500 |
| International Business Machines Corp. | 89,600 | 13,149,696 |
| Microsoft Corp. | 497,000 | 13,876,240 |
| Western Union Co./The | 420,000 | |
| | | 69,444,986 |
| Materials - 2.9% | | |
| Air Products & Chemicals Inc. | 93,000 | 8,458,350 |
| Nucor Corp. | 160,000 | |
| | | 15,469,550 |
| Telecommunication Services - 3.4% | | |
| AT&T Inc. | 439,987 | 12,926,818 |
| Vodafone Group PLC, ADR | 187,000 | |
| | | 17,869,228 |
| Utilities - 3.1% | | |
| Exelon Corp. | 265,000 | 11,034,600 |
| NextEra Energy Inc. | 100,000 | |
| | | |
Total Common Stocks ( Cost $458,238,853 ) | | 521,200,050 |
| INVESTMENT COMPANY - 1.5% | | |
| State Street Institutional U.S. Government Money Market Fund | 8,194,094 | |
Total Investment Company ( Cost $8,194,094 ) | | |
TOTAL INVESTMENTS - 99.8% ( Cost $466,432,947** ) | 529,394,144 |
| NET OTHER ASSETS AND LIABILITIES - 0.2% | |
| TOTAL NET ASSETS - 100.0% | |
| * | Non-income producing. |
| ** | Aggregate cost for Federal tax purposes was $466,869,448. |
| ADR | American Depositary Receipt. |
| PLC | Public Limited Company. |
See accompanying Notes to Financial Statements.
Ultra Series Fund | December 31, 2010
Large Cap Growth Fund Portfolio of Investments
| | | |
| COMMON STOCKS - 95.7% | | |
| Consumer Discretionary - 8.7% | | |
| Amazon.com Inc. * | 53,160 | $ 9,568,800 |
| Lamar Advertising Co., Class A * | 114,515 | 4,562,278 |
| McDonald’s Corp. | 48,660 | 3,735,142 |
| Omnicom Group Inc. | 167,367 | 7,665,409 |
| Starbucks Corp. | 138,610 | 4,453,539 |
| Vitamin Shoppe Inc. * | 65,080 | 2,189,291 |
| Yum! Brands Inc. | 44,369 | |
| | | 34,350,758 |
| Consumer Staples - 8.1% | | |
| Coca-Cola Co./The | 220,335 | 14,491,433 |
| Diageo PLC, ADR | 51,520 | 3,829,481 |
| PepsiCo Inc./NC | 213,030 | |
| | | 32,238,164 |
| Energy - 18.2% | | |
| Apache Corp. | 33,300 | 3,970,359 |
| Exxon Mobil Corp. | 282,010 | 20,620,571 |
| Occidental Petroleum Corp. | 172,390 | 16,911,459 |
| Petrohawk Energy Corp. * | 453,100 | 8,269,075 |
| Schlumberger Ltd. | 93,150 | 7,778,025 |
| Southwestern Energy Co. * | 129,590 | 4,850,554 |
| Weatherford International Ltd. * | 415,540 | |
| | | 71,874,355 |
| Financials - 7.0% | | |
| Axis Capital Holdings Ltd. | 169,257 | 6,072,941 |
| Green Dot Corp., Class A * | 35,330 | 2,004,624 |
| IntercontinentalExchange Inc. * | 35,150 | 4,188,123 |
| T Rowe Price Group Inc. | 236,116 | |
| | | 27,504,615 |
| Health Care - 8.9% | | |
| Allergan Inc./United States | 97,695 | 6,708,715 |
| Celgene Corp. * | 288,455 | 17,059,229 |
| HMS Holdings Corp. * | 59,836 | 3,875,578 |
| Johnson & Johnson | 62,815 | 3,885,108 |
| UnitedHealth Group Inc. | 105,720 | |
| | | 35,346,179 |
| Industrials - 8.9% | | |
| 3M Co. | 44,625 | 3,851,138 |
| Boeing Co./The | 57,180 | 3,731,567 |
| Deere & Co. | 68,310 | 5,673,145 |
| Emerson Electric Co. | 168,915 | 9,656,871 |
| Illinois Tool Works Inc. | 151,775 | 8,104,785 |
| Roper Industries Inc. | 54,540 | |
| | | 35,185,998 |
| | | |
| Information Technology - 33.7% | | |
| Communications Equipment - 6.1% | | |
| Cisco Systems Inc. * | 763,400 | $ 15,443,582 |
| QUALCOMM Inc. | 179,390 | |
| | | 24,321,593 |
| Computers & Peripherals - 5.5% | | |
| Apple Inc. * | 67,790 | 21,866,342 |
| Electronic Equipment, Instruments & Components - 1.1% | | |
| FLIR Systems Inc. * | 142,585 | 4,241,904 |
| Internet Software & Services - 7.5% | | |
| eBay Inc. * | 159,770 | 4,446,399 |
| Google Inc., Class A * | 42,755 | |
| | | 29,841,586 |
| IT Services - 6.2% | | |
| International Business Machines Corp. | 77,534 | 11,378,890 |
| Visa Inc., Class A | 184,810 | |
| | | 24,385,818 |
| Semiconductors & Semiconductor Equipment - 3.3% | | |
| Intel Corp. | 406,385 | 8,546,276 |
| Varian Semiconductor Equipment Associates Inc. * | 118,213 | |
| | | 12,916,611 |
| Software - 4.0% | | |
| BMC Software Inc. * | 96,095 | 4,529,918 |
| Microsoft Corp. | 318,230 | 8,884,982 |
| Salesforce.com Inc. * | 17,510 | |
| | | 15,726,220 |
| Materials - 2.2% | | |
| Ecolab Inc. | 172,005 | |
Total Common Stocks ( Cost $294,555,017 ) | | 378,472,635 |
| INVESTMENT COMPANY - 4.1% | | |
| State Street Institutional U.S. Government Money Market Fund | 16,066,626 | |
Total Investment Company ( Cost $16,066,626 ) | | |
TOTAL INVESTMENTS - 99.8% ( Cost $310,621,643** ) | 394,539,261 |
| NET OTHER ASSETS AND LIABILITIES - 0.2% | |
| TOTAL NET ASSETS - 100.0% | |
| * | Non-income producing. |
| ** | Aggregate cost for Federal tax purposes was $313,016,067. |
| ADR | American Depositary Receipt. |
| PLC | Public Limited Company. |
See accompanying Notes to Financial Statements.
Ultra Series Fund | December 31, 2010
Mid Cap Fund Portfolio of Investments
| | | |
| COMMON STOCKS - 95.6% | | |
| Consumer Discretionary - 14.3% | | |
| Bed Bath & Beyond Inc. * | 170,288 | $ 8,369,655 |
| CarMax Inc. * | 209,128 | 6,667,001 |
| Lamar Advertising Co., Class A * | 205,425 | 8,184,132 |
| Lumber Liquidators Holdings Inc. * | 221,393 | 5,514,899 |
| Omnicom Group Inc. | 191,910 | 8,789,478 |
| Sears Holdings Corp. * | 81,928 | 6,042,190 |
| TJX Cos. Inc. | 171,420 | 7,609,334 |
| Yum! Brands Inc. | 117,377 | |
| | | 56,934,031 |
| Consumer Staples - 3.5% | | |
| Brown-Forman Corp., Class B | 95,671 | 6,660,615 |
| McCormick & Co. Inc./MD | 154,193 | |
| | | 13,835,215 |
| Energy - 8.9% | | |
| Contango Oil & Gas Co. * | 109,202 | 6,326,072 |
| Ensco PLC, ADR | 171,640 | 9,162,143 |
| EOG Resources Inc. | 72,646 | 6,640,571 |
| Noble Corp. | 193,560 | 6,923,641 |
| Southwestern Energy Co. * | 170,287 | |
| | | 35,426,270 |
| Financials - 22.1% | | |
| Arch Capital Group Ltd. * | 94,360 | 8,308,398 |
| Brookfield Asset Management Inc., Class A | 354,955 | 11,816,452 |
| Brookfield Properties Corp. | 434,225 | 7,611,964 |
| Brown & Brown Inc. | 347,331 | 8,315,104 |
| IntercontinentalExchange Inc. * | 67,294 | 8,018,080 |
| Leucadia National Corp. | 312,194 | 9,109,821 |
| Markel Corp. * | 21,083 | 7,972,115 |
| RLI Corp. | 115,587 | 6,076,409 |
| SEI Investments Co. | 305,434 | 7,266,275 |
| T Rowe Price Group Inc. | 110,010 | 7,100,045 |
| WR Berkley Corp. | 230,835 | |
| | | 87,914,925 |
| Health Care - 13.0% | | |
| Covance Inc. * | 143,814 | 7,393,478 |
| CR Bard Inc. | 81,430 | 7,472,831 |
| DENTSPLY International Inc. | 295,142 | 10,085,002 |
| IDEXX Laboratories Inc. * | 111,650 | 7,728,413 |
| Laboratory Corp. of America Holdings * | 114,852 | 10,097,788 |
| Techne Corp. | 136,500 | |
| | | 51,741,467 |
| | | |
| Industrials - 13.6% | | |
| Copart Inc. * | 295,411 | $ 11,033,601 |
| IDEX Corp. | 237,860 | 9,305,083 |
| Jacobs Engineering Group Inc. * | 148,760 | 6,820,646 |
| Knight Transportation Inc. | 291,920 | 5,546,480 |
| Ritchie Bros Auctioneers Inc. | 313,478 | 7,225,668 |
| Wabtec Corp./DE | 120,989 | 6,399,108 |
| Waste Management Inc. | 209,483 | |
| | | 54,054,224 |
| Information Technology - 12.0% | | |
| Adobe Systems Inc. * | 172,990 | 5,324,632 |
| Amphenol Corp., Class A | 115,610 | 6,101,896 |
| Blackboard Inc. * | 105,415 | 4,353,640 |
| Broadridge Financial Solutions Inc. | 366,584 | 8,039,187 |
| Factset Research Systems Inc. | 74,708 | 7,004,622 |
| FLIR Systems Inc. * | 310,705 | 9,243,474 |
| Western Union Co./The | 416,260 | |
| | | 47,797,399 |
| Materials - 5.8% | | |
| Ecolab Inc. | 139,425 | 7,029,809 |
| iShares COMEX Gold Trust, ETF * | 651,145 | 9,050,915 |
| Valspar Corp. | 200,021 | |
| | | 22,977,448 |
| Telecommunication Service - 2.2% | | |
| Crown Castle International Corp. * | 202,722 | |
Total Common Stocks ( Cost $320,089,441 ) | | 379,566,284 |
| INVESTMENT COMPANY - 4.4% | | |
| State Street Institutional U.S. Government Money Market Fund | 17,571,772 | 17,571,772 |
Total Investment Company ( Cost $17,571,772 ) | | |
TOTAL INVESTMENTS - 100.0% ( Cost $337,661,213** ) | 397,138,056 |
| NET OTHER ASSETS AND LIABILITIES – 0.0% | |
| TOTAL NET ASSETS - 100.0% | |
| * | Non-income producing. |
| ** | Aggregate cost for Federal tax purposes was $337,780,348. |
| ADR | American Depositary Receipt. |
| ETF | Exchange Traded Fund. |
| PLC | Public Limited Company. |
See accompanying Notes to Financial Statements.
Ultra Series Fund | December 31, 2010
Small Cap Fund Portfolio of Investments
| | | |
| COMMON STOCKS - 95.7% | | |
| Consumer Discretionary - 16.8% | | |
| Arbitron Inc. | 7,740 | $ 321,365 |
| Bally Technologies Inc. * | 2,770 | 116,866 |
| Cato Corp./The, Class A | 10,540 | 288,901 |
| CEC Entertainment Inc. * | 3,820 | 148,331 |
| Choice Hotels International Inc. | 3,820 | 146,191 |
| Dress Barn Inc./The * | 6,060 | 160,105 |
| Helen of Troy Ltd. * | 8,110 | 241,191 |
| Hibbett Sports Inc. * | 2,100 | 77,490 |
| Matthews International Corp., Class A | 4,440 | 155,311 |
| Sonic Corp. * | 14,440 | 146,133 |
| Stage Stores Inc. | 17,610 | 305,358 |
| Tempur-Pedic International Inc. * | 2,360 | |
| | | 2,201,784 |
| Consumer Staples - 3.3% | | |
| Casey’s General Stores Inc. | 2,580 | 109,676 |
| Herbalife Ltd. | 2,610 | 178,445 |
| Snyders-Lance Inc. | 6,370 | |
| | | 437,434 |
| Energy - 4.4% | | |
| Bristow Group Inc. * | 2,700 | 127,845 |
| Penn Virginia Corp. | 7,670 | 129,009 |
| SEACOR Holdings Inc. * | 1,800 | 181,962 |
| SM Energy Co. | 2,320 | |
| | | 575,534 |
| Financials - 23.2% | | |
| Alleghany Corp. * | 305 | 93,443 |
| American Campus Communities Inc., REIT | 3,820 | 121,323 |
| AMERISAFE Inc. * | 5,670 | 99,225 |
| Ares Capital Corp. | 14,863 | 244,942 |
| Assured Guaranty Ltd. | 7,400 | 130,980 |
| Delphi Financial Group Inc., Class A | 9,270 | 267,347 |
| DiamondRock Hospitality Co., REIT * | 9,529 | 114,348 |
| Education Realty Trust Inc., REIT | 15,410 | 119,736 |
| First Busey Corp. | 20,007 | 94,033 |
| First Midwest Bancorp Inc./IL | 15,530 | 178,906 |
| Hancock Holding Co. | 1,900 | 66,234 |
| International Bancshares Corp. | 8,150 | 163,244 |
| Mack-Cali Realty Corp., REIT | 2,200 | 72,732 |
| MB Financial Inc. | 7,130 | 123,492 |
| NewAlliance Bancshares Inc. | 8,170 | 122,387 |
| Northwest Bancshares Inc. | 17,380 | 204,389 |
| Platinum Underwriters Holdings Ltd. | 4,860 | 218,554 |
| Reinsurance Group of America Inc. | 4,140 | 222,359 |
| Validus Holdings Ltd. | 2,550 | 78,055 |
| Webster Financial Corp. | 11,580 | 228,126 |
| | | |
| Westamerica Bancorporation | 1,270 | |
| | | 3,034,302 |
| Health Care - 7.8% | | |
| Amsurg Corp. * | 7,690 | 161,105 |
| Charles River Laboratories International Inc. * | 5,800 | 206,132 |
| Corvel Corp. * | 3,130 | 151,336 |
| Haemonetics Corp. * | 900 | 56,862 |
| ICON PLC, ADR * | 11,830 | 259,077 |
| ICU Medical Inc. * | 5,070 | |
| | | 1,019,567 |
| Industrials - 22.8% | | |
| ACCO Brands Corp. * | 20,840 | 177,557 |
| Acuity Brands Inc. | 2,110 | 121,684 |
| Albany International Corp., Class A | 9,850 | 233,346 |
| Belden Inc. | 11,930 | 439,263 |
| Carlisle Cos. Inc. | 10,350 | 411,309 |
| ESCO Technologies Inc. | 4,190 | 158,550 |
| G&K Services Inc., Class A | 800 | 24,728 |
| GATX Corp. | 5,670 | 200,038 |
| Genesee & Wyoming Inc., Class A * | 5,100 | 270,045 |
| Kirby Corp. * | 4,630 | 203,951 |
| Mueller Industries Inc. | 6,600 | 215,820 |
| Standard Parking Corp. * | 5,890 | 111,262 |
| Sterling Construction Co. Inc. * | 3,590 | 46,814 |
| Unifirst Corp./MA | 1,270 | 69,913 |
| United Stationers Inc. * | 4,630 | |
| | | 2,979,720 |
| Information Technology - 7.7% | | |
| Coherent Inc. * | 1,870 | 84,412 |
| Diebold Inc. | 5,670 | 181,723 |
| Electronics for Imaging Inc. * | 6,165 | 88,221 |
| MAXIMUS Inc. | 3,240 | 212,479 |
| MTS Systems Corp. | 3,130 | 117,250 |
| NAM TAI Electronics Inc. * | 5,510 | 35,264 |
| Websense Inc. * | 6,800 | 137,700 |
| Zebra Technologies Corp., Class A * | 4,100 | |
| | | 1,012,808 |
| Materials - 4.7% | | |
| Aptargroup Inc. | 3,820 | 181,718 |
| Deltic Timber Corp. | 2,780 | 156,625 |
| Kraton Performance Polymers Inc. * | 800 | 24,760 |
| Zep Inc. | 12,840 | |
| | | 618,362 |
| Utilities - 5.0% | | |
| Atmos Energy Corp. | 4,050 | 126,360 |
| New Jersey Resources Corp. | 2,370 | 102,171 |
| Unisource Energy Corp. | 5,440 | 194,970 |
See accompanying Notes to Financial Statements.
Ultra Series Fund | December 31, 2010
Small Cap Fund Portfolio of Investments
| | | |
COMMON STOCKS (continued) | | |
Utilities (continued) | | |
| Westar Energy Inc. | 5,390 | $ 135,612 |
| WGL Holdings Inc. | 2,660 | |
| | | |
Total Common Stocks ( Cost $9,994,656 ) | | 12,533,772 |
| INVESTMENT COMPANY - 3.9% | | |
| State Street Institutional U.S. Government Money Market Fund | 508,051 | |
Total Investment Company ( Cost $508,051 ) | | |
TOTAL INVESTMENTS - 99.6% ( Cost $10,502,707** ) | 13,041,823 |
| NET OTHER ASSETS AND LIABILITIES - 0.4% | |
| TOTAL NET ASSETS - 100.0% | |
| * | Non-income producing. |
| ** | Aggregate cost for Federal tax purposes was $10,579,600. |
| ADR | American Depository Receipt. |
| PLC | Public Limited Company. |
| REIT | Real Estate Investment Trust. |
See accompanying Notes to Financial Statements.
Ultra Series Fund | December 31, 2010
International Stock Fund Portfolio of Investments
| | | |
| COMMON STOCKS - 98.3% | | |
| Australia - 2.2% | | |
| QBE Insurance Group Ltd. | 48,800 | $ 905,915 |
| Telstra Corp. Ltd. | 491,000 | |
| | | 2,307,039 |
| Belgium - 2.2% | | |
| Anheuser-Busch InBev N.V. | 39,900 | 2,282,026 |
| Brazil - 2.8% | | |
| Banco do Brasil S.A. | 87,870 | 1,663,178 |
| Cielo S.A. | 161,000 | |
| | | 2,967,666 |
| Canada - 1.8% | | |
| Potash Corp. of Saskatchewan Inc. | 6,200 | 963,080 |
| Rogers Communications Inc. | 25,300 | |
| | | 1,843,478 |
| China - 1.5% | | |
| Industrial & Commercial Bank of China | 1,275,700 | 946,993 |
| Weichai Power Co. Ltd. | 108,000 | |
| | | 1,614,629 |
| Denmark - 1.3% | | |
| Novo Nordisk A/S, B Shares | 11,800 | 1,330,608 |
| Finland - 0.9% | | |
| Sampo OYJ | 36,000 | 964,541 |
| France - 10.4% | | |
| BNP Paribas | 27,145 | 1,726,998 |
| Danone | 26,100 | 1,639,937 |
| Sanofi-Aventis S.A. | 40,312 | 2,577,628 |
| Technip S.A. | 16,800 | 1,551,284 |
| Total S.A. | 29,587 | 1,567,646 |
| Valeo S.A. * | 33,300 | |
| | | 10,953,134 |
| Germany - 4.5% | | |
| Bayerische Motoren Werke AG | 16,600 | 1,305,445 |
| SAP AG | 20,600 | 1,048,808 |
| Siemens AG | 19,319 | |
| | | 4,747,394 |
| Hong Kong - 1.2% | | |
| AIA Group Ltd. * | 85,000 | 238,942 |
| Kerry Properties Ltd. | 196,500 | |
| | | 1,257,745 |
| Israel - 0.9% | | |
| Teva Pharmaceutical Industries Ltd., ADR | 18,800 | 980,044 |
| Italy - 1.1% | | |
| Atlantia SpA | 56,060 | 1,143,921 |
| | | |
| Japan - 19.8% | | |
| Asics Corp. | 42,990 | $ 552,797 |
| Benesse Holdings Inc. | 19,100 | 879,837 |
| Canon Inc. | 45,400 | 2,354,157 |
| Daito Trust Construction Co. Ltd. | 32,910 | 2,253,721 |
| Don Quijote Co. Ltd. | 24,500 | 746,256 |
| eAccess Ltd. | 1,215 | 734,776 |
| Honda Motor Co. Ltd. | 48,400 | 1,916,566 |
| Hoya Corp. | 59,800 | 1,452,464 |
| JS Group Corp. | 43,400 | 955,238 |
| Keyence Corp. | 3,555 | 1,029,851 |
| Mitsubishi Corp. | 40,500 | 1,096,428 |
| Mitsubishi Estate Co. Ltd. | 71,000 | 1,316,985 |
| Nidec Corp. | 11,600 | 1,173,002 |
| Sumitomo Mitsui Financial Group Inc. | 44,400 | 1,581,535 |
| Yahoo! Japan Corp. | 4,164 | 1,615,544 |
| Yamada Denki Co. Ltd. | 17,510 | |
| | | 20,853,952 |
| Mexico - 0.9% | | |
| Grupo Televisa S.A., ADR * | 35,500 | 920,515 |
| Netherlands - 2.6% | | |
| ING Groep N.V. * | 154,570 | 1,503,698 |
| TNT N.V. | 47,745 | |
| | | 2,763,780 |
| Norway - 0.9% | | |
| Aker Solutions ASA | 58,280 | 991,301 |
| Russia - 1.0% | | |
| Sberbank of Russia | 293,700 | 1,000,636 |
| Singapore - 0.9% | | |
| Singapore Telecommunications Ltd. | 403,300 | 958,947 |
| South Korea - 2.3% | | |
| Hyundai Mobis * | 4,800 | 1,203,278 |
| Samsung Electronics Co. Ltd., GDR (A) | 2,890 | |
| | | 2,422,569 |
| Spain - 1.1% | | |
| Amadeus IT Holding S.A. * | 57,700 | 1,208,999 |
| Sweden - 0.9% | | |
| Assa Abloy AB | 35,200 | 991,785 |
| Switzerland - 7.1% | | |
| Julius Baer Group Ltd. | 23,500 | 1,100,856 |
| Nestle S.A. | 31,350 | 1,835,735 |
| Novartis AG | 49,497 | 2,908,941 |
| UBS AG * | 100,610 | |
| | | 7,497,258 |
See accompanying Notes to Financial Statements.
Ultra Series Fund | December 31, 2010
International Stock Fund Portfolio of Investments
| | | |
COMMON STOCKS (continued) | | |
| Turkey - 0.9% | | |
| Turkiye Garanti Bankasi AS, ADR | 175,800 | $ 905,370 |
| United Kingdom - 29.1% | | |
| AMEC PLC | 34,800 | 623,952 |
| BAE Systems PLC | 140,173 | 721,194 |
| BG Group PLC | 55,600 | 1,123,449 |
| BHP Billiton PLC | 52,700 | 2,096,017 |
| British American Tobacco PLC | 39,231 | 1,506,800 |
| GlaxoSmithKline PLC | 103,000 | 1,991,282 |
| HSBC Holdings PLC | 227,400 | 2,308,404 |
| Informa PLC | 225,853 | 1,434,918 |
| International Power PLC | 195,300 | 1,332,457 |
| Lloyds Banking Group PLC * | 1,466,838 | 1,502,524 |
| Prudential PLC | 232,000 | 2,416,230 |
| Royal Dutch Shell PLC | 69,400 | 2,313,889 |
| Standard Chartered PLC | 63,550 | 1,709,638 |
| Tullow Oil PLC | 53,600 | 1,053,789 |
| Unilever PLC | 72,600 | 2,221,932 |
| Vodafone Group PLC | 422,599 | 1,092,413 |
| WM Morrison Supermarkets PLC | 312,800 | 1,305,048 |
| WPP PLC | 112,600 | 1,386,003 |
| Xstrata PLC | 105,300 | |
| | | |
Total Common Stocks ( Cost $86,048,400 ) | | 103,518,903 |
| INVESTMENT COMPANY - 1.5% | | |
| United States - 1.5% | | |
| State Street Institutional U.S. Government Money Market Fund | 1,607,953 | |
Total Investment Company ( Cost $1,607,953 ) | | |
TOTAL INVESTMENTS - 99.8% ( Cost $87,656,353** ) | 105,126,856 |
| NET OTHER ASSETS AND LIABILITIES - 0.2% | |
| TOTAL NET ASSETS - 100.0% | |
| * | Non-income producing. |
| ** | Aggregate cost for Federal tax purposes was $89,317,517. |
| (A) | Security sold within terms of a private placement memorandum exempt from registration under section 144A of the Securities Act of 1933, as amended, and may be sold only to dealers in that program or other "qualified institutional investors." |
| ADR | American Depositary Receipt. |
| GDR | Global Depositary Receipt. |
| PLC | Public Limited Company. |
OTHER INFORMATION: Sector Concentration | |
| Consumer Discretionary | 13% |
| Consumer Staples | 10% |
| Energy | 9% |
| Financials | 26% |
| Health Care | 9% |
| Industrials | 10% |
| Information Technology | 11% |
| Materials | 5% |
| Money Market Funds | 2% |
| Telecommunication Services | 4% |
| Utilities | 1% |
| Net Other Assets and Liabilities | |
| | 100% |
See accompanying Notes to Financial Statements.
Ultra Series Fund | December 31, 2010
Target Retirement 2020 Fund Portfolio of Investments
| | | |
| INVESTMENT COMPANIES - 99.0% | | |
| Bond Funds - 35.2% | | |
| Franklin Floating Rate Daily Access Fund Advisor Class | 134,071 | $ 1,229,434 |
| MEMBERS Bond Fund Class Y (A) | 100,475 | 1,026,853 |
| MEMBERS High Income Fund Class Y (A) | 311,509 | 2,174,331 |
| PIMCO Investment Grade Corporate Bond Fund Institutional Class | 254,223 | 2,664,260 |
| PIMCO Total Return Fund Institutional Class | 243,810 | |
| | | 9,740,212 |
| Foreign Bond Funds - 6.7% | | |
| Templeton Global Bond Fund Advisor Class | 135,849 | 1,842,117 |
| Foreign Stock Funds - 7.8% | | |
| Matthews Asian Growth and Income Fund Institutional Shares | 48,451 | 874,048 |
| MEMBERS International Stock Fund Class Y (A) | 121,433 | |
| | | 2,158,814 |
| Money Market Funds - 1.7% | | |
| State Street Institutional U.S. Government Money Market Fund | 460,532 | 460,532 |
| | | |
| Stock Funds - 47.6% | | |
| Calamos Growth and Income Fund Class I | 27,667 | $ 849,368 |
| Hussman Strategic Growth Fund | 105,972 | 1,302,398 |
| iShares S&P 100 Index Fund ETF | 11,396 | 645,811 |
| Madison Mosaic Disciplined Equity Fund (A) | 192,131 | 2,436,223 |
| MEMBERS Equity Income Fund Class Y (A) | 68,516 | 696,809 |
| MEMBERS Large Cap Growth Fund Class Y (A) | 123,349 | 1,972,348 |
| MEMBERS Large Cap Value Fund Class Y (A) | 159,911 | 1,912,540 |
| MEMBERS Small Cap Fund Class Y (A) | 98,390 | 1,084,255 |
| T Rowe Price New Era Fund | 15,875 | 828,052 |
| Yacktman Fund/The | 87,654 | |
| | | |
TOTAL INVESTMENTS - 99.0% ( Cost $25,490,648** ) | 27,379,277 |
| NET OTHER ASSETS AND LIABILITIES - 1.0% | |
| TOTAL NET ASSETS - 100.0% | |
| ** | Aggregate cost for Federal tax purposes was $25,850,195. |
| (A) | Affiliated Company (see Note 11). |
| ETF | Exchange Traded Fund. |
See accompanying Notes to Financial Statements.
Ultra Series Fund | December 31, 2010
Target Retirement 2030 Fund Portfolio of Investments
| | | |
| INVESTMENT COMPANIES - 99.0% | | |
| Bond Funds - 26.1% | | |
| Franklin Floating Rate Daily Access Fund Advisor Class | 99,609 | $ 913,411 |
| MEMBERS Bond Fund Class Y (A) | 92,351 | 943,829 |
| MEMBERS High Income Fund Class Y (A) | 324,161 | 2,262,643 |
| PIMCO Investment Grade Corporate Bond Fund Institutional Class | 201,940 | 2,116,333 |
| PIMCO Total Return Fund Institutional Class | 176,726 | |
| | | 8,153,688 |
| Foreign Bond Funds - 5.8% | | |
| Templeton Global Bond Fund Advisor Class | 133,212 | 1,806,362 |
| Foreign Stock Funds - 11.0% | | |
| Matthews Asian Growth and Income Fund Institutional Shares | 72,316 | 1,304,585 |
| MEMBERS International Stock Fund Class Y (A) | 159,464 | 1,687,131 |
| Vanguard Emerging Markets ETF | 9,444 | |
| | | 3,446,445 |
| Money Market Funds - 1.6% | | |
| State Street Institutional U.S. Government Money Market Fund | 508,816 | 508,816 |
| | | |
| Stock Funds - 54.5% | | |
| Calamos Growth and Income Fund Class I | 31,442 | $ 965,271 |
| Hussman Strategic Growth Fund | 119,813 | 1,472,503 |
| iShares S&P 100 Index Fund ETF | 26,127 | 1,480,617 |
| Madison Mosaic Disciplined Equity Fund (A) | 243,730 | 3,090,492 |
| MEMBERS Equity Income Fund Class Y (A) | 69,522 | 707,042 |
| MEMBERS Large Cap Growth Fund Class Y (A) | 150,735 | 2,410,247 |
| MEMBERS Large Cap Value Fund Class Y (A) | 187,731 | 2,245,263 |
| MEMBERS Small Cap Fund Class Y (A) | 127,640 | 1,406,590 |
| T Rowe Price New Era Fund | 25,883 | 1,350,049 |
| Yacktman Fund/The | 115,874 | |
| | | |
TOTAL INVESTMENTS - 99.0% ( Cost $28,664,348** ) | 30,959,942 |
| NET OTHER ASSETS AND LIABILITIES - 1.0% | |
| TOTAL NET ASSETS - 100.0% | |
| ** | Aggregate cost for Federal tax purposes was $28,899,749. |
| (A) | Affiliated Company (see Note 11). |
| ETF | Exchange Traded Fund. |
See accompanying Notes to Financial Statements.
Ultra Series Fund | December 31, 2010
Target Retirement 2040 Fund Portfolio of Investments
| | | |
| INVESTMENT COMPANIES - 98.8% | | |
| Bond Funds - 16.5% | | |
| Franklin Floating Rate Daily Access Fund Advisor Class | 51,966 | $ 476,532 |
| MEMBERS Bond Fund Class Y (A) | 26,774 | 273,632 |
| MEMBERS High Income Fund Class Y (A) | 243,274 | 1,698,050 |
| PIMCO Investment Grade Corporate Bond Fund Institutional Class | 101,617 | 1,064,948 |
| PIMCO Total Return Fund Institutional Class | 74,301 | |
| | | 4,319,330 |
| Foreign Bond Funds - 4.8% | | |
| Templeton Global Bond Fund Advisor Class | 91,661 | 1,242,918 |
| Foreign Stock Funds - 12.6% | | |
| Matthews Asian Growth and Income Fund Institutional Shares | 62,537 | 1,128,163 |
| MEMBERS International Stock Fund Class Y (A) | 153,236 | 1,621,232 |
| Vanguard Emerging Markets ETF | 11,542 | |
| | | 3,305,142 |
| Money Market Funds - 1.5% | | |
| State Street Institutional U.S. Government Money Market Fund | 394,286 | 394,286 |
| | | |
| Stock Funds - 63.4% | | |
| Calamos Growth and Income Fund Class I | 41,800 | $ 1,283,273 |
| Hussman Strategic Growth Fund | 99,683 | 1,225,098 |
| iShares S&P 100 Index Fund ETF | 37,221 | 2,109,314 |
| Madison Mosaic Disciplined Equity Fund (A) | 224,178 | 2,842,576 |
| MEMBERS Equity Income Fund Class Y (A) | 66,526 | 676,574 |
| MEMBERS Large Cap Growth Fund Class Y (A) | 115,944 | 1,853,944 |
| MEMBERS Large Cap Value Fund Class Y (A) | 146,305 | 1,749,804 |
| MEMBERS Small Cap Fund Class Y (A) | 120,340 | 1,326,145 |
| T Rowe Price New Era Fund | 27,287 | 1,423,272 |
| Yacktman Fund/The | 125,310 | |
| | | |
TOTAL INVESTMENTS - 98.8% ( Cost $23,612,377** ) | 25,824,301 |
| NET OTHER ASSETS AND LIABILITIES - 1.2% | |
| TOTAL NET ASSETS - 100.0% | |
| ** | Aggregate cost for Federal tax purposes was $23,787,535. |
| (A) | Affiliated Company (see Note 11). |
| ETF | Exchange Traded Fund. |
See accompanying Notes to Financial Statements.
Ultra Series Fund | December 31, 2010
Statements of Assets and Liabilities as of December 31, 2010
| | Conservative Allocation Fund | | Aggressive Allocation Fund | |
| Assets: | | | | |
| Investments in securities, at cost | | | | |
| Unaffiliated issuers | $ 83,357,892 | $123,240,026 | $ 39,805,042 | $ 70,259,530 |
Affiliated issuers1 | 137,102,750 | 232,766,892 | 72,911,643 | – |
| Net unrealized appreciation (depreciation) | | | | |
| Unaffiliated issuers | (1,046,927) | 2,289,478 | 2,512,226 | – |
Affiliated issuers1 | | | | |
| Total investments at value | | | | |
| Receivables: | | | | |
| Fund shares sold | 165,197 | 505,254 | 217,974 | – |
| Dividends and interest | 1,465,922 | 3,391,942 | 1,262,175 | 197 |
| Due from Adviser | | | | |
| Total assets | | | | |
| Liabilities: | | | | |
| Payables: | | | | |
| Fund shares repurchased | 9,323 | 5,854 | – | 29,426 |
| Auditor fees | 4,100 | 9,800 | 4,100 | 5,400 |
| Management fees | 58,219 | 96,093 | 32,107 | 27,787 |
| Distribution fees – Class II | 7,342 | 6,167 | 298 | 103 |
| Compliance expense | | | | |
| Total liabilities | | | | |
| Net assets applicable to outstanding capital stock | | | | |
| Net assets consist of: | | | | |
| Paid-in capital | $230,702,772 | $415,201,387 | $136,368,477 | $ 70,211,054 |
| Accumulated undistributed net investment gain | 200,401 | 242,947 | 45,988 | – |
| Accumulated net realized loss on investments sold and foreign currency related transactions | (8,892,578) | (55,666,432) | (22,256,490) | – |
| Net unrealized appreciation of investments (including appreciation (depreciation) of foreign currency related transactions) | | | | |
| Net Assets | | | | |
| Class I Shares: | | | | |
| Net Assets | $195,656,651 | $352,544,833 | $126,269,621 | $ 69,633,641 |
| Shares of beneficial interest outstanding | 19,551,697 | 37,162,935 | 13,908,898 | 69,633,641 |
Net Asset Value and redemption price per share | | | | |
| Class II Shares: | | | | |
| Net Assets | $ 35,425,384 | $ 31,715,193 | $ 1,424,383 | $ 577,413 |
| Shares of beneficial interest outstanding | 3,542,345 | 3,345,851 | 157,069 | 577,413 |
Net Asset Value and redemption price per share | | | | |
| 1 | See Note 11 for information on affiliated issuers. |
See accompanying Notes to Financial Statements.
Ultra Series Fund | December 31, 2010
Statements of Assets and Liabilities as of December 31, 2010
| | | | | |
| Assets: | | | | |
| Investments in securities, at cost | | | | |
| Unaffiliated issuers | $439,747,364 | $ 92,898,462 | $365,608,841 | $ 2,322,785 |
Affiliated issuers1 | – | – | – | – |
| Net unrealized appreciation (depreciation) | | | | |
| Unaffiliated issuers | 21,719,611 | 5,745,588 | 39,145,848 | 106,789 |
Affiliated issuers1 | | | | |
| Total investments at value | | | | |
| Cash | – | – | – | 940 |
| Foreign currency (cost of $10,661) (Note 2) | – | – | – | – |
| Receivables: | | | | |
| Investments sold | – | – | – | 15,309 |
| Fund shares sold | 157,965 | 39,118 | 81,265 | – |
| Dividends and interest | 3,892,764 | 1,721,068 | 2,479,482 | 734 |
| Due from Adviser | – | – | – | – |
| Other assets | | | | |
| Total assets | | | | |
| Liabilities: | | | | |
| Payables: | | | | |
| Investments purchased | – | 484,562 | – | 105,369 |
| Fund shares repurchased | 1,326 | 9,067 | 11,938 | – |
| Audit fees | 17,700 | 3,600 | 17,300 | – |
| Management fees | 217,928 | 63,077 | 239,545 | – |
| Distribution fees – Class II | 7,144 | 846 | 4,456 | – |
| Compliance expense | 24,780 | 4,983 | 24,614 | – |
| Options written, at value (premiums received of $84,813) | | | | |
| Total liabilities | | | | |
| Net assets applicable to outstanding capital stock | | | | |
| Net assets consist of: | | | | |
| Paid-in capital | $457,273,227 | $107,077,149 | $416,516,667 | $ 2,140,446 |
| Accumulated undistributed net investment income (loss) | 342,572 | 93,670 | 282,108 | – |
| Accumulated net realized gain (loss) on investments sold, options and foreign currency related transactions | (14,086,584) | (13,078,306) | (48,927,040) | 9,140 |
| Net unrealized appreciation of investments (including appreciation (depreciation) of options and foreign currency related transactions) | | | | |
| Net Assets | | | | |
| Class I Shares: | | | | |
| Net Assets | $429,499,343 | $ 95,552,272 | $384,708,585 | $ 478,056 |
| Shares of beneficial interest outstanding | 41,737,582 | 10,147,364 | 23,151,837 | 46,105 |
Net Asset Value and redemption price per share | | | | |
| Class II Shares: | | | | |
| Net Assets | $ 35,749,483 | $ 4,285,829 | $ 22,308,998 | $ 1,743,281 |
| Shares of beneficial interest outstanding | 3,475,945 | 454,957 | 1,343,358 | 168,394 |
Net Asset Value and redemption price per share | | | | |
| 1 | See Note 11 for information on affiliated issuers. |
See accompanying Notes to Financial Statements.
Ultra Series Fund | December 31, 2010
Statements of Assets and Liabilities as of December 31, 2010
| | | | | Target Retirement 2020 Fund | Target Retirement 2030 Fund | Target Retirement 2040 Fund |
| | | | | | | | |
| | | | | | | | |
| $466,432,947 | $310,621,643 | $337,661,213 | $10,502,707 | $87,656,353 | $14,722,553 | $15,919,662 | $13,290,711 |
| – | – | – | – | – | 10,768,095 | 12,744,686 | 10,321,666 |
| | | | | | | | |
| 62,961,197 | 83,917,618 | 59,476,843 | 2,539,116 | 17,470,503 | 68,599 | 287,043 | 491,634 |
| | | | | | | |
| | | | | | | |
| – | – | – | – | – | – | – | – |
| – | – | – | – | 10,786 | – | – | – |
| | | | | | | | |
| – | 760,985 | – | 60,383 | 1,568 | – | – | – |
| 169,376 | 219,638 | 110,978 | 230 | 71,696 | 66,429 | 79,877 | 108,015 |
| 1,020,733 | 365,851 | 266,285 | 8,932 | 164,123 | 206,781 | 244,282 | 218,803 |
| – | – | – | – | – | 4,527 | 5,163 | 4,294 |
| | | | | | | |
| | | | | | | |
| | | | | | | | |
| | | | | | | | |
| – | – | – | – | 150,357 | – | – | – |
| – | 124,386 | 28,411 | 1,405 | 502 | – | – | – |
| 25,500 | 18,100 | 12,467 | 440 | 8,275 | 105 | 75 | 60 |
| 265,281 | 266,341 | 298,076 | 12,094 | 105,999 | 9,053 | 10,327 | 8,588 |
| 1,119 | 4,165 | 2,446 | 291 | 2,674 | – | – | – |
| 44,436 | 26,496 | 4,323 | 81 | – | 71 | 19 | 12 |
| | | | | | | |
| | | | | | | |
| | | | | | | |
| | | | | | | | |
| $594,781,876 | $369,734,149 | $448,291,091 | $12,538,717 | $129,120,536 | $26,826,758 | $29,631,021 | $24,354,817 |
| 99,876 | 43,934 | 105,029 | 884 | (268,045) | 21,164 | 28,384 | 26,328 |
(127,595,032) | (58,249,258) | (110,703,367) | (1,981,660) | (41,045,290) | (1,088,766) | (676,156) | (446,316) |
| | | | | | | |
| | | | | | | |
| | | | | | | | |
| $524,894,090 | $374,644,652 | $385,218,483 | $11,710,137 | $92,062,636 | $27,647,785 | $31,278,843 | $26,146,753 |
| 22,279,104 | 16,906,164 | 27,237,412 | 1,089,020 | 9,215,867 | 3,429,363 | 3,958,122 | 3,439,943 |
| | | | | | | |
| | | | | | | | |
| $5,353,827 | $20,801,791 | $11,951,113 | $1,386,920 | $13,241,605 | | | |
| 227,441 | 939,620 | 845,608 | 129,106 | 1,325,823 | | | |
| | | | | | | |
See accompanying Notes to Financial Statements.
Ultra Series Fund | December 31, 2010
Statements of Operations for the Period Ended December 31, 2010
| | Conservative Allocation Fund | | Aggressive Allocation Fund | |
| Investment Income: | | | | |
| Interest | $ 2,153 | $ 2,874 | $ 968 | $ 117,261 |
| Dividends | | | | |
| Unaffiliated issuers | 2,963,578 | 4,081,648 | 736,279 | – |
Affiliated issuers1 | 3,983,077 | 5,303,129 | 1,199,406 | – |
| Less: Foreign taxes withheld | | | | |
| Total investment income | | | | |
| Expenses: | | | | |
| Management fees | 631,649 | 1,084,295 | 365,838 | 367,232 |
| Audit fees | 6,600 | 16,300 | 6,600 | 9,000 |
| Trustees’ fees | 2,500 | 7,000 | 2,500 | 3,500 |
| Distribution fees – Class II | 62,282 | 51,762 | 2,008 | 742 |
| Compliance expense | | | | |
| Total expenses before reimbursement/waiver | – | – | – | 386,757 |
Less reimbursement/waiver2 | | | | |
| Total expenses net of reimbursement/waiver | | | | |
| Net Investment Income (Loss) | 6,243,595 | 8,219,996 | 1,557,353 | – |
| Net Realized and Unrealized Gain (Loss) on Investments | | | | |
| Net realized gain (loss) on investments (including net realized gain (loss) on foreign currency related transactions) | | | | |
| Options | – | – | – | – |
| Unaffiliated issuers | 4,368,863 | 5,033,611 | 892,429 | – |
Affiliated issuers1 | (725,483) | (2,607,971) | (823,478) | – |
| Capital gain distributions received from underlying funds | | | | |
| Unaffiliated issuers | 3,604,052 | 3,890,219 | 546,309 | – |
Affiliated issuers1 | 522,008 | 1,109,617 | 366,111 | – |
| Net change in unrealized appreciation (depreciation) on investments (including net unrealized appreciation (depreciation) on foreign currency related transactions) | | | | |
| Options | – | – | – | – |
| Unaffiliated issuers | (4,625,539) | (1,436,098) | 1,947,396 | – |
Affiliated issuers1 | | | | |
| Net Realized and Unrealized Gain on Investments and Options Transactions | | | | |
| Net Increase in Net Assets from Operations | | | | |
| 1 | See Note 11 for information on affiliated issuers. |
| 2 | Waiver includes advisory agreement fees of $268,754 and distribution fees of $742. |
See accompanying Notes to Financial Statements.
Ultra Series Fund | December 31, 2010
Statements of Operations for the Period Ended December 31, 2010
| | | | | | | |
| | | | | | | | |
$ 22,934,220 | $ 8,193,571 | $ 10,309,116 | $ 19 | $ 9,578 | $ 8,318 | $ 12,898 | $ 278 |
| | | | | | | | |
| 8 | 8 | 7,278,991 | 5,627 | 13,678,454 | 5,502,389 | 4,588,233 | 212,304 |
| – | – | – | – | – | – | – | – |
| | | | | | | |
| | | | | | | |
| | | | | | | | |
| 2,921,870 | 740,961 | 2,919,393 | 7,697 | 3,515,418 | 3,304,937 | 3,038,519 | 118,894 |
| 29,200 | 6,000 | 28,700 | 146 | 41,500 | 30,100 | 20,800 | 640 |
| 19,337 | 3,763 | 18,000 | 25 | 34,500 | 20,000 | 17,378 | 313 |
| 52,698 | 6,146 | 33,498 | 1,383 | 10,378 | 29,294 | 17,449 | 2,581 |
| | | | | | | |
| – | – | – | – | – | – | – | – |
| | | | | | | |
| | | | | | | |
| 19,886,343 | 7,431,726 | 14,547,308 | (3,605) | 10,041,801 | 2,098,277 | 1,426,201 | 90,074 |
| | | | | | | | |
| | | | | | | | |
| – | – | – | 24,936 | – | – | – | – |
| (776,528) | 2,864,620 | 13,803,156 | 40,885 | 12,524,176 | 45,547,695 | 38,533,473 | 1,388,131 |
| – | – | – | – | – | – | – | – |
| | | | | | | | |
| – | – | – | – | – | – | – | – |
| – | – | – | – | – | – | – | – |
| | | | | | | | |
| – | – | – | (35,038) | – | – | – | – |
| 12,715,837 | 650,950 | 18,841,915 | 106,789 | 20,216,492 | (1,480,283) | 22,164,950 | 2,037,319 |
| | | | | | | |
| | | | | | | |
| | | | | | | |
See accompanying Notes to Financial Statements.
Ultra Series Fund | December 31, 2010
Statements of Operations for the Period Ended December 31, 2010
| | | Target Retirement 2020 Fund | Target Retirement 2030 Fund | Target Retirement 2040 Fund |
| Investment Income: | | | | |
| Interest | $ 1,937 | $ 304 | $ 318 | $ 255 |
| Dividends | | | | |
| Unaffiliated issuers | 2,754,100 | 378,454 | 361,196 | 272,799 |
Affiliated issuers1 | – | 259,401 | 270,245 | 205,005 |
| Less: Foreign taxes withheld | | | | |
| Total investment income | | | | |
| Expenses: | | | | |
| Management fees | 1,140,087 | 90,695 | 96,332 | 81,517 |
| Audit fees | 13,675 | 165 | 125 | 100 |
| Trustees’ fees | 4,397 | 100 | 100 | 100 |
Distribution fees – Class II2 | 20,264 | – | – | – |
| Compliance expense | | | | |
| Total expenses before reimbursement/waiver | – | 91,031 | 96,576 | 81,729 |
| Less reimbursement/waiver | | | | |
| Total expenses net of reimbursement/waiver | | | | |
| Net Investment Income | 1,364,848 | 592,475 | 583,349 | 437,089 |
| Net Realized and Unrealized Gain (Loss) on Investments | | | | |
Net realized gain (loss) on investments (including net realized gain (loss) on foreign currency related transactions)2 | | | | |
| Unaffiliated issuers | (12,611,702) | 8,643 | 157,744 | 218,461 |
Affiliated issuers1 | – | (78,482) | (133,524) | (125,864) |
| Capital gain distributions received from underlying funds | | | | |
| Unaffiliated issuers | – | 441,922 | 373,445 | 216,784 |
Affiliated issuers1 | – | 61,154 | 63,439 | 60,448 |
| Net change in unrealized appreciation (depreciation)on investments (including net unrealized appreciation (depreciation) on foreign currency related transactions) | | | | |
| Net Realized and Unrealized Gain (Loss) on Investments | | | | |
| Net Increase (Decrease) in Net Assets from Operations | | | | |
| 1 | See Note 11 for information on affiliated issuers. |
| 2 | Includes foreign capital gains taxes paid of $27 for the Ultra International Stock Fund. |
See accompanying Notes to Financial Statements.
Ultra Series Fund | December 31, 2010
Statements of Changes in Net Assets
| | Conservative Allocation Fund | |
| | | | |
| Net Assets at beginning of period | $189,151,289 | $116,678,068 | $344,590,404 | $243,761,079 |
| Increase in net assets from operations: | | | | |
| Net investment income | 6,243,595 | 4,826,812 | 8,219,996 | 6,572,283 |
| Net realized gain (loss) on investment | 7,769,440 | (8,857,931) | 7,425,476 | (28,234,158) |
| Net change in unrealized appreciation (depreciation) on investments | | | | |
| Net increase (decrease) in net assets from operations | 17,228,663 | 24,246,360 | 35,612,978 | 55,907,017 |
| Distributions to shareholders from: | | | | |
| Net investment income | | | | |
| Class I | (7,654,294) | (4,767,331) | (10,317,104) | (6,702,184) |
| Class II | | | | |
| Total distributions | (8,982,364) | (4,991,218) | (11,196,100) | (6,860,559) |
| Capital Stock transactions: | | | | |
| Class I Shares | | | | |
| Shares sold | 30,294,841 | 48,197,600 | 37,578,345 | 52,588,638 |
| Issued in reinvestment of distributions | 7,654,294 | 4,767,331 | 10,317,104 | 6,702,184 |
| Shares redeemed | | | | |
| Net increase (decrease) in net assets from capital stock transactions | | | | |
Class II Shares1 | | | | |
| Shares sold | 21,941,860 | 12,467,744 | 18,891,332 | 12,754,353 |
| Issued in reinvestment of distributions | 1,328,070 | 223,887 | 878,996 | 158,375 |
| Shares redeemed | | | | |
| Net increase in net assets from capital share transactions | | | | |
| Total increase (decrease) in net assets | | | | |
| Net Assets at end of period | | | | |
| Undistributed net investment income (loss) | $ 200,401 | $ 76,082 | $ 242,947 | $ 103,446 |
| Capital Share transactions: | | | | |
| Class I Shares | | | | |
| Shares sold | 3,053,915 | 5,448,382 | 4,111,214 | 6,666,402 |
| Issued to shareholders in reinvestment of distributions | 765,160 | 514,619 | 1,088,307 | 791,400 |
| Shares redeemed | | | | |
| Net increase (decrease) in shares outstanding | | | | |
Class II Shares1 | | | | |
| Shares sold | 2,225,231 | 1,332,005 | 2,059,232 | 1,519,377 |
| Issued to shareholders in reinvestment of distributions | 132,811 | 23,296 | 92,735 | 17,861 |
| Shares redeemed | | | | |
| Net increase (decrease) in shares outstanding | | | | |
| 1 | Class II shares commenced investment operations on May 1, 2009 and are not available for the Target Retirement Funds. |
See accompanying Notes to Financial Statements.
Ultra Series Fund | December 31, 2010
Statements of Changes in Net Assets
| | Aggressive Allocation Fund | |
| | | | |
| Net Assets at beginning of period | $115,006,315 | $ 69,616,011 | $ 92,647,633 | $159,348,665 |
| Increase (decrease) in net assets from operations: | | | | |
| Net investment income (loss) | 1,557,353 | 1,300,679 | – | 5,409 |
| Net realized gain (loss) on investments and options transactions | 981,371 | (9,641,347) | – | – |
Net change in unrealized appreciation (depreciation) on investments and options transactions | | | | |
| Net increase (decrease) in net assets from operations | 13,256,806 | 24,161,343 | – | 5,409 |
| Distributions to shareholders from: | | | | |
| Net investment income | | | | |
| Class I | (1,957,002) | (1,429,089) | – | (5,409) |
| Class II | (20,174) | (4,716) | – | – |
| Net realized gains | | | | |
| Class I | – | | – | |
| Class II | | | | |
| Total distributions | | | | |
| Capital Stock transactions: | | | | |
| Class I Shares | | | | |
| Shares sold | 21,387,476 | 27,495,291 | 24,976,798 | 23,066,620 |
| Issued to shareholders in reinvestment of distributions | 1,957,002 | 1,429,089 | – | 5,409 |
| Shares redeemed | | | | |
| Net increase (decrease) from capital share transactions | | | | |
Class II Shares1 | | | | |
| Shares sold | 815,901 | 480,785 | 1,623,479 | 271,669 |
| Issued to shareholders in reinvestment of distributions | 20,174 | 4,716 | – | – |
| Shares redeemed | | | | |
| Net increase from capital share transactions | | | | |
| Total net increase (decrease) from capital stock transactions | | | | |
| Total increase (decrease) in net assets | | | | |
| Net Assets at end of period | | | | |
| Undistributed net investment income (loss) included in net assets | $ 45,988 | $ – | $ – | $ – |
| Capital Share transactions: | | | | |
| Class I Shares | | | | |
| Shares sold | 2,513,771 | 3,946,294 | 24,976,798 | 23,066,620 |
| Issued to shareholders in reinvestment of distributions | 215,569 | 177,871 | – | 5,409 |
| Shares redeemed | | | | |
| Net increase (decrease) in shares outstanding | | | | |
Class II Shares1 | | | | |
| Shares sold | 94,595 | 61,702 | 1,623,479 | 271,669 |
| Issued to shareholders in reinvestment of distributions | 2,225 | 568 | – | – |
| Shares redeemed | | | | |
| Net increase (decrease) in shares outstanding | | | | |
| 1 | Class II shares commenced investment operations on May 1, 2009 and are not available for the Target Retirement Funds. |
| 2 | The Equity Income Fund commenced investment operations on April 30, 2010. |
See accompanying Notes to Financial Statements.
Ultra Series Fund | December 31, 2010
Statements of Changes in Net Assets
| | | |
| | | | | | |
| $551,508,094 | $572,562,403 | $108,870,121 | $ 90,728,399 | $424,642,342 | $438,046,968 | $ – |
| | | | | | | |
| 19,886,343 | 23,291,118 | 7,431,726 | 7,977,724 | 14,547,308 | 16,805,881 | (3,605) |
| (776,528) | (9,641,583) | 2,864,620 | (1,908,133) | 13,803,156 | (45,549,349) | 65,821 |
| | | | | | |
| 31,825,652 | 33,830,744 | 10,947,296 | 29,265,648 | 47,192,379 | 40,278,617 | 133,967 |
| | | | | | | |
| | | | | | | |
| (17,920,685) | (23,057,764) | (7,114,840) | (8,050,694) | (13,512,500) | (16,548,568) | – |
| (1,415,679) | (239,898) | (303,771) | (54,824) | (740,470) | (141,616) | – |
| | | | | | | |
| – | | – | | – | | (11,456) |
| | | | | | |
| | | | | | |
| | | | | | | |
| | | | | | | |
| 24,922,679 | 58,018,601 | 9,178,883 | 6,765,253 | 6,186,073 | 10,140,953 | 450,000 |
| 17,920,685 | 23,057,764 | 7,114,840 | 8,050,694 | 13,512,500 | 16,548,568 | 11,456 |
| | | | | | |
| | | | | | |
| | | | | | | |
| 25,338,964 | 9,630,532 | 2,870,986 | 1,081,174 | 16,060,982 | 6,085,900 | 1,639,463 |
| 1,415,679 | 239,898 | 303,771 | 54,824 | 740,470 | 141,616 | 41,620 |
| | | | | | |
| | | | | | |
| | | | | | |
| | | | | | |
| | | | | | |
$ 342,572 | $ 249,769 | $ 93,670 | $ 66,140 | $ 282,108 | $ 209,484 | $ – |
| | | | | | | |
| | | | | | | |
| 2,367,180 | 5,718,500 | 944,926 | 792,157 | 382,789 | 701,712 | 45,000 |
| 1,746,484 | 2,296,864 | 756,070 | 923,541 | 815,184 | 1,126,943 | 1,105 |
| | | | | | |
| | | | | | |
| | | | | | | |
| 2,391,169 | 938,118 | 298,803 | 121,539 | 995,293 | 407,839 | 164,579 |
| 138,090 | 23,607 | 32,256 | 6,021 | 44,665 | 9,162 | 4,021 |
| | | | | | |
| | | | | | |
See accompanying Notes to Financial Statements.
Ultra Series Fund | December 31, 2010
Statements of Changes in Net Assets
| | | |
| | | | |
| Net Assets at beginning of period | $633,315,527 | $609,443,601 | $439,485,846 | $352,473,289 |
| Increase (decrease) in net assets from operations: | | | | |
| Net investment income (loss) | 10,041,801 | 12,901,396 | 2,098,277 | 2,811,433 |
| Net realized gain (loss) on investments | 12,524,176 | (41,096,851) | 45,547,695 | (15,751,601) |
| Net change in unrealized appreciation (depreciation) | | | | |
| Net increase (decrease) in net assets from operations | 42,782,469 | 92,648,626 | 46,165,689 | 128,105,482 |
| Distributions to shareholders from: | | | | |
| Net investment income | | | | |
| Class I | (9,874,790) | (12,916,238) | (2,008,954) | (2,778,954) |
| Class II | | | | |
| Total distributions | | | | |
| Capital Stock transactions: | | | | |
| Class I Shares | | | | |
Shares sold1 | 10,390,330 | 23,903,274 | 12,483,565 | 22,586,452 |
| Issued to shareholders in reinvestment of distributions | 9,874,790 | 12,916,238 | 2,008,954 | 2,778,954 |
| Shares redeemed | | | | |
| Net increase (decrease) from capital share transactions | | | | |
Class II Shares2 | | | | |
Shares sold1 | 2,505,643 | 2,364,778 | 12,822,773 | 5,465,138 |
| Issued to shareholders in reinvestment of distributions | 92,316 | 22,315 | 80,740 | 15,228 |
| Shares redeemed | | | | |
| Net increase from capital share transactions | | | | |
| Total net increase (decrease) from capital stock transactions | | | | |
| Total increase (decrease) in net assets | | | | |
| Net Assets at end of period | | | | |
| Undistributed net investment income | $ 99,876 | $ 133,000 | $ 43,934 | $ 35,351 |
| Capital Share transactions: | | | | |
| Class I Shares | | | | |
Shares sold1 | 452,699 | 1,259,034 | 617,902 | 1,369,916 |
| Issued to shareholders in reinvestment of distributions | 420,253 | 660,509 | 90,753 | 152,387 |
Shares redeemed3 | | | | |
| Net increase (decrease) from capital share transactions | | | | |
Class II Shares2 | | | | |
Shares sold1 | 113,216 | 115,293 | 637,399 | 301,926 |
| Issued to shareholders in reinvestment of distributions | 3,928 | 998 | 3,643 | 759 |
Shares redeemed3 | | | | |
| Net increase from capital share transactions | | | | |
| 1 | A portion of the shares sold for the Mid Cap, Small Cap and International Stock Funds are merger related. See Note 12. |
| 2 | Class II shares commenced investment operations on May 1, 2009 and are not available for the Target Retirement Funds. |
| 3 | Included in these amounts are 55,587,696 shares of Class I and 975,111 shares of Class II, redeemed as part of a reverse stock split resulting from the Mid Cap merger effective May 1, 2010. See Note 12. |
See accompanying Notes to Financial Statements.
Ultra Series Fund | December 31, 2010
Statements of Changes in Net Assets
| | | Target Retirement 2020 Fund |
| | | | | | | |
| $231,140,313 | $166,464,913 | $ 8,605,016 | $ 5,985,697 | $ 81,959,251 | $ 72,768,214 | $ 19,299,907 | $ 8,718,521 |
| | | | | | | | |
| $1,426,201 | (104,120) | 90,074 | 51,771 | 1,364,848 | 1,544,670 | 592,475 | 433,236 |
| 38,533,473 | (37,900,000) | 1,388,131 | (617,038) | (12,611,702) | (8,729,999) | 433,236 | 555,068 |
| | | | | | | |
| 62,124,624 | 77,513,498 | 3,515,524 | 2,056,428 | (1,524,165) | 19,266,686 | 2,067,702 | 3,588,736 |
| | | | | | | | |
| | | | | | | | |
| (1,297,752) | (5,837) | (77,264) | (40,097) | (1,747,310) | (1,466,292) | (890,022) | (323,699) |
| | | | | | | |
| | | | | | | |
| | | | | | | | |
| | | | | | | | |
| 193,863,822 | 18,490,085 | 10,030,126 | 856,902 | 44,238,040 | 4,628,487 | 10,542,189 | 8,086,115 |
| 1,297,752 | 5,837 | 77,264 | 40,097 | 1,747,310 | 1,466,292 | 890,022 | 323,699 |
| | | | | | | |
| | | | | | | |
| | | | | | | | |
| 9,080,395 | 1,594,503 | 579,122 | 551,876 | 8,220,151 | 3,704,941 | | |
| 23,971 | – | 7,146 | 809 | 164,100 | 63,227 | | |
| | | | | | | |
| | | | | | | |
| | | | | | | |
| | | | | | | |
| | | | | | | |
$ 105,029 | $ – | $ 884 | $ 891 | $ (268,045) | $ 65,549 | $ 21,164 | $ – |
| | | | | | | | |
| | | | | | | | |
| 40,430,546 | 5,174,854 | 1,150,799 | 135,378 | 3,857,990 | 594,689 | 1,339,863 | 1,201,511 |
| 91,523 | 1,753 | 7,118 | 5,318 | 178,541 | 156,897 | 110,405 | 43,937 |
| | | | | | | |
| | | | | | | |
| | | | | | | | |
| 1,438,260 | 394,534 | 63,338 | 72,869 | 899,702 | 410,041 | | |
| 1,692 | – | 658 | 93 | 16,689 | 6,626 | | |
| | | | | | | |
| | | | | | | |
See accompanying Notes to Financial Statements.
Ultra Series Fund | December 31, 2010
Statements of Changes in Net Assets
| | Target Retirement 2030 Fund | Target Retirement 2040 Fund |
| | | | |
| Net Assets at beginning of period | $ 19,330,304 | $ 8,010,286 | $ 16,656,174 | $ 6,385,244 |
| Increase (decrease) in net assets from operations: | | | | |
| Net investment income | 583,349 | 244,296 | 437,089 | 135,424 |
| Net realized gain (loss) on investment | 461,104 | 488,323 | 369,829 | 773,217 |
| Net change in unrealized appreciation (depreciation) | | | | |
| Net increase (decrease) in net assets from operations | 2,492,907 | 3,898,091 | 2,214,174 | 3,436,254 |
| Distributions to shareholders from net investment income | | | | |
| Class I | | | | |
| Capital Stock transactions: | | | | |
| Class I Shares | | | | |
| Shares sold | 11,552,787 | 7,908,500 | 9,124,273 | 7,164,454 |
| Issued to shareholders in reinvestment of distributions | 823,904 | 270,609 | 574,774 | 157,883 |
| Shares redeemed | | | | |
| Net increase from capital stock transactions | | | | |
| Total increase in net assets | | | | |
| Net Assets at end of period | | | | |
| Undistributed net investment income | $ 28,384 | $ 7,679 | $ 26,328 | $ 9,451 |
| Capital Share transactions: | | | | |
| Class I Shares | | | | |
| Shares sold | 1,523,733 | 1,253,097 | 1,264,901 | 1,212,814 |
| Issued to shareholders in reinvestment of distributions | 104,333 | 38,477 | 75,725 | 23,589 |
| Shares redeemed | | | | |
| Net increase (decrease) from capital share transactions | | | | |
See accompanying Notes to Financial Statements.
Ultra Series Fund | December 31, 2010
Financial Highlights for a Share of Beneficial Interest Outstanding
CONSERVATIVE ALLOCATION FUND |
| | | |
| | | | | |
| CLASS I | | | | | |
Net Asset Value at beginning of period | $ 9.61 | $ 8.48 | $10.77 | $10.60 | $10.00 |
| Income from Investment Operations: | | | | | |
Net investment income3 | 0.29 | 0.29 | 0.35 | 0.45 | 0.23 |
| Net realized and unrealized gain (loss) on investments | | | | | |
| Total from investment operations | 0.81 | 1.41 | (1.92) | 0.42 | 0.74 |
| Less Distributions: | | | | | |
| Distributions from net investment income | (0.41) | (0.28) | (0.27) | (0.23) | (0.14) |
| Distributions from capital gains | | | | | |
| Total distributions | (0.41) | (0.28) | (0.37) | (0.25) | (0.14) |
| Net increase (decrease) in net asset value | 0.40 | 1.13 | (2.29) | 0.17 | 0.60 |
Net Asset Value at end of period | $10.01 | $ 9.61 | $ 8.48 | $10.77 | $10.60 |
Total Return4 (%) | 8.37 | 16.76 | (17.89) | 3.92 | 7.345 |
| Ratios/Supplemental Data: | | | | | |
| Net Assets at end of period (in 000’s) | $195,657 | $176,322 | $116,678 | $66,747 | $9,113 |
| Ratios of expenses to average net assets: | | | | | |
| Before management fee reduction (%) | 0.31 | 0.31 | 0.31 | 0.31 | 0.346 |
| After management fee reduction (%) | 0.31 | 0.31 | 0.28 | 0.21 | 0.246 |
| Ratio of net investment income to average net assets (%) | 2.90 | 3.23 | 3.53 | 4.12 | 4.256 |
Portfolio Turnover7 (%) | 36 | 47 | 71 | 28 | 245 |
| CLASS II | Year Ended December 31, 2010 | | | | |
Net Asset Value at beginning of period | $ 9.61 | $ 8.51 | | | |
| Income from Investment Operations: | | | | | |
Net investment income3 | 0.35 | 0.28 | | | |
| Net realized and unrealized gain (loss) on investments | | | | | |
| Total from investment operations | 0.78 | 1.27 | | | |
| Less Distributions: | | | | | |
| Distributions from net investment income | | | | | |
| Net increase in net asset value | 0.39 | 1.10 | | | |
Net Asset Value at end of period | $10.00 | $ 9.61 | | | |
Total Return4 (%) | 8.10 | 14.915 | | | |
| Ratios/Supplemental Data: | | | | | |
| Net Assets at end of period (in 000’s) | $35,425 | $12,829 | | | |
| Ratios of expenses to average net assets (%) | 0.55 | 0.566 | | | |
| Ratio of net investment income to average net assets (%) | 3.47 | 4.386 | | | |
Portfolio Turnover7 (%) | 36 | 475 | | | |
| 1 | Commenced investment operations June 30, 2006. |
| 2 | Commenced investment operations May 1, 2009 |
| 3 | Based on average shares outstanding during the year. |
| 4 | These returns are after all charges at the mutual fund level have been subtracted. These returns are higher than the returns at the separate account level because charges made at the separate account level have not been subtracted. Total returns are not annualized for periods less than one year. |
| 5 | Annualized. |
| 6 | Not annualized. |
| 7 | Portfolio Turnover is calculated at the fund level and represents the entire fiscal year or period |
See accompanying Notes to Financial Statements.
Ultra Series Fund | December 31, 2010
Financial Highlights for a Share of Beneficial Interest Outstanding
|
| | | |
| | | | | |
| CLASS I | | | | | |
Net Asset Value at beginning of period | $ 8.87 | $ 7.51 | $11.21 | $10.86 | $10.00 |
| Income from Investment Operations: | | | | | |
Net investment income3 | 0.20 | 0.18 | 0.21 | 0.28 | 0.20 |
| Net realized and unrealized gain (loss) on investments | | | | | |
| Total from investment operations | 0.91 | 1.55 | (3.34) | 0.60 | 0.99 |
| Less Distributions: | | | | | |
| Distributions from net investment income | (0.29) | (0.19) | (0.17) | (0.19) | (0.13) |
| Distributions from capital gains | | | | | |
| Total distributions | (0.29) | (0.19) | (0.36) | (0.25) | (0.13) |
| Net increase (decrease) in net asset value | 0.62 | 1.36 | (3.70) | 0.35 | 0.86 |
Net Asset Value at end of period | $ 9.49 | $ 8.87 | $ 7.51 | $11.21 | $10.86 |
Total Return4 (%) | 10.22 | 20.61 | (30.23) | 5.56 | 9.876 |
| Ratios/Supplemental Data: | | | | | |
| Net Assets at end of period (in 000’s) | $352,545 | $332,428 | $243,761 | $218,281 | $36,994 |
| Ratios of expenses to average net assets: | | | | | |
| Before management fee reduction (%) | 0.31 | 0.31 | 0.31 | 0.31 | 0.347 |
| After management fee reduction (%) | 0.31 | 0.31 | 0.28 | 0.21 | 0.247 |
| Ratio of net investment income to average net assets (%) | 2.24 | 2.29 | 2.20 | 2.45 | 3.747 |
Portfolio Turnover8 (%) | 34 | 52 | 69 | 29 | 236 |
| CLASS II | Year Ended December 31, 2010 | | | | |
Net Asset Value at beginning of period | $ 8.87 | $ 7.56 | | | |
| Income from Investment Operations: | | | | | |
Net investment income3 | 0.25 | 0.19 | | | |
| Net realized and unrealized gain (loss) on investments | | | | | |
| Total from investment operations | 0.88 | 1.43 | | | |
| Less Distributions: | | | | | |
| Distributions from net investment income | | | | | |
| Net increase in net asset value | 0.61 | 1.31 | | | |
Net Asset Value at end of period | $ 9.48 | $ 8.87 | | | |
Total Return4 (%) | 9.94 | 18.826 | | | |
| Ratios/Supplemental Data: | | | | | |
| Net Assets at end of period (in 000’s) | $31,715 | $12,162 | | | |
| Ratios of expenses to average net assets (%) | 0.56 | 0.567 | | | |
| Ratio of net investment income to average net assets (%) | 2.76 | 3.337 | | | |
Portfolio Turnover8 (%) | 34 | 526 | | | |
| 1 | Commenced investment operations June 30, 2006. |
| 2 | Commenced investment operations May 1, 2009. |
| 3 | Based on average shares outstanding during the year. |
| 4 | These returns are after all charges at the mutual fund level have been subtracted. These returns are higher than the returns at the separate account level because charges made at the separate account level have not been subtracted. Total returns are not annualized for periods less than one year. |
| 5 | Not annualized. |
| 6 | Annualized. |
| 7 | Amounts represent less than $0.005 per share. |
| 8 | Portfolio Turnover is calculated at the fund level and represents the entire fiscal year or period |
See accompanying Notes to Financial Statements.
Ultra Series Fund | December 31, 2010
Financial Highlights for a Share of Beneficial Interest Outstanding
AGGRESSIVE ALLOCATION FUND |
| | | |
| | | | | |
| CLASS I | | | | | |
Net Asset Value at beginning of period | $ 8.30 | $ 6.57 | $11.61 | $11.10 | $10.00 |
| Income from Investment Operations: | | | | | |
Net investment income3 | 0.11 | 0.10 | 0.09 | 0.09 | 0.15 |
| Net realized and unrealized gain (loss) on investments | | | | | |
| Total from investment operations | 0.92 | 1.84 | (4.65) | 0.86 | 1.25 |
| Less Distributions: | | | | | |
| Distributions from net investment income | (0.14) | (0.11) | (0.06) | (0.14) | (0.15) |
| Distributions from capital gains | | | | | |
| Total distributions | (0.14) | (0.11) | (0.39) | (0.35) | (0.15) |
| Net increase (decrease) in net asset value | 0.78 | 1.73 | (5.04) | 0.51 | 1.10 |
Net Asset Value at end of period | $ 9.08 | $ 8.30 | $ 6.57 | $11.61 | $11.10 |
Total Return4 (%) | 11.15 | 27.91 | (41.09) | 7.69 | 12.495 |
| Ratios/Supplemental Data: | | | | | |
| Net Assets at end of period (in 000’s) | $126,270 | $114,492 | $69,616 | $68,120 | $21,547 |
| Ratios of expenses to average net assets: | | | | | |
| Before management fee reduction (%) | 0.31 | 0.31 | 0.31 | 0.31 | 0.336 |
| After management fee reduction (%) | 0.31 | 0.31 | 0.28 | 0.21 | 0.236 |
| Ratio of net investment income to average net assets (%) | 1.27 | 1.44 | 0.94 | 0.79 | 2.716 |
Portfolio Turnover7 (%) | 33 | 58 | 67 | 46 | 215 |
| CLASS II | Year Ended December 31, 2010 | | | | |
Net Asset Value at beginning of period | $ 8.30 | $ 6.69 | | | |
| Income from Investment Operations: | | | | | |
Net investment income3 | 0.17 | 0.15 | | | |
| Net realized and unrealized gain (loss) on investments | | | | | |
| Total from investment operations | 0.90 | 1.69 | | | |
| Less Distributions: | | | | | |
| Distributions from net investment income | | | | | |
| Net increase in net asset value | 0.77 | 1.61 | | | |
Net Asset Value at end of period | $ 9.07 | $ 8.30 | | | |
Total Return4 (%) | 10.87 | 25.095 | | | |
| Ratios/Supplemental Data: | | | | | |
| Net Assets at end of period (in 000’s) | $1,424 | $514 | | | |
| Ratios of expenses to average net assets (%) | 0.56 | 0.566 | | | |
| Ratio of net investment income to average net assets (%) | 1.99 | 2.866 | | | |
Portfolio Turnover7 (%) | 33 | 585 | | | |
| 1 | Commenced investment operations June 30, 2006. |
| 2 | Commenced investment operations May 1, 2009. |
| 3 | Based on average shares outstanding during the year. |
| 4 | These returns are after all charges at the mutual fund level have been subtracted. These returns are higher than the returns at the separate account level because charges made at the separate account level have not been subtracted. Total returns are not annualized for periods less than one year. |
| 5 | Not annualized. |
| 6 | Annualized. |
| 7 | Portfolio Turnover is calculated at the fund level and represents the entire fiscal year or period |
See accompanying Notes to Financial Statements.
Ultra Series Fund | December 31, 2010
Financial Highlights for a Share of Beneficial Interest Outstanding
|
| | |
| | | | | | |
| CLASS I | | | | | |
Net Asset Value at beginning of period | $ 1.00 | $1.00 | $1.00 | $1.00 | $1.00 |
| Income from Investment Operations: | | | | | |
Net investment income2 | – | 0.004 | 0.02 | 0.05 | 0.04 |
| Net realized and unrealized gain (loss) on investments | – | | | | |
| Total from investment operations | 0.00 | 0.00 | 0.02 | 0.05 | 0.04 |
| Less Distributions: | | | | | |
| Distributions from net investment income | – | | | | |
| Net increase in net asset value | 0.00 | 0.00 | 0.00 | 0.00 | 0.00 |
Net Asset Value at end of period | $ 1.00 | $1.00 | $1.00 | $1.00 | $1.00 |
Total Return3 (%) | 0.00 | 0.00 | 1.75 | 4.71 | 4.54 |
| Ratios/Supplemental Data: | | | | | |
| Net Assets at end of period (in 000’s) | $ 69,634 | $92,463 | $159,349 | $111,333 | $100,462 |
| Ratios of expenses to average net assets: | | | | | |
| Before waiver of expenses by Adviser (%) | 0.47 | 0.47 | 0.47 | 0.46 | 0.46 |
| After waiver of expenses by Adviser (%) | 0.147 | 0.287 | 0.47 | 0.46 | 0.46 |
| Ratio of net investment income to average net assets (%) | 0.00 | 0.00 | 1.67 | 4.58 | 4.42 |
| CLASS II | Year Ended December 31, 2010 | | | | | |
Net Asset Value at beginning of period | $1.00 | $1.00 | | | | |
| Income from Investment Operations: | | | | | | |
Net investment income2 | – | – | | | | |
| Net realized and unrealized gain (loss) on investments | | | | | | |
| Total from investment operations | 0.00 | 0.00 | | | | |
| Less Distributions: | | | | | | |
| Distributions from net investment income | | | | | | |
| Net increase in net asset value | 0.00 | 0.00 | | | | |
Net Asset Value at end of period | $1.00 | $1.00 | | | | |
Total Return3(%) | 0.00 | 0.005 | | | | |
| Ratios/Supplemental Data: | | | | | | |
| Net Assets at end of period (in 000’s) | $577 | $185 | | | | |
| Ratios of expenses to average net assets: | | | | | | |
| Before waiver of expenses by Adviser (%) | 0.73 | 0.736 | | | | |
| After waiver of expenses by Adviser (%) | 0.167 | 0.206,7 | | | | |
| Ratio of net investment income to average net assets (%) | 0.00 | 0.006 | | | | |
| 1 | Commenced investment operations May 1, 2009 |
| 2 | Based on average shares outstanding during the year. |
| 3 | These returns are after all charges at the mutual fund level have been subtracted. These returns are higher than the returns at the separate account level because charges made at the separate account level have not been subtracted. Total returns are not annualized for periods less than one year. |
| 4 | Amounts represent less than $0.005 per share. |
| 5 | Not annualized. |
| 6 | Annualized. |
| 7 | Amount includes fees waived by the adviser (see Note 3). |
See accompanying Notes to Financial Statements.
Ultra Series Fund | December 31, 2010
Financial Highlights for a Share of Beneficial Interest Outstanding
|
| | |
| | | | | | |
| CLASS I | | | | | |
Net Asset Value at beginning of period | $10.14 | $ 9.94 | $10.19 | $10.11 | $10.17 |
| Income from Investment Operations: | | | | | |
Net investment income2 | 0.40 | 0.43 | 0.50 | 0.49 | 0.47 |
| Net realized and unrealized gain (loss) on investments | | | | | |
| Total from investment operations | 0.60 | 0.64 | 0.29 | 0.51 | 0.41 |
| Less Distributions: | | | | | |
| Distributions from net investment income | | | | | |
| Net increase (decrease) in net asset value | 0.15 | 0.20 | (0.25) | 0.08 | (0.06) |
Net Asset Value at end of period | $10.29 | $10.14 | $ 9.94 | $10.19 | $10.11 |
Total Return3 (%) | 5.92 | 6.50 | 2.86 | 5.05 | 4.01 |
| Ratios/Supplemental Data: | | | | | |
| Net Assets at end of period (in 000’s) | $429,499 | $541,789 | $572,562 | $646,233 | $659,273 |
| Ratios of expenses to average net assets | 0.56 | 0.57 | 0.56 | 0.56 | 0.56 |
| Ratio of net investment income to average net assets (%) | 3.76 | 4.28 | 4.84 | 4.81 | 4.54 |
Portfolio Turnover6 (%) | 2 | 25 | 12 | 29 | 27 |
| CLASS II | Year Ended December 31, 2010 | | | | | |
Net Asset Value at beginning of period | $10.14 | $ 9.85 | | | | |
| Income from Investment Operations: | | | | | | |
Net investment income2 | 0.37 | 0.27 | | | | |
| Net realized and unrealized gain (loss) on investments | | | | | | |
| Total from investment operations | 0.57 | 0.55 | | | | |
| Less Distributions: | | | | | | |
| Distributions from net investment income | | | | | | |
| Net increase in net asset value | 0.14 | 0.29 | | | | |
Net Asset Value at end of period | $10.28 | $10.14 | | | | |
Total Return3(%) | 5.66 | 5.554 | | | | |
| Ratios/Supplemental Data: | | | | | | |
| Net Assets at end of period (in 000’s) | $35,750 | $9,719 | | | | |
| Ratios of expenses to average net assets | 0.81 | 0.825 | | | | |
| Ratio of net investment income to average net assets (%) | 3.49 | 3.865 | | | | |
Portfolio Turnover6 (%) | 2 | 254 | | | | |
| 1 | Commenced investment operations May 1, 2009. |
| 2 | Based on average shares outstanding during the year. |
| 3 | These returns are after all charges at the mutual fund level have been subtracted. These returns are higher than the returns at the separate account level because charges made at the separate account level have not been subtracted. Total returns are not annualized for periods less than one year. |
| 4 | Not annualized. |
| 5 | Annualized. |
| 6 | Portfolio Turnover is calculated at the fund level and represents the entire fiscal year or period |
See accompanying Notes to Financial Statements.
Ultra Series Fund | December 31, 2010
Financial Highlights for a Share of Beneficial Interest Outstanding
|
| | |
| | | | | | |
| CLASS I | | | | | |
Net Asset Value at beginning of period | $ 9.11 | $ 7.34 | $ 9.54 | $10.16 | $10.01 |
| Income from Investment Operations: | | | | | |
Net investment income2 | 0.72 | 0.68 | 0.67 | 0.76 | 0.74 |
| Net realized and unrealized gain (loss) on investments | | | | | |
| Total from investment operations | 1.07 | 2.48 | (1.40) | 0.23 | 0.90 |
| Less Distributions: | | | | | |
| Distributions from net investment income | | (0.71) | (0.80) | (0.85) | (0.74) |
| Distributions from capital gains | – | | | | |
| Total distributions | (0.76) | (0.71) | (0.80) | (0.85) | (0.75) |
| Net increase (decrease) in net asset value | 0.31 | 1.77 | (2.20) | (0.62) | 0.15 |
Net Asset Value at end of period | $ 9.42 | $ 9.11 | $ 7.34 | $ 9.54 | $10.16 |
Total Return3 (%) | 11.73 | 34.29 | (14.74) | 2.29 | 9.03 |
| Ratios/Supplemental Data: | | | | | |
| Net Assets at end of period (in 000’s) | $95,552 | $107,722 | $90,728 | $135,045 | $153,528 |
| Ratios of expenses to average net assets | 0.77 | 0.77 | 0.76 | 0.76 | 0.77 |
| Ratio of net investment income to average net assets (%) | 7.54 | 7.94 | 7.42 | 7.27 | 7.12 |
Portfolio Turnover7 (%) | 53 | 73 | 45 | 73 | 64 |
| CLASS II | Year Ended December 31, 2010 | | | | | |
Net Asset Value at beginning of period | $ 9.11 | $ 8.14 | | | | |
| Income from Investment Operations: | | | | | | |
Net investment income2 | 0.70 | 0.47 | | | | |
| Net realized and unrealized gain (loss) on investments | | | | | | |
| Total from investment operations | 1.04 | 1.43 | | | | |
| Less Distributions: | | | | | | |
| Distributions from net investment income | | | | | | |
| Net increase in net asset value | 0.31 | 0.97 | | | | |
Net Asset Value at end of period | $ 9.42 | $ 9.11 | | | | |
Total Return3(%) | 11.45 | 17.495 | | | | |
| Ratios/Supplemental Data: | | | | | | |
| Net Assets at end of period (in 000’s) | $4,286 | $1,148 | | | | |
| Ratios of expenses to average net assets | 1.01 | 1.016 | | | | |
| Ratio of net investment income to average net assets (%) | 7.20 | 7.656 | | | | |
Portfolio Turnover7 (%) | 53 | 735 | | | | |
| 1 | Commenced investment operations May 1, 2009. |
| 2 | Based on average shares outstanding during the year. |
| 3 | These returns are after all charges at the mutual fund level have been subtracted. These returns are higher than the returns at the separate account level because charges made at the separate account level have not been subtracted. Total returns are not annualized for periods less than one year. |
| 4 | Amounts represent less than $0.005 per share. |
| 5 | Not annualized. |
| 6 | Annualized. |
| 7 | Portfolio Turnover is calculated at the fund level and represents the entire fiscal year or period |
See accompanying Notes to Financial Statements.
Ultra Series Fund | December 31, 2010
Financial Highlights for a Share of Beneficial Interest Outstanding
|
| | |
| | | | | | |
| CLASS I | | | | | |
Net Asset Value at beginning of period | $15.37 | $14.46 | $17.62 | $18.46 | $19.40 |
| Income from Investment Operations: | | | | | |
Net investment income2 | 0.56 | 0.60 | 0.72 | 0.79 | 0.49 |
| Net realized and unrealized gain (loss) on investments | | | | | |
| Total from investment operations | 1.85 | 1.52 | (2.33) | 0.47 | 1.94 |
| Less Distributions: | | | | | |
| Distributions from net investment income | (0.60) | (0.61) | (0.81) | (0.80) | (0.55) |
| Distributions from capital gains | | | | | |
| Total distributions | (0.60) | (0.61) | (0.83) | (1.31) | (2.88) |
| Net increase (decrease) in net asset value | 1.25 | 0.91 | (3.16) | (0.84) | (0.94) |
Net Asset Value at end of period | $16.62 | $15.37 | $14.46 | $17.62 | $18.46 |
Total Return3 (%) | 12.04 | 10.74 | (13.25) | 2.51 | 9.984 |
| Ratios/Supplemental Data: | | | | | |
| Net Assets at end of period (in 000’s) | $384,709 | $418,381 | $438,047 | $637,606 | $735,881 |
| Ratios of expenses to average net assets | 0.72 | 0.72 | 0.71 | 0.71 | 0.71 |
| Ratio of net investment income to average net assets (%) | 3.50 | 4.12 | 4.37 | 4.21 | 2.52 |
Portfolio Turnover7 (%) | 23 | 26 | 14 | 41 | 62 |
| CLASS II | Year Ended December 31, 2010 | | | | | |
Net Asset Value at beginning of period | $15.37 | $13.74 | | | | |
| Income from Investment Operations: | | | | | | |
Net investment income2 | 0.52 | 0.35 | | | | |
| Net realized and unrealized gain (loss) on investments | | | | | | |
| Total from investment operations | 1.81 | 1.99 | | | | |
| Less Distributions: | | | | | | |
| Distributions from net investment income | | | | | | |
| Net increase in net asset value | 1.24 | 1.63 | | | | |
Net Asset Value at end of period | $16.61 | $15.37 | | | | |
Total Return3(%) | 11.77 | 14.435 | | | | |
| Ratios/Supplemental Data: | | | | | | |
| Net Assets at end of period (in 000’s) | $22,309 | $6,261 | | | | |
| Ratios of expenses to average net assets | 0.97 | 0.976 | | | | |
| Ratio of net investment income to average net assets (%) | 3.20 | 3.446 | | | | |
Portfolio Turnover7 (%) | 23 | 265 | | | | |
| 1 | Commenced investment operations May 1, 2009 |
| 2 | Based on average shares outstanding during the year. |
| 3 | These returns are after all charges at the mutual fund level have been subtracted. These returns are higher than the returns at the separate account level because charges made at the separate account level have not been subtracted. Total returns are not annualized for periods less than one year. |
| 4 | In 2006, 0.01% of the Fund’s total return consisted of a voluntary reimbursement by the Adviser for a realized investment loss. Excluding this reimbursement, the total return would have been 9.97%. |
| 5 | Not annualized. |
| 6 | Annualized. |
| 7 | Portfolio Turnover is calculated at the fund level and represents the entire fiscal year or period |
See accompanying Notes to Financial Statements.
Ultra Series Fund | December 31, 2010
Financial Highlights for a Share of Beneficial Interest Outstanding
|
| | |
| |
| CLASS I | |
Net Asset Value at beginning of period | $10.00 |
| Income from Investment Operations: | |
Net investment income2 | (0.02) |
| Net realized and unrealized gain (loss) on investments | |
| Total from investment operations | 0.62 |
| Less Distributions: | |
| Distributions from net investment income | – |
| Distributions from capital gains | |
| Total distributions | (0.25) |
| Net increase (decrease) in net asset value | 0.37 |
Net Asset Value at end of period | $10.37 |
Total Return (%) | 6.24 |
| Ratios/Supplemental Data: | |
| Net Assets at end of period (in 000’s) | $478 |
Ratios of expenses to average net assets3 | 0.91 |
Ratio of net investment income to average net assets3 (%) | (0.34) |
Portfolio Turnover4 (%) | 49 |
| | |
| CLASS II | |
Net Asset Value at beginning of period | $10.00 |
| Income from Investment Operations: | |
Net investment income2 | (0.02) |
| Net realized and unrealized gain (loss) on investments | |
| Total from investment operations | 0.60 |
| Less Distributions: | |
| Distributions from net investment income | – |
| Distributions from capital gains | |
| Total distributions | (0.25) |
| Net increase in net asset value | 0.35 |
Net Asset Value at end of period | $10.35 |
Total Return3(%) | 6.07 |
| Ratios/Supplemental Data: | |
| Net Assets at end of period (in 000’s) | $1,743 |
Ratios of expenses to average net assets3 | 1.17 |
Ratio of net investment income to average net assets3 (%) | (0.46) |
Portfolio Turnover4 (%) | 49 |
| 1 | Commenced investment operations May 1, 2010. |
| 2 | Based on average shares outstanding during the period. |
| 3 | Annualized. |
| 4 | Portfolio Turnover is calculated at the fund level and represents the entire period |
See accompanying Notes to Financial Statements.
Ultra Series Fund | December 31, 2010
Financial Highlights for a Share of Beneficial Interest Outstanding
|
| | |
| | | | | | |
| CLASS I | | | | | |
Net Asset Value at beginning of period | $22.17 | $19.42 | $31.49 | $35.14 | $31.62 |
| Income from Investment Operations: | | | | | |
Net investment income2 | 0.38 | 0.43 | 0.65 | 0.68 | 0.65 |
| Net realized and unrealized gain (loss) on investments | | | | | |
| Total from investment operations | 1.84 | 3.19 | (11.34) | 0.23 | 6.52 |
| Less Distributions: | | | | | |
| Distributions from net investment income | (0.45) | (0.44) | (0.71) | (0.71) | (0.67) |
| Distributions from capital gains | | | | | |
| Total distributions | (0.45) | (0.44) | (0.73) | (3.88) | (3.00) |
| Net increase (decrease) in net asset value | 1.39 | 2.75 | (12.07) | (3.65) | 3.52 |
Net Asset Value at end of period | $ 23.56 | $22.17 | $19.42 | $31.49 | $35.14 |
Total Return3 (%) | 8.29 | 16.79 | (35.99) | 0.60 | 20.55 |
| Ratios/Supplemental Data: | | | | | |
| Net Assets at end of period (in 000’s) | $524,894 | $630,764 | $609,444 | $1,229,433 | $1,390,778 |
| Ratios of expenses to average net assets | 0.62 | 0.62 | 0.61 | 0.61 | 0.61 |
| Ratio of net investment income to average net assets (%) | 1.72 | 2.23 | 2.42 | 1.87 | 1.91 |
Portfolio Turnover6 (%) | 63 | 81 | 38 | 45 | 35 |
| CLASS II | Year Ended December 31, 2010 | | | | | |
Net Asset Value at beginning of period | $22.17 | $17.74 | | | | |
| Income from Investment Operations: | | | | | | |
Net investment income2 | 0.34 | 0.18 | | | | |
| Net realized and unrealized gain (loss) on investments | | | | | | |
| Total from investment operations | 1.78 | 4.63 | | | | |
| Less Distributions: | | | | | | |
| Distributions from net investment income | | | | | | |
| Net increase in net asset value | 1.37 | 4.43 | | | | |
Net Asset Value at end of period | $23.54 | $22.17 | | | | |
Total Return3(%) | 8.02 | 26.094 | | | | |
| Ratios/Supplemental Data: | | | | | | |
| Net Assets at end of period (in 000’s) | $5,354 | $2,552 | | | | |
| Ratios of expenses to average net assets | 0.87 | 0.875 | | | | |
| Ratio of net investment income to average net assets (%) | 1.51 | 1.285 | | | | |
Portfolio Turnover6 (%) | 63 | 814 | | | | |
| 1 | Commenced investment operations May 1, 2009. |
| 2 | Based on average shares outstanding during the year. |
| 3 | These returns are after all charges at the mutual fund level have been subtracted. These returns are higher than the returns at the separate account level because charges made at the separate account level have not been subtracted. Total returns are not annualized for periods less than one year. |
| 4 | Not annualized. |
| 5 | Annualized. |
| 6 | Portfolio Turnover is calculated at the fund level and represents the entire fiscal year or period |
See accompanying Notes to Financial Statements.
Ultra Series Fund | December 31, 2010
Financial Highlights for a Share of Beneficial Interest Outstanding
|
| | |
| | | | | | |
| CLASS I | | | | | |
Net Asset Value at beginning of period | $19.87 | $14.50 | $23.36 | $21.47 | $19.97 |
| Income from Investment Operations: | | | | | |
Net investment income2 | 0.10 | 0.12 | 0.12 | 0.08 | 0.07 |
| Net realized and unrealized gain (loss) on investments | | | | | |
| Total from investment operations | 2.41 | 5.49 | (8.68) | 2.67 | 1.58 |
| Less Distributions: | | | | | |
| Distributions from net investment income | (0.12) | (0.12) | (0.14) | (0.09) | (0.08) |
| Distributions from capital gains | | | | | |
| Total distributions | (0.12) | (0.12) | (0.18) | (0.78) | (0.08) |
| Net increase (decrease) in net asset value | 2.29 | 5.37 | (8.86) | 1.89 | 1.50 |
Net Asset Value at end of period | $22.16 | $19.87 | $14.50 | $23.36 | $21.47 |
Total Return3 (%) | 12.13 | 37.98 | (37.20) | 12.36 | 7.88 |
| Ratios/Supplemental Data: | | | | | |
| Net Assets at end of period (in 000’s) | $374,644 | $433,483 | $352,473 | $665,240 | $669,761 |
| Ratios of expenses to average net assets | 0.82 | 0.82 | 0.82 | 0.81 | 0.81 |
| Ratio of net investment income to average net assets (%) | 0.51 | 0.72 | 0.62 | 0.34 | 0.35 |
Portfolio Turnover6 (%) | 78 | 89 | 123 | 76 | 87 |
| CLASS II | Year Ended December 31, 2010 | | | | | |
Net Asset Value at beginning of period | $19.87 | $15.78 | | | | |
| Income from Investment Operations: | | | | | | |
Net investment income2 | 0.06 | 0.05 | | | | |
| Net realized and unrealized gain (loss) on investments | | | | | | |
| Total from investment operations | 2.36 | 4.14 | | | | |
| Less Distributions: | | | | | | |
| Distributions from net investment income | | | | | | |
| Net increase in net asset value | 2.27 | 4.09 | | | | |
Net Asset Value at end of period | $22.14 | $19.87 | | | | |
Total Return3(%) | 11.85 | 26.214 | | | | |
| Ratios/Supplemental Data: | | | | | | |
| Net Assets at end of period (in 000’s) | $20,802 | $6,003 | | | | |
| Ratios of expenses to average net assets | 1.07 | 1.075 | | | | |
| Ratio of net investment income to average net assets (%) | 0.29 | 0.365 | | | | |
Portfolio Turnover6 (%) | 78 | 894 | | | | |
| 1 | Commenced investment operations May 1, 2009. |
| 2 | Based on average shares outstanding during the year. |
| 3 | These returns are after all charges at the mutual fund level have been subtracted. These returns are higher than the returns at the separate account level because charges made at the separate account level have not been subtracted. Total returns are not annualized for periods less than one year. |
| 4 | Not annualized. |
| 5 | Annualized. |
| 6 | Portfolio Turnover is calculated at the fund level and represents the entire fiscal year or period |
See accompanying Notes to Financial Statements.
Ultra Series Fund | December 31, 2010
Financial Highlights for a Share of Beneficial Interest Outstanding
|
| | |
| | | | | | |
| CLASS I | | | | | |
Net Asset Value at beginning of period | $11.82 | $ 8.01 | $15.31 | $15.68 | $17.94 |
| Income from Investment Operations: | | | | | |
Net investment income2 | 0.04 | – | 0.005 | (0.08) | (0.05) |
| Net realized and unrealized gain (loss) on investments | | | | | |
| Total from investment operations | 2.37 | 3.81 | (7.13) | 1.33 | 2.03 |
| Less Distributions: | | | | | |
| Distributions from net investment income | (0.05) | (0.00)5 | (0.00)5 | – | – |
| Distributions from capital gains | | | | | |
| Total distributions | (0.05) | (0.00) | (0.16) | (1.70) | (4.29) |
| Net increase (decrease) in net asset value | 2.32 | 3.81 | (7.29) | (0.37) | (2.26) |
Net Asset Value at end of period | $14.14 | $11.82 | $ 8.01 | $15.31 | $15.68 |
Total Return4(%) | 20.12 | 47.28 | (46.89) | 8.44 | 11.38 |
| Ratios/Supplemental Data: | | | | | |
| Net Assets at end of period (in 000’s) | $385,219 | $229,395 | $166,465 | $367,318 | $374,044 |
| Ratios of expenses to average net assets | 0.90 | 0.87 | 0.87 | 0.86 | 0.86 |
| Ratio of net investment income to average net assets (%) | 0.42 | (0.05) | 0.09 | (0.41) | (0.22) |
Portfolio Turnover8 (%) | 46 | 186 | 108 | 104 | 204 |
| CLASS II | Year Ended December 31, 2010 | | | | | |
Net Asset Value at beginning of period | $11.82 | $ 9.36 | | | | |
| Income from Investment Operations: | | | | | | |
Net investment income2 | 0.04 | (0.00) | | | | |
| Net realized and unrealized gain (loss) on investments | | | | | | |
| Total from investment operations | 2.34 | 2.45 | | | | |
| Less Distributions: | | | | | | |
| Distributions from net investment income | | | | | | |
| Net increase in net asset value | 2.31 | 2.45 | | | | |
Net Asset Value at end of period | $14.13 | $11.82 | | | | |
Total Return4(%) | 19.82 | 26.136 | | | | |
| Ratios/Supplemental Data: | | | | | | |
| Net Assets at end of period (in 000’s) | $11,951 | $1,745 | | | | |
| Ratios of expenses to average net assets | 1.16 | 1.127 | | | | |
| Ratio of net investment income to average net assets (%) | 0.38 | (0.14)7 | | | | |
Portfolio Turnover8 (%) | 46 | 1866 | | | | |
| 1 | Commenced investment operations May 1, 2009 |
| 2 | Based on average shares outstanding during the year. |
| 3 | The financial highlights prior to May 1, 2010 are those of the Mid Cap Growth Fund, the accounting survivor of the reorganization of the Mid Cap Value and Mid Cap Growth Funds. The net asset values and other per share information of the Mid Cap Growth Fund have been restated by the conversion ration of 2.6623 for Class I shares and 2.6678 for Class II shares to reflect those of the legal survivor of the reorganization the Mid Cap Value Fund, which was renamed the Mid Cap Fund after the reorganization. |
| 4 | These returns are after all charges at the mutual fund level have been subtracted. These returns are higher than the returns at the separate account level because charges made at the separate account level have not been subtracted. Total returns are not annualized for periods less than one year. |
| 5 | Amounts represent less than $0.005 per share. |
| 6 | Not annualized. |
| 7 | Annualized. |
| 8 | Portfolio Turnover is calculated at the fund level and represents the entire fiscal year or period |
See accompanying Notes to Financial Statements.
Ultra Series Fund | December 31, 2010
Financial Highlights for a Share of Beneficial Interest Outstanding
|
| | | |
| | | | |
| CLASS I | | | | |
Net Asset Value at beginning of period | $ 8.54 | $ 6.53 | $ 8.86 | $10.00 |
| Income from Investment Operations: | | | | |
Net investment income3 | 0.08 | 0.05 | 0.08 | 0.09 |
| Net realized and unrealized gain (loss) on investments | | | | |
| Total from investment operations | 2.28 | 2.05 | (2.26) | (0.96) |
| Less Distributions: | | | | |
| Distributions from net investment income | (0.07) | (0.04) | (0.07) | (0.08) |
| Distributions from capital gains | | | | |
| Total distributions | (0.07) | (0.04) | (0.07) | (0.18) |
| Net increase (decrease) in net asset value | 2.21 | 2.01 | (2.33) | (1.14) |
Net Asset Value at end of period | $10.75 | $ 8.54 | $ 6.53 | $ 8.86 |
Total Return4 (%) | 26.80 | 31.56 | (25.54) | (9.62)6 |
| Ratios/Supplemental Data: | | | | |
| Net Assets at end of period (in 000’s) | $11,710 | $7,989 | $5,986 | $5,624 |
| Ratios of expenses to average net assets | 1.11 | 1.11 | 1.12 | 1.047 |
| Ratio of net investment income to average net assets (%) | 0.85 | 0.77 | 1.03 | 1.457 |
Portfolio Turnover8 (%) | 33 | 21 | 28 | 136 |
| | | | | |
| CLASS II | Year Ended December 31, 2010 | | | |
Net Asset Value at beginning of period | $ 8.54 | $ 6.50 | | |
| Income from Investment Operations: | | | | |
Net investment income3 | 0.06 | 0.02 | | |
| Net realized and unrealized gain (loss) on investments | | | | |
| Total from investment operations | 2.26 | 2.05 | | |
| Less Distributions: | | | | |
| Distributions from net investment income | | | | |
| Net increase in net asset value | 2.20 | 2.04 | | |
Net Asset Value at end of period | $10.74 | $ 8.54 | | |
Total Return4(%) | 26.48 | 31.575 | | |
| Ratios/Supplemental Data: | | | | |
| Net Assets at end of period (in 000’s) | $1,387 | $616 | | |
| Ratios of expenses to average net assets | 1.36 | 1.366 | | |
| Ratio of net investment income to average net assets (%) | 0.67 | 0.446 | | |
Portfolio Turnover8 (%) | 33 | 215 | | |
| 1 | Commenced investment operations May 1, 2007. |
| 2 | Commenced investment operations May 1, 2009. |
| 3 | Based on average shares outstanding during the year. |
| 4 | These returns are after all charges at the mutual fund level have been subtracted. These returns are higher than the returns at the separate account level because charges made at the separate account level have not been subtracted. Total returns are not annualized for periods less than one year. |
| 5 | Not annualized. |
| 6 | Annualized. |
| 8 | Portfolio Turnover is calculated at the fund level and represents the entire fiscal year or period |
See accompanying Notes to Financial Statements.
Ultra Series Fund | December 31, 2010
Financial Highlights for a Share of Beneficial Interest Outstanding
|
| | |
| | | | | | |
| CLASS I | | | | | |
Net Asset Value at beginning of period | $ 9.53 | $ 7.59 | $13.40 | $13.78 | $12.38 |
| Income from Investment Operations: | | | | | |
Net investment income2 | 0.14 | 0.17 | 0.26 | 0.23 | 0.19 |
| Net realized and unrealized gain (loss) on investments | | | | | |
| Total from investment operations | 0.67 | 2.12 | (5.01) | 1.59 | 2.97 |
| Less Distributions: | | | | | |
| Distributions from net investment income | (0.21) | (0.18) | (0.26) | (0.32) | (0.20) |
| Distributions from capital gains | | | | | |
| Total distributions | (0.21) | (0.18) | (0.80) | (1.97) | (1.57) |
| Net increase (decrease) in net asset value | 0.46 | 1.94 | (5.81) | (0.38) | 1.40 |
Net Asset Value at end of period | $ 9.99 | $ 9.53 | $ 7.59 | $13.40 | $13.78 |
Total Return3 (%) | 7.09 | 27.90 | (38.62) | 11.42 | 24.19 |
| Ratios/Supplemental Data: | | | | | |
| Net Assets at end of period (in 000’s) | $92,063 | $77,997 | $72,768 | $164,151 | $165,704 |
| Ratios of expenses to average net assets | 1.22 | 1.22 | 1.22 | 1.21 | 1.22 |
| Ratio of net investment income to average net assets (%) | 1.48 | 2.08 | 2.45 | 1.60 | 1.48 |
Portfolio Turnover6 (%) | 79 | 87 | 43 | 62 | 62 |
| CLASS II | Year Ended December 31, 2010 | | | | | |
Net Asset Value at beginning of period | $ 9.53 | $ 7.32 | | | | |
| Income from Investment Operations: | | | | | | |
Net investment income2 | 0.09 | 0.04 | | | | |
| Net realized and unrealized gain (loss) on investments | | | | | | |
| Total from investment operations | 0.65 | 2.37 | | | | |
| Less Distributions: | | | | | | |
| Distributions from net investment income | | | | | | |
| Net increase in net asset value | 0.46 | 2.21 | | | | |
Net Asset Value at end of period | $ 9.99 | $ 9.53 | | | | |
Total Return3(%) | 6.83 | 32.304 | | | | |
| Ratios/Supplemental Data: | | | | | | |
| Net Assets at end of period (in 000’s) | $13,241 | $3,962 | | | | |
| Ratios of expenses to average net assets | 1.47 | 1.485 | | | | |
| Ratio of net investment income to average net assets (%) | 1.00 | 0.575 | | | | |
Portfolio Turnover6 (%) | 79 | 874 | | | | |
| 1 | Commenced investment operations May 1, 2009. |
| 2 | Based on average shares outstanding during the year. |
| 3 | These returns are after all charges at the mutual fund level have been subtracted. These returns are higher than the returns at the separate account level because charges made at the separate account level have not been subtracted. Total returns are not annualized for periods less than one year. |
| 4 | Not annualized. |
| 5 | Annualized. |
| 6 | Portfolio Turnover is calculated at the fund level and represents the entire fiscal year or period |
See accompanying Notes to Financial Statements.
Ultra Series Fund | December 31, 2010
Financial Highlights for a Share of Beneficial Interest Outstanding
TARGET RETIREMENT 2020 FUND |
| | | |
| | | | |
| CLASS I | | | | |
Net Asset Value at beginning of period | $ 7.64 | $ 6.04 | $ 9.63 | $10.00 |
| Income from Investment Operations: | | | | |
Net investment income2 | 0.20 | 0.15 | 0.22 | 0.13 |
| Net realized and unrealized gain (loss) on investments | | | | |
| Total from investment operations | 0.69 | 1.74 | (3.38) | (0.19) |
| Less Distributions: | | | | |
| Distributions from net investment income | (0.27) | (0.14) | (0.16) | (0.18) |
| Distributions from capital gains | | | | |
| Total distributions | (0.27) | (0.14) | (0.21) | (0.18) |
| Net increase (decrease) in net asset value | 0.42 | 1.60 | (3.59) | (0.37) |
Net Asset Value at end of period | $ 8.06 | $ 7.64 | $ 6.04 | $ 9.63 |
Total Return3 (%) | 9.01 | 28.93 | (35.31) | (1.94)4 |
| Ratios/Supplemental Data: | | | | |
| Net Assets at end of period (in 000’s) | $27,648 | $19,300 | $8,719 | $2,524 |
| Ratios of expenses to average net assets | | | | |
| Before reimbursement of expenses by Adviser | 0.40 | 0.41 | 0.40 | 0.435 |
| After reimbursement of expenses by Adviser | 0.20 | 0.34 | 0.40 | 0.435 |
| Ratio of net investment income to average net assets (%) | 2.61 | 2.24 | 2.80 | 5.175 |
Portfolio Turnover6 (%) | 51 | 78 | 74 | 34 |
| 1 | Commenced investment operations May 1, 2007. |
| 2 | Based on average shares outstanding during the year. |
| 3 | These returns are after all charges at the mutual fund level have been subtracted. These returns are higher than the returns at the separate account level because charges made at the separate account level have not been subtracted. Total returns are not annualized for periods less than one year. |
| 4 | Not annualized. |
| 5 | Annualized. |
| 6 | Portfolio Turnover is calculated at the fund level and represents the entire fiscal year or period |
See accompanying Notes to Financial Statements.
Ultra Series Fund | December 31, 2010
Financial Highlights for a Share of Beneficial Interest Outstanding
TARGET RETIREMENT 2030 FUND |
| | | |
| | | | |
| CLASS I | | | | |
Net Asset Value at beginning of period | $ 7.41 | $ 5.75 | $ 9.54 | $10.00 |
| Income from Investment Operations: | | | | |
Net investment income2 | 0.18 | 0.12 | 0.18 | 0.09 |
| Net realized and unrealized gain (loss) on investments | | | | |
| Total from investment operations | 0.70 | 1.77 | (3.64) | (0.25) |
| Less Distributions: | | | | |
| Distributions from net investment income | (0.21) | (0.11) | (0.11) | (0.21) |
| Distributions from capital gains | | | | |
| Total distributions | (0.21) | (0.11) | | (0.21) |
| Net increase (decrease) in net asset value | 0.49 | 1.66 | (3.79) | (0.46) |
Net Asset Value at end of period | $ 7.90 | $ 7.41 | $ 5.75 | $ 9.54 |
Total Return3 (%) | 9.56 | 30.94 | (38.35) | (2.51)4 |
| Ratios/Supplemental Data: | | | | |
| Net Assets at end of period (in 000’s) | $31,279 | $19,330 | $8,010 | $1,521 |
| Ratios of expenses to average net assets | | | | |
| Before reimbursement of expenses by Adviser | 0.40 | 0.41 | 0.40 | 0.445 |
| After reimbursement of expenses by Adviser | 0.20 | 0.34 | 0.40 | 0.445 |
| Ratio of net investment income to average net assets (%) | 2.42 | 1.87 | 2.38 | 3.535 |
Portfolio Turnover6 (%) | 43 | 78 | 52 | 154 |
| 1 | Commenced investment operations May 1, 2007. |
| 2 | Based on average shares outstanding during the year. |
| 3 | These returns are after all charges at the mutual fund level have been subtracted. These returns are higher than the returns at the separate account level because charges made at the separate account level have not been subtracted. Total returns are not annualized for periods less than one year. |
| 4 | Not annualized. |
| 5 | Annualized. |
| 6 | Portfolio Turnover is calculated at the fund level and represents the entire fiscal year or period |
See accompanying Notes to Financial Statements.
Ultra Series Fund | December 31, 2010
Financial Highlights for a Share of Beneficial Interest Outstanding
TARGET RETIREMENT 2040 FUND |
| | | |
| | | | |
| CLASS I | | | | |
Net Asset Value at beginning of period | $ 7.07 | $ 5.43 | $ 9.48 | $10.00 |
| Income from Investment Operations: | | | | |
Net investment income2 | 0.15 | 0.08 | 0.14 | 0.07 |
| Net realized and unrealized gain (loss) on investments | | | | |
| Total from investment operations | 0.70 | 1.71 | (3.92) | (0.29) |
| Less Distributions: | | | | |
| Distributions from net investment income | (0.17) | (0.07) | (0.08) | (0.23) |
| Distributions from capital gains | | – | (0.05) | – |
| Total distributions | (0.17) | | | |
| Net increase (decrease) in net asset value | 0.53 | 1.64 | (4.05) | (0.52) |
Net Asset Value at end of period | $ 7.60 | $ 7.07 | $ 5.43 | $ 9.48 |
Total Return3 (%) | 9.97 | 31.64 | (41.65) | (2.86)4 |
| Ratios/Supplemental Data: | | | | |
| Net Assets at end of period (in 000’s) | $26,147 | $16,656 | $6,385 | $1,193 |
| Ratios of expenses to average net assets | | | | |
| Before reimbursement of expenses by Adviser | 0.40 | 0.41 | 0.40 | 0.445 |
| After reimbursement of expenses by Adviser | 0.20 | 0.34 | 0.40 | 0.445 |
| Ratio of net investment income to average net assets (%) | 2.14 | 1.22 | 1.99 | 2.765 |
Portfolio Turnover6 (%) | 40 | 86 | 62 | 14 |
| 1 | Commenced investment operations May 1, 2007. |
| 2 | Based on average shares outstanding during the year. |
| 3 | These returns are after all charges at the mutual fund level have been subtracted. These returns are higher than the returns at the separate account level because charges made at the separate account level have not been subtracted. Total returns are not annualized for periods less than one year. |
| 4 | Not annualized. |
| 5 | Annualized. |
| 6 | Portfolio Turnover is calculated at the fund level and represents the entire fiscal year or period |
See accompanying Notes to Financial Statements.
Ultra Series Fund | December 31, 2010
Notes to Financial Statements
1. ORGANIZATION
The Ultra Series Fund (the "Trust’’), a Massachusetts business trust, is registered under the Investment Company Act of 1940 (the "1940 Act’’), as amended, as a diversified, open-end management investment company. The Trust is a series fund with 17 investment portfolios (individually, a "Fund", and collectively, the "Funds’’), each with different investment objectives and policies. The funds currently available are the Money Market Fund, Bond Fund, High Income Fund, Diversified Income Fund, Equity Income Fund, Large Cap Value Fund, Large Cap Growth Fund, Mid Cap Fund, Small Cap Fund and International Stock Fund (collectively, the "Core Funds’’), the Conservative Allocation Fund, Moderate Allocation Fund and Aggressi ve Allocation Fund (collectively, the "Target Allocation Funds’’), and the Target Retirement 2020 Fund, Target Retirement 2030 Fund, Target Retirement 2040 Fund and Target Retirement 2050 Fund (collectively, the "Target Date Funds"). As of December 31, 2010, all funds are currently available except for the Target Retirement 2050 Fund, which commenced investment operations on January 3, 2011.
The Declaration of Trust permits the Board of Trustees to issue an unlimited number of full and fractional shares of the Trust without par value. All funds, except for the Target Date Funds, offer Class I and II shares. The Target Date Funds only offer a single class of shares, Class I shares. Each class of shares represents an interest in the assets of the respective fund and has identical voting, dividend, liquidation and other rights, except that each class of shares bears its own distribution fees, if any, and its proportional share of fund level expenses, and has exclusive voting rights on matters pertaining to Rule 12b-1 under the 1940 Act as it relates to that class and other class specific matters. Shares are offered to separate accounts (the "Accounts� 217;’) of CUNA Mutual Insurance Society and to qualified pension and retirement plans of CUNA Mutual Insurance Society or its affiliates ("CUNA Mutual Group’’). The Trust may, in the future, offer other share classes to separate accounts of insurance companies and to qualified pension and retirement plans that are not affiliated with CUNA Mutual Group. The Trust does not offer shares directly to the general public.
The Trust has entered into a Management Agreement with Madison Asset Management, LLC. (the "Investment Adviser" or "Madison"). The Investment Adviser, in turn, has entered into subadvisory agreements with certain subadvisers ("Subadvisers") for the management of the investments of the High Income, Small Cap and International Stock Funds.
2. SIGNIFICANT ACCOUNTING POLICIES
The preparation of financial statements requires management to make estimates and assumptions that affect the reported amounts of assets and liabilities and disclosure of contingent assets and liabilities at the date of the financial statements and the reported amounts of income and expenses during the reported period. Actual results could differ from those estimates. The following is a summary of significant accounting policies consistently followed by each Fund in the preparation of its financial statements.
Portfolio Valuation: Equity securities and exchange-traded funds ("ETFs") listed on any U.S. or foreign stock exchange or quoted on the National Association of Securities Dealers Automated Quotation System ("NASDAQ’’) are valued at the last quoted sale price or official closing price on that exchange or NASDAQ on the valuation day (provided that, for securities traded on NASDAQ, the funds utilize the NASDAQ Official Closing Price). If no sale occurs, (a) equities traded on a U.S. exchange or on NASDAQ are valued at the mean between the closing bid and closing asked prices and (b) equity securities traded on a foreign exchange are valued at the official bid price. Debt securities purcha sed with a remaining maturity of 61 days or more are valued by a pricing service selected by the Trust or on the basis of dealer-supplied quotations. Investments in shares of open-ended mutual funds, including money market funds, are valued at their daily net asset value ("NAV") which is calculated as of the close of regular trading on the New York Stock Exchange (usually 4:00 p.m. Eastern Standard Time) on each day on which the New York Stock Exchange is open for business. NAV per share is determined by dividing each
Ultra Series Fund | December 31, 2010
Notes to Financial Statements
Fund’s total net assets by the number of shares of such fund outstanding at the time of calculation. The assets of each Target Allocation and each Target Date Fund consist primarily of shares of underlying funds, the NAV of each Fund is determined based on the NAV’s of the underlying funds. Total net assets are determined by adding the total current value of portfolio securities, cash, receivables, and other assets and subtracting liabilities. Short-term instruments having maturities of 60 days or less and all securities in the Money Market Fund are valued on an amortized cost basis, which approximates market value.
Over-the-counter securities not listed or traded on NASDAQ are valued at the last sale price on the valuation day. If no sale occurs on the valuation day, an over-the-counter security is valued at the mean between the last bid and asked prices. Over-the-counter options are valued based upon prices provided by market makers in such securities or dealers in such currencies. Exchange traded options are valued at the last sale or bid price on the exchange where such option contract is principally traded, except for the Equity Income Fund where they are valued at the mean of the best bid and best ask prices across all option exchanges. Futures contracts generally are valued at the settlement price established by the exchange(s) on which the contracts are primarily tra ded. The Trust’s Valuation Committee (the "Committee’’) shall estimate the fair value of futures positions affected by the daily limit by using its valuation procedures for determining fair value, when necessary. Spot and forward foreign currency exchange contracts are valued based on quotations supplied by dealers in such contracts. Overnight repurchase agreements are valued at cost, and term repurchase agreements (i.e., those whose maturity exceeds seven days), swaps, caps, collars and floors are valued at the average of the closing bids obtained daily from at least one dealer.
The value of all assets and liabilities expressed in foreign currencies was converted into U.S. dollar values using the then current exchange rate at the close of regular trading on the New York Stock Exchange (usually 4:00 p.m. Eastern Standard Time).
All other securities for which either quotations are not readily available, no other sales have occurred, or in the Investment Adviser’s opinion, do not reflect the current market value, are appraised at their fair values as determined in good faith by the Committee and under the general supervision of the Board of Trustees. When fair value pricing of securities is employed, the prices of securities used by the Funds to calculate NAV may differ from market quotations or official closing prices. Because the Target Allocation and Target Date Funds primarily invest in underlying funds, government securities and short-term paper, it is not anticipated that the Investment Adviser will need to "fair’’ value any of the investments of these funds. Howev er, an underlying fund may need to "fair’’ value one or more of its investments, which may, in turn, require a Target Allocation or Target Date Fund to do the same because of delays in obtaining the underlying fund’s NAV.
A fund’s investments (or underlying fund) will be valued at fair value if in the judgment of the Committee an event impacting the value of an investment occurred between the closing time of a security’s primary market or exchange (for example, a foreign exchange or market) and the time the fund’s share price is calculated as of the close of regular trading on the New York Stock Exchange (usually 4:00 p.m. Eastern Standard Time). Significant events may include, but are not limited to, the following: (1) significant fluctuations in domestic markets, foreign markets or foreign currencies; (2) occurrences not directly tied to the securities markets such as natural disasters, armed conflicts or significant government actions; and (3) major announceme nts affecting a single issuer or an entire market or market sector. In responding to a significant event, the Committee would determine the fair value of affected securities considering factors including, but not limited to: fundamental analytical data relating to the investment; the nature and duration of any restrictions on the disposition of the investment; and the forces influencing the market(s) in which the investment is purchased or sold. The Committee may rely on an independent fair valuation service to adjust the valuations of foreign equity securities based on specific market-movement parameters established by the Committee and approved by the Trust.
Ultra Series Fund | December 31, 2010
Notes to Financial Statements
Security Transactions and Investment Income: Security transactions are accounted for on a trade date basis. Net realized gains or losses on sales are determined by the identified cost method. Interest income is recorded on an accrual basis. Dividend income is recorded on ex-dividend date. Amortization and accretion are recorded on the effective yield method.
Federal Income Taxes: It is each Fund’s policy to comply with the requirements of Subchapter M of the Internal Revenue Code of 1986 applicable to regulated investment companies and to distribute substantially all its taxable income to its shareholders. Accordingly, no provisions for federal income taxes are recorded in the accompanying financial statements.
The Funds have not recorded any liabilities for material unrecognized tax benefits as of December 31, 2010. It is the Funds’ policy to recognize accrued interest and penalties related to uncertain tax benefits in income taxes, as appropriate. Tax years that remain open to examination by major tax jurisdictions include tax years ended December 31, 2007 through December 31, 2010.
Expenses: Expenses that are directly related to one fund are charged directly to that fund. Other operating expenses are prorated to the Funds on the basis of relative net assets. Class-specific expenses are borne by that class.
Classes: Income and realized and unrealized gains/losses are allocated to the respective classes on the basis of relative net assets.
Repurchase Agreements: Each Fund may engage in repurchase agreements. In a repurchase agreement, a security is purchased for a relatively short period (usually not more than 7 days) subject to the obligation to sell it back to the issuer at a fixed time and price plus accrued interest. The Funds will enter into repurchase agreements only with member banks of the Federal Reserve System and with "primary dealers’’ in U.S. Government securities. As of December 31, 2010, only the Equity Income Fund had open repurchase agreements.
The Trust has established a procedure providing that the securities serving as collateral for each repurchase agreement must be delivered to the Trust’s custodian either physically or in book-entry form and that the collateral must be marked to market daily to ensure that the repurchase agreement is fully collateralized at all times. In the event of bankruptcy or other default by a seller of a repurchase agreement, a fund could experience one of the following: delays in liquidating the underlying securities during the period in which the fund seeks to enforce its rights thereto, possible subnormal levels of income, declines in value of the underlying securities, or lack of access to income during this period and the expense of enforcing its rights.
Foreign Currency Transactions: The books and records are maintained in U.S. dollars. Foreign currency denominated transactions (i.e., market value of investment securities, assets and liabilities, purchases and sales of investment securities, and income and expenses) are translated into U.S. dollars at the current rate of exchange.
Each Fund, except the Money Market Fund, reports certain foreign currency-related transactions as components of realized gains or losses for financial reporting purposes, whereas such components are treated as ordinary income for federal income tax purposes. Only the International Stock Fund had net realized losses. The International Stock Fund’s net realized losses of $815,153 are included in the Statements of Operations under the heading "Net realized gain (loss) on investments" for the International Stock Fund. The Money Market Fund can only invest in U.S. dollar-denominated foreign money market securities.
The Funds do not isolate the portion of gains and losses on investments in securities that is due to changes in the foreign exchange rates from that which is due to changes in market prices of securities. Such amounts are categorized as gain or loss on investments for financial reporting purposes.
Ultra Series Fund | December 31, 2010
Notes to Financial Statements
Forward Foreign Currency Exchange Contracts: Each Fund, except the Money Market Fund, may purchase and sell forward foreign currency exchange contracts for defensive or hedging purposes. When entering into forward foreign currency exchange contracts, the Funds agree to receive or deliver a fixed quantity of foreign currency for an agreed-upon price on an agreed future date. These contracts are valued daily. The Funds’ net assets reflect unrealized gains or losses on the contracts as measured by the difference between the forward foreign currency exchange rates at the dates of entry into the contracts and the forward rates at the reporting date. The Funds realize a gain or a loss at the time the forward foreign currency exchange contracts are settled or closed out with an offsetting contract. Realized and unrealized gains and losses are included in the Statements of Operations. As of December 31, 2010, none of the Funds had open forward foreign currency exchange contracts. However, as the Funds enter into contracts on the trade date, at the current spot rate, to settle any securities transactions denominated in foreign currencies on behalf of the funds. As of December 31, 2010, the International Stock Fund had open foreign currency contracts to settle payables for investments purchased and receivables for investments sold.
If a Fund enters into a forward foreign currency exchange contract to buy foreign currency for any purpose, the fund will be required to place cash or other liquid assets in a segregated account with the Fund’s custodian in an amount equal to the value of the fund’s total assets committed to the consummation of the forward contract. If the value of the securities in the segregated account declines, additional cash or securities will be placed in the segregated account so that the value of the account will equal the amount of the Fund’s commitment with respect to the contract.
Futures Contracts: Each Fund, except the Money Market Fund, may purchase and sell futures contracts and purchase and write options on futures contracts. The Funds will engage in futures contracts or related options transactions to hedge certain market positions. Upon entering into a futures contract, the Fund is required to pledge to the broker an amount of cash, U.S. Government securities or other assets, equal to a certain percentage of the contract (initial margin deposit). Subsequent payments, known as "variation margin,’’ are made or received by the Fund each day, depending on the daily fluctuations in the fair value of the futures contract. When a Fund enters into a futures contr act, the Fund segregates cash or other liquid securities, of any type or maturity, equal in value to the Fund’s commitment. The Fund recognizes a gain or loss equal to the daily change in the value of the futures contracts. Should market conditions move unexpectedly, the Fund may not achieve the anticipated benefits of the futures contracts and may realize a loss. As of December 31, 2010, none of the Funds have open futures contracts.
Each Fund currently limits investments in illiquid securities to 15% of net assets at the time of purchase, except for Money Market which limits the investment in illiquid securities to 5% of net assets. At December 31, 2010, investments in securities of the Bond, High Income and Diversified Income Funds include issues that are illiquid. The aggregate values of illiquid securities held by Bond, High Income and Diversified Income were $14,529,681, $2,300,625 and $10,665,486, respectively, which represent 3.1%, 2.3% and 2.6% of net assets, respectively. Pursuant to guidelines adopted by the Board of Trustees, certain unregistered securities are determined to be liquid and are not included within the percent limitations specified above. Information concerning the il liquid securities held at December 31, 2010, which includes cost and acquisition date, is as follows:
| | |
| Bond Fund | | |
| American Association of Retired Persons | 5/16/02 | $ 2,644,675 |
| ERAC USA Finance LLC | 12/16/04 | 4,815,932 |
| Indianapolis Power & Light Co. | 10/02/06 | 3,422,883 |
| WM Wrigley Jr. Co. | 6/21/10 | |
| | | $14,050,954 |
Ultra Series Fund | December 31, 2010
Notes to Financial Statements
| | |
| High Income Fund | | |
| Stewart Enterprises, Inc. | 10/24/07 | $ 483,125 |
| Syniverse Technologies Inc., Series B | Various | 755,802 |
| WCA Waste Corp. | 6/28/06 | |
| | | $ 2,241,034 |
| Diversified Income Fund | | |
| American Association of Retired Persons | 5/16/02 | $ 2,115,740 |
| ERAC USA Finance LLC | 12/16/04 | 2,024,881 |
| Indianapolis Power & Light Co. | 10/2/06 | 1,545,017 |
| Nissan Motor Acceptance Corp. | 3/16/07 | 3,267,151 |
| WM Wrigley Jr. Co. | 6/21/10 | |
| | | $10,261,741 |
Delayed Delivery Securities: Each Fund may purchase securities on a when-issued or delayed delivery basis. "When-issued’’ refers to securities whose terms are available and for which a market exists, but that have not been issued. For when-issued or delayed delivery transactions, no payment is made until delivery date, which is typically longer than the normal course of settlement, and often a month or more after the purchase. When a Fund enters into an agreement to purchase securities on a when-issued or delayed delivery basis, the Fund segregates cash or other liquid securities, of any type or maturity, equal in value to the Fund’s commitment. Losses may arise due to changes in the market value of the underlying securities, if the counterparty does not perform under the contract, or if the issuer does not issue the securities due to political, economic or other factors. As of December 31, 2010, none of the Funds had entered into such transactions.
Reclassification Adjustments: Paid-in capital, undistributed net investment income, and accumulated net realized gain (loss) have been adjusted in the Statements of Assets and Liabilities for permanent book-tax differences for all Funds.
Differences primarily relate to the tax treatment of net operating losses, paydown gains and losses, foreign currency gains and losses, and distributions from real estate investment trusts and passive foreign investment companies.
To the extent these book and tax differences are permanent in nature, such amounts are reclassified at the end of the fiscal year among paid-in capital in excess of par value, undistributed net investment income (loss) and undistributed net realized gain (loss) on investments and foreign currency translations. Accordingly, at December 31, 2010, reclassifications were recorded as follows:
| | Undistributed Net Investment Income (Loss) | Accumulated Net Realized Gain (Loss) |
| Conservative Allocation | $ – | $2,863,088 | $(2,863,088) |
| Moderate Allocation | – | 3,115,605 | (3,115,605) |
| Aggressive Allocation | – | 465,811 | (465,811) |
| Money Market | – | – | – |
| Bond | (1,857,702) | (457,176) | 2,314,878 |
| High Income | 4 | 14,415 | (14,419) |
| Diversified Income | (1,719) | (221,714) | 223,433 |
| Equity Income | – | 3,605 | (3,605) |
| Large Cap Value | – | (107,819) | 107,819 |
| Large Cap Growth | – | – | – |
| Mid Cap | 43,896,700 | 551 | (43,897,251) |
| Small Cap | 2,338,038 | (5,671) | (2,332,367) |
| International Stock | 5,292,907 | 212,968 | (5,505,875) |
Ultra Series Fund | December 31, 2010
Notes to Financial Statements
| | Undistributed Net Investment Income (Loss) | Accumulated Net Realized Gain (Loss) |
| Target Retirement 2020 | $ – | $ 318,711 | $ (318,711) |
| Target Retirement 2030 | – | 261,260 | (261,260) |
| Target Retirement 2040 | – | 154,562 | (154,562) |
Fair Value Measurements: Each Fund has adopted the Financial Accounting Standards Board ("FASB") guidance on fair value measurements. Fair value is defined as the price that each Fund would receive upon selling an investment in a timely transaction to an independent buyer in the principal or most advantageous market of the investment. A three-tier hierarchy is used to maximize the use of observable market data "inputs" and minimize the use of unobservable "inputs" and to establish classification of fair value measurements for disclosure purposes. Inputs refer broadly to the assumptions that market participants would use in pricing the asset or liability, including assumptions about risk (for examp le, the risk inherent in a particular valuation technique used to measure fair value including such a pricing model and/or the risk inherent in the inputs to the valuation technique). Inputs may be observable or unobservable. Observable inputs are inputs that reflect the assumptions market participants would use in pricing the asset or liability developed based on market data obtained from sources independent of the reporting entity. Unobservable inputs are inputs that reflect the reporting entity’s own assumptions about the assumptions market participants would use in pricing the asset or liability developed based on the best information available in the circumstances. The three-tier hierarchy of inputs is summarized in the three broad Levels listed below:
| | •Level 1 – quoted prices in active markets for identical investments |
| | •Level 2 – other significant observable inputs (including quoted prices for similar investments, interest rate volatilities, prepayment speeds, credit risk, benchmark yields, transactions, bids, offers, new issues, spreads and other relationships observed in the markets among comparable securities, underlying equity of the issuer; and proprietary pricing models such as yield measures calculated using factors such as cash flows, financial or collateral performance and other reference data, etc.) |
| | •Level 3 – significant unobservable inputs (including the Fund’s own assumptions in determining the fair value of investments) |
The valuation techniques used by the Funds to measure fair value for the period ended December 31, 2010 maximized the use of observable inputs and minimized the use of unobservable inputs. The Funds utilized the following fair value techniques: multi-dimensional relational pricing model and option adjusted spread pricing; the Funds estimated the price that would have prevailed in a liquid market for an international equity security given information available at the time of evaluation. As of December 31, 2010 or throughout the year, none of the Funds held securities deemed as a Level 3.
The following is a summary of the inputs used as of December 31, 2010 in valuing the Funds’ investments carried at fair value (please see the Portfolio of Investments for each Fund for a listing of all securities within each caption):
Ultra Series Fund | December 31, 2010
Notes to Financial Statements
| Quoted Prices in Active Markets for Identical Investments (Level 1) | Significant Other Observable Inputs (Level 2) | Significant Unobservable Inputs (Level 3) | |
Conservative Allocation1 | $229,532,082 | $ – | $ – | $229,532,082 |
Moderate Allocation1 | 380,489,042 | – | – | 380,489,042 |
Aggressive Allocation1 | 126,252,714 | – | – | 126,252,714 |
Money Market2 | 1,529,834 | 68,729,696 | – | 70,259,530 |
| Bond | | | | |
| Asset Backed | – | 8,321,492 | – | 8,321,492 |
| Corporate Notes and Bonds | – | 120,025,458 | – | 120,025,458 |
| Mortgage Backed | – | 110,728,120 | – | 110,728,120 |
| U.S. Government and Agency Obligations | – | 208,161,197 | – | 208,161,197 |
| Investment Companies | | | | |
| | 14,230,708 | 447,236,267 | – | 461,466,975 |
| High Income | | | | |
| Corporate Notes and Bonds | – | 95,148,152 | – | 95,148,152 |
| Investment Companies | | | | |
| | 3,495,898 | 95,148,152 | – | 98,644,050 |
| Diversified Income | | | | |
| Common Stocks | 212,239,029 | – | – | 212,239,029 |
| Asset Backed | – | 4,819,241 | – | 4,819,241 |
| Corporate Notes and Bonds | – | 75,993,859 | – | 75,993,859 |
| Mortgage Backed | – | 46,309,443 | – | 46,309,443 |
| U.S. Government and Agency Obligations | – | 53,804,234 | – | 53,804,234 |
| Investment Companies | | | | |
| | 223,827,912 | 180,926,777 | – | 404,754,689 |
| Equity Income | | | | |
| Assets: | | | | |
| Common Stocks | 1,869,030 | – | – | 1,869,030 |
| Investment Companies | 94,514 | – | – | 94,514 |
| Repurchase Agreement | | | | |
| | 1,963,544 | 466,030 | – | 2,429,574 |
| Liabilities: | | | | |
| Options Written | 119,851 | – | – | 119,851 |
| Large Cap Value | | | | |
| Common Stocks | 521,200,050 | – | – | 521,200,050 |
| Investment Companies | | | | |
| | 529,394,144 | – | – | 529,394,144 |
| Large Cap Growth | | | | |
| Common Stocks | 378,472,635 | – | – | 378,472,635 |
| Investment Companies | | | | |
| | 394,539,261 | – | – | 394,539,261 |
| Mid Cap | | | | |
| Common Stocks | 379,566,284 | – | – | 379,566,284 |
| Investment Companies | | | | |
| | 397,138,056 | – | – | 397,138,056 |
| Small Cap | | | | |
| Common Stocks | 12,533,772 | – | – | 12,533,772 |
| Investment Companies | | | | |
| | 13,041,823 | – | – | 13,041,823 |
1 At December 31, 2010, all investments are Level 1. |
2 At December 31, 2010, all Level 2 securities held are short term investments. |
Ultra Series Fund | December 31, 2010
Notes to Financial Statements
| Quoted Prices in Active Markets for Identical Investments (Level 1) | Significant Other Observable Inputs (Level 2) | Significant Unobservable Inputs (Level 3) | |
| International Stock | | | | |
| Common Stocks | | | | |
| Australia | $ – | $ 2,307,039 | $ – | $ 2,307,039 |
| Belgium | – | 2,282,026 | – | 2,282,026 |
| Brazil | – | 2,967,666 | – | 2,967,666 |
| Canada | – | 1,843,478 | – | 1,843,478 |
| China | – | 1,614,629 | – | 1,614,629 |
| Denmark | – | 1,330,608 | – | 1,330,608 |
| Finland | – | 964,541 | – | 964,541 |
| France | – | 10,953,134 | – | 10,953,134 |
| Germany | – | 4,747,394 | – | 4,747,394 |
| Hong Kong | – | 1,257,745 | – | 1,257,745 |
| Israel | – | 980,044 | – | 980,044 |
| Italy | – | 1,143,921 | – | 1,143,921 |
| Japan | – | 20,853,952 | – | 20,853,952 |
| Mexico | – | 920,515 | – | 920,515 |
| Netherlands | – | 2,763,780 | – | 2,763,780 |
| Norway | – | 991,301 | – | 991,301 |
| Russia | – | 1,000,636 | – | 1,000,636 |
| Singapore | – | 958,947 | – | 958,947 |
| South Korea | – | 2,422,569 | – | 2,422,569 |
| Spain | – | 1,208,999 | – | 1,208,999 |
| Sweden | – | 991,785 | – | 991,785 |
| Switzerland | – | 7,497,258 | – | 7,497,258 |
| Turkey | – | 905,370 | – | 905,370 |
| United Kingdom | – | 30,611,566 | – | 30,611,566 |
| Investment Companies | | | | |
| | 1,607,953 | 103,518,903 | – | 105,126,856 |
Target Retirement 20201 | 27,379,277 | – | – | 27,379,277 |
Target Retirement 20301 | 30,959,942 | – | – | 30,959,942 |
Target Retirement 20401 | 25,824,301 | - | – | 25,824,301 |
1At December 31, 2010, all investments are level 1. |
Derivatives: In March 2008, FASB issued guidance intended to enhance financial statement disclosures for derivative instruments and hedging activities and enable investors to understand: a) how and why a Fund uses derivative instruments, b) how derivative instruments and related hedge Fund items are accounted for, and c) how derivative instruments and related hedge items affect a Fund’s financial position, results of operations and cash flows. This guidance is effective for financial statements issued for fiscal years and interim periods beginning after November 15, 2008. The Funds adopted this guidance effective April 30, 2010 with the inception of the Equity Income Fund.
The following table presents the types of derivative in the Equity Income Fund by location as presented on the Statement of Assets and Liabilities as of December 31, 2010.
Ultra Series Fund | December 31, 2010
Notes to Financial Statements
Statement of Asset & Liability Presentation of Fair Values of Derivative Instruments |
| | | |
Derivatives not accounted for as hedging instruments | Statement of Assets and Liabilities Location | | Statement of Assets | |
| Equity contracts | – | -- | Options written | $119,851 |
The following table presents the effect of Derivative Instruments on the Statement of Operations for the period ended December 31, 2010:
Derivatives not accounted for as hedging instruments | Realized Gain on Derivatives: | Change in Unrealized Depreciation on Derivatives |
| Equity contracts | $24,936 | $(35,038) |
Management has determined that there is no impact on the financial statements of the other Funds held in the Trust as they did not hold derivative financial instruments.
For the year ended December 31, 2010, none of the Funds had securities transferred between classification levels.
3. ADVISORY, ADMINISTRATION AND DISTRIBUTION AGREEMENTS
For its investment advisory services to the Funds, the Investment Adviser is entitled to receive a fee, which is calculated daily and paid monthly, at an annual rate based upon the following percentages of average daily net assets: 0.45% for the Money Market Fund, 0.55% for the Bond Fund, 0.75% for the High Income Fund, 0.70% for the Diversified Income Fund, 0.90% for the Equity Income Fund,0.60% for the Large Cap Value Fund, 0.80% for the Large Cap Growth Fund, 0.90% for the Mid Cap Fund, 1.10% for the Small Cap Fund, 1.20% for the International Stock Fund, 0.30% for each of the Target Allocation Funds. Since October 1, 2009, Madison reduced the management fee of the Target Date Funds from 0.40% to 0.20%. This waiver became permanent effective February 16, 2011. The Investment Adviser is solely responsible for the payment of all fees to the Subadvisers. The Subadvisers for the funds are Shenkman Capital Management, Inc. for the High Income Fund, Wellington Management Company, LLP for the Small Cap Fund and Lazard Asset Management LLC for the International Stock Fund. The Investment Adviser manages the Money Market Fund, Bond Fund, Diversified Income Fund, Equity Income Fund, Large Cap Growth Fund, Large Cap Value Fund, Mid Cap Fund, Target Allocation Funds and the Target Date Funds.
The Investment Adviser may from time to time voluntarily agree to waive a portion of its fees or expenses related to the Funds. In that regard, the Investment Adviser waived a portion of management fees on the Money Market Class I Shares and Class II Shares for the purpose of maintaining a one-day yield of zero. The amount of the daily waiver is equal to the amount required to maintain a minimum daily distribution rate of zero. For the period ended December 31, 2010, the waivers totaled $267,805 for Class I Shares and $949 for Class II Shares and are reflected as fees waived by the Investment Adviser in the accompanying Statement of Operations.
In addition to the management fee, the Trust is responsible for fees of the disinterested trustees, brokerage commissions and other expenses incurred in connection with the acquisition or disposition of investments, costs of borrowing money, expenses for independent audits, tax, compliance and extraordinary expenses as approved by a majority of the Independent Trustees.
Certain officers and trustees of the Trust are also officers of the Investment Adviser. The Trust does not compensate its officers or trustees. Unaffiliated trustees receive from the Trust an attendance fee for each Board or Committee meeting attended, with additional remuneration paid to the audit committee and nominating and governance committee chairs.
Ultra Series Fund | December 31, 2010
Notes to Financial Statements
Limited Services Agreement: Effective July 1, 2009, the investment adviser, Madison Asset Management, LLC ("Madison"), entered into a Limited Services Agreement with the Trust. Under the agreement, Madison agreed to cap certain operating expenses of each Fund (other than the Equity Income Fund) that, prior to that date, had been paid directly by the funds (not including securities transaction commissions and expenses, certain taxes, interest, share distribution expenses, and extraordinary and non-recurring expenses). The Limited Services Agreement is in force for a period of no less than two years from the date of the agreement. Specifically, Madison, in exchange for the Limited Service Fee, is re sponsible for paying the fees and expenses of the Funds’ Independent Trustees, independent registered public accountants, and all costs related to the funds’ compliance program. The agreement requires Madison to maintain expense levels for these items at a dollar amount that is no more than the amount of such expenses incurred by each fund’s Class I shares for the year-ended December 31, 2008, as follows:
| | | | |
| Conservative Allocation | $11,284 | | Large Cap Value | $120,439 |
| Moderate Allocation | 31,600 | | Large Cap Growth | 76,596 |
| Aggressive Allocation | 11,456 | | Mid Cap | 40,739 |
| Money Market | 18,783 | | Small Cap | 1,035 |
| Bond | 73,318 | | International Stock | 24,119 |
| High Income | 14,749 | | Target Retirement 2020 | 337 |
| Diversified Income | 71,315 | | Target Retirement 2030 | 245 |
| | | | Target Retirement 2040 | 213 |
If actual expenses exceed these dollar amounts, Madison is required to pay the excess (not the Funds). The caps listed above for the Mid Cap and International Stock Funds may not reflect the actual expenses on the Statement of Operations due to merger-related activity. At no time did these funds’ expenses exceed their respected caps per the Limited Services Agreement.
Distribution Agreement. Mosaic Funds Distributor, LLC ("MFD") serves as distributor of the Funds. The Trust adopted distribution and service plan with respect to the Trust’s Class II shares pursuant to Rule 12b-1 under the 1940 Act. Under the plan, the Trust will pay a service fee with regard to Class II shares at an annual rate of 0.25% of each Fund’s daily net assets. MFD arranges to provide compensation to others that provide distribution and shareholder servicing services to the Funds and their shareholders. Fees incurred by the Funds under the plan are detailed in the Statement of Operations.
The distributor may from time to time voluntarily agree to waive a portion of its fees or expenses related to the Funds. In this regard, the distributor waived a portion of 12b-1 fees on the Money Market Class II shares for the purpose of maintaining a one-day yield of zero. For the period ended December 31, 2010, the waivers totaled $742 and are reflected as fees waived in the accompanying Statement of Operations.
The Trust has entered into participation agreements with CUNA Mutual Insurance Society setting forth the terms and conditions pursuant to which the Accounts and retirement plans purchase and redeem shares of the funds. Investments in the Trust by the Accounts are made through either variable annuity or variable life insurance contracts. Net purchase payments under the variable contracts are placed in one or more sub-accounts of the Accounts, and the assets of each sub-account are invested (without sales or redemption charges) in shares of the Fund corresponding to that sub-account. Shares are purchased and redeemed at a price equal to the shares’ net asset value. The assets of each Fund are held separate from the assets of the other Funds.
Ultra Series Fund | December 31, 2010
Notes to Financial Statements
4. DIVIDENDS FROM NET INCOME AND DISTRIBUTIONS OF CAPITAL GAINS
The Money Market Fund declares dividends from net investment income and net realized gains from investment transactions, if any, daily, and net realized gains from investment transactions, if any, annually, which are reinvested in additional full and fractional shares of the fund. The Bond Fund, High Income Fund, Diversified Income Fund, Equity Income Fund, Large Cap Value Fund, Large Cap Growth Fund, Small Cap, Mid Cap Fund, International Stock Fund, Target Allocation Funds, and Target Date Funds declare dividends from net investment income and net realized gains from investment transactions, if any, annually, which are reinvested in additional full and fractional shares of the respective Funds.
Income and capital gain distributions, if any, are determined in accordance with federal income tax regulations, which may differ from accounting principles generally accepted in the United States of America. Taxable distributions from income and realized capital gains of the Funds may differ from book amounts earned during the period due to differences in the timing of capital gains recognition, and due to the reclassification of certain gains or losses from capital to income.
5. SECURITIES TRANSACTIONS
For the period ended December 31, 2010, aggregate cost of purchases and proceeds from sales of securities, other than short-term investments, were as follows:
| | U.S. Government Securities | Other Investment Securities |
| | | | |
| Conservative Allocation | $ – | $ – | $106,478,692 | $ 74,773,509 |
| Moderate Allocation | – | – | 132,594,592 | 120,224,453 |
| Aggressive Allocation | – | – | 40,155,987 | 39,848,617 |
| Bond | 7,892,956 | 75,930,606 | 3,167,464 | 34,599,267 |
| High Income | – | – | 50,430,293 | 64,365,473 |
| Diversified Income | 2,588,729 | 26,270,980 | 89,695,390 | 115,364,375 |
| Equity Income | – | – | 2,329,126 | 493,282 |
| Large Cap Value | – | – | 355,718,949 | 491,701,621 |
| Large Cap Growth | – | – | 309,414,971 | 405,118,566 |
| Mid Cap | – | – | 149,496,633 | 228,018,838 |
| Small Cap | – | – | 3,423,656 | 5,771,562 |
| International Stock | – | – | 73,095,083 | 87,199,857 |
| Target Retirement 2020 | – | – | 18,347,989 | 11,434,073 |
| Target Retirement 2030 | – | – | 20,032,260 | 10,178,771 |
| Target Retirement 2040 | – | – | 15,483,333 | 8,000,960 |
6. COVERED CALL OPTIONS
The Equity Income Fund will pursue its primary objective by employing an option strategy of writing (selling) covered call options on common stocks. The number of call options the Fund can write (sell) is limited by the amount of equity securities the fund holds in its portfolio. The fund will not write (sell) "naked" or uncovered call options. The Fund seeks to produce a high level of current income and gains generated from option writing premiums and, to a lesser extent, from dividends.
Ultra Series Fund | December 31, 2010
Notes to Financial Statements
Transactions in option contracts during the period ended December 31, 2010 were as follows:
| | | |
| Options outstanding, beginning of period | – | – |
| Options written during the period | 719 | $130,853 |
| Options expired during the period | (110) | (21,138) |
| Options closed during the period | (20) | (4,928) |
| Options assigned during the period | | |
| Options outstanding, end of period | | |
7. FOREIGN SECURITIES
Each Fund may invest in foreign securities; provided, however, that the Money Market Fund is limited to U.S. dollar-denominated foreign money market securities. Foreign securities refer to securities that are: (1) issued by companies organized outside the U.S. or whose principal operations are outside the U.S., (2) issued by foreign governments or their agencies or instrumentalities, (3) principally traded outside the U.S., or (4) quoted or denominated in a foreign currency. Foreign securities include American Depositary Receipts ("ADRs’’), European Depositary Receipts ("EDRs’’), Global Depositary Receipts ("GDRs’’), Swedish Depositary Receipts ("SDRs’’) and foreign money market securities. Dollar-denominated securi ties that are part of the Merrill Lynch U.S. Domestic Master Index are not considered a foreign security.
Certain funds have reclaim receivable balances, in which the funds are due a reclaim on the taxes that have been paid to some foreign jurisdictions. The values of all reclaims are not significant for any of the funds and are reflected in Other Assets on the Statement of Assets and Liabilities. On a periodic basis, these receivables are reviewed to ensure the current receivable balance is reflective of the amount deemed to be collectible.
8. SECURITIES LENDING
Each fund, except the Target Allocation, Money Market, Small Cap, Equity Income and Target Retirement Funds, entered into a Securities Lending Agreement (the "Agreement") with State Street Bank and Trust Company ("State Street"). Under the terms of the Agreement, the Funds may lend portfolio securities to qualified borrowers in order to earn additional income. The Agreement requires that loans are collateralized at all times by cash or other liquid assets at least equal to 102% of the value of the securities, which is determined on a daily basis.
Amounts earned as interest on investments of cash collateral, net of rebates and fees, if any, are included in the Statement of Operations.
The primary risk associated with securities lending is if the borrower defaults on its obligation to return the securities loaned because of insolvency or other reasons, the funds could experience delays and costs in recovering securities loaned or in gaining access to the collateral.
The Funds did not transact in securities lending for the year ended December 31, 2010 and had no securities out on loan as of December 31, 2010.
Ultra Series Fund | December 31, 2010
Notes to Financial Statements
9. TAX INFORMATION
The tax character of distributions paid during the years ended December 31, 2010 and 2009 was as follows:
| | |
| | | |
| Conservative Allocation | $ 8,982,364 | $ 4,991,218 | $ – | $ – |
| Moderate Allocation | 11,196,100 | 6,860,559 | – | – |
| Aggressive Allocation | 1,977,176 | 1,433,805 | – | – |
| Money Market | – | 5,409 | – | – |
| Bond | 19,336,364 | 23,297,662 | – | – |
| High Income | 7,418,611 | 8,105,518 | – | – |
| Diversified Income | 14,252,970 | 16,690,184 | – | – |
| Equity Income | 53,076 | | – | |
| Large Cap Value | 9,967,106 | 12,938,553 | – | – |
| Large Cap Growth | 2,089,694 | 2,794,182 | – | – |
| Mid Cap | 1,321,723 | 5,837 | – | – |
| Small Cap | 84,410 | 40,906 | – | – |
| International Stock | 1,911,410 | 1,529,519 | – | – |
| Target Retirement 2020 | 890,022 | 323,699 | – | – |
| Target Retirement 2030 | 823,904 | 270,609 | – | – |
| Target Retirement 2040 | 574,774 | 157,883 | – | – |
As of December 31, 2010, the components of distributable earnings on a tax basis were as follows:
| | |
| Conservative Allocation | $200,401 | $– |
| Moderate Allocation | 242,947 | – |
| Aggressive Allocation | 45,988 | – |
| Bond | 379,626 | – |
| High Income | 235,020 | – |
| Diversified Income | 282,108 | – |
| Equity Income | 9,457 | – |
| Large Cap Value | 99,876 | – |
| Large Cap Growth | 43,934 | – |
| Mid Cap | 105,029 | – |
| Small Cap | 884 | – |
| International Stock | 38,929 | – |
| Target Retirement 2020 | 21,164 | – |
| Target Retirement 2030 | 28,384 | – |
| Target Retirement 2040 | 26,328 | – |
For federal income tax purposes, the Funds listed below have capital loss carryovers as of December 31, 2010, which are available to offset future capital gains, if any:
| | | | | | | | |
| Conservative Allocation | $ – | $ – | $ – | $ – | $ – | $ 41,976 | $ 6,053,243 | $ – |
| Moderate Allocation | – | – | – | – | – | 17,885,475 | 20,811,527 | 9,937,108 |
| Aggressive Allocation | – | – | – | – | – | 6,446,542 | 6,205,447 | 6,513,626 |
| Bond | 104,606 | 1,560,242 | 1,445,891 | 816,322 | 228,563 | – | 9,584,651 | 346,309 |
| High Income | – | – | – | – | – | 8,436,671 | 4,641,635 | – |
| Diversified Income | – | – | – | – | – | 2,487,530 | 45,589,823 | – |
Ultra Series Fund | December 31, 2010
Notes to Financial Statements
| | | | | | | | |
| Large Cap Value | $ – | $ – | $ – | $ – | $ – | $85,305,978 | $41,852,552 | $ – |
| Large Cap Growth | – | – | – | – | – | 35,115,320 | 20,739,513 | – |
| Mid Cap | – | – | – | – | 7,828,526 | 30,807,814 | 71,947,894 | – |
| Small Cap | – | – | – | – | – | 1,269,222 | 635,547 | – |
| International Stock | – | – | – | – | 751,246 | 8,819,661 | 21,825,302 | 1,915,037 |
| Target Retirement 2020 | – | – | – | – | – | – | 225,054 | 504,165 |
| Target Retirement 2030 | – | – | – | – | – | 40,540 | 140,356 | 259,860 |
| Target Retirement 2040 | – | – | – | – | – | 28,331 | 13,390 | 229,437 |
As a result of the mergers of the Mid Cap Growth and Mid Cap Value (surviving fund - Mid Cap), the Small Cap Growth and the Small Cap Value (surviving fund - Small Cap) and Global Securities and International Stock Funds (surviving fund - International Stock) each surviving fund acquired realized capital losses, which are limited by Internal Revenue Code section 382. Included in the net capital loss carryovers for the Mid Cap Fund, Small Cap Fund, and International Stock Fund are $38,636,340, $1,215,090 and $10,500,521, respectively, of capital loss carryovers subject to certain limitations upon availability to offset future gains, if any, as the successor of a merger. These acquired capital loss carryforwards are included in the total amounts above. Additionally , Small Cap Fund and International Stock Fund both forfeited $630,036 and $4,805,092, respectively, of capital loss carryforwards acquired from the Small Cap Value Fund and Global Securities Fund, respectively, due to the change of ownership rules in the tax law.
As of December 31, 2010, capital loss carryforwards utilized in the fiscal year to offset capital gains were as follows:
| |
| Conservative Allocation | $ 2,949,668 |
| High Income | 2,807,169 |
| Diversified Income | 13,978,906 |
| Large Cap Value | 11,906,830 |
| Large Cap Growth | 43,527,501 |
| Mid Cap | 37,762,319 |
| Small Cap | 1,360,827 |
The Bond Fund had a capital loss carryover expire unused in the current year in the amount of $1,857,702.
After October 31, 2010, the following funds had post-October capital losses in the following amounts:
| |
| Moderate Allocation | $ 786,044 |
| International Stock | 6,378,285 |
For federal income tax purposes, these amounts are deferred and deemed to have occurred in the next fiscal year.
At December 31, 2010, the aggregate gross unrealized appreciation (depreciation) and net unrealized appreciation (depreciation) for all securities, excluding option contracts, as computed on a federal income tax basis for each Fund were as follows:
| | | |
| Conservative Allocation | $ 8,887,780 | $2,613,700 | $ 6,274,080 |
| Moderate Allocation | 20,335,921 | 2,100,075 | 18,235,846 |
| Aggressive Allocation | 10,800,142 | 354,988 | 10,445,154 |
| Bond | 26,280,589 | 4,598,032 | 21,682,557 |
| High Income | 5,816,387 | 212,148 | 5,604,239 |
| Diversified Income | 46,028,019 | 7,731,860 | 38,296,159 |
| Equity Income | 123,302 | 16,830 | 106,472 |
Ultra Series Fund | December 31, 2010
Notes to Financial Statements
| | | |
| Large Cap Value | $71,950,975 | $9,426,278 | $62,524,697 |
| Large Cap Growth | 81,561,387 | 38,193 | 81,523,194 |
| Mid Cap | 60,955,291 | 1,597,582 | 59,357,709 |
| Small Cap | 2,672,701 | 210,478 | 2,462,223 |
| International Stock | 16,905,511 | 1,096,172 | 15,809,339 |
| Target Retirement 2020 | 1,861,754 | 332,671 | 1,529,083 |
| Target Retirement 2030 | 2,349,110 | 288,917 | 2,060,193 |
| Target Retirement 2040 | 2,193,543 | 156,778 | 2,036,765 |
The differences between cost amounts for book purposes and tax purposes are primarily due to the tax deferral of losses.
10. CONCENTRATION OF RISK
Investing in certain financial instruments, including forward foreign currency contracts and futures contracts, involves certain risks, other than that reflected in the Statements of Assets and Liabilities. Risks associated with these instruments include potential for an illiquid secondary market for the instruments or inability of counterparties to perform under the terms of the contracts, changes in the value of foreign currency relative to the U.S. dollar and financial statement volatility resulting from an imperfect correlation between the movements in the prices of the instruments and the prices of the underlying securities and interest rates being hedged. The High Income Fund, Mid Cap Fund, and the International Stock Fund may enter into these contracts pri marily to protect these Funds from adverse currency movements.
Investing in foreign securities involves certain risks not necessarily found in U.S. markets. These include risks associated with adverse changes in economic, political, regulatory and other conditions, changes in currency exchange rates, exchange control regulations, expropriation of assets or nationalization, imposition of withholding taxes on dividend or interest payments or capital gains, and possible difficulty in obtaining and enforcing judgments against foreign entities. Further, issuers of foreign securities are subject to different, and often less comprehensive, accounting, reporting and disclosure requirements than domestic issuers.
The High Income Fund invests in securities offering high current income which generally will include bonds in the below investment grade categories of recognized ratings agencies (so-called "junk bonds’’). These securities generally involve more credit risk than securities in the higher rating categories. In addition, the trading market for high yield securities may be relatively less liquid than the market for higher-rated securities. The Fund generally invests at least 80% of its assets in high yield securities.
The Equity Income Fund invests in option on securities. As the writer of a covered call option, the Fund forgoes, during the option’s life, the opportunity to profit from increases in the market value of the security covering the call option above the sum of the premium and the strike price of the call but has retained the risk of loss should the price of the underlying security decline. The writer of an option has no control over the time when it may be required to fulfill its obligation as writer of the option. Once an option writer has received an exercise notice, it cannot effect a closing purchase transaction in order to terminate its obligation under the option and must deliver the underlying security at the exercise price.
The Target Allocation Funds and Target Date Funds are fund of funds, meaning that they invest primarily in the shares of other registered investment companies (the "underlying funds’’), including ETFs. Thus, each fund’s investment performance and its ability to achieve its investment goal are directly related to the performance of the underlying funds in which it invests; and the underlying fund’s performance, in turn, depends on the particular securities in which that underlying fund invests and the expenses of that fund. Accordingly, these Funds are subject to the risks of the underlying funds in direct proportion to the allocation of their respective assets among the underlying funds.
Ultra Series Fund | December 31, 2010
Notes to Financial Statements
Additionally, the Target Allocation Funds and Target Date Funds are subject to asset allocation risk and manager risk. Manager risk (i.e., fund selection risk) is the risk that the fund(s) selected to fulfill a particular asset class under performs their peer. Asset allocation risk is the risk that the allocation of the Fund’s assets among the various asset classes and market segments will cause the Fund to under perform other funds with a similar investment objective.
11. CAPITAL SHARES AND AFFILIATED OWNERSHIP
All capital shares outstanding at December 31, 2010, are owned by separate investment accounts and/or pension plans of CUNA Mutual Insurance Society, except for the Equity Income Fund, which also had investments by the Adviser of $478,056 in Class I, and $53,035 in Class II, respectively.
The Target Allocation Funds and Target Date Funds invest in underlying funds, of which certain underlying funds (the "affiliated underlying funds’’), may be deemed to be under common control because of the same or affiliated investment adviser and membership in a common family of investment companies. A summary of the transactions with each affiliated underlying fund during the period ended December 31, 2010 follows:
| Balance of Shares Held at 12/31/09 | | | Balance of Shares Held at 12/31/10 | | | |
| Conservative Allocation Fund | | | | | | | |
| Madison Mosaic Institutional Bond Fund | 555,505 | 1,144,074 | - | 1,699,579 | $ 18,593,391 | $ – | $ 343,915 |
| Madison Mosaic Disciplined Equity Fund | - | 1,133,295 | - | 1,133,295 | 14,370,182 | - | 109,331 |
| MEMBERS Bond Fund Class Y | 4,403,462 | 297,205 | 671,028 | 4,029,639 | 41,182,910 | 288,438 | 1,213,576 |
| MEMBERS High Income Fund Class Y | 3,489,567 | 174,355 | 142,653 | 3,521,269 | 24,578,459 | (18,163) | 1,898,874 |
| MEMBERS International Stock Fund Class Y | 1,079,844 | 71,361 | 85,529 | 1,065,676 | 11,274,851 | (252,221) | 188,228 |
| MEMBERS Equity Income Fund | 17,286 | 568,607 | - | 585,893 | 5,958,534 | - | 476,215 |
| MEMBERS Large Cap Growth Fund Class Y | 1,112,762 | 48,397 | 159,087 | 1,002,072 | 16,023,137 | (52,792) | 51,786 |
| MEMBERS Large Cap Value Fund Class Y | 1,311,819 | 138,070 | 175,671 | 1,274,218 | 15,239,653 | (690,745) | 223,160 |
| Totals | | | | | | | |
| | | | | | | | |
| Moderate Allocation Fund | | | | | | | |
| Madison Mosaic Institutional Bond Fund | 555,505 | 1,078,564 | 142,312 | 1,491,757 | $ 16,319,818 | $ 29,838 | $ 316,901 |
| MEMBERS Bond Fund Class Y | 4,910,674 | 43,159 | 1,306,679 | 3,647,154 | 37,273,918 | 610,318 | 1,211,949 |
| MEMBERS High Income Fund Class Y | 4,623,070 | 117,055 | 420,757 | 4,319,368 | 30,149,187 | (113,025) | 2,456,816 |
| MEMBERS International Stock Fund Class Y | 3,012,210 | 58,917 | 570,884 | 2,500,243 | 26,452,571 | (1,332,607) | 441,612 |
| Madison Mosaic Disciplined Equity Fund | 1,479,289 | 1,234,697 | - | 2,713,986 | 34,413,338 | - | 261,824 |
| MEMBERS Equity Income Fund | 1,301,910 | 55,337 | 200,191 | 1,157,056 | 11,767,256 | 80,077 | 1,020,533 |
| MEMBERS Large Cap Growth Fund Class Y | 2,417,729 | 145,516 | 208,710 | 2,354,535 | 37,649,016 | (16,643) | 121,678 |
| MEMBERS Large Cap Value Fund Class Y | 2,900,292 | 376,917 | 421,712 | 2,855,497 | 34,151,748 | (1,870,265) | 500,097 |
MEMBERS Mid Cap Fund Class Y1 | 1,925,389 | - | - | 1,925,389 | 12,438,010 | - | - |
| MEMBERS Small Cap Fund Class Y | 1,403,625 | - | 101,930 | 1,301,695 | 14,344,676 | 4,336 | 81,337 |
| Totals | | | | | | | |
1 Non-income producing. |
2 Distributions received include distributions from net investment income and from capital gains from the underlying funds. |
Ultra Series Fund | December 31, 2010
Notes to Financial Statements
| Balance of Shares Held at 12/31/09 | | | Balance of Shares Held at 12/31/10 | | | |
| Aggressive Allocation Fund | | | | | | | |
| MEMBERS Bond Fund Class Y | 352,733 | 77,813 | 371,385 | 59,161 | $ 604,620 | $ 212,086 | $ 72,305 |
| MEMBERS High Income Fund Class Y | 991,649 | 106,186 | 154,278 | 943,557 | 6,586,028 | 134,722 | 540,775 |
| MEMBERS International Stock Fund Class Y | 1,491,728 | - | 313,245 | 1,178,483 | 12,468,350 | (859,565) | 208,153 |
| Madison Mosaic Disciplined Equity Fund | 976,979 | 461,553 | 88,212 | 1,350,320 | 17,122,058 | 27,045 | 130,268 |
| MEMBERS Equity Income Fund | 427,396 | - | 47,664 | 379,732 | 3,861,874 | 19,066 | 327,713 |
| MEMBERS Large Cap Growth Fund Class Y | 970,472 | 45,399 | 106,127 | 909,744 | 14,546,805 | 21,341 | 47,014 |
| MEMBERS Large Cap Value Fund Class Y | 1,182,856 | 99,148 | 138,267 | 1,143,737 | 13,679,090 | (546,843) | 200,308 |
MEMBERS Mid Cap Fund Class Y1 | 1,344,249 | 82,781 | 128,518 | 1,298,512 | 8,388,388 | (118,112) | - |
| MEMBERS Small Cap Fund Class Y | 770,791 | 20,526 | 185,307 | 606,010 | 6,678,232 | 286,782 | 38,982 |
| Totals | | | | | | | |
| | | | | | | | |
| Target Retirement 2020 Fund | | | | | | | |
| MEMBERS Bond Fund Class Y | 111,413 | 57,452 | 68,390 | 100,475 | $ 1,026,853 | $ 11,237 | $ 33,324 |
| MEMBERS High Income Fund Class Y | 253,162 | 58,347 | - | 311,509 | 2,174,331 | - | 151,028 |
| MEMBERS International Fund Class Y | 165,741 | - | 44,308 | 121,433 | 1,284,766 | 16,065 | 21,449 |
| Madison Mosaic Disciplined Equity Fund | - | 192,131 | - | 192,131 | 2,436,223 | - | 18,535 |
| MEMBERS Equity Income Fund | 68,516 | - | - | 68,516 | 696,809 | - | 55,690 |
| MEMBERS Large Cap Growth Fund Class Y | 162,128 | 10,087 | 48,866 | 123,349 | 1,972,348 | (32,202) | 6,374 |
| MEMBERS Large Cap Value Fund Class Y | 135,648 | 63,595 | 39,332 | 159,911 | 1,912,540 | (74,710) | 28,006 |
| MEMBERS Small Cap Value Fund Class Y | 72,263 | 31,062 | 4,935 | 98,390 | 1,084,255 | 1,128 | 6,148 |
| Totals | | | | | | | |
| Target Retirement 2030 Fund | | | | | | | |
| MEMBERS Bond Fund Class Y | 73,815 | 59,217 | 40,681 | 92,351 | $ 943,829 | $ 4,690 | $ 28,300 |
| MEMBERS High Income Fund Class Y | 227,283 | 96,878 | - | 324,161 | 2,262,643 | - | 148,553 |
| MEMBERS International Fund Class Y | 199,885 | 26,166 | 66,587 | 159,464 | 1,687,131 | 32,725 | 28,166 |
| Madison Mosaic Disciplined Equity Fund | - | 243,730 | - | 243,730 | $3,090,492 | - | 23,513 |
| MEMBERS Equity Income Fund | 69,522 | - | - | 69,522 | 707,042 | - | 56,508 |
| MEMBERS Large Cap Growth Fund Class Y | 163,431 | 12,214 | 24,910 | 150,735 | 2,410,247 | (39,067) | 7,790 |
| MEMBERS Large Cap Value Fund Class Y | 134,886 | 94,813 | 41,968 | 187,731 | 2,245,263 | (133,509) | 32,878 |
| MEMBERS Small Cap Value Fund Class Y | 83,057 | 49,837 | 5,254 | 127,640 | 1,406,590 | 1,638 | 7,976 |
| Totals | | | | | | | |
| | | | | | | | |
| Target Retirement 2040 Fund | | | | | | | |
| MEMBERS Bond Fund Class Y | 62,114 | 9,616 | 44,956 | 26,774 | $ 273,632 | $ 13,923 | $ 13,265 |
| MEMBERS High Income Fund Class Y | 175,203 | 68,071 | - | 243,274 | 1,698,050 | - | 110,288 |
| MEMBERS International Fund Class Y | 179,408 | 19,030 | 45,202 | 153,236 | 1,621,232 | 4,146 | 27,066 |
| Madison Mosaic Disciplined Equity Fund | - | 224,178 | | 224,178 | 2,842,576 | - | 21,627 |
| MEMBERS Equity Income Fund | 58,946 | 7,580 | - | 66,526 | 676,574 | - | 54,073 |
| MEMBERS Large Cap Growth Fund Class Y | 139,669 | 7,872 | 31,597 | 115,944 | 1,853,944 | (54,015) | 5,992 |
| MEMBERS Large Cap Value Fund Class Y | 120,810 | 53,600 | 28,105 | 146,305 | 1,749,804 | (90,982) | 25,623 |
| MEMBERS Small Cap Value Fund Class Y | 80,271 | 44,374 | 4,305 | 120,340 | 1,326,145 | 1,064 | 7,519 |
| Totals | | | | | | | |
1 Non-income producing. |
2 Distributions received includes distributions from net investment income and from capital gains from the underlying funds. |
Ultra Series Fund | December 31, 2010
Notes to Financial Statements
12. DISCUSSION OF BUSINESS COMBINATIONS
Mid Cap Fund
Effective May 1, 2010, the assets of the Mid Cap Growth Fund were reorganized into the Mid Cap Value Fund and, together, renamed the Mid Cap Fund. The legal survivor of the business combination was the Mid Cap Value Fund; the accounting survivor was the Mid Cap Growth Fund. The combined net assets of the Mid Cap Fund after the reorganization were $437,463,154. Under the plan of reorganization, the following shares were exchanged:
| | | | Per share Conversion Ratio |
| Mid Cap Growth Class I | 49,872,030.322 | Mid Cap Value Class I | 18,732,679.964 | 0.3756 |
| Mid Cap Growth Class II | 560,785.285 | Mid Cap Value Class II | 210,203.526 | 0.3748 |
Small Cap Fund
Effective May 1, 2010, the assets of the Small Cap Growth Fund were reorganized into the Small Cap Value Fund and, together, renamed the Small Cap Fund. The combined net assets of the Small Cap Fund after the reorganization were $15,374,776. Under the plan of reorganization, the following shares were exchanged.
| | | | Per Share Conversion Ratio |
| Small Cap Growth Class I | 696,430.677 | Small Cap Value Class I | 508,434.004 | 0.7301 |
| Small Cap Growth Class II | 984.266 | Small Cap Value Class II | 717.312 | 0.7288 |
International Stock Fund
Effective May 1, 2010, the assets of the Global Securities Fund were reorganized into the International Stock Fund. The combined net assets of the International Fund after the merger were $112,730,616. Under the plan of reorganization, the following shares were exchanged:
| | | | Per Share Conversion Ratio |
| Global Securities Class I | 4,649,016.917 | International Stock Class I | 3,385,631.044 | 0.7282 |
| Global Securities Class II | 149,488.534 | International Stock Class II | 108,859.748 | 0.7282 |
13. SUBSEQUENT EVENTS
The initial investment in the seventeenth fund in the Trust, the Target Retirement 2050 Fund, was made by the Investment Adviser on January 3, 2011. As of January 3, 2011, net assets were $100,000 (comprised solely of cash), shares outstanding were 10,000, and the net asset value per share was $10.00. Shares were offered to the public commencing on January 3, 2011.
The Trust is aware of litigation relating to attempts by certain fixed income security-holders of Lyondell Chemical Company (LYO) to retrieve proceeds from the sale by equity security-holders of LYO shares occurring pursuant to its acquisition by merger in December 2007. The Midcap Fund received proceeds of approximately $1,574,400 from the sale of its LYO equity securities in December 2007. The Trust has not been named as a defendant in this litigation as of the date of this report.
Management has evaluated the effects of all subsequent events that provide additional evidence about conditions that existed at the date of the Statement of Assets and Liabilities. There were no additional events or transactions that impacted the amounts or disclosures in the Funds’ financial statements.
Ultra Series Fund | December 31, 2010
Report of Independent Registered Public Accounting Firm
To the Shareholders and Board of Trustees of Ultra Series Fund:
We have audited the accompanying statements of assets and liabilities, including the portfolios of investments, of Ultra Series Fund, comprising the Conservative Allocation Fund, Moderate Allocation Fund, Aggressive Allocation Fund, Money Market Fund, Bond Fund, High Income Fund, Diversified Income Fund, Equity Income Fund, Large Cap Value Fund, Large Cap Growth Fund, Mid Cap Fund, Small Cap Fund, International Stock Fund, Target Retirement 2020 Fund, Target Retirement 2030 Fund, and Target Retirement 2040 Fund Portfolios (collectively, the "Funds") as of December 31, 2010, and the related statements of operations for the year then ended, and the statements of changes in net assets and the financial highlights for each of the periods presented. These financial st atements and financial highlights are the responsibility of the Funds’ management. Our responsibility is to express an opinion on these financial statements and financial highlights based on our audits.
We conducted our audits in accordance with the standards of the Public Company Accounting Oversight Board (United States). Those standards require that we plan and perform the audit to obtain reasonable assurance about whether the financial statements and financial highlights are free of material misstatement. The Funds are not required to have, nor were we engaged to perform, an audit of their internal control over financial reporting. Our audits included consideration of internal control over financial reporting as a basis for designing audit procedures that are appropriate in the circumstances, but not for the purpose of expressing an opinion on the effectiveness of the Funds’ internal control over financial reporting. Accordingly, we express no such opi nion. An audit also includes examining, on a test basis, evidence supporting the amounts and disclosures in the financial statements, assessing the accounting principles used and significant estimates made by management, as well as evaluating the overall financial statement presentation. Our procedures included confirmation of securities owned as of December 31, 2010, by correspondence with the custodian and brokers; where replies were not received from brokers, we performed other auditing procedures. We believe that our audits provide a reasonable basis for our opinion.
In our opinion, the financial statements and financial highlights referred to above present fairly, in all material respects, the financial position of each of the Funds as of December 31, 2010, the results of their operations for the year then ended, and the changes in their net assets and the financial highlights for each of the periods presented, in conformity with accounting principles generally accepted in the United States of America.
/s/ DELOITTE & TOUCHE LLP
Milwaukee, WI
February 21, 2011
Ultra Series Fund | December 31, 2010
Other Information
BOARD APPROVAL OF ADVISORY AND SUBADVISORY CONTRACTS
The Board reviewed a variety of matters in connection with the Trust���s investment advisory contract with the Adviser and the three subadvisers.
With regard to the nature, extent and quality of the services to be provided by the Adviser and each subadviser, the Board reviewed the biographies and tenure of the personnel involved in Trust management and the experience of the Adviser (and applicable subadviser) and its affiliates as investment manager to other investment companies with similar investment strategies or to individual clients or institutions with similar investment strategies. They recognized the wide array of investment professionals employed by the firm. Representatives of the Adviser and each subadviser discussed the firm’s ongoing investm ent philosophies and strategies intended to provide superior performance consistent with each Trust portfolio’s investment objectives under various market scenarios. The Trustees also noted their familiarity with the Adviser and its affiliates due to the Advisers’ history of providing advisory services to the Madison Mosaic organization as well as the MEMBERS Mutual Funds, Ultra Series Fund and the Madison Strategic Sector Premium Fund. Likewise, they noted their familiarity with each subadviser that had been managing their respective funds for a number of years.
The Board also discussed the quality of services provided to the Trust by its transfer agent, fund administrator and custodian as well as the various administrative services provided directly by the Adviser. Such services included arranging for third party service providers to provide all necessary administration as well as supervising the subadvisers to any Trust portfolios.
With regard to the investment performance of the Trust and the investment adviser, the Board reviewed current performance information provided in the written Board materials. They discussed the reasons for both outperformance and underperformance compared with peer groups and applicable indices and benchmarks. The Board performed this review in connection with the Adviser and each subadviser that manages a subadvised fund portfolio.
A comprehensive discussion of fund performance and market conditions followed. Representatives of the Adviser and each subadviser discussed with the Board the methodology for arriving at peer groups and indices used for performance comparisons.
With regard to the costs of the services to be provided and the profits to be realized by the investment adviser and its affiliates from the relationship with the Trust, the Board reviewed the expense ratios for a variety of other funds in each Trust portfolio’s peer group with similar investment objectives. Again, the board reviewed these matters in connection with the Adviser and each subadviser that manages a subadvised fund portfolio.
The Board noted that the Adviser or its affiliates, and, as applicable, each subadviser, provided investment management services to other investment company and/or non-investment company clients and considered the fees charged by the Adviser (and respective subadviser) to such funds and clients for purposes of determining whether the given advisory fee was disproportionately large under the so-called "Gartenberg" standard traditionally used by investment company boards in connection with contract renewal considerations. The Board took those fees into account and considered the differences in services and time required by the various types of funds and clients to which the Adviser (or subadviser, if applicable) provided services. The Board recognized that significant differences may exist between the services provided to one type of fund or client and those provided to others, such as those resulting from a greater frequency of shareholder redemptions in a mutual fund and the higher turnover of mutual fund assets. The Board gave such comparisons the weight that they merit in light of the similarities and differences between the services that the various funds require and were wary of "inapt comparisons." They considered that, if the services rendered by the Adviser (or subadviser, if applicable) to one type of fund or client differ significantly from others, then the comparison should not be used. In the case of non-investment company clients
Ultra Series Fund | December 31, 2010
Other Information
for which the Adviser (or subadviser, if applicable) may act as either investment adviser or subadviser, the Board noted that the fee is lower than the fee charged to the Trust. The Board noted too the various administrative, operational, compliance, legal and corporate communication services required to be handled by the Adviser (or subadviser, if applicable) which are performed for investment company clients but are not performed for other institutional clients.
The Trustees reviewed each fund’s fee structure based on total fund expense ratio as well as by comparing advisory fees to other advisory fees. The Board noted the simple expense structure maintained by the Trust (i.e. a unitary fee with a capped limited services expense for certain items not covered by the unitary fee). The Board paid particular attention to the total expense ratios paid by other funds with similar investment objectives, recognizing that such a comparison, while not completely dispositive, was nevertheless an important consideration.
The Trustees sought to ensure that fees paid by the Trust were appropriate. The Board reviewed materials demonstrating that although the Adviser is compensated for a variety of the administrative services it provides or arranges to provide to the Trust pursuant to its unitary fee Advisory Agreement and Limited Services Agreement with the Trust, such compensation does not always cover all costs due to the cap on administrative expenses. Administrative, operational, regulatory and compliance fees and costs in excess of the unitary fee are paid by the Adviser from investment advisory fees earned. In this regard, the Trustees noted that examination of each Trust portfolio’s total expense ratio compared to those of other investment companies was more meaningful than a simple comparison of basic "investment management only" fee schedules.
The Board noted that to the extent a Trust portfolio invests in other mutual funds also managed by the Adviser (or its affiliates), the Adviser (or an affiliate) receives investment advisory fees from both the Trust portfolio and the underlying mutual fund. The Board was satisfied in this regard that the Adviser (or an affiliate) provides separate services to each respective Trust "fund of funds" portfolio and the underlying mutual funds in which each such fund invests in exchange for the fees received from them.
With regard to the extent to which economies of scale would be realized as each Trust portfolio grows, the Trustees recognized that at their current sizes, it was premature to discuss any economies of scale not already factored into existing advisory and services agreements. The Trustees also recognized that the Adviser was currently waiving fees with regard to the Target Retirement Date funds.
Mr. Leahy confirmed that the Trust’s non-interested Trustees met previously and reviewed the written contract renewal materials provided by the Adviser. He noted that the Independent Trustees had considered such materials in light of the aforementioned Gartenberg standards as well as criteria either set forth or discussed in the recent Supreme Court decision in Jones v. Harris regarding the investment company contract renewal process under Section 15(c) of the Investment Company Act of 1940, as amended. The Independent Trustees made a variety of additional inquiries regarding such written materials to the Adviser and the subadvisers and representatives of the Adviser and subadvisers, respectively, discussed each matter raised.
After further discussion and analysis and reviewing the totality of the information presented, including the information set forth above and the other information considered by the Board of Trustees, the Trustees concluded that the Trust’s advisory fees (including applicable subadvisory fees) are fair and reasonable for each respective portfolio and that renewal of their respective Advisory, Subadvisory and Services Agreements are in the best interests of each respective Trust portfolio and its shareholders.
In the course of their review of the contract renewal materials, the Board also reviewed and discussed with counsel the so-called "Rule 12b-1" plans adopted by the Trust. The Board reviewed a variety of written materials regarding these matters
Ultra Series Fund | December 31, 2010
Other Information
during the course of the Board’s consideration of the Rule 12b-1 plans. Finally, the Board also reviewed the Trust’s distribution agreements and the information provided in the written materials regarding the distributor.
After further discussion and analysis and reviewing the totality of the information presented, including the information set forth above and the other information considered by the Board of Trustees, the Trustees concluded that the Trust’s advisory fees are fair and reasonable for each respective portfolio and that renewal of its respective Advisory, Subadvisory, Services and Distribution Agreements are in the best interests of each respective fund and its shareholders.
FUND EXPENSES PAID BY SHAREHOLDERS
As a shareholder of the Funds, you pay no transaction costs, but do incur ongoing costs which include management fees; disinterested trustee fees; brokerage commissions and other expenses incurred in connection with the acquisition or disposition of investments; costs of borrowing money; expenses for independent audits, taxes, and extraordinary expenses as approved by a majority of the disinterested trustees. The examples in the table that follows are intended to help you understand your ongoing costs (in dollars) of investing in the Funds and to compare these costs with the ongoing costs of investing in other mutual funds.
The examples below are based on an investment of $1,000 invested at the beginning of the period and held for the entire year ended December 31, 2010. Expenses paid during the period in the table below are equal to the fund’s annualized expense ratio, multiplied by the average account value over the period, multiplied by 184/365 (to reflect the one-half fiscal year period).
Actual Expenses
The table below provides information about actual account values using actual expenses and actual returns for the Funds. You may use the information in this table, together with the amount you invested, to estimate the expenses that you paid over the period. Simply divide your account value by $1,000 (for example, an $8,600 account value divided by $1,000 = 8.6), then multiply the result by the number in the table for the fund you own under the heading entitled "Actual" to estimate the expenses you paid on your account during this period.
| | | | |
| Fund | | | | | | | | |
| Conservative Allocation | $1,000 | $1,081.40 | 0.30% | $1.57 | | $1,080.00 | 0.55% | $2.88 |
| Moderate Allocation | 1,000 | 1,131.30 | 0.31% | 1.67 | | 1,129.90 | 0.56% | 3.01 |
| Aggressive Allocation | 1,000 | 1,174.50 | 0.31% | 1.70 | | 1,173.10 | 0.56% | 3.07 |
| Money Market | 1,000 | 1,000.00 | 0.16% | 0.81 | | 1,000.00 | 0.16% | 0.81 |
| Bond | 1,000 | 1,010.10 | 0.57% | 2.89 | | 1,008.90 | 0.81% | 4.10 |
| High Income | 1,000 | 1,087.00 | 0.76% | 4.00 | | 1,085.60 | 1.01% | 5.31 |
| Diversified Income | 1,000 | 1,107.50 | 0.72% | 3.82 | | 1,106.20 | 0.97% | 5.15 |
Equity Income1 | 1,000 | 1,076.48 | 0.61% | 3.32 | | 1,075.85 | 0.78% | 4.24 |
| Large Cap Value | 1,000 | 1,188.90 | 0.62% | 3.42 | | 1,187.40 | 0.87% | 4.80 |
| Large Cap Growth | 1,000 | 1,227.80 | 0.82% | 4.60 | | 1,226.20 | 1.07% | 6.00 |
| Mid Cap | 1,000 | 1,234.50 | 0.91% | 5.13 | | 1,233.00 | 1.16% | 6.53 |
1Commenced investment operations April 30, 2010. |
Ultra Series Fund | December 31, 2010
Other Information
| | | | |
| Fund | | | | | | | | |
| Small Cap | $1,000 | $1,261.60 | 1.11% | $6.33 | | $1,260.00 | 1.36% | $7.75 |
| International Stock | 1,000 | 1,223.50 | 1.22% | 6.84 | | 1,221.90 | 1.47% | 8.23 |
| Target Retirement 2020 | 1,000 | 1,120.00 | 0.20% | 1.07 | | | | |
| Target Retirement 2030 | 1,000 | 1,139.00 | 0.20% | 1.08 | | | | |
| Target Retirement 2040 | 1,000 | 1,158.00 | 0.20% | 1.09 | | | | |
Hypothetical Example for Comparison Purposes
The table also provides information about hypothetical account values and hypothetical expenses based on the Funds’ actual expense ratios and an assumed rate of return of 5% per year before expenses, which are not the Funds’ actual returns. The hypothetical account values and expenses may not be used to estimate the actual ending account balance or expenses you paid for the period. You may use this information to compare the ongoing costs of investing in the Funds and other funds. To do so, compare the 5% hypothetical example of the funds you own with the 5% hypothetical examples that appear in the shareholder reports of other similar funds.
| | | | |
| Fund | | | | | | | | |
| Conservative Allocation | $1,000 | $1,023.69 | 0.30% | $1.53 | | $1,022.43 | 0.55% | $2.80 |
| Moderate Allocation | 1,000 | 1,023.64 | 0.31% | 1.58 | | 1,022.38 | 0.56% | 2.85 |
| Aggressive Allocation | 1,000 | 1,023.64 | 0.31% | 1.58 | | 1,022.38 | 0.56% | 2.85 |
| Money Market | 1,000 | 1,024.40 | 0.16% | 0.82 | | 1,024.40 | 0.16% | 0.82 |
| Bond | 1,000 | 1,022.33 | 0.57% | 2.91 | | 1,021.12 | 0.81% | 4.13 |
| High Income | 1,000 | 1,021.37 | 0.76% | 3.87 | | 1,020.11 | 1.01% | 5.14 |
| Diversified Income | 1,000 | 1,021.58 | 0.72% | 3.67 | | 1,020.32 | 0.97% | 4.94 |
Equity Income1 | 1,000 | 1,012.71 | 0.61% | 3.13 | | 1,012.71 | 0.78% | 3.99 |
| Large Cap Value | 1,000 | 1,022.08 | 0.62% | 3.16 | | 1,020.82 | 0.87% | 4.43 |
| Large Cap Growth | 1,000 | 1,021.07 | 0.82% | 4.18 | | 1,019.81 | 1.07% | 5.45 |
| Mid Cap | 1,000 | 1,020.62 | 0.91% | 4.63 | | 1,019.36 | 1.16% | 5.90 |
| Small Cap | 1,000 | 1,019.61 | 1.11% | 5.65 | | 1,018.35 | 1.36% | 6.92 |
| International Stock | 1,000 | 1,019.06 | 1.22% | 6.21 | | 1,017.80 | 1.47% | 7.48 |
| Target Retirement 2020 | 1,000 | 1,024.20 | 0.20% | 1.02 | | | | |
| Target Retirement 2030 | 1,000 | 1,024.20 | 0.20% | 1.02 | | | | |
| Target Retirement 2040 | 1,000 | 1,024.20 | 0.20% | 1.02 | | | | |
1 Commenced investment operations April 30, 2010. | |
Please note that the expenses shown in the table are meant to highlight your ongoing costs only and do not reflect any separate account fees, charges, or expenses imposed by the variable annuity or variable life insurance contracts, or retirement and pension plans that use the funds. The information provided in the hypothetical example table is useful in comparing ongoing fund costs only, and will not help you determine the relative total costs of owning different funds. In addition, if these fees, charges or expenses were included, your costs would have been higher.
Ultra Series Fund | December 31, 2010
Other Information
AVAILABILITY OF QUARTERLY PORTFOLIO SCHEDULES
The Trust files its complete schedule of portfolio holdings with the SEC for the first and third quarters of each fiscal year on Form N-Q. Form N-Q is available to shareholders at no cost on the SEC’s website at www.sec.gov. Form N-Q may also be reviewed and copied at the Commission’s Public Reference Room in Washington, DC. More information on the operation of the Public Reference Room may be obtained by calling 1-800-SEC-0330.
FORWARD-LOOKING STATEMENT DISCLOSURE
One of our most important responsibilities as investment company managers is to communicate with shareholders in an open and direct manner. Some of our comments in our letters to shareholders are based on current management expectations and are considered "forward-looking statements." Actual future results, however, may prove to be different from our expectations. You can identify forward-looking statements by words such as "estimate," "may," "will," "expect," "believe," "plan" and other similar terms. We cannot promise future returns. Our opinions are a reflection of our best judgment at the time this report is compiled, and we disclaim any obligation to update or alter forward-looking statements as a result of new information, future events, or otherwise.
SEC File Number: 811-04815
Ultra Series Fund | December 31, 2010
Ultra Series Fund’s Trustees and Officers
The address of each trustee and officer of the funds is 550 Science Drive, Madison, WI 53711, except that Mr. Mason’s address is 8777 N. Gainey Center Drive, #220, Scottsdale, AZ, 85258. The Statement of Additional Information, which includes additional information about the trustees and officers, is available at no cost on the SEC’s website at www.sec.gov or by calling CUNA Mutual Insurance Society at 1-800-798-5500.
Interested Trustees and Officers
Name and Year of Birth | Position(s) and Length of Time Served | Principal Occupation(s) During Past Five Years | Other Directorships/Trusteeships |
Katherine L. Frank1 1960 | Trustee and President, 2009 - Present | Madison Investment Holdings, Inc. ("MIH") (affiliated investment advisory firm of Madison), Executive Director and Chief Operating Officer, 2010 - Present; Managing Director and Vice President, 1986 - 2010; Madison Asset Management, LLC ("Madison"), Executive Director and Chief Operating Officer, 2010 - Present; Vice President, 2004 - 2010; Madison Investment Advisors, LLC ("MIA") (affiliated investment advisory firm of Madison), Executive Director and Chief Operating Officer, 2010 - Present; President, 1996 - 2010; Madison Mosaic Funds (13) (mutual funds), President, 1996 - Present; Madison Strategic Sector Premium Fund (closed end fund), 2005 - Present; Madison/Claymore Covered Call and Equity Strategy Fund (closed end fund), Vice President, 2005 - Present; MEMBERS Mutual Funds (13), President, 2009 - Present | Madison Mosaic Funds (all but Equity Trust), 1996 - Present; Madison; Strategic Sector Premium Fund, 2005 - Present; MEMBERS Mutual Funds (13), 2009 - Present |
Frank E. Burgess 1942 | Vice President, 2009 - Present | MIH, Founder, Executive Director and President, 2010 - Present; Managing Director and President, 1973 - 2010; Madison, Executive Director and President, 2010 - Present; President, 2004 - 2010; MIA, Executive Director and President, 2010 -- Present; Madison Mosaic Funds (13), Vice President, 1996 - Present; Madison Strategic Sector Premium Fund, Vice President, 2005 - Present; MEMBERS Mutual Funds (13), Vice President, 2009 - Present | N/A |
1 "Interested person" as defined in the Investment Company Act of 1940. Considered an interested Trustee because of the position held with the investment adviser of the Trust.
Ultra Series Fund | December 31, 2010
Ultra Series Fund’s Trustees and Officers
Name and Year of Birth | Position(s) and Length of Time Served | Principal Occupation(s) During Past Five Years | Other Directorships/Trusteeships |
Jay R. Sekelsky 1959 | Vice President, 2009 - Present | MIH, Executive Director and Chief Investment Officer, 2010 - Present; Managing Director and Vice President, 1990 - 2010; Madison, Executive Director and Chief Investment Officer, 2010 - Present ; MIA, Executive Director and Chief Investment Officer, 2010 - Present; Vice President, 1996 - 2010; Madison Mosaic Funds (13), Vice President, 1996 - Present; Madison Strategic Sector Premium Fund, Vice President, 2005 - Present; Madison/Claymore Covered Call and Equity Strategy Fund, Vice President, 2005 - Present; MEMBERS Mutual Funds (13), Vice President, 2009 - Present | N/A |
Paul Lefurgey 1964 | Vice President, 2009 - Present | MIH, Managing Director and Head of Fixed Income Investments, 2005 - Present; Madison and MIA, Managing Director and Head of Fixed Income Investments, 2010 - Present; MEMBERS Capital Advisors, Inc. ("MCA") (investment advisory firm), Madison, WI, Vice President, 2003 - 2005; Madison Mosaic Funds (13), Vice President, 2009 - Present; Madison Strategic Sector Premium Fund, Vice President, 2010 - Present; MEMBERS Mutual Funds (13), Vice President, 2009 - Present | N/A |
Greg D. Hoppe 1969 | Treasurer, 2009 - Present | MIH and MIA, Vice President, 1999 - Present; Madison, Vice President, 2009 - Present; Madison Mosaic Funds (13), Treasurer, 2009 - Present; Chief Financial Officer, 1999 - 2009; Madison Strategic Sector Premium Fund, Treasurer, 2009 - Present; Chief Financial Officer, 2005 - 2009; Madison/Claymore Covered Call and Equity Strategy Fund, Vice President, 2008 - Present; MEMBERS Mutual Funds (13), Treasurer, 2009 - Present | N/A |
Ultra Series Fund | December 31, 2010
Ultra Series Fund’s Trustees and Officers
Name and Year of Birth | Position(s) and Length of Time Served | Principal Occupation(s) During Past Five Years | Other Directorships/Trusteeships |
Holly S. Baggot 1960 | Secretary, 1999 - Present; Assistant Treasurer, 1999 - 2007; 2009 - Present; Treasurer, 2008 - 2009 | MIH and MIA, Vice President, 2010 - Present; Madison, Vice President, 2009 - Present; MCA, Director-Mutual Funds, 2008-2009; Director-Mutual Fund Operations, 2006-2008; Operations Officer-Mutual Funds, 2005-2006; Senior Manager-Product & Fund Operations, 2001-2005; Madison Mosaic Funds (13), Secretary and Assistant Treasurer, 2009 - Present; Madison Strategic Sector Premium Fund, Secretary and Assistant Treasurer, 2010 - Present; MEMBERS Mutual Funds (13), Secretary, 1999-Present and Treasurer, 2008-2009 and Assistant Treasurer, 1997-2007 and 2009-Present | N/A |
W. Richard Mason 1960 | Chief Compliance Officer, Corporate Counsel and Assistant Secretary, 2009 - Present | MIH, MIA, Madison and Madison Scottsdale, LC (an affiliated investment advisory firm of Madison), Chief Compliance Officer and Corporate Counsel, 2009 - Present; General Counsel and Chief Compliance Officer, 1996 - 2009; Mosaic Funds Distributor, LLC (an affiliated brokerage firm of Madison), Principal, 1998 - Present; Concord Asset Management ("Concord") (an affiliated investment advisory firm of Madison), LLC, General Counsel, 1996 - 2009; NorthRoad Capital Management LLC ("NorthRoad") (an affiliated investment advisory firm of Madison), Chief Compliance Officer and Corporate Counsel, 2011 - Present; Madison Mosaic Funds (13), Chief Compliance Officer, Corporate Counsel and Assistant Secretary, 2009 - Present; Secretary, General Counsel and Chief Compliance Officer, 1992 - 2009; Madison Strategic Sector Premium Fund, Chief Co mpliance Officer, Corporate Counsel and Assistant Secretary, 2009 - Present; Secretary, General Counsel and Chief Compliance Officer, 2005 - 2009; MEMBERS Mutual Funds (13), Chief Compliance Officer, Corporate Counsel and Assistant Secretary, 2009 - Present | N/A |
Ultra Series Fund | December 31, 2010
Ultra Series Fund’s Trustees and Officers
Name and Year of Birth | Position(s) and Length of Time Served | Principal Occupation(s) During Past Five Years | Other Directorships/Trusteeships |
Pamela M. Krill 1966 | General Counsel, Chief Legal Officer and Assistant Secretary, 2009 - Present | MIH, MIA, Madison, Madison Scottsdale, LC, Mosaic Funds Distributor, and Concord, General Counsel and Chief Legal Officer, 2009 - Present; NorthRoad, General Counsel & Chief Legal Officer, 2011 - Present; Madison Mosaic Funds (13), General Counsel, Chief Legal Officer and Assistant Secretary, 2009 - Present; Madison Strategic Sector Premium Fund, General Counsel, Chief Legal Officer and Assistant Secretary, 2010 - Present; MEMBERS Mutual Funds (13), General Counsel, Chief Legal Officer and Assistant Secretary, 2009 - Present; CUNA Mutual Insurance Society (insurance company with affiliated investment advisory, brokerage and mutual fund operations), Madison, WI, Managing Associate General Counsel-Securities & Investments, 2007 - 2009 ; Godfrey & Kahn, S.C. (law firm), Madison and Milwaukee, WI, Shareholder, Securitie s Practice Group, 1994-2007 | N/A |
Independent Trustees
Name and Year of Birth | Position(s) and Length of Time Served1 | Principal Occupation(s) During Past Five Years | Portfolios Overseen in Fund Complex2 | Other Directorships/Trusteeships |
Philip E. Blake 1944 | Trustee, 2009 - Present | Retired Investor; Lee Enterprises, Inc (news and advertising publisher), Madison, WI, Vice President, 1998 - 2001; Madison Newspapers, Inc., Madison, WI, President and Chief Executive Officer, 1993 - 2000 | 44 | Madison Newspapers, Inc., 1993 - Present; Meriter Hospital & Health Services, 2000 - Present; Edgewood College, 2003 - Present; Chairman of the Board, 2010 - Present; Nerites Corporation (technology company), 2004 - Present; Madison Mosaic Funds (13), 2001- Present; Madison Strategic Sector Premium Fund, 2005 - Present; MEMBERS Mutual Funds (13), 2009 - Present |
1 Independent Trustees serve in such capacity until the Trustee reaches the age of 76, unless retirement is waived by unanimous vote of the remaining Trustees on an annual basis.
2 As of the date of this report, the fund complex consists of the Trust with 17 portfolios, the MEMBERS Mutual Funds with 13 portfolios, the Madison Strategic Sector Premium Fund (a closed-end fund) and the Madison Mosaic Equity, Income, Tax-Free and Government Money Market Trusts, which together have 13 portfolios, for a grand total of 44 separate portfolios in the fund complex. Not every Trustee is a member of the Board of Trustees of every fund in the fund complex, as noted above.
Ultra Series Fund | December 31, 2010
Ultra Series Fund’s Trustees and Officers
Name and Year of Birth | Position(s) and Length of Time Served1 | Principal Occupation(s) During Past Five Years | Portfolios Overseen in Fund Complex2 | Other Directorships/Trusteeships |
James R Imhoff, Jr. 1944 | Trustee, 2009 - Present | First Weber Group (real estate brokers), Madison, WI, Chief Executive Officer, 1996 - Present | 44 | Park Bank, 1978 - Present; Madison Mosaic Funds (13), 1996 - Present; Madison Strategic Sector Premium Fund, 2005 - Present; Madison/Claymore Covered Call and Equity Strategy Fund, 2005 - Present; MEMBERS Mutual Funds (13), 2009 - Present |
Steven P. Riege 1954 | Trustee, 2005 - Present | Ovation Leadership (management consulting), Milwaukee, WI, Owner/President, 2001 - Present; Robert W. Baird & Company (financial services), Milwaukee, WI, Senior Vice President-Marketing and Vice President-Human Resources, 1986 - 2001 | 30 | MEMBERS Mutual Funds (13), 2005 - Present |
Richard E. Struthers 1952 | Trustee, 2004 - Present | Clearwater Capital Management (investment advisory firm), Minneapolis, MN, Chair and Chief Executive Officer, 1998 - Present; Park Nicollet Health Services, Minneapolis, MN, Chairman, Finance and Investment Committee, 2006 - Present; IAI Mutual Funds, Minneapolis, MN, President and Director, 1992-1997 | 30 | Park Nicolet Health Services, 2001 - Present; MEMBERS Mutual Funds (13), 2004 - Present |
1 Independent Trustees serve in such capacity until the Trustee reaches the age of 76, unless retirement is waived by unanimous vote of the remaining Trustees on an annual basis.
2 As of the date of this report, the fund complex consists of the Trust with 17 portfolios, the MEMBERS Mutual Funds with 13 portfolios, the Madison Strategic Sector Premium Fund (a closed-end fund) and the Madison Mosaic Equity, Income, Tax-Free and Government Money Market Trusts, which together have 13 portfolios, for a grand total of 44 separate portfolios in the fund complex. Not every Trustee is a member of the Board of Trustees of every fund in the fund complex, as noted above.
Ultra Series Fund | December 31, 2010
Ultra Series Fund’s Trustees and Officers
Name and Year of Birth | Position(s) and Length of Time Served1 | Principal Occupation(s) During Past Five Years | Portfolios Overseen in Fund Complex2 | Other Directorships/Trusteeships |
Lorence D. Wheeler 1938 | Trustee, 2009 - Present | Retired investor; Credit Union Benefits Services, Inc. (a provider of retirement plans and related services for credit union employees nationwide), Madison, WI, President, 1986 - 1997 | 44 | Grand Mountain Bank FSB and Grand Mountain Bancshares, Inc. 2003 - Present; Madison Mosaic Funds (13), 1996 - Present; Madison Strategic Sector Premium Fund, 2005 - Present; Madison/Claymore Covered Call and Equity Strategy Fund, 2005 - Present; MEMBERS Mutual Funds (13), 2009 - Present |
1 Independent Trustees serve in such capacity until the Trustee reaches the age of 76, unless retirement is waived by unanimous vote of the remaining Trustees on an annual basis.
2 As of the date of this report, the fund complex consists of the Trust with 17 portfolios, the MEMBERS Mutual Funds with 13 portfolios, the Madison Strategic Sector Premium Fund (a closed-end fund) and the Madison Mosaic Equity, Income, Tax-Free and Government Money Market Trusts, which together have 13 portfolios, for a grand total of 44 separate portfolios in the fund complex. Not every Trustee is a member of the Board of Trustees of every fund in the fund complex, as noted above.