Ultra Series Fund | Management’s Discussion of Fund Performance | December 31, 2011
MONEY MARKET FUND
INVESTMENT STRATEGY HIGHLIGHTS
The Ultra Series Money Market Fund invests exclusively in U.S. dollar-denominated money market securities maturing in thirteen months or less from the date of purchase. These securities will be obligations of the U.S. Government and its agencies and instrumentalities, but may also include securities issued by U.S. and foreign financial institutions, corporations, municipalities, foreign governments, and multi-national organizations, such as the World Bank. The fund may invest in mortgage-backed and asset-backed securities, including those representing pools of mortgage, commercial, or consumer loans originated by credit unions or other financial institutions.
PORTFOLIO ALLOCATION AS A PERCENTAGE OF NET ASSETS AS OF 12/31/11 |
| Fannie Mae | 20% |
| Federal Home Loan Bank | 29% |
| Freddie Mac | 22% |
| U.S. Treasury Bills | 9% |
| Commercial Paper | 15% |
| Cash and Other Net Assets | 5% |
Ultra Series Fund | Management’s Discussion of Fund Performance | December 31, 2011
This page was intentionally left blank.
Ultra Series Fund | Management’s Discussion of Fund Performance | December 31, 2011
INVESTMENT STRATEGY HIGHLIGHTS
Under normal circumstances, the Ultra Series Bond Fund invests at least 80% of its assets in bonds. To keep current income relatively stable and to limit share price volatility, the fund emphasizes investment grade securities and maintains an intermediate (typically 3-6 year) average portfolio duration (a measure of a security’s price sensitivity to changes in interest rates). The fund also strives to minimize risk in the portfolio by making strategic decisions relating to credit risk and yield curve outlook. The fund may invest in corporate debt securities, U.S. Government debt securities, foreign government debt securities, non-rated debt securities, and asset-backed, mortgage-backed and commercial mortgage-backed securities.
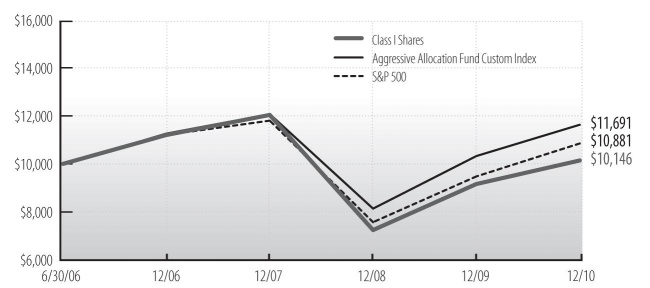
Cumulative Performance of $10,000 Investment Since Inception1
Average Annual Total Return through December 31, 20111 |
| | | | | | |
| Class I Shares | 6.73% | 6.39% | 5.40% | 4.84% | — |
| Class II Shares | 6.47 | — | — | — | 6.64% |
| Bank of America Merrill Lynch U.S. Corporate, Government & Mortgage Index | 7.88 | 6.51 | 6.59 | 5.85 | 7.24 |
See accompanying Notes to Management’s Discussion of Fund Performance.
Ultra Series Fund | Management’s Discussion of Fund Performance | December 31, 2011
Bond Fund (concluded)
The assumption to start the year was that the economy was finally on the mend and growth would be good based upon the decent growth in 2010. Instead, we witnessed decelerating growth which prompted concerns about a double dip recession, the Arab Spring drove up oil prices, a Japanese disaster disrupted production supply lines, further gridlock in Washington resulted in the loss of the U.S. AAA rating from S&P, and a seemingly endless sequence of problems and policy errors in Europe.
For the year, the yield curve flattened with 2-Year Treasury rates declining 35 basis points (bps) while those of the 10- and 30-Year Treasuries fell more than 140 bps. Concerns over the economy in general and potential contagion effects from Europe, especially for banks, caused corporate bonds to severely underperform. While corporates earned a very respectable 7.5% in absolute terms, they underperformed Treasuries by -4.1%. Bank debt turned in the poorest performance with an absolute return of 1.7% (-6.7% below Treasuries). Even the mortgage market underperformed Treasuries; only asset-backed and commercial mortgage-backed securities delivered returns above Treasuries.
PORTFOLIO ALLOCATION AS A PERCENTAGE OF NET ASSETS AS OF 12/31/11 |
| Asset Backed | 2% |
| Corporate Notes and Bonds | 28% |
| Mortgage Backed | 20% |
| U.S. Government and Agency Obligations | 46% |
| Cash and Other Net Assets | 4% |
For the twelve-month period ended December 31, 2011, the Ultra Series Bond Fund returned 6.73% (Class I shares), while the Bank of America Merrill Lynch US Corp. Govt. & Mtg. Index returned 7.88%. The fund’s performance was negatively affected by being overweight in corporates in general and by having a duration (a measure of a security’s price sensitivity to changes in interest rates) less than the market during the rally. This was partially offset by a significant underweighting in banks and, more specifically, avoiding problematic banks such as Citigroup Inc., Bank of America Corp., and Morgan Stanley. The fund also modestly benefited being underweight in the mortgage sector and slightly overweight in asset-backed securities.
Activity in the portfolio was minimal during the year as our basic outlook on rates and sector allocations was unchanged. The portfolio experienced eight maturities and one called security. Treasuries were purchased or sold as cash flows dictated and occasional Treasury swaps were initiated to adjust duration.
Ultra Series Fund | Management’s Discussion of Fund Performance | December 31, 2011
INVESTMENT STRATEGY HIGHLIGHTS
The Ultra Series High Income Fund invests primarily in lower-rated, higher-yielding income bearing securities, such as "junk" bonds. Because the performance of these securities has historically been strongly influenced by economic conditions, the fund may emphasize security selection in business sectors that favor the economic outlook. Under normal market conditions, the fund invests at least 80% of its assets in bonds rated lower than investment grade (BBB/Baa) and their unrated equivalents or other high-yielding securities.
Cumulative Performance of $10,000 Investment Since Inception1
Average Annual Total Return through December 31, 20111 |
| | | | | | |
| Class I Shares | 5.01% | 16.36% | 6.56% | 7.40% | — |
| Class II Shares | 4.75 | — | — | — | 12.56% |
| Bank of America Merrill Lynch U.S. High Yield Master II Constrained Index | 4.37 | 23.83 | 7.55 | 8.74 | 19.70 |
See accompanying Notes to Management’s Discussion of Fund Performance.
Ultra Series Fund | Management’s Discussion of Fund Performance | December 31, 2011
High Income Fund (concluded)
The high-yield market closed out 2011 in solid fashion advancing 4.4%. All U.S. financial markets benefited from a relief rally in the fourth quarter as investors became more comfortable that policy makers were taking action to contain the eurozone crisis. U.S. economic data released during the fourth quarter evidenced a slightly better tone highlighted by marginally improved employment and housing data.
The high-yield market appears poised for solid returns in 2012. Demand for the high-yield sector remains solid as mutual fund inflows into the high-yield market were $11.8 billion in the fourth quarter alone. Default rates at 1.82% remain well below historical levels. Despite this low default environment, high-yield securities continue to yield far more than like-maturity Treasuries, therefore, we expect continued demand for the asset class.
SECTOR ALLOCATION AS A PERCENTAGE OF NET ASSETS |
Consumer Discretionary | 29% |
| Consumer Staples | 8% |
| Energy | 9% |
| Financials | 4% |
| Health Care | 8% |
| Industrials | 14% |
| Information Technology | 5% |
| Materials | 8% |
| Telecommunication Services | 7% |
| Utilities | 3% |
| Cash and Other Net Assets | 5% |
Consumer Discretionary includes securities in the following industries: Auto Components; Consumer Finance; Hotels, Restaurants & Leisure; Household Durables; Leisure Equipment & Products; Media; Multiline Retail; Specialty Retail; and Textiles, Apparel & Luxury Goods |
The High Income Fund performed well during 2011. For the twelve-month period ended December 31, 2011, the fund returned 5.01% (Class I shares), while the Merrill Lynch US High Yield Master II Constrained Index Benchmark (HUCO) returned 4.37%. An underweight to Financials and Telecommunications sector bonds, and positive security selection in Financials (Nuveen) and Telecommunication sector bonds (Sprint Nextel Corp., Charter Communications Inc., Cablevision Systems Corp.) all contributed positively to the fund’s performance. The fund’s outperformance to the index was primarily due to the above mentioned industry allocations as well as superior selection across all rating categories (including BB, B, CCC rated bonds). Security selection within the Technology sector (Alcatel-Lucent) and the fund’s cash position detracted from performance.
The fund had an active year trading as we increased investments in more stable credits with higher earnings predictability and reduced the cyclical or volatile components of the portfolio. Overall for the year, there were 161 purchases aggregating $50.6 million and 175 sales totaling $41.4 million. Sector allocations were increased in Telecommunications, Utilities, Energy, and Consumer Staples while holdings in the Technology and Business Support Services industries were reduced. The portfolio also shifted higher in ratings categories with a 5% increase in BB rated bonds for a total of 28.0% and an approximately 5% decrease in portfolio weighting in the single B rated bond investments to 48.7% of the fund. The fund’s holdings in convertible bonds also declined from an 8-10% weighting earlier in the year to 4.0% at year-end. Looking to 2012, we remain focused on those bond swaps we believe will increase overall portfolio yields while not increasing the fund’s current risk profile.
Ultra Series Fund | Management’s Discussion of Fund Performance | December 31, 2011
INVESTMENT STRATEGY HIGHLIGHTS
The Ultra Series Diversified Income Fund seeks income by investing in a broadly diversified array of securities including bonds, common stocks, real estate securities, foreign market bonds and stocks and money market instruments. Bonds, stock and cash components will vary, reflecting the portfolio managers’ judgments of the relative availability of attractively yielding and priced stocks and bonds. Generally, however, bonds will constitute up to 80% of the fund’s assets, stocks will constitute up to 60% of the fund’s assets, real estate securities will constitute up to 25% of the fund’s assets, foreign stocks and bonds will constitute up to 25% of the fund’s assets and money market instruments may constitute up to 25% of the fund’s assets. The fund intends to limit the investment in lower credit quality bonds to less than 50% of the fund’s assets. The balance between the two strategies of the fund (fixed income and equity investing) is determined after reviewing the risks associated with each type of investment, with the goal of meaningful risk reduction as market conditions demand. The fund typically sells a stock when the fundamental expectations for producing competitive yields at an acceptable level of price risk no longer apply, the price exceeds the intrinsic value or other stocks appear more attractive.
Cumulative Performance of $10,000 Investment Since Inception1
Average Annual Total Return through December 31, 20111 |
| | | | | | |
| Class I Shares | 7.84% | 10.19% | 3.54% | 4.34% | — |
| Class II Shares | 7.57 | — | — | — | 12.68% |
| Bank of America Merrill Lynch U.S. Corporate, Government & Mortgage Index | 7.88 | 6.51 | 6.59 | 5.85 | 7.24 |
| Russell 1000¨ Index | 1.50 | 14.81 | -0.02 | 3.34 | 17.40 |
See accompanying Notes to Management’s Discussion of Fund Performance.
Ultra Series Fund | Management’s Discussion of Fund Performance | December 31, 2011
Diversified Income Fund (concluded)
During the twelve-month period ended December 31, 2011, large cap stocks had a period of slightly positive performance despite elevated volatility and high correlation in the markets. The second round of quantitative easing by the Fed coincided with a rally through the first half of 2011 before worries about the global economy resulted in a sharp correction during the summer. Stock prices quickly recovered during October, which registered as one of the strongest monthly gains in stock market history, before stocks pulled back modestly from there to end the year. For the year, the Russell 1000¨ Index rose 1.50%. The strongest sectors were Utilities, Consumer Staples, and Health Care. The Consumer Discretionary, Energy, Telecommunications and Technology sectors also had positive returns. The worst performing sectors, all of which had negative returns during the year, were Financials, Materials, and Industrials.
PORTFOLIO ALLOCATION AS A PERCENTAGE OF NET ASSETS AS OF 12/31/11 |
| Asset Backed | 1% |
| Common Stocks | 52% |
| Corporate Notes and Bonds | 17% |
| Mortgage Backed | 9% |
| U.S. Government and Agency Obligations | 16% |
| Cash and Other Net Assets | 5% |
The Diversified Income Fund gained 7.84% (Class I), while the Russell 1000¨ Index returned 1.50%.
Positive stock selection accounted for approximately 85% of the fund’s outperformance. Relative to the benchmark, global pharmaceutical company Pfizer Inc. was the most additive stock in the portfolio. Stocks selected in the Financial and Energy sectors also contributed nicely to performance. Insurance holding company Travelers Cos. Inc. and regional bank US Bancorp were top performers within Financials, while exploration and production company Marathon Oil Corp. and integrated oil company Chevron Corp. had strong results in the Energy sector.
Relative weakness compared to the benchmark occurred in the Utilities sector. Utility services company Exelon Corp. and gas & electric company Duke Energy Corp. detracted from performance. Other stocks that negatively impacted portfolio results were global financial services company Bank of New York Mellon Corp. and healthcare solutions provider Novartis AG.
The bond portion of the fund contributed positively to overall fund performance. Interest rates fell significantly over the course of the year and bond prices consequently rose. To give some perspective on this, the overall rate exposure of the fund is approximately equivalent to that of a 5-Year Treasury. That sector of the yield curve saw rates decline by over 100 basis points which implies price appreciation of over 4%. Additionally, the fund’s yield was higher than the overall bond market thereby contributing incremental income.
We increased exposure to Financial sector stocks during the year. Investment management firm Blackrock Inc., regional bank M&T Bank Corp., financial holding company Northern Trust Corp., and international reinsurance company PartnerRe Ltd. all were new purchases. We maintain an overweight position in Financials as we believe our holdings are strong franchises that can take market share.
We reduced the portfolio’s equity exposure to the Energy and Health Care sectors during the period. We sold Marathon Oil and Spectra Energy Corp., a natural gas infrastructure company, after periods of outperformance. Within Health Care, we sold diversified healthcare company Baxter International Inc. and trimmed Novartis. We are modestly underweight Energy but maintain an overweight in Health Care.
Ultra Series Fund | Management’s Discussion of Fund Performance | December 31, 2011
INVESTMENT STRATEGY HIGHLIGHTS
The Ultra Series Equity Income Fund invests primarily in common stocks of large-and mid-capitalization companies that are, in the view of the fund’s investment adviser, selling at a reasonable price in relation to their long-term earnings growth rates. The portfolio managers will allocate the fund’s assets among stocks in sectors of the economy based upon their expected earnings growth rates, adjusted to reflect their views on economic and market conditions and sector risk factors.
The fund will seek to generate current earnings from option premiums by writing (selling) covered call options on a substantial portion of its portfolio securities. The fund seeks to produce a high level of current income and current gains generated from option writing premiums and, to a lesser extent, from dividends. The extent of option writing activity will depend upon market conditions and the portfolio manager’s ongoing assessment of the attractiveness of writing call options on the fund’s stock holdings. In addition to providing income, covered call writing helps to reduce the volatility (and risk profile) of the fund by providing downside protection.
Cumulative Performance of $10,000 Investment Since Inception1
Average Annual Total Return through December 31, 20111 |
| | | |
| Class I Shares | 1.08% | 4.37% |
| Class II Shares | 0.84 | 4.12 |
| S&P 500 Index | 2.11 | 5.73 |
| CBOE BuyWrite Monthly Index | 5.72 | 6.42 |
See accompanying Notes to Management’s Discussion of Fund Performance.
Ultra Series Fund | Management’s Discussion of Fund Performance | December 31, 2011
Equity Income Fund (concluded)
The investment environment for the Equity Income Fund has transitioned through a number of phases over the past twelve months. U.S. stocks surged in early 2011. During this phase, the fund participated in the market upside but lagged the benchmark indices as one would expect of a covered call strategy. With stocks climbing very strongly, a number of the fund’s holdings were "called away" generating higher cash levels. Given the strength and duration of the rally, the fund was opportunistically and conservatively reinvesting the cash. The equity markets moved into a somewhat more volatile phase between February and July as geo-political issues in North Africa and the Japanese earthquake tragedy weighed on investor’s minds. This choppier environment provided opportunity for the fund to more aggressively reinvest the larger cash levels. The final phase, August through year-end, was primarily focused on the deteriorating European crisis and its potential to negatively impact global economic growth. During this phase, stock prices fluctuated extensively but maintained an upward bias, particularly as the calendar year came to a close. The fund performed relatively well as more opportunities were presented to reduce cash levels and the higher market volatility lead to very attractive option premiums being realized through call option writing.
The fund’s performance lagged the S&P 500 and the CBOE BuyWrite Index (BXM) on a one year basis. Much of the underperformance occurred during the market rally phase early in the year. During most strong market rallies, a covered call approach will lag the overall market, and this was no exception. For the full twelve-month period, the fund delivered a 1.08% return, (Class I shares), compared with a 2.11% return on the S&P 500 Index
SECTOR ALLOCATION AS A PERCENTAGE OF NET ASSETS |
| | Fund | S&P 500 |
| Consumer Discretionary | 13% | 11% |
| Consumer Staples | – | 10% |
| Energy | 15% | 13% |
| Financials | 17% | 15% |
| Health Care | 17% | 12% |
| Industrials | 5% | 11% |
| Information Technology | 23% | 18% |
| Materials | 3% | 4% |
| Telecommunication Services | – | 3% |
| Utilities | – | 3% |
| Exchange-Traded Fund | 2% | – |
| Cash, Options and Other Net Assets | 5% | – |
and a 5.72% return on the CBOE BuyWrite Index (BXM). Importantly, the fund’s yield was 11.06% for the twelve months ended 12/31/11 based on a distribution of $1.04 per share and a 12/31/11 share value of $9.4068 for the Class I shares.
The performance of the fund’s individual holdings was led by Technology holdings Google Inc. and eBAY Inc. while strong performance from financial holding IntercontinentalExchange Inc. offset weakness in banking and investment holdings such as Morgan Stanley and Wells Fargo & Co. Many of the fund’s Energy holdings lagged during the market downturn as oil prices fell sharply but rebounded very well later in the year. Finally, strength in United HealthCare and biotechnology companies Gilead Sciences Inc. and Celgene Corp. offset weakness in medical device oriented companies such as Stryker Corp. and St. Jude Medical.
Following the market’s late year rebound, the fund has taken a more conservative approach given the still high levels of global uncertainty. We increased the percentage of call options written against portfolio holdings and believe the fund is well positioned for the current environment and to continue to payout a relatively high level of income.
Ultra Series Fund | Management’s Discussion of Fund Performance | December 31, 2011
INVESTMENT STRATEGY HIGHLIGHTS
The Ultra Series Large Cap Value Fund will, under normal market conditions, invest primarily in large cap stocks. The fund follows a "value" approach, meaning the portfolio managers seek to invest in stocks at prices below their perceived intrinsic value as estimated based on fundamental analysis of the issuing company and its prospects. By investing in value stocks, the fund attempts to limit the downside risk over time but may also produce smaller gains than other stock funds if their intrinsic values are not realized by the market or if growth-oriented investments are favored by investors. The fund will diversify its holdings among various industries and among companies within those industries. The fund typically sells a stock when the fundamental expectations for buying it no longer apply, the price exceeds its intrinsic value or other stocks appear more attractively priced relative to their intrinsic values.
Cumulative Performance of $10,000 Investment Since Inception1
Average Annual Total Return through December 31, 20111 |
| | | | | | |
| Class I Shares | 7.38% | 10.74% | -2.65% | 2.14% | — |
| Class II Shares | 7.11 | — | — | — | 15.19% |
| Russell 1000¨ Value Index | 0.39 | 11.55 | -2.64 | 3.89 | 16.57 |
See accompanying Notes to Management’s Discussion of Fund Performance.
Ultra Series Fund | Management’s Discussion of Fund Performance | December 31, 2011
Large Cap Value Fund (concluded)
During the twelve-month period ended December 31, 2011, large cap value stocks in general delivered slightly positive performance despite elevated volatility and high correlation in the markets. The second round of quantitative easing by the Fed coincided with a rally through the first half of 2011 before worries about the global economy resulted in a sharp correction during the summer. Stock prices quickly recovered during October, which registered as one of the strongest monthly gains in stock market history, before stocks pulled back modestly from there to end the year. For the year, the Russell 1000¨ Value Index rose 0.39%. The strongest sectors were Utilities, Health Care, and Consumer Staples. The Telecommunications, Consumer Discretionary, Energy, and Industrials sectors also had positive returns. The worst performing sectors, all of which had negative returns during the year, were Financials, Materials, and Technology.
SECTOR ALLOCATION AS A PERCENTAGE OF NET ASSETS |
| | Fund | Russell 1000¨ Value Index |
| Consumer Discretionary | 6% | 9% |
| Consumer Staples | 12% | 8% |
| Energy | 13% | 12% |
| Financials | 22% | 24% |
| Health Care | 15% | 13% |
| Industrials | 9% | 9% |
| Information Technology | 11% | 9% |
| Materials | 1% | 3% |
| Telecommunication Services | 3% | 5% |
| Utilities | 4% | 8% |
| Cash and Other Net Assets | 4% | – |
The Large Cap Value Fund returned 7.38% (Class I shares), while the Russell 1000¨ Value Index returned 0.39%. We believe our focus on firms with sustainable competitive advantages, modest financial leverage and stable earnings histories contributed to this outperformance.
Positive stock selection accounted for approximately 90% of the outperformance. Relative to the benchmark, the fund’s Financial sector holdings contributed nicely to performance. Regional bank US Bancorp and insurance stocks Arch Capital Group Ltd., W.R. Berkley Corp. and Travelers Cos. Ins. were top performers. The Technology sector also generated strong results from information technology services company International Business Machines Corp. (IBM) and semiconductor chip maker Intel Corp. The Consumer Discretionary sector was another source of relative strength due to positive performance from off-price retailer TJX Cos. Inc.
Relative weakness compared to the benchmark occurred in the Health Care sector. Medical device manufacturer Medtronic Inc. and healthcare solutions provider Novartis AG negatively impacted results. Other stocks that were relatively weak included network communications equipment provider Cisco Systems Inc. and global financial services company Bank of New York Mellon Corp.
We increased exposure to the Consumer Staples sector during the year. We bought leading candy and snack manufacturer Nestle SA and global retailer Wal-Mart Stores Inc. Additionally, we added to existing positions in branded alcohol manufacturer Diageo PLC and global food, snack and beverage company PepsiCo Inc. The fund maintains an overweight position in Consumer Staples as we believe its holdings are strong franchises with good pricing power.
We reduced fund exposure to the Technology and Energy sectors during the period. We trimmed Cisco, Intel and IBM although the fund maintains positions in those stocks. Within Energy, we sold exploration and production companies Marathon Oil Corp. and Southwestern Energy Co. after periods of outperformance. Despite reducing fund exposure to these sectors, the fund maintains modest overweight positions.
Ultra Series Fund | Management’s Discussion of Fund Performance | December 31, 2011
LARGE CAP GROWTH FUND
INVESTMENT STRATEGY HIGHLIGHTS
The Ultra Series Large Cap Growth Fund invests primarily in common stocks of larger companies and will, under normal market conditions, maintain at least 80% of its assets in large cap stocks. The fund follows a "growth" approach, meaning the portfolio managers seek stocks that have low market prices relative to their perceived growth capabilities as estimated based on fundamental analysis of the issuing companies and their prospects. The fund typically seeks higher earnings growth capabilities in the stocks it purchases, and may include some companies undergoing more significant changes in their operations or experiencing significant changes in their markets. The fund will diversify its holdings among various industries and among companies within those industries. The fund has an active trading strategy which will lead to more portfolio turnover than a more passively-managed fund. The fund typically sells a stock when the fundamental expectations for buying it no longer apply, the price exceeds its perceived value or other stocks appear more attractively priced relative to their prospects.
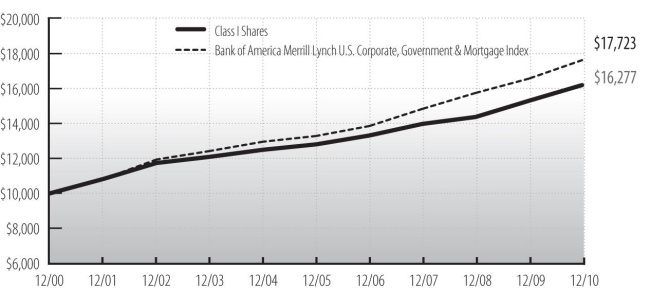
Cumulative Performance of $10,000 Investment Since Inception1
Average Annual Total Return through December 31, 20111 |
| | | | | | |
| Class I Shares | -1.19% | 15.20% | 1.53% | 1.41% | — |
| Class II Shares | -1.43 | — | — | — | 13.16% |
| Russell 1000¨ Growth Index | 2.64 | 18.02 | 2.50 | 2.60 | 18.23 |
See accompanying Notes to Management’s Discussion of Fund Performance.
For the twelve-month period ended December 31, 2011, market sentiment oscillated sharply around the impact of the European debt crisis, the revoluntary wave of demonstrations and protests in the Arab World, and the U.S. debt downgrade, to name a few. Because these issues have broad implications, the correlation of all stocks to one another was at record levels. This meant that the stock market had large price swings with most
Ultra Series Fund | Management’s Discussion of Fund Performance | December 31, 2011
Large Cap Growth Fund (concluded)
stocks moving up or down together. As such, this proved to be an unusually challenging
environment for most investors since these "macro" influences overshadowed company level fundamentals.
Another oddity in 2011 for growth stock investors was that generally the most defensive stocks did better than those exhibiting higher growth. For example, of the top 10 holdings in the Russell 1000¨ Growth Index, Phillip Morris was the best performing stock, up 39%. Meanwhile, Google was up only 8%. We apply a consistent methodology for identifying growth companies. From our perspective, Google is a true-growth company while Phillip Morris lacks many of the characteristics most growth companies exhibit. Consequently, we do not own stock in Phillip Morris, but do own Google stock.
SECTOR ALLOCATION AS A PERCENTAGE OF NET ASSETS |
| | Fund | Russell 1000¨ Growth Index |
| Consumer Discretionary | 14% | 14% |
| Consumer Staples | 6% | 13% |
| Energy | 11% | 11% |
| Financials | 6% | 4% |
| Health Care | 6% | 11% |
| Industrials | 11% | 13% |
Information Technology | 38% | 28% |
| Materials | 5% | 5% |
| Telecommunication Services | – | 1% |
| Utilities | – | –* |
| Cash and Other Net Assets | 3% | – |
| *Rounds to 0% |
Information Technology includes securities in the following industries: communications equipment; computers and peripherals; electronic equipment, instruments & components; internet software & services; IT services; semiconductors & semiconductor equipment; and software. |
For the twelve-month period ended December 31, 2011 the Large Cap Growth Fund returned -1.19% (Class I shares), while the Russell 1000¨ Growth Index returned 2.64%. The fund trailed the benchmark return this year because we expected investors to gravitate towards technology companies as a result of the strong balance sheets, excess cash flow, product innovation, and low valuations these companies presented. However, this proved incorrect as investors instead bid up Utilities, Consumer Staples and Consumer Discretionary stocks, allowing those sectors to be the leaders.
We had very good success with a number of Technology holdings, though not enough to offset the strength in the consumer related sectors. Visa Inc. was a standout, up 44%. Through our fundamental analysis we gained conviction to make it a top holding despite it being the subject of regulatory change via the Dodd-Frank Act. Similarly, SanDisk Corp. is a leader in flash memory, used in smartphones and tablets, and it contributed strongly to performance.
Detracting from performance was Acme Packet Inc., a high growth situation whose end market growth was delayed, causing the stock to fall sharply. We remain confident its products will be needed as more video and voice move over the Internet.
The fund’s holdings in Energy securities, while mixed, detracted from performance. Petrobras Brasileiro SA, the Brazilian oil company, has a bright future, but near term its growth has been restricted by politics.
We took profits in Petrohawk and Varian Medical Systems Inc. as they received buyout bids at substantial premiums. We increased our holdings in Ecolabs Inc. and Roper Industries Inc., each with diversified service businesses which may excel in the current weak economy.
Ultra Series Fund | Management’s Discussion of Fund Performance | December 31, 2011
MID CAP FUND
INVESTMENT STRATEGY HIGHLIGHTS
The Ultra Series Mid Cap Fund generally invests in common stocks of midsize companies and will, under normal market conditions, maintain at least 80% of its assets in mid cap securities. However, the fund will not automatically sell a stock because its market capitalization has changed and such positions may be increased through additional purchases. The fund seeks attractive long-term returns through bottom-up security selection based on fundamental analysis in a diversified portfolio of high-quality growth companies with attractive valuations. These will typically be industry leading companies in niches with strong growth prospects. The fund’s portfolio managers believe in selecting stocks for the fund that show steady, sustainable growth and reasonable valuations. As a result, stocks of issuers that are believed to have a blend of both value and growth potential will be selected for investment. Stocks are generally sold when target prices are reached, company fundamentals deteriorate or more attractive stocks are identified.
Cumulative Performance of $10,000 Investment Since Inception1
Average Annual Total Return through December 31, 20111 |
| | | | | | |
| Class I Shares | 4.47% | 22.72% | 1.26% | 3.85% | — |
| Class II Shares | 4.22 | — | — | — | 18.54% |
| Russell Midcap¨ Index | -1.55 | 20.17 | 1.41 | 6.99 | 20.69 |
See accompanying Notes to Management’s Discussion of Fund Performance.
Ultra Series Fund | Management’s Discussion of Fund Performance | December 31, 2011
Mid Cap Fund (concluded)
During the twelve-month period ended December 31, 2011, mid cap stocks in general had a period of slightly negative performance that was associated with elevated volatility and high correlation in the markets. The second round of quantitative easing by the Fed coincided with a rally through the first half of 2011 before worries about the global economy resulted in a sharp correction during the summer. Stock prices quickly recovered during October, which registered as one of the strongest monthly gains in stock market history, before stocks pulled back modestly from there to end the year. For the year, the Russell Midcap¨ Index declined 1.55%.
SECTOR ALLOCATION AS A PERCENTAGE OF NET ASSETS |
| | Fund | Russell Midcap¨ Index |
| Consumer Discretionary | 19% | 16% |
| Consumer Staples | 4% | 6% |
| Energy | 6% | 8% |
| Financials | 25% | 19% |
| Health Care | 9% | 10% |
| Industrials | 14% | 12% |
| Information Technology | 10% | 13% |
| Materials | 8% | 7% |
| Telecommunication Services | – | 1% |
| Utilities | – | 8% |
| Cash and Other Net Assets | 5% | – |
For the year ended December 31, 2011, the Mid Cap Fund gained 4.47% (Class I shares), while the Russell Midcap¨ Index returned -1.55%.
Positive stock selection accounted for approximately 95% of the fund’s outperformance. Relative to the benchmark, the Industrial sector generated strong performance from used car auctioneer Copart Inc. and global rail industry equipment provider Wabtec Corp./DE. Our holdings in Financials also contributed nicely to performance. Insurance stocks W.R. Berkley Corp., Arch Capital Group and Markel Corp. were top performers in the sector.
With the exception of Utilities, all sectors had positive performance relative to the benchmark. However, there were a few stocks that negatively impacted results. Leading office supply retailer Staples Inc. detracted from performance in the Consumer Discretionary sector, while Brookfield Asset Management Inc. had relatively weak returns within Financials.
We increased exposure to the Consumer Discretionary sector during the period by purchasing two media companies. We bought Discovery Communications Inc., a global nonfiction media company with leading cable networks, and Liberty Global Inc., an international provider of video, broadband and telephone services. We also purchased Staples and added to Carmax Inc., a leading used car retailer. The fund maintains an overweight position in the Consumer Discretionary sector as we believe its holdings are strong franchises with good pricing power.
We reduced fund exposure to the Health Care and Telecommunications sectors during the period. We sold medical products manufacturer C.R. Bard Inc., clinical research organization Covance Inc. and animal diagnostic test provider Idexx Laboratories Inc. after periods of outperformance. Within Telecommunications, we sold tower operator Crown Castle International Corp. which also had contributed to results. The fund is modestly underweight in the Health Care sector and no longer has any exposure to the Telecommunications sector.
Ultra Series Fund | Management’s Discussion of Fund Performance | December 31, 2011
SMALL CAP FUND
INVESTMENT STRATEGY HIGHLIGHTS
The Ultra Series Small Cap Fund invests primarily in a diversified mix of common stocks of small cap U.S. companies that are believed to be undervalued by various measures and offer sound prospects for capital appreciation. The portfolio managers employ a value-oriented investment approach in selecting stocks, using proprietary fundamental research to identify securities of companies they believe have attractive valuations. The portfolio managers focus on companies with a record of above average rates of profitability that sell at a discount relative to the overall small cap market. Through fundamental research, the portfolio managers seek to identify those companies that possess one or more of the following characteristics: sustainable competitive advantages within a market niche; strong profitability and free cash flows; strong market share positions and trends; quality of and share ownership by management; and financial structures that are more conservative than the relevant industry average.
Cumulative Performance of $10,000 Investment Since Inception1
Average Annual Total Return through December 31, 20111 |
| | | | | |
| Class I Shares | 0.91% | 18.96% | 2.71% | — |
| Class II Shares | 0.66 | — | — | 21.31% |
| Russell 2000¨ Index | -4.18 | 15.63 | -0.63 | 18.52 |
See accompanying Notes to Management’s Discussion of Fund Performance.
The twelve-month period ended December 31, 2011 was yet another extremely volatile period for equity markets. Global equities started the year on a strong note and continued to march higher in the first quarter of 2011, driven by investors’ enthusiasm for additional government debt purchases by the U.S. Federal Reserve, the extension of tax cuts in the U.S., strong earnings growth, and generally improving economic data. This enthusiasm reversed later in the period as concerns surfaced regarding whether the global economy could slip back
Ultra Series Fund | Management’s Discussion of Fund Performance | December 31, 2011
Small Cap Fund (concluded)
into recession, resulting in a rapid decline in equity markets. Fears about sovereign debt and solvency in the eurozone, slowing economic expansion in China and the U.S., and uncertainty about the sustainability of corporate earnings growth combined to produce an extremely volatile stock market. Return correlations among stocks spiked as investors shed risk and fled to safety. Despite these lingering concerns, markets ended the year on a positive note in the final month of the period in response to encouraging employment and manufacturing data in the U.S.
SECTOR ALLOCATION AS A PERCENTAGE OF NET ASSETS AS OF 12/31/11 |
| | Fund | Russell 2000¨ Index |
| Consumer Discretionary | 15% | 13% |
| Consumer Staples | 1% | 4% |
| Energy | 4% | 7% |
| Financials | 25% | 22% |
| Health Care | 8% | 13% |
| Industrials | 24% | 15% |
| Information Technology | 8% | 17% |
| Materials | 5% | 4% |
| Telecommunication Services | – | 1% |
| Utilities | 5% | 4% |
| Cash and Other Net Assets | 5% | – |
For the twelve-month period ended December 31, 2011, the Small Cap Fund returned 0.91% (Class I shares), while the Russell 2000¨ Index, returned -4.18%.
The fund’s outperformance was primarily due to strong selection in the Industrials, Financials, and Technology sectors. Positive results were somewhat offset by weaker stock selection within Energy and Health Care. Allocation among sectors, a residual of the bottom-up stock selection process, was modestly positive due to an overweight in Utilities and underweight in Technology.
The fund’s largest contributors to relative performance during the period included Delphi Financial Group Inc., an insurance holding company specializing in life and disability insurance; Kirby Corp., an inland barge operator; and Carlisle Cos. Inc., a diversified industrial manufacturer with significant operations in commercial roofing and specialty tires and wheels.
The fund’s largest relative detractors during the period included Penn Virgina Corp., an independent oil and gas exploration and production company; Zep Inc., a cleaning products and solutions manufacturer; and ICON PLC, a contract research organization. Our position in Scorpio Tankers Inc., a transportation firm focused on seaborne shipments of refined petroleum products, also detracted from relative and absolute results during the period.
The fund’s investment approach emphasizes individual stock selection; sector weights are a residual of our bottom-up investment process. We do, however, carefully consider diversification across economic sectors to limit risk. Based on bottom-up stock decisions, exposure to the Industrials sector increased during the period and exposure to Consumer Staples sector fell. In Industrials, we added positions in ESCO Technologies Inc. and United Stationers Inc. Within the Consumer Staples sector, we eliminated positions in Snyders-Lance Inc. and Herbalife Ltd. As of the end of the period, the fund was most overweight in the Industrials and Financials sectors relative to the Russell 2000¨ Index, and most underweight in the Technology sector.
Ultra Series Fund | Management’s Discussion of Fund Performance | December 31, 2011
INTERNATIONAL STOCK FUND
INVESTMENT STRATEGY HIGHLIGHTS
The Ultra Series International Stock Fund will invest, under normal market conditions, primarily in foreign equity securities. Typically, a majority of the fund’s assets are invested in relatively large capitalization stocks of companies located or operating in developed countries. The fund may also invest up to 30% of its assets in securities of companies whose principal business activities are located in emerging market countries. The portfolio managers typically maintain this segment of the fund’s portfolio in such stocks which it believes have a low market price relative to their perceived value based on fundamental analysis of the issuing company and its prospects. The fund may also invest in foreign debt and other income bearing securities at times when it believes that income bearing securities have greater capital appreciation potential than equity securities.
Cumulative Performance of $10,000 Investment Since Inception1
Average Annual Total Return through December 31, 20111 |
| | | | | | |
| Class I Shares | -7.70% | 8.13% | -2.87% | 6.37% | — |
| Class II Shares | -7.91 | — | — | — | 10.37% |
| MSCI EAFE Index | -11.73 | 8.16 | -4.26 | 5.12 | 10.32 |
See accompanying Notes to Management’s Discussion of Fund Performance.
International equity markets fell in 2011 as macroeconomic concerns overwhelmed resilient corporate profits. The largest issue was in Europe, where in July the sovereign debt crisis spread inexorably from the smaller periphery countries, such as Greece and Ireland, to the heart of Europe – Spain and Italy. Both countries now have new governments implementing more aggressive reforms, and the eurozone is moving toward much more centralized fiscal control, while setting up substantial rescue funds. The European Central Bank (ECB) has provided virtually unlimited three-year liquidity to banks, and has bought substantial quantities of Italian and Spanish debt. However, these actions will likely still fall short of an ultimate solution, and with banks pulling in lending, the economic environment appears to be deteriorating. After
Ultra Series Fund | Management’s Discussion of Fund Performance | December 31, 2011
International Stock Fund (concluded)
a summer scare around the Standard & Poor’s downgrade of U.S. long-term sovereign debt, more recent economic indicators in the United States have improved as corporations continue to invest in capital expenditures and consumers start to reduce savings rates again. However, it remains to be seen whether this is sustainable, as the United States has yet to take any material steps toward addressing its own fiscal deficit. In China, the government’s measures to cool the economy, particularly in the housing market, started to make an impact in the second half of the year, and initial signs of easing policy are calming fears of a hard landing. Meanwhile, Japan has recovered remarkably from the severe earthquake and tsunami in March, although it remains exposed to risk from global trade, its strong currency, and ultimately its own debt issues.
In this environment, traditionally cyclical and risk assets performed poorly. Financials, materials, capital goods, technology, and automotive stocks all fell significantly, as did smaller-capitalization and emerging market stocks. The latter was driven in part by weakening currencies as money flowed out of the emerging markets. The better-performing stocks were in the traditionally more defensive sectors, such as Health Care, Consumer Staples, and Telecommunications. The large integrated energy stocks also performed well, but stocks in the Utilities sector fell sharply as weak energy demand and harsh government intervention hurt corporate profits.
For the twelve-month period ended December 31, 2011, the International Stock Fund returned -7.70% (Class I shares) while the MSCI EAFE Index returned -11.73%. Stock selection was the main driver of performance, led by the Financials and Telecommunications sectors. In the Financials sector, life insurers AIA Group Ltd. and Prudential Financial Ltd. performed well on strong demand for their services. In the Telecommunications sector, stock selection was led by Telstra Corp. Ltd., which performed well amid expectations of a beneficial deal with the government regarding the National Broadband Network.
In contrast, the fund was negatively impacted by its high exposure to the Technology sector as it underperformed the broader market. However, its negative impact was more than offset by positive stock selection in the sector. Exposure to emerging markets detracted from relative returns as the fund’s positions underperformed the broader market.
GEOGRAPHICAL ALLOCATION AS A PERCENTAGE OF NET ASSETS |
| Africa | 1% |
| Europe (excluding United Kingdom) | 33% |
| Japan | 15% |
| Latin America | 3% |
| Pacific Basin | 8% |
| United Kingdom | 30% |
| Other Countries | 5% |
| Cash and Other Net Assets | 5% |
The fund increased its exposure to the Industrials sector during the year by investing in companies that we believed were attractively valued, such as discount carrier Ryanair Holdings PLC and container shipping company A.P. Moller-Maersk. Additionally, the fund increased positions in the Materials sector, including Rexam PLC, a beverage can producer, and James Hardie Industries SE, a manufacturer of fibre-cement building products. The fund increased its exposure to Europe, where we believed many quality companies were trading at attractive values. Positions included insurance company AXA Cooperative Insurance and television provider British Sky Broadcasting Group PLC.
The fund’s exposure to the Financials sector changed significantly over the year, shifting from an overweight exposure in January to an underweight exposure in December. The fund also reduced its exposure to the Information Technology sector during the year.
Ultra Series Fund | Management’s Discussion of Fund Performance | December 31, 2011
MADISON TARGET RETIREMENT 2020 FUND
INVESTMENT STRATEGY HIGHLIGHTS
The Ultra Series Target Retirement 2020 Fund invests primarily in shares of registered investment companies (the "underlying funds") according to an asset allocation strategy developed by Madison Asset Management, LLC ("Madison"), the fund’s investment adviser, for investors planning to retire in or within a few years of 2020. Over time, the fund’s asset allocation will become more conservative until it reaches approximately 15-30% in stock funds and 70-85% in bond funds. The asset allocation strategy is designed to reduce the volatility of investment returns in the later years while still providing the potential for higher total returns over the target period.
On a periodic basis, Madison will evaluate and sometimes revise the fund’s asset allocations, including revising the asset class weightings and adding and/or removing underlying funds. Madison will also monitor the underlying funds on an ongoing basis and may increase or decrease the fund’s investment in one or several underlying funds. The underlying fund selections are made based on several considerations, including the fund’s style or asset class exposures, portfolio characteristics, risk profile, and investment process.
Cumulative Performance of $10,000 Investment Since Inception1,2
Average Annual Total Return through December 31, 20111,2 |
| | | | |
| Ultra Series Target Retirement 2020, Class I | 2.11% | 12.80% | -2.19% |
| Dow Jones Global Target 2020 Index | 2.01 | 11.52 | 1.69 |
See accompanying Notes to Management’s Discussion of Fund Performance.
Ultra Series Fund | Management’s Discussion of Fund Performance | December 31, 2011
Madison Target Retirement 2020 Fund (concluded)
It was a tough year for global equities, with global stock indices declining by over 7% in 2011. Though it may not have felt like it, the U.S. was clearly a relative winner, posting modestly positive returns, while much of the rest of the world ended the year solidly in the red. Despite having its own share of economic issues, the U.S. rather amazingly saw the spotlight pointed elsewhere for much of the year.
Bonds proved to be the preferred asset class for 2011. Entering the year, conventional wisdom was that interest rates were set to rise and bonds would underperform stocks. However, by mid-year, weakening economic data, U.S. debt ceiling brinksmanship, and an intensifying European debt crisis led to a substantial stock market correction. By year-end, the Barclays U.S. Aggregate Bond Index had gained 7.8%, compared to the 2.1% return on the S&P 500 Index and the 11.7% decline on the MSCI EAFE (foreign stock) Index.
PORTFOLIO ALLOCATION AS A PERCENTAGE OF NET ASSETS |
| Bond Funds | 47% |
| Foreign Bond Funds | 3% |
| Stock Funds | 38% |
| Foreign Stock Funds | 9% |
| Cash and Other Net Assets | 3% |
We entered the year with a relatively defensive allocation mindset. Our view was that the world economy was still mired in the global deleveraging process and that a number of serious headwinds remained, which would in turn lead to below-average growth and disappointed risk markets. This view proved to be correct, and the portfolio benefited from our positioning, which had the fund overweight in fixed income securities and substantially underweight in foreign equities.
For the twelve-month period ended December 31, 2011, the Madison Target Retirement 2020 Fund returned 2.11%, while the Dow Jones Global Target 2020 Index returned 2.01%. The fund’s performance put it well ahead of the Morningstar Target Date 2016-2020 peer average return of -0.22%, placing the fund in the top 10% of the category for the one-year period.
Top contributors to performance included: Vanguard Total Bond Market, which returned 7.7% for the year; Vanguard Dividend Appreciation at 6.2%; and PIMCO Investment Grade Corporate Bond at 6.9%.
Top detractors from performance included: Vanguard FTSE All-World ex-US, which declined -14.2% for the year; Templeton Global Bond at -2.2%; and iShares S&P MidCap 400 at -1.9%.
During the middle of the year, a significant change was made to the investment structure of the Target Retirement Date Funds. The funds were redesigned into a predominately index-based structure, utilizing exchange traded funds for the majority of the underlying holdings, as opposed to traditional "actively managed" funds. As a result, the portfolio experienced a large amount of turnover because we sold a majority of the underlying active fund holdings. We are very excited about the new structure and the flexibility it affords us in managing the fund.
Ultra Series Fund | Management’s Discussion of Fund Performance | December 31, 2011
MADISON TARGET RETIREMENT 2030 FUND
INVESTMENT STRATEGY HIGHLIGHTS
The Ultra Series Target Retirement 2030 Fund invests primarily in shares of registered investment companies (the "underlying funds") according to an asset allocation strategy developed by Madison Asset Management, LLC ("Madison"), the fund’s investment adviser, for investors planning to retire in or within a few years of 2030. Over time, the fund’s asset allocation will become more conservative until it reaches approximately 15-30% in stock funds and 70-85% in bond funds. The asset allocation strategy is designed to reduce the volatility of investment returns in the later years while still providing the potential for higher total returns over the target period.
On a periodic basis, Madison will evaluate and sometimes revise the fund’s asset allocations, including revising the asset class weightings and adding and/or removing underlying funds. Madison will also monitor the underlying funds on an ongoing basis and may increase or decrease the fund’s investment in one or several underlying funds. The underlying fund selections are made based on several considerations, including the fund’s style or asset class exposures, portfolio characteristics, risk profile, and investment process.
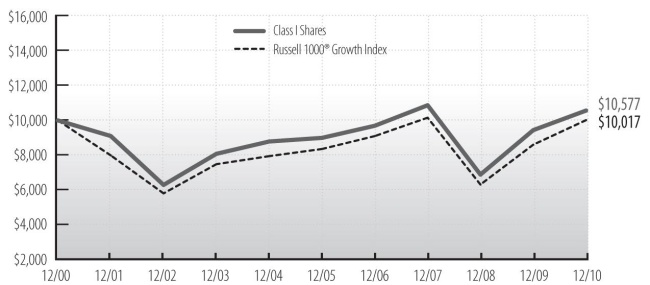
Cumulative Performance of $10,000 Investment Since Inception1,2
Average Annual Total Return through December 31, 20111,2 |
| | | | |
| Ultra Series Target Retirement 2030, Class I | 1.16% | 13.22% | -3.17% |
| Dow Jones Global Target 2030 Index | -1.20 | 13.96 | -0.25 |
See accompanying Notes to Management’s Discussion of Fund Performance.
Ultra Series Fund | Management’s Discussion of Fund Performance | December 31, 2011
Madison Target Retirement 2030 Fund (concluded)
It was a tough year for global equities, with global stock indices declining by over 7% in 2011. Though it may not have felt like it, the U.S. was clearly a relative winner, posting modestly positive returns, while much of the rest of the world ended the year solidly in the red. Despite having its own share of economic issues, the U.S. rather amazingly saw the spotlight pointed elsewhere for much of the year.
Bonds proved to be the preferred asset class for 2011. Entering the year, conventional wisdom was that interest rates were set to rise and bonds would underperform stocks. However, by mid-year, weakening economic data, U.S. debt ceiling brinksmanship, and an intensifying European debt crisis led to a substantial stock market correction. By year-end, the Barclays U.S. Aggregate Bond Index had gained 7.8%, compared to the 2.1% return on the S&P 500 Index and the 11.7% decline on the MSCI EAFE (foreign stock) Index.
PORTFOLIO ALLOCATION AS A PERCENTAGE OF NET ASSETS |
| Bond Funds | 34% |
| Foreign Bond Funds | 2% |
| Stock Funds | 50% |
| Foreign Stock Funds | 11% |
| Cash and Other Net Assets | 3% |
We entered the year with a relatively defensive allocation mindset. Our view was that the world economy was still mired in the global deleveraging process and that a number of serious headwinds remained, which would in turn lead to below average growth and disappointed risk markets. This view proved to be correct, and the portfolio benefited from our positioning, which had the fund overweight in fixed income securities and substantially underweight in foreign equities.
For the twelve-month period ended December 31, 2011, the Madison Target Retirement 2030 Fund returned 1.16%, while the Dow Jones Global Target 2030 Index returned -1.20%. The fund’s performance put it well ahead of the Morningstar Target Date 2026-2030 peer average return of -2.26%, placing the fund in the top 10% of the category for the one-year period.
Top contributors to performance included: Vanguard Total Bond Market, which returned 7.7% for the year; Vanguard Dividend Appreciation at 6.2%; and PIMCO Investment Grade Corporate Bond at 6.9%.
Top detractors from performance included: Vanguard FTSE All-World ex-US, which declined -14.2% for the year; Templeton Global Bond at -2.2%; and iShares S&P MidCap 400 at -1.9%.
During the middle of the year, a significant change was made to the investment structure of the Target Retirement Date Funds. The funds were redesigned into a predominately index-based structure, utilizing exchange traded funds for the majority of the underlying holdings, as opposed to traditional "actively managed" funds. As a result, the portfolio experienced a large amount of turnover because we sold a majority of the underlying active fund holdings. We are very excited about the new structure and the flexibility it affords us in managing the fund.
Ultra Series Fund | Management’s Discussion of Fund Performance | December 31, 2011
MADISON TARGET RETIREMENT 2040 FUND
INVESTMENT STRATEGY HIGHLIGHTS
The Ultra Series Target Retirement 2040 Fund invests primarily in shares of registered investment companies (the "underlying funds") according to an asset allocation strategy developed by Madison Asset Management, LLC ("Madison"), the fund’s investment adviser, for investors planning to retire in or within a few years of 2040. Over time, the fund’s asset allocation will become more conservative until it reaches approximately 15-30% in stock funds and 70-85% in bond funds. The asset allocation strategy is designed to reduce the volatility of investment returns in the later years while still providing the potential for higher total returns over the target period.
On a periodic basis, Madison will evaluate and sometimes revise the fund’s asset allocations, including revising the asset class weightings and adding and/or removing underlying funds. Madison will also monitor the underlying funds on an ongoing basis and may increase or decrease the fund’s investment in one or several underlying funds. The underlying fund selections are made based on several considerations, including the fund’s style or asset class exposures, portfolio characteristics, risk profile, and investment process.
Cumulative Performance of $10,000 Investment Since Inception1,2
Average Annual Total Return through December 31, 20111,2 |
| | | | |
| Ultra Series Target Retirement 2040, Class I | 0.47% | 13.30% | -4.44% |
| Dow Jones Global Target 2040 Index | -3.59 | 15.16 | -1.36 |
See accompanying Notes to Management’s Discussion of Fund Performance.
Ultra Series Fund | Management’s Discussion of Fund Performance | December 31, 2011
Madison Target Retirement 2040 Fund (concluded)
It was a tough year for global equities, with global stock indices declining by over 7% in 2011. Though it may not have felt like it, the U.S. was clearly a relative winner, posting modestly positive returns, while much of the rest of the world ended the year solidly in the red. Despite having its own share of economic issues, the U.S. rather amazingly saw the spotlight pointed elsewhere for much of the year.
Bonds proved to be the preferred asset class for 2011. Entering the year, conventional wisdom was that interest rates were set to rise and bonds would underperform stocks. However, by mid-year, weakening economic data, U.S. debt ceiling brinksmanship, and an intensifying European debt crisis led to a substantial stock market correction. By year-end, the Barclays U.S. Aggregate Bond Index had gained 7.8%, compared to the 2.1% return on the S&P 500 Index and the 11.7% decline on the MSCI EAFE (foreign stock) Index.
PORTFOLIO ALLOCATION AS A PERCENTAGE OF NET ASSETS |
| Bond Funds | 25% |
| Foreign Bond Funds | –* |
| Stock Funds | 59% |
| Foreign Stock Funds | 13% |
| Cash and Other Net Assets | 3% |
| *Rounds to 0% | |
We entered the year with a relatively defensive allocation mindset. Our view was that the world economy was still mired in the global deleveraging process and that a number of serious headwinds remained, which would in turn lead to below average growth and disappointed risk markets. This view proved to be correct, and the portfolio benefited from our positioning, which had the fund overweight in fixed income securities and substantially underweight in foreign equities.
For the twelve-month period ended December 31, 2011, the Madison Target Retirement 2040 Fund returned 0.47%, while the Dow Jones Global Target 2040 Index returned -3.59%. The fund’s performance put it well ahead of the Morningstar Target Date 2036-2040 peer average return of -3.49%, placing the fund in the top 10% of the category for the one-year period.
Top contributors to performance included: Vanguard Total Bond Market, which returned 7.7% for the year; Vanguard Dividend Appreciation at 6.2%; and PIMCO Investment Grade Corporate Bond at 6.9%.
Top detractors from performance included: Vanguard FTSE All-World ex-US, which declined -14.2% for the year; Templeton Global Bond at -2.2%; and iShares S&P MidCap 400 at -1.9%.
During the middle of the year, a significant change was made to the investment structure of the Target Retirement Date Funds. The funds were redesigned into a predominately index-based structure, utilizing exchange traded funds for the majority of the underlying holdings, as opposed to traditional "actively managed" funds. As a result, the portfolio experienced a large amount of turnover because we sold a majority of the underlying active fund holdings. We are very excited about the new structure and the flexibility it affords us in managing the fund.
Ultra Series Fund | Management’s Discussion of Fund Performance | December 31, 2011
MADISON TARGET RETIREMENT 2050 FUND
INVESTMENT STRATEGY HIGHLIGHTS
The Madison Target Retirement 2050 Fund invests primarily in shares of registered investment companies (the "underlying funds") according to an asset allocation strategy developed by Madison Asset Management, LLC ("Madison"), the fund’s investment adviser, for investors planning to retire in or within a few years of 2050. Over time, the fund’s asset allocation will become more conservative until it reaches approximately 15-30% in stock funds and 70-85% in bond funds. The asset allocation strategy is designed to reduce the volatility of investment returns in the later years while still providing the potential for higher total returns over the target period.
On a periodic basis, Madison will evaluate and sometimes revise the fund’s asset allocations, including revising the asset class weightings and adding and/or removing underlying funds. Madison will also monitor the underlying funds on an ongoing basis and may increase or decrease the fund’s investment in one or several underlying funds. The underlying fund selections are made based on several considerations, including the fund’s style or asset class exposures, portfolio characteristics, risk profile, and investment process.
Cumulative Performance of $10,000 Investment Since Inception1,2
Average Annual Total Return through December 31, 20111,2 |
| | |
| Ultra Series Target Retirement 2050, Class I | -1.03% |
| Dow Jones Global Target 2050 Index | -4.84 |
See accompanying Notes to Management’s Discussion of Fund Performance.
Ultra Series Fund | Management’s Discussion of Fund Performance | December 31, 2011
Madison Target Retirement 2050 Fund (concluded)
It was a tough year for global equities, with global stock indices declining by over 7% in 2011. Though it may not have felt like it, the U.S. was clearly a relative winner, posting modestly positive returns, while much of the rest of the world ended the year solidly in the red. Despite having its own share of economic issues, the U.S. rather amazingly saw the spotlight pointed elsewhere for much of the year.
Bonds proved to be the preferred asset class for 2011. Entering the year, conventional wisdom was that interest rates were set to rise and bonds would underperform stocks. However, by mid-year, weakening economic data, U.S. debt ceiling brinksmanship, and an intensifying European debt crisis led to a substantial stock market correction. By year-end, the Barclays U.S. Aggregate Bond Index had gained 7.8%, compared to the 2.1% return on the S&P 500 Total Return Index and the 11.7% decline on the MSCI EAFE (foreign stock) Index.
| PORTFOLIO ALLOCATION AS A PERCENTAGE OF NET ASSETS |
|
| Bond Funds | 15% |
| Stock Funds | 67% |
| Foreign Stock Funds | 15% |
| Cash and Other Net Assets | 3% |
We entered the year with a relatively defensive allocation mindset. Our view was that the world economy was still mired in the global deleveraging process and that a number of serious headwinds remained, which would in turn lead to below average growth and disappointed risk markets. This view proved to be correct, and the portfolio benefited from our positioning, which had the fund overweight in fixed income securities and substantially underweight in foreign equities.
Since its January 3, 2011 inception date, the Madison Target Retirement 2050 Fund returned -1.03%, while the Dow Jones Global Target 2050 Index returned -4.84%.
Top contributors to performance included: Vanguard Total Bond Market, which returned 7.7% for the year; Vanguard Dividend Appreciation at 6.2%; and PIMCO Investment Grade Corporate Bond at 6.9%.
Top detractors from performance included: Vanguard FTSE All-World ex-US, which declined -14.2% for the year; iShares S&P MidCap 400 at -1.9%; and Schwab Fundamental Large Company Index at -0.2%.
During the middle of the year, a significant change was made to the investment structure of the Target Retirement Date Funds. The funds were redesigned into a predominately index-based structure, utilizing exchange traded funds for the majority of the underlying holdings, as opposed to traditional "actively managed" funds. As a result, the portfolio experienced a large amount of turnover because we sold a majority of the underlying active fund holdings. We are very excited about the new structure and the flexibility it affords us in managing the fund.
Ultra Series Fund | Management’s Discussion of Fund Performance | December 31, 2011
Notes to Management’s Discussion of Fund Performance
| | 1Fund returns are calculated after fund level expenses have been subtracted, but do not include any separate account fees, charges or expenses imposed by the variable annuity and variable life insurance contracts that invest in the fund, as described in the Prospectus. If these fees, charges, or expenses were included, fund returns would have been lower. Fund returns also assume that dividends and capital gains are reinvested in additional shares of the fund. Investment return and principal value will fluctuate, so an investor’s shares, when redeemed, may be worth more or less than when purchased. Further information relating to the fund’s performance is contained in the Prospectus and elsewhere in this report. The fund’s past performance is not indicative of future performance. Current performance may be lower or higher than the performance data cited. For Ultra Series Fund performance data current to the most recent month-end, please call 1-800-670-3600. Indices are unmanaged and investors cannot invest in them directly. Index returns do not reflect fees or expenses. |
| | 2MEMBERS Capital Advisors, Inc., the then acting fund adviser, reduced its management fee for the Conservative, Moderate, and Aggressive Allocation Funds from June 30, 2006-April 30, 2008. Effective October 1, 2009, Madison contractually agreed to waive a portion of the management fee of the Target Retirement Date 2020, 2030 and 2040 Funds from 0.40% to 0.20%. Effective February 17, 2011, the fee was permanently reduced to 0.20%. On September 1, 2011, shareholders of the Target Retirement Date Funds approved a new fee arrangement which includes an investment advisory fee of 0.25% annualized and a services agreement fee of 0.05% annualized. If the management fees had not been reduced, returns would have been lower. |
Morningstar Percentile rankings note: 1st is top, 99th is bottom.
©Morningstar, Inc. All Rights Reserved. The information contained herein: (1) is proprietary to Morningstar and/or its content providers; (2) may not be copied or distributed; and (3) is not warranted to be accurate, complete or timely. Neither Morningstar nor its content providers are responsible for any damages or losses arising from any use of this information.
BENCHMARK DESCRIPTIONS
Allocation Fund Indexes
The Conservative Allocation Fund Custom Index consists of 65% Merrill Lynch U.S. Corporate, Government and Mortgage Index, 30% Russell 3000¨ Index and 5% MSCI EAFE Index. See market indexes descriptions below.
The Moderate Allocation Fund Custom Index consists of 40% Merrill Lynch U.S. Corporate, Government and Mortgage Index, 45% Russell 3000¨ Index and 15% MSCI EAFE Index. See market indexes descriptions below.
The Aggressive Allocation Fund Custom Index consists of 15% Merrill Lynch U.S. Corporate, Government and Mortgage Index, 55% Russell 3000¨ Index and 30% MSCI EAFE Index. See market indexes descriptions below.
Market Indexes
The Bank of America Merrill Lynch U.S. Corporate, Government & Mortgage Index is a broad-based measure of the total rate of return performance of the U.S. investment-grade bond markets. The index is a capitalization-weighted aggregation of outstanding U.S. treasury, agency and supranational mortgage pass-through, and investment-grade corporate bonds meeting specified selection criteria.
The Bank of America Merrill Lynch U.S. High Yield Master II Constrained Index tracks the performance of below investment grade U.S. dollar denominated corporate bonds publicly issued in the U.S. domestic market, but limits any individual issuer to a maximum weighting of 2%.
Ultra Series Fund | Management’s Discussion of Fund Performance | December 31, 2011
Benchmark Descriptions (concluded)
The CBOE BuyWrite Monthly Index (BXM) is a benchmark index designed to track the performance of a hypothetical buy-write strategy (ie. holding a long position in and selling covered call options on that position) on the S&P 500 Index.
The Dow Jones Global Target 2020 Index is a benchmark for multi-asset class portfolios with risk profiles that become more conservative as the year 2020 approaches. The index is a composite of other indexes that represent stocks, bonds and cash.
The Dow Jones Global Target 2030 Index is a benchmark for multi-asset class portfolios with risk profiles that become more conservative as the year 2030 approaches. The index is a composite of other indexes that represent stocks, bonds and cash.
The Dow Jones Global Target 2040 Index is a benchmark for multi-asset class portfolios with risk profiles that become more conservative as the year 2040 approaches. The index is a composite of other indexes that represent stocks, bonds and cash.
The Dow Jones Global Target 2050 Index is a benchmark for multi-asset class portfolios with risk profiles that become more conservative as the year 2050 approaches. The index is a composite of other indexes that represent stocks, bonds and cash.
The MSCI EAFE (Europe, Australasia & Far East) Index is a free float-adjusted market capitalization index that is designed to measure developed market equity performance, excluding the U.S. and Canada.
The Russell 1000(R) Index is a large-cap market index which measures the performance of the 1,000 largest companies in the Russell 3000(R) Index (see definition below).
The Russell 1000(R) Growth Index is a large-cap market index which measures the performance of those Russell 1000 companies with higher price-to-book ratios and higher forecasted growth values.
The Russell 1000(R) Value Index is a large-cap market index which measures the performance of those Russell 1000 companies with lower price-to-book ratios and lower forecasted growth values.
The Russell 2000(R) Index is a small-cap market index which measures the performance of the smallest 2,000 companies in the Russell 3000(R) Index (see definition below.)
The Russell 3000(R) Index measures the performance of the 3,000 largest U.S. companies based on total market capitalization, which represents 98% of the investable U.S. equity market.
The Russell Midcap(R) Index is a mid-cap market index which measures the performance of the mid-cap segment of the U.S. equity universe.
The S&P 500 Index is a large-cap market index which measures the performance of a representative sample of 500 leading companies in leading industries in the U.S.
Ultra Series Fund | December 31, 2011
Conservative Allocation Fund Portfolio of Investments
| | | |
| INVESTMENT COMPANIES - 99.2% | | |
| Bond Funds - 64.3% | | |
| Franklin Floating Rate Daily Access Fund Advisor Class | 1,409,586 | $ 12,460,743 |
| Madison Investment Grade Corporate Bond Fund (A) | 1,205,357 | 13,584,375 |
| Madison Mosaic Institutional Bond Fund (A) | 1,756,767 | 19,587,956 |
| MEMBERS Bond Fund Class Y (A) | 3,695,022 | 39,315,033 |
| MEMBERS High Income Fund Class Y (A) | 2,807,172 | 19,285,274 |
| Metropolitan West Total Return Bond Fund | 1,158,301 | 12,011,583 |
| PIMCO Investment Grade Corporate Bond Fund Institutional Class | 1,778,720 | 18,409,755 |
| PIMCO Total Return Fund Institutional Class | 1,087,361 | |
| | | 146,474,339 |
| Foreign Bond Funds - 4.8% | | |
| Templeton Global Bond Fund Advisor Class | 893,260 | |
| Foreign Stock Funds - 7.8% | | |
| IVA Worldwide Fund | 887,677 | 13,634,715 |
| MEMBERS International Stock Fund Class Y (A) | 423,641 | |
| | | 17,667,781 |
| | | |
| Money Market Funds - 1.8% | | |
| State Street Institutional U.S. Government Money Market Fund | 4,039,780 | |
| Stock Funds - 20.5% | | |
| Calamos Growth and Income Fund Class I | 83,800 | 2,519,857 |
| Madison Mosaic Disciplined Equity Fund (A) | 881,454 | 11,176,839 |
| MEMBERS Equity Income Fund Class Y (A) | 1,388,402 | 13,425,843 |
| MEMBERS Large Cap Growth Fund Class Y (A) | 439,308 | 6,927,892 |
| MEMBERS Large Cap Value Fund Class Y (A) | 1,003,905 | |
| | | |
| TOTAL INVESTMENTS - 99.2% ( Cost $217,941,007** ) | 225,911,081 |
| NET OTHER ASSETS AND LIABILITIES - 0.8% | |
| TOTAL NET ASSETS - 100.0% | |
| ** | Aggregate cost for Federal tax purposes was $220,249,404. |
| (A) | Affiliated Company (see Note 11). |
See accompanying Notes to Financial Statements.
Ultra Series Fund | December 31, 2011
Moderate Allocation Fund Portfolio of Investments
| | | |
| INVESTMENT COMPANIES - 99.3% | | |
| Bond Funds - 39.5% | | |
| Franklin Floating Rate Daily Access Fund Advisor Class | 1,830,237 | $ 16,179,293 |
| Madison Mosaic Institutional Bond Fund (A) | 1,538,367 | 17,152,797 |
| MEMBERS Bond Fund Class Y (A) | 3,954,926 | 42,080,412 |
| MEMBERS High Income Fund Class Y (A) | 4,596,563 | 31,578,386 |
| Metropolitan West Total Return Bond Fund | 2,138,031 | 22,171,380 |
| PIMCO Investment Grade Corporate Bond Fund Institutional Class | 2,126,454 | |
| | | 151,171,066 |
| Foreign Bond Funds - 3.4% | | |
| Templeton Global Bond Fund Advisor Class | 1,052,207 | |
| Foreign Stock Funds – 11.3% | | |
| IVA Worldwide Fund | 1,477,891 | 22,700,412 |
| Matthews Asian Growth and Income Fund Institutional Shares | 116,808 | 1,759,133 |
| MEMBERS International Stock Fund Class Y (A) | 1,961,026 | |
| | | 43,128,513 |
| Money Market Funds - 2.9% | | |
| State Street Institutional U.S. Government Money Market Fund | 11,250,762 | |
| | | |
| Stock Funds – 42.2% | | |
| Calamos Growth and Income Fund Class I | 91,865 | $ 2,762,369 |
| iShares S&P Global Energy Sector Index Fund ETF | 75,663 | 2,889,570 |
| Madison Mosaic Disciplined Equity Fund (A) | 2,379,388 | 30,170,637 |
| MEMBERS Equity Income Fund Class Y (A) | 1,523,183 | 14,729,182 |
| MEMBERS Large Cap Growth Fund Class Y (A) | 1,726,326 | 27,224,158 |
| MEMBERS Large Cap Value Fund Class Y (A) | 2,645,715 | 33,283,093 |
| MEMBERS Mid Cap Fund Class Y (A) * | 1,421,439 | 9,651,572 |
| MEMBERS Small Cap Fund Class Y (A) | 794,942 | 8,497,933 |
| Yacktman Fund/The | 1,843,712 | |
| | | |
TOTAL INVESTMENTS - 99.3% ( Cost $360,257,731** ) | 380,058,050 |
NET OTHER ASSETS AND LIABILITIES - 0.7% | |
TOTAL NET ASSETS - 100.0% | |
| * | Non-income producing. |
| ** | Aggregate cost for Federal tax purposes was $367,572,556. |
| (A) | Affiliated Company (see Note 11). |
| ETF | Exchange Traded Fund. |
See accompanying Notes to Financial Statements.
Ultra Series Fund | December 31, 2011
Aggressive Allocation Fund Portfolio of Investments
| | | |
| INVESTMENT COMPANIES - 99.8% | | |
| Bond Funds - 11.7% | | |
| MEMBERS High Income Fund Class Y (A) | 1,549,510 | $ 10,645,136 |
| PIMCO Investment Grade Corporate Bond Fund Institutional Class | 489,283 | |
| | | 15,709,220 |
| Foreign Bond Funds - 0.7% | | |
| Templeton Global Bond Fund Advisor Class | 78,419 | |
| Foreign Stock Funds – 18.3% | | |
| IVA Worldwide Fund | 998,640 | 15,339,117 |
| Matthews Asian Growth and Income Fund Institutional Shares | 112,406 | 1,692,838 |
| MEMBERS International Stock Fund Class Y (A) | 797,169 | |
| | | 24,621,006 |
| Money Market Funds - 2.6% | | |
| State Street Institutional U.S. Government Money Market Fund | 3,404,031 | |
| | | |
| Stock Funds – 66.5% | | |
| Calamos Growth and Income Fund Class I | 87,112 | $ 2,619,448 |
| Hussman Strategic Growth Fund | 689,965 | 8,576,263 |
| iShares S&P Global Energy Sector Index Fund ETF | 89,186 | 3,406,013 |
| Madison Mosaic Disciplined Equity Fund (A) | 1,318,039 | 16,712,732 |
| MEMBERS Equity Income Fund Class Y (A) | 301,130 | 2,911,930 |
| MEMBERS Large Cap Growth Fund Class Y (A) | 821,449 | 12,954,247 |
| MEMBERS Large Cap Value Fund Class Y (A) | 1,238,799 | 15,584,091 |
| MEMBERS Mid Cap Fund Class Y (A) * | 903,562 | 6,135,187 |
| MEMBERS Small Cap Fund Class Y (A) | 374,420 | 4,002,554 |
| Yacktman Fund/The | 940,482 | |
| | | |
TOTAL INVESTMENTS - 99.8% ( Cost $124,682,576** ) | 134,074,608 |
| NET OTHER ASSETS AND LIABILITIES - 0.2% | |
| TOTAL NET ASSETS - 100.0% | |
| * | Non-income producing. |
| ** | Aggregate cost for Federal tax purposes was $127,520,940. |
| (A) | Affiliated Company (see Note 11). |
| ETF | Exchange Traded Fund. |
See accompanying Notes to Financial Statements.
Ultra Series Fund | December 31, 2011
Money Market Fund Portfolio of Investments
| | | |
| U.S. GOVERNMENT AND AGENCY OBLIGATIONS - 80.8% | | |
| Fannie Mae (A) - 20.7% | | |
| 0.026%, 1/3/12 | $2,300,000 | $ 2,299,997 |
| 0.040%, 1/4/12 | 1,700,000 | 1,699,994 |
| 0.040%, 1/12/12 | 214,000 | 213,998 |
| 0.015%, 2/1/12 | 455,000 | 454,994 |
| 0.024%, 2/8/12 | 1,850,000 | 1,849,954 |
| 0.010%, 2/15/12 | 295,000 | 294,996 |
| 0.050%, 2/17/12 | 225,000 | 224,985 |
| 0.030%, 2/22/12 | 450,000 | 449,981 |
| 0.007%, 2/29/12 | 4,550,000 | 4,549,948 |
| 0.015%, 3/5/12 | 900,000 | |
| | | 12,938,823 |
| Federal Home Loan Bank (A) - 28.7% | | |
| 0.080%, 1/3/12 | 100,000 | 100,000 |
| 0.025%, 1/25/12 | 600,000 | 599,990 |
| 0.030%, 2/3/12 | 2,700,000 | 2,699,926 |
| 0.012%, 2/10/12 | 1,100,000 | 1,099,985 |
| 0.023%, 2/15/12 | 250,000 | 249,993 |
| 0.030%, 2/22/12 | 500,000 | 499,978 |
| 0.010%, 2/29/12 | 950,000 | 949,984 |
| 0.011%, 3/2/12 | 2,000,000 | 1,999,964 |
| 0.015%, 3/7/12 | 1,200,000 | 1,199,967 |
| 0.025%, 3/12/12 | 600,000 | 599,970 |
| 0.020%, 3/14/12 | 2,050,000 | 2,049,917 |
| 0.024%, 3/21/12 | 3,300,000 | 3,299,826 |
| 0.015%, 3/23/12 | 1,800,000 | 1,799,939 |
| 0.025%, 3/28/12 | 850,000 | |
| | | 17,999,388 |
| Freddie Mac (A) - 22.6% | | |
| 0.028%, 1/3/12 | 2,000,000 | 1,999,997 |
| 0.030%, 1/9/12 | 3,100,000 | 3,099,979 |
| 0.050%, 1/10/12 | 52,000 | 51,999 |
| 0.001%, 1/23/12 | 300,000 | 300,000 |
| 0.010%, 1/31/12 | 300,000 | 299,998 |
| 0.005%, 2/10/12 | 1,600,000 | 1,599,991 |
| 0.030%, 2/21/12 | 1,400,000 | 1,399,940 |
| 0.010%, 2/23/12 | 1,300,000 | 1,299,981 |
| 0.021%, 3/19/12 | 2,125,000 | 2,124,905 |
| 0.020%, 3/26/12 | 2,000,000 | |
| | | 14,176,696 |
| | | |
| U.S. Treasury Bill (A) - 8.8% | | |
| 0.000%, 1/19/12 | $5,500,000 | |
Total U.S. Government and Agency Obligations ( Cost $50,614,908 ) | 50,614,908 |
| SHORT-TERM INVESTMENTS - 14.4% | | |
| Consumer Staples - 4.8% | | |
| Coca-Cola Co. (A), 0.122%, 1/13/12 | 3,000,000 | |
| Energy - 4.8% | | |
| ConocoPhillips Qatar (A), 0.152%, 1/6/12 | 3,000,000 | |
| Industrials - 4.8% | | |
| General Electric Capital Corp. (A), 0.172%, 2/13/12 | 3,000,000 | |
Total Short-Term Investments ( Cost $8,999,209 ) | 8,999,209 |
| | | |
| INVESTMENT COMPANIES - 4.9% | | |
| State Street Institutional U.S. Government Money Market Fund | 3,086,814 | |
Total Investment Companies ( Cost $3,086,814 ) | | |
TOTAL INVESTMENTS - 100.1% ( Cost $62,700,931** ) | 62,700,931 |
| NET OTHER ASSETS AND LIABILITIES - (0.1%) | |
| TOTAL NET ASSETS - 100.0% | |
| ** | Aggregate cost for Federal tax purposes was $62,700,931. |
| (A) | Rate noted represents annualized yield at time of purchase. |
See accompanying Notes to Financial Statements.
Ultra Series Fund | December 31, 2011
Bond Fund Portfolio of Investments
| | | |
| ASSET BACKED SECURITIES - 1.9% | | |
| ABSC Long Beach Home Equity Loan Trust, Series 2000-LB1, Class AF5 (A), 8.55%, 9/21/30 | $ 652,045 | $ 661,061 |
| Chase Issuance Trust, Series 2007-A17, Class A, 5.12%, 10/15/14 | 3,820,000 | 3,954,071 |
| New Century Home Equity Loan Trust, Series 2003-5, Class AI5 (B), 5.5%, 11/25/33 | 3,500,000 | |
Total Asset Backed Securities ( Cost $7,989,729 ) | | 8,093,443 |
| CORPORATE NOTES AND BONDS - 27.8% | | |
| Consumer Discretionary - 2.3% | | |
| American Association of Retired Persons (C) (D), 7.5%, 5/1/31 | 2,500,000 | 3,536,820 |
| DR Horton Inc., 5.25%, 2/15/15 | 1,140,000 | 1,154,250 |
| ERAC USA Finance LLC (C) (D), 6.7%, 6/1/34 | 4,400,000 | |
| | | 9,665,345 |
| Consumer Staples - 1.0% | | |
| PepsiCo Inc., 4.65%, 2/15/13 | 1,165,000 | 1,218,885 |
| WM Wrigley Jr. Co. (C) (D), 3.05%, 6/28/13 | 3,170,000 | |
| | | 4,446,775 |
| Energy - 2.3% | | |
| Hess Corp., 7.875%, 10/1/29 | 2,460,000 | 3,304,944 |
| Transocean Inc., 6%, 3/15/18 | 1,400,000 | 1,430,829 |
| Transocean Inc., 7.5%, 4/15/31 | 2,310,000 | 2,397,461 |
| Valero Energy Corp., 7.5%, 4/15/32 | 2,275,000 | |
| | | 9,795,105 |
| Financials - 4.5% | | |
| American General Finance Corp., 5.85%, 6/1/13 | 2,885,000 | 2,538,800 |
| Goldman Sachs Group Inc./The, 5.7%, 9/1/12 | 2,750,000 | 2,798,416 |
| HCP Inc., 6.7%, 1/30/18 | 2,725,000 | 3,029,175 |
| Lehman Brothers Holdings Inc. * (E), 5.75%, 1/3/17 | 3,135,000 | 314 |
| Simon Property Group L.P., 5.875%, 3/1/17 | 1,060,000 | 1,210,685 |
| Swiss Re Solutions Holding Corp., 7%, 2/15/26 | 1,250,000 | 1,446,618 |
| UBS AG, 5.75%, 4/25/18 | 750,000 | 777,056 |
| US Bank NA, 6.3%, 2/4/14 | 2,000,000 | 2,195,196 |
| Wells Fargo & Co., 5.25%, 10/23/12 | 2,735,000 | 2,830,936 |
| Western Union Co./The, 5.93%, 10/1/16 | 2,065,000 | |
| | | 19,153,957 |
| Health Care - 4.9% | | |
| Eli Lilly & Co., 6.57%, 1/1/16 | 2,600,000 | 3,082,453 |
| Genentech Inc., 5.25%, 7/15/35 | 1,740,000 | 2,056,600 |
| | | |
| Medco Health Solutions Inc., 7.25%, 8/15/13 | $3,450,000 | $ 3,727,456 |
| Merck & Co. Inc., 5.75%, 11/15/36 | 3,960,000 | 4,998,459 |
| Quest Diagnostics Inc., 5.45%, 11/1/15 | 3,500,000 | 3,957,866 |
| Wyeth, 6.5%, 2/1/34 | 2,370,000 | |
| | | 21,028,868 |
| Industrials - 4.4% | | |
| Boeing Co./The, 8.625%, 11/15/31 | 760,000 | 1,147,070 |
| Boeing Co./The, 6.875%, 10/15/43 | 1,380,000 | 1,935,947 |
| Burlington Northern Santa Fe LLC, 8.125%, 4/15/20 | 2,925,000 | 3,909,166 |
| EI du Pont de Nemours & Co., 5%, 1/15/13 | 195,000 | 203,404 |
| General Electric Capital Corp., MTN, 3.35%, 10/17/16 | 3,200,000 | 3,332,477 |
| Lockheed Martin Corp., 7.65%, 5/1/16 | 1,450,000 | 1,773,051 |
| Norfolk Southern Corp., 5.59%, 5/17/25 | 1,268,000 | 1,464,730 |
| Norfolk Southern Corp., 7.05%, 5/1/37 | 1,400,000 | 1,961,928 |
| Waste Management Inc., 7.125%, 12/15/17 | 2,465,000 | |
| | | 18,699,860 |
| Information Technology - 0.7% | | |
| Cisco Systems Inc., 5.5%, 2/22/16 | 2,400,000 | |
| Materials - 1.3% | | |
| Westvaco Corp., 8.2%, 1/15/30 | 2,250,000 | 2,558,149 |
| Weyerhaeuser Co., 7.375%, 3/15/32 | 3,000,000 | |
| | | 5,707,045 |
| Telecommunication Services - 1.8% | | |
| Comcast Cable Communications Holdings Inc., 9.455%, 11/15/22 | 3,080,000 | 4,388,686 |
| Rogers Communications Inc. (F), 6.25%, 6/15/13 | 3,000,000 | |
| | | 7,599,934 |
| Utilities - 4.6% | | |
| Indianapolis Power & Light Co. (C) (D), 6.05%, 10/1/36 | 3,445,000 | 4,141,255 |
| Interstate Power & Light Co., 6.25%, 7/15/39 | 2,925,000 | 3,860,883 |
| Sierra Pacific Power Co., Series M, 6%, 5/15/16 | 3,250,000 | 3,770,208 |
| Southwestern Electric Power Co., Series E, 5.55%, 1/15/17 | 2,165,000 | 2,422,272 |
| Virginia Electric and Power Co., Series C, 5.1%, 11/30/12 | 1,165,000 | 1,210,090 |
| Wisconsin Electric Power Co., 6.5%, 6/1/28 | 3,000,000 | |
| | | |
Total Corporate Notes and Bonds ( Cost $109,085,481 ) | | 118,248,786 |
See accompanying Notes to Financial Statements.
Ultra Series Fund | December 31, 2011
Bond Fund Portfolio of Investments
| | | |
| MORTGAGE BACKED SECURITIES - 20.1% | | |
| Fannie Mae - 16.8% | | |
| 4%, 4/1/15 Pool # 255719 | $ 724,979 | $ 764,955 |
| 5.5%, 4/1/16 Pool # 745444 | 1,080,164 | 1,173,776 |
| 6%, 5/1/16 Pool # 582558 | 66,712 | 72,151 |
| 5.5%, 9/1/17 Pool # 657335 | 190,947 | 207,553 |
| 5.5%, 2/1/18 Pool # 673194 | 430,361 | 467,788 |
| 5%, 5/1/20 Pool # 813965 | 1,685,195 | 1,830,171 |
| 4.5%, 9/1/20 Pool # 835465 | 1,360,966 | 1,455,558 |
| 6%, 5/1/21 Pool # 253847 | 193,841 | 213,535 |
| 7%, 12/1/29 Pool # 762813 | 118,341 | 135,559 |
| 7%, 11/1/31 Pool # 607515 | 84,556 | 98,318 |
| 6.5%, 3/1/32 Pool # 631377 | 228,892 | 261,183 |
| 7%, 4/1/32 Pool # 641518 | 4,988 | 5,782 |
| 7%, 5/1/32 Pool # 644591 | 145,174 | 168,803 |
| 6.5%, 6/1/32 Pool # 545691 | 1,489,619 | 1,691,701 |
| 5.5%, 4/1/33 Pool # 690206 | 2,385,337 | 2,607,556 |
| 5%, 10/1/33 Pool # 254903 | 2,949,911 | 3,190,156 |
| 5.5%, 11/1/33 Pool # 555880 | 2,481,961 | 2,713,182 |
| 5%, 5/1/34 Pool # 782214 | 74,361 | 80,417 |
| 5%, 6/1/34 Pool # 778891 | 747,116 | 807,962 |
| 5.5%, 6/1/34 Pool # 780384 | 2,900,406 | 3,168,795 |
| 7%, 7/1/34 Pool # 792636 | 81,393 | 93,725 |
| 5.5%, 8/1/34 Pool # 793647 | 321,032 | 353,246 |
| 5.5%, 3/1/35 Pool # 810075 | 1,513,958 | 1,653,107 |
| 5.5%, 3/1/35 Pool # 815976 | 1,626,879 | 1,780,473 |
| 5.5%, 7/1/35 Pool # 825283 | 1,786,548 | 1,955,216 |
| 5%, 8/1/35 Pool # 829670 | 2,286,374 | 2,471,865 |
| 5.5%, 8/1/35 Pool # 826872 | 813,509 | 890,312 |
| 5%, 9/1/35 Pool # 820347 | 2,234,824 | 2,470,606 |
| 5%, 9/1/35 Pool # 835699 | 2,029,012 | 2,243,081 |
| 5%, 10/1/35 Pool # 797669 | 3,277,270 | 3,606,649 |
| 5.5%, 10/1/35 Pool # 836912 | 359,880 | 392,957 |
| 5%, 11/1/35 Pool # 844809 | 1,817,750 | 1,965,223 |
| 5%, 12/1/35 Pool # 850561 | 1,828,818 | 1,977,188 |
| 5.5%, 2/1/36 Pool # 851330 | 698,360 | 764,292 |
| 5.5%, 10/1/36 Pool # 896340 | 631,641 | 691,274 |
| 5.5%, 10/1/36 Pool # 901723 | 3,198,743 | 3,489,741 |
| 6.5%, 10/1/36 Pool # 894118 | 1,852,920 | 2,085,758 |
| 6%, 11/1/36 Pool # 902510 | 2,847,616 | 3,180,532 |
| 5.5%, 2/1/37 Pool # 905140 | 2,334,808 | 2,566,547 |
| 5.5%, 5/1/37 Pool # 899323 | 1,671,306 | 1,829,094 |
| 5.5%, 5/1/37 Pool # 928292 | 1,387,114 | 1,526,307 |
| 6%, 10/1/37 Pool # 947563 | 2,571,407 | 2,872,031 |
| 5.5%, 7/1/38 Pool # 986973 | 2,487,759 | 2,731,958 |
| 5%, 8/1/38 Pool # 988934 | 3,173,198 | 3,450,965 |
| 6.5%, 8/1/38 Pool # 987711 | 3,005,869 | |
| | | 71,518,091 |
| | | |
| Freddie Mac - 3.2% | | |
| 5%, 5/1/18 Pool # E96322 | $1,071,919 | $ 1,154,421 |
| 8%, 6/1/30 Pool # C01005 | 64,464 | 77,981 |
| 7%, 3/1/31 Pool # C48129 | 224,419 | 257,635 |
| 5%, 7/1/33 Pool # A11325 | 1,991,946 | 2,180,628 |
| 6%, 10/1/34 Pool # A28439 | 469,217 | 520,627 |
| 6%, 10/1/34 Pool # A28598 | 266,206 | 295,373 |
| 5.5%, 11/1/34 Pool # A28282 | 3,606,903 | 3,977,302 |
| 5%, 4/1/35 Pool # A32314 | 431,375 | 472,236 |
| 5%, 4/1/35 Pool # A32315 | 843,119 | 927,197 |
| 5%, 4/1/35 Pool # A32316 | 956,606 | 1,052,002 |
| 5%, 4/1/35 Pool # A32509 | 277,870 | 305,580 |
| 5%, 1/1/37 Pool # A56371 | 2,256,572 | |
| | | 13,649,697 |
| Ginnie Mae - 0.1% | | |
| 8%, 10/20/15 Pool # 2995 | 41,711 | 44,972 |
| 6.5%, 2/20/29 Pool # 2714 | 158,549 | 181,355 |
| 6.5%, 4/20/31 Pool # 3068 | 118,969 | |
| | | 362,409 |
Total Mortgage Backed Securities ( Cost $77,498,413 ) | | 85,530,197 |
| U.S. GOVERNMENT AND AGENCY OBLIGATIONS - 45.5% | | |
| Fannie Mae - 1.6% | | |
| 5.250%, 8/1/12 | 2,400,000 | 2,466,374 |
| 4.625%, 10/15/14 | 3,905,000 | |
| | | 6,805,380 |
| Federal Farm Credit Bank - 1.2% | | |
| 5.875%, 10/3/16 | 4,000,000 | |
| Freddie Mac - 2.0% | | |
| 4.875%, 11/15/13 | 2,500,000 | 2,708,170 |
| 4.500%, 1/15/14 | 5,500,000 | |
| | | 8,648,016 |
| U.S. Treasury Bonds - 3.9% | | |
| 6.625%, 2/15/27 | 7,350,000 | 11,309,813 |
| 4.500%, 5/15/38 | 4,000,000 | |
| | | 16,581,061 |
| U.S. Treasury Notes - 36.8% | | |
| 1.375%, 2/15/12 | 11,400,000 | 11,417,807 |
| 4.625%, 2/29/12 | 6,425,000 | 6,470,926 |
| 1.375%, 5/15/12 | 2,625,000 | 2,637,818 |
| 4.875%, 6/30/12 | 6,000,000 | 6,141,564 |
| 3.625%, 5/15/13 | 4,000,000 | 4,185,624 |
| 3.125%, 8/31/13 | 2,710,000 | 2,839,148 |
| 4.000%, 2/15/14 | 9,500,000 | 10,245,161 |
| 4.250%, 8/15/14 | 11,200,000 | 12,337,494 |
See accompanying Notes to Financial Statements.
Ultra Series Fund | December 31, 2011
Bond Fund Portfolio of Investments
| | | |
U.S. GOVERNMENT AND AGENCY OBLIGATIONS (continued) | | |
U.S. Treasury Notes (continued) | | |
| 2.375%, 9/30/14 | $3,600,000 | $ 3,798,281 |
| 2.625%, 12/31/14 | 20,000,000 | 21,331,240 |
| 2.500%, 3/31/15 | 1,750,000 | 1,865,937 |
| 4.250%, 8/15/15 | 8,900,000 | 10,085,507 |
| 3.250%, 12/31/16 | 8,000,000 | 8,932,496 |
| 3.125%, 1/31/17 | 4,000,000 | 4,446,248 |
| 2.375%, 7/31/17 | 4,000,000 | 4,299,064 |
| 4.250%, 11/15/17 | 9,100,000 | 10,748,665 |
| 2.750%, 2/15/19 | 16,750,000 | 18,345,169 |
| 3.375%, 11/15/19 | 8,000,000 | 9,119,376 |
| 2.625%, 11/15/20 | 6,500,000 | |
| | | |
Total U.S. Government and Agency Obligations ( Cost $177,109,063 ) | | 193,135,679 |
| | | |
| INVESTMENT COMPANIES - 2.4% | | |
| State Street Institutional U.S. Government Money Market Fund | 10,208,997 | |
Total Investment Companies ( Cost $10,208,997 ) | | |
TOTAL INVESTMENTS - 97.7% ( Cost $381,891,683** ) | 415,217,102 |
| NET OTHER ASSETS AND LIABILITIES - 2.3% | |
| TOTAL NET ASSETS - 100.0% | |
| * | Non-income producing. |
| ** | Aggregate cost for Federal tax purposes was $381,928,737. |
| (A) | Stated interest rate is contingent upon sufficient collateral market value. If collateral market value falls below a stated level, the issuer will either initiate a clean-up call or increase the stated interest rate. |
| (B) | Floating rate or variable rate note. Rate shown is as of December 31, 2011. |
| (C) | Security sold within terms of a private placement memorandum exempt from registration under section 144A of the Securities Act of 1933, as amended, and may be sold only to dealers in that program or other "qualified institutional investors." |
| (D) | Illiquid security (See Note 2). |
| (E) | In default. Issuer is bankrupt. |
| (F) | Notes and bonds, issued by foreign entities, denominated in U.S. dollars. The aggregate of these securities is 0.76% of total net assets. |
See accompanying Notes to Financial Statements.
Ultra Series Fund | December 31, 2011
High Income Fund Portfolio of Investments
| | | |
| CORPORATE NOTES AND BONDS - 94.6% | | |
| Consumer Discretionary - 29.3% | | |
| Auto Components - 1.9% | | |
| American Axle & Manufacturing Inc., 7.875%, 3/1/17 | $ 750,000 | $ 742,500 |
| Tenneco Inc., 8.125%, 11/15/15 | 350,000 | 364,000 |
| Tenneco Inc., 6.875%, 12/15/20 | 625,000 | |
| | | 1,747,125 |
| Automobiles - 1.1% | | |
| Ford Motor Credit Co. LLC, 5.875%, 8/2/21 | 1,000,000 | |
| Consumer Finance - 0.1% | | |
| Ally Financial Inc. (A), 7.5%, 9/15/20 | 150,000 | |
| Hotels, Restaurants & Leisure - 4.1% | | |
| Ameristar Casinos Inc., 7.5%, 4/15/21 | 500,000 | 515,000 |
| Boyd Gaming Corp., 7.125%, 2/1/16 | 50,000 | 43,250 |
| Felcor Lodging L.P., 6.75%, 6/1/19 | 750,000 | 720,000 |
| Isle of Capri Casinos Inc., 7%, 3/1/14 | 1,000,000 | 935,000 |
| Pinnacle Entertainment Inc., 8.625%, 8/1/17 | 500,000 | 528,750 |
| Pinnacle Entertainment Inc., 8.75%, 5/15/20 | 300,000 | 294,000 |
| Scientific Games International Inc. (A), 7.875%, 6/15/16 | 750,000 | |
| | | 3,795,375 |
| Household Durables - 1.7% | | |
| Griffon Corp., 7.125%, 4/1/18 | 500,000 | 495,000 |
| Jarden Corp., 7.5%, 5/1/17 | 500,000 | 530,000 |
| Spectrum Brands Holdings Inc., 9.5%, 6/15/18 | 500,000 | |
| | | 1,571,875 |
| Media - 15.8% | | |
| Allbritton Communications Co., 8%, 5/15/18 | 950,000 | 942,875 |
| Belo Corp., 8%, 11/15/16 | 500,000 | 542,500 |
| Cablevision Systems Corp., 7.75%, 4/15/18 | 250,000 | 265,000 |
| Cablevision Systems Corp., 8%, 4/15/20 | 250,000 | 268,125 |
| CCO Holdings LLC / CCO Holdings Capital Corp. (A), 8.125%, 4/30/20 | 1,000,000 | 1,095,000 |
| CCO Holdings LLC / CCO Holdings Capital Corp., 6.5%, 4/30/21 | 750,000 | 759,375 |
| Cequel Communications Holdings I LLC and Cequel Capital Corp. (A), 8.625%, 11/15/17 | 900,000 | 954,000 |
| CSC Holdings LLC (A), 6.75%, 11/15/21 | 500,000 | 526,250 |
| Cumulus Media Inc. (A), 7.75%, 5/1/19 | 650,000 | 576,875 |
| DISH DBS Corp., 6.75%, 6/1/21 | 925,000 | 996,687 |
| EH Holding Corp. (A), 6.5%, 6/15/19 | 500,000 | 521,250 |
| EH Holding Corp. (A), 7.625%, 6/15/21 | 750,000 | 787,500 |
| Gray Television Inc., 10.5%, 6/29/15 | 700,000 | 661,500 |
| Intelsat Jackson Holdings S.A. (B), 9.5%, 6/15/16 | 100,000 | 104,500 |
| Intelsat Luxembourg S.A. (B), 11.25%, 2/4/17 | 550,000 | 532,125 |
| | | |
| Intelsat Luxembourg S.A., PIK (A) (B), 11.5%, 2/4/17 | $ 375,000 | $ 361,875 |
| Lamar Media Corp., 6.625%, 8/15/15 | 250,000 | 255,000 |
| Lamar Media Corp., Series C, 6.625%, 8/15/15 | 500,000 | 508,750 |
| LIN Television Corp., 6.5%, 5/15/13 | 574,000 | 574,718 |
| Mediacom Broadband LLC / Mediacom Broadband Corp., 8.5%, 10/15/15 | 500,000 | 515,000 |
| Nielsen Finance LLC / Nielsen Finance Co., 7.75%, 10/15/18 | 500,000 | 540,000 |
| Quebecor Media Inc. (B), 7.75%, 3/15/16 | 500,000 | 513,750 |
| Unitymedia Hessen GmbH & Co. KG / Unitymedia NRW GmbH (A) (B), 8.125%, 12/1/17 | 750,000 | 792,187 |
| Viasat Inc., 8.875%, 9/15/16 | 500,000 | 512,500 |
| XM Satellite Radio Inc. (A), 7.625%, 11/1/18 | 500,000 | |
| | | 14,632,342 |
| Specialty Retail - 2.9% | | |
| Ltd. Brands Inc., 6.9%, 7/15/17 | 250,000 | 269,375 |
| Michaels Stores Inc., 11.375%, 11/1/16 | 600,000 | 635,940 |
| Penske Automotive Group Inc., 7.75%, 12/15/16 | 1,000,000 | 1,025,000 |
| Yankee Acquisition Corp., Series B, 8.5%, 2/15/15 | 750,000 | |
| | | 2,687,815 |
| Textiles, Apparel & Luxury Goods - 1.7% | | |
| Hanesbrands Inc., 6.375%, 12/15/20 | 250,000 | 253,750 |
| Iconix Brand Group Inc. (C), 1.875%, 6/30/12 | 550,000 | 541,750 |
| Iconix Brand Group Inc. (A), 2.5%, 6/1/16 | 250,000 | 236,563 |
| Levi Strauss & Co., 7.625%, 5/15/20 | 500,000 | |
| | | 1,542,688 |
| Consumer Staples - 8.3% | | |
| ACCO Brands Corp., 10.625%, 3/15/15 | 250,000 | 278,125 |
| ACCO Brands Corp., 7.625%, 8/15/15 | 500,000 | 510,000 |
| Central Garden and Pet Co., 8.25%, 3/1/18 | 500,000 | 490,000 |
| Del Monte Corp., 7.625%, 2/15/19 | 500,000 | 480,000 |
| Dole Food Co. Inc. (A), 8%, 10/1/16 | 200,000 | 208,500 |
| Ingles Markets Inc., 8.875%, 5/15/17 | 750,000 | 811,875 |
| NBTY Inc., 9%, 10/1/18 | 1,000,000 | 1,100,000 |
| Pinnacle Foods Finance LLC / Pinnacle Foods Finance Corp. (A), 9.25%, 4/1/15 | 1,000,000 | 1,026,250 |
| Pinnacle Foods Finance LLC / Pinnacle Foods Finance Corp. (A), 8.25%, 9/1/17 | 500,000 | 520,000 |
| Sealy Mattress Co., 8.25%, 6/15/14 | 250,000 | 247,500 |
| Stater Brothers Holdings, 7.75%, 4/15/15 | 500,000 | 513,125 |
| SUPERVALU Inc., 7.5%, 11/15/14 | 500,000 | 508,750 |
| SUPERVALU Inc., 8%, 5/1/16 | 500,000 | 516,250 |
| Tops Markets LLC (A), 10.125%, 10/15/15 | 500,000 | |
| | | 7,732,875 |
See accompanying Notes to Financial Statements.
Ultra Series Fund | December 31, 2011
High Income Fund Portfolio of Investments
| | | |
| Energy - 8.4% | | |
| AmeriGas Partners L.P. / AmeriGas Finance Corp., 6.25%, 8/20/19 | $ 500,000 | $ 497,500 |
| Chaparral Energy Inc., 8.875%, 2/1/17 | 500,000 | 517,500 |
| Chaparral Energy Inc. (A), 8.25%, 9/1/21 | 500,000 | 506,250 |
| Complete Production Services Inc., 8%, 12/15/16 | 750,000 | 780,000 |
| Continental Resources Inc., 8.25%, 10/1/19 | 250,000 | 275,000 |
| Copano Energy LLC / Copano Energy Finance Corp., 7.125%, 4/1/21 | 550,000 | 555,500 |
| Exterran Holdings Inc., 7.25%, 12/1/18 | 500,000 | 475,000 |
| Ferrellgas Partners L.P. / Ferrellgas Partners Finance Corp., 8.625%, 6/15/20 | 488,000 | 472,140 |
| Helix Energy Solutions Group Inc. (A), 9.5%, 1/15/16 | 150,000 | 156,000 |
| Helix Energy Solutions Group Inc. (C), 3.25%, 12/15/25 | 750,000 | 751,875 |
| Inergy L.P. / Inergy Finance Corp., 6.875%, 8/1/21 | 366,000 | 367,830 |
| MarkWest Energy Partners L.P. / MarkWest Energy Finance Corp., 6.75%, 11/1/20 | 500,000 | 523,750 |
| Precision Drilling Corp. (A) (B), 6.5%, 12/15/21 | 350,000 | 357,000 |
| Regency Energy Partners L.P. / Regency Energy Finance Corp., 6.875%, 12/1/18 | 500,000 | 531,250 |
| Regency Energy Partners L.P. / Regency Energy Finance Corp., 6.5%, 7/15/21 | 750,000 | 780,000 |
| Unit Corp., 6.625%, 5/15/21 | 250,000 | |
| | | 7,796,595 |
| Financials - 3.7% | | |
| CIT Group Inc. (A), 7%, 5/2/16 | 600,000 | 599,250 |
| CIT Group Inc. (A), 7%, 5/2/17 | 750,000 | 749,063 |
| MPT Operating Partnership L.P. / MPT Finance Corp., 6.875%, 5/1/21 | 500,000 | 495,625 |
| Nuveen Investments Inc., 10.5%, 11/15/15 | 1,000,000 | 992,500 |
| Trans Union LLC / TransUnion Financing Corp. (A), 11.375%, 6/15/18 | 500,000 | |
| | | 3,407,688 |
| Health Care - 7.9% | | |
| AMGH Merger Sub Inc. (A), 9.25%, 11/1/18 | 830,000 | 854,900 |
| Biomet Inc., 10%, 10/15/17 | 250,000 | 270,000 |
| Biomet Inc., 11.625%, 10/15/17 | 750,000 | 813,750 |
| DaVita Inc., 6.375%, 11/1/18 | 500,000 | 511,875 |
| Endo Pharmaceuticals Holdings Inc., 7%, 12/15/20 | 500,000 | 531,250 |
| Endo Pharmaceuticals Holdings Inc., 7.25%, 1/15/22 | 500,000 | 531,875 |
| HCA Inc., 6.5%, 2/15/20 | 500,000 | 518,750 |
| HCA Inc., 7.5%, 2/15/22 | 650,000 | 664,625 |
| Hologic Inc. (C) (D), 2%, 12/15/37 | 150,000 | 143,063 |
| | | |
| Multiplan Inc. (A), 9.875%, 9/1/18 | $ 250,000 | $ 260,000 |
| Tenet Healthcare Corp., 9.25%, 2/1/15 | 150,000 | 157,687 |
| Tenet Healthcare Corp. (A), 6.25%, 11/1/18 | 250,000 | 254,375 |
| Tenet Healthcare Corp., 8%, 8/1/20 | 850,000 | 851,062 |
| Valeant Pharmaceuticals International (A), 6.75%, 10/1/17 | 1,000,000 | |
| | | 7,361,962 |
| Industrials - 14.4% | | |
| Affinion Group Inc. (E), 11.5%, 10/15/15 | 750,000 | 654,375 |
| ARAMARK Corp., 8.5%, 2/1/15 | 1,000,000 | 1,025,000 |
| ARAMARK Holdings Corp., PIK (A), 8.625%, 5/1/16 | 500,000 | 515,000 |
| Avis Budget Car Rental LLC / Avis Budget Finance Inc., 8.25%, 1/15/19 | 500,000 | 496,250 |
| Bristow Group Inc., 7.5%, 9/15/17 | 750,000 | 780,000 |
| FTI Consulting Inc., 7.75%, 10/1/16 | 750,000 | 776,250 |
| Gulfmark Offshore Inc. (D) (E), 7.75%, 7/15/14 | 255,000 | 255,000 |
| Hertz Corp./The, 8.875%, 1/1/14 | 46,000 | 46,230 |
| Hornbeck Offshore Services Inc., Series B, 6.125%, 12/1/14 | 695,000 | 699,344 |
| Mac-Gray Corp., 7.625%, 8/15/15 | 333,000 | 340,909 |
| Moog Inc., 7.25%, 6/15/18 | 500,000 | 527,500 |
| RBS Global Inc. / Rexnord LLC, 8.5%, 5/1/18 | 300,000 | 318,000 |
| RR Donnelley & Sons Co., 7.25%, 5/15/18 | 1,200,000 | 1,164,000 |
| RSC Equipment Rental Inc. / RSC Holdings III LLC, 9.5%, 12/1/14 | 730,000 | 750,075 |
| RSC Equipment Rental Inc. / RSC Holdings III LLC (A), 8.25%, 2/1/21 | 175,000 | 177,187 |
| ServiceMaster Co./The, PIK (A), 10.75%, 7/15/15 | 1,000,000 | 1,035,000 |
| Terex Corp., 8%, 11/15/17 | 500,000 | 490,000 |
| Tomkins LLC / Tomkins Inc., 9%, 10/1/18 | 900,000 | 997,875 |
| Trinity Industries Inc. (C), 3.875%, 6/1/36 | 850,000 | 830,875 |
| United Rentals North America Inc., 10.875%, 6/15/16 | 250,000 | 277,500 |
| United Rentals North America Inc., 8.375%, 9/15/20 | 150,000 | 146,250 |
| West Corp./Old, 11%, 10/15/16 | 1,000,000 | |
| | | 13,355,120 |
| Information Technology - 4.7% | | |
| Advanced Micro Devices Inc. (C), 6%, 5/1/15 | 77,000 | 75,171 |
| Advanced Micro Devices Inc., 8.125%, 12/15/17 | 550,000 | 570,625 |
| Advanced Micro Devices Inc., 7.75%, 8/1/20 | 500,000 | 513,750 |
| General Cable Corp. (C), 0.875%, 11/15/13 | 325,000 | 299,000 |
| Level 3 Financing Inc., 9.25%, 11/1/14 | 900,000 | 920,250 |
| Linear Technology Corp., Series A (C), 3%, 5/1/27 | 225,000 | 229,782 |
| SunGard Data Systems Inc., 10.25%, 8/15/15 | 700,000 | 725,375 |
See accompanying Notes to Financial Statements.
Ultra Series Fund | December 31, 2011
High Income Fund Portfolio of Investments
| | | |
CORPORATE NOTES AND BONDS (continued) | |
Information Technology (continued) | | |
| SunGard Data Systems Inc. (A), 7.375%, 11/15/18 | $ 500,000 | $ 511,875 |
| Syniverse Holdings Inc., 9.125%, 1/15/19 | 500,000 | |
| | | 4,373,328 |
| Materials - 8.2% | | |
| Alpha Natural Resources Inc., 6.25%, 6/1/21 | 1,250,000 | 1,212,500 |
| Arch Coal Inc. (A), 7.25%, 6/15/21 | 300,000 | 308,250 |
| Calcipar S.A. (A) (B), 6.875%, 5/1/18 | 500,000 | 450,000 |
| Ferro Corp., 7.875%, 8/15/18 | 500,000 | 502,500 |
| FMG Resources August 2006 Pty Ltd. (A) (B), 7%, 11/1/15 | 750,000 | 757,500 |
| Graham Packaging Co. L.P. / GPC Capital Corp. I, 9.875%, 10/15/14 | 225,000 | 228,656 |
| Graphic Packaging International Inc., 9.5%, 6/15/17 | 350,000 | 383,250 |
| Huntsman International LLC, 5.5%, 6/30/16 | 500,000 | 490,000 |
| JMC Steel Group (A), 8.25%, 3/15/18 | 1,000,000 | 975,000 |
| Owens-Brockway Glass Container Inc. (A), 3%, 6/1/15 | 50,000 | 46,500 |
| Peabody Energy Corp. (A), 6.25%, 11/15/21 | 500,000 | 517,500 |
| Polymer Group Inc. (A), 7.75%, 2/1/19 | 500,000 | 517,500 |
| Reynolds Group Holdings Ltd. (A), 8.25%, 2/15/21 | 500,000 | 442,500 |
| Reynolds Group Issuer Inc. / Reynolds Group Issuer LLC (A), 9.25%, 5/15/18 | 250,000 | 239,375 |
| Reynolds Group Issuer Inc. / Reynolds Group Issuer LLC (A), 9%, 4/15/19 | 250,000 | 237,500 |
| Sealed Air Corp. (A), 8.375%, 9/15/21 | 250,000 | |
| | | 7,584,781 |
| Telecommunication Services - 6.5% | | |
| Avaya Inc., 9.75%, 11/1/15 | 650,000 | 585,000 |
| CommScope Inc. (A), 8.25%, 1/15/19 | 500,000 | 500,000 |
| Crown Castle International Corp., 7.125%, 11/1/19 | 150,000 | 162,000 |
| Equinix Inc., 7%, 7/15/21 | 500,000 | 527,500 |
| Nextel Communications Inc., Series E, 6.875%, 10/31/13 | 1,000,000 | 995,000 |
| Qwest Communications International Inc., Series B, 7.5%, 2/15/14 | 500,000 | 501,887 |
| Qwest Communications International Inc. (D), 7.5%, 2/15/14 | 500,000 | 501,888 |
| tw telecom holdings, Inc., 8%, 3/1/18 | 500,000 | 532,500 |
| Wind Acquisition Finance S.A. (A) (B), 11.75%, 7/15/17 | 125,000 | 111,875 |
| | | |
| Windstream Corp., 7.875%, 11/1/17 | $ 250,000 | $ 270,625 |
| Windstream Corp., 7%, 3/15/19 | 250,000 | 252,500 |
| Windstream Corp., 7.75%, 10/15/20 | 1,000,000 | |
| | | 5,974,525 |
| Utilities - 3.2% | | |
| AES Corp./The, 8%, 6/1/20 | 500,000 | 550,000 |
| Calpine Corp. (A), 7.25%, 10/15/17 | 1,000,000 | 1,050,000 |
| GenOn Energy Inc., 7.875%, 6/15/17 | 400,000 | 386,000 |
| Mirant Americas Generation LLC, 8.5%, 10/1/21 | 500,000 | 466,250 |
| NRG Energy Inc. (A), 8.25%, 9/1/20 | 475,000 | |
| | | |
Total Corporate Notes and Bonds ( Cost $85,112,377 ) | | 87,687,427 |
| | | |
| PREFERRED STOCK - 0.6% | | |
| Information Technology - 0.6% | | |
| Lucent Technologies Capital Trust I (E) | 900 | |
Total Preferred Stocks ( Cost $884,250 ) | | 552,600 |
| INVESTMENT COMPANIES - 3.2% | | |
| State Street Institutional U.S. Government Money Market Fund | 2,983,122 | |
Total Investment Companies ( Cost $2,983,122 ) | | |
TOTAL INVESTMENTS - 98.4% ( Cost $88,979,749** ) | 91,223,149 |
NET OTHER ASSETS AND LIABILITIES - 1.6% | |
TOTAL NET ASSETS - 100.0% | |
| ** | Aggregate cost for Federal tax purposes was $89,148,883. |
| (A) | Security sold within terms of a private placement memorandum exempt from registration under section 144A of the Securities Act of 1933, as amended, and may be sold only to dealers in that program or other "qualified institutional investors." |
| (B) | Notes and bonds, issued by foreign entities, denominated in U.S. dollars. The aggregate of these securities is 4.30% of total net assets. |
| (C) | Convertible. |
| (D) | Floating rate or variable rate note. Rate shown is as of December 31, 2011. |
| (E) | Illiquid security (See Note 2). |
| PIK | Payment in Kind. |
See accompanying Notes to Financial Statements.
Ultra Series Fund | December 31, 2011
Diversified Income Fund Portfolio of Investments
| | | |
| COMMON STOCKS - 51.7% | | |
| Consumer Discretionary - 3.5% | | |
| McDonald’s Corp. | 35,000 | $ 3,511,550 |
| Omnicom Group Inc. | 71,500 | 3,187,470 |
| Target Corp. | 67,000 | 3,431,740 |
| Time Warner Inc. | 105,000 | |
| | | 13,925,460 |
| Consumer Staples - 7.9% | | |
| Altria Group Inc. | 91,000 | 2,698,150 |
| Coca-Cola Co./The | 46,500 | 3,253,605 |
| Diageo PLC, ADR | 30,000 | 2,622,600 |
| Kraft Foods Inc., Class A | 66,518 | 2,485,112 |
| Nestle S.A., ADR | 42,000 | 2,423,820 |
| PepsiCo Inc. | 91,000 | 6,037,850 |
| Philip Morris International Inc. | 31,000 | 2,432,880 |
| Procter & Gamble Co./The | 74,000 | 4,936,540 |
| Sysco Corp. | 82,000 | 2,405,060 |
| Wal-Mart Stores Inc. | 40,000 | |
| | | 31,686,017 |
| Energy - 5.9% | | |
| Chevron Corp. | 95,000 | 10,108,000 |
| ConocoPhillips | 128,000 | 9,327,360 |
| Ensco PLC, ADR | 92,000 | |
| | | 23,752,000 |
| Financials - 8.6% | | |
| Axis Capital Holdings Ltd. | 110,500 | 3,531,580 |
| Bank of New York Mellon Corp./The | 109,100 | 2,172,181 |
| BlackRock Inc. | 20,000 | 3,564,800 |
| M&T Bank Corp. | 36,000 | 2,748,240 |
| Northern Trust Corp. | 58,500 | 2,320,110 |
| PartnerRe Ltd. | 54,000 | 3,467,340 |
| Travelers Cos. Inc./The | 126,000 | 7,455,420 |
| US Bancorp | 177,000 | 4,787,850 |
| Wells Fargo & Co. | 167,000 | |
| | | 34,650,041 |
| Health Care - 8.2% | | |
| Johnson & Johnson | 113,000 | 7,410,540 |
| Medtronic Inc. | 130,000 | 4,972,500 |
| Merck & Co. Inc. | 222,000 | 8,369,400 |
| Novartis AG, ADR | 41,000 | 2,343,970 |
| Pfizer Inc. | 452,019 | |
| | | 32,878,101 |
| Industrials - 6.5% | | |
| 3M Co. | 66,000 | 5,394,180 |
| Boeing Co./The | 42,500 | 3,117,375 |
| Emerson Electric Co. | 48,000 | 2,236,320 |
| Illinois Tool Works Inc. | 71,000 | 3,316,410 |
| | | |
| Lockheed Martin Corp. | 45,000 | $ 3,640,500 |
| Norfolk Southern Corp. | 37,000 | 2,695,820 |
| United Parcel Service Inc., Class B | 49,000 | 3,586,310 |
| Waste Management Inc. | 72,000 | |
| | | 26,342,035 |
| Information Technology - 6.5% | | |
| Broadridge Financial Solutions Inc. | 146,000 | 3,292,300 |
| Intel Corp. | 300,000 | 7,275,000 |
| International Business Machines Corp. | 12,200 | 2,243,336 |
| Linear Technology Corp. | 90,000 | 2,702,700 |
| Microsoft Corp. | 297,000 | 7,710,120 |
| Paychex Inc. | 105,000 | |
| | | 26,385,006 |
| Materials - 0.8% | | |
| Air Products & Chemicals Inc. | 40,000 | |
| Telecommunication Service - 1.9% | | |
| AT&T Inc. | 255,015 | |
| Utilities - 1.9% | | |
| Exelon Corp. | 107,000 | 4,640,590 |
| FirstEnergy Corp. | 67,000 | |
| | | 7,608,690 |
Total Common Stocks ( Cost $180,769,219 ) | | 208,346,604 |
| | | |
| ASSET BACKED SECURITIES - 0.7% | | |
| ABSC Long Beach Home Equity Loan Trust, Series 2000-LB1, Class AF5 (A), 8.55%, 9/21/30 | $ 599,648 | 607,940 |
| Chase Issuance Trust, Series 2007-A17, Class A, 5.12%, 10/15/14 | 2,045,000 | |
Total Asset Backed Securities ( Cost $2,660,891 ) | | 2,724,714 |
| CORPORATE NOTES AND BONDS - 17.0% | | |
| Consumer Discretionary - 1.8% | | |
| American Association of Retired Persons (B) (C), 7.5%, 5/1/31 | 2,000,000 | 2,829,456 |
| DR Horton Inc., 5.25%, 2/15/15 | 515,000 | 521,438 |
| ERAC USA Finance LLC (B) (C), 6.7%, 6/1/34 | 1,850,000 | 2,091,456 |
| Royal Caribbean Cruises Ltd. (D), 7.25%, 6/15/16 | 1,600,000 | |
| | | 7,162,350 |
| Consumer Staples - 1.1% | | |
| Kraft Foods Inc., 6.5%, 11/1/31 | 2,025,000 | 2,517,486 |
| PepsiCo Inc., 4.65%, 2/15/13 | 620,000 | 648,677 |
| WM Wrigley Jr. Co. (B) (C), 3.05%, 6/28/13 | 1,310,000 | |
| | | 4,500,086 |
See accompanying Notes to Financial Statements.
Ultra Series Fund | December 31, 2011
Diversified Income Fund Portfolio of Investments
| | | |
CORPORATE NOTES AND BONDS (continued) | |
| Energy - 1.3% | | |
| ConocoPhillips, 6.65%, 7/15/18 | $1,500,000 | $ 1,870,561 |
| Hess Corp., 7.875%, 10/1/29 | 1,150,000 | 1,544,994 |
| Transocean Inc., 6%, 3/15/18 | 750,000 | 766,516 |
| Transocean Inc., 7.5%, 4/15/31 | 1,030,000 | |
| | | 5,251,069 |
| Financials - 3.3% | | |
| American General Finance Corp., 5.85%, 6/1/13 | 1,115,000 | 981,200 |
| HCP Inc., 6.7%, 1/30/18 | 1,450,000 | 1,611,855 |
| Lehman Brothers Holdings Inc. * (E), 5.75%, 1/3/17 | 1,735,000 | 173 |
| National Rural Utilities Cooperative Finance Corp., Series C, 7.25%, 3/1/12 | 1,600,000 | 1,616,824 |
| Nationwide Health Properties Inc., Series D, 8.25%, 7/1/12 | 2,400,000 | 2,446,994 |
| Simon Property Group L.P., 5.875%, 3/1/17 | 530,000 | 605,343 |
| Swiss Re Solutions Holding Corp., 7%, 2/15/26 | 1,000,000 | 1,157,294 |
| US Bank NA, 6.3%, 2/4/14 | 2,000,000 | 2,195,196 |
| Wells Fargo & Co., 5.25%, 10/23/12 | 1,450,000 | 1,500,862 |
| Western Union Co./The, 5.93%, 10/1/16 | 935,000 | |
| | | 13,169,263 |
| Health Care - 3.3% | | |
| Amgen Inc., 5.85%, 6/1/17 | 3,950,000 | 4,542,500 |
| Eli Lilly & Co., 6.57%, 1/1/16 | 1,200,000 | 1,422,671 |
| Genentech Inc., 5.25%, 7/15/35 | 740,000 | 874,646 |
| Medco Health Solutions Inc., 7.25%, 8/15/13 | 1,550,000 | 1,674,654 |
| Merck & Co. Inc., 5.75%, 11/15/36 | 1,320,000 | 1,666,153 |
| Quest Diagnostics Inc., 5.45%, 11/1/15 | 1,500,000 | 1,696,228 |
| Wyeth, 6.5%, 2/1/34 | 1,100,000 | |
| | | 13,364,885 |
| Industrials - 2.0% | | |
| Boeing Co./The, 8.625%, 11/15/31 | 350,000 | 528,256 |
| Boeing Co./The, 6.875%, 10/15/43 | 620,000 | 869,773 |
| Burlington Northern Santa Fe LLC, 8.125%, 4/15/20 | 1,365,000 | 1,824,277 |
| EI du Pont de Nemours & Co., 5%, 1/15/13 | 103,000 | 107,439 |
| Lockheed Martin Corp., 7.65%, 5/1/16 | 780,000 | 953,779 |
| Norfolk Southern Corp., 5.59%, 5/17/25 | 957,000 | 1,105,479 |
| Norfolk Southern Corp., 7.05%, 5/1/37 | 1,050,000 | 1,471,446 |
| Waste Management Inc., 7.125%, 12/15/17 | 1,150,000 | |
| | | 8,247,021 |
| Information Technology - 0.3% | | |
| Cisco Systems Inc., 5.5%, 2/22/16 | 960,000 | |
| Materials - 0.3% | | |
| Westvaco Corp., 8.2%, 1/15/30 | 1,025,000 | |
| | | |
| Telecommunication Services - 1.0% | | |
| Comcast Cable Communications Holdings Inc., 9.455%, 11/15/22 | $1,780,000 | $ 2,536,318 |
| Rogers Communications Inc. (D), 6.25%, 6/15/13 | 1,315,000 | |
| | | 3,943,915 |
| Utilities - 2.6% | | |
| Indianapolis Power & Light Co. (B) (C), 6.05%, 10/1/36 | 1,555,000 | 1,869,275 |
| Interstate Power & Light Co., 6.25%, 7/15/39 | 1,365,000 | 1,801,745 |
| Nevada Power Co., Series R, 6.75%, 7/1/37 | 1,600,000 | 2,183,734 |
| Sierra Pacific Power Co., Series M, 6%, 5/15/16 | 474,000 | 549,870 |
| Southwestern Electric Power Co., Series E, 5.55%, 1/15/17 | 835,000 | 934,225 |
| Virginia Electric and Power Co., Series C, 5.1%, 11/30/12 | 620,000 | 643,997 |
| Westar Energy Inc., 6%, 7/1/14 | 2,400,000 | |
| | | |
Total Corporate Notes and Bonds ( Cost $62,578,513 ) | | 68,535,456 |
| MORTGAGE BACKED SECURITIES - 8.8% | | |
| Fannie Mae - 7.5% | | |
| 4%, 4/1/15 Pool # 255719 | 340,366 | 359,134 |
| 5.5%, 4/1/16 Pool # 745444 | 417,437 | 453,614 |
| 6%, 5/1/16 Pool # 582558 | 122,305 | 132,276 |
| 5%, 12/1/17 Pool # 672243 | 905,628 | 978,161 |
| 4.5%, 9/1/20 Pool # 835465 | 836,659 | 894,810 |
| 6%, 5/1/21 Pool # 253847 | 164,909 | 181,664 |
| 7%, 12/1/29 Pool # 762813 | 55,420 | 63,483 |
| 7%, 11/1/31 Pool # 607515 | 84,556 | 98,318 |
| 7%, 4/1/32 Pool # 641518 | 2,671 | 3,096 |
| 7%, 5/1/32 Pool # 644591 | 79,812 | 92,802 |
| 5.5%, 10/1/33 Pool # 254904 | 789,277 | 862,806 |
| 5.5%, 11/1/33 Pool # 555880 | 2,481,961 | 2,713,182 |
| 5%, 5/1/34 Pool # 780890 | 2,789,361 | 3,016,531 |
| 7%, 7/1/34 Pool # 792636 | 38,958 | 44,860 |
| 5.5%, 8/1/34 Pool # 793647 | 310,149 | 341,272 |
| 5.5%, 3/1/35 Pool # 815976 | 1,578,433 | 1,727,454 |
| 5.5%, 7/1/35 Pool # 825283 | 742,742 | 812,864 |
| 5.5%, 8/1/35 Pool # 826872 | 356,981 | 390,683 |
| 5%, 9/1/35 Pool # 820347 | 913,383 | 1,009,749 |
| 5%, 9/1/35 Pool # 835699 | 849,320 | 938,927 |
| 5%, 10/1/35 Pool # 797669 | 1,026,615 | 1,129,794 |
| 5.5%, 10/1/35 Pool # 836912 | 786,419 | 858,699 |
| 5%, 12/1/35 Pool # 850561 | 765,043 | 827,110 |
| 5.5%, 12/1/35 Pool # 844583 | 1,875,431 | 2,052,491 |
| 5.5%, 2/1/36 Pool # 851330 | 313,661 | 343,273 |
| 5.5%, 9/1/36 Pool # 831820 | 1,770,990 | 1,972,503 |
See accompanying Notes to Financial Statements.
Ultra Series Fund | December 31, 2011
Diversified Income Fund Portfolio of Investments
| | | |
MORTGAGE BACKED SECURITIES (continued) | |
Fannie Mae (continued) | | |
| 6%, 9/1/36 Pool # 831741 | $ 645,282 | $ 713,095 |
| 5.5%, 10/1/36 Pool # 896340 | 284,195 | 311,026 |
| 5.5%, 10/1/36 Pool # 901723 | 1,199,528 | 1,308,653 |
| 5.5%, 12/1/36 Pool # 902853 | 1,574,674 | 1,729,244 |
| 5.5%, 12/1/36 Pool # 903059 | 1,415,115 | 1,565,963 |
| 5.5%, 12/1/36 Pool # 907512 | 992,052 | 1,085,712 |
| 5.5%, 12/1/36 Pool # 907635 | 1,192,801 | |
| | | 30,322,949 |
| Freddie Mac - 1.3% | | |
| 8%, 6/1/30 Pool # C01005 | 51,571 | 62,385 |
| 6.5%, 1/1/32 Pool # C62333 | 176,201 | 201,012 |
| 5%, 7/1/33 Pool # A11325 | 1,991,946 | 2,180,628 |
| 6%, 10/1/34 Pool # A28439 | 217,608 | 241,450 |
| 6%, 10/1/34 Pool # A28598 | 123,458 | 136,985 |
| 5%, 4/1/35 Pool # A32314 | 233,272 | 255,369 |
| 5%, 4/1/35 Pool # A32315 | 376,490 | 414,035 |
| 5%, 4/1/35 Pool # A32316 | 328,832 | 361,624 |
| 5%, 4/1/35 Pool # A32509 | 184,546 | 202,949 |
| 5%, 1/1/37 Pool # A56371 | 1,128,286 | |
| | | 5,270,794 |
| Ginnie Mae - 0.0% | | |
| 6.5%, 4/20/31 Pool # 3068 | 97,975 | |
Total Mortgage Backed Securities ( Cost $32,458,638 ) | | 35,705,810 |
| U.S. GOVERNMENT AND AGENCY OBLIGATIONS - 16.4% | | |
| U.S. Treasury Bond - 1.2% | | |
| 6.625%, 2/15/27 | 3,270,000 | |
| U.S. Treasury Notes - 15.2% | | |
| 1.375%, 2/15/12 | 1,125,000 | 1,126,757 |
| 4.625%, 2/29/12 | 3,400,000 | 3,424,303 |
| 1.375%, 5/15/12 | 1,312,000 | 1,318,406 |
| 4.000%, 11/15/12 | 2,500,000 | 2,583,300 |
| 1.375%, 1/15/13 | 4,000,000 | 4,049,688 |
| 3.625%, 5/15/13 | 1,980,000 | 2,071,884 |
| 3.125%, 8/31/13 | 1,175,000 | 1,230,996 |
| 4.000%, 2/15/14 | 4,810,000 | 5,187,287 |
| | | |
| 4.250%, 8/15/14 | $4,965,000 | $ 5,469,255 |
| 2.375%, 9/30/14 | 1,400,000 | 1,477,109 |
| 2.500%, 3/31/15 | 795,000 | 847,669 |
| 4.500%, 2/15/16 | 3,550,000 | 4,104,411 |
| 3.250%, 12/31/16 | 2,500,000 | 2,791,405 |
| 3.125%, 1/31/17 | 2,000,000 | 2,223,124 |
| 2.375%, 7/31/17 | 2,000,000 | 2,149,532 |
| 4.250%, 11/15/17 | 9,100,000 | 10,748,665 |
| 2.750%, 2/15/19 | 1,300,000 | 1,423,804 |
| 3.375%, 11/15/19 | 1,000,000 | 1,139,922 |
| 2.625%, 11/15/20 | 7,400,000 | |
| | | |
Total U.S. Government and Agency Obligations ( Cost $61,721,978 ) | | 66,365,789 |
| | | |
| INVESTMENT COMPANIES - 4.1% | | |
| State Street Institutional U.S. Government Money Market Fund | 16,337,132 | |
Total Investment Companies ( Cost $16,337,132 ) | | |
TOTAL INVESTMENTS - 98.7% ( Cost $356,526,371** ) | 398,015,505 |
| NET OTHER ASSETS AND LIABILITIES - 1.3% | |
| TOTAL NET ASSETS - 100.0% | |
| * | Non-income producing. |
| ** | Aggregate cost for Federal tax purposes was $357,376,060. |
| (A) | Stated interest rate is contingent upon sufficient collateral market value. If collateral market value falls below a stated level, the issuer will either initiate a clean-up call or increase the stated interest rate. |
| (B) | Security sold within terms of a private placement memorandum exempt from registration under section 144A of the Securities Act of 1933, as amended, and may be sold only to dealers in that program or other "qualified institutional investors." |
| (C) | Illiquid security (See Note 2). |
| (D) | Notes and bonds, issued by foreign entities, denominated in U.S. dollars. The aggregate of these securities is 0.8% of total net assets. |
| (E) | In default. Issuer is bankrupt. |
| ADR | American Depositary Receipt. |
| PLC | Public Limited Company. |
See accompanying Notes to Financial Statements.
Ultra Series Fund | December 31, 2011
Equity Income Fund Portfolio of Investments
| | | |
| COMMON STOCK - 92.8%*** | | |
| Consumer Discretionary - 12.9% | | |
| American Eagle Outfitters Inc. | 4,200 | $ 64,218 |
| Best Buy Co. Inc. | 1,500 | 35,055 |
| CarMax Inc.* | 2,500 | 76,200 |
| Kohl’s Corp. | 1,500 | 74,025 |
| Staples Inc. | 3,500 | 48,615 |
| Target Corp. | 1,600 | |
| | | 380,065 |
| Energy - 14.7% | | |
| Apache Corp. | 1,000 | 90,580 |
| Canadian Natural Resources Ltd. | 2,000 | 74,740 |
| Noble Corp.* | 2,000 | 60,440 |
| Petroleo Brasileiro S.A., ADR | 2,700 | 67,095 |
| Schlumberger Ltd. | 1,500 | 102,465 |
| Southwestern Energy Co.* | 1,200 | |
| | | 433,648 |
| Financials - 16.6% | | |
| Bank of New York Mellon Corp./The | 3,500 | 69,685 |
| Franklin Resources Inc. | 600 | 57,636 |
| Goldman Sachs Group Inc./The | 300 | 27,129 |
| IntercontinentalExchange Inc.* | 600 | 72,330 |
| Morgan Stanley | 2,500 | 37,825 |
| State Street Corp. | 2,200 | 88,682 |
| T Rowe Price Group Inc. | 1,200 | 68,340 |
| Wells Fargo & Co. | 2,400 | |
| | | 487,771 |
| Health Care - 17.5% | | |
| Community Health Systems Inc.* | 3,000 | 52,350 |
| Gilead Sciences Inc.* | 2,000 | 81,860 |
| Laboratory Corp. of America Holdings* | 800 | 68,776 |
| Merck & Co. Inc.c. | 1,500 | 56,550 |
| Mylan Inc./PA* | 4,000 | 85,840 |
| St Jude Medical Inc. | 1,700 | 58,310 |
| Stryker Corp. | 1,000 | 49,710 |
| Teva Pharmaceutical Industries Ltd., ADR | 1,500 | |
| | | 513,936 |
| | | |
| Industrials - 5.5% | | |
| Expeditors International of Washington Inc. | 2,000 | $ 81,920 |
| Jacobs Engineering Group Inc.* | 2,000 | |
| | | 163,080 |
| Information Technology - 22.5% | | |
| Adobe Systems Inc.* | 3,200 | 90,464 |
| Cisco Systems Inc. | 5,000 | 90,400 |
| eBay Inc.* | 3,000 | 90,990 |
| FLIR Systems Inc. | 2,500 | 62,675 |
| Google Inc., Class A* | 200 | 129,180 |
| Hewlett-Packard Co. | 1,500 | 38,640 |
| Microsoft Corp. | 3,000 | 77,880 |
| Yahoo! Inc.* | 5,000 | |
| | | 660,879 |
| Materials - 3.1% | | |
| Freeport-McMoRan Copper & Gold Inc. | 2,500 | |
Total Common Stock (Cost $3,009,856) | 2,731,354 |
| INVESTMENT COMPANIES - 2.1% | | |
| Powershares QQQ Trust Series 1 ETF | 1,100 | |
Total Investment Companies ( Cost $59,752 ) | 61,413 |
| Repurchase Agreement - 7.8% | | |
| With U.S. Bank National Association issued 12/30/11 at 0.01%, due 01/03/12, collateralized by $234,393 in Freddie Mac Gold Pool #E99837 due 10/01/18. Proceeds at maturity are $229,742 (Cost $229,741) | | |
TOTAL INVESTMENTS - 102.7% (Cost $3,299,350**) | 3,022,508 |
| NET OTHER ASSETS AND LIABILITIES - 0.4% | 10,845 |
| TOTAL CALL OPTIONS WRITTEN - (3.1%) | |
| TOTAL NET ASSETS - 100.0% | |
| * | Non-income producing |
| ** | Aggregate cost for Federal tax purposes was $3,299,350. |
| *** | All or a portion of these securities’ positions represent covers (directly or through conversion rights) for outstanding options written. |
| ADR | American Depository Receipt |
| ETF | Exchange Traded Fund |
See accompanying Notes to Financial Statements.
Ultra Series Fund | December 31, 2011
Equity Income Fund Portfolio of Investments
| | | | |
| Adobe Systems Inc. | 32 | April 2012 | $31.00 | $ 3,440 |
| American Eagle Outfitters Inc. | 42 | February 2012 | 13.00 | 10,080 |
| Apache Corp. | 10 | January 2012 | 100.00 | 415 |
| Bank of New York Mellon Corp./The | 35 | March 2012 | 22.00 | 1,593 |
| Best Buy Co. Inc. | 15 | March 2012 | 28.00 | 315 |
| Canadian Natural Resources Ltd. | 20 | June 2012 | 40.00 | 5,900 |
| CarMax Inc. | 25 | January 2012 | 30.00 | 3,000 |
| Cisco Systems Inc. | 50 | February 2012 | 19.00 | 2,400 |
| eBay Inc. | 30 | January 2012 | 33.00 | 540 |
| Expeditors International of Washington Inc. | 20 | February 2012 | 45.00 | 700 |
| Franklin Resources Inc. | 6 | January 2012 | 98.00 | 1,215 |
| Freeport-McMoRan Copper & Gold Inc. | 25 | February 2012 | 40.00 | 2,600 |
| Gilead Sciences Inc. | 20 | February 2012 | 40.00 | 4,230 |
| Google Inc. | 2 | January 2012 | 610.00 | 8,790 |
| Hewlett-Packard Co. | 15 | January 2012 | 29.00 | 83 |
| IntercontinentalExchange Inc. | 6 | January 2012 | 120.00 | 1,980 |
| Jacobs Engineering Group Inc. | 20 | April 2012 | 43.00 | 4,250 |
| Kohl’s Corp. | 15 | April 2012 | 55.00 | 1,350 |
| Laboratory Corp. of America Holdings | 8 | February 2012 | 85.00 | 3,200 |
| Merck & Co. Inc. | 15 | January 2012 | 35.00 | 4,245 |
| Microsoft Corp. | 30 | March 2012 | 26.00 | 3,030 |
| Mylan Inc./PA | 40 | April 2012 | 23.00 | 4,920 |
| Noble Corp. | 16 | January 2012 | 38.00 | 16 |
| Powershares QQQ Trust Series 1 | 11 | January 2012 | 56.00 | 1,062 |
| Schlumberger Ltd. | 15 | January 2012 | 80.00 | 75 |
| Southwestern Energy Co. | 12 | January 2012 | 42.00 | 48 |
| St Jude Medical Inc. | 17 | April 2012 | 40.00 | 1,105 |
| State Street Corp. | 22 | January 2012 | 38.00 | 6,512 |
| T Rowe Price Group Inc. | 12 | January 2012 | 55.00 | 3,510 |
| Target Corp. | 16 | January 2012 | 55.00 | 120 |
| Teva Pharmaceutical Industries Ltd. | 15 | January 2012 | 40.00 | 1,890 |
| Wells Fargo & Co. | 24 | April 2012 | 29.00 | 3,372 |
| Yahoo! Inc. | 50 | January 2012 | 16.00 | |
TOTAL CALL OPTIONS WRITTEN (Premiums received $140,153) | | | | |
See accompanying Notes to Financial Statements.
Ultra Series Fund | December 31, 2011
Large Cap Value Fund Portfolio of Investments
| | | |
| COMMON STOCKS - 96.3% | | |
| Consumer Discretionary - 5.9% | | |
| Omnicom Group Inc. | 174,000 | $ 7,756,920 |
| Target Corp. | 145,000 | 7,426,900 |
| Time Warner Inc. | 230,000 | 8,312,200 |
| TJX Cos. Inc. | 83,000 | |
| | | 28,853,670 |
| Consumer Staples - 12.2% | | |
| Diageo PLC, ADR | 71,000 | 6,206,820 |
| Kraft Foods Inc., Class A | 150,000 | 5,604,000 |
| Nestle S.A., ADR | 90,000 | 5,193,900 |
| PepsiCo Inc. | 230,000 | 15,260,500 |
| Philip Morris International Inc. | 67,000 | 5,258,160 |
| Procter & Gamble Co./The | 177,000 | 11,807,670 |
| Sysco Corp. | 180,000 | 5,279,400 |
| Wal-Mart Stores Inc. | 89,000 | |
| | | 59,929,090 |
| Energy - 13.5% | | |
| Apache Corp. | 49,000 | 4,438,420 |
| Canadian Natural Resources Ltd. | 208,000 | 7,772,960 |
| Chevron Corp. | 143,046 | 15,220,094 |
| ConocoPhillips | 163,000 | 11,877,810 |
| Ensco PLC, ADR | 110,000 | 5,161,200 |
| Noble Corp. | 197,000 | 5,953,340 |
| Occidental Petroleum Corp. | 169,500 | |
| | | 66,305,974 |
| Financials - 21.7% | | |
| Arch Capital Group Ltd. * | 214,000 | 7,967,220 |
| Bank of New York Mellon Corp./The | 500,000 | 9,955,000 |
| Berkshire Hathaway Inc., Class B * | 135,000 | 10,300,500 |
| BlackRock Inc. | 33,500 | 5,971,040 |
| Brookfield Asset Management Inc., Class A | 255,000 | 7,007,400 |
| Franklin Resources Inc. | 51,500 | 4,947,090 |
| M&T Bank Corp. | 71,500 | 5,458,310 |
| Markel Corp. * | 13,800 | 5,722,446 |
| Travelers Cos. Inc./The | 182,000 | 10,768,940 |
| US Bancorp | 570,000 | 15,418,500 |
| Wells Fargo & Co. | 610,000 | 16,811,600 |
| WR Berkley Corp. | 179,532 | |
| | | 106,502,152 |
| Health Care - 15.1% | | |
| Johnson & Johnson | 250,000 | 16,395,000 |
| Medtronic Inc. | 265,000 | 10,136,250 |
| Merck & Co. Inc. | 471,000 | 17,756,700 |
| Novartis AG, ADR | 91,000 | 5,202,470 |
| Pfizer Inc. | 1,140,000 | |
| | | 74,160,020 |
| | | |
| Industrials - 9.4% | | |
| 3M Co. | 149,500 | $ 12,218,635 |
| Boeing Co./The | 74,000 | 5,427,900 |
| Emerson Electric Co. | 108,000 | 5,031,720 |
| Illinois Tool Works Inc. | 105,000 | 4,904,550 |
| Lockheed Martin Corp. | 69,000 | 5,582,100 |
| Norfolk Southern Corp. | 74,000 | 5,391,640 |
| United Parcel Service Inc., Class B | 108,000 | |
| | | 46,461,065 |
| Information Technology - 10.6% | | |
| Broadridge Financial Solutions Inc. | 270,000 | 6,088,500 |
| Cisco Systems Inc. | 292,000 | 5,279,360 |
| Intel Corp. | 508,000 | 12,319,000 |
| International Business Machines Corp. | 28,000 | 5,148,640 |
| Microsoft Corp. | 527,000 | 13,680,920 |
| Western Union Co./The | 530,000 | |
| | | 52,194,220 |
| Materials - 1.5% | | |
| Air Products & Chemicals Inc. | 86,000 | |
| Telecommunication Service - 2.7% | | |
| AT&T Inc. | 439,987 | |
| Utilities - 3.7% | | |
| Exelon Corp. | 248,000 | 10,755,760 |
| NextEra Energy Inc. | 125,000 | |
| | | |
Total Common Stocks ( Cost $415,779,513 ) | | 473,403,498 |
| INVESTMENT COMPANIES - 3.6% | | |
| State Street Institutional U.S. Government Money Market Fund | 17,872,405 | |
Total Investment Companies ( Cost $17,872,405 ) | | |
TOTAL INVESTMENTS - 99.9% ( Cost $433,651,918** ) | 491,275,903 |
| NET OTHER ASSETS AND LIABILITIES - 0.1% | |
| TOTAL NET ASSETS - 100.0% | |
| * | Non-income producing. |
| ** | Aggregate cost for Federal tax purposes was $434,101,295. |
| ADR | American Depositary Receipt. |
| PLC | Public Limited Company. |
See accompanying Notes to Financial Statements.
Ultra Series Fund | December 31, 2011
Large Cap Growth Fund Portfolio of Investments
| | | |
| COMMON STOCKS - 97.0% | | |
| Consumer Discretionary - 13.7% | | |
| Amazon.com Inc. * | 39,782 | $ 6,886,264 |
| CarMax Inc. * | 130,558 | 3,979,408 |
| Comcast Corp., Class A | 153,742 | 3,645,223 |
| Ctrip.com International Ltd., ADR * | 175,617 | 4,109,438 |
| JC Penney Co. Inc. | 111,142 | 3,906,641 |
| Netflix Inc. * | 7,900 | 547,391 |
| Omnicom Group Inc. | 113,115 | 5,042,667 |
| Panera Bread Co., Class A * | 34,808 | 4,923,591 |
| priceline.com Inc. * | 6,728 | 3,146,753 |
| Starbucks Corp. | 114,638 | 5,274,494 |
| Yum! Brands Inc. | 127,385 | |
| | | 48,978,859 |
| Consumer Staples - 6.6% | | |
| Costco Wholesale Corp. | 77,170 | 6,429,804 |
| Diageo PLC, ADR | 57,038 | 4,986,262 |
| Mead Johnson Nutrition Co. | 11,590 | 796,581 |
| PepsiCo Inc. | 173,808 | |
| | | 23,744,808 |
| Energy - 10.8% | | |
| Apache Corp. | 36,663 | 3,320,935 |
| Ensco PLC, ADR | 125,085 | 5,868,988 |
| Occidental Petroleum Corp. | 98,821 | 9,259,528 |
| Petroleo Brasileiro S.A., ADR | 287,772 | 7,151,134 |
| Schlumberger Ltd. | 193,452 | |
| | | 38,815,291 |
| Financials - 6.4% | | |
| Brookfield Asset Management Inc., Class A | 246,692 | 6,779,096 |
| IntercontinentalExchange Inc. * | 83,717 | 10,092,085 |
| T Rowe Price Group Inc. | 106,694 | |
| | | 22,947,404 |
| Health Care - 6.2% | | |
| Allergan Inc. | 41,188 | 3,613,835 |
| Allscripts Healthcare Solutions Inc. * | 338,338 | 6,408,122 |
| CareFusion Corp. * | 74,567 | 1,894,748 |
| Celgene Corp. * | 87,335 | 5,903,846 |
| Cerner Corp. * | 70,437 | |
| | | 22,134,817 |
| Industrials - 10.6% | | |
| Boeing Co./The | 162,667 | 11,931,624 |
| Emerson Electric Co. | 122,854 | 5,723,768 |
| Expeditors International of Washington Inc. | 52,502 | 2,150,482 |
| Roper Industries Inc. | 117,798 | 10,233,112 |
| | | |
| Sensata Technologies Holding N.V. * | 56,622 | $ 1,488,026 |
| United Parcel Service Inc., Class B | 91,366 | |
| | | 38,214,090 |
| Information Technology - 37.7% | | |
| Communications Equipment - 5.7% | | |
| Acme Packet Inc. * | 189,256 | $ 5,849,903 |
| QUALCOMM Inc. | 197,975 | 10,829,232 |
| Riverbed Technology Inc. * | 167,476 | |
| | | 20,614,821 |
| Computers & Peripherals - 10.6% | | |
| Apple Inc. * | 52,534 | 21,276,270 |
| EMC Corp. * | 162,670 | 3,503,912 |
| SanDisk Corp. * | 268,418 | |
| | | 37,989,031 |
| Electronic Equipment, Instruments & Components - 0.5% | | |
| FLIR Systems Inc. * | 71,616 | |
| Internet Software & Services - 7.9% | | |
| Google Inc., Class A * | 39,715 | 25,651,919 |
| OpenTable Inc. * | 68,040 | |
| | | 28,314,324 |
| IT Services - 9.2% | | |
| Accenture PLC, Class A | 148,632 | 7,911,681 |
| Sapient Corp. * | 524,345 | 6,606,747 |
| Visa Inc., Class A | 180,550 | |
| | | 32,849,670 |
| Semiconductors & Semiconductor Equipment - 1.8% | | |
| Cavium Inc. * | 165,649 | 4,709,401 |
| Cree Inc. * | 86,348 | |
| | | 6,612,511 |
| Software - 2.0% | | |
| Ariba Inc. * | 27,892 | 783,207 |
| MICROS Systems Inc. * | 41,884 | 1,950,957 |
| Oracle Corp. | 170,721 | |
| | | 7,113,158 |
| Materials - 5.0% | | |
| Ecolab Inc. | 136,067 | 7,866,033 |
| International Flavors & Fragrances Inc. | 106,860 | 5,601,601 |
| Molycorp Inc. * | 181,258 | |
| | | |
Total Common Stocks ( Cost $308,276,616 ) | | 347,938,398 |
See accompanying Notes to Financial Statements.
Ultra Series Fund | December 31, 2011
Large Cap Growth Fund Portfolio of Investments
| | | |
| INVESTMENT COMPANIES - 3.0% | | |
| State Street Institutional U.S. Government Money Market Fund | 10,689,273 | |
Total Investment Companies ( Cost $10,689,273 ) | | |
TOTAL INVESTMENTS - 100.0% ( Cost $318,965,889** ) | 358,627,671 |
| NET OTHER ASSETS AND LIABILITIES - 0.0% | |
| TOTAL NET ASSETS - 100.0% | |
| * | Non-income producing. |
| ** | Aggregate cost for Federal tax purposes was $320,753,302. |
| ADR | American Depositary Receipt. |
| PLC | Public Limited Company. |
See accompanying Notes to Financial Statements.
Ultra Series Fund | December 31, 2011
Mid Cap Fund Portfolio of Investments
| | | |
| COMMON STOCKS - 94.8% | | |
| Consumer Discretionary - 19.1% | | |
| Bed Bath & Beyond Inc. * | 150,257 | $ 8,710,398 |
| CarMax Inc. * | 405,454 | 12,358,238 |
| Discovery Communications Inc., Class C * | 209,449 | 7,896,227 |
| Liberty Global Inc., Series C * | 191,062 | 7,550,770 |
| Omnicom Group Inc. | 222,024 | 9,897,830 |
| Staples Inc. | 567,202 | 7,878,436 |
| TJX Cos. Inc. | 236,118 | |
| | | 69,533,316 |
| Consumer Staples - 4.1% | | |
| Brown-Forman Corp., Class B | 91,151 | 7,338,567 |
| McCormick & Co. Inc. | 149,173 | |
| | | 14,859,870 |
| Energy - 5.8% | | |
| Ensco PLC, ADR | 116,216 | 5,452,855 |
| EOG Resources Inc. | 85,644 | 8,436,790 |
| Noble Corp. | 244,790 | |
| | | 21,287,199 |
| Financials - 25.2% | | |
| Capital Markets - 1.8% | | |
| T Rowe Price Group Inc. | 117,517 | |
| Commercial Banks - 3.8% | | |
| Glacier Bancorp Inc. | 428,654 | 5,156,708 |
| M&T Bank Corp. | 115,225 | |
| | | 13,952,984 |
| Diversified Financial Services - 2.2% | | |
| Leucadia National Corp. | 350,382 | |
| Insurance - 13.0% | | |
| Arch Capital Group Ltd. * | 259,317 | 9,654,372 |
| Brown & Brown Inc. | 329,047 | 7,446,334 |
| Markel Corp. * | 40,979 | 16,992,762 |
| WR Berkley Corp. | 391,578 | |
| | | 47,559,835 |
Real Estate Management & Development - 4.4% | | |
| Brookfield Asset Management Inc., Class A | 581,215 | |
| Health Care - 9.1% | | |
| DENTSPLY International Inc. | 338,023 | 11,827,425 |
| Laboratory Corp. of America Holdings * | 131,610 | 11,314,511 |
| Techne Corp. | 146,180 | |
| | | 33,120,183 |
| | | |
| Industrials - 14.3% | | |
| Copart Inc. * | 258,884 | $ 12,397,955 |
| IDEX Corp. | 284,295 | 10,550,187 |
| Jacobs Engineering Group Inc. * | 265,475 | 10,772,976 |
| Ritchie Bros Auctioneers Inc. | 384,856 | 8,497,620 |
| Wabtec Corp. | 141,584 | |
| | | 52,122,539 |
| Information Technology - 9.9% | | |
| Amphenol Corp., Class A | 124,889 | 5,668,712 |
| Broadridge Financial Solutions Inc. | 469,850 | 10,595,117 |
| FLIR Systems Inc. * | 387,427 | 9,712,795 |
| Western Union Co./The | 559,614 | |
| | | 36,195,176 |
| Materials - 7.3% | | |
| Ecolab Inc. | 236,161 | 13,652,467 |
| Valspar Corp. | 336,286 | |
| | | |
Total Common Stocks ( Cost $306,078,023 ) | | 346,020,703 |
| INVESTMENT COMPANIES - 5.2% | | |
| State Street Institutional U.S. Government Money Market Fund | 18,972,961 | |
Total Investment Companies ( Cost $18,972,961 ) | | |
TOTAL INVESTMENTS - 100.0% ( Cost $325,050,984** ) | 364,993,664 |
| NET OTHER ASSETS AND LIABILITIES - 0.0% | |
| TOTAL NET ASSETS - 100.0% | |
| * | Non-income producing. |
| ** | Aggregate cost for Federal tax purposes was $325,254,380. |
| ADR | American Depositary Receipt. |
| PLC | Public Limited Company. |
See accompanying Notes to Financial Statements.
Ultra Series Fund | December 31, 2011
Small Cap Fund Portfolio of Investments
| | | |
| COMMON STOCKS - 95.4% | | |
| Consumer Discretionary - 14.8% | | |
| Arbitron Inc. | 7,340 | $ 252,570 |
| Ascena Retail Group Inc. * | 5,760 | 171,187 |
| Cato Corp./The, Class A | 10,240 | 247,808 |
| CEC Entertainment Inc. * | 3,720 | 128,154 |
| Choice Hotels International Inc. | 3,720 | 141,546 |
| Fred’s Inc., Class A | 12,300 | 179,334 |
| Helen of Troy Ltd. * | 7,110 | 218,277 |
| Matthews International Corp., Class A | 4,640 | 145,835 |
| Skechers U.S.A. Inc., Class A * | 5,700 | 69,084 |
| Sonic Corp. * | 14,040 | 94,489 |
| Stage Stores Inc. | 16,810 | |
| | | 1,881,775 |
| Consumer Staples - 1.6% | | |
| Casey’s General Stores Inc. | 3,880 | |
| Energy - 3.8% | | |
| Bristow Group Inc. * | 2,500 | 118,475 |
| Georesources Inc. * | 3,900 | 114,309 |
| Penn Virginia Corp. | 7,970 | 42,161 |
| Scorpio Tankers Inc. * | 12,400 | 60,636 |
| SEACOR Holdings Inc. * | 1,600 | |
| | | 477,917 |
| Financials - 24.6% | | |
| Alleghany Corp. * | 541 | 154,342 |
| AMERISAFE Inc. * | 5,570 | 129,503 |
| Ares Capital Corp. | 14,563 | 224,998 |
| Assured Guaranty Ltd. | 6,700 | 88,038 |
| Campus Crest Communities Inc., REIT | 10,500 | 105,630 |
| Delphi Financial Group Inc., Class A | 8,770 | 388,511 |
| DiamondRock Hospitality Co., REIT * | 13,029 | 125,600 |
| Education Realty Trust Inc., REIT | 10,710 | 109,563 |
| First Busey Corp. | 18,907 | 94,535 |
| First Midwest Bancorp Inc. | 15,230 | 154,280 |
| First Niagara Financial Group Inc. | 11,407 | 98,442 |
| Flushing Financial Corp. | 7,000 | 88,410 |
| Hancock Holding Co. | 3,600 | 115,092 |
| International Bancshares Corp. | 11,550 | 211,769 |
| Mack-Cali Realty Corp., REIT | 3,700 | 98,753 |
| MB Financial Inc. | 6,530 | 111,663 |
| Northwest Bancshares Inc. | 16,980 | 211,231 |
| Platinum Underwriters Holdings Ltd. | 4,560 | 155,542 |
| Primerica Inc. | 7,300 | 169,652 |
| | | |
| Webster Financial Corp. | 11,480 | $ 234,077 |
| Westamerica Bancorporation | 1,170 | |
| | | 3,120,994 |
| Health Care - 8.6% | | |
| Amsurg Corp. * | 7,490 | 195,040 |
| Charles River Laboratories International Inc. * | 8,600 | 235,038 |
| Corvel Corp. * | 2,830 | 146,339 |
| Haemonetics Corp. * | 1,200 | 73,464 |
| ICON PLC, ADR * | 13,830 | 236,631 |
| ICU Medical Inc. * | 4,470 | |
| | | 1,087,662 |
| Industrials - 23.9% | | |
| ACCO Brands Corp. * | 20,440 | 197,246 |
| Acuity Brands Inc. | 1,910 | 101,230 |
| Albany International Corp., Class A | 9,650 | 223,108 |
| Belden Inc. | 9,830 | 327,143 |
| Carlisle Cos. Inc. | 9,050 | 400,915 |
| ESCO Technologies Inc. | 5,990 | 172,392 |
| G&K Services Inc., Class A | 4,300 | 125,173 |
| GATX Corp. | 5,570 | 243,186 |
| Genesee & Wyoming Inc., Class A * | 4,100 | 248,378 |
| Kirby Corp. * | 3,430 | 225,831 |
| Mueller Industries Inc. | 6,500 | 249,730 |
| Standard Parking Corp. * | 5,690 | 101,680 |
| Sterling Construction Co. Inc. * | 3,490 | 37,587 |
| Unifirst Corp. | 1,170 | 66,386 |
| United Stationers Inc. * | 9,260 | |
| | | 3,021,491 |
| Information Technology - 7.7% | | |
| Coherent Inc. * | 2,270 | 118,653 |
| Diebold Inc. | 5,570 | 167,490 |
| MAXIMUS Inc. | 6,380 | 263,813 |
| MTS Systems Corp. | 3,830 | 156,072 |
| Websense Inc. * | 6,700 | 125,491 |
| Zebra Technologies Corp., Class A * | 4,100 | |
| | | 978,217 |
| Materials - 5.6% | | |
| Aptargroup Inc. | 3,820 | 199,290 |
| Deltic Timber Corp. | 2,580 | 155,806 |
| Greif Inc., Class A | 1,600 | 72,880 |
| Koppers Holdings Inc. | 3,200 | 109,952 |
| Zep Inc. | 12,140 | |
| | | 707,645 |
See accompanying Notes to Financial Statements.
Ultra Series Fund | December 31, 2011
Small Cap Fund Portfolio of Investments
| | | |
COMMON STOCKS (continued) | | |
| Utilities - 4.8% | | |
| Atmos Energy Corp. | 4,050 | $ 135,068 |
| New Jersey Resources Corp. | 1,570 | 77,244 |
| Unisource Energy Corp. | 4,440 | 163,925 |
| Westar Energy Inc. | 4,990 | 143,612 |
| WGL Holdings Inc. | 2,060 | |
| | | |
Total Common Stocks ( Cost $9,916,109 ) | | 12,086,502 |
| INVESTMENT COMPANIES - 4.8% | | |
| State Street Institutional U.S. Government Money Market Fund | 603,117 | |
Total Investment Companies ( Cost $603,117 ) | | |
TOTAL INVESTMENTS - 100.2% ( Cost $10,519,226** ) | 12,689,619 |
| NET OTHER ASSETS AND LIABILITIES - (0.2%) | |
| TOTAL NET ASSETS - 100.0% | |
| * | Non-income producing. |
| ** | Aggregate cost for Federal tax purposes was $10,623,993. |
| ADR | American Depository Receipt. |
| PLC | Public Limited Company. |
| REIT | Real Estate Investment Trust. |
See accompanying Notes to Financial Statements.
Ultra Series Fund | December 31, 2011
International Stock Fund Portfolio of Investments
| | | |
| COMMON STOCKS - 95.7% | | |
| Australia - 4.7% | | |
| James Hardie Industries SE | 173,980 | $ 1,213,597 |
| QBE Insurance Group Ltd. | 59,330 | 785,841 |
| Telstra Corp. Ltd. | 634,700 | |
| | | 4,161,179 |
| Belgium - 3.0% | | |
| Anheuser-Busch InBev N.V. | 43,800 | |
| Brazil - 2.8% | | |
| Banco do Brasil S.A. | 78,770 | 1,000,857 |
| Cielo S.A. | 34,140 | 882,213 |
| MRV Engenharia e Participacoes S.A. | 96,200 | |
| | | 2,434,921 |
| Canada - 1.8% | | |
| Potash Corp. of Saskatchewan Inc. | 16,600 | 686,160 |
| Rogers Communications Inc. | 22,700 | |
| | | 1,560,737 |
| China - 0.9% | | |
| Weichai Power Co. Ltd. | 155,000 | |
| Denmark - 0.4% | | |
| AP Moeller - Maersk AS | 48 | |
| Finland - 1.2% | | |
| Sampo OYJ | 42,080 | |
| France - 10.2% | | |
| AXA S.A. | 41,040 | 533,551 |
| BNP Paribas | 24,245 | 952,356 |
| Danone | 12,000 | 754,341 |
| Sanofi-Aventis S.A. | 35,912 | 2,637,690 |
| Technip S.A. | 12,730 | 1,196,473 |
| Total S.A. | 34,187 | 1,747,738 |
| Valeo S.A. | 29,900 | |
| | | 9,010,567 |
| Germany - 6.7% | | |
| Bayerische Motoren Werke AG | 21,990 | 1,473,119 |
| GEA Group AG | 14,100 | 398,739 |
| Merck KGaA | 13,400 | 1,335,928 |
| SAP AG | 24,210 | 1,279,986 |
| Siemens AG | 14,619 | |
| | | 5,886,764 |
| Ireland - 1.0% | | |
| Ryanair Holdings PLC, ADR * | 32,500 | |
| Italy - 0.8% | | |
| Atlantia SpA | 43,293 | |
| | | |
| Japan - 14.9% | | |
| Asics Corp. | 42,790 | $ 482,548 |
| Canon Inc. | 31,200 | 1,382,253 |
| Daito Trust Construction Co. Ltd. | 22,010 | 1,887,307 |
| Don Quijote Co. Ltd. | 42,400 | 1,454,832 |
| FANUC Corp. | 8,500 | 1,300,896 |
| JS Group Corp. | 52,100 | 998,409 |
| Mitsubishi Corp. | 61,700 | 1,246,505 |
| Sumitomo Mitsui Financial Group Inc. | 49,400 | 1,376,037 |
| Yahoo! Japan Corp. | 4,477 | 1,441,923 |
| Yamada Denki Co. Ltd. | 22,610 | |
| | | 13,109,964 |
| Netherlands - 1.4% | | |
| ING Groep N.V. * | 175,870 | |
| New Zealand - 0.7% | | |
| Telecom Corp. of New Zealand Ltd. | 392,700 | |
| Russia - 1.3% | | |
| Sberbank of Russia | 511,700 | |
| South Africa - 0.7% | | |
| Mr Price Group Ltd., ADR * | 33,500 | |
| South Korea - 2.3% | | |
| Hyundai Mobis * | 2,930 | 742,674 |
| Samsung Electronics Co. Ltd., GDR | 2,843 | |
| | | 2,052,444 |
| Spain - 1.8% | | |
| Amadeus IT Holding S.A. | 63,200 | 1,025,320 |
| Mediaset Espana Comunicacion S.A. | 100,293 | |
| | | 1,597,757 |
| Sweden - 2.4% | | |
| Assa Abloy AB | 44,800 | 1,123,572 |
| Swedbank AB | 76,600 | |
| | | 2,115,848 |
| Switzerland - 5.3% | | |
| Julius Baer Group Ltd. * | 34,610 | 1,353,744 |
| Novartis AG | 58,367 | |
| | | 4,690,599 |
| Turkey - 1.0% | | |
| KOC Holding AS | 121,200 | 363,520 |
| Turkiye Garanti Bankasi AS, ADR | 159,600 | |
| | | 859,876 |
See accompanying Notes to Financial Statements.
Ultra Series Fund | December 31, 2011
International Stock Fund Portfolio of Investments
| | | |
COMMON STOCKS (continued) | | |
| United Kingdom - 30.4% | | |
| BG Group PLC | 52,700 | $ 1,126,570 |
| BHP Billiton PLC | 60,600 | 1,766,949 |
| British American Tobacco PLC | 41,231 | 1,956,490 |
| British Sky Broadcasting Group PLC | 56,700 | 645,004 |
| GlaxoSmithKline PLC | 119,500 | 2,730,861 |
| Informa PLC | 245,443 | 1,377,178 |
| International Power PLC | 175,600 | 919,567 |
| Petrofac Ltd. | 26,850 | 600,869 |
| Prudential PLC | 172,200 | 1,707,519 |
| Rexam PLC | 260,130 | 1,425,248 |
| Royal Dutch Shell PLC | 71,570 | 2,635,324 |
| Standard Chartered PLC | 72,157 | 1,578,923 |
| Tullow Oil PLC | 38,550 | 839,351 |
| Unilever PLC | 77,630 | 2,607,700 |
| Vodafone Group PLC | 379,599 | 1,054,646 |
| WM Morrison Supermarkets PLC | 202,070 | 1,023,664 |
| WPP PLC | 101,000 | 1,059,542 |
| Xstrata PLC | 116,540 | |
| | | |
Total Common Stocks ( Cost $79,699,873 ) | | 84,422,578 |
| INVESTMENT COMPANIES - 2.8% | | |
| United States - 2.8% | | |
| State Street Institutional U.S. Government Money Market Fund | 2,429,115 | |
Total Investment Companies ( Cost $2,429,115 ) | | |
TOTAL INVESTMENTS - 98.5% ( Cost $82,128,988** ) | 86,851,693 |
| NET OTHER ASSETS AND LIABILITIES - 1.5% | |
| TOTAL NET ASSETS - 100.0% | |
| * | Non-income producing. |
| ** | Aggregate cost for Federal tax purposes was $83,260,789. |
| ADR | American Depositary Receipt. |
| GDR | Global Depositary Receipt. |
| PLC | Public Limited Company. |
OTHER INFORMATION: Sector Concentration | |
| Consumer Discretionary | 13% |
| Consumer Staples | 10% |
| Energy | 9% |
| Financials | 18% |
| Health Care | 12% |
| Industrials | 11% |
| Information Technology | 8% |
| Materials | 8% |
| Money Market Funds | 3% |
| Telecommunication Services | 5% |
| Utilities | 1% |
| Net Other Assets and Liabilities | |
| | 100% |
See accompanying Notes to Financial Statements.
Ultra Series Fund | December 31, 2011
Madison Target Retirement 2020 Fund Portfolio of Investments
| | | |
| INVESTMENT COMPANIES - 99.6% | | |
| Bond Funds - 46.4% | | |
| Franklin Floating Rate Daily Access Fund Advisor Class | 221,612 | $ 1,959,051 |
| Metropolitan West High Yield Bond Fund Class I | 311,179 | 3,055,774 |
| PIMCO Investment Grade Corporate Bond Fund Institutional Class | 225,266 | 2,331,506 |
| Vanguard Total Bond Market ETF | 132,038 | |
| | | 18,376,785 |
| Foreign Bond Funds - 3.0% | | |
| Templeton Global Bond Fund Advisor Class | 94,457 | |
| Foreign Stock Funds – 9.2% | | |
| IVA Worldwide Fund | 139,102 | 2,136,607 |
| Vanguard FTSE All-World ex-U.S. ETF | 37,367 | |
| | | 3,618,209 |
| Money Market Funds - 2.7% | | |
| State Street Institutional U.S. Government Money Market Fund | 1,082,804 | |
| | | |
| Stock Funds – 38.3% | | |
| Hussman Strategic Growth Fund | 123,779 | $ 1,538,572 |
| iShares S&P Global Energy Sector Index Fund ETF | 10,234 | 390,836 |
| iShares S&P MidCap 400 Index Fund ETF | 6,205 | 543,620 |
| Schwab Fundamental U.S. Large Company Index Fund | 82,393 | 777,790 |
| SPDR S&P 500 ETF Trust | 37,406 | 4,694,453 |
| Vanguard Dividend Appreciation ETF | 107,644 | 5,881,668 |
| Vanguard Health Care ETF | 9,888 | 605,245 |
| Vanguard Information Technology ETF | 12,060 | |
| | | |
TOTAL INVESTMENTS - 99.6% ( Cost $39,798,912** ) | 39,418,537 |
| NET OTHER ASSETS AND LIABILITIES - 0.4% | |
| TOTAL NET ASSETS - 100.0% | |
| ** | Aggregate cost for Federal tax purposes was $39,954,518. |
| ETF | Exchange Traded Fund. |
See accompanying Notes to Financial Statements.
Ultra Series Fund | December 31, 2011
Madison Target Retirement 2030 Fund Portfolio of Investments
| | | |
| INVESTMENT COMPANIES - 99.7% | | |
| Bond Funds - 33.8% | | |
| Franklin Floating Rate Daily Access Fund Advisor Class | 201,950 | $ 1,785,241 |
| Metropolitan West High Yield Bond Fund Class I | 323,781 | 3,179,529 |
| PIMCO Investment Grade Corporate Bond Fund Institutional Class | 219,272 | 2,269,468 |
| Vanguard Total Bond Market ETF | 97,253 | |
| | | 15,358,754 |
| Foreign Bond Funds - 2.1% | | |
| Templeton Global Bond Fund Advisor Class | 75,192 | |
| Foreign Stock Funds – 10.8% | | |
| iShares MSCI Canada Index Fund ETF | 23,602 | 627,813 |
| IVA Worldwide Fund Class I | 163,470 | 2,510,897 |
| Vanguard FTSE All-World ex-U.S. ETF | 44,730 | |
| | | 4,912,255 |
| Money Market Funds – 3.0% | | |
| State Street Institutional U.S. Government Money Market Fund | 1,334,384 | |
| | | |
| Stock Funds – 50.0% | | |
| Hussman Strategic Growth Fund | 137,037 | $ 1,703,371 |
| iShares S&P Global Energy Sector Index Fund ETF | 17,749 | 677,834 |
| iShares S&P MidCap 400 Index Fund ETF | 10,585 | 927,352 |
| Schwab Fundamental U.S. Large Company Index Fund | 182,711 | 1,724,792 |
| SPDR S&P 500 ETF Trust | 60,776 | 7,627,388 |
| Vanguard Dividend Appreciation ETF | 154,841 | 8,460,512 |
| Vanguard Health Care ETF | 12,695 | 777,061 |
| Vanguard Information Technology ETF | 13,353 | |
| | | |
TOTAL INVESTMENTS - 99.7% ( Cost $45,869,059** ) | 45,253,302 |
| NET OTHER ASSETS AND LIABILITIES - 0.3% | |
| TOTAL NET ASSETS - 100.0% | |
| ** | Aggregate cost for Federal tax purposes was $46,060,669. |
| ETF | Exchange Traded Fund. |
See accompanying Notes to Financial Statements.
Ultra Series Fund | December 31, 2011
Madison Target Retirement 2040 Fund Portfolio of Investments
| | | |
| INVESTMENT COMPANIES - 100.0% | | |
| Bond Funds - 25.0% | | |
| Franklin Floating Rate Daily Access Fund Advisor Class | 126,045 | $ 1,114,240 |
| Metropolitan West High Yield Bond Fund Class I | 178,836 | 1,756,172 |
| PIMCO Investment Grade Corporate Bond Fund Institutional Class | 125,545 | 1,299,390 |
| Vanguard Total Bond Market ETF | 55,171 | |
| | | 8,778,787 |
| Foreign Bond Funds - 0.4% | | |
| Templeton Global Bond Fund Advisor Class | 12,592 | |
| Foreign Stock Funds - 12.7% | | |
| iShares MSCI Canada Index Fund ETF | 25,079 | 667,101 |
| IVA Worldwide Fund Class I | 157,110 | 2,413,204 |
| Vanguard FTSE All-World ex-U.S. ETF | 35,132 | |
| | | 4,473,289 |
| Money Market Funds - 2.7% | | |
| State Street Institutional U.S. Government Money Market Fund | 936,553 | |
| | | |
| Stock Funds - 59.2% | | |
| Hussman Strategic Growth Fund | 109,328 | $ 1,358,949 |
| iShares S&P Global Energy Sector Index Fund ETF | 18,331 | 700,061 |
| iShares S&P MidCap 400 Index Fund ETF | 9,230 | 808,640 |
| iShares S&P SmallCap 600 Index Fund ETF | 2,253 | 153,835 |
| Schwab Fundamental U.S. Large Company Index Fund | 211,246 | 1,994,167 |
| SPDR S&P 500 ETF Trust | 53,575 | 6,723,662 |
| Vanguard Dividend Appreciation ETF | 134,306 | 7,338,480 |
| Vanguard Health Care ETF | 15,247 | 933,269 |
| Vanguard Information Technology ETF | 13,199 | |
| | | |
TOTAL INVESTMENTS - 100.0% ( Cost $35,763,274** ) | 35,165,472 |
| NET OTHER ASSETS AND LIABILITIES - 0.0% | |
| TOTAL NET ASSETS - 100.0% | |
| ** | Aggregate cost for Federal tax purposes was $35,909,904. |
| ETF | Exchange Traded Fund. |
See accompanying Notes to Financial Statements.
Ultra Series Fund | December 31, 2011
Madison Target Retirement 2050 Fund Portfolio of Investments
| | | |
| INVESTMENT COMPANIES - 99.8% | | |
| Bond Funds - 15.4% | | |
| Metropolitan West High Yield Bond Fund Class I | 12,784 | $ 125,538 |
| PIMCO Investment Grade Corporate Bond Fund Institutional Class | 7,169 | 74,196 |
| Vanguard Total Bond Market ETF | 1,721 | |
| | | 343,507 |
| Foreign Stock Funds – 14.5% | | |
| iShares MSCI Canada Index Fund ETF | 1,559 | 41,469 |
| IVA Worldwide Fund Class I | 12,448 | 191,199 |
| Vanguard FTSE All-World ex-U.S. ETF | 2,293 | |
| | | 323,586 |
| Money Market Funds - 3.2% | | |
| State Street Institutional U.S. Government Money Market Fund | 71,853 | |
| | | |
| Stock Funds – 66.7% | | |
| Hussman Strategic Growth Fund | 6,832 | $ 84,923 |
| iShares S&P Global Energy Sector Index Fund ETF | 1,449 | 55,337 |
| iShares S&P MidCap 400 Index Fund ETF | 748 | 65,532 |
| iShares S&P SmallCap 600 Index Fund ETF | 194 | 13,246 |
| Schwab Fundamental U.S. Large Company Index Fund | 14,017 | 132,324 |
| SPDR S&P 500 ETF Trust | 3,845 | 482,548 |
| Vanguard Dividend Appreciation ETF | 9,664 | 528,041 |
| Vanguard Health Care ETF | 1,055 | 64,577 |
| Vanguard Information Technology ETF | 1,074 | |
| | | |
TOTAL INVESTMENTS - 99.8% ( Cost $2,248,208** ) | 2,231,386 |
| NET OTHER ASSETS AND LIABILITIES - 0.2% | |
| TOTAL NET ASSETS - 100.0% | |
| ** | Aggregate cost for Federal tax purposes was $2,272,035. |
| ETF | Exchange Traded Fund. |
See accompanying Notes to Financial Statements.
Ultra Series Fund | December 31, 2011
Statements of Assets and Liabilities as of December 31, 2011
| | Conservative Allocation Fund | | Aggressive Allocation Fund | |
| Assets: | | | | |
| Investments in securities, at cost | | | | |
| Unaffiliated issuers | $ 89,569,879 | $149,507,840 | $ 58,551,438 | $ 62,700,931 |
Affiliated issuers1 | 128,371,128 | 210,749,891 | 66,131,138 | – |
| Net unrealized appreciation (depreciation) | | | | |
| Unaffiliated issuers | (3,624,206) | (2,486,928) | (1,011,759) | – |
Affiliated issuers1 | | | | |
| Total investments at value | 225,911,081 | 380,058,050 | 134,074,608 | 62,700,931 |
| Cash | 682,287 | 1,768,226 | 706,668 | – |
| Receivables: | | | | |
| Investments sold | – | – | – | – |
| Fund shares sold | 326,087 | 381,479 | 207,273 | – |
| Dividends and interest | 804,001 | 1,548,633 | 635,433 | – |
| Due from Adviser | | | | |
| Total assets | | | | |
| Liabilities: | | | | |
| Payables: | | | | |
| Investments purchased | – | 950,340 | 1,200,119 | – |
| Fund shares repurchased | 6,251 | 75,552 | 17,177 | 33,050 |
| Auditor fees | 16,161 | 20,155 | 12,010 | 6,006 |
| Management fees | 57,774 | 96,727 | 33,772 | 24,225 |
| Distribution fees – Class II | 9,141 | 7,587 | 376 | 209 |
| Total liabilities | | | | |
| Net assets applicable to outstanding capital stock | | | | |
| Net assets consist of: | | | | |
| Paid-in capital | $227,915,700 | $415,479,052 | $144,632,385 | $ 62,660,366 |
| Accumulated undistributed net investment income (loss) | – | – | – | – |
| Accumulated net realized loss on investments sold and foreign currency related transactions | (8,251,645) | (52,673,344) | (19,663,889) | – |
| Net unrealized appreciation of investments (including appreciation (depreciation) of foreign currency related transactions) | | | | |
| Net Assets | | | | |
| Class I Shares: | | | | |
| Net Assets | $184,431,415 | $346,733,220 | $132,574,593 | $ 61,681,753 |
| Shares of beneficial interest outstanding | 18,516,648 | 36,800,490 | 14,792,766 | 61,681,753 |
Net Asset Value and redemption price per share | | | | |
| Class II Shares: | | | | |
| Net Assets | $ 43,202,714 | $ 35,872,807 | $ 1,785,935 | $ 978,613 |
| Shares of beneficial interest outstanding | 4,341,071 | 3,812,251 | 199,656 | 978,613 |
Net Asset Value and redemption price per share | | | | |
| 1 | See Note 11 for information on affiliated issuers. |
See accompanying Notes to Financial Statements.
Ultra Series Fund | December 31, 2011
Statements of Assets and Liabilities as of December 31, 2011
| | | | | |
| Assets: | | | | |
| Investments in securities, at cost | | | | |
| Unaffiliated issuers | $381,891,683 | $ 88,979,749 | $356,526,371 | $ 3,069,608 |
| Repurchase agreement | – | – | – | 229,741 |
| Net unrealized appreciation (depreciation) | | | | |
| Unaffiliated issuers | | | | |
| Total investments at value | 415,217,102 | 91,223,149 | 398,015,505 | 3,022,508 |
| Cash | – | – | – | – |
| Foreign currency (cost of $113,839) (Note 2) | – | – | – | – |
| Receivables: | | | | |
| Investments sold | 6,100,000 | – | 3,150,000 | 8,070 |
| Fund shares sold | 89,136 | 21,075 | 88,486 | – |
| Dividends and interest | 4,185,732 | 1,525,872 | 2,254,961 | 3,382 |
| Other assets | | | | |
| Total assets | | | | |
| Liabilities: | | | | |
| Payables: | | | | |
| Investments purchased | – | – | – | – |
| Fund shares repurchased | 270,544 | 26,390 | 37,477 | 339 |
| Audit fees | 15,094 | 8,754 | 16,713 | 268 |
| Management fees | 196,645 | 58,365 | 236,983 | – |
| Service agreement fees | – | – | – | – |
| Distribution fees – Class II | 10,485 | 1,305 | 6,345 | – |
| Options written, at value (premiums received of $140,153) | | | | |
| Total liabilities | | | | |
| Net assets applicable to outstanding capital stock | | | | |
| Net assets consist of: | | | | |
| Paid-in capital | $404,382,042 | $101,781,636 | $394,122,596 | $ 3,147,513 |
| Accumulated undistributed net investment income (loss) | 270,176 | 118,232 | 207,484 | – |
| Accumulated net realized gain (loss) on investments sold, options and foreign currency related transactions | (12,878,435) | (11,467,986) | (32,607,780) | 22,528 |
| Net unrealized appreciation (depreciation) of investments (including appreciation (depreciation) of options and foreign currency related transactions) | | | | |
| Net Assets | | | | |
| Class I Shares: | | | | |
| Net Assets | $375,325,251 | $ 86,462,362 | $372,851,554 | $ 483,231 |
| Shares of beneficial interest outstanding | 35,501,861 | 9,417,480 | 21,440,925 | 51,370 |
Net Asset Value and redemption price per share | | | | |
| Class II Shares: | | | | |
| Net Assets | $ 49,773,951 | $ 6,212,920 | $ 30,359,880 | $ 2,460,387 |
| Shares of beneficial interest outstanding | 4,711,812 | 676,251 | 1,747,671 | 262,729 |
Net Asset Value and redemption price per share | | | | |
| 1 | Class II shares are not available for the Madison Target Retirement Funds. |
See accompanying Notes to Financial Statements.
Ultra Series Fund | December 31, 2011
Statements of Assets and Liabilities as of December 31, 2011
| | | | | Madison Target Retirement 2020 Fund1 | Madison Target Retirement 2030 Fund1 | Madison Target Retirement 2040 Fund1 | Madison Target Retirement 2050 Fund1 |
| | | | | | | | | |
| | | | | | | | | |
| $433,651,918 | $318,965,889 | $325,050,984 | $ 10,519,226 | $ 82,128,988 | $ 39,798,912 | $ 45,869,059 | $ 35,763,274 | $ 2,248,208 |
| – | – | – | – | – | – | – | – | – |
| | | | | | | | | |
| | | | | | | | |
| 491,275,903 | 358,627,671 | 364,993,664 | 12,689,619 | 86,851,693 | 39,418,537 | 45,253,302 | 35,165,472 | 2,231,386 |
| – | – | – | – | – | – | – | – | – |
| – | – | – | – | 113,490 | – | – | – | – |
| | | | | | | | | |
| – | – | – | 14,934 | 1,270,967 | – | 149,971 | – | – |
| 92,759 | 68,555 | 121,166 | 351 | 23,892 | 97,402 | 171,285 | 117,553 | 26,666 |
| 783,064 | 289,079 | 368,599 | 17,645 | 133,877 | 74,937 | 92,253 | 68,911 | 4,482 |
| | | | | | | | |
| | | | | | | | |
| | | | | | | | | |
| | | | | | | | | |
| – | – | – | 47,201 | 268,040 | – | 250,121 | 160,081 | 25,727 |
| 208,169 | 94,699 | 86,497 | 358 | 31,373 | – | – | – | – |
| 20,949 | 19,562 | 14,987 | 1,202 | 9,043 | 1,008 | 1,086 | 879 | 31 |
| 246,937 | 244,330 | 276,286 | 11,811 | 89,628 | 8,193 | 9,292 | 7,257 | 446 |
| – | – | – | | – | 1,639 | 1,859 | 1,451 | 89 |
| 1,178 | 5,865 | 2,770 | 287 | 3,252 | – | – | – | – |
| | | | | | | | |
| | | | | | | | |
| | | | | | | | |
| | | | | | | | | |
| $529,534,231 | $337,763,044 | $399,409,088 | $12,107,285 | $121,211,616 | $40,090,314 | $46,186,479 | $35,906,862 | $2,287,026 |
| 190,026 | 23,005 | 15,924 | – | (78) | – | – | – | – |
(95,674,095) | (18,826,982) | (74,264,803) | (1,615,988) | (37,779,662) | (129,904) | (166,269) | (126,792) | (33,963) |
| | | | | | | | |
| | | | | | | | |
| | | | | | | | | |
| $485,977,724 | $331,031,561 | $351,832,741 | $ 11,261,102 | $ 72,756,025 | $ 39,580,036 | $ 45,404,453 | $ 35,182,268 | $ 2,236,241 |
| 19,615,365 | 15,156,749 | 23,857,316 | 1,041,903 | 8,057,723 | 5,063,779 | 6,063,101 | 4,984,359 | 229,307 |
| | | | | | | | |
| | | | | | | | | |
$ 5,696,769 | $ 27,589,288 | $ 13,270,148 | $ 1,400,588 | $ 15,407,441 | | | | |
| 230,369 | 1,265,769 | 901,222 | 129,853 | 1,707,739 | | | | |
| | | | | | | | |
See accompanying Notes to Financial Statements.
Ultra Series Fund | December 31, 2011
Statements of Operations for the Period Ended December 31, 2011
| | Conservative Allocation Fund | | Aggressive Allocation Fund | |
| Investment Income: | | | | |
| Interest | $ 597 | $ 876 | $ 424 | $ 53,588 |
| Dividends | | | | |
| Unaffiliated issuers | 3,945,715 | 4,379,624 | 885,154 | – |
Affiliated issuers1 | 3,310,754 | 4,906,182 | 1,199,650 | – |
| Less: Foreign taxes withheld | | | | |
| Total investment income | | | | |
Expenses:3 | | | | |
| Management fees | 702,192 | 1,166,477 | 398,296 | 298,511 |
| Audit fees | 21,161 | 35,156 | 12,009 | 6,006 |
| Trustees’ fees | 10,606 | 17,591 | 5,983 | 3,001 |
| Distribution fees – Class II | 100,895 | 89,563 | 4,349 | 1,707 |
| Other expenses | – | – | – | – |
| Compliance expense | | | | |
| Total expenses before reimbursement/waiver | 835,926 | 1,312,873 | 421,794 | 312,326 |
Less reimbursement/waiver2 | | | | |
| Total expenses net of reimbursement/waiver | | | | |
| Net Investment Income (Loss) | 6,421,140 | 7,973,809 | 1,663,434 | – |
| Net Realized and Unrealized Gain (Loss) on Investments | | | | |
| Net realized gain (loss) on investments (including net realized gain (loss) on options and foreign currency related transactions) | | | | |
| Options | – | – | – | – |
| Unaffiliated issuers | (619,352) | 948,741 | 1,287,576 | – |
Affiliated issuers1 | 57,206 | (153,884) | 235,842 | – |
| Capital gain distributions received from underlying funds | | | | |
| Unaffiliated issuers | 1,350,188 | 2,139,360 | 1,093,528 | – |
Affiliated issuers1 | 815,922 | 1,536,571 | 509,510 | – |
| Net change in unrealized appreciation (depreciation) on investments (including net unrealized appreciation (depreciation) on options and foreign currency related transactions) | | | | |
| Options | – | – | – | – |
| Unaffiliated issuers | (2,577,279) | (4,776,406) | (4,764,008) | – |
Affiliated issuers1 | | | | |
| Net Realized and Unrealized Gain (Loss) on Investments and Options Transactions | | | | |
| Net Increase (Decrease) in Net Assets from Operations | | | | |
| 1 | See Note 11 for information on affiliated issuers. |
| 2 | Waiver includes management fees of $257,031, and distribution fees of $1,707 for the Money Market Fund. See Note 3. |
| 3 | See Note 3. |
See accompanying Notes to Financial Statements.
Ultra Series Fund | December 31, 2011
Statements of Operations for the Period Ended December 31, 2011
| | | | | | | | |
| | | | | | | | | |
$ 18,590,305 | $ 7,233,242 | $ 8,075,505 | $ 88 | $ 1,388 | $ 4,003 | $ 3,864 | $ 76 | $ 5,515 |
| | | | | | | | | |
| 16 | 63,947 | 6,799,866 | 28,186 | 13,505,403 | 4,106,614 | 4,230,966 | 202,772 | 3,341,529 |
| – | – | – | – | – | – | – | – | – |
| | | | | | | | |
| | | | | | | | |
| | | | | | | | | |
| 2,442,522 | 726,909 | 2,843,178 | 24,584 | 3,053,246 | 3,057,900 | 3,479,609 | 146,432 | 1,202,587 |
| 40,094 | 8,754 | 36,713 | 268 | 45,949 | 34,562 | 34,987 | 1,202 | 9,043 |
| 20,206 | 4,410 | 18,355 | 121 | 23,156 | 17,395 | 17,657 | 605 | 4,623 |
| 113,302 | 14,178 | 69,951 | 5,643 | 14,000 | 65,482 | 32,768 | 3,564 | 38,708 |
| – | – | – | – | – | 8,509 | – | – | – |
| | | | | | | | |
| 2,627,001 | 756,588 | 2,978,329 | 30,616 | 3,158,094 | 3,195,904 | 3,569,908 | 151,898 | 1,257,638 |
| | | | | | | | |
| | | | | | | | |
| 15,963,320 | 6,540,601 | 11,868,731 | (2,342) | 10,296,797 | 872,256 | 602,185 | 50,950 | 1,855,913 |
| | | | | | | | | |
| | | | | | | | | |
| – | – | – | 145,357 | – | – | – | – | – |
| 1,004,732 | 1,733,903 | 16,259,876 | 173,926 | 31,920,133 | 39,422,276 | 36,438,566 | 357,045 | 3,479,732 |
| – | – | – | – | – | – | – | – | – |
| | | | | | | | | |
| – | – | – | – | – | – | – | – | – |
| – | – | – | – | – | – | – | – | – |
| | | | | | | | | |
| – | – | – | 85,456 | – | – | – | – | – |
| 11,605,808 | (3,502,188) | 2,343,286 | (383,630) | (5,336,866) | (44,255,836) | (19,534,163) | (368,723) | (12,765,450) |
| | | | | | | | |
| | | | | | | | |
| | | | | | | | |
See accompanying Notes to Financial Statements.
Ultra Series Fund | December 31, 2011
Statements of Operations for the Period Ended December 31, 2011
| | Madison Target Retirement 2020 Fund | Madison Target Retirement 2030 Fund | Madison Target Retirement 2040 Fund | Madison Target Retirement 2050 Fund |
| Investment Income: | | | | |
| Interest | $ 203 | $ 175 | $ 105 | $ 3 |
| Dividends | | | | |
| Unaffiliated issuers | 934,120 | 940,458 | 666,050 | 29,469 |
Affiliated issuers1 | | | | |
| Total investment income | | | | |
Expenses:2 | | | | |
| Management fees | 82,167 | 91,228 | 73,179 | 2,416 |
| Service agreement fees | 6,148 | 6,915 | 5,445 | 300 |
| Audit fees | 1,008 | 1,086 | 878 | 29 |
| Trustees’ fees | 512 | 558 | 460 | 7 |
| Compliance expense | | | | |
| Total expenses before reimbursement/waiver | 89,870 | 99,796 | 79,972 | 2,754 |
Less reimbursement/waiver2 | | | | |
| Total expenses net of reimbursement/waiver | | | | |
| Net Investment Income | 927,037 | 923,593 | 642,632 | 27,410 |
| Net Realized and Unrealized Gain (Loss) on Investments | | | | |
| Net realized gain (loss) on investments (including net realized gain (loss) on foreign currency related transactions) | | | | |
| Unaffiliated issuers | (310,584) | (120,056) | 153,839 | (39,051) |
Affiliated issuers1 | 2,036,368 | 2,247,664 | 1,924,937 | (3,966) |
| Capital gain distributions received from underlying funds | | | | |
| Unaffiliated issuers | 265,333 | 272,853 | 211,503 | 12,997 |
Affiliated issuers1 | 13,703 | 13,904 | 13,305 | 97 |
| Net change in unrealized appreciation (depreciation)on investments (including net unrealized appreciation (depreciation) on foreign currency related transactions) | | | | |
| Unaffiliated issuers | (448,974) | (902,800) | (1,089,436) | (16,822) |
Affiliated issuers1 | | | | |
| Net Realized and Unrealized Gain (Loss) on Investments | | | | |
| Net Increase (Decrease) in Net Assets from Operations | | | | |
| 1 | See Note 11 for information on affiliated issuers. |
| 2 | See Note 3. |
See accompanying Notes to Financial Statements.
Ultra Series Fund | December 31, 2011
Statements of Changes in Net Assets
| | Conservative Allocation Fund | |
| | | | |
| Net Assets at beginning of period | $231,082,035 | $189,151,289 | $384,260,026 | $344,590,404 |
| Increase in net assets from operations: | | | | |
| Net investment income | 6,421,140 | 6,243,595 | 7,973,809 | 8,219,996 |
| Net realized gain (loss) on investment | 1,603,964 | 7,769,440 | 4,470,788 | 7,425,476 |
| Net change in unrealized appreciation (depreciation) on investments | | | | |
| Net increase in net assets from operations | 6,923,738 | 17,228,663 | 7,762,792 | 35,612,978 |
| Distributions to shareholders from: | | | | |
| Net investment income | | | | |
| Class I | (6,348,062) | (7,654,294) | (9,241,042) | (10,317,104) |
| Class II | (1,388,479) | (1,328,070) | (885,425) | (878,996) |
| Return of Capital | | | | |
| Class I | (127,373) | – | – | – |
| Class II | | | | |
| Total distributions | | | | |
| Capital Stock transactions: | | | | |
| Class I Shares | | | | |
| Shares sold | 20,354,867 | 30,294,841 | 23,367,824 | 37,578,345 |
| Issued to shareholders in reinvestment of distributions | 6,475,435 | 7,654,294 | 9,241,042 | 10,317,104 |
| Shares redeemed | | | | |
| Net increase (decrease) in net assets from capital stock transactions | | | | |
| Class II Shares | | | | |
| Shares sold | 9,767,995 | 21,941,860 | 6,691,106 | 18,891,332 |
| Issued to shareholders in reinvestment of distributions | 1,417,247 | 1,328,070 | 885,425 | 878,996 |
| Shares redeemed | | | | |
| Net increase in net assets from capital stock transactions | | | | |
| Total increase (decrease) from capital stock transactions | | | | |
| Total increase (decrease) in net assets | | | | |
| Net Assets at end of period | | | | |
| Undistributed net investment income (loss) included in net assets | $ – | $ 200,401 | $ – | $ 242,947 |
| Capital Share transactions: | | | | |
| Class I Shares | | | | |
| Shares sold | 1,989,887 | 3,053,915 | 2,426,221 | 4,111,214 |
| Issued to shareholders in reinvestment of distributions | 649,610 | 765,160 | 980,151 | 1,088,307 |
| Shares redeemed | | | | |
| Net increase (decrease) from capital shares transactions | | | | |
| Class II Shares | | | | |
| Shares sold | 955,023 | 2,225,231 | 685,655 | 2,059,232 |
| Issued to shareholders in reinvestment of distributions | 142,423 | 132,811 | 94,103 | 92,735 |
| Shares redeemed | | | | |
| Net increase (decrease) from capital shares transactions | | | | |
See accompanying Notes to Financial Statements.
Ultra Series Fund | December 31, 2011
Statements of Changes in Net Assets
| | Aggressive Allocation Fund | |
| | | | |
| Net Assets at beginning of period | $127,694,004 | $115,006,315 | $ 70,211,054 | $ 92,647,633 |
| Increase (decrease) in net assets from operations: | | | | |
| Net investment income (loss) | 1,663,434 | 1,557,353 | – | – |
| Net realized gain (loss) on investments and options transactions | 3,126,456 | 981,371 | – | – |
Net change in unrealized appreciation (depreciation) on investments and options transactions | | | | |
| Net increase in net assets from operations | 645,893 | 13,256,806 | – | – |
| Distributions to shareholders from: | | | | |
| Net investment income | | | | |
| Class I | (2,322,867) | (1,957,002) | – | – |
| Class II | (28,384) | (20,174) | – | – |
| Net realized gains | | | | |
| Class I | – | – | – | – |
| Class II | | | | |
| Total distributions | | | | |
| Capital Stock transactions: | | | | |
| Class I Shares | | | | |
| Shares sold | 16,814,313 | 21,387,476 | 26,296,004 | 24,976,798 |
| Issued to shareholders in reinvestment of distributions | 2,322,867 | 1,957,002 | – | – |
| Shares redeemed | | | | |
| Net increase (decrease) in net assets from capital stock transactions | | | | |
| Class II Shares | | | | |
| Shares sold | 467,480 | 815,901 | 2,272,356 | 1,623,479 |
| Issued to shareholders in reinvestment of distributions | 28,384 | 20,174 | – | – |
| Shares redeemed | | | | |
| Net increase in net assets from capital stock transactions | | | | |
| Total net increase (decrease) from capital stock transactions | | | | |
| Total increase (decrease) in net assets | | | | |
| Net Assets at end of period | | | | |
| Undistributed net investment income (loss) included in net assets | $ – | $ 45,988 | $ – | $ – |
| Capital Share transactions: | | | | |
| Class I Shares | | | | |
| Shares sold | 1,829,853 | 2,513,771 | 26,296,004 | 24,976,798 |
| Issued to shareholders in reinvestment of distributions | 259,040 | 215,569 | – | – |
| Shares redeemed | | | | |
| Net increase (decrease) from capital shares transactions | | | | |
| Class II Shares | | | | |
| Shares sold | 49,960 | 94,595 | 2,272,356 | 1,623,479 |
| Issued to shareholders in reinvestment of distributions | 3,173 | 2,225 | – | – |
| Shares redeemed | | | | |
| Net increase (decrease) from capital shares transactions | | | | |
| 1 | The Equity Income Fund commenced investment operations on April 30, 2010. |
See accompanying Notes to Financial Statements.
Ultra Series Fund | December 31, 2011
Statements of Changes in Net Assets
| | | |
| | | | | | | |
| $465,248,826 | $551,508,094 | $ 99,838,101 | $108,870,121 | $407,017,583 | $424,642,342 | $ 2,221,337 | $ – |
| | | | | | | | |
| 15,963,320 | 19,886,343 | 6,540,601 | 7,431,726 | 11,868,731 | 14,547,308 | (2,342) | (3,605) |
| 1,004,732 | (776,528) | 1,733,903 | 2,864,620 | 16,259,876 | 13,803,156 | 319,283 | 65,821 |
| | | | | | | |
| 28,573,860 | 31,825,652 | 4,772,316 | 10,947,296 | 30,471,893 | 47,192,379 | 18,767 | 133,967 |
| | | | | | | | |
| | | | | | | | |
| (14,079,587) | (17,920,685) | (6,211,217) | (7,114,840) | (11,046,222) | (13,512,500) | – | – |
| | | | | | | |
| | | | | | | | |
| – | – | – | – | – | – | (49,697) | (11,456) |
| | | | | | | |
| | | | | | | |
| | | | | | | | |
| | | | | | | | |
| 32,933,180 | 24,922,679 | 3,676,230 | 9,178,883 | 8,647,928 | 6,186,073 | – | 450,000 |
| 14,079,587 | 17,920,685 | 6,211,217 | 7,114,840 | 11,046,222 | 13,512,500 | 49,697 | 11,456 |
| | | | | | | |
| | | | | | | |
| | | | | | | | |
| 12,844,910 | 25,338,964 | 1,915,219 | 2,870,986 | 8,977,582 | 16,060,982 | 884,099 | 1,639,463 |
| 1,752,712 | 1,415,679 | 428,405 | 303,771 | 837,747 | 740,470 | 253,857 | 41,620 |
| | | | | | | |
| | | | | | | |
| | | | | | | |
| | | | | | | |
| | | | | | | |
$ 270,176 | $ 342,572 | $ 118,232 | $ 93,670 | $ 207,484 | $ 282,108 | $ – | $ – |
| | | | | | | | |
| | | | | | | | |
| 3,144,908 | 2,367,180 | 380,515 | 944,926 | 502,323 | 382,789 | – | 45,000 |
| 1,333,622 | 1,746,484 | 675,860 | 756,070 | 634,293 | 815,184 | 5,265 | 1,105 |
| | | | | | | |
| | | | | | | |
| | | | | | | | |
| 1,232,926 | 2,391,169 | 197,713 | 298,803 | 526,321 | 995,293 | 77,936 | 164,579 |
| 166,154 | 138,090 | 46,641 | 32,256 | 48,142 | 44,665 | 27,018 | 4,021 |
| | | | | | | |
| | | | | | | |
See accompanying Notes to Financial Statements.
Ultra Series Fund | December 31, 2011
Statements of Changes in Net Assets
| | | |
| | | | |
| Net Assets at beginning of period | $530,247,917 | $633,315,527 | $395,446,443 | $439,485,846 |
| Increase (decrease) in net assets from operations: | | | | |
| Net investment income | 10,296,797 | 10,041,801 | 872,256 | 2,098,277 |
| Net realized gain (loss) on investments | 31,920,133 | 12,524,176 | 39,422,276 | 45,547,695 |
| Net change in unrealized appreciation (depreciation) on investments | | | | |
| Net increase (decrease) in net assets from operations | 36,880,064 | 42,782,469 | (3,961,304) | 46,165,689 |
| Distributions to shareholders from: | | | | |
| Net investment income | | | | |
| Class I | (10,095,971) | (9,874,790) | (861,866) | (2,008,954) |
| Class II | (109,873) | (92,316) | (31,319) | (80,740) |
| Net realized gains | | | | |
| Class I | | | | |
| Total distributions | | | | |
| Capital Stock transactions: | | | | |
| Class I Shares | | | | |
| Shares sold | 13,848,340 | 10,390,330 | 11,740,628 | 12,483,565 |
| Issued to shareholders in reinvestment of distributions | 10,095,971 | 9,874,790 | 861,866 | 2,008,954 |
| Shares redeemed | | | | |
| Net increase (decrease) in net assets from capital stock transactions | | | | |
Class II Shares1 | | | | |
| Shares sold | 544,221 | 2,505,643 | 8,340,118 | 12,822,773 |
| Issued to shareholders in reinvestment of distributions | 109,873 | 92,316 | 31,319 | 80,740 |
| Shares redeemed | | | | |
| Net increase (decrease) in net assets from capital stock transactions | | | | |
| Total net increase (decrease) from capital stock transactions | | | | |
| Total increase (decrease) in net assets | | | | |
| Net Assets at end of period | | | | |
| Undistributed net investment income included in net assets | $ 190,026 | $ 99,876 | $ 23,005 | $ 43,934 |
| Capital Share transactions: | | | | |
| Class I Shares | | | | |
Shares sold2 | 559,931 | 452,699 | 521,785 | 617,902 |
| Issued to shareholders in reinvestment of distributions | 405,964 | 420,253 | 39,349 | 90,753 |
Shares redeemed3 | | | | |
| Net increase (decrease) from capital share transactions | | | | |
Class II Shares1 | | | | |
Shares sold2 | 22,164 | 113,216 | 368,460 | 637,399 |
| Issued to shareholders in reinvestment of distributions | 4,426 | 3,928 | 1,433 | 3,643 |
Shares redeemed3 | | | | |
| Net increase from capital share transactions | | | | |
| 1 | Class II shares are not available for the Madison Target Retirement Funds. |
| 2 | A portion of the shares sold in fiscal year 2010 for the Mid Cap, Small Cap and International Stock Funds are merger related. See Note 12. |
| 3 | Included in Mid Cap Fund’s amounts are 55,587,696 shares of Class I and 975,111 shares of Class II, redeemed as part of a reverse stock split resulting from the Mid Cap merger effective May 1, 2010. See Note 12. |
See accompanying Notes to Financial Statements.
Ultra Series Fund | December 31, 2011
Statements of Changes in Net Assets
| | | Madison Target Retirement 2020 Fund |
| | | | | | | |
| $397,169,596 | $231,140,313 | $ 13,097,057 | $ 8,605,016 | $105,304,241 | $ 81,959,251 | $ 27,647,785 | $ 19,299,907 |
| | | | | | | | |
| 602,185 | $1,426,201 | 50,950 | 90,074 | 1,855,913 | 1,364,848 | 927,037 | 592,475 |
| 36,438,566 | 38,533,473 | 357,045 | 1,388,131 | 3,479,732 | (12,611,702) | 2,004,820 | 433,236 |
| | | | | | | |
| 17,506,588 | 62,124,624 | 39,272 | 3,515,524 | (7,429,805) | (1,524,165) | 662,853 | 2,067,702 |
| | | | | | | | |
| | | | | | | | |
| (687,090) | (1,297,752) | (45,846) | (77,264) | (1,510,650) | (1,747,310) | (1,096,421) | (890,022) |
| (4,200) | (23,971) | (3,723) | (7,146) | (291,401) | (164,100) | – | – |
| | | | | | | | |
| | | | | | | |
| | | | | | | |
| | | | | | | | |
| | | | | | | | |
| 14,847,888 | 193,863,822 | 1,567,954 | 10,030,126 | 3,327,511 | 44,238,040 | 15,901,069 | 10,542,189 |
| 687,090 | 1,297,752 | 45,846 | 77,264 | 1,510,650 | 1,747,310 | 1,994,158 | 890,022 |
| | | | | | | |
| | | | | | | |
| | | | | | | | |
| 1,744,989 | 9,080,395 | 290,607 | 579,122 | 4,073,516 | 8,220,151 | | |
| 4,200 | 23,971 | 3,723 | 7,146 | 291,401 | 164,100 | | |
| | | | | | | |
| | | | | | | |
| | | | | | | |
| | | | | | | |
| | | | | | | |
$ 15,924 | $ 105,029 | $ – | $ 884 | $ (78) | $ (268,045) | $ – | $ 21,164 |
| | | | | | | | |
| | | | | | | | |
| 993,405 | 40,430,546 | 142,303 | 1,150,799 | 332,788 | 3,857,990 | 1,939,616 | 1,339,863 |
| 46,410 | 91,523 | 4,205 | 7,118 | 167,339 | 178,541 | 255,016 | 110,405 |
| | | | | | | |
| | | | | | | |
| | | | | | | | |
| 117,974 | 1,438,260 | 26,862 | 63,338 | 403,814 | 899,702 | | |
| 284 | 1,692 | 342 | 658 | 32,404 | 16,689 | | |
| | | | | | | |
| | | | | | | |
See accompanying Notes to Financial Statements.
Ultra Series Fund | December 31, 2011
Statements of Changes in Net Assets
| | Madison Target Retirement 2030 Fund | Madison Target Retirement 2040 Fund | Madison Target Retirement 2050 Fund |
| | | | | |
| Net Assets at beginning of period | $ 31,278,843 | $ 19,330,304 | $ 26,146,753 | $ 16,656,174 | $ – |
| Increase (decrease) in net assets from operations: | | | | | |
| Net investment income | 923,593 | 583,349 | 642,632 | 437,089 | 27,410 |
| Net realized gain (loss) on investments | 2,414,365 | 461,104 | 2,303,584 | 369,829 | (29,923) |
| Net change in unrealized appreciation (depreciation) on investments | | | | | |
| Net increase (decrease) in net assets from operations | 426,607 | 2,492,907 | 136,490 | 2,214,174 | (19,335) |
| Distributions to shareholders from: | | | | | |
| Net investment income | | | | | |
| Class I | (1,091,758) | (823,904) | (767,165) | (574,774) | (31,450) |
| Net realized gains | | | | | |
| Class I | (1,764,696) | – | (1,885,854) | – | – |
| Return of Capital | | | | | |
| | | | | | |
| Total distributions | | | | | |
| Capital Stock transactions: | | | | | |
| Class I Shares | | | | | |
| Shares sold | 15,550,888 | 11,552,787 | 10,698,786 | 9,124,273 | 2,473,782 |
| Issued to shareholders in reinvestment of distributions | 2,856,454 | 823,904 | 2,653,019 | 574,774 | 32,549 |
| Shares redeemed | | | | | |
| Net increase from capital stock transactions | | | | | |
| Total increase in net assets | | | | | |
| Net Assets at end of period | | | | | |
| Undistributed net investment income (loss) included in net assets | $ – | $ 28,384 | $ – | $ – | $ – |
| Capital Share transactions: | | | | | |
| Class I Shares | | | | | |
| Shares sold | 1,952,016 | 1,523,733 | 1,399,765 | 1,264,901 | 248,588 |
| Issued to shareholders in reinvestment of distributions | 381,214 | 104,333 | 375,570 | 75,725 | 3,338 |
| Shares redeemed | | | | | |
| Net increase from capital share transactions | | | | | |
| 1 | The Madison Target Retirement 2050 Fund commenced operations on January 3, 2011. |
See accompanying Notes to Financial Statements.
Ultra Series Fund | December 31, 2011
Financial Highlights for a Share of Beneficial Interest Outstanding
CONSERVATIVE ALLOCATION FUND |
| | |
| | | | | | |
| CLASS I | | | | | |
Net Asset Value at beginning of period | $10.01 | $ 9.61 | $ 8.48 | $10.77 | $10.60 |
| Income from Investment Operations: | | | | | |
Net investment income2 | 0.28 | 0.29 | 0.29 | 0.35 | 0.45 |
| Net realized and unrealized gain (loss) on investments | | | | | |
| Total from investment operations | 0.31 | 0.81 | 1.41 | (1.92) | 0.42 |
| Less Distributions: | | | | | |
| Distributions from net investment income | (0.35) | (0.41) | (0.28) | (0.27) | (0.23) |
| Distributions from capital gains | – | – | – | (0.10) | (0.02) |
| Distributions from return of capital | | | | | |
| Total distributions | (0.36) | (0.41) | (0.28) | (0.37) | (0.25) |
| Net increase (decrease) in net asset value | (0.05) | 0.40 | 1.13 | (2.29) | 0.17 |
Net Asset Value at end of period | $9.96 | $10.01 | $ 9.61 | $ 8.48 | $10.77 |
Total Return3 (%) | 3.14 | 8.37 | 16.76 | (17.89) | 3.92 |
| Ratios/Supplemental Data: | | | | | |
| Net Assets at end of period (in 000’s) | $184,431 | $195,657 | $176,322 | $116,678 | $66,747 |
| Ratios of expenses to average net assets: | | | | | |
| Before management fee reduction (%) | 0.31 | 0.31 | 0.31 | 0.31 | 0.31 |
| After management fee reduction (%) | 0.31 | 0.31 | 0.31 | 0.28 | 0.21 |
| Ratio of net investment income to average net assets (%) | 2.76 | 2.90 | 3.23 | 3.53 | 4.12 |
Portfolio Turnover6 (%) | 36 | 36 | 47 | 71 | 28 |
| CLASS II | | | | | |
Net Asset Value at beginning of period | $10.00 | $ 9.61 | $ 8.51 | | |
| Income from Investment Operations: | | | | | |
Net investment income2 | 0.27 | 0.35 | 0.28 | | |
| Net realized and unrealized gain (loss) on investments | | | | | |
| Total from investment operations | 0.29 | 0.78 | 1.27 | | |
| Less Distributions: | | | | | |
| Distributions from net investment income | (0.33) | (0.39) | (0.17) | | |
| Distributions from return of capital | | | | | |
| Net increase in net asset value | (0.05) | 0.39 | 1.10 | | |
Net Asset Value at end of period | $9.95 | $10.00 | $ 9.61 | | |
Total Return3 (%) | 2.89 | 8.10 | 14.914 | | |
| Ratios/Supplemental Data: | | | | | |
| Net Assets at end of period (in 000’s) | $43,203 | $35,425 | $12,829 | | |
| Ratios of expenses to average net assets (%) | 0.56 | 0.55 | 0.565 | | |
| Ratio of net investment income to average net assets (%) | 2.67 | 3.47 | 4.385 | | |
Portfolio Turnover6 (%) | 36 | 36 | 474 | | |
| 1 | Commenced investment operations May 1, 2009 |
| 2 | Based on average shares outstanding during the year. |
| 3 | These returns are after all charges at the mutual fund level have been subtracted. These returns are higher than the returns at the separate account level because charges made at the separate account level have not been subtracted. Total returns are not annualized for periods less than one year. |
| 4 | Not annualized. |
| 5 | Annualized. |
| 6 | Portfolio Turnover is calculated at the fund level and represents the entire fiscal year or period. |
See accompanying Notes to Financial Statements.
Ultra Series Fund | December 31, 2011
Financial Highlights for a Share of Beneficial Interest Outstanding
|
| | |
| | | | | | |
| CLASS I | | | | | |
Net Asset Value at beginning of period | $ 9.49 | $ 8.87 | $ 7.51 | $11.21 | $10.86 |
| Income from Investment Operations: | | | | | |
Net investment income2 | 0.20 | 0.20 | 0.18 | 0.21 | 0.28 |
| Net realized and unrealized gain (loss) on investments | | | | | |
| Total from investment operations | 0.19 | 0.91 | 1.55 | (3.34) | 0.60 |
| Less Distributions: | | | | | |
| Distributions from net investment income | (0.26) | (0.29) | (0.19) | (0.17) | (0.19) |
| Distributions from capital gains | | | | | |
| Total distributions | (0.26) | (0.29) | (0.19) | (0.36) | (0.25) |
| Net increase (decrease) in net asset value | (0.07) | 0.62 | 1.36 | (3.70) | 0.35 |
Net Asset Value at end of period | $ 9.42 | $ 9.49 | $ 8.87 | $ 7.51 | $11.21 |
Total Return3 (%) | 2.03 | 10.22 | 20.61 | (30.23) | 5.56 |
| Ratios/Supplemental Data: | | | | | |
| Net Assets at end of period (in 000’s) | $346,733 | $352,545 | $332,428 | $243,761 | $218,281 |
| Ratios of expenses to average net assets: | | | | | |
| Before management fee reduction (%) | 0.31 | 0.31 | 0.31 | 0.31 | 0.31 |
| After management fee reduction (%) | 0.31 | 0.31 | 0.31 | 0.28 | 0.21 |
| Ratio of net investment income to average net assets (%) | 2.07 | 2.24 | 2.29 | 2.20 | 2.45 |
Portfolio Turnover6 (%) | 25 | 34 | 52 | 69 | 29 |
| CLASS II | | | | | |
Net Asset Value at beginning of period | $ 9.48 | $ 8.87 | $ 7.56 | | |
| Income from Investment Operations: | | | | | |
Net investment income2 | 0.18 | 0.25 | 0.19 | | |
| Net realized and unrealized gain (loss) on investments | | | | | |
| Total from investment operations | 0.17 | 0.88 | 1.43 | | |
| Less Distributions: | | | | | |
| Distributions from net investment income | | | | | |
| Net increase in net asset value | (0.07) | 0.61 | 1.31 | | |
Net Asset Value at end of period | $ 9.41 | $ 9.48 | $ 8.87 | | |
Total Return3 (%) | 1.78 | 9.94 | 18.824 | | |
| Ratios/Supplemental Data: | | | | | |
| Net Assets at end of period (in 000’s) | $35,873 | $31,715 | $12,162 | | |
| Ratios of expenses to average net assets (%) | 0.56 | 0.56 | 0.565 | | |
| Ratio of net investment income to average net assets (%) | 1.86 | 2.76 | 3.335 | | |
Portfolio Turnover6 (%) | 25 | 34 | 524 | | |
| 1 | Commenced investment operations May 1, 2009. |
| 2 | Based on average shares outstanding during the year. |
| 3 | These returns are after all charges at the mutual fund level have been subtracted. These returns are higher than the returns at the separate account level because charges made at the separate account level have not been subtracted. Total returns are not annualized for periods less than one year. |
| 4 | Not annualized. |
| 5 | Annualized. |
| 6 | Portfolio Turnover is calculated at the fund level and represents the entire fiscal year or period. |
See accompanying Notes to Financial Statements.
Ultra Series Fund | December 31, 2011
Financial Highlights for a Share of Beneficial Interest Outstanding
AGGRESSIVE ALLOCATION FUND |
| | |
| | | | | | |
| CLASS I | | | | | |
Net Asset Value at beginning of period | $ 9.08 | $ 8.30 | $ 6.57 | $11.61 | $11.10 |
| Income from Investment Operations: | | | | | |
Net investment income2 | 0.12 | 0.11 | 0.10 | 0.09 | 0.09 |
| Net realized and unrealized gain (loss) on investments | | | | | |
| Total from investment operations | 0.04 | 0.92 | 1.84 | (4.65) | 0.86 |
| Less Distributions: | | | | | |
| Distributions from net investment income | (0.16) | (0.14) | (0.11) | (0.06) | (0.14) |
| Distributions from capital gains | | | | | |
| Total distributions | (0.16) | (0.14) | (0.11) | (0.39) | (0.35) |
| Net increase (decrease) in net asset value | (0.12) | 0.78 | 1.73 | (5.04) | 0.51 |
Net Asset Value at end of period | $ 8.96 | $ 9.08 | $ 8.30 | $ 6.57 | $11.61 |
Total Return3 (%) | 0.48 | 11.15 | 27.91 | (41.09) | 7.69 |
| Ratios/Supplemental Data: | | | | | |
| Net Assets at end of period (in 000’s) | $132,575 | $126,270 | $114,492 | $69,616 | $68,120 |
| Ratios of expenses to average net assets: | | | | | |
| Before management fee reduction (%) | 0.31 | 0.31 | 0.31 | 0.31 | 0.31 |
| After management fee reduction (%) | 0.31 | 0.31 | 0.31 | 0.28 | 0.21 |
| Ratio of net investment income to average net assets (%) | 1.26 | 1.27 | 1.44 | 0.94 | 0.79 |
Portfolio Turnover6 (%) | 32 | 33 | 58 | 67 | 46 |
| CLASS II | | | | | |
Net Asset Value at beginning of period | $ 9.07 | $ 8.30 | $ 6.69 | | |
| Income from Investment Operations: | | | | | |
Net investment income2 | 0.10 | 0.17 | 0.15 | | |
| Net realized and unrealized gain (loss) on investments | | | | | |
| Total from investment operations | 0.02 | 0.90 | 1.69 | | |
| Less Distributions: | | | | | |
| Distributions from net investment income | | | | | |
| Net increase in net asset value | (0.12) | 0.77 | 1.61 | | |
Net Asset Value at end of period | $ 8.95 | $ 9.07 | $ 8.30 | | |
Total Return3 (%) | 0.23 | 10.87 | 25.094 | | |
| Ratios/Supplemental Data: | | | | | |
| Net Assets at end of period (in 000’s) | $1,786 | $1,424 | $514 | | |
| Ratios of expenses to average net assets (%) | 0.56 | 0.56 | 0.565 | | |
| Ratio of net investment income to average net assets (%) | 1.05 | 1.99 | 2.865 | | |
Portfolio Turnover6 (%) | 32 | 33 | 584 | | |
| 1 | Commenced investment operations May 1, 2009. |
| 2 | Based on average shares outstanding during the year. |
| 3 | These returns are after all charges at the mutual fund level have been subtracted. These returns are higher than the returns at the separate account level because charges made at the separate account level have not been subtracted. Total returns are not annualized for periods less than one year. |
| 4 | Not annualized. |
| 5 | Annualized. |
| 6 | Portfolio Turnover is calculated at the fund level and represents the entire fiscal year or period. |
See accompanying Notes to Financial Statements.
Ultra Series Fund | December 31, 2011
Financial Highlights for a Share of Beneficial Interest Outstanding
|
| | |
| | | | | | |
| CLASS I | | | | | |
Net Asset Value at beginning of period | $1.00 | $1.00 | $1.00 | $1.00 | $1.00 |
| Income from Investment Operations: | | | | | |
Net investment income2 | – | – | 0.004 | 0.02 | 0.05 |
| Net realized and unrealized gain (loss) on investments | | | | | |
| Total from investment operations | 0.00 | 0.00 | 0.00 | 0.02 | 0.05 |
| Less Distributions: | | | | | |
| Distributions from net investment income | | | | | |
| Net increase in net asset value | 0.00 | 0.00 | 0.00 | 0.00 | 0.00 |
Net Asset Value at end of period | $1.00 | $1.00 | $1.00 | $1.00 | $1.00 |
Total Return3 (%) | 0.00 | 0.00 | 0.00 | 1.75 | 4.71 |
| Ratios/Supplemental Data: | | | | | |
| Net Assets at end of period (in 000’s) | $61,682 | $69,634 | $92,463 | $159,349 | $111,333 |
| Ratios of expenses to average net assets: | | | | | |
| Before waiver of expenses by Adviser (%) | 0.47 | 0.47 | 0.47 | 0.47 | 0.46 |
| After waiver of expenses by Adviser (%) | 0.087 | 0.147 | 0.287 | 0.47 | 0.46 |
| Ratio of net investment income to average net assets (%) | 0.00 | 0.00 | 0.00 | 1.67 | 4.58 |
| CLASS II | | | | |
Net Asset Value at beginning of period | $1.00 | $1.00 | $1.00 | |
| Income from Investment Operations: | | | | |
Net investment income2 | – | – | – | |
| Net realized and unrealized gain (loss) on investments | | | | |
| Total from investment operations | 0.00 | 0.00 | 0.00 | |
| Less Distributions: | | | | |
| Distributions from net investment income | | | | |
| Net increase in net asset value | 0.00 | 0.00 | 0.00 | |
Net Asset Value at end of period | $1.00 | $1.00 | $1.00 | |
Total Return3(%) | 0.00 | 0.00 | 0.005 | |
| Ratios/Supplemental Data: | | | | |
| Net Assets at end of period (in 000’s) | $979 | $577 | $185 | |
| Ratios of expenses to average net assets: | | | | |
| Before waiver of expenses by Adviser (%) | 0.72 | 0.73 | 0.736 | |
| After waiver of expenses by Adviser (%) | 0.077 | 0.167 | 0.206,7 | |
| Ratio of net investment income to average net assets (%) | 0.00 | 0.00 | 0.006 | |
| 1 | Commenced investment operations May 1, 2009 |
| 2 | Based on average shares outstanding during the year. |
| 3 | These returns are after all charges at the mutual fund level have been subtracted. These returns are higher than the returns at the separate account level because charges made at the separate account level have not been subtracted. Total returns are not annualized for periods less than one year. |
| 4 | Amounts represent less than $0.005 per share. |
| 5 | Not annualized. |
| 6 | Annualized. |
| 7 | Amount includes fees waived by the adviser (see Note 3). |
See accompanying Notes to Financial Statements.
Ultra Series Fund | December 31, 2011
Financial Highlights for a Share of Beneficial Interest Outstanding
|
| | |
| | | | | | |
| CLASS I | | | | | |
Net Asset Value at beginning of period | $10.29 | $10.14 | $ 9.94 | $10.19 | $10.11 |
| Income from Investment Operations: | | | | | |
Net investment income2 | 0.38 | 0.40 | 0.43 | 0.50 | 0.49 |
| Net realized and unrealized gain (loss) on investments | | | | | |
| Total from investment operations | 0.69 | 0.60 | 0.64 | 0.29 | 0.51 |
| Less Distributions: | | | | | |
| Distributions from net investment income | | | | | |
| Net increase (decrease) in net asset value | 0.28 | 0.15 | 0.20 | (0.25) | 0.08 |
Net Asset Value at end of period | $10.57 | $10.29 | $10.14 | $ 9.94 | $10.19 |
Total Return3 (%) | 6.73 | 5.92 | 6.50 | 2.86 | 5.05 |
| Ratios/Supplemental Data: | | | | | |
| Net Assets at end of period (in 000’s) | $375,325 | $429,499 | $541,789 | $572,562 | $646,233 |
| Ratios of expenses to average net assets (%) | 0.57 | 0.56 | 0.57 | 0.56 | 0.56 |
| Ratio of net investment income to average net assets (%) | 3.62 | 3.76 | 4.28 | 4.84 | 4.81 |
Portfolio Turnover6 (%) | 6 | 2 | 25 | 12 | 29 |
| CLASS II | | | | | |
Net Asset Value at beginning of period | $10.28 | $10.14 | $ 9.85 | | |
| Income from Investment Operations: | | | | | |
Net investment income2 | 0.36 | 0.37 | 0.27 | | |
| Net realized and unrealized gain (loss) on investments | | | | | |
| Total from investment operations | 0.67 | 0.57 | 0.55 | | |
| Less Distributions: | | | | | |
| Distributions from net investment income | | | | | |
| Net increase in net asset value | 0.28 | 0.14 | 0.29 | | |
Net Asset Value at end of period | $10.56 | $10.28 | $10.14 | | |
Total Return3(%) | 6.47 | 5.66 | 5.554 | | |
| Ratios/Supplemental Data: | | | | | |
| Net Assets at end of period (in 000’s) | $49,774 | $35,750 | $9,719 | | |
| Ratios of expenses to average net assets (%) | 0.82 | 0.81 | 0.825 | | |
| Ratio of net investment income to average net assets (%) | 3.36 | 3.49 | 3.865 | | |
Portfolio Turnover6 (%) | 6 | 2 | 254 | | |
| 1 | Commenced investment operations May 1, 2009. |
| 2 | Based on average shares outstanding during the year. |
| 3 | These returns are after all charges at the mutual fund level have been subtracted. These returns are higher than the returns at the separate account level because charges made at the separate account level have not been subtracted. Total returns are not annualized for periods less than one year. |
| 4 | Not annualized. |
| 5 | Annualized. |
| 6 | Portfolio Turnover is calculated at the fund level and represents the entire fiscal year or period. |
See accompanying Notes to Financial Statements.
Ultra Series Fund | December 31, 2011
Financial Highlights for a Share of Beneficial Interest Outstanding
|
| | |
| | | | | | |
| CLASS I | | | | | |
Net Asset Value at beginning of period | $ 9.42 | $ 9.11 | $ 7.34 | $ 9.54 | $10.16 |
| Income from Investment Operations: | | | | | |
Net investment income2 | 0.65 | 0.72 | 0.68 | 0.67 | 0.76 |
| Net realized and unrealized gain (loss) on investments | | | | | |
| Total from investment operations | 0.47 | 1.07 | 2.48 | (1.40) | 0.23 |
| Less Distributions: | | | | | |
| Distributions from net investment income | (0.71) | (0.76) | (0.71) | (0.80) | (0.85) |
| Distributions from capital gains | | | | | |
| Total distributions | (0.71) | (0.76) | (0.71) | (0.80) | (0.85) |
| Net increase (decrease) in net asset value | (0.24) | 0.31 | 1.77 | (2.20) | (0.62) |
Net Asset Value at end of period | $ 9.18 | $ 9.42 | $ 9.11 | $ 7.34 | $ 9.54 |
Total Return3 (%) | 5.01 | 11.73 | 34.29 | (14.74) | 2.29 |
| Ratios/Supplemental Data: | | | | | |
| Net Assets at end of period (in 000’s) | $86,462 | $95,552 | $107,722 | $90,728 | $135,045 |
| Ratios of expenses to average net assets (%) | 0.77 | 0.77 | 0.77 | 0.76 | 0.76 |
| Ratio of net investment income to average net assets (%) | 6.76 | 7.54 | 7.94 | 7.42 | 7.27 |
Portfolio Turnover7 (%) | 54 | 53 | 73 | 45 | 73 |
| CLASS II | | | | | |
Net Asset Value at beginning of period | $ 9.42 | $ 9.11 | $ 8.14 | | |
| Income from Investment Operations: | | | | | |
Net investment income2 | 0.63 | 0.70 | 0.47 | | |
| Net realized and unrealized gain (loss) on investments | | | | | |
| Total from investment operations | 0.45 | 1.04 | 1.43 | | |
| Less Distributions: | | | | | |
| Distributions from net investment income | | | | | |
| Net increase in net asset value | (0.23) | 0.31 | 0.97 | | |
Net Asset Value at end of period | $ 9.19 | $ 9.42 | $ 9.11 | | |
Total Return3(%) | 4.75 | 11.45 | 17.495 | | |
| Ratios/Supplemental Data: | | | | | |
| Net Assets at end of period (in 000’s) | $6,213 | $4,286 | $1,148 | | |
| Ratios of expenses to average net assets (%) | 1.02 | 1.01 | 1.016 | | |
| Ratio of net investment income to average net assets (%) | 6.52 | 7.20 | 7.656 | | |
Portfolio Turnover7 (%) | 54 | 53 | 735 | | |
| 1 | Commenced investment operations May 1, 2009. |
| 2 | Based on average shares outstanding during the year. |
| 3 | These returns are after all charges at the mutual fund level have been subtracted. These returns are higher than the returns at the separate account level because charges made at the separate account level have not been subtracted. Total returns are not annualized for periods less than one year. |
| 4 | Amounts represent less than $0.005 per share. |
| 5 | Not annualized. |
| 6 | Annualized. |
| 7 | Portfolio Turnover is calculated at the fund level and represents the entire fiscal year or period. |
See accompanying Notes to Financial Statements.
Ultra Series Fund | December 31, 2011
Financial Highlights for a Share of Beneficial Interest Outstanding
|
| | |
| | | | | | |
| CLASS I | | | | | |
Net Asset Value at beginning of period | $16.62 | $15.37 | $14.46 | $17.62 | $18.46 |
| Income from Investment Operations: | | | | | |
Net investment income2 | 0.51 | 0.56 | 0.60 | 0.72 | 0.79 |
| Net realized and unrealized gain (loss) on investments | | | | | |
| Total from investment operations | 1.30 | 1.85 | 1.52 | (2.33) | 0.47 |
| Less Distributions: | | | | | |
| Distributions from net investment income | (0.53) | (0.60) | (0.61) | (0.81) | (0.80) |
| Distributions from capital gains | | | | | |
| Total distributions | (0.53) | (0.60) | (0.61) | (0.83) | (1.31) |
| Net increase (decrease) in net asset value | 0.77 | 1.25 | 0.91 | (3.16) | (0.84) |
Net Asset Value at end of period | $17.39 | $16.62 | $15.37 | $14.46 | $17.62 |
Total Return3 (%) | 7.84 | 12.04 | 10.74 | (13.25) | 2.51 |
| Ratios/Supplemental Data: | | | | | |
| Net Assets at end of period (in 000’s) | $372,852 | $384,709 | $418,381 | $438,047 | $637,606 |
| Ratios of expenses to average net assets (%) | 0.72 | 0.72 | 0.72 | 0.71 | 0.71 |
| Ratio of net investment income to average net assets (%) | 2.94 | 3.50 | 4.12 | 4.37 | 4.21 |
Portfolio Turnover6 (%) | 19 | 23 | 26 | 14 | 41 |
| CLASS II | | | | | |
Net Asset Value at beginning of period | $16.61 | $15.37 | $13.74 | | |
| Income from Investment Operations: | | | | | |
Net investment income2 | 0.46 | 0.52 | 0.35 | | |
| Net realized and unrealized gain (loss) on investments | | | | | |
| Total from investment operations | 1.25 | 1.81 | 1.99 | | |
| Less Distributions: | | | | | |
| Distributions from net investment income | | | | | |
| Net increase in net asset value | 0.76 | 1.24 | 1.63 | | |
Net Asset Value at end of period | $17.37 | $16.61 | $15.37 | | |
Total Return3(%) | 7.57 | 11.77 | 14.434 | | |
| Ratios/Supplemental Data: | | | | | |
| Net Assets at end of period (in 000’s) | $30,360 | $22,309 | $6,261 | | |
| Ratios of expenses to average net assets (%) | 0.97 | 0.97 | 0.975 | | |
| Ratio of net investment income to average net assets (%) | 2.69 | 3.20 | 3.445 | | |
Portfolio Turnover6 (%) | 19 | 23 | 264 | | |
| 1 | Commenced investment operations May 1, 2009 |
| 2 | Based on average shares outstanding during the year. |
| 3 | These returns are after all charges at the mutual fund level have been subtracted. These returns are higher than the returns at the separate account level because charges made at the separate account level have not been subtracted. Total returns are not annualized for periods less than one year. |
| 4 | Not annualized. |
| 5 | Annualized. |
| 6 | Portfolio Turnover is calculated at the fund level and represents the entire fiscal year or period. |
See accompanying Notes to Financial Statements.
Ultra Series Fund | December 31, 2011
Financial Highlights for a Share of Beneficial Interest Outstanding
|
| | Year Ended December 31, 12/31/2011 | |
| CLASS I | | |
Net Asset Value at beginning of period | $10.37 | $10.00 |
| Income from Investment Operations: | | |
Net investment income2 | 0.01 | (0.02) |
| Net realized and unrealized gain (loss) on investments | | |
| Total from investment operations | 0.11 | 0.62 |
| Less Distributions: | | |
| Distributions from net investment income | – | – |
| Distributions from capital gains | | |
| Total distributions | (1.07) | (0.25) |
| Net increase (decrease) in net asset value | (0.96) | 0.37 |
Net Asset Value at end of period | $9.41 | $10.37 |
Total Return6 (%) | 1.08 | 6.244 |
| Ratios/Supplemental Data: | | |
| Net Assets at end of period (in 000’s) | $483 | $478 |
| Ratios of expenses to average net assets (%) | 0.91 | 0.913 |
| Ratio of net investment income to average net assets (%) | 0.10 | (0.34)3 |
Portfolio Turnover5 (%) | 84 | 494 |
| | | |
| CLASS II | Year Ended December 31, 12/31/2011 | |
Net Asset Value at beginning of period | $10.35 | $10.00 |
| Income from Investment Operations: | | |
Net investment income2 | – | (0.02) |
| Net realized and unrealized gain (loss) on investments | | |
| Total from investment operations | 0.08 | 0.60 |
| Less Distributions: | | |
| Distributions from net investment income | – | – |
| Distributions from capital gains | | |
| Total distributions | (1.07) | (0.25) |
| Net increase in net asset value | (0.99) | 0.35 |
Net Asset Value at end of period | $9.36 | $10.35 |
Total Return6 (%) | 0.84 | 6.074 |
| Ratios/Supplemental Data: | | |
| Net Assets at end of period (in 000’s) | $2,460 | $1,743 |
| Ratios of expenses to average net assets (%) | 1.16 | 1.173 |
| Ratio of net investment income to average net assets (%) | (0.12) | (0.46)3 |
Portfolio Turnover5 (%) | 84 | 494 |
| 1 | Commenced investment operations May 1, 2010. |
| 2 | Based on average shares outstanding during the period. |
| 3 | Annualized. |
| 4 | Not annualized. |
| 5 | Portfolio Turnover is calculated at the fund level and represents the entire period. |
| 6 | These returns are after all charges at the mutual fund level have been subtracted. These returns are higher than the returns at the separate account level because charges made at the separate account level have not been subtracted. Total returns are not annualized for periods less than one year. |
See accompanying Notes to Financial Statements.
Ultra Series Fund | December 31, 2011
Financial Highlights for a Share of Beneficial Interest Outstanding
|
| | |
| | | | | | |
| CLASS I | | | | | |
Net Asset Value at beginning of period | $23.56 | $22.17 | $19.42 | $31.49 | $35.14 |
| Income from Investment Operations: | | | | | |
Net investment income2 | 0.50 | 0.38 | 0.43 | 0.65 | 0.68 |
| Net realized and unrealized gain (loss) on investments | | | | | |
| Total from investment operations | 1.74 | 1.84 | 3.19 | (11.34) | 0.23 |
| Less Distributions: | | | | | |
| Distributions from net investment income | (0.52) | (0.45) | (0.44) | (0.71) | (0.71) |
| Distributions from capital gains | | | | | |
| Total distributions | (0.52) | (0.45) | (0.44) | (0.73) | (3.88) |
| Net increase (decrease) in net asset value | 1.22 | 1.39 | 2.75 | (12.07) | (3.65) |
Net Asset Value at end of period | $24.78 | $ 23.56 | $22.17 | $19.42 | $31.49 |
Total Return3 (%) | 7.38 | 8.29 | 16.79 | (35.99) | 0.60 |
| Ratios/Supplemental Data: | | | | | |
| Net Assets at end of period (in 000’s) | $485,978 | $524,894 | $630,764 | $609,444 | $1,229,433 |
| Ratios of expenses to average net assets (%) | 0.62 | 0.62 | 0.62 | 0.61 | 0.61 |
| Ratio of net investment income to average net assets (%) | 2.03 | 1.72 | 2.23 | 2.42 | 1.87 |
Portfolio Turnover6 (%) | 29 | 63 | 81 | 38 | 45 |
| CLASS II | | | | | |
Net Asset Value at beginning of period | $23.54 | $22.17 | $17.74 | | |
| Income from Investment Operations: | | | | | |
Net investment income2 | 0.43 | 0.34 | 0.18 | | |
| Net realized and unrealized gain (loss) on investments | | | | | |
| Total from investment operations | 1.68 | 1.78 | 4.63 | | |
| Less Distributions: | | | | | |
| Distributions from net investment income | | | | | |
| Net increase in net asset value | 1.19 | 1.37 | 4.43 | | |
Net Asset Value at end of period | $24.73 | $23.54 | $22.17 | | |
Total Return3(%) | 7.11 | 8.02 | 26.094 | | |
| Ratios/Supplemental Data: | | | | | |
| Net Assets at end of period (in 000’s) | $5,697 | $5,354 | $2,552 | | |
| Ratios of expenses to average net assets (%) | 0.87 | 0.87 | 0.875 | | |
| Ratio of net investment income to average net assets (%) | 1.78 | 1.51 | 1.285 | | |
Portfolio Turnover6 (%) | 29 | 63 | 814 | | |
| 1 | Commenced investment operations May 1, 2009. |
| 2 | Based on average shares outstanding during the year. |
| 3 | These returns are after all charges at the mutual fund level have been subtracted. These returns are higher than the returns at the separate account level because charges made at the separate account level have not been subtracted. Total returns are not annualized for periods less than one year. |
| 4 | Not annualized. |
| 5 | Annualized. |
| 6 | Portfolio Turnover is calculated at the fund level and represents the entire fiscal year or period. |
See accompanying Notes to Financial Statements.
Ultra Series Fund | December 31, 2011
Financial Highlights for a Share of Beneficial Interest Outstanding
|
| | |
| | | | | | |
| CLASS I | | | | | |
Net Asset Value at beginning of period | $22.16 | $19.87 | $14.50 | $23.36 | $21.47 |
| Income from Investment Operations: | | | | | |
Net investment income2 | 0.05 | 0.10 | 0.12 | 0.12 | 0.08 |
| Net realized and unrealized gain (loss) on investments | | | | | |
| Total from investment operations | (0.26) | 2.41 | 5.49 | (8.68) | 2.67 |
| Less Distributions: | | | | | |
| Distributions from net investment income | (0.06) | (0.12) | (0.12) | (0.14) | (0.09) |
| Distributions from capital gains | | | | | |
| Total distributions | (0.06) | (0.12) | (0.12) | (0.18) | (0.78) |
| Net increase (decrease) in net asset value | (0.32) | 2.29 | 5.37 | (8.86) | 1.89 |
Net Asset Value at end of period | $21.84 | $22.16 | $19.87 | $14.50 | $23.36 |
Total Return3 (%) | (1.19) | 12.13 | 37.98 | (37.20) | 12.36 |
| Ratios/Supplemental Data: | | | | | |
| Net Assets at end of period (in 000’s) | $331,032 | $374,644 | $433,483 | $352,473 | $665,240 |
| Ratios of expenses to average net assets (%) | 0.82 | 0.82 | 0.82 | 0.82 | 0.81 |
| Ratio of net investment income to average net assets (%) | 0.24 | 0.51 | 0.72 | 0.62 | 0.34 |
Portfolio Turnover8 (%) | 85 | 78 | 89 | 123 | 76 |
| CLASS II | | | | | |
Net Asset Value at beginning of period | $22.14 | $19.87 | $15.78 | | |
| Income from Investment Operations: | | | | | |
Net investment income2 | (0.00)7 | 0.06 | 0.05 | | |
| Net realized and unrealized gain (loss) on investments | | | | | |
| Total from investment operations | (0.32) | 2.36 | 4.14 | | |
| Less Distributions: | | | | | |
| Distributions from net investment income | | | | | |
| Net increase in net asset value | (0.34) | 2.27 | 4.09 | | |
Net Asset Value at end of period | $21.80 | $22.14 | $19.87 | | |
Total Return3(%) | (1.43) | 11.85 | 26.214 | | |
| Ratios/Supplemental Data: | | | | | |
| Net Assets at end of period (in 000’s) | $27,589 | $20,802 | $6,003 | | |
| Ratios of expenses to average net assets (%) | 1.07 | 1.07 | 1.075 | | |
| Ratio of net investment income to average net assets (%) | –6 | 0.29 | 0.365 | | |
Portfolio Turnover8 (%) | 85 | 78 | 894 | | |
| 1 | Commenced investment operations May 1, 2009. |
| 2 | Based on average shares outstanding during the year. |
| 3 | These returns are after all charges at the mutual fund level have been subtracted. These returns are higher than the returns at the separate account level because charges made at the separate account level have not been subtracted. Total returns are not annualized for periods less than one year. |
| 4 | Not annualized. |
| 5 | Annualized. |
| 6 | Amount represents less than 0.01%. |
| 7 | Amount represents less than $0.005 per share. |
| 8 | Portfolio Turnover is calculated at the fund level and represents the entire fiscal year or period. |
See accompanying Notes to Financial Statements.
Ultra Series Fund | December 31, 2011
Financial Highlights for a Share of Beneficial Interest Outstanding
|
| | |
| | | | | | |
| CLASS I | | | | | |
Net Asset Value at beginning of period | $14.14 | $11.82 | $ 8.01 | $15.31 | $15.68 |
| Income from Investment Operations: | | | | | |
Net investment income2 | 0.02 | 0.04 | 0.005 | 0.005 | (0.08) |
| Net realized and unrealized gain (loss) on investments | | | | | |
| Total from investment operations | 0.64 | 2.37 | 3.81 | (7.13) | 1.33 |
| Less Distributions: | | | | | |
| Distributions from net investment income | (0.03) | (0.05) | (0.00)5 | (0.00)5 | – |
| Distributions from capital gains | | | | | |
| Total distributions | (0.03) | (0.05) | (0.00) | (0.16) | (1.70) |
| Net increase (decrease) in net asset value | 0.61 | 2.32 | 3.81 | (7.29) | (0.37) |
Net Asset Value at end of period | $14.75 | $14.14 | $11.82 | $ 8.01 | $15.31 |
Total Return4(%) | 4.47 | 20.12 | 47.28 | (46.89) | 8.44 |
| Ratios/Supplemental Data: | | | | | |
| Net Assets at end of period (in 000’s) | $351,833 | $385,219 | $229,395 | $166,465 | $367,318 |
| Ratios of expenses to average net assets (%) | 0.91 | 0.90 | 0.87 | 0.87 | 0.86 |
| Ratio of net investment income to average net assets (%) | 0.16 | 0.42 | (0.05) | 0.09 | (0.41) |
Portfolio Turnover8 (%) | 52 | 46 | 186 | 108 | 104 |
| CLASS II | | | | | |
Net Asset Value at beginning of period | $14.13 | $11.82 | $ 9.36 | | |
| Income from Investment Operations: | | | | | |
Net investment income2 | (0.01) | 0.04 | (0.00)5 | | |
| Net realized and unrealized gain (loss) on investments | | | | | |
| Total from investment operations | 0.59 | 2.34 | 2.45 | | |
| Less Distributions: | | | | | |
| Distributions from net investment income | | | | | |
| Net increase in net asset value | 0.59 | 2.31 | 2.45 | | |
Net Asset Value at end of period | $14.72 | $14.13 | $11.82 | | |
Total Return4(%) | 4.22 | 19.82 | 26.136 | | |
| Ratios/Supplemental Data: | | | | | |
| Net Assets at end of period (in 000’s) | $13,270 | $11,951 | $1,745 | | |
| Ratios of expenses to average net assets (%) | 1.17 | 1.16 | 1.127 | | |
| Ratio of net investment income to average net assets (%) | (0.07) | 0.38 | (0.14)7 | | |
Portfolio Turnover8 (%) | 52 | 46 | 1866 | | |
| 1 | Commenced investment operations May 1, 2009 |
| 2 | Based on average shares outstanding during the year. |
| 3 | The financial highlights prior to May 1, 2010 are those of the Mid Cap Growth Fund, the accounting survivor of the reorganization of the Mid Cap Value and Mid Cap Growth Funds. The net asset values and other per share information of the Mid Cap Growth Fund have been restated by the conversion ration of 2.6623 for Class I shares and 2.6678 for Class II shares to reflect those of the legal survivor of the reorganization the Mid Cap Value Fund, which was renamed the Mid Cap Fund after the reorganization. |
| 4 | These returns are after all charges at the mutual fund level have been subtracted. These returns are higher than the returns at the separate account level because charges made at the separate account level have not been subtracted. Total returns are not annualized for periods less than one year. |
| 5 | Amounts represents less than $0.005 per share. |
| 6 | Not annualized. |
| 7 | Annualized. |
| 8 | Portfolio Turnover is calculated at the fund level and represents the entire fiscal year or period. |
See accompanying Notes to Financial Statements.
Ultra Series Fund | December 31, 2011
Financial Highlights for a Share of Beneficial Interest Outstanding
|
| | | |
| | | | | |
| CLASS I | | | | | |
Net Asset Value at beginning of period | $10.75 | $ 8.54 | $ 6.53 | $ 8.86 | $10.00 |
| Income from Investment Operations: | | | | | |
Net investment income3 | 0.04 | 0.08 | 0.05 | 0.08 | 0.09 |
| Net realized and unrealized gain (loss) on investments | | | | | |
| Total from investment operations | 0.10 | 2.28 | 2.05 | (2.26) | (0.96) |
| Less Distributions: | | | | | |
| Distributions from net investment income | (0.04) | (0.07) | (0.04) | (0.07) | (0.08) |
| Distributions from capital gains | | | | | |
| Total distributions | (0.04) | (0.07) | (0.04) | (0.07) | (0.18) |
| Net increase (decrease) in net asset value | 0.06 | 2.21 | 2.01 | (2.33) | (1.14) |
Net Asset Value at end of period | $10.81 | $10.75 | $ 8.54 | $ 6.53 | $ 8.86 |
Total Return4 (%) | 0.91 | 26.80 | 31.56 | (25.54) | (9.62)5 |
| Ratios/Supplemental Data: | | | | | |
| Net Assets at end of period (in 000’s) | $11,261 | $11,710 | $7,989 | $5,986 | $5,624 |
| Ratios of expenses to average net assets (%) | 1.11 | 1.11 | 1.11 | 1.12 | 1.046 |
| Ratio of net investment income to average net assets (%) | 0.41 | 0.85 | 0.77 | 1.03 | 1.456 |
Portfolio Turnover7 (%) | 22 | 33 | 21 | 28 | 135 |
| | | | | | |
| CLASS II | | | | | |
Net Asset Value at beginning of period | $10.74 | $ 8.54 | $ 6.50 | | |
| Income from Investment Operations: | | | | | |
Net investment income3 | 0.02 | 0.06 | 0.02 | | |
| Net realized and unrealized gain (loss) on investments | | | | | |
| Total from investment operations | 0.08 | 2.26 | 2.05 | | |
| Less Distributions: | | | | | |
| Distributions from net investment income | | | | | |
| Net increase in net asset value | 0.05 | 2.20 | 2.04 | | |
Net Asset Value at end of period | $10.79 | $10.74 | $ 8.54 | | |
Total Return4(%) | 0.66 | 26.48 | 31.575 | | |
| Ratios/Supplemental Data: | | | | | |
| Net Assets at end of period (in 000’s) | $1,401 | $1,387 | $616 | | |
| Ratios of expenses to average net assets (%) | 1.36 | 1.36 | 1.366 | | |
| Ratio of net investment income to average net assets (%) | 0.16 | 0.67 | 0.446 | | |
Portfolio Turnover7 (%) | 22 | 33 | 215 | | |
| 1 | Commenced investment operations May 1, 2007. |
| 2 | Commenced investment operations May 1, 2009. |
| 3 | Based on average shares outstanding during the year. |
| 4 | These returns are after all charges at the mutual fund level have been subtracted. These returns are higher than the returns at the separate account level because charges made at the separate account level have not been subtracted. Total returns are not annualized for periods less than one year. |
| 5 | Not annualized. |
| 6 | Annualized. |
| 7 | Portfolio Turnover is calculated at the fund level and represents the entire fiscal year or period |
| 8 | Amount represents less than $0.005 per share. |
See accompanying Notes to Financial Statements.
Ultra Series Fund | December 31, 2011
Financial Highlights for a Share of Beneficial Interest Outstanding
|
| | |
| | | | | | |
| CLASS I | | | | | |
Net Asset Value at beginning of period | $ 9.99 | $ 9.53 | $ 7.59 | $13.40 | $13.78 |
| Income from Investment Operations: | | | | | |
Net investment income2 | 0.19 | 0.14 | 0.17 | 0.26 | 0.23 |
| Net realized and unrealized gain (loss) on investments | | | | | |
| Total from investment operations | (0.77) | 0.67 | 2.12 | (5.01) | 1.59 |
| Less Distributions: | | | | | |
| Distributions from net investment income | (0.19) | (0.21) | (0.18) | (0.26) | (0.32) |
| Distributions from capital gains | | | | | |
| Total distributions | (0.19) | (0.21) | (0.18) | (0.80) | (1.97) |
| Net increase (decrease) in net asset value | (0.96) | 0.46 | 1.94 | (5.81) | (0.38) |
Net Asset Value at end of period | $ 9.03 | $ 9.99 | $ 9.53 | $ 7.59 | $13.40 |
Total Return3 (%) | (7.70) | 7.09 | 27.90 | (38.62) | 11.42 |
| Ratios/Supplemental Data: | | | | | |
| Net Assets at end of period (in 000’s) | $72,756 | $92,063 | $77,997 | $72,768 | $164,151 |
| Ratios of expenses to average net assets (%) | 1.22 | 1.22 | 1.22 | 1.22 | 1.21 |
| Ratio of net investment income to average net assets (%) | 1.90 | 1.48 | 2.08 | 2.45 | 1.60 |
Portfolio Turnover6 (%) | 38 | 79 | 87 | 43 | 62 |
| CLASS II | | | | | |
Net Asset Value at beginning of period | $ 9.99 | $ 9.53 | $ 7.32 | | |
| Income from Investment Operations: | | | | | |
Net investment income2 | 0.16 | 0.09 | 0.04 | | |
| Net realized and unrealized gain (loss) on investments | | | | | |
| Total from investment operations | (0.80) | 0.65 | 2.37 | | |
| Less Distributions: | | | | | |
| Distributions from net investment income | | | | | |
| Net increase in net asset value | (0.97) | 0.46 | 2.21 | | |
Net Asset Value at end of period | $ 9.02 | $ 9.99 | $ 9.53 | | |
Total Return3(%) | (7.91) | 6.83 | 32.304 | | |
| Ratios/Supplemental Data: | | | | | |
| Net Assets at end of period (in 000’s) | $15,407 | $13,241 | $3,962 | | |
| Ratios of expenses to average net assets (%) | 1.47 | 1.47 | 1.485 | | |
| Ratio of net investment income to average net assets (%) | 1.58 | 1.00 | 0.575 | | |
Portfolio Turnover6 (%) | 38 | 79 | 874 | | |
| 1 | Commenced investment operations May 1, 2009. |
| 2 | Based on average shares outstanding during the year. |
| 3 | These returns are after all charges at the mutual fund level have been subtracted. These returns are higher than the returns at the separate account level because charges made at the separate account level have not been subtracted. Total returns are not annualized for periods less than one year. |
| 4 | Not annualized. |
| 5 | Annualized. |
| 6 | Portfolio Turnover is calculated at the fund level and represents the entire fiscal year or period. |
See accompanying Notes to Financial Statements.
Ultra Series Fund | December 31, 2011
Financial Highlights for a Share of Beneficial Interest Outstanding
MADISON TARGET RETIREMENT 2020 FUND |
| | | |
| | | | | |
| CLASS I | | | | | |
Net Asset Value at beginning of period | $8.06 | $ 7.64 | $ 6.04 | $ 9.63 | $10.00 |
| Income from Investment Operations: | | | | | |
Net investment income2 | 0.22 | 0.20 | 0.15 | 0.22 | 0.13 |
| Net realized and unrealized gain (loss) on investments | | | | | |
| Total from investment operations | 0.18 | 0.69 | 1.74 | (3.38) | (0.19) |
| Less Distributions: | | | | | |
| Distributions from net investment income | (0.23) | (0.27) | (0.14) | (0.16) | (0.18) |
| Distributions from capital gains | | | | | |
| Total distributions | (0.42) | (0.27) | (0.14) | (0.21) | (0.18) |
| Net increase (decrease) in net asset value | (0.24) | 0.42 | 1.60 | (3.59) | (0.37) |
Net Asset Value at end of period | $7.82 | $ 8.06 | $ 7.64 | $ 6.04 | $ 9.63 |
Total Return3 (%) | 2.11 | 9.01 | 28.93 | (35.31) | (1.94)4 |
| Ratios/Supplemental Data: | | | | | |
| Net Assets at end of period (in 000’s) | $39,580 | $27,648 | $19,300 | $8,719 | $2,524 |
| Ratios of expenses to average net assets | | | | | |
| Before reimbursement of expenses by Adviser (%) | 0.26 | 0.40 | 0.41 | 0.40 | 0.435 |
| After reimbursement of expenses by Adviser (%) | 0.246 | 0.206 | 0.346 | 0.40 | 0.435 |
| Ratio of net investment income to average net assets (%) | 2.70 | 2.61 | 2.24 | 2.80 | 5.175 |
Portfolio Turnover7 (%) | 114 | 51 | 78 | 74 | 34 |
| 1 | Commenced investment operations May 1, 2007. |
| 2 | Based on average shares outstanding during the year. |
| 3 | These returns are after all charges at the mutual fund level have been subtracted. These returns are higher than the returns at the separate account level because charges made at the separate account level have not been subtracted. Total returns are not annualized for periods less than one year. |
| 4 | Not annualized. |
| 5 | Annualized. |
| 6 | Amount includes fees waived by the Adviser through a contractual management fee reduction (see Note 3.) |
| 7 | Portfolio Turnover is calculated at the fund level and represents the entire fiscal year or period. |
See accompanying Notes to Financial Statements.
Ultra Series Fund | December 31, 2011
Financial Highlights for a Share of Beneficial Interest Outstanding
MADISON TARGET RETIREMENT 2030 FUND |
| | | |
| | | | | |
| CLASS I | | | | | |
Net Asset Value at beginning of period | $ 7.90 | $ 7.41 | $ 5.75 | $ 9.54 | $10.00 |
| Income from Investment Operations: | | | | | |
Net investment income2 | 0.19 | 0.18 | 0.12 | 0.18 | 0.09 |
| Net realized and unrealized gain (loss) on investments | | | | | |
| Total from investment operations | 0.10 | 0.70 | 1.77 | (3.64) | (0.25) |
| Less Distributions: | | | | | |
| Distributions from net investment income | (0.20) | (0.21) | (0.11) | (0.11) | (0.21) |
| Distributions from capital gains | | | | | |
| Total distributions | (0.51) | (0.21) | (0.11) | | (0.21) |
| Net increase (decrease) in net asset value | (0.41) | 0.49 | 1.66 | (3.79) | (0.46) |
Net Asset Value at end of period | $ 7.49 | $ 7.90 | $ 7.41 | $ 5.75 | $ 9.54 |
Total Return3 (%) | 1.16 | 9.56 | 30.94 | (38.35) | (2.51)4 |
| Ratios/Supplemental Data: | | | | | |
| Net Assets at end of period (in 000’s) | $45,404 | $31,279 | $19,330 | $8,010 | $1,521 |
| Ratios of expenses to average net assets | | | | | |
| Before reimbursement of expenses by Adviser (%) | 0.26 | 0.40 | 0.41 | 0.40 | 0.445 |
| After reimbursement of expenses by Adviser (%) | 0.246 | 0.206 | 0.346 | 0.40 | 0.445 |
| Ratio of net investment income to average net assets (%) | 2.43 | 2.42 | 1.87 | 2.38 | 3.535 |
Portfolio Turnover7 (%) | 108 | 43 | 78 | 52 | 154 |
| 1 | Commenced investment operations May 1, 2007. |
| 2 | Based on average shares outstanding during the year. |
| 3 | These returns are after all charges at the mutual fund level have been subtracted. These returns are higher than the returns at the separate account level because charges made at the separate account level have not been subtracted. Total returns are not annualized for periods less than one year. |
| 4 | Not annualized. |
| 5 | Annualized. |
| 6 | Amount includes fees waived by the Adviser through a contractual management fee reduction (see Note 3.) |
| 7 | Portfolio Turnover is calculated at the fund level and represents the entire fiscal year or period. |
See accompanying Notes to Financial Statements.
Ultra Series Fund | December 31, 2011
Financial Highlights for a Share of Beneficial Interest Outstanding
MADISON TARGET RETIREMENT 2040 FUND |
| | | |
| | | | | |
| CLASS I | | | | | |
Net Asset Value at beginning of period | $ 7.60 | $ 7.07 | $ 5.43 | $ 9.48 | $10.00 |
| Income from Investment Operations: | | | | | |
Net investment income2 | 0.16 | 0.15 | 0.08 | 0.14 | 0.07 |
| Net realized and unrealized gain (loss) on investments | | | | | |
| Total from investment operations | 0.04 | 0.70 | 1.71 | (3.92) | (0.29) |
| Less Distributions: | | | | | |
| Distributions from net investment income | (0.17) | (0.17) | (0.07) | (0.08) | (0.23) |
| Distributions from capital gains | | | | | |
| Total distributions | (0.58) | (0.17) | | | (0.23) |
| Net increase (decrease) in net asset value | (0.54) | 0.53 | 1.64 | (4.05) | (0.52) |
Net Asset Value at end of period | $ 7.06 | $ 7.60 | $ 7.07 | $ 5.43 | $ 9.48 |
Total Return3 (%) | 0.47 | 9.97 | 31.64 | (41.65) | (2.86)4 |
| Ratios/Supplemental Data: | | | | | |
| Net Assets at end of period (in 000’s) | $35,182 | $26,147 | $16,656 | $6,385 | $1,193 |
| Ratios of expenses to average net assets | | | | | |
| Before reimbursement of expenses by Adviser (%) | 0.26 | 0.40 | 0.41 | 0.40 | 0.445 |
| After reimbursement of expenses by Adviser (%) | 0.246 | 0.206 | 0.346 | 0.40 | 0.445 |
| Ratio of net investment income to average net assets (%) | 2.11 | 2.14 | 1.22 | 1.99 | 2.765 |
Portfolio Turnover7 (%) | 115 | 40 | 86 | 62 | 14 |
| 1 | Commenced investment operations May 1, 2007. |
| 2 | Based on average shares outstanding during the year. |
| 3 | These returns are after all charges at the mutual fund level have been subtracted. These returns are higher than the returns at the separate account level because charges made at the separate account level have not been subtracted. Total returns are not annualized for periods less than one year. |
| 4 | Not annualized. |
| 5 | Annualized. |
| 6 | Amount includes fees waived by the Adviser through a contractual management fee reduction (see Note 3.) |
| 7 | Portfolio Turnover is calculated at the fund level and represents the entire fiscal year or period. |
See accompanying Notes to Financial Statements.
Ultra Series Fund | December 31, 2011
Financial Highlights for a Share of Beneficial Interest Outstanding
MADISON TARGET RETIREMENT 2050 FUND |
| | |
| |
| CLASS I | |
Net Asset Value at beginning of period | $10.00 |
| Income from Investment Operations: | |
Net investment income2 | 0.26 |
| Net realized and unrealized gain (loss) on investments | |
| Total from investment operations | (0.10) |
| Less Distributions: | |
| Distributions from net investment income | (0.14) |
| Distributions from return of capital | |
| Net increase (decrease) in net asset value | (0.25) |
Net Asset Value at end of period | $ 9.75 |
Total Return3 (%) | (1.03)5 |
| Ratios/Supplemental Data: | |
| Net Assets at end of period (in 000’s) | $2,236 |
| Ratios of expenses to average net assets | |
| Before reimbursement of expenses by Adviser (%) | 0.264 |
| After reimbursement of expenses by Adviser (%) | 0.264,6 |
| Ratio of net investment income to average net assets (%) | 2.614 |
Portfolio Turnover7 (%) | 755 |
| 1 | Commenced investment operations January 3, 2011. |
| 2 | Based on average shares outstanding during the year. |
| 3 | These returns are after all charges at the mutual fund level have been subtracted. These returns are higher than the returns at the separate account level because charges made at the separate account level have not been subtracted. Total returns are not annualized for periods less than one year. |
| 4 | Annualized. |
| 5 | Not annualized. |
| 6 | Amount includes fees waived by the Adviser through a contractual management fee reduction (see Note 3.) |
| 7 | Portfolio Turnover is calculated at the fund level and represents the entire fiscal year or period. |
See accompanying Notes to Financial Statements.
Ultra Series Fund | December 31, 2011
Notes to Financial Statements
1. ORGANIZATION
The Ultra Series Fund (the "Trust’’), a Massachusetts business trust, is registered under the Investment Company Act of 1940 (the "1940 Act’’), as amended, as a diversified, open-end management investment company. The Trust is a series fund with 17 investment portfolios (individually, a "fund", and collectively, the "funds’’), each with different investment objectives and policies. The funds currently available are the Money Market Fund, Bond Fund, High Income Fund, Diversified Income Fund, Equity Income Fund, Large Cap Value Fund, Large Cap Growth Fund, Mid Cap Fund, Small Cap Fund and International Stock Fund (collectively, the "Core Funds’’), the Conservative Allocation Fund, Moderate Allocation Fund and Aggressive Allocation Fund (collectively, the "Target Allocation Funds’’), and the Madison Target Retirement 2020 Fund, Madison Target Retirement 2030 Fund, Madison Target Retirement 2040 Fund, and Madison Target Retirement 2050 Fund, (collectively, the "Target Date Funds").
The Declaration of Trust permits the Board of Trustees to issue an unlimited number of full and fractional shares of the Trust without par value. All funds, except for the Target Date Funds, offer Class I and II shares. The Target Date Funds only offer a single class of shares, Class I shares. Each class of shares represents an interest in the assets of the respective fund and has identical voting, dividend, liquidation and other rights, except that each class of shares bears its own distribution fees, if any, and its proportional share of fund level expenses, and has exclusive voting rights on matters pertaining to Rule 12b-1 under the 1940 Act as it relates to that class and other class specific matters. Shares are offered to separate accounts (the "Accounts’’) of CMFG Life Insurance Company (formerly known as CUNA Mutual Insurance Society, or CMIS, see Note 13 Subsequent Events) and to qualified pension and retirement plans of CMFG Life Insurance Company or its affiliates ("CUNA Mutual Group’’). The Trust may, in the future, offer other share classes to separate accounts of insurance companies and to qualified pension and retirement plans that are not affiliated with CUNA Mutual Group. The Trust does not offer shares directly to the general public.
The Trust has entered into a Management Agreement with Madison Asset Management, LLC. (the "Investment Adviser" or "Madison"). The Investment Adviser, in turn, has entered into subadvisory agreements with certain subadvisers ("Subadvisers") for the management of the investments of the High Income, Small Cap and International Stock Funds.
2. SIGNIFICANT ACCOUNTING POLICIES
The preparation of financial statements requires management to make estimates and assumptions that affect the reported amounts of assets and liabilities and disclosure of contingent assets and liabilities at the date of the financial statements and the reported amounts of income and expenses during the reported period. Actual results could differ from those estimates. The following is a summary of significant accounting policies consistently followed by each fund in the preparation of its financial statements.
Portfolio Valuation: Equity securities and exchange-traded funds ("ETFs") listed on any U.S. or foreign stock exchange or quoted on the National Association of Securities Dealers Automated Quotation System ("NASDAQ’’) are valued at the last quoted sale price or official closing price on that exchange or NASDAQ on the valuation day (provided that, for securities traded on NASDAQ, the funds utilize the NASDAQ Official Closing Price). If no sale occurs, (a) equities traded on a U.S. exchange or on NASDAQ are valued at the mean between the closing bid and closing asked prices and (b) equity securities traded on a foreign exchange are valued at the official bid price. Debt securities purchased with a remaining maturity of 61 days or more are valued on the basis of last available bid prices or current market quotations provided by dealers or pricing services approved by the Trust. In determining the value of a particular investment, pricing services may use certain information with respect to transactions in such investments, quotations from dealers, pricing matrixes, market transactions in comparable investments, various relationships observed in the market between investments and calculated yield measures
Ultra Series Fund | December 31, 2011
Notes to Financial Statements
based on valuation technology commonly employed in the market for such investments. Asset-backed and mortgage-backed securities are valued by independent pricing services using models that consider estimated cash flows of each tranche of the security, establish a benchmark yield and develop an estimated tranche specific spread to the benchmark yield based on the unique attributes of the tranche.
Investments in shares of open-end mutual funds, including money market funds, are valued at their daily net asset value ("NAV") which is calculated as of the close of regular trading on the New York Stock Exchange (usually 4:00 p.m. Eastern Standard Time) on each day on which the New York Stock Exchange is open for business. NAV per share is determined by dividing each fund’s total net assets by the number of shares of such fund outstanding at the time of calculation. Because the assets of each Target Allocation and each Target Date Fund consist primarily of shares of underlying funds, the NAV of each fund is determined based on the NAV’s of the underlying funds. Total net assets are determined by adding the total current value of portfolio securities, cash, receivables, and other assets and subtracting liabilities. Short-term instruments having maturities of 60 days or less and all securities in the Money Market Fund are valued on an amortized cost basis, which approximates market value.
Over-the-counter securities not listed or traded on NASDAQ are valued at the last sale price on the valuation day. If no sale occurs on the valuation day, an over-the-counter security is valued at the mean between the last bid and asked prices. Over-the-counter options are valued based upon prices provided by market makers in such securities or dealers in such currencies. Exchange traded options are valued at the last sale or bid price on the exchange where such option contract is principally traded, except for the Equity Income Fund, where they are valued at the mean of the best bid and best ask prices across all option exchanges. Futures contracts generally are valued at the settlement price established by the exchange(s) on which the contracts are primarily traded. The Trust’s Pricing Committee (the "Committee’’) shall estimate the fair value of futures positions affected by the daily limit by using its valuation procedures for determining fair value, when necessary. Spot and forward foreign currency exchange contracts are valued based on quotations supplied by dealers in such contracts. Overnight repurchase agreements are valued at cost, and term repurchase agreements (i.e., those whose maturity exceeds seven days), swaps, caps, collars and floors are valued at the average of the closing bids obtained daily from at least one dealer.
The value of all assets and liabilities expressed in foreign currencies was converted into U.S. dollar values using the then current exchange rate at the close of regular trading on the New York Stock Exchange (usually 4:00 p.m. Eastern Standard Time).
All other securities for which either quotations are not readily available, no other sales have occurred, or in the Investment Adviser’s opinion, do not reflect the current market value, are appraised at their fair values as determined in good faith by the Committee and under the general supervision of the Board of Trustees. When fair value pricing of securities is employed, the prices of securities used by the funds to calculate NAV may differ from market quotations or official closing prices. Because the Target Allocation and Target Date Funds primarily invest in underlying funds, government securities and short-term paper, it is not anticipated that the Investment Adviser will need to "fair’’ value any of the investments of these funds. However, an underlying fund may need to "fair’’ value one or more of its investments, which may, in turn, require a Target Allocation or Target Date Fund to do the same because of delays in obtaining the underlying fund’s NAV.
A fund’s investments (or underlying fund) will be valued at fair value if in the judgment of the Committee an event impacting the value of an investment occurred between the closing time of a security’s primary market or exchange (for example, a foreign exchange or market) and the time the fund’s share price is calculated as of the close of regular trading on the New York Stock Exchange (usually 4:00 p.m. Eastern Standard Time). Significant events may include, but are not limited to, the following: (1) significant fluctuations in domestic markets, foreign markets or foreign currencies; (2) occurrences not directly tied to the securities markets such as natural disasters, armed conflicts or significant government actions; and (3) major
Ultra Series Fund | December 31, 2011
Notes to Financial Statements
announcements affecting a single issuer or an entire market or market sector. In responding to a significant event, the Committee would determine the fair value of affected securities considering factors including, but not limited to: fundamental analytical data relating to the investment; the nature and duration of any restrictions on the disposition of the investment; and the forces influencing the market(s) in which the investment is purchased or sold. The Committee may rely on an independent fair valuation service to adjust the valuations of foreign equity securities based on specific market-movement parameters established by the Committee and approved by the Trust.
Security Transactions and Investment Income: Security transactions are accounted for on a trade date basis. Net realized gains or losses on sales are determined by the identified cost method. Interest income is recorded on an accrual basis. Dividend income is recorded on ex-dividend date. Amortization and accretion are recorded on the effective yield method.
Expenses: Expenses that are directly related to one fund are charged directly to that fund. Other operating expenses are prorated to the funds on the basis of relative net assets. Class-specific expenses are borne by that class.
Classes: Income and realized and unrealized gains/losses are allocated to the respective classes on the basis of relative net assets.
Repurchase Agreements: Each fund may engage in repurchase agreements. In a repurchase agreement, a security is purchased for a relatively short period (usually not more than 7 days) subject to the obligation to sell it back to the issuer at a fixed time and price plus accrued interest. The funds will enter into repurchase agreements only with member banks of the Federal Reserve System and with "primary dealers’’ in U.S. Government securities. As of December 31, 2011, only the Equity Income Fund had open repurchase agreements.
The Trust has established a procedure providing that the securities serving as collateral for each repurchase agreement must be delivered to the Trust’s custodian either physically or in book-entry form and that the collateral must be marked to market daily to ensure that the repurchase agreement is fully collateralized at all times. In the event of bankruptcy or other default by a seller of a repurchase agreement, a fund could experience one of the following: delays in liquidating the underlying securities during the period in which the fund seeks to enforce its rights thereto, possible subnormal levels of income, declines in value of the underlying securities, or lack of access to income during this period and the expense of enforcing its rights.
In April 2011, the Financial Accounting Standards Board ("FASB") issued Accounting Standards Update ("ASU") No. 2011-03 "Reconsideration of Effective Control of Repurchase Agreements". ASU 2011-03 is an amendment to Topic 860 "Transfers and Servicing". These amendments simplify the accounting for repurchase agreements by eliminating the requirement that the transferor demonstrate it has adequate collateral to fund substantially all the cost of purchasing replacement assets. As a result, more arrangements could be accounted for as secured borrowings rather than sales. The guidance applies to public and nonpublic companies and is effective for interim and annual reporting periods beginning on or after December 15, 2011. The guidance should be applied prospectively to transactions or modifications of existing transactions that occur on or after the effective date. At this time, management is evaluating the implications of ASU 2011-03 and its impact on the funds’ financial statements.
Foreign Currency Transactions: The Trust’s books and records are maintained in U.S. dollars. Foreign currency denominated transactions (i.e., market value of investment securities, assets and liabilities, purchases and sales of investment securities, and income and expenses) are translated into U.S. dollars at the current rate of exchange. The funds enter into contracts on the trade date to settle any securities transactions denominated in foreign currencies on behalf of the funds at the spot rate at settlement.
Ultra Series Fund | December 31, 2011
Notes to Financial Statements
Each fund, except the Money Market Fund, which can only invest in U.S. dollar-denominated foreign money market securities, reports certain foreign currency-related transactions as components of realized gains or losses for financial reporting purposes, whereas such components are treated as ordinary income for federal income tax purposes. Only the International Stock Fund had net realized gains, and that amount of $3,126,039 is included in the Statements of Operations under the heading "Net realized gain (loss) on investments" for the International Stock Fund.
The funds do not isolate the portion of unrealized gains and losses on investments in securities that is due to changes in the foreign exchange rates from that which is due to changes in market prices of securities. Such amounts are categorized as unrealized gain or loss on investments for financial reporting purposes.
Forward Foreign Currency Exchange Contracts: Each fund, except the Money Market Fund, may purchase and sell forward foreign currency exchange contracts for defensive or hedging purposes. When entering into forward foreign currency exchange contracts, the funds agree to receive or deliver a fixed quantity of foreign currency for an agreed-upon price on an agreed future date. These contracts are valued daily. The funds’ net assets reflect unrealized gains or losses on the contracts as measured by the difference between the forward foreign currency exchange rates at the dates of entry into the contracts and the forward rates at the reporting date. The funds realize a gain or a loss at the time the forward foreign currency exchange contracts are settled or closed out with an offsetting contract. Realized and unrealized gains and losses are included in the Statements of Operations. As of December 31, 2011, none of the funds had open forward foreign currency exchange contracts.
If a fund enters into a forward foreign currency exchange contract to buy foreign currency for any purpose, the fund will be required to place cash or other liquid assets in a segregated account with the fund’s custodian in an amount equal to the value of the fund’s total assets committed to the consummation of the forward contract. If the value of the securities in the segregated account declines, additional cash or securities will be placed in the segregated account so that the value of the account will equal the amount of the fund’s commitment with respect to the contract.
Futures Contracts: Each fund, except the Money Market Fund, may purchase and sell futures contracts and purchase and write options on futures contracts. The funds will engage in futures contracts or related options transactions to hedge certain market positions. Upon entering into a futures contract, the fund is required to pledge to the broker an amount of cash, U.S. Government securities or other assets, equal to a certain percentage of the contract (initial margin deposit). Subsequent payments, known as "variation margin,’’ are made or received by the fund each day, depending on the daily fluctuations in the fair value of the futures contract. When a fund enters into a futures contract, the fund segregates cash or other liquid securities, of any type or maturity, equal in value to the fund’s commitment. The fund recognizes a gain or loss equal to the daily change in the value of the futures contracts. Should market conditions move unexpectedly, the fund may not achieve the anticipated benefits of the futures contracts and may realize a loss. As of December 31, 2011, none of the funds had open futures contracts.
Illiquid Securities: Each fund currently limits investments in illiquid securities to 15% of net assets at the time of purchase, except for the Money Market Fund which limits the investment in illiquid securities to 5% of net assets. At December 31, 2011, investments in securities of the Bond, High Income and Diversified Income Funds included issues that are illiquid. The aggregate values of illiquid securities held by Bond, High Income and Diversified Income were $15,880,240, $1,461,975 and $8,124,110, respectively, which represent 3.7%, 1.6% and 2.0% of net assets, respectively. Pursuant to guidelines adopted by the Board of Trustees, certain unregistered securities are determined to be liquid and are not included within the percent limitations specified above. Information concerning the illiquid securities held at December 31, 2011, which includes cost and acquisition date, is as follows:
Ultra Series Fund | December 31, 2011
Notes to Financial Statements
| | |
| Bond Fund | | |
| American Association of Retired Persons | 5/16/02 | $ 2,623,313 |
| ERAC USA Finance LLC | 12/16/04 | 4,770,412 |
| Indianapolis Power & Light Co. | 10/02/06 | 3,424,501 |
| WM Wrigley Jr. Co. | 6/21/10 | |
| | | $13,986,938 |
| High Income Fund | | |
| Affinion Group, Inc. | Various | $ 697,897 |
| Gulfmark Offshore, Inc. | Various | 254,248 |
| Lucent Technologies Capital Trust I | Various | |
| | | $ 1,836,395 |
| Diversified Income Fund | | |
| American Association of Retired Persons | 5/16/02 | $ 2,098,650 |
| ERAC USA Finance LLC | 12/16/04 | 2,005,741 |
| Indianapolis Power & Light Co. | 10/2/06 | 1,545,747 |
| WM Wrigley Jr. Co. | 6/21/10 | |
| | | $ 6,959,606 |
Delayed Delivery Securities: Each fund may purchase securities on a when-issued or delayed delivery basis. "When-issued’’ refers to securities whose terms are available and for which a market exists, but that have not been issued. For when-issued or delayed delivery transactions, no payment is made until delivery date, which is typically longer than the normal course of settlement, and often a month or more after the purchase. When a fund enters into an agreement to purchase securities on a when-issued or delayed delivery basis, the fund segregates cash or other liquid securities, of any type or maturity, equal in value to the fund’s commitment. Losses may arise due to changes in the market value of the underlying securities, if the counterparty does not perform under the contract, or if the issuer does not issue the securities due to political, economic or other factors. As of December 31, 2011, none of the funds had entered into such transactions.
Reclassification Adjustments: Paid-in capital, undistributed net investment income, and accumulated net realized gain (loss) have been adjusted in the Statements of Assets and Liabilities for permanent book-tax differences for all funds.
Differences primarily relate to the tax treatment of net operating losses, paydown gains and losses, foreign currency gains and losses, and distributions from real estate investment trusts and passive foreign investment companies.
To the extent these book and tax differences are permanent in nature, such amounts are reclassified at the end of the fiscal year among paid-in capital in excess of par value, undistributed net investment income (loss) and undistributed net realized gain (loss) on investments and foreign currency translations. Accordingly, at December 31, 2011 reclassifications were recorded as follows:
Ultra Series Fund | December 31, 2011
Notes to Financial Statements
| | Undistributed Net Investment Income (Loss) | Accumulated Net Realized Gain (Loss) |
| Conservative Allocation | $(308,110) | $1,271,141 | $ (963,031) |
| Moderate Allocation | (432,011) | 1,909,711 | (1,477,700) |
| Aggressive Allocation | (107,974) | 641,829 | (533,855) |
| Money Market | – | – | – |
| Bond | – | (203,417) | 203,417 |
| High Income | – | 123,583 | (123,583) |
| Diversified Income | 2 | (59,386) | 59,384 |
| Equity Income | – | 2,342 | (2,342) |
| Large Cap Value | (1) | (803) | 804 |
| Large Cap Growth | – | – | – |
| Mid Cap | 2 | – | (2) |
| Small Cap | (6,362) | (2,265) | 8,627 |
| International Stock | (1) | 214,105 | (214,104) |
| Madison Target Retirement 2020 | – | 148,219 | (148,219) |
| Madison Target Retirement 2030 | 1 | 139,781 | (139,782) |
| Madison Target Retirement 2040 | 3 | 98,203 | (98,206) |
| Madison Target Retirement 2050 | (1,099) | 5,139 | (4,040) |
Fair Value Measurements: Each fund has adopted the Financial Accounting Standards Board ("FASB") guidance on fair value measurements. Fair value is defined as the price that each fund would receive upon selling an investment in a timely transaction to an independent buyer in the principal or most advantageous market of the investment. A three-tier hierarchy is used to maximize the use of observable market data "inputs" and minimize the use of unobservable "inputs" and to establish classification of fair value measurements for disclosure purposes. Inputs refer broadly to the assumptions that market participants would use in pricing the asset or liability, including assumptions about risk (for example, the risk inherent in a particular valuation technique used to measure fair value including such a pricing model and/or the risk inherent in the inputs to the valuation technique). Inputs may be observable or unobservable.
Observable inputs are inputs that reflect the assumptions market participants would use in pricing the asset or liability developed based on market data obtained from sources independent of the reporting entity. Unobservable inputs are inputs that reflect the reporting entity’s own assumptions about the assumptions market participants would use in pricing the asset or liability developed based on the best information available in the circumstances. The three-tier hierarchy of inputs is summarized in the three broad Levels listed below:
| | •Level 1 – unadjusted quoted prices in active markets for identical investments |
| | •Level 2 – other significant observable inputs (including quoted prices for similar investments, interest rate volatilities, prepayment speeds, credit risk, benchmark yields, transactions, bids, offers, new issues, spreads and other relationships observed in the markets among comparable securities, underlying equity of the issuer; and proprietary pricing models such as yield measures calculated using factors such as cash flows, financial or collateral performance and other reference data, etc.) |
| | •Level 3 – significant unobservable inputs (including the fund’s own assumptions in determining the fair value of investments) |
The valuation techniques used by the funds to measure fair value for the period ended December 31, 2011 maximized the use of observable inputs and minimized the use of unobservable inputs. The funds utilized the following fair value techniques:
Ultra Series Fund | December 31, 2011
Notes to Financial Statements
multi-dimensional relational pricing model and option adjusted spread pricing; the funds estimated the price that would have prevailed in a liquid market for an international equity security given information available at the time of evaluation. As of December 31, 2011, none of the funds held securities deemed as a Level 3.
The following is a summary of the inputs used as of December 31, 2011 in valuing the funds’ investments carried at market value (please see the Portfolio of Investments for each fund for a listing of all securities within each caption):
| Quoted Prices in Active Markets for Identical Investments (Level 1) | Significant Other Observable Inputs (Level 2) | Significant Unobservable Inputs (Level 3) | |
Conservative Allocation1 | $225,911,081 | $ – | $ – | $225,911,081 |
Moderate Allocation1 | 380,058,050 | – | – | 380,058,050 |
Aggressive Allocation1 | 134,074,608 | – | – | 134,074,608 |
Money Market2 | 3,086,814 | 59,614,117 | – | 62,700,931 |
| Bond | | | | |
| Asset Backed | – | 8,093,443 | – | 8,093,443 |
| Corporate Notes and Bonds | – | 118,248,786 | – | 118,248,786 |
| Mortgage Backed | – | 85,530,197 | – | 85,530,197 |
| U.S. Government and Agency Obligations | – | 193,135,679 | – | 193,135,679 |
| Investment Companies | | | | |
| | 10,208,997 | 405,008,105 | – | 415,217,102 |
| High Income | | | | |
| Corporate Notes and Bonds | – | 87,687,427 | – | 87,687,427 |
| Preferred Stock | 552,600 | – | – | 552,600 |
| Investment Companies | | | | |
| | 3,535,722 | 87,687,427 | – | 91,223,149 |
| Diversified Income | | | | |
| Common Stocks | 208,346,604 | – | – | 208,346,604 |
| Asset Backed | – | 2,724,714 | – | 2,724,714 |
| Corporate Notes and Bonds | – | 68,535,456 | – | 68,535,456 |
| Mortgage Backed | – | 35,705,810 | – | 35,705,810 |
| U.S. Government and Agency Obligations | – | 66,365,789 | – | 66,365,789 |
| Investment Companies | | | | |
| | 224,683,736 | 173,331,769 | – | 398,015,505 |
| Equity Income | | | | |
| Assets: | | | | |
| Common Stocks | 2,731,354 | – | – | 2,731,354 |
| Investment Companies | 61,413 | – | – | 61,413 |
| Repurchase Agreement | | | | |
| | 2,792,767 | 229,741 | – | 3,022,508 |
| Liabilities: | | | | |
| Options Written | 89,735 | – | – | 89,735 |
Large Cap Value1 | 491,275,903 | – | – | 491,275,903 |
Large Cap Growth1 | 358,627,671 | – | – | 358,627,671 |
| Mid Cap | 364,993,664 | – | – | 364,993,664 |
| Small Cap | 12,689,619 | – | – | 12,689,619 |
1 At December 31, 2011, all investments are Level 1. See respective portfolio of investments. |
2 At December 31, 2011, all Level 2 securities held are short term investments. See respective portfolio of investments. |
Ultra Series Fund | December 31, 2011
Notes to Financial Statements
| Quoted Prices in Active Markets for Identical Investments (Level 1) | Significant Other Observable Inputs (Level 2) | Significant Unobservable Inputs (Level 3) | |
| International Stock | | | | |
| Common Stocks | | | | |
| Australia | $ – | $ 4,161,179 | $ – | $ 4,161,179 |
| Belgium | – | 2,681,634 | – | 2,681,634 |
| Brazil | – | 2,434,921 | – | 2,434,921 |
| Canada | – | 1,560,737 | – | 1,560,737 |
| China | – | 762,367 | – | 762,367 |
| Denmark | – | 316,919 | – | 316,919 |
| Finland | – | 1,044,038 | – | 1,044,038 |
| France | – | 9,010,567 | – | 9,010,567 |
| Germany | – | 5,886,764 | – | 5,886,764 |
| Ireland | 905,450 | – | – | 905,450 |
| Italy | – | 693,116 | – | 693,116 |
| Japan | – | 13,109,964 | – | 13,109,964 |
| Netherlands | – | 1,265,566 | – | 1,265,566 |
| New Zealand | – | 632,753 | – | 632,753 |
| Russia | – | 1,151,325 | – | 1,151,325 |
| South Africa | 663,300 | – | – | 663,300 |
| South Korea | – | 2,052,444 | – | 2,052,444 |
| Spain | – | 1,597,757 | – | 1,597,757 |
| Sweden | – | 2,115,848 | – | 2,115,848 |
| Switzerland | – | 4,690,599 | – | 4,690,599 |
| Turkey | 496,356 | 363,520 | – | 859,876 |
| United Kingdom | – | 26,825,454 | – | 26,825,454 |
| Investment Companies | | | | |
| | 4,494,221 | 82,357,472 | – | 86,851,693 |
Madison Target Retirement 20201 | 39,418,537 | – | – | 39,418,537 |
Madison Target Retirement 20301 | 45,253,302 | – | – | 45,253,302 |
Madison Target Retirement 20401 | 35,165,472 | - | – | 35,165,472 |
Madison Target Retirement 20451 | 2,231,386 | - | – | 2,231,386 |
1At December 31, 2011, all investments are level 1. See respective potfolio of investments. |
Derivatives: The following table presents the types of derivative in the Equity Income Fund by location as presented on the Statement of Assets and Liabilities as of December 31, 2011.
Statement of Asset & Liability Presentation of Fair Values of Derivative Instruments |
| | | |
Derivatives not accounted for as hedging instruments | Statement of Assets and Liabilities Location | | Statement of Assets | |
| Equity contracts | – | -- | Options written | $89,735 |
The following table presents the effect of Derivative Instruments on the Statement of Operations for the period ended December 31, 2011:
Derivatives not accounted for as hedging instruments | Realized Gain on Derivatives: | Change in Unrealized Depreciation on Derivatives |
| Equity contracts | $145,357 | $85,456 |
Ultra Series Fund | December 31, 2011
Notes to Financial Statements
Management has determined that there is no impact on the financial statements of the other funds held in the Trust as they did not hold derivative financial instruments.
New Accounting Pronouncements: In May 2011, FASB issued ASU 2011-04, modifying Topic 820, Fair Value Measurements and Disclosures. At the same time, the International Accounting Standards Board ("IASB") issued International Financial Reporting Standard ("IFRS") 13, Fair Value Measurement. The objective by the FASB and IASB is convergence of their guidance on fair value measurements and disclosures. The effective date of the ASU is for Interim and annual periods beginning after December 15, 2011 and therefore not effective for the current fiscal year. The Investment Adviser is in the process of assessing the impact of the updated standards on the Trust’s financial statements.
In December 2011, the International Accounting Standards Board (IASB) and the FASB issued ASU 2011-11 "Disclosures about Offsetting Assets And Liabilities." These common disclosure requirements are intended to help investors and other financial statement users to better assess the effect or potential effect of offsetting arrangements on a portfolio’s financial position. They also improve transparency in the reporting of how companies mitigate credit risk, including disclosure of related collateral pledged or received. In addition, ASU 2011-11 facilitates comparison between those entities that prepare their financial statements on the basis of U.S. GAAP and those entities that prepare their financial statements on the basis of IFRS. ASU 2011-11 requires entities to disclose both gross and net information about both instruments and transactions eligible for offset in the financial position; and disclose instruments and transactions subject to an agreement similar to a master netting agreement. ASU 2011-11 is effective for fiscal years beginning on or after January 1, 2013, and interim periods within those annual periods. The Investment Adviser is currently evaluating the implications of ASU 2011-11 and its impact on financial statements disclosures.
3. MANAGEMENT, SERVICES AND DISTRIBUTION AGREEMENTS
Management Agreement: For services under the Management Agreement, the Investment Adviser is entitled to receive a management fee, which is calculated daily and paid monthly, at an annual rate based upon the following percentages of average daily net assets: 0.45% for the Money Market Fund, 0.55% for the Bond Fund, 0.75% for the High Income Fund, 0.70% for the Diversified Income Fund, 0.90% for the Equity Income Fund, 0.60% for the Large Cap Value Fund, 0.80% for the Large Cap Growth Fund, 0.90% for the Mid Cap Fund, 1.10% for the Small Cap Fund, 1.20% for the International Stock Fund, 0.30% for each of the Target Allocation Funds, and 0.25% for each of the Target Date Funds. Effective October 1, 2009, Madison contractually agreed to waive a portion of the management fee of the Target Date Funds from 0.40% to 0.20%. Effective February 17, 2011, the fee was permanently reduced to 0.20%. On September 1, 2011, shareholders of the Target Date Funds approved a new fee arrangement which includes an investment advisory fee of 0.25% annualized and a services agreement fee of 0.05% annualized (more information on the services agreement and proxy solicitation is below).
The Management Agreement requires the Investment Adviser to provide or arrange to provide overall management of the funds, including but not limited to, investment advisory services, custody, transfer agency, dividend disbursing, legal, accounting and administrative services.
The Investment Adviser is also responsible for the payment of all fees to the Subadvisers. The Subadvisers for the funds are Shenkman Capital Management, Inc. for the High Income Fund, Wellington Management Company, LLP for the Small Cap Fund and Lazard Asset Management LLC for the International Stock Fund. The Investment Adviser manages the Money Market Fund, Bond Fund, Diversified Income Fund, Equity Income Fund, Large Cap Growth Fund, Large Cap Value Fund, Mid Cap Fund, Target Allocation Funds and the Target Date Funds, without the aid of a Subadviser.
Ultra Series Fund | December 31, 2011
Notes to Financial Statements
The Investment Adviser may from time to time voluntarily agree to waive all or a portion of its fees or expenses related to the Funds. In that regard, the Investment Adviser waived a portion of management fees on the Money Market Class I Shares and Class II Shares for the purpose of maintaining a one-day yield of zero. The amount of the daily waiver is equal to the amount required to maintain a minimum daily distribution rate of zero. For the period ended December 31, 2011, the waivers totaled $254,332 for Class I Shares and $4,406 for Class II Shares and are reflected as fees waived by the Investment Adviser in the accompanying Statement of Operations. The Investment Adviser does not have the right to recoup these waived fees.
Limited Services Agreement: Effective July 1, 2009, the Investment Adviser entered into a Limited Services Agreement with the Trust. Under this agreement, Madison agreed to cap certain operating expenses (which includes certain of the "Other Expenses" referenced below) of each fund (other than the Equity Income Fund and the Target Retirement 2050 Fund) that, prior to that date, had been paid directly by the funds. This cap does not include securities transaction commissions and expenses, certain taxes, interest, share distribution expenses, and extraordinary and non-recurring expenses. The Limited Services Agreement was to be enforced for a period of no less than two years from the date of the agreement. Specifically, Madison, in exchange for the Limited Service Fee, was responsible for paying the fees and expenses of the funds’ Independent Trustees, independent registered public accountants, and all costs related to the funds’ compliance program. The agreement required Madison to maintain expense levels for these items at a dollar amount that was no more than the amount of such expenses incurred by each fund’s Class I shares for the year-ended December 31, 2008. This Limited Services Agreement ended on June 30, 2011.
Services Agreement: Effective September 1, 2011, the Investment Adviser entered into a services agreement ("Services Agreement") for the Target Date Funds. Under this Services Agreement, Madison provides either directly or through outsourced arrangements all operational and support services of the Target Date Funds not provided under the Management Agreement discussed above. Under this Services Agreement, Madison receives a fee of 0.05% (annualized) of the average daily net assets of each Target Date Fund. In exchange for the aforementioned fee, Madison is responsible for paying all of the funds’ fees and expenses, other than (i) the management fee (described above), (ii) fees related to the funds’ portfolio holdings (such as brokerage commissions, interest on loans, etc.), (iii) acquired fund fees, and (iv) extraordinary or non-recurring fees (such as fees and costs relating to any temporary line of credit the funds may maintain for emergency or extraordinary purposes). The direct expenses of the funds’ independent Trustees and independent auditors are paid out of this fee by the funds. Pursuant to the Services Agreement, Madison has also agreed, until April 30, 2013, to waive and/or reimburse investment advisory fees and/or its services fee to the extent necessary to limit each fund’s total operating expenses and underlying fund fees and expenses to 0.65% of average daily net assets of each Target Date Fund. In applying this waiver, Madison must utilize good faith estimates of the fees and expenses of the underlying funds. The Investment Adviser does not have the right to recoup these waived fees.
Distribution Agreement: Mosaic Funds Distributor, LLC ("MFD") serves as distributor of the funds. The Trust adopted a distribution and service plan with respect to the Trust’s Class II shares pursuant to Rule 12b-1 under the 1940 Act. Under the plan, the Trust will pay a service fee with regard to Class II shares at an annual rate of 0.25% of each fund’s daily net assets. MFD arranges to provide compensation to others that provide distribution and shareholder servicing services to the funds and their shareholders. Fees incurred by the funds under the plan are detailed in the Statement of Operations.
The distributor may from time to time voluntarily agree to waive a portion of its fees or expenses related to the funds. In this regard, the distributor waived a portion of 12b-1 fees on the Money Market Class II shares for the purpose of maintaining a one-day yield of zero. For the period ended December 31, 2011, the waivers totaled $1,707 and are reflected as fees waived in the accompanying Statement of Operations. Neither MFD nor the Investment Adviser has the right to recoup these waived fees.
Ultra Series Fund | December 31, 2011
Notes to Financial Statements
Other Expenses: In addition to the management fee, the Trust, except for the Target Date Funds effective September 1, 2011, is responsible for fees of the disinterested trustees, brokerage commissions and other expenses incurred in connection with the acquisition or disposition of investments, costs of borrowing money, expenses for independent audits, tax, compliance and extraordinary expenses as approved by a majority of the Independent Trustees. Effective September 1, 2011, the fees for the disinterested trustees and independent audit are paid out of the Services Agreement fee (noted above) for the Target Date Funds.
Certain officers and trustees of the Trust are also officers of the Investment Adviser. The funds do not compensate their officers or trustees. Unaffiliated trustees receive from the Trust an attendance fee for each Board or Committee meeting attended, with additional remuneration paid to Audit Committee and Nominating and Governance Committee Chairpersons.
4. DIVIDENDS FROM NET INCOME AND DISTRIBUTIONS OF CAPITAL GAINS
The Money Market Fund declares dividends from net investment income and net realized gains from investment transactions, if any, daily, and net realized gains from investment transactions, if any, annually, which are reinvested in additional full and fractional shares of the fund. The Bond Fund, High Income Fund, Diversified Income Fund, Equity Income Fund, Large Cap Value Fund, Large Cap Growth Fund, Small Cap, Mid Cap Fund, International Stock Fund, Target Allocation Funds, and Target Date Funds declare dividends from net investment income and net realized gains from investment transactions, if any, annually, which are reinvested in additional full and fractional shares of the respective funds.
Income and capital gain distributions, if any, are determined in accordance with federal income tax regulations, which may differ from accounting principles generally accepted in the United States of America. Taxable distributions from income and realized capital gains of the funds may differ from book amounts earned during the period due to differences in the timing of capital gains recognition, and due to the reclassification of certain gains or losses from capital to income.
5. SECURITIES TRANSACTIONS
For the period ended December 31, 2011, aggregate cost of purchases and proceeds from sales of securities, other than short-term investments, were as follows:
| | U.S. Government Securities | Other Investment Securities |
| | | | |
| Conservative Allocation | $ – | $ – | $ 81,676,457 | $ 85,139,741 |
| Moderate Allocation | – | – | 96,390,420 | 100,684,961 |
| Aggressive Allocation | – | – | 50,561,556 | 42,050,788 |
| Bond | 24,235,053 | 49,005,067 | 3,216,384 | 5,987,978 |
| High Income | – | – | 50,162,961 | 55,025,440 |
| Diversified Income | 21,142,226 | 21,115,839 | 53,756,731 | 76,406,265 |
| Equity Income | – | – | 3,043,584 | 1,915,731 |
| Large Cap Value | – | – | 143,646,140 | 217,684,851 |
| Large Cap Growth | – | – | 307,892,418 | 332,993,002 |
| Mid Cap | – | – | 190,308,686 | 240,144,945 |
| Small Cap | – | – | 2,881,617 | 3,317,210 |
| International Stock | – | – | 37,555,606 | 47,434,213 |
| Madison Target Retirement 2020 | – | – | 49,923,882 | 37,963,674 |
| Madison Target Retirement 2030 | – | – | 54,497,145 | 40,245,610 |
| Madison Target Retirement 2040 | – | – | 43,934,153 | 34,404,299 |
| Madison Target Retirement 2050 | – | – | 3,047,301 | 827,929 |
Ultra Series Fund | December 31, 2011
Notes to Financial Statements
6. COVERED CALL OPTIONS
The Equity Income Fund will pursue its primary objective by employing an option strategy of writing (selling) covered call options on common stocks. The number of call options the fund can write (sell) is limited by the amount of equity securities the fund holds in its portfolio. The fund will not write (sell) "naked" or uncovered call options. The fund seeks to produce a high level of current income and gains generated from option writing premiums and to a lesser extent, from dividends. Covered call writing also helps to reduce volatility (and risk profile) of the fund by providing protection from declining stock prices.
Transactions in option contracts during the period ended December 31, 2011 were as follows:
| | | |
| Options outstanding, beginning of period | 476 | $ 84,813 |
| Options written during the period | 1,485 | 302,238 |
| Options expired during the period | (451) | (88,233) |
| Options closed during the period | (311) | (69,739) |
| Options assigned during the period | | |
| Options outstanding, end of period | | |
7. FOREIGN SECURITIES
Each fund may invest in foreign securities; provided, however, that the Money Market Fund is limited to U.S. dollar-denominated foreign money market securities. Foreign securities refer to securities that are: (1) issued by companies organized outside the U.S. or whose principal operations are outside the U.S., (2) issued by foreign governments or their agencies or instrumentalities, (3) principally traded outside the U.S., or (4) quoted or denominated in a foreign currency. Foreign securities include American Depositary Receipts ("ADRs’’), European Depositary Receipts ("EDRs’’), Global Depositary Receipts ("GDRs’’), Swedish Depositary Receipts ("SDRs’’) and foreign money market securities. Dollar-denominated securities that are part of the Merrill Lynch U.S. Domestic Master Index are not considered a foreign security.
Certain funds have reclaim receivable balances, in which the funds are due a reclaim on the taxes that have been paid to some foreign jurisdictions. The values of all reclaims are not significant for any of the funds and are reflected in Other Assets on the Statement of Assets and Liabilities. These receivables are reviewed to ensure the current receivable balance is reflective of the amount deemed to be collectible.
8. SECURITIES LENDING
Each fund, except the Target Allocation, Money Market, Small Cap, Equity Income and Target Retirement Funds, entered into a Securities Lending Agreement (the "Agreement") with State Street Bank and Trust Company ("State Street"). Under the terms of the Agreement, the funds may lend portfolio securities to qualified borrowers in order to earn additional income. The Agreement requires that loans are collateralized at all times by cash or other liquid assets at least equal to 102% of the value of the securities, which is determined on a daily basis.
Amounts earned as interest on investments of cash collateral, net of rebates and fees, if any, are included in the Statement of Operations.
The primary risk associated with securities lending is if the borrower defaults on its obligation to return the securities loaned because of insolvency or other reasons, the funds could experience delays and costs in recovering securities loaned or in gaining access to the collateral.
Ultra Series Fund | December 31, 2011
Notes to Financial Statements
The funds did not transact in securities lending for the time period ending on December 31, 2011 and had no securities out on loan as of December 31, 2011.
9. FEDERAL INCOME TAX INFORMATION
It is each fund’s policy to comply with the requirements of Subchapter M of the Internal Revenue Code of 1986 applicable to regulated investment companies and to distribute all its taxable income to its shareholders. Accordingly, no provisions for federal income taxes are recorded in the accompanying financial statements.
The funds have not recorded any liabilities for material unrecognized tax benefits as of December 31, 2011. It is the funds’ policy to recognize accrued interest and penalties related to uncertain tax benefits in income taxes, as appropriate. Tax years that remain open to examination by major tax jurisdictions include tax years ended December 31, 2008 through December 31, 2011.
The tax character of distributions paid during the years ended December 31, 2011 and 2010 was as follows:
| | | |
| | | | |
| Conservative Allocation | $ 7,736,541 | $ 8,982,364 | $ – | $– | $156,141 |
| Moderate Allocation | 10,126,467 | 11,196,100 | – | – | – |
| Aggressive Allocation | 2,351,251 | 1,977,176 | – | – | – |
| Money Market | – | – | – | – | – |
| Bond | 15,832,299 | 19,336,364 | – | – | – |
| High Income | 6,639,622 | 7,418,611 | – | – | – |
| Diversified Income | 11,883,969 | 14,252,970 | – | – | – |
| Equity Income | 284,700 | 53,076 | 18,854 | – | – |
| Large Cap Value | 10,205,844 | 9,967,106 | – | – | – |
| Large Cap Growth | 893,185 | 2,089,694 | – | – | – |
| Mid Cap | 691,290 | 1,321,723 | – | – | – |
| Small Cap | 49,569 | 84,410 | – | – | – |
| International Stock | 1,802,051 | 1,911,410 | – | – | – |
| Madison Target Retirement 2020 | 1,042,918 | 890,022 | 951,240 | – | – |
| Madison Target Retirement 2030 | 1,048,477 | 823,904 | 1,807,977 | – | – |
| Madison Target Retirement 2040 | 746,609 | 574,774 | 1,906,410 | – | – |
| Madison Target Retirement 2050 | 31,450 | – | – | – | 1,099 |
Ultra Series Fund | December 31, 2011
Notes to Financial Statements
As of December 31, 2011, the components of distributable earnings on a tax basis were as follows:
| | | | | | |
| Conservative Allocation | $ – | $– | | Large Cap Growth | $23,005 | $ – |
| Moderate Allocation | – | – | | Mid Cap | 15,924 | – |
| Aggressive Allocation | – | – | | Small Cap | – | – |
| Bond | 307,230 | – | | International Stock | 11,527 | – |
| High Income | 287,366 | – | | Madison Target Retirement 2020 | – | 144,574 |
| Diversified Income | 207,483 | – | | Madison Target Retirement 2030 | – | 150,726 |
| Equity Income | 22,528 | – | | Madison Target Retirement 2040 | – | 30,019 |
| Large Cap Value | 190,026 | – | | Madison Target Retirement 2050 | – | – |
The Regulated Investment Company Modernization Act of 2010 (the "Modernization Act") modernizes several tax provisions related to Regulated Investment Companies ("RICs") and their shareholders. Generally, the Modernization Act is effective for taxable years beginning after December 22, 2010.
Under the Modernization Act, the funds will be permitted to carry forward capital losses incurred in taxable years beginning after December 22, 2010 for an unlimited period. Post-enactment losses that are carried forward will retain their character as either short-term or long-term capital losses rather than being considered all short-term as under previous law. However, any losses incurred during those future taxable years will be required to be utilized prior to the losses incurred in pre-enactment taxable years, which carry an expiration date. As a result of this ordering rule, pre-enactment capital loss carryovers may be more likely to expire unused.
The capital loss carryovers noted below may be available to offset future realized capital gains and thereby reduce future taxable gains distributions. For federal income tax purposes, the funds have the following capital loss carryovers at December 31, 2011 which are available through the date specified to offset future capital gains, if any.
| | | | | | | | No Expiration- Short Term |
| Conservative Allocation | $ – | $ – | $ – | $ – | $ – | $ 5,943,248 | $ – | $ – |
| Moderate Allocation | – | – | – | – | 16,343,850 | 20,811,527 | 9,937,108 | – |
| Aggressive Allocation | – | – | – | – | 3,992,723 | 6,205,447 | 6,513,626 | – |
| Bond | 456,699 | 1,445,891 | 816,322 | 228,563 | – | 9,584,651 | 346,309 | – |
| High Income | – | – | – | – | 6,713,643 | 4,641,635 | – | – |
| Diversified Income | – | – | – | – | – | 31,758,091 | – | – |
| Large Cap Value | – | – | – | – | 53,372,166 | 41,852,552 | – | – |
| Large Cap Growth | – | – | – | – | – | 17,039,570 | – | – |
| Mid Cap | – | – | – | 13,912 | 30,807,814 | 41,679,580 | – | – |
| Small Cap | – | – | – | – | 1,012,575 | 416,408 | – | – |
| International Stock | – | – | – | 751,246 | 8,819,661 | 21,825,302 | 1,915,037 | 2,418,733 |
| Madison Target Retirement 2050 | – | – | – | – | – | – | – | 5,446 |
Included in the net capital loss carryovers for Mid Cap Fund, Small Cap Fund and International Stock Fund is $30,821,726, $1,012,575, and $11,114,891, respectively, of capital loss carryovers subject to certain limitations upon availability, to offset future gains, if any, as the successor of a merger. These acquired losses are included in the total losses available noted above.
Ultra Series Fund | December 31, 2011
Notes to Financial Statements
For the year ended December 31, 2011, capital losses utilized for each fund were as follows:
| | | | |
| Conservative Allocation | $ 151,971 | | Mid Cap | $38,082,929 |
| Moderate Allocation | 1,541,625 | | Small Cap | 475,785 |
| Aggressive Allocation | 2,453,819 | | International Stock | – |
| Bond | 1,208,149 | | Madison Target Retirement 2020 | 729,219 |
| High Income | 1,723,028 | | Madison Target Retirement 2030 | 440,756 |
| Diversified Income | 16,319,262 | | Madison Target Retirement 2040 | 271,158 |
| Large Cap Value | 31,933,812 | | Madison Target Retirement 2050 | – |
| Large Cap Growth | 38,815,263 | | | |
After October 31, 2011, the following funds had Short Term and Long Term post-October capital losses in the following amounts:
| | |
| Moderate Allocation Fund | $ 34,260 | $ – |
| Aggressive Allocation Fund | 113,729 | – |
| High Income Fund | 112,708 | – |
| Mid Cap Fund | 1,560,101 | – |
| Small Cap Fund | 9,267 | 72,971 |
| International Stock Fund | 248,718 | 688,129 |
| Madison Target Retirement 2020 | 118,872 | – |
| Madison Target Retirement 2030 | 125,385 | – |
| Madison Target Retirement 2040 | 10,181 | – |
| Madison Target Retirement 2050 | 4,690 | – |
For federal income tax purposes, these amounts are deferred and deemed to have occurred in the next fiscal year.
At December 31, 2011, the aggregate gross unrealized appreciation (depreciation) and net unrealized appreciation (depreciation) for all securities as computed on a federal income tax basis for each fund were as follows:
| | | |
| Conservative Allocation | $ 9,637,037 | $ 3,975,360 | $ 5,661,677 |
| Moderate Allocation | 19,070,634 | 4,816,914 | 14,253,720 |
| Aggressive Allocation | 8,818,988 | 2,265,320 | 6,553,668 |
| Bond | 37,258,482 | 3,970,117 | 33,288,365 |
| High Income | 3,197,947 | 1,123,681 | 2,074,266 |
| Diversified Income | 46,506,864 | 5,867,419 | 40,639,445 |
| Equity Income | 53,635 | 330,476 | (276,841) |
| Large Cap Value | 69,677,701 | 12,503,093 | 57,174,608 |
| Large Cap Growth | 62,587,326 | 24,712,957 | 37,874,369 |
| Mid Cap | 46,619,106 | 6,879,822 | 39,739,284 |
| Small Cap | 2,568,506 | 502,880 | 2,065,626 |
| International Stock | 8,035,049 | 4,444,145 | 3,590,904 |
| Madison Target Retirement 2020 | 453,883 | 989,864 | (535,981) |
| Madison Target Retirement 2030 | 419,673 | 1,227,040 | (807,367) |
| Madison Target Retirement 2040 | 286,976 | 1,031,408 | (744,432) |
| Madison Target Retirement 2050 | 22,819 | 63,468 | (40,649) |
The differences between cost amounts for book purposes and tax purposes are primarily due to the tax deferral of wash losses.
Ultra Series Fund | December 31, 2011
Notes to Financial Statements
10. CONCENTRATION OF RISK
Investing in certain financial instruments, including forward foreign currency contracts and futures contracts, involves certain risks, other than that reflected in the Statements of Assets and Liabilities. Risks associated with these instruments include potential for an illiquid secondary market for the instruments or inability of counterparties to perform under the terms of the contracts, changes in the value of foreign currency relative to the U.S. dollar and financial statement volatility resulting from an imperfect correlation between the movements in the prices of the instruments and the prices of the underlying securities and interest rates being hedged. The High Income Fund, Mid Cap Fund, and the International Stock Fund may enter into these contracts primarily to protect these funds from adverse currency movements.
Investing in foreign securities involves certain risks not necessarily found in U.S. markets. These include risks associated with adverse changes in economic, political, regulatory and other conditions, changes in currency exchange rates, exchange control regulations, expropriation of assets or nationalization, imposition of withholding taxes on dividend or interest payments or capital gains, and possible difficulty in obtaining and enforcing judgments against foreign entities. Further, issuers of foreign securities are subject to different, and often less comprehensive, accounting, reporting and disclosure requirements than domestic issuers.
The High Income Fund invests in securities offering high current income which generally will include bonds in the below investment grade categories of recognized ratings agencies (so-called "junk bonds’’). These securities generally involve more credit risk than securities in the higher rating categories. In addition, the trading market for high yield securities may be relatively less liquid than the market for higher-rated securities. The fund generally invests at least 80% of its assets in high yield securities.
The Equity Income Fund invests in option on securities. As the writer of a covered call option, the forgoes, during the option’s life, the opportunity to profit from increases in the market value of the security covering the call option above the sum of the premium and the strike price of the call but has retained the risk of loss should the price of the underlying security decline. The writer of an option has no control over the time when it may be required to fulfill its obligation as writer of the option. Once an option writer has received an exercise notice, it cannot effect a closing purchase transaction in order to terminate its obligation under the option and must deliver the underlying security at the exercise price.
The Target Allocation Funds and Target Date Funds are fund of funds, meaning that they invest primarily in the shares of other registered investment companies (the "underlying funds’’), including ETFs. Thus, each fund’s investment performance and its ability to achieve its investment goal are directly related to the performance of the underlying funds in which it invests; and the underlying fund’s performance, in turn, depends on the particular securities in which that underlying fund invests and the expenses of that fund. Accordingly, these funds are subject to the risks of the underlying funds in direct proportion to the allocation of their respective assets among the underlying funds.
Additionally, the Target Allocation Funds and Target Date Funds are subject to asset allocation risk and manager risk. Manager risk (i.e., fund selection risk) is the risk that the fund(s) selected to fulfill a particular asset class under performs their peer. Asset allocation risk is the risk that the allocation of the fund’s assets among the various asset classes and market segments will cause the fund to under perform other funds with a similar investment objective.
Ultra Series Fund | December 31, 2011
Notes to Financial Statements
11. CAPITAL SHARES AND AFFILIATED OWNERSHIP
All capital shares outstanding at December 31, 2011, are owned by separate investment accounts and/or pension plans of CMFG Life Insurance Company, except for the Equity Income Fund, which had capital shares outstanding held by the Adviser at NAV of $483,223 in Class I and $53,479 in Class II.
The Target Allocation Funds and Target Date Funds invest in underlying funds, of which certain underlying funds (the "affiliated underlying funds’’), may be deemed to be under common control because of the same Board of Trustees. The MEMBERS Mutual Funds audited financial statements for the fiscal year ended October 31, 2011 are available at no cost on the Securities and Exchange Commission’s website at www.sec.gov, by calling 1-800-877-6089 or by visiting the MEMBERS Mutual Funds’ website at www.membersfunds.com. The Madison Mosaic audited financial statements for the fiscal year ended December 31, 2011 are also available at www.sec.gov, by calling 1-800-368-3195 or visiting www.mosaicfunds.com. A summary of the transactions with each affiliated underlying fund as of December 31, 2011 follows:
| Balance of Shares Held at 12/31/10 | | | Balance of Shares Held at 12/31/11 | | | |
| Conservative Allocation Fund | | | | | | | |
| Madison Mosaic Institutional Bond Fund | 1,699,579 | 57,188 | - | 1,756,767 | $ 19,587,956 | $ – | $ 296,795 |
| Madison Mosaic Disciplined Equity Fund | 1,133,295 | 82,147 | 333,988 | 881,454 | 11,176,839 | 177,333 | 187,545 |
| Madison Investment Grade Corporate Bond Fund | – | 1,205,357 | – | 1,205,357 | 13,584,375 | – | 47,231 |
| MEMBERS Bond Fund Class Y | 4,029,639 | 407,350 | 741,967 | 3,695,022 | 39,315,033 | 247,171 | 1,073,286 |
| MEMBERS High Income Fund Class Y | 3,521,269 | 286,812 | 1,000,909 | 2,807,172 | 19,285,274 | 103,449 | 1,473,003 |
| MEMBERS International Stock Fund Class Y | 1,065,676 | – | 642,035 | 423,641 | 4,033,066 | (364,862) | 99,856 |
| MEMBERS Equity Income Fund Class Y | 585,893 | 802,509 | – | 1,388,402 | 13,425,843 | – | 714,419 |
| MEMBERS Large Cap Growth Fund Class Y | 1,002,072 | 22,801 | 585,565 | 439,308 | 6,927,892 | 665,008 | 9,105 |
| MEMBERS Large Cap Value Fund Class Y | 1,274,218 | 181,836 | 452,149 | 1,003,905 | 12,629,130 | (770,893) | 225,436 |
| Totals | | | | | | | |
| | | | | | | | |
| Moderate Allocation Fund | | | | | | | |
| Madison Mosaic Institutional Bond Fund | 1,491,757 | 46,610 | – | 1,538,367 | $ 17,152,797 | $ – | $ 260,871 |
| MEMBERS Bond Fund Class Y | 3,647,154 | 379,275 | 71,503 | 3,954,926 | 42,080,412 | 27,259 | 1,087,344 |
| MEMBERS High Income Fund Class Y | 4,319,368 | 347,816 | 70,621 | 4,596,563 | 31,578,386 | (16,304) | 2,176,321 |
| MEMBERS International Stock Fund Class Y | 2,500,243 | – | 539,217 | 1,961,026 | 18,668,968 | (914,136) | 462,233 |
| Madison Mosaic Disciplined Equity Fund | 2,713,986 | – | 334,598 | 2,379,388 | 30,170,637 | 282,805 | 506,259 |
| MEMBERS Equity Income Fund Class Y | 1,157,056 | 366,127 | – | 1,523,183 | 14,729,182 | – | 1,039,124 |
| MEMBERS Large Cap Growth Fund Class Y | 2,354,535 | – | 628,209 | 1,726,326 | 27,224,158 | 432,495 | 35,779 |
| MEMBERS Large Cap Value Fund Class Y | 2,855,497 | – | 209,782 | 2,645,715 | 33,283,093 | (651,488) | 594,120 |
MEMBERS Mid Cap Fund Class Y1 | 1,925,389 | 64,687 | 568,637 | 1,421,439 | 9,651,572 | (319,931) | – |
| MEMBERS Small Cap Fund Class Y | 1,301,695 | – | 506,753 | 794,942 | 8,497,933 | 1,005,416 | 280,701 |
| Totals | | | | | | | |
1 Non-income producing. |
2 Distributions received include distributions from net investment income and from capital gains from the underlying funds. |
Ultra Series Fund | December 31, 2011
Notes to Financial Statements
| Balance of Shares Held at 12/31/10 | | | Balance of Shares Held at 12/31/11 | | | |
| Aggressive Allocation Fund | | | | | | | |
| MEMBERS Bond Fund Class Y | 59,161 | – | 59,161 | – | $ – | $ (2,944) | $ 1,296 |
| MEMBERS High Income Fund Class Y | 943,557 | 676,577 | 70,624 | 1,549,510 | 10,645,136 | 19,372 | 555,749 |
| MEMBERS International Stock Fund Class Y | 1,178,483 | – | 381,314 | 797,169 | 7,589,051 | (432,363) | 187,900 |
| Madison Mosaic Disciplined Equity Fund | 1,350,320 | 23,328 | 55,609 | 1,318,039 | 16,712,732 | 52,164 | 280,439 |
| MEMBERS Equity Income Fund | 379,732 | 100,335 | 178,937 | 301,130 | 2,911,930 | (32,228) | 259,776 |
| MEMBERS Large Cap Growth Fund Class Y | 909,744 | 99,572 | 187,867 | 821,449 | 12,954,247 | 212,151 | 16,729 |
| MEMBERS Large Cap Value Fund Class Y | 1,143,737 | 191,958 | 96,896 | 1,238,799 | 15,584,091 | (199,797) | 275,060 |
MEMBERS Mid Cap Fund Class Y1 | 1,298,512 | 75,518 | 470,468 | 903,562 | 6,135,187 | (27,590) | – |
| MEMBERS Small Cap Fund Class Y | 606,010 | – | 231,590 | 374,420 | 4,002,554 | 647,077 | 132,211 |
| Totals | | | | | | | |
| Madison Target Retirement 2020 Fund | | | | | | | |
| MEMBERS Bond Fund Class Y | 100,475 | – | 100,475 | – | $0 | $ 60,748 | $ 12,054 |
| MEMBERS High Income Fund Class Y | 311,509 | 31,322 | 342,831 | – | 0 | 181,861 | 63,050 |
| MEMBERS International Fund Class Y | 121,433 | 9,294 | 130,727 | – | 0 | 357,219 | – |
| Madison Mosaic Disciplined Equity Fund | 192,131 | 24,374 | 216,505 | – | 0 | 243,523 | – |
| MEMBERS Equity Income Fund | 68,516 | – | 68,516 | – | 0 | (2,653) | 13,703 |
| MEMBERS Large Cap Growth Fund Class Y | 123,349 | – | 123,349 | – | 0 | 471,552 | – |
| MEMBERS Large Cap Value Fund Class Y | 159,911 | – | 159,911 | – | 0 | 350,042 | – |
| MEMBERS Small Cap Fund Class Y | 98,390 | – | 98,390 | – | 0 | 374,076 | – |
| Totals | | | | | | | |
| Madison Target Retirement 2030 Fund | | | | | | | |
| MEMBERS Bond Fund Class Y | 92,351 | – | 92,351 | – | $0 | $ 39,176 | $ 9,644 |
| MEMBERS High Income Fund Class Y | 324,161 | 17,385 | 341,546 | – | 0 | 177,061 | 64,786 |
| MEMBERS International Fund Class Y | 159,464 | – | 159,464 | – | 0 | 415,715 | – |
| Madison Mosaic Disciplined Equity Fund | 243,730 | 15,468 | 259,198 | – | 0 | 305,413 | – |
| MEMBERS Equity Income Fund | 69,522 | – | 69,522 | – | 0 | (2,732) | 13,904 |
| MEMBERS Large Cap Growth Fund Class Y | 150,735 | – | 150,735 | – | 0 | 460,558 | – |
| MEMBERS Large Cap Value Fund Class Y | 187,731 | – | 187,731 | – | 0 | 393,770 | – |
| MEMBERS Small Cap Fund Class Y | 127,640 | – | 127,640 | – | 0 | 458,703 | – |
| Totals | | | | | | | |
| | | | | | | | |
| Madison Target Retirement 2040 Fund | | | | | | | |
| MEMBERS Bond Fund Class Y | 26,774 | – | 26,774 | – | $0 | $ 15,477 | $ 1,163 |
| MEMBERS High Income Fund Class Y | 243,274 | 10,431 | 253,705 | – | 0 | 65,206 | 48,402 |
| MEMBERS International Fund Class Y | 153,236 | – | 153,236 | – | 0 | 400,377 | – |
| Madison Mosaic Disciplined Equity Fund | 224,178 | 20,572 | 244,750 | – | 0 | 279,074 | – |
| MEMBERS Equity Income Fund | 66,526 | – | 66,526 | – | 0 | (5,665) | 13,305 |
| MEMBERS Large Cap Growth Fund Class Y | 115,944 | – | 115,944 | – | 0 | 424,676 | – |
| MEMBERS Large Cap Value Fund Class Y | 146,305 | – | 146,305 | – | 0 | 304,714 | – |
| MEMBERS Small Cap Fund Class Y | 120,340 | – | 120,340 | – | 0 | 441,077 | – |
| Totals | | | | | | | |
1 Non-income producing. |
2 Distributions received include distributions from net investment income and from capital gains from the underlying funds. |
Ultra Series Fund | December 31, 2011
Notes to Financial Statements
| Balance of Shares Held at 12/31/10 | | | Balance of Shares Held at 12/31/11 | | | |
| Madison Target Retirement 2050 Fund | | | | | | | |
| MEMBERS Bond Fund Class Y | – | 196 | 196 | – | $0 | $ (6) | $ 9 |
| MEMBERS High Income Fund Class Y | – | 6,152 | 6,152 | – | 0 | (573) | 646 |
| MEMBERS International Fund Class Y | – | 1,880 | 1,880 | – | 0 | (48) | - |
| Madison Mosaic Disciplined Equity Fund | – | 6,702 | 6,702 | – | 0 | (1,871) | - |
| MEMBERS Equity Income Fund Class Y | – | 872 | 872 | – | 0 | (301) | 97 |
| MEMBERS Large Cap Growth Fund Class Y | – | 1,977 | 1,977 | – | 0 | (1,109) | - |
| MEMBERS Large Cap Value Fund Class Y | – | 2,576 | 2,576 | – | 0 | 166 | - |
| MEMBERS Small Cap Fund Class Y | – | 1,565 | 1,565 | – | 0 | (224) | - |
| Totals | | | | | | | |
1 Distributions received includes distributions from net investment income and from capital gains from the underlying funds. |
12. DISCUSSION OF BUSINESS COMBINATIONS
Mid Cap Fund
Effective May 1, 2010, the assets of the Mid Cap Growth Fund were reorganized into the Mid Cap Value Fund and, together, renamed the Mid Cap Fund. The legal survivor of the business combination was the Mid Cap Value Fund; the accounting survivor was the Mid Cap Growth Fund. The combined net assets of the Mid Cap Fund after the reorganization were $437,463,154. Under the plan of reorganization, the following shares were exchanged:
| | | | Per share Conversion Ratio |
| Mid Cap Growth Class I | 49,872,030.322 | Mid Cap Value Class I | 18,732,679.964 | 0.3756 |
| Mid Cap Growth Class II | 560,785.285 | Mid Cap Value Class II | 210,203.526 | 0.3748 |
Small Cap Fund
Effective May 1, 2010, the assets of the Small Cap Growth Fund were reorganized into the Small Cap Value Fund and, together, renamed the Small Cap Fund. The combined net assets of the Small Cap Fund after the reorganization were $15,374,776. Under the plan of reorganization, the following shares were exchanged.
| | | | Per Share Conversion Ratio |
| Small Cap Growth Class I | 696,430.677 | Small Cap Value Class I | 508,434.004 | 0.7301 |
| Small Cap Growth Class II | 984.266 | Small Cap Value Class II | 717.312 | 0.7288 |
International Stock Fund
Effective May 1, 2010, the assets of the Global Securities Fund were reorganized into the International Stock Fund. The combined net assets of the International Fund after the merger were $112,730,616. Under the plan of reorganization, the following shares were exchanged:
| | | | Per Share Conversion Ratio |
| Global Securities Class I | 4,649,016.917 | International Stock Class I | 3,385,631.044 | 0.7282 |
| Global Securities Class II | 149,488.534 | International Stock Class II | 108,859.748 | 0.7282 |
Ultra Series Fund | December 31, 2011
Notes to Financial Statements
13. SUBSEQUENT EVENTS
The Trust is aware of litigation relating to attempts by certain fixed income security-holders of Lyondell Chemical company (LYO) to retrieve proceeds from the sale by equity security-holders of LYO shares occurring pursuant to its acquisition by merger in December 2007. The Midcap Fund received proceeds of approximately $1,574,400 from the sale of its LYO equity securities in December 2007. The Trust has not been named as a defendant in this litigation as of the date of this report.
Fund shares are offered to separate accounts of CUNA Mutual Insurance Society ("CMIS") and to qualified pension and retirement plans of CMIS or its affiliates ("CUNA Mutual Group"). Effective February 1, 2012, CMIS reorganized from a mutual insurance company structure to a mutual insurance holding company structure. As part of the reorganization, CMIS changed its name to CMFG Life Insurance Company. This is not a change of control. CMIS has not been sold to another company. The same policyholders will continue to own the parent organization of the CUNA Mutual Group, and there will be no related changes in personnel or office locations. The new mutual holding company and its subsidiaries will continue use of the trade name, "CUNA Mutual Group." Because of this name change, effective February 1, 2012, any references to "CUNA Mutual Insurance Society" will be deemed to be "CMFG Life Insurance Company" and all references to "CUNA Mutual" shall be deemed to be "CMFG Life."
Madison has evaluated the effects of all subsequent events that provide additional evidence about conditions that existed at the date of the Statement of Assets and Liabilities. There were no additional events or transactions that impacted the amounts or disclosures in the funds’ financial statements.
Ultra Series Fund | December 31, 2011
Report of Independent Registered Public Accounting Firm
To the Shareholders and Board of Trustees of Ultra Series Fund:
We have audited the accompanying statements of assets and liabilities, including the portfolios of investments, of Ultra Series Fund, comprising the Conservative Allocation Fund, Moderate Allocation Fund, Aggressive Allocation Fund, Money Market Fund, Bond Fund, High Income Fund, Diversified Income Fund, Equity Income Fund, Large Cap Value Fund, Large Cap Growth Fund, Mid Cap Fund, Small Cap Fund, International Stock Fund, Madison Target Retirement 2020 Fund, Madison Target Retirement 2030 Fund, Madison Target Retirement 2040 Fund, and Madison Target Retirement 2050 Fund Portfolios (collectively, the "Funds") as of December 31, 2011, and the related statements of operations for the year then ended, and the statements of changes in net assets and the financial highlights for each of the periods presented. These financial statements and financial highlights are the responsibility of the Funds’ management. Our responsibility is to express an opinion on these financial statements and financial highlights based on our audits.
We conducted our audits in accordance with the standards of the Public Company Accounting Oversight Board (United States). Those standards require that we plan and perform the audit to obtain reasonable assurance about whether the financial statements and financial highlights are free of material misstatement. The Funds are not required to have, nor were we engaged to perform, an audit of their internal control over financial reporting. Our audits included consideration of internal control over financial reporting as a basis for designing audit procedures that are appropriate in the circumstances, but not for the purpose of expressing an opinion on the effectiveness of the Funds’ internal control over financial reporting. Accordingly, we express no such opinion. An audit also includes examining, on a test basis, evidence supporting the amounts and disclosures in the financial statements, assessing the accounting principles used and significant estimates made by management, as well as evaluating the overall financial statement presentation. Our procedures included confirmation of securities owned as of December 31, 2011, by correspondence with the custodian and brokers; where replies were not received from brokers, we performed other auditing procedures. We believe that our audits provide a reasonable basis for our opinion.
In our opinion, the financial statements and financial highlights referred to above present fairly, in all material respects, the financial position of each of the Funds as of December 31, 2011, the results of their operations for the year then ended, and the changes in their net assets and the financial highlights for each of the periods presented, in conformity with accounting principles generally accepted in the United States of America.
/s/ DELOITTE & TOUCHE LLP
Milwaukee, WI
February 22, 2012
Ultra Series Fund | December 31, 2011
Other Information
BOARD APPROVAL OF ADVISORY AND SUBADVISORY CONTRACTS
The Board reviewed a variety of matters in connection with the Trust’s investment advisory contract with the Adviser and the three subadvisers.
Discussion of Contract Renewal (Unaudited). The Trustees considered a number of factors when the Board approved the renewal of the advisory contract between the Adviser and the Trust during its meeting in July 2011. Rather than providing you with a list of factors or conclusory statements that explained the Board’s decision-making process, the following discussion is designed to describe what you would have seen and heard if you had been at the Trust’s Board meeting when it renewed the Trust’s advisory contract:
With regard to the nature, extent and quality of the services to be provided by the Adviser and each subadviser, the Board reviewed the biographies and tenure of the personnel involved in Trust management and the experience of the Adviser (and applicable subadviser) and its affiliates as investment manager to other investment companies with similar investment strategies or to individual clients or institutions with similar investment strategies. They recognized the wide array of investment professionals employed by the respective firm or firms. Representatives of the Adviser and each subadviser discussed their firms’ ongoing investment philosophies and strategies intended to provide superior performance consistent with each Trust portfolio’s investment objectives under various market scenarios. The Trustees also noted their familiarity with the Adviser and its affiliates due to the Advisers’ history of providing advisory services to its proprietary investment company clients.
The Board also discussed the quality of services provided to each Trust by its applicable transfer agent, fund administrator and custodian as well as the various administrative services provided directly by the Adviser. Such services included arranging for third party service providers to provide all necessary administration as well as supervising any subadvisers to Trust portfolios.
With regard to the investment performance of the Trust and the investment adviser, the Board reviewed current performance information. They discussed the reasons for both outperformance and underperformance compared with peer groups and applicable indices and benchmarks. They reviewed both long-term and short-term performance and considered the effect on long-term performance that may have been attributable to any previous investment advisers to any Trust portfolio. The Board performed this review in connection with the Adviser and each subadviser that manages a subadvised Trust portfolio.
Representatives of the Adviser discussed with the Board the methodology for arriving at peer groups and indices used for performance comparisons.
With regard to the costs of the services to be provided and the profits to be realized by the Adviser and its affiliates from the relationship with the Trust, the Board reviewed the expense ratios for a variety of other funds in each Trust portfolio’s peer group with similar investment objectives. Again, the Board reviewed these matters in connection with the Adviser and each subadviser that manages a subadvised fund portfolio.
The Board noted that the Adviser or its affiliates, and, as applicable, each subadviser, provided investment management services to other investment company and/or non-investment company clients and considered the fees charged by the Adviser (and respective subadviser) to such funds and clients for purposes of determining whether the given advisory fee was disproportionately large under the so-called "Gartenberg" standard traditionally used by investment company boards in connection with contract renewal considerations. The Board took those fees into account and considered the differences in services and time required by the various types of funds and clients to which the Adviser (or subadviser, if applicable) provided services. The Board recognized that significant differences may exist between the services provided to one type of fund or client and those provided to others, such as those resulting from a greater frequency of shareholder redemptions
Ultra Series Fund | December 31, 2011
Other Information
in a mutual fund and the higher turnover of mutual fund assets. The Board gave such comparisons the weight that they merit in light of the similarities and differences between the services that the various funds require and were wary of "inapt comparisons." They considered that, if the services rendered by the Adviser (or subadviser, if applicable) to one type of fund or client differed significantly from others, then the comparison should not be used. In the case of non-investment company clients for which the Adviser (or subadviser, if applicable) may act as either investment adviser or subadviser, the Board noted that the fee may be lower than the fee charged to the Trust. The Board noted too the various administrative, operational, compliance, legal and corporate communication services required to be handled by the Adviser (or subadviser, if applicable) which are performed for investment company clients but are not performed for other institutional clients.
The Trustees reviewed each Trust portfolio’s fee structure based on total expense ratio as well as by comparing advisory fees to other advisory fees. The Board noted the simple expense structure maintained by the Trust (i.e. for the Target Retirement Date Funds an advisory fee and a capped administrative "services" expense and for the remaining series of the Trust, a unitary fee with limited independent expenses for Trustee compensation and audit fees not covered by the unitary fee). The Board noted the total expense ratios paid by other funds with similar investment objectives, recognizing that such a comparison, while not dispositive, was an important consideration.
The Trustees sought to ensure that fees paid by the Trust were appropriate. The Board reviewed materials demonstrating that although the Adviser is compensated for a variety of the administrative services it provides or arranges to provide to the Target Retirement Date Funds of the Trust and other investment companies pursuant to its administrative services agreements with the Trust (or series, as the case may be), such compensation does not always cover all costs due to the cap on administrative expenses. Administrative, operational, regulatory and compliance fees and costs in excess of the Services Agreement fees or the unitary fee, as applicable, are paid by the Adviser from the investment advisory fees earned. In this regard, the Trustees noted that examination of each Trust portfolio’s total expense ratio compared to those of other investment companies was more meaningful than a simple comparison of basic "investment management only" fee schedules.
The Board recognized that to the extent a Trust portfolio invests in other mutual funds also managed by the Adviser (or its affiliates), the Adviser (or an affiliate) receives investment advisory fees from both the Trust portfolio and the underlying mutual fund. The Board was satisfied in this regard that the Adviser (or an affiliate) provides separate services to each respective Trust’s "Fund of funds" portfolios and the underlying mutual funds in which each such Fund invests in exchange for the fees received from them.
In reviewing costs and profits, the Board noted that for some smaller portfolios, the salaries of all portfolio management personnel, trading desk personnel, corporate accounting personnel and employees of the Adviser who serve as Trust officers, as well as facility costs (rent), could not be supported by fees received from such portfolios alone. However, the Board recognized that the Trust, along with the other funds in the Madison Mosaic and other proprietary mutual fund families in the Madison organization, are profitable to the Adviser because such salaries and fixed costs are already paid in whole or in part from revenue generated by management of other client assets managed by the Adviser. The Trustees noted that total assets managed by the Adviser and its affiliates approximated $16 billion at the time of the meeting. As a result, although the fees paid by each Trust portfolio at its present size might not be sufficient to profitably support a stand-alone fund, the Trust is reasonably profitable to the Adviser as part of its larger, diversified organization. In sum, the Trustees recognized that the Trust is important to the Adviser and is managed with the attention given to the Adviser’s other clients.
With regard to the extent to which economies of scale would be realized as each Trust portfolio grows, the Trustees recognized that at their current sizes, it was premature to discuss any economies of scale not already factored into existing advisory and
Ultra Series Fund | December 31, 2011
Other Information
services agreements. The Trustees also recognized that the Adviser was currently waiving fees with regard to the money market fund portfolio of the Trust.
During the meeting, the Independent Trustees were represented by Independent counsel and he confirmed that the Trust’s Independent Trustees met to review a variety of written contract renewal materials provided by the Adviser and subadvisers. Counsel noted that the Independent Trustees had considered such materials in light of the aforementioned Gartenberg standards as well as criteria either set forth or discussed in the recent Supreme Court decision in Jones v. Harris regarding the investment company contract renewal process under Section 15(c) of the Investment Company Act of 1940, as amended. The Independent Trustees made a variety of additional inquiries regarding such written materials to the Adviser and the subadvisers and representatives of the Adviser and subadvisers discussed each matter raised.
In the course of their review of the contract renewal materials, the Board also reviewed and discussed with counsel the "Rule 12b-1" plans adopted by the Trust. The Board reviewed a variety of statistics and other matters in the written materials regarding these matters during the course of the Board’s consideration of the Rule 12b-1 plans. Finally, the Board also reviewed the Trust’s distribution agreements and the information provided in the written materials regarding the distributor as well as applicable Codes of Ethics.
After further discussion, analysis and review of the totality of the information presented, including the information set forth above and the other information considered by the Board of Trustees, the Trustees, including the Independent Trustees, concluded that the Trust’s advisory fees (including applicable subadvisory fees) are fair and reasonable for each respective portfolio and that renewal of their respective Advisory, Subadvisory and Services Agreements are in the best interests of each respective Trust portfolio and its shareholders.
FUND EXPENSES PAID BY SHAREHOLDERS
As a shareholder of the funds, you pay no transaction costs, but do incur ongoing costs which include management fees; disinterested trustee fees; brokerage commissions and other expenses incurred in connection with the acquisition or disposition of investments; costs of borrowing money; expenses for independent audits, taxes, and extraordinary expenses as approved by a majority of the disinterested trustees. The examples in the table that follows are intended to help you understand your ongoing costs (in dollars) of investing in the funds and to compare these costs with the ongoing costs of investing in other mutual funds.
The examples below are based on an investment of $1,000 invested at the beginning of the period and held for the entire six month period ended December 31, 2011. Expenses paid during the period in the table below are equal to the fund’s annualized expense ratio, multiplied by the average account value over the period, multiplied by 184/365 (to reflect the one-half fiscal year period).
Actual Expenses
The table below provides information about actual account values using actual expenses and actual returns for the funds. You may use the information in this table, together with the amount you invested, to estimate the expenses that you paid over the period. Simply divide your account value by $1,000 (for example, an $8,600 account value divided by $1,000 = 8.6), then multiply the result by the number in the table for the fund you own under the heading entitled "Actual" to estimate the expenses you paid on your account during this period.
Ultra Series Fund | December 31, 2011
Other Information
| | | | |
| Fund | | | | | | | | |
| Conservative Allocation | $1,000 | $ 995.60 | 0.32% | $1.61 | | $ 994.40 | 0.57% | $2.87 |
| Moderate Allocation | 1,000 | 976.60 | 0.32% | 1.59 | | 975.40 | 0.57% | 2.84 |
| Aggressive Allocation | 1,000 | 956.40 | 0.32% | 1.58 | | 955.20 | 0.57% | 2.81 |
| Money Market | 1,000 | 1,000.00 | 0.05% | 0.25 | | 1,000.00 | 0.05% | 0.25 |
| Bond | 1,000 | 1,043.50 | 0.57% | 2.94 | | 1,042.20 | 0.82% | 4.22 |
| High Income | 1,000 | 1,012.10 | 0.77% | 3.91 | | 1,010.80 | 1.02% | 5.17 |
| Diversified Income | 1,000 | 1,023.60 | 0.71% | 3.62 | | 1,022.30 | 0.96% | 4.89 |
| Equity Income | 1,000 | 999.80 | 0.91% | 4.48 | | 998.58 | 1.16% | 5.71 |
| Large Cap Value | 1,000 | 996.10 | 0.61% | 3.07 | | 994.80 | 0.86% | 4.32 |
| Large Cap Growth | 1,000 | 940.50 | 0.82% | 4.01 | | 939.30 | 1.07% | 5.23 |
| Mid Cap | 1,000 | 953.20 | 0.92% | 4.53 | | 952.00 | 1.17% | 5.76 |
| Small Cap | 1,000 | 952.00 | 1.12% | 5.51 | | 950.80 | 1.37% | $6.74 |
| International Stock | 1,000 | 865.00 | 1.21% | 5.69 | | 863.90 | 1.46% | 6.86 |
| Madison Target Retirement 2020 | 1,000 | 981.00 | 0.27% | 1.35 | | | | |
| Madison Target Retirement 2030 | 1,000 | 970.80 | 0.28% | 1.39 | | | | |
| Madison Target Retirement 2040 | 1,000 | 962.20 | 0.28% | 1.38 | | | | |
| Madison Target Retirement 2050 | 1,000 | 950.90 | 0.27% | 1.33 | | | | |
Hypothetical Example for Comparison Purposes
The table also provides information about hypothetical account values and hypothetical expenses based on the funds’ actual expense ratios and an assumed rate of return of 5% per year before expenses, which are not the funds’ actual returns. The hypothetical account values and expenses may not be used to estimate the actual ending account balance or expenses you paid for the period. You may use this information to compare the ongoing costs of investing in the funds and other funds. To do so, compare the 5% hypothetical example of the funds you own with the 5% hypothetical examples that appear in the shareholder reports of other similar funds.
| | | | |
| Fund | | | | | | | | |
| Conservative Allocation | $1,000 | $1,046.80 | 0.32% | $3.27 | | $1,044.30 | 0.57% | $5.83 |
| Moderate Allocation | 1,000 | 1,046.80 | 0.32% | 3.27 | | 1,044.30 | 0.57% | 5.83 |
| Aggressive Allocation | 1,000 | 1,046.80 | 0.32% | 3.27 | | 1,044.30 | 0.57% | 5.83 |
| Money Market | 1,000 | 1,049.50 | 0.05% | 0.51 | | 1,049.50 | 0.05% | 0.51 |
| Bond | 1,000 | 1,044.30 | 0.57% | 5.83 | | 1,041.80 | 0.82% | 8.37 |
| High Income | 1,000 | 1,042.30 | 0.77% | 7.86 | | 1,039.80 | 1.02% | 10.40 |
| Diversified Income | 1,000 | 1,042.90 | 0.71% | 7.25 | | 1,040.40 | 0.96% | 9.79 |
| Equity Income | 1,000 | 1,025.47 | 0.91% | 4.65 | | 1,012,.71 | 1.16% | 5.94 |
| Large Cap Value | 1,000 | 1,043.90 | 0.61% | 6.23 | | 1,041.40 | 0.86% | 8.78 |
| Large Cap Growth | 1,000 | 1,041.80 | 0.82% | 8.37 | | 1,039.30 | 1.07% | 10.91 |
| Mid Cap | 1,000 | 1,040.80 | 0.92% | 9.39 | | 1,038.30 | 1.17% | 11.92 |
| Small Cap | 1,000 | 1,038.80 | 1.12% | 11.42 | | 1,036.30 | 1.37% | 13.95 |
Ultra Series Fund | December 31, 2011
Other Information
| | | | |
| Fund | | | | | | | | |
| International Stock | 1,000 | 1,037.90 | 1.21% | 12.33 | | 1,035.40 | 1.46% | 14.86 |
| Madison Target Retirement 2020 | 1,000 | 1,047.30 | 0.27% | 2.76 | | | | |
| Madison Target Retirement 2030 | 1,000 | 1,047.20 | 0.28% | 2.87 | | | | |
| Madison Target Retirement 2040 | 1,000 | 1,047.20 | 0.28% | 2.87 | | | | |
| Madison Target Retirement 2050 | 1,000 | 1,047.30 | 0.27% | 2.76 | | | | |
Please note that the expenses shown in the table are meant to highlight your ongoing costs only and do not reflect any separate account fees, charges, or expenses imposed by the variable annuity or variable life insurance contracts, or retirement and pension plans that use the funds. The information provided in the hypothetical example table is useful in comparing ongoing fund costs only, and will not help you determine the relative total costs of owning different funds. In addition, if these fees, charges or expenses were included, your costs would have been higher.
AVAILABILITY OF QUARTERLY PORTFOLIO SCHEDULES
The Trust files its complete schedule of portfolio holdings with the SEC for the first and third quarters of each fiscal year on Form N-Q. Form N-Q is available to shareholders at no cost on the SEC’s website at www.sec.gov. Form N-Q may also be reviewed and copied at the Commission’s Public Reference Room in Washington, DC. More information on the operation of the Public Reference Room may be obtained by calling 1-800-732-0330.
PROXY VOTING POLICIES, PROCEDURES AND RECORDS
A description of the policies and procedures used by the Trust to vote proxies related to portfolio securities is available to shareholders at no cost on the SEC’s website at www.sec.gov or by calling CUNA Mutual Insurance Society at 1-800-798-5500. The proxy voting records for the Trust for the most recent twelve-month period ended August 31 are available to shareholders at no cost on the SEC’s website at www.sec.gov.
PROXY VOTING RESULTS
A joint special meeting of shareholders of the Ultra Series Fund - Madison Target Retirement 2020 Fund, Madison Target Retirement 2030 Fund, Madison Target Retirement 2040 Fund, and the Madison Target Retirement 2050 Fund (the "Funds") was held on August 25, 2011, at which shareholders voted on the following proposal, the results of which are described below.
Proposal. To approve a new subadvisory agreement between Madison and each Fund to restructure the fees for these Funds to eliminate the unitary fee and in its place to implement a two-pronged fee structure consisting of an investment advisory fee of 0.25% (annualized) to pay for Madison’s investment advisory services to the Funds, and a separate service fee of 0.05% (annualized) to pay for all the other services and expenses of the Funds.
Madison Target Retirement 2020 Fund
| FOR | 97.530% |
| AGAINST | 2.273% |
| ABSTAIN | 0.197% |
Ultra Series Fund | December 31, 2011
Other Information
Madison Target Retirement 2030 Fund
| FOR | 96.991% |
| AGAINST | 1.142% |
| ABSTAIN | 1.867% |
Madison Target Retirement 2040 Fund
| FOR | 98.190% |
| AGAINST | 1.316% |
| ABSTAIN | 0.494% |
Madison Target Retirement 2050 Fund
| FOR | 98.147% |
| AGAINST | 1.670% |
| ABSTAIN | 0.183% |
FORWARD-LOOKING STATEMENT DISCLOSURE
One of our most important responsibilities as investment company managers is to communicate with shareholders in an open and direct manner. Some of our comments in our letters to shareholders are based on current management expectations and are considered "forward-looking statements." Actual future results, however, may prove to be different from our expectations. You can identify forward-looking statements by words such as "estimate," "may," "will," "expect," "believe," "plan" and other similar terms. We cannot promise future returns. Our opinions are a reflection of our best judgment at the time this report is compiled, and we disclaim any obligation to update or alter forward-looking statements as a result of new information, future events, or otherwise.
SEC File Number: 811-04815
Ultra Series Fund | December 31, 2011
Ultra Series Fund’s Trustees and Officers
The address of each trustee and officer of the Trust is 550 Science Drive, Madison, Wisconsin 53711, except for Mr. Mason for which it is 8777 N. Gainey Center Drive, #220, Scottsdale, Arizona 85258. The Statement of Additional Information, which includes additional information about the trustees and officers, is available at no cost on the SEC’s website at www.sec.gov or by calling CMFG Life Insurance Company at 1-800-798-5500.
Interested Trustees and Officers
Name and Year of Birth | Position(s) and Length of Time Served | Principal Occupation(s) During Past Five Years | Other Directorships/Trusteeships |
Katherine L. Frank1 1960 | Trustee and President, 2009 - Present | Madison Investment Holdings, Inc. ("MIH") (affiliated investment advisory firm of Madison), Executive Director and Chief Operating Officer, 2010 - Present; Managing Director and Vice President, 1986 - 2010; Madison Asset Management, LLC ("Madison"), Executive Director and Chief Operating Officer, 2010 - Present; Vice President, 2004 - 2010; Madison Investment Advisors, LLC ("MIA") (affiliated investment advisory firm of Madison), Executive Director and Chief Operating Officer, 2010 - Present; President, 1996 - 2010 ; Madison Mosaic Funds (13) (mutual funds), President, 1996 - Present; Madison Strategic Sector Premium Fund (closed end fund), President, 2005 - Present; Madison/Claymore Covered Call and Equity Strategy Fund (closed end fund), Vice President, 2005 - Present; MEMBERS Mutual Funds (13) (mutual fund), President, 2009 - Present | Madison Mosaic Funds (all but Equity Trust), 1996 - Present; Madison Strategic Sector Premium Fund, 2005 - Present; MEMBERS Mutual Funds (13), 2009 - Present |
Frank E. Burgess 1942 | Vice President, 2009 - Present | MIH, Founder, Executive Director and President, 2010 - Present; Managing Director and President, 1973 - 2010; Madison, Executive Director and President, 2010 - Present; President, 2004 - 2010; MIA, Executive Director and President, 2010 - Present; Madison Mosaic Funds (13), Vice President, 1996 - Present; Madison Strategic Sector Premium Fund, Vice President, 2005 - Present; MEMBERS Mutual Funds (13), Vice President, 2009 - Present | N/A |
Jay R. Sekelsky 1959 | Vice President, 2009 - Present | MIH, Executive Director and Chief Investment Officer, 2010 - Present; Managing Director and Vice President, 1990 - 2010; Madison, Executive Director and Chief Investment Officer, 2010 - Present; MIA, Executive Director and Chief Investment Officer, 2010 - Present; Vice President, 1996 - 2010; Madison Mosaic Funds (13), Vice President, 1996 - Present; Madison Strategic Sector Premium Fund, Vice President, 2005 - Present; Madison/Claymore Covered Call and Equity Strategy Fund, Vice President, 2005 - Present; MEMBERS Mutual Funds (13), Vice President, 2009 - Present | N/A |
1 "Interested person" as defined in the Investment Company Act of 1940. Considered an interested Trustee because of the position held with the investment adviser of the Trust.
Ultra Series Fund | December 31, 2011
Ultra Series Fund’s Trustees and Officers
Name and Year of Birth | Position(s) and Length of Time Served | Principal Occupation(s) During Past Five Years | Other Directorships/Trusteeships |
Paul Lefurgey 1964 | Vice President, 2009-Present | MIH, Managing Director and Head of Fixed Income Investments, 2005 - Present; Madison and MIA, Managing Director and Head of Fixed Income Investments, 2010 - Present; MEMBERS Capital Advisors, Inc. ("MCA") (investment advisory firm), Madison, WI, Vice President, 2003 - 2005; Madison Mosaic Funds (13), Vice President, 2009 - Present; Madison Strategic Sector Premium Fund, Vice President, 2010 - Present; MEMBERS Mutual Funds (13), Vice President, 2009 - Present | N/A |
Greg D. Hoppe 1969 | Treasurer, 2009-Present | MIH and MIA, Vice President, 1999 - Present; Madison, Vice President, 2009 - Present; Madison Mosaic Funds (13), Treasurer, 2009 - Present; Chief Financial Officer, 1999 - 2009; Madison Strategic Sector Premium Fund, Treasurer, 2009 - Present; Chief Financial Officer, 2005 - 2009; Madison/Claymore Covered Call and Equity Strategy Fund, Vice President, 2008 - Present; MEMBERS Mutual Funds (13), Treasurer, 2009 - Present | N/A |
Holly S. Baggot 1960 | Secretary, 1999 - Present; Assistant Treasurer, 1999 - 2007; 2009 - Present; Treasurer, 2008 - 2009 | MIH and MIA, Vice President, 2010 - Present; Madison, Vice President, 2009 - Present; MCA, Director-Mutual Funds, 2008-2009; Director-Mutual Fund Operations, 2006-2008; Operations Officer-Mutual Funds, 2005-2006; Senior Manager-Product & Fund Operations, 2001-2005; Madison Mosaic Funds (13), Secretary and Assistant Treasurer, 2009 - Present; Madison Strategic Sector Premium Fund, Secretary and Assistant Treasurer, 2010 - Present; MEMBERS Mutual Funds (13), Secretary, 1999-Present and Treasurer, 2008-2009 and Assistant Treasurer, 1997-2007 and 2009-Present | N/A |
Ultra Series Fund | December 31, 2011
Ultra Series Fund’s Trustees and Officers
Name and Year of Birth | Position(s) and Length of Time Served | Principal Occupation(s) During Past Five Years | Other Directorships/Trusteeships |
W. Richard Mason 1960 | Chief Compliance Officer, Corporate Counsel and Assistant Secretary, 2009 - Present | MIH, MIA, Madison and Madison Scottsdale, LC (an affiliated investment advisory firm of Madison), Chief Compliance Officer and Corporate Counsel, 2009 - Present; General Counsel and Chief Compliance Officer, 1996 - 2009; Mosaic Funds Distributor, LLC (an affiliated brokerage firm of Madison), Principal, 1998 - Present; Concord Asset Management ("Concord") (an affiliated investment advisory firm of Madison), LLC, General Counsel, 1996 - 2009; NorthRoad Capital Management LLC ("NorthRoad") (an affiliated investment advisory firm of Madison), Corporate Counsel, 2011 - Present; Madison Mosaic Funds (13), Chief Compliance Officer, Corporate Counsel and Assistant Secretary, 2009 - Present; Secretary, General Counsel and Chief Compliance Officer, 1992 - 2009; Madison Strategic Sector Premium Fund, Chief Compliance Officer, Corporate Counsel and Assistant Secretary, 2009 - Present; Secretary, General Counsel and Chief Compliance Officer, 2005 - 2009; MEMBERS Mutual Funds (13), Chief Compliance Officer, Corporate Counsel and Assistant Secretary, 2009 - Present | N/A |
Pamela M. Krill 1966 | General Counsel, Chief Legal Officer and Assistant Secretary, 2009 - Present | MIH, MIA, Madison, Madison Scottsdale, LC, Mosaic Funds Distributor, and Concord, General Counsel and Chief Legal Officer, 2009 - Present; NorthRoad, General Counsel & Chief Legal Officer, 2011 - Present; Madison Mosaic Funds (13), General Counsel, Chief Legal Officer and Assistant Secretary, 2009 - Present; Madison Strategic Sector Premium Fund, General Counsel, Chief Legal Officer and Assistant Secretary, 2010 - Present; MEMBERS Mutual Funds (13), General Counsel, Chief Legal Officer and Assistant Secretary, 2009 - Present; CUNA Mutual Insurance Society (insurance company with affiliated investment advisory, brokerage and mutual fund operations), Madison, WI, Managing Associate General Counsel-Securities & Investments, 2007 - 2009; Godfrey & Kahn, S.C. (law firm), Madison and Milwaukee, WI, Shareholder, Securities Practice Group, 1994-2007 | N/A |
Ultra Series Fund | December 31, 2011
Ultra Series Fund’s Trustees and Officers
Independent Trustees
Name and Year of Birth | Position(s) and Length of Time Served1 | Principal Occupation(s) During Past Five Years | Portfolios Overseen in Fund Complex2 | Other Directorships/Trusteeships |
Philip E. Blake 1944 | Trustee, 2009-Present | Retired Investor; Lee Enterprises, Inc (news and advertising publisher), Madison, WI, Vice President, 1998 - 2001; Madison Newspapers, Inc., Madison, WI, President and Chief Executive Officer, 1993 - 2000 | 44 | Edgewood College, 2003 - Present; Chairman of the Board, 2010 - Present; Nerites Corporation (technology company), 2004 - Present; Madison Mosaic Funds (13), 2001 - Present; Madison Strategic Sector Premium Fund, 2005 - Present; MEMBERS Mutual Funds (13), 2009 - Present |
James R Imhoff, Jr. 1944 | Trustee, 2009 - Present | First Weber Group (real estate brokers), Madison, WI, Chief Executive Officer, 1996-Present | 44 | Park Bank, 1978 - Present; Madison Mosaic Funds (13), 1996 - Present; Madison Strategic Sector Premium Fund, 2005 - Present; Madison/ Claymore Covered Call and Equity Strategy Fund, 2005 - Present; MEMBERS Mutual Funds (13), 2009 - Present |
Steven P. Riege 1954 | Trustee, 2005-Present | Ovation Leadership (management consulting), Milwaukee, WI, Owner/President, 2001 - Present; Robert W. Baird & Company (financial services), Milwaukee, WI, Senior Vice President-Marketing and Vice President-Human Resources, 1986 - 2001 | 30 | MEMBERS Mutual Funds (13), 2005-Present |
1 Independent Trustees serve in such capacity until the Trustee reaches the age of 76, unless retirement is waived by unanimous vote of the remaining Trustees on an annual basis.
2 As of the date of this report, the fund complex consists of the Trust with 17 portfolios, the MEMBERS Mutual Funds with 13 portfolios, the Madison Strategic Sector Premium Fund (a closed-end fund) and the Madison Mosaic Equity, Income, Tax-Free and Government Money Market Trusts, which together have 13 portfolios, for a grand total of 44 separate portfolios in the fund complex. Not every Trustee is a member of the Board of Trustees of every fund in the fund complex, as noted above.
Ultra Series Fund | December 31, 2011
Ultra Series Fund’s Trustees and Officers
Name and Year of Birth | Position(s) and Length of Time Served1 | Principal Occupation(s) During Past Five Years | Portfolios Overseen in Fund Complex2 | Other Directorships/Trusteeships |
Richard E. Struthers 1952 | Trustee, 2004-Present | Clearwater Capital Management (investment advisory firm), Minneapolis, MN, Chair and Chief Executive Officer, 1998 - Present; Park Nicollet Health Services, Minneapolis, MN, Chairman, Finance and Investment Committee, 2006 - Present; IAI Mutual Funds, Minneapolis, MN, President and Director, 1992-1997 | 30 | Park Nicolet Health Services, 2001 - Present; MEMBERS Mutual Funds (13), 2004 - Present |
Lorence D. Wheeler 1938 | Trustee, 2009 - Present | Retired investor; Credit Union Benefits Services, Inc. (a provider of retirement plans and related services for credit union employees nationwide), Madison, WI, President, 1986 - 1997 | 44 | Grand Mountain Bank FSB and Grand Mountain Bancshares, Inc. 2003 - Present; Madison Mosaic Funds (13), 1996 - Present; Madison Strategic Sector Premium Fund, 2005 - Present; Madison/Claymore Covered Call and Equity Strategy Fund, 2005 - Present; MEMBERS Mutual Funds (13), 2009 - Present |
1 Independent Trustees serve in such capacity until the Trustee reaches the age of 76, unless retirement is waived by unanimous vote of the remaining Trustees on an annual basis.
2 As of the date of this report, the fund complex consists of the Trust with 17 portfolios, the MEMBERS Mutual Funds with 13 portfolios, the Madison Strategic Sector Premium Fund (a closed-end fund) and the Madison Mosaic Equity, Income, Tax-Free and Government Money Market Trusts, which together have 13 portfolios, for a grand total of 44 separate portfolios in the fund complex. Not every Trustee is a member of the Board of Trustees of every fund in the fund complex, as noted above.
This page was intentionally left blank.