OMB APPROVAL
OMB Number: 3235-0570
Expires: August 31, 2020
Estimated average burden hours per response...20.6
UNITED STATES SECURITIES AND EXCHANGE COMMISSION
Washington, DC 20549
FORM N-CSR
CERTIFIED SHAREHOLDER REPORT OF REGISTERED
MANAGEMENT INVESTMENT COMPANIES
Investment Company Act file number 811-4815
Ultra Series Fund
(Exact name of registrant as specified in charter)
550 Science Drive, Madison, WI 53711
(Address of principal executive offices)(Zip code)
Kevin S. Thompson
Madison Funds Legal and Compliance Department
550 Science Drive
Madison, WI 53711
(Name and address of agent for service)
Registrant’s telephone number, including area code: 608-274-0300
Date of fiscal year end: December 31
Date of reporting period: December 31, 2018
Form N-CSR is to be used by management investment companies to file reports with the Commission not later than 10 days after the transmission to stockholders of any report that is required to be transmitted to stockholders under Rule 30e-1 under the Investment Company Act of 1940 (17 CFR 270.30e-1). The Commission may use the information provided on Form N-CSR in its regulatory, disclosure review, inspection, and policymaking roles.
A registrant is required to disclose the information specified by Form N-CSR, and the Commission will make this information public. A registrant is not required to respond to the collection of information contained in Form N-CSR unless the Form displays a currently valid Office of Management and Budget ("OMB") control number. Please direct comments concerning the accuracy of the information collection burden estimate and any suggestions for reducing the burden to Secretary, Securities and Exchange Commission, 450 Fifth Street, NW, Washington, DC 20549-0609. The OMB has reviewed this collection of information under the clearance requirements of 44 U.S.C. § 3507.
Item 1. Certified Financial Statement
| Annual Report |
| December 31, 2018 |
ULTRA SERIES FUND
| | Conservative Allocation Fund |
| | Moderate Allocation Fund |
| | Aggressive Allocation Fund |
| | Core Bond Fund |
| | High Income Fund |
| | Diversified Income Fund |
| | Large Cap Value Fund |
| | Large Cap Growth Fund |
| | Mid Cap Fund |
| | International Stock Fund |
| | Madison Target Retirement 2020 Fund |
| | Madison Target Retirement 2030 Fund |
| | Madison Target Retirement 2040 Fund |
| | Madison Target Retirement 2050 Fund |
Beginning January 1, 2021, as permitted by regulations adopted by the Securities and Exchange Commission, the insurance company that offers your contract may determine that it will no longer send you paper copies of the fund’s shareholder reports like this one, unless you specifically request paper copies from the insurance company or your financial intermediary. Instead, the shareholder reports will be made available on a website and the insurance company will notify you by mail each time a report is posted and provide you with a website link to access the report. Instructions for requesting paper copies will be provided by your insurance company or financial intermediary.
If you have already elected to receive shareholder reports electronically, you will not be affected by this change and do not need to take any action. If your insurance company or financial intermediary offers electronic delivery, you may elect to receive shareholder reports and other communications from the insurance company or financial intermediary by following the instructions provided by the insurance company or financial intermediary.
You may elect to receive paper copies of all future reports free of charge from the insurance company or financial intermediary. You can inform the insurance company or financial intermediary that you wish to continue receiving paper copies of your shareholder reports by contacting your insurance company or financial intermediary. Your election to receive reports in paper will apply to all funds held in your account with your insurance company or financial intermediary.
Ultra Series Fund | December 31, 2018
| | | Page |
| Management’s Discussion of Fund Performance | | |
Period in Review | | 2 |
Allocation Funds | | 4 |
Conservative Allocation Fund | | 4 |
Moderate Allocation Fund | | 5 |
Aggressive Allocation Fund | | 7 |
Core Bond Fund | | 8 |
High Income Fund | | 10 |
Diversified Income Fund | | 11 |
Large Cap Value Fund | | 13 |
Large Cap Growth Fund | | 14 |
Mid Cap Fund | | 15 |
International Stock Fund | | 16 |
Madison Target Retirement 2020 Fund | | 19 |
Madison Target Retirement 2030 Fund | | 20 |
Madison Target Retirement 2040 Fund | | 22 |
Madison Target Retirement 2050 Fund | | 23 |
Notes to Management’s Discussion of Fund Performance | | 25 |
| Portfolios of Investments | | |
Conservative Allocation Fund | | 28 |
Moderate Allocation Fund | | 29 |
Aggressive Allocation Fund | | 30 |
Core Bond Fund | | 31 |
High Income Fund | | 36 |
Diversified Income Fund | | 38 |
Large Cap Value Fund | | 43 |
Large Cap Growth Fund | | 44 |
Mid Cap Fund | | 45 |
International Stock Fund | | 46 |
Madison Target Retirement 2020 Fund | | 48 |
Madison Target Retirement 2030 Fund | | 48 |
Madison Target Retirement 2040 Fund | | 49 |
Madison Target Retirement 2050 Fund | | 49 |
| Financial Statements | | |
Statements of Assets and Liabilities | | 51 |
Statements of Operations | | 54 |
Statements of Changes in Net Assets | | 56 |
Financial Highlights for a Share of Beneficial Interest Outstanding | | 61 |
| Notes to Financial Statements | | 75 |
| Report of Independent Registered Public Accounting Firm | | 93 |
| Other Information | | 94 |
| Trustees and Officers | | 101 |
Nondeposit investment products are not federally insured, involve investment risk, may lose value and are not obligations of or guaranteed by any financial institution. For more complete information about Ultra Series Fund, including charges and expenses, request a prospectus from your financial advisor or from CMFG Life Insurance Company, 2000 Heritage Way, Waverly, IA 50677. Consider the investment objectives, risks, and charges and expenses of any fund carefully before investing. The prospectus contains this and other information about the investment company. For more current Ultra Series Fund performance information, please call 1-800-SEC-0330. Current performance may be lower or higher than the performance data quoted within. Past performance does not guarantee future results. Nothing in this report represents a recommendation of a security by the investment adviser. Portfolio holdings may have changed since the date of this report.
Ultra Series Fund | December 31, 2018
Management’s Discussion of Fund Performance (unaudited)
PERIOD IN REVIEW
The stock market teetered in the fourth quarter as sentiment overshadowed economic fundamentals and drove market indices sharply lower. During the fourth-quarter, the S&P 500® declined (13.52)%, the Russell Midcap® lost (15.37)%, and the MSCI EAFE® declined (12.54)%. For 2018, the S&P 500® lost (4.38)%, the Russell Midcap® lost (9.06)% and the MSCI EAFE® declined (13.79)% . Bond returns were generally positive during the quarter as longer-dated interest rates actually declined, despite short-term rates continuing to rise. The Bloomberg Barclays Intermediate Government/Credit Index returned 1.65% and the Bloomberg Barclays U.S. Aggregate Bond Index advanced 1.64% during the quarter resulting in full year results of 0.88% and 0.01%, respectively.
As Benjamin Graham, the father of securities analysis, said “in the short run, the stock market is a voting machine, but in the long run it is a weighing machine.” The second half of 2018 was a classic example of the “voting machine” in full effect as markets gyrated based mostly on investor sentiment. A sharp run-up by the S&P 500 of 7.7% in the third quarter was followed by a sharp decline of 13.5% in the fourth quarter. There was no shortage of items for investors to fret about: Fed rate hikes with simultaneous shrinking of its balance sheet, U.S./China trade tensions and the shutdown of the federal government. While economic data generally softened during the quarter, it continued to show growth as third quarter GDP advanced 3.2%, unemployment remained at 3.7%, wages advanced 3.1% (year over year) and third quarter earnings showed robust growth. Still, investor sentiment can have real influence over actual economic performance as confidence often drives consumer and business behavior – which can result in a self-fulfilling situation.
Indeed, 2018 stood in contrast to 2017, when the S&P 500 exhibited a “perfect” year – when every month delivered positive returns – culminating with a 21.8% gain for 2017. Investor psychology was giddy in 2017, not just over stocks but with speculators laying audacious bets on cryptocurrencies (think Bitcoin), VIX (the volatility measure of options on the S&P 500) and high-flying technology stocks. Much of that positive sentiment continued into 2018, reaching a crescendo in the third quarter. Since then, richly valued technology stocks have corrected, Bitcoin has fallen 80% from its peak and VIX has risen from record low levels in 2017, wiping out some investors who placed bets that low volatility would persist. Perhaps the flip-flop in 2018 wasn’t so unusual – from euphoria to fret – and may indeed create a healthier investment backdrop. In fact, if one looks at 2017 and 2018 together, the S&P 500 returned a healthy 7.9% annualized, not far off our longer-range forecast for stock returns of 6-7% per year.
Treasury yields continued to move higher during the third quarter. The 2-year Treasury yield rose 29 basis points (bps) during the period, closing near a decade high level of 2.82%. Longer-term yields also rose. The benchmark 10-year Treasury Note, which began the quarter at 2.86%, advanced 20 bps and closed at 3.06%. As a result, three month returns were mixed, with most high quality bond indices ranging from slightly positive to slightly negative depending on maturity and quality characteristics.
Stock market volatility was mirrored in the bond market as both investment grade and high yield bonds suffered from sharply increasing spreads (risk premiums) over comparable Treasuries. Indeed, for much of this year, the credit markets have been sounding a warning bell on investor preferences for risk assets. The fourth quarter saw a continuation of the trend toward larger risk premiums, especially in the quality tiers at the lower end of the credit spectrum. The lowest rated high yield bonds suffered losses for both the quarter and the year, despite falling Government bond yields during the final three months. We expect this trend toward “up in quality” preference to continue as less-creditworthy borrowers struggle with rising financing costs at a time when the U.S. Government faces growing needs for capital to finance surging fiscal deficits.
Graham opined “in the long run the market is a weighing machine,” meaning that economic fundamentals drive long-term value of a company (i.e., growth of sales, earnings and assets). Overall economic data have remained positive in the U.S. In fact, retail sales this holiday season were the best in six years and both auto sales and heavy truck sales
Ultra Series Fund | Management’s Discussion of Fund Performance (unaudited) - continued | December 31, 2018
remain strong. Payrolls continued to grow (averaging gains of 170,000 jobs/month in the quarter) and capital goods shipments remain steady. Additionally, with the sharp pullback in equity prices during the fourth quarter, valuation levels have improved with the price-earnings ratio showing one of its sharpest quarterly declines on record. Still, we believe that investors have merit in their concern as central banks withdraw liquidity from the system as they redeem their balance sheet – arguably one of the key drivers of asset prices – and evidence mounts that economic growth is slowing.
Where does this leave investors as we begin 2019? We believe continued volatility should be anticipated as the markets weigh economic growth, solid earnings and strong employment against tighter monetary policy, shifting interest rates, trade tensions and uncertain government policy. Without doubt, the economic expansion will come to an end but predicting that point is near impossible – making market timing a futile endeavor in our opinion. Indeed, it was in this spirit that Graham concluded short-term markets are driven by investor psychology, but long-term markets are driven by economic fundamentals. With this in mind, we continue to believe investors are best served by choosing risk assets based upon investment time horizon and risk tolerance. We believe that approach, along with investing in stocks of lower-risk, higher-quality companies and shorter-duration, higher-quality bonds, will allow investors to participate in the market, while providing some shelter as we experience market volatility.
Ultra Series Fund | Management’s Discussion of Fund Performance (unaudited) - continued | December 31, 2018
ALLOCATION FUNDS
The Ultra Series Conservative Allocation, Moderate Allocation and Aggressive Allocation Funds (the “Funds”) invest primarily in shares of registered investment companies (the “Underlying Funds”). The Funds are diversified among a number of asset classes and their allocation among Underlying Funds is based on an asset allocation model developed by Madison Asset Management, LLC (“Madison”), the Funds’ investment adviser. The team may use multiple analytical approaches to determine the appropriate asset allocation, including:
| • | Asset allocation optimization analysis – considers the degree to which returns in different asset classes do or do not move together, and the Funds’ aim to achieve a favorable overall risk profile for any targeted portfolio return. |
| | |
| • | Scenario analysis – historical and expected return data is analyzed to model how individual asset classes and combinations of asset classes would affect the Funds under different economic and market conditions. |
| | |
| • | Fundamental analysis – draws upon Madison’s investment teams to judge each asset class against current and forecasted market conditions. Economic, industry and security analysis is used to develop return and risk expectations that may influence asset class selection. In addition, Madison has a flexible mandate which permits the Funds, at the sole discretion of Madison, to materially reduce equity risk exposures when and if conditions are deemed to warrant such an action. |
| CONSERVATIVE ALLOCATION FUND |
|
| INVESTMENT STRATEGY HIGHLIGHTS |
Under normal circumstances, the Ultra Series Conservative Allocation Fund’s total net assets will be allocated among various asset classes and Underlying Funds, including those whose shares trade on a stock exchange (exchange traded funds or “ETFs”), with target allocations over time of approximately 35% equity investments and 65% fixed income investments. Underlying Funds in which the Fund invests may include funds advised by Madison and/or its affiliates, including the Madison Funds (the “Affiliated Underlying Funds”). Generally, Madison will not invest more than 75% of the Fund’s net assets, at the time of purchase, in Affiliated Underlying Funds.
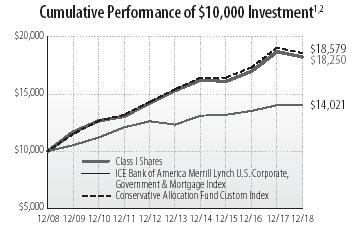
The Ultra Series Conservative Allocation Fund (Class I) returned (2.49)% over the 12-month period, slightly outperforming the Conservative Allocation Fund Custom Index return of (2.60)%. The fund outperformed the Morningstar Conservative Allocation Category peer group, which returned (4.32)%.
After a long absence, volatility reestablished itself with authority over the past 12 months. Markets entered 2018 revved up on fresh U.S. fiscal stimulus provided by sweeping tax law changes and a broad-based synchronized global economic expansion. However, after making a parabolic 12% advance between mid-November 2017 and late January 2018, the S&P 500® experienced an abrupt 10% nosedive over two-weeks. Rising U.S. interest rates and the concern of an even more restrictive Federal Reserve rate hike campaign appeared to be behind the newfound market concerns.
By spring it was clear that economic growth in both Europe and China was slowing and failing to meet expectations, while talk of tariffs and a potential trade war sparked even greater worries on the global stage. The U.S. equity market was able to recover throughout the summer on the back of impressive earnings growth, assisted by the corporate tax cut. International markets, however, continued to decline. Emerging markets were hit especially hard by the combination of a slowing China, stronger U.S. Dollar and a general tightening in financial conditions. In late September, turbulence returned as the markets took the turn of the season to fall quite literally, shaken by a resolute Fed amid signs of slowing U.S. economic data. An historic
Ultra Series Fund | Management’s Discussion of Fund Performance (unaudited) - continued | December 31, 2018
December decline took the S&P 500 Index from a sizable 11.2% advance at its September peak to a 4.4% loss for the calendar year.
Outside of the U.S., foreign equities were strongly negative as international stocks (MSCI ACWI ex-USA Index®) dropped 14.2% and emerging markets (MSCI EM Index) fell 14.6%. Bonds (Bloomberg Barclays U.S. Aggregate Bond Index), hurt by rising interest rates for the bulk of the year, made a fourth quarter charge to finish flat for 2018.
The Fund held up extremely well during the two larger equity declines, buffered by an underweight allocation to equities and an elevated cash position. Within U.S. equities, overweight allocations to growth stocks boosted returns, as did outperformance from our two core actively managed large cap funds. Timely allocations into Consumer Staples and Health Care were also additive. Detracting from returns were our overweight allocations to midcaps, Energy stocks and Commodities. Unfortunately, our equity composition was leaning a little too heavily on the international side early on, which detracted from returns. However, we quickly reallocated back toward the U.S. as our concerns grew over the potential for trade disruption. We also increased the use of dollar hedging, which aided performance as the dollar strengthened during the year. On the fixed income side, the Fund was rewarded for taking lower interest rate (duration) risk throughout the year as interest rates increased. The largest positive contributions came from our short-term holdings in corporate bonds and Treasuries. Below benchmark performance from our core actively managed holdings provided the largest drag on returns. Positions in TIPS (Treasury Inflation Protected Securities), which were negatively impacted by the steep decline in inflation break-evens late in the year, and longer-term Treasuries also detracted from the Fund’s return.
We are paying close attention to how the U.S. and global economies respond to less accommodative monetary conditions. From an historical perspective, U.S. interest rates are still very low. The notion that the U.S. could readily withstand still higher rates has been the prevailing view of most economists. We’ve long thought otherwise. Due to elevated, if not record, global debt levels, our view remains that interest rate sensitivity is very high. In other words, small increases in interest rates are now disproportionately impactful in slowing economic growth. If true, it could mean that the Fed is already overly restrictive and has possibly made a policy error in raising rates to current levels. Until remedied, this would be a hostile environment for risk assets. We believe recent economic weakness – housing and autos – is potentially corroborating this view. We stand ready to increase our level of defense if the backdrop deteriorates and believe that the Fund is well positioned for today’s increasingly volatile capital markets.
| |
| Average Annual Total Return (%) through December 31, 20181,2 |
| | | | | | | | | | | Since |
| | | | | | | | | | | 5/1/09 |
| | | 1 Year | | 3 Years | | 5 Years | | 10 Year | | Inception |
| |
| Ultra Series Conservative Allocation, Class I | | -2.49 | | 4.25 | | 3.58 | | 6.20 | | NA |
| |
| Ultra Series Conservative Allocation, Class II | | -2.73 | | 3.99 | | 3.32 | | NA | | 6.00 |
| |
| ICE BofAML US Corp, Govt & Mortg Index | | 0.00 | | 2.07 | | 2.61 | | 3.44 | | 3.54 |
| |
| Conservative Allocation Fund Custom Index | | -2.60 | | 4.15 | | 3.80 | | 6.39 | | 6.55 |
| |
| See accompanying Notes to Management’s Discussion of Fund Performance. |
| |
| PORTFOLIO ALLOCATION AS A PERCENTAGE OF NET ASSETS AS OF 12/31/18 | | | |
| |
| Alternative Funds | | 1.3 | % |
| Bond Funds | | 61.4 | % |
| Foreign Stock Funds | | 10.5 | % |
| Short-Term Investments | | 5.0 | % |
| Stock Funds | | 22.0 | % |
| Net Other Assets and Liabilities | | (0.2) | % |
| MODERATE ALLOCATION FUND |
|
| INVESTMENT STRATEGY HIGHLIGHTS |
Under normal circumstances, the Ultra Series Moderate Allocation Fund’s total net assets will be allocated among various asset classes and Underlying Funds, including those whose shares trade on a stock exchange (exchange traded funds or “ETFs”), with target allocations over time of approximately 60% equity investments and 40% fixed income investments. Underlying Funds in which the Fund invests may include Affiliated Underlying Funds. Generally, Madison will not invest more than 75% of the Fund’s net assets, at the time of purchase, in Affiliated Underlying Funds.
Ultra Series Fund | Management’s Discussion of Fund Performance (unaudited) - continued | December 31, 2018
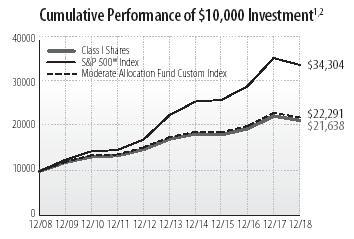
The Ultra Series Moderate Allocation Fund (Class I) returned (4.36)% over the 12-month period, outperforming the Moderate Allocation Fund Custom Index return of (4.58)%. The Fund outperformed the Morningstar Moderate Allocation Category peer group, which returned (5.25)%.
After a long absence, volatility reestablished itself with authority over the past 12 months. Markets entered 2018 revved up on fresh U.S. fiscal stimulus provided by sweeping tax law changes and a broad-based synchronized global economic expansion. However, after making a parabolic 12% advance between mid-November 2017 and late January 2018, the S&P 500® experienced an abrupt 10% nosedive over two-weeks. Rising U.S. interest rates and the concern of an even more restrictive Federal Reserve rate hike campaign appeared to be behind the newfound market concerns.
By spring it was clear that economic growth in both Europe and China was slowing and failing to meet expectations, while talk of tariffs and a potential trade war sparked even greater worries on the global stage. The U.S. equity market was able to recover throughout the summer on the back of impressive earnings growth, assisted by the corporate tax cut. International markets, however, continued to decline. Emerging markets were hit especially hard by the combination of a slowing China, stronger U.S. Dollar and a general tightening in financial conditions. In late September, turbulence returned as the markets took the turn of the season to fall quite literally, shaken by a resolute Fed amid signs of slowing U.S. economic data. An historic December decline took the S&P 500 Index from a sizable 11.2% advance at its September peak to a 4.4% loss for the calendar year.
Outside of the U.S., foreign equities were strongly negative as international stocks (MSCI ACWI ex-USA Index®) dropped 14.2% and emerging markets (MSCI EM Index) fell 14.6%. Bonds (Bloomberg Barclays U.S. Aggregate Bond Index), hurt by rising interest rates for the bulk of the year, made a fourth quarter charge to finish flat for 2018.
The Fund held up extremely well during the two larger equity declines, buffered by an underweight allocation to equities and an elevated cash position. Within U.S. equities, overweight allocations to growth stocks boosted returns, as did outperformance from our two core actively managed large cap funds. Timely allocations into Consumer Staples and Health Care were also additive. Detracting from returns were our overweight allocations to midcaps, Energy stocks and Commodities. Unfortunately, our equity composition was leaning a little too heavily on the international side early on, which detracted from returns. However, we quickly reallocated back toward the U.S. as our concerns grew over the potential for trade disruption. We also increased the use of dollar hedging, which aided performance as the dollar strengthened during the year. On the fixed income side, the Fund was rewarded for taking lower interest rate (duration) risk throughout the year as interest rates increased. The largest positive contributions came from our short-term holdings in corporate bonds and Treasuries. Below benchmark performance from our core actively managed holdings provided the largest drag on returns. Positions in TIPS (Treasury Inflation Protected Securities), which were negatively impacted by the steep decline in inflation break-evens late in the year, and longer-term Treasuries also detracted from the Fund’s return.
We are paying close attention to how the U.S. and global economies respond to less accommodative monetary conditions. From an historical perspective, U.S. interest rates are still very low. The notion that the U.S. could readily withstand still higher rates has been the prevailing view of most economists. We’ve long thought otherwise. Due to elevated, if not record, global debt levels, our view remains that interest rate sensitivity is very high. In other words, small increases in interest rates are now disproportionately impactful in slowing economic growth. If true, it could mean that the Fed is already overly restrictive and has possibly made a policy error in raising rates to current levels. Until remedied, this would be a hostile environment for risk
Ultra Series Fund | Management’s Discussion of Fund Performance (unaudited) - continued | December 31, 2018
assets. We believe recent economic weakness – housing and autos – is potentially corroborating this view. We stand ready to increase our level of defense if the backdrop deteriorates and believe that the Fund is well positioned for today’s increasingly volatile capital markets.
| |
| Average Annual Total Return (%) through December 31, 20181,2 |
| | | | | | | | | | | Since |
| | | | | | | | | | | 5/1/09 |
| | | 1 Year | | 3 Years | | 5 Years | | 10 Years | | Inception |
| |
| Ultra Series Moderate Allocation, Class I | | -4.36 | | 5.64 | | 4.53 | | 8.02 | | NA |
| |
| Ultra Series Moderate Allocation, Class II | | -4.60 | | 5.38 | | 4.27 | | NA | | 7.89 |
| |
| S&P 500® Index | | -4.38 | | 9.26 | | 8.49 | | 13.12 | | 13.83 |
| |
| Moderate Allocation Fund Custom Index | | -4.58 | | 5.56 | | 4.61 | | 8.35 | | 8.59 |
| |
| See accompanying Notes to Management’s Discussion of Fund Performance. |
| |
| PORTFOLIO ALLOCATION AS A PERCENTAGE OF NET ASSETS AS OF 12/31/18 | | | |
| |
| Alternative Funds | | 2.2 | % |
| Bond Funds | | 37.8 | % |
| Foreign Stock Funds | | 18.7 | % |
| Short-Term Investments | | 7.3 | % |
| Stock Funds | | 37.7 | % |
| Net Other Assets and Liabilities | | (3.7) | % |
| AGGRESSIVE ALLOCATION FUND |
|
| INVESTMENT STRATEGY HIGHLIGHTS |
Under normal circumstances, the Ultra Series Aggressive Allocation Fund’s total net assets will be allocated among various asset classes and Underlying Funds, including ETFs, with target allocations over time of approximately 80% equity investments and 20% fixed income investments. Underlying Funds in which the Fund invests may include Affiliated Underlying Funds. Generally, Madison will not invest more than 75% of Fund’s net assets, at the time of purchase, in Affiliated Underlying Funds.

The Ultra Series Aggressive Allocation Fund (Class I) returned (6.16)% over the 12-month period, modestly outperforming the Aggressive Allocation Fund Custom Index return of (6.23)%. The Fund outperformed the Morningstar Aggressive Allocation Category peer group, which returned (7.01)%.
After a long absence, volatility reestablished itself with authority over the past 12 months. Markets entered 2018 revved up on fresh U.S. fiscal stimulus provided by sweeping tax law changes and a broad-based synchronized global economic expansion. However, after making a parabolic 12% advance between mid-November 2017 and late January 2018, the S&P 500® experienced an abrupt 10% nosedive over two-weeks. Rising U.S. interest rates and the concern of an even more restrictive Federal Reserve rate hike campaign appeared to be behind the newfound market concerns.
By spring it was clear that economic growth in both Europe and China was slowing and failing to meet expectations, while talk of tariffs and a potential trade war sparked even greater worries on the global stage. The U.S. equity market was able to recover throughout the summer on the back of impressive earnings growth, assisted by the corporate tax cut. International markets, however, continued to decline. Emerging markets were hit especially hard by the combination of a slowing China, stronger U.S. Dollar and a general tightening in financial conditions. In late September, turbulence returned as the markets took the turn of the season to fall quite literally, shaken by a resolute Fed amid signs of slowing U.S. economic data. An historic December decline took the S&P 500 Index from a sizable 11.2% advance at its September peak to a 4.4% loss for the calendar year.
Ultra Series Fund | Management’s Discussion of Fund Performance (unaudited) - continued | December 31, 2018
Outside of the U.S., foreign equities were strongly negative as international stocks (MSCI ACWI ex-USA Index®) dropped 14.2% and emerging markets (MSCI EM Index) fell 14.6%. Bonds (Bloomberg Barclays U.S. Aggregate Bond Index), hurt by rising interest rates for the bulk of the year, made a fourth quarter charge to finish flat for 2018.
The Fund held up extremely well during the two larger equity declines, buffered by an underweight allocation to equities and an elevated cash position. Within U.S. equities, overweight allocations to growth stocks boosted returns, as did outperformance from our two core actively managed large cap funds. Timely allocations into consumer staples and health care were also additive. Detracting from returns were our overweight allocations to midcaps, Energy stocks and Commodities. Unfortunately, our equity composition was leaning a little too heavily on the international side early on, which detracted from returns. However, we quickly reallocated back toward the U.S. as our concerns grew over the potential for trade disruption. We also increased the use of dollar hedging, which aided performance as the dollar strengthened during the year. On the fixed income side, the Fund was rewarded for taking lower interest rate (duration) risk throughout the year as interest rates increased. The largest positive contributions came from our short-term holdings in corporate bonds and Treasuries. Below benchmark performance from our core actively managed holding and our long-term Treasury position provided the largest drag on the Fund’s return.
We are paying close attention to how the U.S. and global economies respond to less accommodative monetary conditions. From an historical perspective, U.S. interest rates are still very low. The notion that the U.S. could readily withstand still higher rates has been the prevailing view of most economists. We’ve long thought otherwise. Due to elevated, if not record, global debt levels, our view remains that interest rate sensitivity is very high. In other words, small increases in interest rates are now disproportionately impactful in slowing economic growth. If true, it could mean that the Fed is already overly restrictive and has possibly made a policy error in raising rates to current levels. Until remedied, this would be a hostile environment for risk assets. We believe recent economic weakness – housing and autos – is potentially corroborating this view. We stand ready to increase our level of defense if the backdrop deteriorates and believe that the Fund is well positioned for today’s increasingly volatile capital markets.
| |
| Average Annual Total Return (%) through December 31, 20181,2 |
| | | | | | | | | | Since |
| | | | | | | | | | 5/1/09 |
| | 1 Year | | 3 Years | | 5 Years | | 10 Years | | Inception |
| |
| Ultra Series Aggressive Allocation, Class I | -6.16 | | 6.58 | | 5.17 | | 9.61 | | NA |
| |
| Ultra Series Aggressive Allocation, Class II | -6.39 | | 6.32 | | 4.90 | | NA | | 9.45 |
| |
| S&P 500® Index | -4.38 | | 9.26 | | 8.49 | | 13.12 | | 13.83 |
| |
| Aggressive Allocation Fund Custom Index | -6.23 | | 6.64 | | 5.21 | | 9.83 | | 10.16 |
| |
| See accompanying Notes to Management’s Discussion of Fund Performance. |
| |
| PORTFOLIO ALLOCATION AS A PERCENTAGE OF NET ASSETS AS OF 12/31/18 | | | |
| |
| Alternative Funds | | 3.4 | % |
| Bond Funds | | 19.7 | % |
| Collateral for Securities on Loan | | 2.8 | % |
| Foreign Stock Funds | | 24.9 | % |
| Short-Term Investments | | 1.8 | % |
| Stock Funds | | 49.2 | % |
| Net Other Assets and Liabilities | | (1.8) | % |
| CORE BOND FUND |
|
| INVESTMENT STRATEGY HIGHLIGHTS |
Under normal circumstances, the Ultra Series Core Bond Fund invests at least 80% of its net assets in bonds. To keep current income relatively stable and to limit share price volatility, the Fund emphasizes investment grade securities and maintains an intermediate (typically 3-7 year) average portfolio duration, with the goal of being between 85-115% of the market benchmark duration. The Fund also strives to add incremental return in the portfolio by making strategic decisions relating to credit risk, sector exposure and yield curve positioning. The Fund may invest in corporate debt securities, U.S. Government debt securities, foreign government debt securities, non-rated debt securities, and asset-backed, mortgage-backed and commercial mortgage-backed securities.
Ultra Series Fund | Management’s Discussion of Fund Performance (unaudited) - continued | December 31, 2018
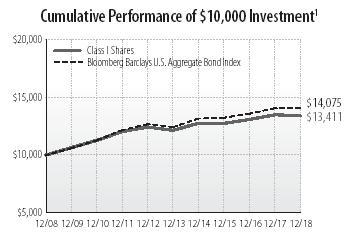
The Ultra Series Core Bond Fund (Class I) returned (0.62)% over the 12-month period, underperforming the Fund’s benchmark, the Bloomberg Barclays U.S. Aggregate Bond® Index, which returned 0.01%. The Morningstar Intermediate-Term Bond peer group returned (0.58)% for the period.
Performance in 2017 was strong and the economy was on solid footing and trending higher, leading to optimistic investor sentiment as 2018 began. For much of 2018, risk assets moved higher as the economy grew at a solid rate. However, as investors entered the fourth quarter, risk appetite quickly diminished. Plunging oil prices, the fourth increase in the Federal Funds Rate (FFR) for 2018, a shrinking Federal Reserve (Fed) balance sheet and a continuing trade war all weighed on investor sentiment and cracks began to surface in risk assets. Equity markets turned south first and had one of the worst quarters in a number of years with the S&P 500® returning (13.52)% during the fourth quarter. Equity market weakness and investor worries pushed investment grade credit returns versus Treasuries into negative territory for the year.
2018 was a rough year for risk assets. Equities and both investment grade and high yield credit all had negative returns for the first time since 2015. The Bloomberg Barclay’s U.S. Credit Index® had a total return of (2.11)% and an excess return of (2.11)% versus Treasuries. There was no place to hide on a sector level as Industrials, Utilities and Financials all had negative excess returns. However, there were significant differences in the performance of credit by maturity. Shorter maturity credit significantly outperformed longer credit, both on a total return and excess return versus Treasuries. The Bloomberg Barclay’s 1-3 year U.S. Credit® Index had a total return of 1.64% and an excess return of (0.01)%. This compared favorably to longer credit as the Bloomberg Barclay’s Long U.S. Credit® Index had a total return of (6.76)% and an excess return of (6.06)%. One of the largest drivers of the underperformance was due to the flattening Treasury curve and the additional credit spread needed to offset this flattening.
The high yield sector fared no better with the Bloomberg Barclay’s U.S. Corporate High Yield® Index returning (2.08)% in 2018. High yield held up well for most of the year, but in the fourth quarter equity weakness and increased overall volatility pushed bonds lower. Lower quality triple-C rated bonds significantly underperformed double-B rated bonds as access to the capital markets greatly diminished for highly leveraged firms. Liquidity has become so poor for many firms that there wasn’t a single index eligible high yield bond issued in December. This was the first time since December 2008 that this occurred.
There were also significant money outflows within the investment grade and high yield bond markets during the second half of 2018. According to a Wells Fargo report (Credit Flows: Supply & Demand for the Week of December 20-December 26), money market funds had the largest positive flow for 2018 with leveraged loans, high yield and equities having the largest outflows. The likelihood that foreign investors will pick-up the slack is low given high hedging costs and the large disparity in funding rates from multiple FFR hikes.
Elevated Interest Rate Volatility
Volatility was not isolated to the equity and credit markets. Interest rates swung wildly during the year as market participants attempted to price various paths for the FFR. The Fed increased the FFR four times in 2018 to an effective rate of roughly 2.40% by December. These actions by the Fed put significant pressure on shorter maturities and thus flattened the yield curve. The two-year Treasury yield had increased at one point by over 100 basis points (bps) to 2.97% after starting the year at 1.89%. However, by year-end, the two-year Treasury had fallen to 2.48% after the market began to price in a slowing economy in 2019 and 2020.
Longer Treasuries also rose but not to the same extent as shorter maturities. Ten-year Treasury yields rose 29 bps to 2.69%, and thirty-year Treasuries rose 28 bps to 3.02%. Longer-maturity rates were significantly higher during the fourth-quarter versus year-end levels but as risk off sentiment entered the market, rates fell significantly off the highs.
Ultra Series Fund | Management’s Discussion of Fund Performance (unaudited) - continued | December 31, 2018
Positioning
As we look to 2019, the Fund is currently at 95% duration versus its benchmark, which is the longest relative duration in the last five years. The credit allocation will continue to be scrutinized and opportunities to sell credit and swap into securitized products will be explored. The Fund continues to look for opportunities to move the duration towards neutral versus the benchmark while owning a higher credit quality portfolio versus many of its peers.
| |
| Average Annual Total Return (%) through December 31, 20181 |
| | | | | | | | | | | Since |
| | | | | | | | | | | 5/1/09 |
| | | 1 Year | | 3 Years | | 5 Years | | 10 Years | | Inception |
| |
| Ultra Series Core Bond, Class I | | -0.62 | | 1.70 | | 2.00 | | 2.98 | | NA |
| |
| Ultra Series Core Bond, Class II | | -0.87 | | 1.45 | | 1.74 | | NA | | 2.75 |
| |
| Bloomberg Barclays U.S. Aggregate Bond Index | | 0.01 | | 2.06 | | 2.52 | | 3.48 | | 3.55 |
| |
| See accompanying Notes to Management’s Discussion of Fund Performance. | | | | | | | | | | |
| |
| SECTOR ALLOCATION AS A PERCENTAGE OF NET ASSETS AS OF 12/31/18 |
| |
| Asset Backed Securities | | 4.9% |
| Collateralized Mortgage Obligations | | 2.2% |
| Commercial Mortgage-Backed Securities | | 2.4% |
| Corporate Notes and Bonds | | 35.1% |
| Long Term Municipal Bonds | | 5.0% |
| Mortgage Backed Securities | | 25.1% |
| Short-Term Investments | | 2.3% |
| U.S. Government and Agency Obligations | | 22.0% |
| Net Other Assets and Liabilities | | 1.0% |
| HIGH INCOME FUND |
|
| INVESTMENT STRATEGY HIGHLIGHTS |
The Ultra Series High Income Fund invests primarily in lower-rated, higher-yielding income bearing securities, such as “junk” bonds. Because the performance of these securities has historically been strongly influenced by economic conditions, the Fund may rotate securities selection by business sector according to the economic outlook. Under normal market conditions, the Fund invests at least 80% of its net assets in bonds rated lower than investment grade (BBB/Baa) and their unrated equivalents or other high-yielding securities.
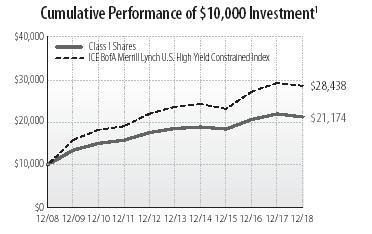
The Ultra Series High Income Fund (Class I) returned (3.20)% during the period, lagging the ICE Bank of America Merrill Lynch U.S. High Yield Constrained® Index’s (2.27)% return. The Fund also trailed its Morningstar High Yield Bond Category peer group, which returned (2.86)%.
The high yield market in 2018 experienced its worst performance since 2015 and only its second annual decline since 2008. This year’s weakness came entirely during the fourth quarter as investor’s began pricing in: 1) a 38% fourth quarter year-over-year decline in the price of crude oil; 2) the prospect for slower grow in the U.S. economy in 2019; 3) an outlook for lower corporate profit growth; 4) higher interest rates along with the potential for additional hikes; and 5) escalating trade war concerns. As a result of these issues, the average spread-over-Treasuries, or the additional yield investor’s receive from assets that carry greater risk than government bonds, ended the year at 537 basis points (bps; 1 basis point equals 0.01%), or 164 bps wider than at the end of 2017.
Within the high yield rating categories, B-rated bonds had the best relative annual total return at (1.54)%, while BB-rated bonds slightly underperformed at (2.46)%. CCC-rated bonds underperformed the most with a (4.15)% total return. The outperformance by the B category was largely driven by a 1.41% total return from shorter maturities (1-5 years), which was supported by an accommodative new issue market throughout most of the year.
On a sector level, the Fund had underexposure to Energy (6.37)%, Metals & Mining (3.31)% and Telecommunications (1.08%). The Fund underperformed in
| Ultra Series Fund | Management’s Discussion of Fund Performance (unaudited) - continued | December 31, 2018 |
its bond selection within the Services, Media and Consumer Goods sectors. Partially offsetting these negatives, the Fund had a positive contribution to performance from an underweight in the Energy and a higher cash balance. The Fund also benefited from bond selection in the Healthcare sector. As of December 31, 2018, the yield-to-worst of the Fund was 7.08% and the average rating within the Fund was B2.
For 2019, the Fund will continue to emphasize BB-rated and B-rated corporate bonds. Even with the recent spread widening, we see little on the near-term horizon to drive material price appreciation. Our targeted total return factors in a conservative fundamental view, as well as the likelihood of another interest rate hike (we view the Federal Reserve’s decisions as a wildcard to the annual performance). Therefore, we anticipate a potential decline in bond prices could offset the positive return generated by coupon income. We intend to maintain our bias towards higher quality credit and a relatively higher cash position.
| |
| Average Annual Total Return (%) through December 31, 20181 |
| | | | | | | | | | | Since |
| | | | | | | | | | | 5/1/09 |
| | | 1 Year | | 3 Years | | 5 Years | | 10 Years | | Inception |
| |
| Ultra Series High Income, Class I | | -3.20 | | 4.90 | | 2.75 | | 7.79 | | NA |
| |
| Ultra Series High Income, Class II | | -3.44 | | 4.64 | | 2.49 | | NA | | 6.34 |
| |
| ICE BofAmerica Merrill Lynch US High Yield Constrained Index | | -2.27 | | 7.27 | | 3.83 | | 11.02 | | 9.54 |
| |
| See accompanying Notes to Management’s Discussion of Fund Performance. |
| |
| SECTOR ALLOCATION AS A PERCENTAGE OF NET ASSETS AS OF 12/31/18 |
| |
| Communication Services | | 4.6% |
| Consumer Discretionary | | 20.3% |
| Consumer Staples | | 8.5% |
| Energy | | 10.7% |
| Financials | | 8.4% |
| Health Care | | 7.8% |
| Industrials | | 18.0% |
| Information Technology | | 0.5% |
| Materials | | 5.1% |
| Real Estate | | 2.7% |
| Short-Term Investments | | 12.7% |
| Utilities | | 4.3% |
| Net Other Assets and Liabilities | | (3.6)% |
| DIVERSIFIED INCOME FUND |
| |
| INVESTMENT STRATEGY HIGHLIGHTS |
The Ultra Series Diversified Income Fund seeks income by investing in a broadly diversified array of securities including bonds, common stocks, real estate securities, foreign market bonds and stocks and money market instruments. Bonds, stock and cash components will vary, reflecting the portfolio managers’ judgments of the relative availability of attractively yielding and priced stocks and bonds; however, under normal market conditions, the Fund’s portfolio managers generally attempt to target a 40% bond and 60% stock investment allocation. Nevertheless, bonds (including investment grade, high yield and mortgage- or asset-backed) may constitute up to 80% of the Fund’s assets, stocks (including common stocks, preferred stocks and convertible bonds) may constitute up to 70% of the Fund’s assets, real estate securities may constitute up to 25% of the Fund’s assets, foreign (including American Depositary Receipts (“ADRs”) and emerging market) stocks and bonds may constitute up to 25% of the Fund’s assets, and money market instruments may constitute up to 25% of the Fund’s assets. Although the Fund is permitted to invest up to 80% of its assets in lower credit quality bonds, under normal circumstances, the Fund intends to limit the investment in lower credit quality bonds to less than 50% of the Fund’s assets. The balance between the two strategies of the Fund (fixed income and equity investing) is determined after reviewing the risks associated with each type of investment, with the goal of meaningful risk reduction as market conditions demand.
| Ultra Series Fund | Management’s Discussion of Fund Performance (unaudited) - continued | December 31, 2018 |
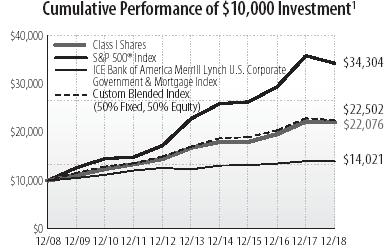
For the twelve month period, the Ultra Series Diversified Income Fund (Class I) returned (0.76)% compared to its custom blended benchmark (50% S&P 500® Index and 50% ICE Bank of America Merrill Lynch U.S. Corporate, Government and Mortgage Index) return of (1.90)%. The Fund’s Morningstar peer group, the Moderate Allocation Category, returned (5.25)% over the same period.
The equity portion of the Fund outpaced its S&P 500 Index® benchmark for the year. Sector allocation was negative and stock selection accounted for all of the outperformance versus the index. Overweight positions in Industrials and Energy detracted from results. In terms of stock selection, there were positive contributions from Health Care, Financials, Consumer Staples, Technology, Industrials and Materials, which were partially offset by weakness in Energy and Utilities. Within Health Care, Merck (MRK) was the best performing stock in the portfolio. Global pharmaceutical firm Pfizer (PFE) also performed well. Both companies have solid drug pipelines and reported better than expected earnings. In Financials, CME Group (CME) was a top performing stock. Within Technology, software firm Microsoft (MSFT) and internet routing company Cisco Systems (CSCO) were notable outperforming stocks. Each firm is benefitting from a transition to its cloud services, which appear to have better growth prospects than traditional hardware products. On the negative side, in Energy, Schlumberger (SLB) negatively impacted performance. The Fund sold SLB as we believed the thesis was unlikely to play out due to low energy prices. Within Financials, regional bank firm Wells Fargo (WFC) was the worst performing stock in the portfolio. While there were market concerns about slowing loan growth and potential margin pressure, we believe the thesis remains intact.
Within Industrials, global conglomerate 3M (MMM) and airfreight and logistics firm UPS (UPS) underperformed due to worries about slowing global growth. Despite the short-term setback, we believe each thesis is intact. Another notable underperforming stock was coffee and pet food manufacturer J.M. Smucker (SJM) in Consumer Staples. The Fund sold SJM as we believe it lacked pricing power and it participated in slow growth categories with little product differentiation. The Fund continues to hold all stocks mentioned above except for SJM and SLB.
The Fixed Income allocation of the Fund lagged its ICE BAML US Corporate, Government & Mortgage Index® benchmark over the last twelve months. Bond performance was aided by a more conservative duration posture relative to the Index and a market value overweight in credit securities which boosted portfolio yield. However, these additive positions were offset by significant credit spread widening as the year ended. The Fund benefited from owning longer Treasuries as the yield curve flattened but this impact was negated by having a lower overall duration than the benchmark as yields on longer-maturity Treasuries rallied sharply in the final months of 2018.
| |
| Average Annual Total Return (%) through December 31, 20181 |
| | | | | | | | | | Since |
| | | | | | | | | | 5/1/09 |
| | 1 Year | | 3 Years | | 5 Years | | 10 Years | | Inception |
| |
| Ultra Series Diversified Income, Class I | -0.76 | | 7.02 | | 5.62 | | 8.24 | | NA |
| |
| Ultra Series Diversified Income, Class II | -1.01 | | 6.75 | | 5.35 | | NA | | 8.65 |
| |
| S&P 500® Index | -4.38 | | 9.26 | | 8.49 | | 13.12 | | 13.83 |
| |
| ICE BofAML US Corp, Govt & Mortgage Index | 0.00 | | 2.07 | | 2.61 | | 3.44 | | 3.54 |
| |
| Custom Blended Index (50% Fixed, 50% Equity) | -1.90 | | 5.79 | | 5.70 | | 8.45 | | 8.81 |
| |
| See accompanying Notes to Management’s Discussion of Fund Performance. |
| Ultra Series Fund | Management’s Discussion of Fund Performance (unaudited) - continued | December 31, 2018 |
| |
| SECTOR ALLOCATION AS A PERCENTAGE OF NET ASSETS AS OF 12/31/18 |
| |
| Asset Backed Securities | | 1.7% |
| Collateralized Mortgage Obligations | | 1.2% |
| Commercial Mortgage-Backed Securities | | 0.7% |
| Common Stocks | | 63.9% |
| Corporate Notes and Bonds | | 11.5% |
| Long Term Municipal Bonds | | 2.3% |
| Mortgage Backed Securities | | 8.3% |
| Short-Term Investments | | 3.8% |
| U.S. Government and Agency Obligations | | 6.5% |
| Net Other Assets and Liabilities | | 0.1% |
| LARGE CAP VALUE FUND |
| |
| INVESTMENT STRATEGY HIGHLIGHTS |
The Ultra Series Large Cap Value Fund will, under normal market conditions, maintain at least 80% of its net assets in large cap stocks. The Fund follows a “value”approach, meaning the portfolio managers seek to invest in stocks at prices below their perceived intrinsic value as estimated based on fundamental analysis of the issuing company and its prospects. By investing in value stocks, the Fund attempts to limit the downside risk over time but may also produce smaller gains than other stock funds if their intrinsic values are not realized by the market or if growth-oriented investments are favored by investors. The Fund will diversify its holdings among various industries and among companies within those industries.
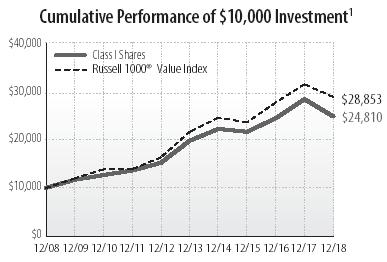
In the past twelve months, the Ultra Series Large Cap Value Fund (Class I) returned (12.59)%, which lagged the Russell 1000® Value Index return of (8.27)%. The Fund underperformed its Morningstar peer group, the Morningstar Large Value Category, which returned (9.28)% for the period.
Sector allocation was positive while stock selection was negative and accounted for all of the performance discrepancy versus the Index. For sector allocation, an overweight position in Utilities and an underweight position in Financials were additive to results. In terms of stock selection, there were positive contributions in Utilities, Health Care, Industrials and Consumer Staples, which were more than offset by negative results in Energy, Materials, Communications Services, Consumer Discretionary and Real Estate. In Utilities, NRG Energy (NRG) was the best performing stock in the portfolio, while AES Corp. (AES) was another stock that performed well in that sector. Within Technology, disk drive manufacturer Seagate Technology (STX) contributed nicely to results. It benefited from strong demand for its hard and solid-state discs that are being used in a variety of different areas within computing. The Fund sold STX after it reached a full valuation. In Health Care, Eli Lilly and Co. (LLY) was a strong performing stock, along with managed care firm Humana (HUM). It benefitted from solid enrollment growth in its Medicare Advantage health plans. On the negative side, the Fund’s Energy and Materials investments underperformed coincident with falling oil prices and slowing global growth expectations. Within Energy, Transocean Ltd. (RIG), Range Resources (RRC), Murphy Oil (MUR) and oilfield service firm Haliburton (HAL) all trailed the Index. The Fund sold HAL, RIG and RRC. Another notable underperforming stock was gold producer Newmont Mining (NEM). It was negatively impacted by falling gold prices early in the year and was sold. The Fund continues to hold AES, HUM, LLY, NRG and MUR.
The fourth quarter, and in turn the full year, was among the most difficult periods we can remember. In general, stocks with strong balance sheets performed the best and, conversely, stocks with the most debt on the balance sheet performed the worst. The Fund sold stocks that had considerable debt outstanding and has repositioned into companies with stronger balance sheets. We believe this will add value in 2019. In prior instances of challenging results, the Fund has recovered well by sticking to our process of owning stocks with rising return on invested capital. We will continue to work hard to find these stocks and improve upon the investment results realized in 2018.
| Ultra Series Fund | Management’s Discussion of Fund Performance (unaudited) - continued | December 31, 2018 |
| |
| Average Annual Total Return (%) through December 31, 20181 |
| | | | | | | | | | | | | | | | | | | Since |
| | | | | | | | | | | | | | | | | | | 5/1/09 |
| | | 1 Year | | 3 Years | | 5 Years | | 10 Years | | Inception |
| |
| Ultra Series Large Cap Value, Class I | | | -12.59 | | | | 4.71 | | | | 4.66 | | | | 9.51 | | | | NA | |
| |
| Ultra Series Large Cap Value, Class II | | | -12.81 | | | | 4.45 | | | | 4.40 | | | | NA | | | | 10.47 | |
| |
| Russell 1000® Value Index | | | -8.27 | | | | 6.95 | | | | 5.95 | | | | 11.18 | | | | 12.47 | |
| |
| See accompanying Notes to Management’s Discussion of Fund Performance. |
| |
| SECTOR ALLOCATION AS A PERCENTAGE OF NET ASSETS AS OF 12/31/18 |
| |
| Communication Services | | 11.3% |
| Consumer Staples | | 9.0% |
| Energy | | 7.5% |
| Financials | | 16.1% |
| Health Care | | 18.7% |
| Industrials | | 4.8% |
| Information Technology | | 2.4% |
| Materials | | 6.0% |
| Real Estate | | 3.6% |
| Short-Term Investments | | 5.8% |
| Utilities | | 16.4% |
| Net Other Assets and Liabilities | | (1.6)% |
| LARGE CAP GROWTH FUND |
| |
| INVESTMENT STRATEGY HIGHLIGHTS |
The Ultra Series Large Cap Growth Fund invests primarily in common stocks of larger companies and will, under normal market conditions, maintain at least 80% of its net assets in large cap stocks. The Fund invests in well-established companies with competitive advantages that have demonstrated patterns of consistent growth. To a lesser extent, the Fund may invest in the stocks of less established companies that may offer more rapid growth potential. The Fund invests when a stock trades at a good price in relation to underlying value and the Fund looks to sell or trim a stock when the portfolio manager deems a stock to be overpriced compared to underlying value.

The Ultra Series Large Cap Growth Fund (Class I) returned (0.28)% for the twelve months ended December 31, 2018, beating the Russell 1000 Growth® Index return of (1.51)%. The Fund outperformed its peer group, the Morningstar Large Growth Category, which returned (1.50)% for the same period.
For the first nine months of the year, the market continued to march steadily upward. The Russell 1000® Growth Index was up a robust 17% through September, 2018. The advance was led by strong performance from the large Technology stocks and rapidly growing companies with lofty valuation multiples (“growth stocks”). Volatility finally returned to the markets in October, as investors started to become increasingly worried about escalating trade tensions, emerging market weakness and rising interest rates. The Index fell by double-digits in the fourth quarter, giving back all of its earlier gains. Throughout 2018, we found opportunities to sell and trim holdings deemed expensive and reinvest these proceeds in stocks with more reasonable valuation levels.
The Large Cap Growth strategy also made a number of portfolio changes in early April, when portfolio management duties transitioned over to the Madison U.S. Equity Team. The new composition mirrors the holdings of the Madison Large Cap strategy. This activity led to portfolio turnover of more than 70% during the year, which is well above the range we’d typically expect. However, we believe the turnover has been productive because it related to improving the risk-reward proposition of the Fund.
For the year, the Fund enjoyed strong relative performance from its Industrials and Materials holdings, which held up far better than the benchmark constituents in these sectors. This
| Ultra Series Fund | Management’s Discussion of Fund Performance (unaudited) - continued | December 31, 2018 |
is attributable to the fact that most of the Fund’s Industrial holdings are “asset-light” or service companies rather than cyclical, heavy-industry businesses. These industrial service holdings posted strong sales and earnings performance over the past year. The Fund also enjoyed good returns from its Specialty Retail holdings. We believe that 2017’s pessimism about brick and mortar retailers led to opportunities in our retail stocks that bore fruit in 2018. The Fund’s Real Estate sector holdings also outperformed its sector for the year.
The Fund’s Energy, Health Care and Financial holdings experienced returns that were similar to the corresponding benchmark sectors such that these sectors were roughly neutral to relative performance.
Information Technology was a fairly strong sector for the S&P 500® during 2018. The Fund was underweight Information Technology, and our holdings in the sector underperformed their benchmark comparison in aggregate. We added an Information Technology consulting stock and an analog Semiconductor stock over the course of the year that we expect to contribute positively to future returns. The Fund’s Consumer Staples holdings also underperformed in 2018. This was primarily a result of disappointing volume growth from our food and beverage stocks.
Our goal is to provide superior long-term returns while assuming less risk. We continue to believe in the merit of thinking independently, investing for the long-term, and emphasizing risk management. We believe that this strategy will outperform over a full market cycle.
| |
| Average Annual Total Return (%) through December 31, 20181 |
| | | | | | | | | | | | | | | | | | | Since |
| | | | | | | | | | | | | | | | | | | 5/1/09 |
| | | 1 Year | | 3 Years | | 5 Years | | 10 Years | | Inception |
| |
| Ultra Series Large Cap Growth, Class I | | | -0.28 | | | | 8.84 | | | | 8.34 | | | | 12.72 | | | | NA | |
| |
| Ultra Series Large Cap Growth, Class II | | | -0.53 | | | | 8.57 | | | | 8.07 | | | | NA | | | | 11.89 | |
| |
| Russell 1000® Growth Index | | | -1.51 | | | | 11.15 | | | | 10.40 | | | | 15.29 | | | | 15.20 | |
| |
| See accompanying Notes to Management’s Discussion of Fund Performance. |
| |
| SECTOR ALLOCATION AS A PERCENTAGE OF NET ASSETS AS OF 12/31/18 |
| |
| Consumer Discretionary | | 23.0% |
| Financials | | 14.9% |
| Health Care | | 16.3% |
| Industrials | | 9.7% |
| Information Technology | | 21.5% |
| Materials | | 8.4% |
| Real Estate | | 4.1% |
| Short-Term Investments | | 2.0% |
| Net Other Assets and Liabilities | | 0.1% |
| MID CAP FUND |
| |
| INVESTMENT STRATEGY HIGHLIGHTS |
The Ultra Series Mid Cap Fund generally invests in common stocks of midsize companies and will, under normal market conditions, maintain at least 80% of its net assets in mid cap securities. The Fund seeks attractive long-term returns through bottom-up security selection based on fundamental analysis in a diversified portfolio of high-quality companies with attractive valuations. These will typically be industry leading companies in niches with strong growth prospects. The Fund’s portfolio managers believe in selecting stocks for the Fund that show steady, sustainable growth and reasonable valuations. As a result, stocks of issuers that are believed to have a blend of both value and growth potential will be selected for investment.

The Ultra Series Mid Cap Fund (Class I) returned (1.50)% for the annual period, sharply outperforming its benchmark Russell Midcap® Index’s (9.06)% return. The Fund outperformed its peer group, the Morningstar Mid-Cap Growth category, which returned (4.04)%.
Ultra Series Fund | Management’s Discussion of Fund Performance (unaudited) - continued | December 31, 2018
Strong stock selection was the primary driver of outperformance during the past 12 months. We construct our portfolio using a bottom-up process, and make no attempt to target sector allocations relative to any index except to diversify adequately for prudent risk management.
That being said, the Mid Cap Fund was underweight in the three strongest sectors of the benchmark – Communication Services, Utilities and Information Technology. We were also hurt by an overweighting in Materials, which was one of the worst performing sectors. Excellent relative performance from our holdings in Consumer Discretionary, Industrials and Financials more than offset these allocation headwinds. Our top individual contributors were O’Reilly Automotive, Copart, CDW, TJX Companies and Zoetis. Our largest detractors were Liberty Global, Axalta Coating Systems, Mohawk Industries, Liberty Broadband and Crown Holdings.
O’Reilly Automotive owns and operates auto parts stores. O’Reilly has recently seen same stores sales growth accelerate to mid-single digit rates, which is in-line with historical averages. The stock price has closely followed this improvement in sales. Copart is an auctioneer of salvaged cars. Copart delivered another year of healthy unit volume growth. The robust performance was driven by strength in both core domestic salvage operations and non-salvage operations. CDW is a value-added distributor selling hardware, software and services from thousands of vendors. The company is benefitting from secular growth in Information Technology spending. TJX Companies operates several off-price retail concepts across the globe. Off-price retail has consistently taken share from department stores and specialty apparel stores due to its affordable, exciting and ever-changing assortment of merchandise. Zoetis, the largest global manufacturer of drugs and vaccines for animals, continues to benefit from new product launches and the robust demand for pet medications. Management’s focus on controlling costs has also lead to significant improvements in Zoetis’ profitability over the past several years.
Liberty Global, an international telecom provider, had a tough year due to lackluster subscriber numbers and concerns that regulators will hold up a deal to sell their German and Eastern European assets to Vodafone. Results in the UK have been disappointing and the outcome of the Vodafone transaction is difficult to handicap, but we still think the strategic value of Liberty Global’s assets provides a talented management team with opportunities to unlock shareholder value through asset swaps, asset sales or an outright sale of the company. The recent spike in oil prices has weighed on margins at Mohawk and Axalta. Both of these businesses rely heavily on petroleum-derived inputs in their manufacturing processes. This raw material inflation is largely a cyclical phenomenon. We believe Mohawk and Axalta will eventually improve profitability through price increases and productivity initiatives. Crown Holdings, a global can maker, surprised investors last December when they decided to lever up and acquire a transit packaging company. This news was disappointing, but valuation is now extremely cheap, the integration has gone well and the core business is growing nicely.
| |
| Average Annual Total Return (%) through December 31, 20181 |
| | | | | | | | | | | Since |
| | | | | | | | | | | 5/1/09 |
| | | 1 Year | | 3 Years | | 5 Years | | 10 Years | | Inception |
| |
| Ultra Series Mid Cap, Class I | | -1.50 | | 8.75 | | 7.38 | | 14.77 | | NA |
| |
| Ultra Series Mid Cap, Class II | | -1.75 | | 8.48 | | 7.11 | | NA | | 13.21 |
| |
| Russell Midcap® Index | | -9.06 | | 7.04 | | 6.26 | | 14.03 | | 13.95 |
| |
| See accompanying Notes to Management’s Discussion of Fund Performance. |
| |
| SECTOR ALLOCATION AS A PERCENTAGE OF NET ASSETS AS OF 12/31/18 | | | |
| |
| Consumer Discretionary† | | 31.5 | % |
| Consumer Staples | | 0.9 | % |
| Financials | | 23.1 | % |
| Health Care | | 6.9 | % |
| Industrials | | 13.7 | % |
| Information Technology | | 9.3 | % |
| Materials | | 7.5 | % |
| Real Estate | | 2.9 | % |
| Short-Term Investments | | 4.4 | % |
| Net Other Assets and Liabilities | | (0.2) | % |
| |
| †Consumer Discretionary includes securities in the following industries: Household Durables, Media, Multiline Retail and Specialty Retail. |
| INTERNATIONAL STOCK FUND |
|
| INVESTMENT STRATEGY HIGHLIGHTS |
The Ultra Series International Stock Fund will invest, under normal market conditions, at least 80% of its net assets in the stock of foreign companies. Typically, a majority of the Fund’s assets are invested in relatively large cap stocks of
Ultra Series Fund | Management’s Discussion of Fund Performance (unaudited) - continued | December 31, 2018
companies located or operating in developed countries. The Fund may also invest up to 30% of its assets in securities of companies whose principal business activities are located in emerging market countries. The portfolio managers typically maintain this segment of the Fund’s portfolio in such stocks which it believes have a low market price relative to their perceived value based on fundamental analysis of the issuing company and its prospects. The Fund may also invest in foreign debt and other income bearing securities at times when it believes that income bearing securities have greater capital appreciation potential than equity securities.
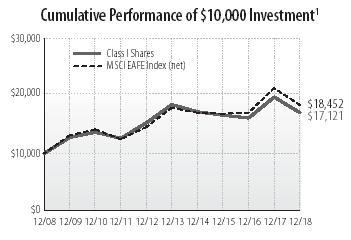
The Ultra Series International Stock Fund (Class I) returned (13.69)% for the past twelve months compared to the MSCI EAFE Index® (net) return of (13.79)%. The Fund outperformed its peer group, the Morningstar Foreign Large Blend Category, which returned (15.30)%.
Global equities declined significantly in 2018 as investor sentiment was undermined by global macroeconomic and geopolitical trends, including interest rate pressures, trade disputes and populism. Riskier assets around the world sold off, with many generating their worst calendar-year performance since the global financial crisis a decade ago. The MSCI EAFE Index® declined 12.5% in the fourth quarter and was down 13.8% in 2018. Emerging markets equities (represented by the MSCI EM Index®) fell less in the fourth quarter by declining 7.5%, but they fell dramatically earlier in the year and ended 2018 down 14.6%. U.S. equities joined the rout, plunging 13.5% in the quarter and ending the year down 4.4%. These returns are notable given the outperformance of U.S. equities over international equities over much of the past decade.
The decline of investor confidence in 2018 was most pronounced in emerging markets equities, which fell 14.6% for the year. Most of these losses occurred earlier in the year before the decline in developed markets. Some of this performance reflected the fact that emerging markets generated extraordinary returns in 2017 and that the asset class is relatively volatile. However, the downturn was also due to a significant shift in investor sentiment from the beginning of the year, when confidence was high as the major global economies appeared to be growing together and investors expected healthy earnings. Within a few months, however, U.S. economic growth, boosted by tax cuts and fiscal stimulus, appeared to diverge from the rest of the world. Relatively strong U.S. growth supported further Fed rate hikes which in turn boosted the U.S. dollar early in the year.
Stock selection in the Consumer Discretionary sector was among the largest drivers of relative returns. Don Quijote, a Japanese discount retailer that focuses on lower cost household items to drive store traffic, performed well, rising almost 20%. The company announced a favorable, significant transaction with Family Mart. This involves Don Quijote taking full control of the struggling Uny chain of stores, while Family Mart tendered for 20% of Don Quijote shares in the market. Elsewhere, stock selection in the Financial sector was additive to relative returns. Aon, the global insurance broker domiciled in the United Kingdom, helped performance during the year. This long-term holding has demonstrated the ability to generate strong free cash flow from operating leverage derived from improving organic growth and disciplined spending and capital allocation. The rising free cash flow has been used for sizable and consistent share buybacks. Also in the sector, DBS Group Holdings, Singapore’s largest bank, outperformed. Our original thesis was predicated on an increase in net interest margins and fading bad debt charges. In a year when most U.S. and European banks saw significant multiple compression, DBS outperformed with higher margins resulting from a consistent focus on increasing digitization, improving credit quality and solid loan demand. Stock selection in the Health Care sector was also beneficial to relative returns as shares of Medtronic, the Irish-domiciled global leader in medical devices, positively impacted
Ultra Series Fund | Management’s Discussion of Fund Performance (unaudited) - continued | December 31, 2018
performance. Our thesis of improving revenue growth from new product launches, coupled with margin expansion from an increased focus on costs, continued to play out. Lastly, stock selection in the United Kingdom helped relative returns.
In contrast, stock selection in the Consumer Staples sector detracted from relative returns. British American Tobacco declined as the sensitivities around the potential ban of menthol in the U.S. combustibles market made the potential for significant earnings per share (EPS) contraction more of a reality. For several quarters, we had thought the growth algorithm in the combustible business (modest volume declines more than offset by price increases) remained generally intact despite a short-term volume setback early in the year, and the stock represented good relative value. However, due to the fact that management had more recently appeared less confident in their margin outlook, along with the potential menthol ban and high financial leverage of the business model, we deemed the thesis impaired and sold the stock. In the Energy sector, Canadian integrated oil sands and refinery company, Suncor, lagged on the back of a very weak commodity. With cash operating costs below $50 /barrel, however, we believe Suncor will continue to generate significant free cash flow. Management spent the past several years repositioning their portfolio by selling highly valued infrastructure and renewables as well as downstream assets and buying cheap, synergistic oil assets. Lastly, the portfolio’s lower-than-benchmark weights in the Utilities and Health Care sectors detracted from relative returns.
Outlook
The uncertainty and volatility global investors faced last year will likely continue in 2019. We see this, however, as a partly positive development. The fact that investors are pricing in risks leads us to be more constructive about markets going forward given that valuations have come down. We acknowledge challenges for growth, geopolitics and corporate earnings, but we also note that prior market reverses have led to more realistic pricing and, in some cases, opportunities. Over the past 20 years, when valuations have been at the current level or less expensive, the median 3-year forward return for the market has been nearly double that of the overall median market return.
We note that multiples for global equity markets compressed significantly in 2018. From this perspective, non-U.S. markets look attractive, particularly when compared to U.S. markets. EAFE offers historically cheap valuations compared to the United States, more room for margin improvement and lower expectations. We believe that many multiples are attractive and that investor expectations for 2019 earnings look achievable.
| |
| Average Annual Total Return through December 31, 20181 | | | | | | | | | | |
| | | | | | | | | | | Since |
| | | | | | | | | | | 5/1/09 |
| | | 1 Year | | 3 Years | | 5 Years | | 10 Years | | Inception |
| |
| Ultra Series International Stock, Class I | | -13.69 | | 0.89 | | -1.56 | | 5.52 | | NA |
| |
| Ultra Series International Stock, Class II | | -13.91 | | 0.63 | | -1.81 | | NA | | 5.84 |
| |
| MSCI EAFE Index (net) | | -13.79 | | 2.87 | | 0.53 | | 6.32 | | 6.86 |
| |
| See accompanying Notes to Management’s Discussion of Fund Performance. |
| |
| SECTOR ALLOCATION AS A PERCENTAGE OF NET ASSETS AS OF 12/31/18 | | | |
|
| Communication Services | | 6.5 | % |
| Consumer Discretionary | | 14.4 | % |
| Consumer Staples | | 8.1 | % |
| Energy | | 6.5 | % |
| Financials | | 19.3 | % |
| Health Care | | 7.7 | % |
| Industrials | | 15.9 | % |
| Information Technology | | 6.6 | % |
| Materials | | 5.5 | % |
| Real Estate | | 2.7 | % |
| Short-Term Investments | | 5.7 | % |
| Utilities | | 1.8 | % |
| Net Other Assets and Liabilities | | (0.7) | % |
Ultra Series Fund | Management’s Discussion of Fund Performance (unaudited) - continued | December 31, 2018
| |
| GEOGRAPHICAL ALLOCATION AS A PERCENTAGE OF NET ASSETS AS OF 12/31/18 | | | |
|
| United Kingdom | | 17.9 | % |
| Japan | | 12.9 | % |
| France | | 11.2 | % |
| Switzerland | | 7.4 | % |
| Netherlands | | 6.9 | % |
| Canada | | 6.1 | % |
| United States | | 5.7 | % |
| Germany | | 5.5 | % |
| Ireland | | 4.2 | % |
| Sweden | | 3.4 | % |
| Norway | | 3.1 | % |
| Finland | | 2.9 | % |
| Singapore | | 2.7 | % |
| Australia | | 2.0 | % |
| Belgium | | 1.8 | % |
| Spain | | 1.8 | % |
| Denmark | | 1.4 | % |
| India | | 1.4 | % |
| Hong Kong | | 0.9 | % |
| Israel | | 0.8 | % |
| South Korea | | 0.7 | % |
| Net Other Assets and Liabilities | | (0.7) | % |
| MADISON TARGET RETIREMENT 2020 FUND |
|
| INVESTMENT STRATEGY HIGHLIGHTS |
The Ultra Series Madison Target Retirement 2020 Fund invests primarily in shares of registered investment companies according to an asset allocation strategy developed by the Fund’s investment adviser for investors planning to retire in or within a few years of 2020. Over time, the Fund’s asset allocation will gradually shift until it reaches the more conservative allocation target of approximately 10-30% in stock funds and 70-90% in bond funds. The asset allocation strategy is designed to reduce the volatility of investment returns in the later years while still providing the potential for higher total returns over the target period.

The Ultra Series Target Retirement 2020 Fund (Class I) returned (2.11)% in the 12-month period, outperforming the S&P Target Date® To 2020 Index, which returned (3.22)%, and the Morningstar Target Date 2020 Category peer group which returned (4.54)%.
After a long absence, volatility reestablished itself with authority over the past 12 months. Markets entered 2018 revved up on fresh U.S. fiscal stimulus provided by sweeping tax law changes and a broad-based synchronized global economic expansion. However, after making a parabolic 12% advance between mid-November 2017 and late January 2018, the S&P 500® experienced an abrupt 10% nosedive over two-weeks. Rising U.S. interest rates and the concern of an even more restrictive Federal Reserve rate hike campaign appeared to be behind the newfound market concerns.
By spring it was clear that economic growth in both Europe and China was slowing and failing to meet expectations, while talk of tariffs and a potential trade war sparked even greater worries on the global stage. The U.S. equity market was able to recover throughout the summer on the back of impressive earnings growth, assisted by the corporate tax cut. International markets, however, continued to decline. Emerging markets were hit especially hard by the combination of a slowing China, stronger U.S. Dollar and a general tightening in financial conditions. In late September, turbulence returned as the markets took the turn of the season to fall quite literally, shaken by a resolute Fed amid signs of slowing U.S. economic data. An historic December decline took the S&P 500 Index from a sizable 11.2% advance at its September peak to a 4.4% loss for the calendar year.
Ultra Series Fund | Management’s Discussion of Fund Performance (unaudited) - continued | December 31, 2018
Outside of the U.S., foreign equities were strongly negative as international stocks (MSCI ACWI ex-USA Index®) dropped 14.2% and emerging markets (MSCI EM Index®) fell 14.6%. Bonds (Bloomberg Barclays U.S. Aggregate Bond Index®), hurt by rising interest rates for the bulk of the year, made a fourth quarter charge to finish flat for 2018.
The Fund held up extremely well during the two larger equity declines, buffered by an underweight allocation to equities and an elevated cash position. Within U.S. equities, overweight allocations to large caps and Technology stocks boosted returns. Detracting from performance were our overweight allocations to the Financial sector, Energy stocks and Commodities. Outside the U.S., the largest positive impact came from our two minimum volatility ETF holdings, which declined by less than half of the MSCI ACWI ex-US Index. We also increased our use of dollar hedging, which aided performance as the dollar strengthened during the year. On the fixed income side, the Fund was rewarded for taking lower interest rate (duration) risk throughout the year as interest rates increased. The largest positive contributions came from our intermediate-term Treasury and short-term corporate bond holdings. Positions in TIPS (Treasury Inflation Protected Securities), which were negatively impacted by the steep decline in inflation break-evens late in the year, and longer-term Treasuries were the largest performance detractors.
We are paying close attention to how the U.S. and global economies respond to less accommodative monetary conditions. From an historical perspective, U.S. interest rates are still very low. The notion that the U.S. could readily withstand still higher rates has been the prevailing view of most economists. We’ve long thought otherwise. Due to elevated, if not record, global debt levels, our view remains that interest rate sensitivity is very high. In other words, small increases in interest rates are now disproportionately impactful in slowing economic growth. If true, it could mean that the Fed is already overly restrictive and has possibly made a policy error in raising rates to current levels. Until remedied, this would be a hostile environment for risk assets. We believe recent economic weakness – housing and autos – is potentially corroborating this view. We stand ready to increase our level of defense if the backdrop deteriorates and believe that the Fund is well positioned for today’s increasingly volatile capital markets.
| |
| Average Annual Total Return (%) through December 31, 20181,3 |
| | | 1 Year | | 3 Years | | 5 Years | | 10 Years |
| |
| Ultra Series Madison Target Retirement 2020 | | -2.11 | | 3.87 | | 3.65 | | 7.68 |
| |
| S&P Target Date® To 2020 Index | | -3.22 | | 4.65 | | 3.72 | | 7.01 |
| |
| See accompanying Notes to Management’s Discussion of Fund Performance. |
| |
| PORTFOLIO ALLOCATION AS A PERCENTAGE OF NET ASSETS AS OF 12/31/18 | | | |
|
| Alternative Funds | | 2.0 | % |
| Bond Funds | | 72.7 | % |
| Foreign Stock Funds | | 6.5 | % |
| Stock Funds | | 15.0 | % |
| Net Other Assets and Liabilities | | 3.8 | % |
| MADISON TARGET RETIREMENT 2030 FUND |
|
| INVESTMENT STRATEGY HIGHLIGHTS |
The Ultra Series Madison Target Retirement 2030 Fund invests primarily in shares of registered investment companies according to an asset allocation strategy developed by the Fund’s investment adviser for investors planning to retire in or within a few years of 2030. Over time, the Fund’s asset allocation will gradually shift until it reaches the more conservative allocation target of approximately 10-30% in stock funds and 70-90% in bond funds. The asset allocation strategy is designed to reduce the volatility of investment returns in the later years while still providing the potential for higher total returns over the target period.

Ultra Series Fund | Management’s Discussion of Fund Performance (unaudited) - continued | December 31, 2018
The Ultra Series Target Retirement 2030 Fund (Class I) returned (4.04)% in the 12-month period, outperforming the S&P Target Date® To 2030 Index, which returned (5.30)%, and the Morningstar Target Date 2030 Category peer group, which returned (6.44)%.
After a long absence, volatility reestablished itself with authority over the past 12 months. Markets entered 2018 revved up on fresh U.S. fiscal stimulus provided by sweeping tax law changes and a broad-based synchronized global economic expansion. However, after making a parabolic 12% advance between mid-November 2017 and late January 2018, the S&P 500® experienced an abrupt 10% nosedive over two-weeks. Rising U.S. interest rates and the concern of an even more restrictive Federal Reserve rate hike campaign appeared to be behind the newfound market concerns.
By spring it was clear that economic growth in both Europe and China was slowing and failing to meet expectations, while talk of tariffs and a potential trade war sparked even greater worries on the global stage. The U.S. equity market was able to recover throughout the summer on the back of impressive earnings growth, assisted by the corporate tax cut. International markets, however, continued to decline. Emerging markets were hit especially hard by the combination of a slowing China, stronger U.S. Dollar and a general tightening in financial conditions. In late September, turbulence returned as the markets took the turn of the season to fall quite literally, shaken by a resolute Fed amid signs of slowing U.S. economic data. An historic December decline took the S&P 500 Index from a sizable 11.2% advance at its September peak to a 4.4% loss for the calendar year.
Outside of the U.S., foreign equities were strongly negative as international stocks (MSCI ACWI ex-USA Index®) dropped 14.2% and emerging markets (MSCI EM Index®) fell 14.6%. Bonds (Bloomberg Barclays U.S. Aggregate Bond Index®), hurt by rising interest rates for the bulk of the year, made a fourth quarter charge to finish flat for 2018.
The Fund held up extremely well during the two larger equity declines, buffered by an underweight allocation to equities and an elevated cash position. Within U.S. equities, overweight allocations to large caps and Technology stocks boosted returns. Detracting from performance were our overweight allocations to the Financial sector, Energy stocks and Commodities. Outside the U.S., the largest positive impact came from our two minimum volatility ETF holdings, which declined by less than half of the MSCI ACWI ex-US Index. We also increased our use of dollar hedging, which aided performance as the dollar strengthened during the year. On the fixed income side, the Fund was rewarded for taking lower interest rate (duration) risk throughout the year as interest rates increased. The largest positive contributions came from our intermediate-term Treasury and short-term corporate bond holdings. Positions in TIPS (Treasury Inflation Protected Securities), which were negatively impacted by the steep decline in inflation break-evens late in the year, and longer-term Treasuries were the largest performance detractors.
We are paying close attention to how the U.S. and global economies respond to less accommodative monetary conditions. From an historical perspective, U.S. interest rates are still very low. The notion that the U.S. could readily withstand still higher rates has been the prevailing view of most economists. We’ve long thought otherwise. Due to elevated, if not record, global debt levels, our view remains that interest rate sensitivity is very high. In other words, small increases in interest rates are now disproportionately impactful in slowing economic growth. If true, it could mean that the Fed is already overly restrictive and has possibly made a policy error in raising rates to current levels. Until remedied, this would be a hostile environment for risk assets. We believe recent economic weakness – housing and autos – is potentially corroborating this view. We stand ready to increase our level of defense if the backdrop deteriorates and believe that the Fund is well positioned for today’s increasingly volatile capital markets.
| |
| Average Annual Total Return (%) through December 31, 20181,3 | | | | | | | | |
| | | 1 Year | | 3 Years | | 5 Years | | 10 Years |
| |
| Ultra Series Madison Target Retirement 2030 | | -4.04 | | 5.25 | | 4.55 | | 8.90 |
| |
| S&P Target Date® To 2030 Index | | -5.30 | | 5.40 | | 4.16 | | 8.26 |
| |
| See accompanying Notes to Management’s Discussion of Fund Performance. |
Ultra Series Fund | Management’s Discussion of Fund Performance (unaudited) - continued | December 31, 2018
| |
| PORTFOLIO ALLOCATION AS A PERCENTAGE OF NET ASSETS AS OF 12/31/18 | | | |
|
| Alternative Funds | | 3.0 | % |
| Bond Funds | | 42.9 | % |
| Foreign Stock Funds | | 11.9 | % |
| Stock Funds | | 37.9 | % |
| Net Other Assets and Liabilities | | 4.3 | % |
| MADISON TARGET RETIREMENT 2040 FUND |
|
| INVESTMENT STRATEGY HIGHLIGHTS |
The Ultra Series Madison Target Retirement 2040 Fund invests primarily in shares of registered investment companies according to an asset allocation strategy developed by the Fund’s investment adviser for investors planning to retire in or within a few years of 2040. Over time, the Fund’s asset allocation will gradually shift until it reaches the more conservative allocation target of approximately 10-30% in stock funds and 70-90% in bond funds. The asset allocation strategy is designed to reduce the volatility of investment returns in the later years while still providing the potential for higher total returns over the target period.
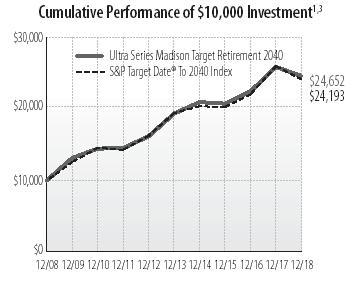
The Ultra Series Target Retirement 2040 Fund (Class I) returned (4.88)% in the 12-month period, outperforming the S&P Target Date® To 2040 Index, which returned (6.95)%, and the Morningstar Target Date 2040 Category peer group, which returned (7.54)%.
After a long absence, volatility reestablished itself with authority over the past 12 months. Markets entered 2018 revved up on fresh U.S. fiscal stimulus provided by sweeping tax law changes and a broad-based synchronized global economic expansion. However, after making a parabolic 12% advance between mid-November 2017 and late January 2018, the S&P 500® experienced an abrupt 10% nosedive over two-weeks. Rising U.S. interest rates and the concern of an even more restrictive Federal Reserve rate hike campaign appeared to be behind the newfound market concerns.
By spring it was clear that economic growth in both Europe and China was slowing and failing to meet expectations, while talk of tariffs and a potential trade war sparked even greater worries on the global stage. The U.S. equity market was able to recover throughout the summer on the back of impressive earnings growth, assisted by the corporate tax cut. International markets, however, continued to decline. Emerging markets were hit especially hard by the combination of a slowing China, stronger U.S. Dollar and a general tightening in financial conditions. In late September, turbulence returned as the markets took the turn of the season to fall quite literally, shaken by a resolute Fed amid signs of slowing U.S. economic data. An historic December decline took the S&P 500 Index from a sizable 11.2% advance at its September peak to a 4.4% loss for the calendar year.
Outside of the U.S., foreign equities were strongly negative as international stocks (MSCI ACWI ex-USA Index®) dropped 14.2% and emerging markets (MSCI EM Index®) fell 14.6%. Bonds (Bloomberg Barclays U.S. Aggregate Bond Index®), hurt by rising interest rates for the bulk of the year, made a fourth quarter charge to finish flat for 2018.
The Fund held up extremely well during the two larger equity declines, buffered by an underweight allocation to equities and an elevated cash position. Within U.S. equities, overweight allocations to large caps and Technology stocks boosted returns. Detracting from performance were our overweight allocations to the Financial sector, Energy stocks and Commodities. Outside the U.S., the largest positive impact came from our two minimum volatility ETF holdings, which declined by less than half of the MSCI ACWI ex-US Index. We also increased our use of dollar hedging, which aided performance as the dollar strengthened during the year. On the fixed income side, the Fund was rewarded for taking lower interest rate (duration) risk throughout the year as interest rates increased. The largest positive contributions
Ultra Series Fund | Management’s Discussion of Fund Performance (unaudited) - continued | December 31, 2018
came from our intermediate-term Treasury and short-term corporate bond holdings. Positions in TIPS (Treasury Inflation Protected Securities), which were negatively impacted by the steep decline in inflation break-evens late in the year, and longer-term Treasuries were the largest performance detractors.
We are paying close attention to how the U.S. and global economies respond to less accommodative monetary conditions. From an historical perspective, U.S. interest rates are still very low. The notion that the U.S. could readily withstand still higher rates has been the prevailing view of most economists. We’ve long thought otherwise. Due to elevated, if not record, global debt levels, our view remains that interest rate sensitivity is very high. In other words, small increases in interest rates are now disproportionately impactful in slowing economic growth. If true, it could mean that the Fed is already overly restrictive and has possibly made a policy error in raising rates to current levels. Until remedied, this would be a hostile environment for risk assets. We believe recent economic weakness – housing and autos – is potentially corroborating this view. We stand ready to increase our level of defense if the backdrop deteriorates and believe that the Fund is well positioned for today’s increasingly volatile capital markets.
| |
| Average Annual Total Return (%) through December 31, 20181,3 |
| | | 1 Year | | 3 Years | | 5 Years | | 10 Years |
| |
| Ultra Series Madison Target Retirement 2040 | | -4.88 | | 5.86 | | 4.92 | | 9.44 |
| |
| S&P Target Date® To 2040 Index | | -6.95 | | 6.01 | | 4.46 | | 9.24 |
| |
| See accompanying Notes to Management’s Discussion of Fund Performance. | | | | | | | | |
| |
| PORTFOLIO ALLOCATION AS A PERCENTAGE OF NET ASSETS AS OF 12/31/18 | | | |
|
| Alternative Funds | | 3.5 | % |
| Bond Funds | | 33.0 | % |
| Foreign Stock Funds | | 17.8 | % |
| Stock Funds | | 41.4 | % |
| Net Other Assets and Liabilities | | 4.3 | % |
| MADISON TARGET RETIREMENT 2050 FUND |
|
| INVESTMENT STRATEGY HIGHLIGHTS |
The Ultra Series Madison Target Retirement 2050 Fund invests primarily in shares of registered investment companies according to an asset allocation strategy developed by the Fund’s investment adviser for investors planning to retire in or within a few years of 2050. Over time, the Fund’s asset allocation will gradually shift until it reaches the more conservative allocation target of approximately 10-30% in stock funds and 70-90% in bond funds. The asset allocation strategy is designed to reduce the volatility of investment returns in the later years while still providing the potential for higher total returns over the target period.
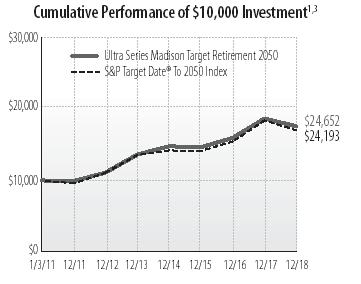
The Ultra Series Target Retirement 2050 Fund (Class I) returned (5.85)% in the 12-month period, outperforming the S&P Target Date® To 2050 Index, which returned (7.54)%, and the Morningstar Target Date 2050 Category peer group, which returned (8.38)%.
After a long absence, volatility reestablished itself with authority over the past 12 months. Markets entered 2018 revved up on fresh U.S. fiscal stimulus provided by sweeping tax law changes and a broad-based synchronized global economic expansion. However, after making a parabolic 12% advance between mid-November 2017 and late January 2018, the S&P 500® experienced an abrupt 10% nosedive over two-weeks. Rising U.S. interest rates and the concern of an even more restrictive Federal Reserve rate hike campaign appeared to be behind the newfound market concerns.
By spring it was clear that economic growth in both Europe and China was slowing and failing to meet expectations, while talk of tariffs and a potential trade war sparked even greater worries on the global stage. The U.S. equity market was able to recover throughout the summer on the back of impressive earnings growth, assisted by the corporate
Ultra Series Fund | Management’s Discussion of Fund Performance (unaudited) - continued | December 31, 2018
tax cut. International markets, however, continued to decline. Emerging markets were hit especially hard by the combination of a slowing China, stronger U.S. Dollar and a general tightening in financial conditions. In late September, turbulence returned as the markets took the turn of the season to fall quite literally, shaken by a resolute Fed amid signs of slowing U.S. economic data. An historic December decline took the S&P 500 Index from a sizable 11.2% advance at its September peak to a 4.4% loss for the calendar year.
Outside of the U.S., foreign equities were strongly negative as international stocks (MSCI ACWI ex-USA Index®) dropped 14.2% and emerging markets (MSCI EM Index®) fell 14.6%. Bonds (Bloomberg Barclays U.S. Aggregate Bond Index®), hurt by rising interest rates for the bulk of the year, made a fourth quarter charge to finish flat for 2018.
The Fund held up extremely well during the two larger equity declines, buffered by an underweight allocation to equities and an elevated cash position. Within U.S. equities, overweight allocations to large caps and Technology stocks boosted returns. Detracting from performance were our overweight allocations to the Financial sector, Energy stocks and Commodities. Outside the U.S., the largest positive impact came from our two minimum volatility ETF holdings, which declined by less than half of the MSCI ACWI ex-US Index. We also increased our use of dollar hedging, which aided performance as the dollar strengthened during the year. On the fixed income side, the Fund was rewarded for taking lower interest rate (duration) risk throughout the year as interest rates increased. The largest positive contributions came from our intermediate-term Treasury and short-term corporate bond holdings. Positions in TIPS (Treasury Inflation Protected Securities), which were negatively impacted by the steep decline in inflation break-evens late in the year, and longer-term Treasuries were the largest performance detractors.
We are paying close attention to how the U.S. and global economies respond to less accommodative monetary conditions. From an historical perspective, U.S. interest rates are still very low. The notion that the U.S. could readily withstand still higher rates has been the prevailing view of most economists. We’ve long thought otherwise. Due to elevated, if not record, global debt levels, our view remains that interest rate sensitivity is very high. In other words, small increases in interest rates are now disproportionately impactful in slowing economic growth. If true, it could mean that the Fed is already overly restrictive and has possibly made a policy error in raising rates to current levels. Until remedied, this would be a hostile environment for risk assets. We believe recent economic weakness – housing and autos – is potentially corroborating this view. We stand ready to increase our level of defense if the backdrop deteriorates and believe that the Fund is well positioned for today’s increasingly volatile capital markets.
| |
| Average Annual Total Return (%) through December 31, 20181,3 | | | | | | | | |
| | | | | | | | | Since |
| | | | | | | | | 1/3/11 |
| | | 1 Year | | 3 Years | | 5 Years | | Inception |
| |
| Ultra Series Madison Target Retirement 2050 | | -5.85 | | 6.28 | | 5.23 | | 7.32 |
| |
| S&P Target Date® To 2050 Index | | -7.54 | | 6.41 | | 4.64 | | 6.88 |
| |
| See accompanying Notes to Management’s Discussion of Fund Performance. |
| |
| PORTFOLIO ALLOCATION AS A PERCENTAGE OF NET ASSETS AS OF 12/31/18 |
|
| Alternative Funds | | 4.0 | % |
| Bond Funds | | 22.9 | % |
| Foreign Stock Funds | | 20.8 | % |
| Stock Funds | | 47.8 | % |
| Net Other Assets and Liabilities | | 4.5 | % |
Ultra Series Fund | Management’s Discussion of Fund Performance (unaudited) - continued | December 31, 2018
Notes to Management’s Discussion of Fund Performance (unaudited)
| 1 | Fund returns are calculated after fund level expenses have been subtracted, but do not include any separate account fees, charges or expenses imposed by the variable annuity and variable life insurance contracts that invest in the fund, as described in the Prospectus. If these fees, charges, or expenses were included, fund returns would have been lower. Fund returns also assume that dividends and capital gains are reinvested in additional shares of the fund. Investment return and principal value will fluctuate, so an investor’s shares, when redeemed, may be worth more or less than when purchased. Further information relating to the fund’s performance is contained in the Prospectus and elsewhere in this report. The fund’s past performance is not indicative of future performance. Current performance may be lower or higher than the performance data cited. For Ultra Series Fund performance data current to the most recent month-end, please call 1-800-670-3600 or visit www.ultraseriesfund.com. Indices are unmanaged and investors cannot invest in them directly. Index returns do not reflect fees or expenses. |
| | |
| 2 | Effective July 1, 2014, Madison Asset Management, LLC (the “Investment Adviser” or “Madison”), contractually agreed to waive a portion of the management fee for the Conservative, Moderate and Aggressive Allocation Funds until at least June 30, 2015. This waiver was most recently renewed through April 30, 2020. If these waivers were not in place, returns would have been lower. |
| | |
| 3 | Effective October 1, 2009, Madison contractually agreed to waive a portion of the management fee of the Ultra Series Madison Target Retirement 2020, 2030, 2040 and 2050 Funds (USF Target Date Funds) from 0.40% to 0.20%. Effective February 17, 2011, the fee was permanently reduced to 0.20%. On September 1, 2011, shareholders of the USF Target Date Funds approved a new fee arrangement which includes an investment advisory fee of 0.25% (annualized) and a services agreement fee of 0.05% (annualized). From August 30, 2014 to August 21, 2016, each USF Target Date Fund invested substantially all of its assets in a corresponding Madison Target Retirement Fund. In order to avoid duplicate fees, from August 30 through December 31, 2014, all direct fees and expenses (0.25% management and 0.05% services) of each USF Target Date Fund were waived; and effective January 1, 2015, the USF Target Date Funds did not charge management or services fees, only the acquired Fund fees from the Madison Target Retirement Funds. Effective August 22, 2016, the Madison Target Retirement Funds were reorganized (the “Reorganization”) into the Goldman Sachs Trust II Target Date Portfolios (GS Target Date Portfolios) managed by Goldman Sachs Asset Management, L.P. and subadvised by Madison. Following the Reorganization, the USF Target Date Funds did not charge management or service fees, only the acquired fees from the GS Target Date Portfolios. If these fees had not been reduced, returns would have been lower. Effective November 20, 2018, each USF Target Date Fund achieves its investment objective by investing directly in individual securities. The direct fees and expenses will no longer be waived, however, there will be no change in the total annual operating expenses. |
© Morningstar, Inc. All Rights Reserved. The Morningstar related information contained herein: (1) is proprietary to Morningstar and/or its content providers; (2) may not be copied or distributed; and (3) is not warranted to be accurate, complete or timely. Neither Morningstar nor its content providers are responsible for any damages or losses arising from any use of this information.
Morningstar Percentile rankings note: 1st percentile is top, 99th percentile is bottom.
BENCHMARK DESCRIPTIONS
Allocation Fund Indexes*
The Conservative Allocation Fund Custom Index consists of 65% Bloomberg Barclays US Aggregate Bond Index, 24.5% Russell 3000® Index and 10.5% MSCI ACWI ex-USA Index (net). See market index descriptions below.
The Moderate Allocation Fund Custom Index consists of 40% Bloomberg Barclays US Aggregate Bond Index, 42% Russell 3000® Index and 18% MSCI ACWI ex-USA Index (net). See market index descriptions below.
The Aggressive Allocation Fund Custom Index consists of 20% Bloomberg Barclays US Aggregate Bond Index, 56% Russell 3000® Index and 24% MSCI ACWI ex-USA Index (net). See market index descriptions below.
Ultra Series Fund | Management’s Discussion of Fund Performance (unaudited) - continued | December 31, 2018
Hybrid Fund Custom Indexes*
The Custom Blended Index consists of 50% S&P 500® Index and 50% ICE Bank of America Merrill Lynch U.S. Corporate, Government & Mortgage Index. See market indexes descriptions below.
*The Custom Indexes are calculated using a monthly re-balancing frequency (i.e., rebalanced back to original constituent weight every calendar month-end).
Market Indexes
The ICE Bank of America Merrill Lynch U.S. Corporate, Government & Mortgage Index is a broad-based measure of the total rate of return performance of the U.S. investment-grade bond markets. The index is a capitalization-weighted aggregation of outstanding U.S. treasury, agency and supranational mortgage pass-through, and investment-grade corporate bonds meeting specified selection criteria.
The ICE Bank of America Merrill Lynch U.S. High Yield Constrained Index tracks the performance of below investment grade U.S. dollar denominated corporate bonds publicly issued in the U.S. domestic market, but limits any individual issuer to a maximum weighting of 2%.
The Bloomberg Barclays Intermediate Government Credit Index measures the investment grade, U.S. dollar-denominated, fixed-rate, taxable corporate and government related bond markets. It is composed of the U.S. corporate index and a non-corporate component that includes foreign agencies, sovereigns, supranationals and local authorities.
The Bloomberg Barclays U.S. Aggregate Bond Index is a broad-based flagship benchmark that measures the investment grade, U.S. dollar-denominated, fixed-rate taxable bond market. The index includes Treasuries, government-related and corporate securities, mortgage backed securities, asset backed securities and commercial mortgage-backed securities.
The Bloomberg Barclays U.S. Credit Index measures the investment grade, US dollar-denominated, fixed-rate, taxable corporate and government related bond markets. It is composed of the US Corporate Index and a non-corporate component that includes foreign agencies, sovereigns, supranationals and local authorities.
The Bloomberg Barclays U.S. Corporate High Yield® Index measures the USD-denominated, high yield, fixed-rate corporate bond markets.
The MSCI EAFE (Europe, Australasia & Far East) Index (net) is a free float-adjusted market capitalization index that is designed to measure developed market equity performance, excluding the U.S. and Canada. The MSCI EAFE Index (net) is calculated on a total return basis with dividends reinvested after the deduction of withholding taxes.
The MSCI ACWI ex USA Index (net) is a free float-adjusted market capitalization weighted index that is designed to measure the equity market performance of developed and emerging markets. The MSCI ACWI ex USA (net) is calculated on a total return basis with dividends reinvested after the deduction of withholding taxes.
The MSCI EM Index captures large and mid-cap representation across 24 Emerging Markets (EM) countries. With 1,138 constituents, the index covers approximately 85% of the free float-adjusted market capitalization in each country.
The Russell 1000® Growth Index is a large-cap market index which measures the performance of those Russell 1000 companies with higher price-to-book ratios and higher forecasted growth values.
The Russell 1000® Value Index is a large-cap market index which measures the performance of those Russell 1000 companies with lower price-to-book ratios and lower forecasted growth values.
The Russell 3000® Index measures the performance of the 3,000 largest U.S. companies based on total market capitalization, which represents 98% of the investable U.S. equity market.
The Russell Midcap® Index is a mid-cap market index which measures the performance of the mid-cap segment of the U.S. equity universe.
The S&P 500® Index is a large-cap market index which measures the performance of a representative sample of 500 leading companies in leading industries in the U.S.
Ultra Series Fund | Management’s Discussion of Fund Performance (unaudited) - concluded | December 31, 2018
Russell Investment Group is the source and owner of the trademarks, service marks and copyrights related to the Russell Indexes. Russell® is a trademark of Russell Investment Group.
The S&P Target Date® To Index Series
The S&P Target Date® “To” Index Series consists of multi-asset class indices, and corresponds to specific target retirement dates. The series reflects the consensus asset allocation and glide path of a subset of target date funds that generally pursue investment policies characterized by static total equity exposure after retirement and a relatively conservative total equity exposure near retirement. As the overall universe becomes more conservative with the approach of each target date year, so will the index. The asset allocation is based on market observations through an annual survey of “to” target date fund managers, and is categorized by S&P Dow Jones Indices.
| • | The S&P Target Date® To 2020 Index is a benchmark for multi-class asset portfolios that corresponds to the target retirement date 2020. |
| | |
| • | The S&P Target Date® To 2030 Index is a benchmark for multi-class asset portfolios that corresponds to the target retirement date 2030. |
| | |
| • | The S&P Target Date® To 2040 Index is a benchmark for multi-class asset portfolios that corresponds to the target retirement date 2040. |
| | |
| • | The S&P Target Date® To 2050 Index is a benchmark for multi-class asset portfolios that corresponds to the target retirement date 2050. |
| Ultra Series Fund | December 31, 2018 |
| | |
| Conservative Allocation Fund Portfolio of Investments |
| | | | | Shares | | | | Value (Note 2) | |
| | | | | | | | | |
| INVESTMENT COMPANIES - 95.2% | | | | | | | | | |
| | | | | | | | | | |
| Alternative Funds - 1.3% | | | | | | | | | |
| Invesco Optimum Yield Diversified Commodity Strategy | | | | 102,866 | | | $ | 1,550,191 | |
| | | | | | | | | |
| | | | | | | | | | |
| Bond Funds - 61.4% | | | | | | | | | |
| Baird Aggregate Bond Fund Institutional Shares | | | | 478,443 | | | | 5,038,000 | |
| iShares 20+ Year Treasury Bond ETF (A) | | | | 35,980 | | | | 4,371,930 | |
| iShares TIPS Bond Fund ETF | | | | 55,800 | | | | 6,110,658 | |
| Madison Core Bond Fund Class Y (B) | | | | 2,737,135 | | | | 26,385,982 | |
| Madison Corporate Bond Fund Class Y (B) | | | | 796,625 | | | | 8,715,077 | |
| Schwab Intermediate-Term U.S. Treasury ETF (A) | | | | 90,059 | | | | 4,768,624 | |
| Vanguard Short-Term Corporate Bond ETF | | | | 89,279 | | | | 6,958,405 | |
| Vanguard Short-Term Treasury ETF | | | | 180,514 | | | | 10,852,502 | |
| | | | | | | | | |
| | | | | | | | | 73,201,178 | |
| | | | | | | | | | |
| Foreign Stock Funds - 10.5% | | | | | | | | | |
| iShares MSCI Eurozone ETF | | | | 3,453 | | | | 121,062 | |
| iShares MSCI Japan ETF (A) | | | | 23,185 | | | | 1,175,248 | |
| iShares MSCI United Kingdom ETF | | | | 20,099 | | | | 589,906 | |
| SPDR S&P Emerging Asia Pacific ETF | | | | 23,312 | | | | 2,045,861 | |
| Vanguard FTSE All-World ex-U.S. ETF | | | | 96,193 | | | | 4,384,477 | |
| Vanguard FTSE Emerging Markets ETF | | | | 36,778 | | | | 1,401,242 | |
| Vanguard FTSE Europe ETF (A) | | | | 30,381 | | | | 1,477,124 | |
| WisdomTree Japan Hedged Equity Fund | | | | 24,145 | | | | 1,120,086 | |
| Xtrackers MSCI EAFE Hedged Equity ETF | | | | 9,952 | | | | 277,661 | |
| | | | | | | | | |
| | | | | | | | | 12,592,667 | |
| | | | | | | | | | |
| Stock Funds - 22.0% | | | | | | | | | |
| Energy Select Sector SPDR Fund | | | | 5,388 | | | | 309,002 | |
| iShares Core S&P Mid-Cap ETF | | | | 3,356 | | | | 557,297 | |
| iShares Edge MSCI Minimum Volatility USA ETF | | | | 56,815 | | | | 2,977,106 | |
| Madison Dividend Income Fund Class Y (B) | | | | 344,285 | | | | 8,076,929 | |
| Madison Investors Fund Class Y (B) | | | | 418,523 | | | | 8,014,715 | |
| Madison Mid Cap Fund Class Y (B) | | | | 107,475 | | | | 966,202 | |
| Vanguard Consumer Staples ETF | | | | 6,780 | | | | 889,333 | |
| Vanguard Growth ETF | | | | 15,552 | | | | 2,089,100 | |
| Vanguard Health Care ETF | | | | 3,746 | | | | 601,608 | |
| Vanguard Information Technology ETF | | | | 10,385 | | | | 1,732,530 | |
| | | | | | | | | |
| | | | | | | | | 26,213,822 | |
| | | | | | | | | |
Total Investment Companies | | | | | | | | |
(Cost $115,098,536) | | | | | | | | 113,557,858 | |
| | | | | | | | | | |
| SHORT-TERM INVESTMENTS - 5.0% | | | | | | | | | |
| State Street Institutional U.S. Government Money Market Fund, 2.27%, Premier Class (C) | | | | 3,892,541 | | | | 3,892,541 | |
| State Street Navigator Securities Lending Government Money Market Portfolio, 2.35% (C) (D) | | | | 2,115,228 | | | | 2,115,228 | |
| | | | | | | | | |
| | | | | | | | | | |
Total Short-Term Investments | | | | | | | | | |
(Cost $6,007,769) | | | | | | | | 6,007,769 | |
| | | | | | | | | |
| | | | | | | | | | |
| TOTAL INVESTMENTS - 100.2% (Cost $121,106,305**) | | | | | | | | 119,565,627 | |
| NET OTHER ASSETS AND LIABILITIES - (0.2%) | | | | | | | | (275,409 | ) |
| | | | | | | | | |
| TOTAL NET ASSETS - 100.0% | | | | | | | $ | 119,290,218 | |
| | | | | | | | | |
| ** | | Aggregate cost for Federal tax purposes was $121,208,202 |
| (A) | | All or a portion of these securities, with an aggregate fair value of $8,883,203, are on loan as part of a securities lending program. See footnote (D) and Note 8 for details on the securities lending program. |
| (B) | | Affiliated Company (see Note 11). |
| (C) | | 7-day yield. |
| (D) | | Represents investments of cash collateral received in connection with securities lending. |
| ETF | | Exchange Traded Fund. |
| TIPS | | Treasury Inflation Protected Security. |
See accompanying Notes to Financial Statements.
28
| Ultra Series Fund | December 31, 2018 |
| | |
| Moderate Allocation Fund Portfolio of Investments |
| | | | Shares | | | | Value (Note 2) | |
| | | | | | | | |
| INVESTMENT COMPANIES - 96.4% | | | | | | | | |
| | | | | | | | | |
| Alternative Funds - 2.2% | | | | | | | | |
| Invesco Optimum Yield Diversified Commodity Strategy | | | 284,204 | | | $ | 4,282,954 | |
| | | | | | | | |
| | | | | | | | | |
| Bond Funds - 37.8% | | | | | | | | |
| Baird Aggregate Bond Fund Institutional Shares | | | 398,452 | | | | 4,195,696 | |
| iShares 20+ Year Treasury Bond ETF (A) | | | 46,917 | | | | 5,700,885 | |
| iShares TIPS Bond Fund ETF | | | 38,069 | | | | 4,168,936 | |
| Madison Core Bond Fund Class Y (B) | | | 3,466,443 | | | | 33,416,506 | |
| Madison Corporate Bond Fund Class Y (B) | | | 437,539 | | | | 4,786,675 | |
| Schwab Intermediate-Term U.S. Treasury ETF (A) | | | 28,758 | | | | 1,522,736 | |
| Vanguard Short-Term Corporate Bond ETF | | | 56,150 | | | | 4,376,331 | |
| Vanguard Short-Term Treasury ETF (A) | | | 265,031 | | | | 15,933,664 | |
| | | | | | | | |
| | | | | | | | 74,101,429 | |
| | | | | | | | | |
| Foreign Stock Funds - 18.7% | | | | | | | | |
| iShares MSCI Eurozone ETF (A) | | | 5,631 | | | | 197,423 | |
| iShares MSCI Japan ETF | | | 66,761 | | | | 3,384,115 | |
| iShares MSCI United Kingdom ETF (A) | | | 64,505 | | | | 1,893,222 | |
| SPDR S&P Emerging Asia Pacific ETF | | | 66,709 | | | | 5,854,382 | |
| Vanguard FTSE All-World ex-U.S. ETF | | | 235,146 | | | | 10,717,954 | |
| Vanguard FTSE Emerging Markets ETF | | | 128,517 | | | | 4,896,498 | |
| Vanguard FTSE Europe ETF (A) | | | 122,221 | | | | 5,942,385 | |
| WisdomTree Japan Hedged Equity Fund (A) | | | 69,527 | | | | 3,225,357 | |
| Xtrackers MSCI EAFE Hedged Equity ETF (A) | | | 16,942 | | | | 472,682 | |
| | | | | | | | |
| | | | | | | | 36,584,018 | |
| | | | | | | | | |
| Stock Funds - 37.7% | | | | | | | | |
| Energy Select Sector SPDR Fund | | | 23,297 | | | | 1,336,083 | |
| iShares Core S&P Mid-Cap ETF | | | 5,520 | | | | 916,651 | |
| iShares Edge MSCI Minimum Volatility USA ETF | | | 117,996 | | | | 6,182,990 | |
| Madison Dividend Income Fund Class Y (B) | | | 992,337 | | | | 23,280,220 | |
| Madison Investors Fund Class Y (B) | | | 1,224,633 | | | | 23,451,726 | |
| Madison Large Cap Value Fund Class Y (B) | | | 59,522 | | | | 660,698 | |
| Madison Mid Cap Fund Class Y (B) | | | 345,425 | | | | 3,105,372 | |
| Vanguard Consumer Staples ETF | | | 25,238 | | | | 3,310,468 | |
| Vanguard Growth ETF (A) | | | 34,742 | | | | 4,666,893 | |
| Vanguard Health Care ETF (A) | | | 12,330 | | | | 1,980,198 | |
| Vanguard Information Technology ETF (A) | | | 30,519 | | | | 5,091,485 | |
| | | | | | | | |
| | | | | | | | 73,982,784 | |
| | | | | | | | |
Total Investment Companies | | | | | | | | |
(Cost $189,069,022) | | | | | | | 188,951,185 | |
| | | | | | | | | |
| SHORT-TERM INVESTMENTS - 7.3% | | | | | | | | |
| State Street Institutional U.S. Government Money Market Fund, 2.27%, Premier Class (C) | | | 7,029,518 | | | | 7,029,518 | |
| State Street Navigator Securities Lending Government Money Market Portfolio, 2.35% (C) (D) | | | 7,249,267 | | | | 7,249,267 | |
| | | | | | | | |
| | | | | | | | | |
Total Short-Term Investments | | | | | | | | |
(Cost $14,278,785) | | | | | | | 14,278,785 | |
| | | | | | | | |
| | | | | | | | | |
| TOTAL INVESTMENTS - 103.7% (Cost $203,347,807**) | | | | | | | 203,229,970 | |
| NET OTHER ASSETS AND LIABILITIES - (3.7%) | | | | | | | (7,143,180 | ) |
| | | | | | | | |
| TOTAL NET ASSETS - 100.0% | | | | | | $ | 196,086,790 | |
| | | | | | | | |
| ** | | Aggregate cost for Federal tax purposes was $203,513,841 |
| (A) | | All or a portion of these securities, with an aggregate fair value of $16,766,405, are on loan as part of a securities lending program. See footnote (D) and Note 8 for details on the securities lending program. |
| (B) | | Affiliated Company (see Note 11). |
| (C) | | 7-day yield. |
| (D) | | Represents investments of cash collateral received in connection with securities lending. |
| ETF | | Exchange Traded Fund. |
| TIPS | | Treasury Inflation Protected Security. |
See accompanying Notes to Financial Statements.
29
| Ultra Series Fund | December 31, 2018 |
| | |
| Aggressive Allocation Fund Portfolio of Investments |
| | | | Shares | | | | Value (Note 2) | |
| | | | | | | | |
| INVESTMENT COMPANIES - 97.2% | | | | | | | | |
| | | | | | | | | |
| Alternative Funds - 3.4% | | | | | | | | |
| Invesco Optimum Yield Diversified Commodity Strategy | | | 143,687 | | | $ | 2,165,363 | |
| | | | | | | | |
| | | | | | | | | |
| Bond Funds - 19.7% | | | | | | | | |
| iShares 20+ Year Treasury Bond ETF (A) | | | 12,492 | | | | 1,517,903 | |
| Madison Core Bond Fund Class Y (B) | | | 531,586 | | | | 5,124,492 | |
| Vanguard Short-Term Corporate Bond ETF | | | 24,101 | | | | 1,878,432 | |
| Vanguard Short-Term Treasury ETF | | | 65,864 | | | | 3,959,744 | |
| | | | | | | | |
| | | | | | | | 12,480,571 | |
| | | | | | | | | |
| Foreign Stock Funds - 24.9% | | | | | | | | |
| iShares MSCI Eurozone ETF | | | 4,610 | | | | 161,627 | |
| iShares MSCI Japan ETF (A) | | | 29,199 | | | | 1,480,097 | |
| iShares MSCI United Kingdom ETF | | | 33,230 | | | | 975,301 | |
| SPDR S&P Emerging Asia Pacific ETF | | | 26,860 | | | | 2,357,234 | |
| Vanguard FTSE All-World ex-U.S. ETF | | | 107,697 | | | | 4,908,829 | |
| Vanguard FTSE Emerging Markets ETF | | | 57,795 | | | | 2,201,989 | |
| Vanguard FTSE Europe ETF (A) | | | 43,360 | | | | 2,108,163 | |
| WisdomTree Japan Hedged Equity Fund (A) | | | 30,409 | | | | 1,410,674 | |
| Xtrackers MSCI EAFE Hedged Equity ETF | | | 5,467 | | | | 152,529 | |
| | | | | | | | |
| | | | | | | | 15,756,443 | |
| | | | | | | | | |
| Stock Funds - 49.2% | | | | | | | | |
| Energy Select Sector SPDR Fund | | | 10,682 | | | | 612,613 | |
| iShares Core S&P Mid-Cap ETF | | | 2,810 | | | | 466,629 | |
| iShares Edge MSCI Minimum Volatility USA ETF | | | 42,298 | | | | 2,216,415 | |
| Madison Dividend Income Fund Class Y (B) | | | 352,271 | | | | 8,264,273 | |
| Madison Investors Fund Class Y (B) | | | 429,765 | | | | 8,229,996 | |
| Madison Large Cap Value Fund Class Y (B) | | | 65,142 | | | | 723,080 | |
| Madison Mid Cap Fund Class Y (B) | | | 250,231 | | | | 2,249,579 | |
| Vanguard Consumer Staples ETF | | | 9,615 | | | | 1,261,200 | |
| Vanguard Growth ETF | | | 26,477 | | | | 3,556,655 | |
| Vanguard Health Care ETF (A) | | | 7,323 | | | | 1,176,075 | |
| Vanguard Information Technology ETF | | | 14,139 | | | | 2,358,809 | |
| | | | | | | | |
| | | | | | | | 31,115,324 | |
| | | | | | | | |
Total Investment Companies | | | | | | | | |
(Cost $61,198,642) | | | | | | | 61,517,701 | |
| | | | | | | | | |
| SHORT-TERM INVESTMENTS - 4.6% | | | | | | | | |
| State Street Institutional U.S. Government Money Market Fund, 2.27%, Premier Class (C) | | | 1,151,243 | | | | 1,151,243 | |
| State Street Navigator Securities Lending Government Money Market Portfolio, 2.35% (C) (D) | | | 1,773,287 | | | | 1,773,287 | |
| | | | | | | | |
| | | | | | | | | |
Total Short-Term Investments | | | | | | | | |
(Cost $2,924,530) | | | | | | | 2,924,530 | |
| | | | | | | | |
| | | | | | | | | |
| TOTAL INVESTMENTS - 101.8% (Cost $64,123,172**) | | | | | | | 64,442,231 | |
| NET OTHER ASSETS AND LIABILITIES - (1.8%) | | | | | | | (1,138,196 | ) |
| | | | | | | | |
| TOTAL NET ASSETS - 100.0% | | | | | | $ | 63,304,035 | |
| | | | | | | | |
| ** | | Aggregate cost for Federal tax purposes was $64,184,025. |
| (A) | | All or a portion of these securities, with an aggregate fair value of $5,546,228, are on loan as part of a securities lending program. See footnote (D) and Note 8 for details on the securities lending program. |
| (B) | | Affiliated Company (see Note 11). |
| (C) | | 7-day yield. |
| (D) | | Represents investments of cash collateral received in connection with securities lending. |
| ETF | | Exchange Traded Fund. |
See accompanying Notes to Financial Statements.
30
| Ultra Series Fund | December 31, 2018 |
| | |
| Core Bond Fund Portfolio of Investments |
| | | | Par Value | | | | Value (Note 2) | |
| | | | | | | |
| ASSET BACKED SECURITIES - 4.9% | | | | | | | | |
| American Express Credit Account Master Trust, Series 2017-1, Class B, 2.1%, 9/15/22 | | $ | 500,000 | | | $ | 495,301 | |
| BMW Floorplan Master Owner Trust, Series 2018-1, Class A2, (1M USD LIBOR + 0.930%) (A) (B), 2.775%, 5/15/23 | | | 275,000 | | | | 275,000 | |
| CarMax Auto Owner Trust, Series 2015-2, Class A4, 1.8%, 3/15/21 | | | 506,999 | | | | 504,650 | |
| CarMax Auto Owner Trust, Series 2018-3, Class A3, 3.13%, 6/15/23 | | | 350,000 | | | | 351,338 | |
| Chesapeake Funding II LLC, Series 2018-3A, Class B (A), 3.62%, 1/15/31 | | | 100,000 | | | | 100,866 | |
| Chesapeake Funding II LLC, Series 2017-4A, Class A1 (A), 2.12%, 11/15/29 | | | 325,043 | | | | 321,521 | |
| Chesapeake Funding II LLC, Series 2018-1A, Class A1 (A), 3.04%, 4/15/30 | | | 145,542 | | | | 145,441 | |
| Chesapeake Funding II LLC, Series 2018-2A, Class A1 (A), 3.23%, 8/15/30 | | | 150,000 | | | | 150,678 | |
| Chesapeake Funding II LLC, Series 2018-2A, Class B (A), 3.52%, 8/15/30 | | | 150,000 | | | | 151,197 | |
| Enterprise Fleet Financing LLC, Series 2015-2, Class A3 (A), 2.09%, 2/22/21 | | | 101,734 | | | | 101,488 | |
| Enterprise Fleet Financing LLC, Series 2017-2, Class A2 (A), 1.97%, 1/20/23 | | | 359,355 | | | | 356,575 | |
| Enterprise Fleet Financing LLC, Series 2017-3, Class A2 (A), 2.13%, 5/22/23 | | | 770,741 | | | | 763,923 | |
| John Deere Owner Trust, Series 2018-B, Class A3, 3.08%, 11/15/22 | | | 350,000 | | | | 351,710 | |
| Synchrony Credit Card Master Note Trust, Series 2017-1, Class B, 2.19%, 6/15/23 | | | 1,000,000 | | | | 986,983 | |
| Verizon Owner Trust, Series 2017-1A, Class A (A), 2.06%, 9/20/21 | | | 800,000 | | | | 794,034 | |
| Verizon Owner Trust, Series 2018-A, Class A1A, 3.23%, 4/20/23 | | | 670,000 | | | | 674,108 | |
| | | | | | | | |
| | | | | | | | | |
Total Asset Backed Securities | | | | | | | | |
(Cost $6,518,439) | | | | | | | 6,524,813 | |
| | | | | | | | | |
| COLLATERALIZED MORTGAGE OBLIGATIONS - 2.2% | | | | | | | | |
| Fannie Mae REMICS, Series 2015-12, Class NI, IO, 3.5%, 3/25/30 | | | 1,937,983 | | | | 214,417 | |
| Fannie Mae REMICS, Series 2011-31, Class DB, 3.5%, 4/25/31 | | | 375,000 | | | | 383,528 | |
| Fannie Mae REMICS, Series 2011-36, Class QB, 4%, 5/25/31 | | | 500,000 | | | | 518,852 | |
| Fannie Mae REMICS, Series 2005-79, Class LT, 5.5%, 9/25/35 | | | 438,196 | | | | 479,463 | |
| Fannie Mae REMICS, Series 2011-101, Class NC, 2.5%, 4/25/40 | | | 215,606 | | | | 214,194 | |
| Fannie Mae REMICS, Series 2016-21, Class BA, 3%, 3/25/42 | | | 618,338 | | | | 619,875 | |
| Freddie Mac REMICS, Series 4066, Class DI, IO, 3%, 6/15/27 | | | 2,373,336 | | | | 185,408 | |
| Government National Mortgage Association, Series 2015-53, Class IL, IO, 3%, 9/20/44 | | | 1,834,118 | | | | 353,737 | |
| | | | | | | | |
| | | | | | | | | |
Total Collateralized Mortgage Obligations
(Cost $2,983,074) | | | | | | | 2,969,474 | |
| | | | | | | | | |
| COMMERCIAL MORTGAGE-BACKED SECURITIES - 2.4% | | | | | | | | |
| Fannie Mae-Aces, Series 2016-M2, Class X2, IO (B) (C), 1.097%, 1/25/23 | | | 9,955,388 | | | | 333,673 | |
| FHLMC Multifamily Structured Pass Through Certificates, Series K718, Class X1, IO (B) (C), 0.624%, 1/25/22 | | | 23,222,586 | | | | 371,552 | |
| FHLMC Multifamily Structured Pass Through Certificates, Series KJ17, Class A2, 2.982%, 11/25/25 | | | 300,000 | | | | 296,898 | |
| FHLMC Multifamily Structured Pass Through Certificates, Series K059, Class X1, IO (B) (C), 0.316%, 9/25/26 | | | 12,028,203 | | | | 251,150 | |
| FHLMC Multifamily Structured Pass Through Certificates, Series K066, Class A2, 3.117%, 6/25/27 | | | 500,000 | | | | 494,297 | |
| FREMF Mortgage Trust, Series 2012-K708, Class B (A) (B) (C), 3.718%, 2/25/45 | | | 1,000,000 | | | | 997,654 | |
| FREMF Mortgage Trust, Series 2015-K721, Class B (A) (B) (C), 3.565%, 11/25/47 | | | 500,000 | | | | 498,930 | |
| WFRBS Commercial Mortgage Trust, Series 2014-LC14, Class A2, 2.862%, 3/15/47 | | | 52,454 | | | | 52,372 | |
| | | | | | | | |
| | | | | | | | | |
Total Commercial Mortgage-Backed Securities
(Cost $3,415,330) | | | | | | | 3,296,526 | |
| | | | | | | | | |
| CORPORATE NOTES AND BONDS - 35.1% | | | | | | | | |
| | | | | | | | | |
| Communication Services - 1.2% | | | | | | | | |
| Comcast Corp., 4.7%, 10/15/48 | | | 250,000 | | | | 252,720 | |
| Verizon Communications Inc., 4.329%, 9/21/28 | | | 647,000 | | | | 649,659 | |
| Verizon Communications Inc., 4.4%, 11/1/34 | | | 300,000 | | | | 289,138 | |
| Vodafone Group PLC (D), 3.75%, 1/16/24 | | | 250,000 | | | | 246,408 | |
| Vodafone Group PLC (D), 5%, 5/30/38 | | | 250,000 | | | | 234,253 | |
| | | | | | | | |
| | | | | | | | 1,672,178 | |
| | | | | | | | | |
| Consumer Discretionary - 4.9% | | | | | | | | |
| Advance Auto Parts Inc., 4.5%, 12/1/23 | | | 750,000 | | | | 767,630 | |
| CCO Holdings LLC / CCO Holdings Capital Corp. (A), 5.875%, 5/1/27 | | | 525,000 | | | | 509,250 | |
| Charter Communications Operating LLC / Charter Communications Operating Capital Corp., 4.464%, 7/23/22 | | | 400,000 | | | | 403,842 | |
| D.R. Horton Inc., 2.55%, 12/1/20 | | | 400,000 | | | | 390,374 | |
| Discovery Communications LLC, 5%, 9/20/37 | | | 500,000 | | | | 463,787 | |
| DISH DBS Corp., 6.75%, 6/1/21 | | | 150,000 | | | | 148,455 | |
See accompanying Notes to Financial Statements.
31
| Ultra Series Fund | December 31, 2018 |
| | |
| Core Bond Fund Portfolio of Investments - continued |
| | | | Par Value | | | | Value (Note 2) | |
| | | | | | | |
| CORPORATE NOTES AND BONDS - continued | | | | | | | | |
| | | | | | | | | |
| Consumer Discretionary - continued | | | | | | | | |
| ERAC USA Finance LLC (A), 6.7%, 6/1/34 | | $ | 150,000 | | | $ | 178,169 | |
| GameStop Corp. (A), 6.75%, 3/15/21 | | | 200,000 | | | | 199,500 | |
| General Motors Financial Co. Inc., 3.2%, 7/6/21 | | | 150,000 | | | | 146,521 | |
| GLP Capital L.P. / GLP Financing II Inc., 4.875%, 11/1/20 | | | 253,000 | | | | 255,150 | |
| Lennar Corp., 4.75%, 4/1/21 | | | 500,000 | | | | 495,625 | |
| Marriott International Inc., 3.125%, 6/15/26 | | | 400,000 | | | | 363,222 | |
| McDonald’s Corp., MTN, 4.875%, 12/9/45 | | | 400,000 | | | | 402,658 | |
| Omnicom Group Inc. / Omnicom Capital Inc., 3.6%, 4/15/26 | | | 750,000 | | | | 717,801 | |
| Sirius XM Radio Inc. (A), 6%, 7/15/24 | | | 350,000 | | | | 350,875 | |
| Walgreens Boots Alliance Inc., 3.45%, 6/1/26 | | | 850,000 | | | | 799,755 | |
| | | | | | | | |
| | | | | | | | 6,592,614 | |
| | | | | | | | | |
| Consumer Staples - 1.9% | | | | | | | | |
| Anheuser-Busch Cos. LLC / Anheuser-Busch InBev Worldwide Inc. (A), 4.9%, 2/1/46 | | | 1,000,000 | | | | 927,385 | |
| B&G Foods Inc., 4.625%, 6/1/21 | | | 100,000 | | | | 97,500 | |
| Bunge Ltd. Finance Corp., 3.25%, 8/15/26 | | | 850,000 | | | | 744,745 | |
| Conagra Brands Inc., 5.4%, 11/1/48 | | | 250,000 | | | | 230,243 | |
| Molson Coors Brewing Co., 2.1%, 7/15/21 | | | 400,000 | | | | 385,661 | |
| Tyson Foods Inc., 3.55%, 6/2/27 | | | 150,000 | | | | 139,792 | |
| | | | | | | | |
| | | | | | | | 2,525,326 | |
| | | | | | | | | |
| Energy - 4.0% | | | | | | | | |
| Antero Resources Corp., 5.625%, 6/1/23 | | | 300,000 | | | | 285,000 | |
| Concho Resources Inc., 4.3%, 8/15/28 | | | 200,000 | | | | 195,640 | |
| EnLink Midstream Partners L.P., 5.45%, 6/1/47 | | | 550,000 | | | | 444,799 | |
| Enterprise Products Operating LLC, 3.75%, 2/15/25 | | | 750,000 | | | | 742,093 | |
| Helmerich & Payne International Drilling Co. (A), 4.65%, 3/15/25 | | | 400,000 | | | | 407,862 | |
| Jonah Energy LLC / Jonah Energy Finance Corp. (A), 7.25%, 10/15/25 | | | 230,000 | | | | 147,200 | |
| Kinder Morgan Inc., 5.55%, 6/1/45 | | | 800,000 | | | | 792,295 | |
| Marathon Oil Corp., 2.7%, 6/1/20 | | | 750,000 | | | | 738,918 | |
| MPLX L.P., 4.8%, 2/15/29 | | | 250,000 | | | | 249,384 | |
| Unit Corp., 6.625%, 5/15/21 | | | 600,000 | | | | 546,000 | |
| Valero Energy Partners L.P., 4.5%, 3/15/28 | | | 850,000 | | | | 832,287 | |
| | | | | | | | |
| | | | | | | | 5,381,478 | |
| | | | | | | | | |
| Financials - 11.7% | | | | | | | | |
| AerCap Ireland Capital DAC / AerCap Global Aviation Trust (D), 3.75%, 5/15/19 | | | 400,000 | | | | 399,970 | |
| Affiliated Managers Group Inc., 4.25%, 2/15/24 | | | 500,000 | | | | 510,114 | |
| Aflac Inc., 4.75%, 1/15/49 | | | 400,000 | | | | 408,178 | |
| Air Lease Corp., 3.875%, 4/1/21 | | | 500,000 | | | | 500,637 | |
| Air Lease Corp., 3.75%, 2/1/22 | | | 700,000 | | | | 692,687 | |
| American Express Co., 2.5%, 8/1/22 | | | 150,000 | | | | 144,777 | |
| American Express Co., 4.2%, 11/6/25 | | | 350,000 | | | | 356,785 | |
| American International Group Inc., 4.75%, 4/1/48 | | | 200,000 | | | | 183,024 | |
| Bank of America Corp., MTN, 2.503%, 10/21/22 | | | 400,000 | | | | 385,132 | |
| Bank of America Corp., MTN, (3M USD LIBOR + 0.930%) (B), 2.816%, 7/21/23 | | | 400,000 | | | | 386,909 | |
| Bank of Montreal, MTN (D), 1.9%, 8/27/21 | | | 500,000 | | | | 482,919 | |
| Bank of New York Mellon Corp./The, MTN, 2.2%, 8/16/23 | | | 500,000 | | | | 474,769 | |
| Boston Properties L.P., 2.75%, 10/1/26 | | | 500,000 | | | | 451,607 | |
| Capital One Financial Corp., 2.5%, 5/12/20 | | | 400,000 | | | | 394,824 | |
| Capital One Financial Corp., 3.3%, 10/30/24 | | | 400,000 | | | | 378,299 | |
| Cboe Global Markets Inc., 3.65%, 1/12/27 | | | 500,000 | | | | 486,636 | |
| Citigroup Inc.(3M USD LIBOR + 0.930%) (B), 4.075%, 4/23/29 | | | 450,000 | | | | 437,828 | |
| Discover Bank, 3.45%, 7/27/26 | | | 400,000 | | | | 366,799 | |
| Fifth Third Bank, 3.35%, 7/26/21 | | | 500,000 | | | | 501,007 | |
| Goldman Sachs Group Inc./The(3M USD LIBOR + 0.930%) (B), 3.272%, 9/29/25 | | | 700,000 | | | | 656,161 | |
| Goldman Sachs Group Inc./The, 3.5%, 11/16/26 | | | 500,000 | | | | 461,825 | |
| Huntington National Bank/The, 2.4%, 4/1/20 | | | 500,000 | | | | 494,683 | |
| Huntington National Bank/The, 3.55%, 10/6/23 | | | 250,000 | | | | 249,137 | |
| Intercontinental Exchange Inc., 2.35%, 9/15/22 | | | 200,000 | | | | 193,275 | |
| Intercontinental Exchange Inc., 3.75%, 9/21/28 | | | 200,000 | | | | 200,127 | |
| JPMorgan Chase & Co., 3.125%, 1/23/25 | | | 900,000 | | | | 857,435 | |
| Liberty Mutual Group Inc. (A), 4.25%, 6/15/23 | | | 750,000 | | | | 756,162 | |
| M&T Bank Corp., 3.55%, 7/26/23 | | | 250,000 | | | | 250,996 | |
| Morgan Stanley, 4.3%, 1/27/45 | | | 1,000,000 | | | | 935,345 | |
| Nasdaq Inc., 3.85%, 6/30/26 | | | 100,000 | | | | 96,570 | |
| Old Republic International Corp., 3.875%, 8/26/26 | | | 500,000 | | | | 477,440 | |
| Regions Financial Corp., 3.2%, 2/8/21 | | | 750,000 | | | | 745,203 | |
| Regions Financial Corp., 2.75%, 8/14/22 | | | 400,000 | | | | 385,912 | |
| Synchrony Financial, 3.75%, 8/15/21 | | | 100,000 | | | | 97,320 | |
| Synchrony Financial, 3.7%, 8/4/26 | | | 400,000 | | | | 339,297 | |
| TD Ameritrade Holding Corp., 3.3%, 4/1/27 | | | 400,000 | | | | 382,583 | |
| ZB NA, 3.5%, 8/27/21 | | | 250,000 | | | | 249,225 | |
| | | | | | | | |
| | | | | | | | 15,771,597 | |
| | | | | | | | | |
| Health Care - 3.4% | | | | | | | | |
| AbbVie Inc., 3.75%, 11/14/23 | | | 400,000 | | | | 397,978 | |
| Becton, Dickinson and Co., 2.894%, 6/6/22 | | | 500,000 | | | | 484,260 | |
| Cigna Corp. (A), 4.375%, 10/15/28 | | | 200,000 | | | | 201,116 | |
| Cigna Corp. (A), 4.9%, 12/15/48 | | | 200,000 | | | | 195,680 | |
| CVS Health Corp., 5.125%, 7/20/45 | | | 750,000 | | | | 730,057 | |
See accompanying Notes to Financial Statements.
32
| Ultra Series Fund | December 31, 2018 |
| | |
| Core Bond Fund Portfolio of Investments - continued |
| | | | Par Value | | | | Value (Note 2) | |
| | | | | | | |
| CORPORATE NOTES AND BONDS - continued | | | | | | | | |
| | | | | | | | | |
| Health Care - continued | | | | | | | | |
| Forest Laboratories LLC (A), 5%, 12/15/21 | | $ | 250,000 | | | $ | 257,225 | |
| Humana Inc., 2.5%, 12/15/20 | | | 400,000 | | | | 393,966 | |
| Laboratory Corp. of America Holdings, 3.6%, 9/1/27 | | | 300,000 | | | | 285,725 | |
| Shire Acquisitions Investments Ireland DAC (D), 1.9%, 9/23/19 | | | 750,000 | | | | 739,489 | |
| UnitedHealth Group, Inc., 3.5%, 2/15/24 | | | 450,000 | | | | 452,880 | |
| Zoetis Inc., 3%, 9/12/27 | | | 475,000 | | | | 438,684 | |
| | | | | | | | |
| | | | | | | | 4,577,060 | |
| | | | | | | | | |
| Industrials - 1.7% | | | | | | | | |
| Carlisle Cos. Inc., 3.5%, 12/1/24 | | | 200,000 | | | | 191,505 | |
| CRH America Inc. (A), 3.875%, 5/18/25 | | | 300,000 | | | | 288,332 | |
| DAE Funding LLC (A), 5.25%, 11/15/21 | | | 200,000 | | | | 196,750 | |
| Masco Corp., 4.375%, 4/1/26 | | | 650,000 | | | | 650,074 | |
| TransDigm Inc., 6%, 7/15/22 | | | 250,000 | | | | 246,250 | |
| Union Pacific Corp., 3.5%, 6/8/23 | | | 300,000 | | | | 300,570 | |
| United Rentals North America Inc., 4.625%, 7/15/23 | | | 400,000 | | | | 392,500 | |
| | | | | | | | |
| | | | | | | | 2,265,981 | |
| | | | | | | | | |
| Information Technology - 2.9% | | | | | | | | |
| Analog Devices Inc., 5.3%, 12/15/45 | | | 600,000 | | | | 631,164 | |
| Broadridge Financial Solutions Inc., 3.95%, 9/1/20 | | | 500,000 | | | | 505,004 | |
| Citrix Systems Inc., 4.5%, 12/1/27 | | | 105,000 | | | | 100,360 | |
| Dell International LLC / EMC Corp. (A), 8.35%, 7/15/46 | | | 250,000 | | | | 270,697 | |
| Fidelity National Information Services Inc., 3%, 8/15/26 | | | 475,000 | | | | 436,984 | |
| Fidelity National Information Services Inc., 4.75%, 5/15/48 | | | 300,000 | | | | 278,867 | |
| Fiserv Inc., 3.8%, 10/1/23 | | | 250,000 | | | | 251,557 | |
| Marvell Technology Group Ltd. (D), 4.2%, 6/22/23 | | | 400,000 | | | | 398,842 | |
| Oracle Corp., 4%, 7/15/46 | | | 750,000 | | | | 699,814 | |
| Salesforce.com Inc., 3.7%, 4/11/28 | | | 250,000 | | | | 251,321 | |
| | | | | | | | |
| | | | | | | | 3,824,610 | |
| | | | | | | | | |
| Materials - 0.9% | | | | | | | | |
| DowDuPont Inc., 4.725%, 11/15/28 | | | 400,000 | | | | 412,961 | |
| WestRock Co. (A), 3.75%, 3/15/25 | | | 750,000 | | | | 735,933 | |
| | | | | | | | |
| | | | | | | | 1,148,894 | |
| | | | | | | | | |
| Real Estate - 2.1% | | | | | | | | |
| Boston Properties L.P., 3.65%, 2/1/26 | | | 450,000 | | | | 435,447 | |
| Brixmor Operating Partnership L.P., 3.65%, 6/15/24 | | | 500,000 | | | | 485,561 | |
| Iron Mountain Inc. (A), 4.875%, 9/15/27 | | | 250,000 | | | | 218,125 | |
| Store Capital Corp., 4.5%, 3/15/28 | | | 550,000 | | | | 531,368 | |
| Welltower Inc., 4.5%, 1/15/24 | | | 750,000 | | | | 769,103 | |
| WP Carey Inc., 4.25%, 10/1/26 | | | 400,000 | | | | 391,135 | |
| | | | | | | | |
| | | | | | | | 2,830,739 | |
| | | | | | | | | |
| Utilities - 0.4% | | | | | | | | |
| Duke Energy Corp., 3.75%, 9/1/46 | | | 650,000 | | | | 561,960 | |
| | | | | | | | |
| | | | | | | | | |
| Total Corporate Notes and Bonds | | | | | | | | |
| (Cost $48,563,641) | | | | | | | 47,152,437 | |
| | | | | | | | | |
| LONG TERM MUNICIPAL BONDS - 5.0% | | | | | | | | |
| County of Pasco FL Water & Sewer Revenue, Series B, 6.76%, 10/1/39 | | | 1,000,000 | | | | 1,028,100 | |
| East Baton Rouge Sewerage Commission Revenue, Series B, 6.087%, 2/1/45 | | | 1,000,000 | | | | 1,028,800 | |
| Los Angeles Department of Water & Power Revenue, 6.166%, 7/1/40 | | | 1,000,000 | | | | 1,045,350 | |
| Metropolitan Transportation Authority Revenue, 6.548%, 11/15/31 | | | 1,000,000 | | | | 1,231,270 | |
| New York City Transitional Finance Authority Future Tax Secured Revenue, 6.267%, 8/1/39 | | | 500,000 | | | | 509,080 | |
| Palomar Community College District, General Obligation, 7.194%, 8/1/45 | | | 1,000,000 | | | | 1,065,070 | |
| Washington County School District #1 West Union, General Obligation, 4.355%, 6/30/34 | | | 800,000 | | | | 849,016 | |
| | | | | | | | |
| | | | | | | | | |
| Total Long Term Municipal Bonds | | | | | | | | |
| (Cost $6,808,498) | | | | | | | 6,756,686 | |
| | | | | | | | | |
| MORTGAGE BACKED SECURITIES - 25.1% | | | | | | | | |
| | | | | | | | | |
| Fannie Mae - 16.6% | | | | | | | | |
| 3%, 9/1/30 Pool # 890696 | | | 1,105,544 | | | | 1,106,281 | |
| 3%, 12/1/30 Pool # AL8924 | | | 465,634 | | | | 465,944 | |
| 7%, 11/1/31 Pool # 607515 | | | 22,754 | | | | 25,061 | |
| 3.5%, 12/1/31 Pool # MA0919 | | | 122,367 | | | | 124,641 | |
| 6.5%, 3/1/32 Pool # 631377 | | | 29,793 | | | | 31,994 | |
| 7%, 5/1/32 Pool # 644591 | | | 6,427 | | | | 6,564 | |
| 6.5%, 6/1/32 Pool # 545691 | | | 256,575 | | | | 287,694 | |
| 3.5%, 8/1/32 Pool # MA3098 | | | 199,821 | | | | 202,354 | |
| 5.5%, 11/1/33 Pool # 555880 | | | 321,297 | | | | 345,552 | |
| 7%, 7/1/34 Pool # 792636 | | | 36,223 | | | | 37,018 | |
| 4%, 2/1/35 Pool # MA2177 | | | 1,268,147 | | | | 1,315,642 | |
| 5%, 8/1/35 Pool # 829670 | | | 403,240 | | | | 428,006 | |
| 5%, 9/1/35 Pool # 820347 | | | 505,751 | | | | 541,288 | |
| 5%, 9/1/35 Pool # 835699 | | | 402,649 | | | | 429,698 | |
| 3.5%, 12/1/35 Pool # MA2473 | | | 904,122 | | | | 915,920 | |
| 5%, 12/1/35 Pool # 850561 | | | 138,855 | | | | 147,426 | |
| 5.5%, 10/1/36 Pool # 901723 | | | 341,540 | | | | 364,099 | |
| 6.5%, 10/1/36 Pool # 894118 | | | 316,895 | | | | 349,536 | |
| 6%, 11/1/36 Pool # 902510 | | | 329,915 | | | | 363,515 | |
| 6%, 10/1/37 Pool # 947563 | | | 409,559 | | | | 451,038 | |
| 6.5%, 8/1/38 Pool # 987711 | | | 631,306 | | | | 725,335 | |
See accompanying Notes to Financial Statements.
33
| Ultra Series Fund | December 31, 2018 |
| | |
| Core Bond Fund Portfolio of Investments - continued |
| | | | Par Value | | | | Value (Note 2) | |
| | | | | | | |
| MORTGAGE BACKED SECURITIES - continued | | | | | | | | |
| | | | | | | | | |
| Fannie Mae - continued | | | | | | | | |
| 4%, 1/1/41 Pool # AB2080 | | $ | 1,321,591 | | | $ | 1,358,929 | |
| 4.5%, 7/1/41 Pool # AB3274 | | | 519,262 | | | | 543,897 | |
| 5.5%, 7/1/41 Pool # AL6588 | | | 1,026,028 | | | | 1,108,032 | |
| 4%, 9/1/41 Pool # AJ1406 | | | 896,055 | | | | 921,308 | |
| 3.5%, 6/1/42 Pool # AO4136 | | | 1,437,729 | | | | 1,448,951 | |
| 4%, 6/1/42 Pool # MA1087 | | | 356,984 | | | | 367,059 | |
| 3.5%, 8/1/42 Pool # AP2133 | | | 656,014 | | | | 661,135 | |
| 3.5%, 9/1/42 Pool # AB6228 | | | 1,167,980 | | | | 1,177,097 | |
| 4%, 10/1/42 Pool # AP7363 | | | 848,041 | | | | 871,938 | |
| 3.5%, 3/1/43 Pool # AT0310 | | | 672,668 | | | | 677,854 | |
| 4%, 1/1/45 Pool # AS4257 | | | 210,793 | | | | 215,941 | |
| 4.5%, 2/1/45 Pool # MA2193 | | | 825,421 | | | | 859,459 | |
| 3.5%, 8/1/45 Pool # AS5645 | | | 665,918 | | | | 668,264 | |
| 3.5%, 11/1/45 Pool # BA4907 | | | 551,945 | | | | 553,748 | |
| 3.5%, 12/1/45 Pool # AS6309 | | | 309,767 | | | | 310,762 | |
| 4.5%, 10/1/46 Pool # MA2783 | | | 107,474 | | | | 111,388 | |
| 4%, 12/1/46 Pool # BD2379 | | | 404,387 | | | | 412,405 | |
| 3%, 1/1/47 Pool # BE0108 | | | 436,878 | | | | 427,024 | |
| 4%, 7/1/48 Pool # MA3415 | | | 968,704 | | | | 987,682 | |
| | | | | | | | |
| | | | | | | | 22,347,479 | |
| | | | | | | | | |
| Freddie Mac - 8.4% | | | | | | | | |
| 4.5%, 2/1/25 Pool # J11722 | | | 149,029 | | | | 153,736 | |
| 4.5%, 5/1/25 Pool # J12247 | | | 277,780 | | | | 286,572 | |
| 8%, 6/1/30 Pool # C01005 | | | 11,354 | | | | 12,984 | |
| 7%, 3/1/31 Pool # C48129 | | | 49,106 | | | | 49,698 | |
| 5.5%, 11/1/34 Pool # A28282 | | | 579,479 | | | | 619,490 | |
| 5.5%, 1/1/37 Pool # G04593 | | | 181,769 | | | | 196,099 | |
| 4%, 10/1/41 Pool # Q04092 | | | 614,401 | | | | 632,185 | |
| 3%, 9/1/42 Pool # C04233 | | | 1,985,043 | | | | 1,951,828 | |
| 3%, 4/1/43 Pool # V80025 | | | 1,792,820 | | | | 1,761,987 | |
| 3%, 4/1/43 Pool # V80026 | | | 1,760,892 | | | | 1,730,199 | |
| 3.5%, 8/1/44 Pool # Q27927 | | | 593,454 | | | | 596,983 | |
| 3%, 7/1/45 Pool # G08653 | | | 537,581 | | | | 525,605 | |
| 3.5%, 8/1/45 Pool # Q35614 | | | 1,014,107 | | | | 1,018,483 | |
| 3%, 10/1/46 Pool # G60722 | | | 964,653 | | | | 941,779 | |
| 4%, 3/1/47 Pool # Q46801 | | | 815,182 | | | | 833,356 | |
| | | | | | | | |
| | | | | | | | 11,310,984 | |
| | | | | | | | | |
| Ginnie Mae - 0.1% | | | | | | | | |
| 6.5%, 2/20/29 Pool # 2714 | | | 45,859 | | | | 51,725 | |
| 6.5%, 4/20/31 Pool # 3068 | | | 32,485 | | | | 37,000 | |
| | | | | | | | |
| | | | | | | | 88,725 | |
| | | | | | | | |
| | | | | | | | | |
Total Mortgage Backed Securities | | | | | | | | |
(Cost $34,192,395) | | | | | | | 33,747,188 | |
| | | | | | | | | |
| U.S. GOVERNMENT AND AGENCY OBLIGATIONS - 22.0% | | | | | | | | |
| | | | | | | | | |
| Federal Farm Credit Bank - 0.4% | | | | | | | | |
| 3.470%, 5/7/24 | | | 500,000 | | | | 500,420 | |
| | | | | | | | |
| | | | | | | | | |
| U.S. Treasury Bonds - 8.2% | | | | | | | | |
| 6.625%, 2/15/27 | | | 2,000,000 | | | | 2,581,953 | |
| 4.500%, 5/15/38 | | | 2,000,000 | | | | 2,489,453 | |
| 3.750%, 8/15/41 | | | 1,000,000 | | | | 1,128,125 | |
| 3.000%, 5/15/45 | | | 1,250,000 | | | | 1,247,608 | |
| 2.500%, 5/15/46 | | | 1,000,000 | | | | 901,836 | |
| 2.250%, 8/15/46 | | | 2,000,000 | | | | 1,709,297 | |
| 3.000%, 5/15/47 | | | 1,000,000 | | | | 995,703 | |
| | | | | | | | |
| | | | | | | | 11,053,975 | |
| | | | | | | | | |
| U.S. Treasury Notes - 13.4% | | | | | | | | |
| 2.625%, 11/15/20 (E) | | | 3,150,000 | | | | 3,155,783 | |
| 2.000%, 11/15/21 (E) | | | 3,500,000 | | | | 3,454,746 | |
| 2.500%, 8/15/23 | | | 2,500,000 | | | | 2,499,219 | |
| 2.750%, 11/15/23 | | | 2,000,000 | | | | 2,021,875 | |
| 2.125%, 3/31/24 | | | 3,000,000 | | | | 2,940,820 | |
| 2.250%, 11/15/25 | | | 2,500,000 | | | | 2,444,824 | |
| 2.875%, 5/15/28 | | | 1,500,000 | | | | 1,523,028 | |
| | | | | | | | |
| | | | | | | | 18,040,295 | |
| | | | | | | | |
| | | | | | | | | |
Total U.S. Government and Agency Obligations
(Cost $28,900,932) | | | | | | | 29,594,690 | |
See accompanying Notes to Financial Statements.
34
| Ultra Series Fund | December 31, 2018 |
| | |
| Core Bond Fund Portfolio of Investments - continued |
| | | | Shares | | | | Value (Note 2) | |
| | | | | | | | | |
| SHORT-TERM INVESTMENTS - 2.3% | | | | | | | | |
| State Street Institutional U.S. Government Money Market Fund, 2.27%, Premier Class (F) | | | 3,110,858 | | | $ | 3,110,858 | |
| | | | | | | | |
| | | | | | | | | |
Total Short-Term Investments | | | | | | | | |
(Cost $3,110,858) | | | | | | | 3,110,858 | |
| | | | | | | | | |
| TOTAL PUT OPTIONS PURCHASED - 0.0% | | | | | | | 1,406 | |
| | | | | | | | |
| TOTAL INVESTMENTS - 99.0% (Cost $134,503,290**) | | | | | | | 133,154,078 | |
| TOTAL CALL & PUT OPTIONS WRITTEN - 0.0% | | | | | | | (11,484 | ) |
| NET OTHER ASSETS AND LIABILITIES - 1.0% | | | | | | | 1,351,296 | |
| | | | | | | | |
| TOTAL NET ASSETS - 100.0% | | | | | | $ | 134,493,890 | |
| | | | | | | | |
| ** | | Aggregate cost for Federal tax purposes was $134,495,890. |
| (A) | | Security sold within terms of a private placement memorandum exempt from registration under section 144A of the Securities Act of1933, as amended, and may be sold only to dealers in that programor other “qualified institutional buyers.” |
| (B) | | Floating rate or variable rate note. Rate shown is as of December 31, 2018. |
| (C) | | Coupon rate may change based on changes of the underlying collateral or prepayments of principal. The coupon rate shown represents the rate at period end. |
| (D) | | Notes and bonds, issued by foreign entities, denominated in U.S. dollars. The aggregate of these securities is 1.9% of total net assets. |
| (E) | | Restricted. The aggregate cost of such securities is $6,617,614. The aggregate value is $6,610,529,representing 4.9% of net assets. |
| (F) | | 7-day yield. |
| IO | | Interest Only. |
| LIBOR | | London Interbank Offered Rate. |
| MTN | | Medium Term Note. |
| PLC | | Public Limited Company. |
| REMICS | | Real Estate Mortgage Investment Conduit. |
| Written Option Contracts Outstanding at December 31, 2018 |
| Description | | Exercise
Price | | Expiration
Date | | Number of
Contracts | | Notional
Amount | | Fair Value | | Premiums
Paid
(Received) | | Unrealized
Appreciation
(Depreciation) |
| |
| Call Options Written - 0.0% | | | | | | | | | | | | | | | | | | | | | | | | | | | | |
| U.S. Treasury Bond Futures | | $ | 147.00 | | | | 01/25/2019 | | | | (15 | ) | | | (15,000 | ) | | $ | (10,781 | ) | | $ | (8,627 | ) | | $ | (2,154 | ) |
| | | | | | | | | | | | | | | | | | | | | | | | | | |
Total Call Options Written | | | | | | | | | | | | | | | | | | $ | (10,781 | ) | | $ | (8,627 | ) | | $ | (2,154 | ) |
| | | | | | | | | | | | | | | | | | | | | | | | | | |
| | | | | | | | | | | | | | | | | | | | | | | | | | | | | |
| Put Options Written - 0.0% | | | | | | | | | | | | | | | | | | | | | | | | | | | | |
| U.S. Treasury Bond Futures | | $ | 139.00 | | | | 01/25/2019 | | | | (15 | ) | | | (15,000 | ) | | $ | (703 | ) | | $ | (4,174 | ) | | $ | 3,471 | |
| | | | | | | | | | | | | | | | | | | | | | | | | | |
Total Put Options Written | | | | | | | | | | | | | | | | | | $ | (703 | ) | | $ | (4,174 | ) | | $ | 3,471 | |
| | | | | | | | | | | | | | | | | | | | | | | | | | |
Total Options Written | | | | | | | | | | | | | | | | | | $ | (11,484 | ) | | $ | (12,801 | ) | | $ | 1,317 | |
| | | | | | | | | | | | | | | | | | | | | | | | | | |
| | | | | | | | | | | | | | | | | | | | | | | | | | | | | |
| Purchased Option Contracts Outstanding at December 31, 2018 |
| | | | | | | | | | | | | | | | | | | | | | | | | | | | | |
| Description | | Exercise
Price | | Expiration
Date | | Number of
Contracts | | Notional
Amount | | Fair Value | | Premiums
Paid
(Received) | | Unrealized
Appreciation
(Depreciation) |
| |
| Put Options Purchased - 0.0% | | | | | | | | | | | | | | | | | | | | | | | | | | | | |
| U.S. Treasury Bond Futures | | $ | 141.00 | | | | 01/25/2019 | | | | 15 | | | | 15,000 | | | $ | 1,406 | | | $ | 10,123 | | | $ | (8,717 | ) |
| | | | | | | | | | | | | | | | | | | | | | | | | | |
Total Put Options Purchased | | | | | | | | | | | | | | | | | | $ | 1,406 | | | $ | 10,123 | | | $ | (8,717 | ) |
| | | | | | | | | | | | | | | | | | | | | | | | | | |
See accompanying Notes to Financial Statements.
35
| Ultra Series Fund | December 31, 2018 |
| | |
| High Income Fund Portfolio of Investments |
| | | | Par Value | | | | Value (Note 2) | |
| | | | | | | |
| CORPORATE NOTES AND BONDS - 90.9% | | | | | | | | |
| | | | | | | | | |
| Communication Services - 4.6% | | | | | | | | |
| Altice Luxembourg S.A. (A) (B), 7.625%, 2/15/25 | | $ | 400,000 | | | $ | 299,000 | |
| CenturyLink Inc., 6.45%, 6/15/21 | | | 205,000 | | | | 204,487 | |
| Frontier Communications Corp. (A), 8.5%, 4/1/26 | | | 150,000 | | | | 131,250 | |
| Inmarsat Finance PLC (A) (B), 6.5%, 10/1/24 | | | 300,000 | | | | 280,500 | |
| Sprint Spectrum Co. LLC / Sprint Spectrum Co. II LLC / Sprint Spectrum Co. III LLC (A), 3.36%, 3/20/23 | | | 103,125 | | | | 101,836 | |
| | | | | | | | |
| | | | | | | | 1,017,073 | |
| | | | | | | | | |
| Consumer Discretionary - 20.3% | | | | | | | | |
| Cablevision Systems Corp., 5.875%, 9/15/22 | | | 250,000 | | | | 245,625 | |
| CCO Holdings LLC / CCO Holdings Capital Corp. (A), 5.125%, 5/1/23 | | | 350,000 | | | | 340,375 | |
| CCO Holdings LLC / CCO Holdings Capital Corp. (A), 5.875%, 4/1/24 | | | 200,000 | | | | 199,000 | |
| Deck Chassis Acquisition Inc. (A) (C), 10%, 6/15/23 | | | 100,000 | | | | 96,000 | |
| Diamond Resorts International Inc. (A) (C), 7.75%, 9/1/23 | | | 250,000 | | | | 240,000 | |
| DISH DBS Corp., 6.75%, 6/1/21 | | | 300,000 | | | | 296,910 | |
| GameStop Corp. (A), 6.75%, 3/15/21 | | | 335,000 | | | | 334,162 | |
| IRB Holding Corp. (A), 6.75%, 2/15/26 | | | 250,000 | | | | 218,750 | |
| Jack Ohio Finance LLC / Jack Ohio Finance 1 Corp. (A), 6.75%, 11/15/21 | | | 250,000 | | | | 252,500 | |
| Outfront Media Capital LLC / Outfront Media Capital Corp., 5.25%, 2/15/22 | | | 150,000 | | | | 149,250 | |
| Outfront Media Capital LLC / Outfront Media Capital Corp., 5.625%, 2/15/24 | | | 500,000 | | | | 492,500 | |
| Penske Automotive Group Inc., 5.75%, 10/1/22 | | | 250,000 | | | | 249,375 | |
| Scientific Games International Inc. (A), 5%, 10/15/25 | | | 325,000 | | | | 290,063 | |
| Service Corp. International/US, 5.375%, 5/15/24 | | | 300,000 | | | | 297,000 | |
| Sinclair Television Group Inc., 6.125%, 10/1/22 | | | 250,000 | | | | 251,875 | |
| Sirius XM Radio Inc. (A), 4.625%, 5/15/23 | | | 250,000 | | | | 239,375 | |
| Univision Communications Inc. (A), 5.125%, 5/15/23 | | | 325,000 | | | | 291,687 | |
| | | | | | | | |
| | | | | | | | 4,484,447 | |
| | | | | | | | | |
| Consumer Staples - 8.5% | | | | | | | | |
| Avon International Operations Inc. (A), 7.875%, 8/15/22 | | | 250,000 | | | | 246,250 | |
| B&G Foods Inc., 4.625%, 6/1/21 | | | 250,000 | | | | 243,750 | |
| Dean Foods Co. (A), 6.5%, 3/15/23 | | | 250,000 | | | | 200,000 | |
| First Quality Finance Co. Inc. (A), 4.625%, 5/15/21 | | | 400,000 | | | | 387,000 | |
| Pilgrim’s Pride Corp. (A), 5.75%, 3/15/25 | | | 350,000 | | | | 328,125 | |
| Post Holdings Inc. (A), 5.5%, 3/1/25 | | | 250,000 | | | | 239,953 | |
| Simmons Foods Inc. (A), 5.75%, 11/1/24 | | | 325,000 | | | | 230,750 | |
| | | | | | | | |
| | | | | | | | 1,875,828 | |
| | | | | | | | | |
| Energy - 10.7% | | | | | | | | |
| American Midstream Partners L.P. / American Midstream Finance Corp. (A), 9.5%, 12/15/21 | | | 375,000 | | | | 352,500 | |
| Berry Petroleum Co. LLC (A), 7%, 2/15/26 | | | 125,000 | | | | 112,500 | |
| Carrizo Oil & Gas Inc. (C), 6.25%, 4/15/23 | | | 375,000 | | | | 346,875 | |
| DCP Midstream Operating L.P., 5.375%, 7/15/25 | | | 125,000 | | | | 122,187 | |
| Jonah Energy LLC / Jonah Energy Finance Corp. (A), 7.25%, 10/15/25 | | | 375,000 | | | | 240,000 | |
| Murphy Oil USA Inc., 5.625%, 5/1/27 | | | 400,000 | | | | 384,000 | |
| Sunoco L.P. / Sunoco Finance Corp., Series WI, 4.875%, 1/15/23 | | | 250,000 | | | | 243,750 | |
| Unit Corp., 6.625%, 5/15/21 | | | 600,000 | | | | 546,000 | |
| | | | | | | | |
| | | | | | | | 2,347,812 | |
| | | | | | | | | |
| Financials - 8.4% | | | | | | | | |
| Acrisure LLC / Acrisure Finance Inc. (A), 7%, 11/15/25 | | | 250,000 | | | | 213,125 | |
| Donnelley Financial Solutions Inc., 8.25%, 10/15/24 | | | 250,000 | | | | 248,125 | |
| Equinix Inc., 5.875%, 1/15/26 | | | 400,000 | | | | 403,000 | |
| Jefferies Finance LLC / JFIN Co-Issuer Corp. (A), 7.25%, 8/15/24 | | | 250,000 | | | | 231,250 | |
| MPT Operating Partnership L.P. / MPT Finance Corp., 5%, 10/15/27 | | | 400,000 | | | | 365,750 | |
| Quicken Loans Inc. (A), 5.75%, 5/1/25 | | | 200,000 | | | | 187,000 | |
| Solera LLC / Solera Finance Inc. (A), 10.5%, 3/1/24 | | | 200,000 | | | | 213,000 | |
| | | | | | | | |
| | | | | | | | 1,861,250 | |
| | | | | | | | | |
| Health Care - 7.8% | | | | | | | | |
| Acadia Healthcare Co. Inc., 5.125%, 7/1/22 | | | 500,000 | | | | 477,500 | |
| Avantor Inc. (A), 6%, 10/1/24 | | | 200,000 | | | | 196,500 | |
| Bausch Health Cos. Inc. (A) (B), 5.625%, 12/1/21 | | | 311,000 | | | | 306,335 | |
| HCA Inc., 5.875%, 2/15/26 | | | 250,000 | | | | 248,750 | |
| Mallinckrodt International Finance S.A. / Mallinckrodt CB LLC (A) (B) (C), 4.875%, 4/15/20 | | | 500,000 | | | | 482,500 | |
| | | | | | | | |
| | | | | | | | 1,711,585 | |
See accompanying Notes to Financial Statements.
36
| Ultra Series Fund | December 31, 2018 |
| | |
| High Income Fund Portfolio of Investments - continued |
| | | | Par Value | | | | Value (Note 2) | |
| | | | | | | |
| CORPORATE NOTES AND BONDS - continued | | | | | | | | |
| | | | | | | | | |
| Industrials - 18.0% | | | | | | | | |
| ARD Finance S.A., 7.125% Cash, 7.875 PIK (B), 7.125%, 9/15/23 | | $ | 300,000 | | | $ | 269,250 | |
| Avis Budget Car Rental LLC / Avis Budget Finance Inc. (A) (C), 5.25%, 3/15/25 | | | 250,000 | | | | 216,250 | |
| Bombardier Inc. (A) (B), 8.75%, 12/1/21 | | | 250,000 | | | | 257,500 | |
| Covanta Holding Corp., 5.875%, 3/1/24 | | | 500,000 | | | | 470,000 | |
| DAE Funding LLC (A), 5%, 8/1/24 | | | 250,000 | | | | 241,875 | |
| DAE Funding LLC (A), 5.25%, 11/15/21 | | | 150,000 | | | | 147,563 | |
| GFL Environmental Inc. (A) (B), 5.375%, 3/1/23 | | | 250,000 | | | | 218,750 | |
| Griffon Corp., 5.25%, 3/1/22 | | | 300,000 | | | | 271,500 | |
| Herc Rentals Inc. (A), 7.5%, 6/1/22 | | | 210,000 | | | | 217,875 | |
| Mueller Industries Inc., 6%, 3/1/27 | | | 250,000 | | | | 232,500 | |
| Nielsen Finance LLC / Nielsen Finance Co. (A), 5%, 4/15/22 | | | 425,000 | | | | 405,875 | |
| Prime Security Services Borrower LLC / Prime Finance Inc. (A), 9.25%, 5/15/23 | | | 101,000 | | | | 104,156 | |
| Summit Materials LLC / Summit Materials Finance Corp., 8.5%, 4/15/22 | | | 250,000 | | | | 261,250 | |
| Tennant Co., 5.625%, 5/1/25 | | | 250,000 | | | | 235,625 | |
| TransDigm Inc., 6%, 7/15/22 | | | 250,000 | | | | 246,250 | |
| Waste Pro USA Inc. (A), 5.5%, 2/15/26 | | | 200,000 | | | | 184,000 | |
| | | | | | | | |
| | | | | | | | 3,980,219 | |
| | | | | | | | | |
| Information Technology - 0.5% | | | | | | | | |
| Match Group Inc. (A), 5%, 12/15/27 | | | 125,000 | | | | 114,688 | |
| | | | | | | | |
| | | | | | | | | |
| Materials - 5.1% | | | | | | | | |
| Berry Global Inc., 5.125%, 7/15/23 | | | 250,000 | | | | 247,263 | |
| Rayonier AM Products Inc. (A), 5.5%, 6/1/24 | | | 545,000 | | | | 480,962 | |
| Sealed Air Corp. (A), 5.125%, 12/1/24 | | | 400,000 | | | | 392,500 | |
| | | | | | | | |
| | | | | | | | 1,120,725 | |
| | | | | | | | | |
| Real Estate - 2.7% | | | | | | | | |
| Iron Mountain Inc., 5.75%, 8/15/24 | | | 400,000 | | | | 380,000 | |
| Iron Mountain Inc. (A), 4.875%, 9/15/27 | | | 250,000 | | | | 218,125 | |
| | | | | | | | |
| | | | | | | | 598,125 | |
| | | | | | | | | |
| Utilities - 4.3% | | | | | | | | |
| AES Corp., 5.5%, 4/15/25 | | | 415,000 | | | | 411,888 | |
| AmeriGas Partners L.P. / AmeriGas Finance Corp., 5.875%, 8/20/26 | | | 100,000 | | | | 91,250 | |
| Calpine Corp., 5.5%, 2/1/24 | | | 250,000 | | | | 228,750 | |
| NRG Energy Inc., 6.25%, 5/1/24 | | | 200,000 | | | | 203,000 | |
| | | | | | | | |
| | | | | | | | 934,888 | |
| | | | | | | | |
| | | | | | | | | |
Total Corporate Notes and Bonds | | | | | | | | |
(Cost $21,233,229) | | | | | | | 20,046,640 | |
| | | | | | | | | |
| SHORT-TERM INVESTMENTS - 12.7% | | | | | | | | |
| State Street Institutional U.S. Government Money Market Fund, 2.27%, Premier Class (D) | | | 1,761,809 | | | $ | 1,761,809 | |
| State Street Navigator Securities Lending Government Money Market Portfolio, 2.35% (D) (E) | | | 1,047,563 | | | | 1,047,563 | |
| | | | | | | | |
| | | | | | | | | |
Total Short-Term Investments | | | | | | | | |
(Cost $2,809,372) | | | | | | | 2,809,372 | |
| | | | | | | | |
| | | | | | | | | |
| TOTAL INVESTMENTS - 103.6% (Cost $24,042,601**) | | | | | | | 22,856,012 | |
| NET OTHER ASSETS AND LIABILITIES - (3.6%) | | | | | | | (785,399 | ) |
| | | | | | | | |
| TOTAL NET ASSETS - 100.0% | | | | | | $ | 22,070,613 | |
| | | | | | | | |
| ** | | Aggregate cost for Federal tax purposes was $24,042,601. |
| (A) | | Security sold within terms of a private placement memorandum exempt from registration under section 144A of the Securities Act of 1933, as amended, and may be sold only to dealers in that program or other “qualified institutional buyers.” |
| (B) | | Notes and bonds, issued by foreign entities, denominated in U.S. dollars. The aggregate of these securities is 9.6% of total net assets. |
| (C) | | All or a portion of these securities, with an aggregate fair value of $1,028,516, are on loan as part of a securities lending program. See footnote (E) and Note 8 for details on the securities lending program. |
| (D) | | 7-day yield. |
| (E) | | Represents investments of cash collateral received in connection with securities lending. |
| PIK | | Payment in Kind. |
| PLC | | Public Limited Company. |
See accompanying Notes to Financial Statements.
37
| Ultra Series Fund | December 31, 2018 |
| | |
| Diversified Income Fund Portfolio of Investments |
| | | | Shares | | | | Value (Note 2) | |
| | | | | | | | |
| COMMON STOCKS - 63.9% | | | | | | | | |
| | | | | | | | | |
| Communication Services - 4.6% | | | | | | | | |
| Comcast Corp., Class A | | | 139,000 | | | $ | 4,732,950 | |
| Verizon Communications Inc. | | | 108,500 | | | | 6,099,870 | |
| | | | | | | | |
| | | | | | | | 10,832,820 | |
| | | | | | | | | |
| Consumer Discretionary - 6.1% | | | | | | | | |
| Home Depot Inc./The | | | 16,500 | | | | 2,835,030 | |
| McDonald’s Corp. | | | 26,500 | | | | 4,705,605 | |
| Starbucks Corp. | | | 61,000 | | | | 3,928,400 | |
| TJX Cos. Inc./The | | | 63,000 | | | | 2,818,620 | |
| | | | | | | | |
| | | | | | | | 14,287,655 | |
| | | | | | | | | |
| Consumer Staples - 8.5% | | | | | | | | |
| Diageo PLC, ADR | | | 24,500 | | | | 3,474,100 | |
| Hershey Co./The | | | 24,500 | | | | 2,625,910 | |
| Nestle S.A., ADR | | | 46,000 | | | | 3,724,160 | |
| PepsiCo Inc. | | | 39,000 | | | | 4,308,720 | |
| Procter & Gamble Co./The | | | 62,000 | | | | 5,699,040 | |
| | | | | | | | |
| | | | | | | | 19,831,930 | |
| | | | | | | | | |
| Energy - 4.0% | | | | | | | | |
| Chevron Corp. | | | 38,000 | | | | 4,134,020 | |
| Exxon Mobil Corp. | | | 77,000 | | | | 5,250,630 | |
| | | | | | | | |
| | | | | | | | 9,384,650 | |
| | | | | | | | | |
| Financials - 9.0% | | | | | | | | |
| BlackRock Inc. | | | 4,500 | | | | 1,767,690 | |
| Chubb Ltd. | | | 15,500 | | | | 2,002,290 | |
| CME Group Inc. | | | 24,000 | | | | 4,514,880 | |
| Northern Trust Corp. | | | 20,000 | | | | 1,671,800 | |
| Travelers Cos. Inc./The | | | 24,500 | | | | 2,933,875 | |
| US Bancorp | | | 89,000 | | | | 4,067,300 | |
| Wells Fargo & Co. | | | 91,000 | | | | 4,193,280 | |
| | | | | | | | |
| | | | | | | | 21,151,115 | |
| | | | | | | | | |
| Health Care - 13.0% | | | | | | | | |
| Amgen Inc. | | | 15,000 | | | | 2,920,050 | |
| Johnson & Johnson | | | 46,000 | | | | 5,936,300 | |
| Medtronic PLC | | | 70,000 | | | | 6,367,200 | |
| Merck & Co. Inc. | | | 77,000 | | | | 5,883,570 | |
| Novartis AG, ADR | | | 43,000 | | | | 3,689,830 | |
| Pfizer Inc. | | | 127,500 | | | | 5,565,375 | |
| | | | | | | | |
| | | | | | | | 30,362,325 | |
| | | | | | | | | |
| Industrials - 7.3% | | | | | | | | |
| 3M Co. | | | 13,000 | | | | 2,477,020 | |
| Emerson Electric Co. | | | 32,000 | | | | 1,912,000 | |
| Fastenal Co. | | | 72,500 | | | | 3,791,025 | |
| Union Pacific Corp. | | | 18,500 | | | | 2,557,255 | |
| United Parcel Service Inc., Class B | | | 37,000 | | | | 3,608,610 | |
| United Technologies Corp. | | | 26,500 | | | | 2,821,720 | |
| | | | | | | | |
| | | | | | | | 17,167,630 | |
| | | | | | | | | |
| Information Technology - 7.2% | | | | | | | | |
| Accenture PLC, Class A | | | 13,500 | | | | 1,903,635 | |
| Analog Devices Inc. | | | 23,000 | | | | 1,974,090 | |
| Automatic Data Processing Inc. | | | 14,000 | | | | 1,835,680 | |
| Cisco Systems Inc. | | | 102,500 | | | | 4,441,325 | |
| Microsoft Corp. | | | 32,000 | | | | 3,250,240 | |
| Paychex Inc. | | | 28,000 | | | | 1,824,200 | |
| Texas Instruments Inc. | | | 17,000 | | | | 1,606,500 | |
| | | | | | | | |
| | | | | | | | 16,835,670 | |
| | | | | | | | | |
| Materials - 1.7% | | | | | | | | |
| Linde PLC | | | 26,000 | | | | 4,057,040 | |
| | | | | | | | |
| | | | | | | | | |
| Utilities - 2.5% | | | | | | | | |
| Dominion Energy Inc. | | | 35,000 | | | | 2,501,100 | |
| NextEra Energy Inc. | | | 19,000 | | | | 3,302,580 | |
| | | | | | | | |
| | | | | | | | 5,803,680 | |
| | | | | | | | |
| | | | | | | | | |
Total Common Stocks | | | | | | | | |
(Cost $109,819,231) | | | | | | | 149,714,515 | |
| | | | | | | | | |
| | | | Par Value | | | | | |
| | | | | | | | | |
| ASSET BACKED SECURITIES - 1.7% | | | | | | | | |
| American Express Credit Account Master Trust, Series 2017-1, Class B, 2.1%, 9/15/22 | | $ | 250,000 | | | | 247,651 | |
| BMW Floorplan Master Owner Trust, Series 2018-1, Class A2, (1M LIBOR + 0.320%) (A) (B), 2.775%, 5/15/23 | | | 150,000 | | | | 150,000 | |
| CarMax Auto Owner Trust, Series 2015-2, Class A4, 1.8%, 3/15/21 | | | 460,908 | | | | 458,773 | |
| CarMax Auto Owner Trust, Series 2018-3, Class A3, 3.13%, 6/15/23 | | | 200,000 | | | | 200,764 | |
| Chesapeake Funding II LLC, Series 2018-3A, Class B (A), 3.62%, 1/15/31 | | | 100,000 | | | | 100,866 | |
| Chesapeake Funding II LLC, Series 2017-4A, Class A1 (A), 2.12%, 11/15/29 | | | 203,152 | | | | 200,950 | |
| Chesapeake Funding II LLC, Series 2018-1A, Class A1 (A), 3.04%, 4/15/30 | | | 368,707 | | | | 368,451 | |
| Chesapeake Funding II LLC, Series 2018-2A, Class A1 (A), 3.23%, 8/15/30 | | | 150,000 | | | | 150,678 | |
| Enterprise Fleet Financing LLC, Series 2017-2, Class A2 (A), 1.97%, 1/20/23 | | | 352,309 | | | | 349,583 | |
| Enterprise Fleet Financing LLC, Series 2017-3, Class A2 (A), 2.13%, 5/22/23 | | | 171,276 | | | | 169,761 | |
| John Deere Owner Trust, Series 2018-B, Class A3, 3.08%, 11/15/22 | | | 200,000 | | | | 200,977 | |
| Synchrony Credit Card Master Note Trust, Series 2017-1, Class B, 2.19%, 6/15/23 | | | 500,000 | | | | 493,491 | |
| Verizon Owner Trust, Series 2017-1A, Class A (A), 2.06%, 9/20/21 | | | 600,000 | | | | 595,526 | |
| Verizon Owner Trust, Series 2018-A, Class A1A, 3.23%, 4/20/23 | | | 390,000 | | | | 392,391 | |
| | | | | | | | |
| | | | | | | | | |
| Total Asset Backed Securities | | | | | | | | |
| (Cost $4,071,532) | | | | | | | 4,079,862 | |
See accompanying Notes to Financial Statements.
38
| Ultra Series Fund | December 31, 2018 |
| | |
| Diversified Income Fund Portfolio of Investments - continued |
| | | | Par Value | | | | Value (Note 2) | |
| | | | | | | |
| COLLATERALIZED MORTGAGE OBLIGATIONS - 1.2% | | | | | | | | |
| Fannie Mae REMICS, Series 2011-31, Class DB, 3.5%, 4/25/31 | | $ | 350,000 | | | $ | 357,959 | |
| Fannie Mae REMICS, Series 2011-36, Class QB, 4%, 5/25/31 | | | 481,000 | | | | 499,135 | |
| Fannie Mae REMICS, Series 2005-79, Class LT, 5.5%, 9/25/35 | | | 399,853 | | | | 437,510 | |
| Fannie Mae REMICS, Series 2011-101, Class NC, 2.5%, 4/25/40 | | | 369,611 | | | | 367,189 | |
| Fannie Mae REMICS, Series 2016-21, Class BA, 3%, 3/25/42 | | | 371,003 | | | | 371,925 | |
| Freddie Mac REMICS, Series 3825, Class CB, 3.5%, 3/15/26 | | | 400,000 | | | | 409,199 | |
| Freddie Mac REMICS, Series 4037, Class B, 3%, 4/15/27 | | | 450,000 | | | | 442,910 | |
| | | | | | | | |
| | | | | | | | | |
Total Collateralized Mortgage
Obligations (Cost $2,984,668) | | | | | | | 2,885,827 | |
| | | | | | | | | |
| COMMERCIAL MORTGAGE-BACKED SECURITIES - 0.7% | | | | | | | | |
| Fannie Mae-Aces, Series 2016-M2, Class X2, IO (B) (C), 1.097%, 1/25/23 | | | 7,240,282 | | | | 242,671 | |
| FHLMC Multifamily Structured Pass Through Certificates, Series KJ17, Class A2, 2.982%, 11/25/25 | | | 200,000 | | | | 197,932 | |
| FHLMC Multifamily Structured Pass Through Certificates, Series K066, Class A2, 3.117%, 6/25/27 | | | 225,000 | | | | 222,434 | |
| FREMF Mortgage Trust, Series 2012-K708, Class B (A) (B) (C), 3.718%, 2/25/45 | | | 700,000 | | | | 698,358 | |
| FREMF Mortgage Trust, Series 2015-K721, Class B (A) (B) (C), 3.565%, 11/25/47 | | | 300,000 | | | | 299,358 | |
| | | | | | | | |
| | | | | | | | | |
Total Commercial Mortgage-Backed Securities
(Cost $1,710,506) | | | | | | | 1,660,753 | |
| | | | | | | | | |
| CORPORATE NOTES AND BONDS - 11.5% | | | | | | | | |
| | | | | | | | | |
| Communication Services - 0.5% | | | | | | | | |
| AT&T Inc., 4.75%, 5/15/46 | | | 500,000 | | | | 443,947 | |
| Comcast Corp., 4.15%, 10/15/28 | | | 275,000 | | | | 279,244 | |
| Verizon Communications Inc., 4.329%, 9/21/28 | | | 559,000 | | | | 561,297 | |
| | | | | | | | |
| | | | | | | | 1,284,488 | |
| | | | | | | | | |
| Consumer Discretionary - 1.6% | | | | | | | | |
| CCO Holdings LLC / CCO Holdings Capital Corp. (A), 5.875%, 5/1/27 | | | 325,000 | | | | 315,250 | |
| Charter Communications Operating LLC / Charter Communications Operating Capital Corp., 4.464%, 7/23/22 | | | 300,000 | | | | 302,882 | |
| Discovery Communications LLC, 5%, 9/20/37 | | | 300,000 | | | | 278,272 | |
| DISH DBS Corp., 6.75%, 6/1/21 | | | 150,000 | | | | 148,455 | |
| ERAC USA Finance LLC (A), 6.7%, 6/1/34 | | | 225,000 | | | | 267,254 | |
| GameStop Corp. (A), 6.75%, 3/15/21 | | | 200,000 | | | | 199,500 | |
| General Motors Financial Co. Inc., 3.2%, 7/6/21 | | | 150,000 | | | | 146,521 | |
| GLP Capital L.P. / GLP Financing II Inc., 4.875%, 11/1/20 | | | 450,000 | | | | 453,825 | |
| Lennar Corp., 4.75%, 4/1/21 | | | 350,000 | | | | 346,937 | |
| Marriott International Inc., 3.125%, 6/15/26 | | | 400,000 | | | | 363,222 | |
| Omnicom Group Inc. / Omnicom Capital Inc., 3.6%, 4/15/26 | | | 650,000 | | | | 622,094 | |
| Walgreens Boots Alliance Inc., 3.45%, 6/1/26 | | | 350,000 | | | | 329,311 | |
| | | | | | | | |
| | | | | | | | 3,773,523 | |
| | | | | | | | | |
| Consumer Staples - 0.6% | | | | | | | | |
| Anheuser-Busch Cos. LLC / Anheuser-Busch InBev Worldwide Inc. (A), 4.9%, 2/1/46 | | | 500,000 | | | | 463,693 | |
| Bunge Ltd. Finance Corp., 3.25%, 8/15/26 | | | 600,000 | | | | 525,703 | |
| Conagra Brands Inc., 5.4%, 11/1/48 | | | 200,000 | | | | 184,194 | |
| Tyson Foods Inc., 3.55%, 6/2/27 | | | 150,000 | | | | 139,791 | |
| | | | | | | | |
| | | | | | | | 1,313,381 | |
| | | | | | | | | |
| Energy - 1.8% | | | | | | | | |
| Antero Resources Corp., 5.625%, 6/1/23 | | | 200,000 | | | | 190,000 | |
| Enterprise Products Operating LLC, 3.75%, 2/15/25 | | | 400,000 | | | | 395,783 | |
| Exxon Mobil Corp., 4.114%, 3/1/46 | | | 500,000 | | | | 507,575 | |
| Jonah Energy LLC / Jonah Energy Finance Corp. (A), 7.25%, 10/15/25 | | | 175,000 | | | | 112,000 | |
| Kinder Morgan Inc., 5.55%, 6/1/45 | | | 500,000 | | | | 495,185 | |
| Marathon Oil Corp., 2.7%, 6/1/20 | | | 500,000 | | | | 492,612 | |
| MPLX L.P., 4.8%, 2/15/29 | | | 150,000 | | | | 149,631 | |
| Phillips 66, 4.65%, 11/15/34 | | | 500,000 | | | | 487,006 | |
| Schlumberger Holdings Corp. (A), 4%, 12/21/25 | | | 400,000 | | | | 394,816 | |
| Unit Corp., 6.625%, 5/15/21 | | | 200,000 | | | | 182,000 | |
| Valero Energy Corp., 6.625%, 6/15/37 | | | 500,000 | | | | 547,818 | |
| Valero Energy Partners L.P., 4.5%, 3/15/28 | | | 350,000 | | | | 342,706 | |
| | | | | | | | |
| | | | | | | | 4,297,132 | |
| | | | | | | | | |
| Financials - 3.3% | | | | | | | | |
| Air Lease Corp., 3.75%, 2/1/22 | | | 500,000 | | | | 494,777 | |
| Air Lease Corp., 3.625%, 4/1/27 | | | 500,000 | | | | 447,191 | |
| American Express Co., 2.5%, 8/1/22 | | | 150,000 | | | | 144,777 | |
| American Express Co., 4.2%, 11/6/25 | | | 250,000 | | | | 254,846 | |
| Bank of America Corp., MTN, 2.503%, 10/21/22 | | | 400,000 | | | | 385,132 | |
| Bank of America Corp., MTN, (3M USD LIBOR + 0.930%) (B), 2.816%, 7/21/23 | | | 250,000 | | | | 241,818 | |
| Bank of America Corp., MTN, (3M USD LIBOR + 1.090%) (B), 3.093%, 10/1/25 | | | 200,000 | | | | 189,638 | |
See accompanying Notes to Financial Statements.
39
| Ultra Series Fund | December 31, 2018 |
| | |
| Diversified Income Fund Portfolio of Investments - continued |
| | | | Par Value | | | | Value (Note 2) | |
| | | | | | | |
| CORPORATE NOTES AND BONDS - continued | | | | | | | | |
| | | | | | | | | |
| Financials - continued | | | | | | | | |
| Bank of New York Mellon Corp./The, MTN, 2.2%, 8/16/23 | | $ | 500,000 | | | $ | 474,769 | |
| Berkshire Hathaway Inc., 3.125%, 3/15/26 | | | 250,000 | | | | 242,310 | |
| Capital One Financial Corp., 3.3%, 10/30/24 | | | 400,000 | | | | 378,299 | |
| Cboe Global Markets Inc., 3.65%, 1/12/27 | | | 400,000 | | | | 389,309 | |
| Fifth Third Bank, 3.35%, 7/26/21 | | | 250,000 | | | | 250,504 | |
| Goldman Sachs Group Inc./The(3M USD LIBOR + 1.201%) (B), 3.272%, 9/29/25 | | | 750,000 | | | | 703,029 | |
| JPMorgan Chase & Co., 2.972%, 1/15/23 | | | 500,000 | | | | 487,489 | |
| JPMorgan Chase & Co., 2.95%, 10/1/26 | | | 400,000 | | | | 369,411 | |
| Morgan Stanley, MTN, 3.875%, 1/27/26 | | | 200,000 | | | | 195,074 | |
| Morgan Stanley, 4.3%, 1/27/45 | | | 500,000 | | | | 467,672 | |
| Nasdaq Inc., 3.85%, 6/30/26 | | | 75,000 | | | | 72,428 | |
| Old Republic International Corp., 3.875%, 8/26/26 | | | 450,000 | | | | 429,696 | |
| Regions Financial Corp., 3.2%, 2/8/21 | | | 500,000 | | | | 496,802 | |
| Regions Financial Corp., 2.75%, 8/14/22 | | | 250,000 | | | | 241,195 | |
| Synchrony Financial, 3.75%, 8/15/21 | | | 50,000 | | | | 48,660 | |
| Synchrony Financial, 3.7%, 8/4/26 | | | 400,000 | | | | 339,297 | |
| | | | | | | | |
| | | | | | | | 7,744,123 | |
| | | | | | | | | |
| Health Care - 1.2% | | | | | | | | |
| AbbVie Inc., 3.75%, 11/14/23 | | | 225,000 | | | | 223,863 | |
| Cigna Corp. (A), 4.375%, 10/15/28 | | | 150,000 | | | | 150,837 | |
| Cigna Corp. (A), 4.9%, 12/15/48 | | | 100,000 | | | | 97,840 | |
| CVS Health Corp., 5.125%, 7/20/45 | | | 400,000 | | | | 389,364 | |
| Humana Inc., 2.5%, 12/15/20 | | | 300,000 | | | | 295,474 | |
| Shire Acquisitions Investments Ireland DAC (D), 1.9%, 9/23/19 | | | 750,000 | | | | 739,489 | |
| UnitedHealth Group Inc., 2.875%, 3/15/23 | | | 750,000 | | | | 738,820 | |
| Zoetis Inc., 3%, 9/12/27 | | | 225,000 | | | | 207,798 | |
| | | | | | | | |
| | | | | | | | 2,843,485 | |
| | | | | | | | | |
| Industrials - 0.4% | | | | | | | | |
| DAE Funding LLC (A), 5.25%, 11/15/21 | | | 100,000 | | | | 98,375 | |
| Masco Corp., 4.375%, 4/1/26 | | | 400,000 | | | | 400,045 | |
| Union Pacific Corp., 3.5%, 6/8/23 | | | 200,000 | | | | 200,380 | |
| United Rentals North America Inc., 4.625%, 7/15/23 | | | 300,000 | | | | 294,375 | |
| | | | | | | | |
| | | | | | | | 993,175 | |
| | | | | | | | | |
| Information Technology - 1.1% | | | | | | | | |
| Analog Devices Inc., 5.3%, 12/15/45 | | | 350,000 | | | | 368,179 | |
| Citrix Systems Inc., 4.5%, 12/1/27 | | | 85,000 | | | | 81,244 | |
| Dell International LLC / EMC Corp. (A), 8.35%, 7/15/46 | | | 175,000 | | | | 189,488 | |
| Fidelity National Information Services Inc., 3%, 8/15/26 | | | 450,000 | | | | 413,985 | |
| Intel Corp., 3.734%, 12/8/47 | | | 435,000 | | | | 402,775 | |
| Oracle Corp., 4%, 7/15/46 | | | 500,000 | | | | 466,543 | |
| Thomson Reuters Corp. (D), 4.3%, 11/23/23 | | | 600,000 | | | | 611,344 | |
| | | | | | | | |
| | | | | | | | 2,533,558 | |
| | | | | | | | | |
| Materials - 0.2% | | | | | | | | |
| DowDuPont Inc., 4.725%, 11/15/28 | | | 400,000 | | | | 412,961 | |
| | | | | | | | |
| | | | | | | | | |
| Real Estate - 0.8% | | | | | | | | |
| Brixmor Operating Partnership L.P., 3.65%, 6/15/24 | | | 500,000 | | | | 485,561 | |
| Iron Mountain Inc. (A), 4.875%, 9/15/27 | | | 300,000 | | | | 261,750 | |
| Store Capital Corp., 4.5%, 3/15/28 | | | 300,000 | | | | 289,838 | |
| Welltower Inc., 4.5%, 1/15/24 | | | 725,000 | | | | 743,466 | |
| | | | | | | | |
| | | | | | | | 1,780,615 | |
| | | | | | | | |
| | | | | | | | | |
Total Corporate Notes and Bonds | | | | | | | | |
(Cost $27,777,752) | | | | | | | 26,976,441 | |
| | | | | | | | | |
| LONG TERM MUNICIPAL BONDS - 2.3% | | | | | | | | |
| County of Pasco FL Water & Sewer Revenue, Series B, 6.76%, 10/1/39 | | | 1,000,000 | | | | 1,028,100 | |
| Los Angeles Department of Water & Power Revenue, 6.166%, 7/1/40 | | | 1,000,000 | | | | 1,045,350 | |
| Metropolitan Transportation Authority Revenue, 6.548%, 11/15/31 | | | 1,000,000 | | | | 1,231,270 | |
| New York City Transitional Finance Authority Future Tax Secured Revenue, 6.267%, 8/1/39 | | | 500,000 | | | | 509,080 | |
| Rancho Water District Financing Authority Revenue, (Prerefunded 8/1/20 @ $100), 6.337%, 8/1/40 | | | 5,000 | | | | 5,266 | |
| Rancho Water District Financing Authority Revenue, 6.337%, 8/1/40 | | | 620,000 | | | | 653,009 | |
| University of Massachusetts Building Authority Revenue, 6.573%, 5/1/39 | | | 1,000,000 | | | | 1,011,940 | |
| | | | | | | | |
| | | | | | | | | |
Total Long Term Municipal Bonds | | | | | | | | |
(Cost $5,535,030) | | | | | | | 5,484,015 | |
| | | | | | | | | |
| MORTGAGE BACKED SECURITIES - 8.3% | | | | | | | | |
| | | | | | | | | |
| Fannie Mae - 5.7% | | | | | | | | |
| 3%, 9/1/30 Pool # 890696 | | | 523,679 | | | | 524,028 | |
| 3%, 12/1/30 Pool # AL8924 | | | 372,508 | | | | 372,755 | |
| 7%, 11/1/31 Pool # 607515 | | | 22,754 | | | | 25,062 | |
| 3.5%, 12/1/31 Pool # MA0919 | | | 152,959 | | | | 155,801 | |
| 7%, 5/1/32 Pool # 644591 | | | 3,533 | | | | 3,609 | |
| 3.5%, 8/1/32 Pool # MA3098 | | | 199,821 | | | | 202,354 | |
| 5.5%, 10/1/33 Pool # 254904 | | | 130,355 | | | | 140,398 | |
| 5.5%, 11/1/33 Pool # 555880 | | | 321,297 | | | | 345,553 | |
| 5%, 5/1/34 Pool # 780890 | | | 424,434 | | | | 450,604 | |
| 7%, 7/1/34 Pool # 792636 | | | 17,338 | | | | 17,718 | |
| 4%, 2/1/35 Pool # MA2177 | | | 609,686 | | | | 632,520 | |
| 5%, 9/1/35 Pool # 820347 | | | 206,703 | | | | 221,227 | |
| 5%, 9/1/35 Pool # 835699 | | | 168,544 | | | | 179,867 | |
| 5%, 12/1/35 Pool # 850561 | | | 58,087 | | | | 61,672 | |
See accompanying Notes to Financial Statements.
40
| Ultra Series Fund | December 31, 2018 |
| | |
| Diversified Income Fund Portfolio of Investments - continued |
| | | | Par Value | | | | Value (Note 2) | |
| | | | | | | |
| MORTGAGE BACKED SECURITIES - continued | | | | | | | | |
| | | | | | | | | |
| Fannie Mae - continued | | | | | | | | |
| 5.5%, 9/1/36 Pool # 831820 | | $ | 314,165 | | | $ | 339,284 | |
| 5.5%, 10/1/36 Pool # 901723 | | | 128,077 | | | | 136,537 | |
| 5.5%, 12/1/36 Pool # 903059 | | | 229,720 | | | | 246,900 | |
| 4%, 1/1/41 Pool # AB2080 | | | 587,374 | | | | 603,968 | |
| 4.5%, 7/1/41 Pool # AB3274 | | | 163,680 | | | | 171,446 | |
| 5.5%, 7/1/41 Pool # AL6588 | | | 591,939 | | | | 639,249 | |
| 4%, 9/1/41 Pool # AJ1406 | | | 398,247 | | | | 409,470 | |
| 4%, 10/1/41 Pool # AJ4046 | | | 525,881 | | | | 540,740 | |
| 3.5%, 6/1/42 Pool # AO4136 | | | 539,148 | | | | 543,357 | |
| 3.5%, 6/1/42 Pool # AO4134 | | | 435,130 | | | | 438,519 | |
| 3.5%, 8/1/42 Pool # AP2133 | | | 546,678 | | | | 550,945 | |
| 4%, 10/1/42 Pool # AP7363 | | | 446,338 | | | | 458,915 | |
| 3%, 2/1/43 Pool # AB8486 | | | 896,707 | | | | 881,390 | |
| 3%, 2/1/43 Pool # AL3072 | | | 677,224 | | | | 666,208 | |
| 3.5%, 3/1/43 Pool # AT0310 | | | 428,062 | | | | 431,362 | |
| 4%, 1/1/45 Pool # AS4257 | | | 152,240 | | | | 155,957 | |
| 4.5%, 2/1/45 Pool # MA2193 | | | 466,126 | | | | 485,348 | |
| 3.5%, 4/1/45 Pool # MA2229 | | | 431,643 | | | | 433,253 | |
| 3.5%, 11/1/45 Pool # BA4907 | | | 551,945 | | | | 553,748 | |
| 3.5%, 12/1/45 Pool # AS6309 | | | 116,163 | | | | 116,536 | |
| 4%, 7/1/48 Pool # MA3415 | | | 726,528 | | | | 740,761 | |
| 3.5%, 1/1/49 Pool # MA3574 | | | 500,000 | | | | 500,053 | |
| | | | | | | | |
| | | | | | | | 13,377,114 | |
| | | | | | | | | |
| Freddie Mac - 2.6% | | | | | | | | |
| 4.5%, 2/1/25 Pool # J11722 | | | 89,417 | | | | 92,242 | |
| 4.5%, 5/1/25 Pool # J12247 | | | 78,126 | | | | 80,598 | |
| 8%, 6/1/30 Pool # C01005 | | | 9,083 | | | | 10,387 | |
| 6.5%, 1/1/32 Pool # C62333 | | | 75,366 | | | | 82,460 | |
| 3.5%, 11/1/40 Pool # G06168 | | | 274,455 | | | | 276,490 | |
| 4.5%, 9/1/41 Pool # Q03516 | | | 449,303 | | | | 470,449 | |
| 4%, 10/1/41 Pool # Q04092 | | | 614,401 | | | | 632,185 | |
| 3%, 9/1/42 Pool # C04233 | | | 1,020,879 | | | | 1,003,797 | |
| 3%, 4/1/43 Pool # V80025 | | | 717,128 | | | | 704,795 | |
| 3%, 4/1/43 Pool # V80026 | | | 704,357 | | | | 692,079 | |
| 3.5%, 8/1/45 Pool # Q35614 | | | 676,071 | | | | 678,989 | |
| 3%, 10/1/46 Pool # G60722 | | | 533,638 | | | | 520,984 | |
| 4%, 3/1/47 Pool # Q46801 | | | 652,146 | | | | 666,685 | |
| | | | | | | | |
| | | | | | | | 5,912,140 | |
| | | | | | | | | |
| Ginnie Mae - 0.0% | | | | | | | | |
| 6.5%, 4/20/31 Pool # 3068 | | | 26,753 | | | | 30,471 | |
| | | | | | | | |
| | | | | | | | | |
Total Mortgage Backed Securities | | | | | | | | |
(Cost $19,621,556) | | | | | | | 19,319,725 | |
| | | | | | | | | |
| U.S. GOVERNMENT AND AGENCY OBLIGATIONS - 6.5% | | | | | | | | |
| | | | | | | | | |
| Federal Farm Credit Bank - 0.2% | | | | | | | | |
| 3.470%, 5/7/24 | | | 500,000 | | | | 500,420 | |
| | | | | | | | |
| | | | | | | | | |
| Federal Home Loan Bank - 0.1% | | | | | | | | |
| 2.000%, 12/21/23 (E) | | | 350,000 | | | | 349,052 | |
| | | | | | | | |
| | | | | | | | | |
| U.S. Treasury Bonds - 2.2% | | | | | | | | |
| 6.625%, 2/15/27 | | | 1,100,000 | | | | 1,420,074 | |
| 3.000%, 5/15/42 | | | 1,000,000 | | | | 1,001,094 | |
| 2.500%, 2/15/45 | | | 750,000 | | | | 679,688 | |
| 2.500%, 5/15/46 | | | 750,000 | | | | 676,377 | |
| 2.250%, 8/15/46 | | | 750,000 | | | | 640,986 | |
| 3.000%, 5/15/47 | | | 400,000 | | | | 398,281 | |
| 3.000%, 2/15/48 | | | 300,000 | | | | 298,395 | |
| | | | | | | | |
| | | | | | | | 5,114,895 | |
| | | | | | | | | |
| U.S. Treasury Notes - 4.0% | | | | | | | | |
| 2.625%, 11/15/20 (F) | | | 1,500,000 | | | | 1,502,754 | |
| 2.000%, 11/15/21 | | | 1,000,000 | | | | 987,070 | |
| 2.000%, 2/15/22 | | | 1,250,000 | | | | 1,232,422 | |
| 1.750%, 5/15/22 | | | 1,750,000 | | | | 1,708,916 | |
| 2.500%, 8/15/23 | | | 2,150,000 | | | | 2,149,328 | |
| 2.125%, 3/31/24 | | | 1,000,000 | | | | 980,273 | |
| 2.875%, 5/15/28 | | | 750,000 | | | | 761,514 | |
| | | | | | | | |
| | | | | | | | 9,322,277 | |
| | | | | | | | |
| | | | | | | | | |
Total U.S. Government and Agency Obligations
(Cost $15,149,181) | | | | | | | 15,286,644 | |
| | | | Shares | | | | | |
| | | | | | | | |
| | | | | | | | | |
| SHORT-TERM INVESTMENTS - 3.8% | | | | | | | | |
| State Street Institutional U.S. Government Money Market Fund, 2.27%, Premier Class (G) | | | 8,799,622 | | | | 8,799,622 | |
| | | | | | | | |
| | | | | | | | | |
Total Short-Term Investments | | | | | | | | |
(Cost $8,799,622) | | | | | | | 8,799,622 | |
| | | | | | | | |
| | | | | | | | | |
| TOTAL INVESTMENTS - 99.9% (Cost $195,469,078**) | | | | | | | 234,207,404 | |
| NET OTHER ASSETS AND LIABILITIES - 0.1% | | | | | | | 138,845 | |
| | | | | | | | |
| TOTAL NET ASSETS - 100.0% | | | | | | $ | 234,346,249 | |
| | | | | | | | |
See accompanying Notes to Financial Statements.
41
| Ultra Series Fund | December 31, 2018 |
| | |
| Diversified Income Fund Portfolio of Investments - continued |
| ** | | Aggregate cost for Federal tax purposes was $196,165,096. |
| (A) | | Security sold within terms of a private placement memorandum exempt from registration under section 144A of the Securities Act of 1933, as amended, and may be sold only to dealers in that program or other “qualified institutional buyers.” |
| (B) | | Floating rate or variable rate note. Rate shown is as of December 31, 2018. |
| (C) | | Coupon rate may change based on changes of the underlying collateral or prepayments of principal. The coupon rate shown represents the rate at period end. |
| (D) | | Notes and bonds, issued by foreign entities, denominated in U.S. dollars. The aggregate of these securities is 0.6% of total net assets. |
| (E) | | Stepped rate security. Rate shown is as of December 31, 2018. |
| (F) | | Restricted. The aggregate cost of such securities is $1,482,987. The aggregate value is $1,502,754, representing 0.6% of net assets. |
| (G) | | 7-day yield. |
| ADR | | American Depositary Receipt. |
| DAC | | Designated Activity Company. |
| IO | | Interest Only. |
| LIBOR | | London Interbank Offered Rate. |
| MTN | | Medium Term Note. |
| PLC | | Public Limited Company. |
| REMICS | | Real Estate Mortgage Investment Conduit. |
See accompanying Notes to Financial Statements.
42
| Ultra Series Fund | December 31, 2018 |
| | |
| Large Cap Value Fund Portfolio of Investments |
| | | | Shares | | | | Value (Note 2) | |
| | | | | | | | |
| COMMON STOCKS - 95.8% | | | | | | | | |
| | | | | | | | | |
| Communication Services - 11.3% | | | | | | | | |
| CenturyLink Inc. | | | 635,000 | | | $ | 9,620,250 | |
| Discovery Inc., Class C * | | | 395,500 | | | | 9,128,140 | |
| Verizon Communications Inc. | | | 163,000 | | | | 9,163,860 | |
| | | | | | | | |
| | | | | | | | 27,912,250 | |
| | | | | | | | | |
| Consumer Staples - 9.0% | | | | | | | | |
| Archer-Daniels-Midland Co. | | | 269,000 | | | | 11,020,930 | |
| Procter & Gamble Co./The | | | 122,000 | | | | 11,214,240 | |
| | | | | | | | |
| | | | | | | | 22,235,170 | |
| | | | | | | | | |
| Energy - 7.5% | | | | | | | | |
| Chevron Corp. | | | 27,500 | | | | 2,991,725 | |
| EOG Resources Inc. | | | 132,000 | | | | 11,511,720 | |
| Murphy Oil Corp. | | | 173,000 | | | | 4,046,470 | |
| | | | | | | | |
| | | | | | | | 18,549,915 | |
| | | | | | | | | |
| Financials - 16.1% | | | | | | | | |
| American Express Co. | | | 52,000 | | | | 4,956,640 | |
| Aon PLC | | | 34,000 | | | | 4,942,240 | |
| Bank of America Corp. | | | 290,000 | | | | 7,145,600 | |
| Bank of New York Mellon Corp./The | | | 62,000 | | | | 2,918,340 | |
| JPMorgan Chase & Co. | | | 119,000 | | | | 11,616,780 | |
| US Bancorp | | | 183,000 | | | | 8,363,100 | |
| | | | | | | | |
| | | | | | | | 39,942,700 | |
| | | | | | | | | |
| Health Care - 18.7% | | | | | | | | |
| Baxter International Inc. | | | 175,000 | | | | 11,518,500 | |
| Eli Lilly & Co. | | | 128,000 | | | | 14,812,160 | |
| Humana Inc. | | | 22,500 | | | | 6,445,800 | |
| Medtronic PLC | | | 148,000 | | | | 13,462,080 | |
| | | | | | | | |
| | | | | | | | 46,238,540 | |
| | | | | | | | | |
| Industrials - 4.8% | | | | | | | | |
| Jacobs Engineering Group Inc. | | | 203,000 | | | | 11,867,380 | |
| | | | | | | | |
| | | | | | | | | |
| Information Technology - 2.4% | | | | | | | | |
| First Data Corp., Class A * | | | 348,000 | | | | 5,884,680 | |
| | | | | | | | |
| | | | | | | | | |
| Materials - 6.0% | | | | | | | | |
| Barrick Gold Corp. (A) | | | 340,000 | | | | 4,603,600 | |
| Cleveland-Cliffs Inc. * | | | 628,000 | | | | 4,829,320 | |
| Vale S.A., ADR | | | 407,000 | | | | 5,368,330 | |
| | | | | | | | |
| | | | | | | | 14,801,250 | |
| | | | | | | | | |
| Real Estate - 3.6% | | | | | | | | |
| Boston Properties Inc., REIT | | | 48,000 | | | | 5,402,400 | |
| Prologis Inc., REIT | | | 61,000 | | | | 3,581,920 | |
| | | | | | | | |
| | | | | | | | 8,984,320 | |
| | | | | | | | | |
| Utilities - 16.4% | | | | | | | | |
| AES Corp. | | | 1,085,000 | | | | 15,689,100 | |
| NRG Energy Inc. | | | 350,000 | | | | 13,860,000 | |
| Sempra Energy | | | 103,000 | | | | 11,143,570 | |
| | | | | | | | |
| | | | | | | | 40,692,670 | |
| | | | | | | | |
| | | | | | | | | |
Total Common Stocks | | | | | | | | |
(Cost $221,261,491) | | | | | | | 237,108,875 | |
| | | | | | | | | |
| SHORT-TERM INVESTMENTS - 5.8% | | | | | | | | |
| State Street Institutional U.S. Government Money Market Fund, 2.27%, Premier Class (B) | | | 10,160,127 | | | | 10,160,127 | |
| State Street Navigator Securities Lending Government Money Market Portfolio, 2.35% (B) (C) | | | 4,182,840 | | | | 4,182,840 | |
| | | | | | | | |
| | | | | | | | | |
Total Short-Term Investments | | | | | | | | |
(Cost $14,342,967) | | | | | | | 14,342,967 | |
| | | | | | | | |
| | | | | | | | | |
| TOTAL INVESTMENTS - 101.6% (Cost $235,604,458**) | | | | | | | 251,451,842 | |
| NET OTHER ASSETS AND LIABILITIES - (1.6%) | | | | | | | (3,925,906 | ) |
| | | | | | | | |
| TOTAL NET ASSETS - 100.0% | | | | | | $ | 247,525,936 | |
| | | | | | | | |
| * | | Non-income producing. |
| ** | | Aggregate cost for Federal tax purposes was $235,604,458. |
| (A) | | All or a portion of these securities, with an aggregate fair value of $4,195,234, are on loan as part of a securities lending program. See footnote (C) and Note 8 for details on the securities lending program. |
| (B) | | 7-day yield. |
| (C) | | Represents investments of cash collateral received in connection with securities lending. |
| ADR | | American Depositary Receipt. |
| PLC | | Public Limited Company. |
| REIT | | Real Estate Investment Trust. |
See accompanying Notes to Financial Statements.
43
| Ultra Series Fund | December 31, 2018 |
| | |
| Large Cap Growth Fund Portfolio of Investments |
| | | | Shares | | | | Value (Note 2) | |
| | | | | | | | |
| COMMON STOCKS - 97.9% | | | | | | | | |
| | | | | | | | | |
| Consumer Discretionary - 23.0% | | | | | | | | |
| Booking Holdings Inc. * | | | 3,062 | | | $ | 5,274,050 | |
| CarMax Inc. * | | | 105,377 | | | | 6,610,299 | |
| Dollar Tree Inc. * | | | 87,617 | | | | 7,913,568 | |
| Lowe’s Cos. Inc. | | | 84,330 | | | | 7,788,719 | |
| Omnicom Group Inc. | | | 64,139 | | | | 4,697,540 | |
| Starbucks Corp. | | | 110,881 | | | | 7,140,736 | |
| TJX Cos. Inc./The | | | 157,735 | | | | 7,057,064 | |
| | | | | | | | |
| | | | | | | | 46,481,976 | |
| | | | | | | | | |
| Financials - 14.9% | | | | | | | | |
| Berkshire Hathaway Inc., Class B * | | | 40,135 | | | | 8,194,764 | |
| Brookfield Asset Management Inc., Class A | | | 212,288 | | | | 8,141,245 | |
| Charles Schwab Corp./The | | | 101,095 | | | | 4,198,475 | |
| US Bancorp | | | 210,254 | | | | 9,608,608 | |
| | | | | | | | |
| | | | | | | | 30,143,092 | |
| | | | | | | | | |
| Health Care - 16.3% | | | | | | | | |
| Danaher Corp. | | | 72,180 | | | | 7,443,201 | |
| Henry Schein Inc. * | | | 102,417 | | | | 8,041,783 | |
| Johnson & Johnson | | | 35,416 | | | | 4,570,435 | |
| Novartis AG, ADR | | | 103,632 | | | | 8,892,662 | |
| Varian Medical Systems Inc. * | | | 35,632 | | | | 4,037,462 | |
| | | | | | | | |
| | | | | | | | 32,985,543 | |
| | | | | | | | | |
| Industrials - 9.7% | | | | | | | | |
| Copart Inc. * | | | 91,673 | | | | 4,380,136 | |
| Jacobs Engineering Group Inc. | | | 158,212 | | | | 9,249,074 | |
| PACCAR Inc. | | | 106,358 | | | | 6,077,296 | |
| | | | | | | | |
| | | | | | | | 19,706,506 | |
| | | | | | | | | |
| Information Technology - 21.5% | | | | | | | | |
| Accenture PLC, Class A | | | 26,821 | | | | 3,782,029 | |
| Alphabet Inc., Class C * | | | 8,014 | | | | 8,299,379 | |
| Analog Devices Inc. | | | 51,589 | | | | 4,427,884 | |
| CDW Corp. | | | 72,125 | | | | 5,845,731 | |
| Cognizant Technology Solutions Corp., Class A | | | 114,998 | | | | 7,300,073 | |
| TE Connectivity Ltd. | | | 100,529 | | | | 7,603,008 | |
| Visa Inc., Class A | | | 46,904 | | | | 6,188,514 | |
| | | | | | | | |
| | | | | | | | 43,446,618 | |
| | | | | | | | | |
| Materials - 8.4% | | | | | | | | |
| Linde PLC | | | 43,473 | | | | 6,783,527 | |
| PPG Industries Inc. | | | 99,846 | | | | 10,207,256 | |
| | | | | | | | |
| | | | | | | | 16,990,783 | |
| | | | | | | | | |
| Real Estate - 4.1% | | | | | | | | |
| American Tower Corp. | | | 52,109 | | | | 8,243,123 | |
| | | | | | | | |
| | | | | | | | | |
Total Common Stocks | | | | | | | | |
(Cost $165,217,797) | | | | | | | 197,997,641 | |
| | | | | | | | | |
| SHORT-TERM INVESTMENTS - 2.0% | | | | | | | | |
| State Street Institutional U.S. Government Money Market Fund, 2.27%, Premier Class (A) | | | 4,051,688 | | | | 4,051,688 | |
| | | | | | | | |
| | | | | | | | | |
Total Short-Term Investments | | | | | | | | |
(Cost $4,051,688) | | | | | | | 4,051,688 | |
| | | | | | | | |
| | | | | | | | | |
| TOTAL INVESTMENTS - 99.9% (Cost $169,269,485**) | | | | | | | 202,049,329 | |
| NET OTHER ASSETS AND LIABILITIES - 0.1% | | | | | | | 162,577 | |
| | | | | | | | |
| TOTAL NET ASSETS - 100.0% | | | | | | $ | 202,211,906 | |
| | | | | | | | |
| * | | Non-income producing. |
| ** | | Aggregate cost for Federal tax purposes was $169,464,255. |
| (A) | | 7-day yield. |
| ADR | | American Depositary Receipt. |
| PLC | | Public Limited Company. |
See accompanying Notes to Financial Statements.
44
| Ultra Series Fund | December 31, 2018 |
| | |
| Mid Cap Fund Portfolio of Investments |
| | | | Shares | | | | Value (Note 2) | |
| | | | | | | | |
| COMMON STOCKS - 95.8% | | | | | | | | |
| | | | | | | | | |
| Consumer Discretionary – 31.5% | | | | | | | | |
| | | | | | | | | |
| Household Durables - 2.6% | | | | | | | | |
| Mohawk Industries Inc. * | | | 35,660 | | | $ | 4,170,793 | |
| | | | | | | | |
| | | | | | | | | |
| Media - 9.6% | | | | | | | | |
| Liberty Broadband Corp., Class C * | | | 101,659 | | | | 7,322,498 | |
| Liberty Global PLC, Series C * | | | 140,778 | | | | 2,905,658 | |
| Omnicom Group Inc. | | | 69,276 | | | | 5,073,774 | |
| | | | | | | | |
| | | | | | | | 15,301,930 | |
| | | | | | | | | |
| Multiline Retail - 5.1% | | | | | | | | |
| Dollar Tree Inc. * | | | 91,119 | | | | 8,229,868 | |
| | | | | | | | |
| | | | | | | | | |
| Specialty Retail - 14.2% | | | | | | | | |
| CarMax Inc. * | | | 95,965 | | | | 6,019,885 | |
| Floor & Decor Holdings Inc., Class A * | | | 121,852 | | | | 3,155,967 | |
| O’Reilly Automotive Inc. * | | | 20,961 | | | | 7,217,501 | |
| Ross Stores Inc. | | | 40,691 | | | | 3,385,491 | |
| TJX Cos. Inc./The | | | 65,065 | | | | 2,911,008 | |
| | | | | | | | |
| | | | | | | | 22,689,852 | |
| | | | | | | | | |
| Consumer Staples - 0.9% | | | | | | | | |
| Brown-Forman Corp., Class B | | | 30,476 | | | | 1,450,048 | |
| | | | | | | | |
| | | | | | | | | |
| Financials - 23.1% | | | | | | | | |
| Arch Capital Group Ltd. * | | | 321,374 | | | | 8,587,113 | |
| Brookfield Asset Management Inc., Class A | | | 156,287 | | | | 5,993,607 | |
| Brown & Brown Inc. | | | 244,947 | | | | 6,750,739 | |
| Glacier Bancorp Inc. | | | 94,906 | | | | 3,760,176 | |
| Markel Corp. * | | | 7,338 | | | | 7,617,211 | |
| WR Berkley Corp. | | | 57,824 | | | | 4,273,772 | |
| | | | | | | | |
| | | | | | | | 36,982,618 | |
| | | | | | | | |
| | | | | | | | | |
| Health Care - 6.9% | | | | | | | | |
| Henry Schein Inc. * | | | 81,242 | | | | 6,379,122 | |
| Laboratory Corp. of America Holdings * | | | 36,373 | | | | 4,596,092 | |
| | | | | | | | |
| | | | | | | | 10,975,214 | |
| | | | | | | | | |
| Industrials - 13.7% | | | | | | | | |
| Copart Inc. * | | | 107,393 | | | | 5,131,238 | |
| Expeditors International of Washington Inc. | | | 96,585 | | | | 6,576,473 | |
| Fastenal Co. | | | 83,948 | | | | 4,389,641 | |
| IHS Markit Ltd. * | | | 120,388 | | | | 5,775,012 | |
| | | | | | | | |
| | | | | | | | 21,872,364 | |
| | | | | | | | | |
| Information Technology - 9.3% | | | | | | | | |
| Alliance Data Systems Corp. | | | 15,641 | | | | 2,347,401 | |
| Amphenol Corp., Class A | | | 55,644 | | | | 4,508,277 | |
| CDW Corp. | | | 64,367 | | | | 5,216,945 | |
| TE Connectivity Ltd. | | | 36,204 | | | | 2,738,109 | |
| | | | | | | | |
| | | | | | | | 14,810,732 | |
| | | | | | | | | |
| Materials - 7.5% | | | | | | | | |
| Axalta Coating Systems Ltd. * | | | 247,076 | | | | 5,786,520 | |
| Crown Holdings Inc. * | | | 80,183 | | | | 3,333,207 | |
| NewMarket Corp. | | | 7,160 | | | | 2,950,565 | |
| | | | | | | | |
| | | | | | | | 12,070,292 | |
| | | | | | | | | |
| Real Estate - 2.9% | | | | | | | | |
| Crown Castle International Corp. | | | 42,894 | | | | 4,659,575 | |
| | | | | | | | |
| | | | | | | | | |
Total Common Stocks | | | | | | | | |
(Cost $101,922,781) | | | | | | | 153,213,286 | |
| | | | | | | | | |
| SHORT-TERM INVESTMENTS - 4.4% | | | | | | | | |
| State Street Institutional U.S. Government Money Market Fund, 2.27%, Premier Class (A) | | | 7,069,223 | | | | 7,069,223 | |
| | | | | | | | |
| | | | | | | | | |
Total Short-Term Investments | | | | | | | | |
(Cost $7,069,223) | | | | | | | 7,069,223 | |
| | | | | | | | |
| | | | | | | | | |
| TOTAL INVESTMENTS - 100.2% (Cost $108,992,004**) | | | | | | | 160,282,509 | |
| NET OTHER ASSETS AND LIABILITIES - (0.2%) | | | | | | | (284,781 | ) |
| | | | | | | | |
| TOTAL NET ASSETS - 100.0% | | | | | | $ | 159,997,728 | |
| | | | | | | | |
| * | | Non-income producing. |
| ** | | Aggregate cost for Federal tax purposes was $109,108,522. |
| (A) | | 7-day yield. |
| PLC | | Public Limited Company. |
See accompanying Notes to Financial Statements.
45
| Ultra Series Fund | December 31, 2018 |
| | |
| International Stock Fund Portfolio of Investments |
| | | | Shares | | | | Value (Note 2) | |
| | | | | | | | |
| COMMON STOCKS - 93.2% | | | | | | | | |
| | | | | | | | | |
| Australia - 2.0% | | | | | | | | |
| BHP Group PLC | | | 28,617 | | | $ | 602,425 | |
| | | | | | | | |
| | | | | | | | | |
| Belgium - 1.8% | | | | | | | | |
| Anheuser-Busch InBev S.A. | | | 8,047 | | | | 531,985 | |
| | | | | | | | |
| | | | | | | | | |
| Canada - 6.1% | | | | | | | | |
| Canadian National Railway Co. | | | 4,271 | | | | 316,320 | |
| National Bank of Canada | | | 8,621 | | | | 353,946 | |
| Rogers Communications Inc., Class B | | | 11,600 | | | | 594,445 | |
| Suncor Energy Inc. | | | 21,468 | | | | 599,601 | |
| | | | | | | | |
| | | | | | | | 1,864,312 | |
| | | | | | | | | |
| Denmark - 1.4% | | | | | | | | |
| Carlsberg AS, Class B (A) | | | 4,032 | | | | 428,959 | |
| | | | | | | | |
| | | | | | | | | |
| Finland - 2.9% | | | | | | | | |
| Nordea Bank Abp (A) | | | 50,765 | | | | 428,155 | |
| Sampo Oyj, Class A (A) | | | 10,244 | | | | 450,338 | |
| | | | | | | | |
| | | | | | | | 878,493 | |
| | | | | | | | | |
| France - 11.2% | | | | | | | | |
| Air Liquide S.A. | | | 3,801 | | | | 472,299 | |
| Capgemini SE | | | 4,467 | | | | 444,248 | |
| Cie de Saint-Gobain | | | 7,837 | | | | 261,880 | |
| Cie Generale des Etablissements Michelin | | | 2,775 | | | | 275,659 | |
| Safran S.A. | | | 5,435 | | | | 656,341 | |
| Societe Generale S.A. | | | 8,150 | | | | 259,779 | |
| Vinci S.A. | | | 5,804 | | | | 478,928 | |
| Vivendi S.A. | | | 22,563 | | | | 550,121 | |
| | | | | | | | |
| | | | | | | | 3,399,255 | |
| | | | | | | | | |
| Germany - 3.7% | | | | | | | | |
| Fresenius SE & Co. KGaA (A) | | | 4,517 | | | | 218,341 | |
| SAP SE (A) | | | 9,089 | | | | 905,352 | |
| | | | | | | | |
| | | | | | | | 1,123,693 | |
| | | | | | | | | |
| Hong Kong - 0.9% | | | | | | | | |
| Techtronic Industries Co. Ltd. | | | 53,000 | | | | 281,566 | |
| | | | | | | | |
| | | | | | | | | |
| India - 1.4% | | | | | | | | |
| ICICI Bank Ltd., ADR | | | 41,792 | | | | 430,040 | |
| | | | | | | | |
| | | | | | | | | |
| Ireland - 4.2% | | | | | | | | |
| Medtronic PLC | | | 9,527 | | | | 866,576 | |
| Ryanair Holdings PLC, ADR * | | | 5,790 | | | | 413,059 | |
| | | | | | | | |
| | | | | | | | 1,279,635 | |
| | | | | | | | | |
| Israel - 0.8% | | | | | | | | |
| Bank Leumi Le-Israel BM | | | 38,667 | | | | 233,706 | |
| | | | | | | | |
| | | | | | | | | |
| Japan - 12.9% | | | | | | | | |
| Daiwa House Industry Co. Ltd. (A) | | | 25,435 | | | | 807,804 | |
| Don Quijote Holdings Co. Ltd. (A) | | | 8,900 | | | | 552,122 | |
| Kao Corp. (A) | | | 5,730 | | | | 422,450 | |
| Makita Corp. (A) | | | 11,600 | | | | 410,774 | |
| Nexon Co. Ltd. * (A) | | | 32,200 | | | | 411,343 | |
| Shin-Etsu Chemical Co. Ltd. (A) | | | 5,300 | | | | 408,316 | |
| Sumitomo Mitsui Financial Group Inc. (A) | | | 14,800 | | | | 488,057 | |
| Suzuki Motor Corp. (A) | | | 2,800 | | | | 141,681 | |
| Yamaha Corp. (A) | | | 6,500 | | | | 275,967 | |
| | | | | | | | |
| | | | | | | | 3,918,514 | |
| | | | | | | | | |
| Netherlands - 6.9% | | | | | | | | |
| ABN AMRO Group N.V. (B) | | | 15,025 | | | | 353,594 | |
| Koninklijke DSM N.V. | | | 2,702 | | | | 221,165 | |
| Royal Dutch Shell PLC, Class A | | | 35,169 | | | | 1,034,369 | |
| Wolters Kluwer N.V. | | | 8,084 | | | | 478,487 | |
| | | | | | | | |
| | | | | | | | 2,087,615 | |
| | | | | | | | | |
| Norway - 3.1% | | | | | | | | |
| Equinor ASA (A) | | | 16,504 | | | | 351,968 | |
| Telenor ASA (A) | | | 30,936 | | | | 597,185 | |
| | | | | | | | |
| | | | | | | | 949,153 | |
| | | | | | | | | |
| Singapore - 2.7% | | | | | | | | |
| DBS Group Holdings Ltd. | | | 32,990 | | | | 573,413 | |
| NetLink NBN Trust | | | 428,500 | | | | 240,509 | |
| | | | | | | | |
| | | | | | | | 813,922 | |
| | | | | | | | | |
| South Korea - 0.7% | | | | | | | | |
| Samsung Electronics Co. Ltd. (A) | | | 6,218 | | | | 215,147 | |
| | | | | | | | |
| | | | | | | | | |
| Spain - 1.8% | | | | | | | | |
| Red Electrica Corp. S.A. | | | 24,370 | | | | 544,338 | |
| | | | | | | | |
| | | | | | | | | |
| Sweden - 3.4% | | | | | | | | |
| Assa Abloy AB, Class B (A) | | | 33,394 | | | | 597,061 | |
| Epiroc AB, Class A * (A) | | | 43,981 | | | | 417,685 | |
| | | | | | | | |
| | | | | | | | 1,014,746 | |
| | | | | | | | | |
| Switzerland - 7.4% | | | | | | | | |
| Ferguson PLC | | | 11,005 | | | | 703,733 | |
| Julius Baer Group Ltd. * (A) | | | 7,735 | | | | 276,401 | |
| Novartis AG (A) | | | 14,875 | | | | 1,274,020 | |
| | | | | | | | |
| | | | | | | | 2,254,154 | |
See accompanying Notes to Financial Statements.
46
| Ultra Series Fund | December 31, 2018 |
| | |
| International Stock Fund Portfolio of Investments - continued |
| | | | Shares | | | | Value (Note 2) | |
| | | | | | | | |
| COMMON STOCKS - continued | | | | | | | | |
| United Kingdom - 17.9% | | | | | | | | |
| Aon PLC | | | 5,463 | | | $ | 794,102 | |
| Compass Group PLC | | | 34,185 | | | | 718,941 | |
| Diageo PLC | | | 10,368 | | | | 369,361 | |
| Howden Joinery Group PLC | | | 46,034 | | | | 255,588 | |
| Informa PLC | | | 43,243 | | | | 347,350 | |
| Melrose Industries PLC | | | 141,499 | | | | 295,511 | |
| Prudential PLC | | | 51,359 | | | | 917,780 | |
| RELX PLC | | | 36,644 | | | | 755,009 | |
| RSA Insurance Group PLC | | | 46,115 | | | | 301,885 | |
| Unilever PLC | | | 13,009 | | | | 681,241 | |
| | | | | | | | |
| | | | | | | | 5,436,768 | |
| | | | | | | | |
Total Common Stocks | | | | | | | | |
(Cost $27,785,523) | | | | | | | 28,288,426 | |
| | | | | | | | | |
| PREFERRED STOCK - 1.8% | | | | | | | | |
| | | | | | | | | |
| Germany - 1.8% | | | | | | | | |
| Volkswagen AG (A) | | | 3,560 | | | | 566,515 | |
| | | | | | | | |
| | | | | | | | | |
Total Preferred Stocks | | | | | | | | |
(Cost $677,642) | | | | | | | 566,515 | |
| | | | | | | | | |
| Short-Term Investments - 5.7% | | | | | | | | |
| | | | | | | | | |
| United States - 5.7% | | | | | | | | |
State Street Institutional U.S. Government
Money Market Fund, 2.27%, Premier Class (C) | | | 1,367,642 | | | | 1,367,642 | |
State Street Navigator Securities Lending
Government Money Market Portfolio, 2.35% (C) (D) | | | 352,127 | | | | 352,127 | |
| | | | | | | | |
| | | | | | | | 1,719,769 | |
| | | | | | | | |
Total Short-Term Investments | | | | | | | | |
(Cost $1,719,769) | | | | | | | 1,719,769 | |
| | | | | | | | |
| | | | | | | | | |
| TOTAL INVESTMENTS – 100.7% (Cost $30,182,934**) | | | | | | | 30,574,710 | |
| NET OTHER ASSETS AND LIABILITIES – (0.7%) | | | | | | | (226,138 | ) |
| | | | | | | | |
| TOTAL NET ASSETS – 100.0% | | | | | | $ | 30,348,572 | |
| | | | | | | | |
| * | | Non-income producing. |
| ** | | Aggregate cost for Federal tax purposes was $30,233,006. |
| (A) | | All or a portion of these securities, with an aggregate fair value of $336,518, are on loan as part of a securities lending program. See footnote (D) and Note 8 for details on the securities lending program. |
| (B) | | Security sold within terms of a private placement memorandum exempt from registration under section 144A of the Securities Act of 1933, as amended, and may be sold only to dealers in that program or other “qualified institutional investors.” The securities have been determined to be liquid under guidelines established by the Board of Trustees. |
| (C) | | 7-day yield. |
| (D) | | Represents investments of cash collateral received in connection with securities lending. |
| ADR | | American Depositary Receipt. |
| PLC | | Public Limited Company. |
| OTHER INFORMATION: | | | |
| Sector Allocation | | % of Net Assets |
| Communication Services | | 6.5 | % |
| Consumer Discretionary | | 14.4 | % |
| Consumer Staples | | 8.1 | % |
| Energy | | 6.5 | % |
| Financials | | 19.3 | % |
| Health Care | | 7.7 | % |
| Industrials | | 15.9 | % |
| Information Technology | | 6.6 | % |
| Materials | | 5.5 | % |
| Real Estate | | 2.7 | % |
| Short-Term Investments | | 5.7 | % |
| Utilities | | 1.8 | % |
| Net Other Assets and Liabilities | | (0.7 | )% |
See accompanying Notes to Financial Statements.
47
| Ultra Series Fund | December 31, 2018 |
| | |
| Madison Target Retirement 2020 Fund Portfolio of Investments |
| | | | Shares | | | | Value (Note 2) | |
| | | | | | | | |
| INVESTMENT COMPANIES - 96.2% | | | | | | | | |
| | | | | | | | | |
| Alternative Funds - 2.0% | | | | | | | | |
| Invesco Optimum Yield Diversified Commodity Strategy | | | 51,098 | | | $ | 770,047 | |
| | | | | | | | |
| | | | | | | | | |
| Bond Funds - 72.7% | | | | | | | | |
| iShares 20+ Year Treasury Bond ETF | | | 15,957 | | | | 1,938,935 | |
| Schwab Intermediate-Term U.S. Treasury ETF | | | 284,553 | | | | 15,067,081 | |
| Schwab U.S. TIPS ETF | | | 115,840 | | | | 6,168,480 | |
| Vanguard Long-Term Corporate Bond ETF | | | 2,265 | | | | 192,933 | |
| Vanguard Short-Term Corporate Bond ETF | | | 59,345 | | | | 4,625,349 | |
| | | | | | | | |
| | | | | | | | 27,992,778 | |
| | | | | | | | | |
| Foreign Stock Funds - 6.5% | | | | | | | | |
| iShares Edge MSCI Minimum Volatility EAFE ETF | | | 11,539 | | | | 769,190 | |
| iShares Edge MSCI Minimum Volatility Emerging Markets ETF | | | 10,311 | | | | 576,075 | |
| iShares MSCI Japan ETF | | | 7,545 | | | | 382,456 | |
| iShares MSCI United Kingdom ETF | | | 13,034 | | | | 382,548 | |
| SPDR S&P China ETF | | | 2,258 | | | | 191,501 | |
| Xtrackers MSCI EAFE Hedged Equity ETF | | | 6,878 | | | | 191,896 | |
| | | | | | | | |
| | | | | | | | 2,493,666 | |
| | | | | | | | | |
| Stock Funds - 15.0% | | | | | | | | |
| Energy Select Sector SPDR Fund | | | 3,345 | | | | 191,836 | |
| Invesco Dynamic Pharmaceuticals ETF | | | 3,103 | | | | 193,472 | |
| iShares Core S&P 500 ETF | | | 7,664 | | | | 1,928,339 | |
| iShares Core S&P Mid-Cap ETF | | | 1,167 | | | | 193,792 | |
| iShares Edge MSCI Minimum Volatility USA ETF | | | 3,690 | | | | 193,356 | |
| iShares Edge MSCI USA Quality Factor ETF | | | 5,030 | | | | 386,103 | |
| Schwab Fundamental U.S. Large Co. Index ETF | | | 22,729 | | | | 772,331 | |
| Schwab U.S. Dividend Equity ETF | | | 16,429 | | | | 771,670 | |
| Vanguard Growth ETF | | | 2,868 | | | | 385,259 | |
| Vanguard Information Technology ETF | | | 4,611 | | | | 769,254 | |
| | | | | | | | |
| | | | | | | | 5,785,412 | |
| | | | | | | | |
| TOTAL INVESTMENTS - 96.2% (Cost $37,117,011**) | | | | | | | 37,041,903 | |
| NET OTHER ASSETS AND LIABILITIES - 3.8% | | | | | | | 1,480,687 | |
| | | | | | | | |
| TOTAL NET ASSETS - 100.0% | | | | | | $ | 38,522,590 | |
| | | | | | | | |
| ** | | Aggregate cost for Federal tax purposes was $37,332,591. |
| ETF | | Exchange Traded Fund. |
| TIPS | | Treasury Inflation Protected Securities. |
| |
| Madison Target Retirement 2030 Fund Portfolio of Investments |
| | | | Shares | | | | Value (Note 2) | |
| | | | | | | | |
| INVESTMENT COMPANIES - 95.7% | | | | | | | | |
| | | | | | | | | |
| Alternative Funds - 3.0% | | | | | | | | |
| Invesco Optimum Yield Diversified Commodity Strategy | | | 124,001 | | | $ | 1,868,695 | |
| | | | | | | | |
| | | | | | | | | |
| Bond Funds - 42.9% | | | | | | | | |
| iShares 20+ Year Treasury Bond ETF | | | 25,816 | | | | 3,136,902 | |
| Schwab Intermediate-Term U.S. Treasury ETF | | | 247,885 | | | | 13,125,511 | |
| Schwab U.S. TIPS ETF | �� | | 93,704 | | | | 4,989,738 | |
| Vanguard Short-Term Corporate Bond ETF | | | 72,007 | | | | 5,612,225 | |
| | | | | | | | |
| | | | | | | | 26,864,376 | |
| | | | | | | | | |
| Foreign Stock Funds - 11.9% | | | | | | | | |
| iShares Edge MSCI Minimum Volatility EAFE ETF | | | 37,344 | | | | 2,489,351 | |
| iShares Edge MSCI Minimum Volatility Emerging Markets ETF | | | 44,435 | | | | 2,482,583 | |
| iShares MSCI United Kingdom ETF | | | 42,173 | | | | 1,237,778 | |
| SPDR S&P China ETF | | | 7,242 | | | | 614,194 | |
| Xtrackers MSCI EAFE Hedged Equity ETF | | | 22,356 | | | | 623,732 | |
| | | | | | | | |
| | | | | | | | 7,447,638 | |
| | | | | | | | | |
| Stock Funds - 37.9% | | | | | | | | |
| Energy Select Sector SPDR Fund | | | 10,822 | | | | 620,642 | |
| Invesco Dynamic Pharmaceuticals ETF | | | 10,039 | | | | 625,931 | |
| iShares Core S&P 500 ETF | | | 44,639 | | | | 11,231,619 | |
| iShares Core S&P Mid-Cap ETF | | | 7,553 | | | | 1,254,251 | |
| iShares Edge MSCI Minimum Volatility USA ETF | | | 17,908 | | | | 938,379 | |
| iShares Edge MSCI USA Quality Factor ETF | | | 16,276 | | | | 1,249,346 | |
| iShares MSCI Japan ETF | | | 36,620 | | | | 1,856,268 | |
| Schwab Fundamental U.S. Large Co. Index ETF | | | 36,771 | | | | 1,249,478 | |
| Schwab U.S. Dividend Equity ETF | | | 53,160 | | | | 2,496,925 | |
| Vanguard Growth ETF | | | 6,960 | | | | 934,937 | |
| Vanguard Information Technology ETF | | | 7,460 | | | | 1,244,553 | |
| | | | | | | | |
| | | | | | | | 23,702,329 | |
| | | | | | | | |
| TOTAL INVESTMENTS - 95.7% (Cost $61,429,242**) | | | | | | | 59,883,038 | |
| NET OTHER ASSETS AND LIABILITIES - 4.3% | | | | | | | 2,673,106 | |
| | | | | | | | |
| TOTAL NET ASSETS - 100.0% | | | | | | $ | 62,556,144 | |
| | | | | | | | |
| ** | | Aggregate cost for Federal tax purposes was $61,706,292. |
| ETF | | Exchange Traded Fund. |
| TIPS | | Treasury Inflation Protected Securities |
See accompanying Notes to Financial Statements.
48
| Ultra Series Fund | December 31, 2018 |
| | |
| Madison Target Retirement 2040 Fund Portfolio of Investments |
| | | | Shares | | | | Value (Note 2) | |
| | | | | | | | |
| INVESTMENT COMPANIES - 95.7% | | | | | | | | |
| | | | | | | | | |
| Alternative Funds - 3.5% | | | | | | | | |
| Invesco Optimum Yield Diversified Commodity Strategy | | | 88,823 | | | $ | 1,338,563 | |
| | | | | | | | |
| | | | | | | | | |
| Bond Funds - 33.0% | | | | | | | | |
| iShares 20+ Year Treasury Bond ETF | | | 12,681 | | | | 1,540,868 | |
| Schwab Intermediate-Term U.S. Treasury ETF | | | 123,207 | | | | 6,523,811 | |
| Schwab U.S. TIPS ETF | | | 43,150 | | | | 2,297,737 | |
| Vanguard Short-Term Corporate Bond ETF | | | 29,474 | | | | 2,297,204 | |
| | | | | | | | |
| | | | | | | | 12,659,620 | |
| | | | | | | | | |
| Foreign Stock Funds - 17.8% | | | | | | | | |
| iShares Edge MSCI Minimum Volatility EAFE ETF | | | 25,795 | | | | 1,719,495 | |
| iShares Edge MSCI Minimum Volatility Emerging Markets ETF | | | 34,141 | | | | 1,907,458 | |
| iShares MSCI Japan ETF | | | 26,231 | | | | 1,329,649 | |
| iShares MSCI United Kingdom ETF | | | 29,130 | | | | 854,965 | |
| SPDR S&P China ETF | | | 5,558 | | | | 471,374 | |
| Xtrackers MSCI EAFE Hedged Equity ETF | | | 20,511 | | | | 572,257 | |
| | | | | | | | |
| | | | | | | | 6,855,198 | |
| | | | | | | | | |
| Stock Funds - 41.4% | | | | | | | | |
| Energy Select Sector SPDR Fund | | | 8,305 | | | �� | 476,292 | |
| Invesco Dynamic Pharmaceuticals ETF | | | 9,245 | | | | 576,426 | |
| iShares Core S&P 500 ETF | | | 28,930 | | | | 7,279,077 | |
| iShares Core S&P Mid-Cap ETF | | | 5,797 | | | | 962,650 | |
| iShares Edge MSCI Minimum Volatility USA ETF | | | 12,828 | | | | 672,187 | |
| iShares Edge MSCI USA Quality Factor ETF | | | 14,990 | | | | 1,150,632 | |
| Schwab Fundamental U.S. Large Co. Index ETF | | | 28,221 | | | | 958,950 | |
| Schwab U.S. Dividend Equity ETF | | | 40,799 | | | | 1,916,329 | |
| Vanguard Growth ETF | | | 5,698 | | | | 765,412 | |
| Vanguard Information Technology ETF | | | 6,870 | | | | 1,146,122 | |
| | | | | | | | |
| | | | | | | | 15,904,077 | |
| | | | | | | | |
| TOTAL INVESTMENTS - 95.7% (Cost $38,005,716**) | | | | | | | 36,757,458 | |
| NET OTHER ASSETS AND LIABILITIES - 4.3% | | | | | | | 1,666,539 | |
| | | | | | | | |
| TOTAL NET ASSETS - 100.0% | | | | | | $ | 38,423,997 | |
| | | | | | | | |
| ** | | Aggregate cost for Federal tax purposes was $38,150,474. |
| ETF | | Exchange Traded Fund. |
| TIPS | | Treasury Inflation Protected Securities |
| |
| Madison Target Retirement 2050 Fund Portfolio of Investments |
| | | | Shares | | | | Value (Note 2) | |
| | | | | | | | |
| INVESTMENT COMPANIES - 95.5% | | | | | | | | |
| | | | | | | | | |
| Alternative Funds - 4.0% | | | | | | | | |
| Invesco Optimum Yield Diversified Commodity Strategy | | | 60,879 | | | $ | 917,447 | |
| | | | | | | | |
| | | | | | | | | |
| Bond Funds - 22.9% | | | | | | | | |
| iShares 20+ Year Treasury Bond ETF | | | 5,704 | | | | 693,093 | |
| Schwab Intermediate-Term U.S. Treasury ETF | | | 56,503 | | | | 2,991,834 | |
| Schwab U.S. TIPS ETF | | | 17,252 | | | | 918,669 | |
| Vanguard Short-Term Corporate Bond ETF | | | 8,838 | | | | 688,834 | |
| | | | | | | | |
| | | | | | | | 5,292,430 | |
| | | | | | | | | |
| Foreign Stock Funds - 20.8% | | | | | | | | |
| iShares Edge MSCI Minimum Volatility EAFE ETF | | | 17,188 | | | | 1,145,752 | |
| iShares Edge MSCI Minimum Volatility Emerging Markets ETF | | | 24,570 | | | | 1,372,726 | |
| iShares MSCI Japan ETF | | | 17,978 | | | | 911,305 | |
| iShares MSCI United Kingdom ETF | | | 19,411 | | | | 569,713 | |
| SPDR S&P China ETF | | | 4,000 | | | | 339,240 | |
| Xtrackers MSCI EAFE Hedged Equity ETF | | | 16,389 | | | | 457,253 | |
| | | | | | | | |
| | | | | | | | 4,795,989 | |
| Stock Funds - 47.8% | | | | | | | | |
| Energy Select Sector SPDR Fund | | | 5,977 | | | | 342,781 | |
| Invesco Dynamic Pharmaceuticals ETF | | | 7,393 | | | | 460,954 | |
| iShares Core S&P 500 ETF | | | 18,263 | | | | 4,595,154 | |
| iShares Core S&P Mid-Cap ETF | | | 4,172 | | | | 692,802 | |
| iShares Edge MSCI Minimum Volatility USA ETF | | | 8,792 | | | | 460,701 | |
| iShares Edge MSCI USA Quality Factor ETF | | | 11,986 | | | | 920,045 | |
| Schwab Fundamental U.S. Large Co. Index ETF | | | 20,309 | | | | 690,100 | |
| Schwab U.S. Dividend Equity ETF | | | 29,361 | | | | 1,379,086 | |
| Vanguard Growth ETF | | | 4,271 | | | | 573,723 | |
| Vanguard Information Technology ETF | | | 5,494 | | | | 916,563 | |
| | | | | | | | |
| | | | | | | | 11,031,909 | |
| | | | | | | | |
| TOTAL INVESTMENTS - 95.5% (Cost $22,967,556**) | | | | | | | 22,037,775 | |
| NET OTHER ASSETS AND LIABILITIES - 4.5% | | | | | | | 1,042,991 | |
| | | | | | | | |
| TOTAL NET ASSETS - 100.0% | | | | | | $ | 23,080,766 | |
| | | | | | | | |
| ** | | Aggregate cost for Federal tax purposes was $23,036,742. |
| ETF | | Exchange Traded Fund. |
| TIPS | | Treasury Inflation Protected Security. |
See accompanying Notes to Financial Statements.
49
This page was intentionally left blank.
50
Ultra Series Fund| December 31, 2018
| |
| Statements of Assets and Liabilities as of December 31, 2018 |
| | | Conservative
Allocation
Fund | | | Moderate
Allocation
Fund | | | Aggressive
Allocation
Fund | | | Core
Bond
Fund | | | High
Income
Fund |
| Assets: | | | | | | | | | | | | | | | | | | | | |
| Investments in unaffiliated securities, at fair value†§ | | $ | 67,406,721 | | | $ | 114,528,773 | | | $ | 39,850,810 | | | $ | 133,154,078 | | | $ | 22,856,012 | |
| Investments in affiliated securities, at fair value‡1 | | | 52,158,905 | | | | 88,701,197 | | | | 24,591,421 | | | | – | | | | – | |
| Cash | | | – | | | | – | | | | – | | | | 496,849 | | | | – | |
| Foreign currency (cost of $49) (Note 2) | | | – | | | | – | | | | – | | | | – | | | | – | |
| Receivables: | | | | | | | | | | | | | | | | | | | | |
| Investments sold | | | 807,868 | | | | – | | | | 571,464 | | | | – | | | | – | |
| Fund shares sold | | | 1,077,347 | | | | 170,260 | | | | 83,611 | | | | 35,682 | | | | 413 | |
| Dividends and Interest | | | 2,154 | | | | 3,862 | | | | 1,564 | | | | 987,823 | | | | 301,426 | |
| Due from Adviser | | | 10,128 | | | | 16,855 | | | | 5,455 | | | | – | | | | – | |
| Total assets | | | 121,463,123 | | | | 203,420,947 | | | | 65,104,325 | | | | 134,674,432 | | | | 23,157,851 | |
| Liabilities: | | | | | | | | | | | | | | | | | | | | |
| Payables: | | | | | | | | | | | | | | | | | | | | |
| Investments purchased | | | – | | | | – | | | | – | | | | – | | | | – | |
| Fund shares repurchased | | | 6,140 | | | | 3,118 | | | | 878 | | | | 82,363 | | | | 21,527 | |
| Upon return of securities loaned | | | 2,115,228 | | | | 7,249,267 | | | | 1,773,287 | | | | – | | | | 1,047,563 | |
| Management fees | | | 30,384 | | | | 50,566 | | | | 16,366 | | | | 62,737 | | | | 14,261 | |
| Audit and trustees fees | | | 16,338 | | | | 26,815 | | | | 9,430 | | | | 17,660 | | | | 2,894 | |
| Distribution fees - Class II | | | 4,815 | | | | 4,391 | | | | 329 | | | | 6,298 | | | | 993 | |
| Accrued expenses and other payables | | | – | | | | – | | | | – | | | | – | | | | – | |
| Options written, at value (premium received $12,801) (Note 6) | | | – | | | | – | | | | – | | | | 11,484 | | | | – | |
| Total liabilities | | | 2,172,905 | | | | 7,334,157 | | | | 1,800,290 | | | | 180,542 | | | | 1,087,238 | |
| Net assets applicable to outstanding capital stock. | | $ | 119,290,218 | | | $ | 196,086,790 | | | $ | 63,304,035 | | | $ | 134,493,890 | | | $ | 22,070,613 | |
| Net assets consist of: | | | | | | | | | | | | | | | | | | | | |
| Paid-in capital in excess of par. | | $ | 120,851,984 | | | $ | 195,656,648 | | | $ | 62,887,630 | | | $ | 135,757,210 | | | $ | 25,017,310 | |
| Accumulated distributable earnings (loss) | | | (1,561,766 | ) | | | 430,142 | | | | 416,405 | | | | (1,263,320 | ) | | | (2,946,697 | ) |
| Net Assets | | $ | 119,290,218 | | | $ | 196,086,790 | | | $ | 63,304,035 | | | $ | 134,493,890 | | | $ | 22,070,613 | |
| Class I Shares: | | | | | | | | | | | | | | | | | | | | |
| Net Assets | | $ | 96,763,420 | | | $ | 175,784,632 | | | $ | 61,777,475 | | | $ | 104,780,989 | | | $ | 17,466,077 | |
| Shares of beneficial interest outstanding | | | 10,505,958 | | | | 19,111,663 | | | | 7,753,937 | | | | 11,158,429 | | | | 2,207,005 | |
| Net Asset Valueand redemption price per share | | $ | 9.21 | | | $ | 9.20 | | | $ | 7.97 | | | $ | 9.39 | | | $ | 7.91 | |
| Class II Shares: | | | | | | | | | | | | | | | | | | | | |
| Net Assets | | $ | 22,526,798 | | | $ | 20,302,158 | | | $ | 1,526,560 | | | $ | 29,712,901 | | | $ | 4,604,536 | |
| Shares of beneficial interest outstanding | | | 2,443,141 | | | | 2,209,444 | | | | 192,233 | | | | 3,175,968 | | | | 581,303 | |
| Net Asset Valueand redemption price per share | | $ | 9.22 | | | $ | 9.19 | | | $ | 7.94 | | | $ | 9.36 | | | $ | 7.92 | |
| † Cost of Investments in unaffiliated securities | | $ | 70,055,733 | | | $ | 120,048,494 | | | $ | 42,080,315 | | | $ | 134,503,290 | | | $ | 24,042,601 | |
| ‡ Cost of investments in affiliated securities | | $ | 51,050,572 | | | $ | 83,299,313 | | | $ | 22,042,857 | | | | – | | | | – | |
| § Fair Value of securities on loan | | $ | 8,883,203 | | | $ | 16,766,405 | | | $ | 5,546,228 | | | | – | | | $ | 1,028,516 | |
1See Note 11 for information on affiliated issuers.
See accompanying Notes to Financial Statements.
Ultra Series Fund| December 31, 2018
| |
| Statements of Assets and Liabilities as of December 31, 2018 |
| | | | Diversified | | | | Large Cap | | | | Large Cap | | | | | | | | | |
| | | | Income | | | | Value | | | | Growth | | | | Mid Cap | | | | International | |
| | | | Fund | | | | Fund | | | | Fund | | | | Fund | | | | Stock Fund | |
| Assets: | | | | | | | | | | | | | | | | | | | | |
| Investments in unaffiliated securities, at fair value†§ | | $ | 234,207,404 | | | $ | 251,451,842 | | | $ | 202,049,329 | | | $ | 160,282,509 | | | $ | 30,574,710 | |
| Cash | | | – | | | | – | | | | – | | | | – | | | | – | |
| Foreign currency (cost of $49) (Note 2) | | | – | | | | – | | | | – | | | | – | | | | 49 | |
| Receivables: | | | | | | | | | | | | | | | | | | | | |
| Investments sold | | | – | | | | – | | | | – | | | | – | | | | 239 | |
| Fund shares sold | | | 7,383 | | | | 71,085 | | | | 13,080 | | | | 53,486 | | | | 52,477 | |
| Dividends and Interest | | | 939,414 | | | | 384,781 | | | | 465,769 | | | | 67,737 | | | | 153,944 | |
| Total assets | | | 235,154,201 | | | | 251,907,708 | | | | 202,528,178 | | | | 160,403,732 | | | | 30,781,419 | |
| Liabilities: | | | | | | | | | | | | | | | | | | | | |
| Payables: | | | | | | | | | | | | | | | | | | | | |
| Investments purchased | | | 498,757 | | | | – | | | | – | | | | 234,499 | | | | 29,721 | |
| Fund shares repurchased | | | 130,363 | | | | 28,323 | | | | 147,415 | | | | 20,320 | | | | 14,608 | |
| Upon return of securities loaned | | | – | | | | 4,182,840 | | | | – | | | | – | | | | 352,127 | |
| Management fees | | | 140,849 | | | | 130,846 | | | | 136,483 | | | | 124,038 | | | | 30,006 | |
| Audit and trustees fees | | | 30,927 | | | | 38,911 | | | | 28,637 | | | | 22,970 | | | | 4,400 | |
| Distribution fees - Class II | | | 7,056 | | | | 852 | | | | 3,737 | | | | 1,709 | | | | 1,985 | |
| Accrued expenses and other payables | | | – | | | | – | | | | – | | | | 2,468 | | | | – | |
| Total liabilities | | | 807,952 | | | | 4,381,772 | | | | 316,272 | | | | 406,004 | | | | 432,847 | |
| Net assets applicable to outstanding capital stock | | $ | 234,346,249 | | | $ | 247,525,936 | | | $ | 202,211,906 | | | $ | 159,997,728 | | | $ | 30,348,572 | |
| Net assets consist of: | | | | | | | | | | | | | | | | | | | | |
| Paid-in capital in excess of par. | | $ | 196,181,729 | | | $ | 231,678,552 | | | $ | 166,835,658 | | | $ | 108,123,313 | | | $ | 35,423,201 | |
| Accumulated distributable earnings (loss) | | | 38,164,520 | | | | 15,847,384 | | | | 35,376,248 | | | | 51,874,415 | | | | (5,074,629 | ) |
| Net Assets | | $ | 234,346,249 | | | $ | 247,525,936 | | | $ | 202,211,906 | | | $ | 159,997,728 | | | $ | 30,348,572 | |
| Class I Shares: | | | | | | | | | | | | | | | | | | | | |
| Net Assets | | $ | 201,421,291 | | | $ | 243,697,282 | | | $ | 184,507,479 | | | $ | 152,076,585 | | | $ | 21,129,710 | |
| Shares of beneficial interest outstanding | | | 11,668,736 | | | | 11,150,729 | | | | 10,731,120 | | | | 10,014,248 | | | | 2,126,810 | |
| Net Asset Valueand redemption price per share | | $ | 17.26 | | | $ | 21.85 | | | $ | 17.19 | | | $ | 15.19 | | | $ | 9.93 | |
| Class II Shares: | | | | | | | | | | | | | | | | | | | | |
| Net Assets | | $ | 32,924,958 | | | $ | 3,828,654 | | | $ | 17,704,427 | | | $ | 7,921,143 | | | $ | 9,218,862 | |
| Shares of beneficial interest outstanding | | | 1,923,202 | | | | 177,568 | | | | 1,050,732 | | | | 536,218 | | | | 933,147 | |
| Net Asset Valueand redemption price per share | | $ | 17.12 | | | $ | 21.56 | | | $ | 16.85 | | | $ | 14.77 | | | $ | 9.88 | |
| † Cost of Investments in unaffiliated securities | | $ | 195,469,078 | | | $ | 235,604,458 | | | $ | 169,269,485 | | | $ | 108,992,004 | | | $ | 30,182,934 | |
| ‡ Cost of investments in affiliated securities | | | – | | | | – | | | | – | | | | – | | | | – | |
| § Fair Value of securities on loan | | | – | | | $ | 4,195,234 | | | | – | | | | – | | | $ | 336,518 | |
See accompanying Notes to Financial Statements.
Ultra Series Fund| December 31, 2018
| |
| Statements of Assets and Liabilities as of December 31, 2018 |
| Madison | | Madison | | Madison | | Madison |
| Target | | Target | | Target | | Target |
| Retirement | | Retirement | | Retirement | | Retirement |
| 2020 Fund | | | 2030 Fund | | | 2040 Fund | | | 2050 Fund | |
$ | 37,041,903 | | | $ | 59,883,038 | | | $ | 36,757,458 | | | $ | 22,037,775 | |
| | 1,932,733 | | | | 2,564,373 | | | | 1,590,313 | | | | 1,008,357 | |
| | – | | | | – | | | | – | | | | – | |
| 1,851,866 | | | | 1,337,283 | | | | 699,998 | | | | 330,402 | |
| | – | | | | 187,870 | | | | 140,189 | | | | 126,808 | |
| | 2,756 | | | | 15,042 | | | | 9,819 | | | | 6,224 | |
| | 40,829,258 | | | | 63,987,606 | | | | 39,197,777 | | | | 23,509,566 | |
| 2,251,852 | | | | 1,415,230 | | | | 763,813 | | | | 422,846 | |
| | 44,972 | | | | – | | | | – | | | | – | |
| | – | | | | – | | | | – | | | | – | |
| | 8,204 | | | | 13,528 | | | | 8,306 | | | | 4,962 | |
| | 1,640 | | | | 2,704 | | | | 1,661 | | | | 992 | |
| | – | | | | – | | | | – | | | | – | |
| | – | | | | – | | | | – | | | | – | |
| | 2,306,668 | | | | 1,431,462 | | | | 773,780 | | | | 428,800 | |
| $ | 38,522,590 | | | $ | 62,556,144 | | | $ | 38,423,997 | | | $ | 23,080,766 | |
$ | 39,163,853 | | | $ | 63,229,516 | | | $ | 39,001,121 | | | $ | 21,972,566 | |
| | (641,263 | ) | | | (673,372 | ) | | | (577,124 | ) | | | 1,108,200 | |
| $ | 38,522,590 | | | $ | 62,556,144 | | | $ | 38,423,997 | | | $ | 23,080,766 | |
$ | 38,522,590 | | | $ | 62,556,144 | | | $ | 38,423,997 | | | $ | 23,080,766 | |
| | 5,221,609 | | | | 8,524,283 | | | | 5,770,770 | | | | 1,918,246 | |
| $ | 7.38 | | | $ | 7.34 | | | $ | 6.66 | | | $ | 12.03 | |
$ | 37,117,011 | | | $ | 61,429,242 | | | $ | 38,005,716 | | | $ | 22,967,556 | |
| | – | | | | – | | | | – | | | | – | |
| | – | | | | – | | | | – | | | | – | |
See accompanying Notes to Financial Statements.
Ultra Series Fund| December 31, 2018
| |
| Statements of Operations for the Year Ended December 31, 2018 |
| | | Conservative | | | Moderate | | | Aggressive | | | Core | | | High | |
| | | Allocation | | | Allocation | | | Allocation | | | Bond | | | Income | |
| | | Fund | | | Fund | | | Fund | | | Fund | | | Fund | |
| Investment Income: | | | | | | | | | | | | | | | | | | | | |
| Interest | | $ | 56,817 | | | $ | 96,683 | | | $ | 31,115 | | | $ | 4,846,937 | | | $ | 1,415,964 | |
| Dividends | | | | | | | | | | | | | | | | | | | | |
| Unaffiliated issuers | | | 1,839,173 | | | | 2,711,338 | | | | 889,072 | | | | – | | | | – | |
| Affiliated issuers1 | | | 1,272,079 | | | | 1,774,948 | | | | 429,793 | | | | – | | | | – | |
| Less: Foreign taxes withheld/reclaimed | | | – | | | | – | | | | – | | | | – | | | | – | |
| Income from securities lending | | | 34,469 | | | | 47,565 | | | | 24,881 | | | | 3,066 | | | | 18,270 | |
| Total investment income | | | 3,202,538 | | | | 4,630,534 | | | | 1,374,861 | | | | 4,850,003 | | | | 1,434,234 | |
| Expenses:2 | | | | | | | | | | | | | | | | | | | | |
| Management fees | | | 409,397 | | | | 672,663 | | | | 234,360 | | | | 814,576 | | | | 182,512 | |
| Services agreement fees | | | – | | | | – | | | | – | | | | – | | | | – | |
| Audit and trustee fees | | | 27,524 | | | | 45,174 | | | | 15,886 | | | | 29,752 | | | | 4,875 | |
| Distribution fees - Class II | | | 64,486 | | | | 58,486 | | | | 5,210 | | | | 79,965 | | | | 12,849 | |
| Other expenses | | | 3,273 | | | | 5,444 | | | | 1,718 | | | | 4,349 | | | | 610 | |
| Total expenses before reimbursement/waiver | | | 504,680 | | | | 781,767 | | | | 257,174 | | | | 928,642 | | | | 200,846 | |
| Less reimbursement/waiver2 | | | (136,466 | ) | | | (224,221 | ) | | | (78,120 | ) | | | – | | | | – | |
| Total expenses net of waiver | | | 368,214 | | | | 557,546 | | | | 179,054 | | | | 928,642 | | | | 200,846 | |
| Net Investment Income (Loss) | | | 2,834,324 | | | | 4,072,988 | | | | 1,195,807 | | | | 3,921,361 | | | | 1,233,388 | |
| Net Realized and Unrealized Gain (Loss) on Investments | | | | | | | | | | | | | | | | | | | | |
| Net realized gain (loss) on investments (including net realized | | | | | | | | | | | | | | | | | | | | |
| gain (loss) on foreign currency related transactions) | | | | | | | | | | | | | | | | | | | | |
| Options purchased | | | – | | | | – | | | | – | | | | (2,354 | ) | | | – | |
| Unaffiliated issuers | | | 2,904,641 | | | | 8,574,561 | | | | 4,160,181 | | | | 621,037 | | | | (119,514 | ) |
| Affiliated issuers1 | | | 1,148,155 | | | | 3,941,934 | | | | 2,609,281 | | | | – | | | | – | |
| Capital gain distributions received from underlying funds | | | | | | | | | | | | | | | | | | | | |
| Unaffiliated issuers | | | – | | | | – | | | | – | | | | – | | | | – | |
| Affiliated issuers1 | | | 2,122,747 | | | | 6,267,798 | | | | 2,273,000 | | | | – | | | | – | |
| Net change in unrealized appreciation (depreciation) on | | | | | | | | | | | | | | | | | | | | |
| investments (including net unrealized appreciation (depreciation) | | | | | | | | | | | | | | | | | | | | |
| on foreign currency related transactions) | | | | | | | | | | | | | | | | | | | | |
| Options purchased | | | – | | | | – | | | | – | | | | (8,717 | ) | | | – | |
| Options written | | | – | | | | – | | | | – | | | | 1,317 | | | | – | |
| Unaffiliated issuers | | | (7,212,551 | ) | | | (18,880,146 | ) | | | (8,843,182 | ) | | | (5,987,023 | ) | | | (1,885,926 | ) |
| Affiliated issuers1 | | | (5,039,194 | ) | | | (13,017,837 | ) | | | (5,573,294 | ) | | | – | | | | – | |
| Net Realized and Unrealized Loss on Investments | | | (6,076,202 | ) | | | (13,113,690 | ) | | | (5,374,014 | ) | | | (5,375,740 | ) | | | (2,005,440 | ) |
| Net Increase (Decrease) in Net Assets from Operations | | $ | (3,241,878 | ) | | $ | (9,040,702 | ) | | $ | (4,178,207 | ) | | $ | (1,454,379 | ) | | $ | (772,052 | ) |
*Effective November 20, 2018, Fund is not fund of fund of Goldman Sachs Portfolio (See Note 1).
1See Note 11 for information on affiliated issuers.
2See Note 3 for information on expenses.
See accompanying Notes to Financial Statements.
Ultra Series Fund| December 31, 2018
| |
| Statements of Operations for the Year Ended December 31, 2018 |
| | | | | | | | | | | Madison | | Madison | | Madison | | Madison |
| Diversified | | Large Cap | | Large Cap | | Mid | | International | | Target | | Target | | Target | | Target |
| Income | | Value | | Growth | | Cap | | Stock | | Retirement | | | Retirement | | | Retirement | | | Retirement | |
| Fund | | | Fund | | | Fund | | | Fund | | | Fund | | | 2020 Fund* | | | 2030 Fund* | | | 2040 Fund* | | | 2050 Fund* | |
$ | 2,955,049 | | | $ | 128,999 | | | $ | 150,858 | | | $ | 179,907 | | | $ | 16,943 | | | $ | – | | | $ | – | | | $ | – | | | $ | – | |
| | 4,603,323 | | | | 6,913,977 | | | | 3,526,687 | | | | 1,548,846 | | | | 1,094,147 | | | | 780,749 | | | | 1,370,428 | | | | 823,698 | | | | 459,441 | |
| – | | | | – | | | | – | | | | – | | | | – | | | | – | | | | – | | | | – | | | | – | |
| | (39,255 | ) | | | (82,401 | ) | | | (39,238 | ) | | | (16,052 | ) | | | (108,253 | ) | | | – | | | | – | | | | – | | | | – | |
| | 2,726 | | | | 3,245 | | | | 635 | | | | 584 | | | | 6,720 | | | | – | | | | – | | | | – | | | | – | |
| | 7,521,843 | | | | 6,963,820 | | | | 3,638,942 | | | | 1,713,285 | | | | 1,009,557 | | | | 780,749 | | | | 1,370,428 | | | | 823,698 | | | | 459,441 | |
| 1,820,418 | | | | 1,930,100 | | | | 1,909,542 | | | | 1,723,516 | | | | 420,305 | | | | 11,157 | | | | 18,491 | | | | 11,370 | | | | 6,779 | |
| | – | | | | – | | | | – | | | | – | | | | – | | | | 2,231 | | | | 3,698 | | | | 2,274 | | | | 1,356 | |
| | 52,100 | | | | 65,553 | | | | 48,244 | | | | 38,698 | | | | 7,412 | | | | – | | | | – | | | | – | | | | – | |
| | 93,281 | | | | 12,659 | | | | 52,708 | | | | 24,040 | | | | 28,819 | | | | – | | | | – | | | | – | | | | – | |
| | 6,761 | | | | 6,872 | | | | 5,472 | | | | 4,359 | | | | 838 | | | | 17 | | | | 7 | | | | – | | | | 21 | |
| | 1,972,560 | | | | 2,015,184 | | | | 2,015,966 | | | | 1,790,613 | | | | 457,374 | | | | 13,405 | | | | 22,196 | | | | 13,644 | | | | 8,156 | |
| | – | | | | – | | | | – | | | | – | | | | – | | | | – | | | | – | | | | – | | | | – | |
| | 1,972,560 | | | | 2,015,184 | | | | 2,015,966 | | | | 1,790,613 | | | | 457,374 | | | | 13,405 | | | | 22,196 | | | | 13,644 | | | | 8,156 | |
| | 5,549,283 | | | | 4,948,636 | | | | 1,622,976 | | | | (77,328 | ) | | | 552,183 | | | | 767,344 | | | | 1,348,232 | | | | 810,054 | | | | 451,285 | |
| | | | | | | | | | | | | | | | | | | | | | | | | | | | | | | | | | | |
| | – | | | | – | | | | – | | | | – | | | | – | | | | – | | | | – | | | | – | | | | – | |
| | 19,242,964 | | | | 17,769,164 | | | | 68,985,699 | | | | 29,885,732 | | | | 759,553 | | | | (1,654,568 | ) | | | 417,768 | | | | 384,056 | | | | 1,848,599 | |
| | – | | | | – | | | | – | | | | – | | | | – | | | | – | | | | – | | | | – | | | | – | |
| – | | | | – | | | | – | | | | – | | | | – | | | | 1,241,272 | | | | 2,874,160 | | | | 2,174,827 | | | | 1,083,533 | |
| | – | | | | – | | | | – | | | | – | | | | – | | | | – | | | | – | | | | – | | | | – | |
| | | | | | | | | | | | | | | | | | | | | | | | | | | | | | | | | | | |
| | – | | | | – | | | | – | | | | – | | | | – | | | | – | | | | – | | | | – | | | | – | |
| | – | | | | – | | | | – | | | | – | | | | – | | | | – | | | | – | | | | – | | | | – | |
| | (26,430,143 | ) | | | (57,830,738 | ) | | | (69,236,899 | ) | | | (30,541,621 | ) | | | (6,253,225 | ) | | | (1,265,562 | ) | | | (7,320,828 | ) | | | (5,463,696 | ) | | | (4,871,401 | ) |
| | – | | | | – | | | | – | | | | – | | | | – | | | | – | | | | – | | | | – | | | | – | |
| | (7,187,179 | ) | | | (40,061,574 | ) | | | (251,200 | ) | | | (655,889 | ) | | | (5,493,672 | ) | | | (1,678,858 | ) | | | (4,028,900 | ) | | | (2,904,813 | ) | | | (1,939,269 | ) |
| $ | (1,637,896 | ) | | $ | (35,112,938 | ) | | $ | 1,371,776 | | | $ | (733,217 | ) | | $ | (4,941,489 | ) | | $ | (911,514 | ) | | $ | (2,680,668 | ) | | $ | (2,094,759 | ) | | $ | (1,487,984 | ) |
See accompanying Notes to Financial Statements.
| Ultra Series Fund | December 31, 2018 |
| | |
| Statements of Changes in Net Assets |
| | | | Conservative Allocation Fund | | | Moderate Allocation Fund | |
| | | | | | | | |
| Year Ended December 31, | | | | 2018 | | | | 2017 | | | | 2018 | | | | 2017 | |
| | | | | | | | | | | | | | |
| Net Assets at beginning of period | | | $ | 150,474,621 | | | $ | 152,466,453 | | | $ | 244,064,933 | | | $ | 263,051,727 | |
| Increase (decrease) in net assets from operations: | | | | | | | | | | | | | | | | | |
Net investment income | | | | 2,834,324 | | | | 2,947,995 | | | | 4,072,988 | | | | 4,427,720 | |
Net realized gain (loss) | | | | 6,175,543 | | | | 4,405,819 | | | | 18,784,293 | | | | 14,049,738 | |
Net change in unrealized appreciation (depreciation) | | | | (12,251,745 | ) | | | 6,837,805 | | | | (31,897,983 | ) | | | 15,999,709 | |
| | | | | | | | | | | | | | |
Net increase (decrease) in net assets from operations | | | | (3,241,878 | ) | | | 14,191,619 | | | | (9,040,702 | ) | | | 34,477,167 | |
| Distributions to shareholders from: | | | | | | | | | | | | | | | | | |
Net investment income | | | | | | | | | | | | | | | | | |
Class I | | | | | | | | (2,500,202 | ) | | | | | | | (4,216,851 | ) |
Class II | | | | | | | | (529,648 | ) | | | | | | | (442,525 | ) |
Net realized gains | | | | | | | | | | | | | | | | | |
Class I | | | | | | | | (3,187,066 | ) | | | | | | | (11,344,314 | ) |
Class II | | | | | | | | (789,844 | ) | | | | | | | (1,405,372 | ) |
Accumulated earnings (combined net investment income and net realized gains):* | | | | | | | | | | | | | | | | | |
Class I | | | | (7,291,712 | ) | | | | | | | (19,947,973 | ) | | | | |
Class II | | | | (1,629,905 | ) | | | | | | | (2,257,292 | ) | | | | |
| | | | | | | | | | | | | | |
Total distributions | | | | (8,921,617 | ) | | | (7,006,760 | ) | | | (22,205,265 | ) | | | (17,409,062 | ) |
| | | | | | | | | | | | | | |
| Capital Stock transactions: | | | | | | | | | | | | | | | | | |
Class I Shares | | | | | | | | | | | | | | | | | |
Shares sold | | | | 10,252,814 | | | | 21,249,852 | | | | 7,667,779 | | | | 22,851,026 | |
Issued to shareholders in reinvestment of distributions | | | | 7,291,712 | | | | 5,687,269 | | | | 19,947,974 | | | | 15,561,165 | |
Shares redeemed | | | | (31,598,653 | ) | | | (33,248,239 | ) | | | (41,101,322 | ) | | | (71,458,848 | ) |
| | | | | | | | | | | | | | |
Net increase (decrease) from capital stock transactions | | | | (14,054,127 | ) | | | (6,311,118 | ) | | | (13,485,569 | ) | | | (33,046,657 | ) |
| | | | | | | | | | | | | | |
Class II Shares | | | | | | | | | | | | | | | | | |
Shares sold | | | | 415,509 | | | | 1,905,666 | | | | 1,492,216 | | | | 1,476,470 | |
Issued to shareholders in reinvestment of distributions | | | | 1,629,905 | | | | 1,319,492 | | | | 2,257,292 | | | | 1,847,897 | |
Shares redeemed | | | | (7,012,195 | ) | | | (6,090,731 | ) | | | (6,996,115 | ) | | | (6,332,609 | ) |
| | | | | | | | | | | | | | |
Net increase (decrease) from capital stock transactions | | | | (4,966,781 | ) | | | (2,865,573 | ) | | | (3,246,607 | ) | | | (3,008,242 | ) |
| | | | | | | | | | | | | | |
| Total increase (decrease) from capital stock transactions | | | | (19,020,908 | ) | | | (9,176,691 | ) | | | (16,732,176 | ) | | | (36,054,899 | ) |
| | | | | | | | | | | | | | |
| Total decrease in net assets | | | | (31,184,403 | ) | | | (1,991,832 | ) | | | (47,978,143 | ) | | | (18,986,794 | ) |
| | | | | | | | | | | | | | |
| Net Assets at end of period | | | $ | 119,290,218 | | | $ | 150,474,621 | | | $ | 196,086,790 | | | $ | 244,064,933 | |
| | | | | | | | | | | | | | |
| Capital Share transactions: | | | | | | | | | | | | | | | | | |
Class I Shares | | | | | | | | | | | | | | | | | |
Shares sold | | | | 1,021,147 | | | | 2,071,023 | | | | 713,323 | | | | 2,143,826 | |
Issued to shareholders in reinvestment of distributions | | | | 792,595 | | | | 556,409 | | | | 2,166,986 | | | | 1,434,551 | |
Shares redeemed | | | | (3,117,212 | ) | | | (3,281,672 | ) | | | (3,803,325 | ) | | | (6,654,961 | ) |
| | | | | | | | | | | | | | |
Net decrease from capital share transactions | | | | (1,303,470 | ) | | | (654,240 | ) | | | (923,016 | ) | | | (3,076,584 | ) |
| | | | | | | | | | | | | | |
Class II Shares | | | | | | | | | | | | | | | | | |
Shares sold | | | | 41,052 | | | | 189,218 | | | | 136,717 | | | | 138,824 | |
Issued to shareholders in reinvestment of distributions | | | | 177,268 | | | | 129,103 | | | | 245,591 | | | | 170,566 | |
Shares redeemed | | | | (688,166 | ) | | | (602,979 | ) | | | (643,456 | ) | | | (581,871 | ) |
| | | | | | | | | | | | | | |
Net increase (decrease) from capital share transactions | | | | (469,846 | ) | | | (284,658 | ) | | | (261,148 | ) | | | (272,481 | ) |
| | | | | | | | | | | | | | |
* Distributions from net investment income and net realized capital gains are combined for the year ended December 31, 2018. See Note 2 in the Notes to Financial Statements for more information regarding new SEC rules update.
See accompanying Notes to Financial Statements.
56
| Ultra Series Fund | December 31, 2018 |
| | |
| Statements of Changes in Net Assets |
| Aggressive Allocation Fund | | | | Core Bond Fund | | | High Income Fund | | | Diversified Income Fund | |
| | | | | | | | | | | |
| | 2018 | | | | 2017 | | | | 2018 | | | | 2017 | | | | 2018 | | | | 2017 | | | | 2018 | | | | 2017 | |
| | | | | | | | | | | | | | | | | | | | | | | |
| $ | 86,484,460 | | | $ | 90,949,828 | | | $ | 164,681,671 | | | $ | 184,945,243 | | | $ | 26,163,019 | | | $ | 27,407,016 | | | $ | 279,738,859 | | | $ | 286,037,793 | |
| |
| | 1,195,807 | | | | 1,370,984 | | | | 3,921,361 | | | | 4,347,189 | | | | 1,233,388 | | | | 1,271,722 | | | | 5,549,283 | | | | 5,867,008 | |
| | 9,042,462 | | | | 6,192,705 | | | | 618,683 | | | | 390,382 | | | | (119,514 | ) | | | 208,730 | | | | 19,242,964 | | | | 12,354,557 | |
| | (14,416,476 | ) | | | 7,267,306 | | | | (5,994,423 | ) | | | 591,067 | | | | (1,885,926 | ) | | | 189,436 | | | | (26,430,143 | ) | | | 16,682,463 | |
| | | | | | | | | | | | | | | | | | | | | | | |
| | (4,178,207 | ) | | | 14,830,995 | | | | (1,454,379 | ) | | | 5,328,638 | | | | (772,052 | ) | | | 1,669,888 | | | | (1,637,896 | ) | | | 34,904,028 | |
| |
| | | | | | (1,410,274 | ) | | | | | | | (3,839,704 | ) | | | | | | | (1,016,210 | ) | | | | | | | (5,154,317 | ) |
| | | | | | (31,646 | ) | | | | | | | (969,657 | ) | | | | | | | (260,404 | ) | | | | | | | (826,409 | ) |
| |
| | | | | | (5,435,153 | ) | | | | | | | – | | | | | | | | – | | | | | | | | (9,857,953 | ) |
| | | | | | (147,158 | ) | | | | | | | – | | | | | | | | – | | | | | | | | (1,683,155 | ) |
| |
| | (9,972,379 | ) | | | | | | | (3,339,579 | ) | | | | | | | (984,781 | ) | | | | | | | (22,160,414 | ) | | | | |
| | (245,159 | ) | | | | | | | (888,529 | ) | | | | | | | (247,689 | ) | | | | | | | (3,590,982 | ) | | | | |
| | | | | | | | | | | | | | | | | | | | | | | |
| | (10,217,538 | ) | | | (7,024,231 | ) | | | (4,228,108 | ) | | | (4,809,361 | ) | | | (1,232,470 | ) | | | (1,276,614 | ) | | | (25,751,396 | ) | | | (17,521,834 | ) |
| | | | | | | | | | | | | | | | | | | | | | | |
| |
| | 5,898,550 | | | | 14,299,948 | | | | 2,729,922 | | | | 6,624,555 | | | | 278,192 | | | | 528,995 | | | | 3,927,572 | | | | 10,710,442 | |
| | 9,972,379 | | | | 6,845,426 | | | | 3,339,579 | | | | 3,839,704 | | | | 984,781 | | | | 1,016,210 | | | | 22,160,414 | | | | 15,012,270 | |
| | (24,262,546 | ) | | | (33,484,730 | ) | | | (26,281,283 | ) | | | (28,233,982 | ) | | | (2,812,308 | ) | | | (3,361,108 | ) | | | (40,347,330 | ) | | | (46,853,243 | ) |
| | | | | | | | | | | | | | | | | | | | | | | |
| | (8,391,617 | ) | | | (12,339,356 | ) | | | (20,211,782 | ) | | | (17,769,723 | ) | | | (1,549,335 | ) | | | (1,815,903 | ) | | | (14,259,344 | ) | | | (21,130,531 | ) |
| | | | | | | | | | | | | | | | | | | | | | | |
| |
| | 6,857 | | | | 213,038 | | | | 566,506 | | | | 2,264,909 | | | | 88,746 | | | | 783,472 | | | | 1,173,557 | | | | 2,884,175 | |
| | 245,159 | | | | 178,804 | | | | 888,529 | | | | 969,657 | | | | 247,689 | | | | 260,404 | | | | 3,590,981 | | | | 2,509,564 | |
| | (645,079 | ) | | | (324,618 | ) | | | (5,748,547 | ) | | | (6,247,692 | ) | | | (874,984 | ) | | | (865,244 | ) | | | (8,508,512 | ) | | | (7,944,336 | ) |
| | | | | | | | | | | | | | | | | | | | | | | |
| | (393,063 | ) | | | 67,224 | | | | (4,293,512 | ) | | | (3,013,126 | ) | | | (538,549 | ) | | | 178,632 | | | | (3,743,974 | ) | | | (2,550,597 | ) |
| | | | | | | | | | | | | | | | | | | | | | | |
| | (8,784,680 | ) | | | (12,272,132 | ) | | | (24,505,294 | ) | | | (20,782,849 | ) | | | (2,087,884 | ) | | | (1,637,271 | ) | | | (18,003,318 | ) | | | (23,681,128 | ) |
| | | | | | | | | | | | | | | | | | | | | | | |
| | (23,180,425 | ) | | | (4,465,368 | ) | | | (30,187,781 | ) | | | (20,263,572 | ) | | | (4,092,406 | ) | | | (1,243,997 | ) | | | (45,392,610 | ) | | | (6,298,934 | ) |
| | | | | | | | | | | | | | | | | | | | | | | |
| $ | 63,304,035 | | | $ | 86,484,460 | | | | 134,493,890 | | | | 164,681,671 | | | $ | 22,070,613 | | | $ | 26,163,019 | | | $ | 234,346,249 | | | $ | 279,738,859 | |
| | | | | | | | | | | | | | | | | | | | | | | |
| |
| | 585,947 | | | | 1,455,389 | | | | 285,078 | | | | 670,205 | | | | 32,478 | | | | 60,086 | | | | 202,857 | | | | 562,948 | |
| | 1,250,111 | | | | 676,304 | | | | 356,459 | | | | 394,821 | | | | 123,941 | | | | 117,485 | | | | 1,292,235 | | | | 769,261 | |
| | (2,402,511 | ) | | | (3,375,439 | ) | | | (2,745,608 | ) | | | (2,850,687 | ) | | | (329,041 | ) | | | (377,920 | ) | | | (2,065,263 | ) | | | (2,434,037 | ) |
| | | | | | | | | | | | | | | | | | | | | | | |
| | (566,453 | ) | | | (1,243,746 | ) | | | (2,104,071 | ) | | | (1,785,661 | ) | | | (172,622 | ) | | | (200,349 | ) | | | (570,171 | ) | | | (1,101,828 | ) |
| | | | | | | | | | | | | | | | | | | | | | | |
| |
| | 681 | | | | 20,096 | | | | 59,518 | | | | 229,954 | | | | 10,325 | | | | 89,047 | | | | 60,883 | | | | 153,418 | |
| | 30,824 | | | | 17,720 | | | | 95,234 | | | | 100,101 | | | | 31,195 | | | | 30,099 | | | | 211,220 | | | | 129,455 | |
| | (63,949 | ) | | | (32,466 | ) | | | (602,485 | ) | | | (629,907 | ) | | | (102,082 | ) | | | (97,240 | ) | | | (436,376 | ) | | | (410,213 | ) |
| | | | | | | | | | | | | | | | | | | | | | | |
| | (32,444 | ) | | | 5,350 | | | | (447,733 | ) | | | (299,852 | ) | | | (60,562 | ) | | | 21,906 | | | | (164,273 | ) | | | (127,340 | ) |
| | | | | | | | | | | | | | | | | | | | | | | |
See accompanying Notes to Financial Statements.
57
| Ultra Series Fund | December 31, 2018 |
| | |
| Statements of Changes in Net Assets |
| | | | Large Cap Value Fund | | | Large Cap Growth Fund | |
| | | | | | | | |
| Year Ended December 31, | | | | 2018 | | | | 2017 | | | | 2018 | | | | 2017 | |
| | | | | | | | | | | | | | |
| Net Assets at beginning of period | | | $ | 346,751,911 | | | $ | 352,701,915 | | | $ | 255,807,316 | | | $ | 247,224,084 | |
| Increase (decrease) in net assets from operations: | | | | | | | | | | | | | | | | | |
Net investment income | | | | 4,948,636 | | | | 7,804,868 | | | | 1,622,976 | | | | 1,838,076 | |
Net realized gain (loss) | | | | 17,769,164 | | | | 19,175,375 | | | | 68,985,699 | | | | 31,958,000 | |
Net change in unrealized appreciation (depreciation) | | | | (57,830,738 | ) | | | 24,364,107 | | | | (69,236,899 | ) | | | 17,042,657 | |
| | | | | | | | | | | | | | |
Net increase (decrease) in net assets from operations | | | | (35,112,938 | ) | | | 51,344,350 | | | | 1,371,776 | | | | 50,838,733 | |
| Distributions to shareholders from: | | | | | | | | | | | | | | | | | |
Net investment income | | | | | | | | | | | | | | | | | |
Class I | | | | | | | | (7,698,319 | ) | | | | | | | (1,700,965 | ) |
Class II | | | | | | | | (117,237 | ) | | | | | | | (139,953 | ) |
Net realized gains | | | | | | | | | | | | | | | | | |
Class I | | | | | | | | (18,774,779 | ) | | | | | | | (28,091,073 | ) |
Class II | | | | | | | | (308,724 | ) | | | | | | | (2,888,346 | ) |
Accumulated earnings (combined net investment income and net realized gains):* | | | | | | | | | | | | | | | | | |
Return of Capital | | | | (6,385,380 | ) | | | | | | | – | | | | | |
Class I | | | | (23,800,307 | ) | | | | | | | (64,293,293 | ) | | | | |
Class II | | | | (374,603 | ) | | | | | | | (6,229,483 | ) | | | | |
| | | | | | | | | | | | | | |
Total distributions | | | | (30,560,290 | ) | | | (26,899,059 | ) | | | (70,522,776 | ) | | | (32,820,337 | ) |
| | | | | | | | | | | | | | |
| Capital Stock transactions: | | | | | | | | | | | | | | | | | |
Class I Shares | | | | | | | | | | | | | | | | | |
Shares sold | | | | 4,330,924 | | | | 10,247,248 | | | | 3,508,523 | | | | 9,778,133 | |
Issued to shareholders in reinvestment of distributions | | | | 30,086,743 | | | | 26,473,098 | | | | 64,293,293 | | | | 29,792,038 | |
Shares redeemed | | | | (67,284,693 | ) | | | (67,580,492 | ) | | | (52,663,852 | ) | | | (46,921,100 | ) |
| | | | | | | | | | | | | | |
Net increase (decrease) from capital stock transactions | | | | (32,867,026 | ) | | | (30,860,146 | ) | | | 15,137,964 | | | | (7,350,929 | ) |
| | | | | | | | | | | | | | |
Class II Shares | | | | | | | | | | | | | | | | | |
Shares sold | | | | 44,018 | | | | 1,255,348 | | | | 72,230 | | | | 275,075 | |
Issued to shareholders in reinvestment of distributions | | | | 473,547 | | | | 425,960 | | | | 6,229,483 | | | | 3,028,299 | |
Shares redeemed | | | | (1,203,286 | ) | | | (1,216,457 | ) | | | (5,884,087 | ) | | | (5,387,609 | ) |
| | | | | | | | | | | | | | |
Net increase (decrease) from capital stock transactions | | | | (685,721 | ) | | | 464,851 | | | | 417,626 | | | | (2,084,235 | ) |
| | | | | | | | | | | | | | |
| Total increase (decrease) from capital stock transactions | | | | (33,552,747 | ) | | | (30,395,295 | ) | | | 15,555,590 | | | | (9,435,164 | ) |
| | | | | | | | | | | | | | |
| Total increase (decrease) in net assets | | | | (99,225,975 | ) | | | (5,950,004 | ) | | | (53,595,410 | ) | | | 8,583,232 | |
| | | | | | | | | | | | | | |
| Net Assets at end of period | | | $ | 247,525,936 | | | $ | 346,751,911 | | | $ | 202,211,906 | | | $ | 255,807,316 | |
| | | | | | | | | | | | | | |
| Capital Share transactions: | | | | | | | | | | | | | | | | | |
Class I Shares | | | | | | | | | | | | | | | | | |
Shares sold | | | | 152,427 | | | | 375,647 | | | | 131,232 | | | | 368,199 | |
Issued to shareholders in reinvestment of distributions | | | | 1,369,103 | | | | 933,148 | | | | 3,790,125 | | | | 1,113,799 | |
Shares redeemed | | | | (2,350,839 | ) | | | (2,429,088 | ) | | | (1,945,994 | ) | | | (1,721,641 | ) |
| | | | | | | | | | | | | | |
Net increase (decrease) from capital share transactions | | | | (829,309 | ) | | | (1,120,293 | ) | | | 1,975,363 | | | | (239,643 | ) |
| | | | | | | | | | | | | | |
Class II Shares | | | | | | | | | | | | | | | | | |
Shares sold | | | | 1,752 | | | | 46,300 | | | | 2,770 | | | | 10,349 | |
Issued to shareholders in reinvestment of distributions | | | | 21,853 | | | | 15,178 | | | | 374,596 | | | | 114,571 | |
Shares redeemed | | | | (42,669 | ) | | | (43,767 | ) | | | (220,833 | ) | | | (196,943 | ) |
| | | | | | | | | | | | | | |
Net increase (decrease) from capital share transactions | | | | (19,064 | ) | | | 17,711 | | | | 156,533 | | | | (72,023 | ) |
| | | | | | | | | | | | | | |
* Distributions from net investment income and net realized capital gains are combined for the year ended December 31, 2018. See Note 2 in the Notes to Financial Statements for more information regarding new SEC rules update.
See accompanying Notes to Financial Statements.
58
| Ultra Series Fund | December 31, 2018 |
| | |
| Statements of Changes in Net Assets |
| | Mid Cap Fund | | | International Stock Fund | | | Madison Target Retirement
2020 Fund | | Madison Target Retirement
2030 Fund | |
| | | | | | | | | | |
| | 2018 | | | | 2017 | | | | 2018 | | | | 2017 | | | | 2018 | | | | 2017 | | | 2018 | | | 2017 | |
| | | | | | | | | | | | | | | | | | | | | |
| $ | 202,649,040 | | | $ | 214,217,873 | | | $ | 40,773,442 | | | $ | 39,604,139 | | | $ | 47,510,099 | | | $ | 51,485,211 | | $ | 74,415,412 | | $ | 75,564,099 | |
| |
| | (77,328 | ) | | | (163,928 | ) | | | 552,183 | | | | 484,574 | | | | 767,344 | | | | 919,244 | | | 1,348,232 | | | 1,318,624 | |
| | 29,885,732 | | | | 19,610,591 | | | | 759,553 | | | | 228,731 | | | | (413,296 | ) | | | 3,453,107 | | | 3,291,928 | | | 8,237,306 | |
| | (30,541,621 | ) | | | 10,329,405 | | | | (6,253,225 | ) | | | 7,552,307 | | | | (1,265,562 | ) | | | (460,954 | ) | | (7,320,828 | ) | | (360,994 | ) |
| | | | | | | | | | | | | | | | | | | | | |
| | (733,217 | ) | | | 29,776,068 | | | | (4,941,489 | ) | | | 8,265,612 | | | | (911,514 | ) | | | 3,911,397 | | | (2,680,668 | ) | | 9,194,936 | |
| |
| | | | | | – | | | | | | | | (333,652 | ) | | | | | | | (2,015,556 | ) | | | | | (3,054,046 | ) |
| | | | | | – | | | | | | | | (140,056 | ) | | | | | | | – | | | | | | – | |
| |
| | | | | | (18,232,719 | ) | | | | | | | – | | | | | | | | (2,322,168 | ) | | | | | (6,383,202 | ) |
| | | | | | (1,015,996 | ) | | | | | | | – | | | | | | | | – | | | | | | – | |
| |
| | – | | | | | | | | – | | | | | | | | (919,435 | ) | | | | | | – | | | | |
| | (27,955,190 | ) | | | | | | | (393,378 | ) | | | | | | | (1,007,649 | ) | | | | | | (3,958,445 | ) | | | |
| | (1,492,760 | ) | | | | | | | (154,826 | ) | | | | | | | – | | | | | | | – | | | | |
| | | | | | | | | | | | | | | | | | | | | |
| | (29,447,950 | ) | | | (19,248,715 | ) | | | (548,204 | ) | | | (473,708 | ) | | | (1,927,084 | ) | | | (4,337,724 | ) | | (3,958,445 | ) | | (9,437,248 | ) |
| | | | | | | | | | | | | | | | | | | | | |
| |
| | 2,802,134 | | | | 8,585,574 | | | | 649,664 | | | | 620,534 | | | | 6,176,987 | | | | 9,256,576 | | | 11,814,788 | | | 16,154,343 | |
| | 27,955,189 | | | | 18,232,719 | | | | 393,378 | | | | 333,652 | | | | 1,927,083 | | | | 4,337,724 | | | 3,958,445 | | | 9,437,248 | |
| | (42,163,342 | ) | | | (47,769,566 | ) | | | (3,632,285 | ) | | | (5,488,645 | ) | | | (14,252,981 | ) | | | (17,143,085 | ) | | (20,993,388 | ) | | (26,497,966 | ) |
| | | | | | | | | | | | | | | | | | | | | |
| | (11,406,019 | ) | | | (20,951,273 | ) | | | (2,589,243 | ) | | | (4,534,459 | ) | | | (6,148,911 | ) | | | (3,548,785 | ) | | (5,220,155 | ) | | (906,375 | ) |
| | | | | | | | | | | | | | | | | | | | | |
| |
| | 16,591 | | | | 296,716 | | | | 84,262 | | | | 425,059 | | | | | | | | | | | | | | | |
| | 1,492,761 | | | | 1,015,996 | | | | 154,826 | | | | 140,056 | | | | | | | | | | | | | | | |
| | (2,573,478 | ) | | | (2,457,625 | ) | | | (2,585,022 | ) | | | (2,653,257 | ) | | | | | | | | | | | | | | |
| | | | | | | | | | | | | | | | | | | | | | | | | |
| | (1,064,126 | ) | | | (1,144,913 | ) | | | (2,345,934 | ) | | | (2,088,142 | ) | | | | | | | | | | | | | | |
| | | | | | | | | | | | | | | | | | | | | | | | | |
| | (12,470,145 | ) | | | (22,096,186 | ) | | | (4,935,177 | ) | | | (6,622,601 | ) | | | (6,148,911 | ) | | | (3,548,785 | ) | | (5,220,155 | ) | | (906,375 | ) |
| | | | | | | | | | | | | | | | | | | | | |
| | (42,651,312 | ) | | | (11,568,833 | ) | | | (10,424,870 | ) | | | 1,169,303 | | | | (8,987,509 | ) | | | (3,975,112 | ) | | (11,859,268 | ) | | (1,148,687 | ) |
| | | | | | | | | | | | | | | | | | | | | |
| $ | 159,997,728 | | | $ | 202,649,040 | | | $ | 30,348,572 | | | $ | 40,773,442 | | | $ | 38,522,590 | | | $ | 47,510,099 | | $ | 62,556,144 | | $ | 74,415,412 | |
| | | | | | | | | | | | | | | | | | | | | |
| |
| | 144,964 | | | | 461,805 | | | | 57,554 | | | | 58,835 | | | | 783,998 | | | | 1,111,956 | | | 1,447,980 | | | 1,865,076 | |
| | 1,881,190 | | | | 964,367 | | | | 39,714 | | | | 28,685 | | | | 260,401 | | | | 546,600 | | | 536,541 | | | 1,155,850 | |
| | (2,141,487 | ) | | | (2,512,866 | ) | | | (316,336 | ) | | | (508,360 | ) | | | (1,813,722 | ) | | | (2,058,707 | ) | | (2,579,550 | ) | | (3,051,129 | ) |
| | | | | | | | | | | | | | | | | | | | | |
| | (115,333 | ) | | | (1,086,694 | ) | | | (219,068 | ) | | | (420,840 | ) | | | (769,323 | ) | | | (400,151 | ) | | (595,029 | ) | | (30,203 | ) |
| | | | | | | | | | | | | | | | | | | | | |
| |
| | 836 | | | | 15,984 | | | | 7,786 | | | | 40,942 | | | | | | | | | | | | | | | |
| | 103,245 | | | | 54,813 | | | | 15,801 | | | | 12,069 | | | | | | | | | | | | | | | |
| | (133,015 | ) | | | (130,651 | ) | | | (226,172 | ) | | | (243,062 | ) | | | | | | | | | | | | | | |
| | | | | | | | | | | | | | | | | | | | | | | | | |
| | (28,934 | ) | | | (59,854 | ) | | | (202,585 | ) | | | (190,051 | ) | | | | | | | | | | | | | | |
| | | | | | | | | | | | | | | | | | | | | | | | | |
See accompanying Notes to Financial Statements.
59
| Ultra Series Fund | December 31, 2018 |
| | |
| Statements of Changes in Net Assets |
| | | Madison Target Retirement
2040 Fund | | | Madison Target Retirement
2050 Fund | |
| | | | | | | |
| | | | 2018 | | | | 2017 | | | | 2018 | | | | 2017 | |
| | | | | | | | | | | | | |
| Net Assets at beginning of period | | $ | 49,909,305 | | | $ | 49,514,964 | | | $ | 28,231,062 | | | $ | 23,441,816 | |
| Increase (decrease) in net assets from operations: | | | | | | | | | | | | | | | | |
Net investment income | | | 810,054 | | | | 881,184 | | | | 451,285 | | | | 464,321 | |
Net realized gain (loss) | | | 2,558,883 | | | | 6,387,722 | | | | 2,932,132 | | | | 1,667,011 | |
Net change in unrealized appreciation (depreciation) | | | (5,463,696 | ) | | | (199,904 | ) | | | (4,871,401 | ) | | | 1,914,989 | |
| | | | | | | | | | | | | |
Net increase (decrease) in net assets from operations | | | (2,094,759 | ) | | | 7,069,002 | | | | (1,487,984 | ) | | | 4,046,321 | |
| Distributions to shareholders from: | | | | | | | | | | | | | | | | |
Net investment income | | | | | | | | | | | | | | | | |
Class I | | | | | | | (2,151,191 | ) | | | | | | | (1,024,758 | ) |
Class II | | | | | | | – | | | | | | | | – | |
Net realized gains | | | | | | | | | | | | | | | | |
Class I | | | | | | | (5,032,525 | ) | | | | | | | (1,089,381 | ) |
Class II | | | | | | | – | | | | | | | | – | |
Accumulated earnings (combined net investment income and net realized gains):* | | | | | | | | | | | | | | | | |
Class I | | | (2,843,179 | ) | | | | | | | (1,387,882 | ) | | | | |
Class II | | | – | | | | | | | | – | | | | | |
| | | | | | | | | | | | | |
Total distributions | | | (2,843,179 | ) | | | (7,183,716 | ) | | | (1,387,882 | ) | | | (2,114,139 | ) |
| | | | | | | | | | | | | |
| Capital Stock transactions: | | | | | | | | | | | | | | | | |
Class I Shares | | | | | | | | | | | | | | | | |
Shares sold | | | 8,402,290 | | | | 11,720,477 | | | | 6,486,931 | | | | 8,936,678 | |
Issued to shareholders in reinvestment of distributions | | | 2,843,179 | | | | 7,183,716 | | | | 1,387,882 | | | | 2,114,139 | |
Shares redeemed | | | (17,792,839 | ) | | | (18,395,138 | ) | | | (10,149,243 | ) | | | (8,193,753 | ) |
| | | | | | | | | | | | | |
Net increase (decrease) from capital stock transactions | | | (6,547,370 | ) | | | 509,055 | | | | (2,274,430 | ) | | | 2,857,064 | |
| | | | | | | | | | | | | |
| Total increase (decrease) from capital stock transactions | | | (6,547,370 | ) | | | 509,055 | | | | (2,274,430 | ) | | | 2,857,064 | |
| | | | | | | | | | | | | |
| Total increase (decrease) in net assets | | | (11,485,308 | ) | | | 394,341 | | | | (5,150,296 | ) | | | 4,789,246 | |
| | | | | | | | | | | | | |
| Net Assets at end of period | | $ | 38,423,997 | | | $ | 49,909,305 | | | $ | 23,080,766 | | | $ | 28,231,062 | |
| | | | | | | | | | | | | |
| Capital Share transactions: | | | | | | | | | | | | | | | | |
Class I Shares | | | | | | | | | | | | | | | | |
Shares sold | | | 1,109,112 | | | | 1,450,582 | | | | 475,368 | | | | 665,071 | |
Issued to shareholders in reinvestment of distributions | | | 424,125 | | | | 950,506 | | | | 114,872 | | | | 155,502 | |
Shares redeemed | | | (2,370,700 | ) | | | (2,252,898 | ) | | | (748,435 | ) | | | (609,415 | ) |
| | | | | | | | | | | | | |
Net increase (decrease) from capital share transactions | | | (837,463 | ) | | | 148,190 | | | | (158,195 | ) | | | 211,158 | |
| | | | | | | | | | | | | |
* Distributions from net investment income and net realized capital gains are combined for the year ended December 31, 2018. See Note 2 in the Notes to Financial Statements for more information regarding new SEC rules update.
See accompanying Notes to Financial Statements.
60
| Ultra Series Fund | December 31, 2018 |
| | |
| Financial Highlights for a Share of Beneficial Interest Outstanding |
CONSERVATIVE ALLOCATION FUND
| | Year Ended December 31, |
| | | | 2018 | | | | 2017 | | | | 2016 | | | | 2015 | | | | 2014 | |
| CLASS I | | | | | | | | | | | | | | | | | | | | |
| Net Asset Valueat beginning of period | | $ | 10.22 | | | $ | 9.74 | | | $ | 9.56 | | | $ | 10.22 | | | $ | 10.70 | |
| Income from Investment Operations: | | | | | | | | | | | | | | | | | | | | |
| Net investment income | | | 0.25 | | | | 0.21 | | | | 0.17 | 1 | | | 0.16 | 1 | | | 0.19 | 1 |
| Net realized and unrealized gain (loss) on investments | | | (0.51 | ) | | | 0.77 | | | | 0.36 | | | | (0.24 | ) | | | 0.46 | |
| Total from investment operations | | | (0.26 | ) | | | 0.98 | | | | 0.53 | | | | (0.08 | ) | | | 0.65 | |
| Less Distributions From: | | | | | | | | | | | | | | | | | | | | |
| Net investment income | | | (0.25 | ) | | | (0.22 | ) | | | (0.20 | ) | | | (0.20 | ) | | | (0.25 | ) |
| Capital gains | | | (0.50 | ) | | | (0.28 | ) | | | (0.15 | ) | | | (0.38 | ) | | | (0.88 | ) |
| Total distributions | | | (0.75 | ) | | | (0.50 | ) | | | (0.35 | ) | | | (0.58 | ) | | | (1.13 | ) |
| Net increase (decrease) in net asset value | | | (1.01 | ) | | | 0.48 | | | | 0.18 | | | | (0.66 | ) | | | (0.48 | ) |
| Net Asset Valueat end of period | | $ | 9.21 | | | $ | 10.22 | | | $ | 9.74 | | | $ | 9.56 | | | $ | 10.22 | |
| Total Return (%)2 | | | (2.49 | ) | | | 10.17 | | | | 5.48 | | | | (0.76 | ) | | | 6.03 | |
| Ratios/Supplemental Data: | | | | | | | | | | | | | | | | | | | | |
| Net Assets at end of period (in 000’s) | | $ | 96,763 | | | $ | 120,703 | | | $ | 121,351 | | | $ | 125,007 | | | $ | 156,054 | |
| Ratios of expenses to average net assets: | | | | | | | | | | | | | | | | | | | | |
| Before waiver of expenses by Adviser (%) | | | 0.32 | | | | 0.32 | | | | 0.32 | | | | 0.32 | | | | 0.31 | |
| After waiver of expenses by Adviser (%) | | | 0.22 | | | | 0.22 | | | | 0.22 | | | | 0.22 | | | | 0.27 | |
| Ratio of net investment income to average net assets (%) | | | 2.13 | | | | 2.06 | | | | 1.71 | | | | 1.53 | | | | 1.71 | |
| Portfolio turnover (%)3 | | | 54 | | | | 49 | | | | 83 | | | | 54 | | | | 73 | |
| |
| CLASS II | | | 2018 | | | | 2017 | | | | 2016 | | | | 2015 | | | | 2014 | |
| Net Asset Valueat beginning of period | | $ | 10.22 | | | $ | 9.73 | | | $ | 9.55 | | | $ | 10.20 | | | $ | 10.68 | |
| Income from Investment Operations: | | | | | | | | | | | | | | | | | | | | |
| Net investment income | | | 0.19 | | | | 0.18 | | | | 0.14 | 1 | | | 0.15 | 1 | | | 0.18 | 1 |
| Net realized and unrealized gain (loss) on investments | | | (0.47 | ) | | | 0.78 | | | | 0.36 | | | | (0.25 | ) | | | 0.43 | |
| Total from investment operations | | | (0.28 | ) | | | 0.96 | | | | 0.50 | | | | (0.10 | ) | | | 0.61 | |
| Less Distributions From: | | | | | | | | | | | | | | | | | | | | |
| Net investment income | | | (0.22 | ) | | | (0.19 | ) | | | (0.17 | ) | | | (0.17 | ) | | | (0.21 | ) |
| Capital gains | | | (0.50 | ) | | | (0.28 | ) | | | (0.15 | ) | | | (0.38 | ) | | | (0.88 | ) |
| Total distributions | | | (0.72 | ) | | | (0.47 | ) | | | (0.32 | ) | | | (0.55 | ) | | | (1.09 | ) |
| Net increase (decrease) in net asset value | | | (1.00 | ) | | | 0.49 | | | | 0.18 | | | | (0.65 | ) | | | (0.48 | ) |
| Net Asset Valueat end of period | | $ | 9.22 | | | $ | 10.22 | | | $ | 9.73 | | | $ | 9.55 | | | $ | 10.20 | |
| Total Return (%)2 | | | (2.73 | ) | | | 9.90 | | | | 5.21 | | | | (1.01 | ) | | | 5.77 | |
| Ratios/Supplemental Data: | | | | | | | | | | | | | | | | | | | | |
| Net Assets at end of period (in 000’s) | | $ | 22,527 | | | $ | 29,772 | | | $ | 31,116 | | | $ | 33,705 | | | $ | 37,837 | |
| Ratios of expenses to average net assets: | | | | | | | | | | | | | | | | | | | | |
| Before waiver of expenses by Adviser (%) | | | 0.57 | | | | 0.57 | | | | 0.57 | | | | 0.57 | | | | 0.56 | |
| After waiver of expenses by Adviser (%) | | | 0.47 | | | | 0.47 | | | | 0.47 | | | | 0.47 | | | | 0.51 | |
| Ratio of net investment income to average net assets (%) | | | 1.88 | | | | 1.78 | | | | 1.42 | | | | 1.46 | | | | 1.65 | |
| Portfolio turnover (%)3 | | | 54 | | | | 49 | | | | 83 | | | | 54 | | | | 73 | |
1 | Based on average shares outstanding during the year. |
2 | These returns are after all charges at the mutual fund level have been subtracted. These returns are higher than the returns at the separate account level because charges made at the separate account level have not been subtracted. Total returns are not annualized for periods less than one year. |
3 | Portfolio turnover is calculated at the fund level and represents the entire fiscal year or period. |
See accompanying Notes to Financial Statements.
Ultra Series Fund| December 31, 2018
| |
| Financial Highlights for a Share of Beneficial Interest Outstanding |
MODERATE ALLOCATION FUND
| | Year Ended December 31, |
| | | | 2018 | | | | 2017 | | | | 2016 | | | | 2015 | | | | 2014 | |
| CLASS I | | | | | | | | | | | | | | | | | | | | |
| Net Asset Valueat beginning of period | | $ | 10.85 | | | $ | 10.18 | | | $ | 9.92 | | | $ | 10.92 | | | $ | 11.48 | |
| Income from Investment Operations: | | | | | | | | | | | | | | | | | | | | |
| Net investment income | | | 0.21 | | | | 0.22 | | | | 0.15 | 1 | | | 0.14 | 1 | | | 0.16 | 1 |
| Net realized and unrealized gain (loss) on investments | | | (0.69 | ) | | | 1.29 | | | | 0.58 | | | | (0.24 | ) | | | 0.62 | |
| Total from investment operations | | | (0.48 | ) | | | 1.51 | | | | 0.73 | | | | (0.10 | ) | | | 0.78 | |
| Less Distributions From: | | | | | | | | | | | | | | | | | | | | |
| Net investment income | | | (0.12 | ) | | | (0.23 | ) | | | (0.20 | ) | | | (0.19 | ) | | | (0.25 | ) |
| Capital gains | | | (1.05 | ) | | | (0.61 | ) | | | (0.27 | ) | | | (0.71 | ) | | | (1.09 | ) |
| Total distributions | | | (1.17 | ) | | | (0.84 | ) | | | (0.47 | ) | | | (0.90 | ) | | | (1.34 | ) |
| Net increase (decrease) in net asset value | | | (1.65 | ) | | | 0.67 | | | | 0.26 | | | | (1.00 | ) | | | (0.56 | ) |
| Net Asset Valueat end of period | | $ | 9.20 | | | $ | 10.85 | | | $ | 10.18 | | | $ | 9.92 | | | $ | 10.92 | |
| Total Return (%)2 | | | (4.36 | ) | | | 14.80 | | | | 7.39 | | | | (0.93 | ) | | | 6.85 | |
| Ratios/Supplemental Data: | | | | | | | | | | | | | | | | | | | | |
| Net Assets at end of period (in 000’s) | | $ | 175,785 | | | $ | 217,301 | | | $ | 235,182 | | | $ | 245,807 | | | $ | 315,568 | |
| Ratios of expenses to average net assets: | | | | | | | | | | | | | | | | | | | | |
| Before waiver of expenses by Adviser (%) | | | 0.32 | | | | 0.32 | | | | 0.32 | | | | 0.32 | | | | 0.31 | |
| After waiver of expenses by Adviser (%) | | | 0.22 | | | | 0.22 | | | | 0.22 | | | | 0.22 | | | | 0.27 | |
| Ratio of net investment income to average net assets (%) | | | 1.85 | | | | 1.80 | | | | 1.49 | | | | 1.30 | | | | 1.37 | |
| Portfolio turnover (%)3 | | | 67 | | | | 39 | | | | 91 | | | | 52 | | | | 73 | |
| |
| CLASS II | | | 2018 | | | | 2017 | | | | 2016 | | | | 2015 | | | | 2014 | |
| Net Asset Valueat beginning of period | | $ | 10.83 | | | $ | 10.16 | | | $ | 9.90 | | | $ | 10.89 | | | $ | 11.45 | |
| Income from Investment Operations: | | | | | | | | | | | | | | | | | | | | |
| Net investment income | | | 0.15 | | | | 0.16 | | | | 0.12 | 1 | | | 0.15 | 1 | | | 0.18 | 1 |
| Net realized and unrealized gain (loss) on investments | | | (0.65 | ) | | | 1.31 | | | | 0.58 | | | | (0.27 | ) | | | 0.57 | |
| Total from investment operations | | | (0.50 | ) | | | 1.47 | | | | 0.70 | | | | (0.12 | ) | | | 0.75 | |
| Less Distributions From: | | | | | | | | | | | | | | | | | | | | |
| Net investment income | | | (0.09 | ) | | | (0.19 | ) | | | (0.17 | ) | | | (0.16 | ) | | | (0.22 | ) |
| Capital gains | | | (1.05 | ) | | | (0.61 | ) | | | (0.27 | ) | | | (0.71 | ) | | | (1.09 | ) |
| Total distributions | | | (1.14 | ) | | | (0.80 | ) | | | (0.44 | ) | | | (0.87 | ) | | | (1.31 | ) |
| Net increase (decrease) in net asset value | | | (1.64 | ) | | | 0.67 | | | | 0.26 | | | | (0.99 | ) | | | (0.56 | ) |
| Net Asset Valueat end of period | | $ | 9.19 | | | $ | 10.83 | | | $ | 10.16 | | | $ | 9.90 | | | $ | 10.89 | |
| Total Return (%)2 | | | (4.60 | ) | | | 14.52 | | | | 7.12 | | | | (1.18 | ) | | | 6.58 | |
| Ratios/Supplemental Data: | | | | | | | | | | | | | | | | | | | | |
| Net Assets at end of period (in 000’s) | | $ | 20,302 | | | $ | 26,764 | | | $ | 27,870 | | | $ | 30,763 | | | $ | 34,134 | |
| Ratios of expenses to average net assets: | | | | | | | | | | | | | | | | | | | | |
| Before waiver of expenses by Adviser (%) | | | 0.57 | | | | 0.57 | | | | 0.57 | | | | 0.57 | | | | 0.56 | |
| After waiver of expenses by Adviser (%) | | | 0.47 | | | | 0.47 | | | | 0.47 | | | | 0.47 | | | | 0.51 | |
| Ratio of net investment income to average net assets (%) | | | 1.58 | | | | 1.54 | | | | 1.18 | | | | 1.36 | | | | 1.49 | |
| Portfolio turnover (%)3 | | | 67 | | | | 39 | | | | 91 | | | | 52 | | | | 73 | |
1 | Based on average shares outstanding during the year. |
2 | These returns are after all charges at the mutual fund level have been subtracted. These returns are higher than the returns at the separate account level because charges made at the separate account level have not been subtracted. Total returns are not annualized for periods less than one year. |
3 | Portfolio turnover is calculated at the fund level and represents the entire fiscal year or period. |
See accompanying Notes to Financial Statements.
Ultra Series Fund| December 31, 2018
| |
| Financial Highlights for a Share of Beneficial Interest Outstanding |
AGGRESSIVE ALLOCATION FUND
| | Year Ended December 31, |
| | | | 2018 | | | | 2017 | | | | 2016 | | | | 2015 | | | | 2014 | |
| CLASS I | | | | | | | | | | | | | | | | | | | | |
| Net Asset Valueat beginning of period | | $ | 10.12 | | | $ | 9.30 | | | $ | 8.85 | | | $ | 10.25 | | | $ | 11.66 | |
| Income from Investment Operations: | | | | | | | | | | | | | | | | | | | | |
| Net investment income | | | 0.18 | | | | 0.17 | | | | 0.12 | 1 | | | 0.11 | 1 | | | 0.14 | 1 |
| Net realized and unrealized gain (loss) on investments | | | (0.80 | ) | | | 1.54 | | | | 0.66 | | | | (0.22 | ) | | | 0.72 | |
| Total from investment operations | | | (0.62 | ) | | | 1.71 | | | | 0.78 | | | | (0.11 | ) | | | 0.86 | |
| Less Distributions From: | | | | | | | | | | | | | | | | | | | | |
| Net investment income | | | (0.19 | ) | | | (0.18 | ) | | | (0.17 | ) | | | (0.16 | ) | | | (0.24 | ) |
| Capital gains | | | (1.34 | ) | | | (0.71 | ) | | | (0.16 | ) | | | (1.13 | ) | | | (2.03 | ) |
| Total distributions | | | (1.53 | ) | | | (0.89 | ) | | | (0.33 | ) | | | (1.29 | ) | | | (2.27 | ) |
| Net increase (decrease) in net asset value | | | (2.15 | ) | | | 0.82 | | | | 0.45 | | | | (1.40 | ) | | | (1.41 | ) |
| Net Asset Valueat end of period | | $ | 7.97 | | | $ | 10.12 | | | $ | 9.30 | | | $ | 8.85 | | | $ | 10.25 | |
| Total Return (%)2 | | | (6.16 | ) | | | 18.52 | | | | 8.87 | | | | (1.14 | ) | | | 7.46 | |
| Ratios/Supplemental Data: | | | | | | | | | | | | | | | | | | | | |
| Net Assets at end of period (in 000’s) | | $ | 61,777 | | | $ | 84,217 | | | $ | 88,917 | | | $ | 90,245 | | | $ | 124,838 | |
| Ratios of expenses to average net assets: | | | | | | | | | | | | | | | | | | | | |
| Before waiver of expenses by Adviser (%) | | | 0.32 | | | | 0.32 | | | | 0.32 | | | | 0.32 | | | | 0.31 | |
| After waiver of expenses by Adviser (%) | | | 0.22 | | | | 0.22 | | | | 0.22 | | | | 0.22 | | | | 0.27 | |
| Ratio of net investment income to average net assets (%) | | | 1.55 | | | | 1.57 | | | | 1.34 | | | | 1.08 | | | | 1.13 | |
| Portfolio turnover (%)3 | | | 69 | | | | 36 | | | | 89 | | | | 53 | | | | 70 | |
| |
| CLASS II | | | 2018 | | | | 2017 | | | | 2016 | | | | 2015 | | | | 2014 | |
| Net Asset Valueat beginning of period | | $ | 10.09 | | | $ | 9.27 | | | $ | 8.82 | | | $ | 10.21 | | | $ | 11.62 | |
| Income from Investment Operations: | | | | | | | | | | | | | | | | | | | | |
| Net investment income | | | 0.13 | | | | 0.15 | | | | 0.13 | 1 | | | 0.17 | 1 | | | 0.17 | 1 |
| Net realized and unrealized gain (loss) on investments | | | (0.78 | ) | | | 1.53 | | | | 0.62 | | | | (0.30 | ) | | | 0.66 | |
| Total from investment operations | | | (0.65 | ) | | | 1.68 | | | | 0.75 | | | | (0.13 | ) | | | 0.83 | |
| Less Distributions From: | | | | | | | | | | | | | | | | | | | | |
| Net investment income | | | (0.16 | ) | | | (0.15 | ) | | | (0.14 | ) | | | (0.13 | ) | | | (0.21 | ) |
| Capital gains | | | (1.34 | ) | | | (0.71 | ) | | | (0.16 | ) | | | (1.13 | ) | | | (2.03 | ) |
| Total distributions | | | (1.50 | ) | | | (0.86 | ) | | | (0.30 | ) | | | (1.26 | ) | | | (2.24 | ) |
| Net increase (decrease) in net asset value | | | (2.15 | ) | | | 0.82 | | | | 0.45 | | | | (1.39 | ) | | | (1.41 | ) |
| Net Asset Valueat end of period | | $ | 7.94 | | | $ | 10.09 | | | $ | 9.27 | | | $ | 8.82 | | | $ | 10.21 | |
| Total Return (%)2 | | | (6.39 | ) | | | 18.22 | | | | 8.60 | | | | (1.39 | ) | | | 7.19 | |
| Ratios/Supplemental Data: | | | | | | | | | | | | | | | | | | | | |
| Net Assets at end of period (in 000’s) | | $ | 1,527 | | | $ | 2,267 | | | $ | 2,032 | | | $ | 1,681 | | | $ | 1,809 | |
| Ratios of expenses to average net assets: | | | | | | | | | | | | | | | | | | | | |
| Before waiver of expenses by Adviser (%) | | | 0.57 | | | | 0.57 | | | | 0.57 | | | | 0.57 | | | | 0.56 | |
| After waiver of expenses by Adviser (%) | | | 0.47 | | | | 0.47 | | | | 0.47 | | | | 0.47 | | | | 0.51 | |
| Ratio of net investment income to average net assets (%) | | | 1.01 | | | | 1.53 | | | | 1.42 | | | | 1.64 | | | | 1.45 | |
| Portfolio turnover (%)3 | | | 69 | | | | 36 | | | | 89 | | | | 53 | | | | 70 | |
1 | Based on average shares outstanding during the year. |
2 | These returns are after all charges at the mutual fund level have been subtracted. These returns are higher than the returns at the separate account level because charges made at the separate account level have not been subtracted. Total returns are not annualized for periods less than one year. |
3 | Portfolio turnover is calculated at the fund level and represents the entire fiscal year or period. |
See accompanying Notes to Financial Statements.
Ultra Series Fund| December 31, 2018
| |
| Financial Highlights for a Share of Beneficial Interest Outstanding |
CORE BOND FUND
| | Year Ended December 31, |
| | | | 2018 | | | | 2017 | | | | 2016 | | | | 2015 | | | | 2014 | |
| CLASS I | | | | | | | | | | | | | | | | | | | | |
| Net Asset Valueat beginning of period | | $ | 9.76 | | | $ | 9.75 | | | $ | 9.80 | | | $ | 10.14 | | | $ | 9.97 | |
| Income from Investment Operations: | | | | | | | | | | | | | | | | | | | | |
| Net investment income | | | 0.32 | | | | 0.29 | | | | 0.26 | 1 | | | 0.28 | 1 | | | 0.30 | 1 |
| Net realized and unrealized gain (loss) on investments | | | (0.38 | ) | | | 0.02 | | | | (0.01 | ) | | | (0.29 | ) | | | 0.20 | |
| Total from investment operations | | | (0.06 | ) | | | 0.31 | | | | 0.25 | | | | (0.01 | ) | | | 0.50 | |
| Less Distributions From: | | | | | | | | | | | | | | | | | | | | |
| Net investment income | | | (0.31 | ) | | | (0.30 | ) | | | (0.30 | ) | | | (0.33 | ) | | | (0.33 | ) |
| Net increase (decrease) in net asset value | | | (0.37 | ) | | | 0.01 | | | | (0.05 | ) | | | (0.34 | ) | | | 0.17 | |
| Net Asset Valueat end of period | | $ | 9.39 | | | $ | 9.76 | | | $ | 9.75 | | | $ | 9.80 | | | $ | 10.14 | |
| Total Return (%)2 | | | (0.62 | ) | | | 3.11 | | | | 2.67 | | | | (0.15 | ) | | | 5.09 | |
| Ratios/Supplemental Data: | | | | | | | | | | | | | | | | | | | | |
| Net Assets at end of period (in 000’s) | | $ | 104,781 | | | $ | 129,429 | | | $ | 146,780 | | | $ | 173,927 | | | $ | 224,976 | |
| Ratios of expenses to average net assets (%) | | | 0.57 | | | | 0.57 | | | | 0.57 | | | | 0.57 | | | | 0.56 | |
| Ratio of net investment income to average net assets (%) | | | 2.70 | | | | 2.54 | | | | 2.53 | | | | 2.73 | | | | 2.88 | |
| Portfolio turnover (%)3 | | | 24 | | | | 16 | | | | 39 | | | | 25 | | | | 17 | |
| |
| CLASS II | | | 2018 | | | | 2017 | | | | 2016 | | | | 2015 | | | | 2014 | |
| Net Asset Valueat beginning of period | | $ | 9.73 | | | $ | 9.73 | | | $ | 9.78 | | | $ | 10.12 | | | $ | 9.95 | |
| Income from Investment Operations: | | | | | | | | | | | | | | | | | | | | |
| Net investment income | | | 0.19 | | | | 0.22 | | | | 0.23 | 1 | | | 0.25 | 1 | | | 0.27 | 1 |
| Net realized and unrealized gain (loss) on investments | | | (0.27 | ) | | | 0.06 | | | | – | | | | (0.29 | ) | | | 0.21 | |
| Total from investment operations | | | (0.08 | ) | | | 0.28 | | | | 0.23 | | | | (0.04 | ) | | | 0.48 | |
| Less Distributions From: | | | | | | | | | | | | | | | | | | | | |
| Net investment income | | | (0.29 | ) | | | (0.28 | ) | | | (0.28 | ) | | | (0.30 | ) | | | (0.31 | ) |
| Net increase (decrease) in net asset value | | | (0.37 | ) | | | – | | | | (0.05 | ) | | | (0.34 | ) | | | 0.17 | |
| Net Asset Valueat end of period | | $ | 9.36 | | | $ | 9.73 | | | $ | 9.73 | | | $ | 9.78 | | | $ | 10.12 | |
| Total Return (%)2 | | | (0.87 | ) | | | 2.85 | | | | 2.41 | | | | (0.40 | ) | | | 4.83 | |
| Ratios/Supplemental Data: | | | | | | | | | | | | | | | | | | | | |
| Net Assets at end of period (in 000’s) | | $ | 29,713 | | | $ | 35,252 | | | $ | 38,165 | | | $ | 44,151 | | | $ | 47,162 | |
| Ratios of expenses to average net assets (%) | | | 0.82 | | | | 0.82 | | | | 0.82 | | | | 0.82 | | | | 0.81 | |
| Ratio of net investment income to average net assets (%) | | | 2.45 | | | | 2.29 | | | | 2.28 | | | | 2.48 | | | | 2.62 | |
| Portfolio turnover (%)3 | | | 24 | | | | 16 | | | | 39 | | | | 25 | | | | 17 | |
1 | Based on average shares outstanding during the year. |
2 | These returns are after all charges at the mutual fund level have been subtracted. These returns are higher than the returns at the separate account level because charges made at the separate account level have not been subtracted. Total returns are not annualized for periods less than one year. |
3 | Portfolio turnover is calculated at the fund level and represents the entire fiscal year or period. |
See accompanying Notes to Financial Statements.
Ultra Series Fund| December 31, 2018
| |
| Financial Highlights for a Share of Beneficial Interest Outstanding |
HIGH INCOME FUND
| | Year Ended December 31, |
| | | | 2018 | | | | 2017 | | | | 2016 | | | | 2015 | | | | 2014 | |
| CLASS I | | | | | | | | | | | | | | | | | | | | |
| Net Asset Valueat beginning of period | | $ | 8.66 | | | $ | 8.56 | | | $ | 8.05 | | | $ | 8.78 | | | $ | 9.22 | |
| Income from Investment Operations: | | | | | | | | | | | | | | | | | | | | |
| Net investment income | | | 0.49 | | | | 0.47 | | | | 0.42 | 1 | | | 0.47 | 1 | | | 0.49 | 1 |
| Net realized and unrealized gain (loss) on investments | | | (0.77 | ) | | | 0.08 | | | | 0.55 | | | | (0.68 | ) | | | (0.33 | ) |
| Total from investment operations | | | (0.28 | ) | | | 0.55 | | | | 0.97 | | | | (0.21 | ) | | | 0.16 | |
| Less Distributions From: | | | | | | | | | | | | | | | | | | | | |
| Net investment income | | | (0.47 | ) | | | (0.45 | ) | | | (0.46 | ) | | | (0.52 | ) | | | (0.60 | ) |
| Net increase (decrease) in net asset value | | | (0.75 | ) | | | 0.10 | | | | 0.51 | | | | (0.73 | ) | | | (0.44 | ) |
| Net Asset Valueat end of period | | $ | 7.91 | | | $ | 8.66 | | | $ | 8.56 | | | $ | 8.05 | | | $ | 8.78 | |
| Total Return (%)2 | | | (3.20 | ) | | | 6.32 | | | | 12.15 | | | | (2.47 | ) | | | 1.74 | |
| Ratios/Supplemental Data: | | | | | | | | | | | | | | | | | | | | |
| Net Assets at end of period (in 000’s) | | $ | 17,466 | | | $ | 20,601 | | | $ | 22,093 | | | $ | 23,975 | | | $ | 30,455 | |
| Ratios of expenses to average net assets (%) | | | 0.77 | | | | 0.77 | | | | 0.77 | | | | 0.77 | | | | 0.76 | |
| Ratio of net investment income to average net assets (%) | | | 5.12 | | | | 4.72 | | | | 4.91 | | | | 5.23 | | | | 5.12 | |
| Portfolio turnover (%)3 | | | 22 | | | | 39 | | | | 58 | | | | 27 | | | | 53 | |
| |
| CLASS II | | | 2018 | | | | 2017 | | | | 2016 | | | | 2015 | | | | 2014 | |
| Net Asset Valueat beginning of period | | $ | 8.67 | | | $ | 8.57 | | | $ | 8.05 | | | $ | 8.79 | | | $ | 9.23 | |
| Income from Investment Operations: | | | | | | | | | | | | | | | | | | | | |
| Net investment income | | | 0.37 | | | | 0.43 | | | | 0.40 | 1 | | | 0.44 | 1 | | | 0.46 | 1 |
| Net realized and unrealized gain (loss) on investments | | | (0.67 | ) | | | 0.09 | | | | 0.56 | | | | (0.68 | ) | | | (0.33 | ) |
| Total from investment operations | | | (0.30 | ) | | | 0.52 | | | | 0.96 | | | | (0.24 | ) | | | 0.13 | |
| Less Distributions From: | | | | | | | | | | | | | | | | | | | | |
| Net investment income | | | (0.45 | ) | | | (0.42 | ) | | | (0.44 | ) | | | (0.50 | ) | | | (0.57 | ) |
| Net increase (decrease) in net asset value | | | (0.75 | ) | | | 0.10 | | | | 0.52 | | | | (0.74 | ) | | | (0.44 | ) |
| Net Asset Valueat end of period | | $ | 7.92 | | | $ | 8.67 | | | $ | 8.57 | | | $ | 8.05 | | | $ | 8.79 | |
| Total Return (%)2 | | | (3.44 | ) | | | 6.06 | | | | 11.87 | | | | (2.71 | ) | | | 1.48 | |
| Ratios/Supplemental Data: | | | | | | | | | | | | | | | | | | | | |
| Net Assets at end of period (in 000’s) | | $ | 4,605 | | | $ | 5,562 | | | $ | 5,314 | | | $ | 5,943 | | | $ | 6,685 | |
| Ratios of expenses to average net assets (%) | | | 1.02 | | | | 1.02 | | | | 1.02 | | | | 1.02 | | | | 1.01 | |
| Ratio of net investment income to average net assets (%) | | | 4.87 | | | | 4.47 | | | | 4.66 | | | | 4.98 | | | | 4.88 | |
| Portfolio turnover (%)3 | | | 22 | | | | 39 | | | | 58 | | | | 27 | | | | 53 | |
1 | Based on average shares outstanding during the year. |
2 | These returns are after all charges at the mutual fund level have been subtracted. These returns are higher than the returns at the separate account level because charges made at the separate account level have not been subtracted. Total returns are not annualized for periods less than one year. |
3 | Portfolio turnover is calculated at the fund level and represents the entire fiscal year or period. |
See accompanying Notes to Financial Statements.
Ultra Series Fund| December 31, 2018
| |
| Financial Highlights for a Share of Beneficial Interest Outstanding |
DIVERSIFIED INCOME FUND
| | Year Ended December 31, |
| | | | 2018 | | | | 2017 | | | | 2016 | | | | 2015 | | | | 2014 | |
| CLASS I | | | | | | | | | | | | | | | | | | | | |
| Net Asset Valueat beginning of period | | $ | 19.55 | | | $ | 18.40 | | | $ | 18.64 | | | $ | 20.30 | | | $ | 20.76 | |
| Income from Investment Operations: | | | | | | | | | | | | | | | | | | | | |
| Net investment income | | | 0.47 | | | | 0.45 | | | | 0.44 | 1 | | | 0.46 | 1 | | | 0.47 | 1 |
| Net realized and unrealized gain (loss) on investments | | | (0.65 | ) | | | 2.00 | | | | 1.24 | | | | (0.43 | ) | | | 1.02 | |
| Total from investment operations | | | (0.18 | ) | | | 2.45 | | | | 1.68 | | | | 0.03 | | | | 1.49 | |
| Less Distributions From: | | | | | | | | | | | | | | | | | | | | |
| Net investment income | | | (0.48 | ) | | | (0.45 | ) | | | (0.49 | ) | | | (0.52 | ) | | | (0.52 | ) |
| Capital gains | | | (1.63 | ) | | | (0.85 | ) | | | (1.43 | ) | | | (1.17 | ) | | | (1.43 | ) |
| Total distributions | | | (2.11 | ) | | | (1.30 | ) | | | (1.92 | ) | | | (1.69 | ) | | | (1.95 | ) |
| Net increase (decrease) in net asset value | | | (2.29 | ) | | | 1.15 | | | | (0.24 | ) | | | (1.66 | ) | | | (0.46 | ) |
| Net Asset Valueat end of period | | $ | 17.26 | | | $ | 19.55 | | | $ | 18.40 | | | $ | 18.64 | | | $ | 20.30 | |
| Total Return (%)2 | | | (0.76 | ) | | | 13.31 | | | | 8.99 | | | | 0.11 | | | | 7.12 | |
| Ratios/Supplemental Data: | | | | | | | | | | | | | | | | | | | | |
| Net Assets at end of period (in 000’s) | | $ | 201,421 | | | $ | 239,212 | | | $ | 245,490 | | | $ | 267,001 | | | $ | 327,951 | |
| Ratios of expenses to average net assets (%) | | | 0.72 | | | | 0.72 | | | | 0.72 | | | | 0.72 | | | | 0.71 | |
| Ratio of net investment income to average net assets (%) | | | 2.17 | | | | 2.13 | | | | 2.25 | | | | 2.27 | | | | 2.20 | |
| Portfolio turnover (%)3 | | | 26 | | | | 16 | | | | 34 | | | | 21 | | | | 24 | |
| |
| CLASS II | | | 2018 | | | | 2017 | | | | 2016 | | | | 2015 | | | | 2014 | |
| Net Asset Valueat beginning of period | | $ | 19.41 | | | $ | 18.31 | | | $ | 18.57 | | | $ | 20.23 | | | $ | 20.71 | |
| Income from Investment Operations: | | | | | | | | | | | | | | | | | | | | |
| Net investment income | | | 0.38 | | | | 0.37 | | | | 0.39 | 1 | | | 0.41 | 1 | | | 0.41 | 1 |
| Net realized and unrealized gain (loss) on investments | | | (0.60 | ) | | | 2.00 | | | | 1.23 | | | | (0.42 | ) | | | 1.02 | |
| Total from investment operations | | | (0.22 | ) | | | 2.37 | | | | 1.62 | | | | (0.01 | ) | | | 1.43 | |
| Less Distributions From: | | | | | | | | | | | | | | | | | | | | |
| Net investment income | | | (0.44 | ) | | | (0.42 | ) | | | (0.45 | ) | | | (0.48 | ) | | | (0.48 | ) |
| Capital gains | | | (1.63 | ) | | | (0.85 | ) | | | (1.43 | ) | | | (1.17 | ) | | | (1.43 | ) |
| Total distributions | | | (2.07 | ) | | | (1.27 | ) | | | (1.88 | ) | | | (1.65 | ) | | | (1.91 | ) |
| Net increase (decrease) in net asset value | | | (2.29 | ) | | | 1.10 | | | | (0.26 | ) | | | (1.66 | ) | | | (0.48 | ) |
| Net Asset Valueat end of period | | $ | 17.12 | | | $ | 19.41 | | | $ | 18.31 | | | $ | 18.57 | | | $ | 20.23 | |
| Total Return (%)2 | | | (1.01 | ) | | | 13.03 | | | | 8.72 | | | | (0.14 | ) | | | 6.85 | |
| Ratios/Supplemental Data: | | | | | | | | | | | | | | | | | | | | |
| Net Assets at end of period (in 000’s) | | $ | 32,925 | | | $ | 40,526 | | | $ | 40,548 | | | $ | 39,894 | | | $ | 44,772 | |
| Ratios of expenses to average net assets (%) | | | 0.97 | | | | 0.97 | | | | 0.97 | | | | 0.97 | | | | 0.96 | |
| Ratio of net investment income to average net assets (%) | | | 1.92 | | | | 1.88 | | | | 1.99 | | | | 2.02 | | | | 1.95 | |
| Portfolio turnover (%)3 | | | 26 | | | | 16 | | | | 34 | | | | 21 | | | | 24 | |
1 | Based on average shares outstanding during the year. |
2 | These returns are after all charges at the mutual fund level have been subtracted. These returns are higher than the returns at the separate account level because charges made at the separate account level have not been subtracted. Total returns are not annualized for periods less than one year. |
3 | Portfolio turnover is calculated at the fund level and represents the entire fiscal year or period. |
See accompanying Notes to Financial Statements.
Ultra Series Fund| December 31, 2018
| |
| Financial Highlights for a Share of Beneficial Interest Outstanding |
LARGE CAP VALUE FUND
| | Year Ended December 31, |
| | | | 2018 | | | | 2017 | | | | 2016 | | | | 2015 | | | | 2014 | |
| CLASS I | | | | | | | | | | | | | | | | | | | | |
| Net Asset Valueat beginning of period | | $ | 28.48 | | | $ | 26.56 | | | $ | 27.06 | | | $ | 33.10 | | | $ | 34.76 | |
| Income from Investment Operations: | | | | | | | | | | | | | | | | | | | | |
| Net investment income | | | 0.50 | | | | 0.69 | | | | 0.42 | 1 | | | 0.35 | 1 | | | 0.43 | 1 |
| Net realized and unrealized gain (loss) on investments | | | (4.09 | ) | | | 3.60 | | | | 3.13 | | | | (1.18 | ) | | | 3.97 | |
| Total from investment operations | | | (3.59 | ) | | | 4.29 | | | | 3.55 | | | | (0.83 | ) | | | 4.40 | |
| Less Distributions From: | | | | | | | | | | | | | | | | | | | | |
| Net investment income | | | (0.46 | ) | | | (0.69 | ) | | | (0.44 | ) | | | (0.40 | ) | | | (0.51 | ) |
| Capital gains | | | (2.01 | ) | | | (1.68 | ) | | | (3.61 | ) | | | (4.81 | ) | | | (5.55 | ) |
| Return of Capital | | | (0.57 | ) | | | – | | | | – | | | | – | | | | – | |
| Total distributions | | | (3.04 | ) | | | (2.37 | ) | | | (4.05 | ) | | | (5.21 | ) | | | (6.06 | ) |
| Net increase (decrease) in net asset value | | | (6.63 | ) | | | 1.92 | | | | (0.50 | ) | | | (6.04 | ) | | | (1.66 | ) |
| Net Asset Valueat end of period | | $ | 21.85 | | | $ | 28.48 | | | $ | 26.56 | | | $ | 27.06 | | | $ | 33.10 | |
| Total Return (%)2 | | | (12.59 | ) | | | 16.23 | | | | 13.01 | | | | (2.68 | ) | | | 12.41 | |
| Ratios/Supplemental Data: | | | | | | | | | | | | | | | | | | | | |
| Net Assets at end of period (in 000’s) | | $ | 243,697 | | | $ | 341,213 | | | $ | 347,993 | | | $ | 365,385 | | | $ | 491,416 | |
| Ratios of expenses to average net assets (%) | | | 0.62 | | | | 0.62 | | | | 0.62 | | | | 0.62 | | | | 0.61 | |
| Ratio of net investment income to average net assets (%) | | | 1.54 | | | | 2.28 | | | | 1.50 | | | | 1.09 | | | | 1.18 | |
| Portfolio turnover (%)3 | | | 83 | | | | 77 | | | | 93 | | | | 90 | | | | 82 | |
| |
| CLASS II | | | 2018 | | | | 2017 | | | | 2016 | | | | 2015 | | | | 2014 | |
| Net Asset Valueat beginning of period | | $ | 28.17 | | | $ | 26.32 | | | $ | 26.87 | | | $ | 32.93 | | | $ | 34.64 | |
| Income from Investment Operations: | | | | | | | | | | | | | | | | | | | | |
| Net investment income | | | 0.36 | | | | 0.65 | | | | 0.34 | 1 | | | 0.27 | 1 | | | 0.34 | 1 |
| Net realized and unrealized gain (loss) on investments | | | (3.98 | ) | | | 3.52 | | | | 3.11 | | | | (1.17 | ) | | | 3.94 | |
| Total from investment operations | | | (3.62 | ) | | | 4.17 | | | | 3.45 | | | | (0.90 | ) | | | 4.28 | |
| Less Distributions From: | | | | | | | | | | | | | | | | | | | | |
| Net investment income | | | (0.41 | ) | | | (0.64 | ) | | | (0.39 | ) | | | (0.35 | ) | | | (0.44 | ) |
| Capital gains | | | (2.01 | ) | | | (1.68 | ) | | | (3.61 | ) | | | (4.81 | ) | | | (5.55 | ) |
| Return of Capital | | | (0.57 | ) | | | – | | | | – | | | | – | | | | – | |
| Total distributions | | | (2.99 | ) | | | (2.32 | ) | | | (4.00 | ) | | | (5.16 | ) | | | (5.99 | ) |
| Net increase (decrease) in net asset value | | | (6.61 | ) | | | 1.85 | | | | (0.55 | ) | | | (6.06 | ) | | | (1.71 | ) |
| Net Asset Valueat end of period | | $ | 21.56 | | | $ | 28.17 | | | $ | 26.32 | | | $ | 26.87 | | | $ | 32.93 | |
| Total Return (%)2 | | | (12.81 | ) | | | 15.94 | | | | 12.73 | | | | (2.92 | ) | | | 12.13 | |
| Ratios/Supplemental Data: | | | | | | | | | | | | | | | | | | | | |
| Net Assets at end of period (in 000’s) | | $ | 3,829 | | | $ | 5,539 | | | $ | 4,709 | | | $ | 5,509 | | | $ | 6,700 | |
| Ratios of expenses to average net assets (%) | | | 0.87 | | | | 0.87 | | | | 0.87 | | | | 0.87 | | | | 0.86 | |
| Ratio of net investment income to average net assets (%) | | | 1.29 | | | | 2.08 | | | | 1.24 | | | | 0.84 | | | | 0.93 | |
| Portfolio turnover (%)3 | | | 83 | | | | 77 | | | | 93 | | | | 90 | | | | 82 | |
1 | Based on average shares outstanding during the year. |
2 | These returns are after all charges at the mutual fund level have been subtracted. These returns are higher than the returns at the separate account level because charges made at the separate account level have not been subtracted. Total returns are not annualized for periods less than one year. |
3 | Portfolio turnover is calculated at the fund level and represents the entire fiscal year or period. |
See accompanying Notes to Financial Statements.
Ultra Series Fund| December 31, 2018
| |
| Financial Highlights for a Share of Beneficial Interest Outstanding |
LARGE CAP GROWTH FUND
| | Year Ended December 31, |
| | | | 2018 | | | | 2017 | | | | 2016 | | | | 2015 | | | | 2014 | |
| CLASS I | | | | | | | | | | | | | | | | | | | | |
| Net Asset Valueat beginning of period | | $ | 26.54 | | | $ | 24.84 | | | $ | 25.12 | | | $ | 27.27 | | | $ | 28.76 | |
| Income from Investment Operations: | | | | | | | | | | | | | | | | | | | | |
| Net investment income | | | 0.20 | | | | 0.22 | | | | 0.20 | 1 | | | 0.28 | 1 | | | 0.19 | 1 |
| Net realized and unrealized gain on investments | | | (0.52 | ) | | | 5.32 | | | | 1.23 | | | | 0.64 | | | | 3.32 | |
| Total from investment operations | | | (0.32 | ) | | | 5.54 | | | | 1.43 | | | | 0.92 | | | | 3.51 | |
| Less Distributions From: | | | | | | | | | | | | | | | | | | | | |
| Net investment income | | | (0.19 | ) | | | (0.22 | ) | | | (0.22 | ) | | | (0.32 | ) | | | (0.20 | ) |
| Capital gains | | | (8.84 | ) | | | (3.62 | ) | | | (1.49 | ) | | | (2.75 | ) | | | (4.80 | ) |
| Total distributions | | | (9.03 | ) | | | (3.84 | ) | | | (1.71 | ) | | | (3.07 | ) | | | (5.00 | ) |
| Net increase (decrease) in net asset value | | | (9.35 | ) | | | 1.70 | | | | (0.28 | ) | | | (2.15 | ) | | | (1.49 | ) |
| Net Asset Valueat end of period | | $ | 17.19 | | | $ | 26.54 | | | $ | 24.84 | | | $ | 25.12 | | | $ | 27.27 | |
| Total Return (%)2 | | | (0.28 | ) | | | 22.28 | | | | 5.74 | | | | 3.26 | | | | 12.13 | |
| Ratios/Supplemental Data: | | | | | | | | | | | | | | | | | | | | |
| Net Assets at end of period (in 000’s) | | $ | 184,508 | | | $ | 232,362 | | | $ | 223,450 | | | $ | 251,524 | | | $ | 305,800 | |
| Ratios of expenses to average net assets (%) | | | 0.82 | | | | 0.82 | | | | 0.82 | | | | 0.82 | | | | 0.81 | |
| Ratio of net investment income to average net assets (%) | | | 0.70 | | | | 0.75 | | | | 0.80 | | | | 1.02 | | | | 0.63 | |
| Portfolio turnover (%)3 | | | 73 | | | | 22 | | | | 13 | | | | 19 | | | | 33 | |
| |
| CLASS II | | | 2018 | | | | 2017 | | | | 2016 | | | | 2015 | | | | 2014 | |
| Net Asset Valueat beginning of period | | $ | 26.22 | | | $ | 24.60 | | | $ | 24.92 | | | $ | 27.10 | | | $ | 28.63 | |
| Income from Investment Operations: | | | | | | | | | | | | | | | | | | | | |
| Net investment income | | | 0.19 | | | | 0.14 | | | | 0.14 | 1 | | | 0.21 | 1 | | | 0.11 | 1 |
| Net realized and unrealized gain on investments | | | (0.56 | ) | | | 5.28 | | | | 1.21 | | | | 0.63 | | | | 3.32 | |
| Total from investment operations | | | (0.37 | ) | | | 5.42 | | | | 1.35 | | | | 0.84 | | | | 3.43 | |
| Less Distributions From: | | | | | | | | | | | | | | | | | | | | |
| Net investment income | | | (0.16 | ) | | | (0.18 | ) | | | (0.18 | ) | | | (0.27 | ) | | | (0.16 | ) |
| Capital gains | | | (8.84 | ) | | | (3.62 | ) | | | (1.49 | ) | | | (2.75 | ) | | | (4.80 | ) |
| Total distributions | | | (9.00 | ) | | | (3.80 | ) | | | (1.67 | ) | | | (3.02 | ) | | | (4.96 | ) |
| Net increase (decrease) in net asset value | | | (9.37 | ) | | | 1.62 | | | | (0.32 | ) | | | (2.18 | ) | | | (1.53 | ) |
| Net Asset Valueat end of period | | $ | 16.85 | | | $ | 26.22 | | | $ | 24.60 | | | $ | 24.92 | | | $ | 27.10 | |
| Total Return (%)2 | | | (0.53 | ) | | | 21.98 | | | | 5.47 | | | | 3.00 | | | | 11.85 | |
| Ratios/Supplemental Data: | | | | | | | | | | | | | | | | | | | | |
| Net Assets at end of period (in 000’s) | | $ | 17,704 | | | $ | 23,445 | | | $ | 23,774 | | | $ | 27,749 | | | $ | 32,168 | |
| Ratios of expenses to average net assets (%) | | | 1.07 | | | | 1.07 | | | | 1.07 | | | | 1.07 | | | | 1.06 | |
| Ratio of net investment income to average net assets (%) | | | 0.45 | | | | 0.50 | | | | 0.55 | | | | 0.77 | | | | 0.38 | |
| Portfolio turnover (%)3 | | | 73 | | | | 22 | | | | 13 | | | | 19 | | | | 33 | |
1 | Based on average shares outstanding during the year. |
2 | These returns are after all charges at the mutual fund level have been subtracted. These returns are higher than the returns at the separate account level because charges made at the separate account level have not been subtracted. Total returns are not annualized for periods less than one year. |
3 | Portfolio turnover is calculated at the fund level and represents the entire fiscal year or period. |
See accompanying Notes to Financial Statements.
Ultra Series Fund| December 31, 2018
| |
| Financial Highlights for a Share of Beneficial Interest Outstanding |
MID CAP FUND
| | Year Ended December 31, |
| | | | 2018 | | | | 2017 | | | | 2016 | | | | 2015 | | | | 2014 | |
| CLASS I | | | | | | | | | | | | | | | | | | | | |
| Net Asset Valueat beginning of period | | $ | 18.97 | | | $ | 18.11 | | | $ | 17.65 | | | $ | 19.30 | | | $ | 21.76 | |
| Income from Investment Operations: | | | | | | | | | | | | | | | | | | | | |
| Net investment income (loss) | | | – | | | | (0.01 | ) | | | 0.01 | 1 | | | (0.05 | )1 | | | 0.02 | 1 |
| Net realized and unrealized gain on investments | | | (0.37 | ) | | | 2.85 | | | | 2.22 | | | | 0.27 | | | | 2.13 | |
| Total from investment operations | | | (0.37 | ) | | | 2.84 | | | | 2.23 | | | | 0.22 | | | | 2.15 | |
| Less Distributions From: | | | | | | | | | | | | | | | | | | | | |
| Net investment income | | | – | | | | – | | | | (0.00 | )4 | | | (0.01 | ) | | | (0.01 | ) |
| Capital gains | | | (3.41 | ) | | | (1.98 | ) | | | (1.77 | ) | | | (1.86 | ) | | | (4.60 | ) |
| Total distributions | | | (3.41 | ) | | | (1.98 | ) | | | (1.77 | ) | | | (1.87 | ) | | | (4.61 | ) |
| Net increase (decrease) in net asset value | | | (3.78 | ) | | | 0.86 | | | | 0.46 | | | | (1.65 | ) | | | (2.46 | ) |
| Net Asset Valueat end of period | | $ | 15.19 | | | $ | 18.97 | | | $ | 18.11 | | | $ | 17.65 | | | $ | 19.30 | |
| Total Return (%)2 | | | (1.50 | ) | | | 15.74 | | | | 12.84 | | | | 1.04 | | | | 9.82 | |
| Ratios/Supplemental Data: | | | | | | | | | | | | | | | | | | | | |
| Net Assets at end of period (in 000’s) | | $ | 152,077 | | | $ | 192,140 | | | $ | 203,076 | | | $ | 220,979 | | | $ | 286,704 | |
| Ratios of expenses to average net assets (%) | | | 0.92 | | | | 0.92 | | | | 0.92 | | | | 0.92 | | | | 0.91 | |
| Ratio of net investment income (loss) to average net assets (%) | | | (0.03 | ) | | | (0.07 | ) | | | 0.04 | | | | (0.24 | ) | | | 0.10 | |
| Portfolio turnover (%)3 | | | 25 | | | | 22 | | | | 21 | | | | 28 | | | | 35 | |
| |
| CLASS II | | | 2018 | | | | 2017 | | | | 2016 | | | | 2015 | | | | 2014 | |
| Net Asset Valueat beginning of period | | $ | 18.59 | | | $ | 17.83 | | | $ | 17.44 | | | $ | 19.13 | | | $ | 21.65 | |
| Income from Investment Operations: | | | | | | | | | | | | | | | | | | | | |
| Net investment income (loss) | | | (0.07 | ) | | | (0.08 | ) | | | (0.04 | )1 | | | (0.09 | )1 | | | (0.03 | )1 |
| Net realized and unrealized gain on investments | | | (0.34 | ) | | | 2.82 | | | | 2.20 | | | | 0.26 | | | | 2.11 | |
| Total from investment operations | | | (0.41 | ) | | | 2.74 | | | | 2.16 | | | | 0.17 | | | | 2.08 | |
| Less Distributions From: | | | | | | | | | | | | | | | | | | | | |
| Capital gains | | | (3.41 | ) | | | (1.98 | ) | | | (1.77 | ) | | | (1.86 | ) | | | (4.60 | ) |
| Total distributions | | | (3.41 | ) | | | (1.98 | ) | | | (1.77 | ) | | | (1.86 | ) | | | (4.60 | ) |
| Net increase (decrease) in net asset value | | | (3.82 | ) | | | 0.76 | | | | 0.39 | | | | (1.69 | ) | | | (2.52 | ) |
| Net Asset Valueat end of period | | $ | 14.77 | | | $ | 18.59 | | | $ | 17.83 | | | $ | 17.44 | | | $ | 19.13 | |
| Total Return (%)2 | | | (1.75 | ) | | | 15.45 | | | | 12.55 | | | | 0.79 | | | | 9.55 | |
| Ratios/Supplemental Data: | | | | | | | | | | | | | | | | | | | | |
| Net Assets at end of period (in 000’s) | | $ | 7,921 | | | $ | 10,509 | | | $ | 11,142 | | | $ | 12,710 | | | $ | 15,067 | |
| Ratios of expenses to average net assets (%) | | | 1.17 | | | | 1.17 | | | | 1.17 | | | | 1.17 | | | | – | |
| Ratio of net investment income to average net assets | | | (0.28 | ) | | | (0.32 | ) | | | (0.21 | ) | | | (0.49 | ) | | | (0.15 | ) |
| Portfolio turnover (%)3 | | | 25 | | | | 22 | | | | 21 | | | | 28 | | | | 35 | |
1 | Based on average shares outstanding during the year. |
2 | These returns are after all charges at the mutual fund level have been subtracted. These returns are higher than the returns at the separate account level because charges made at the separate account level have not been subtracted. Total returns are not annualized for periods less than one year. |
3 | Portfolio turnover is calculated at the fund level and represents the entire fiscal year or period. |
4 | Amounts represent less than $0.005 per share. |
See accompanying Notes to Financial Statements.
Ultra Series Fund| December 31, 2018
| |
| Financial Highlights for a Share of Beneficial Interest Outstanding |
INTERNATIONAL STOCK FUND
| | Year Ended December 31, |
| | | | 2018 | | | | 2017 | | | | 2016 | | | | 2015 | | | | 2014 | |
| CLASS I | | | | | | | | | | | | | | | | | | | | |
| Net Asset Valueat beginning of period | | $ | 11.73 | | | $ | 9.69 | | | $ | 10.16 | | | $ | 10.77 | | | $ | 12.99 | |
| Income from Investment Operations: | | | | | | | | | | | | | | | | | | | | |
| Net investment income | | | 0.21 | | | | 0.17 | | | | 0.18 | 1 | | | 0.19 | 1 | | | 0.27 | 1 |
| Net realized and unrealized gain (loss) on investments | | | (1.82 | ) | | | 2.01 | | | | (0.47 | ) | | | (0.56 | ) | | | (1.10 | ) |
| Total from investment operations | | | (1.61 | ) | | | 2.18 | | | | (0.29 | ) | | | (0.37 | ) | | | (0.83 | ) |
| Less Distributions From: | | | | | | | | | | | | | | | | | | | | |
| Net investment income | | | (0.19 | ) | | | (0.14 | ) | | | (0.18 | ) | | | (0.22 | ) | | | (0.47 | ) |
| Capital gains | | | – | | | | – | | | | – | | | | (0.02 | ) | | | (0.92 | ) |
| Total distributions | | | (0.19 | ) | | | (0.14 | ) | | | (0.18 | ) | | | (0.24 | ) | | | (1.39 | ) |
| Net increase (decrease) in net asset value | | | (1.80 | ) | | | 2.04 | | | | (0.47 | ) | | | (0.61 | ) | | | (2.22 | ) |
| Net Asset Valueat end of period | | $ | 9.93 | | | $ | 11.73 | | | $ | 9.69 | | | $ | 10.16 | | | $ | 10.77 | |
| Total Return (%)2 | | | (13.69 | ) | | | 22.54 | | | | (2.91 | ) | | | (3.45 | ) | | | (6.76 | ) |
| Ratios/Supplemental Data: | | | | | | | | | | | | | | | | | | | | |
| Net Assets at end of period (in 000’s) | | $ | 21,130 | | | $ | 27,516 | | | $ | 26,809 | | | $ | 32,560 | | | $ | 38,826 | |
| Ratios of expenses to average net assets (%) | | | 1.17 | | | | 1.17 | | | | 1.17 | | | | 1.17 | | | | 1.17 | |
| Ratio of net investment income to average net assets (%) | | | 1.59 | | | | 1.27 | | | | 1.84 | | | | 1.70 | | | | 2.09 | |
| Portfolio turnover (%)3 | | | 33 | | | | 28 | | | | 98 | | | | 23 | | | | 103 | |
| |
| CLASS II | | | 2018 | | | | 2017 | | | | 2016 | | | | 2015 | | | | 2014 | |
| Net Asset Valueat beginning of period | | $ | 11.67 | | | $ | 9.65 | | | $ | 10.14 | | | $ | 10.74 | | | $ | 12.96 | |
| Income from Investment Operations: | | | | | | | | | | | | | | | | | | | | |
| Net investment income | | | 0.11 | | | | 0.08 | | | | 0.16 | 1 | | | 0.16 | 1 | | | 0.22 | 1 |
| Net realized and unrealized gain (loss) on investments | | | (1.73 | ) | | | 2.06 | | | | (0.49 | ) | | | (0.55 | ) | | | (1.08 | ) |
| Total from investment operations | | | (1.62 | ) | | | 2.14 | | | | (0.33 | ) | | | (0.39 | ) | | | (0.86 | ) |
| Less Distributions From: | | | | | | | | | | | | | | | | | | | | |
| Net investment income | | | (0.17 | ) | | | (0.12 | ) | | | (0.16 | ) | | | (0.19 | ) | | | (0.44 | ) |
| Capital gains | | | – | | | | – | | | | – | | | | (0.02 | ) | | | (0.92 | ) |
| Total distributions | | | (0.17 | ) | | | (0.12 | ) | | | (0.16 | ) | | | (0.21 | ) | | | (1.36 | ) |
| Net increase (decrease) in net asset value | | | (1.79 | ) | | | 2.02 | | | | (0.49 | ) | | | (0.60 | ) | | | (2.22 | ) |
| Net Asset Valueat end of period | | $ | 9.88 | | | $ | 11.67 | | | $ | 9.65 | | | $ | 10.14 | | | $ | 10.74 | |
| Total Return (%)2 | | | (13.91 | ) | | | 22.24 | | | | (3.16 | ) | | | (3.69 | ) | | | (6.99 | ) |
| Ratios/Supplemental Data: | | | | | | | | | | | | | | | | | | | | |
| Net Assets at end of period (in 000’s) | | $ | 9,219 | | | $ | 13,257 | | | $ | 12,796 | | | $ | 14,641 | | | $ | 16,174 | |
| Ratios of expenses to average net assets (%) | | | 1.42 | | | | 1.42 | | | | 1.42 | | | | 1.42 | | | | 1.42 | |
| Ratio of net investment income to average net assets (%) | | | 1.35 | | | | 1.02 | | | | 1.58 | | | | 1.43 | | | | 1.72 | |
| Portfolio turnover (%)3 | | | 33 | | | | 28 | | | | 98 | | | | 23 | | | | 103 | |
1 | Based on average shares outstanding during the year. |
2 | These returns are after all charges at the mutual fund level have been subtracted. These returns are higher than the returns at the separate account level because charges made at the separate account level have not been subtracted. Total returns are not annualized for periods less than one year. |
3 | Portfolio turnover is calculated at the fund level and represents the entire fiscal year or period. |
See accompanying Notes to Financial Statements.
Ultra Series Fund| December 31, 2018
| |
| Financial Highlights for a Share of Beneficial Interest Outstanding |
MADISON TARGET RETIREMENT 2020 FUND
| | Year Ended December 31, |
| | | | 2018* | | | | 2017 | | | | 2016 | | | | 2015 | | | | 2014 | |
| CLASS I | | | | | | | | | | | | | | | | | | | | |
| Net Asset Valueat beginning of period | | $ | 7.93 | | | $ | 8.06 | | | $ | 8.04 | | | $ | 8.67 | | | $ | 8.76 | |
| Income from Investment Operations: | | | | | | | | | | | | | | | | | | | | |
| Net investment income | | | 0.16 | | | | 0.19 | | | | 0.15 | 1 | | | 0.13 | 1 | | | 0.19 | 1 |
| Net realized and unrealized gain (loss) on investments | | | (0.32 | ) | | | 0.48 | | | | 0.32 | | | | (0.15 | ) | | | 0.42 | |
| Total from investment operations | | | (0.16 | ) | | | 0.67 | | | | 0.47 | | | | (0.02 | ) | | | 0.61 | |
| Less Distributions From: | | | | | | | | | | | | | | | | | | | | |
| Net investment income | | | (0.19 | ) | | | (0.37 | ) | | | (0.18 | ) | | | (0.20 | ) | | | (0.24 | ) |
| Capital gains | | | (0.10 | ) | | | (0.43 | ) | | | (0.27 | ) | | | (0.41 | ) | | | (0.46 | ) |
| Return of Capital | | | (0.10 | ) | | | – | | | | – | | | | – | | | | – | |
| Total distributions | | | (0.39 | ) | | | (0.80 | ) | | | (0.45 | ) | | | (0.61 | ) | | | (0.70 | ) |
| Net increase (decrease) in net asset value | | | (0.55 | ) | | | (0.13 | ) | | | 0.02 | | | | (0.63 | ) | | | (0.09 | ) |
| Net Asset Valueat end of period | | $ | 7.38 | | | $ | 7.93 | | | $ | 8.06 | | | $ | 8.04 | | | $ | 8.67 | |
| Total Return (%)2 | | | (2.11 | ) | | | 8.34 | | | | 5.68 | | | | (0.34 | ) | | | 7.11 | |
| Ratios/Supplemental Data: | | | | | | | | | | | | | | | | | | | | |
| Net Assets at end of period (in 000’s) | | $ | 38,523 | | | $ | 47,510 | | | $ | 51,485 | | | $ | 52,858 | | | $ | 62,087 | |
| Ratios of expenses to average net assets: | | | | | | | | | | | | | | | | | | | | |
| Before waiver of expenses by Adviser (%) | | | 0.03 | 3 | | | 0.00 | 3 | | | 0.00 | 3 | | | 0.00 | 3,4 | | | 0.30 | |
| After waiver of expenses by Adviser (%) | | | 0.03 | 3 | | | 0.00 | 3 | | | 0.00 | 3 | | | 0.00 | 3,4 | | | 0.21 | 5 |
| Ratio of net investment income to average net assets (%) | | | 1.75 | 3 | | | 1.89 | 3 | | | 1.80 | 3 | | | 1.51 | 3 | | | 2.08 | |
| Portfolio turnover (%)6 | | | 35 | | | | 9 | | | | 7 | | | | 7 | | | | 142 | |
* | Effective November 20, 2018, Fund is not fund-of-fund of GS Portfolio (See Note 1). |
|
1 | Based on average shares outstanding during the year. |
2 | These returns are after all charges at the mutual fund level have been subtracted. These returns are higher than the returns at the separate account level because charges made at the separate account level have not been subtracted. Total returns are not annualized for periods less than one year. |
3 | Amount does not include income or expenses of the underlying GS Target Date Portfolio, nor the underlying expenses of the funds held by the GS Target Date Portfolio. See Note 1 for an explanation of the Fund organizational structure and current prospectus for more complete information regarding the charges and expenses of the Fund. |
4 | Amounts represent less than 0.01%. |
5 | Amount includes fees waived by adviser (see Note 3). |
|
6 | Portfolio turnover is calculated at the fund level and represents the entire fiscal year. |
See accompanying Notes to Financial Statements.
Ultra Series Fund| December 31, 2018
| |
| Financial Highlights for a Share of Beneficial Interest Outstanding |
MADISON TARGET RETIREMENT 2030 FUND
| | Year Ended December 31, |
| | | | 2018* | | | | 2017 | | | | 2016 | | | | 2015 | | | | 2014 | |
| CLASS I | | | | | | | | | | | | | | | | | | | | |
| Net Asset Valueat beginning of period | | $ | 8.16 | | | $ | 8.26 | | | $ | 8.08 | | | $ | 8.77 | | | $ | 8.92 | |
| Income from Investment Operations: | | | | | | | | | | | | | | | | | | | | |
| Net investment income | | | 0.17 | | | | 0.19 | | | | 0.16 | 1 | | | 0.13 | 1 | | | 0.18 | 1 |
| Net realized and unrealized gain (loss) on investments | | | (0.50 | ) | | | 0.89 | | | | 0.44 | | | | (0.21 | ) | | | 0.54 | |
| Total from investment operations | | | (0.33 | ) | | | 1.08 | | | | 0.60 | | | | (0.08 | ) | | | 0.72 | |
| Less Distributions From: | | | | | | | | | | | | | | | | | | | | |
| Net investment income | | | (0.21 | ) | | | (0.38 | ) | | | (0.17 | ) | | | (0.18 | ) | | | (0.22 | ) |
| Capital gains | | | (0.28 | ) | | | (0.80 | ) | | | (0.25 | ) | | | (0.43 | ) | | | (0.65 | ) |
| Total distributions | | | (0.49 | ) | | | (1.18 | ) | | | (0.42 | ) | | | (0.61 | ) | | | (0.87 | ) |
| Net increase (decrease) in net asset value | | | (0.82 | ) | | | (0.10 | ) | | | 0.18 | | | | (0.69 | ) | | | (0.15 | ) |
| Net Asset Valueat end of period | | $ | 7.34 | | | $ | 8.16 | | | $ | 8.26 | | | $ | 8.08 | | | $ | 8.77 | |
| Total Return (%)2 | | | (4.04 | ) | | | 13.18 | | | | 7.35 | | | | (0.86 | ) | | | 8.06 | |
| Ratios/Supplemental Data: | | | | | | | | | | | | | | | | | | | | |
| Net Assets at end of period (in 000’s) | | $ | 62,556 | | | $ | 74,415 | | | $ | 75,564 | | | $ | 74,258 | | | $ | 84,935 | |
| Ratios of expenses to average net assets: | | | | | | | | | | | | | | | | | | | | |
| Before waiver of expenses by Adviser (%) | | | 0.03 | 3 | | | 0.00 | 3 | | | 0.00 | 3 | | | 0.00 | 3,4 | | | 0.30 | |
| After waiver of expenses by Adviser (%) | | | 0.03 | 3 | | | 0.00 | 3 | | | 0.00 | 3 | | | 0.00 | 3,4 | | | 0.21 | 5 |
| Ratio of net investment income to average net assets (%) | | | 1.88 | 3 | | | 1.78 | 3 | | | 1.95 | 3 | | | 1.51 | 3 | | | 1.98 | |
| Portfolio turnover (%)6 | | | 33 | | | | 13 | | | | 6 | | | | 7 | | | | 103 | |
* | Effective November 20, 2018, Fund is not fund-of-fund of GS Portfolio (See Note 1). |
|
1 | Based on average shares outstanding during the year. |
2 | These returns are after all charges at the mutual fund level have been subtracted. These returns are higher than the returns at the separate account level because charges made at the separate account level have not been subtracted. Total returns are not annualized for periods less than one year. |
3 | Amount does not include income or expenses of the underlying GS Target Date Portfolio, nor the underlying expenses of the funds held by the GS Target Date Portfolio. See Note 1 for an explanation of the Fund organizational structure and current prospectus for more complete information regarding the charges and expenses of the Fund. |
4 | Amounts represent less than 0.01%. |
5 | Amount includes fees waived by adviser (see Note 3). |
|
6 | Portfolio turnover is calculated at the fund level and represents the entire fiscal year. |
See accompanying Notes to Financial Statements.
Ultra Series Fund| December 31, 2018
| |
| Financial Highlights for a Share of Beneficial Interest Outstanding |
MADISON TARGET RETIREMENT 2040 FUND
| | Year Ended December 31, |
| | | | 2018* | | | | 2017 | | | | 2016 | | | | 2015 | | | | 2014 | |
| CLASS I | | | | | | | | | | | | | | | | | | | | |
| Net Asset Valueat beginning of period | | $ | 7.55 | | | $ | 7.66 | | | $ | 7.54 | | | $ | 8.37 | | | $ | 8.68 | |
| Income from Investment Operations: | | | | | | | | | | | | | | | | | | | | |
| Net investment income | | | 0.16 | | | | 0.19 | | | | 0.16 | 1 | | | 0.13 | 1 | | | 0.17 | 1 |
| Net realized and unrealized gain (loss) on investments | | | (0.52 | ) | | | 0.97 | | | | 0.46 | | | | (0.20 | ) | | | 0.55 | |
| Total from investment operations | | | (0.36 | ) | | | 1.16 | | | | 0.62 | | | | (0.07 | ) | | | 0.72 | |
| Less Distributions From: | | | | | | | | | | | | | | | | | | | | |
| Net investment income | | | (0.21 | ) | | | (0.38 | ) | | | (0.19 | ) | | | (0.19 | ) | | | (0.22 | ) |
| Capital gains | | | (0.32 | ) | | | (0.89 | ) | | | (0.31 | ) | | | (0.57 | ) | | | (0.81 | ) |
| Total distributions | | | (0.53 | ) | | | (1.27 | ) | | | (0.50 | ) | | | (0.76 | ) | | | (1.03 | ) |
| Net increase (decrease) in net asset value | | | (0.89 | ) | | | (0.11 | ) | | | 0.12 | | | | (0.83 | ) | | | (0.31 | ) |
| Net Asset Valueat end of period | | $ | 6.66 | | | $ | 7.55 | | | $ | 7.66 | | | $ | 7.54 | | | $ | 8.37 | |
| Total Return (%)2 | | | (4.88 | ) | | | 15.16 | | | | 8.31 | | | | (1.01 | ) | | | 8.27 | |
| Ratios/Supplemental Data: | | | | | | | | | | | | | | | | | | | | |
| Net Assets at end of period (in 000’s) | | $ | 38,424 | | | $ | 49,909 | | | $ | 49,515 | | | $ | 49,576 | | | $ | 59,499 | |
| Ratios of expenses to average net assets: | | | | | | | | | | | | | | | | | | | | |
| Before waiver of expenses by Adviser (%) | | | 0.03 | 3 | | | 0.00 | 3 | | | 0.00 | 3 | | | 0.00 | 3,4 | | | 0.30 | |
| After waiver of expenses by Adviser (%) | | | 0.03 | 3 | | | 0.00 | 3 | | | 0.00 | 3 | | | 0.00 | 3,4 | | | 0.21 | 5 |
| Ratio of net investment income to average net assets (%) | | | 1.69 | 3 | | | 1.76 | 3 | | | 2.01 | 3 | | | 1.52 | 3 | | | 1.95 | |
| Portfolio turnover (%)6 | | | 30 | | | | 16 | | | | 7 | | | | 8 | | | | 108 | |
* | Effective November 20, 2018, Fund is not fund-of-fund of GS Portfolio (See Note 1). |
|
1 | Based on average shares outstanding during the year. |
2 | These returns are after all charges at the mutual fund level have been subtracted. These returns are higher than the returns at the separate account level because charges made at the separate account level have not been subtracted. Total returns are not annualized for periods less than one year. |
3 | Amount does not include income or expenses of the underlying GS Target Date Portfolio, nor the underlying expenses of the funds held by the GS Target Date Portfolio. See Note 1 for an explanation of the Fund organizational structure and current prospectus for more complete information regarding the charges and expenses of the Fund. |
4 | Amounts represent less than 0.01%. |
5 | Amount includes fees waived by adviser (see Note 3). |
|
6 | Portfolio turnover is calculated at the fund level and represents the entire fiscal year. |
See accompanying Notes to Financial Statements.
Ultra Series Fund| December 31, 2018
| |
| Financial Highlights for a Share of Beneficial Interest Outstanding |
MADISON TARGET RETIREMENT 2050 FUND
| | Year Ended December 31, |
| | | | 2018 | | | | 2017 | | | | 2016 | | | | 2015 | | | | 2014 | |
| CLASS I | | | | | | | | | | | | | | | | | | | | |
| Net Asset Valueat beginning of period | | $ | 13.60 | | | $ | 12.57 | | | $ | 12.19 | | | $ | 12.97 | | | $ | 12.78 | |
| Income from Investment Operations: | | | | | | | | | | | | | | | | | | | | |
| Net investment income | | | 0.26 | | | | 0.27 | | | | 0.26 | 1 | | | 0.21 | 1 | | | 0.27 | 1 |
| Net realized and unrealized gain (loss) on investments | | | (1.06 | ) | | | 1.87 | | | | 0.84 | | | | (0.33 | ) | | | 0.82 | |
| Total from investment operations | | | (0.80 | ) | | | 2.14 | | | | 1.10 | | | | (0.12 | ) | | | 1.09 | |
| Less Distributions From: | | | | | | | | | | | | | | | | | | | | |
| Net investment income | | | (0.38 | ) | | | (0.54 | ) | | | (0.31 | ) | | | (0.28 | ) | | | (0.27 | ) |
| Capital gains | | | (0.39 | ) | | | (0.57 | ) | | | (0.41 | ) | | | (0.38 | ) | | | (0.63 | ) |
| Total distributions | | | (0.77 | ) | | | (1.11 | ) | | | (0.72 | ) | | | (0.66 | ) | | | (0.90 | ) |
| Net increase (decrease) in net asset value | | | (1.57 | ) | | | 1.03 | | | | 0.38 | | | | (0.78 | ) | | | 0.19 | |
| Net Asset Valueat end of period | | $ | 12.03 | | | $ | 13.60 | | | $ | 12.57 | | | $ | 12.19 | | | $ | 12.97 | |
| Total Return (%)2 | | | (5.85 | ) | | | 16.99 | | | | 8.97 | | | | (0.91 | ) | | | 8.51 | |
| Ratios/Supplemental Data: | | | | | | | | | | | | | | | | | | | | |
| Net Assets at end of period (in 000’s) | | $ | 23,081 | | | $ | 28,231 | | | $ | 23,442 | | | $ | 21,173 | | | $ | 22,799 | |
| Ratios of expenses to average net assets: | | | | | | | | | | | | | | | | | | | | |
| Before waiver of expenses by Adviser (%) | | | 0.03 | 3 | | | 0.00 | 3 | | | 0.00 | 3 | | | 0.00 | 3,4 | | | 0.30 | |
| After waiver of expenses by Adviser (%) | | | 0.03 | 3 | | | 0.00 | 3 | | | 0.00 | 3 | | | 0.00 | 3,4 | | | 0.20 | 5 |
| Ratio of net investment income to average net assets (%) | | | 1.61 | 3 | | | 1.79 | 3 | | | 2.08 | 3 | | | 1.57 | 3 | | | 2.02 | |
| Portfolio turnover (%)6 | | | 37 | | | | 8 | | | | 6 | | | | 13 | | | | 133 | |
* | Effective November 20, 2018, Fund is not fund-of-fund of GS Portfolio (See Note 1). |
|
1 | Based on average shares outstanding during the year. |
2 | These returns are after all charges at the mutual fund level have been subtracted. These returns are higher than the returns at the separate account level because charges made at the separate account level have not been subtracted. Total returns are not annualized for periods less than one year. |
3 | Amount does not include income or expenses of the underlying GS Target Date Portfolio, nor the underlying expenses of the funds held by the GS Target Date Portfolio. See Note 1 for an explanation of the Fund organizational structure and current prospectus for more complete information regarding the charges and expenses of the Fund. |
4 | Amounts represent less than 0.01%. |
5 | Amount includes fees waived by adviser (see Note 3). |
|
6 | Portfolio turnover is calculated at the fund level and represents the entire fiscal year. |
See accompanying Notes to Financial Statements.
Ultra Series Fund| December 31, 2018
| |
| Notes to Financial Statements |
1. ORGANIZATION
The Ultra Series Fund (the “Trust”), a Massachusetts business trust, is registered under the Investment Company Act of 1940, as amended, (the “1940 Act”), as a diversified, open-end management investment company. The Trust is a series trust with, at the end of the period covered by this report, 14 investment portfolios (individually, a “fund,” and collectively, the “funds”), each with different investment objectives and policies. The funds reported within this book at the end of the period were the Core Bond Fund, High Income Fund, Diversified Income Fund, Large Cap Value Fund, Large Cap Growth Fund, Mid Cap Fund and International Stock Fund (collectively, the “Core Funds”), the Conservative Allocation Fund, Moderate Allocation Fund and Aggressive Allocation Fund (collectively, the “Target Allocation Funds”) and the Madison Target Retirement 2020 Fund, Madison Target Retirement 2030 Fund, Madison Target Retirement 2040 Fund, and Madison Target Retirement 2050 Fund, (collectively, the “Target Date Funds”).
The Declaration of Trust permits the Board of Trustees to issue an unlimited number of full and fractional shares of the Trust without par value. All funds, except the Target Date Funds, offer Class I and II shares. The Target Date Funds only offer a single class of shares, Class I shares. Each class of shares represents an interest in the assets of the respective fund and has identical voting, dividend, liquidation and other rights, except that each class of shares bears its own distribution fee, if any, and its proportional share of fund level expenses, and has exclusive voting rights on matters pertaining to Rule 12b-1 under the 1940 Act as it relates to that class and other class specific matters. Shares are offered to separate accounts (the “Accounts”) of CMFG Life Insurance Company and to qualified pension and retirement plans of CMFG Life Insurance Company or its affiliates (“CUNA Mutual Group”). The Trust may, in the future, offer other share classes to separate accounts of insurance companies and to qualified pension and retirement plans that are not affiliated with CUNA Mutual Group. The Trust does not offer shares directly to the general public.
On November 19, 2018, each Target Date Fund exchanged its shares of the corresponding Goldman Sachs (“GS”) Portfolio “in-kind” for individual securities held by the GS Portfolio. As a result, effective November 20, 2018, (i) each of the Target Date Funds achieves its investment objective by investing directly in individual securities, in substantially the same basket of securities in which it invested through its investment in the GS Portfolio, and (ii) the direct fees and expenses of the USF Target Date Funds (namely, the advisory and services fees) will no longer be waived. This transaction was taxable, and resulted in gains (loss) of $(1,325,007) for the Target Retirement 2020 Fund, $1,056,122 for the Target Retirement 2030 Fund, $770,603 for the Target Retirement 2040 Fund, and $2,089,552 for the Target Retirement 2050 Fund.
The Trust has entered into a Management Agreement with Madison Asset Management, LLC (the “Investment Adviser” or “Madison”), pursuant to which Madison manages each Fund’s portfolio of investments. The Investment Adviser, in turn, has entered into a subadvisory agreement with a subadviser (“Subadviser”) for the management of the investments of the International Stock Fund.
2. SIGNIFICANT ACCOUNTING POLICIES
The funds are investment companies that apply the accounting and reporting guidance in the Financial Accounting Standards Board (FASB) Accounting Standards Codification Topic 946,Financial Services-Investment Companies(ASC 946). The following is a summary of significant accounting policies consistently followed by each fund in the preparation of its financial statements.
Portfolio Valuation:The Trust and each series of the Trust referred to individually as a fund values securities and other investments as follows: Equity securities, including closed-end investment companies, American Depositary Receipts (“ADRs”),Global Depositary Receipts (“GDRs”) and exchange-traded funds (“ETFs”) listed on any U.S. or foreign stock
Ultra Series Fund| December 31, 2018
| |
| Notes to Financial Statements |
exchange or quoted on the National Association of Securities Dealers Automated Quotation System (“NASDAQ’’) are valued at the last quoted sale price or official closing price on that exchange or NASDAQ on the valuation day (provided that, for securities traded on NASDAQ, the funds utilize the NASDAQ Official Closing Price (“NOCP”). If no sale occurs, equities traded on a U.S. exchange, foreign exchange or on NASDAQ are valued at the bid price. Debt securities (other than short-term obligations) purchased with a remaining maturity of 61 days or more are valued on the basis of last available bid prices or current market quotations provided by dealers or pricing services approved by the Trust. In determining the value of a particular investment, pricing services may use certain information with respect to transactions in such investments, quotations from dealers, pricing matrixes, market transactions in comparable investments, various relationships observed in the market between investments and calculated yield measures based on valuation technology commonly employed in the market for such investments.
Municipal debt securities are traded via a network among dealers and brokers that connect buyers and sellers. They are valued on the basis of last available bid prices or current market quotations provided by dealers or pricing services approved by the Trust. There may be little trading in the secondary market for the particular bonds and other debt securities, making them more difficult to value or sell. Asset-backed and mortgage-backed securities are valued by independent pricing services using models that consider estimated cash flows of each tranche of the security, establish a benchmark yield and develop an estimated tranche specific spread to the benchmark yield based on the unique attributes of the tranche.
Investments in shares of open-end mutual funds, including money market funds, are valued at their daily net asset value (“NAV”) which is calculated as of the close of regular trading on the New York Stock Exchange (the “NYSE”) (usually 4:00 p.m. Eastern Standard Time) on each day on which the NYSE is open for business. NAV per share is determined by dividing each fund’s total net assets by the number of shares of such fund outstanding at the time of calculation. Because the assets of each Target Allocation Fund and each Target Date Fund consist primarily of shares of other registered investment companies (the “Underlying Funds”), the NAV of each fund is determined based on the NAVs of the Underlying Funds. Total net assets are determined by adding the total current value of portfolio securities, cash, receivables, and other assets and subtracting liabilities. Short-term instruments having maturities of 60 days or less are valued on an amortized cost basis, which approximates fair value.
Over-the-counter securities not listed or traded on NASDAQ are valued at the last sale price on the valuation day. If no sale occurs on the valuation day, an over-the-counter security is valued at the last bid price. Exchange-traded options are valued at the mean of the best bid and ask prices across all option exchanges. Over-the-counter options are valued based upon prices provided by market makers in such securities or dealers in such currencies. Financial futures contracts generally are valued at the settlement price established by the exchange(s) on which the contracts are primarily traded. Spot and forward foreign currency exchange contracts are valued based on quotations supplied by dealers in such contracts. Overnight repurchase agreements are valued at cost, and term repurchase agreements (i.e., those whose maturity exceeds seven days), swaps, caps, collars and floors, if any, are valued at the average of the closing bids obtained daily from at least one dealer.
Through the end of this reporting period, the value of all assets and liabilities expressed in foreign currencies was converted into U.S. dollar values using the then-current exchange rate at the close of regular trading on the NYSE.
All other securities for which either quotations are not readily available, no other sales have occurred, or in the Investment Adviser’s opinion, do not reflect the current fair value, are appraised at their fair values as determined in good faith by the Investment Adviser’s Pricing Committee (the “Committee”) and under the general supervision of the Board of Trustees. When fair value pricing of securities is employed, the prices of securities used by the funds to calculate NAV may differ from market quotations or NOCP. Because the Target Allocation Funds and Target Date Funds primarily invest in Underlying Funds,
Ultra Series Fund| December 31, 2018
| |
| Notes to Financial Statements |
government securities and short-term paper, it is not anticipated that the Investment Adviser will need to “fair value” any of the investments of these funds. However, an Underlying Fund may need to “fair value” one or more of its investments, which may, in turn, require a Target Allocation Fund or Target Date Fund to do the same because of delays in obtaining the Underlying Fund’s NAV.
A fund’s investments will be valued at fair value if, in the judgment of the Committee, an event impacting the value of an investment occurred between the closing time of a security’s primary market or exchange (for example, a foreign exchange or market) and the time the fund’s share price is calculated as of the close of regular trading on the NYSE. Significant events may include, but are not limited to, the following: (1) significant fluctuations in domestic markets, foreign markets or foreign currencies; (2) occurrences not directly tied to the securities markets such as natural disasters, armed conflicts or significant government actions; and (3) major announcements affecting a single issuer or an entire market or market sector. In responding to a significant event, the Committee would determine the fair value of affected securities considering factors including, but not limited to: fundamental analytical data relating to the investment; the nature and duration of any restrictions on the disposition of the investment; and the forces influencing the market(s) in which the investment is purchased or sold.
In addition to the fair value decisions made by the Committee noted above, the Committee also engages an independent fair valuation service to adjust the valuations of foreign equity securities based on specific market-movement parameters established by the Committee and approved by the Board of Trustees. Such adjustments to the valuation of foreign securities are applied automatically upon market close if the parameters established are exceeded. A foreign security is also automatically fair valued if the exchange it is traded on is on holiday.
Security Transactions and Investment Income:Security transactions are accounted for on a trade date basis. Net realized gains or losses on sales are determined by the identified cost method. Net realized gain on investments in the Statement of Operations also includes realized gain distributions received from the underlying exchange-listed funds. Distributions of net realized gains are recorded on the fund’s ex-distribution date. Dividend income is recorded on ex-dividend date, except that certain dividends from foreign securities may be recorded after the ex-dividend date based on when the funds are informed of the dividend. Interest income is recorded on an accrual basis and is increased by the accretion of discount and decreased by the amortization of premium. Amortization and accretion are recorded on the effective yield method.
Expenses:Expenses that are directly related to one fund are charged directly to that fund. Other operating expenses are prorated to the funds on the basis of relative net assets. Class-specific expenses are borne by that class.
Classes:Income and realized and unrealized gains/losses are allocated to the respective classes on the basis of relative net assets.
Repurchase Agreements:Each fund may engage in repurchase agreements. In a repurchase agreement, a security is purchased for a relatively short period (usually not more than seven days) subject to the obligation to sell it back to the issuer at a fixed time and price plus accrued interest. The funds will enter into repurchase agreements only with members of the Federal Reserve System, U.S. Central Credit Union and with “primary dealers” in U.S. Government securities.
The Trust has established a procedure providing that the securities serving as collateral for each repurchase agreement must be delivered to the Trust’s custodian either physically or in book-entry form and that the collateral must be marked to market daily to ensure that each repurchase agreement is fully collateralized at all times. In the event of bankruptcy or other default by a seller of a repurchase agreement, a fund could experience one of the following: delays in liquidating the underlying securities during the period in which the fund seeks to enforce its rights thereto, possible decreased levels of income, declines
Ultra Series Fund| December 31, 2018
| |
| Notes to Financial Statements |
in value of the underlying securities, or lack of access to income during this period and the expense of enforcing its rights. As of December 31, 2018, none of the funds held open repurchase agreements.
Foreign Currency Transactions:The Trust’s books and records are maintained in U.S. dollars. Foreign currency-denominated transactions (i.e., investment securities, assets and liabilities, purchases and sales of investment securities, and income and expenses) are translated into U.S. dollars at the current rate of exchange. The funds enter into contracts on the trade date to settle any securities transactions denominated in foreign currencies on behalf of the funds at the spot rate at settlement.
Each fund reports certain foreign currency-related transactions as components of realized gains or losses for financial reporting purposes, whereas such components are treated as ordinary income for federal income tax purposes. Realized gains or losses associated with currency transactions are included in the Statements of Operations under the heading “Net realized gain (loss) on investments.” The International Stock Fund and Large Cap Value Fund had net realized gains from foreign currency transactions.
The funds do not isolate the portion of gains and losses on investments in securities that is due to changes in the foreign exchange rates from that which is due to change in market prices of securities. Such amounts are categorized as gain or loss on investments for financial reporting purposes.
Forward Foreign Currency Exchange Contracts:Each fund may purchase and sell forward foreign currency exchange contracts for defensive or hedging purposes. When entering into forward foreign currency exchange contracts, the funds agree to receive or deliver a fixed quantity of foreign currency for an agreed-upon price on an agreed future date. These contracts are valued daily. The funds’ net assets reflect unrealized gains or losses on the contracts as measured by the difference between the forward foreign currency exchange rates at the dates of entry into the contracts and the forward rates at the reporting date. The funds realize a gain or a loss at the time the forward foreign currency exchange contracts are settled or closed out with an offsetting contract. Contracts are traded over-the-counter directly with a counterparty. Realized and unrealized gains and losses are included in the Statements of Operations. During the year ended December 31, 2018, none of the funds had open forward foreign currency exchange contracts.
If a fund enters into a forward foreign currency exchange contract to buy foreign currency for any purpose, the fund will be required to place cash or other liquid assets in a segregated account with the fund’s custodian in an amount equal to the value of the fund’s total assets committed to the consummation of the forward contract. If the value of the securities in the segregated account declines, additional cash or securities will be placed in the segregated account so that the value of the account will equal the amount of the fund’s commitment with respect to the contract.
Cash Concentration:At times, the funds maintain cash balances at financial institutions in excess of federally insured limits. The funds monitor this credit risk and have not experienced any losses related to this risk.
Illiquid Securities:Each fund currently limits investments in illiquid securities to 15% of net assets at the time of purchase. An illiquid security is generally defined as a security that a fund reasonably expects cannot be sold or disposed of in current market conditions in seven days or less without the sale or disposition significantly changing the fair value of the security. At December 31, 2018, there were no illiquid securities held in the funds. Pursuant to guidelines adopted by the Board of Trustees, certain unregistered securities are determined to be liquid and are not included within the percent limitations specified above.
Delayed Delivery Securities: Each fund may purchase securities on a when-issued or delayed delivery basis. “When-issued” refers to securities whose terms are available and for which a market exists, but that have not been issued. For when-
Ultra Series Fund| December 31, 2018
| |
| Notes to Financial Statements |
issued or delayed delivery transactions, no payment is made until delivery date, which is typically longer than the normal course of settlement. When a fund enters into an agreement to purchase securities on a when-issued or delayed delivery basis, the fund segregates cash or other liquid securities, of any type or maturity, equal in value to the fund’s commitment. Losses may arise due to changes in the fair value of the underlying securities, if the counterparty does not perform under the contract, or if the issuer does not issue the securities due to political, economic or other factors. As of December 31, 2018, none of the funds had entered into such transactions.
Indemnifications:Under the funds’ organizational documents, the funds’ officers and Trustees are indemnified against certain liabilities arising out of the performance of their duties to the funds. In the normal course of business, the funds enter into contracts that contain a variety of representations and provide general indemnifications. The funds’ maximum liability exposure under these arrangements is unknown, as future claims that have not yet occurred may be made against the funds. However, based on experience, management expects the risk of loss to be remote.
Fair Value Measurements:Each fund has adopted FASB guidance on fair value measurements. Fair value is defined as the price that each fund would receive upon selling an investment in a timely transaction to an independent buyer in the principal or most advantageous market of the investment. A three-tier hierarchy is used to maximize the use of observable market data “inputs” and minimize the use of unobservable “inputs” and to establish classification of fair value measurements for disclosure purposes. Inputs refer broadly to the assumptions that market participants would use in pricing the asset or liability, including assumptions about risk (for example, the risk inherent in a particular valuation technique used to measure fair value including such a pricing model and/or the risk inherent in the inputs used in the valuation technique). Inputs may be observable or unobservable.
Observable inputs are inputs that reflect the assumptions market participants would use in pricing the asset or liability developed based on market data obtained from sources independent of the reporting entity. Unobservable inputs are inputs that reflect the reporting entity’s own assumptions about the assumptions market participants would use in pricing the asset or liability developed based on the best information available in the circumstances. The three-tier hierarchy of inputs is summarized in the three broad Levels listed below:
Level 1 - unadjusted quoted prices in active markets for identical investments
Level 2 - other significant observable inputs (including quoted prices for similar investments, interest rate volatilities, prepayment speeds, credit risk, benchmark yields, transactions, bids, offers, new issues, spreads, and other relationships observed in the markets among comparable securities, underlying equity of the issuer; and proprietary pricing models such as yield measures calculated using factors such as cash flows, financial or collateral performance, and other reference data, etc.)
Level 3 - significant unobservable inputs (including the fund’s own assumptions in determining the fair value of investments)
The valuation techniques used by the funds to measure fair value for the year ended December 31, 2018 maximized the use of observable inputs and minimized the use of unobservable inputs. The funds utilized the following fair value techniques: multi-dimensional relational pricing model and option adjusted spread pricing; the funds estimated the price that would have prevailed in a liquid market for an international equity security given information available at the time of valuation. As of December 31, 2018, none of the funds held securities deemed as a Level 3, and there were no transfers between classification levels.
Ultra Series Fund| December 31, 2018
| |
| Notes to Financial Statements |
| The following is a summary of the inputs used as of December 31, 2018, in valuing the funds’ investments carried at fair value: |
| |
| | | Quoted Prices in | | Significant Other | | Significant | | |
| | | Active Markets for | | Observable | | Unobservable | | |
| | | Identical Investments | | Inputs | | Inputs | | Value at |
| Fund1 | | (Level 1) | | (Level 2) | | (Level 3) | | 12/31/18 |
| Conservative Allocation | | | | | | | | | | | | | | | | |
| Investment Companies | | $ | 113,557,857 | | | $ | – | | | $ | – | | | $ | 113,557,857 | |
| Short-Term Investments | | | 6,007,769 | | | | – | | | | – | | | | 6,007,769 | |
| | | | 119,565,626 | | | | – | | | | – | | | | 119,565,626 | |
| Moderate Allocation | | | | | | | | | | | | | | | | |
| Investment Companies | | | 188,951,185 | | | | – | | | | – | | | | 188,951,185 | |
| Short-Term Investments | | | 14,278,785 | | | | – | | | | – | | | | 14,278,785 | |
| | | | 203,229,970 | | | | – | | | | – | | | | 203,229,970 | |
| Aggressive Allocation | | | | | | | | | | | | | | | | |
| Investment Companies | | | 61,517,701 | | | | – | | | | – | | | | 61,517,701 | |
| Short-Term Investments | | | 2,924,530 | | | | – | | | | – | | | | 2,924,530 | |
| | | | 64,442,231 | | | | – | | | | – | | | | 64,442,231 | |
| Core Bond | | | | | | | | | | | | | | | | |
| Assets: | | | | | | | | | | | | | | | | |
| Asset Backed Securities | | | – | | | | 6,524,813 | | | | – | | | | 6,524,813 | |
| Collateralized Mortgage Obligations | | | – | | | | 2,969,474 | | | | – | | | | 2,969,474 | |
| Commercial Mortgage-Backed Securities | | | – | | | | 3,296,526 | | | | – | | | | 3,296,526 | |
| Corporate Notes and Bonds | | | – | | | | 47,152,437 | | | | – | | | | 47,152,437 | |
| Long Term Municipal Bonds | | | – | | | | 6,756,686 | | | | – | | | | 6,756,686 | |
| Mortgage Backed Securities | | | – | | | | 33,747,188 | | | | – | | | | 33,747,188 | |
| U.S. Government and Agency Obligations | | | – | | | | 29,594,690 | | | | – | | | | 29,594,690 | |
| Short-Term Investments | | | 3,110,858 | | | | – | | | | | | | | 3,110,858 | |
| Options Purchased | | | 1,406 | | | | – | | | | – | | | | 1,406 | |
| | | | 3,112,264 | | | | 130,041,814 | | | | – | | | | 133,154,078 | |
| Liabilities: | | | | | | | | | | | | | | | | |
| Options Written | | | 11,484 | | | | | | | | | | | | 11,484 | |
| High Income | | | | | | | | |
| Corporate Notes and Bonds | | | – | | | | 20,046,640 | | | | – | | | | 20,046,640 | |
| Short-Term Investments | | | 2,809,372 | | | | – | | | | – | | | | 2,809,372 | |
| | | | 2,809,372 | | | | 20,046,640 | | | | – | | | | 22,856,012 | |
| Diversified Income | | | | | | | | | | | | | | | | |
| Common Stocks | | | 149,714,515 | | | | – | | | | – | | | | 149,714,515 | |
| Asset Backed Securities | | | – | | | | 4,079,862 | | | | – | | | | 4,079,862 | |
| Collateralized Mortgage Obligations | | | – | | | | 2,885,827 | | | | – | | | | 2,885,827 | |
| Commercial Mortgage-Backed Securities | | | – | | | | 1,660,753 | | | | – | | | | 1,660,753 | |
| Corporate Notes and Bonds | | | – | | | | 26,976,441 | | | | – | | | | 26,976,441 | |
| Long Term Municipal Bonds | | | – | | | | 5,484,015 | | | | – | | | | 5,484,015 | |
| Mortgage Backed Securities | | | – | | | | 19,319,725 | | | | – | | | | 19,319,725 | |
| U.S. Government and Agency Obligations | | | – | | | | 15,286,644 | | | | – | | | | 15,286,644 | |
| Short-Term Investments | | | 8,799,622 | | | | – | | | | – | | | | 8,799,622 | |
| | | | 158,514,137 | | | | 75,693,267 | | | | – | | | | 234,207,404 | |
| Large Cap Value | | | | | | | | | | | | | | | | |
| Common Stocks | | | 237,108,875 | | | | – | | | | – | | | | 237,108,875 | |
| Short-Term Investments | | | 14,342,967 | | | | – | | | | – | | | | 14,342,967 | |
| | | | 251,451,842 | | | | – | | | | – | | | | 251,451,842 | |
Ultra Series Fund| December 31, 2018
| |
| Notes to Financial Statements |
| |
| | | Quoted Prices in | | Significant Other | | Significant | | |
| | | Active Markets for | | Observable | | Unobservable | | |
| | | Identical Investments | | Inputs | | Inputs | | Value at |
| Fund1 | | (Level 1) | | (Level 2) | | (Level 3) | | 12/31/18 |
| Large Cap Growth | | | | | | | | | | | | | | | | |
| Common Stocks | | $ | 197,997,641 | | | $ | – | | | $ | – | | | $ | 197,997,641 | |
| Short-Term Investments | | | 4,051,688 | | | | – | | | | – | | | | 4,051,688 | |
| | | | 202,049,329 | | | | – | | | | – | | | | 202,049,329 | |
| Mid Cap | | | | | | | | | | | | | | | | |
|
| Common Stocks | | | 153,213,286 | | | | – | | | | – | | | | 153,213,286 | |
| Short-Term Investments | | | 7,069,223 | | | | – | | | | – | | | | 7,069,223 | |
| | | | 160,282,509 | | | | – | | | | – | | | | 160,282,509 | |
| International Stock | | | | | | | | |
| Common Stocks | | | | | | | | |
| Australia | | | – | | | | 602,425 | | | | – | | | | 602,425 | |
| Belgium | | | – | | | | 531,985 | | | | – | | | | 531,985 | |
| Canada | | | – | | | | 1,864,312 | | | | – | | | | 1,864,312 | |
| Denmark | | | – | | | | 428,959 | | | | – | | | | 428,959 | |
| Finland | | | – | | | | 878,493 | | | | – | | | | 878,493 | |
| France | | | – | | | | 3,399,255 | | | | – | | | | 3,399,255 | |
| Germany | | | – | | | | 1,123,693 | | | | – | | | | 1,123,693 | |
| Hong Kong | | | – | | | | 281,566 | | | | – | | | | 281,566 | |
| India | | | 430,040 | | | | – | | | | – | | | | 430,040 | |
| Ireland | | | 1,279,635 | | | | – | | | | – | | | | 1,279,635 | |
| Israel | | | – | | | | 233,706 | | | | – | | | | 233,706 | |
| Japan | | | – | | | | 3,918,514 | | | | – | | | | 3,918,514 | |
| Netherlands | | | – | | | | 2,087,615 | | | | – | | | | 2,087,615 | |
| Norway | | | – | | | | 949,153 | | | | – | | | | 949,153 | |
| Singapore | | | – | | | | 813,922 | | | | – | | | | 813,922 | |
| South Korea | | | – | | | | 215,147 | | | | – | | | | 215,147 | |
| Spain | | | – | | | | 544,338 | | | | – | | | | 544,338 | |
| Sweden | | | – | | | | 1,014,746 | | | | – | | | | 1,014,746 | |
| Switzerland | | | – | | | | 2,254,154 | | | | – | | | | 2,254,154 | |
| United Kingdom | | | 794,102 | | | | 4,642,666 | | | | – | | | | 5,436,768 | |
| Preferred Stocks | | | – | | | | 566,515 | | | | – | | | | 566,515 | |
| Short-Term Investments | | | 1,719,769 | | | | – | | | | – | | | | 1,719,769 | |
| | | | 4,223,546 | | | | 26,351,164 | | | | – | | | | 30,574,710 | |
| Madison Target Retirement 2020 Fund | | | 37,041,903 | | | | – | | | | – | | | | 37,041,903 | |
| Madison Target Retirement 2030 Fund | | | 59,883,038 | | | | – | | | | – | | | | 59,883,038 | |
| Madison Target Retirement 2040 Fund | | | 36,757,458 | | | | – | | | | – | | | | 36,757,458 | |
| Madison Target Retirement 2050 Fund | | | 22,037,775 | | | | – | | | | – | | | | 22,037,775 | |
1See respective portfolio of investments for underlying holdings in each fund. For additional information on the underlying funds held in the Conservative, Moderate and Aggressive Allocation Funds including shareholder prospectuses and financial reports, please visit each underlying funds website or visit the securities and exchange commission website http://www.sec.gov.
Derivatives:The FASB issued guidance intended to enhance financial statement disclosure for derivative instruments and enable investors to understand: a) how and why a fund uses derivative investments, b) how derivative instruments are accounted for, and c) how derivative instruments affect a fund’s financial position, and results of operations.
Ultra Series Fund| December 31, 2018
| |
| Notes to Financial Statements |
The following table presents the types of derivatives in the fund by location and as presented on the Statements of Assets and Liabilities as of December 31, 2018:
Statements of Asset & Liability Presentation of Fair Values of Derivative Instruments
| | | | | Asset Derivatives | | | | Liability Derivatives | | |
| | | | | Statements of Assets and | | | | Statements of Assets and | | |
| Fund | | Underlying Risk | | Liabilities Location | | Fair Value | | Liabilities Location | | Fair Value |
| Core Bond | | Interest rate | | Options purchased | | $ | 1,406 | | Options written | | $ | 11,484 |
The following table presents the effect of derivative instruments on the Statements of Operations for the year ended December 31, 2018:
| Fund | | Statement of Operations | | Underlying Risk | | Realized Gain
(Loss) on Derivatives: | | Change in Unrealized Appreciation
(Depreciation) on Derivatives |
| Core Bond | | Options Purchased | | Interest rate | | $ | (2,354 | ) | | $ | (8,717 | ) |
| | | Options Written | | Interest rate | | | – | | | | 1,317 | |
| Total | | | | | | $ | (2,354 | ) | | $ | (7,400 | ) |
The average volume (based on the open positions at each month-end) of derivative activity during the year ended December 31, 2018.
| | | Options Purchased Contracts(1) | | Options Written Contracts(1) | |
| Core Bond | | 13,750 | | 15 | |
(1)Number of Contracts
There is no impact on the financial statements of the other funds as they did not hold derivative investments during the year ended December 31, 2018.
Recently Issued Accounting Pronouncements.In March 2017, the Financial Accounting Standards Board (“FASB”) issued Accounting Standards Update (ASU) 2017-08 which changes the amortization period for a callable debt security from the maturity date to the earliest call date. The ASU is effective for annual periods beginning after December 15, 2018, and interim periods within those annual periods. At this time, management is still evaluating the impacts this ASU will have on the financial statements.
In August 2018, the FASB issued ASU 2018-13, Fair Value Measurement (Topic 820). The amendments in the ASU impact disclosure requirements for fair value measurement. It is anticipated that this change will enhance the effectiveness of disclosures in the notes to the financial statements. This ASU is effective for fiscal years beginning after December 15, 2019. Early adoption is permitted and can include the entire standard or certain provisions that exclude or amend disclosures. At this time, management is still evaluating the impacts this ASU will have on the financial statements.
In August 2018, the U.S. Securities and Exchange Commission (“SEC”) adopted amendments to certain financial statement disclosure requirements to conform them to Generally Accepted Accounting Principles (“GAAP”) for investment companies. These amendments made certain removals from, changes to and additions to existing disclosure requirements under Regulation S-X. These amendments became effective for filings made with the SEC after November 5, 2018. The funds’ adoption of these amendments, effective with the financial statements prepared as of December 31, 2018, required modified disclosures reflected herein, but had no effect on the funds’ net assets or results of operations.
Ultra Series Fund| December 31, 2018
| |
| Notes to Financial Statements |
3. MANAGEMENT, DISTRIBUTION, SERVICES AGREEMENTS AND OTHER EXPENSES
Management Agreements:For services under the Management Agreements, the Investment Adviser is entitled to receive a management fee, which is calculated daily and paid monthly, at an annual rate based upon the following percentages of average daily net assets of each fund as follows:
| Fund | Management Fee |
| | |
|
| Conservative Allocation | 0.30% |
| Moderate Allocation | 0.30% |
| Aggressive Allocation | 0.30% |
| Core Bond | 0.55% |
| High Income | 0.75% |
| Diversified Income | 0.70% |
| Large Cap Value | 0.60% |
| Large Cap Growth | 0.80% |
| Mid Cap | 0.90% |
| International Stock | 1.15% |
| Madison Target Retirement 2020 | 0.25% |
| Madison Target Retirement 2030 | 0.25% |
| Madison Target Retirement 2040 | 0.25% |
| Madison Target Retirement 2050 | 0.25% |
The Management Agreement for the “Core Funds” and the “Target Allocation Funds” requires the Investment Adviser to provide or arrange to provide overall management of the funds, including but not limited to, investment advisory services, custody, transfer agency, dividend disbursing, legal, accounting and administrative services. The management fee does not cover and these funds pay directly for Trustee compensation, Trustee legal fees and the fees paid to the Trust’s independent registered public accountant. For the Target Date Funds, the Management Agreement requires the Investment Adviser to provide investment management services to the funds. Other services performed by the Investment Adviser for the Target Date Funds are covered under a separate Services Agreement (discussed below).
The Investment Adviser is solely responsible for the payment of all fees to Lazard Asset Management LLC, the Subadviser, for the International Stock Fund. The Investment Adviser manages the remaining Funds without the use of a Subadviser.
The Investment Adviser may from time to time contractually or voluntarily agree to waive a portion of its fees or expenses related to the funds. Effective July 1, 2014, the Investment Adviser contractually agreed to waive a portion (0.10%) of its management fee of the Target Allocation Funds, which waiver is in effect until at least April 30, 2020. For the year ended December 31, 2018, the waivers were as follows:
Waived Fees or Expenses*
| Fund | Class I | Class II | Total Waivers |
| Conservative Allocation | $ 110,675 | $ 25,791 | $ 136,466 |
| Moderate Allocation | 200,827 | 23,394 | 224,221 |
| Aggressive Allocation | 76,036 | 2,084 | 78,120 |
*The Investment Adviser does not have the right to recoup these waived fees.
Distribution Agreement:MFD Distributor, LLC (“MFD”) serves as distributor of the funds. The Trust adopted a distribution and service plan with respect to the Trust’s Class II shares pursuant to Rule 12b-1 under the 1940 Act. Under the plan, the Trust will pay a service fee with regard to Class II shares at an annual rate of 0.25% each fund’s daily net assets.
MFD may from time to time voluntarily agree to waive a portion of its fees or expenses related to the funds. MFD does not have the right to recoup these waived fees.
Services Agreement:With respect to the Target Date Funds only, in addition to the management fee, Madison is entitled to receive a services fee from the Target Date Funds pursuant to the terms of a separate Services Agreement. Under the service agreement, Madison provides or arranges for the Target Date Funds to have all operational and support services needed by the funds, for which Madison is entitled to receive a fee of 0.05% annually based upon the average daily net assets of
Ultra Series Fund| December 31, 2018
| |
| Notes to Financial Statements |
each fund, which is computed and accrued daily and paid monthly. Under this fee arrangement, Madison is responsible for paying all of the funds’ fees and expenses, other than (i) the management fee (described above), (ii) fees related to the funds’ portfolio holdings (such as brokerage commissions, interest on loans, etc.), (iii) acquired fund fees, and (iv) extraordinary or non-recurring fees (such as fees and costs relating to any temporary line of credit the funds may maintain for emergency or extraordinary purposes).
Other Expenses:In addition to the management fee noted above, the funds are responsible to pay the following expenses: expenses for independent audits; fees and expenses of the independent trustees and their independent counsel; brokerage commissions and other expenses incurred in the acquisition or disposition of any securities or other investments; costs of borrowing money, overdrafts (if any) and any potential taxes owed; and extraordinary expenses (including litigation and/or and consulting expenses) as approved by a majority of the independent trustees.
Audit and trustees fees are broken out separately from “other expenses” on the Statements of Operations.
Certain officers and trustees of the Trust are also officers of the Investment Adviser. The funds do not compensate their officers or affiliated trustees. The Nominating and Governance Committee of the Board reviews trustee fees paid to Independent Trustees periodically, and may change such fees at any time.
4. DIVIDENDS FROM NET INCOME AND DISTRIBUTIONS OF CAPITAL GAINS
The funds declare dividends from net investment income and net realized gains from investment transactions, if any, annually, which are reinvested in additional full and fractional shares of the respective funds.
Income and capital gain distributions, if any, are determined in accordance with federal income tax regulations, which may differ from accounting principles generally accepted in the United States of America. Taxable distributions from income and realized capital gains of the funds may differ from book amounts earned during the period due to differences in the timing of capital gains recognition, and due to the reclassification of certain gains or losses from capital to income.
5. SECURITIES TRANSACTIONS
For the year ended December 31, 2018, aggregate cost of purchases and proceeds from sales of securities, other than short-term investment, were as follows:
| | | U.S. Government Securities | | | Other Investment Securities | |
| Fund | | Purchases | | | Sales | | | Purchases | | | Sales | |
| Conservative Allocation | | $ | – | | | $ | – | | | $ | 72,269,379 | | | $ | 97,367,979 | |
| Moderate Allocation | | | – | | | | – | | | | 145,530,887 | | | | 177,977,546 | |
| Aggressive Allocation | | | – | | | | – | | | | 52,185,450 | | | | 68,144,734 | |
| Core Bond | | | 12,899,372 | | | | 34,165,266 | | | | 21,424,560 | | | | 24,047,547 | |
| High Income | | | – | | | | – | | | | 4,850,305 | | | | 6,571,000 | |
| Diversified Income | | | 8,709,861 | | | | 23,452,872 | | | | 57,808,355 | | | | 84,155,341 | |
| Large Cap Value | | | – | | | | – | | | | 259,526,294 | | | | 324,194,668 | |
| Large Cap Growth | | | – | | | | – | | | | 168,262,551 | | | | 218,967,767 | |
| Mid Cap | | | – | | | | – | | | | 44,421,730 | | | | 82,845,296 | |
| International Stock | | | – | | | | – | | | | 11,555,217 | | | | 17,167,895 | |
| Madison Target Retirement 2020 | | | – | | | | – | | | | 14,992,692 | | | | 20,427,839 | |
| Madison Target Retirement 2030 | | | – | | | | – | | | | 23,291,809 | | | | 27,664,743 | |
| Madison Target Retirement 2040 | | | – | | | | – | | | | 14,008,569 | | | | 19,936,198 | |
| Madison Target Retirement 2050 | | | – | | | | – | | | | 10,294,091 | | | | 12,042,117 | |
Ultra Series Fund| December 31, 2018
| |
| Notes to Financial Statements |
6. FUTURES CONTRACTS AND OPTIONS ON FUTURES CONTRACTS
The Core Bond Fund (for purposes of this Note, the “Fund”), may purchase and sell futures contracts and purchase and write options on futures contracts on a limited basis. The Fund may purchase and sell futures contracts based on various securities (such as U.S. Government securities), securities indices, foreign currencies and other financial instruments and indices. The Fund will engage in futures or related options transactions on a limited basis only for bona fide hedging purposes or for purposes of seeking to increase total returns to the extent permitted by regulations of the Commodity Futures Trading Commission.
Futures Contracts.The Core Bond Fund may use futures contracts to manage its exposure to the securities markets or to movements in interest rates and currency values. The primary risks associated with the use of futures contracts are the imperfect correlation between the change in fair value of the securities held by the fund and the prices of futures contracts and the possibility of an illiquid market. Futures contracts are valued based upon their quoted daily settlement prices. Upon entering into a futures contract, the Fund is required to deposit with its futures broker an amount of cash, U.S. Government and Agency Obligations, or other assets, in accordance with the initial margin requirements of the broker or exchange. Futures contracts are marked to market daily and based on such movements in the price of the contracts, an appropriate payable or receivable for the change in value may be posted or collected by the fund (“variation margin”). Gains or losses are recognized but not considered realized until the contracts expire or close. Futures contracts involve, to varying degrees, risk of loss in excess of the variation margin disclosed within exchange traded or centrally cleared financial derivative instruments on the Statements of Assets and Liabilities. During the year ended December 31,2018, the Fund did not enter into any futures contracts.
Options on Futures Contracts.The acquisition of put and call options on futures contracts will give the Core Bond Fund the right (but not the obligation) for a specified price, to sell or to purchase, respectively, the underlying futures contract at any time during the option period. As the purchaser of an option on a futures contract, the Fund obtains the benefit of the futures position if prices move in a favorable direction but limits its risk of loss in the event of an unfavorable price movement to the loss of the premium and transaction costs.
The writing of a call option on a futures contract generates a premium which may partially offset a decline in the value of the Fund’s assets. By writing a call option, the Fund becomes obligated, in exchange for the premium, to sell a futures contract which may have a value higher than the exercise price. Conversely, the writing of a put option on a futures contract generates a premium, which may partially offset an increase in the price of securities that the Fund intends to purchase. However, the Fund becomes obligated to purchase a futures contract, which may have a value lower than the exercise price. Thus, the loss incurred by the Fund in writing options on futures is potentially unlimited and may exceed the amount of the premium received.
7. FOREIGN SECURITIES
Each fund may invest in foreign securities. Foreign securities are defined as securities that are: (i) issued by companies organized outside the U.S. or whose principal operations are outside the U.S., or issued by foreign governments or their agencies or instrumentalities (“foreign issuers”); (ii) principally traded outside of the U.S.; and/or (iii) quoted or denominated in a foreign currency (“non-dollar securities”). Foreign securities include American Depositary Receipts (“ADRs”), European Depositary Receipts (“EDRs”), Global Depositary Receipts (“GDRs”), Swedish Depositary Receipts (“SDRs”) and foreign money market securities. U.S. dollar-denominated securities that are part of the Merrill Lynch U.S. Domestic Master Index are not considered a foreign security.
Certain of the funds have reclaimed receivable balances, in which the funds are due a reclaim on the taxes that have been paid to some foreign jurisdictions. The values of all reclaims are not significant for any of the funds and are reflected in Other
Ultra Series Fund| December 31, 2018
| |
| Notes to Financial Statements |
Assets on the Statements of Assets and Liabilities. These receivables are reviewed to ensure the current receivable balance is reflective of the amount deemed to be collectable.
8. SECURITIES LENDING
The Board of Trustees has authorized the funds, other than the USF Target Date Funds, to engage in securities lending with State Street Bank and Trust Company as securities lending agent pursuant to a Securities Lending Authorization Agreement (the “Agreement”) and subject to the Trust’s securities lending policies and procedures. Under the terms of the Agreement, and subject to the policies and procedures, the authorized funds may lend portfolio securities to qualified borrowers in order to generate additional income, while managing risk associated with the securities lending program. The Agreement requires that loans are collateralized at all times by cash or U.S. government securities, initially equal to at least 102% of the value of domestic securities and 105% of non-domestic securities. The loaned securities and collateral are marked to market daily to maintain collateral at 102% of the total loaned portfolio for each broker/borrower. Amounts earned as interest on investments of cash collateral, net of rebates and fees, if any, are included in the Statements of Operations. The primary risk associated with securities lending is loss associated with investment of cash and non-cash collateral. A secondary risk is if the borrower defaults on its obligation to return the securities loaned because of insolvency or other reasons. The fund could experience delays and costs in recovering securities loaned or in gaining access to the collateral. Under the Agreement, the securities lending agent has provided a limited indemnification in the event of a borrower default. The funds do not have a master netting agreement.
As of December 31, 2018, the aggregate fair value of securities on loan for the Trust was $36,756,104. Cash collateral received for such loans is reinvested into the State Street Navigator Securities Lending Government Money Market Portfolio. Non-cash collateral is comprised of U.S. Treasuries or Government securities. See below for fair value on loan and collateral breakout for each fund and each respective fund’s portfolio of investments for individual securities identified on loan.
| | Fair Value on Loan | Cash Collateral | Non-Cash Collateral |
| Conservative Allocation | $ 8,883,203 | $2,115,228 | $ 7,079,484 |
| Moderate Allocation | 16,766,405 | 7,249,267 | 10,068,171 |
| Aggressive Allocation | 5,546,228 | 1,773,287 | 3,973,709 |
| High Income | 1,028,516 | 1,047,563 | – |
| Large Cap Value | 4,195,234 | 4,182,840 | – |
| International Stock | 336,518 | 352,127 | – |
9. FEDERAL INCOME TAX INFORMATION
It is each fund’s policy to comply with the requirements of Subchapter M of the Internal Revenue Code of 1986, as amended, applicable to regulated investment companies and to distribute all its taxable income to its shareholders and any net realized capital gains at least annually. Accordingly, no provisions for federal income taxes are recorded in the accompanying statements.
The funds have not recorded any liabilities for material unrecognized tax benefits as of December 31, 2018. It is each fund’s policy to recognize accrued interest and penalties related to uncertain tax benefits in income taxes, as appropriate. Tax years that remain open to examination by major tax jurisdictions include tax years ended December 31, 2015 through December 31, 2018.
The tax character of distributions paid during the years ended December 31, 2018 and 2017 is as follows:
Ultra Series Fund| December 31, 2018
| |
| Notes to Financial Statements |
| | Ordinary Income | | Long-Term Capital Gain | | Return of Capital |
| Fund | 2018 | | 2017 | | 2018 | | 2017 | | 2018 |
| Conservative Allocation | $2,957,784 | | $4,546,610 | | $ 5,963,833 | | $2,460,150 | | $ – |
| Moderate Allocation | 3,510,775 | | 7,709,142 | | 18,694,490 | | 9,699,920 | | – |
| Aggressive Allocation | 1,266,238 | | 2,844,088 | | 8,951,300 | | 4,180,143 | | – |
| Core Bond | 4,228,108 | | 4,809,361 | | – | | – | | – |
| High Income | 1,232,470 | | 1,276,614 | | – | | – | | – |
| Diversified Income | 5,793,153 | | 6,253,492 | | 19,958,243 | | 11,268,342 | | – |
| Large Cap Value | 4,531,338 | | 8,346,432 | | 19,643,572 | | 18,552,627 | | 6,385,380 |
| Large Cap Growth | 5,295,875 | | 2,512,025 | | 65,226,901 | | 30,308,312 | | – |
| Mid Cap | 2,164,080 | | 295,753 | | 27,283,870 | | 18,952,962 | | – |
| International Stock | 548,204 | | 473,708 | | – | | – | | – |
| Madison Target Retirement 2020 | 961,496 | | 2,044,512 | | 46,153 | | 2,293,212 | | 919,435 |
| Madison Target Retirement 2030 | 1,692,937 | | 3,157,660 | | 2,265,508 | | 6,279,588 | | – |
| Madison Target Retirement 2040 | 1,136,267 | | 2,306,823 | | 1,706,912 | | 4,876,893 | | – |
| Madison Target Retirement 2050 | 684,361 | | 1,042,743 | | 703,521 | | 1,071,396 | | – |
As of December 31, 2018, the components of distributable earnings on a tax basis are as follows:
|
| | | Ordinary | | Tax Exempt | | Long-Term |
| Fund | | Income | | Income | | Capital Gain |
| Conservative Allocation | | $ 28,453 | | $ – | | $ 52,357 |
| Moderate Allocation | | 714,013 | | – | | – |
| Aggressive Allocation | | – | | – | | 158,199 |
| Core Bond | | 77,175 | | – | | – |
| High Income | | 25,452 | | – | | – |
| Diversified Income | | 65,137 | | – | | 57,075 |
| Large Cap Value | | – | | – | | – |
| Large Cap Growth | | 210,869 | | – | | 2,580,305 |
| Mid Cap | | 49,684 | | – | | 650,744 |
| International Stock | | 19,378 | | – | | – |
| Madison Target Retirement 2020 | | – | | – | | – |
| Madison Target Retirement 2030 | | 33,243 | | – | | 1,116,639 |
| Madison Target Retirement 2040 | | 22,241 | | – | | 793,651 |
| Madison Target Retirement 2050 | | 13,534 | | – | | 2,093,633 |
For federal income tax purposes, the funds listed below have capital loss carryforwards as of December 31, 2018, which are available to offset future capital gains, if any, realized through the fiscal year listed:
| Fund | | No Expiration Date Short-Term | | No Expiration Date Long-Term |
| High Income | | $ 591,847 | | $ 1,193,713 |
| International Stock | | 1,587,950 | | 3,837,989 |
| Madison Target Retirement 2020 | | 118,669 | | 231,906 |
The Core Bond and International Stock Funds had capital loss carryovers expire unused in the current year in the amounts of $66,468 and $1,312,565, respectively.
Certain specified losses incurred after October 31 and within the taxable year are deemed to arise on the first day of the funds’ next taxable year, if the funds so elect. For the year ended December 31, 2018, none of the funds elected to defer post- October specified losses.
For the year ended December 31, 2018, the Core Bond and International Stock Funds utilized $316,756 and $713,927, respectively, in prior year capital losses. No other fund utilized losses.
Ultra Series Fund| December 31, 2018
| |
| Notes to Financial Statements |
At December 31, 2018, the aggregate gross unrealized appreciation (depreciation) and net unrealized appreciation (depreciation) for all securities as computed on a federal income tax basis for each fund were as follows:
| Fund | Appreciation | Depreciation | Net |
| Conservative Allocation | $ 2,067,481 | $ 3,710,057 | $(1,642,576) |
| Moderate Allocation | 6,696,132 | 6,980,003 | (283,871) |
| Aggressive Allocation | 2,915,993 | 2,657,787 | 258,206 |
| Core Bond | 1,756,946 | 3,097,441 | (1,340,495) |
| High Income | 74,187 | 1,260,776 | (1,186,589) |
| Diversified Income | 42,228,192 | 4,185,884 | 38,042,308 |
| Large Cap Value | 30,800,875 | 14,953,491 | 15,847,384 |
| Large Cap Growth | 38,230,010 | 5,644,936 | 32,585,074 |
| Mid Cap | 54,773,234 | 3,599,247 | 51,173,987 |
| International Stock | 2,553,963 | 2,212,020 | 341,943 |
| Madison Target Retirement 2020 | 373,563 | 664,251 | (290,688) |
| Madison Target Retirement 2030 | 401,042 | 2,224,296 | (1,823,254) |
| Madison Target Retirement 2040 | 194,360 | 1,587,376 | (1,393,016) |
| Madison Target Retirement 2050 | 84,523 | 1,083,490 | (998,967) |
Reclassification Adjustments:Paid-in capital, undistributed net investment income, and accumulated net realized gain (loss) have been adjusted in the Statements of Assets and Liabilities for permanent book-tax differences for all funds.
Differences primarily relate to the tax treatment of net operating losses, paydown gains and losses, foreign currency gains and losses, return of capital and other distributions from real estate investment trusts and non-REIT, securities adjustments related to Treasury Inflation Protected securities(TIPS), distribution re-designations from investments in other regulated investment companies and unusable capital carry loss carryforwards.
To the extent these book and tax differences are permanent in nature, such amounts are reclassified at the end of the fiscal year among paid-in capital in excess of par value, accumulated undistributed net investment income (loss) and accumulated net realized gain (loss) on investments and foreign currency translations. Accordingly, at December 31, 2018, reclassifications were recorded as follows:
| | | Accumulated Undistributed Net | Accumulated Net |
| Fund | Paid-in Capital | Investment Income (Loss) | Realized Gain (Loss) |
| Conservative Allocation | $ – | $ 5,550 | $ (5,550) |
| Moderate Allocation | – | (1,180,849) | 1,180,849 |
| Aggressive Allocation | – | 25,901 | (25,901) |
| Core Bond | (66,469) | 294,528 | (228,059) |
| Diversified Income | – | 167,382 | (167,382) |
| Large Cap Value | (6,385,378) | (493,891) | 6,879,269 |
| Mid Cap | – | 77,328 | (77,328) |
| International Stock | (1,312,565) | 1,699 | 1,310,866 |
| Madison Target Retirement 2020 | (919,435) | 134,416 | 785,019 |
| Madison Target Retirement 2030 | – | 314,108 | (314,108) |
| Madison Target Retirement 2040 | – | 301,829 | (301,829) |
| Madison Target Retirement 2050 | – | 225,550 | (225,550) |
Ultra Series Fund| December 31, 2018
| |
| Notes to Financial Statements |
10. CONCENTRATION OF RISKS
Investing in certain financial instruments, including forward foreign currency contracts, involves certain risks. Risks associated with these instruments include potential for an illiquid secondary market for the instruments or inability of counterparties to perform under the terms of the contracts, changes in the value of foreign currency relative to the U.S. dollar and volatility resulting from an imperfect correlation between the movements in the prices of the instruments and the prices of the underlying securities and interest rates being hedged. The International Stock Fund may enter into these contracts primarily to protect the fund from adverse currency movements.
Investing in foreign securities involves certain risks not necessarily found in U.S. markets. These include risks associated with adverse changes in economic, political, regulatory and other conditions, changes in currency exchange rates, exchange control regulations, expropriation of assets or nationalization, imposition of withholding taxes on dividend or interest payments or capital gains, and possible difficulty in obtaining and enforcing judgments against foreign entities. Further, issuers of foreign securities are subject to different, and often less comprehensive, accounting, reporting and disclosure requirements than domestic issuers.
The Core Bond Fund is subject to derivatives risk, which is the risk that loss may result from investments in options, forwards, futures, swaps and other derivatives instruments. These instruments may be illiquid, difficult to price and leveraged so that small changes in the value of the underlying instruments may produce disproportionate losses to the fund. Derivatives are also subject to counterparty risk, which is the risk that the other party to the transaction will not fulfill its contractual obligations.
The High Income Fund invests in securities offering high current income which generally will include bonds in the below investment grade categories of recognized rating agencies (so-called “junk bonds”). These securities generally involve more credit risk than securities in the higher rating categories. In addition, the trading market for high yield securities may be relatively less liquid than the market for higher-rated securities. The fund generally invests at least 80% of its net assets in high yield securities.
The Target Allocation Funds and Target Date Funds are fund of funds, meaning that each invests primarily in Underlying Funds, including ETFs. Thus, each fund’s investment performance and its ability to achieve its investment goal are directly related to the performance of the Underlying Funds in which it invests; and the Underlying Fund’s performance, in turn, depends on the particular securities in which that Underlying Fund invests and the expenses of that fund. Accordingly, these funds are subject to the risks of the Underlying Funds in direct proportion to the allocation of their respective assets among the Underlying Funds.
Additionally, the Target Allocation Funds and Target Date Funds are subject to asset allocation risk and manager risk. Manager risk (i.e., fund selection risk) is the risk that the Underlying Fund(s) selected to fulfill a particular asset class underperforms their peers. Asset allocation risk is the risk that the allocation of the fund’s assets among the various asset classes and market segments will cause the fund to underperform other funds with a similar investment objective.
The funds may be subject to interest rate risk which is the risk that the value of your investment will fluctuate with changes in interest rates. Typically, a rise in interest rates causes a decline in the fair value of income-bearing securities. When interest rates rise, bond prices fall; generally the longer a bond’s maturity, the more sensitive it is to risk. Federal Reserve policy changes may expose fixed-income and related markets to heightened volatility and may reduce liquidity for certain fund investments, which could cause the value of a fund’s investments and share price to decline. The Core Bond Fund may invest in derivatives tied to fixed-income markets and may be more substantially exposed to these risks than a fund that does not invest in derivatives.
Ultra Series Fund| December 31, 2018
| |
| Notes to Financial Statements |
The funds are also subject to cybersecurity risk, which include the risks associated with computer systems, networks and devices to carry out routine business operations. These systems, networks and devices employ a variety of protections that are designed to prevent cyberattacks. Despite the various cyber protections utilized by the funds, the Investment Adviser, and other service providers, their systems, networks, or devices could potentially be breached. The funds, their shareholders, and the Investment Adviser could be negatively impacted as a result of a cybersecurity breach. The funds cannot control the cybersecurity plans and systems put in place by service providers or any other third parties whose operations may affect the funds.
In addition to the other risks described above and in the Prospectus, you should understand what we refer to as “unknown market risks.” While investments in securities have been keystones in wealth building and management, at times these investments have produced surprises. Those who enjoyed growth and income of their investments generally were rewarded for the risks they took by investing in the markets. Although the Investment Adviser seeks to appropriately address and manage the risks identified and disclosed to you in connection with the management of the securities in the funds, you should understand that the very nature of the securities markets includes the possibility that there may be additional risks of which we are not aware. We certainly seek to identify all applicable risks and then appropriately address them, take appropriate action to reasonably manage them and to make you aware of them so you can determine if they exceed your risk tolerance. Nevertheless, the often volatile nature of the securities markets and the global economy in which we work suggests that the risk of the unknown is something to consider in connection with an investment in securities. Unforeseen events could under certain circumstances produce a material loss of the value of some or all of the securities we manage for you in the funds.
11. CAPITAL SHARES AND AFFILIATED OWNERSHIP
All capital shares outstanding at December 31, 2018, are owned by separate investment accounts and/or pension plans of CMFG Life Insurance Company.
The Target Allocation Funds invest in Underlying Funds, including the Madison Funds, which may be deemed to be under common control because of the same investment adviser and membership in a common family of investment companies (the “Affiliated Underlying Funds”). Madison Funds’ historical financial information is available to you at no cost on the SEC’s website at www.sec.gov, by calling 1-800-877-6089 or by visiting the Madison Funds’ website at www.madisonfunds.com. A summary of the transactions with each Affiliated Underlying Fund during the year ended December 31, 2018 follows:
Ultra Series Fund | December 31, 2018
| |
| Notes to Financial Statements |
Fund/
Underlying Fund | | Beginning
value as of
12/31/2017 | | Gross
Additions | | Gross
Sales | | Realized
Gain
(Loss) | | Change in
Unrealized
Appreciation
(Depreciation) | | Value at
12/31/2018 | | Shares | | Dividend
Income | | Distributions
Received1 |
| | | | | | | | | | | | | | | | | | | |
| Conservative Allocation Fund | | | | | | | | | | | | | | | | | | | | | | | | | | | | | | | | | | | | |
| Madison Core | | | | | | | | | | | | | | | | | | | | | | | | | | | | | | | | | | | | |
| Bond Fund Class Y | | $ | 33,640,397 | | | $ | – | | | $ | (6,079,244 | ) | | $ | (365,510 | ) | | $ | (809,661 | ) | | $ | 26,385,982 | | | | 2,737,135 | | | $ | 853,006 | | | $ | 853,006 | |
| Madison Corporate | | | | | | | | | | | | | | | | | | | | | | | | | | | | | | | | | | | | |
| Bond Fund Class Y | | | 10,260,871 | | | | – | | | | (999,832 | ) | | | (10,704 | ) | | | (535,258 | ) | | | 8,715,077 | | | | 796,625 | | | | 200,129 | | | | 271,537 | |
| Madison Dividend | | | | | | | | | | | | | | | | | | | | | | | | | | | | | | | | | | | | |
| Income Fund | | | | | | | | | | | | | | | | | | | | | | | | | | | | | | | | | | | | |
| Class Y | | | 10,703,348 | | | | 1,438,954 | | | | (3,122,148 | ) | | | 590,228 | | | | (1,533,453 | ) | | | 8,076,929 | | | | 344,285 | | | | 164,132 | | | | 938,954 | |
| Madison Investors | | | | | | | | | | | | | | | | | | | | | | | | | | | | | | | | | | | | |
| Fund Class Y | | | 10,662,079 | | | | 1,413,452 | | | | (2,878,318 | ) | | | 620,296 | | | | (1,802,794 | ) | | | 8,014,715 | | | | 418,523 | | | | 54,533 | | | | 1,263,452 | |
| Madison Mid Cap | | | | | | | | | | | | | | | | | | | | | | | | | | | | | | | | | | | | |
| Fund Class Y | | | 2,365,565 | | | | 67,877 | | | | (1,423,057 | ) | | | 313,845 | | | | (358,028 | ) | | | 966,202 | | | | 107,475 | | | | 279 | | | | 67,877 | |
| | | | | | | | | | | | | | | | | | | | | | | | | | | | |
| Totals | | $ | 67,632,260 | | | $ | 2,920,283 | | | $ | (14,502,599 | ) | | $ | 1,148,155 | | | $ | (5,039,194 | ) | | $ | 52,158,905 | | | | | | | $ | 1,272,079 | | | $ | 3,394,826 | |
| | | | | | | | | | | | | | | | | | | | | | | | | | | | | | | | | | | | | |
| Moderate Allocation Fund | | | | | | | | | | | | | | | | | | | | | | | | | | | | | | | | | | | | |
| Madison Core | | | | | | | | | | | | | | | | | | | | | | | | | | | | | | | | | | | | |
| Bond Fund Class Y | | $ | 42,598,706 | | | $ | – | | | $ | (7,750,866 | ) | | $ | (420,921 | ) | | $ | (1,010,413 | ) | | $ | 33,416,506 | | | | 3,466,443 | | | $ | 1,033,002 | | | $ | 1,033,002 | |
| Madison Corporate | | | | | | | | | | | | | | | | | | | | | | | | | | | | | | | | | | | | |
| Bond Fund Class Y | | | 5,062,324 | | | | – | | | | — | | | | — | | | | (275,649 | ) | | | 4,786,675 | | | | 437,539 | | | | 105,234 | | | | 140,549 | |
| Madison Dividend | | | | | | | | | | | | | | | | | | | | | | | | | | | | | | | | | | | | |
| Income Fund | | | | | | | | | | | | | | | | | | | | | | | | | | | | | | | | | | | | |
| Class Y | | | 28,866,751 | | | | 2,678,672 | | | | (5,457,102 | ) | | | 957,673 | | | | (3,765,774 | ) | | | 23,280,220 | | | | 992,337 | | | | 445,395 | | | | 2,678,672 | |
| Madison Investors | | | | | | | | | | | | | | | | | | | | | | | | | | | | | | | | | | | | |
| Fund Class Y | | | 28,749,850 | | | | 3,696,967 | | | | (5,365,082 | ) | | | 1,191,376 | | | | (4,821,385 | ) | | | 23,451,726 | | | | 1,224,633 | | | | 159,568 | | | | 3,696,967 | |
| Madison Large Cap | | | | | | | | | | | | | | | | | | | | | | | | | | | | | | | | | | | | |
| Value Fund Class Y | | | 7,757,239 | | | | 275,401 | | | | (6,652,108 | ) | | | 1,815,193 | | | | (2,535,027 | ) | | | 660,698 | | | | 59,522 | | | | 30,856 | | | | 275,401 | |
| Madison Mid Cap | | | | | | | | | | | | | | | | | | | | | | | | | | | | | | | | | | | | |
| Fund Class Y | | | 4,849,948 | | | | 218,156 | | | | (1,751,756 | ) | | | 398,613 | | | | (609,589 | ) | | | 3,105,372 | | | | 345,425 | | | | 893 | | | | 218,155 | |
| | | | | | | | | | | | | | | | | | | | | | | | | | | | | |
| Totals | | $ | 117,884,818 | | | $ | 6,869,196 | | | $ | (26,976,914 | ) | | $ | 3,941,934 | | | $ | (13,017,837 | ) | | $ | 88,701,197 | | | | | | | $ | 1,774,948 | | | $ | 8,042,746 | |
| | | | | | | | | | | | | | | | | | | | | | | | | | | | | | | | | | | | | |
| Aggressive Allocation Fund | | | | | | | | | | | | | | | | | | | | | | | | | | | | | | | | | | | | |
| Madison Core | | | | | | | | | | | | | | | | | | | | | | | | | | | | | | | | | | | | |
| Bond Fund Class Y | | $ | 8,393,210 | | | $ | – | | | $ | (2,975,757 | ) | | $ | (166,523 | ) | | $ | (126,438 | ) | | $ | 5,124,492 | | | | 531,586 | | | $ | 190,518 | | | $ | 190,518 | |
| Madison Dividend | | | | | | | | | | | | | | | | | | | | | | | | | | | | | | | | | | | | |
| Income Fund | | | | | | | | | | | | | | | | | | | | | | | | | | | | | | | | | | | | |
| Class Y | | | 11,553,878 | | | | 965,148 | | | | (3,265,175 | ) | | | 566,574 | | | | (1,556,151 | ) | | | 8,264,274 | | | | 352,271 | | | | 172,355 | | | | 965,148 | |
| Madison Investors | | | | | | | | | | | | | | | | | | | | | | | | | | | | | | | | | | | | |
| Fund Class Y | | | 11,490,182 | | | | 1,297,389 | | | | (3,327,384 | ) | | | 1,188,006 | | | | (2,418,197 | ) | | | 8,229,996 | | | | 429,765 | | | | 55,998 | | | | 1,297,389 | |
| Madison Large Cap | | | | | | | | | | | | | | | | | | | | | | | | | | | | | | | | | | | | |
| Value Fund Class Y | | | 4,259,230 | | | | 91,701 | | | | (3,327,455 | ) | | | 584,766 | | | | (885,162 | ) | | | 723,080 | | | | 65,142 | | | | 10,274 | | | | 91,701 | |
| Madison Mid Cap | | | | | | | | | | | | | | | | | | | | | | | | | | | | | | | | | | | | |
| Fund Class Y | | | 4,230,159 | | | | 158,036 | | | | (1,987,728 | ) | | | 436,458 | | | | (587,346 | ) | | | 2,249,579 | | | | 250,231 | | | | 648 | | | | 158,037 | |
| | | | | | | | | | | | | | | | | | | | | | | | | | | | |
| Totals | | $ | 39,926,659 | | | $ | 2,512,274 | | | $ | (14,883,499 | ) | | $ | 2,609,281 | | | $ | (5,573,294 | ) | | $ | 24,591,421 | | | | | | | $ | 429,793 | | | $ | 2,702,793 | |
| 1 Distributions received include distributions from net investment income and from capital gains from the underlying funds. |
Ultra Series Fund| December 31, 2018
| |
| Notes to Financial Statements |
12. SUBSEQUENT EVENTS
All Matters
Management has evaluated the impact of subsequent events on the funds through the date the financial statements were available for issue. No other events have taken place that meet the definition of a subsequent event that requires adjustment to, or disclosure in, the financial statements.
Ultra Series Fund| December 31, 2018
| |
| Report of Independent Registered Public Accounting Firm |
To the Shareholders and Board of Trustees of Ultra Series Fund:
Opinion on the Financial Statements and Financial Highlights
We have audited the accompanying statements of assets and liabilities of Ultra Series Fund (the “Trust”), comprising the Conservative Allocation Fund, Moderate Allocation Fund, Aggressive Allocation Fund, Core Bond Fund, High Income Fund, Diversified Income Fund, Large Cap Value Fund, Large Cap Growth Fund, Mid Cap Fund, International Stock Fund, Madison Target Retirement 2020 Fund, Madison Target Retirement 2030 Fund, Madison Target Retirement 2040 Fund, and Madison Target Retirement 2050 Fund (collectively, the “Funds”), including the portfolios of investments as of December 31, 2018, the related statements of operations for the year then ended, the statements of changes in net assets for each of the two years in the period then ended, the financial highlights for each of the five years in the period then ended, and the related notes. In our opinion, the financial statements and financial highlights present fairly, in all material respects, the financial position of each of the respective portfolios of the Trust as of December 31, 2018, and the results of their operations for the year then ended, the changes in their net assets for each of the two years in the period then ended, and the financial highlights for each of the five years in the period then ended, in conformity with accounting principles generally accepted in the United States of America.
Basis for Opinion
These financial statements and financial highlights are the responsibility of the Trust’s management. Our responsibility is to express an opinion on the Trust’s financial statements and financial highlights based on our audits. We are a public accounting firm registered with the Public Company Accounting Oversight Board (United States) (PCAOB) and are required to be independent with respect to the Trust in accordance with the U.S. federal securities laws and the applicable rules and regulations of the Securities and Exchange Commission and the PCAOB.
We conducted our audits in accordance with the standards of the PCAOB. Those standards require that we plan and perform the audit to obtain reasonable assurance about whether the financial statements and financial highlights are free of material misstatement, whether due to error or fraud. The Trust is not required to have, nor were we engaged to perform, an audit of their internal control over financial reporting. As part of our audits we are required to obtain an understanding of internal control over financial reporting but not for the purpose of expressing an opinion on the effectiveness of the Trust’s internal control over financial reporting. Accordingly, we express no such opinion.
Our audits included performing procedures to assess the risks of material misstatement of the financial statements and financial highlights, whether due to error or fraud, and performing procedures that respond to those risks. Such procedures included examining, on a test basis, evidence regarding the amounts and disclosures in the financial statements and financial highlights. Our audits also included evaluating the accounting principles used and significant estimates made by management, as well as evaluating the overall presentation of the financial statements and financial highlights. Our procedures included confirmation of securities owned as of December 31, 2018, by correspondence with the custodian and brokers; when replies were not received from brokers, we performed other auditing procedures. We believe that our audits provide a reasonable basis for our opinion.
/s/ Deloitte & Touche, LLP
Chicago, IL
February 22, 2019
We have served as the auditor of one or more Madison Investment Advisors investment companies since 2009.
Ultra Series Fund| December 31, 2018
| |
| Other Information (unaudited) |
DISCUSSION OF CONTRACT RENEWAL PROCESS AND CONSIDERATIONS
At an in-person meeting of the Board held on July 26-27, 2018, the Board of Trustees (the “Board” or “Trustees”) of Ultra Series Fund (the “Trust”), and by a separate vote, the Independent Trustees of the Trust, approved the continuance of the Investment Advisory Agreement between the Trust and Madison Asset Management, LLC (the “Adviser”) with respect to the individual series of the Trust (each a “fund” and together, the “funds”) and the continuance of the Investment Sub-Advisory Agreement between the Adviser and Lazard Asset Management LLC (the “Subadviser”) with respect to the International Stock Fund.
In determining whether to approve the continuation of the Investment Advisory Agreement and the Investment Sub-Advisory Agreement (together, the “Agreements”), the Adviser and Subadviser furnished information necessary for a majority of the Independent Trustees to make the determination that the continuance of the Agreements was in the best interests of the respective funds and their shareholders. The information provided to the Board included: (1) data comparing advisory fees and expense ratios of comparable investment companies; (2) comparative performance information; (3) the Adviser’s and its affiliates’ revenues and costs of providing services to the funds; and (4) information about the Adviser’s and Subadviser’s personnel. Prior to voting, the Independent Trustees reviewed the proposed continuance of the Investment Advisory Agreement and Investment Sub-Advisory Agreement with management and independent legal counsel to the Independent Trustees and received materials from such counsel discussing the legal standards for their consideration of the proposed continuation of the Agreement. The Independent Trustees also reviewed the proposed continuation of the Investment Advisory Agreement and Investment Sub-Advisory Agreement with independent legal counsel in a private session at which no representatives of management were present. The Independent Trustees made a variety of additional inquiries regarding the written materials provided by the Adviser and the Subadviser, and representatives of the Adviser and Subadviser, respectively, which were later discussed with the Independent Trustees at the July 2018 meeting.
In approving the continuance of the Investment Advisory Agreement and the Investment Sub-Advisory Agreement, the Board considered various factors, among them: (1) the nature, extent and quality of services provided by the Adviser and Subadviser to the funds, as applicable, including the personnel providing such services; (2) the Adviser’s and Subadviser’s compensation and profitability; (3) a comparison of fees and performance with comparable funds and accounts; (4) economies of scale; and (5) the terms of the Investment Advisory Agreement and the Investment Sub-Advisory Agreement. The Board’s analysis of these factors is set forth below. The Independent Trustees were advised by independent legal counsel throughout the process.
With regard to thenature, extent and quality of the services to be provided by the Adviser and Sub-Adviser, the Board reviewed the biographies and tenure of the personnel involved in Trust management and the experience of the Adviser (and Sub-Adviser) and its affiliates as investment manager to other investment companies with similar investment strategies or to individual clients or institutions with similar investment strategies. They recognized the wide array of investment professionals employed by the respective firm or firms. Representatives of the Adviser and the Sub-Adviser discussed or otherwise presented their respective firms’ ongoing investment philosophies and strategies intended to provide investment performance consistent with each fund’s investment objectives in a variety of market environments. The Board also noted their familiarity with the Adviser and its affiliates due to the Adviser’s history of providing advisory services to its proprietary investment company clients.
The Board also discussed the quality of services provided to the Trust by its transfer agent, fund administrator and custodian as well as the various administrative services provided directly by the Adviser. Such services included arranging for third party service providers to provide all necessary administration to the Trust, as well as supervising the Sub-Adviser.
Ultra Series Fund| December 31, 2018
| |
| Other Information (unaudited) |
Based on their review of the information provided, the Board determined with respect to each fund that the nature, extent and quality of services provided by the Adviser (and Sub-Adviser, as applicable) to the fund were satisfactory.
With regard to theinvestment performance of the Trust and the Adviser or Sub-Adviser, the Board reviewed current performance information provided in the written Board materials. They discussed the reasons for both outperformance and underperformance compared with peer groups and applicable indices and benchmarks. They recognized that the usefulness of comparative performance data as a frame of reference to measure a fund’s performance may be limited because the performance peer group, among other things, may not precisely reflect the objectives and strategies of the fund, may have a different investable universe, or the composition of the peer group may be limited in size or number as well as other factors. They discussed the unique aspects of the securities markets applicable to particular funds so that the performance of any such funds could be reviewed in context. They reviewed both long-term and short-term performance and considered the effect on long-term performance that may have been attributable to any previous investment advisers/ portfolio managers to any fund or to a different investment strategy. They recognized that the performance data reflects a snapshot in time, in this case as of the end of the most recent calendar year or quarter. They took into account that a different performance period, however, could generate significantly different results. Further, they noted that long-term performance can be adversely affected by even one period of significant underperformance so that a single investment decision or theme has the ability to disproportionately affect long-term performance. The Board also noted that on a quarterly basis, they review detailed information for each fund, including investment performance results, portfolio composition and investment philosophies, processes and strategies. They also considered whether any relative underperformance was appropriate in view of the Adviser’s conservative investment philosophy. The Board noted the type of market environments that favor the funds’ strategies and discussed the funds’ performance in such market environments. The Board performed this review in connection with the Adviser and the Sub-Adviser. In connection with the review of performance, the Board engaged in a robust and comprehensive discussion of market conditions and discussed the reasons for any fund performance under such conditions. Representatives of the Adviser discussed with the Board the methodology for arriving at peer groups and indices used for performance comparisons. The Board also considered that sometimes, the Morningstar categories the funds fall into do not precisely match a fund’s investment strategy and philosophy.
Based on their review, the Board determined that, given the totality of the above factors and considerations, each fund’s overall investment performance had been satisfactory.
With regard to thecosts of the services to be provided and the profits to be realized by the Adviser and its affiliates from the relationship with the Trust, the Board reviewed the expense ratios for a variety of other funds in each fund’s peer group with similar investment objectives. Again, the Board reviewed these matters in connection with the Adviser and the Sub-Adviser.
The Board noted that the Adviser or its affiliates, and, as applicable, the Sub-Adviser, provided investment management services to other investment company and/or non-investment company clients and considered the fees charged by the Adviser (and the Sub-Adviser) to such funds and other clients for purposes of determining whether the given advisory fee was disproportionately large under the so-calledGartenberg standard traditionally used by investment company boards in connection with contract renewal considerations. The Board took those fees into account and considered the differences in services and time required by the various types of funds and clients to which the Adviser (or Sub-Adviser, if applicable) provided services. The Board recognized that significant differences may exist between the services provided to one type of fund or client and those provided to others, such as those resulting from a greater frequency of shareholder redemptions in a mutual fund and the higher turnover of mutual fund assets. The Board gave such comparisons the weight that they merit in light of the similarities and differences between the services that the various funds require. They considered that, if the services rendered by the Adviser (or Sub-Adviser, if applicable) to one type of fund or client differed significantly from others,
Ultra Series Fund| December 31, 2018
| |
| Other Information (unaudited) |
then the comparison should be given less weight. In the case of non-investment company clients for which the Adviser (or Sub-Adviser, if applicable), may act as either investment adviser or sub-adviser, the Board noted that the fee may be lower than the fee charged to the Trust. The Board noted too the various administrative, operational, compliance, legal and corporate communication services required to be handled by the Adviser (or Sub-Adviser, if applicable) which are performed for investment company clients but are not typically performed for non-investment company clients.
The Trustees compared each fund’s total expense ratio and advisory fee to those of comparable funds with similar investment objectives and strategies. The Board noted the simple expense structure maintained by the Trust: (1) an advisory fee and a capped administrative “services” expense for the Target Retirement Date Funds of USF; and (2) for the remaining series of USF, a unitary fee with limited independent expenses for Trustee compensation and audit fees not covered by the unitary fee (“Unitary Fee”). The Board also noted that so long as substantially all of the assets of a USF Target Retirement Date Fund are invested in the corresponding Goldman Sachs Target Retirement Portfolio, no Advisory or Services fee would be payable by such Fund. The Board reviewed total expense ratios paid by other funds with similar investment objectives, recognizing that such a comparison, while not dispositive, was an important consideration.
The Trustees sought to ensure that fees paid by the Trust were appropriate. The Board reviewed materials demonstrating that although the Adviser is compensated for a variety of the administrative services it provides or arranges to provide to the Target Retirement Date Funds of USF pursuant to its administrative services agreement with the Trust (“Services Agreement”) or pursuant to the Unitary Fee structure with respect to the remaining series of USF, such compensation does not always cover all costs because the Services Agreement, or Unitary Fee, as applicable, effectively acts as a cap on administrative expenses. Therefore, the Board recognized that some of the administrative, operational, regulatory or compliance fees or costs in excess of the Services Agreement fees, in the case of the Target Retirement Date Funds of USF, or in excess of the Unitary Fee, in the case of the remaining series of USF, are paid by the Adviser from investment advisory fees earned. In this regard, the Trustees noted that examination of each fund’s total expense ratio compared to those of other investment companies was more meaningful than a simple comparison of basic “investment management only” fee schedules.
The Board recognized that to the extent a fund invests in other mutual funds also managed by the Adviser (or its affiliates), the Adviser (or an affiliate) receives investment advisory fees from both the fund and the underlying mutual fund. The Board was satisfied in this regard that the Adviser (or an affiliate) provides separate services to the Trust’s “fund of funds” portfolios and the underlying mutual funds in which each such fund invests in exchange for the fees received from them (except as noted above with respect to the USF Target Retirement Date Funds which do not pay any advisory or service fees so long as invested in the corresponding Goldman Sachs Target Retirement Portfolio).
In reviewing costs and profits, the Board noted that for some smaller funds, the salaries of all portfolio management personnel, trading desk personnel, corporate accounting personnel and employees of the Adviser who serve as Trust officers, as well as facility costs (e.g., rent, etc.), could not be supported by fees received from such portfolios alone. However, the Board recognized that the Trust is profitable to the Adviser because such salaries and fixed costs are already paid in whole or in part from revenue generated by management of other client assets managed by the Adviser, including the Trust as one of a consolidated family of investment companies. The Trustees noted that total assets managed by the Adviser and its affiliates were approximately $16 billion at the time of the meeting. As a result, although the fees paid by an individual fund at its present size might not be sufficient to profitably support a stand-alone fund, the Trust is reasonably profitable to the Adviser as part of its larger, diversified organization. In sum, the Trustees recognized that the Trust is important to the Adviser and is managed with the attention given to the Adviser’s other clients.
Ultra Series Fund| December 31, 2018
| |
| Other Information (unaudited) |
Based on the foregoing, the Board concluded that the level of profitability to the Adviser and its affiliates was reasonable in light of the services provided. In considering the profitability of the Sub-Adviser, the Board noted that the sub-advisory fees payable under the Sub-Advisory Agreement are paid by the Adviser out of the fees that it receives under the Advisory Agreement and were negotiated by the Adviser at arm’s length. As a consequence, the profitability to the Sub-Adviser of its relationship with the International Stock Fund was not a substantial factor in the Board’s deliberations.
With regard to the extent to whicheconomies of scale would be realized as each fund’s assets increase, the Trustees recognized that at their current asset levels, it was premature to discuss any economies of scale not already factored into the compensation payable under existing Advisory and Services Agreements. In addition, the Trustees recognized that the Adviser was currently waiving certain fees with regard to the USF Conservative, Moderate and Aggressive Allocation Funds. Further, as noted above with respect to the USF Target Retirement Date Funds, so long as such funds invest substantially all of their assets in the corresponding Goldman Sachs Target Retirement Portfolio, no advisory or services fee shall be payable by those funds. Because the Adviser pays the Sub-Adviser’s sub-advisory fees and those fees are negotiated at arm’s length by the Adviser, the Board did not consider the potential economies of scale in the Sub-Adviser’s management of the International Stock Fund to be a material factor in its consideration.
The Board recognized that another method to help ensure the shareholders share in any economies of scale is to include breakpoints in the advisory fee schedules. Based on its review, the Board concluded that the current advisory fee schedules and fee arrangements and waivers (as applicable) were appropriate and reflect economies of scale to be shared with shareholders when assets under management increase.
Counsel to the Independent Trustees confirmed that the Trust’s Independent Trustees had met previously and reviewed the written contract renewal materials provided by the Adviser and the Sub-Adviser. It was noted that the Independent Trustees had considered such materials in light of theGartenberg standard as well as criteria either set forth or discussed in the Supreme Court decision inJones v. Harris regarding the investment company contract renewal process under Section 15(c) of the Investment Company Act of 1940, as amended. The Independent Trustees made a variety of additional inquiries regarding such written materials to the Adviser and the Sub-Adviser, and to representatives of the Adviser and Sub-Adviser, respectively, and discussed each matter raised.
In considering the renewal of the funds’ Advisory and Sub-Advisory Agreements, the Board, including the Independent Trustees, did not identify any single factor as controlling, and each Trustee may have attributed different weights to the various factors. The Board evaluated all information available to them on a fund-by-fund basis, and their determinations were made separately with respect to each fund. The Board reached the following conclusions regarding each fund’s Advisory (and, as applicable, Sub-Advisory) Agreement, among others: (a) the Adviser (and Sub-Adviser, as applicable) demonstrated that it possesses the capability and resources to perform the duties required of it under the Investment Advisory Agreement; (b) the Adviser (and Sub-Adviser, as applicable) is qualified to manage the fund’s assets in accordance with the fund’s investment objective and strategies; (c) the overall investment performance of the fund is satisfactory relative to the performance of funds with similar investment objectives and relevant indices and benchmarks; (d) the fund’s advisory (and, as applicable, sub-advisory) fee is reasonable in light of the services received by the fund from the Adviser (and, as applicable, Sub-Adviser) and other factors considered; and (e) the Adviser’s (and Sub-Adviser’s, as applicable) investment strategies are appropriate for pursuing the investment objectives of the fund. Based on the foregoing conclusions, the Board determined with respect to each fund that continuation of the Advisory Agreement with the Adviser was in the best interests of the fund and its shareholders, and that with respect to the International Stock Fund, continuation of such fund’s Sub-Advisory Agreement was in the best interests of the fund and its shareholders.
Ultra Series Fund| December 31, 2018
| |
| Other Information (unaudited) |
FUND EXPENSES PAID BY SHAREHOLDERS
As a shareholder of the funds, you pay no transaction costs, but do incur ongoing costs which include, among other things, management fees; 12b-1 fees (Class II only); brokerage commissions and other expenses incurred in connection with the acquisition or disposition of investments; and costs of borrowing money. The examples in the table that follows are intended to help you understand your ongoing costs (in dollars) of investing in the funds and to compare these costs with the ongoing costs of investing in other mutual funds.
The examples below are based on an investment of $1,000 invested for the year ended December 31, 2018. Expenses paid during the period in the table below are equal to each fund’s annualized expense ratio, multiplied by the average account value over the period, multiplied by 184/365 (to reflect the one-half fiscal year period).
Actual Expenses
The table below provides information about actual account values using actual expenses and actual returns for the funds. You may use the information in this table, together with the amount you invested, to estimate the expenses that you paid over the period. Simply divide your account value by $1,000 (for example, an $8,600 account value divided by $1,000 = 8.6), then multiply the result by the number in the table for the fund you own under the heading entitled “Expenses Paid During Period” to estimate the expenses you paid on your account during this period.
| | CLASS I | | | CLASS II |
| | | | | | | | Expenses | | | | Expenses |
| | Beginning | | Ending | | | Annual | Paid | | Ending | Annual | Paid |
| | Account | | Account | | | Expense | During | | Account | Expense | During |
| Fund | Value | | Value | | | Ratio | Period | | Value | Ratio | Period |
| Conservative Allocation* | $1,000 | | $ 982.00 | | | 0.22% | $1.15 | | $ 980.70 | 0.47% | $2.40 |
| Moderate Allocation* | 1,000 | | 960.40 | | | 0.22% | 1.14 | | 959.20 | 0.47% | 2.37 |
| Aggressive Allocation* | 1,000 | | 939.20 | | | 0.22% | 1.12 | | 938.00 | 0.47% | 2.34 |
| Core Bond | 1,000 | | 1,012.20 | | | 0.57% | 2.94 | | 1,011.00 | 0.82% | 4.21 |
| High Income | 1,000 | | 978.80 | | | 0.77% | 3.89 | | 977.60 | 1.02% | 5.13 |
| Diversified Income | 1,000 | | 1,007.30 | | | 0.72% | 3.69 | | 1,006.10 | 0.97% | 4.96 |
| Large Cap Value | 1,000 | | 865.50 | | | 0.62% | 2.96 | | 864.40 | 0.87% | 4.14 |
| Large Cap Growth | 1,000 | | 989.40 | | | 0.82% | 4.11 | | 988.20 | 1.07% | 5.36 |
| Mid Cap | 1,000 | | 952.60 | | | 0.92% | 4.58 | | 951.40 | 1.17% | 5.80 |
| International Stock | 1,000 | | 886.70 | | | 1.17% | 5.61 | | 885.50 | 1.42% | 6.80 |
| Target Retirement 2020 | 1,000 | | 983.20 | | | 0.03% | 0.30 | | N/A | N/A | N/A |
| Target Retirement 2030 | 1,000 | | 958.70 | | | 0.03% | 0.30 | | N/A | N/A | N/A |
| Target Retirement 2040 | 1,000 | | 948.40 | | | 0.03% | 0.29 | | N/A | N/A | N/A |
| Target Retirement 2050 | 1,000 | | 939.00 | | | 0.03% | 0.29 | | N/A | N/A | N/A |
Hypothetical Example for Comparison Purposes
The table below provides information about hypothetical account values and hypothetical expenses based on the funds’ actual expense ratios and an assumed rate of return of 5% per year before expenses, which are not the funds’ actual returns. The hypothetical account values and expenses may not be used to estimate the actual ending account balance or expenses you paid for the period. You may use this information to compare the ongoing costs of investing in the funds and other funds. To do so, compare the 5% hypothetical example of the funds you own with the 5% hypothetical examples that appear in the shareholder reports of other similar funds.
Ultra Series Fund| December 31, 2018
| |
| Other Information (unaudited) |
| | CLASS I | | | CLASS II |
| | | | | | | | Expenses | | | | Expenses |
| | Beginning | | Ending | | | Annual | Paid | | Ending | Annual | Paid |
| | Account | | Account | | | Expense | During | | Account | Expense | During |
| Fund | Value | | Value | | | Ratio | Period | | Value | Ratio | Period |
| Conservative Allocation* | $1,000 | | $1,024.05 | | | 0.22% | $1.17 | | $1,022.79 | 0.47% | $2.45 |
| Moderate Allocation* | 1,000 | | 1,024.05 | | | 0.22% | 1.17 | | 1,022.79 | 0.47% | 2.45 |
| Aggressive Allocation* | 1,000 | | 1,024.05 | | | 0.22% | 1.17 | | 1,022.79 | 0.47% | 2.45 |
| Core Bond | 1,000 | | 1,022.28 | | | 0.57% | 2.96 | | 1,021.02 | 0.82% | 4.23 |
| High Income | 1,000 | | 1,021.27 | | | 0.77% | 3.97 | | 1,020.01 | 1.02% | 5.24 |
| Diversified Income | 1,000 | | 1,021.53 | | | 0.72% | 3.72 | | 1,020.27 | 0.97% | 4.99 |
| Large Cap Value | 1,000 | | 1,022.03 | | | 0.62% | 3.21 | | 1,020.77 | 0.87% | 4.48 |
| Large Cap Growth | 1,000 | | 1,021.07 | | | 0.82% | 4.18 | | 1,019.81 | 1.07% | 5.45 |
| Mid Cap | 1,000 | | 1,020.52 | | | 0.92% | 4.74 | | 1,019.26 | 1.17% | 6.01 |
| International Stock | 1,000 | | 1,019.26 | | | 1.17% | 6.01 | | 1,018.00 | 1.42% | 7.27 |
| Target Retirement 2020* | 1,000 | | 1,024.90 | | | 0.03% | 0.31 | | N/A | N/A | N/A |
| Target Retirement 2030* | 1,000 | | 1,024.90 | | | 0.03% | 0.31 | | N/A | N/A | N/A |
| Target Retirement 2040* | 1,000 | | 1,024.90 | | | 0.03% | 0.31 | | N/A | N/A | N/A |
| Target Retirement 2050* | 1,000 | | 1,024.90 | | | 0.03% | 0.31 | | N/A | N/A | N/A |
* The annual expense ratio does not include the expenses of the underlying funds.
Please note that the expenses shown in the table are meant to highlight your ongoing costs only and do not reflect any separate account fees, charges, or expenses imposed by the variable annuity or variable life insurance contracts, or retirement and pension plans that use the funds. The information provided in the hypothetical example table is useful in comparing ongoing fund costs only, and will not help you determine the relative total costs of owning different funds. In addition, if these fees, charges or expenses were included, your costs would have been higher.
AVAILABILITY OF QUARTERLY PORTFOLIO SCHEDULES
The Trust files its complete schedule of portfolio holdings with the SEC for the first and third quarters of each fiscal year on Form N-Q. Form N-Q is available to shareholders at no cost by calling 1-800-877-6089, or on the SEC’s website at www.sec. gov.
PROXY VOTING POLICIES, PROCEDURES AND RECORDS
A description of the policies and procedures used by the Trust to vote proxies related to portfolio securities is available to shareholders at no cost by calling 1-800-877-6089 or on the SEC’s website at www.sec.gov and is also located in the funds’ Statement of Additional Information. The proxy voting records for the Trust for the most recent twelve-month period ended June 30 is available to shareholders at 1-800-SEC-0330 at no cost on the SEC’s website at www.sec.gov.
FORWARD-LOOKING STATEMENT DISCLOSURE
One of our most important responsibilities as investment company managers is to communicate with shareholders in an open and direct manner. Some of our comments in the “Management’s Discussion of Fund Performance” are based on current management expectations and are considered “forward-looking statements.” Actual future results, however, may prove to be different from our expectations. You can identify forward-looking statements by words such as “estimate,” “may,” “will,” “expect,” “believe,” “plan” and other similar terms. We cannot promise future returns. Our opinions are a reflection of our best judgment at the time this report is compiled, and we disclaim any obligation to update or after forward-looking statements as a result of new information, future events, or otherwise.
Ultra Series Fund| December 31, 2018
| |
| Other Information (unaudited) |
TAX INFORMATION
Foreign Tax Credits:The International Stock Fund expects to make an election under Internal Revenue Code Section 853 to pass through foreign taxes paid by the fund to its shareholders. For the year ended December 31, 2018, the total amount of foreign taxes that is expected to pass through to shareholders and foreign source income for information reporting purposes will be $90,444 (all of which represents taxes withheld) and $1,094,140, respectively.
Corporate Dividends Received Deductions:For the taxable year ended December 31, 2018, the following percentage of income dividends paid by the funds qualify for the dividends received deduction available to corporations:
| Fund | Percentage |
| Conservative Allocation | 8.18% |
| Moderate Allocation | 16.38% |
| Aggressive Allocation | 21.70% |
| Diversified Income | 66.69% |
| Large Cap Value | 100.00% |
| Large Cap Growth | 48.76% |
| Mid Cap | 55.99% |
| Madison Target Retirement 2020 | 7.69% |
| Madison Target Retirement 2030 | 7.45% |
| Madison Target Retirement 2040 | 7.42% |
| Madison Target Retirement 2050 | 7.97% |
| | |
Ultra Series Fund| December 31, 2018
| |
| Ultra Series Fund’s Trustees and Officers |
The address of each Trustee and officer is 550 Science Drive, Madison, Wisconsin 53711. The Statement of Additional Information, which includes additional information about the Trustees and officers, is available at no cost on the SEC’s website at www.sec.gov or by calling CMFG Life Insurance Company at 1-800-798-5500. The term of office of Trustees is indefinite while officers are elected annually.
Interested Trustees and Officers
| |
| | Position(s) and | | Portfolios Overseen | |
| Name and | Length of Time | | in Fund Complex by | Other Directorships Held by |
| Year of Birth | Served | Principal Occupation(s) During Past Five Years | Director/Trustee1 | Director/ Trustee |
| Katherine L. Frank2 | Trustee and | Madison Investment Holdings, Inc. (“MIH”) (affiliated | 32 | Madison Funds (18), 2009 - |
| 1960 | President, 2009 - | investment advisory firm of Madison), Vice President, | | Present |
| | Present | Corporate Management, 2018 - Present; Chief Operating | | |
| | | Officer, 2010 - 2017; Executive Committee Member, | | |
| | | 2010 - 2018 | | |
| | | | | |
| | | Madison Asset Management, LLC (“Madison”), Vice | | |
| | | President, Corporate Management, 2018 - Present; Chief | | |
| | | Operating Officer, 2010 - 2017; Executive Committee | | |
| | | Member, 2010 - 2018 | | |
| | | | | |
| | | Madison Investment Advisors, LLC (“MIA”) (affiliated | | |
| | | investment advisory firm of Madison), Vice President, | | |
| | | Corporate Management, 2018 - Present; Chief Operating | | |
| | | Officer, 2010 - 2017; Executive Committee Member, | | |
| | | 2010 - 2018 | | |
| | | | | |
| | | Madison Funds (18) (mutual funds), President, 2009 - | | |
| | | Present; Madison Covered Call & Equity Strategy Fund | | |
| | | (closed end fund), President, 2012 - Present; Madison | | |
| | | Strategic Sector Premium Fund (closed end fund), | | |
| | | President, 2005 - 2018 | | |
| |
| Paul A. Lefurgey | Vice President, | MIH, Madison and MIA, CEO, 2017 - Present; Director | N/A | N/A |
| 1964 | 2009 - Present | of Fixed Income Investments, 2016 - Present; Executive | | |
| | | Director and Head of Fixed Income Investments, 2013 - | | |
| | | 2016; Chairman - Executive Committee, 2015 - 2017 | | |
| | | | | |
| | | Madison Funds (18), Vice President, 2009 - Present; | | |
| | | Madison Covered Call & Equity Strategy Fund, Vice | | |
| | | President, 2012 - Present; Madison Strategic Sector | | |
| | | Premium Fund, Vice President, 2010 - 2018 | | |
| | | | | |
1As of the date of this report, the fund complex consists of Madison Funds with 18 portfolios, the Ultra Series Fund with 14 portfolios and the Madison Covered Call & Equity Strategy Fund (closed end fund), for a grand total of 33 separate portfolios in the fund complex. Not every Trustee is a member of the Board of Trustees of every fund in the fund complex, as noted above. References to the “Fund Complex” in the following tables have the meaning disclosed in this paragraph.
2“Interested person” as defined in the 1940 Act. Considered an interested Trustee because of the position held with the Investment Adviser.
Ultra Series Fund| December 31, 2018
| |
| Ultra Series Fund’s Trustees and Officers |
Name and
Year of Birth | Position(s) and
Length of Time
Served | Principal Occupation(s) During Past Five Years | Portfolios Overseen
in Fund Complex by
Director/Trustee1 | Other Directorships Held by
Director/ Trustee |
| Greg D. Hoppe | Treasurer, 2009 - | MIH and MIA, Vice President, 1999 - Present; Madison, | N/A | N/A |
| 1969 | Present | Vice President, 2009 - Present | | |
| | | | | |
| | | Madison Covered Call & Equity Strategy Fund, Treasurer, | | |
| | | 2012 - Present; Madison Funds (18), Treasurer, 2009 - | | |
| | | Present; Madison Strategic Sector Premium Fund, Treasurer, | | |
| | | 2009 - 2018 | | |
| Holly S. Baggot | Secretary, 1999 - | MIH and MIA, Vice President, 2010 - Present; Madison, Vice | N/A | N/A |
| 1960 | Present; Assistant | President, 2009 - Present; MFD Distributor, LLC (“MFD”) | | |
| | Treasurer, | (an affiliated brokerage firm of Madison), Vice President, | | |
| | 1999 - 2007; | 2012 - Present | | |
| | 2009 - Present; | | | |
| | Anti-Money | Madison Covered Call & Equity Strategy Fund, Secretary | | |
| | Laundering | and Assistant Treasurer, 2012 - Present; Madison Funds | | |
| | Officer, 2019 - | (18), Secretary, 1999 - Present and Assistant Treasurer, | | |
| | Present | 1999-2007 and 2009 - Present; Madison Funds and | | |
| | | Madison Covered Call & Equity Strategy Fund, Anti-Money | | |
| | | Laundering Officer, 2019 - Present; Madison Strategic | | |
| | | Sector Premium Fund, Secretary and Assistant Treasurer, | | |
| | | 2010 - 2018 | | |
| Kevin S. Thompson | Chief Legal Officer | MIH, MIA and Madison, Chief Legal Officer and Chief | N/A | N/A |
| 1966 | and Assistant | Administrative Officer, 2017 - Present | | |
| | Secretary, 2017 - | | | |
| | Present | Madison Funds (18) and Madison Covered Call & Equity | | |
| | | Strategy Fund, Chief Legal Officer and Assistant Secretary, | | |
| | | 2017 - Present; Madison Strategic Sector Premium Fund, | | |
| | | Chief Legal Officer and Assistant Secretary, 2017 - 2018 | | |
| | | | | |
| | | CFMG Life Insurance Company, Associate General Counsel, | | |
| | | 2012 - 2015; Vice President Wealth Management, 2015 - | | |
| | | 2017; President of CBSI 2016 - 2017 | | |
| Steve J. Fredricks | Chief Compliance | MIH, MIA and Madison, Chief Compliance Officer, 2018 | N/A | N/A |
| 1970 | Officer and | - Present | | |
| | Assistant | | | |
| | Secretary, 2018 - | Madison Funds (18) and Madison Covered Call & Equity | | |
| | Present | Strategy Fund, Chief Compliance Officer and Assistant | | |
| | | Secretary, 2018 - Present; Madison Strategic Sector | | |
| | | Premium Fund, Chief Compliance Officer, 2018 | | |
| | | | | |
| | | Jackson National Asset Management, LLC, Senior Vice | | |
| | | President and Chief Compliance Officer, 2005 - 2018 | | |
| Trey D. Edgerle | Assistant Secretary, | Madison Funds (18) and Ultra Series Fund (14), Assistant | N/A | N/A |
| 1990 | 2017 - Present | Secretary, 2017 - Present; Madison Strategic Sector Premium | | |
| | | Fund, Assistant Secretary, 2017 - 2018 | | |
| | | | | |
| | | U.S. Bancorp, Mutual Fund Compliance Officer, 2013 - 2016 | | |
| | | | | |
1As of the date of this report, the fund complex consists of Madison Funds with 18 portfolios, the Ultra Series Fund with 14 portfolios and the Madison Covered Call & Equity Strategy Fund (closed end fund), for a grand total of 33 separate portfolios in the fund complex. Not every Trustee is a member of the Board of Trustees of every fund in the fund complex, as noted above. References to the “Fund Complex” in the following tables have the meaning disclosed in this paragraph.
Ultra Series Fund| December 31, 2018
| |
| Ultra Series Fund’s Trustees and Officers |
Independent Trustees
| |
| | Position(s) and | | Portfolios Overseen | |
| Name and | Length of Time | Principal Occupation(s) | in Fund Complex by | Other Directorships Held by |
| Year of Birth | Served1 | During Past Five Years | Director/Trustee2 | Director/ Trustee |
| James R. Imhoff, Jr. | Trustee, 2009 - | First Weber Inc. (real estate brokers), | 33 | Park Bank, 1978 - Present |
| 1944 | Present | Madison, WI, Chairman, 2017 - | | |
| | | Present; Chief Executive Officer, | | First Weber, Inc., 2017 - Present |
| | | 1996 - 2017 | | |
| | | | | Madison Funds (18), 2009 - Present; Madison |
| | | | | Covered Call & Equity Strategy Fund, 2005 - Present |
| Steven P. Riege | Trustee, 2005 - | Ovation Leadership (management | 33 | Lange Bros. Woodworking Co., Inc., 2017 - Present |
| 1954 | Present | consulting), Milwaukee, WI, Owner/ | | |
| | | President, 2001 - Present | | Madison Funds (18), 2005 - Present; Madison |
| | | | | Covered Call & Equity Strategy Fund, 2015 - Present |
| | | Robert W. Baird & Company (financial | | |
| | | services), Milwaukee, WI, Senior | | |
| | | Vice President-Marketing and Vice | | |
| | | President-Human Resources, | | |
| | | 1986 - 2001 | | |
| Richard E. Struthers | Trustee, 2004 - | Clearwater Capital Management | 33 | Madison Funds (18), 2004 - Present; Madison |
| 1952 | Present | (investment advisory firm), Naples, | | Covered Call & Equity Strategy Fund, 2017 - Present |
| | | FL, Chair and Chief Executive Officer | | |
| | | 1998 - Present | | |
| | | Park Nicollet Health Services, | | |
| | | Minneapolis, MN, Chairman, Finance | | |
| | | and Investment Committee, | | |
| | | 2006 - 2012 | | |
| Carrie J. Thome | Trustee, 2017- | Wisconsin Alumni Research | 32 | Madison Funds (18), 2017 - Present |
| 1968 | Present | Foundation, Madison, WI, Chief | | |
| | | Investment Officer, 2007 - Present | | |
| | | | | |
1Independent Trustees serve in such capacity until the age of 76, unless retirement is waived by unanimous vote of the remaining Trustees on an annual basis.
2As of the date of this report, the fund complex consists of Madison Funds with 18 portfolios, the Ultra Series Fund with 14 portfolios and the Madison Covered Call & Equity Strategy Fund (closed end fund), for a grand total of 33 separate portfolios in the fund complex. Not every Trustee is a member of the Board of Trustees of every fund in the fund complex, as noted above. References to the “Fund Complex” in the preceding tables have the meaning disclosed in this paragraph.
SEC File Number: 811-04815
This page was intentionally left blank.
Item 2. Code of Ethics.
(a) The Trust has adopted a code of ethics that applies to the Trust’s principal executive officer, principal financial officer, principal accounting officer or controller or persons performing similar functions, regardless of whether these individuals are employed by the Trust or a third party.
(c) During the period covered by the report, registrant did not make any substantive amendments to the Code.
(d) The Trust granted no waivers from the code during the period covered by this report.
(f) Any person may obtain a complete copy of the code without charge by calling the Adviser at 800-767-0300 and requesting a copy of “the Ultra Series Fund Sarbanes Oxley Code of Ethics.”
Item 3. Audit Committee Financial Expert.
In July 2018, Richard Struthers, an “independent” Trustee and a member of the Trust’s audit committee, was appointed to serve as the Trust’s audit committee financial expert among the four independent Trustees who so qualify to serve in that capacity.
Item 4. Principal Accountant Fees and Services.
(a) Audit Fees. Total audit fees paid (or to be paid) to the registrant’s principal accountant for the fiscal years ended December 31, 2018 and 2017, respectively were $222,000 ($450,000 budgeted including the Madison Funds and the Madison Covered Call & Equity Strategy Fund (MCN) and Madison Strategic Sector Premium Fund which was merged into MCN during the year, all affiliated investment companies together, the “Affiliated Funds”) and $227,000 ($450,000 including the Affiliated Funds).
(b) Audit-Related Fees. Not applicable.
(c - e) Tax-Fees. The Audit Committee has pre-approved, as required by Rule 2-01(c)(7)(i)(C) of Regulation S-X, 100% of the services described in this Item 4(b) through (e).
For the fiscal years ended December 31, 2018 and December 31, 2017, the aggregate fees for professional services rendered to Deloitte & Touche for tax compliance, tax advice and tax planning for such fiscal years totaled $30,285 (budgeted) and $30,285, respectively.
In the scope of services comprising the fees disclosed under this Item 4(c) were the following services:
-Review and sign as signature preparer for U.S. Income Tax Return for Regulated Investment Companies, Form 1120-RIC.
(f) Not applicable.
(g) Not applicable.
(h) Not applicable.
Item 5. Audit Committee of Listed Registrants.
Not applicable.
Item 6. Schedule of Investments
(a) Schedule included as part of the report to shareholders filed under Item 1 of this Form.
(b) Not applicable.
Item 7. Disclosure of Proxy Voting Policies and Procedures for Closed-End Management Investment Companies.
Not applicable.
Item 8. Portfolio Managers of Closed-End Management Investment Companies.
Not applicable.
Item 9. Purchases of Equity Securities by Closed-End Management Investment Company and Affiliated Purchasers.
Not applicable.
Item 10. Submission of Matters to a Vote of Security Holders.
The Trust does not normally hold shareholder meetings. There have been no changes to the Trust’s procedures during the period covered by this report.
Item 11. Controls and Procedures.
(a) The Trust’s principal executive officer and principal financial officer determined that the Trust’s disclosure controls and procedures (as defined in Rule 30a-3(c) under the Investment Company Act of 1940 (the “Act”)) are effective, based on their evaluation of these controls and procedures required by Rule 30a-3(b) under the Act and Rules 13a-15(b) or 15d-15(b) under the Securities Exchange Act of 1934 within 90 days of the date of this report. There were no significant changes in the Trust’s internal controls or in other factors that could significantly affect these controls subsequent to the date of their evaluation. The officers identified no significant deficiencies or material weaknesses.
(b) There were no changes in the Trust’s internal control over financial reporting (as defined in Rule 30a-3(d) under the Act) that occurred during the second fiscal quarter of the period covered by this report that has materially affected, or is reasonably likely to materially affect, the Trust’s internal control over financial reporting.
Item 12. Disclosure of Securities Lending Activities for Closed-End Management Investment Companies.
Not applicable.
Item 13. Exhibits.
| (a) | | (1) Code of ethics - See Item 2. |
| | | |
| | | (2) Certifications of principal executive and principal financial officers pursuant to Section 302 of the Sarbanes-Oxley Act of 2002 –Filed herewith. |
| | | |
| | | (3) Not applicable. |
| | | |
| | | (4) There was no change in the registrant’s independent public accountant for the period covered by this report. |
| | | |
| (b) Certifications pursuant to Section 906 of the Sarbanes–Oxley Act of 2002. Furnished herewith. |
SIGNATURES
Pursuant to the requirements of the Securities Exchange Act of 1934 and the Investment Company Act of 1940, the Registrant has duly caused this Report to be signed on its behalf by the undersigned, thereunto duly authorized.
Ultra Series Fund
/s/ Kevin S. Thompson,
Kevin S. Thompson, Chief Legal Officer
Date: March 5, 2019
Pursuant to the requirements of the Securities Exchange Act of 1934 and the Investment Company Act of 1940, this Report has been signed below by the following persons on behalf of the Registrant and in the capacities and on the dates indicated.
/s/ Katherine L. Frank
Katherine L. Frank, President and Principal Executive Officer
Date: March 5, 2019
/s/ Greg Hoppe
Greg Hoppe, Principal Financial Officer
Date: March 5, 2019