1 A lower-cost class of shares available to many longtime shareholders and to those with significant investments in the fund.
2 Derived from data provided by Lipper Inc.
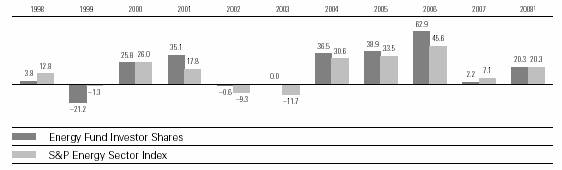
The steady climb in oil prices to record levels during the fiscal six months ended July 31, 2007, helped drive Vanguard Energy Fund’s return to 20.3% for the period. The fund’s advance matched that of the S&P Energy Sector Index and was slightly below the average return of natural resources funds.
Integrated oil companies provided the bulk of the fund’s return. These huge enterprises are engaged in most, if not all, of the process of bringing oil products to market, including exploration, drilling, production, refining, and distribution. Because the Energy Fund is more highly diversified than the S&P Energy Sector Index, the fund provided an equivalent return without overly concentrating in the industry’s largest stocks: Integrated oil companies accounted for about 52% of fund assets, compared with an almost 63% weighting in the index; and the fund’s investments span the globe, while the index only tracks domestic companies.
U.S. stocks produced modest returns for the past six months, as a downturn at the end of the period erased most of the gains recorded earlier. The market stumbled as trouble with low-quality mortgage loans and related securities amplified investors’ risk-aversion.
The broad U.S. stock market returned 1.9% for the fiscal half-year. Large-capitalization stocks bested small-caps, and growth-oriented stocks outperformed
their value-oriented counterparts. International stock markets sidestepped most of the U.S. turmoil, generating excellent six-month returns.
As investors sought a safe haven from some of the financial markets’ riskier precincts, including bonds backed by mortgage loans made to borrowers with poor credit ratings, U.S. Treasury bond prices rose slightly and yields fell. The declines in yield were most pronounced among Treasury securities with maturities of less than 5 years.
These interest rate dynamics helped restore the yield curve—which illustrates the relationship between short- and long-term bond yields—to its typical, upward-sloping pattern. At the start of the period, the curve had been mildly inverted. The broad taxable bond market returned 1.9% for the half-year. Tax-exempt municipal securities returned a bit less.
It’s said that a rising tide raises all boats. The same can be said of the relationship between oil prices and the returns provided by oil-sector companies, especially the integrated oil firms.
Oil prices started the fiscal half-year under $60 per barrel (as measured by West Texas Intermediate crude oil, an industry benchmark) and steadily rose to a record $78.22 per barrel on July 31. Among the factors underlying the oil-price surge were strong global demand, especially from
1 Annualized.
fast-developing countries such as China and India, and concerns relating to the Middle East, Venezuela, and elsewhere. (Natural gas prices, by contrast, declined because of a warm winter and higher levels of inventory.)
The fund’s holdings of integrated oil companies accounted for almost half of the fund’s return. The largest contributors among these oil giants were ConocoPhillips, Chevron, and ExxonMobil.
Rising oil prices also bolstered exploration and production companies as well as equipment and services companies; each of these sectors also made significant contributions to the fund’s return. In oil-field services, Schlumberger and Weatherford International were standout stocks.
The fund also holds several companies with a presence in oil but whose primary business is outside the field. One of these, BHP Billiton, an Australian commodities company, contributed significantly to the fund’s return.
Investors in Vanguard Energy Fund have benefited from handsome returns in recent years. It’s important to remember, however, that the fund’s focus on a specific economic sector means that its returns can
1 Fund expense ratio reflects the six months ended July 31, 2007. Peer-group expense ratio is derived from data provided by Lipper Inc. and captures information through year-end 2006.
be especially volatile owing to specific industry-related events as well as to such factors as the weather, political turmoil, and global economic conditions.
A modest investment of assets in a sector fund, particularly a low-cost one like the Energy Fund, can play a role in your portfolio—perhaps to fill a gap in your overall portfolio’s diversification or to provide the opportunity to meet other specialized investment objectives.
No matter how you choose to use a sector fund, your portfolio planning should aim to strike the right balance between the potential for return and risk. One of the best ways to accomplish this is through a balanced allocation of assets among stock, bond, and money market funds diversified within each of those asset classes.
Thank you for investing with Vanguard.
John J. Brennan
During the six months ended July 31, 2007, Vanguard Energy Fund returned 20.3%—a remarkable result. The performance reflected the combined efforts of your fund’s two advisors. The use of multiple advisors enhances the fund’s diversification by providing exposure to distinct, yet complementary, investment approaches.
The advisors, the percentage of fund assets each manages, and brief descriptions of their investment strategies are presented in the table below. The advisors have also prepared a discussion of the investment environment that existed during the six-month period and of how their portfolio positioning reflects this assessment.
Portfolio Manager: Karl E. Bandtel, Senior Vice President
James A. Bevilacqua, Senior Vice President
The environment for energy investing has remained positive over the last six months. After beginning the period with slightly softer prices due to weak, weather-related demand, oil prices staged a late rally driven by rising global demand and constrained supply. This was in stark contrast to the run-up this time last year based on geopolitical tensions. Natural gas prices fluctuated with weather-related demand trends and ended the period down. Inventories remained above the five-year average.
Despite the pronounced increase in oil prices over the last few years, global oil demand is rising. Continuing solid demand tests the petroleum industry’s ability to provide adequate supplies and increases the likelihood of high and volatile prices. In the short term, prices will depend in part on OPEC’s willingness to maintain production cuts. With the industry operating at near capacity, prices will remain sensitive to potential supply disruptions.
The U.S. refinery industry’s spring maintenance period has extended into the summer, leading to high gasoline prices and strong industry profits. Tougher federal regulations, skilled labor shortages, and wear and tear on aging equipment are all contributing to lower capacity-utilization levels.
Our purchases over the fiscal six months were concentrated in companies with direct access to productive capacity and whose management teams demonstrate an ability to capture resources. We added a new name in Questar and increased our existing positions in OAO Gazprom and Royal Dutch Shell. We eliminated holdings in CNOOC, based on a disappointing change in its production profile, and in Sinopec (formally known as China Petroleum & Chemical).
James D. Troyer, CFA, Principal
Our quantitative investment process evaluates a security’s attractiveness on three dimensions: valuation, sentiment, and balance-sheet prospects. Our experience is that each of our underlying models performs well over long time frames, but that their effectiveness varies over shorter periods. Overall, our model enjoyed modest success relative to the ebullient market during the past six months, despite the increased volatility.
A key characteristic of our strategy is that we do not maintain a “view” on the overall market for energy shares. This is reflected in our portfolio; we are always fully invested. We apply a rigorous risk-control process to neutralize our exposure to market-capitalization, volatility, and industry risks relative to our energy benchmark. In our opinion, such risk exposures are not justified by the potential rewards. We attempt to further reduce risk relative to the benchmark by diversifying our model across three uncorrelated components. Our portfolio strategy boils down to pure stock picking. We make many small investments in individual stocks in an attempt to capture the market’s tendency to overreact or underreact to new information.
During the six months ended July 31, overseas energy stocks performed particularly well. Our portion of the portfolio benefited from its positions in Santos, which was highlighted in the January 31, 2007, annual report as a poor performer, and in Schlumberger and CNOOC. These successes were offset slightly by positions in SEACOR Holdings and Nabors Industries.
1 S&P Energy Sector Index.
2 Dow Jones Wilshire 5000 Index.
3 Annualized.
4 Short-term reserves exclude futures and currency contracts held by the fund.
5 Sector percentages combine U.S. and international holdings.
7 “Ten Largest Holdings” excludes any temporary cash investments and equity index products.
1 Short-term reserves exclude futures and currency contracts held by the fund.
This table presents average annual total returns through the latest calendar quarter—rather than through the end of the fiscal period. Securities and Exchange Commission rules require that we provide this information.
1 Six months ended July 31, 2007.
2 Total returns do not reflect the 1% fee assessed on redemptions of shares held less than one year; nor do they include the account service fee that may be applicable to certain accounts with balances below $10,000.
3 Return since inception.
The fund provides a complete list of its holdings four times in each fiscal year, at the quarter-ends. For the second and fourth fiscal quarters, the lists appear in the fund’s semiannual and annual reports to shareholders. For the first and third fiscal quarters, the fund files the lists with the Securities and Exchange Commission on Form N-Q. Shareholders can look up the fund’s Forms N-Q on the SEC’s website at www.sec.gov. Forms N-Q may also be reviewed and copied at the SEC’s Public Reference Room (see the back cover of this report for further information).
2 Security exempt from registration under Rule 144A of the Securities Act of 1933. Such securities may be sold in transactions exempt from registration, normally to qualified institutional buyers. At July 31, 2007, the value of this security represented 0.1% of net assets.
3 Affiliated money market fund available only to Vanguard funds and certain trusts and accounts managed by Vanguard. Rate shown is the 7-day yield.
4 The issuer operates under a congressional charter; its securities are neither issued nor guaranteed by the U.S. government. If needed, access to additional funding from the U.S. Treasury (beyond the issuer’s line of credit) would require congressional action.
5 Securities with a value of $17,372,000 have been segregated as initial margin for open futures contracts.
ADR—American Depositary Receipt.
1 Dividends are net of foreign withholding taxes of $6,952,000.
2 Interest income from an affiliated company of the fund was $6,093,000.
1 Includes fiscal 2008 and 2007 short-term gain distributions totaling $21,240,000 and $6,548,000, respectively. Short-term gain distributions are treated as ordinary income dividends for tax purposes.
1 Includes increases from redemption fees of $.01, $.03, $.03, $.02, $.00, and $.01.
2 Total returns do not reflect the 1% fee assessed on redemptions of shares held for less than one year; nor do they include the account service fee that may be applicable to certain accounts with balances below $10,000.
3 Excludes the value of portfolio securities received or delivered as a result of in-kind purchases or redemptions of the fund’s capital shares.
1 Includes increases from redemption fees of $.01, $.05, $.03, $.03, $.01, and $.02.
2 Total returns do not reflect the 1% fee assessed on redemptions of shares held for less than one year.
3 Excludes the value of portfolio securities received or delivered as a result of in-kind purchases or redemptions of the fund’s capital shares.
Vanguard Energy Fund is registered under the Investment Company Act of 1940 as an open-end investment company, or mutual fund. The fund files reports with the SEC under the company name Vanguard Specialized Funds. The fund may invest in securities of foreign issuers, which may subject it to investment risks not normally associated with investing in securities of United States corporations. The fund offers two classes of shares, Investor Shares and Admiral Shares. Investor Shares are available to any investor who meets the fund’s minimum purchase requirements. Admiral Shares are designed for investors who meet certain administrative, service, tenure, and account-size criteria.
1. Security Valuation: Securities are valued as of the close of trading on the New York Stock Exchange (generally 4 p.m., Eastern time) on the valuation date. Equity securities are valued at the latest quoted sales prices or official closing prices taken from the primary market in which each security trades; such securities not traded on the valuation date are valued at the mean of the latest quoted bid and asked prices. Securities for which market quotations are not readily available, or whose values have been affected by events occurring before the fund’s pricing time but after the close of the securities’ primary markets, are valued at their fair values calculated according to procedures adopted by the board of trustees. These procedures include obtaining quotations from an independent pricing service, monitoring news to identify significant market- or security-specific events, and evaluating changes in the values of foreign market proxies (for example, ADRs, futures contracts, or exchange-traded funds), between the time the foreign markets close and the fund’s pricing time. When fair-value pricing is employed, the prices of securities used by a fund to calculate its net asset value may differ from quoted or published prices for the same securities. Investments in Vanguard Market Liquidity Fund are valued at that fund’s net asset value. Temporary cash investments acquired over 60 days to maturity are valued using the latest bid prices or using valuations based on a matrix system (which considers such factors as security prices, yields, maturities, and ratings), both as furnished by independent pricing services. Other temporary cash investments are valued at amortized cost, which approximates market value.
2. Foreign Currency: Securities and other assets and liabilities denominated in foreign currencies are translated into U.S. dollars using exchange rates obtained from an independent third party as of the fund’s pricing time on the valuation date. Realized gains (losses) and unrealized appreciation (depreciation) on investment securities include the effects of changes in exchange rates since the securities were purchased, combined with the effects of changes in security prices. Fluctuations in the value of other assets and liabilities resulting from changes in exchange rates are recorded as unrealized foreign currency gains (losses) until the assets or liabilities are settled in cash, at which time they are recorded as realized foreign currency gains (losses).
3. Futures Contracts: The fund uses index futures contracts to a limited extent, with the objective of maintaining full exposure to the stock market while maintaining liquidity. The fund may purchase or sell futures contracts to achieve a desired level of investment, whether to accommodate portfolio turnover or cash flows from capital share transactions. The primary risks associated with the use of futures contracts are imperfect correlation between changes in market values of stocks held by the fund and the prices of futures contracts, and the possibility of an illiquid market.
4. Repurchase Agreements: The fund may invest in repurchase agreements. Securities pledged as collateral for repurchase agreements are held by a custodian bank until the agreements mature. Each agreement requires that the market value of the collateral be sufficient to cover payments of interest and principal; however, in the event of default or bankruptcy by the other party to the agreement, retention of the collateral may be subject to legal proceedings.
5. Federal Income Taxes: The fund intends to continue to qualify as a regulated investment company and distribute all of its taxable income. Accordingly, no provision for federal income taxes is required in the financial statements.
6. Distributions: Distributions to shareholders are recorded on the ex-dividend date.
7. Security Lending: The fund may lend its securities to qualified institutional borrowers to earn additional income. Security loans are required to be secured at all times by collateral at least equal to the market value of securities loaned. The fund invests cash collateral received in Vanguard Market Liquidity Fund, and records a liability for the return of the collateral, during the period the securities are on loan. Security lending income represents the income earned on investing cash collateral, less expenses associated with the loan.
8. Other: Dividend income is recorded on the ex-dividend date. Interest income includes income distributions received from Vanguard Market Liquidity Fund and is accrued daily. Security transactions are accounted for on the date securities are bought or sold. Costs used to determine realized gains (losses) on the sale of investment securities are those of the specific securities sold. Fees assessed on redemptions of capital shares are credited to paid-in capital.
Each class of shares has equal rights as to assets and earnings, except that each class separately bears certain class-specific expenses related to maintenance of shareholder accounts (included in Management and Administrative expenses) and shareholder reporting. Marketing and distribution expenses are allocated to each class of shares based on a method approved by the board of trustees. Income, other non-class-specific expenses, and gains and losses on investments are allocated to each class of shares based on its relative net assets.
The Vanguard Group provides investment advisory services to a portion of the fund on an at-cost basis; the fund paid Vanguard advisory fees of $158,000 for the six months ended July 31, 2007.
For the six months ended July 31, 2007, the aggregate investment advisory fee represented an effective annual rate of 0.07% of the fund’s average net assets.
During the six months ended July 31, 2007, the fund realized net foreign currency gains of $136,000, which increased distributable net income for tax purposes; accordingly, such gains have been reclassified from undistributed net investment income to accumulated net realized gains.
At July 31, 2007, the cost of investment securities for tax purposes was $6,215,089,000. Net unrealized appreciation of investment securities for tax purposes was $6,381,975,000, consisting of unrealized gains of $6,385,554,000 on securities that had risen in value since their purchase and $3,579,000 in unrealized losses on securities that had fallen in value since their purchase.
At July 31, 2007, the aggregate settlement value of open futures contracts expiring in September 2007 and the related unrealized appreciation (depreciation) were:
Unrealized appreciation (depreciation) on open futures contracts is required to be treated as realized gain (loss) for tax purposes.
1 Net of redemption fees of $1,120,000 and $3,975,000, respectively (fund totals).
As a shareholder of the fund, you incur ongoing costs, which include costs for portfolio management, administrative services, and shareholder reports (like this one), among others. Operating expenses, which are deducted from a fund’s gross income, directly reduce the investment return of the fund.
A fund’s expenses are expressed as a percentage of its average net assets. This figure is known as the expense ratio. The following examples are intended to help you understand the ongoing costs (in dollars) of investing in your fund and to compare these costs with those of other mutual funds. The examples are based on an investment of $1,000 made at the beginning of the period shown and held for the entire period.
To do so, simply divide your account value by $1,000 (for example, an $8,600 account value divided by $1,000 = 8.6), then multiply the result by the number given for your fund under the heading “Expenses Paid During Period.”
1 These calculations are based on expenses incurred in the most recent six-month period. The fund’s annualized six-month expense ratios for that period are 0.25% for Investor Shares and 0.18% for Admiral Shares. The dollar amounts shown as “Expenses Paid” are equal to the annualized expense ratio multiplied by the average account value over the period, multiplied by the number of days in the most recent six-month peiod, then divided by the number of days in the most recent 12-month period.
The calculations assume no shares were bought or sold during the period. Your actual costs may have been higher or lower, depending on the amount of your investment and the timing of any purchases or redemptions.
The board of trustees of Vanguard Energy Fund has renewed the fund’s investment advisory arrangement with The Vanguard Group, Inc. (through its Quantitative Equity Group). The board also approved an amended investment advisory agreement with Wellington Management Company, LLP, effective May 1, 2007. The amended agreement contains a new advisory fee schedule that increases the advisory fee paid to Wellington Management and adds a performance adjustment to the fee arrangement. The board determined that renewing the fund’s advisory arrangement with Vanguard, retaining Wellington Management, and amending Wellington Management’s advisory agreement were in the best interests of the fund and its shareholders.
The board based its decisions upon an evaluation of each advisor’s investment staff, portfolio management process, and performance. The trustees considered the factors discussed below, among others. However, no single factor determined whether the board approved the arrangements. Rather, it was the totality of the circumstances that drove the board’s decision.
The board considered the quality of the fund’s investment management over both short- and long-term periods, and took into account the organizational depth and stability of each advisor. The board noted the following:
George U. Sauter, Vanguard managing director and chief investment officer, has been in the investment management business since 1985, and has led the Quantitative Equity Group since 1987. The Quantitative Equity Group adheres to a sound, disciplined investment management process; the team has considerable experience, stability, and depth. Vanguard has managed a portion of the fund since 2005.
The board concluded that the existing advisory fee schedule should be adjusted to reflect the fair- market value of Wellington Management’s services. The new fee arrangement will enable Wellington Management to enhance the organizational depth and stability of the fund’s portfolio management team by retaining top investment talent and by hiring new investment professionals on an as-needed basis. The addition of a performance adjustment will better align the interests of Wellington Management and the fund’s shareholders by increasing or decreasing the asset-based fee proportionately with the performance of the portion of the fund managed by Wellington Management. A full discussion of the board’s decision to amend Wellington Management’s advisory agreement, including the terms of the agreement, appeared in the fund’s annual report for the year ended January 31, 2007.
The board considered the short- and long-term performance of the fund, including any periods of outperformance or underperformance of a relevant benchmark and peer group. The board concluded that each advisor has carried out its investment strategy in disciplined fashion, and the results provided
The board does not conduct a “profitability” analysis of Vanguard because of Vanguard’s unique “at-cost” structure. Unlike most other mutual fund management companies, Vanguard is owned by the funds it oversees, and produces “profits” only in the form of reduced expenses for fund shareholders. The board did not consider profitability of Wellington Management in determining whether to approve the advisory fee, because Wellington Management is independent of Vanguard, and the advisory fee is the result of arm’s-length negotiations.
The board concluded that the fund’s shareholders benefit from economies of scale because of breakpoints in the advisory fee schedule with Wellington Management. The breakpoints reduce the effective rate of the fee as the fund’s assets managed by Wellington Management increase. The board also concluded that the fund’s low-cost arrangement with Vanguard ensures that the fund will realize economies of scale as it grows, with the cost to shareholders declining as the fund’s assets managed by Vanguard increase.
The board will consider whether to renew the advisory arrangements again after a one-year period.
This page intentionally left blank.
The trustees of your mutual fund are there to see that the fund is operated and managed in your best interests since, as a shareholder, you are a part owner of the fund. Your fund’s trustees also serve on the board of directors of The Vanguard Group, Inc., which is owned by the Vanguard funds and provides services to them on an at-cost basis.
A majority of Vanguard’s board members are independent, meaning that they have no affiliation with Vanguard or the funds they oversee, apart from the sizable personal investments they have made as private individuals.
Our independent board members bring distinguished backgrounds in business, academia, and public service to their task of working with Vanguard officers to establish the policies and oversee the activities of the funds. Among board members’ responsibilities are selecting investment advisors for the funds; monitoring fund operations, performance, and costs; reviewing contracts; nominating and selecting new trustees/directors; and electing Vanguard officers.
Each trustee serves a fund until its termination; or until the trustee’s retirement, resignation, or death; or otherwise as specified in the fund’s organizational documents. Any trustee may be removed at a shareholders’ meeting by a vote representing two-thirds of the net asset value of all shares of the fund together with shares of other Vanguard funds organized within the same trust. The table on these two pages shows information for each trustee and executive officer of the fund. The mailing address of the trustees and officers is P.O. Box 876, Valley Forge, PA 19482.
1 Officers of the funds are “interested persons” as defined in the Investment Company Act of 1940.
2 December 2002 for Vanguard Equity Income Fund, Vanguard Growth Equity Fund, the Vanguard Municipal Bond Funds, and the Vanguard State Tax-Exempt Funds.
| |
Vanguard® Precious Metals | |
and Mining Fund | |
| |
| |
> Semiannual Report | |
| |
| |
| |
July 31, 2007 | |
| |
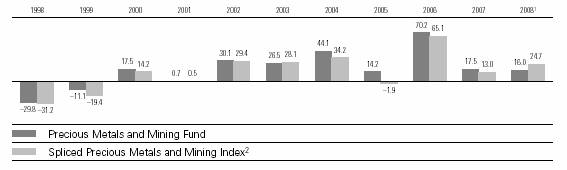
> | During the six months ended July 31, 2007, Vanguard Precious Metals and Mining Fund returned 16.0%, below that of its benchmark index but ahead of the average return for gold-oriented funds. |
> | The fund’s return substantially outpaced the result of the broad stock market. |
> | Concentrated holdings in platinum mining and processing accounted for about one-third of the fund’s return. |
Contents | |
| |
Your Fund’s Total Returns | 1 |
Chairman’s Letter | 2 |
Advisor’s Report | 6 |
Fund Profile | 8 |
Performance Summary | 9 |
Financial Statements | 10 |
About Your Fund’s Expenses | 19 |
Trustees Approve Advisory Agreement | 21 |
Glossary | 22 |
Please note: The opinions expressed in this report are just that—informed opinions. They should not be considered promises or advice. Also, please keep in mind that the information and opinions cover the period through the date on the cover of this report. Of course, the risks of investing in your fund are spelled out in the prospectus.
Your Fund’s Total Returns
Six Months Ended July 31, 2007 | | |
| Ticker | Total |
| Symbol | Returns |
Vanguard Precious Metals and Mining Fund | VGPMX | 16.0% |
S&P/Citigroup Custom Metals and Mining Index | | 24.7 |
Average Gold-Oriented Fund1 | | 5.6 |
Dow Jones Wilshire 5000 Index | | 1.9 |
Your Fund’s Performance at a Glance | | | | |
January 31, 2007–July 31, 2007 | | | | |
| | | Distributions Per Share |
| Starting | Ending | Income | Capital |
| Share Price | Share Price | Dividends | Gains |
Vanguard Precious Metals and Mining Fund | $28.64 | $32.43 | $0.050 | $0.662 |
| | | | | |
1 Derived from data provided by Lipper Inc.
1

Chairman’s Letter
Dear Shareholder,
Vanguard Precious Metals and Mining Fund advanced 16.0% for the fiscal half-year ended July 31, 2007, well ahead of the 1.9% return for the overall U.S. stock market. The return of the fund, which is broadly diversified across metals and mining operations, lagged its benchmark index, but outpaced the average return for gold-oriented funds.
The fund remained closed to new investors, although existing shareholders can make additional share purchases.
For the U.S. stock market, a nervous finish to the half-year
U.S. stocks produced modest returns for the past six months, as a downturn at the end of the period erased most of the gains recorded earlier. The market stumbled as trouble with low-quality mortgage loans and related securities amplified investors’ risk-aversion.
The broad U.S. stock market returned 1.9% for the fiscal half-year. Large-capitalization stocks bested small-caps, and growth-oriented stocks outperformed their value-oriented counterparts. International stock markets sidestepped most of the U.S. turmoil, generating excellent six-month returns.
For bonds, a return to a more typical yield curve
As investors sought a safe haven from some of the financial markets’ riskier precincts, including bonds backed by mortgage loans made to borrowers with poor credit ratings, U.S. Treasury
2
bond prices rose slightly and yields fell. The declines in yield were most pronounced among Treasury securities with maturities of less than 5 years.
These interest rate dynamics helped restore the yield curve—which illustrates the relationship between short- and long-term bond yields—to its typical, upward-sloping pattern. At the start of the period, the curve had been mildly inverted. The broad taxable bond market returned 1.9% for the half-year. Tax-exempt municipal securities returned a bit less.
A focus on platinum paid off, as did a variety of other holdings
Within the parameters of its metals-and-mining mandate, Vanguard Precious Metals and Mining Fund is, on the one hand, highly diversified in terms of the overall industry and geography. The fund’s investments focus on a wide range of products—from precious metals, including gold, to agricultural chemicals and coal—and span the globe from developed countries to South Africa, Peru, and Indonesia. On the other hand, the fund is highly concentrated: It owned only 46 stocks as of July 31, about a quarter of which accounted for the bulk of its return in the fiscal six months.
Market Barometer | | | |
| | | Total Returns |
| | Periods Ended July 31, 2007 |
| Six Months | One Year | Five Years1 |
Stocks | | | |
Russell 1000 Index (Large-caps) | 1.9% | 16.5% | 12.3% |
Russell 2000 Index (Small-caps) | –2.5 | 12.1 | 16.0 |
Dow Jones Wilshire 5000 Index (Entire market) | 1.9 | 16.8 | 13.1 |
MSCI All Country World Index ex USA (International) | 11.8 | 28.5 | 22.3 |
| | | |
Bonds | | | |
Lehman U.S. Aggregate Bond Index (Broad taxable market) | 1.9% | 5.6% | 4.4% |
Lehman Municipal Bond Index | 1.2 | 4.3 | 4.5 |
Citigroup 3-Month Treasury Bill Index | 2.5 | 5.1 | 2.7 |
| | | |
CPI | | | |
Consumer Price Index | 2.9% | 2.4% | 3.0% |
| | | | |
1 Annualized.
3
Four of the fund’s six largest holdings—mining companies Lonmin, Impala Platinum Holdings, and Anglo Platinum, and processor Johnson Matthey—are involved in producing or processing platinum, and they accounted for about one-third of the fund’s return. Platinum’s major use is in catalytic converters in cars, buses, and trucks. The converters, for which long-term demand is strong worldwide, turn emissions into nontoxic compounds.
Other significant contributors to the fund’s return were Rio Tinto, a diversified international mining company; Eramet, which produces nickel and other nonferrous metals; and CONSOL Energy, a coal and gas company. Fertilizer producers K+S AG and Agrium, and steel companies
BlueScope Steel and Sims Group, also provided a boost. The major detractor from the fund’s return was Centerra Gold.
Sector funds can play a role in a balanced portfolio
Investors in Vanguard Precious Metals and Mining Fund have benefited from handsome returns in recent years. It’s important to remember, however, that the fund’s focus on a specific industry means that its returns can be especially volatile, buffeted by events that may not affect other parts of the economy.
A modest allocation to a low-cost sector fund can play a role in your portfolio—perhaps to help achieve diversification or to provide an opportunity to meet specialized investment objectives.
Annualized Expense Ratios1 | | |
Your fund compared with its peer group | | |
| | Average |
| | Gold-Oriented |
| Fund | Fund |
Precious Metals and Mining Fund | 0.32% | 1.59% |
1 Fund expense ratio reflects the six months ended July 31, 2007. Peer-group expense ratio is derived from data provided by Lipper Inc. and captures information through year-end 2006.
4
No matter how you choose to use a sector fund, your portfolio planning should aim to strike the right balance between the potential for return and the potential for risk. This can best be done by establishing a balanced allocation of assets among stock, bond, and money market funds, and diversifying within each of those asset classes.
Thank you for investing with Vanguard.
Sincerely,

John J. Brennan
Chairman and Chief Executive Officer
August 13, 2007
5
Advisor’s Report
Vanguard Precious Metals and Mining Fund produced a return of 16.0% during the six-month period. This was behind the benchmark index’s return of 24.7%, but ahead of the 5.6% result of the average gold-oriented fund.
The investment environment
The price of gold bullion remained at historically high levels, but was broadly unchanged during the half-year. The prices of a number of other metals, including platinum and copper, gained ground. Nickel was an exception; its price fell sharply from April onward due to oversupply in the nickel-intensive stainless steel industry. In spite of volatility in underlying metal prices, shares of broader mining companies advanced strongly. As a group, mining companies continued to generate excellent returns against a backdrop of sustained demand from industrializing and developed economies alike. China is still the driving force behind global demand. By contrast, gold equities continued to underperform as the gold sector remained focused on growth, rather than profitability, and struggled to overcome rising costs and operational inefficiencies.
The fund’s performance
Against this background of metal price strength, French nickel group Eramet, one of the few remaining independent producers in this highly consolidated industry, made a strong contribution as investors looked beyond the extreme volatility in the price of nickel and focused on the long-term value of the company’s assets. The fund’s long-standing and significant positions in United Kingdom platinum producer Lonmin and in South
African producer Anglo Platinum, as well as a more recently added position in U.K. platinum processor Johnson Matthey, all benefited, based on the extremely strong supply/demand balance for the metal.
Outside the traditional metals and mining arena, positions in German potash miner K+S and Canadian potash miner Agrium added significant value, as both benefited from intensifying demand for fertilizers to improve land yields. Sentiment was also buoyed by expectations of rising biofuel production as an alternative fuel source to gasoline. Finally, our lack of exposure to U.S. gold producer Newmont Mining, a poor performer, continued to have a positive impact on relative performance. The company has struggled to effectively combat higher costs in the face of falling production.
By contrast, our holding in Canadian gold producer Centerra Gold was the main detractor from the fund’s performance, due to concerns over government involvement at one of the company’s mines in the Kyrgyz Republic, in Central Asia. We are nevertheless confident that a positive outcome can be achieved for shareholders. The fund’s significant holding in Canadian diamond-producer Aber Diamond also had a negative impact, as the market continued to come to terms with the company’s shift into diamond retailing. In addition, concerns about rising input costs persist. In spite of this, the company continues to exceed production targets, and fundamentals for the diamond industry remain extremely compelling.
6
The fund’s positioning
We remained focused on increasing our holdings among metals and minerals companies with healthy cash flows and exposure to strategically important materials. We established new positions in Minerals Technologies, a U.S. industrial minerals producer with a highly respected new chief executive, and in AUR Resources, a well-managed copper miner that aims to improve returns from its assets in Chile and Canada. Near the end of the fiscal half-year, AUR received a bid at a significant premium. Within the precious metals sector, we added to our positions in Northam Platinum, a midsized producer of platinum-group metals in South Africa that we believe has exciting expansion opportunities; and the Russian gold-mining company Peter Hambro Mining, whose significant reserves and emphasis on efficiency should enable it to generate significantly higher returns than most of the gold industry. We also added substantially to Johnson Matthey, a recent addition to our portfolio, as noted earlier. The company processes platinum for use in catalytic converters in automobiles, an area in which demand is being boosted by tighter global emissions legislation.
We sold holdings that had performed exceptionally well or in which we believed the company’s fundamentals had deteriorated. Significant disposals included those of Australian diversified mining company Rio Tinto, which was sold due to fears that it was overpaying in its $43 billion bid for Canadian aluminium-producer Alcan; previously mentioned Agrium and Anglo Platinum; and Canadian-listed copper-gold miner First Quantum Minerals. In each of these cases, valuation levels appeared less attractive following extremely strong performance.
In spite of heightened levels of volatility during the period, the fund’s investment environment remains supportive. The appetite for raw materials from both emerging and developed nations continues apace, driven primarily by China’s extraordinary industrial expansion. In the meantime, supply remains tightly controlled as a result of ongoing consolidation in the broader mining sector and years of under-investment in new projects. Consequently, we remain confident about the long-term outlook for a number of commodities, a scenario that provides a favorable environment for the mining groups that supply these assets. And we continue to monitor the profitability of the gold industry, which, as recent earnings announcements attest, has remained poor compared with the broader mining industry.
Graham E. French, Portfolio Manager
M&G Investment Management Ltd.
August 30, 2007
7
Fund Profile
As of July 31, 2007
Portfolio Characteristics | | |
| | Comparative | Broad |
| Fund | Index1 | Index2 |
Number of Stocks | 46 | 255 | 4,902 |
Median Market Cap | $6.9B | $17.9B | $32.9B |
Price/Earnings Ratio | 21.0x | 18.0x | 17.4x |
Price/Book Ratio | 3.4x | 3.4x | 2.7x |
Return on Equity | 18.2% | 18.4% | 18.4% |
Earnings Growth Rate | 23.2% | 31.7% | 21.0% |
Foreign Holdings | 82.1% | 0.0% | 0.0% |
Turnover Rate | 16%3 | — | — |
Expense Ratio | 0.32%3 | — | — |
Short-Term Reserves | 5% | — | — |
Market Diversification (% of portfolio) | |
| |
United Kingdom | 20% |
Australia | 15 |
United States | 15 |
South Africa | 15 |
Canada | 14 |
France | 9 |
Germany | 5 |
Peru | 2 |
Short-Term Reserves | 5% |
Volatility Measures4 | |
| Fund Versus | Fund Versus |
| Comparative Index1 | Broad Index2 |
R-Squared | 0.81 | 0.36 |
Beta | 0.80 | 1.53 |
Ten Largest Holdings5 (% of total net assets) |
| |
Lonmin PLC | 10.8% |
Impala Platinum Holdings Ltd. ADR | 7.0 |
Johnson Matthey PLC | 6.5 |
Eramet SLN | 6.0 |
Aber Diamond Corp. | 5.9 |
Anglo Platinum Ltd. ADR | 5.1 |
K+S AG | 4.6 |
Barrick Gold Corp. | 4.2 |
Sims Group Ltd. | 3.5 |
CONSOL Energy, Inc. | 3.4 |
Top Ten | 57.0% |
1 S&P/Citigroup Custom Metals and Mining Index.
2 Dow Jones Wilshire 5000 Index.
3 Annualized.
4 For an explanation of R-squared, beta, and other terms used here, see the Glossary on page 22.
5 “Ten Largest Holdings” excludes any temporary cash investments and equity index products.
8
Performance Summary
All of the returns in this report represent past performance, which is not a guarantee of future results that may be achieved by the fund. (Current performance may be lower or higher than the performance data cited. For performance data current to the most recent month-end, visit our website at www.vanguard.com/performance.) Note, too, that both investment returns and principal value can fluctuate widely, so an investor’s shares, when sold, could be worth more or less than their original cost. The returns shown do not reflect taxes that a shareholder would pay on fund distributions or on the sale of fund shares.
Fiscal-Year Total Returns (%): January 31, 1997–July 31, 2007
Average Annual Total Returns: Periods Ended June 30, 2007
This table presents average annual total returns through the latest calendar quarter—rather than through the end of the fiscal period. Securities and Exchange Commission rules require that we provide this information.
| Inception Date | One Year | Five Years | Ten Years |
Precious Metals and Mining Fund3 | 5/23/1984 | 30.41% | 33.02% | 18.05% |
1 Six months ended July 31, 2007.
2 S&P/Citigroup World Equity Gold Index through June 30, 2005; S&P/Citigroup Custom Metals and Mining Index thereafter.
3 Total return figures do not reflect the 1% redemption fee assessed on redemptions of shares held less than one year, and do not include the account service fee that may be applicable to certain accounts with balances below $10,000.
Note: See Financial Highlights table on page 14 for dividend and capital gains information.
9
Financial Statements (unaudited)
Statement of Net Assets
As of July 31, 2007
The fund provides a complete list of its holdings four times in each fiscal year, at the quarter-ends. For the second and fourth fiscal quarters, the lists appear in the fund’s semiannual and annual reports to shareholders. For the first and third fiscal quarters, the fund files the lists with the Securities and Exchange Commission on Form N-Q. Shareholders can look up the fund’s Forms N-Q on the SEC’s website at www.sec.gov. Forms N-Q may also be reviewed and copied at the SEC’s Public Reference Room (see the back cover of this report for further information).
| | | Market |
| | | Value• |
| | Shares | ($000) |
Common Stocks (95.1%) | | |
Australia (15.7%) | | |
| Sims Group Ltd. | 6,000,000 | 136,741 |
^ | Rio Tinto Ltd. | 1,700,000 | 132,516 |
| BlueScope Steel Ltd. | 12,000,000 | 110,899 |
^,1 | Iluka Resources Ltd | 17,150,000 | 86,280 |
| CSR Ltd. | 30,000,000 | 84,619 |
^,1 | Centennial Coal Co., Ltd. | 15,775,000 | 44,933 |
*^ | St. Barbara Ltd. | 31,800,000 | 13,446 |
| Consolidated | | |
| Minerals Ltd. | 1,500,000 | 4,656 |
* | Tanami Gold NL | 18,170,000 | 1,896 |
| Oxiana Ltd. | 250,000 | 778 |
* | Magnesium | | |
| International Ltd. | 1,678,671 | 109 |
| | | 616,873 |
Canada (14.0%) | | |
1 | Aber Diamond Corp. | 6,200,000 | 231,076 |
| Barrick Gold Corp. | 5,000,000 | 164,229 |
*1 | Centerra Gold Inc. | 12,865,000 | 84,657 |
| AUR Resources Inc. | 1,060,000 | 40,431 |
| Sherritt International Corp. | 1,175,000 | 17,931 |
*1 | Claude Resources, Inc. | 3,650,000 | 5,329 |
* | SouthernEra | | |
| Diamonds, Inc. | 7,022,900 | 4,279 |
* | Arizona Star Resource Corp. | 200,000 | 2,236 |
| | | 550,168 |
France (8.9%) | | |
| Eramet SLN | 776,773 | 234,523 |
| Imerys SA | 1,160,000 | 113,675 |
| | | 348,198 |
Germany (4.6%) | | |
| K+S AG | 1,230,000 | 181,398 |
| | | |
Indonesia (0.2%) | | |
| PT International Nickel | | |
| Indonesia Tbk | 1,250,000 | 7,593 |
| | | Market |
| | | Value• |
| | Shares | ($000) |
Papua New Guinea (0.0%) | | |
* | Bougainville Copper Ltd. | 2,000,000 | 1,448 |
| | | |
Peru (1.7%) | | |
| Compañia de Minas | | |
| Buenaventura S.A.u. ADR | 1,700,000 | 67,847 |
| | | |
South Africa (14.7%) | | |
| Impala Platinum | | |
| Holdings Ltd. ADR | 9,400,000 | 272,730 |
| Anglo Platinum Ltd. ADR | 1,450,000 | 198,805 |
| Northam Platinum Ltd. | 8,936,800 | 66,234 |
| Gold Fields Ltd. ADR | 2,425,000 | 40,061 |
| | | 577,830 |
United Kingdom (20.4%) | | |
| Lonmin PLC | 6,069,413 | 425,384 |
| Johnson Matthey PLC | 7,450,000 | 255,510 |
*^ | Peter Hambro Mining PLC | 2,867,368 | 55,323 |
| Rio Tinto PLC | 475,000 | 34,270 |
| Vedanta Resources PLC | 270,000 | 9,657 |
| Hochschild Mining PLC | 823,081 | 5,955 |
* | Kenmare Resources PLC | 4,550,000 | 5,665 |
* | Gem Diamond Ltd. | 171,428 | 3,644 |
* | Zambezi Resources Ltd. | 4,895,833 | 2,449 |
* | Mwana Africa PLC | 100,000 | 161 |
| | | 798,018 |
United States (14.9%) | | |
| CONSOL Energy, Inc. | 3,230,000 | 134,530 |
| Peabody Energy Corp. | 2,700,000 | 114,102 |
| FMC Corp. | 1,175,000 | 104,728 |
1 | Minerals Technologies, Inc. | 1,277,000 | 82,584 |
* | Meridian Gold Inc. | 2,450,000 | 69,164 |
| AMCOL International Corp. | 1,400,000 | 40,082 |
| Arch Coal, Inc. | 1,200,000 | 35,868 |
| | | 581,058 |
Total Common Stocks | | |
(Cost $2,129,931) | | 3,730,431 |
10
| | Market |
| | Value• |
| Shares | ($000) |
Precious Metals (0.1%) | | |
* Platinum Bullion (In Ounces) | 2,009 | 2,591 |
Total Precious Metals | | |
(Cost $1,213) | | 2,591 |
Temporary Cash Investments (8.8%) | | |
2 Vanguard Market Liquidity Fund, 5.302% | 146,328,435 | 146,328 |
2 Vanguard Market Liquidity Fund, 5.302%—Note F | 200,244,119 | 200,244 |
Total Temporary Cash Investments | | |
(Cost $346,572) | | 346,572 |
Total Investments (104.0%) | | |
(Cost $2,477,716) | | 4,079,594 |
Other Assets and Liabilities—Net (–4.0%) | | (157,055) |
Net Assets (100%) | | |
Applicable to 120,965,031 outstanding | | |
$.001 par value shares of beneficial | | |
interest (unlimited authorization) | | 3,922,539 |
Net Asset Value Per Share | | $32.43 |
| | |
Statement of Assets and Liabilities | | |
Assets | | |
Investments in Securities, at Value | | 4,079,594 |
Receivables for Investment | | |
Securities Sold | | 62,043 |
Receivables for Capital Shares Issued | | 2,445 |
Other Assets—Note C | | 33,795 |
Total Assets | | 4,177,877 |
Liabilities | | |
Security Lending Collateral | | |
Payable to Brokers—Note F | | 200,244 |
Payables for Investment | | |
Securities Purchased | | 25,167 |
Other Liabilities | | 29,927 |
Total Liabilities | | 255,338 |
Net Assets | | 3,922,539 |
At July 31, 2007, net assets consisted of:3 | |
| Amount | Per |
| ($000) | Share |
Paid-in Capital | 2,145,464 | $17.75 |
Undistributed Net | | |
Investment Income | 9,871 | .08 |
Accumulated Net | | |
Realized Gains | 164,999 | 1.36 |
Unrealized Appreciation | | |
Investment Securities | 1,601,878 | 13.24 |
Foreign Currencies | 327 | — |
Net Assets | 3,922,539 | $32.43 |
• | See Note A in Notes to Financial Statements. |
* | Non-income-producing security. |
^ | Part of security position is on loan to broker-dealers. See Note F in Notes to Financial Statements. |
1 Considered an affiliated company of the fund as the fund owns more than 5% of the outstanding voting securities of such company. See Note H in Notes to Financial Statements.
2 Affiliated money market fund available only to Vanguard funds and certain trusts and accounts managed by Vanguard. Rate shown is the 7-day yield.
3 See Note D in Notes to Financial Statements for the tax-basis components of net assets.
ADR—American Depositary Receipt.
11
Statement of Operations
| Six Months Ended |
| July 31, 2007 |
| ($000) |
Investment Income | |
Income | |
Dividends1,2 | 46,948 |
Interest2 | 1,841 |
Security Lending | 989 |
Total Income | 49,778 |
Expenses | |
Investment Advisory Fees—Note B | |
Basic Fee | 2,400 |
Performance Adjustment | 62 |
The Vanguard Group—Note C | |
Management and Administrative | 3,008 |
Marketing and Distribution | 393 |
Custodian Fees | 206 |
Shareholders’ Reports | 25 |
Trustees’ Fees and Expenses | 2 |
Total Expenses | 6,096 |
Net Investment Income | 43,682 |
Realized Net Gain (Loss) | |
Investment Securities Sold2 | 205,420 |
Foreign Currencies | (308) |
Realized Net Gain (Loss) | 205,112 |
Change in Unrealized Appreciation (Depreciation) | |
Investment Securities | 293,846 |
Foreign Currencies | 269 |
Change in Unrealized Appreciation (Depreciation) | 294,115 |
Net Increase (Decrease) in Net Assets Resulting from Operations | 542,909 |
1 Dividends are net of foreign withholding taxes of $1,676,000.
2 Dividend income, interest income, and realized net gain (loss) from affiliated companies of the fund were $4,828,000, $1,841,000, and $0, respectively.
12
Statement of Changes in Net Assets
| Six Months Ended | Year Ended |
| July 31, | January 31, |
| 2007 | 2007 |
| ($000) | ($000) |
Increase (Decrease) in Net Assets | | |
Operations | | |
Net Investment Income | 43,682 | 63,302 |
Realized Net Gain (Loss) | 205,112 | 373,021 |
Change in Unrealized Appreciation (Depreciation) | 294,115 | 81,090 |
Net Increase (Decrease) in Net Assets Resulting from Operations | 542,909 | 517,413 |
Distributions | | |
Net Investment Income | (5,961) | (54,699) |
Realized Capital Gain1 | (78,921) | (284,886) |
Total Distributions | (84,882) | (339,585) |
Capital Share Transactions—Note G | | |
Issued | 225,798 | 585,297 |
Issued in Lieu of Cash Distributions | 78,928 | 314,309 |
Redeemed2 | (283,748) | (930,593) |
Net Increase (Decrease) from Capital Share Transactions | 20,978 | (30,987) |
Total Increase (Decrease) | 479,005 | 146,841 |
Net Assets | | |
Beginning of Period | 3,443,534 | 3,296,693 |
End of Period3 | 3,922,539 | 3,443,534 |
1 Includes fiscal 2008 and 2007 short-term gain distributions totaling $596,000 and $127,033,000, respectively. Short-term gain distributions are treated as ordinary income dividends for tax purposes.
2 Net of redemption fees of $209,000 and $3,932,000.
3 Net Assets—End of Period includes undistributed (overdistributed) net investment income of $9,871,000 and ($27,542,000).
13
Financial Highlights
| Six Months | | | | | |
| Ended | | | | | |
For a Share Outstanding | July 31, | Year Ended January 31, |
Throughout Each Period | 2007 | 2007 | 2006 | 2005 | 2004 | 2003 |
Net Asset Value, Beginning of Period | $28.64 | $27.08 | $16.46 | $15.29 | $11.25 | $9.31 |
Investment Operations | | | | | | |
Net Investment Income | .360 | .560 | .3371 | .1851 | .194 | .25 |
Net Realized and Unrealized Gain (Loss) | | | | | | |
on Investments2 | 4.142 | 4.027 | 11.080 | 1.988 | 4.780 | 2.18 |
Total from Investment Operations | 4.502 | 4.587 | 11.417 | 2.173 | 4.974 | 2.43 |
Distributions | | | | | | |
Dividends from Net Investment Income | (.050) | (.490) | (.240) | (.144) | (.934) | (.49) |
Distributions from Realized Capital Gains | (.662) | (2.537) | (.557) | (.859) | — | — |
Total Distributions | (.712) | (3.027) | (.797) | (1.003) | (.934) | (.49) |
Net Asset Value, End of Period | $32.43 | $28.64 | $27.08 | $16.46 | $15.29 | $11.25 |
| | | | | | |
Total Return3 | 15.98% | 17.48% | 70.19% | 14.20% | 44.07% | 26.51% |
| | | | | | |
Ratios/Supplemental Data | | | | | | |
Net Assets, End of Period (Millions) | $3,923 | $3,444 | $3,297 | $921 | $608 | $537 |
Ratio of Total Expenses to | | | | | | |
Average Net Assets | 0.32%4,* | 0.35%4 | 0.40% | 0.48% | 0.55% | 0.60% |
Ratio of Net Investment Income to | | | | | | |
Average Net Assets | 2.29%* | 1.88% | 1.68% | 1.32% | 1.61% | 2.14% |
Portfolio Turnover Rate | 16%* | 24% | 20% | 36% | 15% | 43% |
1 Calculated based on average shares outstanding.
2 Includes increases from redemption fees of $.00, $.03, $.01, $.01, $.00, and $.02.
3 Total returns do not reflect the 1% fee assessed on redemptions of shares held for less than one year, or the account service fee that may be applicable to certain accounts with balances below $10,000.
4 Includes performance-based investment advisory fee increases of 0.00% and 0.01%.
See accompanying Notes, which are an integral part of the Financial Statements.
14
Notes to Financial Statements
Vanguard Precious Metals and Mining Fund is registered under the Investment Company Act of 1940 as an open-end investment company, or mutual fund. The fund files reports with the SEC under the company name Vanguard Specialized Funds. The fund invests in securities of foreign issuers, which may subject it to investment risks not normally associated with investing in securities of United States corporations.
A. The following significant accounting policies conform to generally accepted accounting principles for U.S. mutual funds. The fund consistently follows such policies in preparing its financial statements.
1. Security Valuation: Securities are valued as of the close of trading on the New York Stock Exchange (generally 4 p.m., Eastern time) on the valuation date. Equity securities are valued at the latest quoted sales prices or official closing prices taken from the primary market in which each security trades; such securities not traded on the valuation date are valued at the mean of the latest quoted bid and asked prices. Securities for which market quotations are not readily available, or whose values have been affected by events occurring before the fund’s pricing time but after the close of the securities’ primary markets, are valued at their fair values calculated according to procedures adopted by the board of trustees. These procedures include obtaining quotations from an independent pricing service, monitoring news to identify significant market- or security-specific events, and evaluating changes in the values of foreign market proxies (for example, ADRs, futures contracts, or exchange-traded funds), between the time the foreign markets close and the fund’s pricing time. When fair-value pricing is employed, the prices of securities used by a fund to calculate its net asset value may differ from quoted or published prices for the same securities. Precious metals are valued at the mean of the latest quoted bid and asked prices. Investments in Vanguard Market Liquidity Fund are valued at that fund’s net asset value.
2. Foreign Currency: Securities and other assets and liabilities denominated in foreign currencies are translated into U.S. dollars using exchange rates obtained from an independent third party as of the fund’s pricing time on the valuation date. Realized gains (losses) and unrealized appreciation (depreciation) on investment securities include the effects of changes in exchange rates since the securities were purchased, combined with the effects of changes in security prices. Fluctuations in the value of other assets and liabilities resulting from changes in exchange rates are recorded as unrealized foreign currency gains (losses) until the assets or liabilities are settled in cash, at which time they are recorded as realized foreign currency gains (losses).
3. Federal Income Taxes: The fund intends to continue to qualify as a regulated investment company and distribute all of its taxable income. Accordingly, no provision for federal income taxes is required in the financial statements.
4. Distributions: Distributions to shareholders are recorded on the ex-dividend date.
5. Security Lending: The fund may lend its securities to qualified institutional borrowers to earn additional income. Security loans are required to be secured at all times by collateral at least equal to the market value of securities loaned. The fund invests cash collateral received in Vanguard Market Liquidity Fund, and records a liability for the return of the collateral, during the period the securities are on loan. Security lending income represents the income earned on investing cash collateral, less expenses associated with the loan.
15
6. Other: Dividend income is recorded on the ex-dividend date. Interest income includes income distributions received from Vanguard Market Liquidity Fund and is accrued daily. Security transactions are accounted for on the date securities are bought or sold. Costs used to determine realized gains (losses) on the sale of investment securities are those of the specific securities sold. Fees assessed on redemptions of capital shares are credited to paid-in capital.
B. M&G Investment Management Ltd. provides investment advisory services to the fund for a fee calculated at an annual percentage rate of average net assets. The basic fee is subject to quarterly adjustments based on the fund’s performance since January 31, 2006, relative to the S&P/Citigroup Custom Metals and Mining Index. For the six months ended July 31, 2007, the investment advisory fee represented an effective annual basic rate of 0.13% of the fund’s average net assets before an increase of $62,000 based on performance.
C. The Vanguard Group furnishes at cost corporate management, administrative, marketing, and distribution services. The costs of such services are allocated to the fund under methods approved by the board of trustees. The fund has committed to provide up to 0.40% of its net assets in capital contributions to Vanguard. At July 31, 2007, the fund had contributed capital of $356,000 to Vanguard (included in Other Assets), representing 0.01% of the fund’s net assets and 0.36% of Vanguard’s capitalization. The fund’s trustees and officers are also directors and officers of Vanguard.
D. Distributions are determined on a tax basis and may differ from net investment income and realized capital gains for financial reporting purposes. Differences may be permanent or temporary. Permanent differences are reclassified among capital accounts in the financial statements to reflect their tax character. Temporary differences arise when certain items of income, expense, gain, or loss are recognized in different periods for financial statement and tax purposes; these differences will reverse at some time in the future. Differences in classification may also result from the treatment of short-term gains as ordinary income for tax purposes. The fund’s tax-basis capital gains and losses are determined only at the end of each fiscal year.
During the six months ended July 31, 2007, the fund realized net foreign currency losses of $308,000, which permanently decreased distributable net income for tax purposes; accordingly, such losses have been reclassified from accumulated net realized gains to undistributed net investment income.
Certain of the fund’s investments are in securities considered to be “passive foreign investment companies,” for which any unrealized appreciation and/or realized gains are required to be included in distributable net income for tax purposes. Unrealized appreciation through January 31, 2007, on passive foreign investment company holdings at July 31, 2007, was $29,932,000, which has been distributed and is reflected in the balance of undistributed net investment income.
During 2001, the fund elected to use a provision of the Taxpayer Relief Act of 1997 to mark to market certain appreciated securities held on January 1, 2001; such securities were treated as sold and repurchased, with unrealized gains of $46,006,000 becoming realized, for tax purposes. The mark-to-market created a difference between the cost of investments for financial statement and tax purposes, which will reverse when the securities are sold. Through July 31, 2007, the fund realized gains on the sale of these securities of $18,280,000 for financial statement purposes, which were included in prior year mark-to-market gains for tax purposes. The remaining difference of $27,726,000 is reflected in the balance of accumulated net realized gains; the corresponding difference between the securities’ cost for financial statement and tax purposes is reflected in unrealized appreciation.
16
At July 31, 2007, the cost of investment securities for tax purposes was $2,535,374,000. Net unrealized appreciation of investment securities for tax purposes was $1,544,220,000, consisting of unrealized gains of $1,563,821,000 on securities that had risen in value since their purchase and $19,601,000 in unrealized losses on securities that had fallen in value since their purchase or since being marked to market for tax purposes.
E. During the six months ended July 31, 2007, the fund purchased $287,394,000 of investment securities and sold $438,425,000 of investment securities other than temporary cash investments.
F. The market value of securities on loan to broker-dealers at July 31, 2007, was $193,873,000, for which the fund received cash collateral of $200,244,000.
G. Capital shares issued and redeemed were:
| Six Months Ended | Year Ended |
| July 31, 2007 | January 31, 2007 |
| Shares | Shares |
| (000) | (000) |
Issued | 7,014 | 20,497 |
Issued in Lieu of Cash Distributions | 2,689 | 11,406 |
Redeemed | (8,975) | (33,402) |
Net Increase (Decrease) in Shares Outstanding | 728 | (1,499) |
H. Certain of the fund’s investments are in companies that are considered to be affiliated companies of the fund because the fund owns more than 5% of the outstanding voting securities of the company. Transactions during the period in securities of these companies were as follows:
| | | Current Period Transactions | |
| Jan. 31, 2007 | | Proceeds from | | July 31, 2007 |
| Market | Purchases | Securities | Dividend | Market |
| Value | at Cost | Sold | Income | Value |
| ($000) | ($000) | ($000) | ($000) | ($000) |
Aber Diamond Corp. | 217,068 | 21,136 | — | 2,565 | 231,076 |
Centennial Coal Co. Ltd. | 34,777 | — | — | 438 | 44,933 |
Centerra Gold Inc. | 143,974 | — | — | — | 84,657 |
Claude Resources, Inc. | n/a1 | 1,093 | — | — | 5,329 |
Iluka Resources Ltd. | 83,373 | — | — | 1,697 | 86,280 |
Minerals Technologies Inc | 69,142 | 5,005 | — | 128 | 82,584 |
| 548,334 | | | 4,828 | 534,859 |
1 At January 31, 2007, the issuer was not an affiliated company of the fund.
17
I. In June 2006, the Financial Accounting Standards Board issued Interpretation No. 48 (“FIN 48”), “Accounting for Uncertainty in Income Taxes.” FIN 48 establishes the minimum threshold for recognizing, and a system for measuring, the benefits of tax-return positions in financial statements, effective for the fund’s current fiscal year. Management has analyzed the fund’s tax positions taken on federal income tax returns for all open tax years (tax years ended January 31, 2005–2007) for purposes of implementing FIN 48, and has concluded that no provision for income tax is required in the fund’s financial statements.
18
About Your Fund’s Expenses
As a shareholder of the fund, you incur ongoing costs, which include costs for portfolio management, administrative services, and shareholder reports (like this one), among others. Operating expenses, which are deducted from a fund’s gross income, directly reduce the investment return of the fund.
A fund’s expenses are expressed as a percentage of its average net assets. This figure is known as the expense ratio. The following examples are intended to help you understand the ongoing costs (in dollars) of investing in your fund and to compare these costs with those of other mutual funds. The examples are based on an investment of $1,000 made at the beginning of the period shown and held for the entire period.
The table below illustrates your fund’s costs in two ways:
• Based on actual fund return. This section helps you to estimate the actual expenses that you paid over the period. The “Ending Account Value” shown is derived from the fund’s actual return, and the third column shows the dollar amount that would have been paid by an investor who started with $1,000 in the fund. You may use the information here, together with the amount you invested, to estimate the expenses that you paid over the period.
To do so, simply divide your account value by $1,000 (for example, an $8,600 account value divided by $1,000 = 8.6), then multiply the result by the number given for your fund under the heading “Expenses Paid During Period.”
• Based on hypothetical 5% yearly return. This section is intended to help you compare your fund’s costs with those of other mutual funds. It assumes that the fund had a yearly return of 5% before expenses, but that the expense ratio is unchanged. In this case—because the return used is not the fund’s actual return—the results do not apply to your investment. The example is useful in making comparisons because the Securities and Exchange Commission requires all mutual funds to calculate expenses based on a 5% return. You can assess your fund’s costs by comparing this hypothetical example with the hypothetical examples that appear in shareholder reports of other funds.
Six Months Ended July 31, 2007 | | | |
| Beginning | Ending | Expenses |
| Account Value | Account Value | Paid During |
Precious Metals and Mining Fund | 1/31/2007 | 7/31/2007 | Period1 |
Based on Actual Fund Return | $1,000.00 | $1,159.80 | $1.71 |
Based on Hypothetical 5% Return | 1,000.00 | 1,023.21 | 1.61 |
1 These calculations are based on expenses incurred in the most recent six-month period. The fund’s annualized six-month expense ratio for that period is 0.32%. The dollar amounts shown as “Expenses Paid” are equal to the annualized expense ratio multiplied by the average account value over the period, multiplied by the number of days in the most recent six-month peiod, then divided by the number of days in the most recent 12-month period.
19
Note that the expenses shown in the table on page 19 are meant to highlight and help you compare ongoing costs only and do not reflect transaction costs incurred by the fund for buying and selling securities. Further, the expenses do not include the 1% fee on redemptions of shares held for less than one year, nor do they include any account service fee described in the prospectus. If such fees were applied to your account, your costs would be higher. Your fund does not carry a “sales load.”
The calculations assume no shares were bought or sold during the period. Your actual costs may have been higher or lower, depending on the amount of your investment and the timing of any purchases or redemptions.
You can find more information about the fund’s expenses, including annual expense ratios, in the Financial Statements section of this report. For additional information on operating expenses and other shareholder costs, please refer to the appropriate fund prospectus.
20
Trustees Approve Advisory Agreement
The board of trustees of Vanguard Precious Metals and Mining Fund has renewed the fund’s investment advisory agreement with M&G Investment Management Limited. The board determined that the retention of M&G was in the best interests of the fund and its shareholders.
The board based its decision upon an evaluation of M&G’s investment staff, portfolio management process, and performance. The trustees considered the factors discussed below, among others. However, no single factor determined whether the board approved the agreement. Rather, it was the totality of the circumstances that drove the board’s decision.
Nature, extent, and quality of services
The board considered the quality of the fund’s investment management over both the short and long term and took into account the organizational depth and stability of the advisor. The board noted that M&G, founded in 1931, specializes in managing equity and fixed income portfolios for both institutional and retail clients worldwide. The firm has advised the fund since the fund’s inception in 1984. The advisor continues to employ a sound process, selecting companies that are broadly representative of the metals and mining industries and emphasizing large, stable, and diversified companies. The advisor’s internal research team—comprising the portfolio manager, Graham E. French, and a team of six global equity analysts—conducts intensive fundamental analysis of companies in the industry; their research includes regular company visits.
The board concluded that the advisor’s experience, stability, depth, and performance, among other factors, warranted continuation of the advisory agreement.
Investment performance
The board considered the short- and long-term performance of the fund, including any periods of outperformance or underperformance of a relevant benchmark and peer group. The board concluded that the advisor has carried out the fund’s investment strategy in disciplined fashion, and that performance results have allowed the fund to remain competitive versus its benchmark. The board noted that the fund is more broadly diversified than its competitors—with the ability to invest up to half of the fund’s assets in non-precious metals and mining stocks—but continues to remain competitive versus gold-oriented peer funds. Information about the fund’s most recent performance can be found in the Performance Summary section of this report.
Cost
The board concluded that the fund’s expense ratio was far below the average expense ratio charged by funds in its peer group. The board noted that the fund’s advisory fee rate was also well below the peer-group average. Information about the fund’s expense ratio appears in the About Your Fund’s Expenses section of this report as well as in the Financial Statements section, which also includes information about the advisory fee rate.
The board did not consider profitability of M&G in determining whether to approve the advisory fee, because M&G is independent of Vanguard, and the advisory fee is the result of arm’s-length negotiations.
The benefit of economies of scale
The board concluded that the fund’s shareholders benefit from economies of scale because of breakpoints in the fund’s advisory fee schedule. The breakpoints reduce the effective rate of the fee as the fund’s assets increase.
The board will consider whether to renew the advisory agreement again after a one-year period.
21
Glossary
Beta. A measure of the magnitude of a fund’s past share-price fluctuations in relation to the ups and downs of a given market index. The index is assigned a beta of 1.00. Compared with a given index, a fund with a beta of 1.20 typically would have seen its share price rise or fall by 12% when the index rose or fell by 10%. A fund’s beta should be reviewed in conjunction with its R-squared (see definition below). The lower the R-squared, the less correlation there is between the fund and the index, and the less reliable beta is as an indicator of volatility.
Earnings Growth Rate. The average annual rate of growth in earnings over the past five years for the stocks now in a fund.
Expense Ratio. The percentage of a fund’s average net assets used to pay its annual administrative and advisory expenses. These expenses directly reduce returns to investors.
Foreign Holdings. The percentage of a fund represented by stocks or depositary receipts of companies based outside the United States.
Inception Date. The date on which the assets of a fund (or one of its share classes) are first invested in accordance with the fund’s investment objective. For funds with a subscription period, the inception date is the day after that period ends. Investment performance is measured from the inception date.
Median Market Cap. An indicator of the size of companies in which a fund invests; the midpoint of market capitalization (market price x shares outstanding) of a fund’s stocks, weighted by the proportion of the fund’s assets invested in each stock. Stocks representing half of the fund’s assets have market capitalizations above the median, and the rest are below it.
Price/Book Ratio. The share price of a stock divided by its net worth, or book value, per share. For a fund, the weighted average price/book ratio of the stocks it holds.
Price/Earnings Ratio. The ratio of a stock’s current price to its per-share earnings over the past year. For a fund, the weighted average P/E of the stocks it holds. P/E is an indicator of market expectations about corporate prospects; the higher the P/E, the greater the expectations for a company’s future growth.
R-Squared. A measure of how much of a fund’s past returns can be explained by the returns from the market in general, as measured by a given index. If a fund’s total returns were precisely synchronized with an index’s returns, its R-squared would be 1.00. If the fund’s returns bore no relationship to the index’s returns, its R-squared would be 0.
Return on Equity. The annual average rate of return generated by a company during the past five years for each dollar of shareholder’s equity (net income divided by shareholder’s equity). For a fund, the weighted average return on equity for the companies whose stocks it holds.
Short-Term Reserves. The percentage of a fund invested in highly liquid, short-term securities that can be readily converted to cash.
Turnover Rate. An indication of the fund’s trading activity. Funds with high turnover rates incur higher transaction costs and may be more likely to distribute capital gains (which may be taxable to investors). The turnover rate excludes in-kind transactions, which have minimal impact on costs.
22
This page intentionally left blank.
The People Who Govern Your Fund
The trustees of your mutual fund are there to see that the fund is operated and managed in your best interests since, as a shareholder, you are a part owner of the fund. Your fund’s trustees also serve on the board of directors of The Vanguard Group, Inc., which is owned by the Vanguard funds and provides services to them on an at-cost basis.
A majority of Vanguard’s board members are independent, meaning that they have no affiliation with Vanguard or the funds they oversee, apart from the sizable personal investments they have made as private individuals.
Our independent board members bring distinguished backgrounds in business, academia, and public service to their task of working with Vanguard officers to establish the policies and oversee the activities of the funds. Among board members’ responsibilities are selecting investment advisors for the funds; monitoring fund operations, performance, and costs; reviewing contracts; nominating and selecting new trustees/directors; and electing Vanguard officers.
Each trustee serves a fund until its termination; or until the trustee’s retirement, resignation, or death; or otherwise as specified in the fund’s organizational documents. Any trustee may be removed at a shareholders’ meeting by a vote representing two-thirds of the net asset value of all shares of the fund together with shares of other Vanguard funds organized within the same trust. The table on these two pages shows information for each trustee and executive officer of the fund. The mailing address of the trustees and officers is P.O. Box 876, Valley Forge, PA 19482.
Chairman of the Board, Chief Executive Officer, and Trustee |
| |
John J. Brennan1 | |
Born 1954 | Principal Occupation(s) During the Past Five Years: Chairman of the Board, Chief Executive |
Trustee since May 1987; | Officer, and Director/Trustee of The Vanguard Group, Inc., and of each of the investment |
Chairman of the Board and | companies served by The Vanguard Group. |
Chief Executive Officer | |
147 Vanguard Funds Overseen | |
| |
Independent Trustees | |
| |
Charles D. Ellis | |
Born 1937 | Principal Occupation(s) During the Past Five Years: Applecore Partners (pro bono ventures |
Trustee since January 2001 | in education); Senior Advisor to Greenwich Associates (international business strategy |
147 Vanguard Funds Overseen | consulting); Successor Trustee of Yale University; Overseer of the Stern School of Business |
| at New York University; Trustee of the Whitehead Institute for Biomedical Research. |
| |
Rajiv L. Gupta | |
Born 1945 | Principal Occupation(s) During the Past Five Years: Chairman, President, and |
Trustee since December 20012 | Chief Executive Officer of Rohm and Haas Co. (chemicals); Board Member of |
147 Vanguard Funds Overseen | the American Chemistry Council; Director of Tyco International, Ltd. (diversified |
| manufacturing and services) since 2005; Trustee of Drexel University and of the |
| Chemical Heritage Foundation. |
| |
Amy Gutmann | |
Born 1949 | Principal Occupation(s) During the Past Five Years: President of the University of |
Trustee since June 2006 | Pennsylvania since 2004; Professor in the School of Arts and Sciences, Annenberg School |
147 Vanguard Funds Overseen | for Communication, and Graduate School of Education of the University of Pennsylvania |
| since 2004; Provost (2001–2004) and Laurance S. Rockefeller Professor of Politics and |
| the University Center for Human Values (1990–2004), Princeton University; Director of |
| Carnegie Corporation of New York since 2005 and of Schuylkill River Development |
| Corporation and Greater Philadelphia Chamber of Commerce since 2004. |
JoAnn Heffernan Heisen | |
Born 1950 | Principal Occupation(s) During the Past Five Years: Corporate Vice President and |
Trustee since July 1998 | Chief Global Diversity Officer since 2006, Vice President and Chief Information |
147 Vanguard Funds Overseen | Officer (1997–2005), and Member of the Executive Committee of Johnson & |
| Johnson (pharmaceuticals/consumer products); Director of the University Medical |
| Center at Princeton and Women’s Research and Education Institute. |
| |
André F. Perold | |
Born 1952 | Principal Occupation(s) During the Past Five Years: George Gund Professor of Finance |
Trustee since December 2004 | and Banking, Harvard Business School; Senior Associate Dean, Director of Faculty |
147 Vanguard Funds Overseen | Recruiting, and Chair of Finance Faculty, Harvard Business School; Director and Chairman |
| of UNX, Inc. (equities trading firm) since 2003; Chair of the Investment Committee of |
| HighVista Strategies LLC (private investment firm) since 2005. |
| |
Alfred M. Rankin, Jr. | |
Born 1941 | Principal Occupation(s) During the Past Five Years: Chairman, President, Chief Executive |
Trustee since January 1993 | Officer, and Director of NACCO Industries, Inc. (forklift trucks/housewares/lignite); Director |
147 Vanguard Funds Overseen | of Goodrich Corporation (industrial products/aircraft systems and services). |
| |
| |
J. Lawrence Wilson | |
Born 1936 | Principal Occupation(s) During the Past Five Years: Retired Chairman and Chief Executive |
Trustee since April 1985 | Officer of Rohm and Haas Co. (chemicals); Director of Cummins Inc. (diesel engines) and |
147 Vanguard Funds Overseen | AmerisourceBergen Corp. (pharmaceutical distribution); Trustee of Vanderbilt University |
| and of Culver Educational Foundation. |
| |
Executive Officers1 | |
| |
Thomas J. Higgins | |
Born 1957 | Principal Occupation(s) During the Past Five Years: Principal of The Vanguard Group, Inc.; |
Treasurer since July 1998 | Treasurer of each of the investment companies served by The Vanguard Group. |
147 Vanguard Funds Overseen | |
| |
| |
Heidi Stam | |
Born 1956 | Principal Occupation(s) During the Past Five Years: Managing Director of The Vanguard |
Secretary since July 2005 | Group, Inc., since 2006; General Counsel of The Vanguard Group since 2005; Secretary of |
147 Vanguard Funds Overseen | The Vanguard Group, and of each of the investment companies served by The Vanguard |
| Group, since 2005; Principal of The Vanguard Group (1997–2006). |
Vanguard Senior Management Team | | |
| | | |
R. Gregory Barton | Kathleen C. Gubanich | F. William McNabb, III | Ralph K. Packard |
Mortimer J. Buckley | Paul A. Heller | Michael S. Miller | George U. Sauter |
Founder |
|
John C. Bogle |
Chairman and Chief Executive Officer, 1974–1996 |
1 Officers of the funds are “interested persons” as defined in the Investment Company Act of 1940.
2 December 2002 for Vanguard Equity Income Fund, Vanguard Growth Equity Fund, the Vanguard Municipal Bond Funds, and the Vanguard State Tax-Exempt Funds.
More information about the trustees is in the Statement of Additional Information, available from The Vanguard Group.
| 
|
| P.O. Box 2600 |
| Valley Forge, PA 19482-2600 |
Connect with Vanguard® > www.vanguard.com |
Fund Information > 800-662-7447 | Vanguard, Connect with Vanguard, and the ship logo |
| are trademarks of The Vanguard Group, Inc. |
Direct Investor Account Services > 800-662-2739 | |
| |
Institutional Investor Services > 800-523-1036 | All other marks are the exclusive property of their |
| respective owners. |
Text Telephone for People | |
With Hearing Impairment > 800-952-3335 | |
| All comparative mutual fund data are from Lipper Inc. |
| or Morningstar, Inc., unless otherwise noted. |
| |
| |
| You can obtain a free copy of Vanguard’s proxy voting |
This material may be used in conjunction | guidelines by visiting our website, www.vanguard.com, |
with the offering of shares of any Vanguard | and searching for “proxy voting guidelines,” or by calling |
fund only if preceded or accompanied by | Vanguard at 800-662-2739. They are also available from |
the fund’s current prospectus. | the SEC’s website, www.sec.gov. In addition, you may |
| obtain a free report on how your fund voted the proxies for |
| securities it owned during the 12 months ended June 30. |
| To get the report, visit either www.vanguard.com |
| or www.sec.gov. |
| |
| |
| You can review and copy information about your fund |
| at the SEC’s Public Reference Room in Washington, D.C. |
| To find out more about this public service, call the SEC |
| at 202-551-8090. Information about your fund is also |
| available on the SEC’s website, and you can receive |
| copies of this information, for a fee, by sending a |
| request in either of two ways: via e-mail addressed to |
| publicinfo@sec.gov or via regular mail addressed to the |
| Public Reference Section, Securities and Exchange |
| Commission, Washington, DC 20549-0102. |
| |
| |
| |
| |
| © 2007 The Vanguard Group, Inc. |
| All rights reserved. |
| Vanguard Marketing Corporation, Distributor. |
| |
| Q532 092007 |
| |
| |
Vanguard® Health Care Fund |
| |
| |
| |
| |
> Semiannual Report | |
| |
| |
| |
| |
| |
July 31, 2007 | |
| |
| |

> For the six months ended July 31, 2007, Vanguard Health Care Fund posted a return of –0.3%.
> The six-month period was a tough one for the health care sector, and particularly for the sector’s mainstay, pharmaceutical stocks.
> Although its return was negative, the fund did better than its benchmark index in this difficult environment, and it also topped the average return of competing funds.
Contents | |
| |
Your Fund’s Total Returns | 1 |
Chairman’s Letter | 2 |
Advisor’s Report | 6 |
Fund Profile | 8 |
Performance Summary | 9 |
Financial Statements | 10 |
About Your Fund’s Expenses | 21 |
Trustees Approve Advisory Agreement | 23 |
Glossary | 25 |
Please note: The opinions expressed in this report are just that—informed opinions. They should not be considered promises or advice. Also, please keep in mind that the information and opinions cover the period through the date on the cover of this report. Of course, the risks of investing in your fund are spelled out in the prospectus.
Your Fund’s Total Returns
Six Months Ended July 31, 2007 | | |
| Ticker | Total |
| Symbol | Returns |
Vanguard Health Care Fund | | |
Investor Shares | VGHCX | –0.3% |
Admiral™ Shares1 | VGHAX | –0.3 |
S&P Health Sector Index | | –1.6 |
Average Health/Biotechnology Fund2 | | –0.8 |
Dow Jones Wilshire 5000 Index | | 1.9 |
Your Fund’s Performance at a Glance |
January 31, 2007–July 31, 2007 |
| | | Distributions Per Share |
| Starting | Ending | Income | Capital |
| Share Price | Share Price | Dividends | Gains |
Vanguard Health Care Fund | | | | |
Investor Shares | $149.69 | $146.99 | $0.140 | $2.128 |
Admiral Shares | 63.19 | 62.06 | 0.066 | 0.899 |
1 A lower-cost class of shares available to many longtime shareholders and to those with significant investments in the fund.
2 Derived from data provided by Lipper Inc.
1

Chairman’s Letter
Dear Shareholder,
During the six months ended July 31, 2007, the health care sector was one of the stock market’s weaker areas. Although Vanguard Health Care Fund is broadly diversified across health care industries, the fund’s large exposure to pharmaceutical stocks weighed it down, leading to a half-year return of only –0.3%. For the fiscal period, the fund trailed the broad U.S. stock market, but its performance was better than that of its average peer and its benchmark index.
For the U.S. stock market, a nervous finish to the half-year
Overall, U.S. stocks produced modest returns for the six months, as a downturn at the end of the period erased most of the gains recorded earlier. The market stumbled as trouble with low-quality mortgage loans and related securities amplified investors’ risk-aversion.
The broad U.S. stock market returned 1.9% for the fiscal half-year. Large-capitalization stocks bested small-caps, and growth-oriented stocks outperformed their value-oriented counterparts.
International stock markets sidestepped most of the U.S. turmoil, generating excellent six-month returns.
For bonds, a return to a more typical yield curve
As investors sought a safe haven from some of the financial markets’ riskier precincts, including bonds backed by mortgage loans made to borrowers with poor credit ratings, U.S. Treasury bond prices rose slightly and yields fell. The declines in yield were most pronounced among Treasury securities with maturities of less than 5 years.
2
These interest rate dynamics helped restore the yield curve—which illustrates the relationship between short- and long-term bond yields—to its typical, upward-sloping pattern. At the start of the period, the curve had been mildly inverted. The broad taxable bond market returned 1.9% for the half-year. Tax-exempt municipal securities returned a bit less.
In the health care sector, it was a tough six months
The stocks of many health care firms stumbled during the half-year. Vanguard Health Care Fund closed the period with a return of –0.3%, below the 1.9% return of the broad stock market. As I mentioned above, it’s worth noting that the fund outperformed its peers and its benchmark index. Even in such a tough environment, it is clear that Wellington Management Company, LLP, your fund’s advisor, continued to enhance the fund’s performance through its stock-picking talents.
The fund’s strategy of diversifying across health care subsectors provided little relief during the period, as most of these groups performed poorly. In addition, the fund experienced distinct weaknesses within the important pharmaceuticals and biotechnology industries, which put a sharp drag on performance.
Market Barometer | | | |
| | | Total Returns |
| Periods Ended July 31, 2007 |
| Six Months | One Year | Five Years1 |
Stocks | | | |
Russell 1000 Index (Large-caps) | 1.9% | 16.5% | 12.3% |
Russell 2000 Index (Small-caps) | –2.5 | 12.1 | 16.0 |
Dow Jones Wilshire 5000 Index (Entire market) | 1.9 | 16.8 | 13.1 |
MSCI All Country World Index ex USA (International) | 11.8 | 28.5 | 22.3 |
| | | |
| | | |
Bonds | | | |
Lehman U.S. Aggregate Bond Index (Broad taxable market) | 1.9% | 5.6% | 4.4% |
Lehman Municipal Bond Index | 1.2 | 4.3 | 4.5 |
Citigroup 3-Month Treasury Bill Index | 2.5 | 5.1 | 2.7 |
| | | |
| | | |
CPI | | | |
Consumer Price Index | 2.9% | 2.4% | 3.0% |
| | | |
| | | |
| | | |
| | | |
1 Annualized. | | | |
3
During the six months, a number of the fund’s top-ten holdings were also its weakest performers. Pharmaceutical firms Forest Laboratories, Roche Holdings AG, and AstraZeneca all produced negative returns. During the period, many of the pharmaceutical industry’s major players, including the three just named, wrestled with regulatory challenges, patent expirations, and disappointments in the research and development of new prescription medications.
Within the portfolio, notable bright spots during the period included Humana and Gilead Sciences, both of which produced double-digit gains. In addition, chemical producers Bayer AG and Akzo Nobel made significant contributions.
Vanguard Health Care Fund was closed to new investors on March 23, 2005, after experiencing a significant run-up in assets. The fund remains closed, although existing shareholders may continue to invest in it.
Diversification and balance are keys to a long-term approach
As seasoned investors realize, there’s no way to know what will happen in the stock market tomorrow, much less next month or next year. What’s the best strategy to follow when the markets remain so unpredictable?
As we often counsel, the best way to put together a long-term investment program is to select a diversified mix of stock, bond, and money market mutual
Annualized Expense Ratios1 | | | |
Your fund compared with its peer group |
| | | Average |
| | | Health/ |
| Investor | Admiral | Biotechnology |
| Shares | Shares | Fund |
Health Care Fund | 0.26% | 0.19% | 1.79% |
1 Fund expense ratios reflect the six months ended July 31, 2007. Peer-group expense ratio is derived from data provided by Lipper Inc. and captures information through year-end 2006.
4
funds that fits your goals, time horizon, and tolerance for risk. A balanced portfolio is not likely to deliver the best (or the worst) short-term returns, but it can help you to reap the rewards of the markets’ best-performing assets while muting the impact of the worst-performing ones.
As part of such a balanced portfolio, Vanguard Health Care Fund can play an important role in helping you to move toward your long-term financial goals.
Thank you for investing with Vanguard.
Sincerely,

John J. Brennan
Chairman and Chief Executive Officer
August 10, 2007
5
Advisor’s Report
Vanguard Health Care Fund returned –0.3% for the six months ended July 31, 2007. This compared to returns of 2.1% for the S&P 500 Index, –1.6% for the S&P Health Sector Index, and –0.8% on average for competing health/biotechnology funds.
The investment environment
Health care stocks lagged the overall stock market during the period. Within the portfolio, health services stocks fared well, helping to buoy performance for the period. Stocks in the pharmaceuticals, biotechnology, and medical products subsectors had mixed results; however, select holdings in each of these groups helped the fund to perform better than the sector index and the competitive fund group.
Our successes
Large-cap pharmaceutical holdings Schering-Plough, Bayer AG, and Merck provided a boost to returns during the period, as favorable pricing trends led to strong results that exceeded investor expectations. Our health services holdings CIGNA and Humana also contributed to overall results.
Our shortfalls
Forest Laboratories and Amgen shares were down during the period. Amgen declined because of the regulatory cloud over the usage of erythropoietin for the treatment of cancer-related anemia; the company markets a form of this hormone. Shares of Japanese pharmaceuticals Eisai and Chugai Pharmaceutical fell as a result of the Japanese market’s weakness. We expect these trends to reverse with the emergence of positive news about product pipelines.
The fund’s positioning
We are somewhat cautious regarding the health care market, believing that the U.S. Food and Drug Administration has tilted its focus toward safety rather than innovation, reducing new-product flow and the value of the sector. We have focused on companies that we think are best prepared to overcome this fundamental risk.
6
We continue to invest in Japanese pharmaceuticals, primarily on the basis of the companies’ attractive pipelines. As the Japanese medical and pricing systems evolve, new drugs will receive premium prices, which should also benefit these innovative companies. We will continue to position the fund with a long-term focus, maintaining appropriate diversification and attention to valuation.
Edward P. Owens
Senior Vice President and Portfolio Manager
Wellington Management Company, LLP
August 15, 2007
Significant Portfolio Changes | |
Six months ended July 31, 2007 |
| |
Additions | Comments |
Walgreen | Replaced CVS Caremark in the portfolio. |
Forest Laboratories | Added on weakness and a strong outlook. |
OSI Pharmaceuticals | Added on weakness and a strong outlook. |
| |
| |
Reductions | Comments |
CVS Caremark | Eliminated after a strong run. |
Gilead Sciences | Reduced as the price rose. |
MedImmune | Acquired by AstraZeneca. |
7
Fund Profile
As of July 31, 2007
Portfolio Characteristics | | |
| | Comparative | Broad |
| Fund | Index1 | Index2 |
Number of Stocks | 80 | 53 | 4,902 |
Median Market Cap | $42.5B | $61.3B | $32.9B |
Price/Earnings Ratio | 22.4x | 21.0x | 17.4x |
Price/Book Ratio | 3.6x | 3.7x | 2.7x |
Yield | | 1.7% | 1.8% |
Investor Shares | 1.2% | | |
Admiral Shares | 1.3% | | |
Return on Equity | 17.9% | 22.5% | 18.4% |
Earnings Growth Rate | 9.2% | 11.8% | 21.0% |
Foreign Holdings | 27.5% | 0.0% | 0.0% |
Turnover Rate | 10%3 | — | — |
Expense Ratio | | — | — |
Investor Shares | 0.26%3 | | |
Admiral Shares | 0.19%3 | | |
Short-Term Reserves | 9% | — | — |
Volatility Measures4 | |
| Fund Versus | Fund Versus |
| Comparative Index1 | Broad Index2 |
R-Squared | 0.86 | 0.35 |
Beta | 0.75 | 0.57 |
Sector Diversification5 (% of portfolio) | |
| |
Biotechnology | 8% |
Consumer Staples | 2 |
Health Care Distributors | 6 |
Health Care Equipment | 9 |
Health Care Facilities | 1 |
Health Care Services | 2 |
Health Care Technology | 2 |
Managed Health Care | 7 |
Materials | 3 |
Pharmaceuticals | 51 |
Short-Term Reserves | 9% |
8
Ten Largest Holdings6 (% of total net assets) |
| |
Schering-Plough Corp. | 6.1% |
Eli Lilly & Co. | 4.8 |
Roche Holdings AG | 4.1 |
Forest Laboratories, Inc. | 4.1 |
Sanofi-Aventis | 3.6 |
AstraZeneca Group PLC | 3.6 |
McKesson Corp. | 3.1 |
Abbott Laboratories | 2.7 |
Novartis AG (Registered) | 2.7 |
Cardinal Health, Inc. | 2.7 |
Top Ten | 37.5% |
Market Diversification (% of portfolio) |
| |
United States | 64% |
Japan | 9 |
Switzerland | 7 |
United Kingdom | 4 |
France | 4 |
Germany | 1 |
Netherlands | 1 |
Belgium | 1 |
Short-Term Reserves | 9% |
Investment Focus
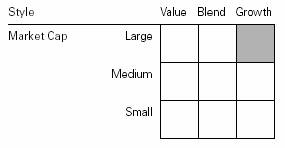
1 S&P Health Sector Index.
2 Dow Jones Wilshire 5000 Index.
3 Annualized.
4 For an explanation of R-squared, beta, and other terms used here, see the Glossary on page 25.
5 Sector percentages combine U.S. and international holdings.
6 “Ten Largest Holdings” excludes any temporary cash investments and equity index products.
9
Performance Summary
All of the returns in this report represent past performance, which is not a guarantee of future results that may be achieved by the fund. (Current performance may be lower or higher than the performance data cited. For performance data current to the most recent month-end, visit our website at www.vanguard.com/performance.) Note, too, that both investment returns and principal value can fluctuate widely, so an investor’s shares, when sold, could be worth more or less than their original cost. The returns shown do not reflect taxes that a shareholder would pay on fund distributions or on the sale of fund shares.
Fiscal-Year Total Returns (%): January 31, 1997–July 31, 2007

Average Annual Total Returns: Periods Ended June 30, 2007
This table presents average annual total returns through the latest calendar quarter—rather than through the end of the fiscal period. Securities and Exchange Commission rules require that we provide this information.
| Inception Date | One Year | Five Years | Ten Years |
Investor Shares2 | 5/23/1984 | 14.39% | 12.18% | 14.69% |
Admiral Shares2 | 11/12/2001 | 14.48 | 12.28 | 10.073 |
1 Six months ended July 31, 2007.
2 Total returns do not reflect the 1% fee assessed on redemptions of shares held less than one year, nor do they include the account service fee that may be applicable to certain accounts with balances below $10,000.
3 Return since inception.
Note: See Financial Highlights tables on pages 15 and 16 for dividend and capital gains information.
10
Financial Statements (unaudited)
Statement of Net Assets
As of July 31, 2007
The fund provides a complete list of its holdings four times in each fiscal year, at the quarter-ends. For the second and fourth fiscal quarters, the lists appear in the fund’s semiannual and annual reports to shareholders. For the first and third fiscal quarters, the fund files the lists with the Securities and Exchange Commission on Form N-Q. Shareholders can look up the fund’s Forms N-Q on the SEC’s website at www.sec.gov. Forms N-Q may also be reviewed and copied at the SEC’s Public Reference Room (see the back cover of this report for further information).
| | | Market |
| | | Value• |
| | Shares | ($000) |
Common Stocks (91.3%) | | |
United States (63.8%) | | |
Biotechnology (8.5%) | | |
* | Amgen, Inc. | 9,989,355 | 536,828 |
* | Genzyme Corp. | 6,919,340 | 436,403 |
* | Genentech, Inc. | 5,250,000 | 390,495 |
* | Gilead Sciences, Inc. | 6,799,696 | 253,153 |
* | Cephalon, Inc. | 1,902,000 | 142,916 |
* | Vertex | | |
| Pharmaceuticals, Inc. | 4,209,400 | 135,964 |
*1 | OSI Pharmaceuticals, Inc. | 3,680,000 | 118,643 |
* | Millennium | | |
| Pharmaceuticals, Inc. | 11,341,300 | 114,434 |
* | Biogen Idec Inc. | 1,900,000 | 107,426 |
* | Amylin | | |
| Pharmaceuticals, Inc. | 400,000 | 18,604 |
* | Human Genome | | |
| Sciences, Inc. | 1,038,500 | 8,059 |
| | | 2,262,925 |
Chemicals (0.8%) | | |
| Sigma-Aldrich Corp. | 4,700,000 | 213,004 |
| | | |
Food & Staples Retailing (1.4%) | |
| Walgreen Co. | 8,550,000 | 377,739 |
| | | |
Health Care Equipment & Supplies (8.5%) | |
| Medtronic, Inc. | 12,614,900 | 639,197 |
| Becton, Dickinson & Co. | 6,900,000 | 526,884 |
* | St. Jude Medical, Inc. | 9,300,900 | 401,241 |
| Baxter International, Inc. | 5,300,000 | 278,780 |
| Beckman Coulter, Inc. | 2,776,600 | 196,639 |
| DENTSPLY | | |
| International Inc. | 2,885,400 | 105,288 |
* | Hospira, Inc. | 2,045,070 | 79,083 |
| STERIS Corp. | 850,000 | 23,248 |
| | | 2,250,360 |
Health Care Providers & Services (15.6%) | |
| McKesson Corp. | 14,400,000 | 831,744 |
11
| Cardinal Health, Inc. | 10,736,708 | 705,724 |
* | Humana Inc. | 7,733,000 | 495,608 |
| Quest Diagnostics, Inc. | 5,335,400 | 295,955 |
| CIGNA Corp. | 5,500,000 | 284,020 |
| UnitedHealth Group Inc. | 5,700,000 | 276,051 |
* | WellPoint Inc. | 3,502,400 | 263,100 |
* | Coventry Health Care Inc. | 4,450,000 | 248,355 |
* | Laboratory Corp. of | | |
| America Holdings | 2,767,360 | 204,369 |
* | Health Net Inc. | 3,000,000 | 148,620 |
| Universal Health Services | | |
| Class B | 2,460,400 | 129,023 |
1 | Health Management | | |
| Associates Class A | 14,386,900 | 115,958 |
1 | Owens & Minor, Inc. | | |
| Holding Co. | 2,200,000 | 84,590 |
* | Medco Health | | |
| Solutions, Inc. | 500,000 | 40,635 |
| Aetna Inc. | 600,000 | 28,842 |
| | | 4,152,594 |
Heath Care Technology (1.7%) | |
| IMS Health, Inc. | 8,347,400 | 234,812 |
*^1Cerner Corp. | 4,200,000 | 222,054 |
| | | 456,866 |
Household Products (0.5%) | | |
| Colgate-Palmolive Co. | 1,400,000 | 92,400 |
| Kimberly-Clark Corp. | 576,300 | 38,768 |
| | | 131,168 |
Insurance (0.1%) | | |
| Unum Group | 1,056,300 | 25,668 |
| | | |
Life Science Tools & Services (0.2%) | |
*1 | PAREXEL | | |
| International Corp. | 1,570,200 | 63,483 |
| | | |
Machinery (0.4%) | | |
| Pall Corp. | 2,404,600 | 99,839 |
| | | |
Pharmaceuticals (26.1%) | | |
| Schering-Plough Corp. | 57,070,000 | 1,628,778 |
| Eli Lilly & Co. | 23,629,900 | 1,278,141 |
*1 | Forest Laboratories, Inc. | 26,901,500 | 1,081,440 |
| Abbott Laboratories | 14,100,000 | 714,729 |
| Bristol-Myers Squibb Co. | 15,100,000 | 428,991 |
| Merck & Co., Inc. | 8,291,200 | 411,658 |
| Wyeth | 8,250,000 | 400,290 |
| Pfizer Inc. | 14,911,570 | 350,571 |
| Allergan, Inc. | 4,200,000 | 244,146 |
| Johnson & Johnson | 3,300,000 | 199,650 |
1 | Perrigo Co. | 5,322,320 | 99,261 |
* | Watson | | |
| Pharmaceuticals, Inc. | 2,200,000 | 66,924 |
* | Barr Pharmaceuticals Inc. | 900,000 | 46,098 |
12
| | | 6,950,677 |
Total United States | | 16,984,323 |
International (27.5%) | | |
Belgium (0.7%) | | |
| UCB SA | 3,223,593 | 181,081 |
| | | |
Canada (0.1%) | | |
* | Axcan Pharma Inc. | 1,146,900 | 20,964 |
| | | |
Denmark (0.3%) | | |
| Novo Nordisk A/S B Shares | 700,000 | 73,444 |
| | | |
France (3.8%) | | |
^Sanofi-Aventis | 11,439,415 | 958,196 |
| Ipsen Promesses | 1,300,000 | 68,954 |
| | | 1,027,150 |
Germany (1.6%) | | |
^Bayer AG | 5,594,656 | 396,029 |
| Fresenius Medical Care AG | 661,950 | 31,195 |
| | | 427,224 |
Ireland (0.1%) | | |
* | Elan Corp. PLC ADR | 1,820,000 | 34,089 |
| | | |
Japan (9.5%) | | |
| Takeda | | |
| Pharmaceutical Co. Ltd. | 10,400,000 | 677,470 |
| Astellas Pharma Inc. | 14,565,700 | 598,404 |
| Eisai Co., Ltd. | 9,653,700 | 407,262 |
| Daiichi Sankyo Co., Ltd. | 13,538,300 | 374,076 |
| Shionogi & Co., Ltd. | 9,876,000 | 157,612 |
| Chugai | | |
| Pharmaceutical Co., Ltd. | 8,834,500 | 152,426 |
| Tanabe Seiyaku Co., Ltd. | 6,850,000 | 80,232 |
| Ono | | |
| Pharmaceutical Co., Ltd. | 1,113,000 | 58,140 |
| Olympus Corp. | 700,000 | 28,693 |
| Terumo Corp. | 300,000 | 12,752 |
| | | 2,547,067 |
Netherlands (0.7%) | | |
| Akzo Nobel NV | 2,300,000 | 189,423 |
| | | |
Switzerland (6.8%) | | |
| Roche Holdings AG | 6,123,977 | 1,084,595 |
| Novartis AG (Registered) | 13,219,880 | 713,077 |
| | | 1,797,672 |
United Kingdom (3.9%) | | |
AstraZeneca Group PLC | 14,781,500 | 763,952 |
AstraZeneca Group | | |
PLC ADR | 3,496,672 | 181,233 |
GlaxoSmithKline PLC ADR | 1,642,381 | 83,893 |
| | 1,029,078 |
Total International | | 7,327,192 |
13
Total Common Stocks | | |
(Cost $15,129,386) | | 24,311,515 |
Temporary Cash Investments (9.4%) | |
Money Market Fund (0.6%) | | |
2 Vanguard Market | | |
Liquidity Fund, | | |
5.302%—Note G | 159,119,349 | 159,119 |
| | |
| Face | |
| Amount | |
| ($000) | |
Commercial Paper (1.6%) | | |
General Electric Capital Corp. | |
5.286%, 8/27/07 | 210,000 | 209,205 |
General Electric Capital Corp. | |
5.289%, 8/28/07 | 210,000 | 209,170 |
| | 418,375 |
Repurchase Agreements (7.2%) | |
Banc of America | | |
5.290%, 8/1/07 (Dated | | |
7/31/07, Repurchase Value | |
$301,344,000 collateralized | |
by Federal Home Loan | | |
Mortgage Corp., | | |
5.000%, 7/1/35 and Federal | |
National Mortgage Assn., | |
5.000%, 7/1/35) | 301,300 | 301,300 |
Credit Suisse First Boston LLC | |
5.320%, 8/1/07 (Dated | | |
7/31/07, Repurchase Value | |
$557,582,000 collateralized | |
by Federal National | | |
Mortgage Assn., | | |
4.500%–7.750%, | | |
3/1/08–7/1/37) | 557,500 | 557,500 |
Deutsche Bank | | |
5.310%, 8/1/07 (Dated | | |
7/31/07, Repurchase Value | |
$630,493,000 collateralized | |
by Federal National | | |
Mortgage Assn., | | |
4.500%–6.500%, | | |
1/1/19–5/1/37) | 630,400 | 630,400 |
14
| Face | Market |
| Amount | Value• |
| ($000) | ($000) |
SBC Warburg Dillon Read | | |
5.310%, 8/1/07 (Dated | | |
7/31/07, Repurchase Value | | |
$427,763,000 collateralized | | |
by Federal Home Loan | | |
Mortgage Corp., 6.000%, | | |
7/1/34 and Federal National | | |
Mortgage Assn., | | |
5.000%–6.000%, | | |
2/1/19–5/1/37) | 427,700 | 427,700 |
| | 1,916,900 |
Total Temporary Cash Investments | |
(Cost $2,494,402) | | 2,494,394 |
Total Investments (100.7%) | | |
(Cost $17,623,788) | | 26,805,909 |
Other Assets and Liabilities— | | |
Net (–0.7%) | | (207,470) |
Net Assets (100%) | | 26,598,439 |
| | |
| | |
| | |
Statement of Assets and Liabilities | |
Assets | | |
Investments in Securities, at Value | 26,805,909 |
Receivables for Investment | | |
Securities Sold | | 144,315 |
Other Assets—Note C | | 77,982 |
Total Assets | | 27,028,206 |
Liabilities | | |
Security Lending Collateral | | |
Payable to Brokers—Note G | | 159,119 |
Payables for Investment | | |
Securities Purchased | | 165,083 |
Other Liabilities | | 105,565 |
Total Liabilities | | 429,767 |
Net Assets | | 26,598,439 |
15
At July 31, 2007, net assets consisted of:3 |
| Amount |
| ($000) |
Paid-in Capital | 15,946,772 |
Undistributed Net Investment Income | 317,084 |
Accumulated Net Realized Gains | 1,152,253 |
Unrealized Appreciation | |
Investment Securities | 9,182,121 |
Foreign Currencies | 209 |
Net Assets | 26,598,439 |
| |
| |
Investor Shares—Net Assets | |
Applicable to 105,108,428 outstanding | |
$.001 par value shares of beneficial | |
interest (unlimited authorization) | 15,449,641 |
Net Asset Value Per Share— | |
Investor Shares | $146.99 |
| |
| |
Admiral Shares—Net Assets | |
Applicable to 179,643,822 outstanding | |
$.001 par value shares of beneficial | |
interest (unlimited authorization) | 11,148,798 |
Net Asset Value Per Share— | |
Admiral Shares | $62.06 |
• See Note A in Notes to Financial Statements.
* Non-income-producing security.
^ Part of security position is on loan to broker-dealers. See Note G in Notes to Financial Statements.
1 Considered an affiliated company of the fund as the fund owns more than 5% of the outstanding voting securities of such company. See Note I in Notes to Financial Statements.
2 Affiliated money market fund available only to Vanguard funds and certain trusts and accounts managed by Vanguard. Rate shown is the 7-day yield.
3 See Note E in Notes to Financial Statements for the tax-basis components of net assets.
ADR—American Depositary Receipt.
16
Statement of Operations
| Six Months Ended |
| July 31, 2007 |
| ($000) |
Investment Income | |
Income | |
Dividends1,2 | 318,204 |
Interest | 67,234 |
Security Lending | 4,305 |
Total Income | 389,743 |
Expenses | |
Investment Advisory Fees—Note B | 10,887 |
The Vanguard Group—Note C | |
Management and Administrative | |
Investor Shares | 13,216 |
Admiral Shares | 4,927 |
Marketing and Distribution | |
Investor Shares | 1,202 |
Admiral Shares | 735 |
Custodian Fees | 974 |
Shareholders’ Reports | |
Investor Shares | 129 |
Admiral Shares | 18 |
Trustees’ Fees and Expenses | 17 |
Total Expenses | 32,105 |
Expenses Paid Indirectly—Note D | (141) |
Net Expenses | 31,964 |
Net Investment Income | 357,779 |
Realized Net Gain (Loss) | |
Investment Securities Sold2 | 1,152,292 |
Foreign Currencies | (1,139) |
Realized Net Gain (Loss) | 1,151,153 |
Change in Unrealized Appreciation (Depreciation) | |
Investment Securities | (1,562,339) |
Foreign Currencies | 198 |
Change in Unrealized Appreciation (Depreciation) | (1,562,141) |
Net Increase (Decrease) in Net Assets Resulting from Operations | (53,209) |
1 Dividends are net of foreign withholding taxes of $12,214,000.
2 Dividend income and realized net gain (loss) from affiliated companies of the fund were $126,836,000 and $39,997,000, respectively.
17
Statement of Changes in Net Assets
| Six Months Ended | | Year Ended |
| July 31, | | January 31, |
| 2007 | | 2007 |
| ($000) | | ($000) |
Increase (Decrease) in Net Assets | | | |
Operations | | | |
Net Investment Income | 357,779 | | 359,863 |
Realized Net Gain (Loss) | 1,151,153 | | 1,022,866 |
Change in Unrealized Appreciation (Depreciation) | (1,562,141) | | 1,359,517 |
Net Increase (Decrease) in Net Assets Resulting from Operations | (53,209) | | 2,742,246 |
Distributions | | | |
Net Investment Income | | | |
Investor Shares | (15,236) | | (231,097) |
Admiral Shares | (11,502) | | (155,419) |
Realized Capital Gain1 | | | |
Investor Shares | (231,561) | | (747,621) |
Admiral Shares | (156,652) | | (459,182) |
Total Distributions | (414,951) | | (1,593,319) |
Capital Share Transactions—Note H | | | |
Investor Shares | (960,614) | | (1,240,502) |
Admiral Shares | 546,353 | | 1,251,373 |
Net Increase (Decrease) from Capital Share Transactions | (414,261) | | 10,871 |
Total Increase (Decrease) | (882,421) | | 1,159,798 |
Net Assets | | | |
Beginning of Period | 27,480,860 | | 26,321,062 |
End of Period2 | 26,598,439 | | 27,480,860 |
1 Includes fiscal 2008 and 2007 short-term gain distributions totaling $20,980,000 and $27,064,000, respectively. Short-term gain distributions are treated as ordinary income dividends for tax purposes.
2 Net Assets—End of Period includes undistributed (overdistributed) net investment income of $317,084,000 and ($12,818,000).
18
Financial Highlights
Investor Shares | | | | | | |
| | | | | | |
| Six Months | | | | | |
| Ended | | | |
For a Share Outstanding | July 31, | Year Ended January 31, |
Throughout Each Period | 2007 | 2007 | 2006 | 2005 | 2004 | 2003 |
Net Asset Value, Beginning of Period | $149.69 | $143.39 | $123.84 | $124.29 | $94.35 | $115.01 |
Investment Operations | | | | | | |
Net Investment Income | 1.9491 | 1.953 | 1.753 | 1.272 | .960 | .947 |
Net Realized and Unrealized Gain (Loss) | | | | | | |
on Investments | (2.381) | 13.107 | 24.424 | 3.385 | 30.078 | (14.124) |
Total from Investment Operations | (.432) | 15.060 | 26.177 | 4.657 | 31.038 | (13.177) |
Distributions | | | | | | |
Dividends from Net Investment Income | (.140) | (2.100) | (1.542) | (1.112) | (.995) | (.955) |
Distributions from Realized Capital Gains | (2.128) | (6.660) | (5.085) | (3.995) | (.103) | (6.528) |
Total Distributions | (2.268) | (8.760) | (6.627) | (5.107) | (1.098) | (7.483) |
Net Asset Value, End of Period | $146.99 | $149.69 | $143.39 | $123.84 | $124.29 | $94.35 |
| | | | | | |
| | | | | | |
Total Return2 | –0.30% | 10.85% | 21.49% | 3.76% | 32.99% | –11.65% |
| | | | | | |
| | | | | | |
Ratios/Supplemental Data | | | | | | |
Net Assets, End of Period (Millions) | $15,450 | $16,662 | $17,198 | $19,087 | $18,340 | $13,506 |
Ratio of Total Expenses to | | | | | | |
Average Net Assets | 0.26%* | 0.25% | 0.25% | 0.22% | 0.28% | 0.29% |
Ratio of Net Investment Income to | | | | | | |
Average Net Assets | 2.12%1,* | 1.33% | 1.29% | 1.02% | 0.91% | 0.86% |
Portfolio Turnover Rate | 10%* | 8% | 14% | 13% | 13% | 25% |
1 Net investment income per share and the ratio of net investment income to average net assets include $0.68 and 0.44%, respectively, resulting from a special dividend from Health Management Associates Class A in March 2007.
2 Total returns do not reflect the 1% fee assessed on redemptions after March 23, 2005, of shares held for less than one year, or the 1% fee assessed until March 23, 2005, on shares purchased on or after April 19, 1999, and held for less than five years. Total returns do not include the account service fee that may be applicable to certain accounts with balances below $10,000.
* Annualized.
19
Admiral Shares | | | | | | |
| | | | | | |
| Six Months | | | | | |
| Ended | | | |
For a Share Outstanding | July 31, | Year Ended January 31, |
Throughout Each Period | 2007 | 2007 | 2006 | 2005 | 2004 | 2003 |
Net Asset Value, Beginning of Period | $63.19 | $60.52 | $52.25 | $52.44 | $39.80 | $48.52 |
Investment Operations | | | | | | |
Net Investment Income | .8491 | .877 | .779 | .576 | .447 | .436 |
Net Realized and Unrealized Gain (Loss) | | | | | | |
on Investments | (1.014) | 5.542 | 10.328 | 1.431 | 12.696 | (5.963) |
Total from Investment Operations | (.165) | 6.419 | 11.107 | 2.007 | 13.143 | (5.527) |
Distributions | | | | | | |
Dividends from Net Investment Income | (.066) | (.938) | (.690) | (.511) | (.460) | (.438) |
Distributions from Realized Capital Gains | (.899) | (2.811) | (2.147) | (1.686) | (.043) | (2.755) |
Total Distributions | (.965) | (3.749) | (2.837) | (2.197) | (.503) | (3.193) |
Net Asset Value, End of Period | $62.06 | $63.19 | $60.52 | $52.25 | $52.44 | $39.80 |
| | | | | | |
| | | | | | |
Total Return2 | –0.27% | 10.96% | 21.62% | 3.84% | 33.12% | –11.58% |
| | | | | | |
| | | | | | |
Ratios/Supplemental Data | | | | | | |
Net Assets, End of Period (Millions) | $11,149 | $10,819 | $9,123 | $2,819 | $2,492 | $1,620 |
Ratio of Total Expenses to | | | | | | |
Average Net Assets | 0.19%* | 0.17% | 0.14% | 0.15% | 0.19% | 0.22% |
Ratio of Net Investment Income to | | | | | | |
Average Net Assets | 2.19%1,* | 1.41% | 1.40% | 1.10% | 0.98% | 0.93% |
Portfolio Turnover Rate | 10%* | 8% | 14% | 13% | 13% | 25% |
1 Net investment income per share and the ratio of net investment income to average net assets include $0.286 and 0.44%, respectively, resulting from a special dividend from Health Management Associates Class A in March 2007.
2 Total returns do not reflect the 1% fee assessed on redemptions after March 23, 2005, of shares held for less than one year, or the 1% fee previously assessed on shares held for less than five years.
* Annualized.
See accompanying Notes, which are an integral part of the Financial Statements.
20
Notes to Financial Statements
Vanguard Health Care Fund is registered under the Investment Company Act of 1940 as an open-end investment company, or mutual fund. The fund files reports with the SEC under the company name Vanguard Specialized Funds. The fund may invest in securities of foreign issuers, which may subject it to investment risks not normally associated with investing in securities of United States corporations. The fund offers two classes of shares, Investor Shares and Admiral Shares. Investor Shares are available to any investor who meets the fund’s minimum purchase requirements. Admiral Shares are designed for investors who meet certain administrative, service, tenure, and account-size criteria.
A. The following significant accounting policies conform to generally accepted accounting principles for U.S. mutual funds. The fund consistently follows such policies in preparing its financial statements.
1. Security Valuation: Securities are valued as of the close of trading on the New York Stock Exchange (generally 4 p.m., Eastern time) on the valuation date. Equity securities are valued at the latest quoted sales prices or official closing prices taken from the primary market in which each security trades; such securities not traded on the valuation date are valued at the mean of the latest quoted bid and asked prices. Securities for which market quotations are not readily available, or whose values have been affected by events occurring before the fund’s pricing time but after the close of the securities’ primary markets, are valued at their fair values calculated according to procedures adopted by the board of trustees. These procedures include obtaining quotations from an independent pricing service, monitoring news to identify significant market- or security-specific events, and evaluating changes in the values of foreign market proxies (for example, ADRs, futures contracts, or exchange-traded funds), between the time the foreign markets close and the fund’s pricing time. When fair-value pricing is employed, the prices of securities used by a fund to calculate its net asset value may differ from quoted or published prices for the same securities. Investments in Vanguard Market Liquidity Fund are valued at that fund’s net asset value. Temporary cash investments acquired over 60 days to maturity are valued using the latest bid prices or using valuations based on a matrix system (which considers such factors as security prices, yields, maturities, and ratings), both as furnished by independent pricing services. Other temporary cash investments are valued at amortized cost, which approximates market value.
2. Foreign Currency: Securities and other assets and liabilities denominated in foreign currencies are translated into U.S. dollars using exchange rates obtained from an independent third party as of the fund’s pricing time on the valuation date. Realized gains (losses) and unrealized appreciation (depreciation) on investment securities include the effects of changes in exchange rates since the securities were purchased, combined with the effects of changes in security prices. Fluctuations in the value of other assets and liabilities resulting from changes in exchange rates are recorded as unrealized foreign currency gains (losses) until the assets or liabilities are settled in cash, at which time they are recorded as realized foreign currency gains (losses).
3. Repurchase Agreements: The fund may invest in repurchase agreements. Securities pledged as collateral for repurchase agreements are held by a custodian bank until the agreements mature. Each agreement requires that the market value of the collateral be sufficient to cover payments of interest and principal; however, in the event of default or bankruptcy by the other party to the agreement, retention of the collateral may be subject to legal proceedings.
4. Federal Income Taxes: The fund intends to continue to qualify as a regulated investment company and distribute all of its taxable income. Accordingly, no provision for federal income taxes is required in the financial statements.
21
5. Distributions: Distributions to shareholders are recorded on the ex-dividend date.
6. Security Lending: The fund may lend its securities to qualified institutional borrowers to earn additional income. Security loans are required to be secured at all times by collateral at least equal to the market value of securities loaned. The fund invests cash collateral received in Vanguard Market Liquidity Fund, and records a liability for the return of the collateral, during the period the securities are on loan. Security lending income represents the income earned on investing cash collateral, less expenses associated with the loan.
7. Other: Dividend income is recorded on the ex-dividend date. Interest income is accrued daily. Premiums and discounts on debt securities purchased are amortized and accreted, respectively, to interest income over the lives of the respective securities. Security transactions are accounted for on the date securities are bought or sold. Costs used to determine realized gains (losses) on the sale of investment securities are those of the specific securities sold. Fees assessed on redemptions of capital shares are credited to paid-in capital.
Each class of shares has equal rights as to assets and earnings, except that each class separately bears certain class-specific expenses related to maintenance of shareholder accounts (included in Management and Administrative expenses) and shareholder reporting. Marketing and distribution expenses are allocated to each class of shares based on a method approved by the board of trustees. Income, other non-class-specific expenses, and gains and losses on investments are allocated to each class of shares based on its relative net assets.
B. Wellington Management Company, LLP, provides investment advisory services to the fund for a fee calculated at an annual percentage rate of average net assets. For the six months ended July 31, 2007, the investment advisory fee represented an effective annual rate of 0.08% of the fund’s average net assets.
C. The Vanguard Group furnishes at cost corporate management, administrative, marketing, and distribution services. The costs of such services are allocated to the fund under methods approved by the board of trustees. The fund has committed to provide up to 0.40% of its net assets in capital contributions to Vanguard. At July 31, 2007, the fund had contributed capital of $2,410,000 to Vanguard (included in Other Assets), representing 0.01% of the fund’s net assets and 2.41% of Vanguard’s capitalization. The fund’s trustees and officers are also directors and officers of Vanguard.
D. The fund has asked its investment advisor to direct certain security trades, subject to obtaining the best price and execution, to brokers who have agreed to rebate to the fund part of the commissions generated. Such rebates are used solely to reduce the fund’s management and administrative expenses. The fund’s custodian bank has also agreed to reduce its fees when the fund maintains cash on deposit in the non-interest-bearing custody account. For the six months ended July 31, 2007, these arrangements reduced the fund’s management and administrative expenses by $67,000 and custodian fees by $74,000.
E. Distributions are determined on a tax basis and may differ from net investment income and realized capital gains for financial reporting purposes. Differences may be permanent or temporary. Permanent differences are reclassified among capital accounts in the financial statements to reflect their tax character. Temporary differences arise when certain items of income, expense, gain, or loss are recognized in different periods for financial statement and tax purposes; these differences will reverse at some time in the future. Differences in classification may also result from the treatment of short-term gains as ordinary income for tax purposes. The fund’s tax-basis capital gains and losses are determined only at the end of each fiscal year.
During the six months ended July 31, 2007, the fund realized net foreign currency losses of $1,139,000, which decreased distributable net income for tax purposes; accordingly such losses
22
have been reclassified from accumulated net realized gains to undistributed net investment income.
At July 31, 2007, the cost of investment securities for tax purposes was $17,623,788,000. Net unrealized appreciation of investment securities for tax purposes was $9,182,121,000, consisting of unrealized gains of $9,423,696,000 on securities that had risen in value since their purchase and $241,575,000 in unrealized losses on securities that had fallen in value since their purchase.
F. During the six months ended July 31, 2007, the fund purchased $1,242,176,000 of investment securities and sold $1,958,356,000 of investment securities other than temporary cash investments.
G. The market value of securities on loan to broker-dealers at July 31, 2007, was $153,448,000, for which the fund received cash collateral of $159,119,000.
H. Capital share transactions for each class of shares were:
| Six Months Ended | | Year Ended |
| July 31, 2007 | | January 31, 2007 |
| Amount | Shares | | Amount | Shares |
| ($000) | (000) | | ($000) | (000) |
Investor Shares | | | | | |
Issued | 351,569 | 2,310 | | 753,042 | 5,236 |
Issued in Lieu of Cash Distributions | 236,784 | 1,602 | | 937,568 | 6,521 |
Redeemed1 | (1,548,967) | (10,113) | | (2,931,112) | (20,390) |
Net Increase (Decrease)—Investor Shares | (960,614) | (6,201) | | (1,240,502) | (8,633) |
Admiral Shares | | | | | |
Issued | 911,181 | 14,020 | | 1,638,889 | 26,900 |
Issued in Lieu of Cash Distributions | 153,267 | 2,457 | | 560,409 | 9,227 |
Redeemed1 | (518,095) | (8,054) | | (947,925) | (15,636) |
Net Increase (Decrease)—Admiral Shares | 546,353 | 8,423 | | 1,251,373 | 20,491 |
1 Net of redemption fees of $180,000 and $745,000 (fund totals).
23
I. Certain of the fund’s investments are in companies that are considered to be affiliated companies of the fund because the fund owns more than 5% of the outstanding voting securities of the company. Transactions during the period in securities of these companies were as follows:
| | Current Period Transactions | |
| Jan. 31, 2007 | | Proceeds from | | July 31, 2007 |
| Market | Purchases | Securities | Dividend | Market |
| Value | at Cost | Sold | Income | Value |
| ($000) | ($000) | ($000) | ($000) | ($000) |
Cerner Corp. | 188,706 | — | — | — | 222,054 |
Forest Laboratories, Inc. | 1,122,284 | 312,444 | 16,365 | — | 1,081,440 |
Health Management Associates | | | | | |
Class A | 240,925 | 16,253 | — | 123,869 | 115,958 |
Humana, Inc. | 468,032 | — | 43,772 | — | n/a1 |
McKesson Corp. | 825,100 | — | 22,491 | 1,740 | n/a1 |
OSI Pharmaceuticals, Inc. | n/a2 | 127,228 | — | — | 118,643 |
Owens & Minor, Inc. Holding Co. | 73,590 | — | — | 748 | 84,590 |
PAREXEL International Corp. | 51,424 | — | — | — | 63,483 |
Perrigo Co. | 91,970 | — | — | 479 | 99,261 |
| 3,062,031 | | | 126,836 | 1,785,430 |
J. In June 2006, the Financial Accounting Standards Board issued Interpretation No. 48 (“FIN 48”), “Accounting for Uncertainty in Income Taxes.” FIN 48 establishes the minimum threshold for recognizing, and a system for measuring, the benefits of tax-return positions in financial statements, effective for the fund’s current fiscal year. Management has analyzed the fund’s tax positions taken on federal income tax returns for all open tax years (tax years ended January 31, 2005–2007) for purposes of implementing FIN 48, and has concluded that no provision for income tax is required in the fund’s financial statements.
1 At July 31, 2007, the security was still held but the issuer was no longer an affiliated company of the fund.
2 At January 31, 2007, the issuer was not an affiliated company of the fund.
24
About Your Fund’s Expenses
As a shareholder of the fund, you incur ongoing costs, which include costs for portfolio management, administrative services, and shareholder reports (like this one), among others. Operating expenses, which are deducted from a fund’s gross income, directly reduce the investment return of the fund.
A fund’s expenses are expressed as a percentage of its average net assets. This figure is known as the expense ratio. The following examples are intended to help you understand the ongoing costs (in dollars) of investing in your fund and to compare these costs with those of other mutual funds. The examples are based on an investment of $1,000 made at the beginning of the period shown and held for the entire period.
The table below illustrates your fund’s costs in two ways:
• Based on actual fund return. This section helps you to estimate the actual expenses that you paid over the period. The “Ending Account Value” shown is derived from the fund’s actual return, and the third column shows the dollar amount that would have been paid by an investor who started with $1,000 in the fund. You may use the information here, together with the amount you invested, to estimate the expenses that you paid over the period.
To do so, simply divide your account value by $1,000 (for example, an $8,600 account value divided by $1,000 = 8.6), then multiply the result by the number given for your fund under the heading “Expenses Paid During Period.”
• Based on hypothetical 5% yearly return. This section is intended to help you compare your fund’s costs with those of other mutual funds. It assumes that the fund had a yearly return of 5% before expenses, but that the expense ratio is unchanged. In this case—because the return used is not the fund’s actual return—the results do not apply to your investment. The example is useful in making comparisons because the Securities and Exchange Commission requires all mutual funds to calculate expenses based on a 5% return. You can assess your fund’s costs by comparing this hypothetical example with the hypothetical examples that appear in shareholder reports of other funds.
Six Months Ended July 31, 2007 | | | |
| Beginning | Ending | Expenses |
| Account Value | Account Value | Paid During |
Health Care Fund | 1/31/2007 | 7/31/2007 | Period1 |
Based on Actual Fund Return | | | |
Investor Shares | $1,000.00 | $997.03 | $1.29 |
Admiral Shares | 1,000.00 | 997.31 | 0.94 |
Based on Hypothetical 5% Yearly Return | | | |
Investor Shares | $1,000.00 | $1,023.51 | $1.30 |
Admiral Shares | 1,000.00 | 1,023.85 | 0.95 |
1 These calculations are based on expenses incurred in the most recent six-month period. The fund’s annualized six-month expense ratios for that period are 0.26% for Investor Shares and 0.19% for Admiral Shares. The dollar amounts shown as “Expenses Paid” are equal to the annualized expense ratio multiplied by the average account value over the period, multiplied by the number of days in the most recent six-month period, then divided by the number of days in the most recent 12-month period.
25
Note that the expenses shown in the table on page 21 are meant to highlight and help you compare ongoing costs only and do not reflect transacton costs incurred by the fund for buying and selling securities. Further, the expenses do not include the 1% fee on redemptions of shares held for less than one year, nor do they include any account service fee described in the prospectus. If such fees were applied to your account, your costs would be higher. Your fund does not carry a “sales load.”
The calculations assume no shares were bought or sold during the period. Your actual costs may have been higher or lower, depending on the amount of your investment and the timing of any purchases or redemptions.
You can find more information about the fund’s expenses, including annual expense ratios, in the Financial Statements section of this report. For additional information on operating expenses and other shareholder costs, please refer to your fund’s current prospectus.
26
Trustees Approve Advisory Agreement
The board of trustees of Vanguard Health Care Fund approved an amended investment advisory agreement with Wellington Management Company, LLP, effective May 1, 2007. The amended agreement contains a new advisory fee schedule that increases the advisory fee paid to Wellington Management. The board determined that retaining Wellington Management and amending the fee schedule were in the best interests of the fund and its shareholders.
The board based its decision upon an evaluation of Wellington Management’s investment staff, portfolio management process, and performance. The trustees considered the factors discussed below, among others. However, no single factor determined whether the board approved the agreement. Rather, it was the totality of the circumstances that drove the board’s decision.
Nature, extent, and quality of services
The board considered the quality of investment management to the fund over both the short and long term and the organizational depth and stability of the advisory firm. The board noted that Wellington Management, with over 75 years of investment management experience, subadvises a broad range of mandates—including both equity and fixed income strategies—for institutional clients worldwide. Edward P. Owens has managed the Health Care Fund since its inception in 1984. He is aided by a team of five experienced health care analysts. The advisor’s health care team utilizes intensive fundamental analysis to identify companies with high-quality balance sheets, strong management, and the potential for new products that may lead to above-average growth in revenue and earnings. The advisor invests in stocks broadly representing the health care industry, seeking to maintain exposure across five primary subsectors: health services, medical products, specialty pharmaceuticals, major pharmaceuticals, and international markets.
The board concluded that the existing advisory fee schedule should be adjusted to reflect the fair market value of Wellington Management’s services and the firm’s need to maintain an expanded portfolio management team to manage a large fund in this market segment. The new fee arrangement will enable Wellington Management to enhance the organizational depth and stability of the fund’s portfolio management team by retaining top investment talent and by hiring new investment professionals on an as-needed basis. A full discussion of the board’s decision to amend Wellington Management’s advisory agreement, including the terms of the agreement, appeared in the fund’s annual report for the year ended January 31, 2007.
Investment performance
The board considered the short- and long-term performance of the fund, including any periods of outperformance or underperformance of a relevant benchmark and peer group. The board concluded that the fund, under Wellington Management, has consistently outperformed both the Standard & Poor’s Health Sector Index and the fund’s peer group since the fund’s inception. Information about the fund’s most recent performance can be found in the Performance Summary section of this report.
27
Cost
The board considered the cost of services to be provided, including consideration of competitive fee rates and the fact that, after the implementation of the amended agreement, the fund’s advisory fee remains below the average fee for its peer group. Information about the fund’s expense ratio appears in the About Your Fund’s Expenses section of this report as well as in the Financial Statements section, which also includes information about the advisory fee rate. The board did not consider profitability of Wellington Management in determining whether to approve the advisory fee, because Wellington Management is independent of Vanguard, and the advisory fee is the result of arm’s-length negotiations.
The benefit of economies of scale
The board concluded that the fund’s shareholders benefit from economies of scale because of breakpoints in the fund’s advisory fee schedule. The breakpoints reduce the effective rate of the fee as the fund’s assets increase.
The board will consider whether to renew the advisory agreement again after a one-year period.
28
Glossary
Beta. A measure of the magnitude of a fund’s past share-price fluctuations in relation to the ups and downs of a given market index. The index is assigned a beta of 1.00. Compared with a given index, a fund with a beta of 1.20 typically would have seen its share price rise or fall by 12% when the index rose or fell by 10%. A fund’s beta should be reviewed in conjunction with its R-squared (see definition below). The lower the R-squared, the less correlation there is between the fund and the index, and the less reliable beta is as an indicator of volatility.
Earnings Growth Rate. The average annual rate of growth in earnings over the past five years for the stocks now in a fund.
Expense Ratio. The percentage of a fund’s average net assets used to pay its annual administrative and advisory expenses. These expenses directly reduce returns to investors.
Foreign Holdings. The percentage of a fund represented by stocks or depositary receipts of companies based outside the United States.
Inception Date. The date on which the assets of a fund (or one of its share classes) are first invested in accordance with the fund’s investment objective. For funds with a subscription period, the inception date is the day after that period ends. Investment performance is measured from the inception date.
Median Market Cap. An indicator of the size of companies in which a fund invests; the midpoint of market capitalization (market price x shares outstanding) of a fund’s stocks, weighted by the proportion of the fund’s assets invested in each stock. Stocks representing half of the fund’s assets have market capitalizations above the median, and the rest are below it.
Price/Book Ratio. The share price of a stock divided by its net worth, or book value, per share. For a fund, the weighted average price/book ratio of the stocks it holds.
Price/Earnings Ratio. The ratio of a stock’s current price to its per-share earnings over the past year. For a fund, the weighted average P/E of the stocks it holds. P/E is an indicator of market expectations about corporate prospects; the higher the P/E, the greater the expectations for a company’s future growth.
R-Squared. A measure of how much of a fund’s past returns can be explained by the returns from the market in general, as measured by a given index. If a fund’s total returns were precisely synchronized with an index’s returns, its R-squared would be 1.00. If the fund’s returns bore no relationship to the index’s returns, its R-squared would be 0.
29
Return on Equity. The annual average rate of return generated by a company during the past
five years for each dollar of shareholder’s equity (net income divided by shareholder’s equity). For a fund, the weighted average return on equity for the companies whose stocks it holds.
Short-Term Reserves. The percentage of a fund invested in highly liquid, short-term securities that can be readily converted to cash.
Turnover Rate. An indication of the fund’s trading activity. Funds with high turnover rates incur higher transaction costs and may be more likely to distribute capital gains (which may be taxable to investors). The turnover rate excludes in-kind transactions, which have minimal impact on costs.
Yield. A snapshot of a fund’s income from interest and dividends. The yield, expressed as a percentage of the fund’s net asset value, is based on income earned over the past 30 days and is annualized, or projected forward for the coming year. The index yield is based on the current annualized rate of income provided by securities in the index.
30
This page intentionally left blank.
This page intentionally left blank.
The People Who Govern Your Fund
The trustees of your mutual fund are there to see that the fund is operated and managed in your best interests since, as a shareholder, you are a part owner of the fund. Your fund’s trustees also serve on the board of directors of The Vanguard Group, Inc., which is owned by the Vanguard funds and provides services to them on an at-cost basis.
A majority of Vanguard’s board members are independent, meaning that they have no affiliation with Vanguard or the funds they oversee, apart from the sizable personal investments they have made as private individuals.
Our independent board members bring distinguished backgrounds in business, academia, and public service to their task of working with Vanguard officers to establish the policies and oversee the activities of the funds. Among board members’ responsibilities are selecting investment advisors for the funds; monitoring fund operations, performance, and costs; reviewing contracts; nominating and selecting new trustees/directors; and electing Vanguard officers.
Each trustee serves a fund until its termination; or until the trustee’s retirement, resignation, or death; or otherwise as specified in the fund’s organizational documents. Any trustee may be removed at a shareholders’ meeting by a vote representing two-thirds of the net asset value of all shares of the fund together with shares of other Vanguard funds organized within the same trust. The table on these two pages shows information for each trustee and executive officer of the fund. The mailing address of the trustees and officers is P.O. Box 876, Valley Forge, PA 19482.
Chairman of the Board, Chief Executive Officer, and Trustee |
| |
John J. Brennan1 | |
Born 1954 | Principal Occupation(s) During the Past Five Years: Chairman of the Board, Chief Executive |
Trustee since May 1987; | Officer, and Director/Trustee of The Vanguard Group, Inc., and of each of the investment |
Chairman of the Board and | companies served by The Vanguard Group. |
Chief Executive Officer | |
147 Vanguard Funds Overseen | |
| |
Independent Trustees | |
| |
Charles D. Ellis | |
Born 1937 | Principal Occupation(s) During the Past Five Years: Applecore Partners (pro bono ventures |
Trustee since January 2001 | in education); Senior Advisor to Greenwich Associates (international business strategy |
147 Vanguard Funds Overseen | consulting); Successor Trustee of Yale University; Overseer of the Stern School of Business |
| at New York University; Trustee of the Whitehead Institute for Biomedical Research. |
| |
Rajiv L. Gupta | |
Born 1945 | Principal Occupation(s) During the Past Five Years: Chairman, President, and |
Trustee since December 20012 | Chief Executive Officer of Rohm and Haas Co. (chemicals); Board Member of |
147 Vanguard Funds Overseen | the American Chemistry Council; Director of Tyco International, Ltd. (diversified |
| manufacturing and services) since 2005; Trustee of Drexel University and of the |
| Chemical Heritage Foundation. |
| |
Amy Gutmann | |
Born 1949 | Principal Occupation(s) During the Past Five Years: President of the University of |
Trustee since June 2006 | Pennsylvania since 2004; Professor in the School of Arts and Sciences, Annenberg School |
147 Vanguard Funds Overseen | for Communication, and Graduate School of Education of the University of Pennsylvania |
| since 2004; Provost (2001–2004) and Laurance S. Rockefeller Professor of Politics and |
| the University Center for Human Values (1990–2004), Princeton University; Director of |
| Carnegie Corporation of New York since 2005 and of Schuylkill River Development |
| Corporation and Greater Philadelphia Chamber of Commerce since 2004. |
JoAnn Heffernan Heisen | |
Born 1950 | Principal Occupation(s) During the Past Five Years: Corporate Vice President and |
Trustee since July 1998 | Chief Global Diversity Officer since 2006, Vice President and Chief Information |
147 Vanguard Funds Overseen | Officer (1997–2005), and Member of the Executive Committee of Johnson & |
| Johnson (pharmaceuticals/consumer products); Director of the University Medical |
| Center at Princeton and Women’s Research and Education Institute. |
| |
André F. Perold | |
Born 1952 | Principal Occupation(s) During the Past Five Years: George Gund Professor of Finance |
Trustee since December 2004 | and Banking, Harvard Business School; Senior Associate Dean, Director of Faculty |
147 Vanguard Funds Overseen | Recruiting, and Chair of Finance Faculty, Harvard Business School; Director and Chairman |
| of UNX, Inc. (equities trading firm) since 2003; Chair of the Investment Committee of |
| HighVista Strategies LLC (private investment firm) since 2005. |
| |
Alfred M. Rankin, Jr. | |
Born 1941 | Principal Occupation(s) During the Past Five Years: Chairman, President, Chief Executive |
Trustee since January 1993 | Officer, and Director of NACCO Industries, Inc. (forklift trucks/housewares/lignite); Director |
147 Vanguard Funds Overseen | of Goodrich Corporation (industrial products/aircraft systems and services). |
| |
| |
J. Lawrence Wilson | |
Born 1936 | Principal Occupation(s) During the Past Five Years: Retired Chairman and Chief Executive |
Trustee since April 1985 | Officer of Rohm and Haas Co. (chemicals); Director of Cummins Inc. (diesel engines) and |
147 Vanguard Funds Overseen | AmerisourceBergen Corp. (pharmaceutical distribution); Trustee of Vanderbilt University |
| and of Culver Educational Foundation. |
| |
Executive Officers1 | |
| |
Thomas J. Higgins | |
Born 1957 | Principal Occupation(s) During the Past Five Years: Principal of The Vanguard Group, Inc.; |
Treasurer since July 1998 | Treasurer of each of the investment companies served by The Vanguard Group. |
147 Vanguard Funds Overseen | |
| |
| |
Heidi Stam | |
Born 1956 | Principal Occupation(s) During the Past Five Years: Managing Director of The Vanguard |
Secretary since July 2005 | Group, Inc., since 2006; General Counsel of The Vanguard Group since 2005; Secretary of |
147 Vanguard Funds Overseen | The Vanguard Group, and of each of the investment companies served by The Vanguard |
| Group, since 2005; Principal of The Vanguard Group (1997–2006). |
Vanguard Senior Management Team | | |
| | | |
R. Gregory Barton | Kathleen C. Gubanich | F. William McNabb, III | Ralph K. Packard |
Mortimer J. Buckley | Paul A. Heller | Michael S. Miller | George U. Sauter |
| | | |
| | | |
Founder | | | |
| | | |
John C. Bogle | | | |
Chairman and Chief Executive Officer, 1974–1996 | | |
1 Officers of the funds are “interested persons” as defined in the Investment Company Act of 1940.
2 December 2002 for Vanguard Equity Income Fund, Vanguard Growth Equity Fund, the Vanguard Municipal Bond Funds, and the Vanguard State Tax-Exempt Funds.
More information about the trustees is in the Statement of Additional Information, available from The Vanguard Group.

P.O. Box 2600
Valley Forge, PA 19482-2600
Connect with Vanguard® > www.vanguard.com
Fund Information > 800-662-7447 | Vanguard, Admiral, Connect with Vanguard, and the |
| ship logo are trademarks of The Vanguard Group, Inc. |
Direct Investor Account Services > 800-662-2739 | |
| All other marks are the exclusive property of their |
Institutional Investor Services > 800-523-1036 | respective owners. |
| |
Text Telephone for People | |
With Hearing Impairment > 800-952-3335 | All comparative mutual fund data are from Lipper Inc. |
| or Morningstar, Inc., unless otherwise noted. |
| |
| You can obtain a free copy of Vanguard’s proxy voting |
| guidelines by visiting our website, www.vanguard.com, |
This material may be used in conjunction | and searching for “proxy voting guidelines,” or by calling |
with the offering of shares of any Vanguard | Vanguard at 800-662-2739. They are also available from |
fund only if preceded or accompanied by | the SEC’s website, www.sec.gov. In addition, you may |
the fund’s current prospectus. | obtain a free report on how your fund voted the proxies for |
| securities it owned during the 12 months ended June 30. |
| To get the report, visit either www.vanguard.com |
| or www.sec.gov. |
| |
| You can review and copy information about your fund |
| at the SEC’s Public Reference Room in Washington, D.C. |
| To find out more about this public service, call the SEC |
| at 202-551-8090. Information about your fund is also |
| available on the SEC’s website, and you can receive |
| copies of this information, for a fee, by sending a |
| request in either of two ways: via e-mail addressed to |
| publicinfo@sec.gov or via regular mail addressed to the |
| Public Reference Section, Securities and Exchange |
| Commission, Washington, DC 20549-0102. |
| |
| |
| |
| |
| © 2007 The Vanguard Group, Inc. |
| All rights reserved. |
| Vanguard Marketing Corporation, Distributor. |
| |
| Q522 092007 |
|
|
Vanguard® REIT Index |
|
|
> Semiannual Report |
|
|
|
|
|
July 31, 2007 |
|
|
> | Vanguard REIT Index Fund’s Investor Shares returned –20.4% for the six months |
| ended July 31, 2007. |
> | The fund closely tracked the equally poor performance of its target benchmark. |
| Both fell shy of the average return of the fund’s peer group. |
> | All real estate investment trust (REIT) segments posted decidedly negative |
| returns. Residential and specialty REITs (primarily hospitals and hotels) |
| detracted the most from returns. Industrial REITs, the smallest component of |
| the index, posted the best relative results. |
Contents | |
| |
Your Fund’s Total Returns | 1 |
Chairman’s Letter | 2 |
Fund Profile | 7 |
Performance Summary | 8 |
Financial Statements | 9 |
About Your Fund’s Expenses | 22 |
Trustees Approve Advisory Arrangement | 24 |
Glossary | 25 |

Please note: The opinions expressed in this report are just that—informed opinions. They should not be considered promises or advice. Also, please keep in mind that the information and opinions cover the period through the date on the cover of this report. Of course, the risks of investing in your fund are spelled out in the prospectus.
Your Fund’s Total Returns
Six Months Ended July 31, 2007 | | |
| Ticker | Total |
| Symbol | Returns |
Vanguard REIT Index Fund | | |
Investor Shares | VGSIX | –20.4% |
Admiral™ Shares1 | VGSLX | –20.3 |
Signal™ Shares2 | VGRSX | –15.23 |
Institutional Shares4 | VGSNX | –20.3 |
ETF Shares5 | VNQ | |
Market Price | | –20.5 |
Net Asset Value | | –20.3 |
Target REIT Composite6 | | –20.4 |
MSCI® US REIT Index | | –20.8 |
Average Real Estate Fund7 | | –17.2 |
Dow Jones Wilshire 5000 Index | | 1.9 |
Your Fund’s Performance at a Glance | | | | | |
January 31, 2007–July 31, 2007 | | | | | |
| | | | |
| Starting | Ending | Distributions Per Share | |
| Share | Share | Income | Capital | Return of |
| Price | Price | Dividends | Gains | Capital |
Vanguard REIT Index Fund | | | | | |
Investor Shares | $27.76 | $21.71 | $0.440 | $0.000 | $0.000 |
Admiral Shares | 118.46 | 92.66 | 1.922 | 0.000 | 0.000 |
Signal Shares | 29.538 | 24.73 | 0.336 | 0.000 | 0.000 |
Institutional Shares | 18.33 | 14.34 | 0.299 | 0.000 | 0.000 |
ETF Shares | 83.55 | 65.33 | 1.359 | 0.000 | 0.000 |
| | | | | | |
1 A lower-cost class of shares available to many longtime shareholders and to those with significant investments in the fund.
2 Signal Shares also carry lower costs and are available to institutional shareholders who meet certain administrative, service, and account-size criteria.
3 Return since the share-class inception on June 5, 2007.
4 This class of shares also carries low expenses and is available for a minimum investment of $5 million.
5 Vanguard ETFTM Shares are traded on the American Stock Exchange and are available only through brokers. The table shows the ETF returns based on both the AMEX market price and the net asset value for a share. U.S. Pat. No. 6,879,964 B2.
6 The Target REIT Composite consists of the MSCI US REIT Index adjusted to include a 2% cash position (Lipper Money Market Average).
7 Derived from data provided by Lipper Inc.
8 Price at the share-class inception on June 5, 2007.
1

Chairman’s Letter
Dear Shareholder,
The fiscal half-year ended July 31, 2007, brought a sharp downturn in the commercial real estate market, where numerous REITs had registered outstanding gains over the past several years. The reversal, which was inevitable at some point, was due to a combination of rising interest rates and investors’ anticipation of an overall slowdown in the demand for real estate.
Against this challenging backdrop, the Investor Shares of Vanguard REIT Index Fund posted a return of –20.4% for the six months. The fund was outpaced by the average return for its peers but, as expected, was in line with the result of its benchmark, the Target REIT Composite.
As of July 31, the fund’s Investor Shares yielded 4.4%, and the Admiral, Signal, Institutional, and ETF Shares yielded 4.5%. Please note that these yield figures are not comparable to dividends paid by other stock funds, because REITs must distribute at least 90% of their taxable income, minus expenses, to shareholders. The figures also include some payments that represent capital gains and returns of capital by the underlying REITs; each REIT determines these amounts at the end of its fiscal year.
For the U.S. stock market, a nervous finish to the half-year
U.S. stocks produced modest returns for the past six months, as a downturn at the end of the period erased most of the gains
2
recorded earlier. The market stumbled as trouble with low-quality mortgage loans and related securities amplified investors’ risk-aversion.
The broad U.S. stock market returned 1.9% for the fiscal half-year. Large-capitalization stocks bested small-caps, and growth-oriented stocks outperformed their value-oriented counterparts. International stock markets sidestepped most of the U.S. turmoil, generating excellent six-month returns.
For bonds, a return to a more typical yield curve
As investors sought a safe haven from some of the financial markets’ riskier precincts, including bonds backed by mortgage loans made to borrowers with poor credit ratings, U.S. Treasury bond prices rose slightly and yields fell. The declines in yield were most pronounced among Treasury securities with maturities of less than 5 years.
These interest rate dynamics helped restore the yield curve—which illustrates the relationship between short- and long-term bond yields—to its typical, upward-sloping pattern. At the start of the period, the curve had been mildly inverted. The broad taxable bond market returned 1.9% for the half-year. Tax-exempt municipal securities returned a bit less.
Market Barometer | | | |
| | | Total Returns |
| Periods Ended July 31, 2007 |
| Six Months | One Year | Five Years1 |
Stocks | | | |
Russell 1000 Index (Large-caps) | 1.9% | 16.5% | 12.3% |
Russell 2000 Index (Small-caps) | –2.5 | 12.1 | 16.0 |
Dow Jones Wilshire 5000 Index (Entire market) | 1.9 | 16.8 | 13.1 |
MSCI All Country World Index ex USA (International) | 11.8 | 28.5 | 22.3 |
| | | |
| | | |
Bonds | | | |
Lehman U.S. Aggregate Bond Index (Broad taxable market) | 1.9% | 5.6% | 4.4% |
Lehman Municipal Bond Index | 1.2 | 4.3 | 4.5 |
Citigroup 3-Month Treasury Bill Index | 2.5 | 5.1 | 2.7 |
| | | |
| | | |
CPI | | | |
Consumer Price Index | 2.9% | 2.4% | 3.0% |
| | | | |
1 Annualized.
3
Negative returns closed the door on REITs’ lengthy ascent
The same credit-related turmoil that troubled the broad stock market also affected the performance of many REITs, particularly in the final weeks of the half-year. Among investors, a leading concern was that the rash of mergers and acquisitions—which had united a number of REITs over the past few years and fueled expectations that more deals might follow—would end as financing to complete deals became harder to obtain. Further intensifying concerns were hints that the residential subprime mortgage crisis would negatively impact residential REITs and might have a spillover effect on the commercial real estate market.
The –20.4% return of the REIT Index Fund’s Investor Shares erased some of the impressive gains achieved over the previous several years. Although the fund’s return was in line with that of its target benchmark, it trailed the average result of its peers by roughly 3 percentage points. The fund’s performance lagged most in the final two months (–16.3%) as growing investor unease caused volatile day-to-day movements in equity markets.
The weakness in the REIT industry was consistent throughout the categories the index encompasses—retail, office, residential, specialized, industrial, and diversified. Stocks of retail REITs, the largest index constituent (more than one-quarter of assets) posted weak results amid fears that consumer spending—an important driver of their success—would diminish in an unsettled economic environment. Top-ten holdings Simon Property Group and General Growth Properties each lost more than –20% for the period, and all of the fund’s other retail REITs also recorded negative returns.
Among office REITs, the story was similar. Top-ten holding Boston Properties declined nearly –25%, while all of the fund’s other office REITs turned in negative results. Although office vacancy rates in and around major U.S. cities have been falling and rents rising thanks to high demand, concerns about higher financing costs and reduced prospects for acquisitions within the business combined to put a dent in many stocks’ prices.
All of the index’s residential REIT stocks also fell during the period. These REITs, which primarily develop and manage multi-unit apartment buildings and condominiums, languished because of the softness in the residential real estate market. Around the country, the pace of luxury apartment and condominium development in major cities has fallen because of the weakening housing outlook. Top-ten holdings Equity Residential and AvalonBay Communities saw especially deep drops in their stock prices.
Specialized REITs, which develop and manage hospitals, storage facilities, and hotels, also posted disappointing returns as a group. Top-ten holdings Host Hotels & Resorts and Public Storage were weak performers, and most of the fund’s stocks in the category posted negative
4
returns. Industrial REITs, the smallest segment of the index, posted the best relative returns, but were still in the red. Diversified REITs, which cross multiple lines, were also in the red as a group.
Despite its disappointing result in the recent period, the fund’s long-term strengths remain intact: the talents of Vanguard’s Quantitative Equity Group, which has more than 20 years’ experience developing and implementing sophisticated indexing techniques, and the fund’s extremely low costs, an important ongoing contributor to its ability to capture the majority of the target index’s return.
Resist the urge to change, even during weak markets
This period of weak performance for the fund may lead some investors to question the value of REITs in their portfolio. That is a typical reaction when an investment that had been performing well for a long time suddenly changes course. However, a six-month period is a mere tick of the clock for long-term investors, for whom the REIT Index Fund is best-suited.
As a portfolio diversifier, REITs give you access to an asset class that tends to move somewhat independently of the broad market. Although REITs’ red-hot performance in recent years may have led some investors to be less cognizant of their potential risks, this period’s weak
Annualized Expense Ratios1 | | | | | |
Your fund compared with its peer group | | | | | |
| | | | | | Average |
| Investor | Admiral | Signal | Institutional | ETF | Real Estate |
| Shares | Shares | Shares | Shares | Shares | Fund |
REIT Index Fund | 0.20% | 0.11% | 0.11%2 | 0.09% | 0.11% | 1.55% |
1 Fund expense ratio reflects the six months ended July 31, 2007. Peer-group expense ratio is derived from data provided by Lipper Inc. and captures information through year-end 2006.
2 Annualized since the share-class inception on June 5, 2007.
5
results provide a valuable reminder that successful long-term investing requires patience through tough times.
With concerns continuing to unfold in the residential real estate market, additional spillover into the commercial real estate market is clearly a possibility, which might make for a bumpy ride in subsequent periods. However, if you maintain a balanced and broadly diversified portfolio of stock, bond, and money market funds, you will be better positioned to weather a variety of market types, especially when a particular market segment or asset class endures a rough stretch.
Thank you for investing with Vanguard.
Sincerely,

John J. Brennan
Chairman and Chief Executive Officer
August 13, 2007
Vanguard REIT ETF | | | | |
Premium/Discount: September 23, 20041–July 31, 2007 | | |
| | | | |
| Market Price Above or | Market Price Below |
| Equal to Net Asset Value | | Net Asset Value |
| Number | Percentage | Number | Percentage |
Basis Point Differential2 | of Days | of Total Days | of Days | of Total Days |
0–24.9 | 340 | 47.28% | 369 | 51.32% |
25–49.9 | 5 | 0.70 | 4 | 0.56 |
50–74.9 | 0 | 0.00 | 0 | 0.00 |
75–100.0 | 0 | 0.00 | 0 | 0.00 |
> 100.0 | 1 | 0.14 | 0 | 0.00 |
Total | 346 | 48.12% | 373 | 51.88% |
| | | | | |
1 Inception.
2 One basis point equals 1/100 of a percentage point.
6
Fund Profile
As of July 31, 2007
Portfolio Characteristics | | |
| Comparative | Broad |
| Fund | Index1 | Index2 |
Number of Stocks | 101 | 99 | 4,902 |
Median Market Cap | $5.6B | $5.6B | $32.9B |
Price/Earnings Ratio | 34.1x | 34.1x | 17.4x |
Price/Book Ratio | 2.4x | 2.4x | 2.7x |
Yield | | 4.6 | 1.8 |
Investor Shares | 4.4%3 | | |
Admiral Shares | 4.5%3 | | |
Signal Shares | 4.5%3 | | |
Institutional Shares | 4.5%3 | | |
ETF Shares | 4.5%3 | | |
Return on Equity | 8.4% | 8.4% | 18.4% |
Earnings Growth Rate | 1.4% | 1.4% | 21.0% |
Foreign Holdings | 0.0% | 0.0% | 0.0% |
Turnover Rate | 18%4 | — | — |
Expense Ratio | | — | — |
Investor Shares | 0.20%4 | | |
Admiral Shares | 0.11%4 | | |
Signal Shares | 0.11%4 | | |
Institutional Shares | 0.09%4 | | |
ETF Shares | 0.11%4 | | |
Short-Term Reserves | 2% | — | — |
| | | | |
Fund Allocation by REIT Type (% of portfolio) |
| |
Retail | 26% |
Specialized | 20 |
Residential | 19 |
Office | 16 |
Diversified | 9 |
Industrial | 8 |
Short-Term Reserves | 2% |
Volatility Measures5 | |
| Fund Versus | Fund Versus |
| Target Index6 | Broad Index2 |
R-Squared | 1.00 | 0.37 |
Beta | 1.00 | 1.23 |
Ten Largest Holdings7 (% of total net assets) |
| |
Simon Property Group, Inc. REIT | 6.5% |
Vornado Realty Trust REIT | 5.0 |
ProLogis REIT | 4.8 |
Archstone-Smith Trust REIT | 4.3 |
Equity Residential REIT | 4.0 |
Host Hotels & Resorts Inc. REIT | 3.9 |
Boston Properties, Inc. REIT | 3.8 |
General Growth Properties Inc. REIT | 3.6 |
Public Storage, Inc. REIT | 3.1 |
Avalonbay Communities, Inc. REIT | 2.9 |
Top Ten | 41.9% |
Investment Focus

1 MSCI US REIT Index.
2 Dow Jones Wilshire 5000 Index.
3 This yield may include some payments that represent a return of capital, capital gains distributions, or both by the underlying REITs. These amounts are determined by each REIT at the end of its fiscal year.
4 Annualized.
5 For an explanation of R-squared, beta, and other terms used here, see the Glossary on page 25.
6 The Target REIT Composite consists of the MSCI US REIT Index adjusted to include a 2% cash position (Lipper Money Market Average).
7 “Ten Largest Holdings” excludes any temporary cash investments and equity index products.
7
Performance Summary
All of the returns in this report represent past performance, which is not a guarantee of future results that may be achieved by the fund. (Current performance may be lower or higher than the performance data cited. For performance data current to the most recent month-end, visit our website at www.vanguard.com/performance.) Note, too, that both investment returns and principal value can fluctuate widely, so an investor’s shares, when sold, could be worth more or less than their original cost. The returns shown do not reflect taxes that a shareholder would pay on fund distributions or on the sale of fund shares.
Fiscal-Year Total Returns (%): January 31, 1997–July 31, 2007
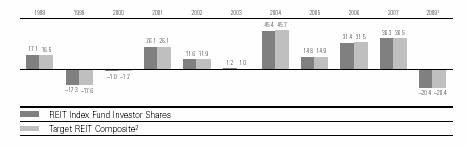
Average Annual Total Returns: Periods Ended June 30, 2007
This table presents average annual total returns through the latest calendar quarter—rather than through the end of the fiscal period. Securities and Exchange Commission rules require that we provide this information.
| Inception Date | One Year | Five Years | Ten Years |
Investor Shares3 | 5/13/1996 | 11.76% | 18.13% | 12.87% |
Admiral Shares3 | 11/12/2001 | 11.88 | 18.22 | 19.854 |
Signal Shares3 | 6/05/2007 | –8.954 | — | — |
Institutional Shares3 | 12/2/2003 | 11.90 | 19.604 | — |
ETF Shares | 9/23/2004 | | | |
Market Price | | 11.74 | 20.054 | — |
Net Asset Value | | 11.89 | 20.134 | — |
1 Six months ended July 31, 2007.
2 The Target REIT Composite consists of the MSCI US REIT Index adjusted to include a 2% cash position (Lipper Money Market Average).
3 Total return figures do not reflect the 1% fee assessed on redemptions of shares held less than one year; nor do they include the account service fee that may be applicable to certain accounts with balances below $10,000.
4 Return since inception.
Note: See Financial Highlights tables on pages 14–18 for dividend and capital gains information.
8
Financial Statements (unaudited)
Statement of Net Assets
As of July 31, 2007
The fund provides a complete list of its holdings four times in each fiscal year, at the quarter-ends. For the second and fourth fiscal quarters, the lists appear in the fund’s semiannual and annual reports to shareholders. For the first and third fiscal quarters, the fund files the lists with the Securities and Exchange Commission on Form N-Q. Shareholders can look up the fund’s Forms N-Q on the SEC’s website at www.sec.gov. Forms N-Q may also be reviewed and copied at the SEC’s Public Reference Room (see the back cover of this report for further information).
| | Market |
| | Value• |
| Shares | ($000) |
Real Estate Investment Trusts (98.5%) | |
Diversified REITs (9.3%) | | |
Vornado Realty Trust REIT | 4,401,030 | 471,042 |
Liberty Property Trust REIT | 2,917,282 | 109,427 |
Crescent | | |
Real Estate, Inc. REIT | 3,148,988 | 71,104 |
Spirit Finance Corp. REIT | 3,468,432 | 50,396 |
Colonial Properties | | |
Trust REIT | 1,411,446 | 48,822 |
Washington REIT | 1,452,167 | 43,333 |
Cousins | | |
Properties, Inc. REIT | 1,247,520 | 32,074 |
PS Business | | |
Parks, Inc. REIT | 515,376 | 26,336 |
^Investors Real Estate | | |
Trust REIT | 1,447,208 | 13,922 |
Capital Lease | | |
Funding, Inc. REIT | 1,404,280 | 13,018 |
| | 879,474 |
Industrial REITs (8.3%) | | |
ProLogis REIT | 7,983,184 | 454,243 |
AMB Property Corp. REIT | 3,190,920 | 170,012 |
First Industrial Realty | | |
Trust REIT | 1,445,975 | 55,974 |
DCT Industrial | | |
Trust Inc. REIT | 5,431,540 | 53,229 |
EastGroup | | |
Properties, Inc. REIT | 763,643 | 31,493 |
First Potomac REIT | 776,118 | 15,204 |
| | 780,155 |
Office REITs (16.1%) | | |
Boston | | |
Properties, Inc. REIT | 3,769,003 | 356,133 |
SL Green Realty Corp. REIT | 1,885,404 | 228,926 |
Duke Realty | | |
Corp. REIT | 4,362,685 | 142,616 |
Mack-Cali Realty | | |
Corp. REIT | 2,169,848 | 83,756 |
| | | |
| | Market |
| | Value• |
| Shares | ($000) |
Alexandria Real Estate | | |
Equities, Inc. REIT | 944,385 | 81,340 |
Douglas Emmett, Inc. REIT | 2,968,347 | 68,450 |
Kilroy Realty Corp. REIT | 1,044,970 | 67,327 |
Brandywine Realty | | |
Trust REIT | 2,704,827 | 65,240 |
HRPT Properties | | |
Trust REIT | 6,776,310 | 63,359 |
Highwood | | |
Properties, Inc. REIT | 1,718,363 | 55,898 |
Digital Realty | | |
Trust, Inc. REIT | 1,574,083 | 52,181 |
Corporate Office Properties | | |
Trust, Inc. REIT | 1,312,479 | 49,467 |
BioMed Realty | | |
Trust, Inc. REIT | 2,113,102 | 46,150 |
Lexington Realty Trust REIT | 2,107,143 | 39,762 |
American Financial Realty | | |
Trust REIT | 4,206,137 | 36,888 |
Maguire | | |
Properties, Inc. REIT | 1,212,688 | 34,695 |
^Franklin Street Properties | | |
Corp. REIT | 1,598,152 | 24,532 |
Parkway | | |
Properties Inc. REIT | 499,435 | 20,267 |
| | 1,516,987 |
Residential REITs (18.9%) | | |
Archstone-Smith | | |
Trust REIT | 7,045,474 | 404,481 |
Equity Residential REIT | 9,424,880 | 375,204 |
Avalonbay | | |
Communities, Inc. REIT | 2,535,976 | 273,809 |
Apartment Investment | | |
& Management Co. | | |
Class A REIT | 3,113,035 | 131,526 |
UDR, Inc. REIT | 4,345,537 | 100,338 |
Camden Property | | |
Trust REIT | 1,820,437 | 100,051 |
Essex Property | | |
Trust, Inc. REIT | 804,397 | 86,537 |
9
| | | Market |
| | | Value• |
| | Shares | ($000) |
| BRE Properties Inc. | | |
| Class A REIT | 1,627,177 | 82,221 |
| Post Properties, Inc. REIT | 1,405,717 | 61,908 |
| Home Properties, Inc. REIT | 1,062,886 | 49,212 |
| Mid-America Apartment | | |
| Communities, Inc. REIT | 750,726 | 33,880 |
| Equity Lifestyle | | |
| Properties, Inc. REIT | 728,876 | 33,062 |
| American Campus | | |
| Communities, Inc. REIT | 738,978 | 18,881 |
| Sun Communities, Inc. REIT | 556,094 | 15,137 |
| Education Realty | | |
| Trust, Inc. REIT | 857,581 | 11,277 |
| GMH Communities | | |
| Trust REIT | 1,271,257 | 10,679 |
| | | 1,788,203 |
Retail REITs (26.4%) | | |
| Simon Property | | |
| Group, Inc. REIT | 7,138,932 | 617,732 |
| General Growth | | |
| Properties Inc. REIT | 7,013,025 | 336,485 |
| Kimco Realty Corp. REIT | 7,254,414 | 270,807 |
| The Macerich Co. REIT | 2,316,784 | 169,473 |
| Developers Diversified | | |
| Realty Corp. REIT | 3,513,310 | 168,639 |
| Regency Centers | | |
| Corp. REIT | 2,223,211 | 144,220 |
| Federal Realty Investment | | |
| Trust REIT | 1,783,806 | 134,035 |
| Weingarten Realty | | |
| Investors REIT | 2,485,374 | 90,990 |
| Taubman Co. REIT | 1,707,750 | 82,126 |
| ^Realty Income Corp. REIT | 3,221,261 | 75,603 |
| CBL & Associates | | |
| Properties, Inc. REIT | 2,003,212 | 63,882 |
| Pennsylvania REIT | 1,189,769 | 46,330 |
| ^National Retail | | |
| Properties REIT | 2,105,871 | 45,613 |
| Tanger Factory Outlet | | |
| Centers, Inc. REIT | 1,000,776 | 33,456 |
| Inland Real Estate | | |
| Corp. REIT | 2,078,099 | 31,421 |
| Equity One, Inc. REIT | 1,179,751 | 27,229 |
| Glimcher Realty Trust REIT | 1,186,494 | 25,225 |
* | Alexander's, Inc. REIT | 64,856 | 22,965 |
| Acadia Realty Trust REIT | 973,882 | 22,428 |
| Cedar Shopping | | |
| Centers, Inc. REIT | 1,386,981 | 17,434 |
| Ramco-Gershenson | | |
| Properties Trust REIT | 534,812 | 17,221 |
| Kite Realty Group | | |
| Trust REIT | 929,486 | 14,835 |
| Saul Centers, Inc. REIT | 334,406 | 14,503 |
| | Market |
| | Value• |
| Shares | ($000) |
Getty Realty Holding | | |
Corp. REIT | 558,545 | 14,075 |
Urstadt Biddle Properties | | |
Class A REIT | 579,917 | 8,757 |
Urstadt Biddle | | |
Properties REIT | 26,988 | 449 |
| | 2,495,933 |
Specialized REITs (19.5%) | | |
Host Hotels | | |
& Resorts Inc. REIT | 17,414,906 | 367,803 |
Public Storage, Inc. REIT | 4,117,674 | 288,608 |
Health Care Properties | | |
Investors REIT | 6,475,871 | 176,403 |
Ventas, Inc. REIT | 4,185,990 | 136,547 |
Hospitality Properties | | |
Trust REIT | 3,003,245 | 115,204 |
^Health Care Inc. REIT | 2,538,828 | 93,200 |
Nationwide Health | | |
Properties, Inc. REIT | 2,726,169 | 64,965 |
Strategic Hotels and | | |
Resorts, Inc. REIT | 2,432,757 | 51,769 |
LaSalle Hotel | | |
Properties REIT | 1,289,682 | 51,626 |
DiamondRock | | |
Hospitality Co. REIT | 2,838,279 | 47,797 |
Senior Housing Properties | | |
Trust REIT | 2,697,621 | 46,615 |
Sunstone Hotel | | |
Investors, Inc. REIT | 1,861,881 | 46,212 |
FelCor Lodging | | |
Trust, Inc. REIT | 1,900,776 | 41,741 |
Equity Inns, Inc. REIT | 1,765,587 | 39,478 |
Entertainment Properties | | |
Trust REIT | 854,273 | 38,058 |
Ashford Hospitality | | |
Trust REIT | 3,562,005 | 36,404 |
Healthcare Realty | | |
Trust Inc. REIT | 1,542,656 | 35,820 |
Sovran Self | | |
Storage, Inc. REIT | 649,509 | 27,994 |
Omega Healthcare | | |
Investors, Inc. REIT | 2,139,066 | 27,658 |
Extra Space | | |
Storage Inc. REIT | 1,966,278 | 27,607 |
National Health | | |
Investors REIT | 761,086 | 24,050 |
U-Store-It Trust REIT | 1,572,325 | 22,500 |
^Medical Properties | | |
Trust Inc. REIT | 1,587,177 | 17,776 |
LTC Properties, Inc. REIT | 606,709 | 12,177 |
Universal Health Realty | | |
Income REIT | 361,468 | 10,573 |
| | 1,848,585 |
Total Real Estate Investment Trusts | |
(Cost $7,277,755) | | 9,309,337 |
| | | |
10
| | Market |
| | Value• |
| Shares | ($000) |
Temporary Cash Investments (2.0%) | |
1 Vanguard Market Liquidity | |
Fund, 5.302% | 154,581,865 | 154,582 |
1 Vanguard Market Liquidity | |
Fund, 5.302%—Note E | 38,031,300 | 38,031 |
Total Temporary Cash Investments | |
(Cost $192,613) | | 192,613 |
Total Investments (100.5%) | | |
(Cost $7,470,368) | | 9,501,950 |
Other Assets and Liabilities (–0.5%) | |
Other Assets—Note B | | 52,781 |
Liabilities—Note E | | (98,906) |
| | (46,125) |
Net Assets (100%) | | 9,455,825 |
At July 31, 2007, net assets consisted of: 2 | |
| Amount |
| ($000) |
Paid-in Capital | 7,634,117 |
Overdistributed Net Investment Income | (51,586) |
Accumulated Net Realized Losses | (158,288) |
Unrealized Appreciation | 2,031,582 |
Net Assets | 9,455,825 |
| |
| |
Investor Shares—Net Assets | |
Applicable to 218,311,696 outstanding | |
$.001 par value shares of beneficial | |
interest (unlimited authorization) | 4,740,475 |
Net Asset Value Per Share— | |
Investor Shares | $21.71 |
| |
| |
Admiral Shares—Net Assets | |
Applicable to 26,928,942 outstanding | |
$.001 par value shares of beneficial | |
interest (unlimited authorization) | 2,495,213 |
Net Asset Value Per Share— | |
Admiral Shares | $92.66 |
| |
| |
Signal Shares—Net Assets | |
Applicable to 465,606 outstanding | |
$.001 par value shares of beneficial | |
interest (unlimited authorization) | 11,517 |
Net Asset Value Per Share— | |
Signal Shares | $24.73 |
| |
| |
Institutional Shares—Net Assets | |
Applicable to 53,071,611 outstanding | |
$.001 par value shares of beneficial | |
interest (unlimited authorization) | 761,091 |
Net Asset Value Per Share— | |
Institutional Shares | $14.34 |
| |
| |
ETF Shares—Net Assets | |
Applicable to 22,157,556 outstanding | |
$.001 par value shares of beneficial | |
interest (unlimited authorization) | 1,447,529 |
Net Asset Value Per Share— | |
ETF Shares | $65.33 |
• See Note A in Notes to Financial Statements.
* Non-income-producing security.
^ Part of security position is on loan to broker-dealers. See Note E in Notes to Financial Statements.
1 Affiliated money market fund available only to Vanguard funds and certain trusts and accounts managed by Vanguard. Rate shown is the 7-day yield.
2 See Note C in Notes to Financial Statements for the tax-basis components of net assets.
11
Statement of Operations
| Six Months Ended |
| July 31, 2007 |
| ($000) |
Investment Income | |
Income | |
Dividends | 167,793 |
Interest1 | 6,018 |
Security Lending | 74 |
Total Income | 173,885 |
Expenses | |
The Vanguard Group—Note B | |
Investment Advisory Services | 141 |
Management and Administrative | |
Investor Shares | 5,272 |
Admiral Shares | 1,432 |
Signal Shares | 1 |
Institutional Shares | 263 |
ETF Shares | 664 |
Marketing and Distribution | |
Investor Shares | 736 |
Admiral Shares | 285 |
Signal Shares | — |
Institutional Shares | 112 |
ETF Shares | 211 |
Custodian Fees | 53 |
Shareholders’ Reports | |
Investor Shares | 68 |
Admiral Shares | 4 |
Signal Shares | — |
Institutional Shares | 3 |
ETF Shares | 28 |
Trustees’ Fees and Expenses | 8 |
Total Expenses | 9,281 |
Net Investment Income | 164,604 |
Realized Net Gain (Loss) | |
Investment Securities Sold | 226,416 |
Capital Gain Distributions Received | 46,903 |
Realized Net Gain (Loss) | 273,319 |
Change in Unrealized Appreciation (Depreciation) of Investment Securities | (3,039,925) |
Net Increase (Decrease) in Net Assets Resulting from Operations | (2,602,002) |
1 Interest income from an affiliated company of the fund was $6,018,000.
12
Statement of Changes in Net Assets
| Six Months Ended | Year Ended |
| July 31, | January 31, |
| 2007 | 2007 |
| ($000) | ($000) |
Increase (Decrease) in Net Assets | | |
Operations | | |
Net Investment Income | 164,604 | 226,677 |
Realized Net Gain (Loss) | 273,319 | 617,561 |
Change in Unrealized Appreciation (Depreciation) | (3,039,925) | 2,406,468 |
Net Increase (Decrease) in Net Assets Resulting from Operations | (2,602,002) | 3,250,706 |
Distributions | | |
Net Investment Income | | |
Investor Shares | (104,595) | (121,669) |
Admiral Shares | (55,954) | (59,953) |
Signal Shares | (55) | — |
Institutional Shares | (15,641) | (17,265) |
ETF Shares | (29,904) | (30,789) |
Realized Capital Gain1 | | |
Investor Shares | — | (94,471) |
Admiral Shares | — | (46,021) |
Signal Shares | — | — |
Institutional Shares | — | (13,057) |
ETF Shares | — | (23,098) |
Return of Capital | | |
Investor Shares | — | (25,625) |
Admiral Shares | — | (12,511) |
Signal Shares | — | — |
Institutional Shares | — | (3,585) |
ETF Shares | — | (6,407) |
Total Distributions | (206,149) | (454,451) |
Capital Share Transactions—Note F | | |
Investor Shares | (658,802) | 596,373 |
Admiral Shares | (145,633) | 650,765 |
Signal Shares | 12,705 | — |
Institutional Shares | 10,627 | 182,463 |
ETF Shares | 153,187 | 471,824 |
Net Increase (Decrease) from Capital Share Transactions | (627,916) | 1,901,425 |
Total Increase (Decrease) | (3,436,067) | 4,697,680 |
Net Assets | | |
Beginning of Period | 12,891,892 | 8,194,212 |
End of Period2 | 9,455,825 | 12,891,892 |
1 Includes fiscal 2008 and 2007 short-term gain distributions totaling $0 and $6,611,000, respectively. Short-term gain distributions are treated as ordinary income dividends for tax purposes.
2 Net Assets—End of Period includes undistributed (overdistributed) net investment income of ($51,586,000) and ($10,041,000).
13
Financial Highlights
Investor Shares | | | | | | |
| Six | | | | | |
| Months | | | | | |
| Ended | | | |
For a Share Outstanding | July 31, | Year Ended January 31, |
Throughout Each Period | 2007 | 2007 | 2006 | 2005 | 2004 | 2003 |
Net Asset Value, Beginning of Period | $27.76 | $21.29 | $17.20 | $15.83 | $11.52 | $12.10 |
Investment Operations | | | | | | |
Net Investment Income | .34 | .530 | .562 | .563 | .579 | .606 |
Net Realized and Unrealized | | | | | | |
Gain (Loss) on Investments1 | (5.95) | 7.000 | 4.692 | 1.759 | 4.511 | (.426) |
Total from Investment Operations | (5.61) | 7.530 | 5.254 | 2.322 | 5.090 | .180 |
Distributions | | | | | | |
Dividends from Net Investment Income | (.44) | (.534) | (.568) | (.565) | (.678) | (.667) |
Distributions from Realized Capital Gains | — | (.413) | (.530) | (.387) | — | — |
Return of Capital | — | (.113) | (.066) | — | (.102) | (.093) |
Total Distributions | (.44) | (1.060) | (1.164) | (.952) | (.780) | (.760) |
Net Asset Value, End of Period | $21.71 | $27.76 | $21.29 | $17.20 | $15.83 | $11.52 |
| | | | | | |
| | | | | | |
Total Return2 | –20.39% | 36.32% | 31.43% | 14.78% | 45.39% | 1.20% |
| | | | | | |
| | | | | | |
Ratios/Supplemental Data | | | | | | |
Net Assets, End of Period (Millions) | $4,740 | $6,827 | $4,727 | $4,311 | $3,383 | $1,734 |
Ratio of Total Expenses to | | | | | | |
Average Net Assets | 0.20%* | 0.21% | 0.21% | 0.21% | 0.24% | 0.27% |
Ratio of Net Investment | | | | | | |
Income to Average Net Assets | 2.70%* | 2.27% | 2.91% | 3.44% | 4.10% | 4.90% |
Portfolio Turnover Rate3 | 18%* | 11% | 17% | 13% | 7% | 12% |
| | | | | | | | | | |
1 Includes increases from redemption fees of $0.01, $0.00, $0.01, $0.01, $0.00, and $0.01.
2 Total returns do not reflect the 1% fee assessed on redemptions of shares held for less than one year; nor do they include the account service fee that may be applicable to certain accounts with balances below $10,000.
3 Excludes the value of portfolio securities received or delivered as a result of in-kind purchases or redemptions of the fund’s capital shares, including ETF Creation Units.
* Annualized.
14
Admiral Shares | | | | | | |
| Six | | | | | |
| Months | | | | | |
| Ended | | | |
For a Share Outstanding | July 31, | | Year Ended January 31, |
Throughout Each Period | 2007 | 2007 | 2006 | 2005 | 2004 | 2003 |
Net Asset Value, Beginning of Period | $118.46 | $90.82 | $73.40 | $67.56 | $49.14 | $51.65 |
Investment Operations | | | | | | |
Net Investment Income | 1.512 | 2.328 | 2.460 | 2.437 | 2.508 | 2.619 |
Net Realized and Unrealized | | | | | | |
Gain (Loss) on Investments1 | (25.390) | 29.903 | 19.993 | 7.494 | 19.279 | (1.854) |
Total from Investment Operations | (23.878) | 32.231 | 22.453 | 9.931 | 21.787 | .765 |
Distributions | | | | | | |
Dividends from Net Investment Income | (1.922) | (2.341) | (2.488) | (2.439) | (2.931) | (2.878) |
Distributions from Realized Capital Gains | — | (1.761) | (2.258) | (1.652) | — | — |
Return of Capital | — | (.489) | (.287) | — | (.436) | (.397) |
Total Distributions | (1.922) | (4.591) | (5.033) | (4.091) | (3.367) | (3.275) |
Net Asset Value, End of Period | $92.66 | $118.46 | $90.82 | $73.40 | $67.56 | $49.14 |
| | | | | | |
| | | | | | |
Total Return2 | –20.34% | 36.46% | 31.49% | 14.82% | 45.57% | 1.19% |
| | | | | | |
| | | | | | |
Ratios/Supplemental Data | | | | | | |
Net Assets, End of Period (Millions) | $2,495 | $3,392 | $2,025 | $938 | $733 | $320 |
Ratio of Total Expenses to | | | | | | |
Average Net Assets | 0.11%* | 0.14% | 0.14% | 0.16% | 0.18% | 0.21% |
Ratio of Net Investment | | | | | | |
Income to Average Net Assets | 2.79%* | 2.34% | 2.98% | 3.49% | 4.16% | 4.99% |
Portfolio Turnover Rate3 | 18%* | 11% | 17% | 13% | 7% | 12% |
| | | | | | | | | |
1 Includes increases from redemption fees of $0.05, $0.02, $0.02, $0.04, $0.01, and $0.03.
2 Total returns do not reflect the 1% fee assessed on redemptions of shares held for less than one year.
3 Excludes the value of portfolio securities received or delivered as a result of in-kind purchases or redemptions of the fund’s capital shares, including ETF Creation Units.
* Annualized.
15
Signal Shares | |
| June 5, 20071 to |
For a Share Outstanding Throughout the Period | July 31, 2007 |
Net Asset Value, Beginning of Period | $29.53 |
Investment Operations | |
Net Investment Income | .012 |
Net Realized and Unrealized Gain (Loss) on Investments2 | (4.476) |
Total from Investment Operations | (4.464) |
Distributions | |
Dividends from Net Investment Income | (.336) |
Distributions from Realized Capital Gains | — |
Return of Capital | — |
Total Distributions | (.336) |
Net Asset Value, End of Period | $24.73 |
| |
| |
Total Return3 | –15.21% |
| |
| |
Ratios/Supplemental Data | |
Net Assets, End of Period (Millions) | $12 |
Ratio of Total Expenses to Average Net Assets | 0.11%* |
Ratio of Net Investment Income to Average Net Assets | 2.79%* |
Portfolio Turnover Rate4 | 18%* |
1 Inception.
2 Includes increase from redemption fees of $0.01.
3 Total returns do not reflect the 1% fee assessed on redemptions of shares held for less than one year.
4 Excludes the value of portfolio securities received or delivered as a result of in-kind purchases or redemptions of the fund’s capital shares, including ETF Creation Units.
* Annualized.
16
Institutional Shares | | | | | |
| | | | | |
| Six Months | | | | Dec. 2, |
| Ended | | 20031 to |
| July 31, | Year Ended January 31, | Jan. 31, |
For a Share Outstanding Throughout Each Period | 2007 | 2007 | 2006 | 2005 | 2004 |
Net Asset Value, Beginning of Period | $18.33 | $14.06 | $11.36 | $10.46 | $10.00 |
Investment Operations | | | | | |
Net Investment Income | .235 | .366 | .385 | .381 | .065 |
Net Realized and Unrealized Gain (Loss) | | | | | |
on Investments | (3.926) | 4.621 | 3.099 | 1.156 | .575 |
Total from Investment Operations | (3.691) | 4.987 | 3.484 | 1.537 | .640 |
Distributions | | | | | |
Dividends from Net Investment Income | (.299) | (.368) | (.389) | (.381) | (.157) |
Distributions from Realized Capital Gains | — | (.273) | (.350) | (.256) | — |
Return of Capital | — | (.076) | (.045) | — | (.023) |
Total Distributions | (.299) | (.717) | (.784) | (.637) | (.180) |
Net Asset Value, End of Period | $14.34 | $18.33 | $14.06 | $11.36 | $10.46 |
| | | | | |
| | | | | |
Total Return2 | –20.32% | 36.45% | 31.58% | 14.81% | 6.49% |
| | | | | |
| | | | | |
Ratios/Supplemental Data | | | | | |
Net Assets, End of Period (Millions) | $761 | $960 | $571 | $297 | $63 |
Ratio of Total Expenses to | | | | | |
Average Net Assets | 0.09%* | 0.10% | 0.10% | 0.13% | 0.15%* |
Ratio of Net Investment Income | | | | | |
to Average Net Assets | 2.81%* | 2.38% | 3.02% | 3.52% | 4.19%* |
Portfolio Turnover Rate3 | 18%* | 11% | 17% | 13% | 7% |
| | | | | | | |
1 Inception.
2 Total returns do not reflect the 1% fee assessed on redemptions of shares held for less than one year.
3 Excludes the value of portfolio securities received or delivered as a result of in-kind purchases or redemptions of the fund’s capital shares, including ETF Creation Units.
* Annualized.
17
ETF Shares | | | | |
| | | | Sept. 23, |
| Six Months | | 20041 to |
| Ended | Year Ended | |
| July 31, | January 31, | Jan. 31, |
For a Share Outstanding Throughout Each Period | 2007 | 2007 | 2006 | 2005 |
Net Asset Value, Beginning of Period | $83.55 | $64.07 | $51.77 | $49.41 |
Investment Operations | | | | |
Net Investment Income | 1.066 | 1.654 | 1.745 | .665 |
Net Realized and Unrealized Gain (Loss) on Investments2 | (17.927) | 21.080 | 14.116 | 2.965 |
Total from Investment Operations | (16.861) | 22.734 | 15.861 | 3.630 |
Distributions | | | | |
Dividends from Net Investment Income | (1.359) | (1.665) | (1.764) | (.682) |
Distributions from Realized Capital Gains | — | (1.242) | (1.594) | (.588) |
Return of Capital | — | (.347) | (.203) | — |
Total Distributions | (1.359) | (3.254) | (3.561) | (1.270) |
Net Asset Value, End of Period | $65.33 | $83.55 | $64.07 | $51.77 |
| | | | |
| | | | |
Total Return | –20.35% | 36.48% | 31.54% | 7.13% |
| | | | |
| | | | |
Ratios/Supplemental Data | | | | |
Net Assets, End of Period (Millions) | $1,448 | $1,713 | $871 | $198 |
Ratio of Total Expenses to Average Net Assets | 0.11%* | 0.12% | 0.12% | 0.18%* |
Ratio of Net Investment Income to Average Net Assets | 2.79%* | 2.36% | 3.00% | 3.47%* |
Portfolio Turnover Rate3 | 18%* | 11% | 17% | 13% |
| | | | | |
1 Inception.
2 Includes increases from redemption fees of $0.03, $0.01, $0.01, and $0.00.
3 Excludes the value of portfolio securities received or delivered as a result of in-kind purchases or redemptions of the fund’s capital shares, including ETF Creation Units.
* Annualized.
See accompanying Notes, which are an integral part of the Financial Statements.
18
Notes to Financial Statements
Vanguard REIT Index Fund is registered under the Investment Company Act of 1940 as an open-end investment company, or mutual fund. The fund files reports with the SEC under the company name Vanguard Specialized Funds. The fund offers five classes of shares: Investor Shares, Admiral Shares, Signal Shares, Institutional Shares, and ETF Shares. Investor Shares are available to any investor who meets the fund’s minimum purchase requirements. Admiral Shares are designed for investors who meet certain administrative, service, tenure, and account-size criteria. Signal Shares are designed for institutional investors who meet certain administrative, service, and account-size criteria. Signal Shares were first issued on June 5, 2007. Institutional Shares are designed for investors who meet certain administrative and service criteria and invest a minimum of $5 million. ETF Shares are listed for trading on the American Stock Exchange; they can be purchased and sold through a broker.
A. The following significant accounting policies conform to generally accepted accounting principles for U.S. mutual funds. The fund consistently follows such policies in preparing its financial statements.
1. Security Valuation: Securities are valued as of the close of trading on the New York Stock Exchange (generally 4 p.m., Eastern time) on the valuation date. Equity securities are valued at the latest quoted sales prices or official closing prices taken from the primary market in which each security trades; such securities not traded on the valuation date are valued at the mean of the latest quoted bid and asked prices. Securities for which market quotations are not readily available, or whose values have been materially affected by events occurring before the fund’s pricing time but after the close of the securities’ primary markets, are valued by methods deemed by the board of trustees to represent fair value. Investments in Vanguard Market Liquidity Fund are valued at that fund’s net asset value.
2. Federal Income Taxes: The fund intends to continue to qualify as a regulated investment company and distribute all of its taxable income. Accordingly, no provision for federal income taxes is required in the financial statements.
3. Distributions: Distributions to shareholders are recorded on the ex-dividend date. Quarterly income dividends declared by the fund are reallocated at fiscal year-end to ordinary income, capital gain, and return of capital to reflect their tax character.
4. Security Lending: The fund may lend its securities to qualified institutional borrowers to earn additional income. Security loans are required to be secured at all times by collateral at least equal to the market value of securities loaned. The fund invests cash collateral received in Vanguard Market Liquidity Fund, and records a liability for the return of the collateral, during the period the securities are on loan. Security lending income represents the income earned on investing cash collateral, less expenses associated with the loan.
5. Other: Distributions received from REITs are recorded on the ex-dividend date. Each REIT reports annually the tax character of its distributions. Dividend income, capital gain distributions received, and unrealized appreciation (depreciation) reflect the amounts of taxable income, capital gain, and return of capital reported by the REITs, and management’s estimates of such amounts for REIT distributions for which actual information has not been reported. Interest income includes income distributions received from Vanguard Market Liquidity Fund and is accrued daily. Security transactions are accounted for on the date securities are bought or sold. Costs used to determine realized gains (losses) on the sale of investment securities are those of the specific securities sold. Fees assessed on redemptions of capital shares are credited to paid-in capital.
19
Each class of shares has equal rights as to assets and earnings, except that each class separately bears certain class-specific expenses related to maintenance of shareholder accounts (included in Management and Administrative expenses) and shareholder reporting. Marketing and distribution expenses are allocated to each class of shares based on a method approved by the board of trustees. Income, other non-class-specific expenses, and gains and losses on investments are allocated to each class of shares based on its relative net assets.
B. The Vanguard Group furnishes at cost investment advisory, corporate management, administrative, marketing, and distribution services. The costs of such services are allocated to the fund under methods approved by the board of trustees. The fund has committed to provide up to 0.40% of its net assets in capital contributions to Vanguard. At July 31, 2007, the fund had contributed capital of $934,000 to Vanguard (included in Other Assets), representing 0.01% of the fund’s net assets and 0.93% of Vanguard’s capitalization. The fund’s trustees and officers are also directors and officers of Vanguard.
C. Distributions are determined on a tax basis and may differ from net investment income and realized capital gains for financial reporting purposes. Differences may be permanent or temporary. Permanent differences are reclassified among capital accounts in the financial statements to reflect their tax character. Temporary differences arise when certain items of income, expense, gain, or loss are recognized in different periods for financial statement and tax purposes; these differences will reverse at some time in the future. Differences in classification may also result from the treatment of short-term gains as ordinary income for tax purposes. The fund’s return of capital distributions and tax-basis capital gains and losses are determined only at the end of each fiscal year.
During the six months ended July 31, 2007, the fund realized $428,649,000 of net capital gains resulting from in-kind redemptions—in which shareholders exchanged fund shares for securities held by the fund rather than for cash. Because such gains are not taxable to the fund, and are not distributed to shareholders, they have been reclassified from accumulated net realized gains to paid-in capital.
At July 31, 2007, the cost of investment securities for tax purposes was $7,470,368,000. Net unrealized appreciation of investment securities for tax purposes was $2,031,582,000, consisting of unrealized gains of $2,185,551,000 on securities that had risen in value since their purchase and $153,969,000 in unrealized losses on securities that had fallen in value since their purchase.
D. During the six months ended July 31, 2007, the fund purchased $2,130,202,000 of investment securities and sold $2,655,586,000 of investment securities other than temporary cash investments.
E. The market value of securities on loan to broker-dealers at July 31, 2007, was $36,713,000, for which the fund received cash collateral of $38,031,000.
20
F. Capital share transactions for each class of shares were:
| Six Months Ended | Year Ended |
| July 31, 2007 | January 31, 2007 |
| Amount | Shares | Amount | Shares |
| ($000) | (000) | ($000) | (000) |
Investor Shares | | | | |
Issued | 928,307 | 35,044 | 1,731,399 | 72,687 |
Issued in Lieu of Cash Distributions | 97,972 | 3,970 | 224,270 | 9,464 |
Redeemed1 | (1,685,081) | (66,626) | (1,359,296) | (58,310) |
Net Increase (Decrease)—Investor Shares | (658,802) | (27,612) | 596,373 | 23,841 |
Admiral Shares | | | | |
Issued | 587,202 | 5,105 | 1,081,669 | 10,634 |
Issued in Lieu of Cash Distributions | 47,395 | 450 | 99,808 | 984 |
Redeemed1 | (780,230) | (7,257) | (530,712) | (5,288) |
Net Increase (Decrease)—Admiral Shares | (145,633) | (1,702) | 650,765 | 6,330 |
Signal Shares | | | | |
Issued | 13,124 | 482 | — | — |
Issued in Lieu of Cash Distributions | 36 | 1 | — | — |
Redeemed1 | (455) | (17) | — | — |
Net Increase (Decrease)—Signal Shares | 12,705 | 466 | — | — |
Institutional Shares | | | | |
Issued | 226,256 | 13,130 | 286,029 | 18,678 |
Issued in Lieu of Cash Distributions | 14,602 | 899 | 29,962 | 1,909 |
Redeemed1 | (230,231) | (13,325) | (133,528) | (8,807) |
Net Increase (Decrease)—Institutional Shares | 10,627 | 704 | 182,463 | 11,780 |
ETF Shares | | | | |
Issued | 1,137,663 | 13,558 | 1,432,154 | 20,104 |
Issued in Lieu of Cash Distributions | — | — | — | — |
Redeemed1 | (984,476) | (11,900) | (960,330) | (13,200) |
Net Increase (Decrease)—ETF Shares | 153,187 | 1,658 | 471,824 | 6,904 |
G. In June 2006, the Financial Accounting Standards Board issued Interpretation No. 48 (“FIN 48”), “Accounting for Uncertainty in Income Taxes.” FIN 48 establishes the minimum threshold for recognizing, and a system for measuring, the benefits of tax-return positions in financial statements, effective for the fund’s current fiscal year. Management has analyzed the fund’s tax positions taken on federal income tax returns for all open tax years (tax years ended January 31, 2005–2007) for purposes of implementing FIN 48, and has concluded that no provision for income tax is required in the fund’s financial statements.
1 Net of redemption fees of $5,378,000 and $1,769,000, respectively (fund totals).
21
About Your Fund’s Expenses
As a shareholder of the fund, you incur ongoing costs, which include costs for portfolio management, administrative services, and shareholder reports (like this one), among others. Operating expenses, which are deducted from a fund’s gross income, directly reduce the investment return of the fund.
A fund’s expenses are expressed as a percentage of its average net assets. This figure is known as the expense ratio. The following examples are intended to help you understand the ongoing costs (in dollars) of investing in your fund and to compare these costs with those of other mutual funds. The examples are based on an investment of $1,000 made at the beginning of the period shown and held for the entire period.
The table below illustrates your fund’s costs in two ways:
• Based on actual fund return. This section helps you to estimate the actual expenses that you paid over the period. The “Ending Account Value” shown is derived from the fund’s actual return, and the third column shows the dollar amount that would have been paid by an investor who started with $1,000 in the fund. You may use the information here, together with the amount you invested, to estimate the expenses that you paid over the period.
To do so, simply divide your account value by $1,000 (for example, an $8,600 account value divided by $1,000 = 8.6), then multiply the result by the number given for your fund under the heading “Expenses Paid During Period.”
• Based on hypothetical 5% yearly return. This section is intended to help you compare your fund’s costs with those of other mutual funds. It assumes that the fund had a yearly return of 5% before expenses, but that the expense ratio is unchanged. In this case—because the return used is not the fund’s actual return—the results do not apply to your investment. The example is useful in making comparisons because the Securities and Exchange Commission requires all mutual funds to calculate expenses based on a 5% return. You can assess your fund’s costs by comparing this hypothetical example with the hypothetical examples that appear in shareholder reports of other funds.
Six Months Ended July 31, 20071 | | | |
| Beginning | Ending | Expenses |
| Account Value | Account Value | Paid During |
REIT Index Fund | 1/31/2007 | 7/31/2007 | Period2 |
Based on Actual Fund Return | | | |
Investor Shares | $1,000.00 | $796.08 | $0.89 |
Admiral Shares | 1,000.00 | 796.56 | 0.49 |
Institutional Shares | 1,000.00 | 796.75 | 0.40 |
ETF Shares | 1,000.00 | 796.53 | 0.49 |
Based on Hypothetical 5% Yearly Return | | | |
Investor Shares | $1,000.00 | $1,023.80 | $1.00 |
Admiral Shares | 1,000.00 | 1,024.25 | 0.55 |
Institutional Shares | 1,000.00 | 1,024.35 | 0.45 |
ETF Shares | 1,000.00 | 1,024.25 | 0.55 |
1 This table does not include data for share classes with fewer than six months of history.
2 These calculations are based on expenses incurred in the most recent six-month period. The fund’s annualized six-month expense ratios for that period are 0.20% for Investor Shares, 0.11% for Admiral Shares, 0.09% for Institutional Shares, and 0.11% for ETF Shares. The dollar amounts shown as “Expenses Paid” are equal to the annualized expense ratio multiplied by the average account value over the period, multiplied by the number of days in the most recent six-month period, then divided by the number of days in the most recent 12-month period.
22
Note that the expenses shown in the table are meant to highlight and help you compare ongoing costs only and do not reflect transaction costs incurred by the fund for buying and selling securities. Further, the expenses do not include the 1% fee on redemptions of shares held for less than one year, nor do they include any account service fee described in the prospectus. If such fees were applied to your account, your costs would be higher. Your fund does not carry a “sales load.”
The calculations assume no shares were bought or sold during the period. Your actual costs may have been higher or lower, depending on the amount of your investment and the timing of any purchases or redemptions.
You can find more information about the fund’s expenses, including annual expense ratios, in the Financial Statements section of this report. For additional information on operating expenses and other shareholder costs, please refer to your fund’s current prospectus.
23
Glossary
Beta. A measure of the magnitude of a fund’s past share-price fluctuations in relation to the ups and downs of a given market index. The index is assigned a beta of 1.00. Compared with a given index, a fund with a beta of 1.20 typically would have seen its share price rise or fall by 12% when the index rose or fell by 10%. A fund’s beta should be reviewed in conjunction with its R-squared (see definition below). The lower the R-squared, the less correlation there is between the fund and the index, and the less reliable beta is as an indicator of volatility.
Earnings Growth Rate. The average annual rate of growth in earnings over the past five years for the stocks now in a fund.
Expense Ratio. The percentage of a fund’s average net assets used to pay its annual administrative and advisory expenses. These expenses directly reduce returns to investors.
Foreign Holdings. The percentage of a fund represented by stocks or depositary receipts of companies based outside the United States.
Inception Date. The date on which the assets of a fund (or one of its share classes) are first invested in accordance with the fund’s investment objective. For funds with a subscription period, the inception date is the day after that period ends. Investment performance is measured from the inception date.
Median Market Cap. An indicator of the size of companies in which a fund invests; the midpoint of market capitalization (market price x shares outstanding) of a fund’s stocks, weighted by the proportion of the fund’s assets invested in each stock. Stocks representing half of the fund’s assets have market capitalizations above the median, and the rest are below it.
Price/Book Ratio. The share price of a stock divided by its net worth, or book value, per share. For a fund, the weighted average price/book ratio of the stocks it holds.
Price/Earnings Ratio. The ratio of a stock’s current price to its per-share earnings over the past year. For a fund, the weighted average P/E of the stocks it holds. P/E is an indicator of market expectations about corporate prospects; the higher the P/E, the greater the expectations for a company’s future growth.
R-Squared. A measure of how much of a fund’s past returns can be explained by the returns from the market in general, as measured by a given index. If a fund’s total returns were precisely synchronized with an index’s returns, its R-squared would be 1.00. If the fund’s returns bore no relationship to the index’s returns, its R-squared would be 0.
Return on Equity. The annual average rate of return generated by a company during the past five years for each dollar of shareholder’s equity (net income divided by shareholder’s equity). For a fund, the weighted average return on equity for the companies whose stocks it holds.
Short-Term Reserves. The percentage of a fund invested in highly liquid, short-term securities that can be readily converted to cash.
Turnover Rate. An indication of the fund’s trading activity. Funds with high turnover rates incur higher transaction costs and may be more likely to distribute capital gains (which may be taxable to investors). The turnover rate excludes in-kind transactions, which have minimal impact on costs.
Yield. A snapshot of the level of dividends, interest, capital gains distributions, and return-of-capital distributions received by the fund. The index yield is based on the current annualized rate of dividends and other distributions provided by securities in the index.
24
This page intentionally left blank.
This page intentionally left blank.
Trustees Approve Advisory Arrangement
The board of trustees of Vanguard REIT Index Fund has renewed the fund’s investment advisory arrangement with The Vanguard Group, Inc. Vanguard—through its Quantitative Equity Group—serves as the investment advisor to the fund. The board determined that continuing the fund’s internalized management structure was in the best interests of the fund and its shareholders.
The board based its decision upon an evaluation of the advisor’s investment staff, portfolio management process, and performance. The trustees considered the factors discussed below, among others. However, no single factor determined whether the board approved the arrangement. Rather, it was the totality of the circumstances that drove the board’s decision.
Nature, extent, and quality of services
The board considered the quality of the fund’s investment management over both the short and long term, and took into account the organizational depth and stability of the advisor. Vanguard has been managing investments for more than two decades. George U. Sauter, Vanguard managing director and chief investment officer, has been in the investment management business since 1985. Mr. Sauter has led the Quantitative Equity Group since 1987. The Quantitative Equity Group adheres to a sound, disciplined investment management process; the team has considerable experience, stability, and depth.
The board concluded that Vanguard’s experience, stability, depth, and performance, among other factors, warranted continuation of the advisory arrangement.
Investment performance
The board considered the short- and long-term performance of the fund, including any periods of outperformance or underperformance of its target benchmark and peer group. The board concluded that the fund has performed in line with expectations, and that its results have been consistent with its investment strategy. Information about the fund’s most recent performance can be found in the Performance Summary section of this report.
Cost
The board concluded that the fund’s expense ratio was far below the average expense ratio charged by funds in its peer group. The board noted that the fund’s advisory expense ratio was also well below its peer-group average. Information about the fund’s expense ratio appears in the About Your Fund’s Expenses section of this report as well as in the Financial Statements section.
The board does not conduct a profitability analysis of Vanguard because of Vanguard’s unique “at-cost” structure. Unlike most other mutual fund management companies, Vanguard is owned by the funds it oversees, and produces “profits” only in the form of reduced expenses for fund shareholders.
The benefit of economies of scale
The board concluded that the fund’s low-cost arrangement with Vanguard ensures that the fund will realize economies of scale as it grows, with the cost to shareholders declining as fund assets increase.
The board will consider whether to renew the advisory arrangement again after a one-year period.
JoAnn Heffernan Heisen | |
Born 1950 | Principal Occupation(s) During the Past Five Years: Corporate Vice |
Trustee since July 1998 | President and Chief Global Diversity Officer since 2006, Vice President |
147 Vanguard Funds Overseen | and Chief Information Officer (1997–2005), and Member of the Executive |
| Committee of Johnson &Johnson (pharmaceuticals/consumer products); |
| Director of the University Medical Center at Princeton and Women’s |
| Research and Education Institute. |
André F. Perold | |
Born 1952 | Principal Occupation(s) During the Past Five Years: George Gund |
Trustee since December 2004 | Professor of Finance and Banking, Harvard Business School; Senior |
147 Vanguard Funds Overseen | Associate Dean, Director of Faculty Recruiting, and Chair of Finance Faculty, Harvard Business School; Director and Chairman |
| of UNX, Inc. (equities trading firm) since 2003; Chair of the Investment |
| Committee of HighVista Strategies LLC (private investment firm) since |
| 2005. |
Alfred M. Rankin, Jr. | |
Born 1941 | Principal Occupation(s) During the Past Five Years: Chairman, |
Trustee since January 1993 | President, Chief Executive Officer, and Director of NACCO Industries, |
147 Vanguard Funds Overseen | Inc. (forklift trucks/housewares/lignite); Director of Goodrich Corporation |
| (industrial products/aircraft systems and services). |
| |
J. Lawrence Wilson | |
Born 1936 | Principal Occupation(s) During the Past Five Years: Retired Chairman |
Trustee since April 1985 | and Chief Executive Officer of Rohm and Haas Co. (chemicals); Director |
147 Vanguard Funds Overseen | of Cummins Inc. (diesel engines) and AmerisourceBergen Corp. |
| (pharmaceutical distribution); Trustee of Vanderbilt University and of |
| Culver Educational Foundation. |
Executive Officers1 | |
| |
Thomas J. Higgins | |
Born 1957 | Principal Occupation(s) During the Past Five Years: Principal of The |
Treasurer since July 1998 | Vanguard Group, Inc.;Treasurer of each of the investment companies |
147 Vanguard Funds Overseen | served by The Vanguard Group. |
| |
| |
Heidi Stam | |
Born 1956 | Principal Occupation(s) During the Past Five Years: Managing Director of |
Secretary since July 2005 | The Vanguard Group, Inc., since 2006; General Counsel of The |
147 Vanguard Funds Overseen | Vanguard Group since 2005; Secretary of The Vanguard Group, and of |
| each of the investment companies served by The Vanguard |
| Group, since 2005; Principal of The Vanguard Group (1997–2006). |
Vanguard Senior Management Team | | |
| | | |
R. Gregory Barton | Kathleen C. Gubanich | F. William McNabb, III | Ralph K. Packard |
Mortimer J. Buckley | Paul A. Heller | Michael S. Miller | George U. Sauter |
Founder |
|
John C. Bogle |
Chairman and Chief Executive Officer, 1974–1996 |
1Officers of the funds are “interested persons” as defined in the Investment Company Act of 1940.
2December 2002 for Vanguard Equity Income Fund, Vanguard Growth Equity Fund, the Vanguard Municipal Bond Funds, and the Vanguard State Tax-Exempt Funds.
More information about the trustees is in the Statement of Additional Information, available from The Vanguard Group.
The People Who Govern Your Fund
The trustees of your mutual fund are there to see that the fund is operated and managed in your best interests since, as a shareholder, you are a part owner of the fund. Your fund’s trustees also serve on the board of directors of The Vanguard Group, Inc., which is owned by the Vanguard funds and provides services to them on an at-cost basis.
A majority of Vanguard’s board members are independent, meaning that they have no affiliation with Vanguard or the funds they oversee, apart from the sizable personal investments they have made as private individuals.
Our independent board members bring distinguished backgrounds in business, academia, and public service to their task of working with Vanguard officers to establish the policies and oversee the activities of the funds. Among board members’ responsibilities are selecting investment advisors for the funds; monitoring fund operations, performance, and costs; reviewing contracts; nominating and selecting new trustees/directors; and electing Vanguard officers.
Each trustee serves a fund until its termination; or until the trustee’s retirement, resignation, or death; or otherwise as specified in the fund’s organizational documents. Any trustee may be removed at a shareholders’ meeting by a vote representing two-thirds of the net asset value of all shares of the fund together with shares of other Vanguard funds organized within the same trust. The table on these two pages shows information for each trustee and executive officer of the fund. The mailing address of the trustees and officers is P.O. Box 876, Valley Forge, PA 19482.
Chairman of the Board, Chief Executive Officer, and Trustee |
| |
John J. Brennan1 | |
Born 1954 | Principal Occupation(s) During the Past Five Years: Chairman of the |
Trustee since May 1987; | Board, Chief Executive Officer, and Director/Trustee of The Vanguard |
Chairman of the Board and | Group, Inc., and of each of the investment companies served by The |
Chief Executive Officer | Vanguard Group. |
147 Vanguard Funds Overseen |
| |
Independent Trustees | |
| |
Charles D. Ellis | |
Born 1937 | Principal Occupation(s) During the Past Five Years: Applecore Partners |
Trustee since January 2001 | (pro bono ventures in education); Senior Advisor to Greenwich |
147 Vanguard Funds Overseen | Associates (international business strategy consulting); Successor |
| Trustee of Yale University; Overseer of the Stern School of Business at |
| New York University; Trustee of the Whitehead Institute for Biomedical |
| Research. |
Rajiv L. Gupta | |
Born 1945 | Principal Occupation(s) During the Past Five Years: Chairman, |
Trustee since December 20012 | President, and Chief Executive Officer of Rohm and Haas Co. |
147 Vanguard Funds Overseen | (chemicals); Board Member of the American Chemistry Council; Director |
| of Tyco International, Ltd. (diversified manufacturing and services) since |
| 2005; Trustee of Drexel University and of the Chemical Heritage |
| Foundation. |
Amy Gutmann | |
Born 1949 | Principal Occupation(s) During the Past Five Years: President of the |
Trustee since June 2006 | University of Pennsylvania since 2004; Professor in the School of Arts |
147 Vanguard Funds Overseen | and Sciences, Annenberg School for Communication, and Graduate |
| School of Education of the University of Pennsylvania since 2004; Provost (2001–2004) and Laurance S. Rockefeller Professor of Politics |
| and the University Center for Human Values (1990–2004), Princeton |
| University; Director of Carnegie Corporation of New York since 2005 and |
| of Schuylkill River Development Corporation and Greater Philadelphia |
| Chamber of Commerce since 2004. |

P.O. Box 2600
Valley Forge, PA 19482-2600
Connect with Vanguard® > www.vanguard.com
Fund Information > 800-662-7447 | Vanguard, Admiral, Signal, Connect with Vanguard, and |
| the ship logo are trademarks of |
Direct Investor Account Services > 800-662-2739 | The Vanguard Group, Inc. |
| |
Institutional Investor Services > 800-523-1036 | |
| All other marks are the exclusive property of their |
Text Telephone for People | respective owners. |
With Hearing Impairment > 800-952-3335 | |
| All comparative mutual fund data are from Lipper Inc. |
| or Morningstar, Inc., unless otherwise noted. |
| |
| |
This material may be used in conjunction | |
| You can obtain a free copy of Vanguard’s proxy voting |
with the offering of shares of any Vanguard | guidelines by visiting our website, www.vanguard.com, |
| and searching for “proxy voting guidelines,” or by calling |
fund only if preceded or accompanied by | Vanguard at 800-662-2739. They are also available from |
the fund’s current prospectus. | the SEC’s website, www.sec.gov. In addition, you may |
| obtain a free report on how your fund voted the proxies |
The funds or securities referred to herein are not | for securities it owned during the 12 months ended June |
sponsored, endorsed, or promoted by MSCI, and | 30. To get the report, visit either www.vanguard.com |
MSCI bears no liability with respect to any such funds | or www.sec.gov. |
or securities. For any such funds or securities, the | |
prospectus or the Statement of Additional Information | |
contains a more detailed description of the limited | |
relationship MSCI has with The Vanguard Group and | |
any related funds. | You can review and copy information about your fund |
| at the SEC’s Public Reference Room in Washington, |
| D.C.To find out more about this public service, call the |
| SEC at 202-551-8090. Information about your fund is |
| also available on the SEC’s website, and you can |
| receive copies of this information, for a fee, by sending a |
| request in either of two ways: via e-mail addressed to |
| publicinfo@sec.gov or via regular mail addressed to the |
| Public Reference Section, Securities and Exchange |
| Commission, Washington, DC 20549-0102. |
| |
| |
| |
| © 2007 The Vanguard Group, Inc. |
| All rights reserved. |
| Vanguard Marketing Corporation, Distributor. |
| |
| Q1232 092007 |
|
|
Vanguard® Dividend Growth Fund |
|
|
> Semiannual Report |
|
|
|
|
|
July 31, 2007 |
|
|
> | For the six months ended July 31, 2007, Vanguard Dividend Growth Fund |
| returned 3.1%. |
| |
| |
> | During the period, the fund outpaced both the return of its benchmark index |
| and the average return of its peer group of funds. |
| |
| |
> | The strong performances of the fund’s holdings in the energy, industrials, |
| and information technology sectors helped boost its return. |
Contents | |
| |
Your Fund’s Total Returns | 1 |
Chairman’s Letter | 2 |
Advisor’s Report | 6 |
Fund Profile | 8 |
Performance Summary | 9 |
Financial Statements | 10 |
About Your Fund’s Expenses | 18 |
Trustees Approve Advisory Agreement | 20 |
Glossary | 21 |
Please note: The opinions expressed in this report are just that—informed opinions. They should not be considered promises or advice. Also, please keep in mind that the information and opinions cover the period through the date on the cover of this report. Of course, the risks of investing in your fund are spelled out in the prospectus.
Your Fund’s Total Returns
Six Months Ended July 31, 2007 | | |
| Ticker | Total |
| Symbol | Returns |
Vanguard Dividend Growth Fund | VDIGX | 3.1% |
Russell 1000 Index | | 1.9 |
Average Large-Cap Core Fund1 | | 2.1 |
Dow Jones Wilshire 5000 Index | | 1.9 |
Your Fund’s Performance at a Glance | | | | |
January 31, 2007–July 31, 2007 | | | | |
| | | Distributions Per Share |
| Starting | Ending | Income | Capital |
| Share Price | Share Price | Dividends | Gains |
Vanguard Dividend Growth Fund | $14.74 | $15.06 | $0.140 | $0.000 |
1 Derived from data provided by Lipper Inc.
1

Chairman’s Letter
Dear Shareholder,
Vanguard Dividend Growth Fund returned 3.1% for the six months ended July 31, 2007, outpacing the return of both the fund’s primary benchmark, the Russell 1000 Index, and the average return of large-cap core mutual funds. The fund’s concentration on dividend-paying stocks paid off during the period, with especially strong returns from a number of the fund’s top-ten holdings, primarily in the energy sector.
For the U.S. stock market, a nervous finish to the half-year
U.S. stocks produced modest returns for the past six months, as a downturn at the end of the period erased most of the gains recorded earlier. The market stumbled as trouble with low-quality mortgage loans and related securities amplified investors’ risk-aversion.
The broad U.S. stock market returned 1.9% for the fiscal half-year. Large-capitalization stocks bested small-caps, and growth-oriented stocks outperformed their value-oriented counterparts. International stock markets sidestepped most of the U.S. turmoil, generating excellent six-month returns.
For bonds, a return to a more typical yield curve
As investors sought a safe haven from some of the financial markets’ riskier precincts, including bonds backed by mortgage loans made to borrowers with poor credit ratings, U.S. Treasury bond prices rose slightly and yields fell. The declines in yield were most pronounced among Treasury securities with maturities of less than 5 years.
These interest rate dynamics helped restore the yield curve—which illustrates the relationship between short- and long-term bond yields—to its typical, upward-sloping pattern. At the start of the period, the curve had been mildly inverted. The broad taxable bond market returned 1.9% for the half-year. Tax-exempt municipal securities returned a bit less.
Energy stocks led the way in boosting your fund’s performance
Like many income-oriented portfolios, the Dividend Growth Fund focuses primarily on the stocks of large, high-quality, dividend-paying companies. However, Wellington Management Company, LLP, your fund’s advisor, adds to this basic strategy its own unique touch: Wellington is less concerned with what a company’s dividend is now than with what it is likely to be in the future. Accordingly, Wellington seeks to identify companies that will increase their earnings over time and that are likely to raise their payouts.
During the past six months, that strategy was rewarded with positive returns from the energy, industrials, and information technology sectors. In particular, energy
2
Market Barometer | | | |
| | | Total Returns |
| | Periods Ended July 31, 2007 |
| Six Months | One Year | Five Years1 |
Stocks | | | |
Russell 1000 Index (Large-caps) | 1.9% | 16.5% | 12.3% |
Russell 2000 Index (Small-caps) | –2.5 | 12.1 | 16.0 |
Dow Jones Wilshire 5000 Index (Entire market) | 1.9 | 16.8 | 13.1 |
MSCI All Country World Index ex USA (International) | 11.8 | 28.5 | 22.3 |
| | | |
| | | |
Bonds | | | |
Lehman U.S. Aggregate Bond Index (Broad taxable market) | 1.9% | 5.6% | 4.4% |
Lehman Municipal Bond Index | 1.2 | 4.3 | 4.5 |
Citigroup 3-Month Treasury Bill Index | 2.5 | 5.1 | 2.7 |
| | | |
| | | |
CPI | | | |
Consumer Price Index | 2.9% | 2.4% | 3.0% |
| | | | |
1 Annualized.
3
firms ConocoPhillips, Total SA, ExxonMobil, and Chevron all produced double-digit gains. These firms, all of which are among your fund’s largest holdings, made the largest contributions to the fund’s return.
That said, four of the fund’s other sectors—financials, consumer discretionary, consumer staples, and health care—produced negative returns during the period. The financials sector (–8%) was particularly hard hit, although given its much smaller weighting in the fund versus the index, the group’s performance took less of a toll on the fund than it did on the benchmark.
After spending its earlier years as a utility fund, Vanguard Dividend Growth Fund adopted its current dividend-growth strategy nearly five years ago; since its inception more than 15 years ago, the fund has benefited from the guidance of Wellington Management Company. Because the fund represents a relatively concentrated portfolio—at the end of the fiscal period, it contained fewer than 60 stocks—the fund’s strategy puts a high premium on Wellington Management’s skill at identifying attractive investment opportunities.
Diversification and balance are keys to a long-term strategy
As seasoned investors realize, there’s no way to know what will happen in the stock market tomorrow, much less next month or next year. What’s the best strategy to follow when the markets remain so unpredictable?
Annualized Expense Ratios1 | | |
Your fund compared with its peer group | | |
| | Average |
| | Large-Cap |
| Fund | Core Fund |
Dividend Growth Fund | 0.34% | 1.35% |
1 Fund expense ratio reflects the six months ended July 31, 2007. Peer-group expense ratio is derived from data provided by Lipper Inc. and captures information through year-end 2006.
4
As we often counsel, the best way to put together a long-term investment program is to select a diversified mix of stock, bond, and money market mutual funds that fits your goals, time horizon, and tolerance for risk. A balanced portfolio is unlikely to deliver the best (or the worst) short-term returns, but it can help you to reap the rewards of the markets’ best-performing assets while muting the impact of the worst-performing ones.
Vanguard Dividend Growth Fund, with its low costs and its focus on companies that are likely to increase their dividends in the years ahead, can be a valuable part of just such a diversified, long-term investment program.
Thank you for investing with Vanguard.
Sincerely,

John J. Brennan
Chairman and Chief Executive Officer
August 14, 2007
5
Advisor’s Report
Vanguard Dividend Growth Fund advanced 3.1% for the six-month period ended July 31, 2007. This performance compared favorably with the 1.9% return of the Russell 1000 Index and the 2.1% average return for large-cap core funds.
The investment environment
Uncertainty in global credit markets, particularly in the U.S. mortgage sector toward the end of the fiscal period, has been the root cause of unprecedented volatility in equity markets over the half-year. A repricing of risk, and the resulting loss of liquidity in the financial marketplace, has had a meaningful impact on global equity markets. Widening credit spreads also have had a dampening effect on the heretofore robust takeover environment. It remains to be seen how this extreme volatility will resolve itself, but it is certain that great investment opportunities will emerge.
The fund’s successes
The fund’s below-average weighting in financials was the main reason it outperformed its benchmark during the period. Financial stocks have performed poorly of late. Although Dividend Growth has not been immune from this trend, the impact on the fund has been quite modest. The fund’s holdings in the energy sector also contributed meaningfully to performance during the period; the top four contributors were ConocoPhillips, Total SA, ExxonMobil, and Chevron. Schering-Plough and NIKE were also strong contributors.
At the end of the period, all but a few companies held in the fund had announced dividend increases. For those companies who have yet to boost their payment, our expectation is that they will do so in the second half of the year. We remain confident that the average dividend increase for 2007 over last year will be substantial.
The fund’s shortfalls
A number of individual stocks detracted from the fund’s performance during the past six months. Among the more noteworthy was H&R Block, a relatively new position in the fund, whose share price has been hurt by continued worries in the mortgage sector. The company is in negotiations to sell its Option One mortgage operation, and we remain hopeful that such a transaction will occur in short order. Beyond that, we believe the company’s core tax business is set to regain traction, which should help accelerate dividend growth going forward.
The fund’s positioning and investment strategy
Our primary objective is to identify companies that we believe will steadily and reliably increase their dividend payments. We fulfill this objective by carefully
6
building the portfolio one stock at a time, giving central consideration to each company’s dividend growth prospects. Our industry weightings are a by-product of this process. The fund continues to have significant positions in health care, industrials, and both consumer sectors, while having less exposure to the utilities, telecommunication services, and materials sectors.
Donald J. Kilbride
Vice President and Portfolio Manager
Wellington Management Company, LLP
August 17, 2007
7
Fund Profile
As of July 31, 2007
Portfolio Characteristics | | |
| Comparative | Broad |
| Fund | Index1 | Index2 |
Number of Stocks | 56 | 1,017 | 4,902 |
Median Market Cap | $65.4B | $39.3B | $32.9B |
Price/Earnings Ratio | 15.4x | 16.9x | 17.4x |
Price/Book Ratio | 3.2x | 2.8x | 2.7x |
Yield | 1.9% | 1.8% | 1.8% |
Return on Equity | 22.9% | 19.1% | 18.4% |
Earnings Growth Rate | 16.5% | 21.1% | 21.0% |
Foreign Holdings | 6.9% | 0.0% | 0.0% |
Turnover Rate | 35%3 | — | — |
Expense Ratio | 0.34%3 | — | — |
Short-Term Reserves | 1% | — | — |
| | | | |
Sector Diversification (% of portfolio) | |
| Comparative | Broad |
| Fund | Index1 | Index2 |
Consumer Discretionary | 13% | 11% | 11% |
Consumer Staples | 14 | 9 | 8 |
Energy | 13 | 11 | 11 |
Financials | 12 | 19 | 20 |
Health Care | 15 | 11 | 11 |
Industrials | 16 | 12 | 12 |
Information Technology | 12 | 16 | 16 |
Materials | 2 | 3 | 4 |
Telecommunication | | | |
Services | 2 | 4 | 3 |
Utilities | 0 | 4 | 4 |
Short-Term Reserves | 1% | — | — |
Volatility Measures4 | |
| Fund Versus | Fund Versus |
| Comparative Index1 | Broad Index2 |
R-Squared | 0.88 | 0.82 |
Beta | 0.82 | 0.76 |
Ten Largest Holdings5(% of total net assets) |
| | |
ExxonMobil Corp. | integrated | |
| oil and gas | 4.1% |
Total SA ADR | integrated | |
| oil and gas | 3.4 |
Chevron Corp. | integrated | |
| oil and gas | 3.1 |
American International | multi-line | |
Group, Inc. | insurance | 2.7 |
Eli Lilly & Co. | pharmaceuticals | 2.5 |
General Electric Co. | industrial | |
| conglomerate | 2.5 |
Medtronic, Inc. | health care | |
| equipment | 2.5 |
Cardinal Health, Inc. | health care | |
| distributors | 2.5 |
Wal-Mart Stores, Inc. | hypermarkets | |
| and super centers | 2.5 |
Paychex, Inc. | data processing | |
| and outsourced | |
| services | 2.4 |
Top Ten | | 28.2% |
Investment Focus
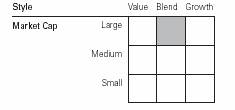
1 Russell 1000 Index.
2 Dow Jones Wilshire 5000 Index.
3 Annualized.
4 For an explanation of R-squared, beta, and other terms used here, see the Glossary on page 21.
5 “Ten Largest Holdings” excludes any temporary cash investments and equity index products.
8
Performance Summary
All of the returns in this report represent past performance, which is not a guarantee of future results that may be achieved by the fund. (Current performance may be lower or higher than the performance data cited. For performance data current to the most recent month-end, visit our website at www.vanguard.com/performance.) Note, too, that both investment returns and principal value can fluctuate widely, so an investor’s shares, when sold, could be worth more or less than their original cost. The returns shown do not reflect taxes that a shareholder would pay on fund distributions or on the sale of fund shares.
Fiscal-Year Total Returns (%): January 31, 1997–July 31, 2007
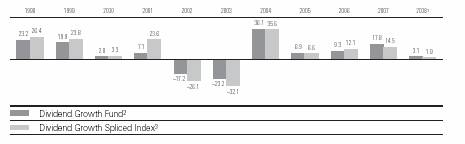
Average Annual Total Returns: Periods Ended June 30, 2007 | | |
This table presents average annual total returns through the latest calendar quarter—rather than through the |
end of the fiscal period. Securities and Exchange Commission rules require that we provide this information. |
| | | |
| Inception Date | One Year | Five Years | Ten Years |
Dividend Growth Fund4 | 5/15/1992 | 22.78% | 9.44% | 7.01% |
1 Six months ended July 31, 2007.
2 Prior to December 6, 2002, the fund was known as Utilities Income Fund.
3 Prior to December 6, 2002, the comparative benchmark was known as the Utilities Composite Index. The index weightings have been: 40% S&P Utilities Index, 40% S&P Telephone Index, and 20% Lehman Utillity Bond Index through April 30, 1999; 63.75% S&P Utilities Index, 21.25% S&P Telephone Index, and 15% Lehman Utility Bond Index through March 31, 2000; 75% S&P Utilities Index, 25% S&P Telephone Index through December 31, 2001; 75% S&P Utilities Index, 25% S&P Integrated Telecommunication Services Index through December 6, 2002; and Russell 1000 Index thereafter.
Note: See Financial Highlights table on page 14 for dividend and capital gains information.
4 Total returns do not include the account service fee that may be applicable to certain accounts with balances below $10,000.
9
Financial Statements (unaudited)
Statement of Net Assets
As of July 31, 2007
The fund provides a complete list of its holdings four times in each fiscal year, at the quarter-ends. For the second and fourth fiscal quarters, the lists appear in the fund’s semiannual and annual reports to shareholders. For the first and third fiscal quarters, the fund files the lists with the Securities and Exchange Commission on Form N-Q. Shareholders can look up the fund’s Forms N-Q on the SEC’s website at www.sec.gov. Forms N-Q may also be reviewed and copied at the SEC’s Public Reference Room (see the back cover of this report for further information).
| | Market |
| | Value• |
| Shares | ($000) |
Common Stocks (99.0%) | | |
Consumer Discretionary (13.1%) | |
NIKE, Inc. Class B | 493,100 | 27,835 |
Home Depot, Inc. | 655,800 | 24,376 |
Staples, Inc. | 936,800 | 21,565 |
Toyota Motor Corp. ADR | 154,400 | 18,625 |
McDonald’s Corp. | 387,900 | 18,569 |
CBS Corp. | 522,200 | 16,564 |
The Walt Disney Co. | 455,500 | 15,031 |
H & R Block, Inc. | 707,200 | 14,109 |
Carnival Corp. | 135,400 | 6,000 |
| | 162,674 |
Consumer Staples (14.3%) | | |
Wal-Mart Stores, Inc. | 660,900 | 30,368 |
PepsiCo, Inc. | 427,300 | 28,039 |
The Procter & Gamble Co. | 406,000 | 25,115 |
The Coca-Cola Co. | 363,800 | 18,958 |
Kimberly-Clark Corp. | 265,900 | 17,887 |
Anheuser-Busch Cos., Inc. | 323,100 | 15,758 |
Sysco Corp. | 482,200 | 15,373 |
Altria Group, Inc. | 194,900 | 12,955 |
General Mills, Inc. | 215,100 | 11,964 |
| | 176,417 |
Energy (13.0%) | | |
ExxonMobil Corp. | 596,100 | 50,746 |
Total SA ADR | 529,500 | 41,624 |
Chevron Corp. | 454,600 | 38,759 |
ConocoPhillips Co. | 370,300 | 29,935 |
| | 161,064 |
Financials (12.3%) | | |
American International | | |
Group, Inc. | 513,500 | 32,956 |
Bank of America Corp. | 468,100 | 22,197 |
Citigroup, Inc. | 457,300 | 21,296 |
Prudential Financial, Inc. | 233,600 | 20,704 |
State Street Corp. | 282,600 | 18,943 |
ACE Ltd. | 318,000 | 18,355 |
Countrywide Financial Corp. | 611,100 | 17,215 |
| | 151,666 |
| | | |
| | Market |
| | Value• |
| Shares | ($000) |
Health Care (15.3%) | | |
Eli Lilly & Co. | 581,700 | 31,464 |
Medtronic, Inc. | 617,200 | 31,274 |
Cardinal Health, Inc. | 462,800 | 30,420 |
Schering-Plough Corp. | 939,000 | 26,799 |
Wyeth | 409,300 | 19,859 |
Johnson & Johnson | 314,700 | 19,039 |
Abbott Laboratories | 365,200 | 18,512 |
AstraZeneca Group | | |
PLC ADR | 235,000 | 12,180 |
| | 189,547 |
Industrials (16.3%) | | |
General Electric Co. | 810,200 | 31,403 |
United Parcel Service, Inc. | 362,700 | 27,464 |
Caterpillar, Inc. | 284,000 | 22,379 |
General Dynamics Corp. | 237,800 | 18,682 |
Emerson Electric Co. | 393,200 | 18,508 |
Avery Dennison Corp. | 282,200 | 17,310 |
Illinois Tool Works, Inc. | 298,000 | 16,405 |
The Boeing Co. | 130,800 | 13,529 |
Lockheed Martin Corp. | 127,800 | 12,586 |
Honeywell International Inc. | 217,400 | 12,503 |
United Technologies Corp. | 159,400 | 11,631 |
| | 202,400 |
Information Technology (11.6%) | |
Paychex, Inc. | 724,500 | 29,980 |
Automatic Data | | |
Processing, Inc. | 631,700 | 29,324 |
International Business | | |
Machines Corp. | 218,300 | 24,155 |
Microsoft Corp. | 821,600 | 23,818 |
Linear Technology Corp. | 658,700 | 23,483 |
Nokia Corp. ADR | 452,000 | 12,945 |
| | 143,705 |
Materials (1.6%) | | |
Praxair, Inc. | 256,200 | 19,630 |
10
| | Market |
| | Value• |
| Shares | ($000) |
Telecommunication Services (1.5%) | |
AT&T Inc. | 467,500 | 18,307 |
Total Common Stocks | | |
(Cost $990,872) | | 1,225,410 |
| | |
| | |
| | | |
| Face | |
| Amount | |
| ($000) | |
Temporary Cash Investment (1.3%) | |
Repurchase Agreement | | |
Credit Suisse First | | |
Boston LLC 5.320%, | | |
8/1/07 (Dated 7/31/07, | | |
Repurchase Value | | |
$16,102,000, collateralized | | |
by Federal National | | |
Mortgage Assn., | | |
5.000%–6.000%, | | |
8/1/35–8/1/36) | | |
(Cost $16,100) | 16,100 | 16,100 |
Total Investments (100.3%) | | |
(Cost $1,006,972) | | 1,241,510 |
Other Assets and Liabilities (–0.3%) | |
Other Assets—Note C | | 2,703 |
Liabilities | | (6,155) |
| | (3,452) |
Net Assets (100%) | | |
Applicable to 82,223,700 outstanding | |
$.001 par value shares of beneficial | |
interest (unlimited authorization) | 1,238,058 |
Net Asset Value Per Share | | $15.06 |
| | | |
At July 31, 2007, net assets consisted of:1 | |
| Amount | Per |
| ($000) | Share |
Paid-in Capital | 992,709 | $12.08 |
Overdistributed Net | | |
Investment Income | (509) | (.01) |
Accumulated Net | | |
Realized Gains | 11,320 | .14 |
Unrealized Appreciation | 234,538 | 2.85 |
Net Assets | 1,238,058 | $15.06 |
• See Note A in Notes to Financial Statements.
1 See Note E in Notes to Financial Statements for the tax-basis components of net assets.
ADR—American Depositary Receipt.
11
Statement of Operations
| Six Months Ended |
| July 31, 2007 |
| ($000) |
Investment Income | |
Income | |
Dividends | 13,072 |
Interest | 364 |
Security Lending | 111 |
Total Income | 13,547 |
Expenses | |
Investment Advisory Fees—Note B | |
Basic Fee | 757 |
Performance Adjustment | 16 |
The Vanguard Group—Note C | |
Management and Administrative | 1,199 |
Marketing and Distribution | 105 |
Custodian Fees | 5 |
Shareholders’ Reports | 14 |
Trustees’ Fees and Expenses | 1 |
Total Expenses | 2,097 |
Expenses Paid Indirectly—Note D | (17) |
Net Expenses | 2,080 |
Net Investment Income | 11,467 |
Realized Net Gain (Loss) on Investment Securities Sold | 68,367 |
Change in Unrealized Appreciation (Depreciation) of Investment Securities | (41,221) |
Net Increase (Decrease) in Net Assets Resulting from Operations | 38,613 |
12
Statement of Changes in Net Assets
| Six Months Ended | Year Ended |
| July 31, | January 31, |
| 2007 | 2007 |
| ($000) | ($000) |
Increase (Decrease) in Net Assets | | |
Operations | | |
Net Investment Income | 11,467 | 20,657 |
Realized Net Gain (Loss) | 68,367 | 81,236 |
Change in Unrealized Appreciation (Depreciation) | (41,221) | 78,627 |
Net Increase (Decrease) in Net Assets Resulting from Operations | 38,613 | 180,520 |
Distributions | | |
Net Investment Income | (11,416) | (20,673) |
Realized Capital Gain | — | — |
Total Distributions | (11,416) | (20,673) |
Capital Share Transactions—Note G | | |
Issued | 94,005 | 221,674 |
Issued in Lieu of Cash Distributions | 9,888 | 17,716 |
Redeemed | (135,748) | (151,063) |
Net Increase (Decrease) from Capital Share Transactions | (31,855) | 88,327 |
Total Increase (Decrease) | (4,658) | 248,174 |
Net Assets | | |
Beginning of Period | 1,242,716 | 994,542 |
End of Period1 | 1,238,058 | 1,242,716 |
1 Net Assets—End of Period includes undistributed (overdistributed) net investment income of ($509,000) and ($560,000).
13
Financial Highlights
| Six | | | | | |
| Months | | | | | |
| Ended | | | | |
For a Share Outstanding | July 31, | | Year Ended January 31, |
Throughout Each Period | 2007 | 2007 | 2006 | 2005 | 2004 | 2003 |
Net Asset Value, Beginning of Period | $14.74 | $12.75 | $11.89 | $11.33 | $ 8.48 | $11.47 |
Investment Operations | | | | | | |
Net Investment Income | .14 | .26 | .22 | .231 | .18 | .37 |
Net Realized and Unrealized Gain | | | | | | |
(Loss) on Investments | .32 | 1.99 | .88 | .55 | 2.86 | (2.98) |
Total from Investment Operations | .46 | 2.25 | 1.10 | .78 | 3.04 | (2.61) |
Distributions | | | | | | |
Dividends from Net Investment Income | (.14) | (.26) | (.24) | (.22) | (.19) | (.38) |
Distributions from Realized Capital Gains | — | — | — | — | — | — |
Total Distributions | (.14) | (.26) | (.24) | (.22) | (.19) | (.38) |
Net Asset Value, End of Period | $15.06 | $14.74 | $12.75 | $11.89 | $11.33 | $ 8.48 |
| | | | | | |
| | | | | | |
Total Return2 | 3.10% | 17.84% | 9.34% | 6.92% | 36.08% | –23.22% |
| | | | | | |
| | | | | | |
Ratios/Supplemental Data | | | | | | |
Net Assets, End of Period (Millions) | $1,238 | $1,243 | $995 | $965 | $818 | $550 |
Ratio of Total Expenses to | | | | | | |
Average Net Assets | 0.34%3,* | 0.38%3 | 0.37%3 | 0.37%3 | 0.40% | 0.34% |
Ratio of Net Investment Income to | | | | | | |
Average Net Assets | 1.83%* | 1.93% | 1.85% | 2.04%1 | 1.84% | 3.57% |
Portfolio Turnover Rate | 35%* | 41% | 16% | 20% | 23% | 104%4 |
| | | | | | | | | |
1 Net investment income per share and the ratio of net investment income to average net assets include $.03 and 0.28%, respectively, resulting from a special dividend from Microsoft Corp. in November 2004.
2 Total returns do not include the account service fee that may be applicable to certain accounts with balances below $10,000.
3 Includes performance-based investment advisory fee increases (decreases) of 0.00%, 0.01%, 0.01%, and 0.01%.
4 Includes activity related to a change in the fund’s investment objective.
* Annualized.
See accompanying Notes, which are an integral part of the Financial Statements.
14
Notes to Financial Statements
Vanguard Dividend Growth Fund is registered under the Investment Company Act of 1940 as an open-end investment company, or mutual fund. The fund files reports with the SEC under the company name Vanguard Specialized Funds.
A. The following significant accounting policies conform to generally accepted accounting principles for U.S. mutual funds. The fund consistently follows such policies in preparing its financial statements.
1. Security Valuation: Securities are valued as of the close of trading on the New York Stock Exchange (generally 4 p.m., Eastern time) on the valuation date. Equity securities are valued at the latest quoted sales prices or official closing prices taken from the primary market in which each security trades; such securities not traded on the valuation date are valued at the mean of the latest quoted bid and asked prices. Securities for which market quotations are not readily available, or whose values have been materially affected by events occurring before the fund’s pricing time but after the close of the securities’ primary markets, are valued by methods deemed by the board of trustees to represent fair value. Temporary cash investments acquired over 60 days to maturity are valued using the latest bid prices or using valuations based on a matrix system (which considers such factors as security prices, yields, maturities, and ratings), both as furnished by independent pricing services. Other temporary cash investments are valued at amortized cost, which approximates market value.
2. Repurchase Agreements: The fund may invest in repurchase agreements. Securities pledged as collateral for repurchase agreements are held by a custodian bank until the agreements mature. Each agreement requires that the market value of the collateral be sufficient to cover payments of interest and principal; however, in the event of default or bankruptcy by the other party to the agreement, retention of the collateral may be subject to legal proceedings.
3. Federal Income Taxes: The fund intends to continue to qualify as a regulated investment company and distribute all of its taxable income. Accordingly, no provision for federal income taxes is required in the financial statements.
4. Distributions: Distributions to shareholders are recorded on the ex-dividend date.
5. Security Lending: The fund may lend its securities to qualified institutional borrowers to earn additional income. Security loans are required to be secured at all times by collateral at least equal to the market value of securities loaned. The fund invests cash collateral received in Vanguard Market Liquidity Fund, and records a liability for the return of the collateral, during the period the securities are on loan. Security lending income represents the income earned on investing cash collateral, less expenses associated with the loan.
6. Other: Dividend income is recorded on the ex-dividend date. Interest income is accrued daily. Security transactions are accounted for on the date securities are bought or sold. Costs used to determine realized gains (losses) on the sale of investment securities are those of the specific securities sold.
15
B. Wellington Management Company, LLP, provides investment advisory services to the fund for a fee calculated at an annual percentage rate of average net assets. The basic fee is subject to quarterly adjustments based on the fund’s performance for the preceding three years relative to the Russell 1000 Index. For the six months ended July 31, 2007, the investment advisory fee represented an effective annual basic rate of 0.12% of the fund’s average net assets before an increase of $16,000 based on performance.
C. The Vanguard Group furnishes at cost corporate management, administrative, marketing, and distribution services. The costs of such services are allocated to the fund under methods approved by the board of trustees. The fund has committed to provide up to 0.40% of its net assets in capital contributions to Vanguard. At July 31, 2007, the fund had contributed capital of $111,000 to Vanguard (included in Other Assets), representing 0.01% of the fund’s net assets and 0.11% of Vanguard’s capitalization. The fund’s trustees and officers are also directors and officers of Vanguard.
D. The fund has asked its investment advisor to direct certain security trades, subject to obtaining the best price and execution, to brokers who have agreed to rebate to the fund part of the commissions generated. Such rebates are used solely to reduce the fund’s management and administrative expenses. The fund’s custodian bank has also agreed to reduce its fees when the fund maintains cash on deposit in the non-interest-bearing custody account. For the six months ended July 31, 2007, these arrangements reduced the fund’s management and administrative expenses by $12,000 and custodian fees by $5,000.
E. Distributions are determined on a tax basis and may differ from net investment income and realized capital gains for financial reporting purposes. Differences may be permanent or temporary. Permanent differences are reclassified among capital accounts in the financial statements to reflect their tax character. Temporary differences arise when certain items of income, expense, gain, or loss are recognized in different periods for financial statement and tax purposes; these differences will reverse at some time in the future. Differences in classification may also result from the treatment of short-term gains as ordinary income for tax purposes.
The fund’s tax-basis capital gains and losses are determined only at the end of each fiscal year. For tax purposes, at January 31, 2007, the fund had available realized losses of $56,731,000 to offset future net capital gains through January 31, 2012. The fund will use these capital losses to offset net taxable capital gains, if any, realized during the year ending January 31, 2008; should the fund realize net capital losses for the year, the losses will be added to the loss carry-forward balance above.
At July 31, 2007, the cost of investment securities for tax purposes was $1,006,972,000. Net unrealized appreciation of investment securities for tax purposes was $234,538,000, consisting of unrealized gains of $252,155,000 on securities that had risen in value since their purchase and $17,617,000 in unrealized losses on securities that had fallen in value since their purchase.
F. During the six months ended July 31, 2007, the fund purchased $218,692,000 of investment securities and sold $241,181,000 of investment securities other than temporary cash investments.
16
G. Capital shares issued and redeemed were:
| Six Months Ended | Year Ended |
| July 31, 2007 | January 31, 2007 |
| Shares | Shares |
| (000) | (000) |
Issued | 6,211 | 16,265 |
Issued in Lieu of Cash Distributions | 645 | 1,305 |
Redeemed | (8,957) | (11,242) |
Net Increase (Decrease) in Shares Outstanding | (2,101) | 6,328 |
H. In June 2006, the Financial Accounting Standards Board issued Interpretation No. 48 (“FIN 48”), “Accounting for Uncertainty in Income Taxes.” FIN 48 establishes the minimum threshold for recognizing, and a system for measuring, the benefits of tax-return positions in financial statements, effective for the fund’s current fiscal year. Management has analyzed the fund’s tax positions taken on federal income tax returns for all open tax years (tax years ended January 31, 2005–2007) for purposes of implementing FIN 48, and has concluded that no provision for income tax is required in the fund’s financial statements.
17
About Your Fund’s Expenses
As a shareholder of the fund, you incur ongoing costs, which include costs for portfolio management, administrative services, and shareholder reports (like this one), among others. Operating expenses, which are deducted from a fund’s gross income, directly reduce the investment return of the fund.
A fund’s expenses are expressed as a percentage of its average net assets. This figure is known as the expense ratio. The following examples are intended to help you understand the ongoing costs (in dollars) of investing in your fund and to compare these costs with those of other mutual funds. The examples are based on an investment of $1,000 made at the beginning of the period shown and held for the entire period.
The table below illustrates your fund’s costs in two ways:
• Based on actual fund return. This section helps you to estimate the actual expenses that you paid over the period. The “Ending Account Value” shown is derived from the fund’s actual return, and the third column shows the dollar amount that would have been paid by an investor who started with $1,000 in the fund. You may use the information here, together with the amount you invested, to estimate the expenses that you paid over the period.
To do so, simply divide your account value by $1,000 (for example, an $8,600 account value divided by $1,000 = 8.6), then multiply the result by the number given for your fund under the heading “Expenses Paid During Period.”
• Based on hypothetical 5% yearly return. This section is intended to help you compare your fund’s costs with those of other mutual funds. It assumes that the fund had a yearly return of 5% before expenses, but that the expense ratio is unchanged. In this case—because the return used is not the fund’s actual return—the results do not apply to your investment. The example is useful in making comparisons because the Securities and Exchange Commission requires all mutual funds to calculate expenses based on a 5% return. You can assess your fund’s costs by comparing this hypothetical example with the hypothetical examples that appear in shareholder reports of other funds.
Six Months Ended July 31, 2007 | | | |
| Beginning | Ending | Expenses |
| Account Value | Account Value | Paid During |
Dividend Growth Fund | 1/31/2007 | 7/31/2007 | Period1 |
Based on Actual Fund Return | $1,000.00 | $1,031.04 | $1.71 |
Based on Hypothetical 5% Yearly Return | 1,000.00 | 1,023.11 | 1.71 |
Note that the expenses shown in the table are meant to highlight and help you compare ongoing costs only and do not reflect transaction costs incurred by the fund for buying and selling securities. Further, the expenses do not include any account service fee described in the prospectus. If such a fee were applied to your account, your costs would be higher. Your fund does not charge transaction fees, such as purchase or redemption fees, nor does it carry a “sales load.”
1 These calculations are based on expenses incurred in the most recent six-month period. The fund’s annualized six-month expense ratio for that period is 0.34%. The dollar amounts shown as “Expenses Paid” are equal to the annualized expense ratio multiplied by the average account value over the period, multiplied by the number of days in the most recent six-month peiod, then divided by the number of days in the most recent 12-month period.
18
The calculations assume no shares were bought or sold during the period. Your actual costs may have been higher or lower, depending on the amount of your investment and the timing of any purchases or redemptions.
You can find more information about the fund’s expenses, including annual expense ratios, in the Financial Statements section of this report. For additional information on operating expenses and other shareholder costs, please refer to your fund’s current prospectus.
19
Trustees Approve Advisory Agreement
The board of trustees of Vanguard Dividend Growth Fund has renewed the fund’s investment advisory agreement with Wellington Management Company, LLP. The board determined that the retention of Wellington Management was in the best interests of the fund and its shareholders.
The board approved a change to the asset-based advisory fee and performance adjustment schedules. The revised base fee schedule will have no current impact on the fund’s advisory fees. The performance adjustment schedule will now be based on a “linear” rather than a “step” approach. The board concluded that linear adjustments better align the interests of an advisor with those of the fund shareholders, because the advisor’s compensation is more closely linked to the fund’s performance.
The board based its decisions upon an evaluation of Wellington Management’s investment staff, portfolio management process, and performance. The trustees considered the factors discussed below, among others. However, no single factor determined whether the board approved the agreement. Rather, it was the totality of the circumstances that drove the board’s decision.
Nature, extent, and quality of services
The board considered the quality of the fund’s investment management over both the short and long term, and took into account the organizational depth and stability of the advisor. The board noted that Wellington Management, founded in 1928, is among the nation’s oldest and most respected institutional managers. The firm has advised the fund since the fund’s inception in 1992. Donald J. Kilbride, who manages the fund, has nearly two decades of industry experience. The portfolio manager is backed by a well-tenured team of research analysts who conduct detailed fundamental analysis of their respective industries and companies. Wellington Management has provided high-quality advisory services for the fund.
The board concluded that Wellington Management’s experience, stability, depth, and performance, among other factors, warranted continuation of the advisory agreement.
Investment performance
The board considered the short- and long-term performance of the fund, including any periods of outperformance or underperformance of a relevant benchmark and peer group. The board noted that the fund’s reconstituted dividend growth mandate began in 2002, so long-term performance comparisons are not meaningful. The board also noted that the fund’s short-term performance and since-2002 performance have been competitive versus its benchmark, the Russell 1000 Index, and its peer group. Information about the fund’s most recent performance can be found in the Performance Summary section of this report.
Cost
The board concluded that the fund’s expense ratio was far below the average expense ratio charged by funds in its peer group. The board noted that the fund’s advisory fee rate was also well below the peer-group average. Information about the fund’s expense ratio appears in the About Your Fund’s Expenses section of this report as well as in the Financial Statements section, which also includes information about the advisory fee rate.
The board did not consider profitability of Wellington Management in determining whether to approve the advisory fee, because Wellington Management is independent of Vanguard, and the advisory fee is the result of arm’s-length negotiations.
The benefit of economies of scale
The board concluded that the fund’s shareholders benefit from economies of scale because of breakpoints in the fund’s advisory fee schedule. The breakpoints reduce the effective rate of the fee as the fund’s assets increase.
The board will consider whether to renew the advisory agreement again after a one-year period.
20
Glossary
Beta. A measure of the magnitude of a fund’s past share-price fluctuations in relation to the ups and downs of a given market index. The index is assigned a beta of 1.00. Compared with a given index, a fund with a beta of 1.20 typically would have seen its share price rise or fall by 12% when the index rose or fell by 10%. A fund’s beta should be reviewed in conjunction with its R-squared (see definition below). The lower the R-squared, the less correlation there is between the fund and the index, and the less reliable beta is as an indicator of volatility.
Earnings Growth Rate. The average annual rate of growth in earnings over the past five years for the stocks now in a fund.
Expense Ratio. The percentage of a fund’s average net assets used to pay its annual administrative and advisory expenses. These expenses directly reduce returns to investors.
Foreign Holdings. The percentage of a fund represented by stocks or depositary receipts of companies based outside the United States.
Inception Date. The date on which the assets of a fund (or one of its share classes) are first invested in accordance with the fund’s investment objective. For funds with a subscription period, the inception date is the day after that period ends. Investment performance is measured from the inception date.
Median Market Cap. An indicator of the size of companies in which a fund invests; the midpoint of market capitalization (market price x shares outstanding) of a fund’s stocks, weighted by the proportion of the fund’s assets invested in each stock. Stocks representing half of the fund’s assets have market capitalizations above the median, and the rest are below it.
Price/Book Ratio. The share price of a stock divided by its net worth, or book value, per share. For a fund, the weighted average price/book ratio of the stocks it holds.
Price/Earnings Ratio. The ratio of a stock’s current price to its per-share earnings over the past year. For a fund, the weighted average P/E of the stocks it holds. P/E is an indicator of market expectations about corporate prospects; the higher the P/E, the greater the expectations for a company’s future growth.
R-Squared. A measure of how much of a fund’s past returns can be explained by the returns from the market in general, as measured by a given index. If a fund’s total returns were precisely synchronized with an index’s returns, its R-squared would be 1.00. If the fund’s returns bore no relationship to the index’s returns, its R-squared would be 0.
Return on Equity. The annual average rate of return generated by a company during the past five years for each dollar of shareholder’s equity (net income divided by shareholder’s equity). For a fund, the weighted average return on equity for the companies whose stocks it holds.
Short-Term Reserves. The percentage of a fund invested in highly liquid, short-term securities that can be readily converted to cash.
Turnover Rate. An indication of the fund’s trading activity. Funds with high turnover rates incur higher transaction costs and may be more likely to distribute capital gains (which may be taxable to investors). The turnover rate excludes in-kind transactions, which have minimal impact on costs.
Yield. A snapshot of a fund’s income from interest and dividends. The yield, expressed as a percentage of the fund’s net asset value, is based on income earned over the past 30 days and is annualized, or projected forward for the coming year. The index yield is based on the current annualized rate of income provided by securities in the index.
21
This page intentionally left blank.
This page intentionally left blank.
The People Who Govern Your Fund
The trustees of your mutual fund are there to see that the fund is operated and managed in your best interests since, as a shareholder, you are a part owner of the fund. Your fund’s trustees also serve on the board of directors of The Vanguard Group, Inc., which is owned by the Vanguard funds and provides services to them on an at-cost basis.
A majority of Vanguard’s board members are independent, meaning that they have no affiliation with Vanguard or the funds they oversee, apart from the sizable personal investments they have made as private individuals.
Our independent board members bring distinguished backgrounds in business, academia, and public service to their task of working with Vanguard officers to establish the policies and oversee the activities of the funds. Among board members’ responsibilities are selecting investment advisors for the funds; monitoring fund operations, performance, and costs; reviewing contracts; nominating and selecting new trustees/directors; and electing Vanguard officers.
Each trustee serves a fund until its termination; or until the trustee’s retirement, resignation, or death; or otherwise as specified in the fund’s organizational documents. Any trustee may be removed at a shareholders’ meeting by a vote representing two-thirds of the net asset value of all shares of the fund together with shares of other Vanguard funds organized within the same trust. The table on these two pages shows information for each trustee and executive officer of the fund. The mailing address of the trustees and officers is P.O. Box 876, Valley Forge, PA 19482.
Chairman of the Board, Chief Executive Officer, and Trustee |
| |
John J. Brennan1 | |
Born 1954 | Principal Occupation(s) During the Past Five Years: Chairman of the |
Trustee since May 1987; | Board, Chief Executive Officer, and Director/Trustee of The Vanguard |
Chairman of the Board and | Group, Inc., and of each of the investment companies served by The |
Chief Executive Officer | Vanguard Group. |
147 Vanguard Funds Overseen | |
| |
Independent Trustees | |
| |
Charles D. Ellis | |
Born 1937 | Principal Occupation(s) During the Past Five Years: Applecore Partners |
Trustee since January 2001 | (pro bono ventures in education); Senior Advisor to Greenwich |
147 Vanguard Funds Overseen | Associates (international business strategy consulting); Successor |
| Trustee of Yale University; Overseer of the Stern School of Business at |
| New York University; Trustee of the Whitehead Institute for Biomedical |
| Research. |
Rajiv L. Gupta | |
Born 1945 | Principal Occupation(s) During the Past Five Years: Chairman, |
Trustee since December 20012 | President, and Chief Executive Officer of Rohm and Haas Co. |
147 Vanguard Funds Overseen | (chemicals); Board Member of the American Chemistry Council; Director |
| of Tyco International, Ltd. (diversified manufacturing and services) since |
| 2005; Trustee of Drexel University and of the Chemical Heritage |
| Foundation. |
Amy Gutmann | |
Born 1949 | Principal Occupation(s) During the Past Five Years: President of the |
Trustee since June 2006 | University of Pennsylvania since 2004; Professor in the School of Arts |
147 Vanguard Funds Overseen | and Sciences, Annenberg School for Communication, and Graduate |
| School of Education of the University of Pennsylvania since 2004; |
| Provost (2001–2004) and Laurance S. Rockefeller Professor of Politics |
| and the University Center for Human Values (1990–2004), Princeton |
| University; Director of Carnegie Corporation of New York since 2005 and |
| of Schuylkill River Development Corporation and Greater Philadelphia |
| Chamber of Commerce since 2004. |
JoAnn Heffernan Heisen | |
Born 1950 | Principal Occupation(s) During the Past Five Years: Corporate Vice |
Trustee since July 1998 | President and Chief Global Diversity Officer since 2006, Vice President |
147 Vanguard Funds Overseen | and Chief Information Officer (1997–2005), and Member of the Executive |
| Committee of Johnson &Johnson (pharmaceuticals/consumer products); |
| Director of the University Medical Center at Princeton and Women’s |
| Research and Education Institute. |
André F. Perold | |
Born 1952 | Principal Occupation(s) During the Past Five Years: George Gund Professor of |
Trustee since December 2004 | Finance and Banking, Harvard Business School; Senior Associate Dean, |
147 Vanguard Funds Overseen | Director of Faculty Recruiting, and Chair of Finance Faculty, Harvard Business |
| School; Director and Chairman of UNX, Inc. (equities trading firm) since 2003; |
| Chair of the Investment Committee of HighVista Strategies LLC (private |
| investment firm) since 2005. |
Alfred M. Rankin, Jr. | |
Born 1941 | Principal Occupation(s) During the Past Five Years: Chairman, President, |
Trustee since January 1993 | Chief Executive Officer, and Director of NACCO Industries, Inc. (forklift |
147 Vanguard Funds Overseen | trucks/housewares/lignite); Director of Goodrich Corporation (industrial |
| products/aircraft systems and services). |
| |
J. Lawrence Wilson | |
Born 1936 | Principal Occupation(s) During the Past Five Years: Retired Chairman and |
Trustee since April 1985 | Chief Executive Officer of Rohm and Haas Co. (chemicals); Director of |
147 Vanguard Funds Overseen | Cummins Inc. (diesel engines) and AmerisourceBergen Corp. (pharmaceutical |
| distribution); Trustee of Vanderbilt University and of Culver Educational |
| Foundation. |
Executive Officers1 | |
| |
Thomas J. Higgins | |
Born 1957 | Principal Occupation(s) During the Past Five Years: Principal of The Vanguard |
Treasurer since July 1998 | Group, Inc.;Treasurer of each of the investment companies served by The |
147 Vanguard Funds Overseen | Vanguard Group. |
| |
| |
Heidi Stam | |
Born 1956 | Principal Occupation(s) During the Past Five Years: Managing Director of The |
Secretary since July 2005 | Vanguard Group, Inc., since 2006; General Counsel of The Vanguard Group |
147 Vanguard Funds Overseen | since 2005; Secretary of The Vanguard Group, and of each of the investment |
| companies served by The Vanguard Group, since 2005; Principal of The |
| Vanguard Group (1997–2006). |
| |
Vanguard Senior Management Team | | |
| | | |
R. Gregory Barton | Kathleen C. Gubanich | F. William McNabb, III | Ralph K. Packard |
Mortimer J. Buckley | Paul A. Heller | Michael S. Miller | George U. Sauter |
Founder | |
| |
John C. Bogle | |
Chairman and Chief Executive Officer, 1974–1996 |
1 Officers of the funds are “interested persons” as defined in the Investment Company Act of 1940.
2 December 2002 for Vanguard Equity Income Fund, Vanguard Growth Equity Fund, the Vanguard Municipal Bond Funds, and the Vanguard State Tax-Exempt Funds.
More information about the trustees is in the Statement of Additional Information, available from The Vanguard Group.

P.O. Box 2600
Valley Forge, PA 19482-2600
Connect with Vanguard® > www.vanguard.com
Fund Information > 800-662-7447 | Vanguard, Connect with Vanguard, and the ship logo |
| are trademarks of The Vanguard Group, Inc. |
Direct Investor Account Services > 800-662-2739 | |
| All other marks are the exclusive property of their |
Institutional Investor Services > 800-523-1036 | respective owners. |
| |
| |
Text Telephone for People | All comparative mutual fund data are from Lipper Inc. |
With Hearing Impairment > 800-952-3335 | or Morningstar, Inc., unless otherwise noted. |
| |
| |
| You can obtain a free copy of Vanguard’s proxy voting |
| guidelines by visiting our website, www.vanguard.com, |
This material may be used in conjunction | and searching for “proxy voting guidelines,” or by calling |
with the offering of shares of any Vanguard | Vanguard at 800-662-2739. They are also available from |
fund only if preceded or accompanied by | the SEC’s website, www.sec.gov. In addition, you may |
the fund’s current prospectus. | obtain a free report on how your fund voted the proxies |
| for securities it owned during the 12 months ended June |
| 30. To get the report, visit either www.vanguard.com |
| or www.sec.gov. |
| |
| |
| You can review and copy information about your fund |
| at the SEC’s Public Reference Room in Washington, |
| D.C.To find out more about this public service, call the |
| SEC at 202-551-8090. Information about your fund is |
| also available on the SEC’s website, and you can |
| receive copies of this information, for a fee, by sending a |
| request in either of two ways: via e-mail addressed to |
| publicinfo@sec.gov or via regular mail addressed to the |
| Public Reference Section, Securities and Exchange |
| Commission, Washington, DC 20549-0102. |
| |
| |
| |
| |
| © 2007 The Vanguard Group, Inc. |
| All rights reserved. |
| Vanguard Marketing Corporation, Distributor. |
| |
| Q572 092007 |
|
|
Vanguard® Dividend Appreciation |
Index Fund |
|
> Semiannual Report |
|
|
|
|
|
July 31, 2007 |
|
|
> | The Investor Shares of Vanguard Dividend Appreciation Index Fund posted a |
| return of 1.4% for the fiscal six months ended July 31, 2007. |
| |
> | The index’s two largest sector weightings, consumer staples and financials, |
| struggled during the half-year. Strength in energy and industrial stocks kept |
| the index in positive territory. |
| |
> | After soaring for much of the period, the stock market pulled back sharply at |
| the end of July. |
Contents | |
| |
Your Fund’s Total Returns | 1 |
Chairman’s Letter | 2 |
Fund Profile | 6 |
Performance Summary | 7 |
Financial Statements | 8 |
About Your Fund’s Expenses | 19 |
Trustees Approve Advisory Arrangement | 21 |
Glossary | 22 |
Please note: The opinions expressed in this report are just that—informed opinions. They should not be considered promises or advice. Also, please keep in mind that the information and opinions cover the period through the date on the cover of this report. Of course, the risks of investing in your fund are spelled out in the prospectus.
Your Fund’s Total Returns
Six Months Ended July 31, 2007 | | |
| Ticker | Total |
| Symbol | Returns |
Vanguard Dividend Appreciation Index Fund | | |
Investor Shares | VDAIX | 1.4% |
ETF Shares1 | VIG | |
Market Price | | 1.2 |
Net Asset Value | | 1.5 |
Dividend Achievers Select Index | | 1.6 |
Average Large-Cap Core Fund2 | | 2.1 |
Dow Jones Wilshire 5000 Index | | 1.9 |
Your Fund’s Performance at a Glance | | | | |
January 31, 2007–July 31, 2007 | | | | |
| | | Distributions Per Share |
| Starting | Ending | Income | Capital |
| Share Price | Share Price | Dividends | Gains |
Vanguard Dividend Appreciation Index Fund | | | | |
Investor Shares | $21.84 | $22.01 | $0.140 | $0.000 |
ETF Shares | 54.60 | 55.02 | 0.375 | 0.000 |
1 Vanguard ETF™ Shares are traded on the American Stock Exchange and are available only through brokers. The table shows the ETF returns based on both the AMEX market price and the net asset value for a share. U.S. Pat. No. 6,879,964 B2.
2 Derived from data provided by Lipper Inc.
1

Chairman’s Letter
Dear Shareholder,
For most of the six months ended July 31, 2007, the stock market charted a steady upward course, topping one record after another. The trend reversed in the second half of July, when a few high-profile earnings disappointments shook investors already nervous about troubles in the mortgage-backed bond market.
Vanguard Dividend Appreciation Index Fund managed a gain of 1.4% for its Investor Shares in this environment. One of its largest weightings, the financials sector, was particularly hard hit as banks and insurers revealed their exposure to mortgage securities tied to borrowers with weak credit.
The fund’s performance for the fiscal half-year was in line with that of the Dividend Achievers Select Index, a specially constructed index developed by Mergent, Inc. The fund lagged the average return for large-cap core funds.
For the U.S. stock market, a nervous finish to the half-year
U.S. stocks produced modest returns for the past six months, as a downturn at the end of the period erased most of the gains recorded earlier. The market stumbled as trouble with low-quality mortgage loans and related securities amplified investors’ risk-aversion.
2
The broad U.S. stock market returned 1.9% for the fiscal half-year. Large-capitalization stocks bested small-caps, and growth-oriented stocks outperformed their value-oriented counterparts. International stock markets sidestepped most of the U.S. turmoil, generating excellent six-month returns.
For bonds, a return to a more typical yield curve
As investors sought a safe haven from some of the financial markets’ riskier precincts, including bonds backed by mortgage loans made to borrowers with poor credit ratings, U.S. Treasury bond prices rose slightly and yields fell. The declines in yield were most pronounced among Treasury securities with maturities of less than 5 years.
These interest rate dynamics helped restore the yield curve—which illustrates the relationship between short- and long-term bond yields—to its typical, upward-sloping pattern. At the start of the period, the curve had been mildly inverted. The broad taxable bond market returned 1.9% for the half-year. Tax-exempt municipal securities returned a bit less.
Market Barometer | | | |
| | | Total Returns |
| | Periods Ended July 31, 2007 |
| Six Months | One Year | Five Years1 |
Stocks | | | |
Russell 1000 Index (Large-caps) | 1.9% | 16.5% | 12.3% |
Russell 2000 Index (Small-caps) | –2.5 | 12.1 | 16.0 |
Dow Jones Wilshire 5000 Index (Entire market) | 1.9 | 16.8 | 13.1 |
MSCI All Country World Index ex USA (International) | 11.8 | 28.5 | 22.3 |
| | | |
| | | |
Bonds | | | |
Lehman U.S. Aggregate Bond Index (Broad taxable market) | 1.9% | 5.6% | 4.4% |
Lehman Municipal Bond Index | 1.2 | 4.3 | 4.5 |
Citigroup 3-Month Treasury Bill Index | 2.5 | 5.1 | 2.7 |
| | | |
| | | |
CPI | | | |
Consumer Price Index | 2.9% | 2.4% | 3.0% |
| | | | |
1 Annualized.
3
Fund’s gain rested on performance of energy and industrials stocks
The shift in sentiment late in the half-year produced a wide range of outcomes across market sectors. Financials, representing, on average, 20% of Vanguard Dividend Appreciation Index Fund, fell –6.5%. Consumer discretionary and health care, together making up about 20% of the fund, on average, fell –4.2% and –4.5%, respectively. The worst-performing subgroups included insurance companies, banks, retailers, and pharmaceutical firms.
The fund’s positive return rested on the continued outperformance of energy and industrials companies that are plugged into global infrastructure development and economic growth. Chevron and ExxonMobil were by far the two largest contributors to the fund’s return. These companies—the fund’s two largest holdings—benefited from steadily rising energy prices and expanding refining margins. IBM, 3M, General Electric, and Caterpillar were all on the top-ten list of fund contributors.
The fund’s mandate is to capture the return of stocks that have a history of increasing dividends. Such a strategy leads to heavy weightings in the dividend-rich financials and consumer product sectors. For the six months, these weightings created a slight drag on performance relative to the broader market.
Annualized Expense Ratios1 | | | |
Your fund compared with its peer group | | | |
| | | Average |
| Investor | ETF | Large-Cap |
| Shares | Shares | Core Fund |
Dividend Appreciation Index Fund | 0.40% | 0.28% | 1.35% |
1 Fund expense ratios reflect the six months ended July 31, 2007. Peer-group expense ratio is derived from data provided by Lipper Inc. and captures information through year-end 2006.
4
Diversification and balance are key to a long-term strategy
As seasoned investors realize, there’s no way to know what will happen in the stock market tomorrow, much less next month or next year. What’s the best strategy to follow when the markets remain so unpredictable?
As we often counsel, the best way to put together a long-term investment program is to select a diversified mix of stock, bond, and money market mutual funds that fits your goals, time horizon, and tolerance for risk. A balanced portfolio is unlikely to deliver the best (or the worst) short-term returns, but it helps you to reap the rewards of the markets’ best-performing assets while muting the impact of the worst-performing ones.
Vanguard Dividend Appreciation Index Fund, with its low costs and its focus on companies that emphasize dividend growth, can be a valuable part of just such a diversified, long-term investment program.
Thank you for investing with Vanguard.
Sincerely,

John J. Brennan
Chairman and Chief Executive Officer
August 13, 2007
Vanguard Dividend Appreciation ETF | | | | |
Premium/Discount: April 21, 20061–July 31, 2007 | | | |
| | | | |
| Market Price Above or | Market Price Below |
| Equal to Net Asset Value | | Net Asset Value |
| Number | Percentage | Number | Percentage |
Basis Point Differential2 | of Days | of Total Days | of Days | of Total Days |
0–24.9 | 158 | 49.07% | 158 | 49.07% |
25–49.9 | 3 | 0.93 | 0 | 0.00 |
50–74.9 | 2 | 0.62 | 0 | 0.00 |
75–100.0 | 0 | 0.00 | 0 | 0.00 |
>100.0 | 1 | 0.31 | 0 | 0.00 |
Total | 164 | 50.93% | 158 | 49.07% |
| | | | | | |
1 Inception.
2 One basis point equals 1/100 of a percentage point.
5
Fund Profile
As of July 31, 2007
Portfolio Characteristics | | |
| | Target | Broad |
| Fund | Index1 | Index2 |
Number of Stocks | 222 | 222 | 4,902 |
Median Market Cap | $58.2B | $58.2B | $32.9B |
Price/Earnings Ratio | 15.7x | 15.7x | 17.4x |
Price/Book Ratio | 3.3x | 3.3x | 2.7x |
Yield | | 1.9% | 1.8% |
Investor Shares | 1.5% | | |
ETF Shares | 1.7% | | |
Return on Equity | 23.8% | 23.8% | 18.4% |
Earnings Growth Rate | 19.4% | 19.4% | 21.0% |
Foreign Holdings | 0.0% | 0.0% | 0.0% |
Turnover Rate | 2%3 | — | — |
Expense Ratio | | — | — |
Investor Shares | 0.40%3 | | |
ETF Shares | 0.28%3 | | |
Short-Term Reserves | 0% | — | — |
Sector Diversification (% of portfolio) | |
| | Target | Broad |
| Fund | Index1 | Index2 |
Consumer Discretionary | 12% | 12% | 11% |
Consumer Staples | 22 | 21 | 8 |
Energy | 9 | 10 | 11 |
Financials | 19 | 19 | 20 |
Health Care | 10 | 10 | 11 |
Industrials | 17 | 17 | 12 |
Information Technology | 6 | 6 | 16 |
Materials | 4 | 4 | 4 |
Telecommunication Services | 0 | 0 | 3 |
Utilities | 1 | 1 | 4 |
Short-Term Reserves | 0% | — | — |
Ten Largest Holdings4 (% of total net assets) |
| | |
Chevron Corp. | integrated oil | |
| and gas | 4.7% |
ExxonMobil Corp. | integrated oil | |
| and gas | 4.6 |
International Business | | |
Machines Corp. | computer hardware | 4.4 |
General Electric Co. | industrial | |
| conglomerate | 4.2 |
Wal-Mart Stores, Inc. | hypermarkets and | |
| super centers | 3.8 |
The Coca-Cola Co. | soft drinks | 3.8 |
The Procter & Gamble Co. | household products | 3.8 |
American International | | |
Group, Inc. | multiline insurance | 3.7 |
Johnson & Johnson | pharmaceuticals | 3.6 |
PepsiCo, Inc. | soft drinks | 3.2 |
Top Ten | | 39.8% |
Investment Focus
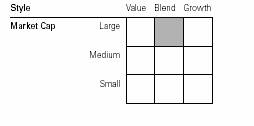
1 Dividend Achievers Select Index.
2 Dow Jones Wilshire 5000 Index.
3 Annualized.
4 “Ten Largest Holdings” excludes any temporary cash investments and equity index products. See page 22 for a Glossary of investment terms.
6
Performance Summary
All of the returns in this report represent past performance, which is not a guarantee of future results that may be achieved by the fund. (Current performance may be lower or higher than the performance data cited. For performance data current to the most recent month-end, visit our website at www.vanguard.com/performance.) Note, too, that both investment returns and principal value can fluctuate widely, so an investor’s shares, when sold, could be worth more or less than their original cost. The returns shown do not reflect taxes that a shareholder would pay on fund distributions or on the sale of fund shares.
Fiscal-Year Total Returns (%): April 27, 2006–July 31, 2007
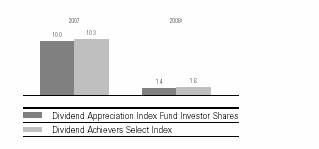
Average Annual Total Returns: Periods Ended June 30, 2007
This table presents average annual total returns through the latest calendar quarter—rather than through the end of the fiscal period. Securities and Exchange Commission rules require that we provide this information.
| | | Since |
| Inception Date | One Year | Inception |
Investor Shares2 | 4/27/2006 | 16.51% | 12.14% |
ETF Shares | 4/21/2006 | | |
Market Price | | 16.47 | 12.25 |
Net Asset Value | | 16.66 | 12.36 |
1 Six months ended July 31, 2007.
2 Total returns do not include the account service fee that may be applicable to certain accounts with balances below $10,000. Note: See Financial Highlights tables on pages 14 and 15 for dividend and capital gains information.
7
Financial Statements (unaudited)
Statement of Net Assets
As of July 31, 2007
The fund provides a complete list of its holdings four times in each fiscal year, at the quarter-ends. For the second and fourth fiscal quarters, the lists appear in the fund’s semiannual and annual reports to shareholders. For the first and third fiscal quarters, the fund files the lists with the Securities and Exchange Commission on Form N-Q. Shareholders can look up the fund’s Forms N-Q on the SEC’s website at www.sec.gov. Forms N-Q may also be reviewed and copied at the SEC’s Public Reference Room (see the back cover of this report for further information).
| | Market |
| | Value• |
| Shares | ($000) |
Common Stocks (100.0%) | | |
Consumer Discretionary (11.6%) | |
Home Depot, Inc. | 262,805 | 9,768 |
McDonald’s Corp. | 162,297 | 7,769 |
Target Corp. | 104,390 | 6,323 |
Lowe’s Cos., Inc. | 185,810 | 5,204 |
The McGraw-Hill Cos., Inc. | 46,216 | 2,796 |
Johnson Controls, Inc. | 23,536 | 2,663 |
Harley-Davidson, Inc. | 33,267 | 1,907 |
TJX Cos., Inc. | 56,599 | 1,571 |
Gannett Co., Inc. | 31,354 | 1,565 |
Nordstrom, Inc. | 29,782 | 1,417 |
VF Corp. | 15,841 | 1,359 |
Sherwin-Williams Co. | 16,387 | 1,142 |
Genuine Parts Co. | 22,280 | 1,060 |
Family Dollar Stores, Inc. | 17,786 | 527 |
The Stanley Works | 9,402 | 520 |
Leggett & Platt, Inc. | 23,254 | 482 |
Ross Stores, Inc. | 16,352 | 473 |
Meredith Corp. | 4,775 | 270 |
John Wiley & Sons Class A | 6,316 | 267 |
Polaris Industries, Inc. | 5,080 | 251 |
Applebee’s International, Inc. | 9,453 | 233 |
Harte-Hanks, Inc. | 9,573 | 225 |
Wolverine World Wide, Inc. | 7,015 | 190 |
^Talbots Inc. | 7,207 | 166 |
Matthews International Corp. | 3,918 | 150 |
Media General, Inc. Class A | 2,716 | 77 |
Courier Corp. | 1,499 | 56 |
Haverty Furniture Cos., Inc. | 2,072 | 23 |
| | 48,454 |
Consumer Staples (21.6%) | | |
Beverages (8.2%) | | |
The Coca-Cola Co. | 303,344 | 15,807 |
PepsiCo, Inc. | 203,440 | 13,350 |
Anheuser-Busch Cos., Inc. | 95,266 | 4,646 |
Brown-Forman Corp. Class B | 8,691 | 577 |
| | | |
| | Market |
| | Value• |
| Shares | ($000) |
Food & Staples Retailing (6.1%) | |
Wal-Mart Stores, Inc. | 346,698 | 15,931 |
Walgreen Co. | 129,790 | 5,734 |
Sysco Corp. | 85,391 | 2,722 |
SuperValu Inc. | 25,313 | 1,055 |
| | |
Food Products (1.6%) | | |
Archer-Daniels-Midland Co. | 85,886 | 2,886 |
Wm. Wrigley Jr. Co. | 28,403 | 1,638 |
The Hershey Co. | 21,230 | 979 |
Hormel Foods Corp. | 17,549 | 604 |
McCormick & Co., Inc. | 15,104 | 516 |
Lancaster Colony Corp. | 3,899 | 151 |
Tootsie Roll Industries, Inc. | 4,668 | 117 |
| | |
Household Products (5.2%) | | |
The Procter & Gamble Co. | 254,463 | 15,741 |
Colgate-Palmolive Co. | 64,309 | 4,244 |
The Clorox Co. | 19,167 | 1,159 |
Church & Dwight, Inc. | 7,918 | 388 |
| | |
Personal Products (0.5%) | | |
Avon Products, Inc. | 55,149 | 1,986 |
| | 90,231 |
Energy (9.5%) | | |
Chevron Corp. | 230,829 | 19,680 |
ExxonMobil Corp. | 225,572 | 19,203 |
Holly Corp. | 6,883 | 464 |
Helmerich & Payne, Inc. | 12,548 | 406 |
| | 39,753 |
Financials (18.9%) | | |
Capital Markets (4.3%) | | |
Lehman Brothers | | |
Holdings, Inc. | 65,671 | 4,072 |
Franklin Resources Corp. | 30,548 | 3,891 |
State Street Corp. | 48,590 | 3,257 |
Northern Trust Corp. | 28,052 | 1,752 |
T. Rowe Price Group Inc. | 31,149 | 1,624 |
Legg Mason Inc. | 15,388 | 1,385 |
SEI Investments Co. | 24,601 | 671 |
| | | |
8
| | Market |
| | Value• |
| Shares | ($000) |
Eaton Vance Corp. | 15,651 | 655 |
Nuveen Investments, Inc. | | |
Class A | 10,607 | 649 |
| | |
Commercial Banks (2.8%) | | |
M & T Bank Corp. | 14,374 | 1,528 |
Marshall & Ilsley Corp. | 34,532 | 1,423 |
Compass Bancshares Inc. | 16,579 | 1,149 |
Synovus Financial Corp. | 40,463 | 1,131 |
Commerce Bancorp, Inc. | 25,647 | 858 |
Colonial BancGroup, Inc. | 20,531 | 448 |
City National Corp. | 6,159 | 436 |
Cullen/Frost Bankers, Inc. | 8,083 | 401 |
Commerce Bancshares, Inc. | 8,954 | 398 |
Bank of Hawaii Corp. | 6,677 | 321 |
Webster Financial Corp. | 7,087 | 308 |
The South | | |
Financial Group, Inc. | 10,058 | 217 |
Trustmark Corp. | 8,421 | 211 |
Chittenden Corp. | 6,062 | 203 |
UMB Financial Corp. | 5,354 | 200 |
Greater Bay Bancorp | 6,417 | 172 |
United Bankshares, Inc. | 6,071 | 169 |
Westamerica Bancorporation | 3,936 | 161 |
Alabama National | | |
BanCorporation | 2,573 | 137 |
Glacier Bancorp, Inc. | 6,819 | 130 |
Pacific Capital Bancorp | 6,190 | 129 |
CVB Financial Corp. | 10,955 | 107 |
Sterling Bancshares, Inc. | 9,661 | 101 |
First Financial Bankshares, Inc. | 2,764 | 100 |
BancFirst Corp. | 2,272 | 92 |
Community Banks, Inc. | 3,292 | 86 |
^Capital City Bank Group, Inc. | 2,308 | 69 |
First Source Corp. | 3,284 | 67 |
Sterling Financial Corp. (PA) | 3,929 | 66 |
Community Trust Bancorp Inc. | 2,053 | 59 |
IBERIABANK Corp. | 1,384 | 58 |
West Coast Bancorp | 2,096 | 55 |
Sandy Spring Bancorp, Inc. | 2,028 | 55 |
Banner Corp. | 1,658 | 51 |
First State Bancorporation | 2,636 | 46 |
Irwin Financial Corp. | 3,806 | 45 |
S.Y. Bancorp, Inc. | 1,860 | 44 |
Renasant Corp. | 2,257 | 43 |
Simmons First National Corp. | 1,852 | 43 |
Old Second Bancorp, Inc. | 1,548 | 43 |
First Financial Corp. (IN) | 1,814 | 43 |
Washington Trust Bancorp, Inc. | 1,735 | 41 |
Seacoast Banking | | |
Corp. of Florida | 2,551 | 41 |
Southwest Bancorp, Inc. | 1,791 | 35 |
First Community | | |
Bancshares, Inc. | 1,262 | 34 |
Heartland Financial USA, Inc. | 1,957 | 33 |
Peoples Bancorp, Inc. | 1,285 | 29 |
Horizon Financial Corp. | 1,402 | 27 |
| | Market |
| | Value• |
| Shares | ($000) |
Consumer Finance (0.7%) | | |
SLM Corp. | 55,785 | 2,743 |
| | |
Insurance (9.5%) | | |
American International Group, Inc. | 241,540 | 15,502 |
The Allstate Corp. | 81,914 | 4,354 |
The Hartford Financial Services Group Inc. | 40,478 | 3,719 |
AFLAC Inc. | 61,836 | 3,223 |
The Chubb Corp. | 53,551 | 2,699 |
Lincoln National Corp. | 35,796 | 2,159 |
Progressive Corp. of Ohio | 99,127 | 2,080 |
MBIA, Inc. | 17,620 | 988 |
Ambac Financial Group, Inc. | 13,883 | 932 |
Transatlantic Holdings, Inc. | 8,373 | 612 |
Old Republic International Corp. | 30,622 | 562 |
Brown & Brown, Inc. | 18,039 | 464 |
HCC Insurance Holdings, Inc. | 15,012 | 440 |
Erie Indemnity Co. Class A | 7,880 | 407 |
Protective Life Corp. | 8,745 | 376 |
Wesco Financial Corp. | 861 | 341 |
Hilb, Rogal and Hamilton Co. | 4,640 | 201 |
Alfa Corp. | 10,481 | 186 |
R.L.I. Corp. | 3,128 | 181 |
State Auto Financial Corp. | 5,504 | 142 |
Harleysville Group, Inc. | 3,999 | 112 |
Midland Co. | 2,200 | 105 |
| | |
Real Estate Management & Development (0.1%) |
Forest City Enterprise Class A | 9,386 | 511 |
| | |
Thrifts & Mortgage Finance (1.5%) | |
Freddie Mac | 93,979 | 5,382 |
People’s United Financial Inc. | 37,432 | 603 |
MAF Bancorp, Inc. | 4,250 | 223 |
BankAtlantic Bancorp, Inc.Class A | 7,636 | 67 |
Anchor Bancorp Wisconsin Inc. | 2,651 | 59 |
First Busey Corp. | 2,732 | 53 |
First Financial Holdings, Inc. | 1,720 | 47 |
Flushing Financial Corp. | 2,609 | 39 |
| | 79,111 |
Health Care (10.4%) | | |
Johnson & Johnson | 249,612 | 15,102 |
Abbott Laboratories | 181,722 | 9,211 |
Medtronic, Inc. | 149,770 | 7,589 |
Cardinal Health, Inc. | 47,156 | 3,099 |
Stryker Corp. | 46,497 | 2,903 |
Becton, Dickinson & Co. | 29,494 | 2,252 |
C.R. Bard, Inc. | 13,469 | 1,057 |
DENTSPLY International Inc. | 18,984 | 693 |
Beckman Coulter, Inc. | 7,553 | 535 |
Hillenbrand Industries, Inc. | 7,971 | 502 |
Arrow International, Inc. | 6,085 | 269 |
| | | |
9
| | Market |
| | Value• |
| Shares | ($000) |
West Pharmaceutical | | |
Services, Inc. | 4,575 | 212 |
Meridian Bioscience Inc. | 4,060 | 91 |
| | 43,515 |
Industrials (16.6%) | | |
General Electric Co. | 456,173 | 17,681 |
United Technologies Corp. | 122,223 | 8,919 |
3M Co. | 93,052 | 8,274 |
Caterpillar, Inc. | 82,685 | 6,515 |
Emerson Electric Co. | 102,418 | 4,821 |
Illinois Tool Works, Inc. | 71,442 | 3,933 |
General Dynamics Corp. | 49,888 | 3,919 |
Danaher Corp. | 39,606 | 2,958 |
Parker Hannifin Corp. | 14,394 | 1,420 |
Dover Corp. | 26,785 | 1,366 |
Pitney Bowes, Inc. | 27,642 | 1,274 |
Expeditors International of | | |
Washington, Inc. | 26,628 | 1,190 |
W.W. Grainger, Inc. | 10,081 | 881 |
Avery Dennison Corp. | 14,101 | 865 |
Cintas Corp. | 19,610 | 717 |
Roper Industries Inc. | 10,825 | 649 |
Harsco Corp. | 10,063 | 530 |
Pentair, Inc. | 13,215 | 478 |
Donaldson Co., Inc. | 10,353 | 377 |
Teleflex Inc. | 4,881 | 373 |
Carlisle Co., Inc. | 7,749 | 351 |
HNI Corp. | 5,821 | 238 |
Brady Corp. Class A | 6,464 | 226 |
CLARCOR Inc. | 6,492 | 226 |
Mine Safety Appliances Co. | 4,537 | 207 |
Nordson Corp. | 4,295 | 197 |
^Franklin Electric, Inc. | 3,100 | 144 |
ABM Industries Inc. | 5,396 | 136 |
A.O. Smith Corp. | 2,748 | 133 |
NACCO Industries, Inc. | | |
Class A | 820 | 108 |
McGrath RentCorp | 3,199 | 96 |
Tennant Co. | 2,373 | 91 |
Universal Forest Products, Inc. | 2,288 | 91 |
Raven Industries, Inc. | 2,264 | 77 |
Badger Meter, Inc. | 1,764 | 59 |
LSI Industries Inc. | 2,796 | 47 |
Gorman-Rupp Co. | 1,515 | 43 |
| | 69,610 |
Information Technology (6.2%) | | |
International Business | | |
Machines Corp. | 167,567 | 18,541 |
Automatic Data | | |
Processing, Inc. | 73,293 | 3,402 |
Paychex, Inc. | 48,282 | 1,998 |
Linear Technology Corp. | 37,798 | 1,348 |
Diebold, Inc. | 8,819 | 447 |
Jack Henry & Associates Inc. | 11,698 | 281 |
| | 26,017 |
| | | Market |
| | | Value• |
| | Shares | ($000) |
Materials (3.5%) | | |
| Praxair, Inc. | 39,364 | 3,016 |
| Air Products & | | |
| Chemicals, Inc. | 26,426 | 2,282 |
| Nucor Corp. | 34,235 | 1,719 |
| Rohm & Haas Co. | 28,181 | 1,593 |
| Ecolab, Inc. | 33,331 | 1,404 |
| Vulcan Materials Co. | 10,830 | 1,037 |
| Sigma-Aldrich Corp. | 17,300 | 784 |
| Martin Marietta Materials, Inc. | 5,373 | 736 |
| Sonoco Products Co. | 12,666 | 464 |
| Albemarle Corp. | 11,216 | 451 |
| Bemis Co., Inc. | 13,709 | 404 |
| Valspar Corp. | 12,643 | 349 |
| AptarGroup Inc. | 8,514 | 310 |
| H.B. Fuller Co. | 7,961 | 220 |
| Myers Industries, Inc. | 3,944 | 84 |
| | | 14,853 |
| | | | |
Telecommunication Services (0.2%) | |
| CenturyTel, Inc. | 14,482 | 664 |
| | | |
Utilities (1.5%) | | |
| FPL Group, Inc. | 50,310 | 2,904 |
| Questar Corp. | 23,062 | 1,187 |
| MDU Resources Group, Inc. | 23,325 | 636 |
| Energen Corp. | 9,555 | 506 |
| ^Aqua America, Inc. | 17,190 | 376 |
| UGI Corp. Holding Co. | 13,399 | 346 |
| American States Water Co. | 2,115 | 78 |
| SJW Corp. | 2,273 | 65 |
| Southwest Water Co. | 3,188 | 42 |
| | | 6,140 |
Total Common Stocks | | |
(Cost $405,483) | | 418,348 |
Temporary Cash Investments (0.3%) | |
1 | Vanguard Market Liquidity | | |
| Fund, 5.302% | 887,421 | 887 |
1 | Vanguard Market Liquidity | | |
| Fund, 5.302%—Note F | 600,300 | 600 |
Total Temporary Cash Investments | |
(Cost $1,487) | | 1,487 |
Total Investments (100.3%) | | |
(Cost $406,970) | | 419,835 |
Other Assets and Liabilities (–0.3%) | |
Other Assets—Note B | | 991 |
Liabilities—Note F | | (2,411) |
| | | (1,420) |
Net Assets (100%) | | 418,415 |
| | | | |
10
At July 31, 2007, net assets consisted of:2 | |
| Amount |
| ($000) |
Paid-in Capital | 404,950 |
Undistributed Net Investment Income | 328 |
Accumulated Net Realized Gains | 272 |
Unrealized Appreciation | 12,865 |
Net Assets | 418,415 |
| |
| |
Investor Shares—Net Assets | |
Applicable to 11,918,740 outstanding | |
$.001 par value shares of beneficial | |
interest (unlimited authorization) | 262,370 |
Net Asset Value Per Share— | |
Investor Shares | $22.01 |
| |
| |
ETF Shares—Net Assets | |
Applicable to 2,835,903 outstanding | |
$.001 par value shares of beneficial | |
interest (unlimited authorization) | 156,045 |
Net Asset Value Per Share— | |
ETF Shares | $55.02 |
• See Note A in Notes to Financial Statements.
^ Part of security position is on loan to broker-dealers. See Note F in Notes to Financial Statements.
1 Affiliated money market fund available only to Vanguard funds and certain trusts and accounts managed by Vanguard. Rate shown is the 7-day yield.
2 See Note D in Notes to Financial Statements for the tax-basis components of net assets.
11
Statement of Operations
| Six Months Ended |
| July 31, 2007 |
| ($000) |
Investment Income | |
Income | |
Dividends | 3,158 |
Interest1 | 46 |
Security Lending | 4 |
Total Income | 3,208 |
Expenses | |
The Vanguard Group—Note B | |
Investment Advisory Services | 25 |
Management and Administrative | |
Investor Shares | 375 |
ETF Shares | 153 |
Marketing and Distribution | |
Investor Shares | 24 |
ETF Shares | 15 |
Custodian Fees | 32 |
Shareholders’ Reports | |
Investor Shares | 2 |
ETF Shares | 3 |
Total Expenses | 629 |
Expenses Paid Indirectly—Note C | (9) |
Net Expenses | 620 |
Net Investment Income | 2,588 |
Realized Net Gain (Loss) on Investment Securities Sold | 384 |
Change in Unrealized Appreciation (Depreciation) of Investment Securities | 1,293 |
Net Increase (Decrease) in Net Assets Resulting from Operations | 4,265 |
1 Interest income from an affiliated company of the fund was $46,000.
12
Statement of Changes in Net Assets
| Six Months Ended | April 21, 20061 |
| July 31, | to January 31, |
| 2007 | 2007 |
| ($000) | ($000) |
Increase (Decrease) in Net Assets | | |
Operations | | |
Net Investment Income | 2,588 | 1,684 |
Realized Net Gain (Loss) | 384 | 3,114 |
Change in Unrealized Appreciation (Depreciation) | 1,293 | 11,572 |
Net Increase (Decrease) in Net Assets Resulting from Operations | 4,265 | 16,370 |
Distributions | | |
Net Investment Income | | |
Investor Shares | (1,434) | (959) |
ETF Shares | (952) | (599) |
Realized Capital Gain | | |
Investor Shares | — | — |
ETF Shares | — | — |
Total Distributions | (2,386) | (1,558) |
Capital Share Transactions—Note G | | |
Investor Shares | 98,166 | 153,498 |
ETF Shares | 44,751 | 105,309 |
Net Increase (Decrease) from Capital Share Transactions | 142,917 | 258,807 |
Total Increase (Decrease) | 144,796 | 273,619 |
Net Assets | | |
Beginning of Period | 273,619 | — |
End of Period2 | 418,415 | 273,619 |
1 Inception.
2 Net Assets—End of Period includes undistributed net investment income of $328,000 and $126,000.
13
Financial Highlights
Investor Shares | | |
| Six Months | April 27, |
| Ended | 20061 to |
| July 31, | January 31, |
For a Share Outstanding Throughout Each Period | 2007 | 2007 |
Net Asset Value, Beginning of Period | $21.84 | $20.05 |
Investment Operations | | |
Net Investment Income | .15 | .214 |
Net Realized and Unrealized Gain (Loss) on Investments | .16 | 1.782 |
Total from Investment Operations | .31 | 1.996 |
Distributions | | |
Dividends from Net Investment Income | (.14) | (.206) |
Distributions from Realized Capital Gains | — | — |
Total Distributions | (.14) | (.206) |
Net Asset Value, End of Period | $22.01 | $21.84 |
| | |
| | |
Total Return2 | 1.42% | 10.02% |
| | |
| | |
Ratios/Supplemental Data | | |
Net Assets, End of Period (Millions) | $262 | $163 |
Ratio of Total Expenses to Average Net Assets | 0.40%* | 0.40%* |
Ratio of Net Investment Income to Average Net Assets | 1.41%* | 1.53%* |
Portfolio Turnover Rate3 | 2%* | 21% |
1 Inception.
2 Total returns do not include the account service fee that may be applicable to certain accounts with balances below $10,000.
3 Excludes the value of portfolio securities received or delivered as a result of in-kind purchases or redemptions of the fund’s capital shares, including ETF creation units.
* Annualized.
14
ETF Shares | | |
| Six Months | April 21, |
| Ended | 20061 to |
| July 31, | January 31, |
For a Share Outstanding Throughout Each Period | 2007 | 2007 |
Net Asset Value, Beginning of Period | $54.60 | $49.94 |
Investment Operations | | |
Net Investment Income | .398 | .555 |
Net Realized and Unrealized Gain (Loss) on Investments | .397 | 4.631 |
Total from Investment Operations | .795 | 5.186 |
Distributions | | |
Dividends from Net Investment Income | (.375) | (.526) |
Distributions from Realized Capital Gains | — | — |
Total Distributions | (.375) | (.526) |
Net Asset Value, End of Period | $55.02 | $54.60 |
| | |
| | |
Total Return | 1.45% | 10.45% |
| | |
| | |
Ratios/Supplemental Data | | |
Net Assets, End of Period (Millions) | $156 | $111 |
Ratio of Total Expenses to Average Net Assets | 0.28%* | 0.28%* |
Ratio of Net Investment Income to Average Net Assets | 1.53%* | 1.65%* |
Portfolio Turnover Rate2 | 2%* | 21% |
1 Inception.
2 Excludes the value of portfolio securities received or delivered as a result of in-kind purchases or redemptions of the fund’s capital shares, including ETF creation units.
* Annualized.
See accompanying Notes, which are an integral part of the Financial Statements.
15
Notes to Financial Statements
Vanguard Dividend Appreciation Index Fund is registered under the Investment Company Act of 1940 as an open-end investment company, or mutual fund. The fund files reports with the SEC under the company name Vanguard Specialized Funds. The fund offers two classes of shares: Investor Shares and ETF Shares. Investor Shares are available to any investor who meets the fund’s minimum purchase requirements. ETF Shares are listed for trading on the American Stock Exchange; they can be purchased and sold through a broker.
A. The following significant accounting policies conform to generally accepted accounting principles for U.S. mutual funds. The fund consistently follows such policies in preparing its financial statements.
1. Security Valuation: Securities are valued as of the close of trading on the New York Stock Exchange (generally 4 p.m., Eastern time) on the valuation date. Equity securities are valued at the latest quoted sales prices or official closing prices taken from the primary market in which each security trades; such securities not traded on the valuation date are valued at the mean of the latest quoted bid and asked prices. Securities for which market quotations are not readily available, or whose values have been materially affected by events occurring before the fund’s pricing time but after the close of the securities’ primary markets, are valued by methods deemed by the board of trustees to represent fair value. Investments in Vanguard Market Liquidity Fund are valued at that fund’s net asset value.
2. Federal Income Taxes: The fund intends to continue to qualify as a regulated investment company and distribute all of its taxable income. Accordingly, no provision for federal income taxes is required in the financial statements.
3. Distributions: Distributions to shareholders are recorded on the ex-dividend date.
4. Security Lending: The fund may lend its securities to qualified institutional borrowers to earn additional income. Security loans are required to be secured at all times by collateral at least equal to the market value of securities loaned. The fund invests cash collateral received in Vanguard Market Liquidity Fund and records a liability for the return of the collateral, during the period the securities are on loan. Security lending income represents the income earned on investing cash collateral, less expenses associated with the loan.
5. Other: Dividend income is recorded on the ex-dividend date. Interest income includes income distributions received from Vanguard Market Liquidity Fund and is accrued daily. Security transactions are accounted for on the date securities are bought or sold. Costs used to determine realized gains (losses) on the sale of investment securities are those of the specific securities sold.
Each class of shares has equal rights as to assets and earnings, except that each class separately bears certain class-specific expenses related to maintenance of shareholder accounts (included in Management and Administrative expenses) and shareholder reporting. Marketing and distribution expenses are allocated to each class of shares based on a method approved by the board of trustees. Income, other non-class-specific expenses, and gains and losses on investments are allocated to each class of shares based on its relative net assets.
B. The Vanguard Group furnishes at cost investment advisory, corporate management, administrative, marketing, and distribution services. The costs of such services are allocated to the fund under methods approved by the board of trustees. The fund has committed to provide up to 0.40% of its net assets in capital contributions to Vanguard. At July 31, 2007, the fund had contributed capital of $36,000 to Vanguard (included in Other Assets), representing 0.01% of the fund’s net assets and 0.04% of Vanguard’s capitalization. The fund’s trustees and officers are also directors and officers of Vanguard.
16
C. The fund’s custodian bank has agreed to reduce its fees when the fund maintains cash on deposit in the non-interest-bearing custody account. For the six months ended July 31, 2007, custodian fee offset arrangements reduced the fund’s expenses by $9,000.
D. Distributions are determined on a tax basis and may differ from net investment income and realized capital gains for financial reporting purposes. Differences may be permanent or temporary. Permanent differences are reclassified among capital accounts in the financial statements to reflect their tax character. Temporary differences arise when certain items of income, expense, gain, or loss are recognized in different periods for financial statement and tax purposes; these differences will reverse at some time in the future. Differences in classification may also result from the treatment of short-term gains as ordinary income for tax purposes. The fund’s tax-basis capital gains and losses are determined only at the end of each fiscal year.
At July 31, 2007, the cost of investment securities for tax purposes was $406,970,000. Net unrealized appreciation of investment securities for tax purposes was $12,865,000 consisting of unrealized gains of $24,504,000 on securities that had risen in value since their purchase and $11,639,000 in unrealized losses on securities that had fallen in value since their purchase.
E. During the six months ended July 31, 2007, the fund purchased $147,343,000 of investment securities and sold $3,909,000 of investment securities other than temporary cash investments.
F. The market value of securities on loan to broker-dealers at July 31, 2007, was $565,000, for which the fund received cash collateral of $600,000.
G. Capital share transactions for each class of shares were:
| Six Months Ended | April 21, 20061 to |
| July 31, 2007 | January 31, 2007 |
| Amount | Shares | Amount | Shares |
| ($000) | (000) | ($000) | (000) |
Investor Shares | | | | |
Issued | 111,403 | 5,061 | 164,261 | 7,978 |
Issued in Lieu of Cash Distributions | 1,199 | 54 | 586 | 28 |
Redeemed | (14,436) | (653) | (11,349) | (550) |
Net Increase (Decrease)—Investor Shares | 98,166 | 4,462 | 153,498 | 7,456 |
ETF Shares | | | | |
Issued | 44,751 | 808 | 136,841 | 2,628 |
Issued in Lieu of Cash Distributions | — | — | — | — |
Redeemed | — | — | (31,532) | (600) |
Net Increase (Decrease)—ETF Shares | 44,751 | 808 | 105,309 | 2,028 |
1 Inception.
17
H. In June 2006, the Financial Accounting Standards Board issued Interpretation No. 48 (“FIN 48”), “Accounting for Uncertainty in Income Taxes.” FIN 48 establishes the minimum threshold for recognizing, and a system for measuring, the benefits of tax-return positions in financial statements, effective for the fund’s current fiscal year. Management has analyzed the fund’s tax positions taken on its federal income tax return for the open tax year ended January 31, 2007, for purposes of implementing FIN 48, and has concluded that no provision for income tax is required in the fund’s financial statements.
18
About Your Fund’s Expenses
As a shareholder of the fund, you incur ongoing costs, which include costs for portfolio management, administrative services, and shareholder reports (like this one), among others. Operating expenses, which are deducted from a fund’s gross income, directly reduce the investment return of the fund.
A fund’s expenses are expressed as a percentage of its average net assets. This figure is known as the expense ratio. The following examples are intended to help you understand the ongoing costs (in dollars) of investing in your fund and to compare these costs with those of other mutual funds. The examples are based on an investment of $1,000 made at the beginning of the period shown and held for the entire period.
The table below illustrates your fund’s costs in two ways:
• Based on actual fund return. This section helps you to estimate the actual expenses that you paid over the period. The “Ending Account Value” shown is derived from the fund’s actual return, and the third column shows the dollar amount that would have been paid by an investor who started with $1,000 in the fund. You may use the information here, together with the amount you invested, to estimate the expenses that you paid over the period.
To do so, simply divide your account value by $1,000 (for example, an $8,600 account value divided by $1,000 = 8.6), then multiply the result by the number given for your fund under the heading “Expenses Paid During Period.”
• Based on hypothetical 5% yearly return. This section is intended to help you compare your fund’s costs with those of other mutual funds. It assumes that the fund had a yearly return of 5% before expenses, but that the expense ratio is unchanged. In this case—because the return used is not the fund’s actual return—the results do not apply to your investment. The example is useful in making comparisons because the Securities and Exchange Commission requires all mutual funds to calculate expenses based on a 5% return. You can assess your fund’s costs by comparing this hypothetical example with the hypothetical examples that appear in shareholder reports of other funds.
Six Months Ended July 31, 2007 | | | |
| Beginning | Ending | Expenses |
| Account Value | Account Value | Paid During |
Dividend Appreciation Index Fund | 1/31/2007 | 7/31/2007 | Period1 |
Based on Actual Fund Return | | | |
Investor Shares | $1,000.00 | $1,014.17 | $2.00 |
ETF Shares | 1,000.00 | 1,014.54 | 1.40 |
Based on Hypothetical 5% Return | | | |
Investor Shares | $1,000.00 | $1,022.81 | $2.01 |
ETF Shares | 1,000.00 | 1,023.41 | 1.40 |
1 These calculations are based on expenses incurred in the most recent six-month period. The fund’s annualized six-month expense ratios for that period are 0.40% for Investor Shares and 0.28% for ETF Shares. The dollar amounts shown as “Expenses Paid” are equal to the annualized expense ratio multiplied by the average account value over the period, multiplied by the number of days in the most recent six-month period, then divided by the number of days in the most recent 12-month period.
19
Note that the expenses shown on page 19 are meant to highlight and help you compare ongoing costs only and do not reflect transaction costs incurred by the fund for buying and selling securities. Further, the expenses do not include any account service fee described in the prospectus. If such a fee were applied to your account, your costs would be higher. Your fund does not charge transaction fees, such as purchase or redemption fees, nor does it carry a “sales load.”
The calculations assume no shares were bought or sold during the period. Your actual costs may have been higher or lower, depending on the amount of your investment and the timing of any purchases or redemptions.
You can find more information about the fund’s expenses, including annual expense ratios, in the Financial Statements section of this report. For additional information on operating expenses and other shareholder costs, please refer to the appropriate fund prospectus.
20
Trustees Approve Advisory Arrangement
The board of trustees of Vanguard Dividend Appreciation Index Fund has renewed the fund’s investment advisory arrangement with The Vanguard Group, Inc. Vanguard—through its Quantitative Equity Group—serves as investment advisor for the fund. The board determined that continuing the fund’s internalized management structure was in the best interests of the fund and its shareholders.
The board based its decision upon an evaluation of the advisor’s investment staff, portfolio management process, and performance. The trustees considered the factors discussed below, among others. However, no single factor determined whether the board approved the arrangement. Rather, it was the totality of the circumstances that drove the board’s decision.
Nature, extent, and quality of services
The board considered the quality of the fund’s investment management since its inception in 2006, and took into account the organizational depth and stability of the firm. Vanguard has been managing investments for more than two decades. George U. Sauter, Vanguard managing director and chief investment officer, has been in the investment management business since 1985. Mr. Sauter has led the Quantitative Equity Group since 1987. The Quantitative Equity Group adheres to a sound, disciplined investment management process; the team has considerable experience, stability, and depth.
The board concluded that Vanguard’s experience, stability, depth, and performance, among other factors, warranted continuation of the advisory arrangement.
Investment performance
The board considered the fund’s performance since inception, noting that the fund’s performance has been competitive versus its target index and the average return of its peer group. The board concluded that the fund has performed in line with expectations, and its results have been consistent with the fund’s investment strategy. Information about the fund’s most recent performance can be found in the Performance Summary section of this report.
Cost
The board concluded that the fund’s expense ratio was far below the average expense ratio charged by funds in its peer group. The board noted that the fund’s advisory expense ratio was also well below its peer-group average. Information about the fund’s expense ratio appears in the About Your Fund’s Expenses section of this report as well as in the Financial Statements section.
The board does not conduct a profitability analysis of Vanguard because of Vanguard’s unique “at-cost” structure. Unlike most other mutual fund management companies, Vanguard is owned by the funds it oversees, and produces “profits” only in the form of reduced expenses for fund shareholders.
The benefit of economies of scale
The board concluded that the fund’s low-cost arrangement with Vanguard ensures that the fund will realize economies of scale as it grows, with the cost to shareholders declining as the fund’s assets increase.
The board will consider whether to renew the advisory arrangement again after a one-year period.
21
Glossary
Earnings Growth Rate. The average annual rate of growth in earnings over the past five years for the stocks now in a fund.
Expense Ratio. The percentage of a fund’s average net assets used to pay its annual administrative and advisory expenses. These expenses directly reduce returns to investors.
Foreign Holdings. The percentage of a fund represented by stocks or depositary receipts of companies based outside the United States.
Inception Date. The date on which the assets of a fund (or one of its share classes) are first invested in accordance with the fund’s investment objective. For funds with a subscription period, the inception date is the day after that period ends. Investment performance is measured from the inception date.
Median Market Cap. An indicator of the size of companies in which a fund invests; the midpoint of market capitalization (market price x shares outstanding) of a fund’s stocks, weighted by the proportion of the fund’s assets invested in each stock. Stocks representing half of the fund’s assets have market capitalizations above the median, and the rest are below it.
Price/Book Ratio. The share price of a stock divided by its net worth, or book value, per share. For a fund, the weighted average price/book ratio of the stocks it holds.
Price/Earnings Ratio. The ratio of a stock’s current price to its per-share earnings over the past year. For a fund, the weighted average P/E of the stocks it holds. P/E is an indicator of market expectations about corporate prospects; the higher the P/E, the greater the expectations for a company’s future growth.
Return on Equity. The annual average rate of return generated by a company during the past five years for each dollar of shareholder’s equity (net income divided by shareholder’s equity). For a fund, the weighted average return on equity for the companies whose stocks it holds.
Short-Term Reserves. The percentage of a fund invested in highly liquid, short-term securities that can be readily converted to cash.
Turnover Rate. An indication of the fund’s trading activity. Funds with high turnover rates incur higher transaction costs and may be more likely to distribute capital gains (which may be taxable to investors). The turnover rate excludes in-kind transactions, which have minimal impact on costs.
Yield. A snapshot of a fund’s income from interest and dividends. The yield, expressed as a percentage of the fund’s net asset value, is based on income earned over the past 30 days and is annualized, or projected forward for the coming year. The index yield is based on the current annualized rate of income provided by securities in the index.
22
This page intentionally left blank.
The People Who Govern Your Fund
The trustees of your mutual fund are there to see that the fund is operated and managed in your best interests since, as a shareholder, you are a part owner of the fund. Your fund’s trustees also serve on the board of directors of The Vanguard Group, Inc., which is owned by the Vanguard funds and provides services to them on an at-cost basis.
A majority of Vanguard’s board members are independent, meaning that they have no affiliation with Vanguard or the funds they oversee, apart from the sizable personal investments they have made as private individuals.
Our independent board members bring distinguished backgrounds in business, academia, and public service to their task of working with Vanguard officers to establish the policies and oversee the activities of the funds. Among board members’ responsibilities are selecting investment advisors for the funds; monitoring fund operations, performance, and costs; reviewing contracts; nominating and selecting new trustees/directors; and electing Vanguard officers.
Each trustee serves a fund until its termination; or until the trustee’s retirement, resignation, or death; or otherwise as specified in the fund’s organizational documents. Any trustee may be removed at a shareholders’ meeting by a vote representing two-thirds of the net asset value of all shares of the fund together with shares of other Vanguard funds organized within the same trust. The table on these two pages shows information for each trustee and executive officer of the fund. The mailing address of the trustees and officers is P.O. Box 876, Valley Forge, PA 19482.
Chairman of the Board, Chief Executive Officer, and Trustee |
| |
John J. Brennan1 | |
Born 1954 | Principal Occupation(s) During the Past Five Years: Chairman of the Board, Chief |
Trustee since May 1987; | Executive Officer, and Director/Trustee of The Vanguard Group, Inc., and of each |
Chairman of the Board and | of the investment companies served by The Vanguard Group. |
Chief Executive Officer | |
147 Vanguard Funds Overseen | |
| |
Independent Trustees | |
| |
Charles D. Ellis | |
Born 1937 | Principal Occupation(s) During the Past Five Years: Applecore Partners (pro bono |
Trustee since January 2001 | ventures in education); Senior Advisor to Greenwich Associates (international |
147 Vanguard Funds Overseen | business strategy consulting); Successor Trustee of Yale University; Overseer of |
| the Stern School of Business at New York University; Trustee of the Whitehead |
| Institute for Biomedical Research. |
| |
Rajiv L. Gupta | |
Born 1945 | Principal Occupation(s) During the Past Five Years: Chairman, President, and |
Trustee since December 20012 | Chief Executive Officer of Rohm and Haas Co. (chemicals); Board Member of |
147 Vanguard Funds Overseen | the American Chemistry Council; Director of Tyco International, Ltd. (diversified |
| manufacturing and services) since 2005; Trustee of Drexel University and of the |
| Chemical Heritage Foundation. |
| |
Amy Gutmann | |
Born 1949 | Principal Occupation(s) During the Past Five Years: President of the University of |
Trustee since June 2006 | Pennsylvania since 2004; Professor in the School of Arts and Sciences, |
147 Vanguard Funds Overseen | Annenberg School for Communication, and Graduate School of Education of the |
| University of Pennsylvania since 2004; Provost (2001–2004) and Laurance S. |
| Rockefeller Professor of Politics and the University Center for Human Values |
| (1990–2004), Princeton University; Director of Carnegie Corporation of New York |
| since 2005 and of Schuylkill River Development Corporation and Greater |
| Philadelphia Chamber of Commerce since 2004. |
| |
JoAnn Heffernan Heisen | |
Born 1950 | Principal Occupation(s) During the Past Five Years: Corporate Vice President and |
Trustee since July 1998 | Chief Global Diversity Officer since 2006, Vice President and Chief Information |
147 Vanguard Funds Overseen | Officer (1997–2005), and Member of the Executive Committee of Johnson & |
| Johnson (pharmaceuticals/consumer products); Director of the University Medical |
| Center at Princeton and Women’s Research and Education Institute. |
| |
André F. Perold | |
Born 1952 | Principal Occupation(s) During the Past Five Years: George Gund Professor of |
Trustee since December 2004 | Finance and Banking, Harvard Business School; Senior Associate Dean, Director |
147 Vanguard Funds Overseen | of Faculty Recruiting, and Chair of Finance Faculty, Harvard Business School; |
| Director and Chairman of UNX, Inc. (equities trading firm) since 2003; Chair of the |
| Investment Committee of HighVista Strategies LLC (private investment firm) since |
| 2005. |
| |
Alfred M. Rankin, Jr. | |
Born 1941 | Principal Occupation(s) During the Past Five Years: Chairman, President, Chief |
Trustee since January 1993 | Executive Officer, and Director of NACCO Industries, Inc. (forklift |
147 Vanguard Funds Overseen | trucks/housewares/lignite); Director of Goodrich Corporation (industrial |
| products/aircraft systems and services). |
| |
| |
J. Lawrence Wilson | |
Born 1936 | Principal Occupation(s) During the Past Five Years: Retired Chairman and Chief |
Trustee since April 1985 | Executive Officer of Rohm and Haas Co. (chemicals); Director of Cummins Inc. |
147 Vanguard Funds Overseen | (diesel engines) and AmerisourceBergen Corp. (pharmaceutical distribution); |
| Trustee of Vanderbilt University and of Culver Educational Foundation. |
| |
Executive Officers1 | |
| |
Thomas J. Higgins | |
Born 1957 | Principal Occupation(s) During the Past Five Years: Principal of The Vanguard |
Treasurer since July 1998 | Group, Inc.;Treasurer of each of the investment companies served by The |
147 Vanguard Funds Overseen | Vanguard Group. |
| |
| |
Heidi Stam | |
Born 1956 | Principal Occupation(s) During the Past Five Years: Managing Director of The |
Secretary since July 2005 | Vanguard Group, Inc., since 2006; General Counsel of The Vanguard Group since |
147 Vanguard Funds Overseen | 2005; Secretary of The Vanguard Group, and of each of the investment companies |
| served by The Vanguard Group, since 2005; Principal of The Vanguard Group |
| (1997–2006). |
| |
Vanguard Senior Management Team | | |
| | | |
R. Gregory Barton | Kathleen C. Gubanich | F. William McNabb, III | Ralph K. Packard |
Mortimer J. Buckley | Paul A. Heller | Michael S. Miller | George U. Sauter |
Founder |
|
John C. Bogle |
Chairman and Chief Executive Officer, 1974–1996 |
1 Officers of the funds are “interested persons” as defined in the Investment Company Act of 1940.
2 December 2002 for Vanguard Equity Income Fund, Vanguard Growth Equity Fund, the Vanguard Municipal Bond Funds, and the Vanguard State Tax-Exempt Funds.
More information about the trustees is in the Statement of Additional Information, available from The Vanguard Group.
P.O. Box 2600
Valley Forge, PA 19482-2600
Connect with Vanguard® > www.vanguard.com
Fund Information > 800-662-7447 | All comparative mutual fund data are from Lipper Inc. |
| or Morningstar, Inc., unless otherwise noted. |
Direct Investor Account Services > 800-662-2739 | |
| |
Institutional Investor Services > 800-523-1036 | You can obtain a free copy of Vanguard’s proxy voting |
| guidelines by visiting our website, www.vanguard.com, |
Text Telephone for People | and searching for “proxy voting guidelines,” or by |
With Hearing Impairment > 800-952-3335 | calling Vanguard at 800-662-2739. They are also |
| available from the SEC’s website, www.sec.gov. In |
| addition, you may obtain a free report on how your fund |
| voted the proxies for securities it owned during the 12 |
This material may be used in conjunction | months ended June 30. To get the report, visit either |
with the offering of shares of any Vanguard | www.vanguard.com or www.sec.gov. |
fund only if preceded or accompanied by | |
the fund’s current prospectus. | You can review and copy information about your fund |
| at the SEC’s Public Reference Room in Washington, |
Vanguard, Vanguard ETF, Connect with Vanguard, and | D.C.To find out more about this public service, call the |
the ship logo are trademarks of The Vanguard Group, | SEC at 202-551-8090. Information about your fund is |
Inc. | also available on the SEC’s website, and you can |
| receive copies of this information, for a fee, by sending |
“Dividend Achievers” is a trademark of Mergent, Inc.,and | a request in either of two ways: via e-mail addressed to |
has been licensed for use by The Vanguard Group,Inc. | publicinfo@sec.gov or via regular mail addressed to the |
Vanguard mutual funds are not sponsored, endorsed, | Public Reference Section, Securities and Exchange |
sold, or promoted by Mergent, and Mergent makes no | Commission, Washington, DC 20549-0102. |
representation regarding the advisability of investing in | |
the funds. | |
| |
All other marks are the exclusive property of their | |
respective owners. | |
| |
| |
| |
| |
| |
| |
| |
| |
| |
| |
| |
| |
| |
| |
| © 2007 The Vanguard Group, Inc. |
| All rights reserved. |
| Vanguard Marketing Corporation, Distributor. |
| |
| Q6022 092007 |
Item 2: Not Applicable.
Item 3: Not Applicable.
Item 4: Not Applicable.
Item 5: Not Applicable.
Item 6: Not Applicable.
Item 7: Not applicable.
Item 8: Not Applicable.
Item 9: Not Applicable.
Item 10: Not Applicable.
Item 11: Controls and Procedures.
(a) Disclosure Controls and Procedures. The Principal Executive and Financial Officers concluded that the Registrant's Disclosure Controls and Procedures are effective based on their evaluation of the Disclosure Controls and Procedures as of a date within 90 days of the filing date of this report.
(b) Internal Control Over Financial Reporting. There were no significant changes in Registrant’s Internal Control Over Financial Reporting or in other factors that could significantly affect this control subsequent to the date of the evaluation, including any corrective actions with regard to significant deficiencies and material weaknesses.
Item 12: Exhibits.
Pursuant to the requirements of the Securities Exchange Act of 1934 and the Investment Company Act of 1940, the registrant has duly caused this report to be signed on its behalf by the undersigned, thereunto duly authorized.
| VANGUARD SPECIALIZED FUNDS |
| |
BY: | (signature) |
| (HEIDI STAM) |
| JOHN J. BRENNAN* |
| CHIEF EXECUTIVE OFFICER |
Date September 11, 2007
Pursuant to the requirements of the Securities Exchange Act of 1934 and the Investment Company Act of 1940, this report has been signed below by the following persons on behalf of the registrant and in the capacities and on the dates indicated.
| VANGUARD SPECIALIZED FUNDS |
| |
BY: | (signature) |
| (HEIDI STAM) |
| JOHN J. BRENNAN* |
| CHIEF EXECUTIVE OFFICER |
Date: September 11, 2007
| VANGUARD SPECIALIZED FUNDS |
| |
BY: | (signature) |
| (HEIDI STAM) |
| THOMAS J HIGGINS* |
| TREASURER |
Date: September 11, 2007
*By Power of Attorney. See File Number 333-145624, filed on August 22, 2007. Incorporated by Reference.