UNITED STATES
SECURITIES AND EXCHANGE COMMISSION
Washington, D.C. 20549
FORM N-CSR
CERTIFIED SHAREHOLDER REPORT
OF
REGISTERED MANAGEMENT INVESTMENT COMPANIES
Investment Company Act file number: 811-3916
Name of Registrant: Vanguard Specialized Funds
Address of Registrant:
P.O. Box 2600
Valley Forge, PA 19482
Name and address of agent for service:
Heidi Stam, Esquire
P.O. Box 876
Valley Forge, PA 19482
Registrant’s telephone number, including area code: (610) 669-1000
Date of fiscal year end: January 31
Date of reporting period: February 1, 2007–July 31, 2008
Item 1: Reports to Shareholders

> Vanguard Energy Fund returned 8.7% for the fiscal half-year ended July 31, propelled by soaring oil prices during most of the period.
> Boosted by superior stock selection, the fund’s return surpassed that of its energy sector benchmark by 3.5 percentage points but trailed the average return of natural resources funds.
> Oil and gas drillers and equipment and services providers contributed about half of the fund’s total return.
See pages 27 and 28 for a Notice to Shareholders concerning the fund’s investment advisors.
Contents | |
| |
Your Fund’s Total Returns | 1 |
Chairman’s Letter | 2 |
Advisors’ Report | 6 |
Fund Profile | 9 |
Performance Summary | 11 |
Financial Statements | 12 |
About Your Fund’s Expenses | 24 |
Trustees Approve Advisory Arrangement | 26 |
Glossary | 29 |
Please note: The opinions expressed in this report are just that—informed opinions. They should not be considered promises or advice. Also, please keep in mind that the information and opinions cover the period through the date on the cover of this report. Of course, the risks of investing in your fund are spelled out in the prospectus.
Your Fund’s Total Returns
Six Months Ended July 31, 2008 | | |
| Ticker | Total |
| Symbol | Returns |
Vanguard Energy Fund | | |
Investor Shares | VGENX | 8.7% |
Admiral™ Shares1 | VGELX | 8.7 |
S&P Energy Sector Index | | 5.2 |
Average Natural Resources Fund2 | | 12.9 |
Your Fund’s Performance at a Glance |
January 31, 2008–July 31, 2008 | | | | |
| | | Distributions Per Share |
| Starting | Ending | Income | Capital |
| Share Price | Share Price | Dividends | Gains |
Vanguard Energy Fund | | | | |
Investor Shares | $73.93 | $78.46 | $0.022 | $1.817 |
Admiral Shares | 138.86 | 147.40 | 0.058 | 3.413 |
1 A lower-cost class of shares available to many longtime shareholders and to those with significant investments in the fund.
2 Derived from data provided by Lipper Inc.
1

Chairman’s Letter
Dear Shareholder,
Vanguard Energy Fund returned 8.7% for both Investor and Admiral Shares for the first half of fiscal 2008, surpassing the benchmark Standard & Poor’s Energy Sector Index return by 3.5 percentage points. (It’s important to keep in mind that this index, although an appropriate comparison, is highly concentrated and includes only United States-based companies.)
As oil prices climbed inexorably until mid-July, energy was again the market’s best-performing sector. Your fund also benefited from astute stock selection by its advisors, Wellington Management Company, LLP, and Vanguard Quantitative Equity Group.
The Energy Fund trailed the average return of natural resources peer funds, which invest in sectors beyond energy—including metals and mining. Your fund’s focus on large, integrated companies with diversified oil and gas reserves also served as a headwind as some smaller, resource-oriented companies notched extraordinary gains.
Stocks rode a bumpy path to disappointing results
U.S. stocks struggled during the half-year, a period of pronounced volatility in the financial markets. Continued weakness in the housing market, record oil prices, rising unemployment, and an uptick in inflation combined to set a downbeat tone.
2
The broad U.S. market performed well in April and May, but those returns were bookended by declines earlier and later in the period. June was a particularly difficult month; the market returned –8.2%, the worst single-month decline in more than five years.
For the half-year, the broad U.S. stock market returned –5.9%. Investors favored small-capitalization stocks over large- and mid-caps, and growth stocks over their value-oriented counterparts. International stocks also experienced high levels of volatility, and returned –3.8%.
Bond investors remained cautious in the wake of the subprime crisis
In the extensive fallout from the subprime-mortgage crisis, bond investors continued to prefer the safety of short-term, high-quality issues—most notably U.S. Treasury securities. During the period, bonds outpaced stocks, but registered negative returns in aggregate. The broad taxable bond market returned –0.6%. Municipal bonds, which experienced a spike in volatility, returned –0.9%.
During the half-year, the Federal Reserve Board lowered its target for the federal funds rate twice, reducing it by a full percentage point to 2.00%. At its June meeting (and again at its August meeting after the end of the fund’s fiscal period),
Market Barometer | | | |
| | Total Returns |
| Periods Ended July 31, 2008 |
| Six Months | One Year | Five Years1 |
Stocks | | | |
Russell 1000 Index (Large-caps) | –6.6% | –10.6% | 7.5% |
Russell 2000 Index (Small-caps) | 0.9 | –6.7 | 9.8 |
Dow Jones Wilshire 5000 Index (Entire market) | –5.9 | –10.2 | 8.1 |
MSCI All Country World Index ex USA (International) | –3.8 | –9.3 | 17.9 |
| | | |
| | | |
Bonds | | | |
Lehman U.S. Aggregate Bond Index (Broad taxable market) | –0.6% | 6.2% | 4.6% |
Lehman Municipal Bond Index | –0.9 | 2.8 | 4.3 |
Citigroup 3-Month Treasury Bill Index | 1.0 | 3.1 | 3.1 |
| | | |
| | | |
CPI | | | |
Consumer Price Index | 4.2% | 5.6% | 3.6% |
| | | |
| | | |
| | | |
| | | |
1 Annualized. | | | |
3
the Fed voted to leave the target rate unchanged, signaling a growing concern about near-term inflation.
Stock selection enhanced strong sector performance
Soaring oil prices continued to make headlines in Vanguard Energy Fund’s fiscal first half. Driven by supply/demand dynamics and a weak U.S. dollar, West Texas Intermediate crude oil—an industry benchmark—climbed from about $90 per barrel to a record of more than $145 per barrel in mid-July, then eased slightly.
Most segments of the Energy Fund benefited from higher energy prices, but there was some rotation among the leading contributors. Oil and gas drillers and equipment and services providers (whose average weighting, by market cap, represented only about 17% of the portfolio) contributed about half of the fund’s six-month return, eclipsing the major integrated producers. Notable contributors (with returns ranging from 22% to 53%) included Baker Hughes, Halliburton, Nabors Industries, Seadrill, and two top-ten holdings—Schlumberger and Weatherford International.
Integrated oil and gas producers—representing slightly more than half of the portfolio’s average weighting—contributed almost 3 percentage points to total return. Their performance was mixed, in part because rising energy prices benefited producing operations but depressed refining margins. Among leading contributors were Russian-based
Annualized Expense Ratios1 | | | |
Your Fund Compared With Its Peer Group | | | |
| | | Average |
| | | Natural |
| Investor | Admiral | Resources |
| Shares | Shares | Fund |
Energy Fund | 0.25% | 0.18% | 1.43% |
1 Fund expense ratios reflect the six months ended July 31, 2008. Peer-group expense ratio is derived from data provided by Lipper Inc. and captures information through year-end 2007.
4
LUKOIL, Norway’s StatoilHydro, and top-ten holding Occidental Petroleum. ExxonMobil—the largest holding in both the fund (6%, on average) and the benchmark index (28%, on average)—was a notable detractor, despite reporting record earnings.
Higher oil and gas prices make harder-to-access reserves more economically viable. This spurred exploration and production companies, which contributed almost 2 percentage points to total return, led by Canadian Natural Resources, Devon Energy, and EOG Resources. In contrast, the leading detractors were oil and gas refiners and marketers, a small slice of the portfolio that was squeezed by higher crude-oil input costs. The advisors’ astute stock selection within this challenged sector helped to bolster the fund’s total return.
Build a balanced portfolio and then stick with it
Investors have been whipsawed by volatile stock and bond markets, which can lead to rash investment decisions. We believe the key to investment success is to determine a diversified mix of stock, bond, and money market funds that is consistent with your goals, time horizon, and risk tolerance. Once you have established your asset allocation plan, try to stick with it. And, always, pay attention to costs.
Energy companies have enjoyed particularly strong performance amid unsettled markets. No matter how tempting it may be to chase today’s winners, we encourage you to maintain a steady, long-term perspective, just as the advisors do in managing this fund. And remember that any sector-specific fund should play a complementary—rather than a cornerstone—role in a balanced portfolio. Vanguard Energy Fund, by providing diversified, low-cost exposure across the energy markets, can help you meet your financial goals.
When I wrote to you six months ago, Vanguard’s board had elected F. William McNabb III as the fund’s president and designated him to succeed me as chief executive officer. The board has since announced that Bill will assume the chief executive role on August 31. Bill and the rest of our team will serve you and our other clients extremely well in the years ahead.
Thank you for entrusting your assets to Vanguard.
Sincerely,

John J. Brennan
Chairman and Chief Executive Officer
August 13, 2008
5
Advisors’ Report
For the fiscal half-year ended July 31, 2008, both the Investor and Admiral Shares of Vanguard Energy Fund returned 8.7%, reflecting the combined efforts of your fund’s two advisors. The use of multiple advisors enhances the fund’s diversification by providing exposure to distinct, yet complementary, investment approaches.
The advisors, the percentage and amount of fund assets each manages, and brief descriptions of their investment strategies are presented in the table below. The advisors have also prepared a discussion of the investment environment that existed during the six months and of how their portfolio positioning reflects this assessment. These reports were prepared on August 12, 2008.
Wellington Management Company, LLP
Portfolio Managers:
Karl E. Bandtel, Senior Vice President
James A. Bevilacqua, Senior Vice President
Energy prices were quite volatile during the six months ended July 31. Crude oil prices rose dramatically to a peak of about $147 per barrel in early July before beginning a steady retreat. The large and rapid increase came as inventories failed to build as expected in the spring because of continued supply disruptions and disappointing supply growth outside of the Organization of the Petroleum Exporting Countries (OPEC). Demand was weaker than projected, but still grew enough to keep inventories low. Crude oil futures
Vanguard Energy Fund Investment Advisors | |
| | | |
| Fund Assets Managed | |
Investment Advisor | % | $ Million | Investment Strategy |
Wellington Management | 94 | 13,243 | Emphasizes long-term total-return opportunities from |
Company, LLP | | | the various energy subsectors: international oils, |
| | | foreign integrated oils and foreign producers, North |
| | | American producers, oil services and equipment, |
| | | transportation and distribution, and refining |
| | | and marketing. |
Vanguard Quantitative | 5 | 771 | Conducts quantitative portfolio management using |
Equity Group | | | models that assess valuation, marketplace sentiment, |
| | | and earnings quality of companies compared with |
| | | their peers. |
Cash Investments1 | 1 | 188 | |
1 These short-term reserves are invested by Vanguard in equity index products to simulate investments in stock. Each advisor may also maintain a modest cash position.
6
prices also rose dramatically as the market seemed to infer that these now quite familiar themes would persist.
Natural gas prices were also volatile, rising from around $8 per thousand cubic feet (mcf) in late January to nearly $14 per mcf in late June before correcting back toward the $8-per-mcf level. The rise came despite signs that North American natural gas production is finally growing materially, primarily because of new completion techniques being used in tight gas and shale formations. The benefit of this increase in production has been tempered by reduced liquefied natural gas imports because North American prices remain below those available in other ports of call. The net effect of all of these factors left natural gas inventories tracking generally in line with historical averages while prices swung wildly.
Our portion of the portfolio benefited from holding Canadian Natural Resources, a large, independent exploration and production company with an attractive long-term resource base. The company has managed a sizable capital program quite well in this environment and is getting closer to bringing on its major oil sands project in Athabasca largely on time and close to budget. On the flip side, despite generally stronger commodity prices, ExxonMobil shares declined, most likely reflecting general stock market weakness as well as investor concerns about access to resources and effective redeployment of prodigious cash flows in the future.
Turnover remained low in our portion of the portfolio. We added to our position in oil-field services provider Baker Hughes as the stock came under pressure in February and March amid relatively disappointing short-term results. Baker Hughes remains well-positioned to take advantage of an environment of strong global activity as well as increased shale development and enhanced recovery activity. We reduced holdings in Repsol YPF, an integrated Spanish oil and gas company, after shares surged on news of a potentially significant offshore discovery near Brazil in which the firm has a partnership interest.
Vanguard Quantitative Equity Group
Portfolio Manager:
James D. Troyer, CFA, Principal
The investing environment for energy companies continued to be favorable as the price of crude oil increased more than 30% on strong demand and tight capacity, and natural gas prices rose more than 10%.
Over the past six months, our quantitative models successfully identified the better-performing companies in our energy benchmark. Our valuation and market-sentiment models were positive contributors to our relative performance. A key characteristic of our strategy is that we do not maintain a “view” on the overall market for energy shares. Our portion of the portfolio is always fully invested. We apply a stringent risk-control process to neutralize our exposure to market capitalization, volatility, and industry risks relative to our benchmark.
7
The resulting portfolio takes many small positions in individual stocks in an attempt to capture the market’s tendency to over-or underreact to new information.
Our positions in Brazil’s Petrobras and U.S. firms National Oilwell Varco, Devon Energy, and Pioneer National Resources were particularly successful. Detracting from our relative performance were our holdings of Thai Oil Public Company (Thailand) and Cosmo Oil (Japan) as well as underweighted positions in StatoilHydro (Norway) and Tenaris (Argentina).
Focusing on the performance of individual names, however, can distract attention from a quantitative model’s objective, which is to make many small systematic bets, rigorously tested and applied, in order to catch relatively small mispricings across large numbers of stocks. The success or failure of a few names is not as important as the average return we earn over our entire portfolio. Over the long run, our quantitative process has demonstrated its ability to add value. We continue to believe that a portfolio of energy securities with attractive valuations, high earnings quality, and market acceptance coupled with disciplined risk control can play an effective role in a diversified investment plan. We thank you for your investment and trust and look forward to the remainder of the fiscal year.
8
Fund Profile
As of July 31, 2008
Portfolio Characteristics | | |
| | Comparative | Broad |
| Fund | Index1 | Index2 |
Number of Stocks | 104 | 39 | 4,724 |
Median Market Cap | $64.7B | $121.2B | $31.5B |
Price/Earnings Ratio | 11.5x | 11.2x | 16.6x |
Price/Book Ratio | 2.7x | 2.7x | 2.3x |
Yield3 | | 1.5% | 2.1% |
Investor Shares | 1.6% | | |
Admiral Shares | 1.7% | | |
Return on Equity | 27.9% | 27.7% | 19.7% |
Earnings Growth Rate | 34.9% | 38.2% | 18.5% |
Foreign Holdings | 45.7% | 0.0% | 0.0% |
Turnover Rate4 | 20% | — | — |
Expense Ratio4 | | — | — |
Investor Shares | 0.25% | | |
Admiral Shares | 0.18% | | |
Short-Term Reserves | 3.4% | — | — |
Sector Diversification5 (% of equity exposure) |
| |
Coal & Consumable Fuels | 3.8% |
Industrials | 0.7 |
Integrated Oil & Gas | 51.8 |
Materials | 3.2 |
Oil & Gas Drilling | 3.5 |
Oil & Gas Equipment & Services | 13.2 |
Oil & Gas Exploration & Production | 18.5 |
Oil & Gas Refining & Marketing | 2.4 |
Oil & Gas Storage & Transportation | 0.4 |
Utilities | 1.9 |
Other | 0.6 |
Volatility Measures6 | |
| Fund Versus | Fund Versus |
| Comparative Index1 | Broad Index2 |
R-Squared | 0.93 | 0.24 |
Beta | 1.03 | 1.07 |
Ten Largest Holdings7 (% of total net assets) |
| |
ExxonMobil Corp. | 6.5% |
Weatherford International Ltd. | 3.8 |
ConocoPhillips Co. | 3.7 |
Royal Dutch Shell PLC | 3.7 |
Chevron Corp. | 3.6 |
Total SA | 3.6 |
Schlumberger Ltd. | 3.6 |
BHP Billiton Ltd. | 3.0 |
Occidental Petroleum Corp. | 3.0 |
BG Group PLC | 3.0 |
Top Ten | 37.5% |
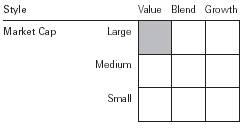
Investment Focus
1 S&P Energy Sector Index.
2 Dow Jones Wilshire 5000 Index.
3 30-day SEC yield for the fund; annualized dividend yield for the indexes. See the Glossary on pages 29–30.
4 Annualized.
5 Sector percentages combine U.S. and international holdings.
6 For an explanation of R-squared, beta, and other terms used here, see the Glossary on pages 29–30.
7 The holdings listed exclude any temporary cash investments and equity index products.
9
Market Diversification (% of equity exposure) |
| |
United States | 52.9% |
Canada | 11.5 |
United Kingdom | 9.2 |
Russia | 4.8 |
Australia | 4.4 |
France | 3.7 |
Norway | 2.9 |
Brazil | 2.8 |
India | 1.9 |
Italy | 1.9 |
Spain | 1.4 |
Other | 2.6 |
10
Performance Summary
All of the returns in this report represent past performance, which is not a guarantee of future results that may be achieved by the fund. (Current performance may be lower or higher than the performance data cited. For performance data current to the most recent month-end, visit our website at www.vanguard.com/performance.) Note, too, that both investment returns and principal value can fluctuate widely, so an investor’s shares, when sold, could be worth more or less than their original cost. The returns shown do not reflect taxes that a shareholder would pay on fund distributions or on the sale of fund shares.
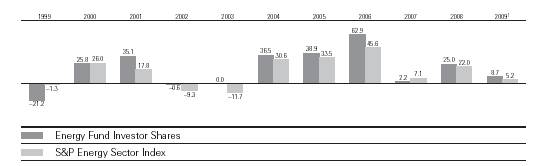
Fiscal-Year Total Returns (%): January 31, 1998–July 31, 2008
Average Annual Total Returns: Periods Ended June 30, 2008
This table presents average annual total returns through the latest calendar quarter—rather than through the end of the fiscal period. Securities and Exchange Commission rules require that we provide this information.
| Inception Date | One Year | Five Years | Ten Years |
Investor Shares2 | 5/23/1984 | 31.09% | 34.39% | 20.30% |
Admiral Shares2 | 11/12/2001 | 31.18 | 34.47 | 27.733 |
1 Six months ended July 31, 2008.
2 Total returns do not reflect the 1% redemption fee assessed on redemptions of shares held less than one year, nor for the Investor Shares do they include the account service fee that may be applicable to certain accounts with balances below $10,000.
3 Return since inception.
Note: See Financial Highlights tables on pages 18–19 for dividend and capital gains information.
11
Financial Statements (unaudited)
Statement of Net Assets
As of July 31, 2008
The fund provides a complete list of its holdings four times in each fiscal year, at the quarter-ends. For the second and fourth fiscal quarters, the lists appear in the fund’s semiannual and annual reports to shareholders. For the first and third fiscal quarters, the fund files the lists with the Securities and Exchange Commission on Form N-Q. Shareholders can look up the fund’s Forms N-Q on the SEC’s website at www.sec.gov. Forms N-Q may also be reviewed and copied at the SEC’s Public Reference Room (see the back cover of this report for further information).
| | | Market |
| | | Value• |
| | Shares | ($000) |
Common Stocks (96.0%)1 | | |
United States (50.4%) | | |
Energy Equipment & Services (14.0%) | | |
| Oil & Gas Drilling (2.1%) | | |
* | Transocean, Inc. | 2,055,564 | 279,618 |
| Noble Corp. | 141,072 | 7,317 |
| ENSCO International, Inc. | 93,014 | 6,431 |
* | Pride International, Inc. | 149,300 | 5,787 |
| Patterson-UTI Energy, Inc. | 177,400 | 5,042 |
| | | |
| Oil & Gas Equipment & Services (11.9%) | |
* | Weatherford | | |
| International Ltd. | 14,147,024 | 533,767 |
| Schlumberger Ltd. | 4,971,464 | 505,101 |
| Baker Hughes, Inc. | 4,920,911 | 407,993 |
| Halliburton Co. | 5,240,932 | 234,899 |
* | National Oilwell Varco Inc. | 43,017 | 3,383 |
| | | 1,989,338 |
Gas Utilities (1.8%) | | |
| Equitable Resources, Inc. | 2,851,800 | 149,007 |
| Questar Corp. | 2,002,500 | 105,892 |
| | | 254,899 |
Oil, Gas & Consumable Fuels (34.1%) | | |
| Coal & Consumable Fuels (3.6%) | | |
| CONSOL Energy, Inc. | 4,367,800 | 324,921 |
| Peabody Energy Corp. | 2,639,000 | 178,528 |
| Arch Coal, Inc. | 58,400 | 3,289 |
| | | |
| Integrated Oil & Gas (20.1%) | | |
| ExxonMobil Corp. | 11,495,531 | 924,586 |
| ConocoPhillips Co. | 6,432,809 | 525,046 |
| Chevron Corp. | 6,124,435 | 517,882 |
| Occidental Petroleum Corp. | 5,389,401 | 424,846 |
| Marathon Oil Corp. | 4,931,591 | 243,966 |
| Hess Corp. | 2,061,589 | 209,045 |
| Murphy Oil Corp. | 96,700 | 7,710 |
| | | |
| Oil & Gas Exploration & Production (9.0%) | |
| EOG Resources, Inc. | 3,352,336 | 337,010 |
| Noble Energy, Inc. | 2,864,600 | 211,608 |
| Devon Energy Corp. | 1,745,976 | 165,676 |
| Chesapeake Energy Corp. | 3,281,455 | 164,565 |
| Cabot Oil & Gas Corp. | 3,037,000 | 133,658 |
* | Newfield Exploration Co. | 2,392,800 | 117,199 |
| XTO Energy, Inc. | 2,387,677 | 112,770 |
| Apache Corp. | 113,370 | 12,717 |
| Anadarko Petroleum Corp. | 174,660 | 10,115 |
* | Denbury Resources, Inc. | 200,392 | 5,639 |
* | Plains Exploration & | | |
| Production Co. | 97,700 | 5,468 |
| Cimarex Energy Co. | 94,700 | 4,935 |
| | | |
| Oil & Gas Refining & Marketing (1.0%) | | |
| Valero Energy Corp. | 3,662,751 | 122,373 |
| Sunoco, Inc. | 424,400 | 17,235 |
| | | |
| Oil & Gas Storage & Transportation (0.4%) | |
| Williams Cos., Inc. | 1,647,682 | 52,808 |
| | | 4,833,595 |
Exchange-Traded Fund (0.5%) | | |
2 | Vanguard Energy ETF | 663,000 | 74,229 |
Total United States | | 7,152,061 |
International (45.6%) | | |
Argentina (0.0%) | | |
| Petrobras Energia | | |
| Participaciones SA ADR | 439,848 | 4,711 |
| | | |
Australia (4.2%) | | |
| BHP Billiton Ltd. ADR | 5,800,000 | 433,028 |
| Woodside Petroleum Ltd. | | |
| ADR | 3,331,600 | 165,497 |
| Woodside Petroleum Ltd. | 28,737 | 1,443 |
| | | 599,968 |
12
| | | Market |
| | | Value• |
| | Shares | ($000) |
Austria (0.9%) | | |
| OMV AG | 1,869,214 | 128,714 |
| | | |
Brazil (2.7%) | | |
| Petroleo Brasileiro SA ADR | 6,277,700 | 350,986 |
| Petroleo Brasileiro SA Pfd. | 684,420 | 15,591 |
| Petroleo Brasileiro SA | 430,242 | 11,998 |
| | | 378,575 |
Canada (11.1%) | | |
| Canadian Natural | | |
| Resources Ltd. | 4,656,200 | 363,416 |
| Suncor Energy, Inc. | 5,447,400 | 296,883 |
| EnCana Corp. | 3,240,700 | 233,946 |
| Canadian Oil Sands Trust | 4,221,175 | 212,058 |
| Petro-Canada (U.S. Shares) | 3,337,000 | 154,270 |
| Husky Energy Inc. | 3,079,900 | 136,377 |
| Talisman Energy, Inc. | 6,420,631 | 114,812 |
| Canadian Natural | | |
| Resources Ltd. | 170,739 | 13,341 |
| Canadian Oil Sands Trust | 251,200 | 12,619 |
| Petro-Canada | 201,450 | 9,298 |
| EnCana Corp. | 126,139 | 9,104 |
| Nexen Inc. | 242,300 | 7,622 |
| Suncor Energy, Inc. | 130,452 | 7,091 |
| Addax Petroleum Corp. | 127,200 | 4,968 |
| TransCanada Corp. | 15,696 | 609 |
| | | 1,576,414 |
China (0.1%) | | |
| CNOOC Ltd. | 3,575,717 | 5,275 |
| Yanzhou Coal Mining Co. | | |
| Ltd. H Shares | 2,864,000 | 5,169 |
| China Oilfield Services Ltd. | 3,286,000 | 4,868 |
| PetroChina Co. Ltd. | 1,464,000 | 1,949 |
| | | 17,261 |
France (3.6%) | | |
| Total SA ADR | 6,098,100 | 466,383 |
| Total SA | 528,655 | 40,478 |
| | | 506,861 |
Greece (0.0%) | | |
| Hellenic Petroleum SA | 52,340 | 686 |
| | | |
Hong Kong (0.0%) | | |
| CNPC Hong Kong Ltd. | 8,700,000 | 3,697 |
| | | |
India (1.8%) | | |
| Reliance Industries Ltd. | 3,186,261 | 164,307 |
| Oil and Natural Gas | | |
| Corp. Ltd. | 3,460,050 | 80,371 |
3 | Oil & Natural Gas Corp., Ltd. | | |
| Warrants Exp. 7/11/10 | 351,450 | 8,231 |
* | Reliance Petroleum Ltd. | 949,370 | 3,638 |
| | | 256,547 |
Indonesia (0.0%) | | |
| PT Bumi Resources Tbk | 5,715,500 | 4,190 |
Italy (1.9%) | | |
| Eni SpA ADR | 3,551,850 | 239,395 |
| Eni SpA | 698,548 | 23,572 |
| | | 262,967 |
Japan (0.0%) | | |
| Cosmo Oil Co., Ltd. | 1,470,000 | 4,533 |
| Nippon Mining Holdings Inc. | 240,000 | 1,446 |
| | | 5,979 |
Netherlands (0.8%) | | |
| Fugro NV | 1,539,827 | 109,252 |
| | | |
Norway (2.8%) | | |
| Statoil ASA ADR | 6,577,900 | 212,992 |
| Seadrill Ltd. | 5,618,640 | 167,783 |
| StatoilHydro ASA | 422,560 | 13,688 |
| | | 394,463 |
Poland (0.0%) | | |
| Polski Koncern Naftowy SA | 326,500 | 5,767 |
| | | |
Russia (4.6%) | | |
| OAO Gazprom | | |
| Sponsored ADR | 8,424,996 | 403,218 |
| LUKOIL ADR | 2,836,000 | 235,539 |
| LUKOIL Sponsored ADR | 152,600 | 12,674 |
| Tatneft GDR | 16,500 | 1,960 |
* | Rosneft Oil Co. GDR | 135,000 | 1,428 |
| | | 654,819 |
South Africa (0.1%) | | |
| Sasol Ltd. | 218,574 | 11,655 |
| | | |
South Korea (0.6%) | | |
| Hyundai Heavy | | |
| Industries Co., Inc. | 268,654 | 81,796 |
| SK Energy Co., Ltd. | 55,600 | 5,658 |
| | | 87,454 |
Spain (1.4%) | | |
| Repsol YPF, SA ADR | 5,561,800 | 185,931 |
| Repsol YPF SA | 171,949 | 5,761 |
| | | 191,692 |
Thailand (0.1%) | | |
| PTT Public Co. Ltd. (Foreign) | 761,300 | 5,642 |
| PTT Exploration and | | |
| Production Public Co. Ltd. | | |
| (Foreign) | 1,240,200 | 5,518 |
| | | 11,160 |
Turkey (0.0%) | | |
| Tupras-Turkiye Petrol | | |
| Rafinerileri A.S. | 203,913 | 5,509 |
13
| | | Market |
| | | Value• |
| | Shares | ($000) |
United Kingdom (8.9%) | | |
| BG Group PLC | 18,601,108 | 420,390 |
| Royal Dutch Shell PLC ADR | | |
| Class B | 3,920,726 | 275,078 |
| BP PLC ADR | 4,455,800 | 273,764 |
| Royal Dutch Shell | | |
| PLC ADR Class A | 2,768,500 | 195,982 |
| BP PLC | 4,546,980 | 46,668 |
| Royal Dutch Shell PLC | | |
| Class A | 780,289 | 27,705 |
| Royal Dutch Shell PLC | | |
| Class B | 603,776 | 21,203 |
| Royal Dutch Shell PLC | | |
| Class A | | |
| (Amsterdam Shares) | 117,600 | 4,170 |
| | | 1,264,960 |
Total International | | 6,483,301 |
Total Common Stocks | | |
(Cost $6,886,629) | | 13,635,362 |
Temporary Cash Investments (4.2%)1 | | |
Money Market Fund (0.7%) | | |
4 | Vanguard Market Liquidity | | |
| Fund, 2.386% | 103,116,450 | 103,116 |
| | | Market |
| | | Value• |
| | Shares | ($000) |
Repurchase Agreements (3.4%) | | |
| Deutsche Bank Securities, Inc. 2.200%, | | |
| 8/1/08 (Dated 7/31/08, | | |
| Repurchase Value $476,629,000, | | |
| collateralized by Federal Home | | |
| Loan Mortgage Corp. | | |
| 4.000%–7.000%, | | |
| 3/1/15–6/1/38 and | | |
| Federal National | | |
| Mortgage Assn. | | |
| 6.000%, 1/1/38 and | | |
| Government National | | |
| Mortgage Assn. | | |
| 7.000%, | | |
| 11/15/36–4/15/38) | 476,600 | 476,600 |
| | | |
U.S. Agency Obligations (0.1%) | | |
5 | Federal Home Loan Bank | | |
6 | 2.432%, 10/15/08 | 200 | 199 |
5 | Federal Home Loan Mortgage Corp. | | |
| 2.158%, 8/25/08 | 5,000 | 4,993 |
5 | Federal National Mortgage Assn. | | |
6 | 2.124%, 8/1/08 | 200 | 200 |
| 2.040%, 8/6/08 | 10,000 | 9,997 |
6 | 2.037%, 8/18/08 | 300 | 300 |
6 | 2.205%, 8/18/08 | 200 | 200 |
| | | 15,889 |
Total Temporary Cash Investments | | |
(Cost $595,605) | | 595,605 |
Total Investments (100.2%) | | |
(Cost $7,482,234) | 14,230,967 | |
Other Assets and Liabilities (–0.2%) | | |
Other Assets—Note C | | 31,713 |
Liabilities | | (60,517) |
| | | (28,804) |
Net Assets (100%) | | 14,202,163 |
| | | | |
14
At July 31, 2008, net assets consisted of:7 |
| Amount |
| ($000) |
Paid-in Capital | 7,068,750 |
Undistributed Net Investment Income | 121,360 |
Accumulated Net Realized Gains | 271,499 |
Unrealized Appreciation (Depreciation) | |
Investment Securities | 6,748,733 |
Futures Contracts | (8,243) |
Foreign Currencies | 64 |
Net Assets | 14,202,163 |
| |
| |
Investor Shares—Net Assets | |
Applicable to 108,162,895 outstanding | |
$.001 par value shares of beneficial interest | |
(unlimited authorization) | 8,486,397 |
Net Asset Value Per Share— | |
Investor Shares | $78.46 |
| |
| |
Admiral Shares—Net Assets | |
Applicable to 38,778,063 outstanding | |
$.001 par value shares of beneficial | |
interest (unlimited authorization) | 5,715,766 |
Net Asset Value Per Share— | |
Admiral Shares | $147.40 |
• See Note A in Notes to Financial Statements.
* Non-income-producing security.
1 The fund invests a portion of its cash reserves in equity markets through the use of index futures contracts. After giving effect to futures investments, the fund’s effective common stock and temporary cash investment positions represent 96.8% and 3.4%, respectively, of net assets. See Note D in Notes to Financial Statements.
2 Considered an affiliated company of the fund as the issuer is another member of The Vanguard Group.
3 Security exempt from registration under Rule 144A of the Securities Act of 1933. Such securities may be sold in transactions exempt from registration, normally to qualified institutional buyers. At July 31, 2008, the value of this security represented 0.06% of net assets.
4 Affiliated money market fund available only to Vanguard funds and certain trusts and accounts managed by Vanguard. Rate shown is the 7-day yield.
5 The issuer operates under a congressional charter; its securities are neither issued nor guaranteed by the U.S. government.
6 Securities with a value of $899,000 have been segregated as initial margin for open futures contracts.
7 See Note D in Notes to Financial Statements for the tax-basis components of net assets.
ADR—American Depositary Receipt.
GDR—Global Depositary Receipt.
15
Statement of Operations
| Six Months Ended |
| July 31, 2008 |
| ($000) |
Investment Income | |
Income | |
Dividends1,2 | 137,422 |
Interest2 | 10,701 |
Security Lending | 2,831 |
Total Income | 150,954 |
Expenses | |
Investment Advisory Fees—Note B | |
Basic Fee | 5,925 |
Performance Adjustment | 649 |
The Vanguard Group—Note C | |
Management and Administrative | |
Investor Shares | 6,497 |
Admiral Shares | 2,352 |
Marketing and Distribution | |
Investor Shares | 913 |
Admiral Shares | 510 |
Custodian Fees | 110 |
Shareholders’ Reports | |
Investor Shares | 54 |
Admiral Shares | 8 |
Trustees’ Fees and Expenses | 11 |
Total Expenses | 17,029 |
Net Investment Income | 133,925 |
Realized Net Gain (Loss) | |
Investment Securities Sold2 | 292,333 |
Futures Contracts | (30,379) |
Foreign Currencies | (561) |
Realized Net Gain (Loss) | 261,393 |
Change in Unrealized Appreciation (Depreciation) | |
Investment Securities | 724,875 |
Futures Contracts | 1,704 |
Foreign Currencies | (134) |
Change in Unrealized Appreciation (Depreciation) | 726,445 |
Net Increase (Decrease) in Net Assets Resulting from Operations | 1,121,763 |
1 Dividends are net of foreign withholding taxes of $10,485,000.
2 Dividend income, interest income, and realized net gain (loss) from affiliated companies of the fund were $0, $3,455,000, and $0, respectively.
16
Statement of Changes in Net Assets
| Six Months Ended | | Year Ended |
| July 31, | | January 31, |
| 2008 | | 2008 |
| ($000) | | ($000) |
Increase (Decrease) in Net Assets | | | |
Operations | | | |
Net Investment Income | 133,925 | | 210,661 |
Realized Net Gain (Loss) | 261,393 | | 915,449 |
Change in Unrealized Appreciation (Depreciation) | 726,445 | | 1,363,542 |
Net Increase (Decrease) in Net Assets Resulting from Operations | 1,121,763 | | 2,489,652 |
Distributions | | | |
Net Investment Income | | | |
Investor Shares | (2,365) | | (119,127) |
Admiral Shares | (2,181) | | (83,384) |
Realized Capital Gain1 | | | |
Investor Shares | (195,258) | | (435,495) |
Admiral Shares | (128,303) | | (280,073) |
Total Distributions | (328,107) | | (918,079) |
Capital Share Transactions—Note F | | | |
Investor Shares | 57,100 | | 422,009 |
Admiral Shares | 218,872 | | 1,048,332 |
Net Increase (Decrease) from Capital Share Transactions | 275,972 | | 1,470,341 |
Total Increase (Decrease) | 1,069,628 | | 3,041,914 |
Net Assets | | | |
Beginning of Period | 13,132,535 | | 10,090,621 |
End of Period2 | 14,202,163 | | 13,132,535 |
1 Includes fiscal 2009 and 2008 short-term gain distributions totaling $0 and $64,462,000, respectively. Short-term gain distributions are treated as ordinary income dividends for tax purposes.
2 Net Assets—End of Period includes undistributed (overdistributed) net investment income of $121,360,000 and ($7,458,000).
17
Financial Highlights
Investor Shares | | | | | | |
| | | | | | |
| Six Months | | | | | |
| Ended | | | |
For a Share Outstanding | July 31, | Year Ended January 31, |
Throughout Each Period | 2008 | 2008 | 2007 | 2006 | 2005 | 2004 |
Net Asset Value, Beginning of Period | $73.93 | $63.55 | $64.50 | $40.85 | $29.99 | $22.85 |
Investment Operations | | | | | | |
Net Investment Income | .730 | 1.226 | 1.112 | .813 | .529 | .435 |
Net Realized and Unrealized Gain (Loss) | | | | | | |
on Investments1 | 5.639 | 14.639 | .405 | 24.606 | 11.052 | 7.839 |
Total from Investment Operations | 6.369 | 15.865 | 1.517 | 25.419 | 11.581 | 8.274 |
Distributions | | | | | | |
Dividends from Net Investment Income | (.022) | (1.177) | (1.020) | (.740) | (.524) | (.390) |
Distributions from Realized Capital Gains | (1.817) | (4.308) | (1.447) | (1.029) | (.197) | (.744) |
Total Distributions | (1.839) | (5.485) | (2.467) | (1.769) | (.721) | (1.134) |
Net Asset Value, End of Period | $78.46 | $73.93 | $63.55 | $64.50 | $40.85 | $29.99 |
| | | | | | |
| | | | | | |
Total Return2 | 8.71% | 25.02% | 2.24% | 62.93% | 38.90% | 36.49% |
| | | | | | |
| | | | | | |
Ratios/Supplemental Data | | | | | | |
Net Assets, End of Period (Millions) | $8,486 | $7,919 | $6,479 | $6,733 | $4,822 | $2,434 |
Ratio of Total Expenses to | | | | | | |
Average Net Assets | 0.25%3,* | 0.25% | 0.25% | 0.28% | 0.32% | 0.38% |
Ratio of Net Investment Income to | | | | | | |
Average Net Assets | 1.75%* | 1.67% | 1.71% | 1.57% | 1.67% | 1.79% |
Portfolio Turnover Rate4 | 20%* | 22% | 22% | 10% | 1% | 26% |
1 Includes increases from redemption fees of $.02, $.02, $.03, $.03, $.02, and $.00.
2 Total returns do not reflect the 1% fee assessed on redemptions of shares held less than one year, nor do they include the account service fee that may be applicable to certain accounts with balances below $10,000.
3 Includes a performance-based investment advisory fee increase of 0.01%.
4 Excludes the value of portfolio securities received or delivered as a result of in-kind purchases or redemptions of the fund’s capital shares.
* Annualized.
18
Admiral Shares | | | | | | |
| | | | | | |
| Six Months | | | | | |
| Ended | | | |
For a Share Outstanding | July 31, | Year Ended January 31, |
Throughout Each Period | 2008 | 2008 | 2007 | 2006 | 2005 | 2004 |
Net Asset Value, Beginning of Period | $138.86 | $119.35 | $121.13 | $76.71 | $56.30 | $42.89 |
Investment Operations | | | | | | |
Net Investment Income | 1.424 | 2.418 | 2.180 | 1.561 | 1.034 | .847 |
Net Realized and Unrealized Gain (Loss) | | | | | | |
on Investments1 | 10.587 | 27.505 | .757 | 46.217 | 20.770 | 14.721 |
Total from Investment Operations | 12.011 | 29.923 | 2.937 | 47.778 | 21.804 | 15.568 |
Distributions | | | | | | |
Dividends from Net Investment Income | (.058) | (2.322) | (2.000) | (1.425) | (1.024) | (.760) |
Distributions from Realized Capital Gains | (3.413) | (8.091) | (2.717) | (1.933) | (.370) | (1.398) |
Total Distributions | (3.471) | (10.413) | (4.717) | (3.358) | (1.394) | (2.158) |
Net Asset Value, End of Period | $147.40 | $138.86 | $119.35 | $121.13 | $76.71 | $56.30 |
| | | | | | |
| | | | | | |
Total Return2 | 8.75% | 25.13% | 2.32% | 63.00% | 39.02% | 36.58% |
| | | | | | |
| | | | | | |
Ratios/Supplemental Data | | | | | | |
Net Assets, End of Period (Millions) | $5,716 | $5,214 | $3,612 | $3,088 | $549 | $208 |
Ratio of Total Expenses to | | | | | | |
Average Net Assets | 0.18%3,* | 0.17% | 0.18% | 0.22% | 0.26% | 0.32% |
Ratio of Net Investment Income to | | | | | | |
Average Net Assets | 1.82%* | 1.75% | 1.78% | 1.63% | 1.70% | 1.85% |
Portfolio Turnover Rate4 | 20%* | 22% | 22% | 10% | 1% | 26% |
1 Includes increases from redemption fees of $.03, $.03, $.05, $.03, $.03, and $.01.
2 Total returns do not reflect the 1% fee assessed on redemptions of shares held less than one year.
3 Includes a performance-based investment advisory fee increase of 0.01%.
4 Excludes the value of portfolio securities received or delivered as a result of in-kind purchases or redemptions of the fund’s capital shares.
* Annualized.
See accompanying Notes, which are an integral part of the Financial Statements.
19
Notes to Financial Statements
Vanguard Energy Fund is registered under the Investment Company Act of 1940 as an open-end investment company, or mutual fund. The fund files reports with the SEC under the company name Vanguard Specialized Funds. The fund may invest in securities of foreign issuers, which may subject it to investment risks not normally associated with investing in securities of United States corporations. The fund offers two classes of shares, Investor Shares and Admiral Shares. Investor Shares are available to any investor who meets the fund’s minimum purchase requirements. Admiral Shares are designed for investors who meet certain administrative, service, tenure, and account-size criteria.
A. The following significant accounting policies conform to generally accepted accounting principles for U.S. mutual funds. The fund consistently follows such policies in preparing its financial statements.
1. Security Valuation: Securities are valued as of the close of trading on the New York Stock Exchange (generally 4 p.m., Eastern time) on the valuation date. Equity securities are valued at the latest quoted sales prices or official closing prices taken from the primary market in which each security trades; such securities not traded on the valuation date are valued at the mean of the latest quoted bid and asked prices. Securities for which market quotations are not readily available, or whose values have been affected by events occurring before the fund’s pricing time but after the close of the securities’ primary markets, are valued at their fair values calculated according to procedures adopted by the board of trustees. These procedures include obtaining quotations from an independent pricing service, monitoring news to identify significant market- or security-specific events, and evaluating changes in the values of foreign market proxies (for example, ADRs, futures contracts, or exchange-traded funds), between the time the foreign markets close and the fund’s pricing time. When fair-value pricing is employed, the prices of securities used by a fund to calculate its net asset value may differ from quoted or published prices for the same securities. Investments in Vanguard Market Liquidity Fund are valued at that fund’s net asset value. Temporary cash investments acquired over 60 days to maturity are valued using the latest bid prices or using valuations based on a matrix system (which considers such factors as security prices, yields, maturities, and ratings), both as furnished by independent pricing services. Other temporary cash investments are valued at amortized cost, which approximates market value.
2. Foreign Currency: Securities and other assets and liabilities denominated in foreign currencies are translated into U.S. dollars using exchange rates obtained from an independent third party as of the fund’s pricing time on the valuation date. Realized gains (losses) and unrealized appreciation (depreciation) on investment securities include the effects of changes in exchange rates since the securities were purchased, combined with the effects of changes in security prices. Fluctuations in the value of other assets and liabilities resulting from changes in exchange rates are recorded as unrealized foreign currency gains (losses) until the assets or liabilities are settled in cash, at which time they are recorded as realized foreign currency gains (losses).
3. Futures Contracts: The fund uses index futures contracts to a limited extent, with the objective of maintaining full exposure to the stock market while maintaining liquidity. The fund may purchase or sell futures contracts to achieve a desired level of investment, whether to accommodate portfolio turnover or cash flows from capital share transactions. The primary risks associated with the use of futures contracts are imperfect correlation between changes in market values of stocks held by the fund and the prices of futures contracts, and the possibility of an illiquid market.
Futures contracts are valued based upon their quoted daily settlement prices. The aggregate principal amounts of the contracts are not recorded in the Statement of Net Assets. Fluctuations in the value of the contracts are recorded in the Statement of Net Assets as an asset (liability) and in the Statement of Operations as unrealized appreciation (depreciation) until the contracts are closed, when they are recorded as realized futures gains (losses).
20
4. Repurchase Agreements: The fund may invest in repurchase agreements. Securities pledged as collateral for repurchase agreements are held by a custodian bank until the agreements mature. Each agreement requires that the market value of the collateral be sufficient to cover payments of interest and principal; however, in the event of default or bankruptcy by the other party to the agreement, retention of the collateral may be subject to legal proceedings.
5. Federal Income Taxes: The fund intends to continue to qualify as a regulated investment company and distribute all of its taxable income. Management has analyzed the fund’s tax positions taken on federal income tax returns for all open tax years (tax years ended January 31, 2005–2008), and for the period ended July 31, 2008, and has concluded that no provision for federal income tax is required in the fund’s financial statements.
6. Distributions: Distributions to shareholders are recorded on the ex-dividend date.
7. Security Lending: The fund may lend its securities to qualified institutional borrowers to earn additional income. Security loans are required to be secured at all times by collateral at least equal to the market value of securities loaned. The fund invests cash collateral received in Vanguard Market Liquidity Fund, and records a liability for the return of the collateral, during the period the securities are on loan. Security lending income represents the income earned on investing cash collateral, less expenses associated with the loan.
8. Other: Dividend income is recorded on the ex-dividend date. Interest income includes income distributions received from Vanguard Market Liquidity Fund and is accrued daily. Security transactions are accounted for on the date securities are bought or sold. Costs used to determine realized gains (losses) on the sale of investment securities are those of the specific securities sold. Fees assessed on redemptions of capital shares are credited to paid-in capital.
Each class of shares has equal rights as to assets and earnings, except that each class separately bears certain class-specific expenses related to maintenance of shareholder accounts (included in Management and Administrative expenses) and shareholder reporting. Marketing and distribution expenses are allocated to each class of shares based on a method approved by the board of trustees. Income, other non-class-specific expenses, and gains and losses on investments are allocated to each class of shares based on its relative net assets.
B. Wellington Management Company, LLP, provides investment advisory services to a portion of the fund for a fee calculated at an annual percentage rate of average net assets managed by the advisor. The basic fee is subject to quarterly adjustments based on performance since May 1, 2007, relative to a combined index composed of the S&P Citigroup BMI World Energy Index and the S&P 500 Energy Equal Weighted Blend Index.
The Vanguard Group provides investment advisory services to a portion of the fund on an at-cost basis; the fund paid Vanguard advisory fees of $117,000 for the six months ended July 31, 2008.
21
For the six months ended July 31, 2008, the aggregate investment advisory fee represented an effective annual rate of 0.08% of the fund’s average net assets before an increase of $649,000 (0.01%) based on performance.
C. The Vanguard Group furnishes at cost corporate management, administrative, marketing, and distribution services. The costs of such services are allocated to the fund under methods approved by the board of trustees. The fund has committed to provide up to 0.40% of its net assets in capital contributions to Vanguard. At July 31, 2008, the fund had contributed capital of $1,449,000 to Vanguard (included in Other Assets), representing 0.01% of the fund’s net assets and 1.45% of Vanguard’s capitalization. The fund’s trustees and officers are also directors and officers of Vanguard.
D. Distributions are determined on a tax basis and may differ from net investment income and realized capital gains for financial reporting purposes. Differences may be permanent or temporary. Permanent differences are reclassified among capital accounts in the financial statements to reflect their tax character. Temporary differences arise when certain items of income, expense, gain, or loss are recognized in different periods for financial statement and tax purposes; these differences will reverse at some time in the future. Differences in classification may also result from the treatment of short-term gains as ordinary income for tax purposes. The fund’s tax-basis capital gains and losses are determined only at the end of each fiscal year.
During the six months ended July 31, 2008, the fund realized net foreign currency losses of $561,000, which decreased distributable net income for tax purposes; accordingly, such losses have been reclassified from accumulated net realized gains to undistributed net investment income.
At July 31, 2008, the cost of investment securities for tax purposes was $7,482,234,000. Net unrealized appreciation of investment securities for tax purposes was $6,748,733,000, consisting of unrealized gains of $6,855,059,000 on securities that had risen in value since their purchase and $106,326,000 in unrealized losses on securities that had fallen in value since their purchase.
At July 31, 2008, the aggregate settlement value of open futures contracts expiring in September 2008 and the related unrealized appreciation (depreciation) were:
| | | ($000) |
| | Aggregate | Unrealized |
| Number of | Settlement | Appreciation |
Futures Contracts | Long Contracts | Value | (Depreciation) |
S&P 500 Index | 369 | 116,890 | (8,240) |
E-mini S&P 500 Index | 5 | 317 | (3) |
Unrealized appreciation (depreciation) on open futures contracts is required to be treated as realized gain (loss) for tax purposes.
22
E. During the six months ended July 31, 2008, the fund purchased $1,562,796,000 of investment securities
and sold $1,396,731,000 of investment securities other than temporary cash investments.
F. Capital share transactions for each class of shares were:
| Six Months Ended | Year Ended |
| July 31, 2008 | January 31, 2008 |
| Amount | Shares | | Amount | Shares |
| ($000) | (000) | | ($000) | (000) |
Investor Shares | | | | | |
Issued | 1,115,148 | 13,136 | | 1,916,427 | 25,320 |
Issued in Lieu of Cash Distributions | 190,676 | 2,523 | | 534,104 | 7,173 |
Redeemed1 | (1,248,724) | (14,605) | | (2,028,522) | (27,338) |
Net Increase (Decrease)—Investor Shares | 57,100 | 1,054 | | 422,009 | 5,155 |
Admiral Shares | | | | | |
Issued | 814,193 | 4,937 | | 1,557,799 | 10,982 |
Issued in Lieu of Cash Distributions | 120,304 | 848 | | 334,798 | 2,381 |
Redeemed1 | (715,625) | (4,555) | | (844,265) | (6,076) |
Net Increase (Decrease)—Admiral Shares | 218,872 | 1,230 | | 1,048,332 | 7,287 |
G. In September 2006, the Financial Accounting Standards Board issued Statement of Financial Accounting Standards No. 157 (“FAS 157”),“Fair Value Measurements.” FAS 157 establishes a framework for measuring fair value and expands disclosures about fair value measurements in financial statements, effective for the fund’s current fiscal period.
The various inputs that may be used to determine the value of the fund’s investments are summarized in three broad levels. The inputs or methodologies used for valuing securities are not necessarily an indication of the risk associated with investing in those securities.
Level 1—Quoted prices in active markets for identical securities.
Level 2—Other significant observable inputs (including quoted prices for similar securities, interest rates, prepayment speeds, credit risk, etc.).
Level 3—Significant unobservable inputs (including the fund’s own assumptions used to determine the fair value of investments).
The following table summarizes the fund’s investments as of July 31, 2008, based on the inputs used to value them:
| Investments | Futures |
| in Securities | Contracts |
Valuation Inputs | ($000) | ($000) |
Level 1—Quoted Prices | 11,658,538 | 8,243 |
Level 2—Other Significant Observable Inputs | 2,572,429 | — |
Level 3—Significant Unobservable Inputs | — | — |
Total | 14,230,967 | 8,243 |
1 Net of redemption fees of $2,735,000 and $3,474,000 (fund totals).
23
About Your Fund’s Expenses
As a shareholder of the fund, you incur ongoing costs, which include costs for portfolio management, administrative services, and shareholder reports (like this one), among others. Operating expenses, which are deducted from a fund’s gross income, directly reduce the investment return of the fund.
A fund’s expenses are expressed as a percentage of its average net assets. This figure is known as the expense ratio. The following examples are intended to help you understand the ongoing costs (in dollars) of investing in your fund and to compare these costs with those of other mutual funds. The examples are based on an investment of $1,000 made at the beginning of the period shown and held for the entire period.
The table below illustrates your fund’s costs in two ways:
• Based on actual fund return. This section helps you to estimate the actual expenses that you paid over the period. The “Ending Account Value” shown is derived from the fund’s actual return, and the third column shows the dollar amount that would have been paid by an investor who started with $1,000 in the fund. You may use the information here, together with the amount you invested, to estimate the expenses that you paid over the period.
To do so, simply divide your account value by $1,000 (for example, an $8,600 account value divided by $1,000 = 8.6), then multiply the result by the number given for your fund under the heading “Expenses Paid During Period.”
• Based on hypothetical 5% yearly return. This section is intended to help you compare your fund’s costs with those of other mutual funds. It assumes that the fund had a yearly return of 5% before expenses, but that the expense ratio is unchanged. In this case—because the return used is not the fund’s actual return—the results do not apply to your investment. The example is useful in making comparisons because the Securities and Exchange Commission requires all mutual funds to calculate expenses based on a 5% return. You can assess your fund’s costs by comparing this hypothetical example with the hypothetical examples that appear in shareholder reports of other funds.
Six Months Ended July 31, 2008 | | | |
| Beginning | Ending | Expenses |
| Account Value | Account Value | Paid During |
Energy Fund | 1/31/2008 | 7/31/2008 | Period1 |
Based on Actual Fund Return | | | |
Investor Shares | $1,000.00 | $1,087.10 | $1.30 |
Admiral Shares | 1,000.00 | 1,087.46 | 0.93 |
Based on Hypothetical 5% Return | | | |
Investor Shares | $1,000.00 | $1,023.62 | $1.26 |
Admiral Shares | 1,000.00 | 1,023.97 | 0.91 |
1 These calculations are based on expenses incurred in the most recent six-month period. The fund’s annualized six-month expense ratios for that period are 0.25% for Investor Shares and 0.18% for Admiral Shares. The dollar amounts shown as “Expenses Paid” are equal to the annualized expense ratio multiplied by the average account value over the period, multiplied by the number of days in the most recent six-month period, then divided by the number of days in the most recent 12-month period.
24
Note that the expenses shown in the table on page 24 are meant to highlight and help you compare ongoing costs only and do not reflect transaction costs incurred by the fund for buying and selling securities. Further, the expenses do not include the 1% fee on redemptions of shares held for less than one year, nor do they include the account service fee described in the prospectus. If such fees were applied to your account, your costs would be higher. Your fund does not carry a “sales load.”
The calculations assume no shares were bought or sold during the period. Your actual costs may have been higher or lower, depending on the amount of your investment and the timing of any purchases or redemptions.
You can find more information about the fund’s expenses, including annual expense ratios, in the Financial Statements section of this report. For additional information on operating expenses and other shareholder costs, please refer to your fund’s current prospectus.
25
Trustees Approve Advisory Arrangement
The board of trustees of Vanguard Energy Fund has renewed the fund’s investment advisory arrangement with The Vanguard Group, Inc. through its Quantitative Equity Group (QEG). The board determined that renewing the fund's advisory arrangement with Vanguard was in the best interests of the fund and its shareholders. The board also approved an amended investment advisory agreement with Wellington Management Company, LLP, effective August 1, 2008. Please see the Shareholder Notice in this report for information about the board’s approval of Wellington Management’s amended agreement.
The board based its decision upon an evaluation of the QEG’s investment staff, portfolio management process, and performance. The trustees considered the factors discussed below, among others. However, no single factor determined whether the board approved the arrangement. Rather, it was the totality of the circumstances that drove the board’s decision.
Nature, extent, and quality of services
The board considered the quality of the fund’s investment management over both the short and long term, and took into account the organizational depth and stability of the advisor. The board noted that Vanguard has been managing investments for more than two decades. George U. Sauter, Vanguard managing director and chief investment officer, has been in the investment management business since 1985. Mr. Sauter has led QEG since 1987. QEG adheres to a sound, disciplined investment management process; the team has considerable experience, stability, and depth. Vanguard has managed a portion of the fund since 2005.
The board concluded that the advisor’s experience, stability, depth, and performance among other factors warranted the continuation of the fund’s advisory arrangement with Vanguard.
Investment performance
The board considered the short- and long-term performance of the fund, including any periods of outperformance or underperformance of a relevant benchmark and peer group. The board concluded that the advisor has carried out its investment strategy in disciplined fashion, and that performance results have been in line with expectations. Information about the fund’s most recent performance can be found in the Performance Summary section of this report.
Cost
The board concluded that the fund’s expense ratio was far below the average expense ratio charged by funds in its peer group. The board noted that the fund’s advisory expense ratio was also well below its peer-group average. Information about the fund’s expense ratio appears in the About Your Fund’s Expenses section of this report as well as in the Financial Statements section, which also includes information about the fund’s advisory fee rate.
The board does not conduct a profitability analysis of Vanguard because of Vanguard’s unique “at-cost” structure. Unlike most other mutual fund management companies, Vanguard is owned by the funds it oversees, and produces “profits” only in the form of reduced expenses for fund shareholders.
The benefit of economies of scale
The board concluded that the fund’s low-cost arrangement with Vanguard ensures that the fund will realize economies of scale as it grows, with the cost to shareholders declining as the fund’s assets managed by Vanguard increase.
The board will consider whether to renew the advisory arrangement again after a one-year period.
26
Notice to Shareholders
The board of trustees of Vanguard Energy Fund has adopted a new advisory fee schedule for one of the fund’s advisors, Wellington Management Company, LLP (Wellington Management), effective August 1, 2008. The new advisory fee schedule is expected to increase the fund’s expense ratio by 0.03%. For shareholders, the increase represents an additional $3.00 in costs on a $10,000 investment. This change will not affect the fund’s investment objective, policies, or strategies. The Vanguard Group, Inc., also provides investment advisory services to the fund.
The fund’s trustees regularly evaluate its investment advisory arrangements, focusing on factors such as the advisor’s investment process, style consistency, and performance, as well as the composition and depth of the management and research teams. In deciding to adopt the new fee schedule, the trustees considered the fund’s performance together with a wide range of information relating to Wellington Management, which has managed the fund since its inception in 1984.
The fund has entered into a new investment advisory agreement with Wellington Management to reflect the new fee schedule; however, other terms of the existing agreement have not changed. Under the terms of the agreement, the fund will pay Wellington Management a fee at the end of each fiscal quarter. The fee is calculated by applying an annual percentage rate to the fund’s average daily net assets of the Wellington Management Portfolio for the quarter.
For the six months ended July 31, 2008, the total advisory fees paid by Vanguard Energy Fund were $6,574,000, or 0.09% of the fund’s average net assets. The Vanguard Group provides advisory services to the fund on an at-cost basis. Of the aggregate fees paid for the period, the investment advisory expenses incurred by Vanguard were $117,000 (representing an effective annual rate of less than 0.01%). If the new fee schedule had been in place throughout the period, the advisory fees paid by the fund would have been $9,075,000 or 0.12% of the fund’s average net assets. The average advisory fee paid by funds in Vanguard Energy Fund’s Lipper peer group was 0.66% of assets, as of December 31, 2007.
Board approval of the investment advisory agreement
Wellington Management is responsible for managing the investment and reinvestment of the Wellington Management Portfolio, which represents a portion of the Energy Fund’s assets. In managing these assets, Wellington Management is responsible for continuously reviewing, supervising, and administering the fund’s investment program. The advisor discharges its responsibilities subject to the supervision and oversight of the officers and trustees of the fund.
The fund’s trustees retained Wellington Management under the terms of an investment advisory agreement. The board’s decision to revise the current advisory fee schedule was based upon its most recent evaluation of the advisor’s investment staff, portfolio management process, and performance results. In considering whether to approve the new agreement, the board engaged in arms-length discussions with Wellington Management and considered the following factors, among others:
The trustees considered the benefits to shareholders of continuing to retain Wellington Management as advisor to the fund, particularly in light of the nature, extent, and quality of services provided by Wellington Management. The board considered the quality of investment management to the fund over both the short and long term and the organizational depth and stability of the firm. Specifically, the board noted that Wellington Management has advised the fund since its inception in 1984. Further, the board noted that Wellington Management utilizes a bottom-up investment approach, in which stocks are selected based on the advisor’s estimates of fundamental investment value. The advisor’s investment process emphasizes company fundamentals, management track record, and security valuation. The board concluded that the existing advisory fee schedule should be adjusted to reflect the fair market value of Wellington Management’s services and the firm’s need to maintain an expanded
27
portfolio management team to manage a large fund in this market segment. The new fee arrangement will enable Wellington Management to enhance the organizational depth and stability of the fund’s portfolio management team by retaining top investment talent and by hiring new investment professionals on an as-needed basis.
The trustees considered the fund’s investment performance compared with those of the fund’s peer group and a relevant benchmark. The board concluded that the fund’s short- and long-term performance has been consistently competitive versus both the fund’s benchmark, the S&P Energy Sector Index, and the fund’s peer group (as defined by Lipper Inc.).
The trustees considered the cost of services to be provided, including consideration of competitive fee rates and the fact that, after the adjustment, the fund’s advisory fee will remain significantly lower than the fees charged by most of the fund’s peers.
The trustees considered the extent to which economies of scale would be realized as the fund grows, including a consideration of appropriate breakpoints in the fee schedule. By including asset-based breakpoints in Wellington Management’s fee schedule, the trustees ensure that if the fund continues to grow, investors will benefit by realizing economies of scale in the form of a lower advisory fee ratio.
The trustees considered all of the circumstances and information provided by both Wellington Management and Vanguard regarding the performance of the fund and concluded that approval of the investment advisory agreement is in the best interests of the fund and its shareholders.
The advisory agreement will continue for a period of one year from its effective date and is renewable after that for successive one-year periods. The agreement will be reviewed annually by the fund’s trustees, a majority of whom are not “interested persons” of either the fund or Wellington Management as defined in federal securities laws.
Background information on Wellington Management
Wellington Management Company, LLP, a Massachusetts partnership with offices at 75 State Street, Boston, MA 02109, is an investment firm that was founded in 1928. As of January 31, 2008, the firm managed approximately $557 billion in assets for a variety of clients, including mutual funds, institutions, and separate accounts. The managers primarily responsible for overseeing Wellington Management’s portion of Vanguard Energy Fund are:
Karl E. Bandtel, senior vice president and equity portfolio manager of Wellington Management. Mr. Bandtel has worked in investment management with Wellington Management since 1990; had been assistant fund manager since 1992; has been fund manager since 2002; and has co-managed Wellington Management’s portion of the fund since 2005. Education: B.S. and M.S., University of Wisconsin.
James A. Bevilacqua, senior vice president and equity portfolio manager of Wellington Management. Mr. Bevilacqua has worked in investment management with Wellington Management since 1994; has been involved in the portfolio management and securities analysis of the fund since 1998; and has co-managed Wellington Management’s portion of the fund since 2005. Education: B.S. and M.S., Massachusetts Institute of Technology; M.B.A., Stanford Graduate School of Business.
Wellington Management is owned by its 99 active partners, all of whom are active members of the firm. The managing partners of the firm are Phillip H. Perelmuter, Brendan J. Swords, and Perry M. Traquina. Please note that the managing partners are not necessarily those with the largest economic interests in the firm.
28
Glossary
Beta. A measure of the magnitude of a fund’s past share-price fluctuations in relation to the ups and downs of a given market index. The index is assigned a beta of 1.00. Compared with a given index, a fund with a beta of 1.20 typically would have seen its share price rise or fall by 12% when the index rose or fell by 10%. For this report, beta is based on returns over the past 36 months for both the fund and the index. Note that a fund’s beta should be reviewed in conjunction with its R-squared (see definition below). The lower the R-squared, the less correlation there is between the fund and the index, and the less reliable beta is as an indicator of volatility.
Earnings Growth Rate. The average annual rate of growth in earnings over the past five years for the stocks now in a fund.
Equity Exposure. A measure that reflects a fund’s investments in stocks and stock futures. Any holdings in short-term reserves are excluded.
Expense Ratio. The percentage of a fund’s average net assets used to pay its annual administrative and advisory expenses. These expenses directly reduce returns to investors.
Foreign Holdings. The percentage of a fund represented by stocks or depositary receipts of companies based outside the United States.
Inception Date. The date on which the assets of a fund (or one of its share classes) are first invested in accordance with the fund’s investment objective. For funds with a subscription period, the inception date is the day after that period ends. Investment performance is measured from the inception date.
Median Market Cap. An indicator of the size of companies in which a fund invests; the midpoint of market capitalization (market price x shares outstanding) of a fund’s stocks, weighted by the proportion of the fund’s assets invested in each stock. Stocks representing half of the fund’s assets have market capitalizations above the median, and the rest are below it.
Price/Book Ratio. The share price of a stock divided by its net worth, or book value, per share. For a fund, the weighted average price/book ratio of the stocks it holds.
Price/Earnings Ratio. The ratio of a stock’s current price to its per-share earnings over the past year. For a fund, the weighted average P/E of the stocks it holds. P/E is an indicator of market expectations about corporate prospects; the higher the P/E, the greater the expectations for a company’s future growth.
R-Squared. A measure of how much of a fund’s past returns can be explained by the returns from the market in general, as measured by a given index. If a fund’s total returns were precisely synchronized with an index’s returns, its R-squared would be 1.00. If the fund’s returns bore no relationship to the index’s returns, its R-squared would be 0. For this report, R-squared is based on returns over the past 36 months for both the fund and the index.
Return on Equity. The annual average rate of return generated by a company during the past five years for each dollar of shareholder’s equity (net income divided by shareholder’s equity). For a fund, the weighted average return on equity for the companies whose stocks it holds.
Short-Term Reserves. The percentage of a fund invested in highly liquid, short-term securities that can be readily converted to cash.
Turnover Rate. An indication of the fund’s trading activity. Funds with high turnover rates incur higher transaction costs and may be more likely to distribute capital gains (which may be taxable to investors). The turnover rate excludes in-kind transactions, which have minimal impact on costs.
29
Yield. A fund’s 30-day SEC yield is derived using a formula specified by the U.S. Securities and Exchange Commission. Under the formula, data related to the fund’s security holdings in the previous 30 days are used to calculate the fund’s hypothetical net income for that period, which is then annualized and divided by the fund’s estimated average net assets over the calculation period. For the purposes of this calculation, a security’s income is based on its current market yield to maturity (in the case of bonds) or its projected dividend yield (for stocks). Because the SEC yield represents hypothetical annualized income, it will differ—at times significantly—from the fund’s actual experience. As a result, the fund’s income distributions may be higher or lower than implied by the SEC yield.
30
This page intentionally left blank.
The People Who Govern Your Fund
The trustees of your mutual fund are there to see that the fund is operated and managed in your best interests since, as a shareholder, you are a part owner of the fund. Your fund’s trustees also serve on the board of directors of The Vanguard Group, Inc., which is owned by the Vanguard funds and provides services to them on an at-cost basis.
A majority of Vanguard’s board members are independent, meaning that they have no affiliation with Vanguard or the funds they oversee, apart from the sizable personal investments they have made as private individuals.
Our independent board members bring distinguished backgrounds in business, academia, and public service to their task of working with Vanguard officers to establish the policies and oversee the activities of the funds. Among board members’ responsibilities are selecting investment advisors for the funds; monitoring fund operations, performance, and costs; reviewing contracts; nominating and selecting new trustees/directors; and electing Vanguard officers.
Each trustee serves a fund until its termination; or until the trustee’s retirement, resignation, or death; or otherwise as specified in the fund’s organizational documents. Any trustee may be removed at a shareholders’ meeting by a vote representing two-thirds of the net asset value of all shares of the fund together with shares of other Vanguard funds organized within the same trust. The table on these two pages shows information for each trustee and executive officer of the fund. The mailing address of the trustees and officers is P.O. Box 876, Valley Forge, PA 19482.
Chairman of the Board, Chief Executive Officer, and Trustee
John J. Brennan1
Born 1954 Principal Occupation(s) During the Past Five Years: Chairman of the Board, Chief Executive Trustee Since May 1987; Officer, and Director/Trustee of The Vanguard Group, Inc., and of each of the investment Chairman of the Board and companies served by The Vanguard Group; Director of Vanguard Marketing Corporation. Chief Executive Officer 156 Vanguard Funds Overseen
Independent Trustees
Charles D. Ellis
Born 1937 Principal Occupation(s) During the Past Five Years: Applecore Partners (pro bono ventures Trustee Since January 2001 in education); Senior Advisor to Greenwich Associates (international business strategy 156 Vanguard Funds Overseen consulting); Successor Trustee of Yale University; Overseer of the Stern School of Business at New York University; Trustee of the Whitehead Institute for Biomedical Research.
Emerson U. Fullwood
Born 1948 Principal Occupation(s) During the Past Five Years: Executive Chief Staff and Marketing Trustee Since January 2008 Officer for North America since 2004 and Corporate Vice President of Xerox Corporation 156 Vanguard Funds Overseen (photocopiers and printers); Director of SPX Corporation (multi-industry manufacturing), of the United Way of Rochester, and of the Boy Scouts of America.
Rajiv L. Gupta
Born 1945 Principal Occupation(s) During the Past Five Years: Chairman, President, and Trustee Since December 20012 Chief Executive Officer of Rohm and Haas Co. (chemicals); Board Member of 156 Vanguard Funds Overseen the American Chemistry Council; Director of Tyco International, Ltd. (diversified manufacturing and services) since 2005.
Amy Gutmann
Born 1949 Principal Occupation(s) During the Past Five Years: President of the University of
Trustee Since June 2006 Pennsylvania since 2004; Professor in the School of Arts and Sciences, Annenberg School 156 Vanguard Funds Overseen for Communication, and Graduate School of Education of the University of Pennsylvania since 2004; Provost (2001–2004) and Laurance S. Rockefeller Professor of Politics and the University Center for Human Values (1990–2004), Princeton University; Director of
Carnegie Corporation of New York since 2005 and of Schuylkill River Development Corporation and Greater Philadelphia Chamber of Commerce since 2004; Trustee of the National Constitution Center since 2007.
JoAnn Heffernan Heisen
Born 1950 Principal Occupation(s) During the Past Five Years: Corporate Vice President and Trustee Since July 1998 Chief Global Diversity Officer since 2006, Vice President and Chief Information 156 Vanguard Funds Overseen Officer (1997–2005), and Member of the Executive Committee of Johnson & Johnson (pharmaceuticals/consumer products); Director of the University Medical Center at Princeton and Women’s Research and Education Institute.
André F. Perold
Born 1952 Principal Occupation(s) During the Past Five Years: George Gund Professor of Finance Trustee Since December 2004 and Banking, Harvard Business School; Senior Associate Dean and Director of Faculty 156 Vanguard Funds Overseen Recruiting, Harvard Business School; Director and Chairman of UNX, Inc. (equities trading firm); Chair of the Investment Committee of HighVista Strategies LLC (private investment firm) since 2005.
Alfred M. Rankin, Jr.
Born 1941 Principal Occupation(s) During the Past Five Years: Chairman, President, Chief Executive Trustee Since January 1993 Officer, and Director of NACCO Industries, Inc. (forklift trucks/housewares/lignite); Director 156 Vanguard Funds Overseen of Goodrich Corporation (industrial products/aircraft systems and services).
J. Lawrence Wilson
Born 1936 Principal Occupation(s) During the Past Five Years: Retired Chairman and Chief Executive Trustee Since April 1985 Officer of Rohm and Haas Co. (chemicals); Director of Cummins Inc. (diesel engines) and 156 Vanguard Funds Overseen AmerisourceBergen Corp. (pharmaceutical distribution); Trustee of Vanderbilt University and of Culver Educational Foundation.
Executive Officers1
Thomas J. Higgins
Born 1957 Principal Occupation(s) During the Past Five Years: Principal of The Vanguard Group, Inc.; Treasurer Since July 1998 Treasurer of each of the investment companies served by The Vanguard Group. 156 Vanguard Funds Overseen
F. William McNabb III
Born 1957 Principal Occupation(s) During the Past Five Years: President of The Vanguard Group, Inc., President Since March 2008 and of each of the investment companies served by The Vanguard Group since 2008; 156 Vanguard Funds Overseen Director of Vanguard Marketing Corporation; Managing Director of The Vanguard Group (1995–2008).
Heidi Stam
Born 1956 Principal Occupation(s) During the Past Five Years: Managing Director of The Vanguard Secretary Since July 2005 Group, Inc., since 2006; General Counsel of The Vanguard Group since 2005; Secretary of 156 Vanguard Funds Overseen The Vanguard Group, and of each of the investment companies served by The Vanguard Group, since 2005; Director and Senior Vice President of Vanguard Marketing Corporation since 2005; Principal of The Vanguard Group (1997–2006).
Vanguard Senior Management Team | | |
| | | |
R. Gregory Barton | Kathleen C. Gubanich | Michael S. Miller | Glenn W. Reed |
Mortimer J. Buckley | Paul A. Heller | Ralph K. Packard | George U. Sauter |
Founder |
|
John C. Bogle |
Chairman and Chief Executive Officer, 1974–1996 |
1 Officers of the funds are “interested persons” as defined in the Investment Company Act of 1940.
2 December 2002 for Vanguard Equity Income Fund, Vanguard Growth Equity Fund, the Vanguard Municipal Bond Funds, and the Vanguard State Tax-Exempt Funds.
More information about the trustees is in the Statement of Additional Information, available from The Vanguard Group.

P.O. Box 2600
Valley Forge, PA 19482-2600
Connect with Vanguard® > www.vanguard.com
Fund Information > 800-662-7447 | Vanguard, Admiral, Connect with Vanguard, and the |
| ship logo are trademarks of The Vanguard Group, Inc. |
Direct Investor Account Services > 800-662-2739 | |
| All other marks are the exclusive property of their |
Institutional Investor Services > 800-523-1036 | respective owners. |
| |
Text Telephone for People | |
With Hearing Impairment > 800-952-3335 | All comparative mutual fund data are from Lipper Inc. |
| or Morningstar, Inc., unless otherwise noted. |
| |
| |
| You can obtain a free copy of Vanguard’s proxy voting |
| guidelines by visiting our website, www.vanguard.com, |
This material may be used in conjunction | and searching for “proxy voting guidelines,” or by |
with the offering of shares of any Vanguard | calling Vanguard at 800-662-2739. The guidelines are |
fund only if preceded or accompanied by | also available from the SEC’s website, www.sec.gov. |
the fund’s current prospectus. | In addition, you may obtain a free report on how your |
| fund voted the proxies for securities it owned during |
| the 12 months ended June 30. To get the report, visit |
| either www.vanguard.com or www.sec.gov. |
| |
| You can review and copy information about your fund |
| at the SEC’s Public Reference Room in Washington, D.C. |
| To find out more about this public service, call the SEC |
| at 202-551-8090. Information about your fund is also |
| available on the SEC’s website, and you can receive |
| copies of this information, for a fee, by sending a |
| request in either of two ways: via e-mail addressed to |
| publicinfo@sec.gov or via regular mail addressed to the |
| Public Reference Section, Securities and Exchange |
| Commission, Washington, DC 20549-0102. |
| |
| |
| |
| |
| |
| © 2008 The Vanguard Group, Inc. |
| All rights reserved. |
| Vanguard Marketing Corporation, Distributor. |
| |
| Q512 092008 |

> For the six months ended July 31, 2008, Vanguard Precious Metals and Mining Fund posted a return of –1.6%.
> The fund beat the returns of its benchmark by more than 2.5 percentage points and outperformed returns for the average gold-oriented fund.
> Big contributors for the period included coal- and nickel-mining companies, while producers of platinum and gold were both weak spots.
Contents | |
| |
Your Fund’s Total Returns | 1 |
Chairman’s Letter | 2 |
Advisor’s Report | 6 |
Fund Profile | 8 |
Performance Summary | 9 |
Financial Statements | 10 |
About Your Fund’s Expenses | 19 |
Trustees Approve Advisory Agreement | 21 |
Glossary | 22 |
Please note: The opinions expressed in this report are just that—informed opinions. They should not be considered promises or advice. Also, please keep in mind that the information and opinions cover the period through the date on the cover of this report. Of course, the risks of investing in your fund are spelled out in the prospectus.
Your Fund’s Total Returns
Six Months Ended July 31, 2008 | | |
| Ticker | Total |
| Symbol | Returns |
Vanguard Precious Metals and Mining Fund | VGPMX | –1.6% |
S&P/Citigroup Custom Precious Metals and Mining Index | | –4.2 |
Average Gold-Oriented Fund1 | | –10.8 |
Your Fund’s Performance at a Glance |
January 31, 2008–July 31, 2008 | | | | |
| | | Distributions Per Share |
| Starting | Ending | Income | Capital |
| Share Price | Share Price | Dividends | Gains |
Vanguard Precious Metals and Mining Fund | $33.45 | $31.79 | $0.220 | $1.028 |
1

Chairman’s Letter
Dear Shareholder,
During the past six months, precious metals and mining stocks have been no strangers to the ongoing turbulence in world markets. For the fiscal half-year ended July 31, 2008, Vanguard Precious Metals and Mining Fund, which is broadly diversified across metal and mining companies, returned –1.6%. Although the fund posted negative results, its performance surpassed that of its target index and significantly outpaced the average gold-oriented fund.
Please note that the fund remained closed to most new investors. (The fund closure does not apply to Flagship members.)
Stocks rode a bumpy path to disappointing results
U.S. stocks struggled during the six months, a period of pronounced volatility in the financial markets. Continued weakness in the housing market, record oil prices, rising unemployment, and an uptick in inflation all weighed on stocks and set a downbeat tone.
The U.S. market performed well in April and May, but those returns were bookended by declines earlier and later in the period. June was a particularly difficult month; the broad U.S. stock market declined –8.2%, the worst single-month return in more than five years.
For the half-year, the broad U.S. stock market returned –5.9%. Investors favored small-capitalization stocks over large- and mid-caps, and growth stocks over their
2
value-oriented counterparts. International stocks also experienced high levels of volatility, and returned –3.8%.
Bond investors remained cautious in the wake of the subprime crisis
In the extensive fallout from the sub-prime-mortgage crisis, bond investors continued to prefer the safety of short-term, high-quality issues—most notably U.S. Treasury securities. During the period, bonds outpaced stocks, but registered negative returns. The broad taxable bond market returned –0.6%. Municipal bonds, which experienced a spike in volatility, returned –0.9%.
During the half-year, the Federal Reserve Board lowered its target for the federal funds rate twice, reducing it a full percentage point, to 2.0%. At its June meeting (and again at its August meeting after the end of the fund’s fiscal period), the Fed voted to leave the target rate unchanged, signaling a growing concern about near-term inflation.
Strong stock selection helped fund’s overall return
Despite holding fewer than 40 stocks in its portfolio as of July 31, 2008, Vanguard Precious Metals and Mining Fund is highly diversified in comparison to its benchmark and average peer fund. The fund’s holdings among coal-mining and steel recycling companies were notable contributors for the period and played a role in the fund’s outperformance of its competitors. Meanwhile, the fund’s gold and platinum producers were significant detractors during the six months.
Market Barometer | | | |
| | | Total Returns |
| | Periods Ended July 31, 2008 |
| Six Months | One Year | Five Years1 |
Stocks | | | |
Russell 1000 Index (Large-caps) | –6.6% | –10.6% | 7.5% |
Russell 2000 Index (Small-caps) | 0.9 | –6.7 | 9.8 |
Dow Jones Wilshire 5000 Index (Entire market) | –5.9 | –10.2 | 8.1 |
MSCI All Country World Index ex USA (International) | –3.8 | –9.3 | 17.9 |
| | | |
| | | |
Bonds | | | |
Lehman U.S. Aggregate Bond Index (Broad taxable market) | –0.6% | 6.2% | 4.6% |
Lehman Municipal Bond Index | –0.9 | 2.8 | 4.3 |
Citigroup 3-Month Treasury Bill Index | 1.0 | 3.1 | 3.1 |
| | | |
| | | |
CPI | | | |
Consumer Price Index | 4.2% | 5.6% | 3.6% |
| | | |
| | | |
| | | |
1 Annualized. | | | |
3
The fund’s coal-mining stocks saw a boost during the period, partially due to rising power consumption in China, where energy generation is 80% reliant on coal. Eramet, the fund’s largest weighting as of July 31 and one of the few independent nickel producers left in the world, benefited from the rise in price of manganese, as well as from speculation over consolidation in the nickel industry. Other fund contributors Schnitzer Steel Industries and Sims Group, both scrap metal recyclers, were good examples of the advisor’s strong stock selection.
The largest detractor for the period was Centerra Gold, whose stock fell owing to ongoing concerns that the Kyrgyzstan government will nationalize the company’s Kumtor mine. Platinum stocks also hurt fund returns. Early in the period, power outages in South Africa—the world’s largest supplier of platinum—shortened the supply of the precious metal, sending prices through the roof. However, weakening U.S. auto sales won out in the end, leading to an anticipated decrease in demand for the metal, which is commonly used in catalytic converters.
Sector funds can diversify a well-planned portfolio
Investors endured difficult times during the past several months as troubles continued in the U.S. economy. Volatility in the marketplace such as that of the recent fiscal period is a good reminder of why we urge shareholders to avoid reacting to short-term noise. Instead, Vanguard suggests that shareholders maintain a well-balanced portfolio with a long-term perspective.
Annualized Expense Ratios1 | | |
Your Fund Compared With Its Peer Group | | |
| | Average |
| | Gold-Oriented |
| Fund | Fund |
Precious Metals and Mining Fund | 0.32% | 1.52% |
1 Fund expense ratio reflects the six months ended July 31, 2008. Peer-group expense ratio is derived from data provided by Lipper Inc. and captures information through year-end 2007.
4
In practice, this means building a portfolio that includes stocks, bonds, and short-term reserves. Such a well-planned investment program can provide some protection against the stock market’s occasionally sharp declines, while allowing you to participate in its long-term potential for growth. As part of a well-balanced investment plan, Vanguard Precious Metals and Mining Fund can add diversification to your portfolio and help you reach your financial goals.
When I wrote to you six months ago, Vanguard’s board had elected F. William McNabb III as the fund’s president and designated him to succeed me as chief executive officer. The board has since announced that Bill will assume the chief executive role on August 31.
Bill and the rest of our team will serve you and our other clients extremely well in the years ahead.
Thank you for investing with Vanguard.
Sincerely,

John J. Brennan
Chairman and Chief Executive Officer
August 14, 2008
5
Advisor’s Report
Vanguard Precious Metals and Mining Fund produced an absolute return of –1.6% for the six-month period ended July 31. This was ahead of the customized benchmark index, which returned –4.2%, as well as the average gold-oriented fund, which returned –10.8%.
Gold bullion declined marginally from $926 to $914 per ounce during the period, masking high levels of volatility which saw the gold price peak above $1,000 per ounce for the first time ever in mid-March. Investment interest in the metal has remained robust because of its defensive characteristics against a backdrop of continued instability in financial markets and heightened geopolitical tensions.
Outside gold, a wide range of metals and minerals made strong gains initially before many succumbed to declines toward the end of the period because of concerns that demand from China and other major commodities consumers would slow. Nevertheless, disruptions on the supply side remain supportive for metal and mineral prices generally, while we retain our confidence in the long-term robustness of demand from emerging and developed economies alike. Against this backdrop, mining groups endured a high degree of volatility, but broadly speaking continued to deliver decent returns.
The fund’s significant holding in French nickel and manganese producer Eramet continued to perform well in spite of weakness toward the end of the period. The company profited from rising manganese prices as well as from speculation over ongoing consolidation in the nickel industry. Holdings in U.S. coal groups Peabody Energy and CONSOL Energy and Australian coal producer Centennial Coal also had a positive impact on performance as coal prices rose to record highs. Against a backdrop of soaring crude oil prices, global energy shortages, and a range of supply-side constraints, coal is being increasingly recognized as a highly valuable source of lower-cost power generation.
The fund’s holdings in U.S. metal recycling company Schnitzer Steel and its Australian counterpart Sims Group benefited from the continued robust demand for scrap metal. Demand soared as rising iron-ore prices prompted the steel industry to move away from iron-ore-intensive blast furnaces toward electric arc furnaces, which use greater concentrations of scrap.
On the negative side, our holdings in North American gold producers Centerra Gold and Barrick Gold had an unfavorable impact as the resurgent U.S. dollar and slowing demand for jewelry hampered the performance of the gold sector generally. The worst performance during the period came from Canadian-listed Centerra Gold because of concerns that the Kyrgyz Republic intends to renegotiate the company’s mining license in this Central Asian country. This is becoming an increasingly commonplace scenario for mining companies with operations in developing countries.
Our positions in platinum producers turned in a mixed performance, as the extremely compelling supply/demand balance for the
6
metal was counterbalanced by concerns over slowing economic growth and operational problems at certain companies. The fund’s position in United Kingdom producer Lonmin was among the portfolio’s weakest performers following production interruptions and power shortages at the platinum miner’s South African operations.
We continued to focus on metals and minerals companies with high-caliber management and strong positions in strategically important materials. We took part in the IPO of Franco-Nevada, a Canadian business that invests in precious metals royalty streams and, therefore, is exposed to price strength in precious metals rather than rising costs. We made a large addition to Lonmin in the belief that the recent decline in its share price has left the company’s unique platinum assets unjustifiably undervalued. We also added to Peter Hambro Mining—a Russian-based gold miner that is increasing production and whose focus on efficiency should enable it to generate higher profits than most of the gold industry—and the United Kingdom’s Johnson Matthey, which processes platinum for use in automotive catalytic converters, an area where more-stringent environmental standards should continue to boost demand.
In terms of sales from the portfolio, the most significant development was a reduction in a number of our coal holdings, including North American producers CONSOL Energy and Patriot Coal and Australian producer Centennial Coal. While we continue to believe in the compelling fundamental outlook for coal as one of the main solutions to the world’s growing energy shortages, from a valuation perspective we thought it sensible to take profits following a sharp appreciation in the shares of these companies. Similarly, we reduced the fund’s position in French nickel/manganese producer Eramet, following an extremely strong run in the company’s share price.
The long-term investment environment for the fund remains encouraging. Appetite for raw materials, particularly from developing economies such as China and India, remains healthy, while prices across the mining industry continue to be supported by a range of supply-side disruptions. We are increasingly mindful of valuation levels after a long period of pronounced share-price gains, however, and we remain focused on efficiently managed companies with high-quality, strategically valuable assets that are underappreciated by the market. It follows that we are avoiding companies—particularly in the gold sector—that are failing to take advantage of the favorable environment because of rising cost pressures and poor management decisions.
Portfolio Managers:
Graham E. French,
Matthew Vaight, UKSIP
M&G Investment Management Ltd.
August 30, 2008
7
Fund Profile
As of July 31, 2008
Portfolio Characteristics | | |
| | Comparative | Broad |
| Fund | Index1 | Index2 |
Number of Stocks | 37 | 300 | 4,724 |
Median Market Cap | $7.3B | $24.5B | $31.5B |
Price/Earnings Ratio | 19.3x | 20.3x | 16.6x |
Price/Book Ratio | 2.7x | 3.1x | 2.3x |
Return on Equity | 18.2% | 21.2% | 19.7% |
Earnings Growth Rate | 24.3% | 37.6% | 18.5% |
Foreign Holdings | 80.6% | 0.0% | 0.0% |
Turnover Rate3 | 15% | — | — |
Expense Ratio3 | 0.32% | — | — |
Short-Term Reserves | 0.6% | — | — |
Market Diversification (% of equity exposure) |
| |
United Kingdom | 21.1% |
United States | 18.7 |
Canada | 17.1�� |
France | 14.8 |
South Africa | 12.8 |
Australia | 11.8 |
Norway | 2.0 |
Peru | 1.5 |
Indonesia | 0.2 |
Volatility Measures4 | |
| Fund Versus | Fund Versus |
| Comparative Index1 | Broad Index2 |
R-Squared | 0.87 | 0.21 |
Beta | 0.88 | 1.10 |
Ten Largest Holdings5 (% of total net assets) |
| |
Eramet SLN | 10.8% |
Lonmin PLC | 8.5 |
Johnson Matthey PLC | 7.5 |
Impala Platinum Holdings Ltd. ADR | 6.8 |
Barrick Gold Corp. | 6.0 |
Peabody Energy Corp. | 4.9 |
Sims Group Ltd. | 4.8 |
Anglo Platinum Ltd. ADR | 4.4 |
Harry Winston Diamond Corp. | 3.9 |
Imerys SA | 3.8 |
Top Ten | 61.4% |
1 S&P/Citigroup Custom Precious Metals and Mining Index.
2 Dow Jones Wilshire 5000 Index.
3 Annualized.
4 For an explanation of R-squared, beta, and other terms used here, see the Glossary on page 22.
5 The holdings listed exclude any temporary cash investments and equity index products.
8
Performance Summary
All of the returns in this report represent past performance, which is not a guarantee of future results that may be achieved by the fund. (Current performance may be lower or higher than the performance data cited. For performance data current to the most recent month-end, visit our website at www.vanguard.com/performance.) Note, too, that both investment returns and principal value can fluctuate widely, so an investor’s shares, when sold, could be worth more or less than their original cost. The returns shown do not reflect taxes that a shareholder would pay on fund distributions or on the sale of fund shares.
Fiscal-Year Total Returns (%): January 31, 1998–July 31, 2008
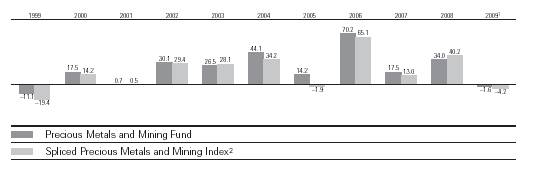
Average Annual Total Returns: Periods Ended June 30, 2008
This table presents average annual total returns through the latest calendar quarter—rather than through the end of the fiscal period. Securities and Exchange Commission rules require that we provide this information.
| Inception Date | One Year | Five Years | Ten Years |
Precious Metals and Mining Fund3 | 5/23/1984 | 33.55% | 39.16% | 26.48% |
1 Six months ended July 31, 2008.
2 S&P/Citigroup World Equity Gold Index through June 30, 2005; S&P/Citigroup Custom Precious Metals and Mining Index thereafter.
3 Total return figures do not reflect the 1% fee assessed on redemptions of shares held for less than one year, nor do they include the account service fee that may be applicable to certain accounts with balances below $10,000.
Note: See Financial Highlights table on page 14 for dividend and capital gains information.
9
Financial Statements (unaudited)
Statement of Net Assets
As of July 31, 2008
The fund provides a complete list of its holdings four times in each fiscal year, at the quarter-ends. For the second and fourth fiscal quarters, the lists appear in the fund’s semiannual and annual reports to shareholders. For the first and third fiscal quarters, the fund files the lists with the Securities and Exchange Commission on Form N-Q. Shareholders can look up the fund’s Forms N-Q on the SEC’s website at www.sec.gov. Forms N-Q may also be reviewed and copied at the SEC’s Public Reference Room (see the back cover of this report for further information).
| | | Market |
| | | Value• |
| | Shares | ($000) |
Common Stocks (99.2%) | | |
Australia (11.8%) | | |
| Sims Group Ltd. | 7,100,000 | 219,577 |
| BlueScope Steel Ltd. | 14,550,000 | 158,076 |
1 ^ | Iluka Resources Ltd. | 28,500,000 | 128,337 |
*1^ | St. Barbara Ltd. | 119,665,600 | 31,959 |
* | Tanami Gold NL | 18,170,000 | 949 |
* | MIL Resources, Ltd. | 1,678,671 | 70 |
| | | 538,968 |
Canada (17.0%) | | |
| Barrick Gold Corp. | 6,450,000 | 273,131 |
1 | Harry Winston | | |
| Diamond Corp. | 7,700,000 | 163,558 |
1 | Franco-Nevada Corp. | 7,500,000 | 156,087 |
| Sherritt International Corp. | 9,175,000 | 94,891 |
*1 | Centerra Gold Inc. | 14,165,000 | 71,935 |
2 | Harry Winston | | |
| Diamond Corp. | | |
| Private Placement | 700,000 | 14,125 |
*1 | Claude Resources, Inc. | 5,150,000 | 4,326 |
| | | 778,053 |
France (14.6%) | | |
^ | Eramet SLN | 716,626 | 496,056 |
^ | Imerys SA | 2,930,000 | 175,363 |
| | | 671,419 |
Indonesia (0.3%) | | |
| PT International Nickel | | |
| Indonesia Tbk | 22,500,000 | 11,254 |
| | | |
Norway (1.9%) | | |
| Norsk Hydro ASA | 7,100,000 | 88,761 |
| | | |
Papua New Guinea (0.0%) | | |
* | Bougainville Copper Ltd. | 2,000,000 | 2,167 |
| | | |
Peru (1.5%) | | |
| Compania de Minas | | |
| Buenaventura SA ADR | 2,600,000 | 69,966 |
| | | |
South Africa (12.7%) | | |
| Impala Platinum | | |
| Holdings Ltd. ADR | 9,400,000 | 311,980 |
| Anglo Platinum Ltd. ADR | 1,550,000 | 202,274 |
| Northam Platinum Ltd. | 9,600,000 | 69,045 |
| | | 583,299 |
United Kingdom (20.8%) | | |
1 | Lonmin PLC | 8,175,000 | 390,158 |
| Johnson Matthey PLC | 10,500,000 | 345,727 |
1 | ^Peter Hambro Mining PLC | 6,500,000 | 138,557 |
* | Gem Diamond Ltd. | 2,386,428 | 48,321 |
| Hochschild Mining PLC | 3,900,000 | 23,654 |
* | Kenmare Resources PLC | 4,550,000 | 3,190 |
* | Mwana Africa PLC | 3,180,219 | 2,452 |
* | Gemfields Resources PLC | 3,333,333 | 1,982 |
* | Zambezi Resources Ltd. | 4,895,833 | 604 |
| | | 954,645 |
United States (18.6%) | | |
| Peabody Energy Corp. | 3,300,000 | 223,245 |
| CONSOL Energy, Inc. | 2,130,000 | 158,451 |
| FMC Corp. | 1,950,000 | 145,022 |
| Schnitzer Steel | | |
| Industries, Inc. Class A | 1,550,000 | 139,872 |
1 | AMCOL International Corp. | 3,100,000 | 98,952 |
1 | Minerals Technologies, Inc. | 1,336,514 | 86,219 |
| | | 851,761 |
Total Common Stocks | | |
(Cost $3,133,926) | | 4,550,293 |
Precious Metals (0.1%) | | |
* | Platinum Bullion (In Ounces) | 2,009 | 3,513 |
Total Precious Metals | | |
(Cost $1,213) | | 3,513 |
10
| | Market |
| | Value• |
| Shares | ($000) |
Temporary Cash Investments (0.8%) | |
3 Vanguard Market Liquidity | | |
Fund, 2.386%—Note F | 21,357,394 | 21,357 |
3 Vanguard Market Liquidity | | |
Fund, 2.386% | 16,266,229 | 16,266 |
Total Temporary Cash Investments | |
(Cost $37,623) | | 37,623 |
Total Investments (100.1%) | | |
(Cost $3,172,762) | | 4,591,429 |
Other Assets and Liabilities—Net (0.1%) | (3,191) |
Net Assets (100%) | | |
Applicable to 144,326,971 outstanding | |
$.001 par value shares of beneficial | |
interest (unlimited authorization) | 4,588,238 |
Net Asset Value Per Share | | $31.79 |
| | |
| | |
Statement of Assets and Liabilities | |
Assets | | |
Investments in Securities, at Value | 4,591,429 |
Receivables for Investment | | |
Securities Sold | | 26,878 |
Receivables for Capital Shares Issued | 1,289 |
Other Assets—Note C | | 11,704 |
Total Assets | | 4,631,300 |
Liabilities | | |
Security Lending Collateral | | |
Payable to Brokers—Note F | | 21,357 |
Payables for Investment | | |
Securities Purchased | | 10,028 |
Payables for Capital Shares Redeemed | 5,156 |
Other Liabilities | | 6,521 |
Total Liabilities | | 43,062 |
Net Assets | | 4,588,238 |
At July 31, 2008, net assets consisted of:4 | |
| Amount | Per |
| ($000) | Share |
Paid-in Capital | 2,983,814 | $20.67 |
Undistributed Net | | |
Investment Income | 8,573 | .06 |
Accumulated Net | | |
Realized Gains | 177,050 | 1.23 |
Unrealized Appreciation | | |
Investment Securities | 1,418,667 | 9.83 |
Foreign Currencies | 134 | — |
Net Assets | 4,588,238 | $31.79 |
• See Note A in Notes to Financial Statements.
* Non-income-producing security.
^ Part of security position is on loan to broker-dealers. See Note F in Notes to Financial Statements.
1 Considered an affiliated company of the fund as the fund owns more than 5% of the outstanding voting securities of such company. See Note H in Notes to Financial Statements.
2 Security exempt from registration under Rule 144A of the Securities Act of 1933. Such securities may be sold in transactions exempt from registration, normally to qualified institutional buyers. At July 31, 2008, the value of this security represented 0.3% of net assets.
3 Affiliated money market fund available only to Vanguard funds and certain trusts and accounts managed by Vanguard. Rate shown is the 7-day yield.
4 See Note D in Notes to Financial Statements for the tax-basis components of net assets.
ADR—American Depositary Receipt.
11
Statement of Operations
| Six Months Ended |
| July 31, 2008 |
| ($000) |
Investment Income | |
Income | |
Dividends1,2 | 52,342 |
Interest2 | 632 |
Security Lending | 2,010 |
Total Income | 54,984 |
Expenses | |
Investment Advisory Fees—Note B | |
Basic Fee | 3,089 |
Performance Adjustment | 822 |
The Vanguard Group—Note C | |
Management and Administrative | 3,607 |
Marketing and Distribution | 412 |
Custodian Fees | 332 |
Shareholders’ Reports | 27 |
Trustees’ Fees and Expenses | 4 |
Total Expenses | 8,293 |
Net Investment Income | 46,691 |
Realized Net Gain (Loss) | |
Investment Securities Sold2 | 205,011 |
Foreign Currencies | (179) |
Realized Net Gain (Loss) | 204,832 |
Change in Unrealized Appreciation (Depreciation) | |
Investment Securities | (338,753) |
Foreign Currencies | 54 |
Change in Unrealized Appreciation (Depreciation) | (338,699) |
Net Increase (Decrease) in Net Assets Resulting from Operations | (87,176) |
1 Dividends are net of foreign withholding taxes of $3,966,000.
2 Dividend income, interest income, and realized net gain (loss) from affiliated companies of the fund were $11,959,000, $604,000, and $23,433,000, respectively.
12
Statement of Changes in Net Assets
| Six Months Ended | Year Ended |
| July 31, | January 31, |
| 2008 | 2008 |
| ($000) | ($000) |
Increase (Decrease) in Net Assets | | |
Operations | | |
Net Investment Income | 46,691 | 110,391 |
Realized Net Gain (Loss) | 204,832 | 573,391 |
Change in Unrealized Appreciation (Depreciation) | (338,699) | 449,410 |
Net Increase (Decrease) in Net Assets Resulting from Operations | (87,176) | 1,133,192 |
Distributions | | |
Net Investment Income | (30,914) | (83,075) |
Realized Capital Gain1 | (144,453) | (466,982) |
Total Distributions | (175,367) | (550,057) |
Capital Share Transactions—Note G | | |
Issued | 505,836 | 783,925 |
Issued in Lieu of Cash Distributions | 161,913 | 507,139 |
Redeemed2 | (451,896) | (682,805) |
Net Increase (Decrease) from Capital Share Transactions | 215,853 | 608,259 |
Total Increase (Decrease) | (46,690) | 1,191,394 |
Net Assets | | |
Beginning of Period | 4,634,928 | 3,443,534 |
End of Period3 | 4,588,238 | 4,634,928 |
1 Includes fiscal 2009 and 2008 short-term gain distributions totaling $2,529,000 and $41,392,000, respectively. Short-term gain distributions are treated as ordinary income dividends for tax purposes.
2 Net of redemption fees of $693,000 and $739,000.
3 Net Assets—End of Period includes undistributed (overdistributed) net investment income of $8,573,000 and ($7,025,000).
13
Financial Highlights
| | | | | | |
| Six Months | | | | | |
| Ended | | | |
For a Share Outstanding | July 31, | Year Ended January 31, |
Throughout Each Period | 2008 | 2008 | 2007 | 2006 | 2005 | 2004 |
Net Asset Value, Beginning of Period | $33.45 | $28.64 | $27.08 | $16.46 | $15.29 | $11.25 |
Investment Operations | | | | | | |
Net Investment Income | .330 | .9001 | .560 | .3372 | .1852 | .194 |
Net Realized and Unrealized Gain (Loss) | | | | | | |
on Investments3 | (.742) | 8.362 | 4.027 | 11.080 | 1.988 | 4.780 |
Total from Investment Operations | (.412) | 9.262 | 4.587 | 11.417 | 2.173 | 4.974 |
Distributions | | | | | | |
Dividends from Net Investment Income | (.220) | (.670) | (.490) | (.240) | (.144) | (.934) |
Distributions from Realized Capital Gains | (1.028) | (3.782) | (2.537) | (.557) | (.859) | — |
Total Distributions | (1.248) | (4.452) | (3.027) | (.797) | (1.003) | (.934) |
Net Asset Value, End of Period | $31.79 | $33.45 | $28.64 | $27.08 | $16.46 | $15.29 |
| | | | | | |
| | | | | | |
Total Return4 | –1.57% | 33.97% | 17.48% | 70.19% | 14.20% | 44.07% |
| | | | | | |
| | | | | | |
Ratios/Supplemental Data | | | | | | |
Net Assets, End of Period (Millions) | $4,588 | $4,635 | $3,444 | $3,297 | $921 | $608 |
Ratio of Total Expenses to | | | | | | |
Average Net Assets | 0.32%5,* | 0.28%5 | 0.35%5 | 0.40% | 0.48% | 0.55% |
Ratio of Net Investment Income to | | | | | | |
Average Net Assets | 1.79%* | 2.70%1 | 1.88% | 1.68% | 1.32% | 1.61% |
Portfolio Turnover Rate | 15%* | 29% | 24% | 20% | 36% | 15% |
1 Net investment income per share and the ratio of net investment income to average net assets include $0.190 and 0.65% respectively, resulting from a special dividend from Centennial Coal Co., Ltd., in January 2008.
2 Calculated based on average shares outstanding.
3 Includes increases from redemption fees of $.00, $.00, $.03, $.01, $.01, and $.00.
4 Total returns do not reflect the 1% fee assessed on redemptions of shares held for less than one year, nor do they reflect the account service fee that may be applicable to certain accounts with balances below $10,000.
5 Includes performance-based investment advisory fee increases (decreases) of 0.03%, (0.01%), and 0.01%.
* Annualized.
See accompanying Notes, which are an integral part of the Financial Statements.
14
Notes to Financial Statements
Vanguard Precious Metals and Mining Fund is registered under the Investment Company Act of 1940 as an open-end investment company, or mutual fund. The fund files reports with the SEC under the company name Vanguard Specialized Funds. The fund invests in securities of foreign issuers, which may subject it to investment risks not normally associated with investing in securities of United States corporations.
A. The following significant accounting policies conform to generally accepted accounting principles for U.S. mutual funds. The fund consistently follows such policies in preparing its financial statements.
1. Security Valuation: Securities are valued as of the close of trading on the New York Stock Exchange (generally 4 p.m., Eastern time) on the valuation date. Equity securities are valued at the latest quoted sales prices or official closing prices taken from the primary market in which each security trades; such securities not traded on the valuation date are valued at the mean of the latest quoted bid and asked prices. Securities for which market quotations are not readily available, or whose values have been affected by events occurring before the fund’s pricing time but after the close of the securities’ primary markets, are valued at their fair values calculated according to procedures adopted by the board of trustees. These procedures include obtaining quotations from an independent pricing service, monitoring news to identify significant market- or security-specific events, and evaluating changes in the values of foreign market proxies (for example, ADRs, futures contracts, or exchange-traded funds), between the time the foreign markets close and the fund’s pricing time. When fair-value pricing is employed, the prices of securities used by a fund to calculate its net asset value may differ from quoted or published prices for the same securities. Precious metals are valued at the mean of the latest quoted bid and asked prices. Investments in Vanguard Market Liquidity Fund are valued at that fund’s net asset value.
2. Foreign Currency: Securities and other assets and liabilities denominated in foreign currencies are translated into U.S. dollars using exchange rates obtained from an independent third party as of the fund’s pricing time on the valuation date. Realized gains (losses) and unrealized appreciation (depreciation) on investment securities include the effects of changes in exchange rates since the securities were purchased, combined with the effects of changes in security prices. Fluctuations in the value of other assets and liabilities resulting from changes in exchange rates are recorded as unrealized foreign currency gains (losses) until the assets or liabilities are settled in cash, at which time they are recorded as realized foreign currency gains (losses).
3. Federal Income Taxes: The fund intends to continue to qualify as a regulated investment company and distribute all of its taxable income. Management has analyzed the fund’s tax positions taken on federal income tax returns for all open tax years (tax years ended January 31, 2005–2008) and for the period ended July 31, 2008, and has concluded that no provision for federal income tax is required in the fund’s financial statements.
4. Distributions: Distributions to shareholders are recorded on the ex-dividend date.
5. Security Lending: The fund may lend its securities to qualified institutional borrowers to earn additional income. Security loans are required to be secured at all times by collateral at least equal to the market value of securities loaned. The fund invests cash collateral received in Vanguard Market Liquidity Fund, and records a liability for the return of the collateral, during the period the securities are on loan. Security lending income represents the income earned on investing cash collateral, less expenses associated with the loan.
15
6. Other: Dividend income is recorded on the ex-dividend date. Interest income includes income distributions received from Vanguard Market Liquidity Fund and is accrued daily. Security transactions are accounted for on the date securities are bought or sold. Costs used to determine realized gains (losses) on the sale of investment securities are those of the specific securities sold. Fees assessed on redemptions of capital shares are credited to paid-in capital.
B. M&G Investment Management Ltd. provides investment advisory services to the fund for a fee calculated at an annual percentage rate of average net assets. The basic fee is subject to quarterly adjustments based on the fund’s performance since January 31, 2006, relative to the S&P/Citigroup Custom Precious Metals and Mining Index. For the six months ended July 31, 2008, the investment advisory fee represented an effective annual basic rate of 0.12% of the fund’s average net assets before an increase of $822,000 (0.03%) based on performance.
C. The Vanguard Group furnishes at cost corporate management, administrative, marketing, and distribution services. The costs of such services are allocated to the fund under methods approved by the board of trustees. The fund has committed to provide up to 0.40% of its net assets in capital contributions to Vanguard. At July 31, 2008, the fund had contributed capital of $486,000 to Vanguard (included in Other Assets), representing 0.01% of the fund’s net assets and 0.49% of Vanguard’s capitalization. The fund’s trustees and officers are also directors and officers of Vanguard.
D. Distributions are determined on a tax basis and may differ from net investment income and realized capital gains for financial reporting purposes. Differences may be permanent or temporary. Permanent differences are reclassified among capital accounts in the financial statements to reflect their tax character. Temporary differences arise when certain items of income, expense, gain, or loss are recognized in different periods for financial statement and tax purposes; these differences will reverse at some time in the future. Differences in classification may also result from the treatment of short-term gains as ordinary income for tax purposes. The fund’s tax-basis capital gains and losses are determined only at the end of each fiscal year.
During the six months ended July 31, 2008, the fund realized net foreign currency losses of $179,000, which permanently decreased distributable net income for tax purposes; accordingly, such losses have been reclassified from accumulated net realized gains to undistributed net investment income.
Certain of the fund’s investments are in securities considered to be “passive foreign investment companies,” for which any unrealized appreciation and/or realized gains are required to be included in distributable net income for tax purposes. Unrealized appreciation through January 31, 2008, on passive foreign investment company holdings at July 31, 2008, was $29,874,000 all of which has been distributed and is reflected in the balance of undistributed net investment income.
During 2001, the fund elected to use a provision of the Taxpayer Relief Act of 1997 to mark to market certain appreciated securities held on January 1, 2001; such securities were treated as sold and repurchased, with unrealized gains of $46,006,000 becoming realized, for tax purposes. The mark-to-market created a difference between the cost of investments for financial statement and tax purposes, which will reverse when the securities are sold. Through July 31, 2008, the fund realized gains on the sale of these securities of $18,280,000 for financial statement purposes, which were included in prior year mark-to-market gains for tax purposes. The remaining difference of $27,726,000 is reflected in the balance of accumulated net realized gains; the corresponding difference between the securities’ cost for financial statement and tax purposes is reflected in unrealized appreciation.
16
At July 31, 2008, the cost of investment securities for tax purposes was $3,230,362,000. Net unrealized appreciation of investment securities for tax purposes was $1,361,067,000, consisting of unrealized gains of $1,671,063,000 on securities that had risen in value since their purchase and $309,996,000 in unrealized losses on securities that had fallen in value since their purchase or since being marked to market for tax purposes.
E. During the six months ended July 31, 2008, the fund purchased $506,084,000 of investment securities and sold $377,138,000 of investment securities other than temporary cash investments.
F. The market value of securities on loan to broker-dealers at July 31, 2008, was $18,664,000, for which the fund received cash collateral of $21,357,000.
G. Capital shares issued and redeemed were:
| Six Months Ended | Year Ended |
| July 31, 2008 | January 31, 2008 |
| Shares | Shares |
| (000) | (000) |
Issued | 13,789 | 22,924 |
Issued in Lieu of Cash Distributions | 4,635 | 16,414 |
Redeemed | (12,656) | (21,016) |
Net Increase (Decrease) in Shares Outstanding | 5,768 | 18,322 |
H. Certain of the fund’s investments are in companies that are considered to be affiliated companies of the fund because the fund owns more than 5% of the outstanding voting securities of the company. Transactions during the period in securities of these companies were as follows:
| | | Current Period Transactions | |
| January 31, 2008 | | Proceeds from | | July 31, 2008 |
| Market | Purchases | Securities | Dividend | Market |
| Value | at Cost | Sold | Income | Value |
| ($000) | ($000) | ($000) | ($000) | ($000) |
AMCOL International Corp. | 63,752 | 14,196 | — | 944 | 98,952 |
Centennial Coal Co., Ltd. | 49,955 | — | 74,803 | 220 | — |
Centerra Gold Inc. | 214,439 | — | — | — | 71,935 |
Claude Resources, Inc. | 6,746 | — | — | — | 4,326 |
Franco-Nevada Corp. | NA1 | 100,260 | — | 702 | 156,087 |
Harry Winston Diamond Corp. | 178,714 | 29,901 | — | 649 | 177,683 |
Iluka Resources Ltd. | 70,228 | 29,126 | — | — | 128,337 |
Lonmin PLC | NA1 | 83,140 | — | 4,741 | 390,158 |
Minerals Technologies, Inc. | 72,706 | — | — | 134 | 86,219 |
Peter Hambro Mining PLC | 123,928 | 48,307 | — | 911 | 138,557 |
Sims Group Ltd. | 182,990 | — | — | 3,658 | NA2 |
St. Barbara Ltd. | 53,465 | 25,935 | — | — | 31,959 |
| 1,016,923 | | | 11,959 | 1,284,213 |
1 At January 31, 2008, the issuer was not an affiliated company of the fund.
2 At July 31, 2008, the security is still held, but the issuer is no longer an affiliated company of the fund.
17
I. In September 2006, the Financial Accounting Standards Board issued Statement of Financial Accounting Standards No.157 (“FAS 157”),“Fair Value Measurements.” FAS 157 establishes a framework for measuring fair value and expands disclosures about fair value measurements in financial statements, effective for the fund’s current fiscal period.
The various inputs that may be used to determine the value of the fund’s investments are summarized in three broad levels. The inputs or methodologies used for valuing securities are not necessarily an indication of the risk associated with investing in those securities.
Level 1—Quoted prices in active markets for identical securities.
Level 2—Other significant observable inputs (including quoted prices for similar securities, interest rates, prepayment speeds, credit risk, etc.).
Level 3—Significant unobservable inputs (including the fund’s own assumptions used to determine the fair value of investments).
The following table summarizes the fund’s investments as of July 31, 2008, based on the inputs used to value them:
| Investments |
| in Securities |
Valuation Inputs | ($000) |
Level 1—Quoted prices | 1,726,789 |
Level 2—Other significant observable inputs | 2,850,515 |
Level 3—Significant unobservable inputs | 14,125 |
Total | 4,591,429 |
The following table summarizes changes in investments valued based on Level 3 inputs during the six months ended July 31, 2008:
| Investments |
| in Securities |
Amount Valued Based on Level 3 Inputs | ($000) |
Balance as of January 31, 2008 | — |
Net Purchases (Sales) | 17,728 |
Change in Unrealized Appreciation (Depreciation) | (3,603) |
Balance as of July 31, 2008 | 14,125 |
18
About Your Fund’s Expenses
As a shareholder of the fund, you incur ongoing costs, which include costs for portfolio management, administrative services, and shareholder reports (like this one), among others. Operating expenses, which are deducted from a fund’s gross income, directly reduce the investment return of the fund.
A fund’s expenses are expressed as a percentage of its average net assets. This figure is known as the expense ratio. The following examples are intended to help you understand the ongoing costs (in dollars) of investing in your fund and to compare these costs with those of other mutual funds. The examples are based on an investment of $1,000 made at the beginning of the period shown and held for the entire period.
The table below illustrates your fund’s costs in two ways:
• Based on actual fund return. This section helps you to estimate the actual expenses that you paid over the period. The “Ending Account Value” shown is derived from the fund’s actual return, and the third column shows the dollar amount that would have been paid by an investor who started with $1,000 in the fund. You may use the information here, together with the amount you invested, to estimate the expenses that you paid over the period.
To do so, simply divide your account value by $1,000 (for example, an $8,600 account value divided by $1,000 = 8.6), then multiply the result by the number given for your fund under the heading “Expenses Paid During Period.”
• Based on hypothetical 5% yearly return. This section is intended to help you compare your fund’s costs with those of other mutual funds. It assumes that the fund had a yearly return of 5% before expenses, but that the expense ratio is unchanged. In this case—because the return used is not the fund’s actual return—the results do not apply to your investment. The example is useful in making comparisons because the Securities and Exchange Commission requires all mutual funds to calculate expenses based on a 5% return. You can assess your fund’s costs by comparing this hypothetical example with the hypothetical examples that appear in shareholder reports of other funds.
Six Months Ended July 31, 2008 | | | |
| Beginning | Ending | Expenses |
| Account Value | Account Value | Paid During |
Precious Metals and Mining Fund | 1/31/2008 | 7/31/2008 | Period1 |
Based on Actual Fund Return | $1,000.00 | $984.33 | $1.58 |
Based on Hypothetical 5% Return | 1,000.00 | 1,023.27 | 1.61 |
1 These calculations are based on expenses incurred in the most recent six-month period. The fund’s annualized six-month expense ratio for that period is 0.32%. The dollar amounts shown as “Expenses Paid” are equal to the annualized expense ratio multiplied by the average account value over the period, multiplied by the number of days in the most recent six-month period, then divided by the number of days in the most recent 12-month period.
19
Note that the expenses shown in the table on page 19 are meant to highlight and help you compare ongoing costs only and do not reflect transaction costs incurred by the fund for buying and selling securities. Further, the expenses do not include the 1% fee on redemptions of shares held for less than one year, nor do they include the account service fee described in the prospectus. If such fees were applied to your account, your costs would be higher. Your fund does not carry a “sales load.”
The calculations assume no shares were bought or sold during the period. Your actual costs may have been higher or lower, depending on the amount of your investment and the timing of any purchases or redemptions.
You can find more information about the fund’s expenses, including annual expense ratios, in the Financial Statements section of this report. For additional information on operating expenses and other shareholder costs, please refer to your fund’s current prospectus.
20
Trustees Approve Advisory Agreement
The board of trustees of Vanguard Precious Metals and Mining Fund has renewed the fund’s investment advisory agreement with M&G Investment Management Limited. The board determined that the retention of M&G was in the best interests of the fund and its shareholders.
The board based its decision upon an evaluation of M&G’s investment staff, portfolio management process, and performance. The trustees considered the factors discussed below, among others. However, no single factor determined whether the board approved the agreement. Rather, it was the totality of the circumstances that drove the board’s decision.
Nature, extent, and quality of services
The board considered the quality of the fund’s investment management over both the short and long term and took into account the organizational depth and stability of the advisor. The board noted that M&G, founded in 1931, specializes in managing equity and fixed income portfolios for both institutional and retail clients worldwide. The firm has advised the fund since the fund’s inception in 1984. The advisor continues to employ a sound process, selecting companies that are broadly representative of the metals and mining industries and emphasizing large, stable, and diversified companies. The advisor’s internal research team—comprising the portfolio manager, Graham E. French, and a team of global equity analysts—conducts intensive fundamental analysis of companies in the industry; their research includes regular company visits.
The board concluded that the advisor’s experience, stability, depth, and performance, among other factors, warranted continuation of the advisory agreement.
Investment performance
The board considered the short- and long-term performance of the fund, including any periods of outperformance or underperformance of a relevant benchmark and peer group. The board concluded that the advisor has carried out the fund’s investment strategy in disciplined fashion, and that performance results have allowed the fund to remain competitive versus its benchmark. The board noted that the fund is more broadly diversified than its competitors—with the ability to invest up to half of the fund’s assets in non-precious metals and mining stocks—but continues to remain competitive versus the average gold-oriented peer fund. Information about the fund’s most recent performance can be found in the Performance Summary section of this report.
Cost
The board concluded that the fund’s expense ratio was far below the average expense ratio charged by peer-group funds. The board noted that the fund’s advisory fee rate was also well below the peer-group average. Information about the fund’s expense ratio appears in the About Your Fund’s Expenses section of this report as well as in the Financial Statements section, which also includes information about the advisory fee rate.
The board did not consider profitability of M&G in determining whether to approve the advisory fee, because M&G is independent of Vanguard, and the advisory fee is the result of arm’s-length negotiations.
The benefit of economies of scale
The board concluded that the fund’s shareholders benefit from economies of scale because of breakpoints in the fund’s advisory fee schedule. The breakpoints reduce the effective rate of the fee as the fund’s assets increase.
The board will consider whether to renew the advisory agreement again after a one-year period.
21
Glossary
Beta. A measure of the magnitude of a fund’s past share-price fluctuations in relation to the ups and downs of a given market index. The index is assigned a beta of 1.00. Compared with a given index, a fund with a beta of 1.20 typically would have seen its share price rise or fall by 12% when the index rose or fell by 10%. For this report, beta is based on returns over the past 36 months for both the fund and the index. Note that a fund’s beta should be reviewed in conjunction with its R-squared (see definition below). The lower the R-squared, the less correlation there is between the fund and the index, and the less reliable beta is as an indicator of volatility.
Earnings Growth Rate. The average annual rate of growth in earnings over the past five years for the stocks now in a fund.
Equity Exposure. A measure that reflects a fund’s investments in stocks and stock futures. Any holdings in short-term reserves are excluded.
Expense Ratio. The percentage of a fund’s average net assets used to pay its annual administrative and advisory expenses. These expenses directly reduce returns to investors.
Foreign Holdings. The percentage of a fund represented by stocks or depositary receipts of companies based outside the United States.
Inception Date. The date on which the assets of a fund (or one of its share classes) are first invested in accordance with the fund’s investment objective. For funds with a subscription period, the inception date is the day after that period ends. Investment performance is measured from the inception date.
Median Market Cap. An indicator of the size of companies in which a fund invests; the midpoint of market capitalization (market price x shares outstanding) of a fund’s stocks, weighted by the proportion of the fund’s assets invested in each stock. Stocks representing half of the fund’s assets have market capitalizations above the median, and the rest are below it.
Price/Book Ratio. The share price of a stock divided by its net worth, or book value, per share. For a fund, the weighted average price/book ratio of the stocks it holds.
Price/Earnings Ratio. The ratio of a stock’s current price to its per-share earnings over the past year. For a fund, the weighted average P/E of the stocks it holds. P/E is an indicator of market expectations about corporate prospects; the higher the P/E, the greater the expectations for a company’s future growth.
R-Squared. A measure of how much of a fund’s past returns can be explained by the returns from the market in general, as measured by a given index. If a fund’s total returns were precisely synchronized with an index’s returns, its R-squared would be 1.00. If the fund’s returns bore no relationship to the index’s returns, its R-squared would be 0. For this report, R-squared is based on returns over the past 36 months for both the fund and the index.
Return on Equity. The annual average rate of return generated by a company during the past five years for each dollar of shareholder’s equity (net income divided by shareholder’s equity). For a fund, the weighted average return on equity for the companies whose stocks it holds.
Short-Term Reserves. The percentage of a fund invested in highly liquid, short-term securities that can be readily converted to cash.
Turnover Rate. An indication of the fund’s trading activity. Funds with high turnover rates incur higher transaction costs and may be more likely to distribute capital gains (which may be taxable to investors). The turnover rate excludes in-kind transactions, which have minimal impact on costs.
22
This page intentionally left blank.
The People Who Govern Your Fund
The trustees of your mutual fund are there to see that the fund is operated and managed in your best interests since, as a shareholder, you are a part owner of the fund. Your fund’s trustees also serve on the board of directors of The Vanguard Group, Inc., which is owned by the Vanguard funds and provides services to them on an at-cost basis.
A majority of Vanguard’s board members are independent, meaning that they have no affiliation with Vanguard or the funds they oversee, apart from the sizable personal investments they have made as private individuals.
Our independent board members bring distinguished backgrounds in business, academia, and public service to their task of working with Vanguard officers to establish the policies and oversee the activities of the funds. Among board members’ responsibilities are selecting investment advisors for the funds; monitoring fund operations, performance, and costs; reviewing contracts; nominating and selecting new trustees/directors; and electing Vanguard officers.
Each trustee serves a fund until its termination; or until the trustee’s retirement, resignation, or death; or otherwise as specified in the fund’s organizational documents. Any trustee may be removed at a shareholders’ meeting by a vote representing two-thirds of the net asset value of all shares of the fund together with shares of other Vanguard funds organized within the same trust. The table on these two pages shows information for each trustee and executive officer of the fund. The mailing address of the trustees and officers is P.O. Box 876, Valley Forge, PA 19482.
Chairman of the Board, Chief Executive Officer, and Trustee
John J. Brennan1
Born 1954 Principal Occupation(s) During the Past Five Years: Chairman of the Board, Chief Executive Trustee Since May 1987; Officer, and Director/Trustee of The Vanguard Group, Inc., and of each of the investment Chairman of the Board and companies served by The Vanguard Group; Director of Vanguard Marketing Corporation. Chief Executive Officer 156 Vanguard Funds Overseen
Independent Trustees
Charles D. Ellis
Born 1937 Principal Occupation(s) During the Past Five Years: Applecore Partners (pro bono ventures Trustee Since January 2001 in education); Senior Advisor to Greenwich Associates (international business strategy 156 Vanguard Funds Overseen consulting); Successor Trustee of Yale University; Overseer of the Stern School of Business at New York University; Trustee of the Whitehead Institute for Biomedical Research.
Emerson U. Fullwood
Born 1948 Principal Occupation(s) During the Past Five Years: Executive Chief Staff and Marketing Trustee Since January 2008 Officer for North America since 2004 and Corporate Vice President of Xerox Corporation 156 Vanguard Funds Overseen (photocopiers and printers); Director of SPX Corporation (multi-industry manufacturing), of the United Way of Rochester, and of the Boy Scouts of America.
Rajiv L. Gupta
Born 1945 Principal Occupation(s) During the Past Five Years: Chairman, President, and Trustee Since December 20012 Chief Executive Officer of Rohm and Haas Co. (chemicals); Board Member of 156 Vanguard Funds Overseen the American Chemistry Council; Director of Tyco International, Ltd. (diversified manufacturing and services) since 2005.
Amy Gutmann
Born 1949 Principal Occupation(s) During the Past Five Years: President of the University of
Trustee Since June 2006 Pennsylvania since 2004; Professor in the School of Arts and Sciences, Annenberg School 156 Vanguard Funds Overseen for Communication, and Graduate School of Education of the University of Pennsylvania since 2004; Provost (2001–2004) and Laurance S. Rockefeller Professor of Politics and the University Center for Human Values (1990–2004), Princeton University; Director of Carnegie Corporation of New York since 2005 and of Schuylkill River Development Corporation and Greater Philadelphia Chamber of Commerce since 2004; Trustee of the National Constitution Center since 2007.
JoAnn Heffernan Heisen
Born 1950 Principal Occupation(s) During the Past Five Years: Corporate Vice President and Trustee Since July 1998 Chief Global Diversity Officer since 2006, Vice President and Chief Information 156 Vanguard Funds Overseen Officer (1997–2005), and Member of the Executive Committee of Johnson & Johnson (pharmaceuticals/consumer products); Director of the University Medical Center at Princeton and Women’s Research and Education Institute.
André F. Perold
Born 1952 Principal Occupation(s) During the Past Five Years: George Gund Professor of Finance Trustee Since December 2004 and Banking, Harvard Business School; Senior Associate Dean and Director of Faculty 156 Vanguard Funds Overseen Recruiting, Harvard Business School; Director and Chairman of UNX, Inc. (equities trading firm); Chair of the Investment Committee of HighVista Strategies LLC (private investment firm) since 2005.
Alfred M. Rankin, Jr.
Born 1941 Principal Occupation(s) During the Past Five Years: Chairman, President, Chief Executive Trustee Since January 1993 Officer, and Director of NACCO Industries, Inc. (forklift trucks/housewares/lignite); Director 156 Vanguard Funds Overseen of Goodrich Corporation (industrial products/aircraft systems and services).
J. Lawrence Wilson
Born 1936 Principal Occupation(s) During the Past Five Years: Retired Chairman and Chief Executive Trustee Since April 1985 Officer of Rohm and Haas Co. (chemicals); Director of Cummins Inc. (diesel engines) and 156 Vanguard Funds Overseen AmerisourceBergen Corp. (pharmaceutical distribution); Trustee of Vanderbilt University and of Culver Educational Foundation.
Executive Officers1
Thomas J. Higgins
Born 1957 Principal Occupation(s) During the Past Five Years: Principal of The Vanguard Group, Inc.; Treasurer Since July 1998 Treasurer of each of the investment companies served by The Vanguard Group. 156 Vanguard Funds Overseen
F. William McNabb III
Born 1957 Principal Occupation(s) During the Past Five Years: President of The Vanguard Group, Inc., President Since March 2008 and of each of the investment companies served by The Vanguard Group since 2008; 156 Vanguard Funds Overseen Director of Vanguard Marketing Corporation; Managing Director of The Vanguard Group (1995–2008).
Heidi Stam
Born 1956 Principal Occupation(s) During the Past Five Years: Managing Director of The Vanguard Secretary Since July 2005 Group, Inc., since 2006; General Counsel of The Vanguard Group since 2005; Secretary of 156 Vanguard Funds Overseen The Vanguard Group, and of each of the investment companies served by The Vanguard Group, since 2005; Director and Senior Vice President of Vanguard Marketing Corporation since 2005; Principal of The Vanguard Group (1997–2006).
Vanguard Senior Management Team | | |
| | | |
R. Gregory Barton | Kathleen C. Gubanich | Michael S. Miller | Glenn W. Reed |
Mortimer J. Buckley | Paul A. Heller | Ralph K. Packard | George U. Sauter |
Founder
John C. Bogle
Chairman and Chief Executive Officer, 1974–1996
1 Officers of the funds are “interested persons” as defined in the Investment Company Act of 1940.
2 December 2002 for Vanguard Equity Income Fund, Vanguard Growth Equity Fund, the Vanguard Municipal Bond Funds, and the Vanguard State Tax-Exempt Funds.
More information about the trustees is in the Statement of Additional Information, available from The Vanguard Group.

P.O. Box 2600
Valley Forge, PA 19482-2600
Connect with Vanguard® > www.vanguard.com
Fund Information > 800-662-7447 | Vanguard, Connect with Vanguard, and the ship logo are |
| trademarks of The Vanguard Group, Inc. |
Direct Investor Account Services > 800-662-2739 | |
| All other marks are the exclusive property of their |
Institutional Investor Services > 800-523-1036 | respective owners. |
| |
Text Telephone for People | |
With Hearing Impairment > 800-952-3335 | All comparative mutual fund data are from Lipper Inc. |
| or Morningstar, Inc., unless otherwise noted. |
| |
| You can obtain a free copy of Vanguard’s proxy voting |
| guidelines by visiting our website, www.vanguard.com, |
This material may be used in conjunction | and searching for “proxy voting guidelines,” or by |
with the offering of shares of any Vanguard | calling Vanguard at 800-662-2739. The guidelines are |
fund only if preceded or accompanied by | also available from the SEC’s website, www.sec.gov. |
the fund’s current prospectus. | In addition, you may obtain a free report on how your |
| fund voted the proxies for securities it owned during |
| the 12 months ended June 30. To get the report, visit |
| either www.vanguard.com or www.sec.gov. |
| |
| You can review and copy information about your fund |
| at the SEC’s Public Reference Room in Washington, D.C. |
| To find out more about this public service, call the SEC |
| at 202-551-8090. Information about your fund is also |
| available on the SEC’s website, and you can receive |
| copies of this information, for a fee, by sending a |
| request in either of two ways: via e-mail addressed to |
| publicinfo@sec.gov or via regular mail addressed to the |
| Public Reference Section, Securities and Exchange |
| Commission, Washington, DC 20549-0102. |
© 2008 The Vanguard Group, Inc.
All rights reserved.
Vanguard Marketing Corporation, Distributor.
Q532 092008

> For the six-month period ended July 31, 2008, Vanguard Health Care Fund posted a return of –1.3%.
> The fund managed to outperform its benchmark index, but lagged the average result for its peers.
> Pharmaceutical stocks, which accounted for more than 50% of the fund’s holdings, were down overall for the period.
Contents | |
| |
Your Fund’s Total Returns | 1 |
Chairman’s Letter | 2 |
Advisor’s Report | 6 |
Fund Profile | 8 |
Performance Summary | 9 |
Financial Statements | 10 |
About Your Fund’s Expenses | 22 |
Notice to Shareholders | 24 |
Glossary | 26 |
Please note: The opinions expressed in this report are just that—informed opinions. They should not be considered promises or advice. Also, please keep in mind that the information and opinions cover the period through the date on the cover of this report. Of course, the risks of investing in your fund are spelled out in the prospectus.
Your Fund’s Total Returns
Six Months Ended July 31, 2008 | | |
| Ticker | Total |
| Symbol | Returns |
Vanguard Health Care Fund | | |
Investor Shares | VGHCX | –1.3% |
Admiral™ Shares1 | VGHAX | –1.3 |
S&P Health Care Index | | –3.5 |
Average Health/Biotechnology Fund2 | | 2.7 |
Your Fund’s Performance at a Glance |
January 31, 2008–July 31, 2008 | | | | |
| | | Distributions Per Share |
| Starting | Ending | Income | Capital |
| Share Price | Share Price | Dividends | Gains |
Vanguard Health Care Fund | | | | |
Investor Shares | $133.80 | $130.58 | $0.033 | $1.350 |
Admiral Shares | 56.47 | 55.13 | 0.021 | 0.570 |
1 A lower-cost class of shares available to many longtime shareholders and to those with significant investments in the fund.
2 Derived from data provided by Lipper Inc.

Chairman’s Letter
Dear Shareholder,
Like the rest of the broad stock market, the health care sector experienced a wild ride during the six-month period ended July 31, 2008, tumbling early in the year, rallying, then pulling back again in June. Although Vanguard Health Care Fund finished the period with a negative return, the fund exceeded the return of its target index by more than 2 percentage points. During the period, the fund continued to hold strong-performing biotechnology and health care equipment stocks, but the six-month result was largely influenced by the subpar performance of pharmaceuticals, which accounted for more than 50% of the fund’s holdings.
Please note that Vanguard Health Care Fund has been reopened to new shareholders, as of August 7, 2008. New accounts can be opened with a minimum initial investment of $25,000.
Stocks rode a bumpy path to disappointing results
U.S. stocks struggled during the six months, a period of pronounced volatility in the financial markets. Continued weakness in the housing market, record oil prices, rising unemployment, and an uptick in inflation all weighed on stocks and set a downbeat tone for the period.
The U.S. market performed well in April and May, but those returns were bookended by declines earlier and later in the period. June was a particularly difficult month; the
2
broad U.S. stock market declined –8.2%, the worst single-month return in more than five years.
For the half-year, the broad U.S. stock market returned –5.9%. Investors favored small-capitalization stocks over large- and mid-caps, and growth stocks over their value-oriented counterparts. International stocks also experienced high levels of volatility, and returned –3.8%.
Bond investors remained cautious in the wake of the subprime crisis
In the extensive fallout from the subprime-mortgage crisis, bond investors continued to prefer the safety of short-term, high-quality issues—most notably U.S. Treasury securities. During the period, bonds outpaced stocks, but registered negative returns. The broad taxable bond market returned –0.6%. Municipal bonds, which experienced a spike in volatility, returned –0.9%.
During the half-year, the Federal Reserve Board lowered its target for the federal funds rate twice, reducing it a total of 1.00 percentage point, to 2.00%. At its June meeting (and again at its August meeting after the end of the fund’s fiscal period), the Fed voted to leave the target rate unchanged, signaling a growing concern about near-term inflation.
Market Barometer | | | |
| Total Returns |
| Periods Ended July 31, 2008 |
| Six Months | One Year | Five Years1 |
Stocks | | | |
Russell 1000 Index (Large-caps) | –6.6% | –10.6% | 7.5% |
Russell 2000 Index (Small-caps) | 0.9 | –6.7 | 9.8 |
Dow Jones Wilshire 5000 Index (Entire market) | –5.9 | –10.2 | 8.1 |
MSCI All Country World Index ex USA (International) | –3.8 | –9.3 | 17.9 |
| | | |
| | | |
Bonds | | | |
Lehman U.S. Aggregate Bond Index (Broad taxable market) | –0.6% | 6.2% | 4.6% |
Lehman Municipal Bond Index | –0.9 | 2.8 | 4.3 |
Citigroup 3-Month Treasury Bill Index | 1.0 | 3.1 | 3.1 |
| | | |
| | | |
CPI | | | |
Consumer Price Index | 4.2% | 5.6% | 3.6% |
| | | |
| | | |
| | | |
| | | |
1 Annualized. | | | |
3
Pharmaceutical companies continued to struggle
Vanguard Health Care Fund’s performance during the past six months is consistent with themes that have governed the sector for much of the past few years: investor concern about regulatory hurdles and the industry’s dwindling pipeline of new drugs. Although some pharmaceutical companies enjoyed healthy returns for the period, the subsector had an overall negative impact on the fund’s returns.
One bright spot for the fund was British drug giant AstraZeneca, which scored regulatory success with its antipsychotic drug Seroquel. Another was Schering-Plough, one of the fund’s largest holdings, which, despite troubles in March, saw a spike in returns after reporting strong first-quarter earnings.
Meanwhile, other pharmaceutical companies had a difficult run. Merck was down significantly for the period, because of problems with several of its blockbuster drugs. Pfizer’s stock stumbled after users of the anti-smoking drug Chantix complained of side effects.
During the six months, both biotech-nology stocks and health care equipment companies generally performed well. Although the fund was underweighted in these areas, the advisor’s strong stock selection helped to make up for the deficits.
Annualized Expense Ratios1 | | | |
Your Fund Compared With Its Peer Group | | | |
| | | Average |
| | | Health/ |
| Investor | Admiral | Biotechnology |
| Shares | Shares | Fund1 |
Health Care Fund | 0.27% | 0.20% | 1.54% |
1 Fund expense ratios reflect the six months ended July 31, 2008. Peer-group expense ratio is derived from data provided by Lipper Inc. and captures information through year-end 2007.
4
Managed health care companies suffered during the period because of concerns about increased liabilities and decreased future enrollment. However, the fund fared better than its index in this area, again because of strong stock selection.
Sector funds can help diversify a portfolio
Investors endured difficult times during the past several months, as trouble continued in the U.S. economy. Unfortunately, the heath care sector has been no stranger to the turbulence. Such volatility in the market place is a good reminder of why we urge shareholders to avoid reacting to short-term noise. Instead, Vanguard suggests that shareholders maintain a well-balanced portfolio with a long-term perspective.
In practice, this means building a portfolio that includes stocks, bonds, and short-term reserves, one that can provide some protection against the stock market’s occasionally sharp declines, while allowing you to participate in its long-term potential for growth. As part of such a well-balanced investment plan, Vanguard Health Care Fund can diversify your portfolio and help you reach your financial goals.
When I wrote to you six months ago, Vanguard’s board had elected F. William McNabb III as the fund’s president and designated him to succeed me as chief executive officer. The board has since announced that Bill will assume the chief executive role on August 31. Bill and the rest of our team will serve you and our other clients extremely well in the years ahead.
Thank you for investing with Vanguard.
Sincerely,

John J. Brennan
Chairman and Chief Executive Officer
August 12, 2008
5
Advisor’s Report
The Health Care Fund returned –1.3% for the six months ending July 31, 2008. In comparison, the S&P 500 Index returned –7.1%, the S&P Health Care Index returned –3.5%, and the average return for health biotechnology mutual funds was 2.7%.
The investment environment
Health care companies held up better than most other stocks in the period owing to the defensive nature of the sector. The larger biotechnology companies led the group’s performance, and medical-product companies also did well as the U.S. dollar’s decline boosted international earnings. The large pharmaceutical companies lagged as the Food and Drug Administration (FDA) became increasingly cautious toward new products. Managed care companies were quite weak as a result of reduced profit expectations.
Our successes
AstraZeneca rebounded, providing a significant boost to performance, after a U.S. court upheld the patent on Seroquel, the company’s antipsychotic drug. Our biotech holdings Amgen, Genentech, and Gilead Sciences were particularly helpful. Millennium Pharmaceuticals’ acquisition at a premium by Takeda also benefited the fund.
Portfolio Changes | |
Six Months Ended July 31, 2008 | |
| |
Additions | Comments |
UnitedHealth Group | Added on weakness. |
Merck | Added on weakness. |
WellPoint | Added on weakness. |
| |
| |
Reductions | Comments |
Medtronic | Reduced after the stock rose. |
Cardinal Health | Reduced because of declining fundamentals. |
Millennium Pharmaceuticals | Eliminated upon the company’s acquisition by Takeda. |
6
Our shortfalls
The managed care companies Humana, UnitedHealth, and WellPoint were the biggest detractors during the period. Pharma companies Merck and Forest Laboratories also were quite weak. We added significantly to all five companies, believing their problems to be transitory in nature and overly reflected in their stock declines.
The fund’s positioning
The turmoil in the financial and energy markets should lead to a weaker economy in the next year. Health care stocks should do better than the overall market in this environment. The FDA, which we view as excessively cautious, is a counterpoint that works against optimism for the sector. We will continue to invest with a long-term focus, maintaining appropriate diversification and attention to valuation.
Edward P. Owens
Senior Vice President and Portfolio Manager
Wellington Management Company, LLP
August 12, 2008
7
Fund Profile
As of July 31, 2008
Portfolio Characteristics | | |
| | Comparative | Broad |
| Fund | Index1 | Index2 |
Number of Stocks | 76 | 53 | 4,724 |
Median Market Cap | $34.2B | $53.6B | $31.5B |
Price/Earnings Ratio | 19.0x | 20.2x | 16.6x |
Price/Book Ratio | 2.9x | 3.2x | 2.3x |
Yield3 | | 2.0% | 2.1% |
Investor Shares | 1.1% | | |
Admiral Shares | 1.2% | | |
Return on Equity | 17.6% | 19.9% | 19.7% |
Earnings Growth Rate | 15.4% | 14.7% | 18.5% |
Foreign Holdings | 25.5% | 0.0% | 0.0% |
Turnover Rate4 | 11% | — | — |
Expense Ratio4 | | — | — |
Investor Shares | 0.27% | | |
Admiral Shares | 0.20% | | |
Short-Term Reserves | 8.3% | — | — |
Sector Diversification5 (% of equity exposure) |
| |
Biotechnology | 9.9% |
Drug Retail | 1.9 |
Health Care Distributors | 5.3 |
Health Care Equipment | 8.8 |
Health Care Facilities | 1.1 |
Health Care Services | 2.4 |
Health Care Technology | 1.7 |
Industrials | 0.4 |
Managed Health Care | 8.8 |
Materials | 1.2 |
Pharmaceuticals | 57.1 |
Other Health Care | 1.4 |
Volatility Measures6 | |
| Fund Versus | Fund Versus |
| Comparative Index1 | Broad Index2 |
R-Squared | 0.87 | 0.34 |
Beta | 0.81 | 0.51 |
Ten Largest Holdings7 (% of total net assets) |
| |
Schering-Plough Corp. | 5.2% |
Eli Lilly & Co. | 4.8 |
Forest Laboratories, Inc. | 4.6 |
Roche Holdings AG | 4.1 |
AstraZeneca Group PLC | 3.6 |
Abbott Laboratories | 3.2 |
McKesson Corp. | 3.2 |
Sanofi-Aventis | 3.2 |
Merck & Co., Inc. | 2.7 |
Astellas Pharma Inc. | 2.7 |
Top Ten | 37.3% |
Market Diversification (% of equity exposure) |
| |
United States | 72.3% |
Japan | 10.9 |
Switzerland | 7.1 |
United Kingdom | 4.3 |
France | 3.8 |
Other Markets | 1.6 |
Investment Focus
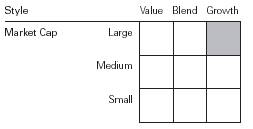
1 S&P Health Care Index.
2 Dow Jones Wilshire 5000 Index.
3 30-day SEC yield for the fund; annualized dividend yield for the indexes. See the Glossary on pages 26–27.
4 Annualized.
5 Sector percentages combine U.S. and international holdings.
6 For an explanation of R-squared, beta, and other terms used here, see the Glossary on pages 26–27.
7 The holdings listed exclude any temporary cash investments and equity index products.
8
Performance Summary
All of the returns in this report represent past performance, which is not a guarantee of future results that may be achieved by the fund. (Current performance may be lower or higher than the performance data cited. For performance data current to the most recent month-end, visit our website at www.vanguard.com/performance.) Note, too, that both investment returns and principal value can fluctuate widely, so an investor’s shares, when sold, could be worth more or less than their original cost. The returns shown do not reflect taxes that a shareholder would pay on fund distributions or on the sale of fund shares.
Fiscal-Year Total Returns (%): January 31, 1998–July 31, 2008
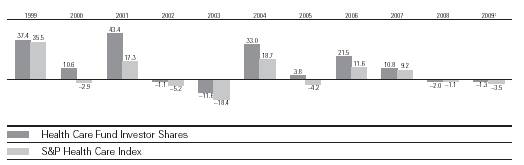
Average Annual Total Returns: Periods Ended June 30, 2008 |
This table presents average annual total returns through the latest calendar quarter—rather than |
through the end of the fiscal period. Securities and Exchange Commission rules require that we |
provide this information. |
| | | | |
| Inception Date | One Year | Five Years | Ten Years |
Investor Shares2 | 5/23/1984 | –10.32% | 8.27% | 10.70% |
Admiral Shares2 | 11/12/2001 | –10.26 | 8.36 | 6.733 |
1 Six months ended July 31, 2008.
2 Total returns do not reflect the 1% fee assessed on redemptions of shares held less than one year, nor for the Investor Shares do they include the account service fee that may be applicable to certain accounts with balances below $10,000.
3 Return since inception.
Note: See Financial Highlights tables on pages 15–16 for dividend and capital gains information.
9
Financial Statements (unaudited)
Statement of Net Assets
As of July 31, 2008
The fund provides a complete list of its holdings four times in each fiscal year, at the quarter-ends. For the second and fourth fiscal quarters, the lists appear in the fund’s semiannual and annual reports to shareholders. For the first and third fiscal quarters, the fund files the lists with the Securities and Exchange Commission on Form N-Q. Shareholders can look up the fund’s Forms N-Q on the SEC’s website at www.sec.gov. Forms N-Q may also be reviewed and copied at the SEC’s Public Reference Room (see the back cover of this report for further information).
| | | Market |
| | | Value• |
| | Shares | ($000) |
Common Stocks (91.8%) | | |
United States (66.3%) | | |
Biotechnology (9.0%) | | |
* | Amgen, Inc. | 9,738,455 | 609,919 |
* | Genzyme Corp. | 6,219,340 | 476,712 |
* | Genentech, Inc. | 3,150,000 | 300,038 |
*1 | OSI Pharmaceuticals, Inc. | 3,480,000 | 183,152 |
* | Gilead Sciences, Inc. | 2,999,696 | 161,924 |
* | Cephalon, Inc. | 1,602,000 | 117,202 |
* | Biogen Idec Inc. | 1,207,300 | 84,221 |
* | Vertex | | |
| Pharmaceuticals, Inc. | 2,393,800 | 82,586 |
*^ | Amylin | | |
| Pharmaceuticals, Inc. | 2,057,200 | 64,905 |
* | Human Genome | | |
| Sciences, Inc. | 938,500 | 6,222 |
| PDL BioPharma Inc. | 230,500 | 2,575 |
| | | 2,089,456 |
Chemicals (1.1%) | | |
| Sigma-Aldrich Corp. | 4,250,000 | 258,145 |
| | | |
Food & Staples Retailing (1.7%) | | |
| Walgreen Co. | 11,450,000 | 393,193 |
| | | |
Health Care Equipment & Supplies (8.5%) | | |
| Becton, Dickinson & Co. | 5,900,000 | 500,969 |
* | St. Jude Medical, Inc. | 9,110,900 | 424,386 |
| Medtronic, Inc. | 7,614,900 | 402,295 |
| Baxter International, Inc. | 3,400,000 | 233,274 |
| Beckman Coulter, Inc. | 2,776,600 | 200,859 |
| DENTSPLY International Inc. | 2,485,400 | 100,037 |
* | Hospira, Inc. | 1,695,070 | 64,684 |
| STERIS Corp. | 850,000 | 29,045 |
| | | 1,955,549 |
Health Care Providers & Services (16.0%) | | |
| McKesson Corp. | 13,300,000 | 744,667 |
| UnitedHealth Group Inc. | 18,867,300 | 529,794 |
* | WellPoint Inc. | 6,902,400 | 362,031 |
* | Humana Inc. | 7,767,800 | 341,084 |
| Quest Diagnostics, Inc. | 5,335,400 | 283,630 |
| Cardinal Health, Inc. | 5,136,708 | 275,995 |
* | Coventry Health Care Inc. | 6,551,500 | 231,727 |
| CIGNA Corp. | 6,200,000 | 229,524 |
* | Laboratory Corp. of | | |
| America Holdings | 2,731,360 | 184,585 |
| Universal Health Services | | |
| Class B | 2,260,400 | 137,026 |
* | Health Net Inc. | 3,500,000 | 97,860 |
*1 | Health Management | | |
| Associates Class A | 15,756,900 | 96,905 |
^ | Owens & Minor, Inc. | | |
| Holding Co. | 2,000,000 | 91,840 |
| Aetna Inc. | 1,200,000 | 49,212 |
* | WellCare Health Plans Inc. | 500,000 | 19,665 |
* | DaVita, Inc. | 204,600 | 11,427 |
| | | 3,686,972 |
Heath Care Technology (1.6%) | | |
*1 | Cerner Corp. | 4,200,000 | 187,572 |
| IMS Health, Inc. | 8,547,400 | 178,641 |
| | | 366,213 |
Household Products (0.5%) | | |
| Colgate-Palmolive Co. | 1,200,000 | 89,124 |
| Kimberly-Clark Corp. | 376,300 | 21,762 |
| | | 110,886 |
Life Science Tools & Services (0.3%) | | |
* | PAREXEL | | |
| International Corp. | 2,640,400 | 77,179 |
| | | |
Machinery (0.4%) | | |
| Pall Corp. | 2,204,600 | 89,110 |
| | | |
Pharmaceuticals (27.2%) | | |
| Schering-Plough Corp. | 57,304,300 | 1,207,975 |
| Eli Lilly & Co. | 23,479,900 | 1,106,138 |
*1 | Forest Laboratories, Inc. | 30,133,000 | 1,070,023 |
| Abbott Laboratories | 13,300,000 | 749,322 |
| Merck & Co., Inc. | 18,871,200 | 620,862 |
| Wyeth | 9,729,800 | 394,252 |
| Bristol-Myers Squibb Co. | 15,100,000 | 318,912 |
| Pfizer Inc. | 13,911,570 | 259,729 |
10
| | | Market |
| | | Value• |
| | Shares | ($000) |
| Allergan, Inc. | 4,100,000 | 212,913 |
| Perrigo Co. | 4,450,000 | 156,774 |
* | Sepracor Inc. | 4,175,400 | 72,986 |
* | Watson | | |
| Pharmaceuticals, Inc. | 2,100,000 | 60,711 |
| Johnson & Johnson | 800,000 | 54,776 |
| | | 6,285,373 |
Total United States | | 15,312,076 |
International (25.5%) | | |
Belgium (0.5%) | | |
| UCB SA | 3,123,593 | 106,920 |
| | | |
Denmark (0.2%) | | |
| Novo Nordisk A/S B Shares | 800,000 | 50,725 |
| | | |
France (3.5%) | | |
| Sanofi-Aventis | 10,407,991 | 730,572 |
| Ipsen Promesses | 1,400,000 | 74,765 |
| | | 805,337 |
Germany (0.8%) | | |
| Bayer AG | 1,894,656 | 163,055 |
| Fresenius Medical Care AG | 611,950 | 33,710 |
| | | 196,765 |
Japan (10.0%) | | |
| Astellas Pharma Inc. | 14,265,700 | 618,558 |
| Takeda | | |
| Pharmaceutical Co. Ltd. | 10,449,900 | 554,830 |
| Daiichi Sankyo Co., Ltd. | 12,411,500 | 370,563 |
| Eisai Co., Ltd. | 9,793,700 | 350,744 |
| Shionogi & Co., Ltd. | 9,776,000 | 191,460 |
| Tanabe Seiyaku Co., Ltd. | 6,850,000 | 89,106 |
| Chugai | | |
| Pharmaceutical Co., Ltd. | 4,001,800 | 63,967 |
| Ono | | |
| Pharmaceutical Co., Ltd. | 960,000 | 52,885 |
| Terumo Corp. | 200,000 | 10,328 |
| | | 2,302,441 |
Switzerland (6.6%) | | |
| Roche Holdings AG | 5,123,977 | 946,715 |
| Novartis AG (Registered) | 9,519,880 | 565,154 |
| | | 1,511,869 |
United Kingdom (3.9%) | | |
| AstraZeneca Group PLC | 15,081,500 | 733,012 |
| AstraZeneca Group | | |
| PLC ADR | 1,896,672 | 92,083 |
| GlaxoSmithKline PLC ADR | 1,642,381 | 76,469 |
| | | 901,564 |
Total International | | 5,875,621 |
Total Common Stocks | | |
(Cost $14,752,296) | | 21,187,697 |
Temporary Cash Investments (8.3%) | | |
Money Market Fund (0.1%) | | |
2 | Vanguard Market | | |
| Liquidity Fund, | | |
| 2.386%—Note G | 32,213,475 | 32,213 |
| | | |
| | | |
| | Face | |
| | Amount | |
| | ($000) | |
Commercial Paper (1.7%) | | |
| General Electric Capital Corp. | | |
| 2.349%, 8/4/08 | 200,000 | 199,961 |
| General Electric Capital Corp. | | |
| 2.546%, 10/21/08 | 200,000 | 198,870 |
| | | 398,831 |
Repurchase Agreements (6.5%) | | |
| Banc of America | | |
| Securities, LLC | | |
| 2.210%, 8/1/08 | | |
| (Dated 7/31/08, | | |
| Repurchase Value | | |
| $482,430,000 collateralized | | |
| by Federal National Mortgage | | |
| Assn. 5.000%, 8/1/33) | 482,400 | 482,400 |
| Deutsche Bank | | |
| Securities, Inc. | | |
| 2.200%, 8/1/08 | | |
| (Dated 7/31/08, | | |
| Repurchase Value | | |
| $660,140,000 collateralized | | |
| by Federal Home Loan | | |
| Mortgage Corp. | | |
| 4.500%–7.500%, | | |
| 5/1/16–7/1/38 and | | |
| Government National | | |
| Mortgage Assn. | | |
| 4.500%–7.000%, | | |
| 5/15/23–6/15/38) | 660,100 | 660,100 |
| Merrill Lynch, Pierce, | | |
| Fenner & Smith Inc. | | |
| 2.200%, 8/1/08 (Dated | | |
| 7/31/08, Repurchase | | |
| Value $350,721,000 | | |
| collateralized by Federal | | |
| National Mortgage Assn. | | |
| 4.500%–5.500%, | | |
| 9/1/18–2/1/38) | 350,700 | 350,700 |
| | | 1,493,200 |
Total Temporary Cash Investments | | |
(Cost $1,924,236) | | 1,924,244 |
11
| Market |
| Value• |
| ($000) |
Total Investments (100.1%) | |
(Cost $16,676,532) | 23,111,941 |
Other Assets and | |
Liabilities—Net (–0.1%) | (32,834) |
Net Assets (100%) | 23,079,107 |
| |
| |
Statement of Assets and Liabilities | |
Assets | |
Investments in Securities, at Value | 23,111,941 |
Accrued Income Receivable | 16,111 |
Other Assets—Note C | 41,552 |
Total Assets | 23,169,604 |
Liabilities | |
Security Lending Collateral | |
Payable to Brokers—Note G | 32,213 |
Payables for Capital Shares Redeemed | 8,761 |
Other Liabilities | 49,523 |
Total Liabilities | 90,497 |
Net Assets | 23,079,107 |
At July 31, 2008, net assets consisted of:3 |
| Amount |
| ($000) |
Paid-in Capital | 15,506,256 |
Undistributed Net Investment Income | 191,918 |
Accumulated Net Realized Gains | 938,475 |
Unrealized Appreciation | |
Investment Securities | 6,435,409 |
Foreign Currencies and | |
Forward Currency Contracts | 7,049 |
Net Assets | 23,079,107 |
| |
| |
Investor Shares—Net Assets | |
Applicable to 101,853,983 outstanding | |
$.001 par value shares of beneficial | |
interest (unlimited authorization) | 13,299,980 |
Net Asset Value Per Share— | |
Investor Shares | $130.58 |
| |
| |
Admiral Shares—Net Assets | |
Applicable to 177,394,289 outstanding | |
$.001 par value shares of beneficial | |
interest (unlimited authorization) | 9,779,127 |
Net Asset Value Per Share— | |
Admiral Shares | $55.13 |
• See Note A in Notes to Financial Statements.
* Non-income-producing security.
^ Part of security position is on loan to broker-dealers. See Note G in Notes to Financial Statements.
1 Considered an affiliated company of the fund as the fund owns more than 5% of the outstanding voting securities of such company. See Note I in Notes to Financial Statements.
2 Affiliated money market fund available only to Vanguard funds and certain trusts and accounts managed by Vanguard. Rate shown is the 7-day yield.
3 See Note E in Notes to Financial Statements for the tax-basis components of net assets. ADR—American Depositary Receipt.
12
Statement of Operations
| Six Months Ended |
| July 31, 2008 |
| ($000) |
Investment Income | |
Income | |
Dividends1,2 | 238,278 |
Interest | 20,780 |
Security Lending | 3,955 |
Total Income | 263,013 |
Expenses | |
Investment Advisory Fees—Note B | 11,241 |
The Vanguard Group—Note C | |
Management and Administrative | |
Investor Shares | 9,535 |
Admiral Shares | 3,700 |
Marketing and Distribution | |
Investor Shares | 1,109 |
Admiral Shares | 774 |
Custodian Fees | 747 |
Shareholders’ Reports | |
Investor Shares | 100 |
Admiral Shares | 12 |
Trustees’ Fees and Expenses | 19 |
Total Expenses | 27,237 |
Expenses Paid Indirectly—Note D | (148) |
Net Expenses | 27,089 |
Net Investment Income | 235,924 |
Realized Net Gain (Loss) | |
Investment Securities Sold2 | 952,070 |
Foreign Currencies and Forward Currency Contracts | (14,223) |
Realized Net Gain (Loss) | 937,847 |
Change in Unrealized Appreciation (Depreciation) | |
Investment Securities | (1,552,917) |
Foreign Currencies and Forward Currency Contracts | 6,079 |
Change in Unrealized Appreciation (Depreciation) | (1,546,838) |
Net Increase (Decrease) in Net Assets Resulting from Operations | (373,067) |
1 Dividends are net of foreign withholding taxes of $16,056,000.
2 Dividend income and realized net gain (loss) from affiliated companies of the fund were $1,288,000 and $15,327,000, respectively.
13
Statement of Changes in Net Assets
| Six Months Ended | Year Ended |
| July 31, | January 31, |
| 2008 | 2008 |
| ($000) | ($000) |
Increase (Decrease) in Net Assets | | |
Operations | | |
Net Investment Income | 235,924 | 493,984 |
Realized Net Gain (Loss) | 937,847 | 1,822,275 |
Change in Unrealized Appreciation (Depreciation) | (1,546,838) | (2,755,175) |
Net Increase (Decrease) in Net Assets Resulting from Operations | (373,067) | (438,916) |
Distributions | | |
Net Investment Income | | |
Investor Shares | (3,474) | (277,864) |
Admiral Shares | (3,870) | (212,406) |
Realized Capital Gain1 | | |
Investor Shares | (142,143) | (1,084,200) |
Admiral Shares | (105,050) | (782,841) |
Total Distributions | (254,537) | (2,357,311) |
Capital Share Transactions—Note H | | |
Investor Shares | (653,409) | (757,827) |
Admiral Shares | (466,933) | 900,247 |
Net Increase (Decrease) from Capital Share Transactions | (1,120,342) | 142,420 |
Total Increase (Decrease) | (1,747,946) | (2,653,807) |
Net Assets | | |
Beginning of Period | 24,827,053 | 27,480,860 |
End of Period2 | 23,079,107 | 24,827,053 |
1 Includes fiscal 2009 and 2008 short-term gain distributions totaling $4,578,000 and $40,898,000, respectively. Short-term gain distributions are treated as ordinary income dividends for tax purposes.
2 Net Assets—End of Period includes undistributed (overdistributed) net investment income of $191,918,000 and ($35,789,000).
14
Financial Highlights
Investor Shares | | | | | | |
| | | | | | |
| Six Months | | | | | |
| Ended | | | |
For a Share Outstanding | July 31, | Year Ended January 31, |
Throughout Each Period | 2008 | 2008 | 2007 | 2006 | 2005 | 2004 |
Net Asset Value, Beginning of Period | $133.80 | $149.69 | $143.39 | $123.84 | $124.29 | $94.35 |
Investment Operations | | | | | | |
Net Investment Income | 1.226 | 2.7661 | 1.953 | 1.753 | 1.272 | .960 |
Net Realized and Unrealized Gain (Loss) | | | | | | |
on Investments | (3.063) | (5.317) | 13.107 | 24.424 | 3.385 | 30.078 |
Total from Investment Operations | (1.837) | (2.551) | 15.060 | 26.177 | 4.657 | 31.038 |
Distributions | | | | | | |
Dividends from Net Investment Income | (.033) | (2.747) | (2.100) | (1.542) | (1.112) | (.995) |
Distributions from Realized Capital Gains | (1.350) | (10.592) | (6.660) | (5.085) | (3.995) | (.103) |
Total Distributions | (1.383) | (13.339) | (8.760) | (6.627) | (5.107) | (1.098) |
Net Asset Value, End of Period | $130.58 | $133.80 | $149.69 | $143.39 | $123.84 | $124.29 |
| | | | | | |
| | | | | | |
Total Return2 | –1.33% | –1.97% | 10.85% | 21.49% | 3.76% | 32.99% |
| | | | | | |
| | | | | | |
Ratios/Supplemental Data | | | | | | |
Net Assets, End of Period (Millions) | $13,300 | $14,314 | $16,662 | $17,198 | $19,087 | $18,340 |
Ratio of Total Expenses to | | | | | | |
Average Net Assets | 0.27%* | 0.26% | 0.25% | 0.25% | 0.22% | 0.28% |
Ratio of Net Investment Income to | | | | | | |
Average Net Assets | 2.01%* | 1.78%1 | 1.33% | 1.29% | 1.02% | 0.91% |
Portfolio Turnover Rate | 11%* | 9% | 8% | 14% | 13% | 13% |
1 Net investment income per share and the ratio of net investment income to average net assets include $0.585 and 0.40%, respectively, resulting from a special dividend from Health Management Associates Class A in March 2007.
2 Total returns do not reflect the 1% fee assessed on redemptions after March 23, 2005, of shares held for less than one year, or the 1% fee assessed until March 23, 2005, on shares purchased on or after April 19, 1999, and held for less than five years. Total returns do not include the account service fee that may be applicable to certain accounts with balances below $10,000.
* Annualized.
15
Admiral Shares | | | | | | |
| | | | | | |
| Six Months | | | | | |
| Ended | | | |
For a Share Outstanding | July 31, | Year Ended January 31, |
Throughout Each Period | 2008 | 2008 | 2007 | 2006 | 2005 | 2004 |
Net Asset Value, Beginning of Period | $56.47 | $63.19 | $60.52 | $52.25 | $52.44 | $39.80 |
Investment Operations | | | | | | |
Net Investment Income | .536 | 1.2201 | .877 | .779 | .576 | .447 |
Net Realized and Unrealized Gain (Loss) | | | | | | |
on Investments | (1.285) | (2.257) | 5.542 | 10.328 | 1.431 | 12.696 |
Total from Investment Operations | (.749) | (1.037) | 6.419 | 11.107 | 2.007 | 13.143 |
Distributions | | | | | | |
Dividends from Net Investment Income | (.021) | (1.212) | (.938) | (.690) | (.511) | (.460) |
Distributions from Realized Capital Gains | (.570) | (4.471) | (2.811) | (2.147) | (1.686) | (.043) |
Total Distributions | (.591) | (5.683) | (3.749) | (2.837) | (2.197) | (.503) |
Net Asset Value, End of Period | $55.13 | $56.47 | $63.19 | $60.52 | $52.25 | $52.44 |
| | | | | | |
| | | | | | |
Total Return2 | –1.28% | –1.90% | 10.96% | 21.62% | 3.84% | 33.12% |
| | | | | | |
| | | | | | |
Ratios/Supplemental Data | | | | | | |
Net Assets, End of Period (Millions) | $9,779 | $10,513 | $10,819 | $9,123 | $2,819 | $2,492 |
Ratio of Total Expenses to | | | | | | |
Average Net Assets | 0.20%* | 0.18% | 0.17% | 0.14% | 0.15% | 0.19% |
Ratio of Net Investment Income to | | | | | | |
Average Net Assets | 2.08%* | 1.86%1 | 1.41% | 1.40% | 1.10% | 0.98% |
Portfolio Turnover Rate | 11%* | 9% | 8% | 14% | 13% | 13% |
1 Net investment income per share and the ratio of net investment income to average net assets include $0.247 and 0.40%, respectively, resulting from a special dividend from Health Management Associates Class A in March 2007.
2 Total returns do not reflect the 1% fee assessed on redemptions after March 23, 2005, of shares held for less than one year, or the 1% fee previously assessed on shares held for less than five years.
* Annualized.
See accompanying Notes, which are an integral part of the Financial Statements.
16
Notes to Financial Statements
Vanguard Health Care Fund is registered under the Investment Company Act of 1940 as an open-end investment company, or mutual fund. The fund files reports with the SEC under the company name Vanguard Specialized Funds. The fund may invest in securities of foreign issuers, which may subject it to investment risks not normally associated with investing in securities of United States corporations. The fund offers two classes of shares, Investor Shares and Admiral Shares. Investor Shares are available to any investor who meets the fund’s minimum purchase requirements. Admiral Shares are designed for investors who meet certain administrative, service, tenure, and account-size criteria.
A. The following significant accounting policies conform to generally accepted accounting principles for U.S. mutual funds. The fund consistently follows such policies in preparing its financial statements.
1. Security Valuation: Securities are valued as of the close of trading on the New York Stock Exchange (generally 4 p.m., Eastern time) on the valuation date. Equity securities are valued at the latest quoted sales prices or official closing prices taken from the primary market in which each security trades; such securities not traded on the valuation date are valued at the mean of the latest quoted bid and asked prices. Securities for which market quotations are not readily available, or whose values have been affected by events occurring before the fund’s pricing time but after the close of the securities’ primary markets, are valued at their fair values calculated according to procedures adopted by the board of trustees. These procedures include obtaining quotations from an independent pricing service, monitoring news to identify significant market- or security-specific events, and evaluating changes in the values of foreign market proxies (for example, ADRs, futures contracts, or exchange-traded funds), between the time the foreign markets close and the fund’s pricing time. When fair-value pricing is employed, the prices of securities used by a fund to calculate its net asset value may differ from quoted or published prices for the same securities. Investments in Vanguard Market Liquidity Fund are valued at that fund’s net asset value. Temporary cash investments acquired over 60 days to maturity are valued using the latest bid prices or using valuations based on a matrix system (which considers such factors as security prices, yields, maturities, and ratings), both as furnished by independent pricing services. Other temporary cash investments are valued at amortized cost, which approximates market value.
2. Foreign Currency: Securities and other assets and liabilities denominated in foreign currencies are translated into U.S. dollars using exchange rates obtained from an independent third party as of the fund’s pricing time on the valuation date. Realized gains (losses) and unrealized appreciation (depreciation) on investment securities include the effects of changes in exchange rates since the securities were purchased, combined with the effects of changes in security prices. Fluctuations in the value of other assets and liabilities resulting from changes in exchange rates are recorded as unrealized foreign currency gains (losses) until the assets or liabilities are settled in cash, at which time they are recorded as realized foreign currency gains (losses).
3. Forward Currency Contracts: The fund enters into forward currency contracts to protect the value of securities and related receivables and payables against changes in future foreign exchange rates. The fund’s risks in using these contracts include movement in the values of the foreign currencies relative to the U.S. dollar and the ability of the counterparties to fulfill their obligations under the contracts.
Forward currency contracts are valued at their quoted daily settlement prices. The aggregate principal amounts of the contracts are not recorded in the Statement of Net Assets. Fluctuations in the value of the contracts are recorded in the Statement of Net Assets as an asset (liability) and in the Statement of Operations as unrealized appreciation (depreciation) until the contracts are closed, when they are recorded as realized forward currency contract gains (losses).
17
4. Repurchase Agreements: The fund may invest in repurchase agreements. Securities pledged as collateral for repurchase agreements are held by a custodian bank until the agreements mature. Each agreement requires that the market value of the collateral be sufficient to cover payments of interest and principal; however, in the event of default or bankruptcy by the other party to the agreement, retention of the collateral may be subject to legal proceedings.
5. Federal Income Taxes: The fund intends to continue to qualify as a regulated investment company and distribute all of its taxable income. Management has analyzed the fund’s tax positions taken on federal income tax returns for all open tax years (tax years ended January 31, 2005–2008) and for the period ended July 31, 2008, and has concluded that no provision for federal income tax is required in the fund’s financial statements.
6. Distributions: Distributions to shareholders are recorded on the ex-dividend date.
7. Security Lending: The fund may lend its securities to qualified institutional borrowers to earn additional income. Security loans are required to be secured at all times by collateral at least equal to the market value of securities loaned. The fund invests cash collateral received in Vanguard Market Liquidity Fund, and records a liability for the return of the collateral, during the period the securities are on loan. Security lending income represents the income earned on investing cash collateral, less expenses associated with the loan.
8. Other: Dividend income is recorded on the ex-dividend date. Interest income is accrued daily. Premiums and discounts on debt securities purchased are amortized and accreted, respectively, to interest income over the lives of the respective securities. Security transactions are accounted for on the date securities are bought or sold. Costs used to determine realized gains (losses) on the sale of investment securities are those of the specific securities sold. Fees assessed on redemptions of capital shares are credited to paid-in capital.
Each class of shares has equal rights as to assets and earnings, except that each class separately bears certain class-specific expenses related to maintenance of shareholder accounts (included in Management and Administrative expenses) and shareholder reporting. Marketing and distribution expenses are allocated to each class of shares based on a method approved by the board of trustees. Income, other non-class-specific expenses, and gains and losses on investments are allocated to each class of shares based on its relative net assets.
B. Wellington Management Company, LLP, provides investment advisory services to the fund for a fee calculated at an annual percentage rate of average net assets. For the six months ended July 31, 2008, the investment advisory fee represented an effective annual rate of 0.10% of the fund’s average net assets.
C. The Vanguard Group furnishes at cost corporate management, administrative, marketing, and distribution services. The costs of such services are allocated to the fund under methods approved by the board of trustees. The fund has committed to provide up to 0.40% of its net assets in capital contributions to Vanguard. At July 31, 2008, the fund had contributed capital of $1,901,000 to Vanguard (included in Other Assets), representing 0.01% of the fund’s net assets and 1.90% of Vanguard’s capitalization. The fund’s trustees and officers are also directors and officers of Vanguard.
18
D. The fund has asked its investment advisor to direct certain security trades, subject to obtaining the best price and execution, to brokers who have agreed to rebate to the fund part of the commissions generated. Such rebates are used solely to reduce the fund’s management and administrative expenses. The fund’s custodian bank has also agreed to reduce its fees when the fund maintains cash on deposit in the non-interest-bearing custody account. For the six months ended July 31, 2008, these arrangements reduced the fund’s management and administrative expenses by $123,000 and custodian fees by $25,000.
E. Distributions are determined on a tax basis and may differ from net investment income and realized capital gains for financial reporting purposes. Differences may be permanent or temporary. Permanent differences are reclassified among capital accounts in the financial statements to reflect their tax character. Temporary differences arise when certain items of income, expense, gain, or loss are recognized in different periods for financial statement and tax purposes; these differences will reverse at some time in the future. Differences in classification may also result from the treatment of short-term gains as ordinary income for tax purposes. The fund’s tax-basis capital gains and losses are determined only at the end of each fiscal year.
During the six months ended July 31, 2008, the fund realized net foreign currency losses of $873,000, which decreased distributable net income for tax purposes; accordingly such losses have been reclassified from accumulated net realized gains to undistributed net investment income.
At July 31, 2008, the cost of investment securities for tax purposes was $16,676,532,000. Net unrealized appreciation of investment securities for tax purposes was $6,435,409,000, consisting of unrealized gains of $7,446,068,000 on securities that had risen in value since their purchase and $1,010,659,000 in unrealized losses on securities that had fallen in value since their purchase.
At July 31, 2008, the fund had open forward currency contracts to receive and deliver currencies as follows:
| | | | | Unrealized |
| | | | | Appreciation |
| | Contract Amount (000) | (Depreciation) |
Contract Settlement Date | | Receive | | Deliver | ($000) |
9/12/08 | USD | 311,317 | EUR | 200,000 | 1,881 |
9/12/08 | USD | 286,365 | CHF | 300,000 | 5,887 |
9/12/08 | USD | 197,430 | GBP | 100,000 | (599) |
| | | | | |
CHF—Swiss franc. | | | | | |
EUR—Euro. | | | | | |
GBP—British pound. | | | | | |
USD—U.S. dollar. | | | | | |
Unrealized appreciation (depreciation) on open forward currency contracts is treated as realized gain (loss) for tax purposes.
The fund had net unrealized foreign currency losses of $120,000 resulting from the translation of other assets and liabilities at July 31, 2008.
19
F. During the six months ended July 31, 2008, the fund purchased $1,186,085,000 of investment securities and sold $2,422,386,000 of investment securities other than temporary cash investments.
G. The market value of securities on loan to broker-dealers at July 31, 2008, was $30,822,000, for which the fund received cash collateral of $32,213,000.
H. Capital share transactions for each class of shares were:
| Six Months Ended | Year Ended |
| July 31, 2008 | January 31, 2008 |
| Amount | Shares | | Amount | Shares |
| ($000) | (000) | | ($000) | (000) |
Investor Shares | | | | | |
Issued | 267,683 | 2,107 | | 677,166 | 4,534 |
Issued in Lieu of Cash Distributions | 139,485 | 1,116 | | 1,302,730 | 9,323 |
Redeemed1 | (1,060,577) | (8,348) | | (2,737,723) | (18,187) |
Net Increase (Decrease)—Investor Shares | (653,409) | (5,125) | | (757,827) | (4,330) |
Admiral Shares | | | | | |
Issued | 228,159 | 4,213 | | 1,267,202 | 19,746 |
Issued in Lieu of Cash Distributions | 98,347 | 1,864 | | 895,071 | 15,187 |
Redeemed1 | (793,439) | (14,838) | | (1,262,026) | (19,999) |
Net Increase (Decrease)—Admiral Shares | (466,933) | (8,761) | | 900,247 | 14,934 |
I. Certain of the fund’s investments are in companies that are considered to be affiliated companies of the fund because the fund owns more than 5% of the outstanding voting securities of the company. Transactions during the period in securities of these companies were as follows:
| | Current Period Transactions | |
| Jan. 31, 2008 | | Proceeds from | | July 31, 2008 |
| Market | Purchases | Securities | Dividend | Market |
| Value | at Cost | Sold | Income | Value |
| ($000) | ($000) | ($000) | ($000) | ($000) |
Cerner Corp. | 209,600 | 9,543 | — | — | 187,572 |
Forest Laboratories, Inc. | 1,163,921 | 36,210 | 5,343 | — | 1,070,023 |
Health Management | | | | | |
Associates Class A | 84,930 | — | — | — | 96,905 |
OSI Pharmaceuticals, Inc. | 138,782 | — | — | — | 183,152 |
Owens & Minor, Inc. Holding Co. | 86,772 | — | 4,533 | 820 | NA2 |
Perrigo Co. | 151,116 | — | 17,817 | 468 | NA2 |
| 1,835,121 | | | 1,288 | 1,537,652 |
1 Net of redemption fees of $365,000 and $607,000 (fund totals).
2 At July 31, 2008, the security was still held but the issuer was no longer an affiliated company of the fund.
20
J. In September 2006, the Financial Accounting Standards Board issued Statement of Financial Accounting Standards No. 157 (“FAS 157”), “Fair Value Measurements.” FAS 157 establishes a framework for measuring fair value and expands disclosures about fair value measurements in financial statements, effective for the fund’s current fiscal period.
The various inputs that may be used to determine the value of the fund’s investments are summarized in three broad levels. The inputs or methodologies used for valuing securities are not necessarily an indication of the risk associated with investing in those securities.
Level 1—Quoted prices in active markets for identical securities.
Level 2—Other significant observable inputs (including quoted prices for similar securities, interest rates, prepayment speeds, credit risk, etc.).
Level 3—Significant unobservable inputs (including the fund’s own assumptions used to determine the fair value of investments).
The following table summarizes the fund’s investments as of July 31, 2008, based on the inputs used to value them:
| | Forward |
| Investments | Currency |
| in Securities | Contracts |
Valuation Inputs | ($000) | ($000) |
Level 1—Quoted prices | 15,512,839 | 7,169 |
Level 2—Other significant observable inputs | 7,599,102 | — |
Level 3—Significant unobservable inputs | — | — |
Total | 23,111,941 | 7,169 |
21
About Your Fund’s Expenses
As a shareholder of the fund, you incur ongoing costs, which include costs for portfolio management, administrative services, and shareholder reports (like this one), among others. Operating expenses, which are deducted from a fund’s gross income, directly reduce the investment return of the fund.
A fund’s expenses are expressed as a percentage of its average net assets. This figure is known as the expense ratio. The following examples are intended to help you understand the ongoing costs (in dollars) of investing in your fund and to compare these costs with those of other mutual funds. The examples are based on an investment of $1,000 made at the beginning of the period shown and held for the entire period.
The table below illustrates your fund’s costs in two ways:
• Based on actual fund return. This section helps you to estimate the actual expenses that you paid over the period. The “Ending Account Value” shown is derived from the fund’s actual return, and the third column shows the dollar amount that would have been paid by an investor who started with $1,000 in the fund. You may use the information here, together with the amount you invested, to estimate the expenses that you paid over the period.
To do so, simply divide your account value by $1,000 (for example, an $8,600 account value divided by $1,000 = 8.6), then multiply the result by the number given for your fund under the heading “Expenses Paid During Period.”
• Based on hypothetical 5% yearly return. This section is intended to help you compare your fund’s costs with those of other mutual funds. It assumes that the fund had a yearly return of 5% before expenses, but that the expense ratio is unchanged. In this case—because the return used is not the fund’s actual return—the results do not apply to your investment. The example is useful in making comparisons because the Securities and Exchange Commission requires all mutual funds to calculate expenses based on a 5% return. You can assess your fund’s costs by comparing this hypothetical example with the hypothetical examples that appear in shareholder reports of other funds.
Six Months Ended July 31, 2008 | | | |
| Beginning | Ending | Expenses |
| Account Value | Account Value | Paid During |
Health Care Fund | 1/31/2008 | 7/31/2008 | Period1 |
Based on Actual Fund Return | | | |
Investor Shares | $1,000.00 | $986.73 | $1.33 |
Admiral Shares | 1,000.00 | 987.21 | 0.99 |
Based on Hypothetical 5% Return | | | |
Investor Shares | $1,000.00 | $1,023.52 | $1.36 |
Admiral Shares | 1,000.00 | 1,023.87 | 1.01 |
1 These calculations are based on expenses incurred in the most recent six-month period. The fund’s annualized six-month expense ratios for that period are 0.27% for Investor Shares, and 0.20% for Admiral Shares. The dollar amounts shown as “Expenses Paid” are equal to the annualized expense ratio multiplied by the average account value over the period, multiplied by the number of days in the most recent six-month period, then divided by the number of days in the most recent 12-month period.
22
Note that the expenses shown in the table on page 22 are meant to highlight and help you compare ongoing costs only and do not reflect transaction costs incurred by the fund for buying and selling securities. Further, the expenses do not include the 1% fee on redemptions of shares held for less than one year, nor do they include the account service fee described in the prospectus. If such fees were applied to your account, your costs would be higher. Your fund does not carry a “sales load.”
The calculations assume no shares were bought or sold during the period. Your actual costs may have been higher or lower, depending on the amount of your investment and the timing of any purchases or redemptions.
You can find more information about the fund’s expenses, including annual expense ratios, in the Financial Statements section of this report. For additional information on operating expenses and other shareholder costs, please refer to your fund’s current prospectus.
23
Notice to Shareholders
The board of trustees of Vanguard Health Care Fund has adopted a new advisory fee schedule for the fund, effective August 1, 2008. The new advisory fee schedule is expected to increase the fund’s expense ratio by 0.02%. For shareholders, the increase represents an additional $2.00 in yearly cost on a $10,000 investment. This change will not affect the fund’s investment objective, policies, or strategies.
The fund’s trustees regularly evaluate its investment advisory arrangement, focusing on factors such as the advisor’s investment process, style consistency, and performance, as well as the composition and depth of the management and research teams. In deciding to adopt the new fee schedule, the trustees considered the fund’s performance together with a wide range of information relating to Wellington Management Company, LLP (Wellington Management), which has managed the fund since its inception in 1984.
The fund has entered into a new investment advisory agreement with Wellington Management to reflect the new fee schedule; however, other terms of the prior agreement have not changed. Under the terms of the new agreement, the fund will pay Wellington Management a fee at the end of each fiscal quarter. The fee is calculated by applying an annual percentage rate to the fund’s average daily net assets for the quarter.
For the six months ended July 31, 2008, the total advisory fees paid by Vanguard Health Care Fund were $11,241,000, or 0.10% of the fund’s average net assets. If the new fee schedule had been in place throughout the period, the advisory fees paid by the fund would have been $14,221,000, or 0.12% of the fund’s average net assets. The average advisory fee paid by funds in the Health Care Fund’s Lipper peer group was 0.73% of assets as of December 31, 2007.
Board approval of the investment advisory agreement
Wellington Management is responsible for managing the investment and reinvestment of the fund’s assets and for continuously reviewing, supervising, and administering the fund’s investment program. The advisor discharges its responsibilities subject to the supervision and oversight of the officers and trustees of the fund.
The board’s decision to revise the current advisory fee schedule was based upon its most recent evaluation of the advisor’s investment staff, portfolio management process, and performance results. In considering whether to approve the new investment advisory agreement, the board engaged in arms-length discussions with Wellington Management and considered the following factors, among others:
• The trustees considered the benefits to shareholders of continuing to retain Wellington Management as advisor to the fund, particularly in light of the nature, extent, and quality of services provided by the advisor. The board considered the quality of investment management to the fund over both the short and long term and the organizational depth and stability of the firm.
Specifically, the board noted that the fund’s investment manager, Edward P. Owens, has managed the fund since its inception. Further, the board noted that Wellington Management utilizes intensive fundamental analysis to identify companies with high-quality balance sheets, strong management, and the potential for new products that will lead to above-average growth in revenue and earnings. The board concluded that the existing advisory fee schedule should be adjusted to reflect the fair market value of Wellington Management’s services and the firm’s need to maintain an expanded portfolio management team to manage a large fund in this market segment. The new fee arrangement will enable Wellington Management to enhance the organizational depth and stability of the fund’s portfolio management team by retaining top investment talent and by hiring new investment professionals on an as-needed basis.
24
• The trustees considered the fund’s investment performance compared with those of the fund’s peer group and a relevant benchmark. The board concluded that short- and long-term performance has been consistently competitive versus the fund’s benchmark, the S&P Health Care Index. The board also concluded that short- and long-term performance has been in line or above average versus that of the fund’s Lipper peer group.
• The trustees considered the cost of services to be provided, including consideration of competitive fee rates and the fact that, after the adjustment, the fund’s advisory fee will remain significantly below those of most of its peers.
• The trustees considered the extent to which economies of scale would be realized as the fund grows, including a consideration of appropriate breakpoints in the fee schedule. By including asset-based breakpoints in this schedule, the trustees ensure that if the fund continues to grow, investors will benefit by realizing economies of scale in the form of a lower advisory fee ratio.
• The trustees considered all of the circumstances and information provided by both Wellington Management and Vanguard regarding the performance of the fund and concluded that approval of the investment advisory agreement is in the best interests of the fund and its shareholders.
The advisory agreement will continue for a period of one year from its effective date and is renewable after that for successive one-year periods. The agreement will be reviewed annually by the fund’s trustees, a majority of whom are not “interested persons” of either the fund or Wellington Management as defined in federal securities laws.
Background information on Wellington Management
Wellington Management Company, LLP, a Massachusetts partnership with offices at 75 State Street, Boston, MA 02109, is an investment firm that was founded in 1928. As of January 31, 2008, the firm managed approximately $557 billion in assets for a variety of clients, including mutual funds, institutions, and separate accounts.
The manager primarily responsible for overseeing the fund’s investments is Edward P. Owens, CFA, senior vice president, partner, and global industry analyst of Wellington Management. He has worked in investment management with Wellington Management since 1974 and has managed the Health Care Fund since its inception in 1984. He holds a B.S. from the University of Virginia and an M.B.A. from Harvard Business School.
Wellington Management is owned by its 99 active partners, all of whom are active members of the firm. The managing partners of the firm are Phillip H. Perelmuter, Brendan J. Swords, and Perry M. Traquina. Please note that the managing partners are not necessarily those with the largest economic interests in the firm.
25
Glossary
Beta. A measure of the magnitude of a fund’s past share-price fluctuations in relation to the ups and downs of a given market index. The index is assigned a beta of 1.00. Compared with a given index, a fund with a beta of 1.20 typically would have seen its share price rise or fall by 12% when the index rose or fell by 10%. For this report, beta is based on returns over the past 36 months for both the fund and the index. Note that a fund’s beta should be reviewed in conjunction with its R-squared (see definition below). The lower the R-squared, the less correlation there is between the fund and the index, and the less reliable beta is as an indicator of volatility.
Earnings Growth Rate. The average annual rate of growth in earnings over the past five years for the stocks now in a fund.
Equity Exposure. A measure that reflects a fund’s investments in stocks and stock futures. Any holdings in short-term reserves are excluded.
Expense Ratio. The percentage of a fund’s average net assets used to pay its annual administrative and advisory expenses. These expenses directly reduce returns to investors.
Foreign Holdings. The percentage of a fund represented by stocks or depositary receipts of companies based outside the United States.
Inception Date. The date on which the assets of a fund (or one of its share classes) are first invested in accordance with the fund’s investment objective. For funds with a subscription period, the inception date is the day after that period ends. Investment performance is measured from the inception date.
Median Market Cap. An indicator of the size of companies in which a fund invests; the midpoint of market capitalization (market price x shares outstanding) of a fund’s stocks, weighted by the proportion of the fund’s assets invested in each stock. Stocks representing half of the fund’s assets have market capitalizations above the median, and the rest are below it.
Price/Book Ratio. The share price of a stock divided by its net worth, or book value, per share. For a fund, the weighted average price/book ratio of the stocks it holds.
Price/Earnings Ratio. The ratio of a stock’s current price to its per-share earnings over the past year. For a fund, the weighted average P/E of the stocks it holds. P/E is an indicator of market expectations about corporate prospects; the higher the P/E, the greater the expectations for a company’s future growth.
R-Squared. A measure of how much of a fund’s past returns can be explained by the returns from the market in general, as measured by a given index. If a fund’s total returns were precisely synchronized with an index’s returns, its R-squared would be 1.00. If the fund’s returns bore no relationship to the index’s returns, its R-squared would be 0. For this report, R-squared is based on returns over the past 36 months for both the fund and the index.
Return on Equity. The annual average rate of return generated by a company during the past five years for each dollar of shareholder’s equity (net income divided by shareholder’s equity). For a fund, the weighted average return on equity for the companies whose stocks it holds.
Short-Term Reserves. The percentage of a fund invested in highly liquid, short-term securities that can be readily converted to cash.
26
Turnover Rate. An indication of the fund’s trading activity. Funds with high turnover rates incur higher transaction costs and may be more likely to distribute capital gains (which may be taxable to investors). The turnover rate excludes in-kind transactions, which have minimal impact on costs.
Yield. A fund’s 30-day SEC yield is derived using a formula specified by the U.S. Securities and Exchange Commission. Under the formula, data related to the fund’s security holdings in the previous 30 days are used to calculate the fund’s hypothetical net income for that period, which is then annualized and divided by the fund’s estimated average net assets over the calculation period. For the purposes of this calculation, a security’s income is based on its current market yield to maturity (in the case of bonds) or its projected dividend yield (for stocks). Because the SEC yield represents hypothetical annualized income, it will differ—at times significantly—from the fund’s actual experience. As a result, the fund’s income distributions may be higher or lower than implied by the SEC yield.
27
The People Who Govern Your Fund
The trustees of your mutual fund are there to see that the fund is operated and managed in your best interests since, as a shareholder, you are a part owner of the fund. Your fund’s trustees also serve on the board of directors of The Vanguard Group, Inc., which is owned by the Vanguard funds and provides services to them on an at-cost basis.
A majority of Vanguard’s board members are independent, meaning that they have no affiliation with Vanguard or the funds they oversee, apart from the sizable personal investments they have made as private individuals.
Our independent board members bring distinguished backgrounds in business, academia, and public service to their task of working with Vanguard officers to establish the policies and oversee the activities of the funds. Among board members’ responsibilities are selecting investment advisors for the funds; monitoring fund operations, performance, and costs; reviewing contracts; nominating and selecting new trustees/directors; and electing Vanguard officers.
Each trustee serves a fund until its termination; or until the trustee’s retirement, resignation, or death; or otherwise as specified in the fund’s organizational documents. Any trustee may be removed at a shareholders’ meeting by a vote representing two-thirds of the net asset value of all shares of the fund together with shares of other Vanguard funds organized within the same trust. The table on these two pages shows information for each trustee and executive officer of the fund. The mailing address of the trustees and officers is P.O. Box 876, Valley Forge, PA 19482.
Chairman of the Board, Chief Executive Officer, and Trustee
John J. Brennan1
Born 1954 Principal Occupation(s) During the Past Five Years: Chairman of the Board, Chief Executive Trustee Since May 1987; Officer, and Director/Trustee of The Vanguard Group, Inc., and of each of the investment Chairman of the Board and companies served by The Vanguard Group; Director of Vanguard Marketing Corporation. Chief Executive Officer 156 Vanguard Funds Overseen
Independent Trustees
Charles D. Ellis
Born 1937 Principal Occupation(s) During the Past Five Years: Applecore Partners (pro bono ventures Trustee Since January 2001 in education); Senior Advisor to Greenwich Associates (international business strategy 156 Vanguard Funds Overseen consulting); Successor Trustee of Yale University; Overseer of the Stern School of Business at New York University; Trustee of the Whitehead Institute for Biomedical Research.
Emerson U. Fullwood
Born 1948 Principal Occupation(s) During the Past Five Years: Executive Chief Staff and Marketing Trustee Since January 2008 Officer for North America since 2004 and Corporate Vice President of Xerox Corporation 156 Vanguard Funds Overseen (photocopiers and printers); Director of SPX Corporation (multi-industry manufacturing), of the United Way of Rochester, and of the Boy Scouts of America.
Rajiv L. Gupta
Born 1945 Principal Occupation(s) During the Past Five Years: Chairman, President, and Trustee Since December 20012 Chief Executive Officer of Rohm and Haas Co. (chemicals); Board Member of 156 Vanguard Funds Overseen the American Chemistry Council; Director of Tyco International, Ltd. (diversified manufacturing and services) since 2005.
Amy Gutmann
Born 1949 Principal Occupation(s) During the Past Five Years: President of the University of
Trustee Since June 2006 Pennsylvania since 2004; Professor in the School of Arts and Sciences, Annenberg School 156 Vanguard Funds Overseen for Communication, and Graduate School of Education of the University of Pennsylvania since 2004; Provost (2001–2004) and Laurance S. Rockefeller Professor of Politics and the University Center for Human Values (1990–2004), Princeton University; Director of Carnegie Corporation of New York since 2005 and of Schuylkill River Development Corporation and Greater Philadelphia Chamber of Commerce since 2004; Trustee of the National Constitution Center since 2007.
JoAnn Heffernan Heisen
Born 1950 Principal Occupation(s) During the Past Five Years: Corporate Vice President and Trustee Since July 1998 Chief Global Diversity Officer since 2006, Vice President and Chief Information 156 Vanguard Funds Overseen Officer (1997–2005), and Member of the Executive Committee of Johnson & Johnson (pharmaceuticals/consumer products); Director of the University Medical Center at Princeton and Women’s Research and Education Institute.
André F. Perold
Born 1952 Principal Occupation(s) During the Past Five Years: George Gund Professor of Finance Trustee Since December 2004 and Banking, Harvard Business School; Senior Associate Dean and Director of Faculty 156 Vanguard Funds Overseen Recruiting, Harvard Business School; Director and Chairman of UNX, Inc. (equities trading firm); Chair of the Investment Committee of HighVista Strategies LLC (private investment firm) since 2005.
Alfred M. Rankin, Jr.
Born 1941 Principal Occupation(s) During the Past Five Years: Chairman, President, Chief Executive Trustee Since January 1993 Officer, and Director of NACCO Industries, Inc. (forklift trucks/housewares/lignite); Director 156 Vanguard Funds Overseen of Goodrich Corporation (industrial products/aircraft systems and services).
J. Lawrence Wilson
Born 1936 Principal Occupation(s) During the Past Five Years: Retired Chairman and Chief Executive Trustee Since April 1985 Officer of Rohm and Haas Co. (chemicals); Director of Cummins Inc. (diesel engines) and 156 Vanguard Funds Overseen AmerisourceBergen Corp. (pharmaceutical distribution); Trustee of Vanderbilt University and of Culver Educational Foundation.
Executive Officers1
Thomas J. Higgins
Born 1957 Principal Occupation(s) During the Past Five Years: Principal of The Vanguard Group, Inc.; Treasurer Since July 1998 Treasurer of each of the investment companies served by The Vanguard Group. 156 Vanguard Funds Overseen
F. William McNabb III
Born 1957 Principal Occupation(s) During the Past Five Years: President of The Vanguard Group, Inc., President Since March 2008 and of each of the investment companies served by The Vanguard Group since 2008; 156 Vanguard Funds Overseen Director of Vanguard Marketing Corporation; Managing Director of The Vanguard Group (1995–2008).
Heidi Stam
Born 1956 Principal Occupation(s) During the Past Five Years: Managing Director of The Vanguard Secretary Since July 2005 Group, Inc., since 2006; General Counsel of The Vanguard Group since 2005; Secretary of 156 Vanguard Funds Overseen The Vanguard Group, and of each of the investment companies served by The Vanguard Group, since 2005; Director and Senior Vice President of Vanguard Marketing Corporation since 2005; Principal of The Vanguard Group (1997–2006).
Vanguard Senior Management Team
Vanguard Senior Management Team | | |
| | | |
R. Gregory Barton | Kathleen C. Gubanich | Michael S. Miller | Glenn W. Reed |
Mortimer J. Buckley | Paul A. Heller | Ralph K. Packard | George U. Sauter |
Founder
John C. Bogle
Chairman and Chief Executive Officer, 1974–1996
1 Officers of the funds are “interested persons” as defined in the Investment Company Act of 1940.
2 December 2002 for Vanguard Equity Income Fund, Vanguard Growth Equity Fund, the Vanguard Municipal Bond Funds, and the Vanguard State Tax-Exempt Funds.
More information about the trustees is in the Statement of Additional Information, available from The Vanguard Group.

P.O. Box 2600
Valley Forge, PA 19482-2600
Connect with Vanguard® > www.vanguard.com
Fund Information > 800-662-7447 | Vanguard, Admiral, Connect with Vanguard, and the ship |
| logo are trademarks of The Vanguard Group, Inc. |
Direct Investor Account Services > 800-662-2739 | |
| All other marks are the exclusive property of their |
Institutional Investor Services > 800-523-1036 | respective owners. |
| |
Text Telephone for People | |
With Hearing Impairment > 800-952-3335 | All comparative mutual fund data are from Lipper Inc. |
| or Morningstar, Inc., unless otherwise noted. |
| |
| You can obtain a free copy of Vanguard’s proxy voting |
| guidelines by visiting our website, www.vanguard.com, |
This material may be used in conjunction | and searching for “proxy voting guidelines,” or by |
with the offering of shares of any Vanguard | calling Vanguard at 800-662-2739. The guidelines are |
fund only if preceded or accompanied by | also available from the SEC’s website, www.sec.gov. |
the fund’s current prospectus. | In addition, you may obtain a free report on how your |
| fund voted the proxies for securities it owned during |
| the 12 months ended June 30. To get the report, visit |
| either www.vanguard.com or www.sec.gov. |
| |
| You can review and copy information about your fund |
| at the SEC’s Public Reference Room in Washington, D.C. |
| To find out more about this public service, call the SEC |
| at 202-551-8090. Information about your fund is also |
| available on the SEC’s website, and you can receive |
| copies of this information, for a fee, by sending a |
| request in either of two ways: via e-mail addressed to |
| publicinfo@sec.gov or via regular mail addressed to the |
| Public Reference Section, Securities and Exchange |
| Commission, Washington, DC 20549-0102. |
| |
| |
| |
| |
| |
| © 2008 The Vanguard Group, Inc. |
| All rights reserved. |
| Vanguard Marketing Corporation, Distributor. |
| |
| Q522 092008 |
> Each share class of Vanguard REIT Index Fund earned a flat total return for the fiscal half-year ended July 31, 2008.
> The fund matched the return of its benchmark index, surpassing both the –1.6% average total return of competing REIT mutual funds and the –5.9% return of the broad stock market.
> REIT mutual funds have been challenged by tightened credit conditions, which were set in motion by the subprime-mortgage-market crisis, and a slowing economy.
Contents | |
| |
Your Fund’s Total Returns | 1 |
Chairman’s Letter | 2 |
Fund Profile | 7 |
Performance Summary | 8 |
Financial Statements | 9 |
About Your Fund’s Expenses | 23 |
Trustees Approve Advisory Arrangement | 25 |
Glossary | 26 |

Please note: The opinions expressed in this report are just that—informed opinions. They should not be considered promises or advice. Also, please keep in mind that the information and opinions cover the period through the date on the cover of this report. Of course, the risks of investing in your fund are spelled out in the prospectus.
Your Fund’s Total Returns
Six Months Ended July 31, 2008 | | |
| Ticker | Total |
| Symbol | Returns |
Vanguard REIT Index Fund | | |
Investor Shares | VGSIX | 0.0% |
Admiral™ Shares1 | VGSLX | 0.1 |
Signal® Shares2 | VGRSX | 0.0 |
Institutional Shares3 | VGSNX | 0.0 |
ETF Shares4 | VNQ | |
Market Price | | 0.4 |
Net Asset Value | | 0.1 |
Target REIT Composite5 | | 0.0 |
MSCI® US REIT Index | | 0.0 |
Average Real Estate Fund6 | | –1.6 |
Your Fund’s Performance at a Glance |
January 31, 2008–July 31, 2008 | | | | | |
| | | | | |
| | | | |
| Starting | Ending | Distributions Per Share7 |
| Share | Share | Income | Capital | Return of |
| Price | Price | Dividends | Gains | Capital |
Vanguard REIT Index Fund | | | | | |
Investor Shares | $20.38 | $19.97 | $0.420 | $0.000 | $0.000 |
Admiral Shares | 86.94 | 85.19 | 1.836 | 0.000 | 0.000 |
Signal Shares | 23.21 | 22.74 | 0.489 | 0.000 | 0.000 |
Institutional Shares | 13.46 | 13.18 | 0.285 | 0.000 | 0.000 |
ETF Shares | 61.31 | 60.08 | 1.293 | 0.000 | 0.000 |
1 A lower-cost class of shares available to many longtime shareholders and to those with significant investments in the fund.
2 Signal Shares also carry lower costs and are available to institutional shareholders who meet certain administrative, service, and account-size criteria.
3 This class of shares also carries low expenses and is available for a minimum investment of $5 million.
4 Vanguard ETF™ Shares are traded on the American Stock Exchange and are available only through brokers. The table shows the ETF returns based on both the AMEX market price and the net asset value for a share. U.S. Pat. No. 6,879,964 B2; 7,337,138.
5 The Target REIT Composite consists of the MSCI US REIT Index adjusted to include a 2% cash position (Lipper Money Market Average).
6 Derived from data provided by Lipper Inc.
7 Distributions may include some combination of dividend income, return of capital, and capital gains. The tax characteristics of these distributions, however, cannot be determined until after the end of the year.
1

Chairman’s Letter
Dear Shareholder,
Vanguard REIT Index Fund produced a flat total return for the six months ended July 31, 2008, a consequence of a sharp rally, a steep plunge, and then a bounceback as the half-year drew to a close. By contrast, competitor funds retuned –1.6%, on average, and the broad stock market fell –5.9% for the period. Underlying the REIT market’s ups and downs were the ongoing effects of the subprime-mortgage crisis that began last summer and an economic slowdown.
As of July 31, Investor Shares yielded 5.0%, while the Admiral, Signal, Institutional, and ETF Shares yielded 5.1%. Yields for each of the fund’s share classes remained the same as six months earlier.
Please note that these yield figures are not comparable to the 30-day SEC yields of other stock funds. REITs must distribute at least 90% of their taxable income, minus expenses, to shareholders. These distributions typically include some payments that represent capital gains and returns of capital by the underlying REITs; each REIT determines these amounts at the end of its fiscal year.
2
Stocks rode a bumpy path to disappointing results
U.S. stocks struggled during the six months, a period of pronounced volatility in the financial markets. Continued weakness in the housing market, record oil prices, rising unemployment, and an uptick in inflation all weighed on stocks and set a downbeat tone for the period.
The U.S. market performed well in April and May, but those returns were bookended by declines earlier and later in the period. June was a particularly difficult month; the broad U.S. stock market declined –8.2%, the worst single-month return in more than five years.
For the half-year, the broad U.S. stock market returned –5.9%. Investors favored small-capitalization stocks over large- and mid-caps, and growth stocks over their value-oriented counterparts. International stocks also experienced high levels of volatility, and returned –3.8%.
Bond investors remained cautious in the wake of the subprime crisis
In the extensive fallout from the subprime-mortgage crisis, bond investors continued to prefer the safety of short-term, high-quality issues—most notably U.S. Treasury securities. During the period, bonds outpaced stocks, but registered negative returns. The broad taxable bond market returned –0.6%. Municipal bonds, which experienced a spike in volatility, returned –0.9%.
Market Barometer | | | |
| | | Total Returns |
| | Periods Ended July 31, 2008 |
| Six Months | One Year | Five Years1 |
Stocks | | | |
Russell 1000 Index (Large-caps) | –6.6% | –10.6% | 7.5% |
Russell 2000 Index (Small-caps) | 0.9 | –6.7 | 9.8 |
Dow Jones Wilshire 5000 Index (Entire market) | –5.9 | –10.2 | 8.1 |
MSCI All Country World Index ex USA (International) | –3.8 | –9.3 | 17.9 |
| | | |
| | | |
Bonds | | | |
Lehman U.S. Aggregate Bond Index (Broad taxable market) | –0.6% | 6.2% | 4.6% |
Lehman Municipal Bond Index | –0.9 | 2.8 | 4.3 |
Citigroup 3-Month Treasury Bill Index | 1.0 | 3.1 | 3.1 |
| | | |
| | | |
CPI | | | |
Consumer Price Index | 4.2% | 5.6% | 3.6% |
| | | |
| | | |
| | | |
| | | |
1 Annualized. | | | |
3
During the half-year, the Federal Reserve Board lowered its target for the federal funds rate twice, reducing it a total of 1 percentage point, to 2.00%. At its June meeting (and again at its August meeting after the end of the fund’s fiscal period), the Fed voted to leave the target rate unchanged, signaling a growing concern about near-term inflation.
In a tough environment, the fund rallied from a slump
During the six months, Vanguard REIT Index Fund snapped back twice. Following its first fiscal-year loss in seven years for the year ended January 31, 2008, the fund rallied through mid-May. But REITs, which typically have high demand for financing, fell victim to tightening credit conditions—an aftereffect of the subprime-mortgage-market crisis that began last summer—and a continuing economic slowdown. The rally stalled and the fund’s return slumped sharply in June, only to bounce back around mid-July.
Led by six of its top ten holdings, the fund’s residential, office, specialized, and diversified REIT categories made positive contributions to return. These were offset by negative returns from the industrial and retail REIT groups.
The largest contributor to the fund’s return was its residential REIT holdings, especially REITs that own and manage apartment complexes such as Equity Residential (+18%) and AvalonBay Communities (+8%). These REITs benefited from one lingering effect of the mortgage-market
Annualized Expense Ratios1 |
Your Fund Compared With Its Peer Group |
| | | | | | Average |
| Investor | Admiral | Signal | Institutional | ETF | Real Estate |
| Shares | Shares | Shares | Shares | Shares | Fund |
REIT Index Fund | 0.20% | 0.10% | 0.10% | 0.09% | 0.10% | 1.46% |
1 Fund expense ratios reflect the six months ended July 31, 2008. Peer-group expense ratio is derived from data provided by Lipper Inc. and captures information through year-end 2007.
4
crisis: healthy demand for apartments as some potential homebuyers were unable to find mortgage loans and owners who could no longer afford their homes were forced to downsize.
The next-largest contributor to return was the office REIT category. The top contributor was Boston Properties (+6%), which acquired the General Motors Building in Manhattan during the period. To a lesser degree, the specialized and diversified REITs groups also provided positive returns.
Within the specialized group, top performers included storage REITs, such as Public Storage (+6%), which were aided by downsizing homeowners. Health care REITs, the other top performers in this category, benefited from the demand for medical services that many consider to be immune from the effects of a slowing economy. But hotel REITs, such as Host Hotels & Resorts (–20%), and Hospitality Properties Trust (–33%), performed poorly as a weakening economy, airline cutbacks, and soaring oil prices were expected to deflate travel plans.
In another reflection, at least in part, of a challenging economy, the performance of the fund’s industrial and retail REITs offset the positive returns from other sectors. General Growth Properties (–23%) and Developers Diversified Realty (–20%), for example, reduced their development budgets for shopping malls amid lower demand from retailers. Within the retail group, Simon Property Group (+6%), the fund’s largest individual holding, bucked the trend with a positive return.
Build a balanced portfolio and then stick with it
Whether it’s stocks, bonds, or REITs, investors can expect markets to be volatile and unpredictable, and this can lead to rash investment decisions. Whatever the economic outlook, it’s especially important to stay the course and maintain a long-term focus.
We believe the key to investment success is to build a portfolio that includes a diversified mix of stocks, bonds, and cash that is consistent with your goals, time horizon, and risk tolerance. Vanguard REIT Index Fund’s broad exposure to publicly traded real estate is an excellent, low-cost way to broaden the diversification of an already well-rounded portfolio.
Once you have established your asset allocation plan, try to stick with it and ignore the marketplace’s ever-present distractions—your choice of asset mix is designed to help steer your way through these recurring periods. And always pay attention to costs.
5
When I wrote to you six months ago, Vanguard’s board had elected F. William McNabb III as the fund’s president and designated him to succeed me as chief executive officer. The board has since announced that Bill will assume the chief executive role on August 31. I will continue to serve as chairman. Bill and the rest of our team will serve you and our other clients extremely well in the years ahead.
Thank you for your ongoing confidence in Vanguard.
Sincerely,

John J. Brennan
Chairman and Chief Executive Officer
August 12, 2008
Vanguard REIT ETF | | | | |
Premium/Discount: September 23, 20041–July 31, 2008 |
| | | | |
| Market Price Above or | Market Price Below |
| Equal to Net Asset Value | Net Asset Value |
| Number | Percentage | | Number | Percentage |
Basis Point Differential2 | of Days | of Total Days | | of Days | of Total Days |
0–24.9 | 439 | 45.16% | | 511 | 52.57% |
25–49.9 | 9 | 0.93 | | 10 | 1.03 |
50–74.9 | 0 | 0.00 | | 0 | 0.00 |
75–100.0 | 0 | 0.00 | | 2 | 0.21 |
> 100.0 | 1 | 0.10 | | 0 | 0.00 |
Total | 449 | 46.19% | | 523 | 53.81% |
| | | | | | |
1 Inception.
2 One basis point equals 1/100 of a percentage point.
6
Fund Profile
As of July 31, 2008
Portfolio Characteristics | | |
| | Comparative | Broad |
| Fund | Index1 | Index2 |
Number of Stocks | 97 | 97 | 4,724 |
Median Market Cap | $4.9B | $4.9B | $31.5B |
Price/Earnings Ratio | 34.6x | 34.5x | 16.6x |
Price/Book Ratio | 2.2x | 2.2x | 2.3x |
Yield3 | | 5.2% | 2.1% |
Investor Shares | 5.0% | | |
Admiral Shares | 5.1% | | |
Signal Shares | 5.1% | | |
Institutional Shares | 5.1% | | |
ETF Shares | 5.1% | | |
Return on Equity | 8.9% | 8.9% | 19.7% |
Earnings Growth Rate | 1.4% | 1.4% | 18.5% |
Foreign Holdings | 0.0% | 0.0% | 0.0% |
Turnover Rate4 | 7% | — | — |
Expense Ratio4 | | — | — |
Investor Shares | 0.20% | | |
Admiral Shares | 0.10% | | |
Signal Shares | 0.10% | | |
Institutional Shares | 0.09% | | |
ETF Shares | 0.10% | | |
Short-Term Reserves | 2.0% | — | — |
Fund Allocation by REIT Type (% of portfolio) |
| |
Retail | 27.0% |
Specialized | 22.4 |
Office | 17.1 |
Residential | 16.3 |
Industrial | 8.6 |
Diversified | 8.6 |
Volatility Measures5 | |
| Fund Versus | Fund Versus |
| Target Index6 | Broad Index2 |
R-Squared | 1.00 | 0.48 |
Beta | 1.00 | 1.16 |
Ten Largest Holdings7 (% of total net assets) |
| |
Simon Property Group, Inc. REIT | 7.9% |
Vornado Realty Trust REIT | 5.0 |
ProLogis REIT | 4.8 |
Equity Residential REIT | 4.5 |
Boston Properties, Inc. REIT | 4.4 |
Public Storage, Inc. REIT | 4.0 |
HCP, Inc. REIT | 3.2 |
Kimco Realty Corp. REIT | 3.1 |
Avalonbay Communities, Inc. REIT | 3.0 |
Host Hotels & Resorts Inc. REIT | 2.5 |
Top Ten | 42.4% |
Investment Focus
1 MSCI US REIT Index.
2 Dow Jones Wilshire 5000 Index.
3 This yield may include some payments that represent a return of capital, capital gains distributions, or both by the underlying REITs. These amounts are determined by each REIT at the end of its fiscal year.
4 Annualized.
5 For an explanation of R-squared, beta, and other terms used here, see the Glossary on page 26.
6 The Target REIT Composite consists of the MSCI US REIT Index adjusted to include a 2% cash position (Lipper Money Market Average).
7 The holdings listed exclude any temporary cash investments and equity index products.
7
Performance Summary
All of the returns in this report represent past performance, which is not a guarantee of future results that may be achieved by the fund. (Current performance may be lower or higher than the performance data cited. For performance data current to the most recent month-end, visit our website at www.vanguard.com/performance.) Note, too, that both investment returns and principal value can fluctuate widely, so an investor’s shares, when sold, could be worth more or less than their original cost. The returns shown do not reflect taxes that a shareholder would pay on fund distributions or on the sale of fund shares.
Fiscal-Year Total Returns (%): January 31, 1998–July 31, 2008
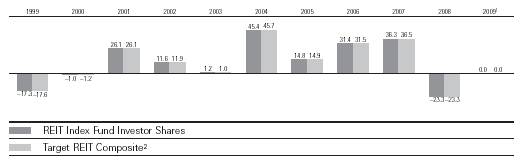
Average Annual Total Returns: Periods Ended June 30, 2008
This table presents average annual total returns through the latest calendar quarter—rather than through the end of the fiscal period. Securities and Exchange Commission rules require that we provide this information.
| Inception Date | One Year | Five Years | Ten Years |
Investor Shares3 | 5/13/1996 | –13.83% | 13.80% | 10.38% |
Admiral Shares3 | 11/12/2001 | –13.74 | 13.88 | 14.054 |
Signal Shares3 | 6/4/2007 | –13.77 | –20.764 | — |
Institutional Shares3 | 12/2/2003 | –13.72 | 11.364 | — |
ETF Shares | 9/23/2004 | | | |
Market Price | | –13.62 | 10.004 | — |
Net Asset Value | | –13.75 | 10.014 | — |
1 Six months ended July 31, 2008.
2 The Target REIT Composite consists of the MSCI US REIT Index adjusted to include a 2% cash position. (Lipper Money Market Average.)
3 Total return figures do not reflect the 1% redemption fee assessed on redemptions of shares held for less than one year, nor for the Investor Shares do they include the account service fee that may apply to certain accounts with balances below $10,000.
4 Return since inception.
Note: See Financial Highlights tables on pages 14–18 for dividend and capital gains information.
8
Financial Statements (unaudited)
Statement of Net Assets
As of July 31, 2008
The fund provides a complete list of its holdings four times in each fiscal year, at the quarter-ends. For the second and fourth fiscal quarters, the lists appear in the fund’s semiannual and annual reports to shareholders. For the first and third fiscal quarters, the fund files the lists with the Securities and Exchange Commission on Form N-Q. Shareholders can look up the fund’s Forms N-Q on the SEC’s website at www.sec.gov. Forms N-Q may also be reviewed and copied at the SEC’s Public Reference Room (see the back cover of this report for further information).
| | Market |
| | Value• |
| Shares | ($000) |
Real Estate Investment Trusts (98.0%) | |
Diversified REITs (8.4%) | | |
Vornado Realty Trust REIT | 5,299,298 | 503,804 |
Liberty Property Trust REIT | 3,514,134 | 127,915 |
Washington REIT | 1,895,919 | 64,954 |
Colonial Properties Trust | | |
REIT | 1,722,313 | 34,377 |
^Cousins Properties, Inc. | | |
REIT | 1,481,590 | 32,551 |
PS Business Parks, Inc. | | |
REIT | 589,871 | 31,027 |
Investors Real Estate Trust | | |
REIT | 2,194,964 | 23,047 |
CapLease, Inc. REIT | 1,612,072 | 12,606 |
^Gramercy Capital Corp. | | |
REIT | 1,650,327 | 11,156 |
| | 841,437 |
Industrial REITs (8.4%) | | |
ProLogis REIT | 9,912,379 | 484,517 |
AMB Property Corp. REIT | 3,802,397 | 186,165 |
DCT Industrial Trust Inc. | | |
REIT | 6,459,848 | 54,715 |
EastGroup Properties, Inc. | | |
REIT | 913,399 | 42,382 |
^First Industrial Realty Trust | | |
REIT | 1,671,610 | 41,439 |
DuPont Fabros | | |
Technology Inc. REIT | 1,365,866 | 22,332 |
First Potomac REIT | 927,882 | 14,735 |
| | 846,285 |
Office REITs (16.8%) | | |
Boston Properties, Inc. | | |
REIT | 4,587,699 | 441,291 |
SL Green Realty Corp. | | |
REIT | 2,260,296 | 188,373 |
Duke Realty Corp. REIT | 5,611,900 | 138,782 |
Alexandria Real Estate | | |
Equities, Inc. REIT | 1,228,773 | 126,883 |
Digital Realty Trust, Inc. | | |
REIT | 2,595,074 | 111,355 |
Mack-Cali Realty Corp. | | |
REIT | 2,518,757 | 96,670 |
Douglas Emmett, Inc. | | |
REIT | 3,690,817 | 86,845 |
Highwood Properties, Inc. | | |
REIT | 2,194,506 | 80,099 |
Corporate Office | | |
Properties Trust, Inc. | | |
REIT | 1,817,179 | 70,652 |
BioMed Realty Trust, Inc. | | |
REIT | 2,733,777 | 70,531 |
HRPT Properties Trust | | |
REIT | 8,649,064 | 60,630 |
Kilroy Realty Corp. REIT | 1,261,679 | 57,798 |
Brandywine Realty Trust | | |
REIT | 3,339,226 | 53,595 |
Lexington Realty Trust | | |
REIT | 2,442,723 | 35,175 |
^Franklin Street | | |
Properties Corp. REIT | 2,307,881 | 28,318 |
Parkway Properties Inc. | | |
REIT | 582,798 | 20,567 |
^Maguire Properties, Inc. | | |
REIT | 1,443,824 | 15,579 |
| | 1,683,143 |
Residential REITs (16.0%) | | |
Equity Residential REIT | 10,351,118 | 446,858 |
Avalonbay | | |
Communities, Inc. REIT | 2,968,301 | 295,969 |
UDR, Inc. REIT | 5,150,927 | 131,555 |
Apartment Investment & | | |
Management Co. | | |
Class A REIT | 3,666,260 | 125,276 |
Essex Property Trust, Inc. | | |
REIT | 954,810 | 115,866 |
Camden Property Trust | | |
REIT | 2,022,820 | 99,482 |
9
| | | Market |
| | | Value• |
| | Shares | ($000) |
| BRE Properties Inc. | | |
| Class A REIT | 1,955,522 | 95,586 |
| Home Properties, Inc. | | |
| REIT | 1,250,496 | 68,802 |
| Mid-America Apartment | | |
| Communities, Inc. REIT | 988,801 | 56,826 |
| Post Properties, Inc. REIT | 1,681,251 | 53,447 |
| American Campus | | |
| Communities, Inc. REIT | 1,529,457 | 44,783 |
| Equity Lifestyle | | |
| Properties, Inc. REIT | 887,316 | 42,600 |
| Education Realty | | |
| Trust, Inc. REIT | 1,088,626 | 12,193 |
| Sun Communities, Inc. | | |
| REIT | 628,702 | 10,675 |
| | | 1,599,918 |
Retail REITs (26.5%) | | |
| Simon Property Group, Inc. | | |
| REIT | 8,561,671 | 793,068 |
| Kimco Realty Corp. REIT | 8,735,914 | 308,290 |
| General Growth | | |
| Properties Inc. REIT | 8,427,788 | 231,006 |
| Federal Realty Investment | | |
| Trust REIT | 2,255,589 | 163,778 |
| Regency Centers Corp. | | |
| REIT | 2,671,530 | 158,956 |
| The Macerich Co. REIT | 2,777,032 | 153,653 |
| Developers Diversified | | |
| Realty Corp. REIT | 4,588,724 | 146,656 |
| ^Realty Income Corp. REIT | 3,888,117 | 97,942 |
| Taubman Co. REIT | 2,020,511 | 96,985 |
| Weingarten Realty | | |
| Investors REIT | 2,894,727 | 88,260 |
| National Retail Properties | | |
| REIT | 2,782,755 | 58,827 |
| CBL & Associates | | |
| Properties, Inc. REIT | 2,394,817 | 46,507 |
| ^Tanger Factory Outlet | | |
| Centers, Inc. REIT | 1,202,304 | 44,894 |
| Inland Real Estate Corp. | | |
| REIT | 2,279,366 | 34,077 |
| Equity One, Inc. REIT | 1,565,925 | 30,238 |
| Pennsylvania REIT | 1,507,640 | 27,771 |
* | Alexander’s, Inc. REIT | 77,733 | 27,575 |
| Saul Centers, Inc. REIT | 548,868 | 26,604 |
| Acadia Realty Trust REIT | 1,170,289 | 26,554 |
| Cedar Shopping | | |
| Centers, Inc. REIT | 1,703,958 | 21,743 |
| Ramco-Gershenson | | |
| Properties Trust REIT | 709,896 | 15,348 |
| ^Glimcher Realty Trust REIT | 1,441,697 | 13,422 |
| Getty Realty Holding Corp. | | |
| REIT | 710,744 | 13,298 |
| Kite Realty Group Trust | | |
| REIT | 1,053,464 | 13,084 |
| Urstadt Biddle Properties | | |
| Class A REIT | 735,513 | 12,173 |
| Urstadt Biddle Properties | | |
| REIT | 29,909 | 503 |
| | | 2,651,212 |
Specialized REITs (21.9%) | | |
| Public Storage, Inc. REIT | 4,910,856 | 402,150 |
| HCP, Inc. REIT | 8,999,646 | 324,617 |
| Host Hotels & | | |
| Resorts Inc. REIT | 19,093,548 | 250,316 |
| Ventas, Inc. REIT | 5,309,500 | 238,184 |
| Health Care Inc. REIT | 3,292,326 | 164,188 |
| Nationwide Health | | |
| Properties, Inc. REIT | 3,656,463 | 135,691 |
| Senior Housing Properties | | |
| Trust REIT | 4,293,696 | 90,382 |
| Hospitality Properties | | |
| Trust REIT | 3,602,107 | 76,725 |
| Entertainment Properties | | |
| Trust REIT | 1,218,871 | 65,380 |
| Healthcare Realty | | |
| Trust Inc. REIT | 1,946,273 | 56,461 |
| Omega Healthcare | | |
| Investors, Inc. REIT | 2,642,519 | 45,636 |
| Extra Space Storage Inc. | | |
| REIT | 2,894,610 | 41,017 |
| LaSalle Hotel Properties | | |
| REIT | 1,545,388 | 35,096 |
| Sovran Self Storage, Inc. | | |
| REIT | 834,704 | 34,899 |
| DiamondRock | | |
| Hospitality Co. REIT | 3,633,632 | 33,502 |
| National Health Investors | | |
| REIT | 962,192 | 29,722 |
| Medical Properties | | |
| Trust Inc. REIT | 2,492,916 | 27,646 |
| Sunstone Hotel | | |
| Investors, Inc. REIT | 1,966,258 | 25,443 |
| Strategic Hotels and | | |
| Resorts, Inc. REIT | 2,846,737 | 22,461 |
| U-Store-It Trust REIT | 1,889,401 | 22,012 |
| LTC Properties, Inc. REIT | 744,399 | 21,759 |
| FelCor Lodging Trust, Inc. | | |
| REIT | 2,405,370 | 19,219 |
| Ashford Hospitality Trust | | |
| REIT | 4,405,441 | 17,490 |
| Universal Health Realty | | |
| Income REIT | 433,299 | 15,152 |
| | | 2,195,148 |
Total Real Estate Investment Trusts | | |
(Cost $9,304,718) | | 9,817,143 |
| | | |
10
| | Market |
| | Value• |
| Shares | ($000) |
Temporary Cash Investments (2.6%) | |
1 Vanguard Market Liquidity | |
Fund, 2.386% | 197,399,834 | 197,400 |
1 Vanguard Market Liquidity | |
Fund, 2.386%—Note E | 60,432,100 | 60,432 |
Total Temporary Cash Investments | |
(Cost $257,832) | | 257,832 |
Total Investments (100.6%) | | |
(Cost $9,562,550) | | 10,074,975 |
Other Assets and Liabilities (–0.6%) | |
Other Assets—Note B | | 170,954 |
Liabilities—Note E | | (228,848) |
| | (57,894) |
Net Assets (100%) | | 10,017,081 |
At July 31, 2008, net assets consisted of:2 |
| Amount |
| ($000) |
Paid-in Capital | 9,552,073 |
Overdistributed Net Investment Income | (57,739) |
Accumulated Net Realized Gains | 10,322 |
Unrealized Appreciation | 512,425 |
Net Assets | 10,017,081 |
| |
| |
Investor Shares—Net Assets | |
Applicable to 216,327,817 outstanding | |
$.001 par value shares of beneficial | |
interest (unlimited authorization) | 4,319,065 |
Net Asset Value Per Share— | |
Investor Shares | $19.97 |
| |
| |
Admiral Shares—Net Assets | |
Applicable to 20,773,892 outstanding | |
$.001 par value shares of beneficial | |
interest (unlimited authorization) | 1,769,812 |
Net Asset Value Per Share— | |
Admiral Shares | $85.19 |
| |
| |
Signal Shares—Net Assets | |
Applicable to 28,686,309 outstanding | |
$.001 par value shares of beneficial | |
interest (unlimited authorization) | 652,394 |
Net Asset Value Per Share— | |
Signal Shares | $22.74 |
| |
| |
Institutional Shares—Net Assets | |
Applicable to 66,719,942 outstanding | |
$.001 par value shares of beneficial | |
interest (unlimited authorization) | 879,655 |
Net Asset Value Per Share— | |
Institutional Shares | $13.18 |
| |
| |
ETF Shares—Net Assets | |
Applicable to 39,881,298 outstanding | |
$.001 par value shares of beneficial | |
interest (unlimited authorization) | 2,396,155 |
Net Asset Value Per Share— | |
ETF Shares | $60.08 |
• See Note A in Notes to Financial Statements.
* Non-income-producing security.
^ Part of security position is on loan to broker-dealers. See Note E in Notes to Financial Statements.
1 Affiliated money market fund available only to Vanguard funds and certain trusts and accounts managed by Vanguard. Rate shown is the 7-day yield.
2 See Note C in Notes to Financial Statements for the tax-basis components of net assets.
11
Statement of Operations
| Six Months Ended |
| July 31, 2008 |
| ($000) |
Investment Income | |
Income | |
Dividends | 159,522 |
Interest1 | 2,717 |
Security Lending | 794 |
Total Income | 163,033 |
Expenses | |
The Vanguard Group—Note B | |
Investment Advisory Services | 103 |
Management and Administrative | |
Investor Shares | 3,584 |
Admiral Shares | 635 |
Signal Shares | 224 |
Institutional Shares | 237 |
ETF Shares | 817 |
Marketing and Distribution | |
Investor Shares | 512 |
Admiral Shares | 195 |
Signal Shares | 59 |
Institutional Shares | 94 |
ETF Shares | 268 |
Custodian Fees | 83 |
Shareholders’ Reports | |
Investor Shares | 45 |
Admiral Shares | 1 |
Signal Shares | 2 |
Institutional Shares | 5 |
ETF Shares | 28 |
Trustees’ Fees and Expenses | 8 |
Total Expenses | 6,900 |
Net Investment Income | 156,133 |
Realized Net Gain (Loss) | |
Investment Securities Sold | 363,622 |
Capital Gain Distributions Received | 61,144 |
Realized Net Gain (Loss) | 424,766 |
Change in Unrealized Appreciation (Depreciation) of Investment Securities | (602,782) |
Net Increase (Decrease) in Net Assets Resulting from Operations | (21,883) |
1 Interest income from an affiliated company of the fund was $2,717,000.
12
Statement of Changes in Net Assets
| Six Months Ended | | Year Ended |
| July 31, | | January 31, |
| 2008 | | 2008 |
| ($000) | | ($000) |
Increase (Decrease) in Net Assets | | | |
Operations | | | |
Net Investment Income | 156,133 | | 277,469 |
Realized Net Gain (Loss) | 424,766 | | 764,385 |
Change in Unrealized Appreciation (Depreciation) | (602,782) | | (3,956,300) |
Net Increase (Decrease) in Net Assets Resulting from Operations | (21,883) | | (2,914,446) |
Distributions | | | |
Net Investment Income | | | |
Investor Shares | (87,173) | | (135,972) |
Admiral Shares | (36,978) | | (69,231) |
Signal Shares | (12,876) | | (5,931) |
Institutional Shares | (16,653) | | (22,421) |
ETF Shares | (47,260) | | (46,805) |
Realized Capital Gain | | | |
Investor Shares | — | | (43,507) |
Admiral Shares | — | | (21,491) |
Signal Shares | — | | (1,833) |
Institutional Shares | — | | (6,913) |
ETF Shares | — | | (14,497) |
Return of Capital | | | |
Investor Shares | — | | (41,347) |
Admiral Shares | — | | (20,900) |
Signal Shares | — | | (1,789) |
Institutional Shares | — | | (6,758) |
ETF Shares | — | | (14,122) |
Total Distributions | (200,940) | | (453,517) |
Capital Share Transactions—Note F | | | |
Investor Shares | 378,181 | | (1,091,585) |
Admiral Shares | 105,455 | | (903,826) |
Signal Shares | 131,225 | | 657,624 |
Institutional Shares | 179,900 | | 18,915 |
ETF Shares | 351,669 | | 888,417 |
Net Increase (Decrease) from Capital Share Transactions | 1,146,430 | | (430,455) |
Total Increase (Decrease) | 923,607 | | (3,798,418) |
Net Assets | | | |
Beginning of Period | 9,093,474 | | 12,891,892 |
End of Period1 | 10,017,081 | | 9,093,474 |
1 Net Assets—End of Period includes undistributed (overdistributed) net investment income of ($57,739,000) and ($12,932,000).
13
Financial Highlights
Investor Shares | | | | | | |
| | | | | | |
| Six Months | | | | | |
| Ended | | | |
For a Share Outstanding | July 31, | Year Ended January 31, |
Throughout Each Period | 2008 | 2008 | 2007 | 2006 | 2005 | 2004 |
Net Asset Value, Beginning of Period | $20.38 | $27.76 | $21.29 | $17.20 | $15.83 | $11.52 |
Investment Operations | | | | | | |
Net Investment Income | .33 | .615 | .530 | .562 | .563 | .579 |
Net Realized and Unrealized Gain (Loss) | | | | | | |
on Investments1 | (.32) | (6.985) | 7.000 | 4.692 | 1.759 | 4.511 |
Total from Investment Operations | .01 | (6.370) | 7.530 | 5.254 | 2.322 | 5.090 |
Distributions | | | | | | |
Dividends from Net Investment Income | (.42) | (.622) | (.534) | (.568) | (.565) | (.678) |
Distributions from Realized Capital Gains | — | (.199) | (.413) | (.530) | (.387) | — |
Return of Capital | — | (.189) | (.113) | (.066) | — | (.102) |
Total Distributions | (.42) | (1.010) | (1.060) | (1.164) | (.952) | (.780) |
Net Asset Value, End of Period | $19.97 | $20.38 | $27.76 | $21.29 | $17.20 | $15.83 |
| | | | | | |
| | | | | | |
Total Return2 | 0.01% | –23.28% | 36.32% | 31.43% | 14.78% | 45.39% |
| | | | | | |
| | | | | | |
Ratios/Supplemental Data | | | | | | |
Net Assets, End of Period (Millions) | $4,319 | $4,046 | $6,827 | $4,727 | $4,311 | $3,383 |
Ratio of Total Expenses to | | | | | | |
Average Net Assets | 0.20%* | 0.20% | 0.21% | 0.21% | 0.21% | 0.24% |
Ratio of Net Investment Income to | | | | | | |
Average Net Assets | 3.14%* | 2.52% | 2.27% | 2.91% | 3.44% | 4.10% |
Portfolio Turnover Rate3 | 7%* | 13% | 11% | 17% | 13% | 7% |
1 Includes increases from redemption fees of $0.00, $0.02, $0.00, $0.01, $0.01, and $0.00.
2 Total returns do not reflect the 1% fee assessed on redemptions of shares held for less than one year, nor do they include the account service fee that may be applicable to certain accounts with balances below $10,000.
3 Excludes the value of portfolio securities received or delivered as a result of in-kind purchases or redemptions of the fund’s capital shares, including ETF Creation Units.
* Annualized.
14
Admiral Shares | | | | | | |
| | | | | | |
| Six Months | | | | | |
| Ended | | | |
For a Share Outstanding | July 31, | Year Ended January 31, |
Throughout Each Period | 2008 | 2008 | 2007 | 2006 | 2005 | 2004 |
Net Asset Value, Beginning of Period | $86.94 | $118.46 | $90.82 | $73.40 | $67.56 | $49.14 |
Investment Operations | | | | | | |
Net Investment Income | 1.467 | 2.707 | 2.328 | 2.460 | 2.437 | 2.508 |
Net Realized and Unrealized Gain (Loss) | | | | | | |
on Investments1 | (1.381) | (29.817) | 29.903 | 19.993 | 7.494 | 19.279 |
Total from Investment Operations | .086 | (27.110) | 32.231 | 22.453 | 9.931 | 21.787 |
Distributions | | | | | | |
Dividends from Net Investment Income | (1.836) | (2.735) | (2.341) | (2.488) | (2.439) | (2.931) |
Distributions from Realized Capital Gains | — | (.849) | (1.761) | (2.258) | (1.652) | — |
Return of Capital | — | (.826) | (.489) | (.287) | — | (.436) |
Total Distributions | (1.836) | (4.410) | (4.591) | (5.033) | (4.091) | (3.367) |
Net Asset Value, End of Period | $85.19 | $86.94 | $118.46 | $90.82 | $73.40 | $67.56 |
| | | | | | |
| | | | | | |
Total Return2 | 0.06% | –23.23% | 36.46% | 31.49% | 14.82% | 45.57% |
| | | | | | |
| | | | | | |
Ratios/Supplemental Data | | | | | | |
Net Assets, End of Period (Millions) | $1,770 | $1,706 | $3,392 | $2,025 | $938 | $733 |
Ratio of Total Expenses to | | | | | | |
Average Net Assets | 0.10%* | 0.10% | 0.14% | 0.14% | 0.16% | 0.18% |
Ratio of Net Investment Income to | | | | | | |
Average Net Assets | 3.24%* | 2.62% | 2.34% | 2.98% | 3.49% | 4.16% |
Portfolio Turnover Rate3 | 7%* | 13% | 11% | 17% | 13% | 7% |
1 Includes increases from redemption fees of $0.01, $0.10, $0.02, $0.02, $0.04, and $0.01.
2 Total returns do not reflect the 1% fee assessed on redemptions of shares held for less than one year.
3 Excludes the value of portfolio securities received or delivered as a result of in-kind purchases or redemptions of the fund’s capital shares, including ETF Creation Units.
* Annualized.
15
Signal Shares | | |
| Six Months | June 4, |
| Ended | 20071 to |
| July 31, | Jan. 31, |
For a Share Outstanding Throughout Each Period | 2008 | 2008 |
Net Asset Value, Beginning of Period | $23.21 | $30.05 |
Investment Operations | | |
Net Investment Income | .392 | .470 |
Net Realized and Unrealized Gain (Loss) on Investments2 | (.373) | (6.311) |
Total from Investment Operations | .019 | (5.841) |
Distributions | | |
Dividends from Net Investment Income | (.489) | (.620) |
Distributions from Realized Capital Gains | — | (.192) |
Return of Capital | — | (.187) |
Total Distributions | (.489) | (.999) |
Net Asset Value, End of Period | $22.74 | $23.21 |
| | |
| | |
Total Return3 | 0.04% | –19.68% |
| | |
| | |
Ratios/Supplemental Data | | |
Net Assets, End of Period (Millions) | $652 | $538 |
Ratio of Total Expenses to Average Net Assets | 0.10%* | 0.10%* |
Ratio of Net Investment Income to Average Net Assets | 3.24%* | 2.62%* |
Portfolio Turnover Rate4 | 7%* | 13% |
1 Inception.
2 Includes increases from redemption fees of $0.00 and $0.01.
3 Total returns do not reflect the 1% fee assessed on redemptions of shares held for less than one year.
4 Excludes the value of portfolio securities received or delivered as a result of in-kind purchases or redemptions of the fund’s capital shares, including ETF Creation Units.
* Annualized.
16
Institutional Shares | | | | | | |
| | | | | | |
| Six Months | | | | | Dec. 2, |
| Ended | | | 20031 to |
For a Share Outstanding | July 31, | Year Ended January 31, | Jan. 31, |
Throughout Each Period | 2008 | 2008 | 2007 | 2006 | 2005 | 2004 |
Net Asset Value, Beginning of Period | $13.46 | $18.33 | $14.06 | $11.36 | $10.46 | $10.00 |
Investment Operations | | | | | | |
Net Investment Income | .228 | .420 | .366 | .385 | .381 | .065 |
Net Realized and Unrealized Gain (Loss) | | | | | | |
on Investments2 | (.223) | (4.605) | 4.621 | 3.099 | 1.156 | .575 |
Total from Investment Operations | .005 | (4.185) | 4.987 | 3.484 | 1.537 | .640 |
Distributions | | | | | | |
Dividends from Net Investment Income | (.285) | (.426) | (.368) | (.389) | (.381) | (.157) |
Distributions from Realized Capital Gains | — | (.131) | (.273) | (.350) | (.256) | — |
Return of Capital | — | (.128) | (.076) | (.045) | — | (.023) |
Total Distributions | (.285) | (.685) | (.717) | (.784) | (.637) | (.180) |
Net Asset Value, End of Period | $13.18 | $13.46 | $18.33 | $14.06 | $11.36 | $10.46 |
| | | | | | |
| | | | | | |
Total Return3 | 0.00% | –23.18% | 36.45% | 31.58% | 14.81% | 6.49% |
| | | | | | |
| | | | | | |
Ratios/Supplemental Data | | | | | | |
Net Assets, End of Period (Millions) | $880 | $722 | $960 | $571 | $297 | $63 |
Ratio of Total Expenses to | | | | | | |
Average Net Assets | 0.09%* | 0.09% | 0.10% | 0.10% | 0.13% | 0.15%* |
Ratio of Net Investment Income | | | | | | |
to Average Net Assets | 3.25%* | 2.63% | 2.38% | 3.02% | 3.52% | 4.19%* |
Portfolio Turnover Rate4 | 7%* | 13% | 11% | 17% | 13% | 7% |
1 Inception.
2 Includes increases from redemption fees of $0.00, $0.01, $0.00, $0.00, $0.00, and $0.00.
3 Total returns do not reflect the 1% fee assessed on redemptions of shares held for less than one year.
4 Excludes the value of portfolio securities received or delivered as a result of in-kind purchases or redemptions of the fund’s capital shares, including ETF Creation Units.
* Annualized.
17
ETF Shares | | | | | |
| | | | | |
| Six Months | | | | Sept. 23, |
| Ended | | 20041 to |
For a Share Outstanding | July 31, | Year Ended January 31, | Jan. 31, |
Throughout Each Period | 2008 | 2008 | 2007 | 2006 | 2005 |
Net Asset Value, Beginning of Period | $61.31 | $83.55 | $64.07 | $51.77 | $49.41 |
Investment Operations | | | | | |
Net Investment Income | 1.034 | 1.908 | 1.654 | 1.745 | .665 |
Net Realized and Unrealized Gain (Loss) | | | | | |
on Investments2 | (.971) | (21.037) | 21.080 | 14.116 | 2.965 |
Total from Investment Operations | .063 | (19.129) | 22.734 | 15.861 | 3.630 |
Distributions | | | | | |
Dividends from Net Investment Income | (1.293) | (1.931) | (1.665) | (1.764) | (.682) |
Distributions from Realized Capital Gains | — | (.598) | (1.242) | (1.594) | (.588) |
Return of Capital | — | (.582) | (.347) | (.203) | — |
Total Distributions | (1.293) | (3.111) | (3.254) | (3.561) | (1.270) |
Net Asset Value, End of Period | $60.08 | $61.31 | $83.55 | $64.07 | $51.77 |
| | | | | |
| | | | | |
Total Return | 0.06% | –23.23% | 36.48% | 31.54% | 7.13% |
| | | | | |
| | | | | |
Ratios/Supplemental Data | | | | | |
Net Assets, End of Period (Millions) | $2,396 | $2,082 | $1,713 | $871 | $198 |
Ratio of Total Expenses to | | | | | |
Average Net Assets | 0.10%* | 0.10% | 0.12% | 0.12% | 0.18%* |
Ratio of Net Investment Income to | | | | | |
Average Net Assets | 3.24%* | 2.62% | 2.36% | 3.00% | 3.47%* |
Portfolio Turnover Rate3 | 7%* | 13% | 11% | 17% | 13% |
1 Inception.
2 Includes increases from redemption fees of $0.00, $0.04, $0.01, $0.01, and $0.00.
3 Excludes the value of portfolio securities received or delivered as a result of in-kind purchases or redemptions of the fund’s capital shares, including ETF Creation Units.
* Annualized.
See accompanying Notes, which are an integral part of the Financial Statements.
18
Notes to Financial Statements
Vanguard REIT Index Fund is registered under the Investment Company Act of 1940 as an open-end investment company, or mutual fund. The fund files reports with the SEC under the company name Vanguard Specialized Funds. The fund offers five classes of shares: Investor Shares, Admiral Shares, Signal Shares, Institutional Shares, and ETF Shares. Investor Shares are available to any investor who meets the fund’s minimum purchase requirements. Admiral Shares are designed for investors who meet certain administrative, service, tenure, and account-size criteria. Signal Shares are designed for institutional investors who meet certain administrative, service, and account-size criteria. Institutional Shares are designed for investors who meet certain administrative and service criteria and invest a minimum of $5 million. ETF Shares are listed for trading on the American Stock Exchange; they can be purchased and sold through a broker.
A. The following significant accounting policies conform to generally accepted accounting principles for U.S. mutual funds. The fund consistently follows such policies in preparing its financial statements.
1. Security Valuation: Securities are valued as of the close of trading on the New York Stock Exchange (generally 4 p.m., Eastern time) on the valuation date. Equity securities are valued at the latest quoted sales prices or official closing prices taken from the primary market in which each security trades; such securities not traded on the valuation date are valued at the mean of the latest quoted bid and asked prices. Securities for which market quotations are not readily available, or whose values have been materially affected by events occurring before the fund’s pricing time but after the close of the securities’ primary markets, are valued by methods deemed by the board of trustees to represent fair value. Investments in Vanguard Market Liquidity Fund are valued at that fund’s net asset value.
2. Federal Income Taxes: The fund intends to continue to qualify as a regulated investment company and distribute all of its taxable income. Management has analyzed the fund’s tax positions taken on federal income tax returns for all open tax years (tax years ended January 31, 2005–2008) and for the period ended July 31, 2008, and has concluded that no provision for federal income tax is required in the fund’s financial statements.
3. Distributions: Distributions to shareholders are recorded on the ex-dividend date. Quarterly income dividends declared by the fund are reallocated at fiscal year-end to ordinary income, capital gain, and return of capital to reflect their tax character.
4. Security Lending: The fund may lend its securities to qualified institutional borrowers to earn additional income. Security loans are required to be secured at all times by collateral at least equal to the market value of securities loaned. The fund invests cash collateral received in Vanguard Market Liquidity Fund, and records a liability for the return of the collateral, during the period the securities are on loan. Security lending income represents the income earned on investing cash collateral, less expenses associated with the loan.
5. Other: Distributions received from REITs are recorded on the ex-dividend date. Each REIT reports annually the tax character of its distributions. Dividend income, capital gain distributions received, and unrealized appreciation (depreciation) reflect the amounts of taxable income, capital gain, and return of capital reported by the REITs, and management’s estimates of such amounts for REIT distributions for which actual information has not been reported. Interest income includes income distributions received from Vanguard Market Liquidity Fund and is accrued daily. Security transactions are accounted for on the date securities are bought or sold. Costs used to determine realized gains (losses) on the sale of investment securities are those of the specific securities sold. Fees assessed on redemptions of capital shares are credited to paid-in capital.
19
Each class of shares has equal rights as to assets and earnings, except that each class separately bears certain class-specific expenses related to maintenance of shareholder accounts (included in Management and Administrative expenses) and shareholder reporting. Marketing and distribution expenses are allocated to each class of shares based on a method approved by the board of trustees. Income, other non-class-specific expenses, and gains and losses on investments are allocated to each class of shares based on its relative net assets.
B. The Vanguard Group furnishes at cost investment advisory, corporate management, administrative, marketing, and distribution services. The costs of such services are allocated to the fund under methods approved by the board of trustees. The fund has committed to provide up to 0.40% of its net assets in capital contributions to Vanguard. At July 31, 2008, the fund had contributed capital of $813,000 to Vanguard (included in Other Assets), representing 0.01% of the fund’s net assets and 0.81% of Vanguard’s capitalization. The fund’s trustees and officers are also directors and officers of Vanguard.
C. Distributions are determined on a tax basis and may differ from net investment income and realized capital gains for financial reporting purposes. Differences may be permanent or temporary. Permanent differences are reclassified among capital accounts in the financial statements to reflect their tax character. Temporary differences arise when certain items of income, expense, gain, or loss are recognized in different periods for financial statement and tax purposes; these differences will reverse at some time in the future. Differences in classification may also result from the treatment of short-term gains as ordinary income for tax purposes. The fund’s tax-basis capital gains and losses are determined only at the end of each fiscal year.
During the six months ended July 31, 2008, the fund realized $414,237,000 of net capital gains resulting from in-kind redemptions—in which shareholders exchanged fund shares for securities held by the fund rather than for cash. Because such gains are not taxable to the fund, and are not distributed to shareholders, they have been reclassified from accumulated net realized gains to paid-in capital.
At July 31, 2008, the cost of investment securities for tax purposes was $9,562,550,000. Net unrealized appreciation of investment securities for tax purposes was $512,425,000, consisting of unrealized gains of $1,285,711,000 on securities that had risen in value since their purchase and $773,286,000 in unrealized losses on securities that had fallen in value since their purchase.
D. During the six months ended July 31, 2008, the fund purchased $2,288,835,000 of investment securities and sold $1,111,662,000 of investment securities other than temporary cash investments.
E. The market value of securities on loan to broker-dealers at July 31, 2008, was $56,656,000, for which the fund received cash collateral of $60,432,000.
20
F. Capital share transactions for each class of shares were:
| Six Months Ended | Year Ended |
| July 31, 2008 | January 31, 2008 |
| Amount | Shares | | Amount | Shares |
| ($000) | (000) | | ($000) | (000) |
Investor Shares | | | | | |
Issued | 682,984 | 32,559 | | 1,399,642 | 56,790 |
Issued in Lieu of Cash Distributions | 81,634 | 3,997 | | 206,766 | 8,999 |
Redeemed1 | (386,437) | (18,819) | | (2,697,993) | (113,122) |
Net Increase (Decrease)—Investor Shares | 378,181 | 17,737 | | (1,091,585) | (47,333) |
Admiral Shares | | | | | |
Issued | 209,567 | 2,331 | | 767,550 | 7,020 |
Issued in Lieu of Cash Distributions | 30,787 | 353 | | 93,775 | 948 |
Redeemed1 | (134,899) | (1,532) | | (1,765,151) | (16,977) |
Net Increase (Decrease)—Admiral Shares | 105,455 | 1,152 | | (903,826) | (9,009) |
Signal Shares | | | | | |
Issued | 198,685 | 8,375 | | 744,428 | 26,756 |
Issued in Lieu of Cash Distributions | 11,260 | 485 | | 8,094 | 346 |
Redeemed1 | (78,720) | (3,350) | | (94,898) | (3,926) |
Net Increase (Decrease)—Signal Shares | 131,225 | 5,510 | | 657,624 | 23,176 |
Institutional Shares | | | | | |
Issued | 247,986 | 18,016 | | 353,251 | 22,005 |
Issued in Lieu of Cash Distributions | 15,606 | 1,158 | | 33,538 | 2,226 |
Redeemed1 | (83,692) | (6,083) | | (367,874) | (22,969) |
Net Increase (Decrease)—Institutional Shares | 179,900 | 13,091 | | 18,915 | 1,262 |
ETF Shares | | | | | |
Issued | 1,164,212 | 18,930 | | 2,480,141 | 33,552 |
Issued in Lieu of Cash Distributions | — | — | | — | — |
Redeemed1 | (812,543) | (13,000) | | (1,591,724) | (20,100) |
Net Increase (Decrease)—ETF Shares | 351,669 | 5,930 | | 888,417 | 13,452 |
1 Net of redemption fees of $773,000 and $7,614,000 (fund totals).
21
G. In September 2006, the Financial Accounting Standards Board issued Statement of Financial Accounting Standards No. 157 (“FAS 157”), “Fair Value Measurements.” FAS 157 establishes a framework for measuring fair value and expands disclosures about fair value measurements in financial statements, effective for the fund’s current fiscal period.
The various inputs that may be used to determine the value of the fund’s investments are summarized in three broad levels. The inputs or methodologies used for valuing securities are not necessarily an indication of the risk associated with investing in those securities.
Level 1—Quoted prices in active markets for identical securities.
Level 2—Other significant observable inputs (including quoted prices for similar securities, interest rates, prepayment speeds, credit risk, etc.).
Level 3—Significant unobservable inputs (including the fund’s own assumptions used to determine the fair value of investments).
At July 31, 2008, 100% of the fund’s investments were valued based on Level 1 inputs.
22
About Your Fund’s Expenses
As a shareholder of the fund, you incur ongoing costs, which include costs for portfolio management, administrative services, and shareholder reports (like this one), among others. Operating expenses, which are deducted from a fund’s gross income, directly reduce the investment return of the fund.
A fund’s expenses are expressed as a percentage of its average net assets. This figure is known as the expense ratio. The following examples are intended to help you understand the ongoing costs (in dollars) of investing in your fund and to compare these costs with those of other mutual funds. The examples are based on an investment of $1,000 made at the beginning of the period shown and held for the entire period.
The table on page 24 illustrates your fund’s costs in two ways:
• Based on actual fund return. This section helps you to estimate the actual expenses that you paid over the period. The “Ending Account Value” shown is derived from the fund’s actual return, and the third column shows the dollar amount that would have been paid by an investor who started with $1,000 in the fund. You may use the information here, together with the amount you invested, to estimate the expenses that you paid over the period.
To do so, simply divide your account value by $1,000 (for example, an $8,600 account value divided by $1,000 = 8.6), then multiply the result by the number given for your fund under the heading “Expenses Paid During Period.”
• Based on hypothetical 5% yearly return. This section is intended to help you compare your fund’s costs with those of other mutual funds. It assumes that the fund had a yearly return of 5% before expenses, but that the expense ratio is unchanged. In this case—because the return used is not the fund’s actual return—the results do not apply to your investment. The example is useful in making comparisons because the Securities and Exchange Commission requires all mutual funds to calculate expenses based on a 5% return. You can assess your fund’s costs by comparing this hypothetical example with the hypothetical examples that appear in shareholder reports of other funds.
Note that the expenses shown in the table are meant to highlight and help you compare ongoing costs only and do not reflect transaction costs incurred by the fund for buying and selling securities. Further, the expenses do not include the 1% fee on redemptions of shares held for less than one year, nor do they include the account service fee described in the prospectus. If such fees were applied to your account, your costs would be higher. Your fund does not carry a “sales load.”
The calculations assume no shares were bought or sold during the period. Your actual costs may have been higher or lower, depending on the amount of your investment and the timing of any purchases or redemptions.
You can find more information about the fund’s expenses, including annual expense ratios, in the Financial Statements section of this report. For additional information on operating expenses and other shareholder costs, please refer to your fund’s current prospectus.
23
Six Months Ended July 31, 2008 | | | |
| Beginning | Ending | Expenses |
| Account Value | Account Value | Paid During |
REIT Index Fund | 1/31/2008 | 7/31/2008 | Period1 |
Based on Actual Fund Return | | | |
Investor Shares | $1,000.00 | $1,000.11 | $0.99 |
Admiral Shares | 1,000.00 | 1,000.59 | 0.50 |
Signal Shares | 1,000.00 | 1,000.42 | 0.50 |
Institutional Shares | 1,000.00 | 999.97 | 0.45 |
ETF Shares | 1,000.00 | 1,000.56 | 0.50 |
Based on Hypothetical 5% Yearly Return | | | |
Investor Shares | $1,000.00 | $1,023.87 | $1.01 |
Admiral Shares | 1,000.00 | 1,024.37 | 0.50 |
Signal Shares | 1,000.00 | 1,024.37 | 0.50 |
Institutional Shares | 1,000.00 | 1,024.32 | 0.45 |
ETF Shares | 1,000.00 | 1,024.37 | 0.50 |
1 These calculations are based on expenses incurred in the most recent six-month period. The fund’s annualized six-month expense ratios for that period are 0.20% for Investor Shares, 0.10% for Admiral Shares, 0.10% for Signal Shares, 0.09% for Institutional Shares, and 0.10% for ETF Shares. The dollar amounts shown as “Expenses Paid” are equal to the annualized expense ratio multiplied by the average account value over the period, multiplied by the number of days in the most recent six-month period, then divided by the number of days in the most recent 12-month period.
24
Trustees Approve Advisory Arrangement
The board of trustees of Vanguard REIT Index Fund has renewed the fund’s investment advisory arrangement with The Vanguard Group, Inc. Vanguard—through its Quantitative Equity Group (QEG)—serves as the investment advisor to the fund. The board determined that continuing the fund’s internalized management structure was in the best interests of the fund and its shareholders.
The board based its decision upon an evaluation of the advisor’s investment staff, portfolio management process, and performance. The trustees considered the factors discussed below, among others. However, no single factor determined whether the board approved the arrangement. Rather, it was the totality of the circumstances that drove the board’s decision.
Nature, extent, and quality of services
The board considered the quality of the fund’s investment management over both the short and long term, and took into account the organizational depth and stability of the advisor. The board noted that Vanguard has been managing investments for more than two decades. George U. Sauter, Vanguard managing director and chief investment officer, has been in the investment management business since 1985. Mr. Sauter has led QEG since 1987. QEG adheres to a sound, disciplined investment management process; the team has considerable experience, stability, and depth.
The board concluded that Vanguard’s experience, stability, depth, and performance, among other factors, warranted continuation of the advisory arrangement.
Investment performance
The board considered the short- and long-term performance of the fund, including any periods of outperformance or underperformance of its target benchmark and peer group. The board concluded that the fund has performed in line with expectations, and that its results have been consistent with its investment strategy. Information about the fund’s most recent performance can be found in the Performance Summary section of this report.
Cost
The board concluded that the fund’s expense ratio was far below the average expense ratio charged by funds in its peer group. The board noted that the fund’s advisory expense ratio was also well below its peer-group average. Information about the fund’s expense ratio appears in the About Your Fund’s Expenses section of this report as well as in the Financial Statements section.
The board does not conduct a profitability analysis of Vanguard because of Vanguard’s unique “at-cost” structure. Unlike most other mutual fund management companies, Vanguard is owned by the funds it oversees, and produces “profits” only in the form of reduced expenses for fund shareholders.
The benefit of economies of scale
The board concluded that the fund’s low-cost arrangement with Vanguard ensures that the fund will realize economies of scale as it grows, with the cost to shareholders declining as the fund’s assets increase.
The board will consider whether to renew the advisory arrangement again after a one-year period.
25
Glossary
Beta. A measure of the magnitude of a fund’s past share-price fluctuations in relation to the ups and downs of a given market index. The index is assigned a beta of 1.00. Compared with a given index, a fund with a beta of 1.20 typically would have seen its share price rise or fall by 12% when the index rose or fell by 10%. For this report, beta is based on returns over the past 36 months for both the fund and the index. Note that a fund’s beta should be reviewed in conjunction with its R-squared (see definition below). The lower the R-squared, the less correlation there is between the fund and the index, and the less reliable beta is as an indicator of volatility.
Earnings Growth Rate. The average annual rate of growth in earnings over the past five years for the stocks now in a fund.
Expense Ratio. The percentage of a fund’s average net assets used to pay its annual administrative and advisory expenses. These expenses directly reduce returns to investors.
Foreign Holdings. The percentage of a fund represented by stocks or depositary receipts of companies based outside the United States.
Inception Date. The date on which the assets of a fund (or one of its share classes) are first invested in accordance with the fund’s investment objective. For funds with a subscription period, the inception date is the day after that period ends. Investment performance is measured from the inception date.
Median Market Cap. An indicator of the size of companies in which a fund invests; the midpoint of market capitalization (market price x shares outstanding) of a fund’s stocks, weighted by the proportion of the fund’s assets invested in each stock. Stocks representing half of the fund’s assets have market capitalizations above the median, and the rest are below it.
Price/Book Ratio. The share price of a stock divided by its net worth, or book value, per share. For a fund, the weighted average price/book ratio of the stocks it holds.
Price/Earnings Ratio. The ratio of a stock’s current price to its per-share earnings over the past year. For a fund, the weighted average P/E of the stocks it holds. P/E is an indicator of market expectations about corporate prospects; the higher the P/E, the greater the expectations for a company’s future growth.
R-Squared. A measure of how much of a fund’s past returns can be explained by the returns from the market in general, as measured by a given index. If a fund’s total returns were precisely synchronized with an index’s returns, its R-squared would be 1.00. If the fund’s returns bore no relationship to the index’s returns, its R-squared would be 0. For this report, R-squared is based on returns over the past 36 months for both the fund and the index.
Return on Equity. The annual average rate of return generated by a company during the past five years for each dollar of shareholder’s equity (net income divided by shareholder’s equity). For a fund, the weighted average return on equity for the companies whose stocks it holds.
Short-Term Reserves. The percentage of a fund invested in highly liquid, short-term securities that can be readily converted to cash.
Turnover Rate. An indication of the fund’s trading activity. Funds with high turnover rates incur higher transaction costs and may be more likely to distribute capital gains (which may be taxable to investors). The turnover rate excludes in-kind transactions, which have minimal impact on costs.
Yield. A snapshot of the level of dividends, interest, capital gains distributions, and return-of-capital distributions received by the fund. The index yield is based on the current annualized rate of dividends and other distributions provided by securities in the index.
26
This page intentionally left blank.
The People Who Govern Your Fund
The trustees of your mutual fund are there to see that the fund is operated and managed in your best interests since, as a shareholder, you are a part owner of the fund. Your fund’s trustees also serve on the board of directors of The Vanguard Group, Inc., which is owned by the Vanguard funds and provides services to them on an at-cost basis.
A majority of Vanguard’s board members are independent, meaning that they have no affiliation with Vanguard or the funds they oversee, apart from the sizable personal investments they have made as private individuals.
Our independent board members bring distinguished backgrounds in business, academia, and public service to their task of working with Vanguard officers to establish the policies and oversee the activities of the funds. Among board members’ responsibilities are selecting investment advisors for the funds; monitoring fund operations, performance, and costs; reviewing contracts; nominating and selecting new trustees/directors; and electing Vanguard officers.
Each trustee serves a fund until its termination; or until the trustee’s retirement, resignation, or death; or otherwise as specified in the fund’s organizational documents. Any trustee may be removed at a shareholders’ meeting by a vote representing two-thirds of the net asset value of all shares of the fund together with shares of other Vanguard funds organized within the same trust. The table on these two pages shows information for each trustee and executive officer of the fund. The mailing address of the trustees and officers is P.O. Box 876, Valley Forge, PA 19482.
Chairman of the Board, Chief Executive Officer, and Trustee
John J. Brennan1
Born 1954 Principal Occupation(s) During the Past Five Years: Chairman of the Board, Chief Executive Trustee Since May 1987; Officer, and Director/Trustee of The Vanguard Group, Inc., and of each of the investment Chairman of the Board and companies served by The Vanguard Group; Director of Vanguard Marketing Corporation. Chief Executive Officer 156 Vanguard Funds Overseen
Independent Trustees
Charles D. Ellis
Born 1937 Principal Occupation(s) During the Past Five Years: Applecore Partners (pro bono ventures Trustee Since January 2001 in education); Senior Advisor to Greenwich Associates (international business strategy 156 Vanguard Funds Overseen consulting); Successor Trustee of Yale University; Overseer of the Stern School of Business at New York University; Trustee of the Whitehead Institute for Biomedical Research.
Emerson U. Fullwood
Born 1948 Principal Occupation(s) During the Past Five Years: Executive Chief Staff and Marketing Trustee Since January 2008 Officer for North America since 2004 and Corporate Vice President of Xerox Corporation 156 Vanguard Funds Overseen (photocopiers and printers); Director of SPX Corporation (multi-industry manufacturing), of the United Way of Rochester, and of the Boy Scouts of America.
Rajiv L. Gupta
Born 1945 Principal Occupation(s) During the Past Five Years: Chairman, President, and Trustee Since December 20012 Chief Executive Officer of Rohm and Haas Co. (chemicals); Board Member of 156 Vanguard Funds Overseen the American Chemistry Council; Director of Tyco International, Ltd. (diversified manufacturing and services) since 2005.
Amy Gutmann
Born 1949 Principal Occupation(s) During the Past Five Years: President of the University of
Trustee Since June 2006 Pennsylvania since 2004; Professor in the School of Arts and Sciences, Annenberg School 156 Vanguard Funds Overseen for Communication, and Graduate School of Education of the University of Pennsylvania since 2004; Provost (2001–2004) and Laurance S. Rockefeller Professor of Politics and the University Center for Human Values (1990–2004), Princeton University; Director of Carnegie Corporation of New York since 2005 and of Schuylkill River Development Corporation and Greater Philadelphia Chamber of Commerce since 2004; Trustee of the National Constitution Center since 2007.
JoAnn Heffernan Heisen
Born 1950 Principal Occupation(s) During the Past Five Years: Corporate Vice President and Trustee Since July 1998 Chief Global Diversity Officer since 2006, Vice President and Chief Information 156 Vanguard Funds Overseen Officer (1997–2005), and Member of the Executive Committee of Johnson & Johnson (pharmaceuticals/consumer products); Director of the University Medical Center at Princeton and Women’s Research and Education Institute.
André F. Perold
Born 1952 Principal Occupation(s) During the Past Five Years: George Gund Professor of Finance Trustee Since December 2004 and Banking, Harvard Business School; Senior Associate Dean and Director of Faculty 156 Vanguard Funds Overseen Recruiting, Harvard Business School; Director and Chairman of UNX, Inc. (equities trading firm); Chair of the Investment Committee of HighVista Strategies LLC (private investment firm) since 2005.
Alfred M. Rankin, Jr.
Born 1941 Principal Occupation(s) During the Past Five Years: Chairman, President, Chief Executive Trustee Since January 1993 Officer, and Director of NACCO Industries, Inc. (forklift trucks/housewares/lignite); Director 156 Vanguard Funds Overseen of Goodrich Corporation (industrial products/aircraft systems and services).
J. Lawrence Wilson
Born 1936 Principal Occupation(s) During the Past Five Years: Retired Chairman and Chief Executive Trustee Since April 1985 Officer of Rohm and Haas Co. (chemicals); Director of Cummins Inc. (diesel engines) and 156 Vanguard Funds Overseen AmerisourceBergen Corp. (pharmaceutical distribution); Trustee of Vanderbilt University and of Culver Educational Foundation.
Executive Officers1
Thomas J. Higgins
Born 1957 Principal Occupation(s) During the Past Five Years: Principal of The Vanguard Group, Inc.; Treasurer Since July 1998 Treasurer of each of the investment companies served by The Vanguard Group. 156 Vanguard Funds Overseen
F. William McNabb III
Born 1957 Principal Occupation(s) During the Past Five Years: President of The Vanguard Group, Inc., President Since March 2008 and of each of the investment companies served by The Vanguard Group since 2008; 156 Vanguard Funds Overseen Director of Vanguard Marketing Corporation; Managing Director of The Vanguard Group (1995–2008).
Heidi Stam
Born 1956 Principal Occupation(s) During the Past Five Years: Managing Director of The Vanguard Secretary Since July 2005 Group, Inc., since 2006; General Counsel of The Vanguard Group since 2005; Secretary of 156 Vanguard Funds Overseen The Vanguard Group, and of each of the investment companies served by The Vanguard Group, since 2005; Director and Senior Vice President of Vanguard Marketing Corporation since 2005; Principal of The Vanguard Group (1997–2006).
Vanguard Senior Management Team | | |
| | | |
R. Gregory Barton | Kathleen C. Gubanich | Michael S. Miller | Glenn W. Reed |
Mortimer J. Buckley | Paul A. Heller | Ralph K. Packard | George U. Sauter |
Founder
John C. Bogle
Chairman and Chief Executive Officer, 1974–1996
1 Officers of the funds are “interested persons” as defined in the Investment Company Act of 1940.
2 December 2002 for Vanguard Equity Income Fund, Vanguard Growth Equity Fund, the Vanguard Municipal Bond Funds, and the Vanguard State Tax-Exempt Funds.
More information about the trustees is in the Statement of Additional Information, available from The Vanguard Group.

P.O. Box 2600
Valley Forge, PA 19482-2600
Connect with Vanguard® > www.vanguard.com
Fund Information > 800-662-7447 | Vanguard, Admiral, Signal, Connect with Vanguard, |
| Vanguard ETF, and the ship logo are trademarks of |
Direct Investor Account Services > 800-662-2739 | The Vanguard Group, Inc. |
| |
Institutional Investor Services > 800-523-1036 | |
| All other marks are the exclusive property of their |
Text Telephone for People | respective owners. |
With Hearing Impairment > 800-952-3335 | |
| All comparative mutual fund data are from Lipper Inc. |
| or Morningstar, Inc., unless otherwise noted. |
| |
| You can obtain a free copy of Vanguard’s proxy voting |
This material may be used in conjunction | guidelines by visiting our website, www.vanguard.com, |
with the offering of shares of any Vanguard | and searching for “proxy voting guidelines,” or by |
fund only if preceded or accompanied by | calling Vanguard at 800-662-2739. The guidelines are |
the fund’s current prospectus. | also available from the SEC’s website, www.sec.gov. |
| In addition, you may obtain a free report on how your |
| fund voted the proxies for securities it owned during |
| the 12 months ended June 30. To get the report, visit |
The funds or securities referred to herein are not | either www.vanguard.com or www.sec.gov. |
sponsored, endorsed, or promoted by MSCI, and | |
MSCI bears no liability with respect to any such funds | |
or securities. For any such funds or securities, the | |
prospectus or the Statement of Additional Information | |
contains a more detailed description of the limited | |
relationship MSCI has with The Vanguard Group and | |
any related funds. | You can review and copy information about your fund |
| at the SEC’s Public Reference Room in Washington, D.C. |
| To find out more about this public service, call the SEC |
| at 202-551-8090. Information about your fund is also |
| available on the SEC’s website, and you can receive |
| copies of this information, for a fee, by sending a |
| request in either of two ways: via e-mail addressed to |
| publicinfo@sec.gov or via regular mail addressed to the |
| Public Reference Section, Securities and Exchange |
| Commission, Washington, DC 20549-0102. |
| |
| |
| |
| |
| © 2008 The Vanguard Group, Inc. |
| All rights reserved. |
| Vanguard Marketing Corporation, Distributor. |
| |
| Q1232 092008 |
> For the six months ended July 31, 2008, Vanguard Dividend Growth Fund returned –1.4%.
> During the period, the fund kept a few steps ahead of both the return of its benchmark index and the average return of its peer funds.
> The fund’s health care and consumer staples holdings helped it to hold up better than its benchmark. Also helpful was the advisor’s decision to limit the fund’s exposure to financials.
Contents | |
| |
Your Fund’s Total Returns | 1 |
Chairman’s Letter | 2 |
Advisor’s Report | 6 |
Fund Profile | 8 |
Performance Summary | 9 |
Financial Statements | 10 |
About Your Fund’s Expenses | 18 |
Trustees Approve Advisory Agreement | 20 |
Glossary | 21 |
Please note: The opinions expressed in this report are just that—informed opinions. They should not be considered promises or advice. Also, please keep in mind that the information and opinions cover the period through the date on the cover of this report. Of course, the risks of investing in your fund are spelled out in the prospectus.
Your Fund’s Total Returns
Six Months Ended July 31, 2008 | | |
| Ticker | Total |
| Symbol | Returns |
Vanguard Dividend Growth Fund | VDIGX | –1.4% |
Russell 1000 Index | | –6.6 |
Average Large-Cap Core Fund1 | | –6.6 |
Your Fund’s Performance at a Glance | | | | |
January 31, 2008–July 31, 2008 | | | | |
| | | Distributions Per Share |
| Starting | Ending | Income | Capital |
| Share Price | Share Price | Dividends | Gains |
Vanguard Dividend Growth Fund | $14.38 | $14.04 | $0.140 | $0.000 |
1 Derived from data provided by Lipper Inc.
1

Chairman’s Letter
Dear Shareholder,
Vanguard Dividend Growth Fund returned –1.4% for the fiscal half-year ended July 31, 2008, a difficult period for stocks in most sectors. The fund outperformed both its market benchmark, the Russell 1000 Index, and the average return of large-capitalization core funds.
Although the fund’s return was under-whelming, it did beat the index return by about 5 percentage points. Effective stock selection in the health care and consumer staples sectors, together with the investment advisor’s decision to limit exposure to financials, contributed most to the relative performance.
Stocks rode a bumpy path to disappointing results
U.S. stocks struggled during the six months, a period of pronounced volatility in the financial markets. Continued weakness in the housing market, record oil prices, rising unemployment, and an uptick in inflation all weighed on stocks and set a downbeat tone for the period.
The U.S. market performed well in April and May, but those returns were bookended by declines earlier and later in the period. June was a particularly difficult month; the broad U.S. stock market declined –8.2%, the worst single-month return in more than five years.
2
For the half-year, the broad U.S. market returned –5.9%. Investors favored small-capitalization stocks over large- and mid-caps, and growth stocks over their value-oriented counterparts. International stocks also experienced high levels of volatility, and returned –3.8%.
Bond investors remained cautious in the wake of the subprime crisis
In the extensive fallout from the subprime-mortgage crisis, bond investors continued to prefer the safety of short-term, high-quality issues—most notably U.S. Treasury securities. During the period, bonds outpaced stocks, but registered negative returns. The broad taxable bond market returned –0.6%. Municipal bonds, which experienced a spike in volatility, returned –0.9%.
During the half-year, the Federal Reserve Board lowered its target for the federal funds rate twice, reducing it by a full percentage point, to 2.00%. At its June meeting (and again at its August meeting after the end of the fund’s fiscal period), the Fed voted to leave the target rate unchanged, signaling a growing concern about near-term inflation.
Health care, consumer staples stocks were key to the fund’s performance
The Dividend Growth Fund focuses on high-quality stocks with the potential to deliver increasing dividends over time. Because the portfolio is relatively concentrated—it contained about 50 stocks at the end of the fiscal period—the fund’s strategy puts a premium on the ability of the investment advisor,
Market Barometer | | | |
| | | Total Returns |
| | Periods Ended July 31, 2008 |
| Six Months | One Year | Five Years1 |
Stocks | | | |
Russell 1000 Index (Large-caps) | –6.6% | –10.6% | 7.5% |
Russell 2000 Index (Small-caps) | 0.9 | –6.7 | 9.8 |
Dow Jones Wilshire 5000 Index (Entire market) | –5.9 | –10.2 | 8.1 |
MSCI All Country World Index ex USA (International) | –3.8 | –9.3 | 17.9 |
| | | |
| | | |
Bonds | | | |
Lehman U.S. Aggregate Bond Index (Broad taxable market) | –0.6% | 6.2% | 4.6% |
Lehman Municipal Bond Index | –0.9 | 2.8 | 4.3 |
Citigroup 3-Month Treasury Bill Index | 1.0 | 3.1 | 3.1 |
| | | |
| | | |
CPI | | | |
Consumer Price Index | 4.2% | 5.6% | 3.6% |
| | | |
| | | |
| | | |
| | | |
1 Annualized. | | | |
3
Wellington Management Company, to select companies with strong prospects for earnings and dividend growth.
The fund’s strong performance in the health care and consumer staples sectors gave it an edge over its benchmark index. Effective stock selection in health care allowed the fund to benefit from double-digit returns for companies such as pharmaceutical giant AstraZeneca and medical equipment-maker Medtronic. The consumer staples sector, traditionally a defensive option for investors during economic downturns, also provided healthy returns, thanks to holdings in such companies as Wal-Mart Stores, Anheuser-Busch, and General Mills.
Other bright spots included holdings in the consumer discretionary, information technology, and materials sectors.
Although the fund’s financial stocks turned in the worst performance, returning –19%, the advisor managed to limit the impact by keeping the fund’s exposure to the group below the index level. The credit-market distress of recent months has left many financial companies scrambling for capital and trimming their dividends.
Also weak for the fund was the industrials sector, which took a nosedive during the six months as companies such as Boeing, General Electric, and United Parcel Service struggled to negotiate a rocky economic landscape with higher energy costs and
Annualized Expense Ratios1 | | |
Your Fund Compared With Its Peer Group | | |
| | Average |
| | Large-Cap |
| Fund | Core Fund |
Dividend Growth Fund | 0.34% | 1.29% |
1 Fund expense ratio reflects the six months ended July 31, 2008. Peer-group expense ratio is derived from data provided by Lipper Inc. and captures information through year-end 2007.
4
weakening consumer demand. The industrial sector, which was, on average, the fund’s second-largest industry group after consumer staples, had the largest negative impact on the fund’s overall performance.
A long-term view is important in volatile markets—and anytime
The continued weakness and uncertainty in the financial markets during the past six months have made many investors uncomfortable. That’s natural; what’s important is not to let market volatility tempt you to make hasty investment decisions.
At Vanguard, we encourage you to look past short-term volatility and focus on the long term. As seasoned investors realize, no one can predict the market’s short-term performance. The best way to invest in a challenging environment—and in any environment—is to put together a long-term investment program with a diversified mix of stock, bond, and money market mutual funds that fits your goals, time horizon, and tolerance for risk.
Vanguard Dividend Growth Fund, with its low costs and its focus on companies that, in the advisor’s judgment, are likely to increase their dividends in the years ahead, can be a valuable part of such a diversified, long-term investment program.
When I wrote to you six months ago, Vanguard’s board had elected F. William McNabb III as the fund’s president and designated him to succeed me as chief executive officer. The board has since announced that Bill will assume the chief executive role on August 31. Bill and the rest of our team will serve you and our other clients extremely well in the years ahead.
Thank you for investing with Vanguard.
Sincerely,

John J. Brennan
Chairman and Chief Executive Officer
August 14, 2008
5
Advisor’s Report
Vanguard Dividend Growth Fund declined –1.4% for the six months ended July 31, 2008. This performance compared favorably with the –6.6% decline of the Russell 1000 Index and the similar –6.6% average return for large-cap core funds.
The investment environment
The extreme volatility that has defined the market of late shows little sign of relenting. We have seen remarkable swings in sentiment among investors that were almost fully unpredictable. The continued meltdown in the financial sector has been periodically interrupted by moments of hope, but the outlook remains quite troublesome through our lens.
Trying to time potential swings in sentiment away from the energy and commodity sectors and back to the improving financial sector would be inconsistent with the spirit of the fund’s investment objective. We believe that our focused strategy of investing in well-positioned companies that generate long-term dividend growth will produce positive long-term results, obviating the need to capture volatile swings in market sentiment.
The fund’s successes
The fund’s holdings in the consumer staples, health care, and energy sectors were beneficial to performance during the period. Among the portfolio’s top contributors were Anheuser-Busch, Schlumberger, IBM, AstraZeneca, Accenture, and Medtronic.
At this point in 2008, all but five of the companies held in the portfolio have indicated increases in their dividends. Some of the more notable increases occurred at Sysco, Medtronic, and Walgreen. We currently estimate that the portfolio-weighted average dividend increase for calendar year 2008 will be roughly 15%.
The fund’s shortfalls
A number of individual stocks detracted from the fund’s performance during the fiscal half-year. The most noteworthy was Boeing, whose scheduled introduction of its next-generation commercial airplane, the 787, has been delayed because of production problems.
The lead time for introducing a new commercial airplane can be long, even with perfect execution. Given the revolutionary design and production strategy of this new aircraft, the timeline has been extended even more. Although we have no insight on whether the revised schedule for first flight and delivery will be met, we do believe that Boeing is one of the world’s great global franchises and that its long-term financial condition remains strong, as evidenced by its board of directors’ decision to increase the company’s dividend by 14% in 2008.
6
The fund’s positioning and strategy
Our primary objective is to identify companies that we believe will steadily and reliably increase their dividend payments. We seek to fulfill this objective by carefully building the portfolio one stock at a time, giving central consideration to each company’s dividend growth prospects. Our industry weightings are an output of this process. The fund currently holds significant positions in health care, industrials, and both consumer sectors, while it has less exposure to the utilities, telecommunication services, and materials sectors.
Donald J. Kilbride
Senior Vice President and
Portfolio Manager
Wellington Management Company, LLP
August 11, 2008
7
Fund Profile
As of July 31, 2008
Portfolio Characteristics | | |
| | Comparative | Broad |
| Fund | Index1 | Index2 |
Number of Stocks | 53 | 1,001 | 4,724 |
Median Market Cap | $43.0B | $37.1B | $31.5B |
Price/Earnings Ratio | 13.8x | 16.1x | 16.6x |
Price/Book Ratio | 3.1x | 2.4x | 2.3x |
Yield3 | 2.1% | 2.1% | 2.1% |
Return on Equity | 23.9% | 20.3% | 19.7% |
Earnings Growth Rate | 16.3% | 18.7% | 18.5% |
Foreign Holdings | 12.3% | 0.0% | 0.0% |
Turnover Rate4 | 27% | — | — |
Expense Ratio4 | 0.34% | — | — |
Short-Term Reserves | 2.4% | — | — |
Sector Diversification (% of equity exposure) |
| | Comparative | Broad |
| Fund | Index1 | Index2 |
Consumer Discretionary | 9.5% | 8.6% | 8.7% |
Consumer Staples | 17.6 | 10.3 | 9.6 |
Energy | 12.5 | 13.7 | 13.6 |
Financials | 10.8 | 15.2 | 16.2 |
Health Care | 15.6 | 12.4 | 12.5 |
Industrials | 14.7 | 11.8 | 11.9 |
Information Technology | 14.2 | 16.5 | 16.3 |
Materials | 1.8 | 4.4 | 4.3 |
Telecommunication | | | |
Services | 1.8 | 3.0 | 2.9 |
Utilities | 1.5 | 4.1 | 4.0 |
Volatility Measures5 | |
| Fund Versus | Fund Versus |
| Comparative Index1 | Broad Index2 |
R-Squared | 0.92 | 0.90 |
Beta | 0.79 | 0.77 |
Ten Largest Holdings6 | (% of total net assets) |
| | |
Total SA ADR | integrated oil | |
| and gas | 3.3% |
Automatic Data | data processing and | |
Processing, Inc. | outsourced services | 3.3 |
Medtronic, Inc. | health care | |
| equipment | 2.6 |
ExxonMobil Corp. | integrated oil | |
| and gas | 2.6 |
State Street Corp. | asset management | |
| and custody banks | 2.5 |
American Express Co. | consumer finance | 2.5 |
Chevron Corp. | integrated oil | |
| and gas | 2.4 |
Staples, Inc. | specialty stores | 2.3 |
Accenture Ltd. | IT consulting and | |
| other services | 2.3 |
ConocoPhillips Co. | integrated oil | |
| and gas | 2.3 |
Top Ten | | 26.1% |
Investment Focus
1 Russell 1000 Index.
2 Dow Jones Wilshire 5000 Index.
3 30-day SEC yield for the fund; annualized dividend yield for the indexes. See the Glossary on pages 21–22.
4 Annualized.
5 For an explanation of R-squared, beta, and other terms used here, see the Glossary on pages 21–22.
6 The holdings listed exclude any temporary cash investments and equity index products.
8
Performance Summary
All of the returns in this report represent past performance, which is not a guarantee of future results that may be achieved by the fund. (Current performance may be lower or higher than the performance data cited. For performance data current to the most recent month-end, visit our website at www.vanguard.com/performance.) Note, too, that both investment returns and principal value can fluctuate widely, so an investor’s shares, when sold, could be worth more or less than their original cost. The returns shown do not reflect taxes that a shareholder would pay on fund distributions or on the sale of fund shares.
Fiscal-Year Total Returns (%): January 31, 1998–July 31, 2008
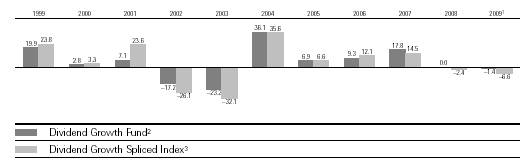
Average Annual Total Returns: Periods Ended June 30, 2008
This table presents average annual total returns through the latest calendar quarter—rather than through the end of the fiscal period. Securities and Exchange Commission rules require that we provide this information.
| Inception Date | One Year | Five Years | Ten Years |
Dividend Growth Fund2 | 5/15/1992 | –7.23% | 9.78% | 3.75% |
1 Six months ended July 31, 2008.
2 Prior to December 6, 2002, the fund was known as Utilities Income Fund. Total returns do not include the account service fee that may be applicable to certain accounts with balances below $10,000.
3 Prior to December 6, 2002, the comparative benchmark was known as the Utilities Composite Index. The index weightings have been: 40% S&P Utilities Index, 40% S&P Telephone Index, and 20% Lehman Utility Bond Index through April 30, 1999; 63.75% S&P Utilities Index, 21.25% S&P Telephone Index, and 15% Lehman Utility Bond Index through March 31, 2000; 75% S&P Utilities Index and 25% S&P Telephone Index through December 31, 2001; 75% S&P Utilities Index and 25% S&P Integrated Telecommunication Services Index through December 6, 2002; and Russell 1000 Index thereafter. Note: See Financial Highlights table on page 14 for dividend and capital gains information.
9
Financial Statements (unaudited)
Statement of Net Assets
As of July 31, 2008
The fund provides a complete list of its holdings four times in each fiscal year, at the quarter-ends. For the second and fourth fiscal quarters, the lists appear in the fund’s semiannual and annual reports to shareholders. For the first and third fiscal quarters, the fund files the lists with the Securities and Exchange Commission on Form N-Q. Shareholders can look up the fund’s Forms N-Q on the SEC’s website at www.sec.gov. Forms N-Q may also be reviewed and copied at the SEC’s Public Reference Room (see the back cover of this report for further information).
| | Market |
| | Value• |
| Shares | ($000) |
Common Stocks (97.2%) | | |
Consumer Discretionary (9.2%) | | |
Staples, Inc. | 1,623,200 | 36,522 |
NIKE, Inc. Class B | 454,200 | 26,653 |
The Walt Disney Co. | 811,700 | 24,635 |
Carnival Corp. | 662,300 | 24,465 |
Toyota Motor Corp. ADR | 196,600 | 16,917 |
McDonald’s Corp. | 266,600 | 15,940 |
| | 145,132 |
Consumer Staples (16.9%) | | |
Walgreen Co. | 995,000 | 34,168 |
Sysco Corp. | 1,194,900 | 33,887 |
Wal-Mart Stores, Inc. | 527,000 | 30,893 |
The Procter & Gamble Co. | 423,200 | 27,711 |
The Coca-Cola Co. | 537,700 | 27,691 |
PepsiCo, Inc. | 412,600 | 27,463 |
Kimberly-Clark Corp. | 412,600 | 23,861 |
Altria Group, Inc. | 1,000,300 | 20,356 |
Hormel Foods Corp. | 553,700 | 20,027 |
General Mills, Inc. | 301,500 | 19,414 |
| | 265,471 |
Energy (12.2%) | | |
Total SA ADR | 679,600 | 51,976 |
ExxonMobil Corp. | 499,200 | 40,150 |
Chevron Corp. | 442,700 | 37,435 |
ConocoPhillips Co. | 434,600 | 35,472 |
Schlumberger Ltd. | 260,700 | 26,487 |
| | 191,520 |
Financials (10.5%) | | |
State Street Corp. | 548,200 | 39,273 |
American Express Co. | 1,052,800 | 39,080 |
Ace Ltd. | 622,400 | 31,556 |
Prudential Financial, Inc. | 443,100 | 30,560 |
Marsh & | | |
McLennan Cos., Inc. | 895,500 | 25,298 |
| | 165,767 |
Health Care (15.2%) | | |
Medtronic, Inc. | 787,900 | 41,625 |
AstraZeneca Group | | |
PLC ADR | 692,300 | 33,611 |
Johnson & Johnson | 446,200 | 30,551 |
Schering-Plough Corp. | 1,410,100 | 29,725 |
Abbott Laboratories | 497,500 | 28,029 |
Eli Lilly & Co. | 558,600 | 26,316 |
Cardinal Health, Inc. | 469,600 | 25,232 |
Wyeth | 598,200 | 24,239 |
| | 239,328 |
Industrials (14.3%) | | |
General Electric Co. | 1,162,200 | 32,879 |
United Parcel Service, Inc. | 502,800 | 31,717 |
Illinois Tool Works, Inc. | 606,300 | 28,405 |
Lockheed Martin Corp. | 251,300 | 26,218 |
Honeywell International Inc. | 472,600 | 24,027 |
The Boeing Co. | 355,449 | 21,722 |
Emerson Electric Co. | 445,100 | 21,676 |
Caterpillar, Inc. | 297,600 | 20,689 |
United Technologies Corp. | 284,200 | 18,183 |
| | 225,516 |
Information Technology (13.8%) | |
Automatic | | |
Data Processing, Inc. | 1,213,700 | 51,837 |
Accenture Ltd. | 873,400 | 36,473 |
International Business | | |
Machines Corp. | 260,000 | 33,275 |
Paychex, Inc. | 966,500 | 31,817 |
Microsoft Corp. | 1,023,200 | 26,317 |
Nokia Corp. ADR | 836,500 | 22,853 |
Linear Technology Corp. | 466,500 | 14,485 |
| | 217,057 |
Materials (1.8%) | | |
Praxair, Inc. | 299,100 | 28,035 |
| | |
Telecommunication Services (1.8%) | |
AT&T Inc. | 917,500 | 28,268 |
| | |
Utilities (1.5%) | | |
Dominion Resources, Inc. | 531,000 | 23,460 |
| | |
Total Common Stocks | | |
(Cost $1,399,042) | | 1,529,554 |
10
| Face | Market |
| Amount | Value• |
| ($000) | ($000) |
Temporary Cash Investment (2.4%) | |
Repurchase Agreement | | |
SBC Warburg Dillon Read | | |
2.160%, 8/1/08 (Dated | | |
7/31/08, Repurchase Value | | |
$37,902,000, collateralized | | |
by Federal National | | |
Mortgage Assn. | | |
5.500%–6.000%, | | |
10/1/32–6/1/38) | | |
(Cost $37,900) | 37,900 | 37,900 |
Total Investments (99.6%) | | |
(Cost $1,436,942) | | 1,567,454 |
Other Assets and Liabilities (0.4%) | |
Other Assets—Note C | | 13,254 |
Liabilities | | (6,845) |
| | 6,409 |
Net Assets (100%) | | |
Applicable to 112,068,564 outstanding | |
$.001 par value shares of beneficial | |
interest (unlimited authorization) | 1,573,863 |
Net Asset Value Per Share | | $14.04 |
At July 31, 2008, net assets consisted of:1 | |
| Amount | Per |
| ($000) | Share |
Paid-in Capital | 1,437,782 | $12.83 |
Overdistributed Net | | |
Investment Income | (274) | — |
Accumulated Net | | |
Realized Gains | 5,843 | .05 |
Unrealized Appreciation | 130,512 | 1.16 |
Net Assets | 1,573,863 | $14.04 |
• See Note A in Notes to Financial Statements.
1 See Note E in Notes to Financial Statements for the tax-basis components of net assets. ADR—American Depositary Receipt.
11
Statement of Operations
| Six Months Ended |
| July 31, 2008 |
| ($000) |
Investment Income | |
Income | |
Dividends | 16,996 |
Interest | 523 |
Security Lending | 124 |
Total Income | 17,643 |
Expenses | |
Investment Advisory Fees—Note B | |
Basic Fee | 859 |
Performance Adjustment | 197 |
The Vanguard Group—Note C | |
Management and Administrative | 1,248 |
Marketing and Distribution | 135 |
Custodian Fees | 7 |
Shareholders’ Reports | 16 |
Trustees’ Fees and Expenses | 1 |
Total Expenses | 2,463 |
Expenses Paid Indirectly—Note D | (22) |
Net Expenses | 2,441 |
Net Investment Income | 15,202 |
Realized Net Gain (Loss) on Investment Securities Sold | 9,149 |
Change in Unrealized Appreciation (Depreciation) of Investment Securities | (53,181) |
Net Increase (Decrease) in Net Assets Resulting from Operations | (28,830) |
12
Statement of Changes in Net Assets
| Six Months Ended | | Year Ended |
| July 31, | | January 31, |
| 2008 | | 2008 |
| ($000) | | ($000) |
Increase (Decrease) in Net Assets | | | |
Operations | | | |
Net Investment Income | 15,202 | | 24,190 |
Realized Net Gain (Loss) | 9,149 | | 63,097 |
Change in Unrealized Appreciation (Depreciation) | (53,181) | | (92,066) |
Net Increase (Decrease) in Net Assets Resulting from Operations | (28,830) | | (4,779) |
Distributions | | | |
Net Investment Income | (15,316) | | (23,790) |
Realized Capital Gain | — | | (8,839) |
Total Distributions | (15,316) | | (32,629) |
Capital Share Transactions—Note G | | | |
Issued | 390,300 | | 350,693 |
Issued in Lieu of Cash Distributions | 13,230 | | 28,508 |
Redeemed | (111,250) | | (258,780) |
Net Increase (Decrease) from Capital Share Transactions | 292,280 | | 120,421 |
Total Increase (Decrease) | 248,134 | | 83,013 |
Net Assets | | | |
Beginning of Period | 1,325,729 | | 1,242,716 |
End of Period1 | 1,573,863 | | 1,325,729 |
1 Net Assets—End of Period includes undistributed (overdistributed) net investment income of ($274,000) and ($160,000).
13
Financial Highlights
| | | | | | |
| Six Months | | | | | |
| Ended | | | | |
For a Share Outstanding | July 31, | Year Ended January 31, |
Throughout Each Period | 2008 | 2008 | 2007 | 2006 | 2005 | 2004 |
Net Asset Value, Beginning of Period | $14.38 | $14.74 | $12.75 | $11.89 | $11.33 | $8.48 |
Investment Operations | | | | | | |
Net Investment Income | .14 | .29 | .26 | .22 | .231 | .18 |
Net Realized and Unrealized Gain (Loss) | | | | | | |
on Investments | (.34) | (.27) | 1.99 | .88 | .55 | 2.86 |
Total from Investment Operations | (.20) | .02 | 2.25 | 1.10 | .78 | 3.04 |
Distributions | | | | | | |
Dividends from Net Investment Income | (.14) | (.28) | (.26) | (.24) | (.22) | (.19) |
Distributions from Realized Capital Gains | — | (.10) | — | — | — | — |
Total Distributions | (.14) | (.38) | (.26) | (.24) | (.22) | (.19) |
Net Asset Value, End of Period | $14.04 | $14.38 | $14.74 | $12.75 | $11.89 | $11.33 |
| | | | | | |
| | | | | | |
Total Return2 | –1.39% | –0.01% | 17.84% | 9.34% | 6.92% | 36.08% |
| | | | | | |
| | | | | | |
Ratios/Supplemental Data | | | | | | |
Net Assets, End of Period (Millions) | $1,574 | $1,326 | $1,243 | $995 | $965 | $818 |
Ratio of Total Expenses to | | | | | | |
Average Net Assets | 0.34%3,4 | 0.32%4 | 0.38%4 | 0.37%4 | 0.37%4 | 0.40% |
Ratio of Net Investment Income to | | | | | | |
Average Net Assets | 2.11%3 | 1.91% | 1.93% | 1.85% | 2.04%1 | 1.84% |
Portfolio Turnover Rate | 27%3 | 36% | 41% | 16% | 20% | 23% |
1 Net investment income per share and the ratio of net investment income to average net assets include $0.03 and 0.28%, respectively, resulting from a special dividend from Microsoft Corp. in November 2004.
2 Total returns do not include the account service fee that may be applicable to certain accounts with balances below $10,000.
3 Annualized.
4 Includes performance-based investment advisory fee increases (decreases) of 0.03%, 0.00%, 0.01%, 0.01%, and 0.01%. See accompanying Notes, which are an integral part of the Financial Statements.
14
Notes to Financial Statements
Vanguard Dividend Growth Fund is registered under the Investment Company Act of 1940 as an open-end investment company, or mutual fund. The fund files reports with the SEC under the company name Vanguard Specialized Funds.
A. The following significant accounting policies conform to generally accepted accounting principles for U.S. mutual funds. The fund consistently follows such policies in preparing its financial statements.
1. Security Valuation: Securities are valued as of the close of trading on the New York Stock Exchange (generally 4 p.m., Eastern time) on the valuation date. Equity securities are valued at the latest quoted sales prices or official closing prices taken from the primary market in which each security trades; such securities not traded on the valuation date are valued at the mean of the latest quoted bid and asked prices. Securities for which market quotations are not readily available, or whose values have been materially affected by events occurring before the fund’s pricing time but after the close of the securities’ primary markets, are valued by methods deemed by the board of trustees to represent fair value. Temporary cash investments acquired over 60 days to maturity are valued using the latest bid prices or using valuations based on a matrix system (which considers such factors as security prices, yields, maturities, and ratings), both as furnished by independent pricing services. Other temporary cash investments are valued at amortized cost, which approximates market value.
2. Repurchase Agreements: The fund may invest in repurchase agreements. Securities pledged as collateral for repurchase agreements are held by a custodian bank until the agreements mature. Each agreement requires that the market value of the collateral be sufficient to cover payments of interest and principal; however, in the event of default or bankruptcy by the other party to the agreement, retention of the collateral may be subject to legal proceedings.
3. Federal Income Taxes: The fund intends to continue to qualify as a regulated investment company and distribute all of its taxable income. Management has analyzed the fund’s tax positions taken on federal income tax returns for all open tax years (tax years ended January 31, 2005–2008) and for the period ended July 31, 2008, and has concluded that no provision for federal income tax is required in the fund’s financial statements.
4. Distributions: Distributions to shareholders are recorded on the ex-dividend date.
5. Security Lending: The fund may lend its securities to qualified institutional borrowers to earn additional income. Security loans are required to be secured at all times by collateral at least equal to the market value of securities loaned. The fund invests cash collateral received in Vanguard Market Liquidity Fund, and records a liability for the return of the collateral, during the period the securities are on loan. Security lending income represents the income earned on investing cash collateral, less expenses associated with the loan.
6. Other: Dividend income is recorded on the ex-dividend date. Interest income is accrued daily. Security transactions are accounted for on the date securities are bought or sold. Costs used to determine realized gains (losses) on the sale of investment securities are those of the specific securities sold.
B. Wellington Management Company, LLP, provides investment advisory services to the fund for a fee calculated at an annual percentage rate of average net assets. The basic fee is subject to quarterly adjustments based on the fund’s performance for the preceding three years relative to the Russell 1000 Index. For the six months ended July 31, 2008, the investment advisory fee represented an effective annual basic rate of 0.12% of the fund’s average net assets before an increase of $197,000 (0.03%) based on performance.
15
C. The Vanguard Group furnishes at cost corporate management, administrative, marketing, and distribution services. The costs of such services are allocated to the fund under methods approved by the board of trustees. The fund has committed to provide up to 0.40% of its net assets in capital contributions to Vanguard. At July 31, 2008, the fund had contributed capital of $133,000 to Vanguard (included in Other Assets), representing 0.01% of the fund’s net assets and 0.13% of Vanguard’s capitalization. The fund’s trustees and officers are also directors and officers of Vanguard.
D. The fund has asked its investment advisor to direct certain security trades, subject to obtaining the best price and execution, to brokers who have agreed to rebate to the fund part of the commissions generated. Such rebates are used solely to reduce the fund’s management and administrative expenses. The fund’s custodian bank has also agreed to reduce its fees when the fund maintains cash on deposit in the non-interest-bearing custody account. For the six months ended July 31, 2008, these arrangements reduced the fund’s management and administrative expenses by $21,000 and custodian fees by $1,000.
E. Distributions are determined on a tax basis and may differ from net investment income and realized capital gains for financial reporting purposes. Differences may be permanent or temporary. Permanent differences are reclassified among capital accounts in the financial statements to reflect their tax character. Temporary differences arise when certain items of income, expense, gain, or loss are recognized in different periods for financial statement and tax purposes; these differences will reverse at some time in the future. Differences in classification may also result from the treatment of short-term gains as ordinary income for tax purposes. The fund’s tax-basis capital gains and losses are determined only at the end of each fiscal year.
At July 31, 2008, the cost of investment securities for tax purposes was $1,436,942,000. Net unrealized appreciation of investment securities for tax purposes was $130,512,000, consisting of unrealized gains of $184,928,000 on securities that had risen in value since their purchase and $54,416,000 in unrealized losses on securities that had fallen in value since their purchase.
F. During the six months ended July 31, 2008, the fund purchased $468,455,000 of investment securities and sold $189,352,000 of investment securities, other than temporary cash investments.
G. Capital shares issued and redeemed were:
| Six Months Ended | | Year Ended |
| July 31, 2008 | | January 31, 2008 |
| Shares | | Shares |
| (000) | | (000) |
Issued | 26,673 | | 23,079 |
Issued In Lieu of Cash Distributions | 947 | | 1,863 |
Redeemed | (7,743) | | (17,075) |
Net Increase (Decrease) in Shares Outstanding | 19,877 | | 7,867 |
16
H. In September 2006, the Financial Accounting Standards Board issued Statement of Financial Accounting Standards No. 157 (“FAS 157”), “Fair Value Measurements.” FAS 157 establishes a framework for measuring fair value and expands disclosures about fair value measurements in financial statements, effective for the fund’s current fiscal period.
The various inputs that may be used to determine the value of the fund’s investments are summarized in three broad levels. The inputs or methodologies used for valuing securities are not necessarily an indication of the risk associated with investing in those securities.
Level 1—Quoted prices in active markets for identical securities.
Level 2—Other significant observable inputs (including quoted prices for similar securities, interest rates, prepayment speeds, credit risk, etc.).
Level 3—Significant unobservable inputs (including the fund’s own assumptions used to determine the fair value of investments).
The following table summarizes the fund’s investments as of July 31, 2008, based on the inputs used to value them:
| Investments |
| in Securities |
Valuation Inputs | ($000) |
Level 1—Quoted prices | 1,529,554 |
Level 2—Other significant observable inputs | 37,900 |
Level 3—Significant unobservable inputs | — |
Total | 1,567,454 |
17
About Your Fund’s Expenses
As a shareholder of the fund, you incur ongoing costs, which include costs for portfolio management, administrative services, and shareholder reports (like this one), among others. Operating expenses, which are deducted from a fund’s gross income, directly reduce the investment return of the fund.
A fund’s expenses are expressed as a percentage of its average net assets. This figure is known as the expense ratio. The following examples are intended to help you understand the ongoing costs (in dollars) of investing in your fund and to compare these costs with those of other mutual funds. The examples are based on an investment of $1,000 made at the beginning of the period shown and held for the entire period.
The table below illustrates your fund’s costs in two ways:
• Based on actual fund return. This section helps you to estimate the actual expenses that you paid over the period. The “Ending Account Value” shown is derived from the fund’s actual return, and the third column shows the dollar amount that would have been paid by an investor who started with $1,000 in the fund. You may use the information here, together with the amount you invested, to estimate the expenses that you paid over the period.
To do so, simply divide your account value by $1,000 (for example, an $8,600 account value divided by $1,000 = 8.6), then multiply the result by the number given for your fund under the heading “Expenses Paid During Period.”
• Based on hypothetical 5% yearly return. This section is intended to help you compare your fund’s costs with those of other mutual funds. It assumes that the fund had a yearly return of 5% before expenses, but that the expense ratio is unchanged. In this case—because the return used is not the fund’s actual return—the results do not apply to your investment. The example is useful in making comparisons because the Securities and Exchange Commission requires all mutual funds to calculate expenses based on a 5% return. You can assess your fund’s costs by comparing this hypothetical example with the hypothetical examples that appear in shareholder reports of other funds.
Six Months Ended July 31, 2008 | | | |
| Beginning | Ending | Expenses |
| Account Value | Account Value | Paid During |
Dividend Growth Fund | 1/31/2008 | 7/31/2008 | Period1 |
Based on Actual Fund Return | $1,000.00 | $986.14 | $1.68 |
Based on Hypothetical 5% Yearly Return | 1,000.00 | 1,023.17 | 1.71 |
Note that the expenses shown in the table are meant to highlight and help you compare ongoing costs only and do not reflect transaction costs incurred by the fund for buying and selling securities. Further, the expenses do not include the account service fee described in the prospectus. If such a fee were applied to your account, your costs would be higher. Your fund does not charge transaction fees, such as purchase or redemption fees, nor does it carry a “sales load.”
1 These calculations are based on expenses incurred in the most recent six-month period. The fund’s annualized six-month expense ratio for that period is 0.34%. The dollar amounts shown as “Expenses Paid” are equal to the annualized expense ratio multiplied by the average account value over the period, multiplied by the number of days in the most recent six-month period, then divided by the number of days in the most recent 12-month period.
18
The calculations assume no shares were bought or sold during the period. Your actual costs may have been higher or lower, depending on the amount of your investment and the timing of any purchases or redemptions.
You can find more information about the fund’s expenses, including annual expense ratios, in the Financial Statements section of this report. For additional information on operating expenses and other shareholder costs, please refer to your fund’s current prospectus.
19
Trustees Approve Advisory Agreement
The board of trustees of Vanguard Dividend Growth Fund has renewed the fund’s investment advisory agreement with Wellington Management Company, LLP. The board determined that the retention of Wellington Management was in the best interests of the fund and its shareholders.
The board based its decision upon an evaluation of the advisor’s investment staff, portfolio management process, and performance. The trustees considered the factors discussed below, among others. However, no single factor determined whether the board approved the agreement. Rather, it was the totality of the circumstances that drove the board’s decision.
Nature, extent, and quality of services
The board considered the quality of the fund’s investment management over both the short and long term, and took into account the organizational depth and stability of the advisor.
The board noted that Wellington Management, founded in 1928, is among the nation’s oldest and most respected institutional managers. The firm has advised the fund since its inception in 1992. Donald J. Kilbride, who manages the fund, has managed investment portfolios since 1996. The portfolio manager is backed by a long-tenured team of research analysts who conduct detailed fundamental analysis of industries and companies. Wellington Management has provided high-quality advisory services for the fund.
The board concluded that Wellington Management’s experience, stability, depth, and performance among other factors, warranted continuation of the advisory agreement.
Investment performance
The board considered the short- and long-term performance of the fund, including any periods of outperformance or underperformance of a relevant benchmark and peer group. The board noted that the fund’s reconstituted dividend growth mandate began in 2002, and concluded that the fund’s performance since then has been competitive versus its benchmark, the Russell 1000 Index, and the average results for its peer group. Information about the fund’s most recent performance can be found in the Performance Summary section of this report.
Cost
The board concluded that the fund’s expense ratio was far below the average expense ratio charged by funds in its peer group. The board noted that the fund’s advisory fee rate was also well below the peer-group average. Information about the fund’s expense ratio appears in the About Your Fund’s Expenses section of this report as well as in the Financial Statements section, which also includes information about the advisory fee rate.
The board did not consider profitability of Wellington Management in determining whether to approve the advisory fee, because Wellington Management is independent of Vanguard and the advisory fee is the result of arm’s-length negotiations.
The benefit of economies of scale
The board concluded that the fund’s shareholders benefit from economies of scale because of breakpoints in the fund’s advisory fee schedule. The breakpoints reduce the effective rate of the fee as the fund’s assets increase.
The board will consider whether to renew the advisory agreement again after a one-year period.
20
Glossary
Beta. A measure of the magnitude of a fund’s past share-price fluctuations in relation to the ups and downs of a given market index. The index is assigned a beta of 1.00. Compared with a given index, a fund with a beta of 1.20 typically would have seen its share price rise or fall by 12% when the index rose or fell by 10%. For this report, beta is based on returns over the past 36 months for both the fund and the index. Note that a fund’s beta should be reviewed in conjunction with its R-squared (see definition below). The lower the R-squared, the less correlation there is between the fund and the index, and the less reliable beta is as an indicator of volatility.
Earnings Growth Rate. The average annual rate of growth in earnings over the past five years for the stocks now in a fund.
Equity Exposure. A measure that reflects a fund’s investments in stocks and stock futures. Any holdings in short-term reserves are excluded.
Expense Ratio. The percentage of a fund’s average net assets used to pay its annual administrative and advisory expenses. These expenses directly reduce returns to investors.
Foreign Holdings. The percentage of a fund represented by stocks or depositary receipts of companies based outside the United States.
Inception Date. The date on which the assets of a fund (or one of its share classes) are first invested in accordance with the fund’s investment objective. For funds with a subscription period, the inception date is the day after that period ends. Investment performance is measured from the inception date.
Median Market Cap. An indicator of the size of companies in which a fund invests; the midpoint of market capitalization (market price x shares outstanding) of a fund’s stocks, weighted by the proportion of the fund’s assets invested in each stock. Stocks representing half of the fund’s assets have market capitalizations above the median, and the rest are below it.
Price/Book Ratio. The share price of a stock divided by its net worth, or book value, per share. For a fund, the weighted average price/book ratio of the stocks it holds.
Price/Earnings Ratio. The ratio of a stock’s current price to its per-share earnings over the past year. For a fund, the weighted average P/E of the stocks it holds. P/E is an indicator of market expectations about corporate prospects; the higher the P/E, the greater the expectations for a company’s future growth.
R-Squared. A measure of how much of a fund’s past returns can be explained by the returns from the market in general, as measured by a given index. If a fund’s total returns were precisely synchronized with an index’s returns, its R-squared would be 1.00. If the fund’s returns bore no relationship to the index’s returns, its R-squared would be 0. For this report, R-squared is based on returns over the past 36 months for both the fund and the index.
Return on Equity. The annual average rate of return generated by a company during the past five years for each dollar of shareholder’s equity (net income divided by shareholder’s equity). For a fund, the weighted average return on equity for the companies whose stocks it holds.
Short-Term Reserves. The percentage of a fund invested in highly liquid, short-term securities that can be readily converted to cash.
21
Turnover Rate. An indication of the fund’s trading activity. Funds with high turnover rates incur higher transaction costs and may be more likely to distribute capital gains (which may be taxable to investors). The turnover rate excludes in-kind transactions, which have minimal impact on costs.
Yield. A fund’s 30-day SEC yield is derived using a formula specified by the U.S. Securities and Exchange Commission. Under the formula, data related to the fund’s security holdings in the previous 30 days are used to calculate the fund’s hypothetical net income for that period, which is then annualized and divided by the fund’s estimated average net assets over the calculation period. For the purposes of this calculation, a security’s income is based on its current market yield to maturity (in the case of bonds) or its projected dividend yield (for stocks). Because the SEC yield represents hypothetical annualized income, it will differ—at times significantly—from the fund’s actual experience. As a result, the fund’s income distributions may be higher or lower than implied by the SEC yield.
22
This page intentionally left blank.
The People Who Govern Your Fund
The trustees of your mutual fund are there to see that the fund is operated and managed in your best interests since, as a shareholder, you are a part owner of the fund. Your fund’s trustees also serve on the board of directors of The Vanguard Group, Inc., which is owned by the Vanguard funds and provides services to them on an at-cost basis.
A majority of Vanguard’s board members are independent, meaning that they have no affiliation with Vanguard or the funds they oversee, apart from the sizable personal investments they have made as private individuals.
Our independent board members bring distinguished backgrounds in business, academia, and public service to their task of working with Vanguard officers to establish the policies and oversee the activities of the funds. Among board members’ responsibilities are selecting investment advisors for the funds; monitoring fund operations, performance, and costs; reviewing contracts; nominating and selecting new trustees/directors; and electing Vanguard officers.
Each trustee serves a fund until its termination; or until the trustee’s retirement, resignation, or death; or otherwise as specified in the fund’s organizational documents. Any trustee may be removed at a shareholders’ meeting by a vote representing two-thirds of the net asset value of all shares of the fund together with shares of other Vanguard funds organized within the same trust. The table on these two pages shows information for each trustee and executive officer of the fund. The mailing address of the trustees and officers is P.O. Box 876, Valley Forge, PA 19482.
Chairman of the Board, Chief Executive Officer, and Trustee
John J. Brennan1
Born 1954 Principal Occupation(s) During the Past Five Years: Chairman of the Board, Chief Executive Trustee Since May 1987; Officer, and Director/Trustee of The Vanguard Group, Inc., and of each of the investment Chairman of the Board and companies served by The Vanguard Group; Director of Vanguard Marketing Corporation. Chief Executive Officer 156 Vanguard Funds Overseen
Independent Trustees
Charles D. Ellis
Born 1937 Principal Occupation(s) During the Past Five Years: Applecore Partners (pro bono ventures Trustee Since January 2001 in education); Senior Advisor to Greenwich Associates (international business strategy 156 Vanguard Funds Overseen consulting); Successor Trustee of Yale University; Overseer of the Stern School of Business at New York University; Trustee of the Whitehead Institute for Biomedical Research.
Emerson U. Fullwood
Born 1948 Principal Occupation(s) During the Past Five Years: Executive Chief Staff and Marketing Trustee Since January 2008 Officer for North America since 2004 and Corporate Vice President of Xerox Corporation 156 Vanguard Funds Overseen (photocopiers and printers); Director of SPX Corporation (multi-industry manufacturing), of the United Way of Rochester, and of the Boy Scouts of America.
Rajiv L. Gupta
Born 1945 Principal Occupation(s) During the Past Five Years: Chairman, President, and Trustee Since December 20012 Chief Executive Officer of Rohm and Haas Co. (chemicals); Board Member of 156 Vanguard Funds Overseen the American Chemistry Council; Director of Tyco International, Ltd. (diversified manufacturing and services) since 2005.
Amy Gutmann
Born 1949 Principal Occupation(s) During the Past Five Years: President of the University of
Trustee Since June 2006 Pennsylvania since 2004; Professor in the School of Arts and Sciences, Annenberg School 156 Vanguard Funds Overseen for Communication, and Graduate School of Education of the University of Pennsylvania since 2004; Provost (2001–2004) and Laurance S. Rockefeller Professor of Politics and the University Center for Human Values (1990–2004), Princeton University; Director of Carnegie Corporation of New York since 2005 and of Schuylkill River Development Corporation and Greater Philadelphia Chamber of Commerce since 2004; Trustee of the National Constitution Center since 2007.
JoAnn Heffernan Heisen
Born 1950 Principal Occupation(s) During the Past Five Years: Corporate Vice President and Trustee Since July 1998 Chief Global Diversity Officer since 2006, Vice President and Chief Information 156 Vanguard Funds Overseen Officer (1997–2005), and Member of the Executive Committee of Johnson & Johnson (pharmaceuticals/consumer products); Director of the University Medical Center at Princeton and Women’s Research and Education Institute.
André F. Perold
Born 1952 Principal Occupation(s) During the Past Five Years: George Gund Professor of Finance Trustee Since December 2004 and Banking, Harvard Business School; Senior Associate Dean and Director of Faculty 156 Vanguard Funds Overseen Recruiting, Harvard Business School; Director and Chairman of UNX, Inc. (equities trading firm); Chair of the Investment Committee of HighVista Strategies LLC (private investment firm) since 2005.
Alfred M. Rankin, Jr.
Born 1941 Principal Occupation(s) During the Past Five Years: Chairman, President, Chief Executive Trustee Since January 1993 Officer, and Director of NACCO Industries, Inc. (forklift trucks/housewares/lignite); Director 156 Vanguard Funds Overseen of Goodrich Corporation (industrial products/aircraft systems and services).
J. Lawrence Wilson
Born 1936 Principal Occupation(s) During the Past Five Years: Retired Chairman and Chief Executive Trustee Since April 1985 Officer of Rohm and Haas Co. (chemicals); Director of Cummins Inc. (diesel engines) and 156 Vanguard Funds Overseen AmerisourceBergen Corp. (pharmaceutical distribution); Trustee of Vanderbilt University and of Culver Educational Foundation.
Executive Officers1
Thomas J. Higgins
Born 1957 Principal Occupation(s) During the Past Five Years: Principal of The Vanguard Group, Inc.; Treasurer Since July 1998 Treasurer of each of the investment companies served by The Vanguard Group. 156 Vanguard Funds Overseen
F. William McNabb III
Born 1957 Principal Occupation(s) During the Past Five Years: President of The Vanguard Group, Inc., President Since March 2008 and of each of the investment companies served by The Vanguard Group since 2008; 156 Vanguard Funds Overseen Director of Vanguard Marketing Corporation; Managing Director of The Vanguard Group (1995–2008).
Heidi Stam
Born 1956 Principal Occupation(s) During the Past Five Years: Managing Director of The Vanguard Secretary Since July 2005 Group, Inc., since 2006; General Counsel of The Vanguard Group since 2005; Secretary of 156 Vanguard Funds Overseen The Vanguard Group, and of each of the investment companies served by The Vanguard Group, since 2005; Director and Senior Vice President of Vanguard Marketing Corporation since 2005; Principal of The Vanguard Group (1997–2006).
Vanguard Senior Management Team
Vanguard Senior Management Team | | |
| | | |
R. Gregory Barton | Kathleen C. Gubanich | Michael S. Miller | Glenn W. Reed |
Mortimer J. Buckley | Paul A. Heller | Ralph K. Packard | George U. Sauter |
Founder
John C. Bogle
Chairman and Chief Executive Officer, 1974–1996
1 Officers of the funds are “interested persons” as defined in the Investment Company Act of 1940.
2 December 2002 for Vanguard Equity Income Fund, Vanguard Growth Equity Fund, the Vanguard Municipal Bond Funds, and the Vanguard State Tax-Exempt Funds.
More information about the trustees is in the Statement of Additional Information, available from The Vanguard Group.

P.O. Box 2600
Valley Forge, PA 19482-2600
Connect with Vanguard® > www.vanguard.com
Fund Information > 800-662-7447 | Vanguard, Connect with Vanguard, and the ship logo |
| are trademarks of The Vanguard Group, Inc. |
Direct Investor Account Services > 800-662-2739 | |
| All other marks are the exclusive property of their |
Institutional Investor Services > 800-523-1036 | respective owners. |
| |
Text Telephone for People | |
With Hearing Impairment > 800-952-3335 | All comparative mutual fund data are from Lipper Inc. |
| or Morningstar, Inc., unless otherwise noted. |
| |
| |
| You can obtain a free copy of Vanguard’s proxy voting |
| guidelines by visiting our website, www.vanguard.com, |
This material may be used in conjunction | and searching for “proxy voting guidelines,” or by |
with the offering of shares of any Vanguard | calling Vanguard at 800-662-2739. The guidelines are |
fund only if preceded or accompanied by | also available from the SEC’s website, www.sec.gov. |
the fund’s current prospectus. | In addition, you may obtain a free report on how your |
| fund voted the proxies for securities it owned during |
| the 12 months ended June 30. To get the report, visit |
| either www.vanguard.com or www.sec.gov. |
| |
| |
| |
| You can review and copy information about your fund |
| at the SEC’s Public Reference Room in Washington, D.C. |
| To find out more about this public service, call the SEC |
| at 202-551-8090. Information about your fund is also |
| available on the SEC’s website, and you can receive |
| copies of this information, for a fee, by sending a |
| request in either of two ways: via e-mail addressed to |
| publicinfo@sec.gov or via regular mail addressed to the |
| Public Reference Section, Securities and Exchange |
| Commission, Washington, DC 20549-0102. |
| |
| |
| |
| |
| |
| © 2008 The Vanguard Group, Inc. |
| All rights reserved. |
| Vanguard Marketing Corporation, Distributor. |
| |
| Q572 092008 |
> The Investor Shares of Vanguard Dividend Appreciation Index Fund returned –4.6% for the fiscal half-year ended July 31, 2008.
> The fund’s performance during the period was in line with its benchmark and was well ahead of the average return of its peer group.
> The information technology and consumer staples sectors were the chief contributors to the fund’s return, while financial and industrial stocks detracted the most from performance.
Contents | |
| |
Your Fund’s Total Returns | 1 |
Chairman’s Letter | 2 |
Fund Profile | 7 |
Performance Summary | 8 |
Financial Statements | 9 |
About Your Fund’s Expenses | 20 |
Trustees Approve Advisory Arrangement | 22 |
Glossary | 23 |
Please note: The opinions expressed in this report are just that—informed opinions. They should not be considered promises or advice. Also, please keep in mind that the information and opinions cover the period through the date on the cover of this report. Of course, the risks of investing in your fund are spelled out in the prospectus.
Your Fund’s Total Returns
Six Months Ended July 31, 2008 | | |
| Ticker | Total |
| Symbol | Returns |
Vanguard Dividend Appreciation Index Fund | | |
Investor Shares | VDAIX | –4.6% |
ETF Shares1 | VIG | |
Market Price | | –4.1 |
Net Asset Value | | –4.6 |
Dividend Achievers Select Index | | –4.5 |
Average Large-Cap Core Fund2 | | –6.6 |
Your Fund’s Performance at a Glance |
January 31, 2008—July 31, 2008 |
| | | Distributions Per Share |
| Starting | Ending | Income | Capital |
| Share Price | Share Price | Dividends | Gains |
Vanguard Dividend Appreciation Index Fund | | | | |
Investor Shares | $21.40 | $20.23 | $0.185 | $0.000 |
ETF Shares | 53.48 | 50.55 | 0.501 | 0.000 |
1 Vanguard ETF Shares are traded on the American Stock Exchange and are available only through brokers. The table shows the ETF returns based on both the AMEX market price and the net asset value for a share. U.S. Pat. No. 6,879,964 B2; 7,337,138.
2 Derived from data provided by Lipper Inc.
1

Chairman’s Letter
Dear Shareholder,
In a challenging market, Vanguard Dividend Appreciation Index Fund’s Investor Shares returned –4.6% for the fiscal half-year ended July 31, 2008.
In a market buffeted by problems in the housing and credit markets, the fund’s performance closely tracked that of its benchmark, the Dividend Achievers Select Index, and outpaced—by a wide margin—the average return of large-cap core funds.
The fund produced strong returns in the information technology and consumer staples sectors, but its overall gains were not enough to offset losses in the financial and industrial groups.
Stocks rode a bumpy path to disappointing results
U.S. stocks struggled during the six months, a period of pronounced volatility in the financial markets. Continued weakness in the housing market, record oil prices, rising unemployment, and an uptick in inflation all weighed on stocks and set a downbeat tone.
The U.S. market performed well in April and May, but those returns were bookended by declines earlier and later in the period. June was a particularly difficult month; the broad U.S. stock market declined –8.2%, the worst single-month return in more than five years.
2
For the half-year, the broad U.S. stock market returned –5.9%. Investors favored small-capitalization stocks over large- and mid-caps, and growth stocks over their value-oriented counterparts. International stocks also experienced high levels of volatility, and returned –3.8%.
Bond investors remained cautious in the wake of the subprime crisis
In the extensive fallout from the sub-prime-mortgage crisis, bond investors continued to prefer the safety of short-term, high-quality issues—most notably U.S. Treasury securities. During the period, bonds outpaced stocks, but registered negative returns. The broad taxable bond market returned –0.6%. Municipal bonds, which experienced a spike in volatility, returned –0.9%.
During the half-year, the Federal Reserve Board lowered its target for the federal funds rate twice, reducing it by a full percentage point, to 2.00%. At its June meeting (and again at its August meeting after the end of the fund’s fiscal period), the Fed voted to leave the target rate unchanged, signaling a growing concern about near-term inflation.
Heavy weighting in financials served as a drag on performance
The stock market’s decline during the six months led to broad weakness across sectors. Half of the ten sectors in the Dividend Appreciation Index Fund produced negative returns, largely as a result of the slowing U.S. economy, constrained consumer spending, and continued turmoil in the credit markets.
Market Barometer | | | |
| Total Returns |
| Periods Ended July 31, 2008 |
| Six Months | One Year | Five Years1 |
Stocks | | | |
Russell 1000 Index (Large-caps) | –6.6% | –10.6% | 7.5% |
Russell 2000 Index (Small-caps) | 0.9 | –6.7 | 9.8 |
Dow Jones Wilshire 5000 Index (Entire market) | –5.9 | –10.2 | 8.1 |
MSCI All Country World Index ex USA (International) | –3.8 | –9.3 | 17.9 |
| | | |
| | | |
Bonds | | | |
Lehman U.S. Aggregate Bond Index (Broad taxable market) | –0.6% | 6.2% | 4.6% |
Lehman Municipal Bond Index | –0.9 | 2.8 | 4.3 |
Citigroup 3-Month Treasury Bill Index | 1.0 | 3.1 | 3.1 |
| | | |
| | | |
CPI | | | |
Consumer Price Index | 4.2% | 5.6% | 3.6% |
| | | |
| | | |
| | | |
| | | |
1 Annualized. | | | |
3
The fund’s financial sector delivered the poorest performance of all the sectors for the period, shaving nearly 4 percentage points from the total return. During the six months ended July 31, the sector suffered steep declines in performance by companies such as American International Group (–52%) and Lehman Brothers Holdings (–73%).
The fund’s industrial sector also was hit hard during the period. Market bellwether General Electric suffered from slumping demand for its industrial business, which it recently said it plans to spin off. Airplane parts manufacturer United Technologies also reported declining returns owing to weak sales.
In contrast, one of the fund’s smaller sectors by weighting, information technology, was the standout performer, with a 16% return. Companies such as International Business Machines and payroll processing giant Automatic Data Processing reported stellar advances (about +20% and +8%, respectively) as technology sales to businesses showed strength despite the shaky financial environment. Consumer staples, the fund’s largest sector, also was strong as consumer demand for basic food and beverage products as well as household goods remained strong. Among companies with the biggest gains for the period were Wal-Mart Stores and Anheuser-Busch.
Annualized Expense Ratios1 | | | |
Your Fund Compared With Its Peer Group | | | |
| | | Average |
| Investor | | Large-Cap |
| Shares | ETF Shares | Core Fund |
Dividend Appreciation Index Fund | 0.35% | 0.23% | 1.29% |
1 Fund expense ratios reflect the six months ended July 31, 2008. Peer-group expense ratio is derived from data provided by Lipper Inc. and captures information through year-end 2007.
4
As its name suggests, the Dividend Appreciation Index Fund’s objective is to capture the return of an index made up of stocks with a history of increasing dividends. A sizable number of the fund’s stock holdings had a 20% or more increase in dividends during the 12 months ended July 31.
Diversification and perspective are key in volatile markets
Volatility in the markets combined with disappointing returns during the past six months may be disheartening for some investors.
At Vanguard, we encourage you to avoid focusing on the daily ups and downs in the market; instead, take a long-term perspective on your invest-ments. The best way to develop an investing strategy for the long run is to select a diversified mix of stock, bond, and money market mutual funds that fits your goals, time horizon, and tolerance for risk.
Vanguard Dividend Appreciation Index Fund, with its low costs and its emphasis on companies with track records of dividend growth, can be a valuable part of such a diversified, long-term investment program.
When I wrote to you six months ago, Vanguard’s board had elected F. William McNabb III as the fund’s president and designated him to succeed me as chief executive officer. The board has since announced that Bill will assume the chief executive role on August 31. Bill and the rest of our team will serve you and our other clients extremely well in the years ahead.
Thank you for investing with Vanguard.
Sincerely,

John J. Brennan
Chairman and Chief Executive Officer
August 13, 2008
5
Vanguard Dividend Appreciation ETF |
Premium/Discount: April 21, 20061–July 31, 2008 |
| | | | |
| Market Price Above or | Market Price Below |
| Equal to Net Asset Value | Net Asset Value |
| Number | Percentage | | Number | Percentage |
Basis Point Differential2 | of Days | of Total Days | | of Days | of Total Days |
0–24.9 | 264 | 45.82% | | 298 | 51.92% |
25–49.9 | 4 | 0.70 | | 3 | 0.52 |
50–74.9 | 4 | 0.70 | | 0 | 0.00 |
75–100.0 | 1 | 0.17 | | 0 | 0.00 |
>100.0 | 1 | 0.17 | | 0 | 0.00 |
Total | 274 | 47.56% | | 301 | 52.44% |
| | | | | | |
1 Inception.
2 One basis point equals 1/100 of a percentage point.
6
Fund Profile
As of July 31, 2008
Portfolio Characteristics | | |
| | Target | Broad |
| Fund | Index1 | Index2 |
Number of Stocks | 213 | 213 | 4,724 |
Median Market Cap | $62.3B | $62.3B | $31.5B |
Price/Earnings Ratio | 15.6x | 15.6x | 16.6x |
Price/Book Ratio | 2.9x | 2.9x | 2.3x |
Yield3 | | 2.5% | 2.1% |
Investor Shares | 1.8% | | |
ETF Shares | 2.1% | | |
Return on Equity | 24.5% | 24.4% | 19.7% |
Earnings Growth Rate | 15.2% | 15.2% | 18.5% |
Foreign Holdings | 0.0% | 0.0% | 0.0% |
Turnover Rate4 | 6% | — | — |
Expense Ratio4 | | — | — |
Investor Shares | 0.35% | | |
ETF Shares | 0.23% | | |
Short-Term Reserves | 0.0% | — | — |
Sector Diversification (% of equity exposure) |
| | Target | Broad |
| Fund | Index1 | Index2 |
Consumer Discretionary | 9.0% | 9.0% | 8.7% |
Consumer Staples | 24.9 | 24.9 | 9.6 |
Energy | 8.5 | 8.5 | 13.6 |
Financials | 11.3 | 11.3 | 16.2 |
Health Care | 13.6 | 13.6 | 12.5 |
Industrials | 15.8 | 15.8 | 11.9 |
Information Technology | 6.7 | 6.7 | 16.3 |
Materials | 4.6 | 4.6 | 4.3 |
Telecommunication | | | |
Services | 3.6 | 3.6 | 2.9 |
Utilities | 2.0 | 2.0 | 4.0 |
Ten Largest Holdings5 (% of total net assets) |
| | |
International Business | | |
Machines Corp. | computer hardware | 5.0% |
Wal-Mart Stores, Inc. | hypermarkets | |
| and super centers | 5.0 |
Johnson & Johnson | pharmaceuticals | 4.6 |
Chevron Corp. | integrated oil | |
| and gas | 4.3 |
The Procter & Gamble Co. | household products | 4.2 |
ExxonMobil Corp. | integrated oil | |
| and gas | 4.0 |
The Coca-Cola Co. | soft drinks | 3.7 |
PepsiCo, Inc. | soft drinks | 3.6 |
General Electric Co. | industrial | |
| conglomerate | 3.4 |
AT&T Inc. | integrated | |
| telecommunication | |
| services | 3.4 |
Top Ten | | 41.2% |
Investment Focus
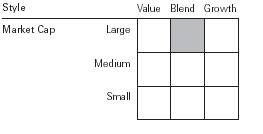
1 Dividend Achievers Select Index.
2 Dow Jones Wilshire 5000 Index.
3 30-day SEC yield for the fund; annualized dividend yield for the indexes. See the Glossary on page 23.
4 Annualized.
5 The holdings listed exclude any temporary cash investments and equity index products.
7
Performance Summary
All of the returns in this report represent past performance, which is not a guarantee of future results that may be achieved by the fund. (Current performance may be lower or higher than the performance data cited. For performance data current to the most recent month-end, visit our website at www.vanguard.com/performance.) Note, too, that both investment returns and principal value can fluctuate widely, so an investor’s shares, when sold, could be worth more or less than their original cost. The returns shown do not reflect taxes that a shareholder would pay on fund distributions or on the sale of fund shares.
Fiscal-Year Total Returns (%): April 27, 2006–July 31, 2008
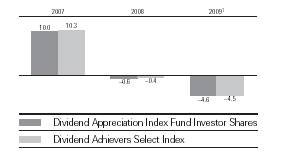
Average Annual Total Returns: Periods Ended June 30, 2008
This table presents average annual total returns through the latest calendar quarter—rather than through the end of the fiscal period. Securities and Exchange Commission rules require that we provide this information.
| | | Since |
| Inception Date | One Year | Inception |
Investor Shares2 | 4/27/2006 | –9.77% | 1.47% |
ETF Shares | 4/21/2006 | | |
Market Price | | –9.61 | 1.69 |
Net Asset Value | | –9.68 | 1.71 |
1 Six months ended July 31, 2008.
2 Total returns do not include the account service fee that may be applicable to certain accounts with balances below $10,000. Note: See Financial Highlights tables on pages 15–16 for dividend and capital gains information.
8
Financial Statements (unaudited)
Statement of Net Assets
As of July 31, 2008
The fund provides a complete list of its holdings four times in each fiscal year, at the quarter-ends. For the second and fourth fiscal quarters, the lists appear in the fund’s semiannual and annual reports to shareholders. For the first and third fiscal quarters, the fund files the lists with the Securities and Exchange Commission on Form N-Q. Shareholders can look up the fund’s Forms N-Q on the SEC’s website at www.sec.gov. Forms N-Q may also be reviewed and copied at the SEC’s Public Reference Room (see the back cover of this report for further information).
| | Market |
| | Value• |
| Shares | ($000) |
Common Stocks (100.0%) | | |
Consumer Discretionary (9.0%) | | |
McDonald’s Corp. | 331,448 | 19,817 |
Home Depot, Inc. | 370,262 | 8,823 |
Target Corp. | 190,110 | 8,599 |
Lowe’s Cos., Inc. | 310,375 | 6,307 |
Johnson Controls, Inc. | 151,359 | 4,565 |
The McGraw-Hill Cos., Inc. | 83,591 | 3,400 |
TJX Cos., Inc. | 95,553 | 3,221 |
Harley-Davidson, Inc. | 68,748 | 2,601 |
H & R Block, Inc. | 76,486 | 1,861 |
Genuine Parts Co. | 44,452 | 1,783 |
VF Corp. | 24,093 | 1,725 |
Sherwin-Williams Co. | 31,767 | 1,692 |
Nordstrom, Inc. | 54,085 | 1,554 |
Ross Stores, Inc. | 29,235 | 1,110 |
Gannett Co., Inc. | 58,681 | 1,063 |
The Stanley Works | 19,373 | 862 |
Family Dollar Stores, Inc. | 33,534 | 781 |
John Wiley & Sons Class A | 12,812 | 581 |
^Polaris Industries, Inc. | 9,365 | 401 |
Wolverine World Wide, Inc. | 14,031 | 375 |
Matthews International Corp. | 7,058 | 352 |
Meredith Corp. | 10,778 | 275 |
Harte-Hanks, Inc. | 14,544 | 180 |
| | 71,928 |
Consumer Staples (24.9%) | | |
Beverages (9.1%) | | |
The Coca-Cola Co. | 572,633 | 29,491 |
PepsiCo, Inc. | 429,835 | 28,610 |
Anheuser-Busch Cos., Inc. | 196,291 | 13,301 |
Brown-Forman Corp. | | |
Class B | 18,382 | 1,323 |
| | |
Food & Staples Retailing (6.9%) | |
Wal-Mart Stores, Inc. | 684,509 | 40,126 |
Walgreen Co. | 262,452 | 9,013 |
Sysco Corp. | 162,903 | 4,620 |
SuperValu Inc. | 64,158 | 1,644 |
Food Products (1.7%) | | |
Archer-Daniels-Midland Co. | 167,641 | 4,800 |
Wm. Wrigley Jr. Co. | 52,333 | 4,132 |
The Hershey Co. | 43,270 | 1,591 |
Hormel Foods Corp. | 34,493 | 1,248 |
McCormick & Co., Inc. | 30,532 | 1,224 |
Lancaster Colony Corp. | 8,257 | 268 |
Tootsie Roll Industries, Inc. | 9,527 | 249 |
| | |
Household Products (6.6%) | | |
The Procter & Gamble Co. | 518,540 | 33,954 |
Colgate-Palmolive Co. | 129,574 | 9,623 |
Kimberly-Clark Corp. | 108,450 | 6,272 |
The Clorox Co. | 36,084 | 1,967 |
Church & Dwight, Inc. | 16,590 | 910 |
| | |
Personal Products (0.6%) | | |
Avon Products, Inc. | 118,321 | 5,017 |
| | |
Tobacco (0.0%) | | |
Universal Corp. (VA) | 6,730 | 347 |
| | 199,730 |
Energy (8.5%) | | |
Chevron Corp. | 406,147 | 34,344 |
ExxonMobil Corp. | 394,323 | 31,715 |
Helmerich & Payne, Inc. | 26,636 | 1,575 |
Holly Corp. | 13,536 | 387 |
| | 68,021 |
Financials (11.3%) | | |
American International | | |
Group, Inc. | 631,114 | 16,441 |
State Street Corp. | 99,441 | 7,124 |
Franklin Resources Corp. | 65,712 | 6,611 |
AFLAC Inc. | 118,422 | 6,585 |
The Allstate Corp. | 138,036 | 6,380 |
The Hartford Financial | | |
Services Group Inc. | 83,369 | 5,285 |
The Chubb Corp. | 99,546 | 4,782 |
Northern Trust Corp. | 56,676 | 4,430 |
9
| | Market |
| | Value• |
| Shares | ($000) |
T. Rowe Price Group Inc. | 73,666 | 4,409 |
Lincoln National Corp. | 69,125 | 3,297 |
Lehman Brothers | | |
Holdings, Inc. | 157,706 | 2,735 |
M & T Bank Corp. | 23,974 | 1,687 |
Synovus Financial Corp. | 154,422 | 1,469 |
Legg Mason Inc. | 32,921 | 1,328 |
Eaton Vance Corp. | 35,643 | 1,324 |
SEI Investments Co. | 52,864 | 1,217 |
Cincinnati Financial Corp. | 41,280 | 1,149 |
Transatlantic Holdings, Inc. | 17,253 | 1,000 |
Commerce Bancshares, Inc. | 17,844 | 779 |
Cullen/Frost Bankers, Inc. | 13,313 | 702 |
Wesco Financial Corp. | 1,846 | 683 |
HCC Insurance | | |
Holdings, Inc. | 29,089 | 659 |
Protective Life Corp. | 17,697 | 636 |
Bank of Hawaii Corp. | 12,552 | 633 |
Brown & Brown, Inc. | 35,372 | 621 |
City National Corp. | 12,411 | 610 |
Erie Indemnity Co. Class A | 13,410 | 586 |
Forest City Enterprise | | |
Class A | 21,500 | 561 |
Nationwide Financial | | |
Services, Inc. | 11,961 | 554 |
UMB Financial Corp. | 9,329 | 514 |
Hilb, Rogal and Hamilton Co. | 9,982 | 433 |
BancorpSouth, Inc. | 18,954 | 404 |
^Ambac Financial | | |
Group, Inc. | 135,738 | 342 |
Westamerica | | |
Bancorporation | 6,433 | 335 |
R.L.I. Corp. | 5,839 | 319 |
Trustmark Corp. | 15,955 | 288 |
Glacier Bancorp, Inc. | 13,179 | 286 |
State Auto Financial Corp. | 9,628 | 278 |
Harleysville Group, Inc. | 7,132 | 254 |
First Financial | | |
Bankshares, Inc. | 4,827 | 222 |
CVB Financial Corp. | 18,766 | 212 |
Sterling Bancshares, Inc. | 19,252 | 187 |
BancFirst Corp. | 3,505 | 166 |
IBERIABANK Corp. | 2,868 | 148 |
^First Busey Corp. | 8,841 | 126 |
First Source Corp. | 5,252 | 123 |
First Financial Corp. (IN) | 3,039 | 114 |
^Capital City Bank Group, Inc. | 4,135 | 98 |
S.Y. Bancorp, Inc. | 3,800 | 98 |
Simmons First National Corp. | 3,184 | 95 |
Flushing Financial Corp. | 5,289 | 93 |
Bank of the Ozarks, Inc. | 4,499 | 92 |
Tompkins Trustco, Inc. | 2,159 | 92 |
Renasant Corp. | 5,164 | 91 |
First Community | | |
Bancshares, Inc. | 2,488 | 89 |
Mainsource Financial | | |
Group, Inc. | 4,766 | 85 |
Heartland Financial USA, Inc. | 3,939 | 81 |
Washington Trust Bancorp, Inc. | 3,219 | 77 |
Suffolk Bancorp | 2,376 | 76 |
Sandy Spring Bancorp, Inc. | 3,718 | 62 |
Southwest Bancorp, Inc. | 3,816 | 53 |
Peoples Bancorp, Inc. | 2,837 | 52 |
West Coast Bancorp | 4,470 | 49 |
Old Second Bancorp, Inc. | 2,856 | 43 |
Banner Corp. | 4,409 | 42 |
Anchor Bancorp | | |
Wisconsin Inc. | 4,961 | 36 |
First State Bancorporation | 5,655 | 29 |
Horizon Financial Corp. | 3,245 | 25 |
| | 90,486 |
Health Care (13.6%) | | |
Johnson & Johnson | 532,775 | 36,479 |
Abbott Laboratories | 372,696 | 20,998 |
Medtronic, Inc. | 293,890 | 15,526 |
Eli Lilly & Co. | 279,934 | 13,188 |
Stryker Corp. | 110,043 | 7,064 |
Becton, Dickinson & Co. | 57,423 | 4,876 |
Cardinal Health, Inc. | 85,682 | 4,604 |
C.R. Bard, Inc. | 25,171 | 2,337 |
DENTSPLY International Inc. | 38,954 | 1,568 |
Beckman Coulter, Inc. | 16,674 | 1,206 |
Owens & Minor, Inc. | | |
Holding Co. | 10,294 | 473 |
Hill-Rom Holdings, Inc. | 16,132 | 453 |
West Pharmaceutical | | |
Services, Inc. | 8,365 | 384 |
Meridian Bioscience Inc. | 8,932 | 232 |
| | 109,388 |
Industrials (15.8%) | | |
General Electric Co. | 965,083 | 27,302 |
United Technologies Corp. | 249,600 | 15,969 |
3M Co. | 186,264 | 13,111 |
Caterpillar, Inc. | 161,419 | 11,222 |
Emerson Electric Co. | 208,418 | 10,150 |
General Dynamics Corp. | 103,670 | 9,241 |
Danaher Corp. | 90,204 | 7,185 |
Illinois Tool Works, Inc. | 139,124 | 6,518 |
Parker Hannifin Corp. | 47,141 | 2,908 |
Dover Corp. | 57,783 | 2,868 |
C.H. Robinson | | |
Worldwide Inc. | 43,760 | 2,109 |
W.W. Grainger, Inc. | 21,721 | 1,944 |
Expeditors International | | |
of Washington, Inc. | 50,359 | 1,788 |
10
| | Market |
| | Value• |
| Shares | ($000) |
Pitney Bowes, Inc. | 54,647 | 1,732 |
Roper Industries Inc. | 24,525 | 1,500 |
Harsco Corp. | 23,723 | 1,283 |
Avery Dennison Corp. | 26,699 | 1,175 |
Cintas Corp. | 39,197 | 1,115 |
Donaldson Co., Inc. | 21,710 | 979 |
Pentair, Inc. | 26,948 | 933 |
Nordson Corp. | 9,893 | 699 |
Teleflex Inc. | 10,280 | 630 |
Carlisle Co., Inc. | 17,147 | 525 |
Brady Corp. Class A | 14,116 | 518 |
CLARCOR Inc. | 12,054 | 464 |
Otter Tail Corp. | 7,704 | 349 |
Mine Safety Appliances Co. | 10,070 | 333 |
ABM Industries Inc. | 11,962 | 286 |
^HNI Corp. | 11,638 | 252 |
Franklin Electric, Inc. | 5,620 | 233 |
Badger Meter, Inc. | 4,073 | 229 |
A.O. Smith Corp. | 5,558 | 221 |
Raven Industries, Inc. | 5,521 | 210 |
Gorman-Rupp Co. | 4,511 | 201 |
McGrath RentCorp | 6,567 | 189 |
NACCO Industries, Inc. | | |
Class A | 1,633 | 165 |
Tennant Co. | 6,170 | 162 |
Universal Forest | | |
Products, Inc. | 3,868 | 104 |
LSI Industries Inc. | 7,549 | 70 |
Courier Corp. | 3,592 | 61 |
| | 126,933 |
Information Technology (6.7%) | | |
International Business | | |
Machines Corp. | 316,025 | 40,445 |
Automatic Data | | |
Processing, Inc. | 143,506 | 6,129 |
Paychex, Inc. | 92,578 | 3,048 |
Linear Technology Corp. | 62,920 | 1,954 |
Total System Services, Inc. | 58,920 | 1,154 |
Diebold, Inc. | 17,644 | 652 |
Jack Henry & | | |
Associates Inc. | 21,309 | 460 |
| | 53,842 |
Materials (4.6%) | | |
Praxair, Inc. | 83,671 | 7,842 |
Air Products & | | |
Chemicals, Inc. | 55,859 | 5,318 |
Nucor Corp. | 79,837 | 4,568 |
Rohm & Haas Co. | 48,018 | 3,601 |
Ecolab, Inc. | 63,628 | 2,844 |
PPG Industries, Inc. | 42,982 | 2,606 |
Sigma-Aldrich Corp. | 35,003 | 2,126 |
Vulcan Materials Co. | 24,331 | 1,562 |
^Martin Marietta | | |
Materials, Inc. | 11,735 | 1,232 |
Albemarle Corp. | 26,993 | 1,051 |
Sonoco Products Co. | 26,146 | 853 |
AptarGroup Inc. | 18,086 | 700 |
Bemis Co., Inc. | 24,845 | 700 |
Valspar Corp. | 28,058 | 608 |
RPM International, Inc. | 27,677 | 567 |
H.B. Fuller Co. | 13,139 | 328 |
Stepan Co. | 2,521 | 145 |
Myers Industries, Inc. | 10,698 | 120 |
| | 36,771 |
Telecommunication Services (3.6%) | |
AT&T Inc. | 884,874 | 27,263 |
CenturyTel, Inc. | 31,495 | 1,171 |
Shenandoah | | |
Telecommunications Co. | 7,280 | 110 |
| | 28,544 |
Utilities (2.0%) | | |
FPL Group, Inc. | 106,670 | 6,883 |
Questar Corp. | 45,439 | 2,403 |
MDU Resources Group, Inc. | 47,248 | 1,508 |
National Fuel Gas Co. | 22,373 | 1,114 |
Energen Corp. | 17,971 | 1,082 |
UGI Corp. Holding Co. | 27,271 | 738 |
Aqua America, Inc. | 34,293 | 544 |
New Jersey Resources Corp. | 10,791 | 368 |
Black Hills Corp. | 10,355 | 334 |
Northwest Natural Gas Co. | 6,532 | 296 |
California Water Service Group | 5,211 | 191 |
American States Water Co. | 4,597 | 166 |
SJW Corp. | 5,096 | 132 |
Southwest Water Co. | 6,426 | 69 |
| | 15,828 |
Total Common Stocks | | |
(Cost $847,619) | | 801,471 |
Temporary Cash Investment (0.2%) | | |
1 Vanguard Market Liquidity | | |
Fund, 2.386%—Note E | | |
(Cost $1,360) 1,360,000 | | 1,360 |
Total Investments (100.2%) | | |
(Cost $848,979) | | 802,831 |
Other Assets and Liabilities (–0.2%) | | |
Other Assets—Note B | | 2,091 |
Liabilities—Note E | | (3,362) |
| | (1,271) |
Net Assets (100%) | | 801,560 |
11
At July 31, 2008, net assets consisted of:2 |
| Amount |
| ($000) |
Paid-in Capital | 860,936 |
Undistributed Net Investment Income | 952 |
Accumulated Net Realized Losses | (14,180) |
Unrealized Depreciation | (46,148) |
Net Assets | 801,560 |
| |
| |
Investor Shares—Net Assets | |
Applicable to 19,281,182 outstanding | |
$.001 par value shares of beneficial | |
interest (unlimited authorization) | 389,962 |
Net Asset Value Per Share— | |
Investor Shares | $20.23 |
| |
| |
ETF Shares—Net Assets | |
Applicable to 8,142,523 outstanding | |
$.001 par value shares of beneficial | |
interest (unlimited authorization) | 411,598 |
Net Asset Value Per Share— | |
ETF Shares | $50.55 |
• See Note A in Notes to Financial Statements.
^ Part of security position is on loan to broker-dealers. See Note E in Notes to Financial Statements.
1 Affiliated money market fund available only to Vanguard funds and certain trusts and accounts managed by Vanguard. Rate shown is the 7-day yield.
2 See Note C in Notes to Financial Statements for the tax-basis components of net assets.
12
Statement of Operations
| Six Months Ended |
| July 31, 2008 |
| ($000) |
Investment Income | |
Income | |
Dividends | 8,652 |
Interest1 | 8 |
Security Lending | 26 |
Total Income | 8,686 |
Expenses | |
The Vanguard Group—Note B | |
Investment Advisory Services | 27 |
Management and Administrative | |
Investor Shares | 582 |
ETF Shares | 343 |
Marketing and Distribution | |
Investor Shares | 47 |
ETF Shares | 40 |
Custodian Fees | 45 |
Shareholders’ Reports | |
Investor Shares | — |
ETF Shares | 10 |
Total Expenses | 1,094 |
Net Investment Income | 7,592 |
Realized Net Gain (Loss) on Investment Securities Sold | 3,766 |
Change in Unrealized Appreciation (Depreciation) of Investment Securities | (48,146) |
Net Increase (Decrease) in Net Assets Resulting from Operations | (36,788) |
1 Interest income from an affiliated company of the fund was $8,000.
13
Statement of Changes in Net Assets
| Six Months Ended | Year Ended |
| July 31, | January 31, |
| 2008 | 2008 |
| ($000) | ($000) |
Increase (Decrease) in Net Assets | | |
Operations | | |
Net Investment Income | 7,592 | 7,113 |
Realized Net Gain (Loss) | 3,766 | (8,098) |
Change in Unrealized Appreciation (Depreciation) | (48,146) | (9,574) |
Net Increase (Decrease) in Net Assets Resulting from Operations | (36,788) | (10,559) |
Distributions | | |
Net Investment Income | | |
Investor Shares | (3,410) | (4,174) |
ETF Shares | (3,787) | (2,783) |
Realized Capital Gain | | |
Investor Shares | — | — |
ETF Shares | — | — |
Total Distributions | (7,197) | (6,957) |
Capital Share Transactions—Note F | | |
Investor Shares | 55,179 | 204,617 |
ETF Shares | 131,881 | 197,765 |
Net Increase (Decrease) from Capital Share Transactions | 187,060 | 402,382 |
Total Increase (Decrease) | 143,075 | 384,866 |
Net Assets | | |
Beginning of Period | 658,485 | 273,619 |
End of Period1 | 801,560 | 658,485 |
1 Net Assets—End of Period includes undistributed net investment income of $952,000 and $557,000.
14
Financial Highlights
Investor Shares | | | |
| Six Months | Year | April 27, |
| Ended | Ended | 20061 to |
| July 31, | Jan. 31, | Jan. 31, |
For a Share Outstanding Throughout Each Period | 2008 | 2008 | 2007 |
Net Asset Value, Beginning of Period | $21.40 | $21.84 | $20.05 |
Investment Operations | | | |
Net Investment Income | .192 | .325 | .214 |
Net Realized and Unrealized Gain (Loss) on Investments | (1.177) | (.438) | 1.782 |
Total from Investment Operations | (.985) | (.113) | 1.996 |
Distributions | | | |
Dividends from Net Investment Income | (.185) | (.327) | (.206) |
Distributions from Realized Capital Gains | — | — | — |
Total Distributions | (.185) | (.327) | (.206) |
Net Asset Value, End of Period | $20.23 | $21.40 | $21.84 |
| | | |
| | | |
Total Return2 | –4.63% | –0.58% | 10.02% |
| | | |
| | | |
Ratios/Supplemental Data | | | |
Net Assets, End of Period (Millions) | $390 | $357 | $163 |
Ratio of Total Expenses to Average Net Assets | 0.35%* | 0.40% | 0.40%* |
Ratio of Net Investment Income to Average Net Assets | 1.95%* | 1.56% | 1.53%* |
Portfolio Turnover Rate3 | 6%* | 17% | 21% |
1 Inception.
2 Total returns do not include the account service fee that may be applicable to certain accounts with balances below $10,000.
3 Excludes the value of portfolio securities received or delivered as a result of in-kind purchases or redemptions of the fund’s capital shares, including ETF creation units.
* Annualized.
15
ETF Shares | | | |
| Six Months | Year | April 21, |
| Ended | Ended | 20061 to |
| July 31, | Jan. 31, | Jan. 31, |
For a Share Outstanding Throughout Each Period | 2008 | 2008 | 2007 |
Net Asset Value, Beginning of Period | $53.48 | $54.60 | $49.94 |
Investment Operations | | | |
Net Investment Income | .513 | .873 | .555 |
Net Realized and Unrealized Gain (Loss) on Investments | (2.942) | (1.120) | 4.631 |
Total from Investment Operations | (2.429) | (.247) | 5.186 |
Distributions | | | |
Dividends from Net Investment Income | (.501) | (.873) | (.526) |
Distributions from Realized Capital Gains | — | — | — |
Total Distributions | (.501) | (.873) | (.526) |
Net Asset Value, End of Period | $50.55 | $53.48 | $54.60 |
| | | |
| | | |
Total Return | –4.57% | –0.51% | 10.45% |
| | | |
| | | |
Ratios/Supplemental Data | | | |
Net Assets, End of Period (Millions) | $412 | $302 | $111 |
Ratio of Total Expenses to Average Net Assets | 0.23%* | 0.28% | 0.28%* |
Ratio of Net Investment Income to Average Net Assets | 2.07%* | 1.68% | 1.65%* |
Portfolio Turnover Rate2 | 6%* | 17% | 21% |
1 Inception.
2 Excludes the value of portfolio securities received or delivered as a result of in-kind purchases or redemptions of the fund’s capital shares, including ETF creation units.
* Annualized.
See accompanying Notes, which are an integral part of the Financial Statements.
16
Notes to Financial Statements
Vanguard Dividend Appreciation Index Fund is registered under the Investment Company Act of 1940 as an open-end investment company, or mutual fund. The fund files reports with the SEC under the company name Vanguard Specialized Funds. The fund offers two classes of shares: Investor Shares and ETF Shares. Investor Shares are available to any investor who meets the fund’s minimum purchase requirements. ETF Shares are listed for trading on the American Stock Exchange; they can be purchased and sold through a broker.
A. The following significant accounting policies conform to generally accepted accounting principles for U.S. mutual funds. The fund consistently follows such policies in preparing its financial statements.
1. Security Valuation: Securities are valued as of the close of trading on the New York Stock Exchange (generally 4 p.m., Eastern time) on the valuation date. Equity securities are valued at the latest quoted sales prices or official closing prices taken from the primary market in which each security trades; such securities not traded on the valuation date are valued at the mean of the latest quoted bid and asked prices. Securities for which market quotations are not readily available, or whose values have been materially affected by events occurring before the fund’s pricing time but after the close of the securities’ primary markets, are valued by methods deemed by the board of trustees to represent fair value. Investments in Vanguard Market Liquidity Fund are valued at that fund’s net asset value.
2. Federal Income Taxes: The fund intends to continue to qualify as a regulated investment company and distribute all of its taxable income. Management has analyzed the fund’s tax positions taken on federal income tax returns for all open tax years (tax years ended January 31, 2007–2008) and for the period ended July 31, 2008, and has concluded that no provision for federal income tax is required in the fund’s financial statements.
3. Distributions: Distributions to shareholders are recorded on the ex-dividend date.
4. Security Lending: The fund may lend its securities to qualified institutional borrowers to earn additional income. Security loans are required to be secured at all times by collateral at least equal to the market value of securities loaned. The fund invests cash collateral received in Vanguard Market Liquidity Fund, and records a liability for the return of the collateral, during the period the securities are on loan. Security lending income represents the income earned on investing cash collateral, less expenses associated with the loan.
5. Other: Dividend income is recorded on the ex-dividend date. Interest income includes income distributions received from Vanguard Market Liquidity Fund and is accrued daily. Security transactions are accounted for on the date securities are bought or sold. Costs used to determine realized gains (losses) on the sale of investment securities are those of the specific securities sold.
Each class of shares has equal rights as to assets and earnings, except that each class separately bears certain class-specific expenses related to maintenance of shareholder accounts (included in Management and Administrative expenses) and shareholder reporting. Marketing and distribution expenses are allocated to each class of shares based on a method approved by the board of trustees. Income, other non-class-specific expenses, and gains and losses on investments are allocated to each class of shares based on its relative net assets.
17
B. The Vanguard Group furnishes at cost investment advisory, corporate management, administrative, marketing, and distribution services. The costs of such services are allocated to the fund under methods approved by the board of trustees. The fund has committed to provide up to 0.40% of its net assets in capital contributions to Vanguard. At July 31, 2008, the fund had contributed capital of $68,000 to Vanguard (included in Other Assets), representing 0.01% of the fund’s net assets and 0.07% of Vanguard’s capitalization. The fund’s trustees and officers are also directors and officers of Vanguard.
C. Distributions are determined on a tax basis and may differ from net investment income and realized capital gains for financial reporting purposes. Differences may be permanent or temporary. Permanent differences are reclassified among capital accounts in the financial statements to reflect their tax character. Temporary differences arise when certain items of income, expense, gain, or loss are recognized in different periods for financial statement and tax purposes; these differences will reverse at some time in the future. Differences in classification may also result from the treatment of short-term gains as ordinary income for tax purposes.
During the six months ended July 31, 2008, the fund realized $811,000 of net capital gains resulting from in-kind redemptions—in which shareholders exchanged fund shares for securities held by the fund rather than for cash. Because such gains are not taxable to the fund, and are not distributed to shareholders, they have been reclassified from accumulated net realized losses to paid-in capital.
The fund’s tax-basis capital gains and losses are determined only at the end of each fiscal year. For tax purposes, at January 31, 2008, the fund had available realized losses of $14,431,000 to offset future net capital gains of $608,000 through January 31, 2016, and $13,823,000 through January 31, 2017. The fund will use these capital losses to offset net taxable capital gains, if any, realized during the year ending January 31, 2009; should the fund realize net capital losses for the year, the losses will be added to the loss carryforward balances above.
At July 31, 2008, the cost of investment securities for tax purposes was $848,979,000. Net unrealized depreciation of investment securities for tax purposes was $46,148,000, consisting of unrealized gains of $40,555,000 on securities that had risen in value since their purchase and $86,703,000 in unrealized losses on securities that had fallen in value since their purchase.
D. During the six months ended July 31, 2008, the fund purchased $215,875,000 of investment securities and sold $26,251,000 of investment securities other than temporary cash investments.
E. The market value of securities on loan to broker-dealers at July 31, 2008, was $1,258,000, for which the fund received cash collateral of $1,360,000.
18
F. Capital share transactions for each class of shares were:
| Six Months Ended | Year Ended |
| July 31, 2008 | January 31, 2008 |
| Amount | Shares | | Amount | Shares |
| ($000) | (000) | | ($000) | (000) |
Investor Shares | | | | | |
Issued | 80,913 | 3,813 | | 233,275 | 10,505 |
Issued in Lieu of Cash Distributions | 3,138 | 150 | | 3,696 | 165 |
Redeemed | (28,872) | (1,355) | | (32,354) | (1,454) |
Net Increase (Decrease)—Investor Shares | 55,179 | 2,608 | | 204,617 | 9,216 |
ETF Shares | | | | | |
Issued | 136,989 | 2,600 | | 241,521 | 4,414 |
Issued in Lieu of Cash Distributions | — | — | | — | — |
Redeemed | (5,108) | (100) | | (43,756) | (800) |
Net Increase (Decrease)—ETF Shares | 131,881 | 2,500 | | 197,765 | 3,614 |
G. In September 2006, the Financial Accounting Standards Board issued Statement of Financial Accounting Standards No. 157 (“FAS 157”), “Fair Value Measurements.” FAS 157 establishes a framework for measuring fair value and expands disclosures about fair value measurements in financial statements, effective for the fund’s current fiscal period.
The various inputs that may be used to determine the value of the fund’s investments are summarized in three broad levels. The inputs or methodologies used for valuing securities are not necessarily an indication of the risk associated with investing in those securities.
Level 1—Quoted prices in active markets for identical securities.
Level 2—Other significant observable inputs (including quoted prices for similar securities, interest rates, prepayment speeds, credit risk, etc.).
Level 3—Significant unobservable inputs (including the fund’s own assumptions used to determine the fair value of investments).
At July 31, 2008, 100% of the fund’s investments were valued based on Level 1 inputs.
19
About Your Fund’s Expenses
As a shareholder of the fund, you incur ongoing costs, which include costs for portfolio management, administrative services, and shareholder reports (like this one), among others. Operating expenses, which are deducted from a fund’s gross income, directly reduce the investment return of the fund.
A fund’s expenses are expressed as a percentage of its average net assets. This figure is known as the expense ratio. The following examples are intended to help you understand the ongoing costs (in dollars) of investing in your fund and to compare these costs with those of other mutual funds. The examples are based on an investment of $1,000 made at the beginning of the period shown and held for the entire period.
The table below illustrates your fund’s costs in two ways:
• Based on actual fund return. This section helps you to estimate the actual expenses that you paid over the period. The “Ending Account Value” shown is derived from the fund’s actual return, and the third column shows the dollar amount that would have been paid by an investor who started with $1,000 in the fund. You may use the information here, together with the amount you invested, to estimate the expenses that you paid over the period.
To do so, simply divide your account value by $1,000 (for example, an $8,600 account value divided by $1,000 = 8.6), then multiply the result by the number given for your fund under the heading “Expenses Paid During Period.”
• Based on hypothetical 5% yearly return. This section is intended to help you compare your fund’s costs with those of other mutual funds. It assumes that the fund had a yearly return of 5% before expenses, but that the expense ratio is unchanged. In this case—because the return used is not the fund’s actual return—the results do not apply to your investment. The example is useful in making comparisons because the Securities and Exchange Commission requires all mutual funds to calculate expenses based on a 5% return. You can assess your fund’s costs by comparing this hypothetical example with the hypothetical examples that appear in shareholder reports of other funds.
Six Months Ended July 31, 2008 | | | |
| Beginning | Ending | Expenses |
| Account Value | Account Value | Paid During |
Dividend Appreciation Index Fund | 1/31/2008 | 7/31/2008 | Period1 |
Based on Actual Fund Return | | | |
Investor Shares | $1,000.00 | $953.68 | $1.70 |
ETF Shares | 1,000.00 | 954.29 | 1.12 |
Based on Hypothetical 5% Return | | | |
Investor Shares | $1,000.00 | $1,023.12 | $1.76 |
ETF Shares | 1,000.00 | 1,023.72 | 1.16 |
1 These calculations are based on expenses incurred in the most recent six-month period. The fund’s annualized six-month expense ratios for that period are 0.35% for Investor Shares and 0.23% for ETF Shares. The dollar amounts shown as “Expenses Paid” are equal to the annualized expense ratio multiplied by the average account value over the period, multiplied by the number of days in the most recent six-month period, then divided by the number of days in the most recent 12-month period.
20
Note that the expenses shown on page 20 are meant to highlight and help you compare ongoing costs only and do not reflect transaction costs incurred by the fund for buying and selling securities. Further, the expenses do not include the account service fee described in the prospectus. If such a fee were applied to your account, your costs would be higher. Your fund does not charge transaction fees, such as purchase or redemption fees, nor does it carry a “sales load.”
The calculations assume no shares were bought or sold during the period. Your actual costs may have been higher or lower, depending on the amount of your investment and the timing of any purchases or redemptions.
You can find more information about the fund’s expenses, including annual expense ratios, in the Financial Statements section of this report. For additional information on operating expenses and other shareholder costs, please refer to the appropriate fund prospectus.
21
Trustees Approve Advisory Arrangement
The board of trustees of Vanguard Dividend Appreciation Index Fund has renewed the fund’s investment advisory arrangement with The Vanguard Group, Inc. Vanguard—through its Quantitative Equity Group (QEG)—serves as investment advisor for the fund. The board determined that continuing the fund’s internalized management structure was in the best interests of the fund and its shareholders.
The board based its decision upon an evaluation of the advisor’s investment staff, portfolio management process, and performance. The trustees considered the factors discussed below, among others. However, no single factor determined whether the board approved the arrangement. Rather, it was the totality of the circumstances that drove the board’s decision.
Nature, extent, and quality of services
The board considered the quality of the fund’s investment management services provided by QEG since the fund’s inception in 2006, and took into account the organizational depth and stability of the group. Vanguard has been managing investments for more than two decades. George U. Sauter, Vanguard managing director and chief investment officer, has been in the investment management business since 1985. Mr. Sauter has led QEG since 1987. QEG adheres to a sound, disciplined investment management process; the team has considerable experience, stability, and depth.
The board concluded that Vanguard’s experience, stability, depth, and performance, among other factors, warranted continuation of the advisory arrangement.
Investment performance
The board considered the fund’s performance since inception, including any periods of outperformance or underperformance of its target index and peer group. The board concluded that the fund has performed in line with expectations and that the results have been consistent with the fund’s investment strategy. Information about the fund’s most recent performance can be found in the Performance Summary section of this report.
Cost
The board concluded that the fund’s expense ratio was far below the average expense ratio charged by funds in its peer group. The board noted that the fund’s advisory expense ratio was also well below its peer-group average. Information about the fund’s expense ratio appears in the About Your Fund’s Expenses section of this report as well as in the Financial Statements section.
The board does not conduct a profitability analysis of Vanguard because of Vanguard’s unique “at-cost” structure. Unlike most other mutual fund management companies, Vanguard is owned by the funds it oversees, and produces “profits” only in the form of reduced expenses for fund shareholders.
The benefit of economies of scale
The board concluded that the fund’s low-cost arrangement with Vanguard ensures that the fund will realize economies of scale as it grows, with the cost to shareholders declining as the fund’s assets increase.
The board will consider whether to renew the advisory arrangement again after a one-year period.
22
Glossary
Earnings Growth Rate. The average annual rate of growth in earnings over the past five years for the stocks now in a fund.
Equity Exposure. A measure that reflects a fund’s investments in stocks and stock futures. Any holdings in short-term reserves are excluded.
Expense Ratio. The percentage of a fund’s average net assets used to pay its annual administrative and advisory expenses. These expenses directly reduce returns to investors.
Foreign Holdings. The percentage of a fund represented by stocks or depositary receipts of companies based outside the United States.
Inception Date. The date on which the assets of a fund (or one of its share classes) are first invested in accordance with the fund’s investment objective. For funds with a subscription period, the inception date is the day after that period ends. Investment performance is measured from the inception date.
Median Market Cap. An indicator of the size of companies in which a fund invests; the midpoint of market capitalization (market price x shares outstanding) of a fund’s stocks, weighted by the proportion of the fund’s assets invested in each stock. Stocks representing half of the fund’s assets have market capitalizations above the median, and the rest are below it.
Price/Book Ratio. The share price of a stock divided by its net worth, or book value, per share. For a fund, the weighted average price/book ratio of the stocks it holds.
Price/Earnings Ratio. The ratio of a stock’s current price to its per-share earnings over the past year. For a fund, the weighted average P/E of the stocks it holds. P/E is an indicator of market expectations about corporate prospects; the higher the P/E, the greater the expectations for a company’s future growth.
Return on Equity. The annual average rate of return generated by a company during the past five years for each dollar of shareholder’s equity (net income divided by shareholder’s equity). For a fund, the weighted average return on equity for the companies whose stocks it holds.
Short-Term Reserves. The percentage of a fund invested in highly liquid, short-term securities that can be readily converted to cash.
Turnover Rate. An indication of the fund’s trading activity. Funds with high turnover rates incur higher transaction costs and may be more likely to distribute capital gains (which may be taxable to investors). The turnover rate excludes in-kind transactions, which have minimal impact on costs.
Yield. A fund’s 30-day SEC yield is derived using a formula specified by the U.S. Securities and Exchange Commission. Under the formula, data related to the fund’s security holdings in the previous 30 days are used to calculate the fund’s hypothetical net income for that period, which is then annualized and divided by the fund’s estimated average net assets over the calculation period. For the purposes of this calculation, a security’s income is based on its current market yield to maturity (in the case of bonds) or its projected dividend yield (for stocks). Because the SEC yield represents hypothetical annualized income, it will differ—at times significantly—from the fund’s actual experience. As a result, the fund’s income distributions may be higher or lower than implied by the SEC yield.
23
The People Who Govern Your Fund
The trustees of your mutual fund are there to see that the fund is operated and managed in your best interests since, as a shareholder, you are a part owner of the fund. Your fund’s trustees also serve on the board of directors of The Vanguard Group, Inc., which is owned by the Vanguard funds and provides services to them on an at-cost basis.
A majority of Vanguard’s board members are independent, meaning that they have no affiliation with Vanguard or the funds they oversee, apart from the sizable personal investments they have made as private individuals.
Our independent board members bring distinguished backgrounds in business, academia, and public service to their task of working with Vanguard officers to establish the policies and oversee the activities of the funds. Among board members’ responsibilities are selecting investment advisors for the funds; monitoring fund operations, performance, and costs; reviewing contracts; nominating and selecting new trustees/directors; and electing Vanguard officers.
Each trustee serves a fund until its termination; or until the trustee’s retirement, resignation, or death; or otherwise as specified in the fund’s organizational documents. Any trustee may be removed at a shareholders’ meeting by a vote representing two-thirds of the net asset value of all shares of the fund together with shares of other Vanguard funds organized within the same trust. The table on these two pages shows information for each trustee and executive officer of the fund. The mailing address of the trustees and officers is P.O. Box 876, Valley Forge, PA 19482.
Chairman of the Board, Chief Executive Officer, and Trustee
John J. Brennan1
Born 1954 Principal Occupation(s) During the Past Five Years: Chairman of the Board, Chief Executive Trustee Since May 1987; Officer, and Director/Trustee of The Vanguard Group, Inc., and of each of the investment Chairman of the Board and companies served by The Vanguard Group; Director of Vanguard Marketing Corporation. Chief Executive Officer 156 Vanguard Funds Overseen
Independent Trustees
Charles D. Ellis
Born 1937 Principal Occupation(s) During the Past Five Years: Applecore Partners (pro bono ventures Trustee Since January 2001 in education); Senior Advisor to Greenwich Associates (international business strategy 156 Vanguard Funds Overseen consulting); Successor Trustee of Yale University; Overseer of the Stern School of Business at New York University; Trustee of the Whitehead Institute for Biomedical Research.
Emerson U. Fullwood
Born 1948 Principal Occupation(s) During the Past Five Years: Executive Chief Staff and Marketing Trustee Since January 2008 Officer for North America since 2004 and Corporate Vice President of Xerox Corporation 156 Vanguard Funds Overseen (photocopiers and printers); Director of SPX Corporation (multi-industry manufacturing), of the United Way of Rochester, and of the Boy Scouts of America.
Rajiv L. Gupta
Born 1945 Principal Occupation(s) During the Past Five Years: Chairman, President, and Trustee Since December 20012 Chief Executive Officer of Rohm and Haas Co. (chemicals); Board Member of 156 Vanguard Funds Overseen the American Chemistry Council; Director of Tyco International, Ltd. (diversified manufacturing and services) since 2005.
Amy Gutmann
Born 1949 Principal Occupation(s) During the Past Five Years: President of the University of
Trustee Since June 2006 Pennsylvania since 2004; Professor in the School of Arts and Sciences, Annenberg School 156 Vanguard Funds Overseen for Communication, and Graduate School of Education of the University of Pennsylvania since 2004; Provost (2001–2004) and Laurance S. Rockefeller Professor of Politics and the University Center for Human Values (1990–2004), Princeton University; Director of Carnegie Corporation of New York since 2005 and of Schuylkill River Development Corporation and Greater Philadelphia Chamber of Commerce since 2004; Trustee of the National Constitution Center since 2007.
JoAnn Heffernan Heisen
Born 1950 Principal Occupation(s) During the Past Five Years: Corporate Vice President and Trustee Since July 1998 Chief Global Diversity Officer since 2006, Vice President and Chief Information 156 Vanguard Funds Overseen Officer (1997–2005), and Member of the Executive Committee of Johnson & Johnson (pharmaceuticals/consumer products); Director of the University Medical Center at Princeton and Women’s Research and Education Institute.
André F. Perold
Born 1952 Principal Occupation(s) During the Past Five Years: George Gund Professor of Finance Trustee Since December 2004 and Banking, Harvard Business School; Senior Associate Dean and Director of Faculty 156 Vanguard Funds Overseen Recruiting, Harvard Business School; Director and Chairman of UNX, Inc. (equities trading firm); Chair of the Investment Committee of HighVista Strategies LLC (private investment firm) since 2005.
Alfred M. Rankin, Jr.
Born 1941 Principal Occupation(s) During the Past Five Years: Chairman, President, Chief Executive Trustee Since January 1993 Officer, and Director of NACCO Industries, Inc. (forklift trucks/housewares/lignite); Director 156 Vanguard Funds Overseen of Goodrich Corporation (industrial products/aircraft systems and services).
J. Lawrence Wilson
Born 1936 Principal Occupation(s) During the Past Five Years: Retired Chairman and Chief Executive Trustee Since April 1985 Officer of Rohm and Haas Co. (chemicals); Director of Cummins Inc. (diesel engines) and 156 Vanguard Funds Overseen AmerisourceBergen Corp. (pharmaceutical distribution); Trustee of Vanderbilt University and of Culver Educational Foundation.
Executive Officers1
Thomas J. Higgins
Born 1957 Principal Occupation(s) During the Past Five Years: Principal of The Vanguard Group, Inc.; Treasurer Since July 1998 Treasurer of each of the investment companies served by The Vanguard Group. 156 Vanguard Funds Overseen
F. William McNabb III
Born 1957 Principal Occupation(s) During the Past Five Years: President of The Vanguard Group, Inc., President Since March 2008 and of each of the investment companies served by The Vanguard Group since 2008; 156 Vanguard Funds Overseen Director of Vanguard Marketing Corporation; Managing Director of The Vanguard Group (1995–2008).
Heidi Stam
Born 1956 Principal Occupation(s) During the Past Five Years: Managing Director of The Vanguard Secretary Since July 2005 Group, Inc., since 2006; General Counsel of The Vanguard Group since 2005; Secretary of 156 Vanguard Funds Overseen The Vanguard Group, and of each of the investment companies served by The Vanguard Group, since 2005; Director and Senior Vice President of Vanguard Marketing Corporation since 2005; Principal of The Vanguard Group (1997–2006).
Vanguard Senior Management Team | | |
| | | |
R. Gregory Barton | Kathleen C. Gubanich | Michael S. Miller | Glenn W. Reed |
Mortimer J. Buckley | Paul A. Heller | Ralph K. Packard | George U. Sauter |
Founder
John C. Bogle
Chairman and Chief Executive Officer, 1974–1996
1 Officers of the funds are “interested persons” as defined in the Investment Company Act of 1940.
2 December 2002 for Vanguard Equity Income Fund, Vanguard Growth Equity Fund, the Vanguard Municipal Bond Funds, and the Vanguard State Tax-Exempt Funds.
More information about the trustees is in the Statement of Additional Information, available from The Vanguard Group.

P.O. Box 2600
Valley Forge, PA 19482-2600
Connect with Vanguard® > www.vanguard.com
Fund Information > 800-662-7447 | All comparative mutual fund data are from Lipper Inc. |
| or Morningstar, Inc., unless otherwise noted. |
Direct Investor Account Services > 800-662-2739 | |
| You can obtain a free copy of Vanguard’s proxy voting |
Institutional Investor Services > 800-523-1036 | guidelines by visiting our website, www.vanguard.com, |
| and searching for “proxy voting guidelines,” or by |
Text Telephone for People | calling Vanguard at 800-662-2739. The guidelines are |
With Hearing Impairment > 800-952-3335 | also available from the SEC’s website, www.sec.gov. |
| In addition, you may obtain a free report on how your |
| fund voted the proxies for securities it owned during |
| the 12 months ended June 30. To get the report, visit |
This material may be used in conjunction | either www.vanguard.com or www.sec.gov. |
with the offering of shares of any Vanguard | |
fund only if preceded or accompanied by | |
the fund’s current prospectus. | |
| You can review and copy information about your fund |
| at the SEC’s Public Reference Room in Washington, D.C. |
| To find out more about this public service, call the SEC |
Vanguard, Vanguard ETF, Connect with Vanguard, and | at 202-551-8090. Information about your fund is also |
the ship logo are trademarks of The Vanguard Group, Inc. | available on the SEC’s website, and you can receive |
| copies of this information, for a fee, by sending a |
| request in either of two ways: via e-mail addressed to |
“Dividend Achievers” is a trademark of Mergent, Inc., | publicinfo@sec.gov or via regular mail addressed to the |
and has been licensed for use by The Vanguard Group, | Public Reference Section, Securities and Exchange |
Inc. Vanguard mutual funds are not sponsored, endorsed, | Commission, Washington, DC 20549-0102. |
sold, or promoted by Mergent, and Mergent makes no | |
representation regarding the advisability of investing in | |
the funds. | |
| |
| |
All other marks are the exclusive property of their | |
respective owners. | |
| |
| |
| |
| |
| |
| |
| |
| |
| |
| |
| |
| © 2008 The Vanguard Group, Inc. |
| All rights reserved. |
| Vanguard Marketing Corporation, Distributor. |
| |
| Q6022 092008 |
Item 2: Not Applicable.
Item 3: Not Applicable.
Item 4: Not Applicable.
Item 5: Not Applicable.
Item 6: Not Applicable.
Item 7: Not applicable.
Item 8: Not Applicable.
Item 9: Not Applicable.
Item 10: Not Applicable.
Item 11: Controls and Procedures.
(a) Disclosure Controls and Procedures. The Principal Executive and Financial Officers concluded that the Registrant's Disclosure Controls and Procedures are effective based on their evaluation of the Disclosure Controls and Procedures as of a date within 90 days of the filing date of this report.
(b) Internal Control Over Financial Reporting. There were no significant changes in Registrant’s Internal Control Over Financial Reporting or in other factors that could significantly affect this control subsequent to the date of the evaluation, including any corrective actions with regard to significant deficiencies and material weaknesses.
Item 12: Exhibits.
(a) Certifications.
Pursuant to the requirements of the Securities Exchange Act of 1934 and the Investment Company Act of 1940, the registrant has duly caused this report to be signed on its behalf by the undersigned, thereunto duly authorized.
| VANGUARD SPECIALIZED FUNDS |
BY: | | (signature) |
| (HEIDI STAM) |
| F. WILLIAM MCNABB III* |
| CHIEF EXECUTIVE OFFICER |
| | |
Date: September 9, 2008
Pursuant to the requirements of the Securities Exchange Act of 1934 and the Investment Company Act of 1940, this report has been signed below by the following persons on behalf of the registrant and in the capacities and on the dates indicated.
| VANGUARD SPECIALIZED FUNDS |
BY: | | (signature) |
| (HEIDI STAM) |
| F. WILLIAM MCNABB III* |
| CHIEF EXECUTIVE OFFICER |
| | |
Date : September 9, 2008
| VANGUARD SPECIALIZED FUNDS |
BY: | | (signature) |
| (HEIDI STAM) |
| THOMAS J. HIGGINS* |
| TREASURER |
| | |
Date : September 9, 2008
*Heidi Stam, pursuant to a Power of Attorney filed on January 18, 2008, see File Number 2-29601, Incorporated by Reference; and pursuant to a Power of Attorney filed on September 26, 2008, see File Number 2-47371, Incorporated by Reference.