UNITED STATES
SECURITIES AND EXCHANGE COMMISSION
Washington, D.C. 20549
FORM N-CSR
CERTIFIED SHAREHOLDER REPORT
OF
REGISTERED MANAGEMENT INVESTMENT COMPANIES
Investment Company Act file number: 811-3916
Name of Registrant: Vanguard Specialized Funds
Address of Registrant:
P.O. Box 2600
Valley Forge, PA 19482
Name and address of agent for service:
Heidi Stam, Esquire
P.O. Box 876
Valley Forge, PA 19482
Registrant’s telephone number, including area code: (610) 669-1000
Date of fiscal year end: January 31
Date of reporting period: February 1, 2010 – July 31, 2010
Item 1: Reports to Shareholders
 |
| Vanguard Energy Fund |
| Semiannual Report |
|
| July 31, 2010 |
 |
|
> Vanguard Energy Fund returned about –2% for the six months ended July 31, 2010.
> The Energy Fund’s return trailed that of its spliced benchmark index, but only slightly lagged the average return of its peer-group funds.
> The fund’s holdings of integrated oil and gas firms, as well as exploration and production companies, were responsible for its substandard performance.
| |
| Contents | |
| Your Fund’s Total Returns. | 1 |
| Chairman’s Letter. | 2 |
| Advisors’ Report. | 6 |
| Fund Profile. | 9 |
| Performance Summary. | 11 |
| Financial Statements. | 12 |
| About Your Fund’s Expenses. | 25 |
| Trustees Approve Advisory Arrangements. | 27 |
| Glossary. | 29 |
Please note: The opinions expressed in this report are just that—informed opinions. They should not be considered promises or advice. Also, please keep in mind that the information and opinions cover the period through the date on the front of this report. Of course, the risks of investing in your fund are spelled out in the prospectus.
See the Glossary for definitions of investment terms used in this report.
Cover photograph: Veronica Coia.
Your Fund’s Total Returns
| |
| Six Months Ended July 31, 2010 | |
| | Total |
| | Returns |
| Vanguard Energy Fund | |
| Investor Shares | -2.03% |
| Admiral™ Shares | -1.99 |
| Spliced Energy Index | -0.40 |
| Global Natural Resources Funds Average | -1.72 |
| Spliced Energy Index: S&P Energy Sector Index through May 31, 2010; MSCI All Country World Energy Index thereafter. | |
| Global Natural Resources Funds Average: Derived from data provided by Lipper Inc. | |
Admiral Shares are a lower-cost class of shares available to many longtime shareholders and to those with significant investments in the fund.
| | | | |
| Your Fund’s Performance at a Glance | | | | |
| January 31, 2010, Through July 31, 2010 | | | | |
| | | | Distributions Per Share |
| | Starting | Ending | Income | Capital |
| | Share Price | Share Price | Dividends | Gains |
| Vanguard Energy Fund | | | | |
| Investor Shares | $57.17 | $55.63 | $0.000 | $0.402 |
| Admiral Shares | 107.34 | 104.49 | 0.000 | 0.754 |
1

Chairman’s Letter
Dear Shareholder,
Vanguard Energy Fund returned about –2% for the fiscal half-year ended July 31. The fund trailed its index benchmark, but was only a step behind the average return of global natural resources peer funds.
The Energy Fund’s performance for the six-month period was largely influenced by poor results from integrated oil and gas companies and from exploration and production firms. Not surprisingly, the British oil giant BP and its massive oil spill in the Gulf of Mexico weighed heavily on the fund’s performance.
Please note that on June 1, the Energy Fund’s primary benchmark changed from the Standard & Poor’s Energy Sector Index to the MSCI All Country World Energy Index. The fund’s trustees believe the new benchmark, which includes companies domiciled outside the United States, is more consistent with the fund’s investment objective and strategies. The “Spliced Energy Index” shown on page 1 and elsewhere in this report combines the old and new benchmarks for performance-comparison purposes.
Stock markets moved higher, but the journey was tense
Global stock markets emerged from a turbulent six-month stretch with respectable single-digit gains. Prices rallied in early spring, buoyed by rapid growth in corporate earnings, but fell sharply in May and June as Europe’s sovereign debt crisis took center stage.
2
Signs that the U.S. economic recovery might be sputtering also dampened investor spirits. By the end of the half-year, however, stock markets had recouped the previous months’ losses as corporate bellwethers continued to report strong profits, and investors’ moods brightened.
For the full period, the U.S. stock market returned more than 4%. Smaller-company stocks, which are less exposed to global turmoil than large-cap multinationals, returned about 9%. International stocks finished the period with a modestly positive return, as strong performance from emerging markets compensated for weaker returns in Europe.
High-quality bonds rallied amid the search for safety
Turmoil in the stock markets and mixed economic signals drove bond prices higher, and yields lower, as investors sought safety in high-quality government and corporate bonds. At the start of the period, the yield of the benchmark 10-year U.S. Treasury note stood at 3.61%. By the end, it had dipped to 2.91%, and rates on home-mortgage loans were at their lowest levels since the 1950s.
Rising bond prices led to strong six-month returns in both the taxable and municipal bond markets. The returns from money market instruments, by contrast, remained vanishingly small. Yields have hovered near
| | | |
| Market Barometer | | | |
| |
| | | | Total Returns |
| | | Periods Ended July 31, 2010 |
| | Six | One | Five Years |
| | Months | Year | (Annualized) |
| Stocks | | | |
| Russell 1000 Index (Large-caps) | 3.84% | 14.51% | 0.02% |
| Russell 2000 Index (Small-caps) | 8.79 | 18.43 | 0.47 |
| Dow Jones U.S. Total Stock Market Index | 4.48 | 15.36 | 0.45 |
| MSCI All Country World Index ex USA (International) | 2.26 | 10.12 | 4.89 |
| |
| Bonds | | | |
| Barclays Capital U.S. Aggregate Bond Index (Broad | | | |
| taxable market) | 4.85% | 8.91% | 5.96% |
| Barclays Capital Municipal Bond Index | 4.06 | 9.15 | 4.75 |
| Citigroup Three-Month U.S. Treasury Bill Index | 0.06 | 0.12 | 2.58 |
| |
| CPI | | | |
| Consumer Price Index | 0.61% | 1.24% | 2.21% |
3
0% since late 2008, when the Federal Reserve Board set its target for short-term interest rates between 0% and 0.25%.
BP’s troubles in the Gulf hurt the fund’s results
Vanguard Energy Fund began the fiscal half-year on solid footing, plummeted in May and June, and sprang most of the way back in July. The fund was lifted in part by more stable global financial markets and an 8% rise in crude oil prices, as measured by the price of West Texas Intermediate crude.
However, a better-than-expected July could not overcome the earlier weakness among oil and gas companies, which dragged the fund’s overall return for the six months into negative territory.
The second calendar quarter was marked by disappointing economic and industry news. In April, the massive explosion at the Deepwater Horizon oil rig leased by BP in the Gulf of Mexico resulted in the worst environmental disaster of its kind in U.S. history. The steep decline in BP’s stock (about –30%) following the incident cut more than one percentage point from the fund’s total return for the six months.
The Energy Fund’s large stake in BP (about 4% of assets, on average) also hampered its results in comparative terms, as its former benchmark index did not include non-U.S. stocks such as BP. Relative to the Spliced Energy Index, which combines the old and new benchmarks, the fund benefited from having less exposure, on average, to Anadarko Petroleum (–23%), a
| | | |
| Expense Ratios | | | |
| Your Fund Compared With Its Peer Group | | | |
| | Investor | Admiral | Peer Group |
| | Shares | Shares | Average |
| Energy Fund | 0.38% | 0.31% | 1.52% |
The fund expense ratios shown are from the prospectus dated May 28, 2010, and represent estimated costs for the current fiscal year. For the six months ended July 31, 2010, the fund’s annualized expense ratios were 0.35% for Investor Shares and 0.29% for Admiral Shares. The peer-group expense ratio is derived from data provided by Lipper Inc. and captures information through year-end 2009.
Peer group: Global Natural Resources Funds.
4
partial owner of the Macondo site where the oil rig is located, and Transocean (–46%), owner of the Deepwater Horizon rig.
The aftermath of BP’s problems in the Gulf, including the possibility of stricter government regulation and a temporary ban on offshore drilling, had ripple effects on the energy sector. But by the end of the period, a general rise in global stock markets and BP’s belated success in controlling its oil gusher helped mitigate some of the declines of big-name oil stocks. Although Exxon Mobil, the fund’s largest holding, ended with a negative return (–6%), some other holdings, including Chevron (+8%) and ConocoPhillips (+19%), performed strongly.
The fund’s selections among natural gas companies helped its performance relative to the spliced index, particularly in the second quarter, when many oil company stocks fell. Although natural gas prices dropped by 8.5% over the six months, according to the Henry Hub (a pricing point for natural gas futures contracts), several companies in this subsector performed well, including EOG Resources (+8%) and Encana (+1%).
Diversification is important amid unpredictable markets
The stock market’s plunge in the spring and rebound in July took many investors by surprise.
Yet the unpredictable movements of the stock market should not shock you, nor should they necessarily affect your investment strategy.
The markets are never truly predictable. That is why, regardless of market conditions, we suggest you develop a portfolio that is consistent with your long-term goals, time horizon, and tolerance for the markets’ unavoidable peaks and valleys. Vanguard encourages investors to maintain a balanced portfolio of low-cost stock, bond, and short-term investments.
While it is impossible to completely shield yourself from gyrations in the market, you can cushion your assets from the brunt of such wild market swings by diversifying your portfolio among, and within, different asset classes. Vanguard Energy Fund, with its low-cost exposure to energy stocks, can play an important supporting role in such a balanced portfolio.
Thank you for entrusting your assets to Vanguard.
Sincerely,

F. William McNabb III
Chairman and Chief Executive Officer
August 11, 2010
5
Advisors’ Report
The Investor Shares of Vanguard Energy Fund returned –2.03% and the Admiral Shares –1.99% for the fiscal half-year ended July 31, 2010. Your fund is managed by two advisors, a strategy that enhances the fund’s diversification by providing exposure to distinct, yet complementary, investment approaches. It’s not uncommon for different advisors to have different views about individual securities or the broader investment environment.
The advisors, the amount and percentage of fund assets they manage, and brief descriptions of their investment strategies are presented in the table below. The advisors have also provided a discussion of the investment environment that existed during the six months and of how their portfolio positioning reflects this assessment. These reports were prepared on August 17, 2010.
Wellington Management Company, LLP
Portfolio Manager:
Karl E. Bandtel, Senior Vice President
As concerns about the global economic outlook subsided, crude oil prices rose to nearly $79 a barrel—more than 8% higher than at the beginning of the fiscal half-year. By contrast, natural gas prices ended the period at $4.81 per million BTUs, a decline of 8% for the six-month period.
| | | |
| Vanguard Energy Fund Investment Advisors | |
| |
| | Fund Assets Managed | |
| Investment Advisor | % | $ Million | Investment Strategy |
| Wellington Management | 96 | 10,234 | Emphasizes long-term total-return opportunities from |
| Company, LLP | | | the various energy subsectors: international oils, |
| | | | foreign integrated oils and foreign producers, North |
| | | | American producers, oil services and equipment, |
| | | | transportation and distribution, and refining and |
| | | | marketing. |
| Vanguard Quantitative Equity | 3 | 285 | Employs a quantitative fundamental management |
| Group | | | approach, using models that assess valuation, market |
| | | | sentiment, earnings quality and growth, and |
| | | | management decisions of companies relative to their |
| | | | peers. |
| Cash Investments | 1 | 124 | These short-term reserves are invested by Vanguard in |
| | | | equity index products to simulate investments in stock. |
| | | | Each advisor may also maintain a modest cash |
| | | | position. |
6
Angst and uncertainty proved a headwind to some industries within the energy universe. Notably, the energy equipment and services subsector was pressured by concerns about liabilities and drilling policy changes resulting from the Deepwater Horizon oil spill in the Gulf of Mexico. On the other hand, the refining and marketing industry performed better than the energy sector as a whole, as did the transmission and distribution industry.
Top contributors to performance included ConocoPhillips, Baker Hughes, and EOG Resources. EOG shares gained after the company announced promising opportunities for onshore oil development in North America. Detractors for the period included BP, Cabot Oil & Gas, and Exxon Mobil. BP shares skidded lower following the Deepwater Horizon oil spill. The market appears to be overly pessimistic about the likely outcome from that calamity. We trimmed our position in BP soon after the accident occurred, and have subsequently added to our holdings. Exxon Mobil shares fell on concerns regarding potential dilution from its acquisition of XTO Energy.
We opened new positions in Repsol, Statoil, and Inpex, and added to our existing positions in Anadarko Petroleum and Devon Energy, as well as BP. We eliminated holdings in Forest Oil and Williams and reduced our position in Weatherford International. All three stocks had performed strongly, and we found other opportunities in which to invest.
We continue to believe that the direction of oil and natural gas prices will be driven largely by underlying supply concerns, including geologic and political issues. We expect high volatility and uncertainty to continue. Our investment process remains steady, with an emphasis on high-quality management and long-lived resources at reasonable valuations.
Vanguard Quantitative Equity Group
Portfolio Manager:
James D. Troyer, CFA, Principal
The first three months of the fiscal half-year began with energy stocks performing strongly, rising 8% before dropping during the rest of the period. Continuing a theme from last year, stocks in emerging markets outperformed developed-market stocks.
Our investment process identifies individual stocks that we believe are overvalued or undervalued relative to their peers in the energy sector. We use a model with three major components to select these stocks. Each component has several elements. The first component is valuation, for which our model analyzes various earnings, cash flow, and dividend payouts for each stock. Second, the earnings quality component predicts the persistence of earnings by analyzing company financial statements. Finally, the third component is market sentiment, which evaluates signals derived from market participants. These are
7
characteristics such as the stock price movements that follow a company’s earnings announcements.
Because our model is designed to select individual stocks, we do not try to add value in the portfolio by choosing countries or currencies to favor. The resulting portfolio has a lower P/E multiple than the benchmark index with roughly the same return on equity and slightly higher growth characteristics. We believe this is an attractive combination of attributes for long-term investors.
For the period, our model was successful in selecting stocks. Our market sentiment component performed best, followed by valuation and then earnings quality. Our best-performing holdings were Cimarex Energy, Polski Koncern Naftowy, and GS Holdings. The oil spill in the Gulf of Mexico, an event that financial models could not have predicted, led to significant stock declines for BP and Transocean. Their combined performance had a small negative effect on our portion of the fund.
8
Energy Fund
Fund Profile
As of July 31, 2010
| | |
| Share-Class Characteristics | |
| | Investor | Admiral |
| | Shares | Shares |
| Ticker Symbol | VGENX | VGELX |
| Expense Ratio1 | 0.38% | 0.31% |
| 30-Day SEC Yield | 2.02% | 2.08% |
| | | |
| Portfolio Characteristics | | |
| | | | DJ |
| | | MSCI | U.S. Total |
| | | ACWI | Market |
| | Fund | Energy | Index |
| Number of Stocks | 119 | 160 | 4,101 |
| Median Market Cap | $37.4B | $64.8B | $27.0B |
| Price/Earnings Ratio | 13.6x | 13.0x | 17.4x |
| Price/Book Ratio | 1.7x | 1.7x | 2.0x |
| Return on Equity | 25.0% | 23.6% | 19.0% |
| Earnings Growth Rate | 3.2% | 6.7% | 6.7% |
| Dividend Yield | 1.9% | 2.8% | 1.9% |
| Foreign Holdings | 37.6% | 57.1% | 0.0% |
| Turnover Rate | | | |
| (Annualized) | 33% | — | — |
| Short-Term Reserves | 2.6% | — | — |
| | |
| Volatility Measures | | |
| | | DJ |
| | Spliced | U.S. Total |
| | Energy | Market |
| | Index | Index |
| R-Squared | 0.91 | 0.60 |
| Beta | 1.13 | 1.06 |
These measures show the degree and timing of the fund’s fluctuations compared with the indexes over 36 months.
| | |
| Ten Largest Holdings (% of total net assets) |
| Exxon Mobil Corp. | Integrated Oil & | |
| | Gas | 7.0% |
| Chevron Corp. | Integrated Oil & | |
| | Gas | 5.1 |
| Occidental Petroleum | Integrated Oil & | |
| Corp. | Gas | 4.4 |
| BP PLC | Integrated Oil & | |
| | Gas | 3.4 |
| EOG Resources Inc. | Oil & Gas | |
| | Exploration & | |
| | Production | 3.4 |
| Halliburton Co. | Oil & Gas | |
| | Equipment & | |
| | Services | 3.3 |
| Baker Hughes Inc. | Oil & Gas | |
| | Equipment & | |
| | Services | 3.2 |
| Schlumberger Ltd. | Oil & Gas | |
| | Equipment & | |
| | Services | 3.2 |
| ConocoPhillips | Integrated Oil & | |
| | Gas | 2.9 |
| BG Group PLC | Integrated Oil & | |
| | Gas | 2.6 |
| Top Ten | | 38.5% |
The holdings listed exclude any temporary cash investments and equity index products.
1 The expense ratios shown are from the prospectus dated May 28, 2010, and represent estimated costs for the current fiscal year. For the six months ended July 31, 2010, the annualized expense ratios were 0.35% for Investor Shares and 0.29% for Admiral Shares.
9
Energy Fund
| |
| Market Diversification (% of equity exposure) |
| Europe | |
| United Kingdom | 9.1% |
| France | 2.5 |
| Italy | 1.7 |
| Spain | 1.5 |
| Norway | 1.3 |
| Other | 0.8 |
| Subtotal | 16.9% |
| Pacific | |
| Australia | 2.1% |
| Japan | 1.0 |
| Subtotal | 3.1% |
| Emerging Markets | |
| Brazil | 2.3% |
| Russia | 2.3 |
| China | 2.2 |
| India | 1.0 |
| Other | 0.1 |
| Subtotal | 7.9% |
| North America | |
| United States | 61.7% |
| Canada | 10.4 |
| Subtotal | 72.1% |
| | |
| Subindustry Diversification (% of equity exposure) | |
| | | MSCI |
| | | ACWI |
| | Fund | Energy |
| Coal & Consumable Fuels | 4.4% | 3.1% |
| Industrials | 0.1 | 0.0 |
| Integrated Oil & Gas | 53.0 | 60.7 |
| Materials | 2.1 | 0.0 |
| Oil & Gas Drilling | 0.9 | 2.1 |
| Oil & Gas Equipment & | | |
| Services | 12.1 | 8.8 |
| Oil & Gas Exploration & | | |
| Production | 22.7 | 18.6 |
| Oil & Gas Refining & | | |
| Marketing | 2.1 | 3.5 |
| Oil & Gas Storage & | | |
| Transportation | 0.1 | 3.2 |
| Utilities | 2.0 | 0.0 |
| Other | 0.5 | 0.0 |
10
Energy Fund
Performance Summary
All of the returns in this report represent past performance, which is not a guarantee of future results that may be achieved by the fund. (Current performance may be lower or higher than the performance data cited. For performance data current to the most recent month-end, visit our website at www.vanguard.com/performance.) Note, too, that both investment returns and principal value can fluctuate widely, so an investor’s shares, when sold, could be worth more or less than their original cost. The returns shown do not reflect taxes that a shareholder would pay on fund distributions or on the sale of fund shares.
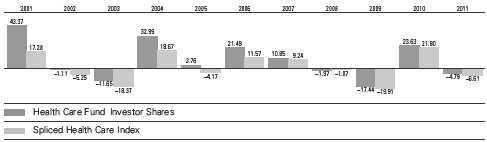
Fiscal-Year Total Returns (%): January 31, 2000, Through July 31, 2010

Spliced Energy Index: S&P Energy Sector Index through May 31, 2010; MSCI All Country World Energy Index thereafter.
Note: For 2011, performance data reflect the six months ended July 31, 2010.
Average Annual Total Returns: Periods Ended June 30, 2010
This table presents average annual total returns through the latest calendar quarter—rather than through the end of the fiscal period. Securities and Exchange Commission rules require that we provide this information.
| | | | |
| | Inception | One | Five | Ten |
| | Date | Year | Years | Years |
| Investor Shares | 5/23/1984 | 3.36% | 5.53% | 12.48% |
| Admiral Shares | 11/12/2001 | 3.43 | 5.60 | 13.641 |
| 1 Return since inception. | | | | |
Vanguard fund returns do not reflect the 1% fee on redemptions of shares held for less than one year.
See Financial Highlights for dividend and capital gains information.
11
Energy Fund
Financial Statements (unaudited)
Statement of Net Assets
As of July 31, 2010
The fund reports a complete list of its holdings in regulatory filings four times in each fiscal year, at the quarter-ends. For the second and fourth fiscal quarters, the lists appear in the fund’s semiannual and annual reports to shareholders. For the first and third fiscal quarters, the fund files the lists with the Securities and Exchange Commission on Form N-Q. Shareholders can look up the fund’s Forms N-Q on the SEC’s website at www.sec.gov. Forms N-Q may also be reviewed and copied at the SEC’s Public Reference Room (see the back cover of this report for further information).
| | | |
| | | | Market |
| | | | Value |
| | | Shares | ($000) |
| Common Stocks (97.2%)1 | | |
| United States (59.6%) | | |
| Electric Utilities (0.5%) | | |
| | Exelon Corp. | 1,257,700 | 52,610 |
| |
| Energy Equipment & Services (11.8%) | |
| | Halliburton Co. | 11,670,232 | 348,707 |
| | Baker Hughes Inc. | 7,142,800 | 344,783 |
| | Schlumberger Ltd. | 5,630,764 | 335,931 |
| * | Weatherford | | |
| | International Ltd. | 5,848,600 | 94,747 |
| * | SEACOR Holdings Inc. | 933,908 | 77,346 |
| | National Oilwell Varco Inc. | 1,189,776 | 46,592 |
| | Helmerich & Payne Inc. | 46,500 | 1,885 |
| * | Rowan Cos. Inc. | 71,600 | 1,809 |
| * | Transocean Ltd. | 32,406 | 1,497 |
| | | | 1,253,297 |
| Exchange-Traded Fund (0.5%) | |
| ^,2 | Vanguard Energy ETF | 663,000 | 52,171 |
| |
| Gas Utilities (1.4%) | | |
| | EQT Corp. | 3,714,800 | 136,259 |
| | Questar Corp. | 895,018 | 14,723 |
| | | | 150,982 |
| Oil, Gas & Consumable Fuels (45.4%) | |
| | Coal & Consumable Fuels (3.7%) | |
| | Consol Energy Inc. | 5,866,700 | 219,884 |
| | Peabody Energy Corp. | 3,794,000 | 171,299 |
| |
| | Integrated Oil & Gas (23.6%) | |
| | Exxon Mobil Corp. | 12,397,019 | 739,854 |
| | Chevron Corp. | 7,143,235 | 544,386 |
| | Occidental | | |
| | Petroleum Corp. | 5,988,401 | 466,676 |
| | ConocoPhillips | 5,550,409 | 306,494 |
| | Marathon Oil Corp. | 7,782,091 | 260,311 |
| | Hess Corp. | 3,668,489 | 196,594 |
| | | |
| | | | Market |
| | | | Value |
| | | Shares | ($000) |
| | Oil & Gas Exploration & Production (17.1%) |
| | EOG Resources Inc. | 3,685,336 | 359,320 |
| | Noble Energy Inc. | 3,601,600 | 241,523 |
| 3 | Cabot Oil & Gas Corp. | 6,728,131 | 205,006 |
| | Devon Energy Corp. | 3,223,807 | 201,456 |
| | Anadarko Petroleum Corp. 3,756,060 | 184,648 |
| * | Denbury Resources Inc. | 8,785,444 | 139,161 |
| * | Ultra Petroleum Corp. | 2,429,636 | 102,944 |
| | Chesapeake Energy Corp. | 4,211,437 | 88,567 |
| | Range Resources Corp. | 1,855,000 | 68,858 |
| * | Newfield Exploration Co. | 1,190,003 | 63,618 |
| * | Southwestern Energy Co. | 1,513,300 | 55,160 |
| * | QEP Resources Inc. | 895,018 | 30,806 |
| * | Quicksilver Resources Inc. 2,336,973 | 29,422 |
| * | Plains Exploration & | | |
| | Production Co. | 1,202,119 | 27,108 |
| * | SandRidge Energy Inc. | 3,024,400 | 17,844 |
| | Apache Corp. | 53,070 | 5,072 |
| |
| | Oil & Gas Refining & Marketing (1.0%) |
| | Valero Energy Corp. | 5,986,742 | 101,715 |
| | Sunoco Inc. | 18,900 | 674 |
| |
| | Oil & Gas Storage & Transportation (0.0%) |
| | Williams Cos. Inc. | 137,500 | 2,669 |
| | El Paso Corp. | 201,400 | 2,481 |
| | Spectra Energy Corp. | 1,200 | 25 |
| | | | 4,833,575 |
| Total United States | | 6,342,635 |
| International (37.6%) | | |
| Australia (2.1%) | | |
| ^ | BHP Billiton Ltd. ADR | 3,060,000 | 221,024 |
| | Woodside Petroleum Ltd. | 20,644 | 779 |
| | | | 221,803 |
| Austria (0.8%) | | |
| | OMV AG | 2,488,530 | 83,207 |
12
Energy Fund
| | |
| | | Market |
| | | Value |
| | Shares | ($000) |
| Brazil (2.3%) | | |
| Petroleo Brasileiro | | |
| SA ADR | 6,412,800 | 233,426 |
| Petroleo Brasileiro SA | | |
| Prior Pfd. | 310,820 | 4,927 |
| Petroleo Brasileiro SA | 219,342 | 3,982 |
| Petroleo Brasileiro SA | | |
| ADR Type A | 23,450 | 747 |
| | | 243,082 |
| Canada (10.1%) | | |
| Suncor Energy Inc. | 8,177,112 | 269,436 |
| Canadian Natural | | |
| Resources Ltd. | 6,550,518 | 225,469 |
| Cenovus Energy Inc. | 5,289,700 | 149,170 |
| Husky Energy Inc. | 4,765,900 | 117,102 |
| Encana Corp. | 3,011,200 | 91,932 |
| Imperial Oil Ltd. | 1,540,977 | 60,036 |
| Cameco Corp. | 2,347,800 | 59,845 |
| ^ Penn West Energy Trust | 2,482,121 | 48,128 |
| Canadian Oil Sands Trust | 1,599,575 | 42,069 |
| Suncor Energy Inc. | 125,184 | 4,127 |
| Encana Corp. | 128,139 | 3,917 |
| Cenovus Energy Inc. | 131,439 | 3,701 |
| Canadian Natural | | |
| Resources Ltd. | 81,478 | 2,806 |
| TransCanada Corp. | 33,196 | 1,173 |
| Enbridge Inc. | 9,000 | 438 |
| Talisman Energy Inc. | 24,173 | 413 |
| | | 1,079,762 |
| China (2.2%) | | |
| PetroChina Co. Ltd. ADR | 1,918,700 | 219,634 |
| CNOOC Ltd. | 2,797,717 | 4,715 |
| China Petroleum & | | |
| Chemical Corp. | 3,506,000 | 2,829 |
| Yanzhou Coal | | |
| Mining Co. Ltd. | 898,000 | 1,937 |
| PetroChina Co. Ltd. | 1,024,000 | 1,171 |
| China Oilfield Services Ltd. | 708,000 | 933 |
| | | 231,219 |
| Finland (0.0%) | | |
| Neste Oil Oyj | 102,567 | 1,513 |
| |
| France (2.4%) | | |
| Total SA ADR | 4,801,300 | 243,090 |
| Total SA | 262,442 | 13,248 |
| Technip SA | 33,395 | 2,223 |
| | | 258,561 |
| Hungary (0.0%) | | |
| * MOL Hungarian | | |
| Oil and Gas PLC | 21,198 | 1,906 |
| |
| India (1.0%) | | |
| Reliance Industries Ltd. | 4,719,974 | 102,875 |
| | | |
| | | | Market |
| | | | Value |
| | | Shares | ($000) |
| | Oil & Natural | | |
| | Gas Corp. Ltd. | 76,693 | 2,055 |
| | Bharat Petroleum Corp. Ltd. | 112,984 | 1,562 |
| | | | 106,492 |
| Indonesia (0.0%) | | |
| | Adaro Energy Tbk PT | 7,842,000 | 1,759 |
| | Indo Tambangraya | | |
| | Megah PT | 372,000 | 1,561 |
| | | | 3,320 |
| Italy (1.7%) | | |
| | ENI SPA ADR | 4,166,750 | 170,462 |
| | ENI SPA | 361,907 | 7,395 |
| | Tenaris SA | 125,252 | 2,502 |
| | Saipem SPA | 6,630 | 238 |
| | | | 180,597 |
| Japan (1.0%) | | |
| ^ | Inpex Corp. | 21,436 | 104,862 |
| * | JX Holdings Inc. | 517,500 | 2,803 |
| | | | 107,665 |
| Malaysia (0.0%) | | |
| | Petronas Dagangan Bhd. | 419,000 | 1,354 |
| |
| Norway (1.3%) | | |
| | Statoil ASA ADR | 6,146,300 | 124,954 |
| | Statoil ASA | 191,560 | 3,875 |
| | Seadrill Ltd. | 100,150 | 2,315 |
| | Aker Solutions ASA | 129,973 | 1,682 |
| | | | 132,826 |
| Poland (0.0%) | | |
| * | Polski Koncern | | |
| | Naftowy Orlen | 156,378 | 1,990 |
| * | Grupa Lotos SA | 97,133 | 1,023 |
| | | | 3,013 |
| Russia (2.2%) | | |
| | Gazprom OAO ADR | 7,466,206 | 161,329 |
| | Rosneft Oil Co. GDR | 9,625,796 | 64,365 |
| | Lukoil OAO ADR | 79,913 | 4,562 |
| | Tatneft ADR | 76,091 | 2,353 |
| | Surgutneftegas OJSC ADR | 156,190 | 1,585 |
| | Surgutneftegas OJSC | | |
| | Prior Pfd. | 2,392,936 | 1,091 |
| | Gazprom OAO | 124,674 | 667 |
| | | | 235,952 |
| South Africa (0.0%) | | |
| | Sasol Ltd. | 22,805 | 904 |
| |
| South Korea (0.0%) | | |
| | GS Holdings | 50,420 | 1,766 |
| |
| Spain (1.5%) | | |
| | Repsol YPF SA ADR | 6,469,900 | 153,013 |
| | Repsol YPF SA | 149,761 | 3,531 |
| | | | 156,544 |
13
Energy Fund
| | |
| | | Market |
| | | Value |
| | Shares | ($000) |
| Thailand (0.1%) | | |
| PTT PCL (Foreign) | 292,100 | 2,305 |
| Banpu PCL | 99,700 | 1,932 |
| PTT Aromatics & | | |
| Refining PCL (Foreign) | 1,913,700 | 1,386 |
| IRPC PCL (Foreign) | 1,628,600 | 196 |
| | | 5,819 |
| Turkey (0.0%) | | |
| Tupras Turkiye | | |
| Petrol Rafine | 84,298 | 1,918 |
| |
| United Kingdom (8.9%) | | |
| BP PLC ADR | 8,992,100 | 345,926 |
| BG Group PLC | 17,489,102 | 280,474 |
| Royal Dutch Shell | | |
| PLC ADR | 3,486,200 | 193,205 |
| Ensco PLC ADR | 1,971,900 | 82,445 |
| BP PLC | 2,266,380 | 14,494 |
| Royal Dutch | | |
| Shell PLC Class A | 325,010 | 8,951 |
| Royal Dutch | | |
| Shell PLC Class B | 325,712 | 8,605 |
| * Hansen Transmissions | | |
| International NV | 6,645,381 | 7,104 |
| Royal Dutch | | |
| Shell PLC Class A | | |
| (Amsterdam Shares) | 93,699 | 2,584 |
| Tullow Oil PLC | 16,160 | 312 |
| | | 944,100 |
| Total International | | 4,003,323 |
| Total Common Stocks | | |
| (Cost $7,548,476) | | 10,345,958 |
| Temporary Cash Investments (4.2%)1 | |
| Money Market Fund (1.5%) | | |
| 4,5 Vanguard Market | | |
| Liquidity Fund, 0.297% | 153,381,718 | 153,382 |
| | | |
| | | Face | Market |
| | | Amount | Value |
| | | ($000) | ($000) |
| Repurchase Agreement (2.5%) | | |
| | Deutsche Bank | | |
| | Securities, Inc. 0.210%, | | |
| | 8/2/10 (Dated 7/30/10, | | |
| | Repurchase Value | | |
| | $268,805,000, collateralized | | |
| | by Government National | | |
| | Mortgage Assn. | | |
| | 5.000%, 6/20/40–7/20/40) | 268,800 | 268,800 |
| |
| U.S. Government and Agency Obligations (0.2%) |
| 6,7 | Fannie Mae Discount | | |
| | Notes, 0.300%, 9/8/10 | 2,000 | 2,000 |
| 6,7 | Freddie Mac Discount | | |
| | Notes, 0.320%, 9/7/10 | 15,390 | 15,387 |
| 6,7 | Freddie Mac Discount | | |
| | Notes, 0.245%, 9/21/10 | 500 | 500 |
| 6,7 | Freddie Mac Discount | | |
| | Notes, 0.361%, 12/16/10 | 2,500 | 2,498 |
| | | | 20,385 |
| Total Temporary Cash Investments | |
| (Cost $442,563) | | 442,567 |
| Total Investments (101.4%) | | |
| (Cost $7,991,039) | | 10,788,525 |
| Other Assets and Liabilities (-1.4%) | |
| Other Assets | | 25,724 |
| Liabilities5 | | (171,352) |
| | | | (145,628) |
| Net Assets (100%) | | 10,642,897 |
14
Energy Fund
| |
| At July 31, 2010, net assets consisted of: |
| | Amount |
| | ($000) |
| Paid-in Capital | 7,624,429 |
| Undistributed Net Investment Income | 83,554 |
| Accumulated Net Realized Gains | 134,985 |
| Unrealized Appreciation (Depreciation) | |
| Investment Securities | 2,797,486 |
| Futures Contracts | 2,447 |
| Foreign Currencies | (4) |
| Net Assets | 10,642,897 |
| |
| Investor Shares—Net Assets | |
| Applicable to 112,117,063 outstanding | |
| $.001 par value shares of beneficial | |
| interest (unlimited authorization) | 6,237,331 |
| Net Asset Value Per Share— | |
| Investor Shares | $55.63 |
| |
| Admiral Shares—Net Assets | |
| Applicable to 42,164,284 outstanding | |
| $.001 par value shares of beneficial | |
| interest (unlimited authorization) | 4,405,566 |
| Net Asset Value Per Share— | |
| Admiral Shares | $104.49 |
See Note A in Notes to Financial Statements.
* Non-income-producing security.
^ Part of security position is on loan to broker-dealers. The total value of securities on loan is $95,160,000.
1 The fund invests a portion of its cash reserves in equity markets through the use of futures contracts. After giving effect to futures investments, the fund’s effective positions in common stock and temporary cash investments represent 97.9% and 3.5%, respectively, of net assets.
2 Considered an affiliated company of the fund as the issuer is another member of The Vanguard Group.
3 Considered an affiliated company of the fund as the fund owns more than 5% of the outstanding voting securities of such company.
4 Affiliated money market fund available only to Vanguard funds and certain trusts and accounts managed by Vanguard. Rate shown is the 7-day yield.
5 Includes $98,670,000 of collateral received for securities on loan.
6 The issuer operates under a congressional charter; its securities are not backed by the full faith and credit of the U.S. government.
7 Securities with a value of $20,385,000 have been segregated as initial margin for open futures contracts.
ADR—American Depositary Receipt.
GDR—Global Depositary Receipt.
See accompanying Notes, which are an integral part of the Financial Statements.
15
Energy Fund
| |
| Statement of Operations | |
| |
| | Six Months Ended |
| | July 31, 2010 |
| | ($000) |
| Investment Income | |
| Income | |
| Dividends1,2 | 117,066 |
| Interest2 | 424 |
| Security Lending | 3,103 |
| Total Income | 120,593 |
| Expenses | |
| Investment Advisory Fees—Note B | |
| Basic Fee | 7,880 |
| Performance Adjustment | 634 |
| The Vanguard Group—Note C | |
| Management and Administrative—Investor Shares | 5,395 |
| Management and Administrative—Admiral Shares | 2,399 |
| Marketing and Distribution—Investor Shares | 774 |
| Marketing and Distribution—Admiral Shares | 503 |
| Custodian Fees | 303 |
| Shareholders’ Reports—Investor Shares | 37 |
| Shareholders’ Reports—Admiral Shares | 6 |
| Trustees’ Fees and Expenses | 9 |
| Total Expenses | 17,940 |
| Expenses Paid Indirectly | (65) |
| Net Expenses | 17,875 |
| Net Investment Income | 102,718 |
| Realized Net Gain (Loss) | |
| Investment Securities Sold2 | 147,558 |
| Futures Contracts | (1,038) |
| Foreign Currencies | (263) |
| Realized Net Gain (Loss) | 146,257 |
| Change in Unrealized Appreciation (Depreciation) | |
| Investment Securities | (495,425) |
| Futures Contracts | 13,599 |
| Foreign Currencies | (22) |
| Change in Unrealized Appreciation (Depreciation) | (481,848) |
| Net Increase (Decrease) in Net Assets Resulting from Operations | (232,873) |
1 Dividends are net of foreign withholding taxes of $7,658,000.
2 Dividend income, interest income, and realized net gain (loss) from affiliated companies of the fund were $344,000, $160,000, and $0, respectively.
See accompanying Notes, which are an integral part of the Financial Statements.
16
Energy Fund
| | |
| Statement of Changes in Net Assets | | |
| |
| | Six Months Ended | Year Ended |
| | July 31, | January 31, |
| | 2010 | 2010 |
| | ($000) | ($000) |
| Increase (Decrease) in Net Assets | | |
| Operations | | |
| Net Investment Income | 102,718 | 171,663 |
| Realized Net Gain (Loss) | 146,257 | 222,696 |
| Change in Unrealized Appreciation (Depreciation) | (481,848) | 2,364,619 |
| Net Increase (Decrease) in Net Assets Resulting from Operations | (232,873) | 2,758,978 |
| Distributions | | |
| Net Investment Income | | |
| Investor Shares | — | (105,714) |
| Admiral Shares | — | (74,777) |
| Realized Capital Gain1 | | |
| Investor Shares | (45,868) | — |
| Admiral Shares | (31,704) | — |
| Total Distributions | (77,572) | (180,491) |
| Capital Share Transactions | | |
| Investor Shares | (113,794) | 565,224 |
| Admiral Shares | 92,471 | 508,755 |
| Net Increase (Decrease) from Capital Share Transactions | (21,323) | 1,073,979 |
| Total Increase (Decrease) | (331,768) | 3,652,466 |
| Net Assets | | |
| Beginning of Period | 10,974,665 | 7,322,199 |
| End of Period2 | 10,642,897 | 10,974,665 |
1 Includes fiscal 2011 short-term gain distributions totaling $15,050,000. Short-term gain distributions are treated as ordinary income dividends for tax purposes.
2 Net Assets—End of Period includes undistributed (overdistributed) net investment income of $83,554,000 and ($18,896,000).
See accompanying Notes, which are an integral part of the Financial Statements.
17
Energy Fund
| | | | | | |
| Financial Highlights | | | | | | |
| |
| Investor Shares | | | | | | |
| Six Months | | | | | |
| | Ended | | | | | |
| For a Share Outstanding | July 31, | | | Year Ended January 31, |
| Throughout Each Period | 2010 | 2010 | 2009 | 2008 | 2007 | 2006 |
| Net Asset Value, Beginning of Period | $57.17 | $42.62 | $73.93 | $63.55 | $64.50 | $40.85 |
| Investment Operations | | | | | | |
| Net Investment Income | .529 | .910 | 1.2761 | 1.226 | 1.112 | .813 |
| Net Realized and Unrealized Gain | | | | | | |
| (Loss) on Investments | (1.667) | 14.591 | (28.853) | 14.639 | .405 | 24.606 |
| Total from Investment Operations | (1.138) | 15.501 | (27.577) | 15.865 | 1.517 | 25.419 |
| Distributions | | | | | | |
| Dividends from Net Investment Income | — | (.951) | (1.264) | (1.177) | (1.020) | (.740) |
| Distributions from Realized Capital Gains | (.402) | — | (2.469) | (4.308) | (1.447) | (1.029) |
| Total Distributions | (.402) | (.951) | (3.733) | (5.485) | (2.467) | (1.769) |
| Net Asset Value, End of Period | $55.63 | $57.17 | $42.62 | $73.93 | $63.55 | $64.50 |
| |
| Total Return2 | -2.03% | 36.28% | -38.51% | 25.02% | 2.24% | 62.93% |
| |
| Ratios/Supplemental Data | | | | | | |
| Net Assets, End of Period (Millions) | $6,237 | $6,536 | $4,434 | $7,919 | $6,479 | $6,733 |
| Ratio of Total Expenses to Average | | | | | | |
| Net Assets | 0.35%3,4 | 0.38%3 | 0.28%3 | 0.25% | 0.25% | 0.28% |
| Ratio of Net Investment Income to | | | | | | |
| Average Net Assets | 1.85%4 | 1.73% | 1.84% | 1.67% | 1.71% | 1.57% |
| Portfolio Turnover Rate5 | 33%4 | 27% | 21% | 22% | 22% | 10% |
1 Calculated based on average shares outstanding.
2 Total returns do not reflect the 1% fee assessed on redemptions of shares held for less than one year, nor do they include the account service fee that may be applicable to certain accounts with balances below $10,000.
3 Includes performance-based investment advisory fee increases (decreases) of 0.01% for fiscal 2011, 0.03% for fiscal 2010, and 0.01% for fiscal 2009.
4 Annualized.
5 Excludes the value of portfolio securities received or delivered as a result of in-kind purchases or redemptions of the fund’s capital shares.
See accompanying Notes, which are an integral part of the Financial Statements.
18
Energy Fund
| | | | | | |
| Financial Highlights | | | | | | |
| |
| Admiral Shares | | | | | | |
| Six Months | | | | | |
| | Ended | | | | | |
| For a Share Outstanding | July 31, | | | Year Ended January 31, |
| Throughout Each Period | 2010 | 2010 | 2009 | 2008 | 2007 | 2006 |
| Net Asset Value, Beginning of Period | $107.34 | $80.02 | $138.86 | $119.35 | $121.13 | $76.71 |
| Investment Operations | | | | | | |
| Net Investment Income | 1.028 | 1.780 | 2.4801 | 2.418 | 2.180 | 1.561 |
| Net Realized and Unrealized Gain (Loss) | | | | | | |
| on Investments | (3.124) | 27.395 | (54.203) | 27.505 | .757 | 46.217 |
| Total from Investment Operations | (2.096) | 29.175 | (51.723) | 29.923 | 2.937 | 47.778 |
| Distributions | | | | | | |
| Dividends from Net Investment Income | — | (1.855) | (2.480) | (2.322) | (2.000) | (1.425) |
| Distributions from Realized Capital Gains | (.754) | — | (4.637) | (8.091) | (2.717) | (1.933) |
| Total Distributions | (.754) | (1.855) | (7.117) | (10.413) | (4.717) | (3.358) |
| Net Asset Value, End of Period | $104.49 | $107.34 | $80.02 | $138.86 | $119.35 | $121.13 |
| |
| Total Return2 | -1.99% | 36.37% | -38.46% | 25.13% | 2.32% | 63.00% |
| |
| Ratios/Supplemental Data | | | | | | |
| Net Assets, End of Period (Millions) | $4,406 | $4,439 | $2,889 | $5,214 | $3,612 | $3,088 |
| Ratio of Total Expenses to | | | | | | |
| Average Net Assets | 0.29%3,4 | 0.31%3 | 0.21%3 | 0.17% | 0.18% | 0.22% |
| Ratio of Net Investment Income to | | | | | | |
| Average Net Assets | 1.91%4 | 1.80% | 1.91% | 1.75% | 1.78% | 1.63% |
| Portfolio Turnover Rate5 | 33%4 | 27% | 21% | 22% | 22% | 10% |
1 Calculated based on average shares outstanding.
2 Total returns do not reflect the 1% fee assessed on redemptions of shares held for less than one year.
3 Includes performance-based investment advisory fee increases (decreases) of 0.01% for fiscal 2011, 0.03% for fiscal 2010, and 0.01% for fiscal 2009.
4 Annualized.
5 Excludes the value of portfolio securities received or delivered as a result of in-kind purchases or redemptions of the fund’s capital shares.
See accompanying Notes, which are an integral part of the Financial Statements.
19
Energy Fund
Notes to Financial Statements
Vanguard Energy Fund is registered under the Investment Company Act of 1940 as an open-end investment company, or mutual fund. The fund invests in securities of foreign issuers, which may subject it to investment risks not normally associated with investing in securities of U.S. corporations. The fund offers two classes of shares: Investor Shares and Admiral Shares. Investor Shares are available to any investor who meets the fund’s minimum purchase requirements. Admiral Shares are designed for investors who meet certain administrative, service, tenure, and account-size criteria.
A. The following significant accounting policies conform to generally accepted accounting principles for U.S. mutual funds. The fund consistently follows such policies in preparing its financial statements.
1. Security Valuation: Securities are valued as of the close of trading on the New York Stock Exchange (generally 4 p.m., Eastern time) on the valuation date. Equity securities are valued at the latest quoted sales prices or official closing prices taken from the primary market in which each security trades; such securities not traded on the valuation date are valued at the mean of the latest quoted bid and asked prices. Securities for which market quotations are not readily available, or whose values have been affected by events occurring before the fund’s pricing time but after the close of the securities’ primary markets, are valued at their fair values calculated according to procedures adopted by the board of trustees. These procedures include obtaining quotations from an independent pricing service, monitoring news to identify significant market- or security-specific events, and evaluating changes in the values of foreign market proxi es (for example, ADRs, futures contracts, or exchange-traded funds), between the time the foreign markets close and the fund’s pricing time. When fair-value pricing is employed, the prices of securities used by a fund to calculate its net asset value may differ from quoted or published prices for the same securities. Investments in Vanguard Market Liquidity Fund are valued at that fund’s net asset value. Temporary cash investments acquired over 60 days to maturity are valued using the latest bid prices or using valuations based on a matrix system (which considers such factors as security prices, yields, maturities, and ratings), both as furnished by independent pricing services. Other temporary cash investments are valued at amortized cost, which approximates market value.
2. Foreign Currency: Securities and other assets and liabilities denominated in foreign currencies are translated into U.S. dollars using exchange rates obtained from an independent third party as of the fund’s pricing time on the valuation date. Realized gains (losses) and unrealized appreciation (depreciation) on investment securities include the effects of changes in exchange rates since the securities were purchased, combined with the effects of changes in security prices. Fluctuations in the value of other assets and liabilities resulting from changes in exchange rates are recorded as unrealized foreign currency gains (losses) until the assets or liabilities are settled in cash, at which time they are recorded as realized foreign currency gains (losses).
3. Futures Contracts: The fund uses index futures contracts to a limited extent, with the objective of maintaining full exposure to the stock market while maintaining liquidity. The fund may purchase or sell futures contracts to achieve a desired level of investment, whether to accommodate portfolio turnover or cash flows from capital share transactions. The primary risks associated with the use of futures contracts are imperfect correlation between changes in market values of stocks held by the fund and the prices of futures contracts, and the possibility of an illiquid market.
Futures contracts are valued at their quoted daily settlement prices. The aggregate principal amounts of the contracts are not recorded in the Statement of Net Assets. Fluctuations in the value of the contracts are recorded in the Statement of Net Assets as an asset (liability) and in the Statement of Operations as unrealized appreciation (depreciation) until the contracts are closed, when they are recorded as realized futures gains (losses).
20
Energy Fund
4. Repurchase Agreements: The fund may invest in repurchase agreements. Securities pledged as collateral for repurchase agreements are held by a custodian bank until the agreements mature. Each agreement requires that the market value of the collateral be sufficient to cover payments of interest and principal; however, in the event of default or bankruptcy by the other party to the agreement, retention of the collateral may be subject to legal proceedings.
5. Federal Income Taxes: The fund intends to continue to qualify as a regulated investment company and distribute all of its taxable income. Management has analyzed the fund’s tax positions taken for all open federal income tax years (January 31, 2007–2010), and for the period ended July 31, 2010, and has concluded that no provision for federal income tax is required in the fund’s financial statements.
6. Distributions: Distributions to shareholders are recorded on the ex-dividend date.
7. Security Lending: The fund may lend its securities to qualified institutional borrowers to earn additional income. Security loans are required to be secured at all times by collateral at least equal to the market value of securities loaned. The fund invests cash collateral received in Vanguard Market Liquidity Fund, and records a liability for the return of the collateral, during the period the securities are on loan. Security lending income represents the income earned on investing cash collateral, less expenses associated with the loan.
8. Other: Dividend income is recorded on the ex-dividend date. Interest income includes income distributions received from Vanguard Market Liquidity Fund and is accrued daily. Security transactions are accounted for on the date securities are bought or sold. Costs used to determine realized gains (losses) on the sale of investment securities are those of the specific securities sold. Fees assessed on redemptions of capital shares are credited to paid-in capital.
Each class of shares has equal rights as to assets and earnings, except that each class separately bears certain class-specific expenses related to maintenance of shareholder accounts (included in Management and Administrative expenses) and shareholder reporting. Marketing and distribution expenses are allocated to each class of shares based on a method approved by the board of trustees. Income, other non-class-specific expenses, and gains and losses on investments are allocated to each class of shares based on its relative net assets.
B. Wellington Management Company, LLP, provides investment advisory services to a portion of the fund for a fee calculated at an annual percentage rate of average net assets managed by the advisor. The basic fee is subject to quarterly adjustments based on the fund’s performance for the preceding three years relative to a combined index composed of the S&P Citigroup BMI World Energy Index and the S&P 500 Energy Equal Weighted Blend Index.
The Vanguard Group provides investment advisory services to a portion of the fund on an at-cost basis; the fund paid Vanguard advisory fees of $149,000 for the six months ended July 31, 2010.
For the six months ended July 31, 2010, the aggregate investment advisory fee represented an effective annual basic rate of 0.14% of the fund’s average net assets, before an increase of $634,000 (0.01%) based on performance.
C. The Vanguard Group furnishes at cost corporate management, administrative, marketing, and distribution services. The costs of such services are allocated to the fund under methods approved by the board of trustees. The fund has committed to provide up to 0.40% of its net assets in capital contributions to Vanguard. At July 31, 2010, the fund had contributed capital of $1,933,000 to Vanguard (included in Other Assets), representing 0.02% of the fund’s net assets and 0.77% of Vanguard’s capitalization. The fund’s trustees and officers are also directors and officers of Vanguard.
21
Energy Fund
D. The fund has asked its investment advisors to direct certain security trades, subject to obtaining the best price and execution, to brokers who have agreed to rebate to the fund part of the commissions generated. Such rebates are used solely to reduce the fund’s management and administrative expenses. For the six months ended July 31, 2010, these arrangements reduced the fund’s expenses by $65,000 (an annual rate of 0.00% of average net assets).
E. Various inputs may be used to determine the value of the fund’s investments. These inputs are summarized in three broad levels for financial statement purposes. The inputs or methodologies used to value securities are not necessarily an indication of the risk associated with investing in those securities.
Level 1—Quoted prices in active markets for identical securities.
Level 2—Other significant observable inputs (including quoted prices for similar securities, interest rates, prepayment speeds, credit risk, etc.).
Level 3—Significant unobservable inputs (including the fund’s own assumptions used to determine the fair value of investments).
The following table summarizes the fund’s investments as of July 31, 2010, based on the inputs used
to value them:
| | | |
| | Level 1 | Level 2 | Level 3 |
| Investments | ($000) | ($000) | ($000) |
| Common Stocks—United States | 6,342,635 | — | — |
| Common Stocks—International | 3,076,596 | 926,727 | — |
| Temporary Cash Investments | 153,382 | 289,185 | — |
| Futures Contracts—Assets1 | 104 | — | — |
| Futures Contracts—Liabilities1 | (7) | — | — |
| Total | 9,572,710 | 1,215,912 | — |
| 1 Represents variation margin on the last day of the reporting period. | | | |
F. At July 31, 2010, the aggregate settlement value of open futures contracts and the related unrealized appreciation (depreciation) were:
| | | | |
| | | | | ($000) |
| | | | Aggregate | |
| | | Number of | Settlement | Unrealized |
| | | Long (Short) | Value | Appreciation |
| Futures Contracts | Expiration | Contracts | Long (Short) | (Depreciation) |
| S&P 500 Index | September 2010 | 156 | 42,834 | 1,692 |
| E-mini S&P 500 Index | September 2010 | 543 | 29,819 | 755 |
Unrealized appreciation (depreciation) on open futures contracts is required to be treated as realized gain (loss) for tax purposes.
G. Distributions are determined on a tax basis and may differ from net investment income and realized capital gains for financial reporting purposes. Differences may be permanent or temporary. Permanent differences are reclassified among capital accounts in the financial statements to reflect their tax character. Temporary differences arise when certain items of income, expense, gain, or loss are recognized in different periods for financial statement and tax purposes; these differences will reverse
22
Energy Fund
at some time in the future. Differences in classification may also result from the treatment of short-term gains as ordinary income for tax purposes. The fund’s tax-basis capital gains and losses are determined only at the end of each fiscal year.
During the six months ended July 31, 2010, the fund realized net foreign currency losses of $263,000, which decreased distributable net income for tax purposes; accordingly, such losses have been reclassified from accumulated net realized gains to undistributed net investment income.
At July 31, 2010, the cost of investment securities for tax purposes was $7,991,039,000. Net unrealized appreciation of investment securities for tax purposes was $2,797,486,000, consisting of unrealized gains of $3,259,761,000 on securities that had risen in value since their purchase and $462,275,000 in unrealized losses on securities that had fallen in value since their purchase.
H. During the six months ended July 31, 2010, the fund purchased $2,065,281,000 of investment securities and sold $1,726,594,000 of investment securities, other than temporary cash investments.
I. Capital share transactions for each class of shares were:
| | | | |
| | Six Months Ended | | Year Ended |
| | | July 31, 2010 | January 31, 2010 |
| | Amount | Shares | Amount | Shares |
| | ($000) | (000) | ($000) | (000) |
| Investor Shares | | | | |
| Issued | 489,106 | 8,442 | 1,489,177 | 28,171 |
| Issued in Lieu of Cash Distributions | 44,178 | 749 | 101,349 | 1,698 |
| Redeemed1 | (647,078) | (11,398) | (1,025,302) | (19,560) |
| Net Increase (Decrease)—Investor Shares | (113,794) | (2,207) | 565,224 | 10,309 |
| Admiral Shares | | | | |
| Issued | 445,094 | 4,114 | 1,126,454 | 11,663 |
| Issued in Lieu of Cash Distributions | 28,143 | 254 | 65,102 | 582 |
| Redeemed1 | (380,766) | (3,553) | (682,801) | (6,994) |
| Net Increase (Decrease)—Admiral Shares | 92,471 | 815 | 508,755 | 5,251 |
| 1 Net of redemption fees for fiscal 2011 and 2010 of $1,526,000 and $3,460,000, respectively (fund totals). | | |
23
Energy Fund
J. The fund has invested in a company that is considered to be an affiliated company of the fund because the fund owns more than 5% of the outstanding voting securities of the company. Transactions during the period in securities of this company were as follows:
| | | | | |
| | | | Current Period Transactions | |
| | Jan. 31, 2010 | | Proceeds from | | July 31, 2010 |
| | Market | Purchases | Securities | Dividend | Market |
| | Value | at Cost | Sold | Income | Value |
| | ($000) | ($000) | ($000) | ($000) | ($000) |
| Cabot Oil & Gas Corp. | N/A1 | 68,009 | — | 344 | 205,006 |
| 1 Not applicable—At January 31, 2010, the issuer was not an affiliated company of the fund. | | |
K. In preparing the financial statements as of July 31, 2010, management considered the impact of subsequent events for potential recognition or disclosure in these financial statements.
24
About Your Fund’s Expenses
As a shareholder of the fund, you incur ongoing costs, which include costs for portfolio management, administrative services, and shareholder reports (like this one), among others. Operating expenses, which are deducted from a fund’s gross income, directly reduce the investment return of the fund.
A fund’s expenses are expressed as a percentage of its average net assets. This figure is known as the expense ratio. The following examples are intended to help you understand the ongoing costs (in dollars) of investing in your fund and to compare these costs with those of other mutual funds. The examples are based on an investment of $1,000 made at the beginning of the period shown and held for the entire period.
The accompanying table illustrates your fund’s costs in two ways:
• Based on actual fund return. This section helps you to estimate the actual expenses that you paid over the period. The ”Ending Account Value“ shown is derived from the fund‘s actual return, and the third column shows the dollar amount that would have been paid by an investor who started with $1,000 in the fund. You may use the information here, together with the amount you invested, to estimate the expenses that you paid over the period.
To do so, simply divide your account value by $1,000 (for example, an $8,600 account value divided by $1,000 = 8.6), then multiply the result by the number given for your fund under the heading ”Expenses Paid During Period.“
• Based on hypothetical 5% yearly return. This section is intended to help you compare your fund‘s costs with those of other mutual funds. It assumes that the fund had a yearly return of 5% before expenses, but that the expense ratio is unchanged. In this case—because the return used is not the fund’s actual return—the results do not apply to your investment. The example is useful in making comparisons because the Securities and Exchange Commission requires all mutual funds to calculate expenses based on a 5% return. You can assess your fund’s costs by comparing this hypothetical example with the hypothetical examples that appear in shareholder reports of other funds.
Note that the expenses shown in the table are meant to highlight and help you compare ongoing costs only and do not reflect transaction costs incurred by the fund for buying and selling securities. Further, the expenses do not include the 1% fee on redemptions of shares held for less than one year, nor do they include the account service fee described in the prospectus. If such fees were applied to your account, your costs would be higher. Your fund does not carry a “sales load.” The calculations assume no shares were bought or sold during the period. Your actual costs may have been higher or lower, depending on the amount of your investment and the timing of any purchases or redemptions.
You can find more information about the fund’s expenses, including annual expense ratios, in the Financial Statements section of this report. For additional information on operating expenses and other shareholder costs, please refer to your fund’s current prospectus.
25
| | | |
| Six Months Ended July 31, 2010 | | | |
| | Beginning | Ending | Expenses |
| | Account Value | Account Value | Paid During |
| Energy Fund | 1/31/2010 | 7/31/2010 | Period |
| Based on Actual Fund Return | | | |
| Investor Shares | $1,000.00 | $979.70 | $1.72 |
| Admiral Shares | 1,000.00 | 980.08 | 1.42 |
| Based on Hypothetical 5% Yearly Return | | | |
| Investor Shares | $1,000.00 | $1,023.06 | $1.76 |
| Admiral Shares | 1,000.00 | 1,023.36 | 1.45 |
The calculations are based on expenses incurred in the most recent six-month period. The fund’s annualized six-month expense ratios for that period are 0.35% for Investor Shares and 0.29% for Admiral Shares. The dollar amounts shown as “Expenses Paid” are equal to the annualized expense ratio multiplied by the average account value over the period, multiplied by the number of days in the most recent six-month period, then divided by the number of days in the most recent 12-month period.
26
Trustees Approve Advisory Arrangements
The board of trustees of Vanguard Energy Fund has renewed the fund’s investment advisory arrangements with The Vanguard Group, Inc., through its Quantitative Equity Group, and Wellington Management Company, LLP. The board also approved an amended investment advisory agreement with Wellington Management. Effective August 1, 2010, Wellington Management’s compensation benchmark, a composite index made up of 50% S&P Citigroup BMI World Energy Index/50% S&P 500 Energy Equal Weighted Blend Index, was replaced with the MSCI All Country World Energy Index. The board concluded that the new index is a more suitable index because it better reflects the fund’s global focus. This change will not affect the fund’s investment objective, policies, strategies, or risks. The board determined that the retention of the fund’s advisors was in the best interests of the fund and its sha reholders.
The board based its decision upon an evaluation of each advisor’s investment staff, portfolio management process, and performance. The trustees considered the factors discussed below, among others. However, no single factor determined whether the board approved the arrangements. Rather, it was the totality of the circumstances that drove the board’s decision.
Nature, extent, and quality of services
The board considered the quality of the fund’s investment management over both the short and long term, and took into account the organizational depth and stability of each advisor.
Wellington Management Company, LLP. Founded in 1928, Wellington Management is among the nation’s oldest and most respected institutional investment managers. The investment team uses a bottom-up approach in which stocks are selected based on the advisor’s estimates of fundamental investment value. The advisor’s investment process emphasizes company fundamentals, management track record, and security valuation. The firm has advised the fund since the fund’s inception in 1984.
The Vanguard Group, Inc. Vanguard has been managing investments for more than three decades. The Quantitative Equity Group adheres to a sound, disciplined investment management process; the team has considerable experience, stability, and depth. Vanguard has managed a portion of the fund since 2005.
The board concluded that each advisor’s experience, stability, depth, and performance, among other factors, warranted the continuation of the advisory arrangements.
Investment performance
The board considered the short- and long-term performance of the fund, including any periods of outperformance or underperformance of a relevant benchmark and peer group. The board concluded that each advisor has carried out its investment strategy in disciplined fashion, and that performance results have been in line with expectations. The fund’s performance has exceeded that of the fund’s benchmark and peer group over the last 3-, 5-, and 10-year periods, although it underperformed both the benchmark and peer group during the most recent 12-month period. Information about the fund’s most recent performance can be found in the Performance Summary portion of this report.
27
Cost
The board concluded that the fund’s expense ratio was well below the average expense ratio charged by funds in its peer group and that the fund’s advisory expense ratio was also well below its peer-group average. Information about the fund’s expense ratio appears in the About Your Fund’s Expenses section of this report as well as in the Financial Statements section, which also includes information about the fund’s advisory fee rate.
The board did not consider profitability of Wellington Management in determining whether to approve the advisory fee, because Wellington Management is independent of Vanguard, and the advisory fee is the result of arm’s-length negotiations. The board does not conduct a profitability analysis of Vanguard, because of Vanguard’s unique “at-cost” structure. Unlike most other mutual fund management companies, Vanguard is owned by the funds it oversees, and produces “profits” only in the form of reduced expenses for fund shareholders.
The benefit of economies of scale
The board concluded that the fund’s shareholders benefit from economies of scale because of breakpoints in the fund’s advisory fee schedule for Wellington Management. The breakpoints reduce the effective rate of the fee as the fund’s assets managed by Wellington Management increase. The board also concluded that the fund’s low-cost arrangement with Vanguard ensures that the fund will realize economies of scale as it grows, with the cost to shareholders declining as the fund’s assets managed by Vanguard increase.
The board will consider whether to renew the advisory arrangement again after a one-year period.
28
Glossary
30-Day SEC Yield. A fund’s 30-day SEC yield is derived using a formula specified by the U.S. Securities and Exchange Commission. Under the formula, data related to the fund’s security holdings in the previous 30 days are used to calculate the fund’s hypothetical net income for that period, which is then annualized and divided by the fund’s estimated average net assets over the calculation period. For the purposes of this calculation, a security’s income is based on its current market yield to maturity (in the case of bonds) or its projected dividend yield (for stocks). Because the SEC yield represents hypothetical annualized income, it will differ—at times significantly—from the fund’s actual experience. As a result, the fund’s income distributions may be higher or lower than implied by the SEC yield.
Beta. A measure of the magnitude of a fund’s past share-price fluctuations in relation to the ups and downs of a given market index. The index is assigned a beta of 1.00. Compared with a given index, a fund with a beta of 1.20 typically would have seen its share price rise or fall by 12% when the index rose or fell by 10%. For this report, beta is based on returns over the past 36 months for both the fund and the index. Note that a fund’s beta should be reviewed in conjunction with its R-squared (see definition). The lower the R-squared, the less correlation there is between the fund and the index, and the less reliable beta is as an indicator of volatility.
Dividend Yield. Dividend income earned by stocks, expressed as a percentage of the aggregate market value (or of net asset value, for a fund). The yield is determined by dividing the amount of the annual dividends by the aggregate value (or net asset value) at the end of the period. For a fund, the dividend yield is based solely on stock holdings and does not include any income produced by other investments.
Earnings Growth Rate. The average annual rate of growth in earnings over the past five years for the stocks now in a fund.
Equity Exposure. A measure that reflects a fund’s investments in stocks and stock futures. Any holdings in short-term reserves are excluded.
Expense Ratio. The percentage of a fund’s average net assets used to pay its annual administrative and advisory expenses. These expenses directly reduce returns to investors.
Foreign Holdings. The percentage of a fund represented by stocks or depositary receipts of companies based outside the United States.
Inception Date. The date on which the assets of a fund (or one of its share classes) are first invested in accordance with the fund’s investment objective. For funds with a subscription period, the inception date is the day after that period ends. Investment performance is measured from the inception date.
Median Market Cap. An indicator of the size of companies in which a fund invests; the midpoint of market capitalization (market price x shares outstanding) of a fund’s stocks, weighted by the proportion of the fund’s assets invested in each stock. Stocks representing half of the fund’s assets have market capitalizations above the median, and the rest are below it.
Price/Book Ratio. The share price of a stock divided by its net worth, or book value, per share. For a fund, the weighted average price/book ratio of the stocks it holds.
29
Price/Earnings Ratio. The ratio of a stock’s current price to its per-share earnings over the past year. For a fund, the weighted average P/E of the stocks it holds. P/E is an indicator of market expectations about corporate prospects; the higher the P/E, the greater the expectations for a company’s future growth.
R-Squared. A measure of how much of a fund’s past returns can be explained by the returns from the market in general, as measured by a given index. If a fund’s total returns were precisely synchronized with an index’s returns, its R-squared would be 1.00. If the fund’s returns bore no relationship to the index’s returns, its R-squared would be 0. For this report, R-squared is based on returns over the past 36 months for both the fund and the index.
Return on Equity. The annual average rate of return generated by a company during the past five years for each dollar of shareholder’s equity (net income divided by shareholder’s equity). For a fund, the weighted average return on equity for the companies whose stocks it holds.
Short-Term Reserves. The percentage of a fund invested in highly liquid, short-term securities that can be readily converted to cash.
Turnover Rate. An indication of the fund’s trading activity. Funds with high turnover rates incur higher transaction costs and may be more likely to distribute capital gains (which may be taxable to investors). The turnover rate excludes in-kind transactions, which have minimal impact on costs.
30
This page intentionally left blank.
The People Who Govern Your Fund
The trustees of your mutual fund are there to see that the fund is operated and managed in your best interests since, as a shareholder, you are a part owner of the fund. Your fund’s trustees also serve on the board of directors of The Vanguard Group, Inc., which is owned by the Vanguard funds and provides services to them on an at-cost basis.
A majority of Vanguard’s board members are independent, meaning that they have no affiliation with Vanguard or the funds they oversee, apart from the sizable personal investments they have made as private individuals. The independent board members have distinguished backgrounds in business, academia, and public service. Each of the trustees and executive officers oversees 162 Vanguard funds.
The following table provides information for each trustee and executive officer of the fund. More information about the trustees is in the Statement of Additional Information, which can be obtained, without charge, by contacting Vanguard at 800-662-7447, or online at www.vanguard.com.
| |
| Interested Trustee1 | Amy Gutmann |
| | Born 1949. Trustee Since June 2006. Principal |
| F. William McNabb III | Occupation(s) During the Past Five Years: President |
| Born 1957. Trustee Since July 2009. Chairman of the | of the University of Pennsylvania; Christopher H. |
| Board. Principal Occupation(s) During the Past Five | Browne Distinguished Professor of Political Science |
| Years: Chairman of the Board of The Vanguard Group, | in the School of Arts and Sciences with secondary |
| Inc., and of each of the investment companies served | appointments at the Annenberg School for Commu- |
| by The Vanguard Group, since January 2010; Director | nication and the Graduate School of Education of |
| of The Vanguard Group since 2008; Chief Executive | the University of Pennsylvania; Director of Carnegie |
| Officer and President of The Vanguard Group and of | Corporation of New York, Schuylkill River Development |
| each of the investment companies served by The | Corporation, and Greater Philadelphia Chamber of |
| Vanguard Group since 2008; Director of Vanguard | Commerce; Trustee of the National Constitution Center; |
| Marketing Corporation; Managing Director of The | Chair of the Presidential Commission for the Study of |
| Vanguard Group (1995–2008). | Bioethical Issues. |
| |
| | JoAnn Heffernan Heisen |
| Independent Trustees | Born 1950. Trustee Since July 1998. Principal |
| | Occupation(s) During the Past Five Years: Corporate |
| Emerson U. Fullwood | Vice President and Chief Global Diversity Officer since |
| Born 1948. Trustee Since January 2008. Principal | 2006 (retired 2008) and Member of the Executive |
| Occupation(s) During the Past Five Years: Executive | Committee (retired 2008) of Johnson & Johnson |
| Chief Staff and Marketing Officer for North America | (pharmaceuticals/consumer products); Vice President |
| and Corporate Vice President (retired 2008) of Xerox | and Chief Information Officer of Johnson & Johnson |
| Corporation (document management products and | (1997–2005); Director of the University Medical Center |
| services); Director of SPX Corporation (multi-industry | at Princeton and Women’s Research and Education |
| manufacturing), the United Way of Rochester, | Institute; Member of the Advisory Board of the |
| Amerigroup Corporation (managed health care), | Maxwell School of Citizenship and Public Affairs |
| the University of Rochester Medical Center, and | at Syracuse University. |
| Monroe Community College Foundation. | |
| | F. Joseph Loughrey |
| Rajiv L. Gupta | Born 1949. Trustee Since October 2009. Principal |
| Born 1945. Trustee Since December 2001.2 | Occupation(s) During the Past Five Years: President |
| Principal Occupation(s) During the Past Five Years: | and Chief Operating Officer since 2005 (retired 2009) |
| Chairman and Chief Executive Officer (retired 2009) | and Vice Chairman of the Board (2008–2009) of |
| and President (2006–2008) of Rohm and Haas Co. | Cummins Inc. (industrial machinery); Director of |
| (chemicals); Director of Tyco International, Ltd. | SKF AB (industrial machinery), Hillenbrand, Inc. |
| (diversified manufacturing and services) and Hewlett- | (specialized consumer services), Sauer-Danfoss Inc. |
| Packard Co. (electronic computer manufacturing); | (machinery), the Lumina Foundation for Education, |
| Trustee of The Conference Board; Member of the | and Oxfam America; Chairman of the Advisory Council |
| Board of Managers of Delphi Automotive LLP | for the College of Arts and Letters at the University of |
| (automotive components). | Notre Dame. |
| | |
| André F. Perold | Kathryn J. Hyatt | |
| Born 1952. Trustee Since December 2004. Principal | Born 1955. Treasurer Since November 2008. Principal |
| Occupation(s) During the Past Five Years: George | Occupation(s) During the Past Five Years: Principal |
| Gund Professor of Finance and Banking at the Harvard | of The Vanguard Group, Inc.; Treasurer of each of |
| Business School; Chair of the Investment Committee | the investment companies served by The Vanguard |
| of HighVista Strategies LLC (private investment firm). | Group since 2008; Assistant Treasurer of each of the |
| | investment companies served by The Vanguard Group |
| Alfred M. Rankin, Jr. | (1988–2008). | |
| Born 1941. Trustee Since January 1993. Principal | | |
| Occupation(s) During the Past Five Years: Chairman, | Heidi Stam | |
| President, and Chief Executive Officer of NACCO | Born 1956. Secretary Since July 2005. Principal |
| Industries, Inc. (forklift trucks/housewares/lignite); | Occupation(s) During the Past Five Years: Managing |
| Director of Goodrich Corporation (industrial products/ | Director of The Vanguard Group, Inc., since 2006; |
| aircraft systems and services); Chairman of the Federal | General Counsel of The Vanguard Group since 2005; |
| Reserve Bank of Cleveland; Trustee of The Cleveland | Secretary of The Vanguard Group and of each of the |
| Museum of Art. | investment companies served by The Vanguard Group |
| | since 2005; Director and Senior Vice President of |
| Peter F. Volanakis | Vanguard Marketing Corporation since 2005; |
| Born 1955. Trustee Since July 2009. Principal | Principal of The Vanguard Group (1997–2006). |
| Occupation(s) During the Past Five Years: President | | |
| since 2007 and Chief Operating Officer since 2005 | Vanguard Senior Management Team |
| of Corning Incorporated (communications equipment); | | |
| President of Corning Technologies (2001–2005); | R. Gregory Barton | Michael S. Miller |
| Director of Corning Incorporated and Dow Corning; | Mortimer J. Buckley | James M. Norris |
| Trustee of the Corning Incorporated Foundation and | Kathleen C. Gubanich | Glenn W. Reed |
| the Corning Museum of Glass; Overseer of the | Paul A. Heller | George U. Sauter |
| Amos Tuck School of Business Administration at | | |
| Dartmouth College. | | |
| | Chairman Emeritus and Senior Advisor |
| Executive Officers | John J. Brennan | |
| | Chairman, 1996–2009 | |
| Glenn Booraem | Chief Executive Officer and President, 1996–2008 |
| Born 1967. Controller Since July 2010. Principal | | |
| Occupation(s) During the Past Five Years: Principal | | |
| of The Vanguard Group, Inc.; Controller of each of | Founder | |
| the investment companies served by The Vanguard | | |
| Group since 2010; Assistant Controller of each of | John C. Bogle | |
| the investment companies served by The Vanguard | Chairman and Chief Executive Officer, 1974–1996 |
| Group (2001–2010). | | |
| |
| Thomas J. Higgins | | |
| Born 1957. Chief Financial Officer Since September | | |
| 2008. Principal Occupation(s) During the Past Five | | |
| Years: Principal of The Vanguard Group, Inc.; Chief | | |
| Financial Officer of each of the investment companies | | |
| served by The Vanguard Group since 2008; Treasurer | | |
| of each of the investment companies served by The | | |
| Vanguard Group (1998–2008). | | |
1 Mr. McNabb is considered an “interested person,” as defined in the Investment Company Act of 1940, because he is an officer of the
Vanguard funds.
2 December 2002 for Vanguard Equity Income Fund, Vanguard Growth Equity Fund, the Vanguard Municipal Bond Funds, and the Vanguard
State Tax-Exempt Funds.
| |
|
|  |
| P.O. Box 2600 |
| Valley Forge, PA 19482-2600 |
Connect with Vanguard® > Vanguard.com
| |
| Fund Information > 800-662-7447 | CFA® is a trademark owned by CFA Institute. |
| Direct Investor Account Services > 800-662-2739 | |
| Institutional Investor Services > 800-523-1036 | |
| Text Telephone for People | |
| With Hearing Impairment > 800-749-7273 | |
| |
| This material may be used in conjunction | |
| with the offering of shares of any Vanguard | |
| fund only if preceded or accompanied by | |
| the fund’s current prospectus. | |
| |
| All comparative mutual fund data are from Lipper Inc. or | |
| Morningstar, Inc., unless otherwise noted. | |
| |
| You can obtain a free copy of Vanguard’s proxy voting | |
| guidelines by visiting vanguard.com/proxyreporting or by | |
| calling Vanguard at 800-662-2739. The guidelines are | |
| also available from the SEC’s website, sec.gov. In | |
| addition, you may obtain a free report on how your fund | |
| voted the proxies for securities it owned during the 12 | |
| months ended June 30. To get the report, visit either | |
| vanguard.com/proxyreporting or sec.gov. | |
| |
| You can review and copy information about your fund at | |
| the SEC’s Public Reference Room in Washington, D.C. To | |
| find out more about this public service, call the SEC at | |
| 202-551-8090. Information about your fund is also | |
| available on the SEC’s website, and you can receive | |
| copies of this information, for a fee, by sending a | |
| request in either of two ways: via e-mail addressed to | |
| publicinfo@sec.gov or via regular mail addressed to the | |
| Public Reference Section, Securities and Exchange | |
| Commission, Washington, DC 20549-1520. | |
| |
| | © 2010 The Vanguard Group, Inc. |
| | All rights reserved. |
| | Vanguard Marketing Corporation, Distributor. |
| |
| | Q512 092010 |
 |
|
| Vanguard Precious Metals |
| and Mining Fund Semiannual Report |
|
| July 31, 2010 |
 |
|
|
|
> For the six months ended July 31, 2010, Vanguard Precious Metals and Mining Fund returned 7.10%.
> The fund significantly lagged the return of its benchmark and the average return of precious metal funds.
> Holdings in precious metals and minerals stocks, a subcategory that does not include gold, weighed most heavily on the fund’s performance for the half-year.
| |
| Contents | |
| Your Fund’s Total Returns. | 1 |
| Chairman’s Letter. | 2 |
| Advisor’s Report. | 6 |
| Fund Profile. | 8 |
| Performance Summary. | 9 |
| Financial Statements. | 10 |
| About Your Fund’s Expenses. | 20 |
| Trustees Approve Advisory Agreement. | 22 |
| Glossary. | 23 |
Please note: The opinions expressed in this report are just that—informed opinions. They should not be considered promises or advice.
Also, please keep in mind that the information and opinions cover the period through the date on the front of this report. Of course, the risks of investing in your fund are spelled out in the prospectus.
See the Glossary for definitions of investment terms used in this report.
Cover photograph: Veronica Coia.
Your Fund’s Total Returns
| | | | |
| Six Months Ended July 31, 2010 | | | | |
| | | | | Total |
| | | | | Returns |
| Vanguard Precious Metals and Mining Fund | | | | 7.10% |
| S&P Custom Precious Metals and Mining Index | | | | 13.57 |
| Precious Metal Funds Average | | | | 16.82 |
| Precious Metal Funds Average: Derived from data provided by Lipper Inc. | | | |
| |
| Your Fund’s Performance at a Glance | | | | |
| January 31, 2010, Through July 31, 2010 | | | | |
| | | | Distributions Per Share |
| | Starting | Ending | Income | Capital |
| | Share Price | Share Price | Dividends | Gains |
| Vanguard Precious Metals and Mining Fund | $18.74 | $20.06 | $0.011 | $0.000 |
1

Chairman’s Letter
Dear Shareholder,
The broad U.S. stock market was up modestly for the six months ended July 31, amid mounting concerns about Europe’s sovereign debt crisis, slowing growth in China, and the sustainability of the global economic recovery. Most commodities prices also rose during the period.
For the fiscal half-year, Vanguard Precious Metals and Mining Fund returned 7.10%. Despite recording positive results for the period, the fund’s performance was disappointing compared with the results for its target index and its peer group.
The fund’s heavy exposure to platinum miners, along with its limited exposure to gold stocks, for most of the period, detracted from the fund’s results.
Stock markets moved higher but the journey was tense
Global stock markets emerged from a turbulent six-month stretch with respect- able single-digit gains. Prices rallied in early spring, buoyed by rapid growth in corporate earnings, but fell sharply in May and June as Europe’s sovereign debt crisis took center stage. Signs that the U.S. economic recovery might be sputtering also dampened investor spirits. By the end of the six-month period, however, stock markets had recouped the previous months’ losses as corporate bellwethers continued to report strong profits, and investors’ moods brightened.
2
For the full period, the U.S. stock market returned more than 4%. Smaller-company stocks, which are less exposed to global turmoil than are large-cap multinationals, returned about 9%. International stocks finished the period with a modestly positive return, as strong performance from emerging markets compensated for weaker returns in Europe.
High-quality bonds rallied amid the search for safety
Turmoil in the stock markets and mixed economic signals drove bond prices higher, and yields lower, as investors sought safety in high-quality government and corporate bonds. At the start of the period, the yield of the benchmark 10-year U.S. Treasury note stood at 3.61%. By the end of the period, it had dipped to 2.91%, and the rates on home-mortgage loans were at their lowest levels since the 1950s.
Rising bond prices led to strong six-month returns in both the taxable and municipal bond markets. The returns from money market instruments, by contrast, remained vanishingly small. Yields have hovered near 0% since late 2008, when the Federal Reserve Board set its target for short-term interest rates between 0% and 0.25%.
An overweighting to platinum limited the fund’s returns
Unlike its benchmark, the Standard and Poor’s Custom Precious Metals and Mining Index, which consists of about 300 stocks, the portfolio of Vanguard Precious Metals
| | | |
| Market Barometer | | | |
| |
| | | | Total Returns |
| | | Periods Ended July 31, 2010 |
| | Six | One | Five Years |
| | Months | Year | (Annualized) |
| Stocks | | | |
| Russell 1000 Index (Large-caps) | 3.84% | 14.51% | 0.02% |
| Russell 2000 Index (Small-caps) | 8.79 | 18.43 | 0.47 |
| Dow Jones U.S. Total Stock Market Index | 4.48 | 15.36 | 0.45 |
| MSCI All Country World Index ex USA (International) | 2.26 | 10.12 | 4.89 |
| |
| Bonds | | | |
| Barclays Capital U.S. Aggregate Bond Index (Broad | | | |
| taxable market) | 4.85% | 8.91% | 5.96% |
| Barclays Capital Municipal Bond Index | 4.06 | 9.15 | 4.75 |
| Citigroup Three-Month U.S. Treasury Bill Index | 0.06 | 0.12 | 2.58 |
| |
| CPI | | | |
| Consumer Price Index | 0.61% | 1.24% | 2.21% |
3
and Mining Fund is much more concentrated; it consisted of a little more than 40 stocks at the end of the period. Such concentration means that the fund can experience significant volatility if a single company or several companies held in the portfolio underperform.
During the six-month period, platinum-related stocks were among the fund’s worst performers. The demand for platinum, which is commonly used in automotive catalytic converters, weakened as global economic growth seemed to sputter. Compared with its index, the fund held a much larger position in platinum mining and distributing companies, and this detracted significantly from relative performance.
For most of the period, the fund also had a smaller investment in gold stocks compared with its benchmark. Gold mining companies performed well, thanks to high gold prices; gold is often considered a safe haven by investors, and gold stocks typically perform well in turbulent markets. Although the fund raised its stake in gold miners throughout the period, its average exposure to these companies was low, restraining relative returns.
Other holdings that significantly underperformed for the period included Eramet, one of the world’s largest refiners and producers of nickel and manganese, and Sims Metal Management, the world’s largest recycler of scrap metal.
| | |
| Expense Ratios | | |
| Your Fund Compared With Its Peer Group | | |
| | | Peer Group |
| | Fund | Average |
| Precious Metals and Mining Fund | 0.27% | 1.43% |
The fund expense ratio shown is from the prospectus dated May 28, 2010, and represents estimated costs for the current fiscal year. For the six months ended July 31, 2010, the fund’s annualized expense ratio was 0.27%. The peer-group expense ratio is derived from data provided by Lipper Inc. and captures information through year-end 2009.Peer group: Precious Metal Funds.4
Among the bright spots were the fund advisor’s decision to limit the portfolio’s exposure to some of the harder-hit industries, including aluminum and diversified metals and mining. Stocks in these industries suffered as prices fell for minerals, including zinc, aluminum, and copper, caused in part by waning demand from China.
The fund also benefited from strong stock selection in a few industries. Diamond miner and distributor Harry Winston Diamonds, gold miner Nevsun Resources, and mineral sands miner Iluka Resources all added significantly to fund performance.
Sector funds can help diversify your portfolio
Though the stock market’s plunge in the spring and rebound in July took many investors by surprise, unpredictable movements of the stock market are to be expected—and they shouldn’t necessarily affect your investment strategy.
While you can’t control what happens in the financial markets, you can control how you invest your money. For this reason, Vanguard encourages you to create a long-term investment plan that includes a mix of stocks, bonds, and short-term investments that is appropriate for your goals and risk tolerance. A well-diversified portfolio can offer some protection during a down market, while also providing an opportunity for long-term growth.
Vanguard Precious Metals and Mining Fund can help diversify your portfolio. While the fund provides exposure to regions around the world, its narrow scope—it invests solely within the precious metals and mining industry—is also its key risk. Returns may vary widely from year to year, so this fund should be considered a complement to an already well-diversified portfolio with a long-term time horizon.
As always, thank you for entrusting your assets to Vanguard.
Sincerely,

F. William McNabb III
Chairman and Chief Executive Officer
August 13, 2010
5
Advisor’s Report
For the six months ended July 31, 2010, Vanguard Precious Metals and Mining Fund returned 7.10%, underperforming the benchmark index, which returned 13.57%, and the 16.82% average return of peer funds.
The markets
Gold bullion demonstrated continued strength during the review period, rising from $1,105 per ounce to around $1,180 per ounce, before finishing the period slightly lower than the all-time high of $1,257 per ounce reached in June. Gold’s qualities as a perceived safe haven in times of economic uncertainty boosted investment-related demand for the metal, as concerns mounted about the sustain- ability of the nascent global economic recovery and whether fiscal actions taken by governments during the financial crisis could erode the value of certain global c urrencies. A number of the more industrially sensitive metals initially made gains, but then declined as anxiety grew over the level of Europe’s sovereign debts and the possibility of a slowdown in China, the world’s largest consumer of industrial metals.
The fund’s performance
Against this backdrop, fund performance during the period was hurt by several holdings that had been among the strongest performers in 2009. Demand for their products is closely aligned to the economic cycle. The largest detractor from performance, U.K.-listed platinum producer Lonmin, saw its share price decline on fears that automobile production, and therefore autocatalyst-driven demand for platinum, could suffer in the event of slower-than-expected global economic growth. Political uncertainty in South Africa, where the company’s mining operations are based, also had a negative impact.
Elsewhere, Australian metal recycler Sims Metal Management, French nickel and manganese producer Eramet, and Hong Kong-based commodities trading firm Noble Group were among fund holdings hurt by rising volatility in the economic environment. In spite of this, we believe that these companies continue to represent compelling investments for the fund, based on valuations, asset quality, and future growth prospects.
By contrast, strong contributions to performance came from the fund’s holdings in a number of gold producers, and we’ve been adding to those positions in recent months. Companies such as Nevsun Resources, Centerra Gold, and Anatolia Minerals—all Canadian-listed, but with mine assets as far afield as Eritrea (Nevsun), the Kyrgyz Republic (Centerra), and Turkey (Anatolia)—continued to progress well. These companies have benefited from a growing appreciation that the risks represented by their perceived riskier projects are diminishing as they approach the cash-generation stage of their development.
Looking beyond gold, Australian mineral sands producer Iluka Resources benefited from excellent earnings results, which highlighted improving profitability and robust demand growth for its products, whose main uses are in ceramics and
6
paints; Canadian-listed miner/retailer Harry Winston Diamond, meanwhile, profited from the strong rise in diamond prices.
Purchases and sales
We maintain a strong conviction that appetite for a broad range of metals and minerals will be supported in the medium-to-long term by the infrastructure develop- ment required to support urbanization and industrialization trends in a number of developing economies. During the period, we significantly increased the fund’s exposure to gold producers, through selected holdings that have demonstrated their focus on managing their mine assets efficiently, profitably, and in the interests of long-term shareholders. The most significant addition during the period was in large North American gold producer Newmont Mining, where management has given the business a much-improved attitude and is running its already world- class assets to generate superior long-term returns for shareholders.
Other significant additions included attractively valued Australian iron ore and coal producer Aquila Resources, returns-focused Australian copper and gold producer Oz Minerals, and the aforementioned Canadian-listed gold producers Anatolia Minerals and Nevsun Resources.
Turning to sales from the portfolio, probably the most notable was the substantial reduction in South African platinum producers Impala Platinum and Anglo Platinum, and also in U.K.-listed platinum processor Johnson Matthey.
The fund retains a significant exposure to platinum, premised on the supportive long-term supply/demand fundamentals for the metal, but following a strong rally during 2009, we decided to reduce the portfolio’s significant platinum weighting and to reinvest the proceeds in more attractive opportunities elsewhere. We closed our positions in some of the fund’s more economically sensitive holdings, including Australian diversified mining giant BHP Billiton, U.S. metal recycler Schnitzer Steel, and U.S. minerals processor Mineral Technologies, which had turned in strong performances after last year’s market lows.
Looking ahead
We remain convinced of the merits of sticking to long-term principles and focusing on industry and company fundamentals. In light of ongoing uncer-tainty about the economic outlook, we shall continue to invest in financially sound, well-managed companies with strategically important assets whose value is not properly appreciated by investors. It is of great importance to us that a company’s long-term growth prospects are balanced by an appreciation of the value of a profitable, shareholder-focused approach.
Portfolio Managers:
Graham E. French
Matthew Vaight, UKSIP
M&G Investment Management Ltd.
August 25, 2010
7
Precious Metals and Mining Fund
Fund Profile
As of July 31, 2010
| | | |
| Portfolio Characteristics | | |
| | | S&P | |
| | | Precious | DJ |
| | | Metals and | U.S. Total |
| | | Mining | Market |
| | Fund | Index | Index |
| Number of Stocks | 44 | 274 | 4,101 |
| Median Market Cap | $3.3B | $27.0B | $27.0B |
| Price/Book Ratio | 2.3x | 2.4x | 2.0x |
| Return on Equity | 11.9% | 18.7% | 19.0% |
| Earnings Growth Rate | 4.8% | 14.6% | 6.7% |
| Dividend Yield | 0.9% | 1.1% | 1.9% |
| Foreign Holdings | 82.6% | 89.6% | 0.0% |
| Turnover Rate | | | |
| (Annualized) | 48% | — | — |
| Ticker Symbol | VGPMX | — | — |
| Expense Ratio1 | 0.27% | — | — |
| Short-Term Reserves | 6.0% | — | — |
| |
| Market Diversification (% of equity exposure) |
| |
| Europe | | | |
| United Kingdom | | | 17.6% |
| France | | | 11.6 |
| Germany | | | 3.9 |
| Other | | | 0.1 |
| Subtotal | | | 33.2% |
| Pacific | | | |
| Australia | | | 18.5% |
| Singapore | | | 3.6 |
| Subtotal | | | 22.1% |
| Emerging Markets | | | |
| South Africa | | | 5.2% |
| Peru | | | 1.7 |
| Other | | | 0.2 |
| Subtotal | | | 7.1% |
| North America | | | |
| Canada | | | 26.8% |
| United States | | | 10.8 |
| Subtotal | | | 37.6% |
| | |
| Volatility Measures | | |
| | S&P | |
| | Precious | DJ |
| | Metals and | U.S. Total |
| | Mining | Market |
| | Index | Index |
| R-Squared | 0.90 | 0.61 |
| Beta | 1.00 | 1.52 |
| These measures show the degree and timing of the fund’s fluctuations compared with the indexes over 36 months. |
|
| |
| Ten Largest Holdings (% of total net assets) |
| Newmont Mining Corp. | Gold | 7.1% |
| Lonmin PLC | Precious Metals & |
| | Minerals | 6.6 |
| Imerys SA | Construction | |
| | Materials | 6.1 |
| Centerra Gold Inc. | Gold | 5.9 |
| Iluka Resources Ltd. | Diversified Metals | |
| | & Mining | 5.4 |
| Eramet | Diversified Metals | |
| | & Mining | 4.9 |
| Hochschild Mining PLC | Precious Metals & |
| | Minerals | 4.5 |
| K&S AG | Fertilizers & | |
| | Agricultural | |
| | Chemicals | 3.6 |
| Nevsun Resources Ltd. | Gold | 3.6 |
| Noble Group Ltd. | Trading Companies |
| | & Distributors | 3.4 |
| Top Ten | | 51.1% |
| The holdings listed exclude any temporary cash investments and equity index products. |
Allocation by Region (% of equity exposure)
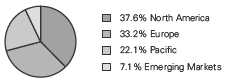
1 The expense ratio shown is from the prospectus dated May 28, 2010, and represents estimated costs for the current fiscal year. For the six months ended July 31, 2010, the annualized expense ratio was 0.27%.
8
Precious Metals and Mining Fund
Performance Summary
All of the returns in this report represent past performance, which is not a guarantee of future results that may be achieved by the fund. (Current performance may be lower or higher than the performance data cited. For performance data current to the most recent month-end, visit our website at www.vanguard.com/performance.) Note, too, that both investment returns and principal value can fluctuate widely, so an investor’s shares, when sold, could be worth more or less than their original cost. The returns shown do not reflect taxes that a shareholder would pay on fund distributions or on the sale of fund shares.
Fiscal-Year Total Returns (%): January 31, 2000, Through July 31, 2010
Spliced Precious Metals and Mining Index: S&P/Citigroup World Equity Gold Index through June 30, 2005; S&P Custom Precious Metals and Mining Index thereafter.
Note: For 2011, performance data reflect the six months ended July 31, 2010.
Average Annual Total Returns: Periods Ended June 30, 2010
This table presents average annual total returns through the latest calendar quarter—rather than through the end of the fiscal period. Securities and Exchange Commission rules require that we provide this information.
| | | | |
| | Inception | One | Five | Ten |
| | Date | Year | Years | Years |
| Precious Metals and Mining Fund | 5/23/1984 | 26.26% | 12.25% | 19.30% |
Vanguard fund returns do not reflect the 1% fee on redemptions of shares held for less than one year.
See Financial Highlights for dividend and capital gains information.
9
Precious Metals and Mining Fund
Financial Statements (unaudited)
Statement of Net Assets
As of July 31, 2010
The fund reports a complete list of its holdings in regulatory filings four times in each fiscal year, at the quarter-ends. For the second and fourth fiscal quarters, the lists appear in the fund’s semiannual and annual reports to shareholders. For the first and third fiscal quarters, the fund files the lists with the Securities and Exchange Commission on Form N-Q. Shareholders can look up the fund’s Forms N-Q on the SEC’s website at www.sec.gov. Forms N-Q may also be reviewed and copied at the SEC’s Public Reference Room (see the back cover of this report for further information).
| | | |
| | | | Market |
| | | | Value |
| | | Shares | ($000) |
| Common Stocks (93.9%) | | |
| Australia (17.4%) | | |
| *,1 | Iluka Resources Ltd. | 41,783,827 | 208,366 |
| | Sims Metal | | |
| | Management Ltd. | 7,600,000 | 122,377 |
| *,1 | Aquila Resources Ltd. | 16,892,500 | 113,562 |
| * | OZ Minerals Ltd. | 66,000,000 | 73,797 |
| *,1 | St. Barbara Ltd. | 245,024,246 | 66,871 |
| 1 | Panoramic | | |
| | Resources Ltd. | 19,700,000 | 43,926 |
| *,1 | Resolute Mining Ltd. | 44,000,000 | 31,077 |
| *,1 | Apex Minerals NL | 260,000,000 | 5,152 |
| | Lihir Gold Ltd. | 1,000,000 | 3,716 |
| | BHP Billiton Ltd. | 100,000 | 3,630 |
| * | Zambezi Resources Ltd. | 4,895,833 | 102 |
| * | MIL Resources Ltd. | 1,678,671 | 46 |
| | | | 672,622 |
| Canada (25.2%) | | |
| *,1 | Centerra Gold Inc. | 18,000,000 | 227,090 |
| *,1 | Nevsun Resources Ltd. | 38,500,000 | 138,189 |
| 1 | Sherritt | | |
| | International Corp. | 19,175,000 | 127,019 |
| *,1 | Harry Winston | | |
| | Diamond Corp. | 9,750,000 | 120,826 |
| *,1 | SEMAFO Inc. | 16,400,000 | 113,901 |
| | Eldorado Gold Corp. | 6,750,000 | 109,649 |
| *,1 | Anatolia Minerals | | |
| | Development Ltd. | 13,800,000 | 74,097 |
| | Franco-Nevada Corp. | 2,150,000 | 65,522 |
| | | | 976,293 |
| France (10.9%) | | |
| 1 | Imerys SA | 4,056,000 | 235,475 |
| | Eramet | 680,000 | 187,977 |
| | | | 423,452 |
| Germany (3.6%) | | |
| | K&S AG | 2,640,000 | 140,557 |
| | | |
| | | | Market |
| | | | Value |
| | | Shares | ($000) |
| Indonesia (0.2%) | | |
| | International Nickel | | |
| | Indonesia Tbk PT | 17,500,000 | 8,102 |
| |
| Ireland (0.1%) | | |
| * | Kenmare Resources PLC | 13,627,035 | 2,830 |
| |
| Papua New Guinea (0.0%) | | |
| * | Bougainville Copper Ltd. | 2,000,000 | 1,555 |
| |
| Peru (1.6%) | | |
| | Cia de Minas | | |
| | Buenaventura SA ADR | 1,600,000 | 61,776 |
| |
| Singapore (3.4%) | | |
| | Noble Group Ltd. | 108,180,353 | 131,694 |
| |
| South Africa (4.9%) | | |
| | Impala Platinum | | |
| | Holdings Ltd. ADR | 4,200,000 | 112,728 |
| | Northam Platinum Ltd. | 11,200,000 | 67,663 |
| | Anglo Platinum Ltd. ADR | 100,000 | 9,574 |
| | | | 189,965 |
| United Kingdom (16.5%) | | |
| *,1 | Lonmin PLC | 10,391,666 | 255,703 |
| 1 | Hochschild Mining PLC | 38,500,000 | 174,537 |
| | Petropavlovsk PLC | 7,500,000 | 118,753 |
| | Johnson Matthey PLC | 3,050,000 | 80,892 |
| | Vedanta Resources PLC | 100,000 | 3,828 |
| | Eurasian Natural | | |
| | Resources Corp. PLC | 200,000 | 2,842 |
| * | Mwana Africa PLC | 9,880,219 | 1,358 |
| * | Gem Diamonds Ltd. | 300,000 | 1,031 |
| * | Gemfields PLC | 3,333,333 | 250 |
| | | | 639,194 |
10
Precious Metals and Mining Fund
| | |
| | | Market |
| | | Value |
| | Shares | ($000) |
| United States (10.1%) | | |
| Newmont Mining Corp. | 4,900,000 | 273,910 |
| 1 AMCOL | | |
| International Corp. | 3,030,000 | 90,779 |
| *,^ Minefinders Corp. | 2,800,000 | 23,996 |
| * Claude Resources Inc. | 2,650,000 | 2,650 |
| | | 391,335 |
| Total Common Stocks | | |
| (Cost $3,362,192) | | 3,639,375 |
| Precious Metals (0.1%) | | |
| * Platinum Bullion | | |
| (In Troy Ounces) | 2,009 | 3,149 |
| Total Precious Metals | | |
| (Cost $1,213) | | 3,149 |
| Temporary Cash Investment (6.2%) | |
| Money Market Fund (6.2%) | | |
| 2,3 Vanguard Market | | |
| Liquidity Fund, 0.297% | | |
| (Cost $238,762) | 238,762,281 | 238,762 |
| Total Investments (100.2%) | | |
| (Cost $3,602,167) | | 3,881,286 |
| Other Assets and Liabilities (-0.2%) | |
| Other Assets | | 21,457 |
| Liabilities3 | | (27,336) |
| | | (5,879) |
| Net Assets (100%) | | |
| Applicable to 193,196,968 outstanding | |
| $.001 par value shares of beneficial | |
| interest (unlimited authorization) | 3,875,407 |
| Net Asset Value Per Share | | $20.06 |
| |
| | Market |
| | Value |
| | ($000) |
| Statement of Assets and Liabilities | |
| Assets | |
| Investments in Securities, at Value | 3,881,286 |
| Receivables for Investment | |
| Securities Sold | 15,884 |
| Receivables for Capital Shares Issued | 1,973 |
| Other Assets | 3,600 |
| Total Assets | 3,902,743 |
| Liabilities | |
| Security Lending Collateral | |
| Payable to Brokers | 4,658 |
| Payables for Investment | |
| Securities Purchased | 12,661 |
| Other Liabilities | 10,017 |
| Total Liabilities | 27,336 |
| Net Assets | 3,875,407 |
| |
| |
| At July 31, 2010, net assets consisted of: | |
| | Amount |
| | ($000) |
| Paid-in Capital | 3,666,333 |
| Overdistributed Net Investment Income | (38,048) |
| Accumulated Net Realized Losses | (32,235) |
| Unrealized Appreciation (Depreciation) | |
| Investment Securities | 279,119 |
| Foreign Currencies | 238 |
| Net Assets | 3,875,407 |
See Note A in Notes to Financial Statements.
* Non-income-producing security.
^ Part of security position is on loan to broker-dealers. The total value of securities on loan is $4,435,000.
1 Considered an affiliated company of the fund as the fund owns more than 5% of the outstanding voting securities of such company.
2 Affiliated money market fund available only to Vanguard funds and certain trusts and accounts managed by Vanguard. Rate shown is the 7-day yield.
3 Includes $4,658,000 of collateral received for securities on loan.
ADR—American Depositary Receipt.
See accompanying Notes, which are an integral part of the Financial Statements.
11
Precious Metals and Mining Fund
Statement of Operations
| |
| | Six Months Ended |
| | July 31, 2010 |
| | ($000) |
| Investment Income | |
| Income | |
| Dividends1,2 | 22,398 |
| Interest2 | 202 |
| Security Lending | 1,052 |
| Total Income | 23,652 |
| Expenses | |
| Investment Advisory Fees—Note B | |
| Basic Fee | 2,448 |
| Performance Adjustment | (1,149) |
| The Vanguard Group—Note C | |
| Management and Administrative | 3,277 |
| Marketing and Distribution | 432 |
| Custodian Fees | 167 |
| Shareholders’ Reports | 40 |
| Trustees’ Fees and Expenses | 3 |
| Total Expenses | 5,218 |
| Net Investment Income | 18,434 |
| Realized Net Gain (Loss) | |
| Investment Securities Sold2 | 73,244 |
| Foreign Currencies | (361) |
| Realized Net Gain (Loss) | 72,883 |
| Change in Unrealized Appreciation (Depreciation) | |
| Investment Securities | 154,141 |
| Foreign Currencies | 773 |
| Change in Unrealized Appreciation (Depreciation) | 154,914 |
| Net Increase (Decrease) in Net Assets Resulting from Operations | 246,231 |
| 1 Dividends are net of foreign withholding taxes of $1,428,000. | |
| 2 Dividend income, interest income, and realized net gain (loss) from affiliated companies of the fund were $12,339,000, $202,000, and ($93,699,000), respectively. |
See accompanying Notes, which are an integral part of the Financial Statements.
12
Precious Metals and Mining Fund
Statement of Changes in Net Assets
| | |
| | Six Months Ended | Year Ended |
| | July 31, | January 31, |
| | 2010 | 2010 |
| | ($000) | ($000) |
| Increase (Decrease) in Net Assets | | |
| Operations | | |
| Net Investment Income | 18,434 | 17,349 |
| Realized Net Gain (Loss) | 72,883 | (61,858) |
| Change in Unrealized Appreciation (Depreciation) | 154,914 | 1,391,219 |
| Net Increase (Decrease) in Net Assets Resulting from Operations | 246,231 | 1,346,710 |
| Distributions | | |
| Net Investment Income | (2,161) | (53,316) |
| Realized Capital Gain | — | — |
| Total Distributions | (2,161) | (53,316) |
| Capital Share Transactions | | |
| Issued | 432,179 | 1,369,003 |
| Issued in Lieu of Cash Distributions | 1,988 | 48,944 |
| Redeemed1 | (486,945) | (671,175) |
| Net Increase (Decrease) from Capital Share Transactions | (52,778) | 746,772 |
| Total Increase (Decrease) | 191,292 | 2,040,166 |
| Net Assets | | |
| Beginning of Period | 3,684,115 | 1,643,949 |
| End of Period2 | 3,875,407 | 3,684,115 |
| 1 Net of redemption fees for fiscal 2011 and 2010 of $1,646,000 and $2,627,000, respectively. |
| 2 Net Assets—End of Period includes undistributed (overdistributed) net investment income of ($38,048,000) and ($53,960,000). |
See accompanying Notes, which are an integral part of the Financial Statements.
13
Precious Metals and Mining Fund
Financial Highlights
| | | | | | |
| Six Months | | | | | |
| | Ended | | | | | |
| For a Share Outstanding | July 31, | Year Ended January 31, |
| Throughout Each Period | 2010 | 2010 | 2009 | 2008 | 2007 | 2006 |
| Net Asset Value, Beginning of Period | $18.74 | $10.74 | $33.45 | $28.64 | $27.08 | $16.46 |
| Investment Operations | | | | | | |
| Net Investment Income | .090 | .0931 | .653 | .9001 | .560 | .3372 |
| Net Realized and Unrealized Gain (Loss) | | | | | | |
| on Investments3 | 1.241 | 8.207 | (19.849) | 8.362 | 4.027 | 11.080 |
| Total from Investment Operations | 1.331 | 8.300 | (19.196) | 9.262 | 4.587 | 11.417 |
| Distributions | | | | | | |
| Dividends from Net Investment Income | (.011) | (.300) | (.763) | (.670) | (.490) | (.240) |
| Distributions from Realized Capital Gains | — | — | (2.751) | (3.782) | (2.537) | (.557) |
| Total Distributions | (.011) | (.300) | (3.514) | (4.452) | (3.027) | (.797) |
| Net Asset Value, End of Period | $20.06 | $18.74 | $10.74 | $33.45 | $28.64 | $27.08 |
| |
| Total Return4 | 7.10% | 77.75% | -60.16% | 33.97% | 17.48% | 70.19% |
| |
| Ratios/Supplemental Data | | | | | | |
| Net Assets, End of Period (Millions) | $3,875 | $3,684 | $1,644 | $4,635 | $3,444 | $3,297 |
| Ratio of Total Expenses to | | | | | | |
| Average Net Assets | 0.27%5,6 | 0.27%5 | 0.30%5 | 0.28%5 | 0.35%5 | 0.40% |
| Ratio of Net Investment Income to | | | | | | |
| Average Net Assets | 0.94%6 | 0.59%1 | 2.17% | 2.70%1 | 1.88% | 1.68% |
| Portfolio Turnover Rate | 48%6 | 17% | 22% | 29% | 24% | 20% |
1 Net investment income per share and the ratio of net investment income to average net assets for the year ended January 31, 2008 include $.190 and 0.65%, respectively, resulting from a special dividend from Centennial Coal Co. Ltd. in January 2008. Based on additional information reported by the company in 2009, a portion o f the special dividend was reallocated to return of capital. The reallocation reduced net investment income per share and the ratio of net investment income to average net assets for the year ended January 31, 2010, by $.134 and 0.90%, respectively. The reallocation has no impact on net assets, net asset values per share, or total returns.2 Calculated based on average shares outstanding.3 Includes increases from redemption fees of $.01, $.01, $.01, $.00, $.03, and $.01.4 Total returns do not reflect the 1% redemption fee on shares held for less than one year, nor do they include the account service fee that may be applicable to certain accounts with balances below $10,000.5 Includes performance-based investment advisory fee increases (decreases) of (0.06%) for fiscal 2011, (0.08%) for fiscal 2010, 0.00% for fiscal 2009, (0.01%) for fiscal 2008, and 0.01% for fiscal 2007.6 Annualized.See accompanying Notes, which are an integral part of the Financial Statements.
14
Precious Metals and Mining Fund
Notes to Financial Statements
Vanguard Precious Metals and Mining Fund is registered under the Investment Company Act of 1940 as an open-end investment company, or mutual fund. The fund invests in securities of foreign issuers, which may subject it to investment risks not normally associated with investing in securities of United States corporations.
A. The following significant accounting policies conform to generally accepted accounting principles for U.S. mutual funds. The fund consistently follows such policies in preparing its financial statements.
1. Security Valuation: Securities are valued as of the close of trading on the New York Stock Exchange (generally 4 p.m., Eastern time) on the valuation date. Equity securities are valued at the latest quoted sales prices or official closing prices taken from the primary market in which each security trades; such securities not traded on the valuation date are valued at the mean of the latest quoted bid and asked prices. Securities for which market quotations are not readily available, or whose values have been affected by events occurring before the fund’s pricing time but after the close of the securities’ primary markets, are valued at their fair values calculated according to procedures adopted by the board of trustees. These procedures include obtaining quotations from an independent pricing service, monitoring news to identify significant market- or security-specific events, and evaluating changes in the values of foreign market proxi es (for example, ADRs, futures contracts, or exchange-traded funds), between the time the foreign markets close and the fund’s pricing time. When fair-value pricing is employed, the prices of securities used by a fund to calculate its net asset value may differ from quoted or published prices for the same securities. Precious metals are valued at the mean of the latest quoted bid and asked prices. Investments in Vanguard Market Liquidity Fund are valued at that fund’s net asset value.
2. Foreign Currency: Securities and other assets and liabilities denominated in foreign currencies are translated into U.S. dollars using exchange rates obtained from an independent third party as of the fund’s pricing time on the valuation date. Realized gains (losses) and unrealized appreciation (depreciation) on investment securities include the effects of changes in exchange rates since the securities were purchased, combined with the effects of changes in security prices. Fluctuations in the value of other assets and liabilities resulting from changes in exchange rates are recorded as unrealized foreign currency gains (losses) until the assets or liabilities are settled in cash, at which time they are recorded as realized foreign currency gains (losses).
3. Federal Income Taxes: The fund intends to continue to qualify as a regulated investment company and distribute all of its taxable income. Management has analyzed the fund’s tax positions taken for all open federal income tax years (January 31, 2007–2010), and for the period ended July 31, 2010, and has concluded that no provision for federal income tax is required in the fund’s financial statements.
4. Distributions: Distributions to shareholders are recorded on the ex-dividend date.
5. Security Lending: The fund may lend its securities to qualified institutional borrowers to earn additional income. Security loans are required to be secured at all times by collateral at least equal to the market value of securities loaned. The fund invests cash collateral received in Vanguard Market Liquidity Fund, and records a liability for the return of the collateral, during the period the securities are on loan. Security lending income represents the income earned on investing cash collateral, less expenses associated with the loan.
15
Precious Metals and Mining Fund
6. Other: Dividend income is recorded on the ex-dividend date. Interest income includes income distributions received from Vanguard Market Liquidity Fund and is accrued daily. Security transactions are accounted for on the date securities are bought or sold. Costs used to determine realized gains (losses) on the sale of investment securities are those of the specific securities sold. Fees assessed on redemptions of capital shares are credited to paid-in capital.
B. M&G Investment Management Ltd. provides investment advisory services to the fund for a fee calculated at an annual percentage rate of average net assets. The basic fee is subject to quarterly adjustments based on the fund’s performance for the preceding three years relative to the S&P Custom Precious Metals and Mining Index. For the six months ended July 31, 2010, the investment advisory fee represented an effective annual basic rate of 0.12% of the fund’s average net assets before a decrease of $1,149,000 (0.06%) based on performance.
C. The Vanguard Group furnishes at cost corporate management, administrative, marketing, and distribution services. The costs of such services are allocated to the fund under methods approved by the board of trustees. The fund has committed to provide up to 0.40% of its net assets in capital contributions to Vanguard. At July 31, 2010, the fund had contributed capital of $722,000 to Vanguard (included in Other Assets), representing 0.02% of the fund’s net assets and 0.29% of Vanguard’s capitalization. The fund’s trustees and officers are also directors and officers of Vanguard.
D. Various inputs may be used to determine the value of the fund’s investments. These inputs are summarized in three broad levels for financial statement purposes. The inputs or methodologies used to value securities are not necessarily an indication of the risk associated with investing in those securities.
Level 1—Quoted prices in active markets for identical securities.
Level 2—Other significant observable inputs (including quoted prices for similar securities, interest rates, prepayment speeds, credit risk, etc.).
Level 3—Significant unobservable inputs (including the fund’s own assumptions used to determine the fair value of investments).
The following table summarizes the fund’s investments as of July 31, 2010, based on the inputs used to value them:
| | | |
| | Level 1 | Level 2 | Level 3 |
| Investments | ($000) | ($000) | ($000) |
| Common Stocks—North America | 1,367,628 | — | — |
| Common Stocks—Other | 184,078 | 2,087,669 | — |
| Precious Metals | 3,149 | — | — |
| Temporary Cash Investments | 238,762 | — | — |
| Total | 1,793,617 | 2,087,669 | — |
16
Precious Metals and Mining Fund
The following table summarizes changes in investments valued based on Level 3 inputs during the six months ended July 31, 2010:
| |
| | Investments in |
| | Common Stocks |
| Amount Valued Based on Level 3 Inputs | ($000) |
| Balance as of January 31, 2010 | 98 |
| Total Purchases | 54,978 |
| Transfers out of Level 3 | (92,687) |
| Change in Unrealized Appreciation (Depreciation) | 37,611 |
| Balance as of July 31, 2010 | — |
E. Distributions are determined on a tax basis and may differ from net investment income and realized capital gains for financial reporting purposes. Differences may be permanent or temporary. Permanent differences are reclassified among capital accounts in the financial statements to reflect their tax character. Temporary differences arise when certain items of income, expense, gain, or loss are recognized in different periods for financial statement and tax purposes; these differences will reverse at some time in the future. Differences in classification may also result from the treatment of short-term gains as ordinary income for tax purposes. The fund’s tax-basis capital gains and losses are determined only at the end of each fiscal year.
During the six months ended July 31, 2010, the fund realized net foreign currency losses of $361,000, which decreased distributable net income for tax purposes; accordingly, such losses have been reclassified from accumulated net realized losses to overdistributed net investment income.
Certain of the fund’s investments are in securities considered to be “passive foreign investment companies,” for which any unrealized appreciation and/or realized gains are required to be included in distributable net income for tax purposes. Unrealized appreciation as of January 31, 2010, on the fund’s passive foreign investment company holdings at July 31, 2010, was $47,889,000, all of which has been distributed and is reflected in the balance of overdistributed net investment income.
During 2001, the fund elected to use a provision of the Taxpayer Relief Act of 1997 to mark-to-market certain appreciated securities held on January 1, 2001; such securities were treated as sold and repurchased, with unrealized gains of $46,006,000 becoming realized, for tax purposes. The mark-to-market created a difference between the cost of investments for financial statement and tax purposes, which will reverse when the securities are sold. Through January 31, 2010, the fund realized
17
Precious Metals and Mining Fund
gains on the sale of these securities of $20,516,000 for financial statement purposes, which were included in prior year mark-to-market gains for tax purposes. During the period ended July 31, 2010, the remaining marked-to-market securities were sold; as a result the remaining $25,490,000 difference between financial statement and tax-basis realized and unrealized gains and losses reversed during the current period.
The fund’s tax-basis capital gains and losses are determined only at the end of each fiscal year. For tax purposes, at January 31, 2010, the fund had available capital loss carryforwards totaling $52,818,000 to offset future net capital gains through January 31, 2018. In addition, the fund realized losses of $27,156,000 during the period from November 1, 2009, through January 31, 2010, which are deferred and will be treated as realized for tax purposes in fiscal 2011. The fund will use these capital losses to offset net taxable capital gains, if any, realized during the year ending January 31, 2011; should the fund realize net capital losses for the year, the losses will be added to the loss carryforward balance above.
At July 31, 2010, the cost of investment securities for tax purposes was $3,650,056,000. Net unrealized appreciation of investment securities for tax purposes was $231,230,000, consisting of unrealized gains of $641,388,000 on securities that had risen in value since their purchase and $410,158,000 in unrealized losses on securities that had fallen in value since their purchase or since being marked to market for tax purposes.
F. During the six months ended July 31, 2010, the fund purchased $894,523,000 of investment securities and sold $980,297,000 of investment securities, other than temporary cash investments.
G. Capital shares issued and redeemed were:
| | |
| | Six Months Ended | Year Ended |
| | July 31, 2010 | January 31, 2010 |
| | Shares | Shares |
| | (000) | (000) |
| Issued | 21,210 | 81,521 |
| Issued in Lieu of Cash Distributions | 95 | 2,952 |
| Redeemed | (24,723) | (40,946) |
| Net Increase (Decrease) in Shares Outstanding | (3,418) | 43,527 |
18
Precious Metals and Mining Fund
H. Certain of the fund’s investments are in companies that are considered to be affiliated companies of the fund because the fund owns more than 5% of the outstanding voting securities of the company. Transactions during the period in securities of these companies were as follows:
| | | | | |
| | | | Current Period Transactions | |
| Jan. 31, 2010
Market
Value
($000) | | Proceeds from
Securities
Sold
($000) | | July 31, 2010
Market
Value
($000) |
| | Purchases
at Cost
($000) | Dividend
Income
($000) |
| |
| |
| AMCOL International Corp. | 76,144 | — | — | 1,091 | 90,779 |
| Anatolia Minerals Development Ltd. | NA1 | 61,092 | — | — | 74,097 |
| Apex Minerals NL | 7,085 | — | — | — | 5,152 |
| Aquila Resources Ltd. | NA1 | 77,488 | — | — | 113,562 |
| Centerra Gold Inc. | 162,058 | 24,220 | — | — | 227,090 |
| Harry Winston Diamond Corp. | 83,200 | 7,015 | — | — | 120,826 |
| Hochschild Mining PLC | 135,378 | 29,905 | — | 647 | 174,537 |
| Iluka Resources Ltd. | 121,198 | — | — | — | 208,366 |
| Imerys SA | 224,312 | — | — | 4,373 | 235,475 |
| Johnson Matthey PLC | 262,966 | — | 188,819 | 2,634 | NA2 |
| Lonmin PLC | 297,263 | — | — | — | 255,703 |
| Nevsun Resources Ltd. | 24,924 | 54,978 | — | — | 138,189 |
| Panoramic Resources Ltd. | 31,730 | — | — | 1,781 | 43,926 |
| Petropavlovsk PLC | 131,813 | 37,802 | 54,598 | 603 | NA2 |
| Resolute Mining Ltd. | 32,015 | 6,984 | — | — | 31,077 |
| SEMAFO Inc. | NA1 | 114,932 | — | — | 113,901 |
| Sherritt International Corp. | 98,625 | 15,775 | — | 1,210 | 127,019 |
| St. Barbara Ltd. | 39,500 | 17,484 | — | — | 66,871 |
| | 1,728,211 | | | 12,339 | 2,026,570 |
| 1 Not applicable—At January 31, 2010, the issuer was not an affiliated company of the fund. | | |
| 2 Not applicable—At July 31, 2010, the security was still held, but the issuer was no longer an affiliated company of the fund. |
I. In preparing the financial statements as of July 31, 2010, management considered the impact of subsequent events for potential recognition or disclosure in these financial statements.
19
About Your Fund’s Expenses
As a shareholder of the fund, you incur ongoing costs, which include costs for portfolio management, administrative services, and shareholder reports (like this one), among others. Operating expenses, which are deducted from a fund’s gross income, directly reduce the investment return of the fund.
A fund’s expenses are expressed as a percentage of its average net assets. This figure is known as the expense ratio. The following examples are intended to help you understand the ongoing costs (in dollars) of investing in your fund and to compare these costs with those of other mutual funds. The examples are based on an investment of $1,000 made at the beginning of the period shown and held for the entire period.
The accompanying table illustrates your fund’s costs in two ways:
• Based on actual fund return. This section helps you to estimate the actual expenses that you paid over the period. The ”Ending Account Value“ shown is derived from the fund‘s actual return, and the third column shows the dollar amount that would have been paid by an investor who started with $1,000 in the fund. You may use the information here, together with the amount you invested, to estimate the expenses that you paid over the period.
To do so, simply divide your account value by $1,000 (for example, an $8,600 account value divided by $1,000 = 8.6), then multiply the result by the number given for your fund under the heading ”Expenses Paid During Period.“
• Based on hypothetical 5% yearly return. This section is intended to help you compare your fund‘s costs with those of other mutual funds. It assumes that the fund had a yearly return of 5% before expenses, but that the expense ratio is unchanged. In this case—because the return used is not the fund’s actual return—the results do not apply to your investment. The example is useful in making comparisons because the Securities and Exchange Commission requires all mutual funds to calculate expenses based on a 5% return. You can assess your fund’s costs by comparing this hypothetical example with the hypothetical examples that appear in shareholder reports of other funds.
Note that the expenses shown in the table are meant to highlight and help you compare ongoing costs only and do not reflect transaction costs incurred by the fund for buying and selling securities. Further, the expenses do not include the 1% fee on redemptions of shares held for less than one year, nor do they include the account service fee described in the prospectus. If such fees were applied to your account, your costs would be higher. Your fund does not carry a “sales load.” The calculations assume no shares were bought or sold during the period. Your actual costs may have been higher or lower, depending on the amount of your investment and the timing of any purchases or redemptions.
You can find more information about the fund’s expenses, including annual expense ratios, in the Financial Statements section of this report. For additional information on operating expenses and other shareholder costs, please refer to your fund’s current prospectus.
20
| | | |
| Six Months Ended July 31, 2010 | | | |
| | Beginning | Ending | Expenses |
| | Account Value | Account Value | Paid During |
| Precious Metals and Mining Fund | 1/31/2010 | 7/31/2010 | Period |
| Based on Actual Fund Return | $1,000.00 | $1,071.00 | $1.39 |
| Based on Hypothetical 5% Yearly Return | 1,000.00 | 1,023.46 | 1.35 |
The calculations are based on expenses incurred in the most recent six-month period. The fund’s annualized six-month expense ratio for that period is 0.27%. The dollar amounts shown as “Expenses Paid” are equal to the annualized expense ratio multiplied by the average account value over the period, multiplied by the number of days in the most recent six-month period, then divided by the number of days in the most recent 12-month period.21
Trustees Approve Advisory Agreement
The board of trustees of Vanguard Precious Metals and Mining Fund has renewed the fund’s investment advisory agreement with M&G Investment Management Limited. The board determined that the retention of the advisor was in the best interests of the fund and its shareholders.
The board based its decision upon an evaluation of the advisor’s investment staff, portfolio management process, and performance. The trustees considered the factors discussed below, among others. However, no single factor determined whether the board approved the agreement. Rather, it was the totality of the circumstances that drove the board’s decision.
Nature, extent, and quality of services
The board considered the quality of the fund’s investment management over both the short and long term, and took into account the organizational depth and stability of the advisor. The board noted that M&G, founded in 1931, specializes in managing equity and fixed income portfolios for both institutional and retail clients worldwide. The firm has advised the fund since the fund’s inception in 1984. The advisor continues to employ a sound process, selecting companies that are broadly representative of the metals and mining industries with emphasis on large, stable, and diversified companies. The fund may be invested in rare minerals (such as diamonds), precious metals (such as gold, silver, and platinum), and base metals and minerals (such as coal). The advis or’s global equity research team— composed of six senior investment professionals and four analysts—conducts intensive fundamental analysis on companies in the industry, including regular company visits.
The board concluded that the advisor’s experience, stability, depth, and performance, among other factors, warranted continuation of the advisory agreement.
Investment performance
The board considered the short- and long-term performance of the fund, including any periods of outperformance or underperformance of a relevant benchmark and peer group. The board noted that the fund is more broadly diversified than its competitors—with the ability to invest up to half of the fund’s assets in non-precious metals and mining stocks. The board concluded that the advisor has carried out the fund’s investment strategy in disciplined fashion, and that performance results have allowed the fund to remain competitive versus its benchmark and peer group over the long term, however, short-term performance lagged because of the fund’s overweighted position to precious metals and minerals, along with an underweighting in gold stocks. Information a bout the fund’s most recent performance can be found in the Performance Summary section of this report.
Cost
The board concluded that the fund’s expense ratio was well below the average expense ratio charged by funds in its peer group and that the fund’s advisory fee rate was also well below its peer-group average. Information about the fund’s expense ratio appears in the About Your Fund’s Expenses section of this report as well as in the Financial Statements section, which also includes information about the advisory fee rate.
The board did not consider profitability of M&G in determining whether to approve the advisory fee, because M&G is independent of Vanguard, and the advisory fee is the result of arm’s-length negotiations.
The benefit of economies of scale
The board concluded that the fund’s shareholders benefit from economies of scale because of breakpoints in the advisory fee schedule. The breakpoints reduce the effective rate of the fee as the fund’s assets increase.
The board will consider whether to renew the advisory agreement again after a one-year period.
22
Glossary
30-Day SEC Yield. A fund’s 30-day SEC yield is derived using a formula specified by the U.S. Securities and Exchange Commission. Under the formula, data related to the fund’s security holdings in the previous 30 days are used to calculate the fund’s hypothetical net income for that period, which is then annualized and divided by the fund’s estimated average net assets over the calculation period. For the purposes of this calculation, a security’s income is based on its current market yield to maturity (in the case of bonds) or its projected dividend yield (for stocks). Because the SEC yield represents hypothetical annualized income, it will differ—at times significantly—from the fund’s actual experience. As a result, the fund’s income distributions may be higher or lower than implied by the SEC yield.
Beta. A measure of the magnitude of a fund’s past share-price fluctuations in relation to the ups and downs of a given market index. The index is assigned a beta of 1.00. Compared with a given index, a fund with a beta of 1.20 typically would have seen its share price rise or fall by 12% when the index rose or fell by 10%. For this report, beta is based on returns over the past 36 months for both the fund and the index. Note that a fund’s beta should be reviewed in conjunction with its R-squared (see definition). The lower the R-squared, the less correlation there is between the fund and the index, and the less reliable beta is as an indicator of volatility.
Dividend Yield. Dividend income earned by stocks, expressed as a percentage of the aggregate market value (or of net asset value, for a fund). The yield is determined by dividing the amount of the annual dividends by the aggregate value (or net asset value) at the end of the period. For a fund, the dividend yield is based solely on stock holdings and does not include any income produced by other investments.
Earnings Growth Rate. The average annual rate of growth in earnings over the past five years for the stocks now in a fund.
Equity Exposure. A measure that reflects a fund’s investments in stocks and stock futures. Any holdings in short-term reserves are excluded.
Expense Ratio. The percentage of a fund’s average net assets used to pay its annual administrative and advisory expenses. These expenses directly reduce returns to investors.
Foreign Holdings. The percentage of a fund represented by stocks or depositary receipts of companies based outside the United States.
Inception Date. The date on which the assets of a fund (or one of its share classes) are first invested in accordance with the fund’s investment objective. For funds with a subscription period, the inception date is the day after that period ends. Investment performance is measured from the inception date.
Median Market Cap. An indicator of the size of companies in which a fund invests; the midpoint of market capitalization (market price x shares outstanding) of a fund’s stocks, weighted by the proportion of the fund’s assets invested in each stock. Stocks representing half of the fund’s assets have market capitalizations above the median, and the rest are below it.
Price/Book Ratio. The share price of a stock divided by its net worth, or book value, per share. For a fund, the weighted average price/book ratio of the stocks it holds.
23
R-Squared. A measure of how much of a fund’s past returns can be explained by the returns from the market in general, as measured by a given index. If a fund’s total returns were precisely synchronized with an index’s returns, its R-squared would be 1.00. If the fund’s returns bore no relationship to the index’s returns, its R-squared would be 0. For this report, R-squared is based on returns over the past 36 months for both the fund and the index.
Return on Equity. The annual average rate of return generated by a company during the past five years for each dollar of shareholder’s equity (net income divided by shareholder’s equity). For a fund, the weighted average return on equity for the companies whose stocks it holds.
Short-Term Reserves. The percentage of a fund invested in highly liquid, short-term securities that can be readily converted to cash.
Turnover Rate. An indication of the fund’s trading activity. Funds with high turnover rates incur higher transaction costs and may be more likely to distribute capital gains (which may be taxable to investors). The turnover rate excludes in-kind transactions, which have minimal impact on costs.
24
This page intentionally left blank.
This page intentionally left blank.
This page intentionally left blank.
The People Who Govern Your Fund
The trustees of your mutual fund are there to see that the fund is operated and managed in your best interests since, as a shareholder, you are a part owner of the fund. Your fund’s trustees also serve on the board of directors of The Vanguard Group, Inc., which is owned by the Vanguard funds and provides services to them on an at-cost basis.
A majority of Vanguard’s board members are independent, meaning that they have no affiliation with Vanguard or the funds they oversee, apart from the sizable personal investments they have made as private individuals. The independent board members have distinguished backgrounds in business, academia, and public service. Each of the trustees and executive officers oversees 162 Vanguard funds.
The following table provides information for each trustee and executive officer of the fund. More information about the trustees is in the Statement of Additional Information, which can be obtained, without charge, by contacting Vanguard at 800-662-7447, or online at www.vanguard.com.
| |
| Interested Trustee1 | Amy Gutmann |
| | Born 1949. Trustee Since June 2006. Principal |
| F. William McNabb III | Occupation(s) During the Past Five Years: President |
| Born 1957. Trustee Since July 2009. Chairman of the | of the University of Pennsylvania; Christopher H. |
| Board. Principal Occupation(s) During the Past Five | Browne Distinguished Professor of Political Science |
| Years: Chairman of the Board of The Vanguard Group, | in the School of Arts and Sciences with secondary |
| Inc., and of each of the investment companies served | appointments at the Annenberg School for Commu- |
| by The Vanguard Group, since January 2010; Director | nication and the Graduate School of Education of |
| of The Vanguard Group since 2008; Chief Executive | the University of Pennsylvania; Director of Carnegie |
| Officer and President of The Vanguard Group and of | Corporation of New York, Schuylkill River Development |
| each of the investment companies served by The | Corporation, and Greater Philadelphia Chamber of |
| Vanguard Group since 2008; Director of Vanguard | Commerce; Trustee of the National Constitution Center; |
| Marketing Corporation; Managing Director of The | Chair of the Presidential Commission for the Study of |
| Vanguard Group (1995–2008). | Bioethical Issues. |
| |
| | JoAnn Heffernan Heisen |
| Independent Trustees | Born 1950. Trustee Since July 1998. Principal |
| | Occupation(s) During the Past Five Years: Corporate |
| Emerson U. Fullwood | Vice President and Chief Global Diversity Officer since |
| Born 1948. Trustee Since January 2008. Principal | 2006 (retired 2008) and Member of the Executive |
| Occupation(s) During the Past Five Years: Executive | Committee (retired 2008) of Johnson & Johnson |
| Chief Staff and Marketing Officer for North America | (pharmaceuticals/consumer products); Vice President |
| and Corporate Vice President (retired 2008) of Xerox | and Chief Information Officer of Johnson & Johnson |
| Corporation (document management products and | (1997–2005); Director of the University Medical Center |
| services); Director of SPX Corporation (multi-industry | at Princeton and Women’s Research and Education |
| manufacturing), the United Way of Rochester, | Institute; Member of the Advisory Board of the |
| Amerigroup Corporation (managed health care), | Maxwell School of Citizenship and Public Affairs |
| the University of Rochester Medical Center, and | at Syracuse University. |
| Monroe Community College Foundation. | |
| | F. Joseph Loughrey |
| Rajiv L. Gupta | Born 1949. Trustee Since October 2009. Principal |
| Born 1945. Trustee Since December 2001.2 | Occupation(s) During the Past Five Years: President |
| Principal Occupation(s) During the Past Five Years: | and Chief Operating Officer since 2005 (retired 2009) |
| Chairman and Chief Executive Officer (retired 2009) | and Vice Chairman of the Board (2008–2009) of |
| and President (2006–2008) of Rohm and Haas Co. | Cummins Inc. (industrial machinery); Director of |
| (chemicals); Director of Tyco International, Ltd. | SKF AB (industrial machinery), Hillenbrand, Inc. |
| (diversified manufacturing and services) and Hewlett- | (specialized consumer services), Sauer-Danfoss Inc. |
| Packard Co. (electronic computer manufacturing); | (machinery), the Lumina Foundation for Education, |
| Trustee of The Conference Board; Member of the | and Oxfam America; Chairman of the Advisory Council |
| Board of Managers of Delphi Automotive LLP | for the College of Arts and Letters at the University of |
| (automotive components). | Notre Dame. |
| | |
| André F. Perold | Kathryn J. Hyatt | |
| Born 1952. Trustee Since December 2004. Principal | Born 1955. Treasurer Since November 2008. Principal |
| Occupation(s) During the Past Five Years: George | Occupation(s) During the Past Five Years: Principal |
| Gund Professor of Finance and Banking at the Harvard | of The Vanguard Group, Inc.; Treasurer of each of |
| Business School; Chair of the Investment Committee | the investment companies served by The Vanguard |
| of HighVista Strategies LLC (private investment firm). | Group since 2008; Assistant Treasurer of each of the |
| | investment companies served by The Vanguard Group |
| Alfred M. Rankin, Jr. | (1988–2008). | |
| Born 1941. Trustee Since January 1993. Principal | | |
| Occupation(s) During the Past Five Years: Chairman, | Heidi Stam | |
| President, and Chief Executive Officer of NACCO | Born 1956. Secretary Since July 2005. Principal |
| Industries, Inc. (forklift trucks/housewares/lignite); | Occupation(s) During the Past Five Years: Managing |
| Director of Goodrich Corporation (industrial products/ | Director of The Vanguard Group, Inc., since 2006; |
| aircraft systems and services); Chairman of the Federal | General Counsel of The Vanguard Group since 2005; |
| Reserve Bank of Cleveland; Trustee of The Cleveland | Secretary of The Vanguard Group and of each of the |
| Museum of Art. | investment companies served by The Vanguard Group |
| | since 2005; Director and Senior Vice President of |
| Peter F. Volanakis | Vanguard Marketing Corporation since 2005; |
| Born 1955. Trustee Since July 2009. Principal | Principal of The Vanguard Group (1997–2006). |
| Occupation(s) During the Past Five Years: President | | |
| since 2007 and Chief Operating Officer since 2005 | Vanguard Senior Management Team |
| of Corning Incorporated (communications equipment); | | |
| President of Corning Technologies (2001–2005); | R. Gregory Barton | Michael S. Miller |
| Director of Corning Incorporated and Dow Corning; | Mortimer J. Buckley | James M. Norris |
| Trustee of the Corning Incorporated Foundation and | Kathleen C. Gubanich | Glenn W. Reed |
| the Corning Museum of Glass; Overseer of the | Paul A. Heller | George U. Sauter |
| Amos Tuck School of Business Administration at | | |
| Dartmouth College. | | |
| | Chairman Emeritus and Senior Advisor |
| |
| Executive Officers | John J. Brennan | |
| | Chairman, 1996–2009 | |
| Glenn Booraem | Chief Executive Officer and President, 1996–2008 |
| Born 1967. Controller Since July 2010. Principal | | |
| Occupation(s) During the Past Five Years: Principal | | |
| of The Vanguard Group, Inc.; Controller of each of | Founder | |
| the investment companies served by The Vanguard | | |
| Group since 2010; Assistant Controller of each of | John C. Bogle | |
| the investment companies served by The Vanguard | Chairman and Chief Executive Officer, 1974–1996 |
| Group (2001–2010). | | |
| |
| Thomas J. Higgins | | |
| Born 1957. Chief Financial Officer Since September | | |
| 2008. Principal Occupation(s) During the Past Five | | |
| Years: Principal of The Vanguard Group, Inc.; Chief | | |
| Financial Officer of each of the investment companies | | |
| served by The Vanguard Group since 2008; Treasurer | | |
| of each of the investment companies served by The | | |
| Vanguard Group (1998–2008). | | |
1 Mr. McNabb is considered an “interested person,” as defined in the Investment Company Act of 1940, because he is an officer of the Vanguard funds.
2 December 2002 for Vanguard Equity Income Fund, Vanguard Growth Equity Fund, the Vanguard Municipal Bond Funds, and the Vanguard State Tax-Exempt Funds.
|  |
| P.O. Box 2600 |
| Valley Forge, PA 19482-2600 |
Connect with Vanguard® > Vanguard.com
| |
| Fund Information > 800-662-7447 | |
| Direct Investor Account Services > 800-662-2739 | |
| Institutional Investor Services > 800-523-1036 | |
| Text Telephone for People | |
| With Hearing Impairment > 800-749-7273 | |
| |
| This material may be used in conjunction | |
| with the offering of shares of any Vanguard | |
| fund only if preceded or accompanied by | |
| the fund’s current prospectus. | |
| |
| All comparative mutual fund data are from Lipper Inc. or | |
| Morningstar, Inc., unless otherwise noted. | |
| |
| You can obtain a free copy of Vanguard’s proxy voting | |
| guidelines by visiting vanguard.com/proxyreporting or by | |
| calling Vanguard at 800-662-2739. The guidelines are | |
| also available from the SEC’s website, sec.gov. In | |
| addition, you may obtain a free report on how your fund | |
| voted the proxies for securities it owned during the 12 | |
| months ended June 30. To get the report, visit either | |
| vanguard.com/proxyreporting or sec.gov. | |
| |
| You can review and copy information about your fund at | |
| the SEC’s Public Reference Room in Washington, D.C. To | |
| find out more about this public service, call the SEC at | |
| 202-551-8090. Information about your fund is also | |
| available on the SEC’s website, and you can receive | |
| copies of this information, for a fee, by sending a | |
| request in either of two ways: via e-mail addressed to | |
| publicinfo@sec.gov or via regular mail addressed to the | |
| Public Reference Section, Securities and Exchange | |
| Commission, Washington, DC 20549-1520. | |
| |
| |
| | © 2010 The Vanguard Group, Inc. |
| | All rights reserved. |
| | Vanguard Marketing Corporation, Distributor. |
| |
| | Q532 092010 |
 |
| Vanguard Health Care Fund |
| Semiannual Report |
|
| July 31, 2010 |
 |
> For the six months ended July 31, 2010, health care was by far the weakest sector in the Standard & Poor’s 500 Index.
> Against this backdrop, Vanguard Health Care Fund returned about –5%, outperforming the results of its comparative standards by almost 2 percentage points.
> In pharmaceuticals—which represented slightly more than half of the fund’s market value, on average, during the period—many companies struggled.
| |
| Contents | |
| Your Fund’s Total Returns. | 1 |
| Chairman’s Letter. | 2 |
| Advisor’s Report. | 7 |
| Fund Profile. | 9 |
| Performance Summary. | 11 |
| Financial Statements. | 12 |
| About Your Fund’s Expenses. | 23 |
| Trustees Approve Advisory Arrangement. | 25 |
| Glossary. | 26 |
Please note: The opinions expressed in this report are just that—informed opinions. They should not be considered promises or advice.
Also, please keep in mind that the information and opinions cover the period through the date on the front of this report. Of course, the risks of investing in your fund are spelled out in the prospectus.
See the Glossary for definitions of investment terms used in this report.
Cover photograph: Veronica Coia.
Your Fund’s Total Returns
Six Months Ended July 31, 2010
| | Total |
| | Returns |
| Vanguard Health Care Fund | |
| Investor Shares | -4.79% |
| Admiral™ Shares | -4.77 |
| Spliced Health Care Index | -6.61 |
| Global Health/Biotechnology Funds Average | -6.51 |
Spliced Health Care Index: S&P Health Care Index through May 31, 2010; MSCI All Country World Health Care Index thereafter.Global Health/Biotechnology Funds Average: Derived from data provided by Lipper Inc.Admiral Shares are a lower-cost class of shares available to many longtime shareholders and to those with significant investments in the fund.Your Fund’s Performance at a Glance
January 31, 2010, Through July 31, 2010
| | | | |
| | | | Distributions Per Share |
| | Starting | Ending | Income | Capital |
| | Share Price | Share Price | Dividends | Gains |
| Vanguard Health Care Fund | | | | |
| Investor Shares | $120.06 | $113.15 | $0.084 | $1.189 |
| Admiral Shares | 50.67 | 47.76 | 0.039 | 0.502 |
1

Chairman’s Letter
Dear Shareholder,
The fund got off to a good start in the new fiscal year, but gains soon gave way to losses that July’s rebound was unable to erase. For the six months ended July 31, Vanguard Health Care Fund returned –4.79% for Investor Shares and –4.77% for Admiral Shares, almost 2 percentage points ahead of the return of its spliced market benchmark index and the average return of its peer funds. The advisor’s biotechnology selections, accounting for about one-tenth of the fund’s market value, on average, boosted the fund’s relative performance.
Please note: As of June 1, 2010, the fund’s comparative benchmark changed from the all-U.S. Standard & Poor’s Health Care Index to the MSCI All Country World Health Care Index. The Trustees believe that the new benchmark, which includes global companies domiciled outside the United States, is more consistent with the fund’s investment objective and strategies.
Stock markets moved higher but the journey was tense
Global stock markets emerged from a turbulent six-month stretch with respectable single-digit gains. Prices rallied in early spring, buoyed by rapid growth in corporate earnings, but fell sharply in May and June as Europe’s sovereign debt crisis took center stage Signs that the U.S. economic recovery might be sputtering also dampened
2
investor spirits. By the end of the six-month period, however, stock markets had recouped the previous months’ losses as corporate bellwethers continued to report strong profits, and investors’ moods brightened.
For the full period, the U.S. stock market returned more than 4%. Smaller-company stocks, which are less exposed to global turmoil than are large-cap multinationals, returned about 9%. International stocks finished the period with a modestly positive return, as strong performance from emerging markets compensated for weaker returns in Europe.
High-quality bonds rallied amid the search for safety
Turmoil in the stock markets and mixed economic signals drove bond prices higher, and yields lower, as investors sought safety in high-quality government and corporate bonds. At the start of the period, the yield of the benchmark 10-year U.S. Treasury note stood at 3.61%. By the end of the period, it had dipped to 2.91%, and the rates on home-mortgage loans were at their lowest levels since the 1950s.
Rising bond prices led to strong six-month returns in both the taxable and municipal bond markets. The returns from money market instruments, by contrast, remained vanishingly small. Yields have hovered near
| | | |
| Market Barometer | | | |
| |
| | | | Total Returns |
| | | Periods Ended July 31, 2010 |
| | Six | One | Five Years |
| | Months | Year | (Annualized) |
| Stocks | | | |
| Russell 1000 Index (Large-caps) | 3.84% | 14.51% | 0.02% |
| Russell 2000 Index (Small-caps) | 8.79 | 18.43 | 0.47 |
| Dow Jones U.S. Total Stock Market Index | 4.48 | 15.36 | 0.45 |
| MSCI All Country World Index ex USA (International) | 2.26 | 10.12 | 4.89 |
| |
| Bonds | | | |
| Barclays Capital U.S. Aggregate Bond Index (Broad | | | |
| taxable market) | 4.85% | 8.91% | 5.96% |
| Barclays Capital Municipal Bond Index | 4.06 | 9.15 | 4.75 |
| Citigroup Three-Month U.S. Treasury Bill Index | 0.06 | 0.12 | 2.58 |
| |
| CPI | | | |
| Consumer Price Index | 0.61% | 1.24% | 2.21% |
3
0% since late 2008, when the Federal Reserve Board set its target for short-term interest rates between 0% and 0.25%.
While biotechnology advanced, many pharmaceuticals struggled
In some ways, the fund’s performance during the six months was the opposite of its performance for the same period a year ago. Last year, pharmaceuticals enjoyed gains and biotechnology stocks were the only group to post a negative return; this year, it was biotech stocks’ chance to shine, especially with merger activity. OSI Pharmaceuticals’ acquisition by Japan’s Astellas Pharma, also held by the fund, was completed in June, and Genzyme became a takeover target.
Performance among the fund’s pharmaceutical stocks was decidedly mixed, as some of the largest stakes lost ground. It is tempting, and perhaps convenient, to cite U.S. health care reform as the culprit. Uncertainty about whether Congress would agree on health care reform gave way to questions about what the new legislation might mean for companies and consumers, and uncertainty is seldom a prescription for market success. Still, the reasons for success and disappointment by U.S. and foreign-based holdings tended to be more company-specific.
Top-ten holdings Merck (–8%) and Pfizer (–18%) have been digesting last year’s major acquisitions of companies that had also been fund holdings. Merck’s
| | | |
| Expense Ratios | | | |
| Your Fund Compared With Its Peer Group | | | |
| | Investor | Admiral | Peer Group |
| | Shares | Shares | Average |
| Health Care Fund | 0.36% | 0.29% | 1.61% |
The fund expense ratios shown are from the prospectus dated May 28, 2010, and represent estimated costs for the current fiscal year. For the six months ended July 31, 2010, the fund’s annualized expense ratios were 0.35% for Investor Shares and 0.29% for Admiral Shares. The peer-group expense ratio is derived from data provided by Lipper Inc. and captures information through year-end 2009.Peer group: Global Health/Biotechnology Funds.4
November merger with Schering-Plough made the combined entity the fund’s largest position (more than 6% of assets on July 31), and Pfizer purchased Wyeth. Other U.S.-based firms that backtracked during the period included Johnson & Johnson (which recalled several products), Forest Laboratories, and Abbott Laboratories. In contrast, Eli Lilly, which faces several near-term expirations of major patents, posted a modest gain. Perrigo, a manufacturer of over-the-counter and generic medications, returned almost 27% for the half-year.
The fund’s international pharmaceutical holdings also delivered disparate returns. At the start of the fiscal year, companies based outside the United States represented about one-quarter of the fund’s market value. Concerns about sovereign debt and new fiscal austerity measures in several countries created headwinds for some of these firms and for international stocks in general. The slide in the value of the euro and pound sterling relative to the U.S. dollar also weakened results for some holdings when translated into dollars for U.S. investors.
Roche Holding, based in Switzerland (not a Eurozone member), and France’s Sanofi-Aventis posted double-digit losses for the half-year. However, the United Kingdom’s AstraZeneca was a notable positive contributor, along with Japan’s Takeda Pharmaceutical.
Relative to the spliced benchmark, the advisor’s biotech holdings—which notched a small gain for the six months, compared with a loss for those in the index—accounted for most of the fund’s advantage. Pharmaceuticals added modest support, while managed-care providers lagged slightly.
Old-fashioned principles still apply in the new decade
Just when it appeared that the U.S. and global economies were squarely back on the growth track—which would bode well for stock markets—yellow warning lights started flashing and volatility increased. When investor confidence about the economy changes, various industry sectors often trade places in the performance rankings, and that’s likely to continue. Even a burgeoning business like health care, striving to meet the current and anticipated needs of the baby boomer generation, is not immune to periods of relative weakness. That’s why it’s important to take a long-term view, as does your fund’s advisor—Wellington Management Company, llp—which has ably managed the fund for more than 26 years.
5
Our experience suggests that the most effective way to manage the markets’ unsettling and unpredictable volatility is to build a diversified and balanced portfolio of stock, bond, and money market funds consistent with your long-term financial goals and risk tolerance. Vanguard Health Care Fund can play a supporting role within such a portfolio, by providing you with low-cost exposure to health care’s primary subsectors and the opportunity to participate in the ever-changing developments, both at home and abroad, in these essential products and services.
As always, thank you for entrusting your assets to Vanguard.
Sincerely,

F. William McNabb III
Chairman and Chief Executive Officer
August 11, 2010
6
Advisor’s Report
Vanguard Health Care Fund returned –4.79% for Investor Shares and –4.77% for Admiral Shares for the six months ended July 31, 2010. This compares with returns of 3.61% for the diversified S&P 500 Index; –6.61% for the fund’s benchmark, the Spliced Health Care Index; and –6.51%, on average, for global health/ biotechnology funds.
The investment environment
Much of the headline risk regarding health care reform is behind us. However, the sector did not provide its usual defensive character during the market’s second- calendar-quarter retreat, which was driven by discouraging economic data. Health care stocks underperformed the overall stock market, as represented by the S&P 500 Index.
Our successes
AstraZeneca shares performed well following the company’s successful defense of its patent for the cholesterol- lowering drug Crestor. With the litigation overhang removed from the company’s outlook, we expect strong growth through the ultimate expiration of the Crestor patent in 2016. The fund also benefited from Astellas Pharma’s acquisition, at a significant premium, of OSI Pharmaceuticals. Genzyme’s stock price rose when the company became a potential acquisition target.
Our shortfalls
Shares of Roche Holding fell on concerns that the growth outlook for its major cancer drug, Avastin, would be reduced because of the drug’s less-than-hoped-for efficacy
| |
| Portfolio Changes: | |
| Six Months Ended July 31, 2010 | |
| |
| Additions | Comments |
| Gilead Sciences | Augmented on weakness. |
| Johnson & Johnson | Patent expirations that caused concern are mostly behind the company. |
| | |
| Boston Scientific | Expect the worst is over for the company. |
| |
| Reductions | Comments |
| OSI Pharmaceuticals | Acquired by Astellas Pharma (also a fund holding). |
| Mead Johnson Nutrition | Eliminated on strength. |
| Takeda Pharmaceutical | Trimmed based on strong yen |
| | and reduced earnings outlook. |
7
in treating breast cancer. Pfizer shares underperformed, which was in keeping with the general malaise surrounding the prospects of big pharma as the much-talked-about patent cliff approaches. Major pharmaceuticals’ price-to-earnings multiples have reached historic lows, and we believe further risk is limited.
The fund’s positioning
With the calendar year more than half over, the economy has not produced the recovery that many had anticipated, and accordingly, the stock market has responded negatively. Despite their defensive qualities, health care stocks did not outperform the weak market. However, as health care reform recedes and the focus shifts more toward company fundamentals, we believe that the sector will become more attractive to investors and that it will have the opportunity to outpace the broad market. We will continue to be mindful of other risks in the industry and to stay diversified, long-term-focused, and positioned in the most attractive health care stocks.
Edward P. Owens, CFA
Senior Vice President and Portfolio Manager
Jean M. Hynes, CFA
Senior Vice President and Associate Portfolio Manager
Wellington Management Company, LLP
August 12, 2010
8
Health Care Fund
Fund Profile
As of July 31, 2010
| | | |
| Share-Class Characteristics | | |
| | Investor | | Admiral |
| | Shares | | Shares |
| Ticker Symbol | VGHCX | | VGHAX |
| Expense Ratio1 | 0.36% | | 0.29% |
| 30-Day SEC Yield | 0.82% | | 0.87% |
| |
| Portfolio Characteristics | | |
| | | MSCI | DJ |
| | | ACWI | U.S. Total |
| | | Health | Market |
| | Fund | Care | Index |
| Number of Stocks | 76 | 131 | 4,101 |
| Median Market Cap $21.7B | $47.5B | $27.0B |
| Price/Earnings Ratio | 11.5x | 12.7x | 17.4x |
| Price/Book Ratio | 2.0x | 2.3x | 2.0x |
| Return on Equity | 19.6% | 21.9% | 19.0% |
| Earnings Growth Rate 11.2% | 11.2% | 6.7% |
| Dividend Yield | 2.2% | 2.8% | 1.9% |
| Foreign Holdings | 23.0% | 41.5% | 0.0% |
| Turnover Rate | | | |
| (Annualized) | 11% | — | — |
| Short-Term Reserves | 8.7% | — | — |
| | |
| Volatility Measures | | |
| | Spliced | DJ |
| | Health | U.S. Total |
| | Care | Market |
| | Index | Index |
| R-Squared | 0.95 | 0.62 |
| Beta | 0.97 | 0.62 |
| These measures show the degree and timing of the fund’s fluctuations compared with the indexes over 36 months. |
|
| |
| Ten Largest Holdings (% of total net assets) |
| Merck & Co. Inc. | Pharmaceuticals | 6.1% |
| Forest Laboratories Inc. | Pharmaceuticals | 4.3 |
| AstraZeneca PLC | Pharmaceuticals | 4.0 |
| McKesson Corp. | Health Care | |
| | Distributors | 3.7 |
| Eli Lilly & Co. | Pharmaceuticals | 3.6 |
| Pfizer Inc. | Pharmaceuticals | 3.6 |
| Abbott Laboratories | Pharmaceuticals | 3.5 |
| Roche Holding AG | Pharmaceuticals | 3.4 |
| UnitedHealth Group Inc. | Managed Health | |
| | Care | 3.1 |
| Amgen Inc. | Biotechnology | 2.6 |
| Top Ten | | 37.9% |
| The holdings listed exclude any temporary cash investments and equity index products. |
| | |
| |
| Market Diversification (% of equity exposure) |
| |
| Europe | |
| Switzerland | 5.5% |
| United Kingdom | 4.9 |
| France | 2.9 |
| Germany | 1.0 |
| Other | 0.5 |
| Subtotal | 14.8% |
| Pacific | |
| Japan | 10.5% |
| North America | |
| United States | 74.7% |
1 The expense ratios shown are from the prospectus dated May 28, 2010, and represent estimated costs for the current fiscal year. For the six months ended July 31, 2010, the annualized expense ratios were 0.35% for Investor Shares and 0.29% for Admiral Shares.9
Health Care Fund
| | |
| Subindustry Diversification (% of equity exposure) | |
| | |
| | | MSCI |
| | | ACWI |
| | | Health |
| | Fund | Care |
| Biotechnology | 10.1% | 8.9% |
| Consumer Staples | 2.0 | 0.0 |
| Health Care Distributors | 5.8 | 2.6 |
| Health Care Equipment | 9.0 | 12.8 |
| Health Care Facilities | 1.6 | 0.1 |
| Health Care Services | 3.2 | 4.1 |
| Health Care Supplies | 0.4 | 1.0 |
| Health Care Technology | 1.4 | 0.3 |
| Industrials | 0.5 | 0.0 |
| Life Sciences Tools & | | |
| Services | 0.4 | 2.6 |
| Managed Health Care | 11.1 | 4.4 |
| Materials | 1.2 | 0.0 |
| Pharmaceuticals | 53.3 | 63.2 |
10
Health Care Fund
Performance Summary
All of the returns in this report represent past performance, which is not a guarantee of future results that may be achieved by the fund. (Current performance may be lower or higher than the performance data cited. For performance data current to the most recent month-end, visit our website at www.vanguard.com/performance.) Note, too, that both investment returns and principal value can fluctuate widely, so an investor’s shares, when sold, could be worth more or less than their original cost. The returns shown do not reflect taxes that a shareholder would pay on fund distributions or on the sale of fund shares.
Fiscal-Year Total Returns (%): January 31, 2000, Through July 31, 2010
Spliced Health Care Index: S&P Health Care Index through May 31, 2010; MSCI All Country World Health Care Index thereafter.
Note: For 2011, performance data reflect the six months ended July 31, 2010.
Average Annual Total Returns: Periods Ended June 30, 2010
This table presents average annual total returns through the latest calendar quarter—rather than through the end of the fiscal period. Securities and Exchange Commission rules require that we provide this information.
| | | | |
| | Inception | One | Five | Ten |
| | Date | Year | Years | Years |
| Investor Shares | 5/23/1984 | 11.30% | 3.20% | 5.45% |
| Admiral Shares | 11/12/2001 | 11.37 | 3.28 | 5.371 |
| 1 Return since inception. | | | | |
Vanguard fund returns do not reflect the 1% fee on redemptions of shares held for less than one year.
See Financial Highlights for dividend and capital gains information.
11
Health Care Fund
Financial Statements (unaudited)
Statement of Net Assets
As of July 31, 2010
The fund reports a complete list of its holdings in regulatory filings four times in each fiscal year, at the quarter-ends. For the second and fourth fiscal quarters, the lists appear in the fund’s semiannual and annual reports to shareholders. For the first and third fiscal quarters, the fund files the lists with the Securities and Exchange Commission on Form N-Q. Shareholders can look up the fund’s Forms N-Q on the SEC’s website at www.sec.gov. Forms N-Q may also be reviewed and copied at the SEC’s Public Reference Room (see the back cover of this report for further information).
| | | |
| | | | Market |
| | | | Value |
| | | Shares | ($000) |
| Common Stocks (91.1%) | | |
| United States (68.1%) | | |
| Biotechnology (9.2%) | | |
| * | Amgen Inc. | 8,938,455 | 487,414 |
| * | Genzyme Corp. | 4,869,340 | 338,711 |
| *,1 | Cephalon Inc. | 5,726,230 | 324,964 |
| * | Gilead Sciences Inc. | 6,557,100 | 218,483 |
| * | Biogen Idec Inc. | 2,720,000 | 151,994 |
| * | Vertex | | |
| | Pharmaceuticals Inc. | 1,693,800 | 57,013 |
| * | Onyx Pharmaceuticals Inc. | 1,307,200 | 33,987 |
| * | Amylin | | |
| | Pharmaceuticals Inc. | 1,557,200 | 29,462 |
| * | Ironwood | | |
| | Pharmaceuticals Inc. | 2,000,000 | 23,600 |
| * | United Therapeutics Corp. | 354,500 | 17,331 |
| * | Regeneron | | |
| | Pharmaceuticals Inc. | 700,000 | 16,933 |
| * | Cubist Pharmaceuticals Inc. | 586,542 | 12,658 |
| | | | 1,712,550 |
| Chemicals (1.1%) | | |
| | Sigma-Aldrich Corp. | 3,480,000 | 195,228 |
| |
| Food & Staples Retailing (1.8%) | |
| | Walgreen Co. | 11,400,000 | 325,470 |
| |
| Health Care Equipment & Supplies (8.5%) |
| * | St. Jude Medical Inc. | 8,910,900 | 327,654 |
| | Medtronic Inc. | 7,001,100 | 258,831 |
| | Becton Dickinson and Co. | 3,402,500 | 234,092 |
| | Baxter International Inc. | 3,700,000 | 161,949 |
| | Beckman Coulter Inc. | 2,711,784 | 124,281 |
| * | Boston Scientific Corp. | 22,100,000 | 123,760 |
| * | CareFusion Corp. | 3,568,354 | 75,185 |
| | DENTSPLY | | |
| | International Inc. | 2,485,400 | 74,612 |
| * | Hospira Inc. | 1,395,070 | 72,683 |
| | Covidien PLC | 1,850,000 | 69,042 |
| | | |
| | | | Market |
| | | | Value |
| | | Shares | ($000) |
| * | Zimmer Holdings Inc. | 800,000 | 42,392 |
| | STERIS Corp. | 803,083 | 25,530 |
| | | | 1,590,011 |
| Health Care Providers & Services (19.6%) | |
| | McKesson Corp. | 11,089,900 | 696,667 |
| | UnitedHealth Group Inc. | 18,885,100 | 575,051 |
| * | WellPoint Inc. | 7,602,400 | 385,594 |
| * | Humana Inc. | 6,860,094 | 322,562 |
| | Quest Diagnostics Inc. | 6,085,400 | 285,953 |
| | CIGNA Corp. | 7,810,600 | 240,254 |
| | Cardinal Health Inc. | 6,536,708 | 210,940 |
| * | Laboratory Corp. of | | |
| | America Holdings | 2,731,360 | 199,335 |
| *,1 | Coventry Health Care Inc. | 8,957,500 | 177,627 |
| | Universal Health | | |
| | Services Inc. Class B | 4,320,800 | 155,419 |
| *,1 | Health Management | | |
| | Associates Inc. Class A | 15,756,900 | 112,819 |
| * | Health Net Inc. | 4,663,458 | 109,824 |
| | Owens & Minor Inc. | 3,000,000 | 81,570 |
| | Aetna Inc. | 2,250,000 | 62,662 |
| * | DaVita Inc. | 304,600 | 17,460 |
| * | WellCare Health Plans Inc. | 449,000 | 11,580 |
| | | | 3,645,317 |
| Health Care Technology (1.3%) | |
| * | Cerner Corp. | 3,150,000 | 243,967 |
| |
| Household Products (0.1%) | | |
| * | Energizer Holdings Inc. | 237,300 | 14,599 |
| |
| Life Sciences Tools & Services (0.3%) | |
| * | Parexel International Corp. | 2,840,400 | 58,313 |
| |
| Machinery (0.4%) | | |
| | Pall Corp. | 2,104,600 | 80,480 |
12
Health Care Fund
| | | |
| | | | Market |
| | | | Value |
| | | Shares | ($000) |
| Pharmaceuticals (25.8%) | | |
| | Merck & Co. Inc. | 33,030,248 | 1,138,222 |
| *,1 | Forest Laboratories Inc. | 28,803,000 | 799,283 |
| | Eli Lilly & Co. | 18,879,900 | 672,125 |
| | Pfizer Inc. | 44,359,788 | 665,397 |
| | Abbott Laboratories | 13,200,000 | 647,856 |
| | Johnson & Johnson | 6,400,000 | 371,776 |
| | Bristol-Myers Squibb Co. | 9,078,361 | 226,233 |
| | Perrigo Co. | 3,509,100 | 196,545 |
| * | Watson | | |
| | Pharmaceuticals Inc. | 1,900,000 | 76,950 |
| * | Warner Chilcott PLC | | |
| | Class A | 232,200 | 5,944 |
| | | | 4,800,331 |
| Total United States | | 12,666,266 |
| International (23.0%) | | |
| Belgium (0.3%) | | |
| | UCB SA | 1,671,065 | 53,889 |
| |
| France (2.6%) | | |
| | Sanofi-Aventis SA | 7,584,974 | 440,934 |
| | Ipsen SA | 1,400,000 | 46,493 |
| | | | 487,427 |
| Germany (1.0%) | | |
| | Bayer AG | 2,494,656 | 143,600 |
| | Fresenius Medical Care | | |
| | AG & Co. KGaA | 611,950 | 33,566 |
| | | | 177,166 |
| Ireland (0.2%) | | |
| * | Elan Corp. PLC ADR | 8,462,700 | 40,367 |
| |
| Japan (9.5%) | | |
| | Astellas Pharma Inc. | 14,265,700 | 482,484 |
| | Takeda | | |
| | Pharmaceutical Co. Ltd. | 7,649,900 | 351,042 |
| | Eisai Co. Ltd. | 7,993,700 | 272,512 |
| | Daiichi Sankyo Co. Ltd. | 12,251,500 | 227,724 |
| | Shionogi & Co. Ltd. | 10,226,000 | 209,069 |
| | Mitsubishi Tanabe | | |
| | Pharma Corp. | 6,850,000 | 100,185 |
| | Chugai | | |
| | Pharmaceutical Co. Ltd. | 4,501,800 | 78,782 |
| | Ono | | |
| | Pharmaceutical Co. Ltd. | 960,000 | 39,664 |
| | Terumo Corp. | 200,000 | 10,505 |
| | | | 1,771,967 |
| | | |
| | | | Market |
| | | | Value |
| | | Shares | ($000) |
| Switzerland (5.0%) | | | |
| Roche Holding AG | | 4,263,977 | 554,428 |
| Novartis AG | | 6,169,880 | 299,937 |
| Roche Holding AG (Bearer) | 514,320 | 72,313 |
| | | | 926,678 |
| United Kingdom (4.4%) | | | |
| AstraZeneca PLC | 14,681,500 | 736,127 |
| GlaxoSmithKline | | | |
| PLC ADR | | 2,542,381 | 89,416 |
| | | | 825,543 |
| Total International | | | 4,283,037 |
| Total Common Stocks | | | |
| (Cost $13,075,562) | | | 16,949,303 |
| Temporary Cash Investments (8.7%) | |
| |
| |
| | | Face | |
| | | Amount | |
| | | ($000) | |
| Repurchase Agreements (6.5%) | |
| Banc Of America | | | |
| Securities, LLC 0.210%, | | |
| 8/2/10 (Dated 7/30/10, | | |
| Repurchase Value | | | |
| $168,803,000, collateralized | |
| by Federal National | | | |
| Mortgage Assn. | | | |
| 1.616%–5.714%, | | | |
| 1/1/36-12/1/44 and Federal | |
| Home Loan | | | |
| Mortgage Corp. | | | |
| 4.249%–5.452%, | | | |
| 10/1/35–11/1/39) | | 168,800 | 168,800 |
| Barclays Capital Inc. 0.220%, | |
| 8/2/10 (Dated 7/30/10, | | |
| Repurchase Value | | | |
| $617,311,000, | | | |
| collateralized by Federal | | |
| National Mortgage Assn. | | |
| Discount Note, 11/15/10, | | |
| Federal Home Loan | | |
| Mortgage Corp. | | | |
| 2.750%, 6/22/15, | | | |
| Federal Home | | | |
| Loan Bank 0.750%, | | |
| 11/21/11, and Federal | | |
| National Mortgage Assn. | | |
| 1.875%, 4/20/12) | | 617,300 | 617,300 |
13
Health Care Fund
| | |
| | Face | |
| | Amount | |
| | ($000) | |
| J.P. Morgan Securities Inc. 0.210%, | |
| 8/2/10 (Dated 7/30/10, | | |
| Repurchase Value | | |
| $122,700,000 collateralized | | |
| by Federal National | | |
| Mortgage Assn. | | |
| Discount Note, | | |
| 10/1/32–8/1/40) | 122,700 | 122,700 |
| Morgan Stanley 0.210%, | | |
| 8/2/10 (Dated 7/30/10, | | |
| Repurchase Value | | |
| $300,005,000, collateralized | | |
| by Federal Home Loan | | |
| Mortgage Corp. | | |
| 4.500%–5.000%, | | |
| 7/1/30–7/1/40) | 300,000 | 300,000 |
| | | 1,208,800 |
| Commercial Paper (2.2%) | | |
| General Electric | | |
| Capital Corp., | | |
| 0.471%, 12/16/10 | 200,000 | 199,772 |
| General Electric | | |
| Capital Services Inc., | | |
| 0.300%, 8/2/10 | 200,000 | 199,997 |
| | | 399,769 |
| |
| Total Temporary Cash Investments | |
| (Cost $1,608,441) | | 1,608,569 |
| Total Investments (99.8%) | | |
| (Cost $14,684,003) | | 18,557,872 |
| Other Assets and Liabilities (0.2%) | |
| Other Assets | | 135,962 |
| Liabilities | | (92,347) |
| | | 43,615 |
| Net Assets (100%) | | 18,601,487 |
| |
| | Market |
| | Value |
| | ($000) |
| Statement of Assets and Liabilities | |
| Assets | |
| Investments in Securities, at Value | 18,557,872 |
| Receivables for Investment Securities Sold 101,187 |
| Other Assets | 34,775 |
| Total Assets | 18,693,834 |
| Liabilities | |
| Payables for Capital Shares Redeemed | 35,171 |
| Other Liabilities | 57,176 |
| Total Liabilities | 92,347 |
| Net Assets (100%) | 18,601,487 |
| |
| |
| At July 31, 2010, net assets consisted of: |
| | Amount |
| | ($000) |
| Paid-in Capital | 14,340,303 |
| Undistributed Net Investment Income | 161,624 |
| Accumulated Net Realized Gains | 224,543 |
| Unrealized Appreciation (Depreciation) | |
| Investment Securities | 3,873,869 |
| Foreign Currencies | 1,148 |
| Net Assets | 18,601,487 |
| |
| |
| Investor Shares—Net Assets | |
| Applicable to 92,524,160 outstanding | |
| $.001 par value shares of beneficial | |
| interest (unlimited authorization) | 10,469,187 |
| Net Asset Value Per Share— | |
| Investor Shares | $113.15 |
| |
| |
| Admiral Shares—Net Assets | |
| Applicable to 170,276,328 outstanding | |
| $.001 par value shares of beneficial | |
| interest (unlimited authorization) | 8,132,300 |
| Net Asset Value Per Share— | |
| Admiral Shares | $47.76 |
• See Note A in Notes to Financial Statements.
* Non-income producing security.
1 Considered an affiliated company of the fund as the fund owns more than 5% of the outstanding voting securities of such company.
ADR - American Depository Receipt.
See accompanying Notes, which are an integral part of the Financial Statements.
14
Health Care Fund
Statement of Operations
| |
| | Six Months Ended |
| | July 31, 2010 |
| | ($000) |
| Investment Income | |
| Income | |
| Dividends1,2 | 228,633 |
| Interest | 1,906 |
| Security Lending | 3,699 |
| Total Income | 234,238 |
| Expenses | |
| Investment Advisory Fees—Note B | 14,746 |
| The Vanguard Group—Note C | |
| Management and Administrative—Investor Shares | 9,765 |
| Management and Administrative—Admiral Shares | 5,132 |
| Marketing and Distribution—Investor Shares | 1,061 |
| Marketing and Distribution—Admiral Shares | 754 |
| Custodian Fees | 229 |
| Shareholders’ Reports—Investor Shares | 94 |
| Shareholders’ Reports—Admiral Shares | 13 |
| Trustees’ Fees and Expenses | 16 |
| Total Expenses | 31,810 |
| Net Investment Income | 202,428 |
| Realized Net Gain (Loss) | |
| Investment Securities Sold2 | 243,689 |
| Foreign Currencies | (1,060) |
| Realized Net Gain (Loss) | 242,629 |
| Change in Unrealized Appreciation (Depreciation) | |
| Investment Securities | (1,394,814) |
| Foreign Currencies | 379 |
| Change in Unrealized Appreciation (Depreciation) | (1,394,435) |
| Net Increase (Decrease) in Net Assets Resulting from Operations | (949,378) |
2 Dividend income and realized net gain (loss) from affiliated companies of the fund were $0 and $59,396,000, respectively.
See accompanying Notes, which are an integral part of the Financial Statements.
15
Health Care Fund
Statement of Changes in Net Assets
| | |
| | Six Months Ended | Year Ended |
| | July 31, | January 31, |
| | 2010 | 2010 |
| | ($000) | ($000) |
| Increase (Decrease) in Net Assets | | |
| Operations | | |
| Net Investment Income | 202,428 | 325,728 |
| Realized Net Gain (Loss) | 242,629 | 346,877 |
| Change in Unrealized Appreciation (Depreciation) | (1,394,435) | 3,255,909 |
| Net Increase (Decrease) in Net Assets Resulting from Operations | (949,378) | 3,928,514 |
| Distributions | | |
| Net Investment Income | | |
| Investor Shares | (8,047) | (169,451) |
| Admiral Shares | (6,690) | (130,015) |
| Realized Capital Gain1 | | |
| Investor Shares | (113,898) | (70,199) |
| Admiral Shares | (86,103) | (51,618) |
| Total Distributions | (214,738) | (421,283) |
| Capital Share Transactions | | |
| Investor Shares | (562,859) | (827,665) |
| Admiral Shares | 16,783 | (422,405) |
| Net Increase (Decrease) from Capital Share Transactions | (546,076) | (1,250,070) |
| Total Increase (Decrease) | (1,710,192) | 2,257,161 |
| Net Assets | | |
| Beginning of Period | 20,311,679 | 18,054,518 |
| End of Period2 | 18,601,487 | 20,311,679 |
2 Net Assets - End of Period includes undistributed (overdistributed) net investment income of $161,624,000 and ($25,007,000).
See accompanying Notes, which are an integral part of the Financial Statements.
16
Health Care Fund
Financial Highlights
| | | | | | |
| Investor Shares | | | | | | |
| Six Months | | | | | |
| | Ended | | | | | |
| For a Share Outstanding | July 31, | | | Year Ended January 31, |
| Throughout Each Period | 2010 | 2010 | 2009 | 2008 | 2007 | 2006 |
| Net Asset Value, Beginning of Period | $120.06 | $99.12 | $133.80 | $149.69 | $143.39 | $123.84 |
| Investment Operations | | | | | | |
| Net Investment Income | 1.210 | 1.902 | 1.998 | 2.7661 | 1.953 | 1.753 |
| Net Realized and Unrealized Gain (Loss) | | | | | | |
| on Investments | (6.847) | 21.530 | (25.229) | (5.317) | 13.107 | 24.424 |
| Total from Investment Operations | (5.637) | 23.432 | (23.231) | (2.551) | 15.060 | 26.177 |
| Distributions | | | | | | |
| Dividends from Net Investment Income | (.084) | (1.761) | (1.925) | (2.747) | (2.100) | (1.542) |
| Distributions from Realized Capital Gains | (1.189) | (.731) | (9.524) | (10.592) | (6.660) | (5.085) |
| Total Distributions | (1.273) | (2.492) | (11.449) | (13.339) | (8.760) | (6.627) |
| Net Asset Value, End of Period | $113.15 | $120.06 | $99.12 | $133.80 | $149.69 | $143.39 |
| |
| Total Return2 | -4.79% | 23.63% | -17.44% | -1.97% | 10.85% | 21.49% |
| |
| Ratios/Supplemental Data | | | | | | |
| Net Assets, End of Period (Millions) | $10,469 | $11,692 | $10,478 | $14,314 | $16,662 | $17,198 |
| Ratio of Total Expenses to | | | | | | |
| Average Net Assets | 0.35%3 | 0.36% | 0.29% | 0.26% | 0.25% | 0.25% |
| Ratio of Net Investment Income to | | | | | | |
| Average Net Assets | 2.05%3 | 1.73% | 1.64% | 1.78%1 | 1.33% | 1.29% |
| Portfolio Turnover Rate | 11%3 | 6% | 12% | 9% | 8% | 14% |
1 Net investment income per share and the ratio of net investment income to average net assets include $.585 and 0.40%, respectively, resulting from a special dividend from Health Management Associates Class A in March 2007.
2 Total returns do not reflect the 1% fee assessed on redemptions after March 23, 2005, of shares held for less than one year, nor do they include the account service fee that may be applicable to certain accounts with balances below $10,000.
3 Annualized.
See accompanying Notes, which are an integral part of the Financial Statements.17
Health Care Fund
Financial Highlights
| | | | | | |
| Admiral Shares | | | | | | |
| Six Months | | | | | |
| | Ended | | | | | |
| For a Share Outstanding | July 31, | | | Year Ended January 31, |
| Throughout Each Period | 2010 | 2010 | 2009 | 2008 | 2007 | 2006 |
| Net Asset Value, Beginning of Period | $50.67 | $41.83 | $56.47 | $63.19 | $60.52 | $52.25 |
| Investment Operations | | | | | | |
| Net Investment Income | .526 | .835 | .879 | 1.2201 | .877 | .779 |
| Net Realized and Unrealized Gain | | | | | | |
| (Loss) on Investments | (2.895) | 9.091 | (10.648) | (2.257) | 5.542 | 10.328 |
| Total from Investment Operations | (2.369) | 9.926 | (9.769) | (1.037) | 6.419 | 11.107 |
| Distributions | | | | | | |
| Dividends from Net Investment Income | (.039) | (.777) | (.852) | (1.212) | (.938) | (.690) |
| Distributions from Realized Capital Gains | (.502) | (.309) | (4.019) | (4.471) | (2.811) | (2.147) |
| Total Distributions | (.541) | (1.086) | (4.871) | (5.683) | (3.749) | (2.837) |
| Net Asset Value, End of Period | $47.76 | $50.67 | $41.83 | $56.47 | $63.19 | $60.52 |
| |
| Total Return2 | -4.77% | 23.72% | -17.38% | -1.90% | 10.96% | 21.62% |
| |
| Ratios/Supplemental Data | | | | | | |
| Net Assets, End of Period (Millions) | $8,132 | $8,619 | $7,576 | $10,513 | $10,819 | $9,123 |
| Ratio of Total Expenses to | | | | | | |
| Average Net Assets | 0.29%3 | 0.29% | 0.22% | 0.18% | 0.17% | 0.14% |
| Ratio of Net Investment Income to | | | | | | |
| Average Net Assets | 2.11%3 | 1.80% | 1.71% | 1.86%1 | 1.41% | 1.40% |
| Portfolio Turnover Rate | 11%3 | 6% | 12% | 9% | 8% | 14% |
1 Net investment income per share and the ratio of net investment income to average net assets include $.247 and 0.40%, respectively, resulting from a special dividend from Health Management Associates Class A in March 2007.
2 Total returns do not reflect the 1% fee assessed on redemptions after March 23, 2005, of shares held for less than one year.
3 Annualized.
See accompanying Notes, which are an integral part of the Financial Statements.18
Health Care Fund
Notes to Financial Statements
Vanguard Health Care Fund is registered under the Investment Company Act of 1940 as an open-end investment company, or mutual fund. The fund invests in securities of foreign issuers, which may subject it to investment risks not normally associated with investing in securities of U.S. corporations. The fund offers two classes of shares: Investor Shares and Admiral Shares. Investor Shares are available to any investor who meets the fund’s minimum purchase requirements. Admiral Shares are designed for investors who meet certain administrative, service, tenure, and account-size criteria.
A. The following significant accounting policies conform to generally accepted accounting principles for U.S. mutual funds. The fund consistently follows such policies in preparing its financial statements.
1. Security Valuation: Securities are valued as of the close of trading on the New York Stock Exchange (generally 4 p.m., Eastern time) on the valuation date. Equity securities are valued at the latest quoted sales prices or official closing prices taken from the primary market in which each security trades; such securities not traded on the valuation date are valued at the mean of the latest quoted bid and asked prices. Securities for which market quotations are not readily available, or whose values have been affected by events occurring before the fund’s pricing time but after the close of the securities’ primary markets, are valued at their fair values calculated according to procedures adopted by the board of trustees. These procedures include obtaining quotations from an independent pricing service, monitoring news to identify significant market- or security-specific events, and evaluating changes in the values of foreign market proxi es (for example, ADRs, futures contracts, or exchange-traded funds), between the time the foreign markets close and the fund’s pricing time. When fair-value pricing is employed, the prices of securities used by a fund to calculate its net asset value may differ from quoted or published prices for the same securities. Investments in Vanguard Market Liquidity Fund are valued at that fund’s net asset value. Temporary cash investments acquired over 60 days to maturity are valued using the latest bid prices or using valuations based on a matrix system (which considers such factors as security prices, yields, maturities, and ratings), both as furnished by independent pricing services. Other temporary cash investments are valued at amortized cost, which approximates market value.
2. Foreign Currency: Securities and other assets and liabilities denominated in foreign currencies are translated into U.S. dollars using exchange rates obtained from an independent third party as of the fund’s pricing time on the valuation date. Realized gains (losses) and unrealized appreciation (depreciation) on investment securities include the effects of changes in exchange rates since the securities were purchased, combined with the effects of changes in security prices. Fluctuations in the value of other assets and liabilities resulting from changes in exchange rates are recorded as unrealized foreign currency gains (losses) until the assets or liabilities are settled in cash, at which time they are recorded as realized foreign currency gains (losses).
3. Repurchase Agreements: The fund may invest in repurchase agreements. Securities pledged as collateral for repurchase agreements are held by a custodian bank until the agreements mature. Each agreement requires that the market value of the collateral be sufficient to cover payments of interest and principal; however, in the event of default or bankruptcy by the other party to the agreement, retention of the collateral may be subject to legal proceedings.
4. Federal Income Taxes: The fund intends to continue to qualify as a regulated investment company and distribute all of its taxable income. Management has analyzed the fund’s tax positions taken for all open federal income tax years (January 31, 2007–2010), and for the period ended July 31, 2010, and has concluded that no provision for federal income tax is required in the fund’s financial statements.
19
Health Care Fund
5. Distributions: Distributions to shareholders are recorded on the ex-dividend date.
6. Security Lending: The fund may lend its securities to qualified institutional borrowers to earn additional income. Security loans are required to be secured at all times by collateral at least equal to the market value of securities loaned. The fund invests cash collateral received in Vanguard Market Liquidity Fund, and records a liability for the return of the collateral, during the period the securities are on loan. Security lending income represents the income earned on investing cash collateral, less expenses associated with the loan.
7. Other: Dividend income is recorded on the ex-dividend date. Interest income is accrued daily. Premiums and discounts on debt securities purchased are amortized and accreted, respectively, to interest income over the lives of the respective securities. Security transactions are accounted for on the date securities are bought or sold. Costs used to determine realized gains (losses) on the sale of investment securities are those of the specific securities sold. Fees assessed on redemptions of capital shares are credited to paid-in capital.
Each class of shares has equal rights as to assets and earnings, except that each class separately bears certain class-specific expenses related to maintenance of shareholder accounts (included in Management and Administrative expenses) and shareholder reporting. Marketing and distribution expenses are allocated to each class of shares based on a method approved by the board of trustees. Income, other non-class-specific expenses, and gains and losses on investments are allocated to each class of shares based on its relative net assets.
B. Wellington Management Company, LLP provides investment advisory services to the fund for a fee calculated at an annual percentage rate of average net assets. For the six months ended July 31, 2010, the investment advisory fee represented an effective annual rate of 0.15% of the fund’s average net assets.
C. The Vanguard Group furnishes at cost corporate management, administrative, marketing, and distribution services. The costs of such services are allocated to the fund under methods approved by the board of trustees. The fund has committed to provide up to 0.40% of its net assets in capital contributions to Vanguard. At July 31, 2010, the fund had contributed capital of $3,621,000 to Vanguard (included in Other Assets), representing 0.02% of the fund’s net assets and 1.45% of Vanguard’s capitalization. The fund’s trustees and officers are also directors and officers of Vanguard.
D. Various inputs may be used to determine the value of the fund’s investments. These inputs are summarized in three broad levels for financial statement purposes. The inputs or methodologies used to value securities are not necessarily an indication of the risk associated with investing in those securities.
Level 1—Quoted prices in active markets for identical securities.
Level 2—Other significant observable inputs (including quoted prices for similar securities, interest rates, prepayment speeds, credit risk, etc.).
Level 3—Significant unobservable inputs (including the fund’s own assumptions used to determine the fair value of investments).
20
Health Care Fund
The following table summarizes the fund’s investments as of July 31, 2010, based on the inputs used to value them:
| | | |
| | Level 1 | Level 2 | Level 3 |
| Investments | ($000) | ($000) | ($000) |
| Common Stocks—U.S. | 12,666,266 | — | — |
| Common Stocks—International | 129,783 | 4,153,254 | — |
| Temporary Cash Investments | — | 1,608,569 | — |
| Total | 12,796,049 | 5,761,823 | — |
E. Distributions are determined on a tax basis and may differ from net investment income and realized capital gains for financial reporting purposes. Differences may be permanent or temporary. Permanent differences are reclassified among capital accounts in the financial statements to reflect their tax character. Temporary differences arise when certain items of income, expense, gain, or loss are recognized in different periods for financial statement and tax purposes; these differences will reverse at some time in the future. Differences in classification may also result from the treatment of short-term gains as ordinary income for tax purposes. The fund’s tax-basis capital gains and losses are determined only at the end of each fiscal year.
During the six months ended July 31, 2010, the fund realized net foreign currency losses of $1,060,000, which decreased distributable net income for tax purposes; accordingly, such losses have been reclassified from accumulated net realized gains to undistributed net investment income.
At July 31, 2010, the cost of investment securities for tax purposes was $14,684,003,000. Net unrealized appreciation of investment securities for tax purposes was $3,873,869,000, consisting of unrealized gains of $5,135,764,000 on securities that had risen in value since their purchase and $1,261,895,000 in unrealized losses on securities that had fallen in value since their purchase.
F. During the six months ended July 31, 2010, the fund purchased $978,538,000 of investment securities and sold $1,013,307,000 of investment securities, other than temporary cash investments.
21
Health Care Fund
G. Capital share transactions for each class of shares were:
| | | | |
| | Six Months Ended | | Year Ended |
| | July 31, 2010 | January 31, 2010 |
| | Amount | Shares | Amount | Shares |
| | ($000) | (000) | ($000) | (000) |
| Investor Shares | | | | |
| Issued | 304,083 | 2,561 | 682,184 | 6,337 |
| Issued in Lieu of Cash Distributions | 116,782 | 940 | 228,626 | 1,898 |
| Redeemed1 | (983,724) | (8,364) | (1,738,475) | (16,563) |
| Net Increase (Decrease)—Investor Shares | (562,859) | (4,863) | (827,665) | (8,328) |
| Admiral Shares | | | | |
| Issued | 422,233 | 8,436 | 545,366 | 11,748 |
| Issued in Lieu of Cash Distributions | 83,821 | 1,598 | 162,555 | 3,200 |
| Redeemed1 | (489,271) | (9,875) | (1,130,326) | (25,942) |
| Net Increase (Decrease)—Admiral Shares | 16,783 | 159 | (422,405) | (10,994) |
| 1. Net of redemption fees for fiscal 2011 and 2010 of $710,000 and $790,000 respectively (fund totals). | | |
H. Certain of the fund’s investments are in companies that are considered to be affiliated companies of the fund because the fund owns more than 5% of the outstanding voting securities of the company. Transactions during the period in securities of these companies were as follows:
| | | | | |
| | | | Current Period Transactions | |
| | Jan. 31, 2010 | | Proceeds from | | July 31, 2010 |
| | Market | Purchases | Securities | Dividend | Market |
| | Value | at Cost | Sold | Income | Value |
| | ($000) | ($000) | ($000) | ($000) | ($000) |
| Cephalon Inc. | 348,854 | 15,544 | — | — | 324,964 |
| Coventry Health Care Inc. | 204,948 | — | — | — | 177,627 |
| Forest Laboratories Inc. | 893,142 | — | 37,502 | — | 799,283 |
| Health Management Associates Inc. | | | | |
| Class A | 104,626 | — | — | — | 112,819 |
| OSI Pharmaceuticals Inc. | 131,435 | — | 220,866 | — | — |
| Parexel International Corp. | 60,735 | — | 7,058 | — | NA1 |
| | 1,743,740 | | | | 1,414,693 |
| 1. Not applicable - At July 31, 2010, the security was still held, but the issuer was no longer an affiliated company of the fund. |
I. In preparing the financial statements as of July 31, 2010, management considered the impact of subsequent events for potential recognition or disclosure in these financial statements.
22
About Your Fund’s Expenses
As a shareholder of the fund, you incur ongoing costs, which include costs for portfolio management, administrative services, and shareholder reports (like this one), among others. Operating expenses, which are deducted from a fund’s gross income, directly reduce the investment return of the fund.
A fund’s expenses are expressed as a percentage of its average net assets. This figure is known as the expense ratio. The following examples are intended to help you understand the ongoing costs (in dollars) of investing in your fund and to compare these costs with those of other mutual funds. The examples are based on an investment of $1,000 made at the beginning of the period shown and held for the entire period.
The accompanying table illustrates your fund’s costs in two ways:
• Based on actual fund return. This section helps you to estimate the actual expenses that you paid over the period. The ”Ending Account Value“ shown is derived from the fund‘s actual return, and the third column shows the dollar amount that would have been paid by an investor who started with $1,000 in the fund. You may use the information here, together with the amount you invested, to estimate the expenses that you paid over the period.
To do so, simply divide your account value by $1,000 (for example, an $8,600 account value divided by $1,000 = 8.6), then multiply the result by the number given for your fund under the heading ”Expenses Paid During Period.“
• Based on hypothetical 5% yearly return. This section is intended to help you compare your fund‘s costs with those of other mutual funds. It assumes that the fund had a yearly return of 5% before expenses, but that the expense ratio is unchanged. In this case—because the return used is not the fund’s actual return—the results do not apply to your investment. The example is useful in making comparisons because the Securities and Exchange Commission requires all mutual funds to calculate expenses based on a 5% return. You can assess your fund’s costs by comparing this hypothetical example with the hypothetical examples that appear in shareholder reports of other funds.
Note that the expenses shown in the table are meant to highlight and help you compare ongoing costs only and do not reflect transaction costs incurred by the fund for buying and selling securities. Further, the expenses do not include the 1% fee on redemptions of shares held for less than one year, nor do they include the account service fee described in the prospectus. If such fees were applied to your account, your costs would be higher. Your fund does not carry a “sales load.” The calculations assume no shares were bought or sold during the period. Your actual costs may have been higher or lower, depending on the amount of your investment and the timing of any purchases or redemptions.
You can find more information about the fund’s expenses, including annual expense ratios, in the Financial Statements section of this report. For additional information on operating expenses and other shareholder costs, please refer to your fund’s current prospectus.
23
| | | |
| Six Months Ended July 31, 2010 | | | |
| | Beginning | Ending | Expenses |
| | Account Value | Account Value | Paid During |
| Health Care Fund | 1/31/2010 | 7/31/2010 | Period |
| Based on Actual Fund Return | | | |
| Investor Shares | $1,000.00 | $952.10 | $1.69 |
| Admiral Shares | 1,000.00 | 952.29 | 1.40 |
| Based on Hypothetical 5% Yearly Return | | | |
| Investor Shares | $1,000.00 | $1,023.06 | $1.76 |
| Admiral Shares | 1,000.00 | 1,023.36 | 1.45 |
The calculations are based on expenses incurred in the most recent six-month period. The fund’s annualized six-month expense ratios for that period are 0.35% for Investor Shares and 0.29% for Admiral Shares. The dollar amounts shown as “Expenses Paid” are equal to the annualized expense ratio multiplied by the average account value over the period, multiplied by the number of days in the most recent six-month period, then divided by the number of days in the most recent 12-month period.24
Trustees Approve Advisory Agreement
The board of trustees of Vanguard Health Care Fund has renewed the fund’s investment advisory agreement with Wellington Management Company, LLP. The board determined that the retention of the advisor was in the best interests of the fund and its shareholders.
The board based its decision upon an evaluation of the advisor’s investment staff, portfolio management process, and performance. The trustees considered the factors discussed below, among others. However, no single factor determined whether the board approved the agreement. Rather, it was the totality of the circumstances that drove the board’s decision.
Nature, extent, and quality of services
The board considered the quality of the fund’s investment management over both the short and long term and the organizational depth and stability of the advisory firm. The board noted that Wellington Management, founded in 1928, is among the nation’s oldest and most respected institutional investment managers. Edward P. Owens has managed the Health Care Fund since its inception in 1984 and Jean Hynes has co-managed the fund since 2008. They are aided by a team of three experienced health care analysts. This health care team utilizes intensive fundamental analysis to identify companies with high-quality balance sheets and strong management, and the potential for new products that lead to above-average growth in revenue and earnings. The advisor invests in stocks broadly representing the health care industry, seeking to maintain exposure across five primary subsectors: health services, medical products, specialty pharmaceuticals, major pharmaceuticals, and international markets.
The board concluded that the advisor’s experience, stability, depth, and performance, among other factors, warranted continuation of the advisory agreement.
Investment performance
The board considered the short- and long-term performance of the fund, including any periods of outperformance or underperformance of a relevant benchmark and peer group. The board concluded that the advisor has carried out the fund’s investment strategy in disciplined fashion, and that performance results have allowed the fund to remain competitive versus its peer group during the last 12 months, and to otherwise outperform its benchmark and the peer group over the short and long term. Information about the fund’s most recent performance can be found in the Performance Summary section of this report.
Cost
The board concluded that the fund’s expense ratio was well below the average expense ratio charged by funds in its peer group and that the fund’s advisory fee rate was also well below its peer-group average. Information about the fund’s expense ratio appears in the About Your Fund’s Expenses section of this report as well as in the Financial Statements section, which also includes information about the advisory fee rate.
The board did not consider profitability of Wellington Management in determining whether to approve the advisory fee, because Wellington Management is independent of Vanguard, and the advisory fee is the result of arm’s-length negotiations.
The benefit of economies of scale
The board concluded that the fund’s shareholders benefit from economies of scale because of breakpoints in the fund’s advisory fee schedule. The breakpoints reduce the effective rate of the fee as the fund’s assets increase.
The board will consider whether to renew the advisory agreement again after a one-year period.
25
Glossary
30-Day SEC Yield. A fund’s 30-day SEC yield is derived using a formula specified by the U.S. Securities and Exchange Commission. Under the formula, data related to the fund’s security holdings in the previous 30 days are used to calculate the fund’s hypothetical net income for that period, which is then annualized and divided by the fund’s estimated average net assets over the calculation period. For the purposes of this calculation, a security’s income is based on its current market yield to maturity (in the case of bonds) or its projected dividend yield (for stocks). Because the SEC yield represents hypothetical annualized income, it will differ—at times significantly—from the fund’s actual experience. As a result, the fund’s income distributions may be higher or lower than implied by the SEC yield.
Beta. A measure of the magnitude of a fund’s past share-price fluctuations in relation to the ups and downs of a given market index. The index is assigned a beta of 1.00. Compared with a given index, a fund with a beta of 1.20 typically would have seen its share price rise or fall by 12% when the index rose or fell by 10%. For this report, beta is based on returns over the past 36 months for both the fund and the index. Note that a fund’s beta should be reviewed in conjunction with its R-squared (see definition). The lower the R-squared, the less correlation there is between the fund and the index, and the less reliable beta is as an indicator of volatility.
Dividend Yield. Dividend income earned by stocks, expressed as a percentage of the aggregate market value (or of net asset value, for a fund). The yield is determined by dividing the amount of the annual dividends by the aggregate value (or net asset value) at the end of the period. For a fund, the dividend yield is based solely on stock holdings and does not include any income produced by other investments.
Earnings Growth Rate. The average annual rate of growth in earnings over the past five years for the stocks now in a fund.
Equity Exposure. A measure that reflects a fund’s investments in stocks and stock futures. Any holdings in short-term reserves are excluded.
Expense Ratio. The percentage of a fund’s average net assets used to pay its annual administrative and advisory expenses. These expenses directly reduce returns to investors.
Foreign Holdings. The percentage of a fund represented by stocks or depositary receipts of companies based outside the United States.
Inception Date. The date on which the assets of a fund (or one of its share classes) are first invested in accordance with the fund’s investment objective. For funds with a subscription period, the inception date is the day after that period ends. Investment performance is measured from the inception date.
Median Market Cap. An indicator of the size of companies in which a fund invests; the midpoint of market capitalization (market price x shares outstanding) of a fund’s stocks, weighted by the proportion of the fund’s assets invested in each stock. Stocks representing half of the fund’s assets have market capitalizations above the median, and the rest are below it.
Price/Book Ratio. The share price of a stock divided by its net worth, or book value, per share. For a fund, the weighted average price/book ratio of the stocks it holds.
26
Price/Earnings Ratio. The ratio of a stock’s current price to its per-share earnings over the past year. For a fund, the weighted average P/E of the stocks it holds. P/E is an indicator of market expectations about corporate prospects; the higher the P/E, the greater the expectations for a company’s future growth.
R-Squared. A measure of how much of a fund’s past returns can be explained by the returns from the market in general, as measured by a given index. If a fund’s total returns were precisely synchronized with an index’s returns, its R-squared would be 1.00. If the fund’s returns bore no relationship to the index’s returns, its R-squared would be 0. For this report, R-squared is based on returns over the past 36 months for both the fund and the index.
Return on Equity. The annual average rate of return generated by a company during the past five years for each dollar of shareholder’s equity (net income divided by shareholder’s equity). For a fund, the weighted average return on equity for the companies whose stocks it holds.
Short-Term Reserves. The percentage of a fund invested in highly liquid, short-term securities that can be readily converted to cash.
Turnover Rate. An indication of the fund’s trading activity. Funds with high turnover rates incur higher transaction costs and may be more likely to distribute capital gains (which may be taxable to investors). The turnover rate excludes in-kind transactions, which have minimal impact on costs.
27
The People Who Govern Your Fund
The trustees of your mutual fund are there to see that the fund is operated and managed in your best interests since, as a shareholder, you are a part owner of the fund. Your fund’s trustees also serve on the board of directors of The Vanguard Group, Inc., which is owned by the Vanguard funds and provides services to them on an at-cost basis.
A majority of Vanguard’s board members are independent, meaning that they have no affiliation with Vanguard or the funds they oversee, apart from the sizable personal investments they have made as private individuals. The independent board members have distinguished backgrounds in business, academia, and public service. Each of the trustees and executive officers oversees 162 Vanguard funds.
The following table provides information for each trustee and executive officer of the fund. More information about the trustees is in the Statement of Additional Information, which can be obtained, without charge, by contacting Vanguard at 800-662-7447, or online at www.vanguard.com.
| |
| Interested Trustee1 | Amy Gutmann |
| | Born 1949. Trustee Since June 2006. Principal |
| F. William McNabb III | Occupation(s) During the Past Five Years: President |
| Born 1957. Trustee Since July 2009. Chairman of the | of the University of Pennsylvania; Christopher H. |
| Board. Principal Occupation(s) During the Past Five | Browne Distinguished Professor of Political Science |
| Years: Chairman of the Board of The Vanguard Group, | in the School of Arts and Sciences with secondary |
| Inc., and of each of the investment companies served | appointments at the Annenberg School for Commu- |
| by The Vanguard Group, since January 2010; Director | nication and the Graduate School of Education of |
| of The Vanguard Group since 2008; Chief Executive | the University of Pennsylvania; Director of Carnegie |
| Officer and President of The Vanguard Group and of | Corporation of New York, Schuylkill River Development |
| each of the investment companies served by The | Corporation, and Greater Philadelphia Chamber of |
| Vanguard Group since 2008; Director of Vanguard | Commerce; Trustee of the National Constitution Center; |
| Marketing Corporation; Managing Director of The | Chair of the Presidential Commission for the Study of |
| Vanguard Group (1995–2008). | Bioethical Issues. |
| |
| | JoAnn Heffernan Heisen |
| Independent Trustees | Born 1950. Trustee Since July 1998. Principal |
| | Occupation(s) During the Past Five Years: Corporate |
| Emerson U. Fullwood | Vice President and Chief Global Diversity Officer since |
| Born 1948. Trustee Since January 2008. Principal | 2006 (retired 2008) and Member of the Executive |
| Occupation(s) During the Past Five Years: Executive | Committee (retired 2008) of Johnson & Johnson |
| Chief Staff and Marketing Officer for North America | (pharmaceuticals/consumer products); Vice President |
| and Corporate Vice President (retired 2008) of Xerox | and Chief Information Officer of Johnson & Johnson |
| Corporation (document management products and | (1997–2005); Director of the University Medical Center |
| services); Director of SPX Corporation (multi-industry | at Princeton and Women’s Research and Education |
| manufacturing), the United Way of Rochester, | Institute; Member of the Advisory Board of the |
| Amerigroup Corporation (managed health care), | Maxwell School of Citizenship and Public Affairs |
| the University of Rochester Medical Center, and | at Syracuse University. |
| Monroe Community College Foundation. | |
| | F. Joseph Loughrey |
| Rajiv L. Gupta | Born 1949. Trustee Since October 2009. Principal |
| Born 1945. Trustee Since December 2001.2 | Occupation(s) During the Past Five Years: President |
| Principal Occupation(s) During the Past Five Years: | and Chief Operating Officer since 2005 (retired 2009) |
| Chairman and Chief Executive Officer (retired 2009) | and Vice Chairman of the Board (2008–2009) of |
| and President (2006–2008) of Rohm and Haas Co. | Cummins Inc. (industrial machinery); Director of |
| (chemicals); Director of Tyco International, Ltd. | SKF AB (industrial machinery), Hillenbrand, Inc. |
| (diversified manufacturing and services) and Hewlett- | (specialized consumer services), Sauer-Danfoss Inc. |
| Packard Co. (electronic computer manufacturing); | (machinery), the Lumina Foundation for Education, |
| Trustee of The Conference Board; Member of the | and Oxfam America; Chairman of the Advisory Council |
| Board of Managers of Delphi Automotive LLP | for the College of Arts and Letters at the University of |
| (automotive components). | Notre Dame. |
| | |
| André F. Perold | Kathryn J. Hyatt | |
| Born 1952. Trustee Since December 2004. Principal | Born 1955. Treasurer Since November 2008. Principal |
| Occupation(s) During the Past Five Years: George | Occupation(s) During the Past Five Years: Principal |
| Gund Professor of Finance and Banking at the Harvard | of The Vanguard Group, Inc.; Treasurer of each of |
| Business School; Chair of the Investment Committee | the investment companies served by The Vanguard |
| of HighVista Strategies LLC (private investment firm). | Group since 2008; Assistant Treasurer of each of the |
| | investment companies served by The Vanguard Group |
| Alfred M. Rankin, Jr. | (1988–2008). | |
| Born 1941. Trustee Since January 1993. Principal | | |
| Occupation(s) During the Past Five Years: Chairman, | Heidi Stam | |
| President, and Chief Executive Officer of NACCO | Born 1956. Secretary Since July 2005. Principal |
| Industries, Inc. (forklift trucks/housewares/lignite); | Occupation(s) During the Past Five Years: Managing |
| Director of Goodrich Corporation (industrial products/ | Director of The Vanguard Group, Inc., since 2006; |
| aircraft systems and services); Chairman of the Federal | General Counsel of The Vanguard Group since 2005; |
| Reserve Bank of Cleveland; Trustee of The Cleveland | Secretary of The Vanguard Group and of each of the |
| Museum of Art. | investment companies served by The Vanguard Group |
| | since 2005; Director and Senior Vice President of |
| Peter F. Volanakis | Vanguard Marketing Corporation since 2005; |
| Born 1955. Trustee Since July 2009. Principal | Principal of The Vanguard Group (1997–2006). |
| Occupation(s) During the Past Five Years: President | | |
| since 2007 and Chief Operating Officer since 2005 | Vanguard Senior Management Team |
| of Corning Incorporated (communications equipment); | | |
| President of Corning Technologies (2001–2005); | R. Gregory Barton | Michael S. Miller |
| Director of Corning Incorporated and Dow Corning; | Mortimer J. Buckley | James M. Norris |
| Trustee of the Corning Incorporated Foundation and | Kathleen C. Gubanich | Glenn W. Reed |
| the Corning Museum of Glass; Overseer of the | Paul A. Heller | George U. Sauter |
| Amos Tuck School of Business Administration at | | |
| Dartmouth College. | | |
| | Chairman Emeritus and Senior Advisor |
| |
| Executive Officers | John J. Brennan | |
| | Chairman, 1996–2009 | |
| Glenn Booraem | Chief Executive Officer and President, 1996–2008 |
| Born 1967. Controller Since July 2010. Principal | | |
| Occupation(s) During the Past Five Years: Principal | | |
| of The Vanguard Group, Inc.; Controller of each of | Founder | |
| the investment companies served by The Vanguard | | |
| Group since 2010; Assistant Controller of each of | John C. Bogle | |
| the investment companies served by The Vanguard | Chairman and Chief Executive Officer, 1974–1996 |
| Group (2001–2010). | | |
| |
| Thomas J. Higgins | | |
| Born 1957. Chief Financial Officer Since September | | |
| 2008. Principal Occupation(s) During the Past Five | | |
| Years: Principal of The Vanguard Group, Inc.; Chief | | |
| Financial Officer of each of the investment companies | | |
| served by The Vanguard Group since 2008; Treasurer | | |
| of each of the investment companies served by The | | |
| Vanguard Group (1998–2008). | | |
1 Mr. McNabb is considered an “interested person,” as defined in the Investment Company Act of 1940, because he is an officer of the Vanguard funds.
2 December 2002 for Vanguard Equity Income Fund, Vanguard Growth Equity Fund, the Vanguard Municipal Bond Funds, and the Vanguar State Tax-Exempt Funds.
|  |
| P.O. Box 2600 |
| Valley Forge, PA 19482-2600 |
Connect with Vanguard® > Vanguard.com
| |
| Fund Information > 800-662-7447 | CFA® is a trademark owned by CFA Institute. |
| Direct Investor Account Services > 800-662-2739 | |
| Institutional Investor Services > 800-523-1036 | |
| Text Telephone for People | |
| With Hearing Impairment > 800-749-7273 | |
| |
| This material may be used in conjunction | |
| with the offering of shares of any Vanguard | |
| fund only if preceded or accompanied by | |
| the fund’s current prospectus. | |
| |
| All comparative mutual fund data are from Lipper Inc. or | |
| Morningstar, Inc., unless otherwise noted. | |
| |
| You can obtain a free copy of Vanguard’s proxy voting | |
| guidelines by visiting vanguard.com/proxyreporting or by | |
| calling Vanguard at 800-662-2739. The guidelines are | |
| also available from the SEC’s website, sec.gov. In | |
| addition, you may obtain a free report on how your fund | |
| voted the proxies for securities it owned during the 12 | |
| months ended June 30. To get the report, visit either | |
| vanguard.com/proxyreporting or sec.gov. | |
| |
| You can review and copy information about your fund at | |
| the SEC’s Public Reference Room in Washington, D.C. To | |
| find out more about this public service, call the SEC at | |
| 202-551-8090. Information about your fund is also | |
| available on the SEC’s website, and you can receive | |
| copies of this information, for a fee, by sending a | |
| request in either of two ways: via e-mail addressed to | |
| publicinfo@sec.gov or via regular mail addressed to the | |
| Public Reference Section, Securities and Exchange | |
| Commission, Washington, DC 20549-1520. | |
| |
| |
| | © 2010 The Vanguard Group, Inc. |
| | All rights reserved. |
| | Vanguard Marketing Corporation, Distributor. |
| Q522 092010 |
 |
|
| Vanguard REIT Index Fund |
| Semiannual Report |
|
| July 31, 2010 |
 |
> Vanguard REIT Index Fund returned more than 22% for the six months ended July 31, 2010.
> The fund’s return closely tracked that of its target index and was slightly better than the average return of its peer group.
> REITs continued their impressive run, performing much better than the broad stock market for the period.
| |
| Contents | |
| Your Fund’s Total Returns. | 1 |
| Chairman’s Letter. | 2 |
| Fund Profile. | 6 |
| Performance Summary. | 7 |
| Financial Statements. | 8 |
| About Your Fund’s Expenses. | 24 |
| Trustees Approve Advisory Arrangement. | 26 |
| Glossary. | 27 |

REIT Index Fund
Please note: The opinions expressed in this report are just that—informed opinions. They should not be considered promises or advice.
Also, please keep in mind that the information and opinions cover the period through the date on the front of this report. Of course, the risks of investing in your fund are spelled out in the prospectus.
See the Glossary for definitions of investment terms used in this report.
Cover photograph: Veronica Coia.
Your Fund’s Total Returns
| |
| Six Months Ended July 31, 2010 | |
| | Total |
| | Returns |
| Vanguard REIT Index Fund | |
| Investor Shares | 22.40% |
| Admiral™ Shares | 22.47 |
| Signal® Shares | 22.49 |
| Institutional Shares | 22.55 |
| ETF Shares | |
| Market Price | 22.54 |
| Net Asset Value | 22.48 |
| MSCI US REIT Index | 22.51 |
| Real Estate Funds Average | 21.74 |
| Real Estate Funds Average: Derived from data provided by Lipper Inc. | |
Admiral Shares are a lower-cost class of shares available to many longtime shareholders and to those with significant investments in the fund. Signal Shares are available to certain institutional shareholders who meet specific administrative, service, and account-size criteria. Institutional Shares are available to certain institutional investors who meet specific administrative, service, and account-size criteria. The Vanguard ETF® Shares shown are traded on the NYSE Arca exchange and are available only through brokers. The table provides ETF returns based on both the NYSE Arca market price and the net asset value for a share. U.S. Pat. No. 6,879,964 B2; 7,337,138.
| | | | | |
| Your Fund’s Performance at a Glance | | | | |
| January 31, 2010, Through July 31, 2010 | | | | |
| | | | Distributions Per Share | |
| | Starting | Ending | Income | Capital | Return of |
| | Share Price | Share Price | Dividends | Gains | Capital |
| Vanguard REIT Index Fund | | | | | |
| Investor Shares | $14.05 | $16.92 | $0.266 | $0.000 | $0.000 |
| Admiral Shares | 59.95 | 72.19 | 1.184 | 0.000 | 0.000 |
| Signal Shares | 16.00 | 19.27 | 0.315 | 0.000 | 0.000 |
| Institutional Shares | 9.28 | 11.18 | 0.185 | 0.000 | 0.000 |
| ETF Shares | 42.30 | 50.93 | 0.834 | 0.000 | 0.000 |
1

Chairman’s Letter
Dear Shareholder,
While the broad U.S. stock market rose modestly for the six months ended July 31, 2010, the REIT market picked up where it left off in 2009, advancing smartly as yield-hungry investors continued to be attracted to REITs’ relatively high dividends. (Please note: REIT dividends are not directly comparable to typical corporate dividends, as explained on page 4).
Vanguard REIT Index Fund posted a total return of more than 22%. The fund’s return was in line with that of its target index, the MSCI US REIT Index, and slightly higher than the average return of other real estate funds. Five of the six subsectors of the REIT market posted double-digit gains. Retail REITs made the largest contribution to returns, while residential REITs posted the largest absolute return.
Stock markets moved higher, but the journey was tense
Global stock markets emerged from a turbulent six-month stretch with respectable single-digit gains. Prices rallied in early spring, buoyed by rapid growth in corporate earnings, but fell sharply in May and June as Europe’s sovereign debt crisis took center stage. Signs that the U.S. economic recovery might be sputtering also dampened investor spirits. By the end of the six-month period, however, stock markets had recouped the previous months’ losses as corporate bellwethers continued to report strong profits, and investors’ moods brightened.
2
For the full period, the U.S. stock market returned more than 4%. Smaller-company stocks, which are less exposed to global turmoil than large-cap multinationals, returned about 9%. International stocks finished the period with a modestly positive return, as strong performance from emerging markets compensated for weaker returns in Europe.
High-quality bonds rallied amid the search for safety
Turmoil in the stock markets and mixed economic signals drove bond prices higher, and yields lower, as investors sought safety in high-quality government and corporate bonds. At the start of the period, the yield of the benchmark 10-year U.S. Treasury note stood at 3.61%. By the end of the period, it had dipped to 2.91%, and rates on home-mortgage loans were at their lowest levels since the 1950s.
Rising bond prices led to strong six-month returns in both the taxable and municipal bond markets. The returns from money market instruments, by contrast, remained vanishingly small. Yields have hovered near 0% since late 2008, when the Federal Reserve Board set its target for short-term interest rates between 0% and 0.25%.
REITs continued their surge, outperforming the broad market
While the broad U.S. stock market’s advance was restrained by evidence of a slowdown in the domestic recovery and Europe’s sovereign debt crisis, the REIT
| | | |
| Market Barometer | | | |
| |
| | | | Total Returns |
| | | Periods Ended July 31, 2010 |
| | Six | One | Five Years |
| | Months | Year | (Annualized) |
| Stocks | | | |
| Russell 1000 Index (Large-caps) | 3.84% | 14.51% | 0.02% |
| Russell 2000 Index (Small-caps) | 8.79 | 18.43 | 0.47 |
| Dow Jones U.S. Total Stock Market Index | 4.48 | 15.36 | 0.45 |
| MSCI All Country World Index ex USA (International) | 2.26 | 10.12 | 4.89 |
| |
| Bonds | | | |
| Barclays Capital U.S. Aggregate Bond Index (Broad | | | |
| taxable market) | 4.85% | 8.91% | 5.96% |
| Barclays Capital Municipal Bond Index | 4.06 | 9.15 | 4.75 |
| Citigroup Three-Month U.S. Treasury Bill Index | 0.06 | 0.12 | 2.58 |
| |
| CPI | | | |
| Consumer Price Index | 0.61% | 1.24% | 2.21% |
3
market posted an impressive half-year gain. During the first three months of the period, REITs’ rise was double that of the broad market, with Vanguard REIT Index Fund rising more than 24%. During the second half, as U.S. stocks pulled back and returned about –7%, REITs returned about –1.6%.
REITs have benefited from several factors of late. Because REITs are required to distribute at least 90% of their taxable income to their shareholders, they typically feature higher yields than those of most other stocks. Recently, those higher yields have been particularly valued by investors looking for reliable income streams in an era of historically low interest rates.
With consumers continuing to spend more than they did a year ago, retail REITs, the second-largest REIT category, gained 24% and were the largest contributor to the fund’s performance. Specialized REITs, which include hotels and self-storage companies and are the largest REIT subsector, did nearly as well, gaining about 22%.
Residential REITs (+35%), one of the largest subsectors, provided the highest absolute return, as apartment vacancy rates began to fall, making rental properties more attractive to investors. These properties could benefit if the percentage of Americans owning homes continues to decline.
| | | | | | |
| Expense Ratios | | | | | | |
| Your Fund Compared With Its Peer Group | | | | | | |
| | | | | | | Peer |
| | Investor | Admiral | Signal | Institutional | ETF | Group |
| | Shares | Shares | Shares | Shares | Shares | Average |
| REIT Index Fund | 0.26% | 0.13% | 0.14% | 0.09% | 0.13% | 1.43% |
The fund expense ratios shown are from the prospectus dated May 28, 2010, and represent estimated costs for the current fiscal year. For the six months ended July 31, 2010, the fund’s annualized expense ratios were 0.26% for Investor Shares, 0.12% for Admiral Shares, 0.12% for Signal Shares, 0.08% for Institutional Shares, and 0.12% for ETF Shares. The peer-group expense ratio is derived from data provided by Lipper Inc. and captures information through year-end 2009.
Peer group: Real Estate Funds.
4
REITs’ recent performance reason for caution, not exuberance
Since the severe bear market ended in early March 2009, Vanguard REIT Index Fund has soared more than 150%. That kind of short-term performance is unlikely to be repeated. As our veteran clients know, we continually remind investors to keep a long-term perspective. Whether recent returns have been gratifying or disappointing, it’s important to remember that short-term trends can quickly reverse themselves. This is particularly true for relatively narrow sectors of the market, such as REITs, where returns are often more volatile than in broader market arenas.
We believe the antidote to euphoria or despair generated by dramatic short-term results is to stay focused on the long term. The REIT Index Fund has rewarded patient investors as it has closely tracked its target benchmark. Its diversified portfolio, experienced management, and low costs have enabled it to provide a convenient way for investors to gain exposure to the U.S. real estate market.
Of course, as always, we think it’s smart to avoid overexposure to any single sector of the market by keeping your own portfolio well diversified across the stock and fixed income markets in a steady allocation that’s suited to your temperament and goals. That way, whenever the markets experience a negative period—as, invariably, they will—you’ll be able to keep working steadily toward your long-term objectives.
Thank you for your confidence in Vanguard.
Sincerely,

F. William McNabb III
Chairman and Chief Executive Officer
August 12, 2010
5
REIT Index Fund
Fund Profile
As of July 31, 2010
| | | | | |
| Share-Class Characteristics | | | | | |
| | Investor | Admiral | Signal | Institutional | ETF |
| | Shares | Shares | Shares | Shares | Shares |
| Ticker Symbol | VGSIX | VGSLX | VGRSX | VGSNX | VNQ |
| Expense Ratio1 | 0.26% | 0.13% | 0.14% | 0.09% | 0.13% |
| | | |
| Portfolio Characteristics | | |
| | | | DJ |
| | | | U.S. Total |
| | | MSCI US | Market |
| | Fund | REIT Index | Index |
| Number of Stocks | 99 | 98 | 4,101 |
| Median Market Cap | $5.2B | $5.2B | $27.0B |
| Price/Earnings Ratio 289.9x | 289.9x | 17.4x |
| Price/Book Ratio | 2.0x | 2.0x | 2.0x |
| Return on Equity | 7.0% | 7.0% | 19.0% |
| Earnings Growth Rate | -5.9% | -5.9% | 6.7% |
| Dividend Yield | 3.8% | 3.8% | 1.9% |
| Turnover Rate | | | |
| (Annualized) | 10% | — | — |
| Short-Term Reserves | 0.6% | — | — |
Dividend Yield: This yield may include some payments that represent a return of capital, capital gains distributions, or both by the underlying REITs. These amounts are determined by each REIT at the end of its fiscal year.
| | |
| Subindustry Diversification (% of equity exposure) |
| | |
| | | MSCI US |
| | Fund | REIT Index |
| Diversified REITs | 8.6% | 8.6% |
| Industrial REITs | 5.0 | 5.0 |
| Office REITs | 16.9 | 16.9 |
| Residential REITs | 16.5 | 16.5 |
| Retail REITs | 25.1 | 25.1 |
| Specialized REITs | 27.9 | 27.9 |
| | |
| Volatility Measures | | |
| | U.S. | DJ |
| | REIT | U.S. Total |
| | Spliced | Market |
| | Index | Index |
| R-Squared | 1.00 | 0.72 |
| Beta | 1.00 | 1.58 |
| These measures show the degree and timing of the fund’s fluctuations compared with the indexes over 36 months. |
|
| |
| Ten Largest Holdings (% of total net assets) |
| Simon Property Group | Retail REITs | |
| Inc. | | 9.5% |
| Public Storage | Specialized REITs | 5.2 |
| Vornado Realty Trust | Diversified REITs | 5.0 |
| Equity Residential | Residential REITs | 4.8 |
| Boston Properties Inc. | Office REITs | 4.2 |
| HCP Inc. | Specialized REITs | 3.8 |
| Host Hotels & Resorts | Specialized REITs | |
| Inc. | | 3.3 |
| AvalonBay Communities | Residential REITs | |
| Inc. | | 3.2 |
| Ventas Inc. | Specialized REITs | 2.9 |
| Kimco Realty Corp. | Retail REITs | 2.3 |
| Top Ten | | 44.2% |
| The holdings listed exclude any temporary cash investments and equity index products. |
1 The expense ratio shown is from the prospectus dated May 28, 2010, and represents estimated costs for the current fiscal year. For the six months ended July 31, 2010, the annualized expense ratios were 0.26% for Investor Shares, 0.12% for Admiral Shares, 0.12% for Signal Shares, 0.08% for Institutional Shares, and 0.12% for ETF Shares.
6
REIT Index Fund
Performance Summary
All of the returns in this report represent past performance, which is not a guarantee of future results that may be achieved by the fund. (Current performance may be lower or higher than the performance data cited. For performance data current to the most recent month-end, visit our website at www.vanguard.com/performance.) Note, too, that both investment returns and principal value can fluctuate widely, so an investor’s shares, when sold, could be worth more or less than their original cost. The returns shown do not reflect taxes that a shareholder would pay on fund distributions or on the sale of fund shares.
Fiscal-Year Total Returns (%): January 31, 2000, Through July 31, 2010

U.S. REIT Spliced Index: MSCI US REIT Index adjusted to include a 2% cash position (Lipper Money Market Average) through April 30, 2009; MSCI US REIT Index thereafter.
Note: For 2011, performance data reflect the six months ended July 31, 2010.
Average Annual Total Returns: Periods Ended June 30, 2010
This table presents average annual total returns through the latest calendar quarter—rather than through the end of the fiscal period. Securities and Exchange Commission rules require that we provide this information.
| | | | |
| | Inception | One | Five | Ten |
| | Date | Year | Years | Years |
| Investor Shares | 5/13/1996 | 54.95% | 0.47% | 9.63% |
| Admiral Shares | 11/12/2001 | 55.24 | 0.58 | 9.201 |
| Signal Shares | 6/4/2007 | 55.29 | — | -11.111 |
| Institutional Shares | 12/2/2003 | 55.26 | 0.61 | 5.961 |
| ETF Shares | 9/23/2004 | | | |
| Market Price | | 55.34 | 0.62 | 4.381 |
| Net Asset Value | | 55.24 | 0.58 | 4.381 |
| 1 Return since inception. | | | | |
For more information about how the ETF Shares' market prices have compared with their net asset value, visit www.vanguard.com, select your ETF, and then select the Performance tab. The Premium/Discount table there shows the percentages of days on which the ETF Shares' market price was above or below the NAV.
Vanguard fund returns do not reflect the 1% fee on redemptions of shares held for less than one year.
See Financial Highlights for dividend and capital gains information.
7
REIT Index Fund
Financial Statements (unaudited)
Statement of Net Assets
As of July 31, 2010
The fund reports a complete list of its holdings in regulatory filings four times in each fiscal year, at the quarter-ends. For the second and fourth fiscal quarters, the lists appear in the fund’s semiannual and annual reports to shareholders. For the first and third fiscal quarters, the fund files the lists with the Securities and Exchange Commission on Form N-Q. Shareholders can look up the fund’s Forms N-Q on the SEC’s website at www.sec.gov. Forms N-Q may also be reviewed and copied at the SEC’s Public Reference Room (see the back cover of this report for further information).
| | | |
| | | | Market |
| | | | Value |
| | | Shares | ($000) |
| Real Estate Investment Trusts (99.4%)1 | |
| Diversified REITs (8.6%) | | |
| | Vornado Realty Trust | 8,246,738 | 682,665 |
| 2 | Liberty Property Trust | 5,702,288 | 180,763 |
| | Washington Real Estate | | |
| | Investment Trust | 3,024,737 | 91,801 |
| | PS Business Parks Inc. | 986,524 | 57,287 |
| | Colonial Properties Trust | 3,208,432 | 51,720 |
| | Cousins Properties Inc. | 4,614,789 | 31,611 |
| | Investors Real | | |
| | Estate Trust | 3,716,865 | 31,482 |
| 2 | Retail Opportunity | | |
| | Investments Corp. | 2,112,747 | 20,747 |
| | CapLease Inc. | 2,626,643 | 12,871 |
| | Winthrop Realty Trust | 879,908 | 10,840 |
| | | | 1,171,787 |
| Industrial REITs (5.0%) | | |
| 2 | ProLogis | 23,978,042 | 260,402 |
| | AMB Property Corp. | 8,380,922 | 209,188 |
| | DuPont Fabros | | |
| | Technology Inc. | 2,888,977 | 72,918 |
| | DCT Industrial Trust Inc. | 10,534,796 | 49,408 |
| 2 | EastGroup Properties Inc. | 1,355,225 | 49,154 |
| | First Potomac | | |
| | Realty Trust | 1,832,815 | 28,409 |
| * | First Industrial | | |
| | Realty Trust Inc. | 2,815,521 | 11,881 |
| | | | 681,360 |
| Office REITs (16.8%) | | |
| 2 | Boston Properties Inc. | 7,026,790 | 575,494 |
| | Digital Realty Trust Inc. | 4,290,266 | 271,231 |
| 2 | SL Green Realty Corp. | 3,935,425 | 237,070 |
| | Alexandria Real Estate | | |
| | Equities Inc. | 2,217,065 | 156,414 |
| | Duke Realty Corp. | 12,538,764 | 149,964 |
| 2 | Mack-Cali Realty Corp. | 4,004,343 | 129,020 |
| 2 | Highwoods Properties Inc. | 3,594,226 | 112,535 |
| | Corporate Office Properties | |
| | Trust SBI | 2,952,349 | 110,713 |
| | BioMed Realty Trust Inc. | 5,631,043 | 101,584 |
| | | |
| | | | Market |
| | | | Value |
| | | Shares | ($000) |
| | Douglas Emmett Inc. | 5,534,647 | 87,503 |
| | Kilroy Realty Corp. | 2,583,575 | 86,756 |
| | CommonWealth REIT | 3,209,168 | 83,278 |
| | Brandywine Realty Trust | 6,501,793 | 73,860 |
| | Franklin Street | | |
| | Properties Corp. | 3,626,287 | 44,277 |
| | Lexington Realty Trust | 5,649,632 | 36,327 |
| | Government Properties | | |
| | Income Trust | 1,105,243 | 30,715 |
| 2 | Parkway Properties Inc. | 1,093,560 | 18,273 |
| | | | 2,305,014 |
| Residential REITs (16.4%) | | |
| 2 | Equity Residential | 14,253,394 | 653,518 |
| | AvalonBay | | |
| | Communities Inc. | 4,122,522 | 433,236 |
| | UDR Inc. | 7,891,116 | 166,581 |
| | Essex Property Trust Inc. | 1,499,965 | 157,661 |
| | Camden Property Trust | 3,263,026 | 148,533 |
| 2 | BRE Properties Inc. | 3,168,383 | 131,488 |
| 2 | Apartment Investment & | | |
| | Management Co. | 5,923,230 | 127,172 |
| | Home Properties Inc. | 1,768,142 | 87,823 |
| | Mid-America Apartment | | |
| | Communities Inc. | 1,477,155 | 83,430 |
| | Equity Lifestyle | | |
| | Properties Inc. | 1,457,943 | 77,169 |
| 2 | American Campus | | |
| | Communities Inc. | 2,639,796 | 76,422 |
| 2 | Post Properties Inc. | 2,455,965 | 62,578 |
| | Sun Communities Inc. | 854,945 | 24,879 |
| 2 | Education Realty Trust Inc. | 2,865,722 | 19,917 |
| | | | 2,250,407 |
| Retail REITs (24.9%) | | |
| 2 | Simon Property | | |
| | Group Inc. | 14,662,525 | 1,308,191 |
| 2 | Kimco Realty Corp. | 20,505,632 | 309,020 |
| 2 | Macerich Co. | 6,507,488 | 269,735 |
| 2 | Federal Realty | | |
| | Investment Trust | 3,097,553 | 242,198 |
| ^,2 | Realty Income Corp. | 5,279,002 | 169,403 |
8
REIT Index Fund
| | | |
| | | | Market |
| | | | Value |
| | | Shares | ($000) |
| ^,2 | Regency Centers Corp. | 4,124,198 | 155,647 |
| | Weingarten Realty | | |
| | Investors | 5,769,112 | 122,132 |
| | Developers Diversified | | |
| | Realty Corp. | 10,730,190 | 121,788 |
| 2 | Taubman Centers Inc. | 2,747,132 | 112,605 |
| 2 | National Retail | | |
| | Properties Inc. | 4,192,757 | 96,937 |
| | CBL & Associates | | |
| | Properties Inc. | 6,623,971 | 93,199 |
| 2 | Tanger Factory | | |
| | Outlet Centers | 2,036,630 | 91,037 |
| | Alexander’s Inc. | 116,160 | 38,817 |
| 2 | Acadia Realty Trust | 2,011,096 | 37,286 |
| | Equity One Inc. | 2,089,811 | 35,610 |
| | Inland Real Estate Corp. | 3,887,805 | 32,269 |
| ^ | Pennsylvania Real Estate | | |
| | Investment Trust | 2,589,118 | 31,820 |
| | Saul Centers Inc. | 682,771 | 28,881 |
| 2 | Glimcher Realty Trust | 4,194,169 | 27,891 |
| | Getty Realty Corp. | 1,109,285 | 26,579 |
| | Ramco-Gershenson | | |
| | Properties Trust | 1,778,373 | 20,451 |
| | Cedar Shopping | | |
| | Centers Inc. | 2,763,067 | 17,131 |
| 2 | Kite Realty Group Trust | 3,182,324 | 14,766 |
| | Urstadt Biddle | | |
| | Properties Inc. Class A | 810,527 | 14,452 |
| | Urstadt Biddle | | |
| | Properties Inc. | 69,255 | 1,074 |
| | | | 3,418,919 |
| Specialized REITs (27.7%) | | |
| | Public Storage | 7,289,305 | 715,227 |
| | HCP Inc. | 14,858,115 | 527,017 |
| | Host Hotels & | | |
| | Resorts Inc. | 31,913,227 | 457,636 |
| 2 | Ventas Inc. | 7,923,823 | 401,896 |
| 2 | Health Care REIT Inc. | 6,254,252 | 283,380 |
| | Nationwide Health | | |
| | Properties Inc. | 5,937,458 | 222,180 |
| 2 | Senior Housing | | |
| | Properties Trust | 6,440,860 | 145,241 |
| 2 | Hospitality Properties | | |
| | Trust | 6,238,759 | 127,583 |
| | Omega Healthcare | | |
| | Investors Inc. | 4,573,680 | 100,529 |
| 2 | Entertainment Properties | | |
| | Trust | 2,350,526 | 98,111 |
| | LaSalle Hotel Properties | 3,489,067 | 82,761 |
| | Healthcare Realty | | |
| | Trust Inc. | 3,104,302 | 72,858 |
| | | | |
| | | | | Market |
| | | | | Value |
| | | | Shares | ($000) |
| | DiamondRock | | | |
| | Hospitality Co. | | 7,650,643 | 70,998 |
| | Extra Space Storage Inc. | 4,165,925 | 64,613 |
| | Medical Properties | | | |
| | Trust Inc. | | 5,426,516 | 53,940 |
| 2 | Sovran Self Storage Inc. | 1,392,987 | 51,262 |
| *,2 | Sunstone Hotel | | | |
| | Investors Inc. | | 4,960,675 | 51,194 |
| | National Health | | | |
| | Investors Inc. | | 1,256,724 | 47,316 |
| | U-Store-It Trust | | 4,216,791 | 34,029 |
| * | Strategic Hotels & | | | |
| | Resorts Inc. | | 7,148,993 | 32,957 |
| | Hersha Hospitality Trust | 6,410,265 | 32,564 |
| 3 | Pebblebrook Hotel Trust | 1,590,082 | 29,083 |
| * | FelCor Lodging Trust Inc. | 4,696,182 | 27,848 |
| | LTC Properties Inc. | | 1,119,193 | 27,588 |
| * | Ashford Hospitality | | | |
| | Trust Inc. | | 2,311,804 | 20,321 |
| | Universal Health Realty | | |
| | Income Trust | | 580,412 | 19,316 |
| | | | | 3,797,448 |
| Total Real Estate Investment Trusts | |
| (Cost $13,921,747) | | | 13,624,935 |
| Temporary Cash Investments (0.9%)1 | |
| Money Market Fund (0.9%) | | |
| 4,5 | Vanguard Market | | | |
| | Liquidity Fund, | | | |
| | 0.297% | 121,945,235 | 121,945 |
| |
| | | | Face | |
| | | | Amount | |
| | | | ($000) | |
| U.S. Government and Agency Obligations (0.0%) |
| 6 | Freddie Mac Discount | | |
| | Notes, 0.331%, 3/28/11 | 6,000 | 5,989 |
| Total Temporary Cash Investments | |
| (Cost $127,932) | | | 127,934 |
| Total Investments (100.3%) | | |
| (Cost $14,049,679) | | | 13,752,869 |
| Other Assets and Liabilities (-0.3%) | |
| Other Assets | | | 38,086 |
| Liabilities5 | | | (80,716) |
| | | | | (42,630) |
| Net Assets (100%) | | | 13,710,239 |
REIT Index Fund
| |
| | Market |
| | Value |
| | ($000) |
| Statement of Assets and Liabilities | |
| Assets | |
| Investments in Securities, at Value | 13,752,869 |
| Receivables for Capital Shares Issued | 12,073 |
| Other Assets | 26,013 |
| Total Assets | 13,790,955 |
| Liabilities | |
| Security Lending Collateral | |
| Payable to Brokers | 49,193 |
| Other Liabilities | 31,523 |
| Total Liabilities | 80,716 |
| Net Assets | 13,710,239 |
| |
| |
| At July 31, 2010, net assets consisted of: |
| | Amount |
| | ($000) |
| Paid-in Capital | 14,138,743 |
| Overdistributed Net Investment Income | (62,951) |
| Accumulated Net Realized Losses | (76,322) |
| Unrealized Appreciation (Depreciation) | |
| Investment Securities | (296,810) |
| Swap Contracts | 7,579 |
| Net Assets | 13,710,239 |
| |
| |
| Investor Shares—Net Assets | |
| Applicable to 266,402,635 outstanding | |
| $.001 par value shares of beneficial | |
| interest (unlimited authorization) | 4,506,807 |
| Net Asset Value Per Share— | |
| Investor Shares | $16.92 |
| |
| | Amount |
| | ($000) |
| Admiral Shares—Net Assets | |
| Applicable to 22,939,674 outstanding | |
| $.001 par value shares of beneficial | |
| interest (unlimited authorization) | 1,656,123 |
| Net Asset Value Per Share— | |
| Admiral Shares | $72.19 |
| |
| Signal Shares—Net Assets | |
| Applicable to 32,199,818 outstanding | |
| $.001 par value shares of beneficial | |
| interest (unlimited authorization) | 620,613 |
| Net Asset Value Per Share— | |
| Signal Shares | $19.27 |
| |
| |
| Institutional Shares—Net Assets | |
| Applicable to 113,099,639 outstanding | |
| $.001 par value shares of beneficial | |
| interest (unlimited authorization) | 1,263,951 |
| Net Asset Value Per Share— | |
| Institutional Shares | $11.18 |
| |
| |
| ETF Shares—Net Assets | |
| Applicable to 111,194,123 outstanding | |
| $.001 par value shares of beneficial | |
| interest (unlimited authorization) | 5,662,745 |
| Net Asset Value Per Share— | |
| ETF Shares | $50.93 |
See Note A in Notes to Financial Statements.
* Non-income-producing security.
^ Part of security position is on loan to broker-dealers. The total value of securities on loan is $47,677,000.
1 The fund invests a portion of its assets in Real Estate Investment Trusts through the use of swap contracts. After giving effect to swap investments, the fund’s effective Real Estate Investment Trust and temporary cash investment positions represent 99.9% and 0.4%, respectively, of net assets.
2 Considered an affiliated company of the fund as the fund owns more than 5% of the outstanding voting securities of such company.
3 Non-income producing security—new issue that has not paid a dividend as of July 31, 2010.
4 Affiliated money market fund available only to Vanguard funds and certain trusts and accounts managed by Vanguard. Rate shown is the 7-day yield.
5 Includes $49,193,000 of collateral received for securities on loan.
6 The issuer operates under a congressional charter; its securities are not backed by the full faith and credit of the U.S. government.
REIT—Real Estate Investment Trust.
See accompanying Notes, which are an integral part of the Financial Statements.
REIT Index Fund
Statement of Operations
| |
| | Six Months Ended |
| | July 31, 2010 |
| | ($000) |
| Investment Income | |
| Income | |
| Dividends1 | 172,489 |
| Interest1 | 65 |
| Security Lending | 1,347 |
| Total Income | 173,901 |
| Expenses | |
| The Vanguard Group—Note B | |
| Investment Advisory Services | 353 |
| Management and Administrative—Investor Shares | 4,771 |
| Management and Administrative—Admiral Shares | 718 |
| Management and Administrative—Signal Shares | 242 |
| Management and Administrative—Institutional Shares | 261 |
| Management and Administrative—ETF Shares | 2,203 |
| Marketing and Distribution—Investor Shares | 494 |
| Marketing and Distribution—Admiral Shares | 130 |
| Marketing and Distribution—Signal Shares | 75 |
| Marketing and Distribution—Institutional Shares | 142 |
| Marketing and Distribution—ETF Shares | 719 |
| Custodian Fees | 27 |
| Shareholders’ Reports—Investor Shares | 8 |
| Shareholders’ Reports—Admiral Shares | — |
| Shareholders’ Reports—Signal Shares | 2 |
| Shareholders’ Reports—Institutional Shares | 5 |
| Shareholders’ Reports—ETF Shares | 144 |
| Trustees’ Fees and Expenses | 11 |
| Total Expenses | 10,305 |
| Net Investment Income | 163,596 |
| Realized Net Gain (Loss) | |
| Capital Gain Distributions Received | 49,113 |
| Investment Securities Sold | 722,566 |
| Swap Contracts | 26,538 |
| Realized Net Gain (Loss)1 | 798,217 |
| Change in Unrealized Appreciation (Depreciation) | |
| Investment Securities | 1,548,178 |
| Swap Contracts | (10,124) |
| Change in Unrealized Appreciation (Depreciation) | 1,538,054 |
| Net Increase (Decrease) in Net Assets Resulting from Operations | 2,499,867 |
| 1 Dividend income, interest income, and realized net gain (loss) from affiliated companies of the fund were $126,815,000, $65,000, and $605,454,000, respectively. |
See accompanying Notes, which are an integral part of the Financial Statements.
11
REIT Index Fund
Statement of Changes in Net Assets
| | |
| | Six Months Ended
July 31,
2010
($000) | Year Ended
January 31,
2010
($000) |
| |
| |
| |
| Increase (Decrease) in Net Assets | | |
| Operations | | |
| Net Investment Income | 163,596 | 318,714 |
| Realized Net Gain (Loss) | 798,217 | (279,343) |
| Change in Unrealized Appreciation (Depreciation) | 1,538,054 | 3,082,398 |
| Net Increase (Decrease) in Net Assets Resulting from Operations | 2,499,867 | 3,121,769 |
| Distributions | | |
| Net Investment Income | | |
| Investor Shares | (69,539) | (116,521) |
| Admiral Shares | (26,502) | (43,685) |
| Signal Shares | (9,739) | (17,371) |
| Institutional Shares | (19,623) | (28,920) |
| ETF Shares | (93,670) | (115,870) |
| Realized Capital Gain | | |
| Investor Shares | — | — |
| Admiral Shares | — | — |
| Signal Shares | — | — |
| Institutional Shares | — | — |
| ETF Shares | — | — |
| Return of Capital | | |
| Investor Shares | — | (38,280) |
| Admiral Shares | — | (14,352) |
| Signal Shares | — | (5,707) |
| Institutional Shares | — | (9,501) |
| ETF Shares | — | (38,066) |
| Total Distributions | (219,073) | (428,273) |
| Capital Share Transactions | | |
| Investor Shares | 204,167 | 297,943 |
| Admiral Shares | 91,742 | 64,315 |
| Signal Shares | 31,907 | (9,662) |
| Institutional Shares | 162,958 | 151,229 |
| ETF Shares | (3,112) | 2,329,044 |
| Net Increase (Decrease) from Capital Share Transactions | 487,662 | 2,832,869 |
| Total Increase (Decrease) | 2,768,456 | 5,526,365 |
| Net Assets | | |
| Beginning of Period | 10,941,783 | 5,415,418 |
| End of Period1 | 13,710,239 | 10,941,783 |
| 1 Net Assets—End of Period includes undistributed (overdistributed) net investment income of ($62,951,000) and ($7,474,000). |
See accompanying Notes, which are an integral part of the Financial Statements.
12
REIT Index Fund
Financial Highlights
| | | | | | |
| Investor Shares | | | | | | |
| Six Months
Ended
July 31,
2010 | | | | | |
| | | | | | |
| For a Share Outstanding | Year Ended January 31, |
| Throughout Each Period | 2010 | 2009 | 2008 | 2007 | 2006 |
| Net Asset Value, Beginning of Period | $14.05 | $10.02 | $20.38 | $27.76 | $21.29 | $17.20 |
| Investment Operations | | | | | | |
| Net Investment Income | .198 | .477 | .593 | .615 | .530 | .562 |
| Net Realized and Unrealized Gain (Loss) | | | | | | |
| on Investments1 | 2.938 | 4.192 | (9.975) | (6.985) | 7.000 | 4.692 |
| Total from Investment Operations | 3.136 | 4.669 | (9.382) | (6.370) | 7.530 | 5.254 |
| Distributions | | | | | | |
| Dividends from Net Investment Income | (.266) | (.481) | (.571) | (.622) | (.534) | (.568) |
| Distributions from Realized Capital Gains | — | — | (.125) | (.199) | (.413) | (.530) |
| Return of Capital | — | (.158) | (.282) | (.189) | (.113) | (.066) |
| Total Distributions | (.266) | (.639) | (.978) | (1.010) | (1.060) | (1.164) |
| Net Asset Value, End of Period | $16.92 | $14.05 | $10.02 | $20.38 | $27.76 | $21.29 |
| |
| Total Return2 | 22.40% | 48.51% | -47.82% | -23.28% | 36.32% | 31.43% |
| |
| Ratios/Supplemental Data | | | | | | |
| Net Assets, End of Period (Millions) | $4,507 | $3,572 | $2,274 | $4,046 | $6,827 | $4,727 |
| Ratio of Total Expenses to | | | | | | |
| Average Net Assets | 0.26%3 | 0.26% | 0.21% | 0.20% | 0.21% | 0.21% |
| Ratio of Net Investment Income to | | | | | | |
| Average Net Assets | 2.47%3 | 3.94% | 3.36% | 2.52% | 2.27% | 2.91% |
| Portfolio Turnover Rate4 | 10%3 | 16% | 10% | 13% | 11% | 17% |
1 Includes increases from redemption fees of $0.00, $0.00, $0.00, $0.02, $0.00, and $0.01.2 Total returns do not reflect the 1% fee assessed on redemptions of shares held for less than one year, nor do they include the account service fee that may be applicable to certain accounts with balances below $10,000.3 Annualized.4 Excludes the value of portfolio securities received or delivered as a result of in-kind purchases or redemptions of the fund’s capital shares, including ETF Creation Units.See accompanying Notes, which are an integral part of the Financial Statements.
13
REIT Index Fund
Financial Highlights
| | | | | | |
| Admiral Shares | | | | | | |
| Six Months
Ended
July 31,
2010 | | | | | |
| | | | | | |
| For a Share Outstanding | Year Ended January 31, |
| Throughout Each Period | 2010 | 2009 | 2008 | 2007 | 2006 |
| Net Asset Value, Beginning of Period | $59.95 | $42.74 | $86.94 | $118.46 | $90.82 | $73.40 |
| Investment Operations | | | | | | |
| Net Investment Income | .892 | 2.083 | 2.581 | 2.707 | 2.328 | 2.460 |
| Net Realized and Unrealized Gain (Loss) | | | | | | |
| on Investments1 | 12.532 | 17.909 | (42.527) | (29.817) | 29.903 | 19.993 |
| Total from Investment Operations | 13.424 | 19.992 | (39.946) | (27.110) | 32.231 | 22.453 |
| Distributions | | | | | | |
| Dividends from Net Investment Income | (1.184) | (2.094) | (2.491) | (2.735) | (2.341) | (2.488) |
| Distributions from Realized Capital Gains | — | — | (.535) | (.849) | (1.761) | (2.258) |
| Return of Capital | — | (.688) | (1.228) | (.826) | (.489) | (.287) |
| Total Distributions | (1.184) | (2.782) | (4.254) | (4.410) | (4.591) | (5.033) |
| Net Asset Value, End of Period | $72.19 | $59.95 | $42.74 | $86.94 | $118.46 | $90.82 |
| |
| Total Return2 | 22.47% | 48.73% | -47.77% | -23.23% | 36.46% | 31.49% |
| |
| Ratios/Supplemental Data | | | | | | |
| Net Assets, End of Period (Millions) | $1,656 | $1,296 | $873 | $1,706 | $3,392 | $2,025 |
| Ratio of Total Expenses to | | | | | | |
| Average Net Assets | 0.12%3 | 0.13% | 0.11% | 0.10% | 0.14% | 0.14% |
| Ratio of Net Investment Income to | | | | | | |
| Average Net Assets | 2.61%3 | 4.07% | 3.46% | 2.62% | 2.34% | 2.98% |
| Portfolio Turnover Rate4 | 10%3 | 16% | 10% | 13% | 11% | 17% |
1 Includes increases from redemption fees of $0.00, $0.01, $0.02, $0.10, $0.02, and $0.02.2 Total returns do not reflect the 1% fee assessed on redemptions of shares held for less than one year.3 Annualized.4 Excludes the value of portfolio securities received or delivered as a result of in-kind purchases or redemptions of the fund’s capital shares, including ETF Creation Units.See accompanying Notes, which are an integral part of the Financial Statements.
14
REIT Index Fund
Financial Highlights
| | | | |
| Signal Shares | | | | |
| | Six Months
Ended
July 31,
2010 | | | June 4,
20071 to
Jan. 31,
2008 |
| | Year Ended
January 31, |
| |
| |
| For a Share Outstanding Throughout Each Period | 2010 | 2009 |
| Net Asset Value, Beginning of Period | $16.00 | $11.41 | $23.21 | $30.05 |
| Investment Operations | | | | |
| Net Investment Income | .237 | .557 | .688 | .470 |
| Net Realized and Unrealized Gain (Loss) | | | | |
| on Investments2 | 3.348 | 4.775 | (11.353) | (6.311) |
| Total from Investment Operations | 3.585 | 5.332 | (10.665) | (5.841) |
| Distributions | | | | |
| Dividends from Net Investment Income | (.315) | (.559) | (.664) | (.620) |
| Distributions from Realized Capital Gains | — | — | (.143) | (.192) |
| Return of Capital | — | (.183) | (.328) | (.187) |
| Total Distributions | (.315) | (.742) | (1.135) | (.999) |
| Net Asset Value, End of Period | $19.27 | $16.00 | $11.41 | $23.21 |
| |
| Total Return3 | 22.49% | 48.68% | -47.77% | -19.68% |
| |
| Ratios/Supplemental Data | | | | |
| Net Assets, End of Period (Millions) | $621 | $489 | $350 | $538 |
| Ratio of Total Expenses to | | | | |
| Average Net Assets | 0.12%4 | 0.14% | 0.11% | 0.10%4 |
| Ratio of Net Investment Income to | | | | |
| Average Net Assets | 2.61%4 | 4.06% | 3.46% | 2.62%4 |
| Portfolio Turnover Rate5 | 10%4 | 16% | 10% | 13% |
1 Inception.2 Includes increases from redemption fees of $0.00, $0.00, $0.00, and $0.01.3 Total returns do not reflect the 1% fee assessed on redemptions of shares held for less than one year.4 Annualized.5 Excludes the value of portfolio securities received or delivered as a result of in-kind purchases or redemptions of the fund’s capital shares, including ETF Creation Units.See accompanying Notes, which are an integral part of the Financial Statements.
15
REIT Index Fund
Financial Highlights
| | | | | | |
| Institutional Shares | | | | | | |
| Six Months
Ended
July 31,
2010 | | | | | |
| | | | | | |
| For a Share Outstanding | Year Ended January 31, |
| Throughout Each Period | 2010 | 2009 | 2008 | 2007 | 2006 |
| Net Asset Value, Beginning of Period | $9.28 | $6.61 | $13.46 | $18.33 | $14.06 | $11.36 |
| Investment Operations | | | | | | |
| Net Investment Income | .140 | .326 | .401 | .420 | .366 | .385 |
| Net Realized and Unrealized Gain (Loss) | | | | | | |
| on Investments1 | 1.945 | 2.777 | (6.591) | (4.605) | 4.621 | 3.099 |
| Total from Investment Operations | 2.085 | 3.103 | (6.190) | (4.185) | 4.987 | 3.484 |
| Distributions | | | | | | |
| Dividends from Net Investment Income | (.185) | (.326) | (.386) | (.426) | (.368) | (.389) |
| Distributions from Realized Capital Gains | — | — | (.083) | (.131) | (.273) | (.350) |
| Return of Capital | — | (.107) | (.191) | (.128) | (.076) | (.045) |
| Total Distributions | (.185) | (.433) | (.660) | (.685) | (.717) | (.784) |
| Net Asset Value, End of Period | $11.18 | $9.28 | $6.61 | $13.46 | $18.33 | $14.06 |
| |
| Total Return2 | 22.55% | 48.90% | -47.82% | -23.18% | 36.45% | 31.58% |
| |
| Ratios/Supplemental Data | | | | | | |
| Net Assets, End of Period (Millions) | $1,264 | $907 | $504 | $722 | $960 | $571 |
| Ratio of Total Expenses to | | | | | | |
| Average Net Assets | 0.08%3 | 0.09% | 0.09% | 0.09% | 0.10% | 0.10% |
| Ratio of Net Investment Income to | | | | | | |
| Average Net Assets | 2.65%3 | 4.11% | 3.48% | 2.63% | 2.38% | 3.02% |
| Portfolio Turnover Rate4 | 10%3 | 16% | 10% | 13% | 11% | 17% |
1 Includes increases from redemption fees of $0.00, $0.00, $0.00, $0.01, $0.00, and $0.00.2 Total returns do not reflect the 1% fee assessed on redemptions of shares held for less than one year.3 Annualized.4 Excludes the value of portfolio securities received or delivered as a result of in-kind purchases or redemptions of the fund’s capital shares, including ETF Creation Units.See accompanying Notes, which are an integral part of the Financial Statements.
16
REIT Index Fund
Financial Highlights
| | | | | | |
| ETF Shares | | | | | | |
| Six Months
Ended
July 31,
2010 | | | | | |
| | | | | | |
| For a Share Outstanding | Year Ended January 31, |
| Throughout Each Period | 2010 | 2009 | 2008 | 2007 | 2006 |
| Net Asset Value, Beginning of Period | $42.30 | $30.14 | $61.31 | $83.55 | $64.07 | $51.77 |
| Investment Operations | | | | | | |
| Net Investment Income | .628 | 1.473 | 1.820 | 1.908 | 1.654 | 1.745 |
| Net Realized and Unrealized Gain (Loss) | | | | | | |
| on Investments1 | 8.836 | 12.651 | (29.990) | (21.037) | 21.080 | 14.116 |
| Total from Investment Operations | 9.464 | 14.124 | (28.170) | (19.129) | 22.734 | 15.861 |
| Distributions | | | | | | |
| Dividends from Net Investment Income | (.834) | (1.478) | (1.757) | (1.931) | (1.665) | (1.764) |
| Distributions from Realized Capital Gains | — | — | (.377) | (.598) | (1.242) | (1.594) |
| Return of Capital | — | (.486) | (.866) | (.582) | (.347) | (.203) |
| Total Distributions | (.834) | (1.964) | (3.000) | (3.111) | (3.254) | (3.561) |
| Net Asset Value, End of Period | $50.93 | $42.30 | $30.14 | $61.31 | $83.55 | $64.07 |
| |
| Total Return | 22.48% | 48.74% | -47.77% | -23.23% | 36.48% | 31.54% |
| |
| Ratios/Supplemental Data | | | | | | |
| Net Assets, End of Period (Millions) | $5,663 | $4,678 | $1,414 | $2,082 | $1,713 | $871 |
| Ratio of Total Expenses to | | | | | | |
| Average Net Assets | 0.12%2 | 0.13% | 0.11% | 0.10% | 0.12% | 0.12% |
| Ratio of Net Investment Income to | | | | | | |
| Average Net Assets | 2.61%2 | 4.07% | 3.46% | 2.62% | 2.36% | 3.00% |
| Portfolio Turnover Rate3 | 10%2 | 16% | 10% | 13% | 11% | 17% |
1 Includes increases from redemption fees of $0.00, $0.01, $0.01, $0.04, $0.01, and $0.01.2 Annualized.3 Excludes the value of portfolio securities received or delivered as a result of in-kind purchases or redemptions of the fund’s capital shares, including ETF Creation Units.See accompanying Notes, which are an integral part of the Financial Statements.
17
REIT Index Fund
Notes to Financial Statements
Vanguard REIT Index Fund is registered under the Investment Company Act of 1940 as an open-end investment company, or mutual fund. The fund offers five classes of shares: Investor Shares, Admiral Shares, Signal Shares, Institutional Shares, and ETF Shares. Investor Shares are available to any investor who meets the fund’s minimum purchase requirements. Admiral Shares are designed for investors who meet certain administrative, service, tenure, and account-size criteria. Signal Shares and Institutional Shares are designed for institutional investors who meet certain administrative, service, and account-size criteria. ETF Shares are listed for trading on the NYSE Arca, Inc.; they can be purchased and sold through a broker.
A. The following significant accounting policies conform to generally accepted accounting principles for U.S. mutual funds. The fund consistently follows such policies in preparing its financial statements.
1. Security Valuation: Securities are valued as of the close of trading on the New York Stock Exchange (generally 4 p.m., Eastern time) on the valuation date. Equity securities are valued at the latest quoted sales prices or official closing prices taken from the primary market in which each security trades; such securities not traded on the valuation date are valued at the mean of the latest quoted bid and asked prices. Securities for which market quotations are not readily available, or whose values have been materially affected by events occurring before the fund’s pricing time but after the close of the securities’ primary markets, are valued by methods deemed by the board of trustees to represent fair value. Investments in Vanguard Market Liquidity Fund are valued at that fund’s net asset value. Temporary cash investments acquired over 60 days to maturity are valued using the latest bid prices or using valuations based on a matrix system (which considers such factors as security prices, yields, maturities, and ratings), both as furnished by independent pricing services. Other temporary cash investments are valued at amortized cost, which approximates market value.
2. Swap Contracts: The fund has entered into swap transactions to earn the total return on a specified REIT index. Under the terms of the swaps, the fund receives the total return (either receiving the increase or paying the decrease) on a reference index, applied to a notional principal amount. In return, the fund agrees to pay the counterparty a floating rate, which is reset periodically based on short-term interest rates, applied to the same notional amount. At the same time, the fund invests an amount approximating the notional amount of the swap in high-quality temporary cash investments.
The notional amounts of swap contracts are not recorded in the Statement of Net Assets. Swaps are valued daily and the change in value is recorded as unrealized appreciation (depreciation) until periodic payments are made, or the swap terminates, at which time realized gain (loss) is recorded. The primary risk associated with the swaps is that a counterparty will default on its obligation to pay net amounts due to the fund. The fund’s maximum risk of loss from counterparty credit risk is the amount of unrealized appreciation on the swap contract. This risk is mitigated by entering into swaps only with highly rated counterparties, by a master netting arrangement between the fund and the counterparty, and by the posting of collateral by the counterparty. The swap contracts contain provisions whereby a counterparty may terminate open contracts if the fund’s net assets decline below a certain level, triggering a payment by the fund if the fund is in a net liability position at the time of the termination. The payment amount would be reduced by any collateral the fund has posted. Any securities posted as collateral for open contracts are noted in the Statement of Net Assets.
18
REIT Index Fund
3. Federal Income Taxes: The fund intends to continue to qualify as a regulated investment company and distribute all of its taxable income. Management has analyzed the fund’s tax positions taken for all open federal income tax years (January 31, 2007–2010), and for the period ended July 31, 2010, and has concluded that no provision for federal income tax is required in the fund’s financial statements.
4. Distributions: Distributions to shareholders are recorded on the ex-dividend date.
5. Security Lending: The fund may lend its securities to qualified institutional borrowers to earn additional income. Security loans are required to be secured at all times by collateral at least equal to the market value of securities loaned. The fund invests cash collateral received in Vanguard Market Liquidity Fund, and records a liability for the return of the collateral, during the period the securities are on loan. Security lending income represents the income earned on investing cash collateral, less expenses associated with the loan.
6. Other: Distributions received from REITs are recorded on the ex-dividend date. Each REIT reports annually the tax character of its distributions. Dividend income, capital gain distributions received, and unrealized appreciation (depreciation) reflect the amounts of taxable income, capital gain, and return of capital reported by the REITs, and management’s estimates of such amounts for REIT distributions for which actual information has not been reported. Interest income includes income distributions received from Vanguard Market Liquidity Fund and is accrued daily. Security transactions are accounted for on the date securities are bought or sold. Costs used to determine realized gains (losses) on the sale of investment securities are those of the specific securities sold. Fees assessed on redemptions of capital shares are credited to paid-in capital.
Each class of shares has equal rights as to assets and earnings, except that each class separately bears certain class-specific expenses related to maintenance of shareholder accounts (included in Management and Administrative expenses) and shareholder reporting. Marketing and distribution expenses are allocated to each class of shares based on a method approved by the board of trustees. Income, other non-class-specific expenses, and gains and losses on investments are allocated to each class of shares based on its relative net assets.
B. The Vanguard Group furnishes at cost investment advisory, corporate management, administrative, marketing, and distribution services. The costs of such services are allocated to the fund under methods approved by the board of trustees. The fund has committed to provide up to 0.40% of its net assets in capital contributions to Vanguard. At July 31, 2010, the fund had contributed capital of $2,436,000 to Vanguard (included in Other Assets), representing 0.02% of the fund’s net assets and 0.97% of Vanguard’s capitalization. The fund’s trustees and officers are also directors and officers of Vanguard.
C. Various inputs may be used to determine the value of the fund’s investments. These inputs are summarized in three broad levels for financial statement purposes. The inputs or methodologies used to value securities are not necessarily an indication of the risk associated with investing in those securities.
Level 1—Quoted prices in active markets for identical securities.
Level 2—Other significant observable inputs (including quoted prices for similar securities, interest rates, prepayment speeds, credit risk, etc.).
Level 3—Significant unobservable inputs (including the fund’s own assumptions used to determine the fair value of investments).
19
REIT Index Fund
The following table summarizes the fund’s investments as of July 31, 2010, based on the inputs used to value them:
| | | |
| | Level 1 | Level 2 | Level 3 |
| Investments | ($000) | ($000) | ($000) |
| Real Estate Investment Trusts | 13,624,935 | — | — |
| Temporary Cash Investments | 121,945 | 5,989 | — |
| Swap Contracts—Assets | — | 7,579 | — |
| Total | 13,746,880 | 13,568 | — |
D. At July 31, 2010, the fund had the following open total return swap contract:
| | | | | |
| | | | | Floating | Unrealized |
| | | | Notional | Interest Rate | Appreciation |
| | Termination | | Amount | Received | (Depreciation) |
| Reference Entity | Date | Counterparty1 | ($000) | (Paid)2 | ($000) |
| MSCI US REIT Gross | | | | | |
| Total Return Index | 8/4/11 | GSI | 76,981 | (0.196%) | 7,579 |
| 1 GSI—Goldman Sachs International. |
| 2 Based on one-month London Interbank Offered Rate (LIBOR) as of the most recent payment date. The contract provides for the payment |
| of interest based on LIBOR less a fixed interest rate spread. |
At July 31, 2010, the counterparty had deposited in segregated accounts securities with a value sufficient to cover substantially all amounts due to the fund in connection with open swap contracts.
E. Distributions are determined on a tax basis and may differ from net investment income and realized capital gains for financial reporting purposes. Differences may be permanent or temporary. Permanent differences are reclassified among capital accounts in the financial statements to reflect their tax character. Temporary differences arise when certain items of income, expense, gain, or loss are recognized in different periods for financial statement and tax purposes; these differences will reverse at some time in the future. Differences in classification may also result from the treatment of short-term gains as ordinary income for tax purposes.
During the six months ended July 31, 2010, the fund realized $477,945,000 of net capital gains resulting from in-kind redemptions—in which shareholders exchanged fund shares for securities held by the fund rather than for cash. Because such gains are not taxable to the fund, and are not distributed to shareholders, they have been reclassified from accumulated net realized losses to paid-in capital.
The fund’s tax-basis capital gains and losses are determined only at the end of each fiscal year. For tax purposes, at January 31, 2010, the fund had available capital loss carryforwards totaling $396,594,000 to offset future net capital gains through January 31, 2018. The fund will use these capital losses to offset net taxable capital gains, if any, realized during the year ending January 31, 2011; should the fund realize net capital losses for the year, the losses will be added to the loss carryforward balance above.
At July 31, 2010, the cost of investment securities for tax purposes was $14,049,679,000. Net unrealized depreciation of investment securities for tax purposes was $296,810,000, consisting of unrealized gains of $1,333,934,000 on securities that had risen in value since their purchase and $1,630,744,000 in unrealized losses on securities that had fallen in value since their purchase.
20
REIT Index Fund
F. During the six months ended July 31, 2010, the fund purchased $2,231,654,000 of investment securities and sold $1,719,785,000 of investment securities, other than temporary cash investments.
G. Capital share transactions for each class of shares were:
| | | | |
| | Six Months Ended
July 31, 2010 | Year Ended
January 31, 2010 |
| |
| | Amount | Shares | Amount | Shares |
| | ($000) | (000) | ($000) | (000) |
| Investor Shares | | | | |
| Issued | 601,504 | 37,047 | 805,386 | 70,148 |
| Issued in Lieu of Cash Distributions | 65,139 | 3,988 | 144,818 | 12,990 |
| Redeemed1 | (462,476) | (28,889) | (652,261) | (55,891) |
| Net Increase (Decrease)—Investor Shares | 204,167 | 12,146 | 297,943 | 27,247 |
| Admiral Shares | | | | |
| Issued | 188,150 | 2,717 | 227,091 | 4,473 |
| Issued in Lieu of Cash Distributions | 21,907 | 314 | 47,522 | 1,002 |
| Redeemed1 | (118,315) | (1,716) | (210,298) | (4,289) |
| Net Increase (Decrease)—Admiral Shares | 91,742 | 1,315 | 64,315 | 1,186 |
| Signal Shares | | | | |
| Issued | 93,404 | 5,003 | 148,001 | 11,605 |
| Issued in Lieu of Cash Distributions | 8,332 | 448 | 20,008 | 1,595 |
| Redeemed1 | (69,829) | (3,788) | (177,671) | (13,365) |
| Net Increase (Decrease)—Signal Shares | 31,907 | 1,663 | (9,662) | (165) |
| Institutional Shares | | | | |
| Issued | 228,165 | 21,687 | 272,886 | 36,428 |
| Issued in Lieu of Cash Distributions | 17,368 | 1,610 | 34,721 | 4,703 |
| Redeemed1 | (82,575) | (7,880) | (156,378) | (19,585) |
| Net Increase (Decrease)—Institutional Shares | 162,958 | 15,417 | 151,229 | 21,546 |
| ETF Shares | | | | |
| Issued | 1,055,166 | 21,594 | 2,512,381 | 68,773 |
| Issued in Lieu of Cash Distributions | — | — | — | — |
| Redeemed1 | (1,058,278) | (21,000) | (183,337) | (5,100) |
| Net Increase (Decrease)—ETF Shares | (3,112) | 594 | 2,329,044 | 63,673 |
| 1 Net of redemption fees for fiscal 2011 and 2010 of $820,000 and $1,733,000, respectively (fund totals). | | |
H. Certain of the fund’s investments are in companies that are considered to be affiliated companies of the fund because the fund owns more than 5% of the outstanding voting securities of the company. Transactions during the period in securities of these companies were as follows:
21
REIT Index Fund
| | | | | |
| | | Current Period Transactions | |
| January 31, 2010
Market
Value
($000) | | Proceeds from
Securities
Sold
($000) | | July 31, 2010
Market
Value
($000) |
| | Purchases
at Cost
($000) | Dividend
Income
($000) |
| |
| |
| Acadia Realty Trust | NA1 | 5,510 | 4,057 | 486 | 37,286 |
| Alexandria Real Estate Equities Inc. | 132,690 | 20,667 | 21,058 | 1,385 | NA2 |
| AMB Property Corp. | 179,533 | 55,332 | 30,478 | 2,514 | NA2 |
| American Campus Communities Inc. | 68,501 | 9,570 | 10,309 | 334 | 76,422 |
| Apartment Investment & | | | | | |
| Management Co. | 91,957 | 15,191 | 17,318 | 65 | 127,172 |
| AvalonBay Communities Inc. | 313,232 | 53,281 | 53,178 | 2,971 | NA2 |
| BioMed Realty Trust Inc. | 73,122 | 24,297 | 13,111 | 1,016 | NA2 |
| Boston Properties Inc. | 459,827 | 69,362 | 75,042 | 5,822 | 575,494 |
| Brandywine Realty Trust | 73,859 | 10,103 | 11,063 | 1,668 | NA2 |
| BRE Properties Inc. | NA1 | 32,427 | 16,415 | 1,151 | 131,488 |
| Camden Property Trust | 127,160 | 18,713 | 20,123 | 1,738 | NA2 |
| Corporate Office Properties | | | | | |
| Trust SBI | 105,911 | 15,253 | 15,665 | 1,878 | NA2 |
| DCT Industrial Trust Inc. | 51,735 | 7,097 | 6,720 | 924 | NA2 |
| Duke Realty Corp. | 129,680 | 32,749 | 20,000 | 2,225 | NA2 |
| DuPont Fabros Technology Inc. | 35,475 | 25,663 | 7,528 | 484 | NA2 |
| EastGroup Properties Inc. | 50,807 | 6,788 | 5,840 | 1,268 | 49,154 |
| Education Realty Trust Inc. | NA1 | 3,029 | 2,297 | — | 19,917 |
| Entertainment Properties Trust | 75,027 | 21,173 | 12,924 | 2,819 | 98,111 |
| Equity Residential | 449,138 | 78,360 | 71,878 | 2,724 | 653,518 |
| Federal Realty Investment Trust | 200,594 | 29,752 | 31,314 | 3,934 | 242,198 |
| FelCor Lodging Trust Inc. | 12,494 | 11,071 | 3,880 | — | NA2 |
| Glimcher Realty Trust | NA1 | 7,781 | 2,732 | 133 | 27,891 |
| HCP Inc. | 421,644 | 62,073 | 61,772 | 7,132 | NA2 |
| Health Care REIT Inc. | NA1 | 40,130 | 34,291 | 6,201 | 283,380 |
| Healthcare Realty Trust Inc. | 63,667 | 10,169 | 8,686 | 872 | NA2 |
| Highwoods Properties Inc. | 109,497 | 14,427 | 15,288 | 1,708 | 112,535 |
| Home Properties Inc. | 74,927 | 13,072 | 9,541 | 821 | NA2 |
| Hospitality Properties Trust | 138,178 | 19,298 | 19,775 | 4,419 | 127,583 |
| Host Hotels & Resorts Inc. | 336,781 | 61,489 | 62,322 | 645 | NA2 |
| HRPT Properties Trust | 76,322 | 23,072 | 12,776 | 2,549 | NA3 |
| Kilroy Realty Corp. | 63,764 | 24,257 | 11,435 | 795 | NA2 |
| Kimco Realty Corp. | 259,331 | 39,642 | 39,933 | 4,320 | 309,020 |
22
REIT Index Fund
| | | | | |
| | | Current Period Transactions | |
| January 31, 2010
Market
Value
($000) | | Proceeds from
Securities
Sold
($000) | | July 31, 2010
Market
Value
($000) |
| | Purchases
at Cost
($000) | Dividend
Income
($000) |
| |
| |
| Kite Realty Group Trust | 12,207 | 1,731 | 1,903 | 74 | 14,766 |
| LaSalle Hotel Properties | 65,505 | 15,560 | 11,287 | 70 | NA2 |
| Liberty Property Trust | 173,612 | 23,820 | 24,051 | 4,635 | 180,763 |
| Macerich Co. | 149,163 | 100,534 | 32,974 | 3,182 | 269,735 |
| Mack-Cali Realty Corp. | 130,706 | 17,591 | 17,488 | 3,091 | 129,020 |
| Medical Properties Trust Inc. | 41,046 | 20,109 | 6,946 | 954 | NA2 |
| Mid-America Apartment | | | | | |
| Communities Inc. | 67,739 | 11,169 | 9,611 | 1,118 | NA2 |
| National Retail Properties Inc. | 83,398 | 13,245 | 11,801 | 3,221 | 96,937 |
| Omega Healthcare Investors Inc. | 79,686 | 18,918 | 12,809 | 2,341 | NA2 |
| Parkway Properties Inc. | 23,028 | 2,369 | 2,503 | 69 | 18,273 |
| Post Properties Inc. | 43,719 | 7,450 | 7,963 | 63 | 62,578 |
| ProLogis | NA1 | 55,834 | 37,684 | 4,523 | 260,402 |
| Realty Income Corp. | 148,978 | 21,241 | 23,025 | 3,673 | 169,403 |
| Regency Centers Corp. | 151,287 | 21,469 | 35,649 | 2,956 | 155,647 |
| Retail Opportunity Investments Corp. | — | 21,153 | 492 | 7 | 20,747 |
| Senior Housing Properties Trust | 135,404 | 18,204 | 19,105 | 3,761 | 145,241 |
| Simon Property Group Inc. | 1,049,446 | 159,425 | 154,172 | 16,151 | 1,308,191 |
| SL Green Realty Corp. | 178,778 | 29,615 | 30,515 | 747 | 237,070 |
| Sovran Self Storage Inc. | 46,761 | 6,509 | 6,126 | 862 | 51,262 |
| Strategic Hotels & Resorts Inc. | 8,823 | 18,817 | 3,239 | — | NA2 |
| Sunstone Hotel Investors Inc. | NA1 | 7,821 | 7,358 | — | 51,194 |
| Tanger Factory Outlet Centers | 77,998 | 11,494 | 11,295 | 1,397 | 91,037 |
| Taubman Centers Inc. | 86,027 | 14,435 | 13,395 | 1,823 | 112,605 |
| UDR Inc. | 119,826 | 20,427 | 17,802 | 340 | NA2 |
| Ventas Inc. | 337,888 | 48,763 | 52,148 | 6,756 | 401,896 |
| | 7,385,878 | | | 126,815 | 6,647,936 |
1 Not applicable—At January 31, 2010, the issuer was not an affiliated company of the fund.2 Not applicable—At July 31, 2010, the security was still held but the issuer was no longer an affiliated company of the fund.3 Not applicable—In July 2010, HRPT Properties Trust changed its name to CommonWealth REIT. At July 31, 2010 CommonWealth REIT was not an affiliated company of the fund.I. In preparing the financial statements as of July 31, 2010, management considered the impact of subsequent events for potential recognition or disclosure in these financial statements.
23
About Your Fund’s Expenses
As a shareholder of the fund, you incur ongoing costs, which include costs for portfolio management, administrative services, and shareholder reports (like this one), among others. Operating expenses, which are deducted from a fund’s gross income, directly reduce the investment return of the fund.
A fund’s expenses are expressed as a percentage of its average net assets. This figure is known as the expense ratio. The following examples are intended to help you understand the ongoing costs (in dollars) of investing in your fund and to compare these costs with those of other mutual funds. The examples are based on an investment of $1,000 made at the beginning of the period shown and held for the entire period.
The accompanying table illustrates your fund’s costs in two ways:
• Based on actual fund return. This section helps you to estimate the actual expenses that you paid over the period. The ”Ending Account Value“ shown is derived from the fund‘s actual return, and the third column shows the dollar amount that would have been paid by an investor who started with $1,000 in the fund. You may use the information here, together with the amount you invested, to estimate the expenses that you paid over the period.
To do so, simply divide your account value by $1,000 (for example, an $8,600 account value divided by $1,000 = 8.6), then multiply the result by the number given for your fund under the heading ”Expenses Paid During Period.“
• Based on hypothetical 5% yearly return. This section is intended to help you compare your fund‘s costs with those of other mutual funds. It assumes that the fund had a yearly return of 5% before expenses, but that the expense ratio is unchanged. In this case—because the return used is not the fund’s actual return—the results do not apply to your investment. The example is useful in making comparisons because the Securities and Exchange Commission requires all mutual funds to calculate expenses based on a 5% return. You can assess your fund’s costs by comparing this hypothetical example with the hypothetical examples that appear in shareholder reports of other funds.
Note that the expenses shown in the table are meant to highlight and help you compare ongoing costs only and do not reflect transaction costs incurred by the fund for buying and selling securities. Further, the expenses do not include the 1% fee on redemptions of shares held for less than one year, nor do they include the account service fee described in the prospectus. If such fees were applied to your account, your costs would be higher. Your fund does not carry a “sales load.” The calculations assume no shares were bought or sold during the period. Your actual costs may have been higher or lower, depending on the amount of your investment and the timing of any purchases or redemptions.
You can find more information about the fund’s expenses, including annual expense ratios, in the Financial Statements section of this report. For additional information on operating expenses and other shareholder costs, please refer to your fund’s current prospectus.
24
| | | |
| Six Months Ended July 31, 2010 | | | |
| | Beginning
Account Value
1/31/2010 | Ending
Account Value
7/31/2010 | Expenses
Paid During
Period |
| |
| REIT Index Fund |
| Based on Actual Fund Return | | | |
| Investor Shares | $1,000.00 | $1,223.96 | $1.43 |
| Admiral Shares | 1,000.00 | 1,224.71 | 0.66 |
| Signal Shares | 1,000.00 | 1,224.85 | 0.66 |
| Institutional Shares | 1,000.00 | 1,225.48 | 0.44 |
| ETF Shares | 1,000.00 | 1,224.77 | 0.66 |
| Based on Hypothetical 5% Yearly Return | | | |
| Investor Shares | $1,000.00 | $1,023.51 | $1.30 |
| Admiral Shares | 1,000.00 | 1,024.20 | 0.60 |
| Signal Shares | 1,000.00 | 1,024.20 | 0.60 |
| Institutional Shares | 1,000.00 | 1,024.40 | 0.40 |
| ETF Shares | 1,000.00 | 1,024.20 | 0.60 |
The calculations are based on expenses incurred in the most recent six-month period. The fund’s annualized six-month expense ratios for that period are 0.26% for Investor Shares, 0.12% for Admiral Shares, 0.12% for Signal Shares, 0.08% for Institutional Shares, and 0.12% for ETF Shares. The dollar amounts shown as “Expenses Paid” are equal to the annualized expense ratio multiplied by the average account value over the period, multiplied by the number of days in the most recent six-month period, then divided by the number of days in the most recent 12-month period.25
Trustees Approve Advisory Arrangement
The board of trustees of Vanguard REIT Index Fund has renewed the fund’s investment advisory arrangement with The Vanguard Group, Inc. Vanguard—through its Quantitative Equity Group—serves as the investment advisor to the fund. The board determined that continuing the fund’s internalized management structure was in the best interests of the fund and its shareholders.
The board based its decision upon an evaluation of the advisor’s investment staff, portfolio management process, and performance. The trustees considered the factors discussed below, among others. However, no single factor determined whether the board approved the arrangement. Rather, it was the totality of the circumstances that drove the board’s decision.
Nature, extent, and quality of services
The board considered the quality of the fund’s investment management over both the short and long term, and took into account the organizational depth and stability of the advisor. The board noted that Vanguard has been managing investments for more than three decades. The Quantitative Equity Group adheres to a sound, disciplined investment management process; the team has considerable experience, stability, and depth.
The board concluded that Vanguard’s experience, stability, depth, and performance, among other factors, warranted continuation of the advisory arrangement.
Investment performance
The board considered the short- and long-term performance of the fund, including any periods of outperformance or underperformance of its target index and peer group. The board concluded that the fund has performed in line with expectations, and that its results have been consistent with its investment strategy. Information about the fund’s most recent performance can be found in the Performance Summary portion of this report.
Cost
The board concluded that the fund’s expense ratio was well below the average expense ratio charged by funds in its peer group and that the fund’s advisory expense ratio was also well below its peer-group average. Information about the fund’s expense ratio appears in the About Your Fund’s Expenses section of this report as well as in the Financial Statements section.
The board does not conduct a profitability analysis of Vanguard, because of Vanguard’s unique “at-cost” structure. Unlike most other mutual fund management companies, Vanguard is owned by the funds it oversees, and produces “profits” only in the form of reduced expenses for fund shareholders.
The benefit of economies of scale
The board concluded that the fund’s low-cost arrangement with Vanguard ensures that the fund will realize economies of scale as it grows, with the cost to shareholders declining as the fund’s assets increase.
The board will consider whether to renew the advisory arrangement again after a one-year period.
26
Glossary
Beta. A measure of the magnitude of a fund’s past share-price fluctuations in relation to the ups and downs of a given market index. The index is assigned a beta of 1.00. Compared with a given index, a fund with a beta of 1.20 typically would have seen its share price rise or fall by 12% when the index rose or fell by 10%. For this report, beta is based on returns over the past 36 months for both the fund and the index. Note that a fund’s beta should be reviewed in conjunction with its R-squared (see definition). The lower the R-squared, the less correlation there is between the fund and the index, and the less reliable beta is as an indicator of volatility.
Dividend Yield. Dividend income earned by stocks, expressed as a percentage of the aggregate market value (or of net asset value, for a fund). The yield is determined by dividing the amount of the annual dividends by the aggregate value (or net asset value) at the end of the period. For a fund, the dividend yield is based solely on stock holdings and does not include any income produced by other investments. This yield may include some payments that represent a return of capital, capital gains distributions, or both by the underlying stocks.
Earnings Growth Rate. The average annual rate of growth in earnings over the past five years for the stocks now in a fund.
Expense Ratio. The percentage of a fund’s average net assets used to pay its annual administrative and advisory expenses. These expenses directly reduce returns to investors.
Foreign Holdings. The percentage of a fund represented by stocks or depositary receipts of companies based outside the United States.
Inception Date. The date on which the assets of a fund (or one of its share classes) are first invested in accordance with the fund’s investment objective. For funds with a subscription period, the inception date is the day after that period ends. Investment performance is measured from the inception date.
Median Market Cap. An indicator of the size of companies in which a fund invests; the midpoint of market capitalization (market price x shares outstanding) of a fund’s stocks, weighted by the proportion of the fund’s assets invested in each stock. Stocks representing half of the fund’s assets have market capitalizations above the median, and the rest are below it.
Price/Book Ratio. The share price of a stock divided by its net worth, or book value, per share. For a fund, the weighted average price/book ratio of the stocks it holds.
Price/Earnings Ratio. The ratio of a stock’s current price to its per-share earnings over the past year. For a fund, the weighted average P/E of the stocks it holds. P/E is an indicator of market expectations about corporate prospects; the higher the P/E, the greater the expectations for a company’s future growth.
R-Squared. A measure of how much of a fund’s past returns can be explained by the returns from the market in general, as measured by a given index. If a fund’s total returns were precisely synchronized with an index’s returns, its R-squared would be 1.00. If the fund’s returns bore no relationship to the index’s returns, its R-squared would be 0. For this report, R-squared is based on returns over the past 36 months for both the fund and the index.
27
Return on Equity. The annual average rate of return generated by a company during the past five years for each dollar of shareholder’s equity (net income divided by shareholder’s equity). For a fund, the weighted average return on equity for the companies whose stocks it holds.
Short-Term Reserves. The percentage of a fund invested in highly liquid, short-term securities that can be readily converted to cash.
Turnover Rate. An indication of the fund’s trading activity. Funds with high turnover rates incur higher transaction costs and may be more likely to distribute capital gains (which may be taxable to investors). The turnover rate excludes in-kind transactions, which have minimal impact on costs.
28
This page intentionally left blank.
This page intentionally left blank.
This page intentionally left blank.
The People Who Govern Your Fund
The trustees of your mutual fund are there to see that the fund is operated and managed in your best interests since, as a shareholder, you are a part owner of the fund. Your fund’s trustees also serve on the board of directors of The Vanguard Group, Inc., which is owned by the Vanguard funds and provides services to them on an at-cost basis.
A majority of Vanguard’s board members are independent, meaning that they have no affiliation with Vanguard or the funds they oversee, apart from the sizable personal investments they have made as private individuals. The independent board members have distinguished backgrounds in business, academia, and public service. Each of the trustees and executive officers oversees 162 Vanguard funds.
The following table provides information for each trustee and executive officer of the fund. More information about the trustees is in the Statement of Additional Information, which can be obtained, without charge, by contacting Vanguard at 800-662-7447, or online at www.vanguard.com.
| |
| Interested Trustee1 | Amy Gutmann |
| | Born 1949. Trustee Since June 2006. Principal |
| F. William McNabb III | Occupation(s) During the Past Five Years: President |
| Born 1957. Trustee Since July 2009. Chairman of the | of the University of Pennsylvania; Christopher H. |
| Board. Principal Occupation(s) During the Past Five | Browne Distinguished Professor of Political Science |
| Years: Chairman of the Board of The Vanguard Group, | in the School of Arts and Sciences with secondary |
| Inc., and of each of the investment companies served | appointments at the Annenberg School for Commu- |
| by The Vanguard Group, since January 2010; Director | nication and the Graduate School of Education of |
| of The Vanguard Group since 2008; Chief Executive | the University of Pennsylvania; Director of Carnegie |
| Officer and President of The Vanguard Group and of | Corporation of New York, Schuylkill River Development |
| each of the investment companies served by The | Corporation, and Greater Philadelphia Chamber of |
| Vanguard Group since 2008; Director of Vanguard | Commerce; Trustee of the National Constitution Center; |
| Marketing Corporation; Managing Director of The | Chair of the Presidential Commission for the Study of |
| Vanguard Group (1995–2008). | Bioethical Issues. |
| |
| | JoAnn Heffernan Heisen |
| Independent Trustees | Born 1950. Trustee Since July 1998. Principal |
| | Occupation(s) During the Past Five Years: Corporate |
| Emerson U. Fullwood | Vice President and Chief Global Diversity Officer since |
| Born 1948. Trustee Since January 2008. Principal | 2006 (retired 2008) and Member of the Executive |
| Occupation(s) During the Past Five Years: Executive | Committee (retired 2008) of Johnson & Johnson |
| Chief Staff and Marketing Officer for North America | (pharmaceuticals/consumer products); Vice President |
| and Corporate Vice President (retired 2008) of Xerox | and Chief Information Officer of Johnson & Johnson |
| Corporation (document management products and | (1997–2005); Director of the University Medical Center |
| services); Director of SPX Corporation (multi-industry | at Princeton and Women’s Research and Education |
| manufacturing), the United Way of Rochester, | Institute; Member of the Advisory Board of the |
| Amerigroup Corporation (managed health care), | Maxwell School of Citizenship and Public Affairs |
| the University of Rochester Medical Center, and | at Syracuse University. |
| Monroe Community College Foundation. | |
| | F. Joseph Loughrey |
| Rajiv L. Gupta | Born 1949. Trustee Since October 2009. Principal |
| Born 1945. Trustee Since December 2001.2 | Occupation(s) During the Past Five Years: President |
| Principal Occupation(s) During the Past Five Years: | and Chief Operating Officer since 2005 (retired 2009) |
| Chairman and Chief Executive Officer (retired 2009) | and Vice Chairman of the Board (2008–2009) of |
| and President (2006–2008) of Rohm and Haas Co. | Cummins Inc. (industrial machinery); Director of |
| (chemicals); Director of Tyco International, Ltd. | SKF AB (industrial machinery), Hillenbrand, Inc. |
| (diversified manufacturing and services) and Hewlett- | (specialized consumer services), Sauer-Danfoss Inc. |
| Packard Co. (electronic computer manufacturing); | (machinery), the Lumina Foundation for Education, |
| Trustee of The Conference Board; Member of the | and Oxfam America; Chairman of the Advisory Council |
| Board of Managers of Delphi Automotive LLP | for the College of Arts and Letters at the University of |
| (automotive components). | Notre Dame. |
| | |
| André F. Perold | Kathryn J. Hyatt | |
| Born 1952. Trustee Since December 2004. Principal | Born 1955. Treasurer Since November 2008. Principal |
| Occupation(s) During the Past Five Years: George | Occupation(s) During the Past Five Years: Principal |
| Gund Professor of Finance and Banking at the Harvard | of The Vanguard Group, Inc.; Treasurer of each of |
| Business School; Chair of the Investment Committee | the investment companies served by The Vanguard |
| of HighVista Strategies LLC (private investment firm). | Group since 2008; Assistant Treasurer of each of the |
| | investment companies served by The Vanguard Group |
| Alfred M. Rankin, Jr. | (1988–2008). | |
| Born 1941. Trustee Since January 1993. Principal | | |
| Occupation(s) During the Past Five Years: Chairman, | Heidi Stam | |
| President, and Chief Executive Officer of NACCO | Born 1956. Secretary Since July 2005. Principal |
| Industries, Inc. (forklift trucks/housewares/lignite); | Occupation(s) During the Past Five Years: Managing |
| Director of Goodrich Corporation (industrial products/ | Director of The Vanguard Group, Inc., since 2006; |
| aircraft systems and services); Chairman of the Federal | General Counsel of The Vanguard Group since 2005; |
| Reserve Bank of Cleveland; Trustee of The Cleveland | Secretary of The Vanguard Group and of each of the |
| Museum of Art. | investment companies served by The Vanguard Group |
| | since 2005; Director and Senior Vice President of |
| Peter F. Volanakis | Vanguard Marketing Corporation since 2005; |
| Born 1955. Trustee Since July 2009. Principal | Principal of The Vanguard Group (1997–2006). |
| Occupation(s) During the Past Five Years: President | | |
| since 2007 and Chief Operating Officer since 2005 | Vanguard Senior Management Team |
| of Corning Incorporated (communications equipment); | | |
| President of Corning Technologies (2001–2005); | R. Gregory Barton | Michael S. Miller |
| Director of Corning Incorporated and Dow Corning; | Mortimer J. Buckley | James M. Norris |
| Trustee of the Corning Incorporated Foundation and | Kathleen C. Gubanich | Glenn W. Reed |
| the Corning Museum of Glass; Overseer of the | Paul A. Heller | George U. Sauter |
| Amos Tuck School of Business Administration at | | |
| Dartmouth College. | | |
| | Chairman Emeritus and Senior Advisor |
| |
| Executive Officers | John J. Brennan | |
| | Chairman, 1996–2009 | |
| Glenn Booraem | Chief Executive Officer and President, 1996–2008 |
| Born 1967. Controller Since July 2010. Principal | | |
| Occupation(s) During the Past Five Years: Principal | | |
| of The Vanguard Group, Inc.; Controller of each of | Founder | |
| the investment companies served by The Vanguard | | |
| Group since 2010; Assistant Controller of each of | John C. Bogle | |
| the investment companies served by The Vanguard | Chairman and Chief Executive Officer, 1974–1996 |
| Group (2001–2010). | | |
| |
| Thomas J. Higgins | | |
| Born 1957. Chief Financial Officer Since September | | |
| 2008. Principal Occupation(s) During the Past Five | | |
| Years: Principal of The Vanguard Group, Inc.; Chief | | |
| Financial Officer of each of the investment companies | | |
| served by The Vanguard Group since 2008; Treasurer | | |
| of each of the investment companies served by The | | |
| Vanguard Group (1998–2008). | | |
1 Mr. McNabb is considered an “interested person,” as defined in the Investment Company Act of 1940, because he is an officer of the Vanguard funds.
2 December 2002 for Vanguard Equity Income Fund, Vanguard Growth Equity Fund, the Vanguard Municipal Bond Funds, and the Vanguard State Tax-Exempt Funds.
|  |
| P.O. Box 2600 |
| Valley Forge, PA 19482-2600 |
Connect with Vanguard® > Vanguard.com
| |
| Fund Information > 800-662-7447 | The funds or securities referred to herein are not |
| sponsored, endorsed, or promoted by MSCI, and MSCI |
| Direct Investor Account Services > 800-662-2739 | bears no liability with respect to any such funds or |
| | securities. For any such funds or securities, the |
| Institutional Investor Services > 800-523-1036 | prospectus or the Statement of Additional Information |
| contains a more detailed description of the limited |
| Text Telephone for People | relationship MSCI has with The Vanguard Group and |
| With Hearing Impairment > 800-749-7273 | any related funds. |
| | |
| This material may be used in conjunction | |
| with the offering of shares of any Vanguard | |
| fund only if preceded or accompanied by | |
| the fund’s current prospectus. | |
| |
| All comparative mutual fund data are from Lipper Inc. or | |
| Morningstar, Inc., unless otherwise noted. | |
| |
| You can obtain a free copy of Vanguard’s proxy voting | |
| guidelines by visiting vanguard.com/proxyreporting or by | |
| calling Vanguard at 800-662-2739. The guidelines are | |
| also available from the SEC’s website, sec.gov. In | |
| addition, you may obtain a free report on how your fund | |
| voted the proxies for securities it owned during the 12 | |
| months ended June 30. To get the report, visit either | |
| vanguard.com/proxyreporting or sec.gov. | |
| |
| You can review and copy information about your fund at | |
| the SEC’s Public Reference Room in Washington, D.C. To | |
| find out more about this public service, call the SEC at | |
| 202-551-8090. Information about your fund is also | |
| available on the SEC’s website, and you can receive | |
| copies of this information, for a fee, by sending a | |
| request in either of two ways: via e-mail addressed to | |
| publicinfo@sec.gov or via regular mail addressed to the | |
| Public Reference Section, Securities and Exchange | |
| Commission, Washington, DC 20549-1520. | |
| |
| |
| | © 2010 The Vanguard Group, Inc. |
| | All rights reserved. |
| | Vanguard Marketing Corporation, Distributor. |
| |
| | Q1232 092010 |
 |
|
| Vanguard Dividend Growth Fund |
| Semiannual Report |
|
| July 31, 2010 |
 |
> For the six months ended July 31, 2010, Vanguard Dividend Growth Fund returned 1.44%.
> During the period, the fund trailed both its benchmark index and the average return of its peer funds.
> Security selection, particularly in the industrial, information technology, and energy sectors, hurt performance relative to the benchmark index.
| |
| Contents | |
| Your Fund’s Total Returns. | 1 |
| Chairman’s Letter. | 2 |
| Advisor’s Report. | 7 |
| Fund Profile. | 9 |
| Performance Summary. | 10 |
| Financial Statements. | 11 |
| About Your Fund’s Expenses. | 19 |
| Glossary. | 21 |
Please note: The opinions expressed in this report are just that—informed opinions. They should not be considered promises or advice.
Also, please keep in mind that the information and opinions cover the period through the date on the front of this report. Of course, the risks of investing in your fund are spelled out in the prospectus.
See the Glossary for definitions of investment terms used in this report.
Cover photograph: Veronica Coia.
Your Fund’s Total Returns
| |
| Six Months Ended July 31, 2010 | |
| | Total |
| | Returns |
| Vanguard Dividend Growth Fund | 1.44% |
| Dividend Growth Spliced Index | 3.28 |
| Large-Cap Core Funds Average | 2.07 |
Dividend Growth Spliced Index: Prior to December 6, 2002, the comparative benchmark was known as the Utilities Composite Index. The index weightings were: 40% S&P Utilities Index, 40% S&P Telephone Index, and 20% Lehman Brothers Utility Bond Index through April 30, 1999; 63.75% S&P Utilities Index, 21.25% S&P Telephone Index, and 15% Lehman Brothers Utility Bond Index through March 31, 2000; 75% S&P Utilities Index and 25% S&P Telephone Index through December 31, 2001; and 75% S&P Utilities Index and 25% S&P Integrated Telecommunication Services Index through December 6, 2002. The fund’s benchmark was the Russell 1000 Index through January 31, 2010, after which it was changed to the Dividend Achievers Select Index. The Dividend Achievers Select Index is administered exclusively fo r Vanguard by Mergent, Inc.
Large-Cap Core Funds Average: Derived from data provided by Lipper Inc.
| | | | |
| Your Fund’s Performance at a Glance | | | | |
| January 31, 2010, Through July 31, 2010 | | | | |
| | | | Distributions Per Share |
| | Starting | Ending | Income | Capital |
| | Share Price | Share Price | Dividends | Gains |
| Vanguard Dividend Growth Fund | $12.82 | $12.87 | $0.131 | $0.000 |
1

Chairman’s Letter
Dear Shareholder,
Vanguard Dividend Growth Fund returned 1.44% for the six months ended July 31, 2010, lagging the return of its index benchmark and the average return of large-cap core funds.
The investment strategy employed by the advisor, Wellington Management Company, kept the fund a bit behind its comparative standards during the stock market’s bumpy six-month ride. At times when the market was performing well, investors tended to favor mid- and small-cap stocks, whereas Wellington Management concentrates on large, profitable companies that are likely to raise their dividends in the future. Individual stock selection also limited the fund’s returns for the six-month period.
Please note that, effective February 1, 2010, the Dividend Growth Fund’s primary benchmark was changed to the Dividend Achievers Select Index, a standard that is more consistent with the fund’s mandate of investing in high-quality companies that have a history of increasing their dividends over time. The “Dividend Growth Spliced Index” shown on page 1 and elsewhere in this report combines the old and new benchmarks for performance-comparison purposes.
2
Stock markets moved higher but the journey was tense
Global stock markets emerged from a turbulent six-month stretch with respectable single-digit gains. Prices rallied in early spring, buoyed by rapid growth in corporate earnings, but fell sharply in May and June as Europe’s sovereign debt crisis took center stage. Signs that the U.S. economic recovery might be sputtering also dampened investor spirits. By the end of the six-month period, however, stock markets had recouped the previous months’ losses as corporate bellwethers continued to report strong profits, and investors’ moods brightened.
For the full period, the U.S. stock market returned more than 4%. Smaller-company stocks, which are less exposed to global turmoil than large-capitalization multinationals, returned about 9%. International stocks finished the period with a modestly positive return, as strong performance from emerging markets compensated for weaker returns in Europe.
High-quality bonds rallied amid the search for safety
Turmoil in the stock markets and mixed economic signals drove bond prices higher, and yields lower, as investors sought safety in high-quality government and corporate bonds. At the start of the period, the yield of the benchmark 10-year U.S. Treasury note stood at 3.61%. By the end of the period, it had dipped to 2.91%, and the rates on home-mortgage loans were at their lowest levels since the 1950s.
| | | |
| Market Barometer | | | |
| |
| | Total Returns
Periods Ended July 31, 2010 |
| |
| | Six | One | Five Years |
| | Months | Year | (Annualized) |
| Stocks | | | |
| Russell 1000 Index (Large-caps) | 3.84% | 14.51% | 0.02% |
| Russell 2000 Index (Small-caps) | 8.79 | 18.43 | 0.47 |
| Dow Jones U.S. Total Stock Market Index | 4.48 | 15.36 | 0.45 |
| MSCI All Country World Index ex USA (International) | 2.26 | 10.12 | 4.89 |
| |
| Bonds | | | |
| Barclays Capital U.S. Aggregate Bond Index (Broad | | | |
| taxable market) | 4.85% | 8.91% | 5.96% |
| Barclays Capital Municipal Bond Index | 4.06 | 9.15 | 4.75 |
| Citigroup Three-Month U.S. Treasury Bill Index | 0.06 | 0.12 | 2.58 |
| |
| CPI | | | |
| Consumer Price Index | 0.61% | 1.24% | 2.21% |
3
Rising bond prices led to strong six-month returns in both the taxable and municipal bond markets. The returns from money market instruments, by contrast, remained vanishingly small. Yields have hovered near 0% since late 2008, when the Federal Reserve Board set its target for short-term interest rates between 0% and 0.25%.
The fund’s stock selections fell a few steps behind
In the universe of dividend-focused stock funds, the Dividend Growth Fund is distinctive. Like other income-oriented portfolios, the fund concentrates on large, high-quality companies that have a history of paying dividends. However, Wellington Management keeps an eye on the future as well as the present. Wellington focuses on companies with the ability to increase their earnings over time, subsequently raise their dividends, and then maintain those payouts in the years ahead.
This approach bodes well for the long term, as companies with these features are well positioned to steadily grow and provide their investors with a stable stream of income. But this approach restrained the Dividend Growth Fund during the past 18 months.
While the remarkable stock market recovery that began in March 2009 was a rising tide that lifted all boats, some vessels rode the waves higher than others. Lower-quality stocks that were most beaten down during the financial crisis led the recovery during the first year. Because of its high-quality orientation, the Dividend
| | |
| Expense Ratios | | |
| Your Fund Compared With Its Peer Group | | |
| | | Peer Group |
| | Fund | Average |
| Dividend Growth Fund | 0.38% | 1.27% |
The fund expense ratio shown is from the prospectus dated May 28, 2010, and represents estimated costs for the current fiscal year. For the six months ended July 31, 2010, the fund’s annualized expense ratio was 0.36%. The peer-group expense ratio is derived from data provided by Lipper Inc. and captures information through year-end 2009.Peer group: Large-Cap Core Funds.4
Growth Fund trailed its benchmark index and the average return of its peer funds in this period.
During the six months just ended, the rally faded and weakness returned to the stock market. When the market did climb, however, it was mid- and small-cap stocks that set the pace—yet another challenge for the Dividend Growth Fund and other funds that focus on large-cap stocks.
Compared with its benchmark index, however, the fund’s shortcomings primarily stemmed from stock selection. Much of the ground was lost in the industrial sector, where errors of omission were the culprit. The fund didn’t hold Caterpillar and 3M, two stocks that appreciated significantly during the six months.
The Dividend Growth Fund was also hurt by some of the stocks it did own, notably in the information technology and energy sectors. Most of the energy sector has been dragged down by the Gulf Coast oil spill. The fund held BP, the global energy titan at the epicenter of the disaster, as well as Total S.A. and BG Group. Dividend Growth also had significant exposure to Western Union and Microsoft, technology giants that have much smaller weightings in the benchmark index; both stocks suffered during the half-year.
Relative to the benchmark, the fund benefited from strong stock selection in the traditionally dividend-heavy financial and health care sectors. In the financial sector, insurance companies were the stars for the period, especially ACE and Marsh & McLennan. Pharmaceutical companies stood out in health care. The fund owned AstraZeneca, a top performer, and had relatively little exposure to struggling Abbott Laboratories, a significant presence in the benchmark. The fund’s two best-performing sectors, materials and utilities, were also two of its smallest allocations and thus only slightly aided returns.
A long-term approach matters when the market’s most turbulent
Volatility returned to the stock market during the recent half-year. The April–June period was the market’s first negative calendar quarter since the beginning of 2009. However, July brought strong returns after more than two months of turbulence, and the market managed a small gain for the six months.
This period underscores the unpredictability that is inherent in the stock market. Rather than focus on the market’s daily twists and turns, Vanguard urges investors to maintain a long-term approach. Controlling the unpredictable market is impossible, but you can dictate how your money is invested. We believe that a diversified mix
5
of stock, bond, and money market mutual funds, held in proportions tailored to your goals, time horizon, and risk tolerance, is the most effective long-term investment program.
Vanguard Dividend Growth Fund, with its low costs and emphasis on companies that are positioned to raise their dividends over time, can be an important part of such a long-term, well-diversified portfolio.
Thank you for entrusting your assets to Vanguard.
Sincerely,

F. William McNabb III
Chairman and Chief Executive Officer
August 12, 2010
6
Advisor’s Report
Vanguard Dividend Growth Fund returned 1.44% for the six-month period ended July 31, 2010. This performance lagged the 3.28% return of the Dividend Achievers Select Index as well as the 2.07% average return of large-capitalization core funds.
The investment environment
The investment environment in 2010 thus far has been dominated by two related concerns, with investors unsure which to worry about most. First is the question of whether public stimulus programs will succeed in reviving willingness to spend among businesses and consumers. The second is whether to expect inflation or deflation in the near term as the economy continues to struggle.
We believe fiscal and monetary stimulus will win over austerity in the long run and eventually result in an inflationary environment. How well policymakers manage this outcome will be critical; however, in the near term we think the possibility of deflation is the more relevant concern. The market’s choppy performance during the past six months is unsurprising given these uncertainties.
The fund’s successes
On an absolute basis, seven of ten sectors contributed positively to performance during the period. The fund’s holdings in the materials and utility sectors returned the most. Among the portfolio’s top absolute contributors were Emerson Electric, United Parcel Service, and Praxair.
Based on present dividend trends, the current portfolio is expected to produce asset-weighted dividend growth of 13.7% for 2010. The portfolio produced dividend growth of about 10% in calendar-year 2009 and 14% in calendar 2008. To date, several companies have yet to announce their dividend plans for 2010, so our current projection for dividend growth may turn out to be understated. The most notable announcements to date have come from ConocoPhillips, Western Union, Walgreen, and Colgate-Palmolive.
The fund’s shortfalls
Our energy, health care, and information technology holdings did not perform well during the period. Among the notable detractors were Walgreen, Pfizer, and Medtronic.
While we would prefer all the stocks in the fund to perform well at all times, it is inevitable that some will detract from the fund’s performance over a given period. We assess a stock’s contribution over a longer time frame, and with an eye consistently focused on dividend action. We expect these three companies to raise their dividends 40%, 13% and 15%, respectively, in the near term.
7
The fund’s positioning and investment strategy
Our primary objective is to identify companies that we believe will steadily and reliably increase their dividend payments. We seek to fulfill this objective by carefully building the portfolio one stock at a time, giving central consideration to each company’s dividend growth prospects. Our industry weightings are a result of this process. The fund has significant positions in the health care, industrial, technology, and consumer staples sectors, and less exposure to the utilities, telecommunication services, and financial sectors.
As mentioned earlier, there are important uncertainties that make portfolio positioning challenging. We believe deflation may well be the most relevant possibility to consider in the near term. High-quality companies with strong business models and the ability to raise prices are best positioned to combat deflation. We are comforted knowing that the dividend-growing companies in this portfolio largely fit that profile and should do well in a deflationary environment.
Donald J. Kilbride,
Senior Vice President and Equity Portfolio Manager
Wellington Management Company, LLP
August 11, 2010
8
Dividend Growth Fund
Fund Profile
As of July 31, 2010
| | | |
| Portfolio Characteristics | | |
| | | Dividend | DJ |
| | | Achievers | U.S. Total |
| | | Select | Market |
| | Fund | Index | Index |
| Number of Stocks | 47 | 142 | 4,101 |
| Median Market Cap $40.7B | $40.7B | $27.0B |
| Price/Earnings Ratio | 13.7x | 15.1x | 17.4x |
| Price/Book Ratio | 2.7x | 2.9x | 2.0x |
| Return on Equity | 25.1% | 25.8% | 19.0% |
| Earnings Growth Rate | 8.3% | 7.9% | 6.7% |
| Dividend Yield | 2.7% | 2.6% | 1.9% |
| Foreign Holdings | 6.4% | 0.0% | 0.0% |
| Turnover Rate | | | |
| (Annualized) | 20% | — | — |
| Ticker Symbol | VDIGX | — | — |
| Expense Ratio1 | 0.38% | — | — |
| 30-Day SEC Yield | 2.14% | — | — |
| Short-Term Reserves | 4.6% | — | — |
| |
| Sector Diversification (% of equity exposure) |
| | | Dividend | DJ |
| | | Achievers | U.S. Total |
| | | Select | Market |
| | Fund | Index | Index |
| Consumer | | | |
| Discretionary | 7.4% | 11.8% | 11.5% |
| Consumer Staples | 17.0 | 25.3 | 10.3 |
| Energy | 13.7 | 10.3 | 9.6 |
| Financials | 7.4 | 6.5 | 17.5 |
| Health Care | 16.8 | 13.3 | 11.0 |
| Industrials | 15.5 | 19.5 | 11.1 |
| Information | | | |
| Technology | 14.6 | 6.0 | 18.7 |
| Materials | 4.2 | 5.7 | 4.1 |
| Telecommunication | | | |
| Services | 1.6 | 0.2 | 2.7 |
| Utilities | 1.8 | 1.4 | 3.5 |
| | |
| Volatility Measures | | |
| | | DJ |
| | Dividend | U.S. Total |
| | Growth | Market |
| | Spliced Index | Index |
| R-Squared | 0.95 | 0.94 |
| Beta | 0.79 | 0.76 |
| These measures show the degree and timing of the fund’s fluctuations compared with the indexes over 36 months. |
|
| |
| Ten Largest Holdings (% of total net assets) |
| Automatic Data | Data Processing & |
| Processing Inc. | Outsourced | |
| | Services | 3.4% |
| Johnson & Johnson | Pharmaceuticals | 3.3 |
| United Parcel Service | Air Freight & | |
| Inc. Class B | Logistics | 3.1 |
| ConocoPhillips | Integrated Oil & | |
| | Gas | 3.1 |
| International Business | IT Consulting & | |
| Machines Corp. | Other Services | 2.9 |
| BG Group PLC | Integrated Oil & | |
| | Gas | 2.6 |
| PepsiCo Inc. | Soft Drinks | 2.6 |
| Cardinal Health Inc. | Health Care | |
| | Distributors | 2.6 |
| ACE Ltd. | Property & Casualty |
| | Insurance | 2.5 |
| Medtronic Inc. | Health Care | |
| | Equipment | 2.4 |
| Top Ten | | 28.5% |
| The holdings listed exclude any temporary cash investments and equity index products. |
| | |
Investment Focus
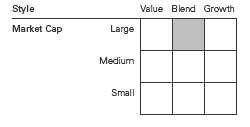
1 The expense ratio shown is from the prospectus dated May 28, 2010, and represents estimated costs for the current fiscal year. For the six months ended July 31, 2010, the annualized expense ratio was 0.36%.
9
Dividend Growth Fund
Performance Summary
All of the returns in this report represent past performance, which is not a guarantee of future results that may be achieved by the fund. (Current performance may be lower or higher than the performance data cited. For performance data current to the most recent month-end, visit our website at www.vanguard.com/performance.) Note, too, that both investment returns and principal value can fluctuate widely, so an investor’s shares, when sold, could be worth more or less than their original cost. The returns shown do not reflect taxes that a shareholder would pay on fund distributions or on the sale of fund shares.
Fiscal-Year Total Returns (%): January 31, 2000, Through July 31, 2010
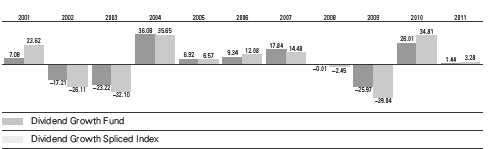
Dividend Growth Spliced Index: Prior to December 6, 2002, the comparative benchmark was known as the Utilities Composite Index. The index weightings were: 40% S&P Utilities Index, 40% S&P Telephone Index, and 20% Lehman Brothers Utility Bond Index through April 30, 1999; 63.75% S&P Utilities Index, 21.25% S&P Telephone Index, and 15% Lehman Brothers Utility Bond Index through March 31, 2000; 75% S&P Utilities Index and 25% S&P Telephone Index through December 31, 2001; and 75% S&P Utilities Index and 25% S&P Integrated Telecommunication Services Index through December 6, 2002. The fund’s benchmark was the Russell 1000 Index through January 31, 2010, after which it was changed to the Dividend Achievers Select Index. The Dividend Achievers Select Ind ex is administered exclusively for Vanguard by Mergent, Inc.
Note: Prior to December 6, 2002, the fund was known as the Utilities Income Fund. For 2011, performance data reflect the six months ended July 31, 2010.
Average Annual Total Returns: Periods Ended June 30, 2010
This table presents average annual total returns through the latest calendar quarter—rather than through the end of the fiscal period. Securities and Exchange Commission rules require that we provide this information.
| | | | |
| | Inception | One | Five | Ten |
| | Date | Year | Years | Years |
| Dividend Growth Fund | 5/15/1992 | 11.77% | 2.60% | 1.38% |
See Financial Highlights for dividend and capital gains information.
10
Dividend Growth Fund
Financial Statements (unaudited)
Statement of Net Assets
As of July 31, 2010
The fund reports a complete list of its holdings in regulatory filings four times in each fiscal year, at the quarter-ends. For the second and fourth fiscal quarters, the lists appear in the fund’s semiannual and annual reports to shareholders. For the first and third fiscal quarters, the fund files the lists with the Securities and Exchange Commission on Form N-Q. Shareholders can look up the fund’s Forms N-Q on the SEC’s website at www.sec.gov. Forms N-Q may also be reviewed and copied at the SEC’s Public Reference Room (see the back cover of this report for further information).
| | |
| | | Market |
| | | Value |
| | Shares | ($000) |
| Common Stocks (95.4%) | | |
| Consumer Discretionary (7.1%) | |
| McDonald’s Corp. | 931,020 | 64,920 |
| Lowe’s Cos. Inc. | 3,008,790 | 62,402 |
| Staples Inc. | 3,019,270 | 61,382 |
| NIKE Inc. Class B | 791,750 | 58,304 |
| | | 247,008 |
| Consumer Staples (16.2%) | | |
| PepsiCo Inc. | 1,383,140 | 89,780 |
| Procter & Gamble Co. | 1,353,910 | 82,805 |
| Sysco Corp. | 2,616,290 | 81,026 |
| Walgreen Co. | 2,642,880 | 75,454 |
| Wal-Mart Stores Inc. | 1,462,370 | 74,859 |
| Kimberly-Clark Corp. | 847,710 | 54,355 |
| Coca-Cola Co. | 971,550 | 53,542 |
| Colgate-Palmolive Co. | 660,430 | 52,161 |
| | | 563,982 |
| Energy (13.1%) | | |
| ConocoPhillips | 1,947,400 | 107,535 |
| BG Group PLC | 5,627,429 | 90,248 |
| Chevron Corp. | 1,015,960 | 77,426 |
| Exxon Mobil Corp. | 1,198,780 | 71,543 |
| Enbridge Inc. | 1,252,500 | 60,922 |
| Schlumberger Ltd. | 823,180 | 49,111 |
| | | 456,785 |
| Financials (7.0%) | | |
| ACE Ltd. | 1,654,940 | 87,844 |
| Wells Fargo & Co. | 2,130,510 | 59,079 |
| Chubb Corp. | 1,057,340 | 55,648 |
| Marsh & | | |
| McLennan Cos. Inc. | 1,774,110 | 41,727 |
| | | 244,298 |
| Health Care (16.0%) | | |
| Johnson & Johnson | 1,961,840 | 113,963 |
| Cardinal Health Inc. | 2,763,560 | 89,180 |
| Medtronic Inc. | 2,254,390 | 83,345 |
| Pfizer Inc. | 5,231,100 | 78,467 |
| | |
| | | Market |
| | | Value |
| | Shares | ($000) |
| ^ AstraZeneca PLC ADR | 1,402,030 | 70,718 |
| Eli Lilly & Co. | 1,796,680 | 63,962 |
| Abbott Laboratories | 1,210,940 | 59,433 |
| | | 559,068 |
| Industrials (14.8%) | | |
| United Parcel Service Inc. | | |
| Class B | 1,688,850 | 109,775 |
| General Dynamics Corp. | 1,267,140 | 77,612 |
| Honeywell | | |
| International Inc. | 1,680,370 | 72,021 |
| Waste Management Inc. | 1,803,230 | 61,220 |
| Lockheed Martin Corp. | 805,340 | 60,521 |
| Emerson Electric Co. | 1,065,920 | 52,806 |
| United Technologies Corp. | 674,500 | 47,957 |
| Illinois Tool Works Inc. | 790,500 | 34,387 |
| | | 516,299 |
| Information Technology (13.9%) | |
| Automatic Data | | |
| Processing Inc. | 2,885,200 | 119,072 |
| International Business | | |
| Machines Corp. | 788,090 | 101,191 |
| Western Union Co. | 4,793,800 | 77,803 |
| Microsoft Corp. | 2,481,920 | 64,058 |
| Accenture PLC Class A | 1,584,380 | 62,805 |
| Oracle Corp. | 2,573,500 | 60,838 |
| | | 485,767 |
| Materials (4.0%) | | |
| Praxair Inc. | 893,740 | 77,594 |
| Ecolab Inc. | 1,277,360 | 62,476 |
| | | 140,070 |
| Telecommunication Services (1.5%) | |
| AT&T Inc. | 1,980,130 | 51,365 |
| |
| Utilities (1.8%) | | |
| Dominion Resources Inc. | 1,449,170 | 60,851 |
| Total Common Stocks | | |
| (Cost $3,152,705) | | 3,325,493 |
11
Dividend Growth Fund
| | |
| | | Market |
| | | Value |
| | Shares | ($000) |
| Temporary Cash Investments (5.3%) | |
| Money Market Fund (0.7%) | |
| 1,2 Vanguard Market | | |
| Liquidity Fund, | | |
| 0.297% | 23,935,000 | 23,935 |
| |
| | Face | |
| | Amount | |
| | ($000) | |
| Repurchase Agreement (4.6%) | |
| Credit Suisse Securities | |
| (USA) LLC 0.210%, | |
| 8/2/10 (Dated 7/30/10, | |
| Repurchase Value | | |
| $162,103,000, | | |
| collateralized by | | |
| Federal Home Loan | |
| Mortgage Corp. | | |
| 3.500%–6.500%, | | |
| 3/1/13–6/1/36) | 162,100 | 162,100 |
| Total Temporary Cash Investments | |
| (Cost $186,035) | | 186,035 |
| Total Investments (100.7%) | |
| (Cost $3,338,740) | | 3,511,528 |
| Other Assets and Liabilities (-0.7%) | |
| Other Assets | | 17,264 |
| Liabilities2 | | (43,077) |
| | | (25,813) |
| Net Assets (100%) | | |
| Applicable to 270,760,368 outstanding | |
| $.001 par value shares of beneficial | |
| interest (unlimited authorization) | 3,485,715 |
| Net Asset Value Per Share | $12.87 |
| |
| At July 31, 2010, net assets consisted of: | |
| | Amount |
| | ($000) |
| Paid-in Capital | 3,418,348 |
| Undistributed Net Investment Income | 2,498 |
| Accumulated Net Realized Losses | (107,957) |
| Unrealized Appreciation (Depreciation) | |
| Investment Securities | 172,788 |
| Foreign Currencies | 38 |
| Net Assets | 3,485,715 |
See Note A in Notes to Financial Statements.
^ Part of security position is on loan to broker-dealers. The total value of securities on loan is $23,218,000.
1 Affiliated money market fund available only to Vanguard funds and certain trusts and accounts managed by Vanguard. Rate shown is the 7-day yield.
2 Includes $23,935,000 of collateral received for securities on loan.
ADR—American Depositary Receipt.
See accompanying Notes, which are an integral part of the Financial Statements.
12
Dividend Growth Fund
Statement of Operations
| |
| | Six Months Ended
July 31, 2010 |
| |
| | ($000) |
| Investment Income | |
| Income | |
| Dividends1 | 43,208 |
| Interest | 137 |
| Security Lending | 41 |
| Total Income | 43,386 |
| Expenses | |
| Investment Advisory Fees—Note B | |
| Basic Fee | 1,753 |
| Performance Adjustment | 561 |
| The Vanguard Group—Note C | |
| Management and Administrative | 2,971 |
| Marketing and Distribution | 402 |
| Custodian Fees | 28 |
| Shareholders’ Reports | 45 |
| Trustees’ Fees and Expenses | 3 |
| Total Expenses | 5,763 |
| Expenses Paid Indirectly | (23) |
| Net Expenses | 5,740 |
| Net Investment Income | 37,646 |
| Realized Net Gain (Loss) | |
| Investment Securities Sold | 22,123 |
| Foreign Currencies | (31) |
| Realized Net Gain (Loss) | 22,092 |
| Change in Unrealized Appreciation (Depreciation) | |
| Investment Securities | (34,056) |
| Foreign Currencies | 38 |
| Change in Unrealized Appreciation (Depreciation) | (34,018) |
| Net Increase (Decrease) in Net Assets Resulting from Operations | 25,720 |
| 1 Dividends are net of foreign withholding taxes of $15,000. | |
See accompanying Notes, which are an integral part of the Financial Statements.
13
Dividend Growth Fund
Statement of Changes in Net Assets
| | |
| | Six Months Ended
July 31,
2010 | Year Ended
January 31,
2010 |
| |
| |
| | ($000) | ($000) |
| Increase (Decrease) in Net Assets | | |
| Operations | | |
| Net Investment Income | 37,646 | 56,033 |
| Realized Net Gain (Loss) | 22,092 | (43,008) |
| Change in Unrealized Appreciation (Depreciation) | (34,018) | 461,001 |
| Net Increase (Decrease) in Net Assets Resulting from Operations | 25,720 | 474,026 |
| Distributions | | |
| Net Investment Income | (34,711) | (56,342) |
| Realized Capital Gain | — | — |
| Total Distributions | (34,711) | (56,342) |
| Capital Share Transactions | | |
| Issued | 947,397 | 1,162,613 |
| Issued in Lieu of Cash Distributions | 29,483 | 47,849 |
| Redeemed | (296,500) | (558,468) |
| Net Increase (Decrease) from Capital Share Transactions | 680,380 | 651,994 |
| Total Increase (Decrease) | 671,389 | 1,069,678 |
| Net Assets | | |
| Beginning of Period | 2,814,326 | 1,744,648 |
| End of Period1 | 3,485,715 | 2,814,326 |
| 1 Net Assets—End of Period includes undistributed (overdistributed) net investment income of $2,498,000 and ($406,000). | |
See accompanying Notes, which are an integral part of the Financial Statements.
14
Dividend Growth Fund
Financial Highlights
| | | | | | |
| Six Months
Ended
July 31,
2010 | | | | | |
| | | | | | |
| For a Share Outstanding | Year Ended January 31, |
| Throughout Each Period | 2010 | 2009 | 2008 | 2007 | 2006 |
| Net Asset Value, Beginning of Period | $12.82 | $10.42 | $14.38 | $14.74 | $12.75 | $11.89 |
| Investment Operations | | | | | | |
| Net Investment Income | .142 | .291 | .264 | .290 | .260 | .220 |
| Net Realized and Unrealized Gain (Loss) | | | | | | |
| on Investments | .039 | 2.401 | (3.960) | (.270) | 1.990 | .880 |
| Total from Investment Operations | .181 | 2.692 | (3.696) | .020 | 2.250 | 1.100 |
| Distributions | | | | | | |
| Dividends from Net Investment Income | (.131) | (.292) | (.264) | (.280) | (.260) | (.240) |
| Distributions from Realized Capital Gains | — | — | — | (.100) | — | — |
| Total Distributions | (.131) | (.292) | (.264) | (.380) | (.260) | (.240) |
| Net Asset Value, End of Period | $12.87 | $12.82 | $10.42 | $14.38 | $14.74 | $12.75 |
| |
| Total Return1 | 1.44% | 26.01% | -25.97% | -0.01% | 17.84% | 9.34% |
| |
| Ratios/Supplemental Data | | | | | | |
| Net Assets, End of Period (Millions) | $3,486 | $2,814 | $1,745 | $1,326 | $1,243 | $995 |
| Ratio of Total Expenses to | | | | | | |
| Average Net Assets2 | 0.36%3 | 0.38% | 0.36% | 0.32% | 0.38% | 0.37% |
| Ratio of Net Investment Income to | | | | | | |
| Average Net Assets | 2.33%3 | 2.59% | 2.25% | 1.91% | 1.93% | 1.85% |
| Portfolio Turnover Rate | 20%3 | 24% | 28% | 36% | 41% | 16% |
1 Total returns do not include the account service fee that may be applicable to certain accounts with balances below $10,000.2 Includes performance-based investment advisory fee increases (decreases) of 0.03%, 0.03%, 0.03%, 0.00%, 0.01%, and 0.01%.3 Annualized.See accompanying Notes, which are an integral part of the Financial Statements.
15
Dividend Growth Fund
Notes to Financial Statements
Vanguard Dividend Growth Fund is registered under the Investment Company Act of 1940 as an open-end investment company, or mutual fund.
A. The following significant accounting policies conform to generally accepted accounting principles for U.S. mutual funds. The fund consistently follows such policies in preparing its financial statements.
1. Security Valuation: Securities are valued as of the close of trading on the New York Stock Exchange (generally 4 p.m., Eastern time) on the valuation date. Equity securities are valued at the latest quoted sales prices or official closing prices taken from the primary market in which each security trades; such securities not traded on the valuation date are valued at the mean of the latest quoted bid and asked prices. Securities for which market quotations are not readily available, or whose values have been affected by events occurring before the fund’s pricing time but after the close of the securities’ primary markets, are valued at their fair values calculated according to procedures adopted by the board of trustees. These procedures include obtaining quotations from an independent pricing service, monitoring news to identify significant market- or security-specific events, and evaluating changes in the values of foreign market proxi es (for example, ADRs, futures contracts, or exchange-traded funds), between the time the foreign markets close and the fund’s pricing time. When fair-value pricing is employed, the prices of securities used by a fund to calculate its net asset value may differ from quoted or published prices for the same securities. Investments in Vanguard Market Liquidity Fund are valued at that fund’s net asset value. Temporary cash investments acquired over 60 days to maturity are valued using the latest bid prices or using valuations based on a matrix system (which considers such factors as security prices, yields, maturities, and ratings), both as furnished by independent pricing services. Other temporary cash investments are valued at amortized cost, which approximates market value.
2. Foreign Currency: Securities and other assets and liabilities denominated in foreign currencies are translated into U.S. dollars using exchange rates obtained from an independent third party as of the fund’s pricing time on the valuation date. Realized gains (losses) and unrealized appreciation (depreciation) on investment securities include the effects of changes in exchange rates since the securities were purchased, combined with the effects of changes in security prices. Fluctuations in the value of other assets and liabilities resulting from changes in exchange rates are recorded as unrealized foreign currency gains (losses) until the assets or liabilities are settled in cash, at which time they are recorded as realized foreign currency gains (losses).
3. Repurchase Agreements: The fund may invest in repurchase agreements. Securities pledged as collateral for repurchase agreements are held by a custodian bank until the agreements mature. Each agreement requires that the market value of the collateral be sufficient to cover payments of interest and principal; however, in the event of default or bankruptcy by the other party to the agreement, retention of the collateral may be subject to legal proceedings.
4. Federal Income Taxes: The fund intends to continue to qualify as a regulated investment company and distribute all of its taxable income. Management has analyzed the fund’s tax positions taken for all open federal income tax years (January 31, 2007–2010), and for the period ended July 31, 2010, and has concluded that no provision for federal income tax is required in the fund’s financial statements.
5. Distributions: Distributions to shareholders are recorded on the ex-dividend date.
6. Security Lending: The fund may lend its securities to qualified institutional borrowers to earn additional income. Security loans are required to be secured at all times by collateral at least equal to the market value of securities loaned. The fund invests cash collateral received in Vanguard Market
16
Dividend Growth Fund
Liquidity Fund, and records a liability for the return of the collateral, during the period the securities are on loan. Security lending income represents the income earned on investing cash collateral, less expenses associated with the loan.
7. Other: Dividend income is recorded on the ex-dividend date. Interest income is accrued daily. Security transactions are accounted for on the date securities are bought or sold. Costs used to determine realized gains (losses) on the sale of investment securities are those of the specific securities sold.
B. Wellington Management Company, LLP, provides investment advisory services to the fund for a fee calculated at an annual percentage rate of average net assets. The basic fee is subject to quarterly adjustments based on the fund’s performance for the preceding three years relative to the Russell 1000 Index for periods prior to February 1, 2010, and the current benchmark, the Dividend Achievers Select Index, beginning February 1, 2010. The benchmark change will be fully phased in by January 2013. For the six months ended July 31, 2010, the investment advisory fee represented an effective annual basic rate of 0.11% of the fund’s average net assets before an increase of $561,000 (0.03%) based on performance.
C. The Vanguard Group furnishes at cost corporate management, administrative, marketing, and distribution services. The costs of such services are allocated to the fund under methods approved by the board of trustees. The fund has committed to provide up to 0.40% of its net assets in capital contributions to Vanguard. At July 31, 2010, the fund had contributed capital of $638,000 to Vanguard (included in Other Assets), representing 0.02% of the fund’s net assets and 0.26% of Vanguard’s capitalization. The fund’s trustees and officers are also directors and officers of Vanguard.
D. The fund has asked its investment advisor to direct certain security trades, subject to obtaining the best price and execution, to brokers who have agreed to rebate to the fund part of the commissions generated. Such rebates are used solely to reduce the fund’s management and administrative expenses. For the six months ended July 31, 2010, these arrangements reduced the fund’s expenses by $23,000 (an annual rate of 0.00% of average net assets).
E. Various inputs may be used to determine the value of the fund’s investments. These inputs are summarized in three broad levels for financial statement purposes. The inputs or methodologies used to value securities are not necessarily an indication of the risk associated with investing in those securities.
Level 1—Quoted prices in active markets for identical securities.
Level 2—Other significant observable inputs (including quoted prices for similar securities, interest rates, prepayment speeds, credit risk, etc.).
Level 3—Significant unobservable inputs (including the fund’s own assumptions used to determine the fair value of investments).
The following table summarizes the fund’s investments as of July 31, 2010, based on the inputs used to value them:
| | | |
| | Level 1 | Level 2 | Level 3 |
| Investments | ($000) | ($000) | ($000) |
| Common Stocks | 3,235,245 | 90,248 | — |
| Temporary Cash Investments | 23,935 | 162,100 | — |
| Total | 3,259,180 | 252,348 | — |
17
Dividend Growth Fund
F. Distributions are determined on a tax basis and may differ from net investment income and realized capital gains for financial reporting purposes. Differences may be permanent or temporary. Permanent differences are reclassified among capital accounts in the financial statements to reflect their tax character. Temporary differences arise when certain items of income, expense, gain, or loss are recognized in different periods for financial statement and tax purposes; these differences will reverse at some time in the future. Differences in classification may also result from the treatment of short-term gains as ordinary income for tax purposes.
During the six months ended July 31, 2010, the fund realized net foreign currency losses of $31,000, which decreased distributable net income for tax purposes; accordingly, such losses have been reclassified from accumulated net realized losses to undistributed net investment income.
The fund’s tax-basis capital gains and losses are determined only at the end of each fiscal year. For tax purposes, at January 31, 2010, the fund had available capital loss carryforwards totaling $129,664,000 to offset future net capital gains of $17,975,000 through January 31, 2017, and $111,689,000 through January 31, 2018. The fund will use these capital losses to offset net taxable capital gains, if any, realized during the year ending January 31, 2011; should the fund realize net capital losses for the year, the losses will be added to the loss carryforward balance above.
At July 31, 2010, the cost of investment securities for tax purposes was $3,338,740,000. Net unrealized appreciation of investment securities for tax purposes was $172,788,000, consisting of unrealized gains of $243,870,000 on securities that had risen in value since their purchase and $71,082,000 in unrealized losses on securities that had fallen in value since their purchase.
G. During the six months ended July 31, 2010, the fund purchased $949,419,000 of investment securities and sold $301,807,000 of investment securities, other than temporary cash investments.
H. Capital shares issued and redeemed were:
| | |
| | Six Months Ended | Year Ended |
| | July 31, 2010 | January 31, 2010 |
| | Shares | Shares |
| | (000) | (000) |
| Issued | 71,573 | 97,395 |
| Issued in Lieu of Cash Distributions | 2,361 | 3,923 |
| Redeemed | (22,667) | (49,252) |
| Net Increase (Decrease) in Shares Outstanding | 51,267 | 52,066 |
I. In preparing the financial statements as of July 31, 2010, management considered the impact of subsequent events for potential recognition or disclosure in these financial statements.
18
About Your Fund’s Expenses
As a shareholder of the fund, you incur ongoing costs, which include costs for portfolio management, administrative services, and shareholder reports (like this one), among others. Operating expenses, which are deducted from a fund’s gross income, directly reduce the investment return of the fund.
A fund’s expenses are expressed as a percentage of its average net assets. This figure is known as the expense ratio. The following examples are intended to help you understand the ongoing costs (in dollars) of investing in your fund and to compare these costs with those of other mutual funds. The examples are based on an investment of $1,000 made at the beginning of the period shown and held for the entire period.
The accompanying table illustrates your fund’s costs in two ways:
• Based on actual fund return. This section helps you to estimate the actual expenses that you paid over the period. The ”Ending Account Value“ shown is derived from the fund‘s actual return, and the third column shows the dollar amount that would have been paid by an investor who started with $1,000 in the fund. You may use the information here, together with the amount you invested, to estimate the expenses that you paid over the period.
To do so, simply divide your account value by $1,000 (for example, an $8,600 account value divided by $1,000 = 8.6), then multiply the result by the number given for your fund under the heading ”Expenses Paid During Period.“
• Based on hypothetical 5% yearly return. This section is intended to help you compare your fund‘s costs with those of other mutual funds. It assumes that the fund had a yearly return of 5% before expenses, but that the expense ratio is unchanged. In this case—because the return used is not the fund’s actual return—the results do not apply to your investment. The example is useful in making comparisons because the Securities and Exchange Commission requires all mutual funds to calculate expenses based on a 5% return. You can assess your fund’s costs by comparing this hypothetical example with the hypothetical examples that appear in shareholder reports of other funds.
Note that the expenses shown in the table are meant to highlight and help you compare ongoing costs only and do not reflect transaction costs incurred by the fund for buying and selling securities. Further, the expenses do not include the account service fee described in the prospectus. If such a fee were applied to your account, your costs would be higher. Your fund does not charge transaction fees, such as purchase or redemption fees, nor does it carry a “sales load.” The calculations assume no shares were bought or sold during the period. Your actual costs may have been higher or lower, depending on the amount of your investment and the timing of any purchases or redemptions.
You can find more information about the fund’s expenses, including annual expense ratios, in the Financial Statements section of this report. For additional information on operating expenses and other shareholder costs, please refer to your fund’s current prospectus.
19
| | | |
| Six Months Ended July 31, 2010 | | | |
| | Beginning | Ending | Expenses |
| | Account Value | Account Value | Paid During |
| Dividend Growth Fund | 1/31/2010 | 7/31/2010 | Period |
| Based on Actual Fund Return | $1,000.00 | $1,014.43 | $1.80 |
| Based on Hypothetical 5% Yearly Return | 1,000.00 | 1,023.01 | 1.81 |
The calculations are based on expenses incurred in the most recent six-month period. The fund’s annualized six-month expense ratio for that period is 0.36%. The dollar amounts shown as “Expenses Paid” are equal to the annualized expense ratio multiplied by the average account value over the period, multiplied by the number of days in the most recent six-month period, then divided by the number of days in the most recent 12-month period.20
Glossary
30-Day SEC Yield. A fund’s 30-day SEC yield is derived using a formula specified by the U.S. Securities and Exchange Commission. Under the formula, data related to the fund’s security holdings in the previous 30 days are used to calculate the fund’s hypothetical net income for that period, which is then annualized and divided by the fund’s estimated average net assets over the calculation period. For the purposes of this calculation, a security’s income is based on its current market yield to maturity (in the case of bonds) or its projected dividend yield (for stocks). Because the SEC yield represents hypothetical annualized income, it will differ—at times significantly—from the fund’s actual experience. As a result, the fund’s income distributions may be higher or lower than implied by the SEC yield.
Beta. A measure of the magnitude of a fund’s past share-price fluctuations in relation to the ups and downs of a given market index. The index is assigned a beta of 1.00. Compared with a given index, a fund with a beta of 1.20 typically would have seen its share price rise or fall by 12% when the index rose or fell by 10%. For this report, beta is based on returns over the past 36 months for both the fund and the index. Note that a fund’s beta should be reviewed in conjunction with its R-squared (see definition). The lower the R-squared, the less correlation there is between the fund and the index, and the less reliable beta is as an indicator of volatility.
Dividend Yield. Dividend income earned by stocks, expressed as a percentage of the aggregate market value (or of net asset value, for a fund). The yield is determined by dividing the amount of the annual dividends by the aggregate value (or net asset value) at the end of the period. For a fund, the dividend yield is based solely on stock holdings and does not include any income produced by other investments.
Earnings Growth Rate. The average annual rate of growth in earnings over the past five years for the stocks now in a fund.
Equity Exposure. A measure that reflects a fund’s investments in stocks and stock futures. Any holdings in short-term reserves are excluded.
Expense Ratio. The percentage of a fund’s average net assets used to pay its annual administrative and advisory expenses. These expenses directly reduce returns to investors.
Foreign Holdings. The percentage of a fund represented by stocks or depositary receipts of companies based outside the United States.
Inception Date. The date on which the assets of a fund (or one of its share classes) are first invested in accordance with the fund’s investment objective. For funds with a subscription period, the inception date is the day after that period ends. Investment performance is measured from the inception date.
Median Market Cap. An indicator of the size of companies in which a fund invests; the midpoint of market capitalization (market price x shares outstanding) of a fund’s stocks, weighted by the proportion of the fund’s assets invested in each stock. Stocks representing half of the fund’s assets have market capitalizations above the median, and the rest are below it.
Price/Book Ratio. The share price of a stock divided by its net worth, or book value, per share. For a fund, the weighted average price/book ratio of the stocks it holds.
21
Price/Earnings Ratio. The ratio of a stock’s current price to its per-share earnings over the past year. For a fund, the weighted average P/E of the stocks it holds. P/E is an indicator of market expectations about corporate prospects; the higher the P/E, the greater the expectations for a company’s future growth.
R-Squared. A measure of how much of a fund’s past returns can be explained by the returns from the market in general, as measured by a given index. If a fund’s total returns were precisely synchronized with an index’s returns, its R-squared would be 1.00. If the fund’s returns bore no relationship to the index’s returns, its R-squared would be 0. For this report, R-squared is based on returns over the past 36 months for both the fund and the index.
Return on Equity. The annual average rate of return generated by a company during the past five years for each dollar of shareholder’s equity (net income divided by shareholder’s equity). For a fund, the weighted average return on equity for the companies whose stocks it holds.
Short-Term Reserves. The percentage of a fund invested in highly liquid, short-term securities that can be readily converted to cash.
Turnover Rate. An indication of the fund’s trading activity. Funds with high turnover rates incur higher transaction costs and may be more likely to distribute capital gains (which may be taxable to investors). The turnover rate excludes in-kind transactions, which have minimal impact on costs.
22
This page intentionally left blank.
The People Who Govern Your Fund
The trustees of your mutual fund are there to see that the fund is operated and managed in your best interests since, as a shareholder, you are a part owner of the fund. Your fund’s trustees also serve on the board of directors of The Vanguard Group, Inc., which is owned by the Vanguard funds and provides services to them on an at-cost basis.
A majority of Vanguard’s board members are independent, meaning that they have no affiliation with Vanguard or the funds they oversee, apart from the sizable personal investments they have made as private individuals. The independent board members have distinguished backgrounds in business, academia, and public service. Each of the trustees and executive officers oversees 162 Vanguard funds.
The following table provides information for each trustee and executive officer of the fund. More information about the trustees is in the Statement of Additional Information, which can be obtained, without charge, by contacting Vanguard at 800-662-7447, or online at www.vanguard.com.
| |
| Interested Trustee1 | Amy Gutmann |
| | Born 1949. Trustee Since June 2006. Principal |
| F. William McNabb III | Occupation(s) During the Past Five Years: President |
| Born 1957. Trustee Since July 2009. Chairman of the | of the University of Pennsylvania; Christopher H. |
| Board. Principal Occupation(s) During the Past Five | Browne Distinguished Professor of Political Science |
| Years: Chairman of the Board of The Vanguard Group, | in the School of Arts and Sciences with secondary |
| Inc., and of each of the investment companies served | appointments at the Annenberg School for Commu- |
| by The Vanguard Group, since January 2010; Director | nication and the Graduate School of Education of |
| of The Vanguard Group since 2008; Chief Executive | the University of Pennsylvania; Director of Carnegie |
| Officer and President of The Vanguard Group and of | Corporation of New York, Schuylkill River Development |
| each of the investment companies served by The | Corporation, and Greater Philadelphia Chamber of |
| Vanguard Group since 2008; Director of Vanguard | Commerce; Trustee of the National Constitution Center; |
| Marketing Corporation; Managing Director of The | Chair of the Presidential Commission for the Study of |
| Vanguard Group (1995–2008). | Bioethical Issues. |
| |
| | JoAnn Heffernan Heisen |
| Independent Trustees | Born 1950. Trustee Since July 1998. Principal |
| | Occupation(s) During the Past Five Years: Corporate |
| Emerson U. Fullwood | Vice President and Chief Global Diversity Officer since |
| Born 1948. Trustee Since January 2008. Principal | 2006 (retired 2008) and Member of the Executive |
| Occupation(s) During the Past Five Years: Executive | Committee (retired 2008) of Johnson & Johnson |
| Chief Staff and Marketing Officer for North America | (pharmaceuticals/consumer products); Vice President |
| and Corporate Vice President (retired 2008) of Xerox | and Chief Information Officer of Johnson & Johnson |
| Corporation (document management products and | (1997–2005); Director of the University Medical Center |
| services); Director of SPX Corporation (multi-industry | at Princeton and Women’s Research and Education |
| manufacturing), the United Way of Rochester, | Institute; Member of the Advisory Board of the |
| Amerigroup Corporation (managed health care), | Maxwell School of Citizenship and Public Affairs |
| the University of Rochester Medical Center, and | at Syracuse University. |
| Monroe Community College Foundation. | |
| | F. Joseph Loughrey |
| Rajiv L. Gupta | Born 1949. Trustee Since October 2009. Principal |
| Born 1945. Trustee Since December 2001.2 | Occupation(s) During the Past Five Years: President |
| Principal Occupation(s) During the Past Five Years: | and Chief Operating Officer since 2005 (retired 2009) |
| Chairman and Chief Executive Officer (retired 2009) | and Vice Chairman of the Board (2008–2009) of |
| and President (2006–2008) of Rohm and Haas Co. | Cummins Inc. (industrial machinery); Director of |
| (chemicals); Director of Tyco International, Ltd. | SKF AB (industrial machinery), Hillenbrand, Inc. |
| (diversified manufacturing and services) and Hewlett- | (specialized consumer services), Sauer-Danfoss Inc. |
| Packard Co. (electronic computer manufacturing); | (machinery), the Lumina Foundation for Education, |
| Trustee of The Conference Board; Member of the | and Oxfam America; Chairman of the Advisory Council |
| Board of Managers of Delphi Automotive LLP | for the College of Arts and Letters at the University of |
| (automotive components). | Notre Dame. |
| | |
| André F. Perold | Kathryn J. Hyatt | |
| Born 1952. Trustee Since December 2004. Principal | Born 1955. Treasurer Since November 2008. Principal |
| Occupation(s) During the Past Five Years: George | Occupation(s) During the Past Five Years: Principal |
| Gund Professor of Finance and Banking at the Harvard | of The Vanguard Group, Inc.; Treasurer of each of |
| Business School; Chair of the Investment Committee | the investment companies served by The Vanguard |
| of HighVista Strategies LLC (private investment firm). | Group since 2008; Assistant Treasurer of each of the |
| | investment companies served by The Vanguard Group |
| Alfred M. Rankin, Jr. | (1988–2008). | |
| Born 1941. Trustee Since January 1993. Principal | | |
| Occupation(s) During the Past Five Years: Chairman, | Heidi Stam | |
| President, and Chief Executive Officer of NACCO | Born 1956. Secretary Since July 2005. Principal |
| Industries, Inc. (forklift trucks/housewares/lignite); | Occupation(s) During the Past Five Years: Managing |
| Director of Goodrich Corporation (industrial products/ | Director of The Vanguard Group, Inc., since 2006; |
| aircraft systems and services); Chairman of the Federal | General Counsel of The Vanguard Group since 2005; |
| Reserve Bank of Cleveland; Trustee of The Cleveland | Secretary of The Vanguard Group and of each of the |
| Museum of Art. | investment companies served by The Vanguard Group |
| | since 2005; Director and Senior Vice President of |
| Peter F. Volanakis | Vanguard Marketing Corporation since 2005; |
| Born 1955. Trustee Since July 2009. Principal | Principal of The Vanguard Group (1997–2006). |
| Occupation(s) During the Past Five Years: President | | |
| since 2007 and Chief Operating Officer since 2005 | Vanguard Senior Management Team |
| of Corning Incorporated (communications equipment); | | |
| President of Corning Technologies (2001–2005); | R. Gregory Barton | Michael S. Miller |
| Director of Corning Incorporated and Dow Corning; | Mortimer J. Buckley | James M. Norris |
| Trustee of the Corning Incorporated Foundation and | Kathleen C. Gubanich | Glenn W. Reed |
| the Corning Museum of Glass; Overseer of the | Paul A. Heller | George U. Sauter |
| Amos Tuck School of Business Administration at | | |
| Dartmouth College. | | |
| | Chairman Emeritus and Senior Advisor |
| |
| Executive Officers | John J. Brennan | |
| | Chairman, 1996–2009 | |
| Glenn Booraem | Chief Executive Officer and President, 1996–2008 |
| Born 1967. Controller Since July 2010. Principal | | |
| Occupation(s) During the Past Five Years: Principal | | |
| of The Vanguard Group, Inc.; Controller of each of | Founder | |
| the investment companies served by The Vanguard | | |
| Group since 2010; Assistant Controller of each of | John C. Bogle | |
| the investment companies served by The Vanguard | Chairman and Chief Executive Officer, 1974–1996 |
| Group (2001–2010). | | |
| |
| Thomas J. Higgins | | |
| Born 1957. Chief Financial Officer Since September | | |
| 2008. Principal Occupation(s) During the Past Five | | |
| Years: Principal of The Vanguard Group, Inc.; Chief | | |
| Financial Officer of each of the investment companies | | |
| served by The Vanguard Group since 2008; Treasurer | | |
| of each of the investment companies served by The | | |
| Vanguard Group (1998–2008). | | |
1 Mr. McNabb is considered an “interested person,” as defined in the Investment Company Act of 1940, because he is an officer of the Vanguard funds.
2 December 2002 for Vanguard Equity Income Fund, Vanguard Growth Equity Fund, the Vanguard Municipal Bond Funds, and the Vanguard State Tax-Exempt Funds.
|  |
| P.O. Box 2600 |
| Valley Forge, PA 19482-2600 |
Connect with Vanguard® > Vanguard.com
| |
| Fund Information > 800-662-7447 | |
| Direct Investor Account Services > 800-662-2739 | |
| Institutional Investor Services > 800-523-1036 | |
| Text Telephone for People | |
| With Hearing Impairment > 800-749-7273 | |
| |
| This material may be used in conjunction | |
| with the offering of shares of any Vanguard | |
| fund only if preceded or accompanied by | |
| the fund’s current prospectus. | |
| |
| All comparative mutual fund data are from Lipper Inc. or | |
| Morningstar, Inc., unless otherwise noted. | |
| |
| You can obtain a free copy of Vanguard’s proxy voting | |
| guidelines by visiting vanguard.com/proxyreporting or by | |
| calling Vanguard at 800-662-2739. The guidelines are | |
| also available from the SEC’s website, sec.gov. In | |
| addition, you may obtain a free report on how your fund | |
| voted the proxies for securities it owned during the 12 | |
| months ended June 30. To get the report, visit either | |
| vanguard.com/proxyreporting or sec.gov. | |
| |
| You can review and copy information about your fund at | |
| the SEC’s Public Reference Room in Washington, D.C. To | |
| find out more about this public service, call the SEC at | |
| 202-551-8090. Information about your fund is also | |
| available on the SEC’s website, and you can receive | |
| copies of this information, for a fee, by sending a | |
| request in either of two ways: via e-mail addressed to | |
| publicinfo@sec.gov or via regular mail addressed to the | |
| Public Reference Section, Securities and Exchange | |
| Commission, Washington, DC 20549-1520. | |
| |
| |
| | © 2010 The Vanguard Group, Inc. |
| | All rights reserved. |
| | Vanguard Marketing Corporation, Distributor. |
| |
| | Q572 092010 |
 |
|
| Vanguard Dividend Appreciation |
| Index Fund Semiannual Report |
|
| July 31, 2010 |
 |
|
> For the fiscal half-year ended July 31, 2010, Vanguard Dividend Appreciation Index Fund returned about 3%.
> The fund’s performance closely tracked that of its target index and bettered the average return of its peers.
> The industrials, consumer discretionary, and materials sectors contributed the most to the fund’s results. Health care was the only sector to post a negative return.
| |
| Contents | |
| Your Fund’s Total Returns. | 1 |
| Chairman’s Letter. | 2 |
| Fund Profile. | 6 |
| Performance Summary. | 7 |
| Financial Statements. | 8 |
| About Your Fund’s Expenses. | 18 |
| Trustees Approve Advisory Arrangement. | 20 |
| Glossary. | 21 |
Please note: The opinions expressed in this report are just that—informed opinions. They should not be considered promises or advice.
Also, please keep in mind that the information and opinions cover the period through the date on the front of this report. Of course, the risks of investing in your fund are spelled out in the prospectus.
See the Glossary for definitions of investment terms used in this report.
Cover photograph: Veronica Coia.
Your Fund’s Total Returns
| |
| Six Months Ended July 31, 2010 | |
| | Total |
| | Returns |
| Vanguard Dividend Appreciation Index Fund | |
| Investor Shares | 3.26% |
| ETF Shares | |
| Market Price | 3.33 |
| Net Asset Value | 3.29 |
| Dividend Achievers Select Index | 3.28 |
| Large-Cap Core Funds Average | 2.07 |
| Large-Cap Core Funds Average: Derived from data provided by Lipper Inc. | |
The Vanguard ETF® Shares shown are traded on the NYSE Arca exchange and are available only through brokers. The table provides ETF returns based on both the NYSE Arca market price and the net asset value for a share. U.S. Pat. No. 6,879,964 B2; 7,337,138.
| | | | |
| Your Fund’s Performance at a Glance | | | | |
| January 31, 2010, Through July 31, 2010 | | | | |
| | | | Distributions Per Share |
| | Starting | Ending | Income | Capital |
| | Share Price | Share Price | Dividends | Gains |
| Vanguard Dividend Appreciation Index Fund | | | | |
| Investor Shares | $18.33 | $18.75 | $0.178 | $0.000 |
| ETF Shares | 45.81 | 46.84 | 0.475 | 0.000 |
1

Chairman’s Letter
Dear Shareholder,
Vanguard Dividend Appreciation Index Fund returned about 3% for the six months ended July 31, 2010. This result closely tracked the return of its benchmark, the Dividend Achievers Select Index, and was more than 1 percentage point ahead of the average return of its peer group.
A year ago, the fund’s return was powered by banks and brokerages, which were rebounding from their financial-crisis lows. Such was not the case this year. Because many of these companies have cut their dividends in the past year, their weighting in the index—and the fund—is now much smaller, limiting their impact on the fund’s performance.
Instead, the fund’s returns were driven by its sizable industrials sector, which turned in strong six-month results. Consumer discretionary and materials stocks were also strong performers. Health care stocks notched the poorest results as many pharmaceutical and medical equipment companies struggled.
Stock markets moved higher but the journey was tense
Global stock markets emerged from a turbulent six-month stretch with respect- able single-digit gains. Prices rallied in early spring, buoyed by rapid growth in corporate
2
earnings, but fell sharply in May and June as Europe’s sovereign debt crisis took center stage. Signs that the U.S. economic recovery might be sputtering also dampened investor spirits. By the end of the six-month period, however, stock markets had recouped the previous months’ losses as corporate bellwethers continued to report strong profits, and investors’ moods brightened.
For the full period, the U.S. stock market returned more than 4%. Smaller-company stocks, which are less exposed to global turmoil than are large-cap multinationals, returned about 9%. International stocks finished the period with a modestly positive return, as strong performance from emerging markets compensated for weaker returns in Europe.
High-quality bonds rallied amid the search for safety
Turmoil in the stock markets and mixed economic signals drove bond prices higher, and yields lower, as investors sought safety in high-quality government and corporate bonds. At the start of the period, the yield of the benchmark 10-year U.S. Treasury note stood at 3.61%. By the end of the period, it had dipped to 2.91%, and the rates on home-mortgage loans were at their lowest levels since the 1950s.
Rising bond prices led to strong six-month returns in both the taxable and municipal bond markets. The returns from money market instruments, by contrast, remained vanishingly small. Yields have hovered near
| | | |
| Market Barometer | | | |
| |
| | | | Total Returns |
| | | Periods Ended July 31, 2010 |
| | Six | One | Five Years |
| | Months | Year | (Annualized) |
| Stocks | | | |
| Russell 1000 Index (Large-caps) | 3.84% | 14.51% | 0.02% |
| Russell 2000 Index (Small-caps) | 8.79 | 18.43 | 0.47 |
| Dow Jones U.S. Total Stock Market Index | 4.48 | 15.36 | 0.45 |
| MSCI All Country World Index ex USA (International) | 2.26 | 10.12 | 4.89 |
| |
| Bonds | | | |
| Barclays Capital U.S. Aggregate Bond Index (Broad | | | |
| taxable market) | 4.85% | 8.91% | 5.96% |
| Barclays Capital Municipal Bond Index | 4.06 | 9.15 | 4.75 |
| Citigroup Three-Month U.S. Treasury Bill Index | 0.06 | 0.12 | 2.58 |
| |
| CPI | | | |
| Consumer Price Index | 0.61% | 1.24% | 2.21% |
3
0% since late 2008, when the Federal Reserve Board set its target for short-term interest rates between 0% and 0.25%.
Industrial stocks lifted the index’s return
Following the 2007–2009 financial crisis, many companies tightened their belts, reconfigured balance sheets, and performed well. This year, as the economy has slowly ground into gear, corporate earnings have improved, setting the stage for a dividend recovery.
Despite a few big bumps in the stock market in the spring, the improved earnings climate helped produce solid, if not spectacular, returns across a wide range of sectors. Industrials were notably strong performers, contributing about2 percentage points to the index’s total return. Farm and industrial machinery manufacturers, electrical equipment makers, and industrial conglomerates performed well, buoyed by increased global demand for their products.
Consumer discretionary stocks also were strong contributors, bolstered by double-digit returns from a fast-food chain and discount retailers. Materials, one of the smaller sectors in the index, also helped, thanks to the performance of specialty chemical manufacturers and makers of industrial gases.
Consumer staples, the index’s largest sector—representing about a quarter of its assets, on average—was the fourth-largest contributor for the half-year.
| | | |
| Expense Ratios | | | |
| Your Fund Compared With Its Peer Group | | | |
| |
| | Investor | ETF | Peer Group |
| | Shares | Shares | Average |
| Dividend Appreciation Index Fund | 0.35% | 0.23% | 1.27% |
The fund expense ratios shown are from the prospectus dated May 28, 2010, and represent estimated costs for the current fiscal year. For the six months ended July 31, 2010, the fund’s annualized expense ratios were 0.31% for Investor Shares and 0.19% for ETF Shares. The peer-group expense ratio is derived from data provided by Lipper Inc. and captures information through year-end 2009.
Peer group: Large-Cap Core Funds.
4
Pockets of strength in industries such as beverages and food distribution were offset by patches of weakness in retailing.
The only index sector that produced a negative return was health care, which has been beset by a variety of product and regulatory challenges.
Diversify your portfolio, and focus on the long term
After an unusually tough stretch for dividend investors, the climate seems to have improved, with many companies announcing increases in their payouts. This is welcome news for investors looking for steady income, especially as yields have shriveled on the traditional— and lower-risk—sources of yield such as bond and money market funds.
While some corporate earnings have bounced back during the past six months, and prices have been creeping higher in fits and starts, the direction of the stock market is never a certainty. And its swings from time to time should not influence your investment strategy.
Regardless of short-term market conditions, we suggest you develop a portfolio that is consistent with your long-term goals, time horizon, and tolerance for the market’s unavoidable peaks and valleys. As always, Vanguard encourages investors to maintain a balanced allocation of low-cost stock, bond, and short-term investments.
While it’s impossible to completely shield yourself from market gyrations, you can cushion your assets from the brunt of wild swings by diversifying your holdings among and within different asset classes. Vanguard Dividend Appreciation Fund, with its low-cost exposure to large-cap, dividend-paying stocks, can play an important role in such a balanced portfolio.
Thank you for entrusting your assets to Vanguard.
Sincerely,

F. William McNabb III
Chairman and Chief Executive Officer
August 12, 2010
5
Dividend Appreciation Index Fund
Fund Profile
As of July 31, 2010
| | | |
| Share-Class Characteristics | | |
| |
| | Investor | | ETF |
| | Shares | | Shares |
| Ticker Symbol | VDAIX | | VIG |
| Expense Ratio1 | 0.35% | | 0.23% |
| 30-Day SEC Yield | 2.06% | | 2.18% |
| |
| Portfolio Characteristics | | |
| | Dividend | DJ |
| | Achievers | U.S. Total |
| | | Select | Market |
| | Fund | Index | Index |
| Number of Stocks | 142 | 142 | 4,101 |
| Median Market Cap | $40.7B | $40.7B | $27.0B |
| Price/Earnings Ratio | 15.1x | 15.1x | 17.4x |
| Price/Book Ratio | 2.9x | 2.9x | 2.0x |
| Return on Equity | 25.8% | 25.8% | 19.0% |
| Earnings Growth Rate | 7.9% | 7.9% | 6.7% |
| Dividend Yield | 2.6% | 2.6% | 1.9% |
| Foreign Holdings | 0.0% | 0.0% | 0.0% |
| Turnover Rate | | | |
| (Annualized) | 2% | — | — |
| Short-Term Reserves | 0.0% | — | — |
| |
| Sector Diversification (% of equity exposure) |
| | Dividend | DJ |
| | Achievers | U.S. Total |
| | | Select | Market |
| | Fund | Index | Index |
| Consumer | | | |
| Discretionary | 11.8% | 11.8% | 11.5% |
| Consumer Staples | 25.3 | 25.3 | 10.3 |
| Energy | 10.3 | 10.3 | 9.6 |
| Financials | 6.5 | 6.5 | 17.5 |
| Health Care | 13.3 | 13.3 | 11.0 |
| Industrials | 19.5 | 19.5 | 11.1 |
| Information | | | |
| Technology | 6.0 | 6.0 | 18.7 |
| Materials | 5.7 | 5.7 | 4.1 |
| Telecommunication | | | |
| Services | 0.2 | 0.2 | 2.7 |
| Utilities | 1.4 | 1.4 | 3.5 |
| | |
| Volatility Measures | | |
| | Dividend | DJ |
| | Achievers | U.S. Total |
| | Select | Market |
| | Index | Index |
| R-Squared | 1.00 | 0.93 |
| Beta | 1.00 | 0.79 |
| These measures show the degree and timing of the fund’s fluctuations compared with the indexes over 36 months. |
|
| |
| Ten Largest Holdings (% of total net assets) |
| PepsiCo Inc. | Soft Drinks | 4.4% |
| McDonald's Corp. | Restaurants | 4.1 |
| Chevron Corp. | Integrated Oil & | |
| | Gas | 4.1 |
| International Business | IT Consulting & | |
| Machines Corp. | Other Services | 4.0 |
| Coca-Cola Co. | Soft Drinks | 4.0 |
| Procter & Gamble Co. | Household | |
| | Products | 4.0 |
| Exxon Mobil Corp. | Integrated Oil & | |
| | Gas | 3.9 |
| United Technologies | Aerospace & | |
| Corp. | Defense | 3.8 |
| Wal-Mart Stores Inc. | Hypermarkets & | |
| | Super Centers | 3.8 |
| Johnson & Johnson | Pharmaceuticals | 3.7 |
| Top Ten | | 39.8% |
| The holdings listed exclude any temporary cash investments and equity index products. |
Investment Focus
1 The expense ratios shown are from the prospectus dated May 28, 2010, and represent estimated costs for the current fiscal year. For the six months ended July 31, 2010, the annualized expense ratios were 0.31% for Investor Shares and 0.19% for ETF Shares.
6
Dividend Appreciation Index Fund
Performance Summary
All of the returns in this report represent past performance, which is not a guarantee of future results that may be achieved by the fund. (Current performance may be lower or higher than the performance data cited. For performance data current to the most recent month-end, visit our website at www.vanguard.com/performance.) Note, too, that both investment returns and principal value can fluctuate widely, so an investor’s shares, when sold, could be worth more or less than their original cost. The returns shown do not reflect taxes that a shareholder would pay on fund distributions or on the sale of fund shares.
Fiscal-Year Total Returns (%): April 27, 2006, Through July 31, 2010
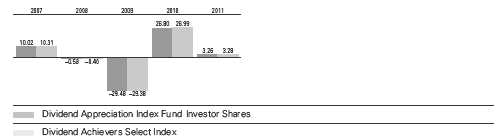
Note: For 2011, performance data reflect the six months ended July 31, 2010.
Average Annual Total Returns: Periods Ended June 30, 2010
This table presents average annual total returns through the latest calendar quarter—rather than through the end of the fiscal period. Securities and Exchange Commission rules require that we provide this information.
| | | |
| | Inception | One | Since |
| | Date | Year | Inception |
| Investor Shares | 4/27/2006 | 13.39% | -1.23% |
| ETF Shares | 4/21/2006 | | |
| Market Price | | 13.51 | -1.04 |
| Net Asset Value | | 13.51 | -1.05 |
For more information about how the ETF Shares' market prices have compared with their net asset value, visit www.vanguard.com, select your ETF, and then select the Performance tab. The Premium/Discount table there shows the percentages of days on which the ETF Shares' market price was above or below the NAV.See Financial Highlights for dividend and capital gains information.
7
Dividend Appreciation Index Fund
Financial Statements (unaudited)
Statement of Net Assets
As of July 31, 2010
The fund reports a complete list of its holdings in regulatory filings four times in each fiscal year, at the quarter-ends. For the second and fourth fiscal quarters, the lists appear in the fund’s semiannual and annual reports to shareholders. For the first and third fiscal quarters, the fund files the lists with the Securities and Exchange Commission on Form N-Q. Shareholders can look up the fund’s Forms N-Q on the SEC’s website at www.sec.gov. Forms N-Q may also be reviewed and copied at the SEC’s Public Reference Room (see the back cover of this report for further information).
| | |
| | | Market |
| | | Value |
| | Shares | ($000) |
| Common Stocks (100.0%) | | |
| Consumer Discretionary (11.8%) | |
| McDonald’s Corp. | 2,366,510 | 165,017 |
| Target Corp. | 1,567,637 | 80,451 |
| Lowe’s Cos. Inc. | 3,513,529 | 72,871 |
| TJX Cos. Inc. | 902,767 | 37,483 |
| McGraw-Hill Cos. Inc. | 690,815 | 21,201 |
| VF Corp. | 251,835 | 19,978 |
| Stanley Black & | | |
| Decker Inc. | 340,274 | 19,743 |
| Ross Stores Inc. | 262,361 | 13,816 |
| H&R Block Inc. | 782,793 | 12,274 |
| Family Dollar Stores Inc. | 283,656 | 11,729 |
| Polaris Industries Inc. | 74,959 | 4,475 |
| John Wiley & Sons Inc. | | |
| Class A | 109,756 | 4,322 |
| Wolverine World Wide Inc. | 113,613 | 3,248 |
| Meredith Corp. | 79,932 | 2,538 |
| Matthews | | |
| International Corp. | | |
| Class A | 70,277 | 2,538 |
| | | 471,684 |
| Consumer Staples (25.3%) | | |
| PepsiCo Inc. | 2,734,756 | 177,513 |
| Coca-Cola Co. | 2,922,873 | 161,079 |
| Procter & Gamble Co. | 2,607,443 | 159,471 |
| Wal-Mart Stores Inc. | 2,951,744 | 151,100 |
| Colgate-Palmolive Co. | 1,138,753 | 89,939 |
| Walgreen Co. | 2,247,208 | 64,158 |
| Archer-Daniels-Midland Co. | 1,521,108 | 41,617 |
| Sysco Corp. | 1,342,597 | 41,580 |
| Avon Products Inc. | 966,525 | 30,088 |
| Clorox Co. | 322,575 | 20,929 |
| JMSmucker Co. | 271,296 | 16,666 |
| Brown-Forman Corp. | | |
| Class B | 213,919 | 13,522 |
| Hormel Foods Corp. | 297,759 | 12,780 |
| Church& Dwight Co. Inc. | 156,275 | 10,356 |
| McCormick & Co. Inc. | 258,631 | 10,172 |
| | |
| | | Market |
| | | Value |
| | Shares | ($000) |
| Casey’s General | | |
| Stores Inc. | 118,595 | 4,536 |
| Lancaster Colony Corp. | 61,547 | 3,195 |
| Tootsie Roll Industries Inc. | 85,715 | 2,163 |
| | | 1,010,864 |
| Energy (10.3%) | | |
| ChevronCorp. | 2,134,166 | 162,645 |
| Exxon Mobil Corp. | 2,585,088 | 154,278 |
| EOG Resources Inc. | 590,850 | 57,608 |
| Murphy Oil Corp. | 444,977 | 24,362 |
| Helmerich & Payne Inc. | 209,158 | 8,477 |
| Holly Corp. | 109,655 | 2,931 |
| | | 410,301 |
| Financials (6.5%) | | |
| Franklin Resources Inc. | 538,708 | 54,183 |
| Aflac Inc. | 975,357 | 47,978 |
| ChubbCorp. | 754,681 | 39,719 |
| T Rowe Price Group Inc. | 598,174 | 28,850 |
| Eaton Vance Corp. | 261,371 | 7,831 |
| SEI Investments Co. | 401,415 | 7,699 |
| Transatlantic Holdings Inc. | 150,731 | 7,207 |
| Cullen/Frost Bankers Inc. | 129,952 | 7,175 |
| Commerce | | |
| Bancshares Inc. | 178,817 | 7,001 |
| HCC Insurance | | |
| Holdings Inc. | 261,596 | 6,833 |
| Brown & Brown Inc. | 321,073 | 6,428 |
| Wesco Financial Corp. | 15,652 | 5,305 |
| Federated Investors Inc. | | |
| Class B | 246,709 | 5,235 |
| StanCorp Financial | | |
| Group Inc. | 106,563 | 4,016 |
| Prosperity Bancshares Inc. | 104,822 | 3,551 |
| Westamerica | | |
| Bancorporation | 63,735 | 3,426 |
| UMBFinancial Corp. | 88,030 | 3,312 |
| RLICorp. | 49,620 | 2,754 |
| First Financial | | |
| Bankshares Inc. | 47,927 | 2,349 |
8
Dividend Appreciation Index Fund
| | |
| | | Market |
| | | Value |
| | Shares | ($000) |
| Bank of the Ozarks Inc. | 37,921 | 1,420 |
| Bancfirst Corp. | 31,989 | 1,317 |
| Republic Bancorp Inc. | | |
| Class A | 51,304 | 1,271 |
| Tompkins Financial Corp. | 24,845 | 1,037 |
| First Financial Corp. | 31,771 | 901 |
| SY Bancorp Inc. | 31,391 | 783 |
| Southside Bancshares Inc. | 37,671 | 714 |
| WSFS Financial Corp. | 15,666 | 595 |
| | | 258,890 |
| Health Care (13.3%) | | |
| Johnson & Johnson | 2,520,252 | 146,401 |
| Abbott Laboratories | 2,904,666 | 142,561 |
| Medtronic Inc. | 2,487,890 | 91,977 |
| Stryker Corp. | 822,778 | 38,317 |
| Becton Dickinson and Co. | 554,068 | 38,120 |
| Cardinal Health Inc. | 809,058 | 26,108 |
| CR Bard Inc. | 210,397 | 16,523 |
| DENTSPLY | | |
| International Inc. | 349,880 | 10,503 |
| Beckman Coulter Inc. | 152,291 | 6,980 |
| Teleflex Inc. | 81,863 | 4,639 |
| Owens& Minor Inc. | 147,866 | 4,021 |
| West Pharmaceutical | | |
| Services Inc. | 79,731 | 2,897 |
| Meridian Bioscience Inc. | 98,435 | 1,891 |
| | | 530,938 |
| Industrials (19.5%) | | |
| United Technologies Corp. | 2,129,811 | 151,430 |
| 3MCo. | 1,606,739 | 137,440 |
| Caterpillar Inc. | 1,423,988 | 99,323 |
| Emerson Electric Co. | 1,702,976 | 84,365 |
| General Dynamics Corp. | 857,676 | 52,533 |
| Illinois Tool Works Inc. | 1,192,126 | 51,857 |
| CH Robinson | | |
| Worldwide Inc. | 386,705 | 25,213 |
| Parker Hannifin Corp. | 342,861 | 21,299 |
| Expeditors International | | |
| of Washington Inc. | 478,295 | 20,395 |
| Dover Corp. | 403,997 | 19,380 |
| WW Grainger Inc. | 162,127 | 18,160 |
| Fastenal Co. | 328,423 | 16,119 |
| Roper Industries Inc. | 215,181 | 13,449 |
| Cintas Corp. | 357,001 | 9,446 |
| Donaldson Co. Inc. | 185,227 | 8,793 |
| Pentair Inc. | 227,995 | 7,797 |
| Nordson Corp. | 79,844 | 5,034 |
| Carlisle Cos. Inc. | 135,832 | 4,575 |
| Graco Inc. | 134,670 | 4,252 |
| Harsco Corp. | 183,351 | 4,246 |
| CLARCORInc. | 110,296 | 4,138 |
| Brady Corp. Class A | 113,694 | 3,162 |
| AO Smith Corp. | 57,598 | 3,149 |
| ABMIndustries Inc. | 123,376 | 2,677 |
| | |
| | | Market |
| | | Value |
| | Shares | ($000) |
| Franklin Electric Co. Inc. | 56,158 | 1,727 |
| Tennant Co. | 45,679 | 1,714 |
| Raven Industries Inc. | 45,579 | 1,597 |
| Universal Forest | | |
| Products Inc. | 47,251 | 1,463 |
| Badger Meter Inc. | 35,672 | 1,397 |
| Gorman-Rupp Co. | 39,700 | 1,189 |
| | | 777,319 |
| Information Technology (6.0%) | |
| International Business | | |
| Machines Corp. | 1,258,400 | 161,579 |
| Automatic Data | | |
| Processing Inc. | 1,179,301 | 48,670 |
| Linear Technology Corp. | 559,721 | 17,844 |
| Factset Research | | |
| Systems Inc. | 109,136 | 8,185 |
| Jack Henry & | | |
| Associates Inc. | 197,935 | 5,027 |
| | | 241,305 |
| Materials (5.7%) | | |
| Praxair Inc. | 701,958 | 60,944 |
| Air Products & | | |
| Chemicals Inc. | 483,302 | 35,078 |
| Nucor Corp. | 755,518 | 29,571 |
| Ecolab Inc. | 533,263 | 26,082 |
| Sherwin-WilliamsCo. | 249,288 | 17,238 |
| Sigma-Aldrich Corp. | 283,808 | 15,922 |
| Martin Marietta | | |
| Materials Inc. | 109,678 | 9,367 |
| Albemarle Corp. | 199,883 | 8,719 |
| Bemis Co. Inc. | 251,776 | 7,543 |
| Valspar Corp. | 218,876 | 6,875 |
| Aptargroup Inc. | 150,298 | 6,473 |
| HBFuller Co. | 117,560 | 2,403 |
| Stepan Co. | 22,904 | 1,512 |
| | | 227,727 |
| Telecommunication Services (0.2%) | |
| Telephone & | | |
| Data Systems Inc. | 119,137 | 4,066 |
| Atlantic Tele-Network Inc. | 38,276 | 1,711 |
| Shenandoah | | |
| Telecommunications Co. | 63,110 | 1,230 |
| | | 7,007 |
| Utilities (1.4%) | | |
| National Fuel Gas Co. | 177,872 | 8,547 |
| MDU Resources | | |
| Group Inc. | 431,600 | 8,524 |
| Energen Corp. | 158,697 | 7,052 |
| UGI Corp. | 235,259 | 6,343 |
| Aqua America Inc. | 315,783 | 6,155 |
| Questar Corp. | 362,102 | 5,957 |
| New Jersey | | |
| Resources Corp. | 95,288 | 3,557 |
9
Dividend Appreciation Index Fund
| | |
| | | Market |
| | | Value |
| | Shares | ($000) |
| South Jersey | | |
| Industries Inc. | 66,105 | 3,088 |
| Northwest Natural Gas Co. | 61,068 | 2,895 |
| California Water | | |
| Service Group | 47,214 | 1,678 |
| American States Water Co. | 44,091 | 1,556 |
| SJW Corp. | 42,400 | 1,055 |
| | | 56,407 |
| Total Common Stocks | | |
| (Cost $3,847,747) | | 3,992,442 |
| Temporary Cash Investment (0.0%) | |
| Money Market Fund (0.0%) | | |
| 1 Vanguard Market | | |
| Liquidity Fund, 0.297% | | |
| (Cost $994) | 994,287 | 994 |
| Total Investments (100.0%) | | |
| (Cost $3,848,741) | | 3,993,436 |
| Other Assets and Liabilities (0.0%) | |
| Other Assets | | 6,979 |
| Liabilities | | (8,893) |
| | | (1,914) |
| Net Assets (100%) | | 3,991,522 |
| |
| At July 31, 2010, net assets consisted of: | |
| | Amount |
| | ($000) |
| Paid-in Capital | 4,033,965 |
| Undistributed Net Investment Income | 6,234 |
| Accumulated Net Realized Losses | (193,372) |
| Unrealized Appreciation (Depreciation) | 144,695 |
| Net Assets | 3,991,522 |
| |
| |
| Investor Shares—Net Assets | |
| Applicable to 47,176,430 outstanding | |
| $.001 par value shares of beneficial | |
| interest (unlimited authorization) | 884,345 |
| Net Asset Value Per Share— | |
| Investor Shares | $18.75 |
| |
| |
| ETF Shares—Net Assets | |
| Applicable to 66,331,287 outstanding | |
| $.001 par value shares of beneficial | |
| interest (unlimited authorization) | 3,107,177 |
| Net Asset Value Per Share— | |
| ETF Shares | $46.84 |
See Note A in Notes to Financial Statements.
1 Affiliated money market fund available only to Vanguard funds and certain trusts and accounts managed by Vanguard. Rate shown is the 7-day yield.
See accompanying Notes, which are an integral part of the Financial Statements.
10
Dividend Appreciation Index Fund
Statement of Operations
| |
| | Six Months Ended |
| | July 31, 2010 |
| | ($000) |
| Investment Income | |
| Income | |
| Dividends | 43,424 |
| Interest1 | 3 |
| Security Lending | 4 |
| Total Income | 43,431 |
| Expenses | |
| The Vanguard Group—Note B | |
| Investment Advisory Services | 118 |
| Management and Administrative—Investor Shares | 1,054 |
| Management and Administrative—ETF Shares | 2,070 |
| Marketing and Distribution—Investor Shares | 92 |
| Marketing and Distribution—ETF Shares | 323 |
| Custodian Fees | 56 |
| Shareholders’ Reports—Investor Shares | 9 |
| Shareholders’ Reports—ETF Shares | 30 |
| Trustees’ Fees and Expenses | 2 |
| Total Expenses | 3,754 |
| Net Investment Income | 39,677 |
| Realized Net Gain (Loss) on Investment Securities Sold | 20,746 |
| Change in Unrealized Appreciation (Depreciation) of Investment Securities | 10,985 |
| Net Increase (Decrease) in Net Assets Resulting from Operations | 71,408 |
| 1 Interest income from an affiliated company of the fund was $3,000. | |
See accompanying Notes, which are an integral part of the Financial Statements.
11
Dividend Appreciation Index Fund
Statement of Changes in Net Assets
| | |
| | Six Months Ended | Year Ended |
| | July 31, | January 31, |
| | 2010 | 2010 |
| | ($000) | ($000) |
| Increase (Decrease) in Net Assets | | |
| Operations | | |
| Net Investment Income | 39,677 | 39,729 |
| Realized Net Gain (Loss) | 20,746 | 31,626 |
| Change in Unrealized Appreciation (Depreciation) | 10,985 | 294,047 |
| Net Increase (Decrease) in Net Assets Resulting from Operations | 71,408 | 365,402 |
| Distributions | | |
| Net Investment Income | | |
| Investor Shares | (7,357) | (10,294) |
| ETF Shares | (28,783) | (28,500) |
| Realized Capital Gain | | |
| Investor Shares | — | — |
| ETF Shares | — | — |
| Total Distributions | (36,140) | (38,794) |
| Capital Share Transactions | | |
| Investor Shares | 261,424 | 133,342 |
| ETF Shares | 1,163,804 | 880,312 |
| Net Increase (Decrease) from Capital Share Transactions | 1,425,228 | 1,013,654 |
| Total Increase (Decrease) | 1,460,496 | 1,340,262 |
| Net Assets | | |
| Beginning of Period | 2,531,026 | 1,190,764 |
| End of Period1 | 3,991,522 | 2,531,026 |
| 1 Net Assets—End of Period includes undistributed net investment income of $6,234,000 and $2,697,000. | |
See accompanying Notes, which are an integral part of the Financial Statements.
12
Dividend Appreciation Index Fund
Financial Highlights
| | | | | |
| Investor Shares | | | | | |
| | | | | | |
| | Six Months
Ended
July 31,
2010 | | | | April 27,
20061, to
Jan. 31,
2007 |
| | |
| | Year Ended January 31, |
| For a Share Outstanding Throughout Each Period | 2010 | 2009 | 2008 |
| Net Asset Value, Beginning of Period | $18.33 | $14.79 | $21.40 | $21.84 | $20.05 |
| Investment Operations | | | | | |
| Net Investment Income | .189 | .369 | .387 | .325 | .214 |
| Net Realized and Unrealized Gain (Loss) | | | | | |
| on Investments | .409 | 3.543 | (6.614) | (.438) | 1.782 |
| Total from Investment Operations | .598 | 3.912 | (6.227) | (.113) | 1.996 |
| Distributions | | | | | |
| Dividends from Net Investment Income | (.178) | (.372) | (.383) | (.327) | (.206) |
| Distributions from Realized Capital Gains | — | — | — | — | — |
| Total Distributions | (.178) | (.372) | (.383) | (.327) | (.206) |
| Net Asset Value, End of Period | $18.75 | $18.33 | $14.79 | $21.40 | $21.84 |
| |
| Total Return2 | 3.26% | 26.80% | -29.48% | -0.58% | 10.02% |
| |
| Ratios/Supplemental Data | | | | | |
| Net Assets, End of Period (Millions) | $884 | $613 | $386 | $357 | $163 |
| Ratio of Total Expenses to | | | | | |
| Average Net Assets | 0.31%3 | 0.35% | 0.36% | 0.40% | 0.40%3 |
| Ratio of Net Investment Income to | | | | | |
| Average Net Assets | 2.17%3 | 2.24% | 2.25% | 1.56% | 1.53%3 |
| Portfolio Turnover Rate4 | 2%3 | 20% | 34% | 17% | 21% |
1 Inception.2 Total returns do not include the account service fee that may be applicable to certain accounts with balances below $10,000.3 Annualized.4 Excludes the value of portfolio securities received or delivered as a result of in-kind purchases or redemptions of the fund’s capital shares, including ETF Creation Units.See accompanying Notes, which are an integral part of the Financial Statements.
13
Dividend Appreciation Index Fund
Financial Highlights
| | | | | |
| ETF Shares | | | | | |
| | | | | | |
| | Six Months
Ended
July 31,
2010 | | | | April 21,
20061, to
Jan. 31,
2007 |
| | |
| | Year Ended January 31, |
| For a Share Outstanding Throughout Each Period | 2010 | 2009 | 2008 |
| Net Asset Value, Beginning of Period | $45.81 | $36.96 | $53.48 | $54.60 | $49.94 |
| Investment Operations | | | | | |
| Net Investment Income | .498 | .973 | 1.032 | .873 | .555 |
| Net Realized and Unrealized Gain (Loss) | | | | | |
| on Investments | 1.007 | 8.856 | (16.526) | (1.120) | 4.631 |
| Total from Investment Operations | 1.505 | 9.829 | (15.494) | (.247) | 5.186 |
| Distributions | | | | | |
| Dividends from Net Investment Income | (.475) | (.979) | (1.026) | (.873) | (.526) |
| Distributions from Realized Capital Gains | — | — | — | — | — |
| Total Distributions | (.475) | (.979) | (1.026) | (.873) | (.526) |
| Net Asset Value, End of Period | $46.84 | $45.81 | $36.96 | $53.48 | $54.60 |
| |
| Total Return | 3.29% | 26.95% | -29.38% | -0.51% | 10.45% |
| |
| Ratios/Supplemental Data | | | | | |
| Net Assets, End of Period (Millions) | $3,107 | $1,918 | $805 | $302 | $111 |
| Ratio of Total Expenses to | | | | | |
| Average Net Assets | 0.19%2 | 0.23% | 0.24% | 0.28% | 0.28%2 |
| Ratio of Net Investment Income to | | | | | |
| Average Net Assets | 2.29%2 | 2.36% | 2.37% | 1.68% | 1.65%2 |
| Portfolio Turnover Rate3 | 2%2 | 20% | 34% | 17% | 21% |
1 Inception.2 Annualized.3 Excludes the value of portfolio securities received or delivered as a result of in-kind purchases or redemptions of the fund’s capital shares, including ETF Creation Units.See accompanying Notes, which are an integral part of the Financial Statements.
14
Dividend Appreciation Index Fund
Notes to Financial Statements
Vanguard Dividend Appreciation Index Fund is registered under the Investment Company Act of 1940 as an open-end investment company, or mutual fund. The fund offers two classes of shares: Investor Shares and ETF Shares. Investor Shares are available to any investor who meets the fund’s minimum purchase requirements. ETF Shares are listed for trading on the NYSE Arca, Inc.; they can be purchased and sold through a broker.
A. The following significant accounting policies conform to generally accepted accounting principles for U.S. mutual funds. The fund consistently follows such policies in preparing its financial statements.
1. Security Valuation: Securities are valued as of the close of trading on the New York Stock Exchange (generally 4 p.m., Eastern time) on the valuation date. Equity securities are valued at the latest quoted sales prices or official closing prices taken from the primary market in which each security trades; suc h securities not traded on the valuation date are valued at the mean of the latest quoted bid and asked prices. Securities for which market quotations are not readily available, or whose values have been materially affected by events occurring before the fund’s pricing time but after the close of the securities’ primary markets, are valued by methods deemed by the board of trustees to represent fair value. Investments in Vanguard Market Liquidity Fund are valued at that fund’s net asset value.
2. Federal Income Taxes: The fund intends to continue to qualify as a regulated investment company and distribute all of its taxable income. Management has analyzed the fund’s tax positions taken for all open federal income tax years (January 31, 2007–2010), and for the period ended July 31, 2010, and has concluded that no provision for federal income tax is required in the fund’s financial statements.
3. Distributions: Distributions to shareholders are recorded on the ex-dividend date.
4. Security Lending: The fund may lend its securities to qualified institutional borrowers to earn additional income. Security loans are required to be secured at all times by collateral at least equal to the market value of securities loaned. The fund invests cash collateral received in Vanguard Market Liquidity Fund, and records a liability for the return of the collateral, during the period the securities are on loan. Security lending income represents the income earned on investing cash collateral, less expenses associated with the loan.
5. Other: Dividend income is recorded on the ex-dividend date. Interest income includes income distributions received from Vanguard Market Liquidity Fund and is accrued daily. Security transactions are accounted for on the date securities are bought or sold. Costs used to determine realized gains (losses) on the sale of investment securities are those of the specific securities sold.
Each class of shares has equal rights as to assets and earnings, except that each class separately bears certain class-specific expenses related to maintenance of shareholder accounts (included in Management and Administrative expenses) and shareholder reporting. Marketing and distribution expenses are allocated to each class of shares based on a method approved by the board of trustees. Income, other non-class-specific expenses, and gains and losses on investments are allocated to each class of shares based on its relative net assets.
15
Dividend Appreciation Index Fund
B. The Vanguard Group furnishes at cost investment advisory, corporate management, administrative, marketing, and distribution services. The costs of such services are allocated to the fund under methods approved by the board of trustees. The fund has committed to provide up to 0.40% of its net assets in capital contributions to Vanguard. At July 31, 2010, the fund had contributed capital of $721,000 to Vanguard (included in Other Assets), representing 0.02% of the fund’s net assets and 0.29% of Vanguard’s capitalization. The fund’s trustees and officers are also directors and officers of Vanguard.
C. Various inputs may be used to determine the value of the fund’s investments. These inputs are summarized in three broad levels for financial statement purposes. The inputs or methodologies used to value securities are not necessarily an indication of the risk associated with investing in those securities .
Level 1—Quoted prices in active markets for identical securities.
Level 2—Other significant observable inputs (including quoted prices for similar securities, interest rates, prepayment speeds, credit risk, etc.).
Level 3—Significant unobservable inputs (including the fund’s own assumptions used to determine the fair value of investments).
At July 31, 2010, 100% of the fund’s investments were valued based on Level 1 inputs.
D. Distributions are determined on a tax basis and may differ from net investment income and realized capital gains for financial reporting purposes. Differences may be permanent or temporary. Permanent differences are reclassified among capital accounts in the financial statements to reflect their tax character. Temporary differences arise when certain items of income, expense, gain, or loss are recognized in different periods for financial statement and tax purposes; these differences will reverse at some time in th e future. Differences in classification may also result from the treatment of short-term gains as ordinary income for tax purposes.
During the six months ended July 31, 2010, the fund realized $17,170,000 of net capital gains resulting from in-kind redemptions—in which shareholders exchanged fund shares for securities held by the fund rather than for cash. Because such gains are not taxable to the fund, and are not distributed to shareholders, they have been reclassified from accumulated net realized losses to paid-in capital.
The fund’s tax-basis capital gains and losses are determined only at the end of each fiscal year. For tax purposes, at January 31, 2010, the fund had available capital loss carryforwards totaling $169,000,000 to offset future net capital gains of $609,000 through January 31, 2016, $22,242,000 through January 31, 2017, and $146,149,000 through January 31, 2018. In addition, the fund realized losses of $25,865,000 during the period from November 1, 2009, through January 31, 2010, which are deferred and will be treated as realized for tax purposes in fiscal 2011. The fund will use these capital losses to offset net taxab le capital gains, if any, realized during the year ending January 31, 2011; should the fund realize net capital losses for the year, the losses will be added to the loss carryforward balance above.
16
Dividend Appreciation Index Fund
At July 31, 2010, the cost of investment securities for tax purposes was $3,848,741,000. Net unrealized appreciation of investment securities for tax purposes was $144,695,000, consisting of unrealized gains of $256,648,000 on securities that had risen in value since their purchase and $111,953,000 in unrealized losses on securities that had fallen in value since their purchase.
E. During the six months ended July 31, 2010, the fund purchased $1,541,735,000 of investment securities and sold $114,798,000 of investment securities, other than temporary cash investments.
F. Capital share transactions for each class of shares were:
| | | | |
| | Six Months Ended | | Year Ended |
| | | July 31, 2010 | January 31, 2010 |
| | Amount | Shares | Amount | Shares |
| | ($000) | (000) | ($000) | (000) |
| Investor Shares | | | | |
| Issued | 307,918 | 16,213 | 227,145 | 13,195 |
| Issued in Lieu of Cash Distributions | 6,868 | 365 | 9,119 | 557 |
| Redeemed | (53,362) | (2,822) | (102,922) | (6,443) |
| Net Increase (Decrease)—Investor Shares | 261,424 | 13,756 | 133,342 | 7,309 |
| ETF Shares | | | | |
| Issued | 1,235,475 | 26,048 | 1,178,556 | 26,816 |
| Issued in Lieu of Cash Distributions | — | — | — | — |
| Redeemed | (71,671) | (1,600) | (298,244) | (6,700) |
| Net Increase (Decrease)—ETF Shares | 1,163,804 | 24,448 | 880,312 | 20,116 |
G. In preparing the financial statements as of July 31, 2010, management considered the impact of subsequent events for potential recognition or disclosure in these financial statements.
17
About Your Fund’s Expenses
As a shareholder of the fund, you incur ongoing costs, which include costs for portfolio management, administrative services, and shareholder reports (like this one), among others. Operating expenses, which are deducted from a fund’s gross income, directly reduce the investment return of the fund.
A fund’s expenses are expressed as a percentage of its average net assets. This figure is known as the expense ratio. The following examples are intended to help you understand the ongoing costs (in dollars) of investing in your fund and to compare these costs with those of other mutual funds. The examples are based on an investment of $1,000 made at the beginning of the period shown and held for the entire period.
The accompanying table illustrates your fund’s costs in two ways:
• Based on actual fund return. This section helps you to estimate the actual expenses that you paid over the period. The ”Ending Account Value“ shown is derived from the fund‘s actual return, and the third column shows the dollar amount that would have been paid by an investor who started with $1,000 in the fund. You may use the information here, together with the amount you invested, to estimate the expenses that you paid over the period.
To do so, simply divide your account value by $1,000 (for example, an $8,600 account value divided by $1,000 = 8.6), then multiply the result by the number given for your fund under the heading ”Expenses Paid During Period.“
• Based on hypothetical 5% yearly return. This section is intended to help you compare your fund‘s costs with those of other mutual funds. It assumes that the fund had a yearly return of 5% before expenses, but that the expense ratio is unchanged. In this case—because the return used is not the fund’s actual return—the results do not apply to your investment. The example is useful in making comparisons because the Securities and Exchange Commission requires all mutual funds to calculate expenses based on a 5% return. You can assess your fund’s costs by comparing this hypothetical example with the hypothetical examples that appear in shareholder reports of other funds.
Note that the expenses shown in the table are meant to highlight and help you compare ongoing costs only and do not reflect transaction costs incurred by the fund for buying and selling securities. Further, the expenses do not include the account service fee described in the prospectus. If such a fee were applied to your account, your costs would be higher. Your fund does not charge transaction fees, such as purchase or redemption fees, nor does it carry a “sales load.” The calculations assume no shares were bought or sold during the period. Your actual costs may have been higher or lower, depending on the amount of your investment and the timing of any purchases or redemptions.
You can find more information about the fund’s expenses, including annual expense ratios, in the Financial Statements section of this report. For additional information on operating expenses and other shareholder costs, please refer to your fund’s current prospectus.
18
| | | |
| Six Months Ended July 31, 2010 | | | |
| | Beginning | Ending | Expenses |
| | Account Value | Account Value | Paid During |
| Dividend Appreciation Index Fund | 1/31/2010 | 7/31/2010 | Period |
| Based on Actual Fund Return | | | |
| Investor Shares | $1,000.00 | $1,032.58 | $1.56 |
| ETF Shares | 1,000.00 | 1,032.89 | 0.96 |
| Based on Hypothetical 5% Yearly Return | | | |
| Investor Shares | $1,000.00 | $1,023.26 | $1.56 |
| ETF Shares | 1,000.00 | 1,023.85 | 0.95 |
The calculations are based on expenses incurred in the most recent six-month period. The fund’s annualized six-month expense ratios for that period are 0.31% for Investor Shares and 0.19% for ETF Shares. The dollar amounts shown as “Expenses Paid” are equal to the annualized expense ratio multiplied by the average account value over the period, multiplied by the number of days in the most recent six-month period, then divided by the number of days in the most recent 12-month period.19
Trustees Approve Advisory Arrangement
The board of trustees of Vanguard Dividend Appreciation Index Fund has renewed the fund’s investment advisory arrangement with The Vanguard Group, Inc. Vanguard—through its Quantitative Equity Group—serves as investment advisor for the fund. The board determined that continuing the fund’s internalized management structure was in the best interests of the fund and its shareholders.
The board based its decision upon an evaluation of the advisor’s investment staff, portfolio management process, and performance. The trustees considered the factors discussed below, among others. However, no single factor determined whether the board approved the arrangement. Rather, it was the totality of the circumstances that drove the board’s decision.
Nature, extent, and quality of services
The board considered the quality of the fund’s investment management since the fund’s inception in 2006, and took into account the organizational depth and stability of the advisor. The board noted that Vanguard has been managing investments for more than three decades. The Quantitative Equity Group adheres to a sound, disciplined investment management process; the team has considerable experience, stability, and depth.
The board concluded that Vanguard’s experience, stability, depth, and performance, among other factors, warranted continuation of the advisory arrangement.
Investment performance
The board considered the fund’s performance since inception, including any periods of outperformance or underperformance of its target index and peer group. The board concluded that the fund has performed in line with expectations, and that the results have been consistent with the fund’s investment strategy. Information about the fund’s most recent performance can be found in the Performance Summary portion of this report.
Cost
The board concluded that the fund’s expense ratio was well below the average expense ratio charged by funds in its peer group and that the fund’s advisory expense ratio was also well below its peer-group average. Information about the fund’s expense ratio appears in the About Your Fund’s Expenses section of this report as well as in the Financial Statements section.
The board does not conduct a profitability analysis of Vanguard, because of Vanguard’s unique “at-cost” structure. Unlike most other mutual fund management companies, Vanguard is owned by the funds it oversees, and produces “profits” only in the form of reduced expenses for fund shareholders.
The benefit of economies of scale
The board concluded that the fund’s low-cost arrangement with Vanguard ensures that the fund will realize economies of scale as it grows, with the cost to sh areholders declining as the fund’s assets increase.
The board will consider whether to renew the advisory arrangement again after a one-year period.
20
Glossary
30-Day SEC Yield. A fund’s 30-day SEC yield is derived using a formula specified by the U.S. Securities and Exchange Commission. Under the formula, data related to the fund’s security holdings in the previous 30 days are used to calculate the fund’s hypothetical net income for that period, which is then annualized and divided by the fund’s estimated average net assets over the calculation period. For the purposes of this calculation, a security’s income is based on its current market yield to maturity (in the case of bonds) or its projected dividend yield (for stocks). Because the SEC yield represents hypothetical annualized income, it will differ—at times significantly—from the fund’s actual experience. As a result, the fund’s income distributions may be higher or lower than implied by the SEC yield.
Beta. A measure of the magnitude of a fund’s past share-price fluctuations in relation to the ups and downs of a given market index. The index is assigned a beta of 1.00. Compared with a given index, a fund with a beta of 1.20 typically would have seen its share price rise or fall by 12% when the index rose or fell by 10%. For this report, beta is based on returns over the past 36 months for both the fund and the index. Note that a fund’s beta should be reviewed in conjunction with its R-squared (see definition). The lower the R-squared, the less correlation there is between the fund and the index, and the less reliable beta is as an indicator of volatility.
Dividend Yield. Dividend income earned by stocks, expressed as a percentage of the aggregate market value (or of net asset value, for a fund). The yield is determined by dividing the amount of the annual dividends by the aggregate value (or net asset value) at the end of the period. For a fund, the dividend yield is based solely on stock holdings and does not include any income produced by other investments.
Earnings Growth Rate. The average annual rate of growth in earnings over the past five years for the stocks now in a fund.
Equity Exposure. A measure that reflects a fund’s investments in stocks and stock futures. Any holdings in short-term reserves are excluded.
Expense Ratio. The percentage of a fund’s average net assets used to pay its annual administrative and advisory expenses. These expenses directly reduce returns to investors.
Foreign Holdings. The percentage of a fund represented by stocks or depositary receipts of companies based outside the United States.
Inception Date. The date on which the assets of a fund (or one of its share classes) are first invested in accordance with the fund’s investment objective. For funds with a subscription period, the inception date is the day after that period ends. Investment performance is measured from the inception date.
Median Market Cap. An indicator of the size of companies in which a fund invests; the midpoint of market capitalization (market price x shares outstanding) of a fund’s stocks, weighted by the proportion of the fund’s assets invested in each stock. Stocks representing half of the fund’s assets have market capitalizations above the median, and the rest are below it.
Price/Book Ratio. The share price of a stock divided by its net worth, or book value, per share. For a fund, the weighted average price/book ratio of the stocks it holds.
21
Price/Earnings Ratio. The ratio of a stock’s current price to its per-share earnings over the past year. For a fund, the weighted average P/E of the stocks it holds. P/E is an indicator of market expectations about corporate prospects; the higher the P/E, the greater the expectations for a company’s future growth.
R-Squared. A measure of how much of a fund’s past returns can be explained by the returns from the market in general, as measured by a given index. If a fund’s total returns were precisely synchronized with an index’s returns, its R-squared would be 1.00. If the fund’s returns bore no relationship to the index’s returns, its R-squared would be 0. For this report, R-squared is based on returns over the past 36 months for both the fund and the index.
Return on Equity. The annual average rate of return generated by a company during the past five years for each dollar of shareholder’s equity (net income divided by shareholder’s equity). For a fund, the weighted average return on equity for the companies whose stocks it holds.
Short-Term Reserves. The percentage of a fund invested in highly liquid, short-term securities that can be readily converted to cash.
Turnover Rate. An indication of the fund’s trading activity. Funds with high turnover rates incur higher transaction costs and may be more likely to distribute capital gains (which may be taxable to investors). The turnover rate excludes in-kind transactions, which have minimal impact on costs.
22
This page intentionally left blank.
The People Who Govern Your Fund
The trustees of your mutual fund are there to see that the fund is operated and managed in your best interests since, as a shareholder, you are a part owner of the fund. Your fund’s trustees also serve on the board of directors of The Vanguard Group, Inc., which is owned by the Vanguard funds and provides services to them on an at-cost basis.
A majority of Vanguard’s board members are independent, meaning that they have no affiliation with Vanguard or the funds they oversee, apart from the sizable personal investments they have made as private individuals. The independent board members have distinguished backgrounds in business, academia, and public service. Each of the trustees and executive officers oversees 162 Vanguard funds.
The following table provides information for each trustee and executive officer of the fund. More information about the trustees is in the Statement of Additional Information, which can be obtained, without charge, by contacting Vanguard at 800-662-7447, or online at www.vanguard.com.
| |
| Interested Trustee1 | Amy Gutmann |
| | Born 1949. Trustee Since June 2006. Principal |
| F. William McNabb III | Occupation(s) During the Past Five Years: President |
| Born 1957. Trustee Since July 2009. Chairman of the | of the University of Pennsylvania; Christopher H. |
| Board. Principal Occupation(s) During the Past Five | Browne Distinguished Professor of Political Science |
| Years: Chairman of the Board of The Vanguard Group, | in the School of Arts and Sciences with secondary |
| Inc., and of each of the investment companies served | appointments at the Annenberg School for Commu- |
| by The Vanguard Group, since January 2010; Director | nication and the Graduate School of Education of |
| of The Vanguard Group since 2008; Chief Executive | the University of Pennsylvania; Director of Carnegie |
| Officer and President of The Vanguard Group and of | Corporation of New York, Schuylkill River Development |
| each of the investment companies served by The | Corporation, and Greater Philadelphia Chamber of |
| Vanguard Group since 2008; Director of Vanguard | Commerce; Trustee of the National Constitution Center; |
| Marketing Corporation; Managing Director of The | Chair of the Presidential Commission for the Study of |
| Vanguard Group (1995–2008). | Bioethical Issues. |
| |
| | JoAnn Heffernan Heisen |
| Independent Trustees | Born 1950. Trustee Since July 1998. Principal |
| | Occupation(s) During the Past Five Years: Corporate |
| Emerson U. Fullwood | Vice President and Chief Global Diversity Officer since |
| Born 1948. Trustee Since January 2008. Principal | 2006 (retired 2008) and Member of the Executive |
| Occupation(s) During the Past Five Years: Executive | Committee (retired 2008) of Johnson & Johnson |
| Chief Staff and Marketing Officer for North America | (pharmaceuticals/consumer products); Vice President |
| and Corporate Vice President (retired 2008) of Xerox | and Chief Information Officer of Johnson & Johnson |
| Corporation (document management products and | (1997–2005); Director of the University Medical Center |
| services); Director of SPX Corporation (multi-industry | at Princeton and Women’s Research and Education |
| manufacturing), the United Way of Rochester, | Institute; Member of the Advisory Board of the |
| Amerigroup Corporation (managed health care), | Maxwell School of Citizenship and Public Affairs |
| the University of Rochester Medical Center, and | at Syracuse University. |
| Monroe Community College Foundation. | |
| | F. Joseph Loughrey |
| Rajiv L. Gupta | Born 1949. Trustee Since October 2009. Principal |
| Born 1945. Trustee Since December 2001.2 | Occupation(s) During the Past Five Years: President |
| Principal Occupation(s) During the Past Five Years: | and Chief Operating Officer since 2005 (retired 2009) |
| Chairman and Chief Executive Officer (retired 2009) | and Vice Chairman of the Board (2008–2009) of |
| and President (2006–2008) of Rohm and Haas Co. | Cummins Inc. (industrial machinery); Director of |
| (chemicals); Director of Tyco International, Ltd. | SKF AB (industrial machinery), Hillenbrand, Inc. |
| (diversified manufacturing and services) and Hewlett- | (specialized consumer services), Sauer-Danfoss Inc. |
| Packard Co. (electronic computer manufacturing); | (machinery), the Lumina Foundation for Education, |
| Trustee of The Conference Board; Member of the | and Oxfam America; Chairman of the Advisory Council |
| Board of Managers of Delphi Automotive LLP | for the College of Arts and Letters at the University of |
| (automotive components). | Notre Dame. |
| | |
| André F. Perold | Kathryn J. Hyatt | |
| Born 1952. Trustee Since December 2004. Principal | Born 1955. Treasurer Since November 2008. Principal |
| Occupation(s) During the Past Five Years: George | Occupation(s) During the Past Five Years: Principal |
| Gund Professor of Finance and Banking at the Harvard | of The Vanguard Group, Inc.; Treasurer of each of |
| Business School; Chair of the Investment Committee | the investment companies served by The Vanguard |
| of HighVista Strategies LLC (private investment firm). | Group since 2008; Assistant Treasurer of each of the |
| | investment companies served by The Vanguard Group |
| Alfred M. Rankin, Jr. | (1988–2008). | |
| Born 1941. Trustee Since January 1993. Principal | | |
| Occupation(s) During the Past Five Years: Chairman, | Heidi Stam | |
| President, and Chief Executive Officer of NACCO | Born 1956. Secretary Since July 2005. Principal |
| Industries, Inc. (forklift trucks/housewares/lignite); | Occupation(s) During the Past Five Years: Managing |
| Director of Goodrich Corporation (industrial products/ | Director of The Vanguard Group, Inc., since 2006; |
| aircraft systems and services); Chairman of the Federal | General Counsel of The Vanguard Group since 2005; |
| Reserve Bank of Cleveland; Trustee of The Cleveland | Secretary of The Vanguard Group and of each of the |
| Museum of Art. | investment companies served by The Vanguard Group |
| | since 2005; Director and Senior Vice President of |
| Peter F. Volanakis | Vanguard Marketing Corporation since 2005; |
| Born 1955. Trustee Since July 2009. Principal | Principal of The Vanguard Group (1997–2006). |
| Occupation(s) During the Past Five Years: President | | |
| since 2007 and Chief Operating Officer since 2005 | Vanguard Senior Management Team |
| of Corning Incorporated (communications equipment); | | |
| President of Corning Technologies (2001–2005); | R. Gregory Barton | Michael S. Miller |
| Director of Corning Incorporated and Dow Corning; | Mortimer J. Buckley | James M. Norris |
| Trustee of the Corning Incorporated Foundation and | Kathleen C. Gubanich | Glenn W. Reed |
| the Corning Museum of Glass; Overseer of the | Paul A. Heller | George U. Sauter |
| Amos Tuck School of Business Administration at | | |
| Dartmouth College. | | |
| | Chairman Emeritus and Senior Advisor |
| |
| Executive Officers | John J. Brennan | |
| | Chairman, 1996–2009 | |
| Glenn Booraem | Chief Executive Officer and President, 1996–2008 |
| Born 1967. Controller Since July 2010. Principal | | |
| Occupation(s) During the Past Five Years: Principal | | |
| of The Vanguard Group, Inc.; Controller of each of | Founder | |
| the investment companies served by The Vanguard | | |
| Group since 2010; Assistant Controller of each of | John C. Bogle | |
| the investment companies served by The Vanguard | Chairman and Chief Executive Officer, 1974–1996 |
| Group (2001–2010). | | |
| |
| Thomas J. Higgins | | |
| Born 1957. Chief Financial Officer Since September | | |
| 2008. Principal Occupation(s) During the Past Five | | |
| Years: Principal of The Vanguard Group, Inc.; Chief | | |
| Financial Officer of each of the investment companies | | |
| served by The Vanguard Group since 2008; Treasurer | | |
| of each of the investment companies served by The | | |
| Vanguard Group (1998–2008). | | |
1 Mr. McNabb is considered an “interested person,” as defined in the Investment Company Act of 1940, because he is an officer of the Vanguard funds.
2 December 2002 for Vanguard Equity Income Fund, Vanguard Growth Equity Fund, the Vanguard Municipal Bond Funds, and the Vanguard State Tax-Exempt Funds.
|  |
| P.O. Box 2600 |
| Valley Forge, PA 19482-2600 |
Connect with Vanguard® > Vanguard.com
| |
| Fund Information > 800-662-7447 | “Dividend Achievers” is a trademark of Mergent, Inc., |
| Direct Investor Account Services > 800-662-2739 | and has been licensed for use by The Vanguard Group, |
| Institutional Investor Services > 800-523-1036 | Inc. Vanguard mutual funds are not sponsored, |
| Text Telephone for People | endorsed, sold, or promoted by Mergent, and Mergent |
| With Hearing Impairment > 800-749-7273 | makes no representation regarding the advisability of |
| | investing in the funds. |
| This material may be used in conjunction | |
| with the offering of shares of any Vanguard | |
| fund only if preceded or accompanied by | |
| the fund’s current prospectus. | |
| |
| All comparative mutual fund data are from Lipper Inc. or | |
| Morningstar, Inc., unless otherwise noted. | |
| |
| You can obtain a free copy of Vanguard’s proxy voting | |
| guidelines by visiting vanguard.com/proxyreporting or by | |
| calling Vanguard at 800-662-2739. The guidelines are | |
| also available from the SEC’s website, sec.gov. In | |
| addition, you may obtain a free report on how your fund | |
| voted the proxies for securities it owned during the 12 | |
| months ended June 30. To get the report, visit either | |
| vanguard.com/proxyreporting or sec.gov. | |
| |
| You can review and copy information about your fund at | |
| the SEC’s Public Reference Room in Washington, D.C. To | |
| find out more about this public service, call the SEC at | |
| 202-551-8090. Information about your fund is also | |
| available on the SEC’s website, and you can receive | |
| copies of this information, for a fee, by sending a | |
| request in either of two ways: via e-mail addressed to | |
| publicinfo@sec.gov or via regular mail addressed to the | |
| Public Reference Section, Securities and Exchange | |
| Commission, Washington, DC 20549-1520. | |
| |
| |
| | © 2010 The Vanguard Group, Inc. |
| | All rights reserved. |
| | Vanguard Marketing Corporation, Distributor. |
| |
| | Q6022 092010 |
Item 2: Not Applicable.
Item 3: Not Applicable.
Item 4: Not Applicable.
Item 5: Not Applicable.
Item 6: Not Applicable.
Item 7: Not Applicable.
Item 8: Not Applicable.
Item 9: Not Applicable.
Item 10: Not Applicable.
Item 11: Controls and Procedures.
(a) Disclosure Controls and Procedures. The Principal Executive and Financial Officers concluded that the Registrant's Disclosure Controls and Procedures are effective based on their evaluation of the Disclosure Controls and Procedures as of a date within 90 days of the filing date of this report.
(b) Internal Control Over Financial Reporting. There were no significant changes in Registrant’s Internal Control Over Financial Reporting or in other factors that could significantly affect this control subsequent to the date of the evaluation, including any corrective actions with regard to significant deficiencies and material weaknesses.
Item 12: Exhibits.
(a) Code of Ethics.
(b) Certifications.
Pursuant to the requirements of the Securities Exchange Act of 1934 and the Investment Company Act of
1940, the registrant has duly caused this report to be signed on its behalf by the undersigned, thereunto
duly authorized.
| |
| | VANGUARD SPECIALIZED FUNDS |
| |
| By: | /s/ F. WILLIAM MCNABB III* |
| | F. WILLIAM MCNABB III |
| | CHIEF EXECUTIVE OFFICER |
| |
| Date: September 23, 2010 |
Pursuant to the requirements of the Securities Exchange Act of 1934 and the Investment Company Act of 1940, this report has been signed below by the following persons on behalf of the registrant and in the capacities and on the dates indicated.
| |
| | VANGUARD SPECIALIZED FUNDS |
| |
| By: | /s/ F. WILLIAM MCNABB III* |
| | F. WILLIAM MCNABB III |
| | CHIEF EXECUTIVE OFFICER |
| |
| Date: September 23, 2010 |
| |
| | VANGUARD SPECIALIZED FUNDS |
| |
| By: | /s/ THOMAS J. HIGGINS* |
| | THOMAS J. HIGGINS |
| | CHIEF FINANCIAL OFFICER |
| |
| Date: September 23, 2010 |
* By: /s/ Heidi Stam
Heidi Stam, pursuant to a Power of Attorney filed on April 26, 2010, see file Number 33-53683, is Incorporated by Reference.