UNITED STATES
SECURITIES AND EXCHANGE COMMISSION
Washington, D.C. 20549
FORM N-CSR
CERTIFIED SHAREHOLDER REPORT
OF
REGISTERED MANAGEMENT INVESTMENT COMPANIES
Investment Company Act file number: 811-03916
Name of Registrant: Vanguard Specialized Funds
Address of Registrant:
P.O. Box 2600
Valley Forge, PA 19482
Name and address of agent for service:
Heidi Stam, Esquire
P.O. Box 876
Valley Forge, PA 19482
Registrant’s telephone number, including area code: (610) 669-1000
Date of fiscal year end: January 31
Date of reporting period: February 1, 2012 – July 31, 2012
Item 1: Reports to Shareholders
 |
| |
| Semiannual Report | July 31, 2012 |
| Vanguard Energy Fund |
> Vanguard Energy Fund returned about –6% for the six months ended July 31, 2012.
> The fund’s return trailed that of its benchmark index but surpassed the average return of its peer funds.
> The energy sector underperformed the broad U.S. stock market. Weakness among integrated oil and gas companies and those involved in exploration and production weighed most on the fund’s performance.
| |
| Contents | |
| Your Fund’s Total Returns. | 1 |
| Chairman’s Letter. | 2 |
| Advisors’ Report. | 8 |
| Fund Profile. | 12 |
| Performance Summary. | 14 |
| Financial Statements. | 15 |
| About Your Fund’s Expenses. | 28 |
| Trustees Approve Advisory Arrangements. | 30 |
| Glossary. | 32 |
Please note: The opinions expressed in this report are just that—informed opinions. They should not be considered promises or advice. Also, please keep in mind that the information and opinions cover the period through the date on the front of this report. Of course, the risks of investing in your fund are spelled out in the prospectus.
See the Glossary for definitions of investment terms used in this report.
About the cover: Vanguard was named for the HMS Vanguard, flagship of British Admiral Horatio Nelson. A ship—whose performance and safety depend on the work of all hands—has served as a fitting metaphor for the Vanguard crew as we strive to help clients reach their financial goals.
Your Fund’s Total Returns
| |
| Six Months Ended July 31, 2012 | |
| | Total |
| | Returns |
| Vanguard Energy Fund | |
| Investor Shares | -6.05% |
| Admiral™ Shares | -6.03 |
| MSCI ACWI Energy Index | -5.51 |
| Global Natural Resources Funds Average | -11.91 |
Global Natural Resources Funds Average: Derived from data provided by Lipper Inc.
Admiral Shares carry lower expenses and are available to investors who meet certain account-balance requirements.
| | | | |
| Your Fund’s Performance at a Glance | | | | |
| January 31, 2012, Through July 31, 2012 | | | | |
| | | | Distributions Per Share |
| | Starting | Ending | Income | Capital |
| | Share Price | Share Price | Dividends | Gains |
| Vanguard Energy Fund | | | | |
| Investor Shares | $62.60 | $57.82 | $0.049 | $1.034 |
| Admiral Shares | 117.52 | 108.57 | 0.101 | 1.941 |
1

Chairman’s Letter
Dear Shareholder,
Vanguard Energy Fund returned about –6% for the fiscal half-year ended July 31, 2012. The fund’s return lagged that of its benchmark index but was well ahead of the average return of global natural resources funds, which invest in energy as well as materials stocks.
The fund’s disappointing results for the six months can be attributed to a combination of factors, including the sharp decline in crude oil prices since March, historically low natural gas prices, and continued uncertainties about global economic growth. Disappointing stock choices, particularly among South American oil companies, kept the fund a step behind its benchmark.
The energy sector as a whole has been one of the market’s weakest performers for the period, as investors have grown increasingly concerned about lessening global demand for oil and its potential effect on the sector’s profitability.
On a separate note, I want to inform you that Vanguard has eliminated the redemption fee for your fund, effective May 23. The fund’s trustees determined that the fee, one of several measures in place to discourage frequent trading and protect the interests of long-term investors, was no longer needed.
2
U.S. stocks delivered solid gains; international equities slumped
U.S. stocks handily outperformed their international counterparts, returning about 5% for the six months ended July 31. Stocks of large companies fared best as investors seemed to be seeking stability amid the uncertainty surrounding Europe’s debt troubles.
International stocks were generally weak, with currency effects further hindering results for U.S.-based investors. Though European stocks posted a modest advance in local-currency terms, their return was negative once converted into U.S. dollars—a result of the dollar’s strengthening against the euro during the six months. Signs of slowing economic growth hurt returns for emerging markets and the developed markets of the Pacific region.
Questions about the finances of European governments and banks continued to preoccupy investors, and global stock markets moved sharply up and down in response to the latest headlines. Although the situation in Europe is very fluid, Vanguard economists believe the most likely scenario is that the Eurozone will “muddle through” for several years, with occasional spikes in market volatility, as fiscal tightening continues in the face of weak economic growth.
| | | |
| Market Barometer | | | |
| |
| | | | Total Returns |
| | | Periods Ended July 31, 2012 |
| | Six | One | Five Years |
| | Months | Year | (Annualized) |
| Stocks | | | |
| Russell 1000 Index (Large-caps) | 5.54% | 7.96% | 1.26% |
| Russell 2000 Index (Small-caps) | -0.03 | 0.19 | 1.69 |
| Dow Jones U.S. Total Stock Market Index | 5.01 | 7.07 | 1.50 |
| MSCI All Country World Index ex USA (International) | -2.40 | -12.16 | -4.29 |
| |
| Bonds | | | |
| Barclays U.S. Aggregate Bond Index (Broad taxable | | | |
| market) | 2.88% | 7.25% | 6.91% |
| Barclays Municipal Bond Index (Broad tax-exempt | | | |
| market) | 2.93 | 10.51 | 6.12 |
| Citigroup Three-Month U.S. Treasury Bill Index | 0.04 | 0.05 | 0.79 |
| |
| CPI | | | |
| Consumer Price Index | 1.08% | 1.41% | 1.92% |
3
Bonds kept up a steady advance as Treasury yields kept dwindling
U.S. Treasury securities stretched their gains during the period as investors lost more of their appetite for risk. Bond prices moved higher, and the yield of the 10-year U.S. Treasury note fell to a record low in July, closing below 1.5%. (Bond yields and prices move in opposite directions.) The broad U.S. taxable bond market posted a return of nearly 3%, and municipal bonds had about the same result for the six months.
Investors have enjoyed years of strong bond returns, but they shouldn’t be surprised if future results are weaker. As yields tumble, the scope for further declines—and price increases—diminishes.
As it has since December 2008, the Federal Reserve Board held its target for the shortest-term interest rates between 0% and 0.25%, keeping a tight lid on the returns from money market funds and savings accounts.
Oil and natural gas price declines dampened the fund’s results
The Energy Fund’s six-month performance was influenced by the weakness in the global economy, particularly in Europe, which accounts for about 20% of the global consumption of crude oil. A slowdown in growth in China and a dimmer outlook for the U.S. economic recovery also discouraged investors early on, contributing to a slump in energy prices and energy stocks.
| | | |
| Expense Ratios | | | |
| Your Fund Compared With Its Peer Group | | | |
| | Investor | Admiral | Peer Group |
| | Shares | Shares | Average |
| Energy Fund | 0.34% | 0.28% | 1.37% |
The fund expense ratios shown are from the prospectus dated May 29, 2012, and represent estimated costs for the current fiscal year. For the six months ended July 31, 2012, the fund’s annualized expense ratios were 0.30% for Investor Shares and 0.24% for Admiral Shares. The peer-group expense ratio is derived from data provided by Lipper Inc. and captures information through year-end 2011.
Peer group: Global Natural Resources Funds.
4
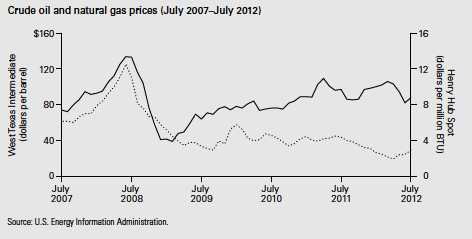
The price of West Texas Intermediate crude oil, which peaked at $106 a barrel in March, plunged nearly 22% in June. Meanwhile, natural gas prices stayed near
decade lows as increased production (partly as a result of improvements in drilling technology) and an unusually warm winter kept prices depressed.
|
| A note on oil and gas prices |
| Historically, crude oil and natural gas prices have generally moved in tandem. |
| However, as you can see in the chart below, since 2008 the prices of the two fuels |
| have often gone in separate directions. Advances in drilling technology known as |
| hydraulic fracturing, or “fracking,” have made it possible to tap previously unreachable |
| deposits of natural gas deep in rock formations. That in turn has dramatically |
| increased the supply of natural gas in the United States and pushed down prices. |
| |
| It’s just one example of the kind of variability that energy investors need to be |
| prepared for. Oil and natural gas prices are influenced by a variety of factors, including |
| the state of the global economy, geopolitics, production and supply levels, and the |
| cost of alternative fuels. Unexpected changes in any of these variables can lead to |
| volatility for energy stocks. Such volatility is one reason we suggest that the Energy |
| Fund generally be no more than a modest component of a broadly diversified |
| investment program. |
| |
 |
5
Oil and natural gas prices greatly influence the profitability of the companies in which the Energy Fund invests. And few, if any, of the fund’s largest holdings remained unscathed by the price declines.
However, a slight rebound in both oil and gas prices in July lifted some energy stocks. Better news about economic growth in China and the United States, together with the prospect of tighter crude oil supplies owing to tensions in the Persian Gulf, helped push up oil prices. Some utilities switched to natural gas and demand rose as the hot U.S. summer led more people to turn on air conditioners. Although helpful, these movements weren’t enough to significantly lift the performance of energy stocks for the six-month period.
Still, certain segments of the Energy Fund did better than others. Refining and marketing companies, a relatively small proportion of the fund’s holdings, did best. These companies beefed up their profit margins as they were able to buy oil at bargain prices and then sell it to some consumers at higher prices.
The story was very different for integrated oil and gas companies. Composing the Energy Fund’s largest chunk of assets— about 46%, on average—these giant integrated companies detracted most from the fund’s performance. The weakest results came from some of the largest oil producers in South America, which suffered double-digit losses. Local currency depreciation pushed up equipment and service costs for a Brazilian oil giant, and Argentina’s government moved to nationalize its largest oil company.
Oil and gas exploration and production companies, the fund’s second-largest segment by asset size, also did poorly. Lackluster oil and gas prices led many of these companies to curtail their activities.
The Advisors’ Report that follows this letter provides additional details about the management of the fund during the fiscal half-year.
The role sector funds can play in a balanced, diversified portfolio
One of Vanguard’s guiding principles is that balance and broad diversification can help investors manage the risks inherent in investing. And when used thoughtfully, sector funds can enhance the diversification of a portfolio that lacks exposure to a certain part of the market or is overly concentrated in a few market segments.
6
These funds can also give investors the opportunity to act on a conviction that a particular sector will outperform the broader market. We recognize that this is a popular use of sector funds, but it’s one we’d urge investors to be cautious about. Our research and our experience suggest that it is difficult to profit consistently from such convictions. The top-returning sector can change at any moment, which is why chasing short-term performance often leads to disappointment.
Although we acknowledge the challenges and risks of sector investing, Vanguard has designed its funds—whether they’re actively managed or index-tracking—to help give investors a better chance of reaching their goals. The deep investment knowledge of the funds’ advisors is an asset no matter what the market environment. And the same can be said for the funds’ low costs.
For those reasons, we believe the Energy Fund can play a role in a well-diversified portfolio for investors who can tolerate the highs and lows that inevitably accompany such a narrowly focused holding.
Thank you for entrusting your assets to Vanguard.
Sincerely,

F. William McNabb III
Chairman and Chief Executive Officer
August 13, 2012
Advisors’ Report
Vanguard Energy Fund returned –6.05% for Investor Shares and –6.03% for Admiral Shares in the six months ended July 31, 2012. Your fund is managed by two advisors, a strategy that enhances the fund’s diversification by providing exposure to distinct yet complementary investment approaches. It’s not uncommon for different advisors to have different views about individual securities or the broader investment environment.
The advisors, the amount and percentage of fund assets each manages, and brief descriptions of their investment strategies are presented in the table below. The advisors have also provided a discussion of the investment environment that existed during the year and of how their portfolio positioning reflects this assessment. These reports were prepared on August 16, 2012.
| | | |
| Vanguard Energy Fund Investment Advisors | |
| |
| | Fund Assets Managed | |
| Investment Advisor | % | $ Million | Investment Strategy |
| Wellington Management | 96 | 11,318 | Emphasizes long-term total-return opportunities from |
| Company, LLP | | | the various energy subsectors: international oils, |
| | | | foreign integrated oils and foreign producers, North |
| | | | American producers, oil services and equipment, |
| | | | transportation and distribution, and refining and |
| | | | marketing. |
| Vanguard Equity Investment | 3 | 339 | Employs a quantitative fundamental management |
| Group | | | approach, using models that assess valuation, market |
| | | | sentiment, earnings quality and growth, and |
| | | | management decisions of companies relative to their |
| | | | peers. |
| Cash Investments | 1 | 84 | These short-term reserves are invested by Vanguard in |
| | | | equity index products to simulate investments in stock. |
| | | | Each advisor may also maintain a modest cash |
| | | | position. |
8
Wellington Management Company, llp
Portfolio Manager:
Karl E. Bandtel, Senior Vice President
The investment environment
Energy stocks posted negative returns over the past six months, underperforming broad-market equity indexes in most regions of the world as investors turned to less economically sensitive market sectors.
Commodity prices were mixed. On one hand, the price of West Texas Intermediate crude oil fell approximately $10, closing the period near $88 per barrel. On the other hand, after a prolonged period of declining prices, North American natural gas began climbing above its historically depressed levels. The Henry Hub Spot price of U.S. natural gas finished the period at nearly $3 per million BTUs, up by roughly one half-dollar.
Our successes
Our position in Canada-based Progress Energy Resources was the portfolio’s top contributor for the period. This mid-capitalization company engages in natural gas exploration and production. Its stock surged in late June following news that the Malaysian state oil and gas company Petronas had agreed to acquire all outstanding shares at a significant premium.
The portfolio’s holdings in Cabot Oil & Gas, a natural gas-focused energy producer, also boosted performance. Cabot shares gained following an announcement that the company had sold its position in southern Texas’s Pearsall Shale to Osaka Gas of Japan at a higher-than-expected price. Cabot is a low-cost producer with a strong balance sheet. We believe the company should benefit from reduced natural gas production and, ultimately, higher prices.
Our shortfalls
YPF explores for, develops, and produces oil and natural gas in South America, the United States, and Indonesia. It also refines, markets, transports, and distributes oil and other petroleum products, petroleum derivatives, petrochemicals, and liquid petroleum gas. The Argentina-based company was our biggest detractor during the period. Shares fell when the Argentine government took over day-to-day control of the firm by decree in an effort to protect the country’s hydrocarbon resources.
The listed YPF shares are not subject to nationalization and are trading as before. We continue to hold the stock. Because the government owns a 51% majority stake, the remaining minority shareholders are now the government’s partners. YPF has an attractive asset profile at a very low valuation relative to the rest of the energy universe because of investor concerns that the Argentine government will not treat minority owners well.
CONSOL Energy, a coal and natural gas producer and energy services provider, also saw its stock price decline during the period, based on a deteriorating near-term outlook for coal. We were able to take advantage of this weakness and increase our position at attractive valuations.
The company has sustainable sources
9
of profitability and solid production capability. In our view, the market is underestimating the long-term value of CONSOL’s undeveloped natural gas assets. We expect the company will adapt to the price environment and continue to increase its earnings.
The fund’s positioning
We are staying the course with our strategy and portfolio positioning. Our outlook, patient and oriented toward the long term, remains favorable for the energy sector. However, as always, we remind shareholders of the uncertainty concerning the direction of commodity prices, which can make the stocks of energy companies especially volatile.
Crude oil prices will likely continue to vary with changes in the outlook for both supply and demand. Although natural gas pricing remains driven by regional factors, we think the wide price arbitrage with other fuels and changing views about nuclear power generation will spur global long-term demand.
The portfolio remains focused on upstream companies and skewed in favor of low-cost producers with compelling valuations based on our assessment of their long-term resource bases. In our view, many of these firms have the ability to create value for shareholders even absent rising commodity prices.
Our investment process remains steady, with an emphasis on large-cap integrated oil companies and exploration and production companies. Maintaining a large-cap, low-turnover bias, our global holdings span the energy sub-sectors.
Vanguard Equity Investment Group
Portfolio Manager:
James D. Troyer, CFA, Principal
For the first half of the fiscal year, the stocks in our benchmark energy index returned –5.51%, trailing the broad U.S. stock market by 10.5 percentage points. Although energy stocks in emerging markets had exhibited a strong six-month performance by this time last year, they were a mixed bag in the recent period. Energy stocks in Colombia, Malaysia, and Turkey had the strongest results, and those in Spain, Brazil, and Indonesia the weakest. The worst-performing country in the energy sector was Spain, where Argentina’s decision to expropriate most of Repsol’s holdings in its YPF subsidiary detracted most.
Broadly, concerns over Europe and signs of slowing economic growth in the United States and emerging markets affected performance and contributed to market volatility. Looking ahead to the rest of the year, brighter spots include low inflation and interest rates and signs of improvement in the housing sector. However, lingering uncertainty about Europe, expiring domestic tax cuts, a stubborn unemployment rate, and the results of the upcoming U.S. presidential election could continue to weigh on the markets.
10
While the portfolio’s performance is influenced by the broader macro environment, we do not maintain a view on the overall market for energy securities or on relative country performance. Rather, our quantitative approach to investing focuses on specific stock fundamentals within the sector. Our core signals include valuation, which measures the price we pay for earnings and cash flows, and market sentiment, which captures how investors reflect their opinion of a company through their activity in the market. During the past six months, both of these signals aided our results.
In this period, our best performers came from various regions. Overweight positions in outperforming securities such as Caltex Australia (+17.8%), Seadrill (Norway, +10.7%), and HollyFrontier (United States, +32.5%) boosted our results compared with the benchmark index. Underweight positions in securities that did poorly, such as OGX (Brazil, –70.9%), Canadian Natural Resources (–30.6%), and Repsol (Spain, –39.7%), also helped our relative return.
Unfortunately, we were not able to avoid all the laggards. Overweight positions in securities that underperformed the benchmark, such as Gazprom (Russia, –18.9%), China Coal Energy (–24.9%), Continental Resources (United States, –32.6%), and Anadarko Petroleum (United States, –13.8%), detracted from our relative results.
We thank you for your investment in the Energy Fund and look forward to the second half of the fiscal year.
11
Energy Fund
Fund Profile
As of July 31, 2012
| | |
| Share-Class Characteristics | |
| | Investor | Admiral |
| | Shares | Shares |
| Ticker Symbol | VGENX | VGELX |
| Expense Ratio1 | 0.34% | 0.28% |
| 30-Day SEC Yield | 2.12% | 2.18% |
| | | |
| Portfolio Characteristics | | |
| | | | DJ |
| | | MSCI | U.S. Total |
| | | ACWI | Market |
| | Fund | Energy | Index |
| Number of Stocks | 139 | 171 | 3,684 |
| Median Market Cap | $34.7B | $70.6B | $34.4B |
| Price/Earnings Ratio | 9.9x | 9.4x | 15.7x |
| Price/Book Ratio | 1.4x | 1.5x | 2.2x |
| Return on Equity | 17.2% | 19.1% | 18.1% |
| Earnings Growth Rate | -1.3% | 1.6% | 9.6% |
| Dividend Yield | 2.4% | 3.0% | 2.1% |
| Foreign Holdings | 40.4% | 53.0% | 0.0% |
| Turnover Rate | | | |
| (Annualized) | 20% | — | — |
| Short-Term Reserves | 2.3% | — | — |
| | |
| Volatility Measures | | |
| | | DJ |
| | Spliced | U.S. Total |
| | Energy | Market |
| | Index | Index |
| R-Squared | 0.96 | 0.81 |
| Beta | 1.04 | 1.31 |
These measures show the degree and timing of the fund’s fluctuations compared with the indexes over 36 months.
| | |
| Ten Largest Holdings (% of total net assets) |
| Exxon Mobil Corp. | Integrated Oil & | |
| | Gas | 9.1% |
| Chevron Corp. | Integrated Oil & | |
| | Gas | 5.4 |
| Royal Dutch Shell plc | Integrated Oil & | |
| | Gas | 5.2 |
| BP plc | Integrated Oil & | |
| | Gas | 3.9 |
| Occidental Petroleum | Integrated Oil & | |
| Corp. | Gas | 3.8 |
| Total SA | Integrated Oil & | |
| | Gas | 2.7 |
| Schlumberger Ltd. | Oil & Gas | |
| | Equipment & | |
| | Services | 2.3 |
| Anadarko Petroleum | Oil & Gas | |
| Corp. | Exploration & | |
| | Production | 2.2 |
| Consol Energy Inc. | Coal & Consumable | |
| | Fuels | 2.1 |
| Baker Hughes Inc. | Oil & Gas | |
| | Equipment & | |
| | Services | 1.9 |
| Top Ten | | 38.6% |
The holdings listed exclude any temporary cash investments and equity index products.
1 The expense ratios shown are from the prospectus dated May 29, 2012, and represent estimated costs for the current fiscal year. For the six months ended July 31, 2012, the annualized expense ratios were 0.30% for Investor Shares and 0.24% for Admiral Shares.
12
Energy Fund
| | |
| Subindustry Diversification (% of equity | |
| exposure) | | |
| | | MSCI |
| | | ACWI |
| | Fund | Energy |
| Coal & Consumable Fuels | 3.4% | 2.0% |
| Industrials | 0.8 | 0.0 |
| Integrated Oil & Gas | 46.4 | 56.2 |
| Oil & Gas Drilling | 2.3 | 2.1 |
| Oil & Gas Equipment & | | |
| Services | 9.3 | 9.6 |
| Oil & Gas Exploration & | | |
| Production | 32.3 | 20.8 |
| Oil & Gas Refining & Marketing | 3.7 | 4.5 |
| Oil & Gas Storage & | | |
| Transportation | 1.6 | 4.8 |
| Other | 0.2 | 0.0 |
| |
| Market Diversification (% of equity exposure) |
| Europe | |
| United Kingdom | 12.5% |
| France | 2.9 |
| Italy | 1.9 |
| Norway | 1.3 |
| Other | 1.1 |
| Subtotal | 19.7% |
| Pacific | |
| Japan | 1.7% |
| Other | 0.3 |
| Subtotal | 2.0% |
| Emerging Markets | |
| Russia | 2.7% |
| China | 2.3 |
| Brazil | 1.5 |
| Other | 1.2 |
| Subtotal | 7.7% |
| North America | |
| United States | 58.8% |
| Canada | 11.8 |
| Subtotal | 70.6% |
13
Energy Fund
Performance Summary
All of the returns in this report represent past performance, which is not a guarantee of future results that may be achieved by the fund. (Current performance may be lower or higher than the performance data cited. For performance data current to the most recent month-end, visit our website at vanguard.com/performance.) Note, too, that both investment returns and principal value can fluctuate widely, so an investor’s shares, when sold, could be worth more or less than their original cost. The returns shown do not reflect taxes that a shareholder would pay on fund distributions or on the sale of fund shares.
Fiscal-Year Total Returns (%): January 31, 2002, Through July 31, 2012
Average Annual Total Returns: Periods Ended June 30, 2012
This table presents returns through the latest calendar quarter—rather than through the end of the fiscal period.
Securities and Exchange Commission rules require that we provide this information.
| | | | |
| | Inception | One | Five | Ten |
| | Date | Year | Years | Years |
| Investor Shares | 5/23/1984 | -14.68% | -0.67% | 12.98% |
| Admiral Shares | 11/12/2001 | -14.63 | -0.61 | 13.05 |
See Financial Highlights for dividend and capital gains information.
14
Energy Fund
Financial Statements (unaudited)
Statement of Net Assets
As of July 31, 2012
The fund reports a complete list of its holdings in regulatory filings four times in each fiscal year, at the quarter-ends. For the second and fourth fiscal quarters, the lists appear in the fund’s semiannual and annual reports to shareholders. For the first and third fiscal quarters, the fund files the lists with the Securities and Exchange Commission on Form N-Q. Shareholders can look up the fund’s Forms N-Q on the SEC’s website at sec.gov. Forms N-Q may also be reviewed and copied at the SEC’s Public Reference Room (see the back cover of this report for further information).
| | | |
| | | | Market |
| | | | Value |
| | | Shares | ($000) |
| Common Stocks (97.5%)1 | | |
| United States (57.1%) | | |
| Energy Equipment & Services (9.9%) | |
| | Schlumberger Ltd. | 3,832,064 | 273,073 |
| | Baker Hughes Inc. | 4,829,750 | 223,714 |
| | Halliburton Co. | 5,426,262 | 179,772 |
| | National Oilwell Varco Inc. | 1,380,076 | 99,779 |
| * | SEACOR Holdings Inc. | 919,408 | 78,104 |
| * | Superior Energy | | |
| | Services Inc. | 3,067,900 | 66,481 |
| * | Weatherford | | |
| | International Ltd. | 5,495,000 | 66,215 |
| | Noble Corp. | 1,689,825 | 62,523 |
| | Bristow Group Inc. | 1,231,485 | 56,365 |
| | Transocean Ltd. | 1,075,802 | 50,380 |
| | Diamond Offshore | | |
| | Drilling Inc. | 35,800 | 2,342 |
| * | Nabors Industries Ltd. | 156,400 | 2,165 |
| | Helmerich & Payne Inc. | 44,100 | 2,051 |
| | | | 1,162,964 |
| Exchange-Traded Fund (0.6%) | |
| ^,2 | Vanguard Energy ETF | 663,000 | 67,029 |
| |
| Oil, Gas & Consumable Fuels (46.6%) | |
| | Coal & Consumable Fuels (2.5%) | |
| | CONSOL Energy Inc. | 8,550,600 | 247,797 |
| | Peabody Energy Corp. | 2,182,000 | 45,560 |
| |
| | Integrated Oil & Gas (19.2%) | |
| | Exxon Mobil Corp. | 12,353,419 | 1,072,894 |
| | Chevron Corp. | 5,831,335 | 638,998 |
| | Occidental Petroleum | | |
| | Corp. | 5,072,541 | 441,463 |
| | Hess Corp. | 2,081,339 | 98,156 |
| | Murphy Oil Corp. | 20,000 | 1,073 |
| |
| | Oil & Gas Exploration & Production (21.9%) |
| | Anadarko Petroleum Corp. 3,682,830 | 255,736 |
| | | |
| | | | Market |
| | | | Value |
| | | Shares | ($000) |
| | Cabot Oil & Gas Corp. | 4,814,962 | 203,143 |
| | Devon Energy Corp. | 3,304,605 | 195,368 |
| | EOG Resources Inc. | 1,804,936 | 176,902 |
| * | Southwestern Energy Co. | 4,614,305 | 153,426 |
| | ConocoPhillips | 2,813,609 | 153,173 |
| * | Denbury Resources Inc. | 9,684,544 | 146,430 |
| | Range Resources Corp. | 2,335,000 | 146,171 |
| | Noble Energy Inc. | 1,603,814 | 140,221 |
| | Apache Corp. | 1,495,975 | 128,833 |
| | EQT Corp. | 1,972,800 | 111,266 |
| * | WPX Energy Inc. | 6,850,100 | 109,259 |
| *,^ | Ultra Petroleum Corp. | 3,590,636 | 85,314 |
| | QEP Resources Inc. | 2,533,747 | 76,088 |
| | Chesapeake Energy Corp. | 3,944,737 | 74,240 |
| | Pioneer Natural | | |
| | Resources Co. | 827,230 | 73,317 |
| | Marathon Oil Corp. | 2,692,191 | 71,262 |
| * | Newfield Exploration Co. | 2,237,203 | 68,302 |
| * | Cobalt International | | |
| | Energy Inc. | 2,630,417 | 66,023 |
| * | Whiting Petroleum Corp. | 1,383,800 | 55,906 |
| * | Gran Tierra Energy Inc. | 6,791,100 | 31,083 |
| | Energen Corp. | 565,261 | 28,947 |
| * | Kosmos Energy Ltd. | 1,790,210 | 17,079 |
| * | Continental Resources Inc. | 26,200 | 1,677 |
| |
| | Oil & Gas Refining & Marketing (2.5%) |
| | Valero Energy Corp. | 4,839,642 | 133,090 |
| | Marathon Petroleum Corp. 2,164,195 | 102,366 |
| | Phillips 66 | 1,722,754 | 64,776 |
| | HollyFrontier Corp. | 72,400 | 2,707 |
| |
| | Oil & Gas Storage & Transportation (0.5%) |
| | Kinder Morgan Inc. | 1,655,431 | 59,281 |
| | Spectra Energy Corp. | 12,500 | 384 |
| | Williams Cos. Inc. | 11,200 | 356 |
| | | | 5,478,067 |
| Total United States | | 6,708,060 |
15
Energy Fund
| | | |
| | | | Market |
| | | | Value |
| | | Shares | ($000) |
| International (40.4%) | | |
| Argentina (0.5%) | | |
| | YPF SA ADR | 4,656,400 | 53,130 |
| Australia (0.3%) | | |
| | Oil Search Ltd. | 3,897,262 | 28,442 |
| | Caltex Australia Ltd. | 140,922 | 2,086 |
| | Woodside Petroleum Ltd. | 20,398 | 719 |
| | | | 31,247 |
| Austria (0.0%) | | |
| | OMV AG | 74,014 | 2,322 |
| |
| Brazil (1.5%) | | |
| | Petroleo Brasileiro | | |
| | SA ADR | 7,902,150 | 155,119 |
| * | OGX Petroleo e Gas | | |
| | Participacoes SA | 4,265,200 | 11,885 |
| | Petroleo Brasileiro SA | | |
| | Prior Pfd. | 385,244 | 3,666 |
| | Petroleo Brasileiro SA | 252,132 | 2,471 |
| | Petroleo Brasileiro SA | | |
| | ADR Type A | 2,450 | 46 |
| | | | 173,187 |
| Canada (11.5%) | | |
| | Canadian Natural | | |
| | Resources Ltd. | 8,094,918 | 220,586 |
| | Encana Corp. | 8,388,795 | 186,651 |
| | Suncor Energy Inc. | 5,931,712 | 181,154 |
| | Progress Energy | | |
| | Resources Corp. | 5,995,000 | 136,058 |
| | Cenovus Energy Inc. | 4,335,000 | 132,261 |
| | TransCanada Corp. | 1,836,496 | 83,634 |
| | Canadian Oil Sands Ltd. | 2,967,100 | 59,728 |
| * | Tourmaline Oil Corp. | 1,999,100 | 57,909 |
| | Cameco Corp. | 2,659,500 | 55,584 |
| * | Celtic Exploration Ltd. | 2,839,700 | 49,582 |
| | Pacific Rubiales | | |
| | Energy Corp. | 2,122,800 | 48,029 |
| | Penn West | | |
| | Petroleum Ltd. | 3,144,421 | 42,796 |
| 3 | Crescent Point | | |
| | Energy Corp. 144A | 857,600 | 34,087 |
| | Petrominerales Ltd. | 2,292,480 | 21,214 |
| * | Athabasca Oil Corp. | 1,541,600 | 18,892 |
| * | MEG Energy Corp. | 274,017 | 11,148 |
| | Suncor Energy Inc. | 235,234 | 7,192 |
| | Imperial Oil Ltd. | 72,900 | 3,123 |
| | Canadian Natural | | |
| | Resources Ltd. | 65,078 | 1,775 |
| | Enbridge Inc. | 42,650 | 1,745 |
| ^ | Crescent Point Energy Corp. | 29,600 | 1,176 |
| | Cenovus Energy Inc. | 34,639 | 1,059 |
| | | | 1,355,383 |
| China (2.3%) | | |
| | PetroChina Co. Ltd. ADR | 995,200 | 124,340 |
| | | |
| | | | Market |
| | | | Value |
| | | Shares | ($000) |
| | Beijing Enterprises | | |
| | Holdings Ltd. | 12,960,500 | 84,136 |
| | China Shenhua | | |
| | Energy Co. Ltd. | 11,974,500 | 44,562 |
| | CNOOC Ltd. | 2,169,717 | 4,352 |
| | PetroChina Co. Ltd. | 2,722,000 | 3,399 |
| | China Petroleum & | | |
| | Chemical Corp. | 3,532,000 | 3,181 |
| | China Oilfield | | |
| | Services Ltd. | 722,000 | 1,106 |
| | | | 265,076 |
| Colombia (0.0%) | | |
| | Ecopetrol SA ADR | 57,891 | 3,313 |
| |
| France (2.9%) | | |
| | Total SA ADR | 6,972,700 | 320,395 |
| | Total SA | 279,142 | 12,862 |
| | Technip SA | 11,028 | 1,158 |
| | | | 334,415 |
| Hungary (0.0%) | | |
| | MOL Hungarian Oil | | |
| | and Gas plc | 22,715 | 1,634 |
| |
| India (0.7%) | | |
| | Reliance Industries Ltd. | 5,975,782 | 79,488 |
| | Oil & Natural Gas | | |
| | Corp. Ltd. | 444,511 | 2,277 |
| * | Cairn India Ltd. | 322,307 | 1,923 |
| | | | 83,688 |
| Italy (1.9%) | | |
| | Eni SPA ADR | 4,718,050 | 194,573 |
| | Eni SPA | 1,201,388 | 24,773 |
| | | | 219,346 |
| Japan (1.7%) | | |
| | Inpex Corp. | 30,091 | 167,197 |
| | JX Holdings Inc. | 5,404,900 | 25,980 |
| | Idemitsu Kosan Co. Ltd. | 20,900 | 1,751 |
| | Japan Petroleum | | |
| | Exploration Co. | 29,300 | 1,098 |
| | | | 196,026 |
| Netherlands (0.0%) | | |
| * | SBM Offshore NV | 118,965 | 1,450 |
| |
| Norway (1.2%) | | |
| | Statoil ASA ADR | 4,225,900 | 100,534 |
| ^,4 | Nordic American | | |
| | Tankers Ltd. | 2,807,618 | 32,849 |
| | Statoil ASA | 197,659 | 4,698 |
| | Seadrill Ltd. | 85,926 | 3,349 |
| | Aker Solutions ASA | 141,052 | 2,066 |
| | | | 143,496 |
| Poland (0.0%) | | |
| * | Polski Koncern Naftowy | | |
| | Orlen SA | 199,335 | 2,130 |
16
Energy Fund
| | | |
| | | | Market |
| | | | Value |
| | | Shares | ($000) |
| Portugal (0.4%) | | |
| | Galp Energia SGPS SA | 3,404,189 | 46,045 |
| |
| Russia (2.6%) | | |
| | Gazprom OAO ADR | | |
| | (London Shares) | 17,720,384 | 162,928 |
| | Rosneft OAO GDR | 10,893,885 | 65,217 |
| | Lukoil OAO ADR | 1,132,300 | 63,659 |
| | Lukoil Sponsored ADR | 89,143 | 5,012 |
| | Tatneft OAO ADR | 74,138 | 2,773 |
| | AK Transneft OAO | | |
| | Prior Pfd. | 1,348 | 2,156 |
| | Surgutneftegas OAO | | |
| | Prior Pfd. | 2,360,800 | 1,369 |
| * | Surgutneftegas OAO ADR | 146,580 | 1,222 |
| | Gazprom OAO | 124,674 | 576 |
| | | | 304,912 |
| South Africa (0.0%) | | |
| | Sasol Ltd. | 102,561 | 4,255 |
| |
| Spain (0.7%) | | |
| | Repsol SA | 4,952,813 | 78,934 |
| |
| Thailand (0.0%) | | |
| | PTT PCL (Foreign) | 265,500 | 2,735 |
| | PTT Exploration & | | |
| | Production PCL (Foreign) | 451,200 | 2,167 |
| | | | 4,902 |
| Turkey (0.0%) | | |
| | Tupras Turkiye | | |
| | Petrol Rafinerileri AS | 97,299 | 2,137 |
| |
| United Kingdom (12.2%) | | |
| | BP plc ADR | 11,133,400 | 444,223 |
| | Royal Dutch | | |
| | Shell plc ADR | 6,397,100 | 436,282 |
| | BG Group plc | 10,807,446 | 212,750 |
| | Royal Dutch Shell plc | | |
| | Class B | 4,414,243 | 155,285 |
| | Ensco plc Class A | 2,469,306 | 134,157 |
| | Royal Dutch Shell plc | | |
| | Class A | 479,872 | 16,308 |
| | BP plc | 2,421,323 | 16,077 |
| * | Genel Energy plc | 1,306,479 | 13,091 |
| | Royal Dutch Shell plc | | |
| | Class A | | |
| | (Amsterdam Shares) | 113,561 | 3,868 |
| | AMEC plc | 141,355 | 2,467 |
| | Petrofac Ltd. | 104,166 | 2,423 |
| | Tullow Oil plc | 25,005 | 503 |
| * | Cairn Energy plc | 1 | — |
| | | | 1,437,434 |
| | | |
| | | | Market |
| | | | Value |
| | | Shares | ($000) |
| Total International | | 4,744,462 |
| Total Common Stocks | | |
| (Cost $8,302,333) | | 11,452,522 |
| Temporary Cash Investments (2.9%)1 | |
| Money Market Fund (0.4%) | | |
| 5,6 | Vanguard Market | | |
| | Liquidity Fund, 0.155% | 43,647,602 | 43,648 |
| |
| | | Face | |
| | | Amount | |
| | | ($000) | |
| Repurchase Agreement (2.4%) | |
| | Deutsche Bank | | |
| | Securities, Inc. | | |
| | 0.190%, 8/1/12 | | |
| | (Dated 7/31/12, | | |
| | Repurchase Value | | |
| | $282,900,000, | | |
| | collateralized by | | |
| | Federal National | | |
| | Mortgage Assn. | | |
| | 3.500%–4.500%, | | |
| | 6/1/26–4/1/41) | 282,900 | 282,900 |
| |
| U.S. Government and Agency Obligations (0.1%) |
| 7 | Fannie Mae Discount | | |
| | Notes, 0.104%, 8/1/12 | 3,000 | 3,000 |
| 8,9 | Federal Home Loan | | |
| | Bank Discount Notes, | | |
| | 0.130%, 10/19/12 | 100 | 100 |
| 9 | United States Treasury Note/ | |
| | Bond, 1.375%, 9/15/12 | 1,000 | 1,001 |
| 9 | United States Treasury Note/ | |
| | Bond, 0.375%, 10/31/12 | 4,000 | 4,002 |
| | | | 8,103 |
| Total Temporary Cash Investments | |
| (Cost $334,651) | | 334,651 |
| Total Investments (100.4%) | | |
| (Cost $8,636,984) | | 11,787,173 |
| Other Assets and Liabilities (-0.4%) | |
| Other Assets | | 36,773 |
| Liabilities6 | | (82,954) |
| | | | (46,181) |
| Net Assets (100%) | | 11,740,992 |
17
Energy Fund
| |
| At July 31, 2012, net assets consisted of: |
| | Amount |
| | ($000) |
| Paid-in Capital | 8,497,415 |
| Undistributed Net Investment Income | 114,746 |
| Accumulated Net Realized Losses | (22,748) |
| Unrealized Appreciation (Depreciation) | |
| Investment Securities | 3,150,189 |
| Futures Contracts | 1,419 |
| Foreign Currencies | (29) |
| Net Assets | 11,740,992 |
| |
| Investor Shares—Net Assets | |
| Applicable to 93,508,399 outstanding | |
| $.001 par value shares of beneficial | |
| interest (unlimited authorization) | 5,406,435 |
| Net Asset Value Per Share— | |
| Investor Shares | $57.82 |
| |
| Admiral Shares—Net Assets | |
| Applicable to 58,345,023 outstanding | |
| $.001 par value shares of beneficial | |
| interest (unlimited authorization) | 6,334,557 |
| Net Asset Value Per Share— | |
| Admiral Shares | $108.57 |
See Note A in Notes to Financial Statements.
* Non-income-producing security.
^ Part of security position is on loan to broker-dealers. The total value of securities on loan is $34,489,000.
1The fund invests a portion of its cash reserves in equity markets through the use of index futures contracts. After giving effect to futures investments, the fund’s effective common stock and temporary cash investment positions represent 97.8% and 2.6%, respectively, of net assets.
2 Considered an affiliated company of the fund as the issuer is another member of The Vanguard Group.
3 Security exempt from registration under Rule 144A of the Securities Act of 1933. Such securities may be sold in transactions exempt from registration, normally to qualified institutional buyers. At July 31, 2012, the value of this security represented 0.3% of net assets.
4 Considered an affiliated company of the fund as the fund owns more than 5% of the outstanding voting securities of such company.
5 Affiliated money market fund available only to Vanguard funds and certain trusts and accounts managed by Vanguard. Rate shown is the 7-day yield.
6 Includes $36,769,000 of collateral received for securities on loan.
7 The issuer was placed under federal conservatorship in September 2008; since that time, its daily operations have been managed by the Federal Housing Finance Agency and it receives capital from the U.S. Treasury in exchange for senior preferred stock.
8 The issuer operates under a congressional charter; its securities are generally neither guaranteed by the U.S. Treasury nor backed by the full faith and credit of the U.S. government.
9 Securities with a value of $2,102,000 have been segregated as initial margin for open futures contracts.
ADR—American Depositary Receipt.
GDR—Global Depositary Receipt.
See accompanying Notes, which are an integral part of the Financial Statements.
18
Energy Fund
| |
| Statement of Operations | |
| |
| | Six Months Ended |
| | July 31, 2012 |
| | ($000) |
| Investment Income | |
| Income | |
| Dividends1,2 | 159,087 |
| Interest2 | 341 |
| Security Lending | 4,848 |
| Total Income | 164,276 |
| Expenses | |
| Investment Advisory Fees—Note B | |
| Basic Fee | 8,588 |
| Performance Adjustment | (2,343) |
| The Vanguard Group—Note C | |
| Management and Administrative—Investor Shares | 4,697 |
| Management and Administrative—Admiral Shares | 3,595 |
| Marketing and Distribution—Investor Shares | 673 |
| Marketing and Distribution—Admiral Shares | 637 |
| Custodian Fees | 267 |
| Shareholders’ Reports—Investor Shares | 62 |
| Shareholders’ Reports—Admiral Shares | 14 |
| Trustees’ Fees and Expenses | 13 |
| Total Expenses | 16,203 |
| Expenses Paid Indirectly | (77) |
| Net Expenses | 16,126 |
| Net Investment Income | 148,150 |
| Realized Net Gain (Loss) | |
| Investment Securities Sold2 | 13,672 |
| Futures Contracts | 17,271 |
| Foreign Currencies | (449) |
| Realized Net Gain (Loss) | 30,494 |
| Change in Unrealized Appreciation (Depreciation) | |
| Investment Securities | (940,921) |
| Futures Contracts | (6,143) |
| Foreign Currencies | (66) |
| Change in Unrealized Appreciation (Depreciation) | (947,130) |
| Net Increase (Decrease) in Net Assets Resulting from Operations | (768,486) |
1 Dividends are net of foreign withholding taxes of $11,155,000.
2 Dividend income, interest income, and realized net gain (loss) from affiliated companies of the fund were $541,000, $87,000, and ($3,153,000), respectively.
See accompanying Notes, which are an integral part of the Financial Statements.
19
Energy Fund
| | |
| Statement of Changes in Net Assets | | |
| |
| | Six Months Ended | Year Ended |
| | July 31, | January 31, |
| | 2012 | 2012 |
| | ($000) | ($000) |
| Increase (Decrease) in Net Assets | | |
| Operations | | |
| Net Investment Income | 148,150 | 224,513 |
| Realized Net Gain (Loss) | 30,494 | 612,079 |
| Change in Unrealized Appreciation (Depreciation) | (947,130) | (1,387,420) |
| Net Increase (Decrease) in Net Assets Resulting from Operations | (768,486) | (550,828) |
| Distributions | | |
| Net Investment Income | | |
| Investor Shares | (4,687) | (99,757) |
| Admiral Shares | (5,780) | (118,812) |
| Realized Capital Gain1 | | |
| Investor Shares | (98,884) | (241,252) |
| Admiral Shares | (111,066) | (269,367) |
| Total Distributions | (220,417) | (729,188) |
| Capital Share Transactions | | |
| Investor Shares | (66,329) | (156,067) |
| Admiral Shares | 94,819 | 535,094 |
| Net Increase (Decrease) from Capital Share Transactions | 28,490 | 379,027 |
| Total Increase (Decrease) | (960,413) | (900,989) |
| Net Assets | | |
| Beginning of Period | 12,701,405 | 13,602,394 |
| End of Period2 | 11,740,992 | 12,701,405 |
1 Includes fiscal 2013 and 2012 short-term gain distributions totaling $0 and $54,868,000, respectively. Short-term gain distributions are treated as ordinary income dividends for tax purposes.
2 Net Assets—End of Period includes undistributed (overdistributed) net investment income of $114,746,000 and ($25,183,000).
See accompanying Notes, which are an integral part of the Financial Statements.
20
Energy Fund
Financial Highlights
| | | | | | |
| Investor Shares | | | | | | |
| Six Months | | | | | |
| | Ended | | | | | |
| For a Share Outstanding | July 31, | | | Year Ended January 31, |
| Throughout Each Period | 2012 | 2012 | 2011 | 2010 | 2009 | 2008 |
| Net Asset Value, Beginning of Period | $62.60 | $69.20 | $57.17 | $42.62 | $73.93 | $63.55 |
| Investment Operations | | | | | | |
| Net Investment Income | .720 | 1.072 | 1.053 | .910 | 1.2761 | 1.226 |
| Net Realized and Unrealized Gain | | | | | | |
| (Loss) on Investments | (4.417) | (3.949) | 14.103 | 14.591 | (28.853) | 14.639 |
| Total from Investment Operations | (3.697) | (2.877) | 15.156 | 15.501 | (27.577) | 15.865 |
| Distributions | | | | | | |
| Dividends from Net Investment Income | (.049) | (1.102) | (.977) | (.951) | (1.264) | (1.177) |
| Distributions from Realized Capital Gains | (1.034) | (2.621) | (2.149) | — | (2.469) | (4.308) |
| Total Distributions | (1.083) | (3.723) | (3.126) | (.951) | (3.733) | (5.485) |
| Net Asset Value, End of Period | $57.82 | $62.60 | $69.20 | $57.17 | $42.62 | $73.93 |
| |
| Total Return2 | -6.05% | -3.82% | 27.17% | 36.28% | -38.51% | 25.02% |
| |
| Ratios/Supplemental Data | | | | | | |
| Net Assets, End of Period (Millions) | $5,406 | $5,945 | $6,731 | $6,536 | $4,434 | $7,919 |
| Ratio of Total Expenses to | | | | | | |
| Average Net Assets | 0.30%3 | 0.34%3 | 0.34%3 | 0.38%3 | 0.28%3 | 0.25% |
| Ratio of Net Investment Income to | | | | | | |
| Average Net Assets | 2.43% | 1.67% | 1.74% | 1.73% | 1.84% | 1.67% |
| Portfolio Turnover Rate | 20% | 24% | 31% | 27% | 21% | 22% |
The expense ratio, net income ratio, and turnover rate for the current period have been annualized.
1 Calculated based on average shares outstanding.
2 Total returns do not include transaction or account service fees that may have applied in the periods shown. Fund prospectuses provide information about any applicable transaction and account service fees.
3 Includes performance-based investment advisory fee increases (decreases) of (0.04%) for fiscal 2013, 0.01% for fiscal 2012, 0.00% for fiscal 2011, 0.03% for fiscal 2010, and 0.01% for fiscal 2009.
See accompanying Notes, which are an integral part of the Financial Statements.
21
Energy Fund
Financial Highlights
| | | | | | |
| Admiral Shares | | | | | | |
| Six Months | | | | | |
| | Ended | | | | | |
| For a Share Outstanding | July 31, | | | Year Ended January 31, |
| Throughout Each Period | 2012 | 2012 | 2011 | 2010 | 2009 | 2008 |
| Net Asset Value, Beginning of Period | $117.52 | $129.93 | $107.34 | $80.02 | $138.86 | $119.35 |
| Investment Operations | | | | | | |
| Net Investment Income | 1.386 | 2.101 | 2.045 | 1.780 | 2.4801 | 2.418 |
| Net Realized and Unrealized Gain | | | | | | |
| (Loss) on Investments | (8.294) | (7.432) | 26.479 | 27.395 | (54.203) | 27.505 |
| Total from Investment Operations | (6.908) | (5.331) | 28.524 | 29.175 | (51.723) | 29.923 |
| Distributions | | | | | | |
| Dividends from Net Investment Income | (.101) | (2.159) | (1.899) | (1.855) | (2.480) | (2.322) |
| Distributions from Realized Capital Gains | (1.941) | (4.920) | (4.035) | — | (4.637) | (8.091) |
| Total Distributions | (2.042) | (7.079) | (5.934) | (1.855) | (7.117) | (10.413) |
| Net Asset Value, End of Period | $108.57 | $117.52 | $129.93 | $107.34 | $80.02 | $138.86 |
| |
| Total Return2 | -6.03% | -3.76% | 27.24% | 36.37% | -38.46% | 25.13% |
| |
| Ratios/Supplemental Data | | | | | | |
| Net Assets, End of Period (Millions) | $6,335 | $6,756 | $6,871 | $4,439 | $2,889 | $5,214 |
| Ratio of Total Expenses to | | | | | | |
| Average Net Assets | 0.24%3 | 0.28%3 | 0.28%3 | 0.31%3 | 0.21%3 | 0.17% |
| Ratio of Net Investment Income to | | | | | | |
| Average Net Assets | 2.49% | 1.73% | 1.80% | 1.80% | 1.91% | 1.75% |
| Portfolio Turnover Rate | 20% | 24% | 31% | 27% | 21% | 22% |
The expense ratio, net income ratio, and turnover rate for the current period have been annualized.
1 Calculated based on average shares outstanding.
2 Total returns do not include transaction or account service fees that may have applied in the periods shown. Fund prospectuses provide information about any applicable transaction and account service fees.
3 Includes performance-based investment advisory fee increases (decreases) of (0.04%) for fiscal 2013, 0.01% for fiscal 2012, 0.00% for fiscal 2011, 0.03% for fiscal 2010, and 0.01% for fiscal 2009.
See accompanying Notes, which are an integral part of the Financial Statements.
22
Energy Fund
Notes to Financial Statements
Vanguard Energy Fund is registered under the Investment Company Act of 1940 as an open-end investment company, or mutual fund. The fund invests in securities of foreign issuers, which may subject it to investment risks not normally associated with investing in securities of U.S. corporations. The fund offers two classes of shares: Investor Shares and Admiral Shares. Investor Shares are available to any investor who meets the fund’s minimum purchase requirements. Admiral Shares are designed for investors who meet certain administrative, service, and account-size criteria.
A. The following significant accounting policies conform to generally accepted accounting principles for U.S. mutual funds. The fund consistently follows such policies in preparing its financial statements.
1. Security Valuation: Securities are valued as of the close of trading on the New York Stock Exchange (generally 4 p.m., Eastern time) on the valuation date. Equity securities are valued at the latest quoted sales prices or official closing prices taken from the primary market in which each security trades; such securities not traded on the valuation date are valued at the mean of the latest quoted bid and asked prices. Securities for which market quotations are not readily available, or whose values have been affected by events occurring before the fund’s pricing time but after the close of the securities’ primary markets, are valued at their fair values calculated according to procedures adopted by the board of trustees. These procedures include obtaining quotations from an independent pricing service, monitoring news to identify significant market- or security-specific events, and evaluating changes in the values of foreign market proxies (for example, ADRs, futures contracts, or exchange-traded funds), between the time the foreign markets close and the fund’s pricing time. When fair-value pricing is employed, the prices of securities used by a fund to calculate its net asset value may differ from quoted or published prices for the same securities. Investments in Vanguard Market Liquidity Fund are valued at that fund’s net asset value. Temporary cash investments acquired over 60 days to maturity are valued using the latest bid prices or using valuations based on a matrix system (which considers such factors as security prices, yields, maturities, and ratings), both as furnished by independent pricing services. Other temporary cash investments are valued at amortized cost, which approximates market value.
2. Foreign Currency: Securities and other assets and liabilities denominated in foreign currencies are translated into U.S. dollars using exchange rates obtained from an independent third party as of the fund’s pricing time on the valuation date. Realized gains (losses) and unrealized appreciation (depreciation) on investment securities include the effects of changes in exchange rates since the securities were purchased, combined with the effects of changes in security prices. Fluctuations in the value of other assets and liabilities resulting from changes in exchange rates are recorded as unrealized foreign currency gains (losses) until the assets or liabilities are settled in cash, at which time they are recorded as realized foreign currency gains (losses).
3. Futures Contracts: The fund uses index futures contracts to a limited extent, with the objective of maintaining full exposure to the stock market while maintaining liquidity. The fund may purchase or sell futures contracts to achieve a desired level of investment, whether to accommodate portfolio turnover or cash flows from capital share transactions. The primary risks associated with the use of futures contracts are imperfect correlation between changes in market values of stocks held by the fund and the prices of futures contracts, and the possibility of an illiquid market.
Futures contracts are valued at their quoted daily settlement prices. The aggregate principal amounts of the contracts are not recorded in the Statement of Net Assets. Fluctuations in the value of the contracts are recorded in the Statement of Net Assets as an asset (liability) and in the Statement of Operations as unrealized appreciation (depreciation) until the contracts are closed, when they are recorded as realized futures gains (losses).
23
Energy Fund
4. Repurchase Agreements: The fund may enter into repurchase agreements. Securities pledged as collateral for repurchase agreements are held by a custodian bank until the agreements mature. Each agreement requires that the market value of the collateral be sufficient to cover payments of interest and principal. In the event of default or bankruptcy by the other party to the agreement, the fund may sell or retain the collateral; however, such action may be subject to legal proceedings.
5. Federal Income Taxes: The fund intends to continue to qualify as a regulated investment company and distribute all of its taxable income. Management has analyzed the fund’s tax positions taken for all open federal income tax years (January 31, 2009–2012), and for the period ended July 31, 2012, and has concluded that no provision for federal income tax is required in the fund’s financial statements.
6. Distributions: Distributions to shareholders are recorded on the ex-dividend date.
7. Security Lending: The fund may lend its securities to qualified institutional borrowers to earn additional income. Security loans are required to be secured at all times by collateral at least equal to the market value of securities loaned. The fund invests cash collateral received in Vanguard Market Liquidity Fund, and records a liability for the return of the collateral, during the period the securities are on loan. Security lending income represents fees charged to borrowers plus income earned on investing cash collateral, less expenses associated with the loan.
8. Other: Dividend income is recorded on the ex-dividend date. Interest income includes income distributions received from Vanguard Market Liquidity Fund and is accrued daily. Security transactions are accounted for on the date securities are bought or sold. Costs used to determine realized gains (losses) on the sale of investment securities are those of the specific securities sold. Fees assessed on redemptions of capital shares are credited to paid-in capital.
Each class of shares has equal rights as to assets and earnings, except that each class separately bears certain class-specific expenses related to maintenance of shareholder accounts (included in Management and Administrative expenses) and shareholder reporting. Marketing and distribution expenses are allocated to each class of shares based on a method approved by the board of trustees. Income, other non-class-specific expenses, and gains and losses on investments are allocated to each class of shares based on its relative net assets.
B. Wellington Management Company, LLP, provides investment advisory services to a portion of the fund for a fee calculated at an annual percentage rate of average net assets managed by the advisor. The basic fee is subject to quarterly adjustments based on performance for the preceding three years relative to a combined index composed of the S&P Citigroup BMI World Energy Index and the S&P 500 Energy Equal Weighted Blend Index through July 31, 2010, and the current benchmark, MSCI ACWI Energy Index, thereafter. The benchmark change will be fully phased in by July 2013.
The Vanguard Group provides investment advisory services to a portion of the fund on an at-cost basis; the fund paid Vanguard advisory fees of $157,000 for the six months ended July 31, 2012.
For the six months ended July 31, 2012, the aggregate investment advisory fee represented an effective annual basic rate of 0.14% of the fund’s average net assets, before a decrease of $2,343,000 (0.04%) based on performance.
C. The Vanguard Group furnishes at cost corporate management, administrative, marketing, and distribution services. The costs of such services are allocated to the fund under methods approved by the board of trustees. The fund has committed to provide up to 0.40% of its net assets in capital contributions to Vanguard. At July 31, 2012, the fund had contributed capital of $1,688,000 to Vanguard (included in Other Assets), representing 0.01% of the fund’s net assets and 0.68% of Vanguard’s capitalization. The fund’s trustees and officers are also directors and officers of Vanguard.
24
Energy Fund
D. The fund has asked its investment advisors to direct certain security trades, subject to obtaining the best price and execution, to brokers who have agreed to rebate to the fund part of the commissions generated. Such rebates are used solely to reduce the fund’s management and administrative expenses. For the six months ended July 31, 2012, these arrangements reduced the fund’s expenses by $77,000 (an annual rate of 0.00% of average net assets).
E. Various inputs may be used to determine the value of the fund’s investments. These inputs are summarized in three broad levels for financial statement purposes. The inputs or methodologies used to value securities are not necessarily an indication of the risk associated with investing in those securities.
Level 1—Quoted prices in active markets for identical securities.
Level 2—Other significant observable inputs (including quoted prices for similar securities, interest rates, prepayment speeds, credit risk, etc.).
Level 3—Significant unobservable inputs (including the fund’s own assumptions used to determine the fair value of investments).
The following table summarizes the market value of the fund’s investments as of July 31, 2012, based on the inputs used to value them:
| | | |
| | Level 1 | Level 2 | Level 3 |
| Investments | ($000) | ($000) | ($000) |
| Common Stocks—United States | 6,708,060 | — | — |
| Common Stocks—International | 3,338,280 | 1,406,182 | — |
| Temporary Cash Investments | 43,648 | 291,003 | — |
| Futures Contracts—Liabilities1 | (116) | — | — |
| Total | 10,089,872 | 1,697,185 | — |
| 1 Represents variation margin on the last day of the reporting period. |
F. At July 31, 2012, the aggregate settlement value of open futures contracts and the related unrealized appreciation (depreciation) were:
| | | | |
| | | | | ($000) |
| | | | Aggregate | |
| | | Number of | Settlement | Unrealized |
| | | Long (Short) | Value | Appreciation |
| Futures Contracts | Expiration | Contracts | Long (Short) | (Depreciation) |
| S&P 500 Index | September 2012 | 75 | 25,774 | 1,382 |
| E-mini S&P 500 Index | September 2012 | 18 | 1,237 | 37 |
Unrealized appreciation (depreciation) on open futures contracts is required to be treated as realized gain (loss) for tax purposes
25
Energy Fund
G. Distributions are determined on a tax basis and may differ from net investment income and realized capital gains for financial reporting purposes. Differences may be permanent or temporary. Permanent differences are reclassified among capital accounts in the financial statements to reflect their tax character. Temporary differences arise when certain items of income, expense, gain, or loss are recognized in different periods for financial statement and tax purposes; these differences will reverse at some time in the future. Differences in classification may also result from the treatment of short-term gains as ordinary income for tax purposes. The fund’s tax-basis capital gains and losses are determined only at the end of each fiscal year.
During the six months ended July 31, 2012, the fund realized net foreign currency losses of $449,000, which decreased distributable net income for tax purposes; accordingly, such losses have been reclassified from accumulated net realized losses to undistributed net investment income. Certain of the fund’s investments are in securities considered to be “passive foreign investment companies,” for which any unrealized appreciation and/or realized gains are required to be included in distributable net income for tax purposes. During the six months ended July 31, 2012, the fund realized gains on the sale of passive foreign investment companies of $2,698,000, which have been included in current and prior periods’ taxable income; accordingly, such gains have been reclassified from accumulated net realized losses to undistributed net investment income. Passive foreign investment companies held at July 31, 2012, had unrealized appreciation of $12,860,000 as of January 31, 2012, the most recent mark-to-market date for tax purposes. This amount has been distributed and is reflected in the balance of undistributed net investment income.
At July 31, 2012, the cost of investment securities for tax purposes was $8,649,844,000. Net unrealized appreciation of investment securities for tax purposes was $3,137,329,000, consisting of unrealized gains of $3,697,478,000 on securities that had risen in value since their purchase and $560,149,000 in unrealized losses on securities that had fallen in value since their purchase.
H. During the six months ended July 31, 2012, the fund purchased $1,336,020,000 of investment securities and sold $1,192,835,000 of investment securities, other than temporary cash investments.
I. Capital share transactions for each class of shares were:
| | | | |
| | Six Months Ended | | Year Ended |
| | | July 31, 2012 | January 31, 2012 |
| | Amount | Shares | Amount | Shares |
| | ($000) | (000) | ($000) | (000) |
| Investor Shares | | | | |
| Issued | 418,304 | 6,955 | 1,166,296 | 17,219 |
| Issued in Lieu of Cash Distributions | 99,590 | 1,575 | 328,737 | 5,528 |
| Redeemed1 | (584,223) | (9,999) | (1,651,100) | (25,049) |
| Net Increase (Decrease)—Investor Shares | (66,329) | (1,469) | (156,067) | (2,302) |
| Admiral Shares | | | | |
| Issued | 471,746 | 4,336 | 1,350,158 | 10,745 |
| Issued in Lieu of Cash Distributions | 106,496 | 897 | 352,941 | 3,171 |
| Redeemed1 | (483,423) | (4,375) | (1,168,005) | (9,311) |
| Net Increase (Decrease)—Admiral Shares | 94,819 | 858 | 535,094 | 4,605 |
1 Net of redemption fees for fiscal 2013 and 2012 of $642,000 and $2,001,100, respectively (fund totals). Effective May 23, 2012, the redemption fee was eliminated.
26
Energy Fund
J. The fund has invested in a company that is considered to be an affiliated company of the fund because the fund owns more than 5% of the outstanding voting securities of the company. Transactions during the period in securities of this company were as follows:
| | | | | |
| | | | Current Period Transactions | |
| | January 31, 2012 | | Proceeds from | | July 31, 2012 |
| | Market | Purchases | Securities | Dividend | Market |
| | Value | at Cost | Sold | Income | Value |
| | ($000) | ($000) | ($000) | ($000) | ($000) |
| Nordic American Tankers Ltd. | 43,932 | — | 5,022 | 541 | 32,849 |
K. In preparing the financial statements as of July 31, 2012, management considered the impact of subsequent events for potential recognition or disclosure in these financial statements.
27
About Your Fund’s Expenses
As a shareholder of the fund, you incur ongoing costs, which include costs for portfolio management, administrative services, and shareholder reports (like this one), among others. Operating expenses, which are deducted from a fund’s gross income, directly reduce the investment return of the fund.
A fund’s expenses are expressed as a percentage of its average net assets. This figure is known as the expense ratio. The following examples are intended to help you understand the ongoing costs (in dollars) of investing in your fund and to compare these costs with those of other mutual funds. The examples are based on an investment of $1,000 made at the beginning of the period shown and held for the entire period.
The accompanying table illustrates your fund’s costs in two ways:
• Based on actual fund return. This section helps you to estimate the actual expenses that you paid over the period. The ”Ending Account Value“ shown is derived from the fund‘s actual return, and the third column shows the dollar amount that would have been paid by an investor who started with $1,000 in the fund. You may use the information here, together with the amount you invested, to estimate the expenses that you paid over the period.
To do so, simply divide your account value by $1,000 (for example, an $8,600 account value divided by $1,000 = 8.6), then multiply the result by the number given for your fund under the heading ”Expenses Paid During Period.“
• Based on hypothetical 5% yearly return. This section is intended to help you compare your fund‘s costs with those of other mutual funds. It assumes that the fund had a yearly return of 5% before expenses, but that the expense ratio is unchanged. In this case—because the return used is not the fund’s actual return—the results do not apply to your investment. The example is useful in making comparisons because the Securities and Exchange Commission requires all mutual funds to calculate expenses based on a 5% return. You can assess your fund’s costs by comparing this hypothetical example with the hypothetical examples that appear in shareholder reports of other funds.
Note that the expenses shown in the table are meant to highlight and help you compare ongoing costs only and do not reflect transaction costs incurred by the fund for buying and selling securities. Further, the expenses do not include any purchase, redemption, or account service fees described in the fund prospectus. If such fees were applied to your account, your costs would be higher. Your fund does not carry a “sales load.”
The calculations assume no shares were bought or sold during the period. Your actual costs may have been higher or lower, depending on the amount of your investment and the timing of any purchases or redemptions.
You can find more information about the fund’s expenses, including annual expense ratios, in the Financial Statements section of this report. For additional information on operating expenses and other shareholder costs, please refer to your fund’s current prospectus.
28
| | | |
| Six Months Ended July 31, 2012 | | | |
| | Beginning | Ending | Expenses |
| | Account Value | Account Value | Paid During |
| Energy Fund | 1/31/2012 | 7/31/2012 | Period |
| Based on Actual Fund Return | | | |
| Investor Shares | $1,000.00 | $939.46 | $1.45 |
| Admiral Shares | 1,000.00 | 939.74 | 1.16 |
| Based on Hypothetical 5% Yearly Return | | | |
| Investor Shares | $1,000.00 | $1,023.37 | $1.51 |
| Admiral Shares | 1,000.00 | 1,023.67 | 1.21 |
The calculations are based on expenses incurred in the most recent six-month period. The fund’s annualized six-month expense ratios for that period are 0.30% for Investor Shares and 0.24% for Admiral Shares. The dollar amounts shown as “Expenses Paid” are equal to the annualized expense ratio multiplied by the average account value over the period, multiplied by the number of days in the most recent six-month period, then divided by the number of days in the most recent 12-month period.
29
Trustees Approve Advisory Arrangements
The board of trustees of Vanguard Energy Fund has renewed the fund’s investment advisory arrangements with The Vanguard Group, Inc., through its Equity Investment Group, and Wellington Management Company, LLP. The board determined that the retention of the fund’s advisors was in the best interests of the fund and its shareholders.
The board based its decision upon an evaluation of each advisor’s investment staff, portfolio management process, and performance. The trustees considered the factors discussed below, among others. However, no single factor determined whether the board approved the arrangements. Rather, it was the totality of the circumstances that drove the board’s decision.
Nature, extent, and quality of services
The board considered the quality of the fund’s investment management over both the short and long term, and took into account the organizational depth and stability of each advisor. The board noted the following:
Wellington Management Company, LLP. Founded in 1928, Wellington Management is among the nation’s oldest and most respected institutional investment managers. The investment team uses a bottom-up approach in which stocks are selected based on the advisor’s estimates of fundamental investment value. The investment team includes experienced industry analysts who identify companies that offer significant potential for capital appreciation and possess high-quality earnings sustainable through cyclical market fluctuations. The advisor’s investment process emphasizes company fundamentals, management track record, and security valuation. The firm has advised the fund since the fund’s inception in 1984.
The Vanguard Group, Inc. Vanguard has been managing investments for more than three decades. The Equity Investment Group adheres to a sound, disciplined investment management process; the team has considerable experience, stability, and depth. Vanguard has managed a portion of the fund since 2005.
The board concluded that each advisor’s experience, stability, depth, and performance, among other factors, warranted the continuation of the advisory arrangements.
Investment performance
The board considered the short- and long-term performance of the fund, including any periods of outperformance or underperformance of a relevant benchmark and peer group. The board concluded that each advisor has carried out its investment strategy in disciplined fashion, and that performance results have been in line with expectations. Information about the fund’s most recent performance can be found in the Performance Summary section of this report.
30
Cost
The board concluded that the fund’s expense ratio was well below the average expense ratio charged
by funds in its peer group and that the fund’s advisory fee rate was also well below its peer-group average. Information about the fund’s expenses appears in the About Your Fund’s Expenses section of this report as well as in the Financial Statements section, which also includes information about the fund’s advisory fee rate.
The board did not consider profitability of Wellington Management in determining whether to approve the advisory fee, because Wellington Management is independent of Vanguard, and the advisory fee is the result of arm’s-length negotiations. The board does not conduct a profitability analysis of Vanguard, because of Vanguard’s unique “at-cost” structure. Unlike most other mutual fund management companies, Vanguard is owned by the funds it oversees, and produces “profits” only in the form of reduced expenses for fund shareholders.
The benefit of economies of scale
The board concluded that the fund’s shareholders benefit from economies of scale because of
breakpoints in the fund’s advisory fee schedule for Wellington Management. The breakpoints reduce the effective rate of the fee as the fund’s assets managed by Wellington Management increase. The board also concluded that the fund’s low-cost arrangement with Vanguard ensures that the fund will realize economies of scale as it grows, with the cost to shareholders declining as the fund’s assets managed by Vanguard increase.
The board will consider whether to renew the advisory arrangement again after a one-year period.
31
Glossary
30-Day SEC Yield. A fund’s 30-day SEC yield is derived using a formula specified by the U.S. Securities and Exchange Commission. Under the formula, data related to the fund’s security holdings in the previous 30 days are used to calculate the fund’s hypothetical net income for that period, which is then annualized and divided by the fund’s estimated average net assets over the calculation period. For the purposes of this calculation, a security’s income is based on its current market yield to maturity (for bonds), its actual income (for asset-backed securities), or its projected dividend yield (for stocks). Because the SEC yield represents hypothetical annualized income, it will differ—at times significantly—from the fund’s actual experience. As a result, the fund’s income distributions may be higher or lower than implied by the SEC yield.
Beta. A measure of the magnitude of a fund’s past share-price fluctuations in relation to the ups and downs of a given market index. The index is assigned a beta of 1.00. Compared with a given index, a fund with a beta of 1.20 typically would have seen its share price rise or fall by 12% when the index rose or fell by 10%. For this report, beta is based on returns over the past 36 months for both the fund and the index. Note that a fund’s beta should be reviewed in conjunction with its R-squared (see definition). The lower the R-squared, the less correlation there is between the fund and the index, and the less reliable beta is as an indicator of volatility.
Dividend Yield. Dividend income earned by stocks, expressed as a percentage of the aggregate market value (or of net asset value, for a fund). The yield is determined by dividing the amount of the annual dividends by the aggregate value (or net asset value) at the end of the period. For a fund, the dividend yield is based solely on stock holdings and does not include any income produced by other investments.
Earnings Growth Rate. The average annual rate of growth in earnings over the past five years for the stocks now in a fund.
Equity Exposure. A measure that reflects a fund’s investments in stocks and stock futures. Any holdings in short-term reserves are excluded.
Expense Ratio. A fund’s total annual operating expenses expressed as a percentage of the fund’s average net assets. The expense ratio includes management and administrative expenses, but does not include the transaction costs of buying and selling portfolio securities.
Foreign Holdings. The percentage of a fund represented by securities or depositary receipts of companies based outside the United States.
Inception Date. The date on which the assets of a fund (or one of its share classes) are first invested in accordance with the fund’s investment objective. For funds with a subscription period, the inception date is the day after that period ends. Investment performance is measured from the inception date.
Median Market Cap. An indicator of the size of companies in which a fund invests; the midpoint of market capitalization (market price x shares outstanding) of a fund’s stocks, weighted by the proportion of the fund’s assets invested in each stock. Stocks representing half of the fund’s assets have market capitalizations above the median, and the rest are below it.
Price/Book Ratio. The share price of a stock divided by its net worth, or book value, per share. For a fund, the weighted average price/book ratio of the stocks it holds.
32
Price/Earnings Ratio. The ratio of a stock’s current price to its per-share earnings over the past year. For a fund, the weighted average P/E of the stocks it holds. P/E is an indicator of market expectations about corporate prospects; the higher the P/E, the greater the expectations for a company’s future growth.
R-Squared. A measure of how much of a fund’s past returns can be explained by the returns from the market in general, as measured by a given index. If a fund’s total returns were precisely synchronized with an index’s returns, its R-squared would be 1.00. If the fund’s returns bore no relationship to the index’s returns, its R-squared would be 0. For this report, R-squared is based on returns over the past 36 months for both the fund and the index.
Return on Equity. The annual average rate of return generated by a company during the past five years for each dollar of shareholder’s equity (net income divided by shareholder’s equity). For a fund, the weighted average return on equity for the companies whose stocks it holds.
Short-Term Reserves. The percentage of a fund invested in highly liquid, short-term securities that can be readily converted to cash.
Turnover Rate. An indication of the fund’s trading activity. Funds with high turnover rates incur higher transaction costs and may be more likely to distribute capital gains (which may be taxable to investors). The turnover rate excludes in-kind transactions, which have minimal impact on costs.
33
This page intentionally left blank.
This page intentionally left blank.
The People Who Govern Your Fund
The trustees of your mutual fund are there to see that the fund is operated and managed in your best interests since, as a shareholder, you are a part owner of the fund. Your fund’s trustees also serve on the board of directors of The Vanguard Group, Inc., which is owned by the Vanguard funds and provides services to them on an at-cost basis.
A majority of Vanguard’s board members are independent, meaning that they have no affiliation with Vanguard or the funds they oversee, apart from the sizable personal investments they have made as private individuals. The independent board members have distinguished backgrounds in business, academia, and public service. Each of the trustees and executive officers oversees 179 Vanguard funds.
The following table provides information for each trustee and executive officer of the fund. More information about the trustees is in the Statement of Additional Information, which can be obtained, without charge, by contacting Vanguard at 800-662-7447, or online at vanguard.com.
| |
| InterestedTrustee1 | and Delphi Automotive LLP (automotive components); |
| | Senior Advisor at New Mountain Capital; Trustee of |
| F. William McNabb III | The Conference Board. |
| Born 1957. Trustee Since July 2009. Chairman of the | |
| Board. Principal Occupation(s) During the Past Five | Amy Gutmann |
| Years: Chairman of the Board of The Vanguard Group, | Born 1949. Trustee Since June 2006. Principal |
| Inc., and of each of the investment companies served | Occupation(s) During the Past Five Years: President |
| by The Vanguard Group, since January 2010; Director | of the University of Pennsylvania; Christopher H. |
| of The Vanguard Group since 2008; Chief Executive | Browne Distinguished Professor of Political Science |
| Officer and President of The Vanguard Group and of | in the School of Arts and Sciences with secondary |
| each of the investment companies served by The | appointments at the Annenberg School for |
| Vanguard Group since 2008; Director of Vanguard | Communication and the Graduate School of Education |
| Marketing Corporation; Managing Director of The | of the University of Pennsylvania; Member of the |
| Vanguard Group (1995–2008). | National Commission on the Humanities and Social |
| | Sciences; Trustee of Carnegie Corporation of New |
| IndependentTrustees | York and of the National Constitution Center; Chair |
| of the U. S. Presidential Commission for the Study |
| Emerson U. Fullwood | of Bioethical Issues. |
| Born 1948. Trustee Since January 2008. Principal | |
| Occupation(s) During the Past Five Years: Executive | JoAnn Heffernan Heisen |
| Chief Staff and Marketing Officer for North America | Born 1950. Trustee Since July 1998. Principal |
| and Corporate Vice President (retired 2008) of Xerox | Occupation(s) During the Past Five Years: Corporate |
| Corporation (document management products and | Vice President and Chief Global Diversity Officer |
| services); Executive in Residence and 2010 | (retired 2008) and Member of the Executive |
| Distinguished Minett Professor at the Rochester | Committee (1997–2008) of Johnson & Johnson |
| Institute of Technology; Director of SPX Corporation | (pharmaceuticals/medical devices/consumer |
| (multi-industry manufacturing), the United Way of | products); Director of Skytop Lodge Corporation |
| Rochester, Amerigroup Corporation (managed health | (hotels), the University Medical Center at Princeton, |
| care), the University of Rochester Medical Center, | the Robert Wood Johnson Foundation, and the Center |
| Monroe Community College Foundation, and North | for Talent Innovation; Member of the Advisory Board |
| Carolina A&T University. | of the Maxwell School of Citizenship and Public Affairs |
| at Syracuse University. |
| |
| Rajiv L. Gupta | |
| Born 1945. Trustee Since December 2001.2 | F. Joseph Loughrey |
| Principal Occupation(s) During the Past Five Years: | Born 1949. Trustee Since October 2009. Principal |
| Chairman and Chief Executive Officer (retired 2009) | Occupation(s) During the Past Five Years: President |
| and President (2006–2008) of Rohm and Haas Co. | and Chief Operating Officer (retired 2009) of Cummins |
| (chemicals); Director of Tyco International, Ltd. | Inc. (industrial machinery); Director of SKF AB |
| (diversified manufacturing and services), Hewlett- | (industrial machinery), Hillenbrand, Inc. (specialized |
| Packard Co. (electronic computer manufacturing), | consumer services), the Lumina Foundation for |
| | |
| Education, and Oxfam America; Chairman of the | Executive Officers | |
| Advisory Council for the College of Arts and Letters | | |
| and Member of the Advisory Board to the Kellogg | Glenn Booraem | |
| Institute for International Studies at the University | Born 1967. Controller Since July 2010. Principal |
| of Notre Dame. | Occupation(s) During the Past Five Years: Principal |
| | of The Vanguard Group, Inc.; Controller of each of |
| Mark Loughridge | the investment companies served by The Vanguard |
| Born 1953. Trustee Since March 2012. Principal | Group; Assistant Controller of each of the investment |
| Occupation(s) During the Past Five Years: Senior Vice | companies served by The Vanguard Group (2001–2010). |
| President and Chief Financial Officer at IBM (information | | |
| technology services); Fiduciary Member of IBM’s | Thomas J. Higgins | |
| Retirement Plan Committee. | Born 1957. Chief Financial Officer Since September |
| | 2008. Principal Occupation(s) During the Past Five |
| Scott C. Malpass | Years: Principal of The Vanguard Group, Inc.; Chief |
| Born 1962. Trustee Since March 2012. Principal | Financial Officer of each of the investment companies |
| Occupation(s) During the Past Five Years: Chief | served by The Vanguard Group; Treasurer of each of |
| Investment Officer and Vice President at the University | the investment companies served by The Vanguard |
| of Notre Dame; Assistant Professor of Finance at the | Group (1998–2008). | |
| Mendoza College of Business at Notre Dame; Member | | |
| of the Notre Dame 403(b) Investment Committee; | Kathryn J. Hyatt | |
| Director of TIFF Advisory Services, Inc. (investment | Born 1955. Treasurer Since November 2008. Principal |
| advisor); Member of the Investment Advisory | Occupation(s) During the Past Five Years: Principal of |
| Committees of the Financial Industry Regulatory | The Vanguard Group, Inc.; Treasurer of each of the |
| Authority (FINRA) and of Major League Baseball. | investment companies served by The Vanguard |
| | Group; Assistant Treasurer of each of the investment |
| André F. Perold | companies served by The Vanguard Group (1988–2008). |
| Born 1952. Trustee Since December 2004. Principal | | |
| Occupation(s) During the Past Five Years: George | Heidi Stam | |
| Gund Professor of Finance and Banking at the Harvard | Born 1956. Secretary Since July 2005. Principal |
| Business School (retired 2011); Chief Investment | Occupation(s) During the Past Five Years: Managing |
| Officer and Managing Partner of HighVista Strategies | Director of The Vanguard Group, Inc.; General Counsel |
| LLC (private investment firm); Director of Rand | of The Vanguard Group; Secretary of The Vanguard |
| Merchant Bank; Overseer of the Museum of Fine | Group and of each of the investment companies |
| Arts Boston. | served by The Vanguard Group; Director and Senior |
| | Vice President of Vanguard Marketing Corporation. |
| Alfred M. Rankin, Jr. | | |
| Born 1941. Trustee Since January 1993. Principal | Vanguard Senior ManagementTeam |
| Occupation(s) During the Past Five Years: Chairman, | | |
| President, and Chief Executive Officer of NACCO | Mortimer J. Buckley | Michael S. Miller |
| Industries, Inc. (forklift trucks/housewares/lignite); | Kathleen C. Gubanich | James M. Norris |
| Director of Goodrich Corporation (industrial products/ | Paul A. Heller | Glenn W. Reed |
| aircraft systems and services) and the National | Martha G. King | George U. Sauter |
| Association of Manufacturers; Chairman of the Board | Chris D. McIsaac | |
| of the Federal Reserve Bank of Cleveland and of | | |
| University Hospitals of Cleveland; Advisory Chairman | | |
| of the Board of The Cleveland Museum of Art. | Chairman Emeritus and Senior Advisor |
| | |
| | John J. Brennan | |
| Peter F. Volanakis | Chairman, 1996–2009 | |
| Born 1955. Trustee Since July 2009. Principal | Chief Executive Officer and President, 1996–2008 |
| Occupation(s) During the Past Five Years: President | | |
| and Chief Operating Officer (retired 2010) of Corning | | |
| Incorporated (communications equipment); Director | Founder | |
| of SPX Corporation (multi-industry manufacturing); | John C. Bogle | |
| Overseer of the Amos Tuck School of Business | Chairman and Chief Executive Officer, 1974–1996 |
| Administration at Dartmouth College; Advisor to the | | |
| Norris Cotton Cancer Center. | | |
1 Mr. McNabb is considered an “interested person,” as defined in the Investment Company Act of 1940, because he is an officer of the Vanguard funds.
2 December 2002 for Vanguard Equity Income Fund, Vanguard Growth Equity Fund, the Vanguard Municipal Bond Funds, and the Vanguard State Tax-Exempt Funds.
|  |
| P.O. Box 2600 |
| Valley Forge, PA 19482-2600 |
Connect with Vanguard® > vanguard.com
| |
| Fund Information > 800-662-7447 | CFA® is a trademark owned by CFA Institute. |
| Direct Investor Account Services > 800-662-2739 | |
| Institutional Investor Services > 800-523-1036 | |
| Text Telephone for People | |
| With Hearing Impairment > 800-749-7273 | |
| |
| This material may be used in conjunction | |
| with the offering of shares of any Vanguard | |
| fund only if preceded or accompanied by | |
| the fund’s current prospectus. | |
| |
| All comparative mutual fund data are from Lipper Inc. or | |
| Morningstar, Inc., unless otherwise noted. | |
| |
| You can obtain a free copy of Vanguard’s proxy voting | |
| guidelines by visiting vanguard.com/proxyreporting or by | |
| calling Vanguard at 800-662-2739. The guidelines are | |
| also available from the SEC’s website, sec.gov. In | |
| addition, you may obtain a free report on how your fund | |
| voted the proxies for securities it owned during the 12 | |
| months ended June 30. To get the report, visit either | |
| vanguard.com/proxyreporting or sec.gov. | |
| |
| You can review and copy information about your fund at | |
| the SEC’s Public Reference Room in Washington, D.C. To | |
| find out more about this public service, call the SEC at | |
| 202-551-8090. Information about your fund is also | |
| available on the SEC’s website, and you can receive | |
| copies of this information, for a fee, by sending a | |
| request in either of two ways: via e-mail addressed to | |
| publicinfo@sec.gov or via regular mail addressed to the | |
| Public Reference Section, Securities and Exchange | |
| Commission, Washington, DC 20549-1520. | |
| | © 2012 The Vanguard Group, Inc. |
| | All rights reserved. |
| | Vanguard Marketing Corporation, Distributor. |
| |
| | Q512 092012 |
 |
| |
| Semiannual Report | July 31, 2012 |
| Vanguard Precious Metals and Mining Fund |
> Vanguard Precious Metals and Mining Fund returned –29.63% as the prices for gold-related and other mining-related equities retreated.
> The fund lagged its comparative benchmarks, largely because of its heavy weightings in a handful of weak performers.
> The fund’s recent retreat is consistent with the pattern of sharp ups and downs in the metals and mining sector.
| |
| Contents | |
| Your Fund’s Total Returns. | 1 |
| Chairman’s Letter. | 2 |
| Advisor’s Report. | 7 |
| Fund Profile. | 11 |
| Performance Summary. | 13 |
| Financial Statements. | 14 |
| About Your Fund’s Expenses. | 24 |
| Trustees Approve Advisory Agreement. | 26 |
| Glossary. | 27 |
Please note: The opinions expressed in this report are just that—informed opinions. They should not be considered promises or advice. Also, please keep in mind that the information and opinions cover the period through the date on the front of this report. Of course, the risks of investing in your fund are spelled out in the prospectus.
See the Glossary for definitions of investment terms used in this report.
About the cover: Vanguard was named for the HMS Vanguard, flagship of British Admiral Horatio Nelson. A ship—whose performance and safety depend on the work of all hands—has served as a fitting metaphor for the Vanguard crew as we strive to help clients reach their financial goals.
Your Fund’s Total Returns
| |
| Six Months Ended July 31, 2012 | |
| | Total |
| | Returns |
| Vanguard Precious Metals and Mining Fund | -29.63% |
| S&P Custom Precious Metals and Mining Index | -22.99 |
| Precious Metal Funds Average | -25.05 |
| Precious Metal Funds Average: Derived from data provided by Lipper Inc. | |
| | | | |
| Your Fund’s Performance at a Glance | | | | |
| January 31, 2012, Through July 31, 2012 | | | | |
| | | | Distributions Per Share |
| | Starting | Ending | Income | Capital |
| | Share Price | Share Price | Dividends | Gains |
| Vanguard Precious Metals and Mining Fund | $22.14 | $15.10 | $0.316 | $0.300 |
1

Chairman’s Letter
Dear Shareholder,
Precious metals and mining stocks tumbled in the six months ended July 31, 2012, reflecting signs of economic weakness across developed and developing markets and investors‘ reduced fervor for gold. Vanguard Precious Metals and Mining Fund returned –29.63%. The fund’s return trailed the similarly weak return of its benchmark and the average return of its peer group.
Please note that Vanguard eliminated the redemption fee for your fund, effective May 23. This 1% fee, which applied to shares redeemed within one year of purchase, was one of several measures in place to protect the interests of long-term investors and discourage frequent trading. The fund’s trustees determined that the fee was no longer needed.
U.S. stocks delivered solid gains; international equities slumped
U.S. stocks outperformed their international counterparts handily, returning about 5% for the six months ended July 31. Stocks of large companies fared best as investors seemed to be seeking stability amid the uncertainty surrounding Europe’s debt troubles.
International stocks were generally weak, with currency effects further hindering results for U.S.-based investors. Though European stocks posted a modest advance in local-currency terms, their return was negative once converted into U.S. dollars—a result of the dollar’s strengthening
2
against the euro during the six months. Signs of slowing economic growth hurt returns for emerging markets and the developed markets of the Pacific region.
Questions about the finances of European governments and banks continued to preoccupy investors, and global stock markets moved sharply up and down in response to the latest headlines. Although the situation in Europe is very fluid, Vanguard economists believe the most likely scenario is that the Eurozone will “muddle through” for several years, with occasional spikes in market volatility, as fiscal tightening continues in the face of weak economic growth.
Bonds kept up a steady advance as Treasury yields kept dwindling
U.S. Treasury securities stretched their gains during the period, as investors lost more of their appetite for risk. Bond prices moved higher, and the yield of the 10-year U.S. Treasury note fell to a record low in July, closing below 1.5%. (Bond yields and prices move in opposite directions.) The broad U.S. taxable bond market posted a return of nearly 3%, and municipal bonds had about the same result for the six months.
Investors have enjoyed several years of strong bond returns, but they shouldn’t be surprised if future results are weaker. As yields tumble, the scope for further declines—and price increases—diminishes.
| | | |
| Market Barometer | | | |
| |
| | | | Total Returns |
| | | Periods Ended July 31, 2012 |
| | Six | One | Five Years |
| | Months | Year | (Annualized) |
| Stocks | | | |
| Russell 1000 Index (Large-caps) | 5.54% | 7.96% | 1.26% |
| Russell 2000 Index (Small-caps) | -0.03 | 0.19 | 1.69 |
| Dow Jones U.S. Total Stock Market Index | 5.01 | 7.07 | 1.50 |
| MSCI All Country World Index ex USA (International) | -2.40 | -12.16 | -4.29 |
| |
| Bonds | | | |
| Barclays U.S. Aggregate Bond Index (Broad taxable | | | |
| market) | 2.88% | 7.25% | 6.91% |
| Barclays Municipal Bond Index (Broad tax-exempt | | | |
| market) | 2.93 | 10.51 | 6.12 |
| Citigroup Three-Month U.S. Treasury Bill Index | 0.04 | 0.05 | 0.79 |
| |
| CPI | | | |
| Consumer Price Index | 1.08% | 1.41% | 1.92% |
3
As it has since December 2008, the Federal Reserve Board held its target for the shortest-term interest rates between 0% and 0.25%, keeping a tight lid on the returns from money market funds and savings accounts.
The fund’s top holdings weighed on performance
As a group, precious metals and mining stocks represent less than 5% of the global stock market’s value. Vanguard Precious Metals and Mining Fund seeks superior returns in this small segment of the market by holding large stakes in a handful of companies that have demonstrated an ability to earn strong returns on their costly investments in mineral exploration, development, and processing. At the end of July, for example, the fund’s top 10 holdings accounted for about 62% of its assets. In such a concentrated fund, the fortunes of a single stock can have a big impact on returns.
During the past six months, the fortunes of many metals and mining companies took a turn for the worse. Gold prices continued to pull back from their peak of late 2011, while the prices of industrial metals such as copper, aluminum, and platinum drifted lower amid fears that the economic deceleration would idle automakers and other manufacturers.
| | |
| Expense Ratios | | |
| Your Fund Compared With Its Peer Group | | |
| | | Peer Group |
| | Fund | Average |
| Precious Metals and Mining Fund | 0.29% | 1.36% |
The fund expense ratio shown is from the prospectus dated May 29, 2012, and represents estimated costs for the current fiscal year. For the six months ended July 31, 2012, the fund’s annualized expense ratio was 0.27%. The peer-group expense ratio is derived from data provided by Lipper Inc. and captures information through year-end 2011.
Peer group: Precious Metal Funds.
4
Gold miner Centerra Gold, which accounted for more than 6% of the fund’s assets on average, was an especially poor performer, returning about –60%. The fund’s heavy weighting in this relatively small stock was a big reason for its shortfall relative to its index and peer funds. Aquila Resources, a minerals exploration company with claims in the Great Lakes region, was another weak spot, pruning about 3 percentage points from the fund’s six-month return.
The fund earned better returns outside the precious metals and mining precincts. Harry Winston Diamond, a retailer and diamond mine investor, returned more than 10%, benefiting from the relative strength of the high-end jewelry market. Fertilizer maker K+S, which accounted for almost 8% of fund assets at the end of the period, also produced a solid return.
The fund’s six-month tumble is consistent with the sharp ups and downs to be expected from precious metals and mining investments. These stocks can go through long periods of weakness and stretches of impressive strength. Over the past decade, the story has been one of strength, as Vanguard Precious Metals and Mining Fund has benefited from long-running rallies for gold miners and producers of industrial commodities. Even when times are good, however, the inherent volatility of these stocks can test investors’ commitment.
The role that sector funds can play in a balanced, diversified portfolio
One of Vanguard’s guiding principles is that balance and broad diversification can help investors manage the risks inherent in investing. When used thoughtfully, sector funds, like the Precious Metals and Mining Fund, can enhance the diversification of a portfolio that lacks exposure to a certain part of the market or is overly concentrated in a few market segments.
These funds also give investors the opportunity to act on a conviction that a particular sector will outperform the broader market. We recognize that this is a popular use of sector funds, but it is one that we’d urge investors to be cautious about. Our research and experience suggest that it is difficult to profit consistently from such convictions. The top-returning sector can change at any moment, which is why chasing short-term performance often leads to disappointment.
Although we acknowledge the challenges and risks of sector investing, Vanguard has designed its funds—whether they are actively managed or track an index—to give investors a better chance of reaching their goals. Vanguard Precious Metals and Mining Fund gives investors the opportunity to benefit from the long experience and deep investment knowledge of the fund’s advisor, M&G Investment Management Limited. These qualities are an asset no
5
matter what the market environment. And the same can be said for the fund’s low costs.
For these reasons, we believe that Vanguard Precious Metals and Mining Fund can play a small supporting role in a well-diversified portfolio for investors who can tolerate the highs and lows that inevitably accompany a narrowly focused investment.
As always, thank you for entrusting your assets to Vanguard.
Sincerely,

F. William McNabb III
Chairman and Chief Executive Officer
August 8, 2012
6
Advisor’s Report
Vanguard Precious Metals and Mining Fund produced a return of –29.63% over the six months under review, behind both the customized benchmark index (–22.99%) and the average return of its peer funds (–25.05%).
The markets
The ongoing uncertainty surrounding the Eurozone and concerns about slowing growth in emerging markets, especially China, coupled with prolonged weakness in the developed countries brought continued volatility to global stock markets during the half-year. Indebted peripheral European nations Greece and Spain once again sought financial aid, placing ever-increasing strain, both political and financial, on the Eurozone.
With the immediate outlook for improved global growth still uncertain, several of the more economically sensitive metals (copper, aluminium, and, especially, zinc) remained under pressure. Precious metals also suffered, with silver and platinum seeing the largest declines. Gold fell in value by 7% during the six months, but remained at an elevated price ($1,608 per troy ounce) at the end of the period.
The fund’s performance
Last year, in the face of intensifying market uncertainty, the fund benefited from its significant exposure to gold equities. However, the more positive outlook on gold equities, based on signs of improved capital discipline in the gold industry and the anticipated volatile environment, has since been tempered. At an aggregate level, irresponsible practices by management teams have continued, and increasingly, assets look to be at risk from either political and social instability or nationalization, which could invalidate the case for investment. Adding to these concerns, the industry is going through a transition, with a trend of senior management departures, often with little warning. Input costs have also been rising, often leaving mines uneconomical and forcing companies to rein in future capital expenditure. These factors help explain why, despite a sustained strong gold price, similar strength has not been seen in gold miners’ share prices.
In this environment, gold equities have struggled to keep up with the relatively resilient metal, while the fund’s holdings have also been affected by the issues mentioned above. And while we analyze these potential hazards thoroughly when selecting stocks, certain gold equities in the portfolio have suffered on account of these risks.
Canadian-listed Centerra Gold, with highly complex operations in the Kyrgyz Republic, has been the largest detractor from performance, primarily because of concerns about its permit to operate in the country. The company’s behavior and success to date have been founded upon operational excellence in all areas; however, news that the opposition party was reviewing Centerra’s right to mine because of alleged environmental damage
7
affected the share price. Although the company assures us that the accusations are unsubstantiated, a weak share price is likely to continue until this issue has been resolved.
Other events that have depressed gold equity share prices include the decision by the CEO of Canadian-listed Alacer Gold to step back to a less influential role. We had great faith in senior management, and, while the company continues to operate effectively, we reduced the holding. In the case of Australian-based Resolute Mining, the share price continues to be affected by political issues surrounding its assets in the West African country of Mali. The manage-ment team and assets in question remain broadly unaffected by the political turbulence, and we retained the holding.
Outside of precious metals, select Australian holdings also detracted significantly from fund performance. The share price of coal and iron ore miner Aquila Resources remained depressed because of concerns about management’s ability to raise enough capital to fully develop its world-class iron ore asset. An ongoing dispute with Vale, a joint venture partner, was settled in the reporting period, enabling Aquila Resources to sell a large stake in its Isaac Plains coal asset, facilitating further development. The current share price, in our view, represents a valuation that overlooks both the quality of the management team and the iron ore assets’ potential.
Iluka Resources, a mineral sands miner, also detracted from performance. The company was one of the fund’s largest contributors in 2011 after the market recognized its excellent position in an industry with immensely compelling demand-supply dynamics. With the global economic slowdown, the CEO decided to cut production in order to keep pricing high. The decision was poorly received by the market, but we support the move and view it as prudent preservation of the assets’ true economic value.
Turning to positives, the fund benefited greatly from its exposure to mineral fertilizers, particularly potash producers, over the period. The German firm K+S, Potash Corporation of Saskatchewan, and Uralkali of Russia were all significant contributors. With farmers being pressured to augment their annual output, these companies are all very well positioned to take advantage of the need to improve arable land yields. After a challenging 2011, during which weaker pricing affected the bottom line, K+S in particular rebounded strongly with positive results, stimulating a rise in the share price. Imerys, a French diversified minerals miner, also rose in value. Good quality management has been able to extract the full value of the company’s broad array of mineral exposure, ensuring a degree of revenue stability and avoiding reliance on a single mineral. Strong talc pricing has been particularly beneficial.
8
Purchases and sales
During the period, we reduced the fund’s exposure to gold miners while increasing our positions in a selection of companies that mine a range of other metals and minerals. We purchased more shares in K+S as short-term pricing pressures continued to affect the share price. We also added to OZ Minerals, an Australian copper and gold miner whose share price had weakened. The company continues to benefit from its world-class Prominent Hill mine, and now holds a significant amount of cash on its balance sheet. Although market conditions have been challenging, especially with the decline in copper prices, this places OZ Minerals in a position to acquire new assets at a depressed value or return substantial cash to investors. Furthermore, the long-term supply of copper is constrained, we believe, given declining ore grades in established mines and a lack of significant new discoveries.
We also retain a positive long-term view on platinum; however, investments in platinum miners, from our perspective, are not viable at present. In order to increase the portfolio’s exposure to the precious metal, we continued to add to the position in Umicore, a Belgium-based pioneer in the recycling of multiple metals and minerals, including platinum, through its innovative processing plant. Investing in Umicore has the additional benefit of avoiding the complexities of operating mines in politically and socially challenging environments.
The fund’s new position in Potash Corporation of Saskatchewan has already contributed positively to performance. The company has vast assets throughout Canada, and given its proximity to many of the largest producers of soft commodities, we believe it is positioned to prosper from the global need to raise arable yields.
Sales during the period were predominantly in gold equity holdings, based on industry and stock-specific concerns. Among the positions we reduced meaningfully was U.S.-listed Newmont Mining. Despite indications that the company was taking a more returns-oriented approach and returning capital back to shareholders in the form of dividends, there continued to be problems with capital discipline; for example, management invested heavily in projects in Peru without attaining all the requisite permits, delaying the project and raising overall costs.
We reduced Canadian-listed Eldorado Gold further because of operational concerns regarding recently purchased assets in Greece. Alacer Gold was also sold down, as mentioned above, because of senior management changes. We also sold out of U.S.-listed Minefinders and NovaGold Resources. Minefinders was the subject of a takeover by Pan American Silver, enabling us to sell our holding at a significant premium. In the case of NovaGold Resources, we exited our position because we lost confidence in management’s ability to operate the business effectively.
9
Looking ahead
We continue to monitor existing holdings while carrying out detailed research to uncover new opportunities. Our research trips and open dialogue with management teams facilitate this process and remain central to our investment approach. Our long-term conviction in the global appetite for a broad range of commodities remains steadfast. However, an awareness of the risks in investing in the mining sector is critical to identifying those companies that actively negotiate and manage the sector’s often latent hazards to ensure that their profits are sustainable. Experienced management teams with a strong focus on good corporate governance practices and prudent capital discipline are fundamental to any investment, especially where strong alignment of corporate and shareholder interests form the basis of collaborative long-term relationships.
Portfolio Managers:
Graham E. French
Matthew Vaight, UKSIP
M&G Investment Management Ltd.
August 15, 2012
10
Precious Metals and Mining Fund
Fund Profile
As of July 31, 2012
| | | |
| Portfolio Characteristics | | |
| | | S&P | |
| | | Precious | DJ |
| | | Metals and | U.S. Total |
| | | Mining | Market |
| | Fund | Index | Index |
| Number of Stocks | 47 | 414 | 3,684 |
| Median Market Cap | $2.2B | $22.0B | $34.4B |
| Price/Earnings Ratio | 16.0x | 11.4x | 15.7x |
| Price/Book Ratio | 1.7x | 1.5x | 2.2x |
| Return on Equity | 8.8% | 15.4% | 18.1% |
| Earnings Growth Rate | 21.4% | 15.6% | 9.6% |
| Dividend Yield | 2.1% | 2.4% | 2.1% |
| Foreign Holdings | 87.8% | 89.1% | 0.0% |
| Turnover Rate | | | |
| (Annualized) | 33% | — | — |
| Ticker Symbol | VGPMX | — | — |
| Expense Ratio1 | 0.29% | — | — |
| Short-Term Reserves | 3.4% | — | — |
| | |
| Volatility Measures | | |
| | S&P | |
| | Precious | DJ |
| | Metals and | U.S. Total |
| | Mining | Market |
| | Index | Index |
| R-Squared | 0.95 | 0.55 |
| Beta | 1.08 | 1.37 |
These measures show the degree and timing of the fund’s fluctuations compared with the indexes over 36 months.
| | |
| Ten Largest Holdings (% of total net assets) |
| Hochschild Mining plc | Precious Metals & | |
| | Minerals | 8.8% |
| Newmont Mining Corp. | Gold | 8.0 |
| Potash Corp. of | Fertilizers & | |
| Saskatchewan Inc. | Agricultural | |
| | Chemicals | 7.6 |
| K+S AG | Fertilizers & | |
| | Agricultural | |
| | Chemicals | 7.6 |
| Imerys SA | Construction | |
| | Materials | 6.1 |
| Umicore SA | Precious Metals & | |
| | Minerals | 5.0 |
| OZ Minerals Ltd. | Diversified Metals | |
| | & Mining | 5.0 |
| Harry Winston Diamond | Precious Metals & | |
| Corp. | Minerals | 4.9 |
| Nevsun Resources Ltd. | Gold | 4.5 |
| Centerra Gold Inc. | Gold | 4.3 |
| Top Ten | | 61.8% |
The holdings listed exclude any temporary cash investments and equity index products.
Allocation by Region (% of equity exposure)

1 The expense ratio shown is from the prospectus dated May 29, 2012, and represents estimated costs for the current fiscal year. For the six months ended July 31, 2012, the annualized expense ratio was 0.27%.
11
Precious Metals and Mining Fund
| |
| Market Diversification (% of equity exposure) |
| Europe | |
| United Kingdom | 11.1% |
| Germany | 7.8 |
| France | 6.3 |
| Belgium | 5.1 |
| Other | 0.3 |
| Subtotal | 30.6% |
| Pacific | |
| Australia | 28.2% |
| Singapore | 1.0 |
| Subtotal | 29.2% |
| Emerging Markets | |
| Russia | 1.5% |
| Other | 0.2 |
| Subtotal | 1.7% |
| North America | |
| Canada | 26.3% |
| United States | 12.2 |
| Subtotal | 38.5% |
12
Precious Metals and Mining Fund
Performance Summary
All of the returns in this report represent past performance, which is not a guarantee of future results that may be achieved by the fund. (Current performance may be lower or higher than the performance data cited. For performance data current to the most recent month-end, visit our website at vanguard.com/performance.) Note, too, that both investment returns and principal value can fluctuate widely, so an investor’s shares, when sold, could be worth more or less than their original cost. The returns shown do not reflect taxes that a shareholder would pay on fund distributions or on the sale of fund shares.
Fiscal-Year Total Returns (%): January 31, 2002, Through July 31, 2012
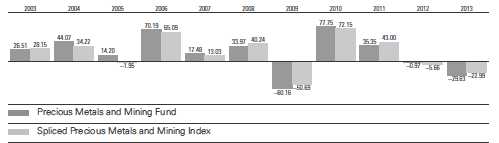
Spliced Precious Metals and Mining Index: S&P/Citigroup World Equity Gold Index through June 30, 2005; S&P Custom Precious Metals and Mining Index thereafter.
Note: For 2013, performance data reflect the six months ended July 31, 2012.
Average Annual Total Returns: Periods Ended June 30, 2012
This table presents returns through the latest calendar quarter—rather than through the end of the fiscal period.
Securities and Exchange Commission rules require that we provide this information.
| | | | |
| | Inception | One | Five | Ten |
| | Date | Year | Years | Years |
| Precious Metals and Mining Fund | 5/23/1984 | -31.91% | -5.25% | 12.26% |
See Financial Highlights for dividend and capital gains information.
13
Precious Metals and Mining Fund
Financial Statements (unaudited)
Statement of Net Assets
As of July 31, 2012
The fund reports a complete list of its holdings in regulatory filings four times in each fiscal year, at the quarter-ends. For the second and fourth fiscal quarters, the lists appear in the fund’s semiannual and annual reports to shareholders. For the first and third fiscal quarters, the fund files the lists with the Securities and Exchange Commission on Form N-Q. Shareholders can look up the fund’s Forms N-Q on the SEC’s website at sec.gov. Forms N-Q may also be reviewed and copied at the SEC’s Public Reference Room (see the back cover of this report for further information).
| | | |
| | | | Market |
| | | | Value |
| | | Shares | ($000) |
| Common Stocks (96.8%) | | |
| Australia (27.2%) | | |
| 1 | OZ Minerals Ltd. | 19,000,000 | 149,790 |
| 1 | Medusa Mining Ltd. | 25,250,000 | 127,118 |
| | Iluka Resources Ltd. | 8,300,000 | 81,970 |
| *,^,1Discovery Metals Ltd. | 56,500,000 | 78,389 |
| *,1 | Aquila Resources Ltd. | 34,665,000 | 76,666 |
| *,^,1St. Barbara Ltd. | 51,000,000 | 74,066 |
| *,1 | Resolute Mining Ltd. | 51,965,029 | 73,559 |
| *,1 | Cudeco Ltd. | 16,576,547 | 57,563 |
| *,^,1Galaxy Resources Ltd. | 40,893,638 | 20,316 |
| *,1 | EquatorialResources Ltd. | 9,082,288 | 18,001 |
| 1 | Panoramic | | |
| | Resources Ltd. | 20,700,000 | 12,817 |
| *,1 | Reed Resources Ltd. | 67,000,000 | 12,636 |
| * | Ivanhoe Australia Ltd. | 26,600,000 | 11,975 |
| *,1 | Glory Resources Ltd. | 33,500,000 | 9,858 |
| * | Papillon Resources Ltd. | 6,500,000 | 7,209 |
| *,1 | Apex Minerals NL | 38,223,611 | 4,597 |
| * | Gindalbie Metals Ltd. | 8,000,000 | 3,327 |
| *,1 | Speewah Metals Ltd. | 13,500,000 | 1,135 |
| *,1 | Kumarina Resources Ltd. | 9,300,000 | 992 |
| *,1 | Drummond Gold Ltd. | 35,000,000 | 294 |
| * | Zambezi Resources Ltd. | 4,895,833 | 36 |
| | | | 822,314 |
| Belgium (5.0%) | | |
| | Umicore SA | 3,400,000 | 150,441 |
| |
| Canada (25.5%) | | |
| | Potash Corp. of | | |
| | Saskatchewan Inc. | 5,200,000 | 230,224 |
| *,1 | Harry Winston | | |
| | Diamond Corp. | 11,450,000 | 148,427 |
| 1 | Nevsun Resources Ltd. | 38,500,000 | 134,367 |
| 1 | Centerra Gold Inc. | 18,000,000 | 129,411 |
| *,1 | Alacer Gold Corp. | 15,950,000 | 94,633 |
| | Eldorado Gold Corp. | 1,900,000 | 20,556 |
| *,^ | Belo Sun Mining Corp. | 4,884,600 | 5,991 |
| | SEMAFO Inc. | 1,000,000 | 3,151 |
| | | |
| | | | Market |
| | | | Value |
| | | Shares | ($000) |
| * | Bear Creek Mining Corp. | 750,000 | 1,743 |
| * | Lake Shore Gold Corp. | 1,000,000 | 1,027 |
| * | Claude Resources Inc. | 400,000 | 280 |
| * | NovaCopper Inc. | 33,333 | 58 |
| | | | 769,868 |
| France (6.1%) | | |
| | Imerys SA | 3,650,000 | 183,732 |
| |
| Germany (7.6%) | | |
| | K+S AG | 4,650,000 | 229,406 |
| |
| Indonesia (0.1%) | | |
| | Vale Indonesia Tbk | 6,500,000 | 1,657 |
| |
| Ireland (0.3%) | | |
| * | Kenmare Resources plc | 13,627,035 | 7,975 |
| |
| Papua New Guinea (0.1%) | | |
| * | Bougainville Copper Ltd. | 2,000,000 | 1,753 |
| |
| Russia (1.4%) | | |
| | Uralkali OJSC GDR | 1,050,000 | 43,610 |
| |
| Singapore (1.0%) | | |
| | Noble Group Ltd. | 35,000,353 | 30,024 |
| |
| United Kingdom (10.8%) | | |
| 1 | Hochschild Mining plc | 40,500,000 | 265,567 |
| | Petropavlovsk plc | 9,000,000 | 59,598 |
| | | | 325,165 |
| United States (11.7%) | | |
| | Newmont Mining Corp. | 5,400,000 | 240,138 |
| 1 | AMCOL | | |
| | International Corp. | 3,080,000 | 94,556 |
| | Mosaic Co. | 350,000 | 20,339 |
| | | | 355,033 |
| Total Common Stocks | | |
| (Cost $3,418,538) | | 2,920,978 |
14
Precious Metals and Mining Fund
| | |
| | | Market |
| | | Value |
| | Shares | ($000) |
| Precious Metals (0.1%) | |
| * Platinum Bullion | | |
| (In Troy Ounces) | 2,009 | 2,839 |
| Total Precious Metals | | |
| (Cost $1,212) | | 2,839 |
| Temporary Cash Investment (4.2%) | |
| Money Market Fund (4.2%) | |
| 2,3 Vanguard Market | | |
| Liquidity Fund, 0.155% | |
| (Cost $128,463) | 128,462,706 | 128,463 |
| Total Investments (101.1%) | |
| (Cost $3,548,213) | | 3,052,280 |
| Other Assets and Liabilities (-1.1%) | |
| Other Assets | | 13,926 |
| Liabilities3 | | (47,465) |
| | | (33,539) |
| Net Assets (100%) | | |
| Applicable to 199,969,582 outstanding | |
| $.001 par value shares of beneficial | |
| interest (unlimited authorization) | 3,018,741 |
| Net Asset Value Per Share | $15.10 |
| |
| | Market |
| | Value |
| Shares | ($000) |
| Statement of Assets and Liabilities | |
| Assets | |
| Investments in Securities, at Value4 | |
| Unaffiliated Issuers4 | 1,339,059 |
| Affiliated Vanguard Funds | 128,463 |
| Other Affiliated Issuers | 1,584,758 |
| Total Investments in Securities | 3,052,280 |
| Receivables for Investment | |
| Securities Sold | 8,436 |
| Other Assets | 5,490 |
| Total Assets | 3,066,206 |
| Liabilities | |
| Payables for Investment | |
| Securities Purchased | 20,419 |
| Security Lending Collateral | |
| Payable to Brokers | 11,655 |
| Other Liabilities | 15,391 |
| Total Liabilities | 47,465 |
| Net Assets | 3,018,741 |
15
Precious Metals and Mining Fund
| |
| At July 31, 2012, net assets consisted of: | |
| | Amount |
| | ($000) |
| Paid-in Capital | 3,848,597 |
| Overdistributed Net Investment Income | (194,884) |
| Accumulated Net Realized Losses | (139,060) |
| Unrealized Appreciation (Depreciation) | |
| Investment Securities4 | (495,933) |
| Foreign Currencies | 21 |
| Net Assets | 3,018,741 |
See Note A in Notes to Financial Statements.
* Non-income-producing security.
^ Part of security position is on loan to broker-dealers. The total value of securities on loan is $7,851,000.
1 Considered an affiliated company of the fund as the fund owns more than 5% of the outstanding voting securities of such company.
2 Affiliated money market fund available only to Vanguard funds and certain trusts and accounts managed by Vanguard. Rate shown is the 7-day yield.
3 Includes $11,655,000 of collateral received for securities on loan.
4 Includes precious metals.
GDR—Global Depositary Receipt.
See accompanying Notes, which are an integral part of the Financial Statements.
16
Precious Metals and Mining Fund
| |
| Statement of Operations | |
| |
| | SixMonths Ended |
| | July 31, 2012 |
| | ($000) |
| Investment Income | |
| Income | |
| Dividends1,2 | 40,108 |
| Interest2 | 42 |
| Security Lending | 1,756 |
| Total Income | 41,906 |
| Expenses | |
| Investment Advisory Fees—Note B | |
| Basic Fee | 2,280 |
| Performance Adjustment | (996) |
| The Vanguard Group—Note C | |
| Management and Administrative | 2,971 |
| Marketing and Distribution | 438 |
| Custodian Fees | 133 |
| Shareholders’ Reports | 32 |
| Trustees’ Fees and Expenses | 5 |
| Total Expenses | 4,863 |
| Net Investment Income | 37,043 |
| Realized Net Gain (Loss) | |
| Investment Securities Sold2,3 | (139,092) |
| Foreign Currencies | (478) |
| Realized Net Gain (Loss) | (139,570) |
| Change in Unrealized Appreciation (Depreciation) | |
| Investment Securities3 | (1,185,354) |
| Foreign Currencies | 27 |
| Change in Unrealized Appreciation (Depreciation) | (1,185,327) |
| Net Increase (Decrease) in Net Assets Resulting from Operations | (1,287,854) |
1 Dividends are net of foreign withholding taxes of $3,284,000.
2 Dividend income, interest income, and realized net gain (loss) from affiliated companies of the fund were $11,900,000, $42,000, and ($103,689,000), respectively.
3 Includes precious metals.
See accompanying Notes, which are an integral part of the Financial Statements.
17
Precious Metals and Mining Fund
| | |
| Statement of Changes in Net Assets | | |
| |
| | Six Months Ended | Year Ended |
| | July 31, | January 31, |
| | 2012 | 2012 |
| | ($000) | ($000) |
| Increase (Decrease) in Net Assets | | |
| Operations | | |
| Net Investment Income | 37,043 | 75,993 |
| Realized Net Gain (Loss) | (139,570) | 394,334 |
| Change in Unrealized Appreciation (Depreciation) | (1,185,327) | (524,311) |
| Net Increase (Decrease) in Net Assets Resulting from Operations | (1,287,854) | (53,984) |
| Distributions | | |
| Net Investment Income | (62,779) | (24,181) |
| Realized Capital Gain | (59,601) | (276,223) |
| Total Distributions | (122,380) | (300,404) |
| Capital Share Transactions | | |
| Issued | 362,040 | 741,011 |
| Issued in Lieu of Cash Distributions | 112,690 | 277,838 |
| Redeemed1 | (461,052) | (1,279,248) |
| Net Increase (Decrease) from Capital Share Transactions | 13,678 | (260,399) |
| Total Increase (Decrease) | (1,396,556) | (614,787) |
| Net Assets | | |
| Beginning of Period | 4,415,297 | 5,030,084 |
| End of Period2 | 3,018,741 | 4,415,297 |
1 Net of redemption fees for fiscal 2013 and 2012 of $435,000 and $2,635,000, respectively. Effective May 23, 2012, the redemption fee was eliminated.
2 Net Assets—End of Period includes undistributed (overdistributed) net investment income of ($194,884,000) and ($168,670,000).
See accompanying Notes, which are an integral part of the Financial Statements.
18
Precious Metals and Mining Fund
Financial Highlights
| | | | | | |
| Six Months | | | | | |
| | Ended | | | | | |
| For a Share Outstanding | July 31, | | | Year Ended January 31, |
| Throughout Each Period | 2012 | 2012 | 2011 | 2010 | 2009 | 2008 |
| Net Asset Value, Beginning of Period | $22.14 | $24.15 | $18.74 | $10.74 | $33.45 | $28.64 |
| Investment Operations | | | | | | |
| Net Investment Income | .190 | .3341 | .181 | .0932 | .653 | .9002 |
| Net Realized and Unrealized Gain (Loss) | | | | | | |
| on Investments3 | (6.614) | (.760) | 6.521 | 8.207 | (19.849) | 8.362 |
| Total from Investment Operations | (6.424) | (.426) | 6.702 | 8.300 | (19.196) | 9.262 |
| Distributions | | | | | | |
| Dividends from Net Investment Income | (.316) | (.123) | (1.101) | (.300) | (.763) | (.670) |
| Distributions from Realized Capital Gains | (.300) | (1.461) | (.191) | — | (2.751) | (3.782) |
| Total Distributions | (.616) | (1.584) | (1.292) | (.300) | (3.514) | (4.452) |
| Net Asset Value, End of Period | $15.10 | $22.14 | $24.15 | $18.74 | $10.74 | $33.45 |
| |
| Total Return4 | -29.63% | -0.97% | 35.35% | 77.75% | -60.16% | 33.97% |
| |
| Ratios/Supplemental Data | | | | | | |
| Net Assets, End of Period (Millions) | $3,019 | $4,415 | $5,030 | $3,684 | $1,644 | $4,635 |
| Ratio of Total Expenses to | | | | | | |
| Average Net Assets5 | 0.27% | 0.29% | 0.27% | 0.27% | 0.30% | 0.28% |
| Ratio of Net Investment Income to | | | | | | |
| Average Net Assets | 2.07% | 1.54%1 | 0.61% | 0.59%2 | 2.17% | 2.70%2 |
| Portfolio Turnover Rate | 33% | 22% | 34% | 17% | 22% | 29% |
The expense ratio, net income ratio, and turnover rate for the current period have been annualized.
1 Net investment income per share and the ratio of net investment income to average net assets include $.103 and 0.40%, respectively, resulting from a special dividend from OZ Minerals Ltd. in May 2011.
2 Net investment income per share and the ratio of net investment income to average net assets for the year ended January 31, 2008, include $.190 and 0.65%, respectively, resulting from a special dividend from Centennial Coal Co. Ltd. in January 2008. Based on additional information reported by the company in 2009, a portion of the special dividend was reallocated to return of capital. The reallocation reduced net investment income per share and the ratio of net investment income to average net assets for the year ended January 31, 2010, by $.134 and 0.90%, respectively. The reallocation has no impact on net assets, net asset values per share, or total returns.
3 Includes increases from redemption fees of $.00, $.01, $.01, $.01, $.01, and $.01.
4 Total returns do not include transaction or account service fees that may have applied in the periods shown. Fund prospectuses provide information about any applicable transaction and account service fees.
5 Includes performance-based investment advisory fee increases (decreases) of (0.06%), (0.03%), (0.05%), (0.08%), 0.00%, and (0.01%).
See accompanying Notes, which are an integral part of the Financial Statements.
19
Precious Metals and Mining Fund
Notes to Financial Statements
Vanguard Precious Metals and Mining Fund is registered under the Investment Company Act of 1940 as an open-end investment company, or mutual fund. The fund invests in securities of foreign issuers, which may subject it to investment risks not normally associated with investing in securities of United States corporations.
A. The following significant accounting policies conform to generally accepted accounting principles for U.S. mutual funds. The fund consistently follows such policies in preparing its financial statements.
1. Security Valuation: Securities are valued as of the close of trading on the New York Stock Exchange (generally 4 p.m., Eastern time) on the valuation date. Equity securities are valued at the latest quoted sales prices or official closing prices taken from the primary market in which each security trades; such securities not traded on the valuation date are valued at the mean of the latest quoted bid and asked prices. Securities for which market quotations are not readily available, or whose values have been affected by events occurring before the fund’s pricing time but after the close of the securities’ primary markets, are valued at their fair values calculated according to procedures adopted by the board of trustees. These procedures include obtaining quotations from an independent pricing service, monitoring news to identify significant market- or security-specific events, and evaluating changes in the values of foreign market proxies (for example, ADRs, futures contracts, or exchange-traded funds), between the time the foreign markets close and the fund’s pricing time. When fair-value pricing is employed, the prices of securities used by a fund to calculate its net asset value may differ from quoted or published prices for the same securities. Precious metals are valued at the mean of the latest quoted bid and asked prices. Investments in Vanguard Market Liquidity Fund are valued at that fund’s net asset value.
2. Foreign Currency: Securities and other assets and liabilities denominated in foreign currencies are translated into U.S. dollars using exchange rates obtained from an independent third party as of the fund’s pricing time on the valuation date. Realized gains (losses) and unrealized appreciation (depreciation) on investment securities include the effects of changes in exchange rates since the securities were purchased, combined with the effects of changes in security prices. Fluctuations in the value of other assets and liabilities resulting from changes in exchange rates are recorded as unrealized foreign currency gains (losses) until the assets or liabilities are settled in cash, at which time they are recorded as realized foreign currency gains (losses).
3. Federal Income Taxes: The fund intends to continue to qualify as a regulated investment company and distribute all of its taxable income. Management has analyzed the fund’s tax positions taken for all open federal income tax years (January 31, 2009–2012), and for the period ended July 31, 2012, and has concluded that no provision for federal income tax is required in the fund’s financial statements.
4. Distributions: Distributions to shareholders are recorded on the ex-dividend date.
5. Security Lending: The fund may lend its securities to qualified institutional borrowers to earn additional income. Security loans are required to be secured at all times by collateral at least equal to the market value of securities loaned. The fund invests cash collateral received in Vanguard Market Liquidity Fund, and records a liability for the return of the collateral, during the period the securities are on loan. Security lending income represents fees charged to borrowers plus income earned on investing cash collateral, less expenses associated with the loan.
20
Precious Metals and Mining Fund
6. Other: Dividend income is recorded on the ex-dividend date. Interest income includes income distributions received from Vanguard Market Liquidity Fund and is accrued daily. Security transactions are accounted for on the date securities are bought or sold. Costs used to determine realized gains (losses) on the sale of investment securities are those of the specific securities sold. Fees assessed on redemptions of capital shares are credited to paid-in capital.
B. M&G Investment Management Ltd. provides investment advisory services to the fund for a fee calculated at an annual percentage rate of average net assets. The basic fee is subject to quarterly adjustments based on the fund’s performance for the preceding three years relative to the S&P Custom Precious Metals and Mining Index. For the six months ended July 31, 2012, the investment advisory fee represented an effective annual basic rate of 0.13% of the fund’s average net assets before a decrease of $996,000 (0.06%) based on performance.
C. The Vanguard Group furnishes at cost corporate management, administrative, marketing, and distribution services. The costs of such services are allocated to the fund under methods approved by the board of trustees. The fund has committed to provide up to 0.40% of its net assets in capital contributions to Vanguard. At July 31, 2012, the fund had contributed capital of $453,000 to Vanguard (included in Other Assets), representing 0.02% of the fund’s net assets and 0.18% of Vanguard’s capitalization. The fund’s trustees and officers are also directors and officers of Vanguard.
D. Various inputs may be used to determine the value of the fund’s investments. These inputs are summarized in three broad levels for financial statement purposes. The inputs or methodologies used to value securities are not necessarily an indication of the risk associated with investing in those securities.
Level 1—Quoted prices in active markets for identical securities.
Level 2—Other significant observable inputs (including quoted prices for similar securities, interest rates, prepayment speeds, credit risk, etc.).
Level 3—Significant unobservable inputs (including the fund’s own assumptions used to determine the fair value of investments).
The following table summarizes the market value of the fund’s investments as of July 31, 2012, based on the inputs used to value them:
| | | |
| | Level 1 | Level 2 | Level 3 |
| Investments | ($000) | ($000) | ($000) |
| Common Stocks—North America | 1,124,901 | — | — |
| Common Stocks—Other | — | 1,796,077 | — |
| Precious Metals | 2,839 | — | — |
| Temporary Cash Investments | 128,463 | — | — |
| Total | 1,256,203 | 1,796,077 | — |
21
Precious Metals and Mining Fund
E. Distributions are determined on a tax basis and may differ from net investment income and realized capital gains for financial reporting purposes. Differences may be permanent or temporary. Permanent differences are reclassified among capital accounts in the financial statements to reflect their tax character. Temporary differences arise when certain items of income, expense, gain, or loss are recognized in different periods for financial statement and tax purposes; these differences will reverse at some time in the future. Differences in classification may also result from the treatment of short-term gains as ordinary income for tax purposes. The fund’s tax-basis capital gains and losses are determined only at the end of each fiscal year.
During the six months ended July 31, 2012, the fund realized net foreign currency losses of $478,000, which decreased distributable net income for tax purposes; accordingly, such losses have been reclassified from accumulated net realized losses to overdistributed net investment income. Certain of the fund’s investments are in securities considered to be “passive foreign investment companies,” for which any unrealized appreciation and/or realized gains are required to be included in distributable net income for tax purposes. Passive foreign investment companies held at July 31, 2012, had unrealized appreciation of $223,473,000, as of January 31, 2012, the most recent mark-to-market date for tax purposes. This amount has been distributed and is reflected in the balance of overdistributed net investment income.
At July 31, 2012, the cost of investment securities for tax purposes was $3,771,686,000. Net unrealized depreciation of investment securities for tax purposes was $719,406,000, consisting of unrealized gains of $49,176,000 on securities that had risen in value since their purchase and $768,582,000 in unrealized losses on securities that had fallen in value since their purchase.
F. During the six months ended July 31, 2012, the fund purchased $587,167,000 of investment securities and sold $732,126,000 of investment securities, other than temporary cash investments.
G. Capital shares issued and redeemed were:
| | |
| | Six Months Ended | Year Ended |
| | July 31, 2012 | January 31, 2012 |
| | Shares | Shares |
| | (000) | (000) |
| Issued | 20,694 | 29,915 |
| Issued in Lieu of Cash Distributions | 5,821 | 14,027 |
| Redeemed | (25,927) | (52,827) |
| Net Increase (Decrease) in Shares Outstanding | 588 | (8,885) |
22
Precious Metals and Mining Fund
H. Certain of the fund’s investments are in companies that are considered to be affiliated companies of the fund because the fund owns more than 5% of the outstanding voting securities of the company. Transactions during the period in securities of these companies were as follows:
| | | | | |
| | | | Current Period Transactions | |
| | Jan. 31, 2012 | | Proceeds from | | July 31, 2012 |
| | Market | Purchases | Securities | Dividend | Market |
| | Value | at Cost | Sold | Income | Value |
| | ($000) | ($000) | ($000) | ($000) | ($000) |
| Alacer Gold Corp. | 239,924 | — | 62,153 | — | 94,633 |
| AMCOL International Corp. | 87,965 | — | — | 1,109 | 94,556 |
| Apex Minerals NL | 3,979 | 5,389 | — | — | 4,597 |
| Aquila Resources Ltd. | 211,654 | 6,912 | — | — | 76,666 |
| Centerra Gold Inc. | 375,144 | — | 11,470 | 612 | 129,411 |
| Cudeco Ltd. | 55,382 | 6,913 | — | — | 57,563 |
| Discovery Metals Ltd. | 40,996 | 48,865 | — | — | 78,389 |
| Drummond Gold Ltd. | 929 | — | — | — | 294 |
| Equatorial Resources Ltd. | 15,509 | 7,601 | — | — | 18,001 |
| Galaxy Resources Ltd. | 24,581 | 34,692 | — | — | 20,316 |
| Glory Resources Ltd. | 8,711 | — | — | — | 9,858 |
| Harry Winston Diamond Corp. | 111,135 | 27,489 | — | — | 148,427 |
| Hochschild Mining plc | 315,742 | — | — | 1,173 | 265,567 |
| Kumarina Resources Ltd. | 2,567 | — | — | — | 992 |
| Medusa Mining Ltd. | 144,972 | — | — | 1,124 | 127,118 |
| Minefinders Corp. | 172,996 | — | 27,650 | — | NA1 |
| Nevsun Resources Ltd. | 253,032 | — | — | 1,666 | 134,367 |
| NovaGold Resources Inc. | 219,420 | — | 165,773 | 133 | — |
| OZ Minerals Ltd. | 199,102 | 22,846 | 2,920 | 5,645 | 149,790 |
| Panoramic Resources Ltd. | 27,580 | 647 | — | 413 | 12,817 |
| Reed Resources Ltd. | 9,921 | 8,563 | — | — | 12,636 |
| Resolute Mining Ltd. | 112,781 | — | — | — | 73,559 |
| SEMAFO Inc. | 98,225 | — | 73,935 | 25 | NA2 |
| Speewah Metals Ltd. | 3,430 | — | — | — | 1,135 |
| St. Barbara Ltd. | 126,529 | — | — | — | 74,066 |
| | 2,862,206 | | | 11,900 | 1,584,758 |
1 Not applicable—In March 2012, Minefinders Corp. merged into Pan American Silver Corp. At July 31, 2012, the security was no longer held in the fund.
2 Not applicable—At July 31, 2012, the security was still held, but the issuer was no longer an affiliated company of the fund.
I. In preparing the financial statements as of July 31, 2012, management considered the impact of subsequent events for potential recognition or disclosure in these financial statements.
23
About Your Fund’s Expenses
As a shareholder of the fund, you incur ongoing costs, which include costs for portfolio management, administrative services, and shareholder reports (like this one), among others. Operating expenses, which are deducted from a fund’s gross income, directly reduce the investment return of the fund.
A fund’s expenses are expressed as a percentage of its average net assets. This figure is known as the expense ratio. The following examples are intended to help you understand the ongoing costs (in dollars) of investing in your fund and to compare these costs with those of other mutual funds. The examples are based on an investment of $1,000 made at the beginning of the period shown and held for the entire period.
The accompanying table illustrates your fund’s costs in two ways:
• Based on actual fund return. This section helps you to estimate the actual expenses that you paid over the period. The ”Ending Account Value“ shown is derived from the fund‘s actual return, and the third column shows the dollar amount that would have been paid by an investor who started with $1,000 in the fund. You may use the information here, together with the amount you invested, to estimate the expenses that you paid over the period.
To do so, simply divide your account value by $1,000 (for example, an $8,600 account value divided by $1,000 = 8.6), then multiply the result by the number given for your fund under the heading ”Expenses Paid During Period.“
• Based on hypothetical 5% yearly return. This section is intended to help you compare your fund‘s costs with those of other mutual funds. It assumes that the fund had a yearly return of 5% before expenses, but that the expense ratio is unchanged. In this case—because the return used is not the fund’s actual return—the results do not apply to your investment. The example is useful in making comparisons because the Securities and Exchange Commission requires all mutual funds to calculate expenses based on a 5% return. You can assess your fund’s costs by comparing this hypothetical example with the hypothetical examples that appear in shareholder reports of other funds.
Note that the expenses shown in the table are meant to highlight and help you compare ongoing costs only and do not reflect transaction costs incurred by the fund for buying and selling securities. Further, the expenses do not include any purchase, redemption, or account service fees described in the fund prospectus. If such fees were applied to your account, your costs would be higher. Your fund does not carry a “sales load.”
The calculations assume no shares were bought or sold during the period. Your actual costs may have been higher or lower, depending on the amount of your investment and the timing of any purchases or redemptions.
You can find more information about the fund’s expenses, including annual expense ratios, in the Financial Statements section of this report. For additional information on operating expenses and other shareholder costs, please refer to your fund’s current prospectus.
24
| | | |
| Six Months Ended July 31, 2012 | | | |
| | Beginning | Ending | Expenses |
| | Account Value | Account Value | Paid During |
| Precious Metals and Mining Fund | 1/31/2012 | 7/31/2012 | Period |
| Based on Actual Fund Return | $1,000.00 | $703.72 | $1.14 |
| Based on Hypothetical 5% Yearly Return | 1,000.00 | 1,023.52 | 1.36 |
The calculations are based on expenses incurred in the most recent six-month period. The fund’s annualized six-month expense ratio for that period is 0.27%. The dollar amounts shown as “Expenses Paid” are equal to the annualized expense ratio multiplied by the average account value over the period, multiplied by the number of days in the most recent six-month period, then divided by the number of days in the most recent 12-month period.
25
Trustees Approve Advisory Agreement
The board of trustees of Vanguard Precious Metals and Mining Fund has renewed the fund’s investment advisory agreement with M&G Investment Management Limited. The board determined that the retention of the advisor was in the best interests of the fund and its shareholders.
The board based its decision upon an evaluation of the advisor’s investment staff, portfolio management process, and performance. The trustees considered the factors discussed below, among others. However, no single factor determined whether the board approved the agreement. Rather, it was the totality of the circumstances that drove the board’s decision.
Nature, extent, and quality of services
The board considered the quality of the fund’s investment management over both the short and long term, and took into account the organizational depth and stability of the advisor. The board noted that M&G, founded in 1931, offers a broad range of investment products. M&G continues to employ a sound process, selecting companies that are broadly representative of the metals and mining industries, with an emphasis on well-managed, returns-focused companies. The fund may be invested in rare minerals (such as diamonds), precious metals (such as gold, silver, and platinum), and in base metals and minerals (such as coal). The advisor’s global equity research team conducts intensive fundamental analysis on companies in the industry, including regular company visits. The firm has advised the fund since the fund’s inception in 1984.
The board concluded that the advisor’s experience, stability, depth, and performance, among other factors, warranted continuation of the advisory agreement.
Investment performance
The board considered the short- and long-term performance of the fund, including any periods of outperformance or underperformance of a relevant benchmark and peer group. The board noted that the fund is more broadly diversified than its competitors—with the ability to invest up to half of the fund’s assets in non-precious metals and mining stocks. The board concluded that the advisor has carried out the fund’s investment strategy in disciplined fashion, and that performance results have allowed the fund to remain competitive versus its benchmark and peer group. Information about the fund’s most recent performance can be found in the Performance Summary section of this report.
Cost
The board concluded that the fund’s expense ratio was well below the average expense ratio charged by funds in its peer group and that the fund’s advisory fee rate was also well below its peer-group average. Information about the fund’s expenses appears in the About Your Fund’s Expenses section of this report as well as in the Financial Statements section, which also includes information about the advisory fee rate.
The board did not consider profitability of M&G in determining whether to approve the advisory fee, because M&G is independent of Vanguard, and the advisory fee is the result of arm’s-length negotiations.
The benefit of economies of scale
The board concluded that the fund’s shareholders benefit from economies of scale because of breakpoints in the advisory fee schedule. The breakpoints reduce the effective rate of the fee as the fund’s assets increase.
The board will consider whether to renew the advisory agreement again after a one-year period.
26
Glossary
Beta. A measure of the magnitude of a fund’s past share-price fluctuations in relation to the ups and downs of a given market index. The index is assigned a beta of 1.00. Compared with a given index, a fund with a beta of 1.20 typically would have seen its share price rise or fall by 12% when the index rose or fell by 10%. For this report, beta is based on returns over the past 36 months for both the fund and the index. Note that a fund’s beta should be reviewed in conjunction with its R-squared (see definition). The lower the R-squared, the less correlation there is between the fund and the index, and the less reliable beta is as an indicator of volatility.
Dividend Yield. Dividend income earned by stocks, expressed as a percentage of the aggregate market value (or of net asset value, for a fund). The yield is determined by dividing the amount of the annual dividends by the aggregate value (or net asset value) at the end of the period. For a fund, the dividend yield is based solely on stock holdings and does not include any income produced by other investments.
Earnings Growth Rate. The average annual rate of growth in earnings over the past five years for the stocks now in a fund.
Equity Exposure. A measure that reflects a fund’s investments in stocks and stock futures. Any holdings in short-term reserves are excluded.
Expense Ratio. A fund’s total annual operating expenses expressed as a percentage of the fund’s average net assets. The expense ratio includes management and administrative expenses, but does not include the transaction costs of buying and selling portfolio securities.
Foreign Holdings. The percentage of a fund represented by securities or depositary receipts of companies based outside the United States.
Inception Date. The date on which the assets of a fund (or one of its share classes) are first invested in accordance with the fund’s investment objective. For funds with a subscription period, the inception date is the day after that period ends. Investment performance is measured from the inception date.
Median Market Cap. An indicator of the size of companies in which a fund invests; the midpoint of market capitalization (market price x shares outstanding) of a fund’s stocks, weighted by the proportion of the fund’s assets invested in each stock. Stocks representing half of the fund’s assets have market capitalizations above the median, and the rest are below it.
Price/Book Ratio. The share price of a stock divided by its net worth, or book value, per share. For a fund, the weighted average price/book ratio of the stocks it holds.
R-Squared. A measure of how much of a fund’s past returns can be explained by the returns from the market in general, as measured by a given index. If a fund’s total returns were precisely synchronized with an index’s returns, its R-squared would be 1.00. If the fund’s returns bore no relationship to the index’s returns, its R-squared would be 0. For this report, R-squared is based on returns over the past 36 months for both the fund and the index.
Return on Equity. The annual average rate of return generated by a company during the past five years for each dollar of shareholder’s equity (net income divided by shareholder’s equity). For a fund, the weighted average return on equity for the companies whose stocks it holds.
27
Short-Term Reserves. The percentage of a fund invested in highly liquid, short-term securities that can be readily converted to cash.
Turnover Rate. An indication of the fund’s trading activity. Funds with high turnover rates incur higher transaction costs and may be more likely to distribute capital gains (which may be taxable to investors). The turnover rate excludes in-kind transactions, which have minimal impact on costs.
28
This page intentionally left blank.
This page intentionally left blank.
This page intentionally left blank.
The People Who Govern Your Fund
The trustees of your mutual fund are there to see that the fund is operated and managed in your best interests since, as a shareholder, you are a part owner of the fund. Your fund’s trustees also serve on the board of directors of The Vanguard Group, Inc., which is owned by the Vanguard funds and provides services to them on an at-cost basis.
A majority of Vanguard’s board members are independent, meaning that they have no affiliation with Vanguard or the funds they oversee, apart from the sizable personal investments they have made as private individuals. The independent board members have distinguished backgrounds in business, academia, and public service. Each of the trustees and executive officers oversees 179 Vanguard funds.
The following table provides information for each trustee and executive officer of the fund. More information about the trustees is in the Statement of Additional Information, which can be obtained, without charge, by contacting Vanguard at 800-662-7447, or online at vanguard.com.
| |
| InterestedTrustee1 | and Delphi Automotive LLP (automotive components); |
| | Senior Advisor at New Mountain Capital; Trustee of |
| F. William McNabb III | The Conference Board. |
| Born 1957. Trustee Since July 2009. Chairman of the | |
| Board. Principal Occupation(s) During the Past Five | Amy Gutmann |
| Years: Chairman of the Board of The Vanguard Group, | Born 1949. Trustee Since June 2006. Principal |
| Inc., and of each of the investment companies served | Occupation(s) During the Past Five Years: President |
| by The Vanguard Group, since January 2010; Director | of the University of Pennsylvania; Christopher H. |
| of The Vanguard Group since 2008; Chief Executive | Browne Distinguished Professor of Political Science |
| Officer and President of The Vanguard Group and of | in the School of Arts and Sciences with secondary |
| each of the investment companies served by The | appointments at the Annenberg School for |
| Vanguard Group since 2008; Director of Vanguard | Communication and the Graduate School of Education |
| Marketing Corporation; Managing Director of The | of the University of Pennsylvania; Member of the |
| Vanguard Group (1995–2008). | National Commission on the Humanities and Social |
| Sciences; Trustee of Carnegie Corporation of New |
| York and of the National Constitution Center; Chair |
| IndependentTrustees | of the U.S. Presidential Commission for the Study |
| of Bioethical Issues. |
| Emerson U. Fullwood | |
| Born 1948. Trustee Since January 2008. Principal | JoAnn Heffernan Heisen |
| Occupation(s) During the Past Five Years: Executive | Born 1950. Trustee Since July 1998. Principal |
| Chief Staff and Marketing Officer for North America | Occupation(s) During the Past Five Years: Corporate |
| and Corporate Vice President (retired 2008) of Xerox | Vice President and Chief Global Diversity Officer |
| Corporation (document management products and | (retired 2008) and Member of the Executive |
| services); Executive in Residence and 2010 | Committee (1997–2008) of Johnson & Johnson |
| Distinguished Minett Professor at the Rochester | (pharmaceuticals/medical devices/consumer |
| Institute of Technology; Director of SPX Corporation | products); Director of Skytop Lodge Corporation |
| (multi-industry manufacturing), the United Way of | (hotels), the University Medical Center at Princeton, |
| Rochester, Amerigroup Corporation (managed health | the Robert Wood Johnson Foundation, and the Center |
| care), the University of Rochester Medical Center, | for Talent Innovation; Member of the Advisory Board |
| Monroe Community College Foundation, and North | of the Maxwell School of Citizenship and Public Affairs |
| Carolina A&T University. | at Syracuse University. |
| |
| Rajiv L. Gupta | F. Joseph Loughrey |
| Born 1945. Trustee Since December 2001. 2 | Born 1949. Trustee Since October 2009. Principal |
| Principal Occupation(s) During the Past Five Years: | Occupation(s) During the Past Five Years: President |
| Chairman and Chief Executive Officer (retired 2009) | and Chief Operating Officer (retired 2009) of Cummins |
| and President (2006–2008) of Rohm and Haas Co. | Inc. (industrial machinery); Director of SKF AB |
| (chemicals); Director of Tyco International, Ltd. | (industrial machinery), Hillenbrand, Inc. (specialized |
| (diversified manufacturing and services), Hewlett- | consumer services), the Lumina Foundation for |
| Packard Co. (electronic computer manufacturing), | |
| | |
| Education, and Oxfam America; Chairman of the | Executive Officers | |
| Advisory Council for the College of Arts and Letters | | |
| and Member of the Advisory Board to the Kellogg | Glenn Booraem | |
| Institute for International Studies at the University | Born 1967. Controller Since July 2010. Principal |
| of Notre Dame. | Occupation(s) During the Past Five Years: Principal |
| | of The Vanguard Group, Inc.; Controller of each of |
| Mark Loughridge | the investment companies served by The Vanguard |
| Born 1953. Trustee Since March 2012. Principal | Group; Assistant Controller of each of the investment |
| Occupation(s) During the Past Five Years: Senior Vice | companies served by The Vanguard Group (2001–2010). |
| President and Chief Financial Officer at IBM (information | | |
| technology services); Fiduciary Member of IBM’s | Thomas J. Higgins | |
| Retirement Plan Committee. | Born 1957. Chief Financial Officer Since September |
| | 2008. Principal Occupation(s) During the Past Five |
| Scott C. Malpass | Years: Principal of The Vanguard Group, Inc.; Chief |
| Born 1962. Trustee Since March 2012. Principal | Financial Officer of each of the investment companies |
| Occupation(s) During the Past Five Years: Chief | served by The Vanguard Group; Treasurer of each of |
| Investment Officer and Vice President at the University | the investment companies served by The Vanguard |
| of Notre Dame; Assistant Professor of Finance at the | Group (1998–2008). | |
| Mendoza College of Business at Notre Dame; Member | | |
| of the Notre Dame 403(b) Investment Committee; | Kathryn J. Hyatt | |
| Director of TIFF Advisory Services, Inc. (investment | Born 1955. Treasurer Since November 2008. Principal |
| advisor); Member of the Investment Advisory | Occupation(s) During the Past Five Years: Principal of |
| Committees of the Financial Industry Regulatory | The Vanguard Group, Inc.; Treasurer of each of the |
| Authority (FINRA) and of Major League Baseball. | investment companies served by The Vanguard |
| | Group; Assistant Treasurer of each of the investment |
| André F. Perold | companies served by The Vanguard Group (1988–2008). |
| Born 1952. Trustee Since December 2004. Principal | | |
| Occupation(s) During the Past Five Years: George | Heidi Stam | |
| Gund Professor of Finance and Banking at the Harvard | Born 1956. Secretary Since July 2005. Principal |
| Business School (retired 2011); Chief Investment | Occupation(s) During the Past Five Years: Managing |
| Officer and Managing Partner of HighVista Strategies | Director of The Vanguard Group, Inc.; General Counsel |
| LLC (private investment firm); Director of Rand | of The Vanguard Group; Secretary of The Vanguard |
| Merchant Bank; Overseer of the Museum of Fine | Group and of each of the investment companies |
| Arts Boston. | served by The Vanguard Group; Director and Senior |
| | Vice President of Vanguard Marketing Corporation. |
| Alfred M. Rankin, Jr. | | |
| Born 1941. Trustee Since January 1993. Principal | Vanguard Senior ManagementTeam |
| Occupation(s) During the Past Five Years: Chairman, | | |
| President, and Chief Executive Officer of NACCO | Mortimer J. Buckley | Michael S. Miller |
| Industries, Inc. (forklift trucks/housewares/lignite); | Kathleen C. Gubanich | James M. Norris |
| Director of Goodrich Corporation (industrial products/ | Paul A. Heller | Glenn W. Reed |
| aircraft systems and services) and the National | Martha G. King | George U. Sauter |
| Association of Manufacturers; Chairman of the Board | Chris D. McIsaac | |
| of the Federal Reserve Bank of Cleveland and of | | |
| University Hospitals of Cleveland; Advisory Chairman | Chairman Emeritus and Senior Advisor |
| of the Board of The Cleveland Museum of Art. | | |
| | John J. Brennan | |
| Peter F. Volanakis | Chairman, 1996–2009 | |
| Born 1955. Trustee Since July 2009. Principal | Chief Executive Officer and President, 1996–2008 |
| Occupation(s) During the Past Five Years: President | |
| and Chief Operating Officer (retired 2010) of Corning | | |
| Incorporated (communications equipment); Director | Founder | |
| of SPX Corporation (multi-industry manufacturing); | John C. Bogle | |
| Overseer of the Amos Tuck School of Business | Chairman and Chief Executive Officer, 1974–1996 |
| Administration at Dartmouth College; Advisor to the | | |
| Norris Cotton Cancer Center. | | |
1 Mr. McNabb is considered an “interested person,” as defined in the Investment Company Act of 1940, because he is an officer of the Vanguard funds.
2 December 2002 for Vanguard Equity Income Fund, Vanguard Growth Equity Fund, the Vanguard Municipal Bond Funds, and the Vanguard State Tax-Exempt Funds.
|  |
| P.O. Box 2600 |
| Valley Forge, PA 19482-2600 |
Connect with Vanguard® > vanguard.com
| |
| Fund Information > 800-662-7447 | |
| Direct Investor Account Services > 800-662-2739 | |
| Institutional Investor Services > 800-523-1036 | |
| Text Telephone for People | |
| With Hearing Impairment > 800-749-7273 | |
| |
| This material may be used in conjunction | |
| with the offering of shares of any Vanguard | |
| fund only if preceded or accompanied by | |
| the fund’s current prospectus. | |
| |
| All comparative mutual fund data are from Lipper Inc. or | |
| Morningstar, Inc., unless otherwise noted. | |
| |
| You can obtain a free copy of Vanguard’s proxy voting | |
| guidelines by visiting vanguard.com/proxyreporting or by | |
| calling Vanguard at 800-662-2739. The guidelines are | |
| also available from the SEC’s website, sec.gov. In | |
| addition, you may obtain a free report on how your fund | |
| voted the proxies for securities it owned during the 12 | |
| months ended June 30. To get the report, visit either | |
| vanguard.com/proxyreporting or sec.gov. | |
| |
| You can review and copy information about your fund at | |
| the SEC’s Public Reference Room in Washington, D.C. To | |
| find out more about this public service, call the SEC at | |
| 202-551-8090. Information about your fund is also | |
| available on the SEC’s website, and you can receive | |
| copies of this information, for a fee, by sending a | |
| request in either of two ways: via e-mail addressed to | |
| publicinfo@sec.gov or via regular mail addressed to the | |
| Public Reference Section, Securities and Exchange | |
| Commission, Washington, DC 20549-1520. | |
| | © 2012 The Vanguard Group, Inc. |
| | All rights reserved. |
| | Vanguard Marketing Corporation, Distributor. |
| |
| | Q532 092012 |
 |
| |
| Semiannual Report | July 31, 2012 |
| Vanguard Health Care Fund |
> For the six months ended July 31, 2012, Vanguard Health Care Fund returned about 6%, lagging the return of its benchmark index and the average return of its peer funds.
> Disappointing stock choices among health insurers contributed to the fund’s underperformance of its comparative standards.
> Health care stocks generally outperformed the broader market, as investors sought out “defensive” investments that are relatively insulated from economic ups and downs.
| |
| Contents | |
| Your Fund’s Total Returns. | 1 |
| Chairman’s Letter. | 2 |
| Advisor’s Report. | 6 |
| Fund Profile. | 10 |
| Performance Summary. | 12 |
| Financial Statements. | 13 |
| About Your Fund’s Expenses. | 26 |
| Trustees Approve Advisory Agreement. | 28 |
| Glossary. | 29 |
Please note: The opinions expressed in this report are just that—informed opinions. They should not be considered promises or advice. Also, please keep in mind that the information and opinions cover the period through the date on the front of this report. Of course, the risks of investing in your fund are spelled out in the prospectus.
See the Glossary for definitions of investment terms used in this report.
About the cover: Vanguard was named for the HMS Vanguard, flagship of British Admiral Horatio Nelson. A ship—whose performance and safety depend on the work of all hands—has served as a fitting metaphor for the Vanguard crew as we strive to help clients reach their financial goals.
Your Fund’s Total Returns
| |
| Six Months Ended July 31, 2012 | |
| | Total |
| | Returns |
| Vanguard Health Care Fund | |
| Investor Shares | 6.30% |
| Admiral™ Shares | 6.32 |
| MSCI All Country World Health Care Index | 8.65 |
| Global Health/Biotechnology Funds Average | 7.54 |
Global Health/Biotechnology Funds Average: Derived from data provided by Lipper Inc.
Admiral Shares carry lower expenses and are available to investors who meet certain account-balance requirements.
| | | | |
| Your Fund’s Performance at a Glance | | | | |
| January 31, 2012, Through July 31, 2012 | | | | |
| | | | Distributions Per Share |
| | Starting | Ending | Income | Capital |
| | Share Price | Share Price | Dividends | Gains |
| Vanguard Health Care Fund | | | | |
| Investor Shares | $131.96 | $140.12 | $0.096 | $0.054 |
| Admiral Shares | 55.68 | 59.13 | 0.044 | 0.023 |
1

Chairman’s Letter
Dear Shareholder,
Health care stocks turned in strong gains for the six months ended July 31, 2012, as investors sought refuge from concerns about the European debt crisis and lackluster U.S. economic growth.
Vanguard Health Care Fund didn’t quite keep pace with the health care sector overall, but still delivered a solid return of more than 6% for both Investor and Admiral Shares. Peer funds, on average, returned 7.54%, and the benchmark MSCI All Country World Health Care Index advanced 8.65%. Poor results from the fund’s health insurance stocks contributed to its underperformance of its comparative standards for the six-month period.
Please note that Vanguard eliminated the redemption fee for your fund in May. The fund’s trustees determined that the fee, which was one of several measures in place to protect the interests of long-term investors and discourage frequent trading, was no longer needed.
International equities slumped; U.S stocks escaped the downdraft
U.S. stocks outperformed their international counterparts handily, returning about 5% for the six months ended July 31. Stocks of large companies fared best as investors seemed to be seeking stability amid the uncertainty surrounding Europe’s debt troubles.
2
International stocks were generally weak, with currency effects further hindering results for U.S.-based investors. Though European stocks posted a modest advance in local-currency terms, their return was negative once converted into U.S. dollars—a result of the dollar’s strengthening against the euro during the six months. Signs of slowing economic growth hurt returns for emerging markets and the developed markets of the Pacific region.
Questions about the finances of European governments and banks continued to preoccupy investors, and global stock markets moved sharply up and down in response to the latest headlines. Although the situation in Europe is very fluid, Vanguard economists believe the most
likely scenario is that the Eurozone will “muddle through” for several years, with occasional spikes in market volatility, as fiscal tightening continues in the face of weak economic growth.
Bonds kept up a steady advance as Treasury yields kept dwindling
U.S. Treasury securities stretched their gains during the period, as investors lost more of their appetite for risk. Bond prices moved higher, and the yield of the 10-year U.S. Treasury note fell to a record low in July, closing below 1.5%. (Bond yields and prices move in opposite directions.) The broad U.S. taxable bond market posted a return of nearly 3%, and municipal bonds had about the same result for the six months.
| | | |
| Market Barometer | | | |
| |
| | | | Total Returns |
| | | Periods Ended July 31, 2012 |
| | Six | One | Five Years |
| | Months | Year | (Annualized) |
| Stocks | | | |
| Russell 1000 Index (Large-caps) | 5.54% | 7.96% | 1.26% |
| Russell 2000 Index (Small-caps) | -0.03 | 0.19 | 1.69 |
| Dow Jones U.S. Total Stock Market Index | 5.01 | 7.07 | 1.50 |
| MSCI All Country World Index ex USA (International) | -2.40 | -12.16 | -4.29 |
| |
| Bonds | | | |
| Barclays U.S. Aggregate Bond Index (Broad taxable | | | |
| market) | 2.88% | 7.25% | 6.91% |
| Barclays Municipal Bond Index (Broad tax-exempt | | | |
| market) | 2.93 | 10.51 | 6.12 |
| Citigroup Three-Month U.S. Treasury Bill Index | 0.04 | 0.05 | 0.79 |
| |
| CPI | | | |
| Consumer Price Index | 1.08% | 1.41% | 1.92% |
3
Investors have enjoyed several years of strong bond returns, but they shouldn’t be surprised if future results are weaker. As yields tumble, the scope for further declines—and price increases—diminishes.
As it has since December 2008, the Federal Reserve Board held its target for the shortest-term interest rates between 0% and 0.25%, keeping a tight lid on the returns from money market funds and savings accounts.
Health care stocks can prosper when uncertainty dominates the markets
As I mentioned, health care stocks produced strong gains for the six months, outperforming the broader market. In times of heightened concern about the economic outlook, health care stocks can do well.
That’s because investors see health care spending as being insulated from the effects of a slowing economy—the expectation is that consumers would cut discretionary expenses before reducing their medical spending.
Internationally, health care stocks also seemed to benefit from their status as a “defensive” investment. The MSCI All Country World Health Care Index significantly outperformed its broader counterpart, the MSCI All Country World Index, which edged up about 1.5%. As of July 31, a little more than 20% of the Health Care Fund was invested internationally, mostly in the stocks of European and Japanese pharmaceutical companies.
| | | |
| Expense Ratios | | | |
| Your Fund Compared With Its Peer Group | | | |
| | Investor | Admiral | Peer Group |
| | Shares | Shares | Average |
| Health Care Fund | 0.35% | 0.30% | 1.39% |
The fund expense ratios shown are from the prospectus dated May 29, 2012, and represent estimated costs for the current fiscal year. For the six months ended July 31, 2012, the fund’s annualized expense ratios were 0.35% for Investor Shares and 0.30% for Admiral Shares. The peer-group expense ratio is derived from data provided by Lipper Inc. and captures information through year-end 2011.
Peer group: Global Health/Biotechnology Funds.
4
Of course, no business is entirely immune from economic forces. Health insurance stocks owned by the fund suffered during the period amid investor concerns that rising medical costs would hurt profits. About 12% of the fund was invested in the stocks of health insurance, or managed care, companies, nearly three times the allocation in the benchmark as of July 31.
In June, the U.S. Supreme Court issued a highly anticipated ruling on the Affordable Care Act, largely upholding the health care legislation passed in 2010, including a requirement that individuals carry health insurance. While the ruling removed some uncertainty from the market, it’s difficult to say at this point exactly how the law may affect health insurance companies or the health care industry overall.
The advisor’s choices among pharmaceutical and biotechnology stocks were among the bright spots for the fund in the six-month period. Drugmakers in particular have been buoyed by recent successes in winning federal regulatory approval for new medications and for label expansions of several existing drugs.
The Advisor’s Report that follows this letter provides additional details about the management of the fund during the year.
Portfolio manager Edward P. Owens to retire after exemplary career
In closing, I wanted to highlight an important change that we announced in early September: Edward P. Owens, CFA, the portfolio manager of your fund, plans to retire on December 31, 2012. Ed has managed the Health Care Fund since its 1984 inception, making him Vanguard’s longest-tenured external portfolio manager. Ed’s performance has been, in a word, remarkable, and we thank him for his years of exemplary service to Vanguard clients.
Ed has also distinguished himself by developing a team of investment professionals with deep expertise in the health care sector. Associate portfolio manager Jean M. Hynes, CFA, will manage the fund when Ed retires. Jean has served on the fund’s management team for nearly 20 years. She and her Wellington colleagues are well positioned to build on the Health Care Fund’s distinguished legacy.
As always, thank you for entrusting your assets to Vanguard.
Sincerely,

F. William McNabb III
Chairman and Chief Executive Officer
September 5, 2012
5
Advisor’s Report
Vanguard Health Care Fund gained 6.30% for Investor Shares for the six months ended July 31, 2012, underperforming its benchmark, the MSCI All Country World Health Care Index, which returned 8.65%. The fund also trailed the 7.54% average return of peer health and biotechnology funds.
The investment environment
Health care stocks outperformed broad market equity indexes by a comfortable margin. Market participants remained concerned about weak economic growth, and equity investors seemed to take comfort in the perceived relative safety of health care stocks.
While investing in the health care sector presents unique risks of its own, improvement in the fundamentals of health care companies drove returns higher. The recent trend of increased FDA approvals over the past few years has also continued to support health care stocks.
At the end of June, the U.S. Supreme Court upheld all key provisions of the Patient Protection and Affordable Care Act, which was passed in 2010. The decision did not alter our long-term outlook or the fund’s positioning. Uncertainty remains high about what the U.S. health care system will look like eventually.
| |
| Major Portfolio Changes | |
| Six Months Ended July 31, 2012 | |
| |
| Additions | Comments |
| Teva Pharmaceutical Industries | The leading generic pharmaceutical company; we were |
| | encouraged by new management’s rebasing of earnings and |
| capital discipline. |
| UCB | Belgian-based biopharmaceutical company that has benefited from |
| | the growth of three new products and an exciting osteoporosis |
| | treatment in late-stage trials. |
| Allscripts Healthcare | The stock price was down significantly because of weak earnings |
| | and news that its chief financial officer would be resigning along |
| | with four board members; this significant slide offered us the |
| | opportunity to initiate a position in this leading health care IT |
| | company. |
| Life Technologies | A California-based global biotechnology tools company that |
| | provides products and services for research and development of |
| | existing and new drugs; we initiated a position at a favorable |
| | valuation. |
| Reductions | Comments |
| Biogen Idec | Trimmed our position as the stock rose when the market took |
| | notice of the potential of its multiple sclerosis drug. |
| Gilead Sciences | We decreased our position amid the stock’s strong performance; |
| | while we still like the company’s growth prospects, competitive |
| | threats to its HIV franchise are emerging. |
| Warner Chilcott | We eliminated our small position in the specialty pharmaceutical |
| | company when the stock rose amid takeover speculation. |
6
The magnitude of the health care cost problem in the United States is substantial, creating both risks and opportunities for health care stocks, as large employers and the government attempt to rein in health care costs.
Our successes
Two of our largest positions at the end of the period, Merck and Amgen, were among the fund’s top contributors to performance. Abbott Laboratories, Astellas Pharma, and Cerner also contributed favorably to the fund’s results.
Merck reported decent earnings during the period, along with positive top-line results for suvorexant, a potential new treatment for insomnia, and odanacatib, a potential new treatment for osteoporosis. The company’s late-stage portfolio is gaining more recognition from the market. The company has an attractive valuation, a solid dividend yield, and a diversified pharmaceutical revenue base. Furthermore, Merck is controlling costs and benefiting from strong sales of existing products.
Amgen, the biotechnology company, reported results that exceeded the market’s expectations during the period. Investors responded favorably to the company’s disciplined cost controls and robust sales of products, including Enbrel, an inflammation drug, and Prolia, a drug for treating osteoporosis. The company’s management remains committed to increasing the dividend over time and continuing to buy back shares. We trimmed our position during the period.
Abbott Laboratories is engaged in the discovery, development, manufacture, and sale of a range of health care products. Abbott’s stock benefited from the news that the company would be splitting into two separate companies: a research-based proprietary pharmaceutical company and a diversified medical products company. We expect the stock to do well in the coming years if current management is able to effectively execute its long-term business strategy and as the pharmaceutical pipeline matures. We modestly pared back our exposure during the period.
Our shortfalls
The fund held a number of positions that hindered returns during the period. Among the holdings that declined in share price were managed care organizations Humana, WellPoint, Health Net, and CIGNA. Medical technology stocks Boston Scientific and St. Jude Medical held back performance as well.
Unlike in recent periods, when managed care organizations have collectively posted consistently positive results, this year’s numbers have been more mixed for the group. Humana was a prominent detractor among the fund’s managed care holdings. At the close of the period, Humana’s management announced lower earnings
7
expectations. We found an opportunity to increase our position size amid the negative market reaction, which was too severe in our view.
Humana was not alone. Health Net, a managed care organization that delivers services through health plans, including government-sponsored plans, saw its shares drop during the latter part of the period. The market reacted to disappointing numbers, attributed largely to a prior-period reserve adjustment. We trimmed our position earlier in the period.
CIGNA also declined during the period. We think that fundamentals will remain favorable for managed care organizations in the intermediate term and that the company’s acquisitions will drive growth. We added to our position while shares were under pressure after the company announced conservative earnings guidance.
St. Jude Medical is a U.S.-based medical technology company. While uncertainty resulting from debates about product quality has pressured the stock, we hold a favorable longer-term view of St. Jude. In addition to its leading technology, diversified revenue mix, and strong balance sheet, St. Jude has achieved progress in its product pipeline. We believe that new products will contribute to accelerated sales growth in the future. We added to our position during the period.
The fund’s positioning
Following the Supreme Court decision, the health care industry continues to face risks, but it has many opportunities as well.
In our view, success will accrue to those companies able to offer an improvement over current standards of care or an equivalent level of care at a lower price. This is one of the key tenets upon which we have structured Vanguard Health Care Fund.
More than half the fund’s assets are invested in pharmaceutical, biotechnology, and specialty pharmaceutical companies. We remain attracted to the combination of valuation, innovation, and volume growth around the globe.
We believe that the managed care companies still offer meaningful upside. In addition to a more benign tone from Washington, the commercial underwriting cycle remains favorable. While we expect to see a slight acceleration in the medical cost trend through the end of the year, given the abnormally depressed levels experienced in 2010 and 2011, we believe that the uptick will be muted as employers and individuals look to keep health care spending under control. More important, we believe managed care companies will remain part of the long-term solution to controlling health care costs in the United States.
8
We also favor drug distributors and drug stores, which are poised to benefit from the conversion of approximately $100 billion of branded pharmaceuticals to generics over the next several years.
While we are confident in the portfolio’s positioning, we will continue to monitor industry developments closely and make adjustments to the fund as needed. As always, we will continue to strive to identify early the drugs and devices with the best chances of changing medicine, as well as the service companies that are best positioned to capture opportunities along the health care chain. We will continue to stay diversified across the industry’s subsectors, focused on the long haul, and positioned in the most attractive health care stocks.
Edward P. Owens, CFA
Senior Vice President and Portfolio Manager
Jean M. Hynes, CFA
Senior Vice President and Associate Portfolio Manager
Wellington Management Company, llp
August 14, 2012
9
Health Care Fund
Fund Profile
As of July 31, 2012
| | |
| Share-Class Characteristics | |
| | Investor | Admiral |
| | Shares | Shares |
| Ticker Symbol | VGHCX | VGHAX |
| Expense Ratio1 | 0.35% | 0.30% |
| 30-Day SEC Yield | 1.67% | 1.72% |
| | | |
| Portfolio Characteristics | | |
| | | MSCI | DJ |
| | | ACWI | U.S. Total |
| | | Health | Market |
| | Fund | Care | Index |
| Number of Stocks | 84 | 134 | 3,684 |
| Median Market Cap | $34.9B | $60.1B | $34.4B |
| Price/Earnings Ratio | 15.0x | 17.3x | 15.7x |
| Price/Book Ratio | 2.2x | 2.8x | 2.2x |
| Return on Equity | 20.8% | 22.4% | 18.1% |
| Earnings Growth | | | |
| Rate | 7.2% | 7.7% | 9.6% |
| Dividend Yield | 2.3% | 2.6% | 2.1% |
| Foreign Holdings | 22.1% | 42.4% | 0.0% |
| Turnover Rate | | | |
| (Annualized) | 4% | — | — |
| Short-Term Reserves | 6.1% | — | — |
| | |
| Volatility Measures | | |
| | Spliced | DJ |
| | Health | U.S. Total |
| | Care | Market |
| | Index | Index |
| R-Squared | 0.93 | 0.63 |
| Beta | 0.83 | 0.53 |
These measures show the degree and timing of the fund’s fluctuations compared with the indexes over 36 months.
| | |
| Ten Largest Holdings (% of total net assets) |
| Merck & Co. Inc. | Pharmaceuticals | 7.0% |
| Amgen Inc. | Biotechnology | 4.4 |
| UnitedHealth Group Inc. | Managed Health | |
| | Care | 4.3 |
| Pfizer Inc. | Pharmaceuticals | 4.0 |
| Roche Holding AG | Pharmaceuticals | 3.9 |
| Forest Laboratories Inc. | Pharmaceuticals | 3.9 |
| McKesson Corp. | Health Care | |
| | Distributors | 3.7 |
| Abbott Laboratories | Pharmaceuticals | 3.6 |
| Astellas Pharma Inc. | Pharmaceuticals | 3.0 |
| Eli Lilly & Co. | Pharmaceuticals | 3.0 |
| Top Ten | | 40.8% |
The holdings listed exclude any temporary cash investments and equity index products.
| |
| Market Diversification (% of equity exposure) |
| Europe | |
| Switzerland | 6.0% |
| United Kingdom | 3.7 |
| Belgium | 1.4 |
| Germany | 1.2 |
| Other | 1.0 |
| Subtotal | 13.3% |
| Pacific | |
| Japan | 8.8% |
| North America | |
| United States | 76.5% |
| Middle East | |
| Israel | 1.4% |
1 The expense ratios shown are from the prospectus dated May 29, 2012, and represent estimated costs for the current fiscal year. For the six months ended July 31, 2012, the annualized expense ratios were 0.35% for Investor Shares and 0.30% for Admiral Shares.
10
Health Care Fund
| | |
| Subindustry Diversification (% of equity | |
| exposure) | | |
| | | MSCI |
| | | ACWI |
| | | Health |
| | Fund | Care |
| Biotechnology | 10.0% | 9.3% |
| Consumer Staples | 2.1 | 0.0 |
| Health Care Distributors | 5.6 | 2.6 |
| Health Care Equipment | 9.1 | 10.1 |
| Health Care Facilities | 1.9 | 0.5 |
| Health Care Services | 3.2 | 4.7 |
| Health Care Supplies | 0.4 | 1.1 |
| Health Care Technology | 2.1 | 0.4 |
| Industrials | 0.2 | 0.0 |
| Life Sciences Tools & Services | 0.5 | 2.3 |
| Managed Health Care | 12.1 | 4.3 |
| Materials | 1.1 | 0.0 |
| Pharmaceuticals | 51.7 | 64.7 |
11
Health Care Fund
Performance Summary
All of the returns in this report represent past performance, which is not a guarantee of future results that may be achieved by the fund. (Current performance may be lower or higher than the performance data cited. For performance data current to the most recent month-end, visit our website at vanguard.com/performance.) Note, too, that both investment returns and principal value can fluctuate widely, so an investor’s shares, when sold, could be worth more or less than their original cost. The returns shown do not reflect taxes that a shareholder would pay on fund distributions or on the sale of fund shares.
Fiscal-Year Total Returns (%): January 31, 2002, Through July 31, 2012
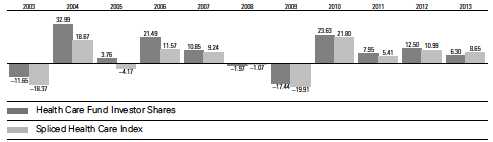
Spliced Health Care Index: S&P 500 Index through December 31, 2001; S&P Health Care Index through May 31, 2010; MSCI All Country World Health Care Index thereafter.
Note: For 2013, performance data reflect the six months ended July 31, 2012.
Average Annual Total Returns: Periods Ended June 30, 2012
This table presents returns through the latest calendar quarter—rather than through the end of the fiscal period.
Securities and Exchange Commission rules require that we provide this information.
| | | | |
| | Inception | One | Five | Ten |
| | Date | Year | Years | Years |
| Investor Shares | 5/23/1984 | 5.88% | 4.77% | 8.41% |
| Admiral Shares | 11/12/2001 | 5.92 | 4.83 | 8.49 |
See Financial Highlights for dividend and capital gains information.
12
Health Care Fund
Financial Statements (unaudited)
Statement of Net Assets
As of July 31, 2012
The fund reports a complete list of its holdings in regulatory filings four times in each fiscal year, at the quarter-ends. For the second and fourth fiscal quarters, the lists appear in the fund’s semiannual and annual reports to shareholders. For the first and third fiscal quarters, the fund files the lists with the Securities and Exchange Commission on Form N-Q. Shareholders can look up the fund’s Forms N-Q on the SEC’s website at sec.gov. Forms N-Q may also be reviewed and copied at the SEC’s Public Reference Room (see the back cover of this report for further information).
| | | |
| | | | Market |
| | | | Value |
| | | Shares | ($000) |
| Common Stocks (94.1%) | | |
| United States (72.0%) | | |
| Biotechnology (9.3%) | | |
| | Amgen Inc. | 11,858,355 | 979,500 |
| * | Gilead Sciences Inc. | 7,042,100 | 382,597 |
| * | Biogen Idec Inc. | 1,837,948 | 268,028 |
| * | Vertex Pharmaceuticals | | |
| | Inc. | 2,243,700 | 108,842 |
| * | United Therapeutics Corp. | 1,687,000 | 92,414 |
| * | Onyx Pharmaceuticals Inc. | 1,152,700 | 86,418 |
| * | Regeneron | | |
| | Pharmaceuticals Inc. | 542,200 | 73,007 |
| * | Cubist Pharmaceuticals | | |
| | Inc. | 1,323,142 | 56,975 |
| * | Ironwood Pharmaceuticals | |
| | Inc. Class A | 2,000,000 | 25,740 |
| * | Alkermes plc | 837,400 | 15,567 |
| | | | 2,089,088 |
| Chemicals (1.1%) | | |
| | Sigma-Aldrich Corp. | 3,380,000 | 233,896 |
| |
| Food & Staples Retailing (1.8%) | |
| | Walgreen Co. | 10,844,700 | 394,313 |
| | CVS Caremark Corp. | 300,000 | 13,575 |
| | | | 407,888 |
| Food Products (0.1%) | | |
| *,^ | Green Mountain Coffee | | |
| | Roasters Inc. | 1,400,000 | 25,564 |
| |
| Health Care Equipment & Supplies (8.9%) |
| | Medtronic Inc. | 10,901,100 | 429,722 |
| | St. Jude Medical Inc. | 9,110,900 | 340,383 |
| * | Boston Scientific Corp. | 46,800,000 | 241,956 |
| | Becton Dickinson and Co. | 3,102,500 | 234,890 |
| | Baxter International Inc. | 3,900,000 | 228,189 |
| | Zimmer Holdings Inc. | 2,400,000 | 141,432 |
| | | |
| | | | Market |
| | | | Value |
| | | Shares | ($000) |
| | Covidien plc | 2,150,000 | 120,142 |
| * | CareFusion Corp. | 4,734,654 | 115,573 |
| | DENTSPLY International | | |
| | Inc. | 2,485,400 | 90,320 |
| * | NuVasive Inc. | 1,680,103 | 35,097 |
| | STERIS Corp. | 803,083 | 24,197 |
| | | | 2,001,901 |
| Health Care Providers & Services (21.3%) | |
| | UnitedHealth Group Inc. | 18,785,100 | 959,731 |
| | McKesson Corp. | 9,189,900 | 833,800 |
| | WellPoint Inc. | 7,702,400 | 410,461 |
| | Humana Inc. | 6,510,094 | 401,022 |
| | Quest Diagnostics Inc. | 6,485,400 | 378,942 |
| | Cigna Corp. | 7,710,600 | 310,583 |
| 1 | Coventry Health Care Inc. | 8,427,500 | 280,888 |
| | Cardinal Health Inc. | 6,236,708 | 268,740 |
| * | Laboratory Corp. of | | |
| | America Holdings | 2,681,360 | 225,475 |
| | Universal Health Services | | |
| | Inc. Class B | 4,120,800 | 161,041 |
| *,1 | Health Management | | |
| | Associates Inc. Class A | 15,656,900 | 103,022 |
| | Aetna Inc. | 2,450,000 | 88,347 |
| | HCA Holdings Inc. | 3,300,000 | 87,384 |
| * | Health Net Inc. | 3,863,458 | 85,073 |
| | Owens & Minor Inc. | 3,000,000 | 84,630 |
| * | Tenet Healthcare Corp. | 5,600,000 | 25,872 |
| * | WellCare Health Plans Inc. | 349,000 | 22,622 |
| | Vanguard Health | | |
| | Systems Inc. | 2,556,780 | 21,733 |
| * | DaVita Inc. | 154,600 | 15,216 |
| * | HealthSouth Corp. | 386,000 | 8,646 |
| | | | 4,773,228 |
13
Health Care Fund
| | | |
| | | | Market |
| | | | Value |
| | | Shares | ($000) |
| Health Care Technology (2.0%) | |
| * | Cerner Corp. | 5,800,000 | 428,736 |
| * | Allscripts Healthcare | | |
| | Solutions Inc. | 2,439,400 | 22,443 |
| | | | 451,179 |
| Life Sciences Tools & Services (0.4%) | |
| * | PAREXEL International | | |
| | Corp. | 2,738,400 | 75,361 |
| * | Life Technologies Corp. | 527,400 | 23,142 |
| | | | 98,503 |
| Machinery (0.2%) | | |
| | Pall Corp. | 874,600 | 46,712 |
| Pharmaceuticals (26.9%) | | |
| | Merck & Co. Inc. | 35,390,648 | 1,563,205 |
| | Pfizer Inc. | 37,383,888 | 898,709 |
| *,1 | Forest Laboratories Inc. | 25,903,000 | 869,045 |
| | Abbott Laboratories | 12,100,000 | 802,351 |
| | Eli Lilly & Co. | 15,364,300 | 676,490 |
| | Bristol-Myers Squibb Co. | 11,903,061 | 423,749 |
| | Johnson & Johnson | 4,500,000 | 311,490 |
| | Perrigo Co. | 1,959,100 | 223,376 |
| * | Watson Pharmaceuticals | | |
| | Inc. | 1,600,000 | 124,528 |
| * | Salix Pharmaceuticals Ltd. | 1,554,300 | 69,664 |
| * | Hospira Inc. | 1,895,070 | 65,854 |
| | | | 6,028,461 |
| Total United States | | 16,156,420 |
| International (22.1%) | | |
| Belgium (1.3%) | | |
| | UCB SA | 5,821,811 | 291,252 |
| |
| France (0.4%) | | |
| | Sanofi | 671,976 | 54,825 |
| | Ipsen SA | 1,400,000 | 33,175 |
| | | | 88,000 |
| Germany (1.1%) | | |
| | Bayer AG | 2,694,656 | 204,667 |
| | Fresenius Medical Care | | |
| | AG & Co. KGaA | 611,950 | 44,237 |
| | | | 248,904 |
| | |
| | | Market |
| | | Value |
| | Shares | ($000) |
| Ireland (0.5%) | | |
| * Elan Corp. plc ADR | 8,894,800 | 102,735 |
| |
| Israel (1.3%) | | |
| Teva Pharmaceutical | | |
| Industries Ltd. ADR | 7,350,000 | 300,542 |
| |
| Japan (8.3%) | | |
| Astellas Pharma Inc. | 14,365,700 | 682,452 |
| Takeda Pharmaceutical | | |
| Co. Ltd. | 5,599,900 | 257,201 |
| Eisai Co. Ltd. | 5,793,700 | 256,390 |
| Daiichi Sankyo Co. Ltd. | 13,001,500 | 213,964 |
| Shionogi & Co. Ltd. | 12,066,234 | 171,870 |
| Mitsubishi Tanabe Pharma | |
| Corp. | 7,100,000 | 108,360 |
| Chugai Pharmaceutical | | |
| Co. Ltd. | 5,321,700 | 102,344 |
| Ono Pharmaceutical | | |
| Co. Ltd. | 960,000 | 60,599 |
| | | 1,853,180 |
| Norway (0.1%) | | |
| * Algeta ASA | 565,247 | 15,414 |
| |
| Switzerland (5.6%) | | |
| Roche Holding AG | 4,273,977 | 756,817 |
| Novartis AG | 4,969,880 | 291,827 |
| Roche Holding AG (Bearer) | 664,320 | 121,718 |
| Novartis AG ADR | 1,461,400 | 85,667 |
| Actelion Ltd. | 200,000 | 9,121 |
| | | 1,265,150 |
| United Kingdom (3.5%) | | |
| AstraZeneca plc | 14,181,500 | 662,312 |
| GlaxoSmithKline plc ADR | 2,742,381 | 126,149 |
| | | 788,461 |
| Total International | | 4,953,638 |
| Total Common Stocks | | |
| (Cost $12,891,884) | | 21,110,058 |
| Temporary Cash Investments (6.1%) | |
| Money Market Fund (0.0%) | | |
| 2,3 Vanguard Market | | |
| Liquidity Fund, 0.155% | 4,940,000 | 4,940 |
14
Health Care Fund
| | |
| | Face | Market |
| | Amount | Value |
| | ($000) | ($000) |
| Repurchase Agreements (4.3%) | |
| Bank of America Securities | | |
| LLC 0.170%, 8/1/12 (Dated | | |
| 7/31/12, Repurchase Value | | |
| $222,101,000, collateralized | | |
| by Federal Home Loan | | |
| Mortgage Corp. 2.713%– | | |
| 3.5000%, 5/1/42–7/1/42, | | |
| and Federal National | | |
| Mortgage Assn. 2.399%– | | |
| 3.059%, 3/1/41–5/1/42) | 222,100 | 222,100 |
| BNP Paribas Securities Corp. | | |
| 0.180%, 8/1/12 (Dated | | |
| 7/31/12, Repurchase Value | | |
| $235,701,000, collateralized | | |
| by Federal Home Loan | | |
| Mortgage Corp. 3.500%, | | |
| 6/1/42, Federal National | | |
| Mortgage Assn. 3.500%, | | |
| 12/1/25, and Government | | |
| National Mortgage Assn. | | |
| 5.000%–5.500%, 10/15/40– | |
| 5/15/41) | 235,700 | 235,700 |
| HSBC Bank USA 0.190%, | | |
| 8/1/12 (Dated 7/31/12, | | |
| Repurchase Value | | |
| $224,601,000, collater– | | |
| alized by Federal National | | |
| Mortgage Assn. 4.000%, | | |
| 1/1/41–2/1/42) | 224,600 | 224,600 |
| Morgan Stanley 0.190%, | | |
| 8/1/12 (Dated 7/31/12, | | |
| Repurchase Value | | |
| $187,801,000, collateralized | | |
| by Federal National | | |
| Mortgage Assn. 3.500%– | | |
| 6.500%, 7/1/27–7/1/47) | 187,800 | 187,800 |
| UBS Securities LLC | | |
| 0.190%, 8/1/12 (Dated | | |
| 7/31/12, Repurchase Value | | |
| $81,100,000, collateralized | | |
| by Government National | | |
| Mortgage Assn. 4.500%, | | |
| 11/20/24) | 81,100 | 81,100 |
| | | 951,300 |
| U.S. Government and Agency Obligations (0.0%) |
| 4 United States Treasury Bill, | | |
| 0.063%–0.095%, 8/9/12 | 5,920 | 5,920 |
| | |
| | Face | Market |
| | Amount | Value |
| | ($000) | ($000) |
| Commercial Paper (1.8%) | | |
| General Electric Capital Corp., | |
| 0.230%, 8/8/12 | 200,000 | 199,994 |
| General Electric Capital Corp., | |
| 0.260%, 10/3/12 | 200,000 | 199,922 |
| | | 399,916 |
| Total Temporary Cash | | |
| Investments (Cost $1,362,060) | 1,362,076 |
| Total Investments (100.2%) | |
| (Cost $14,253,944) | | 22,472,134 |
| Other Assets and Liabilities (-0.2%) | |
| Other Assets | | 68,803 |
| Liabilities3 | | (103,075) |
| | | (34,272) |
| Net Assets (100%) | | 22,437,862 |
| |
| |
| Statement of Assets and Liabilities | |
| Assets | | |
| Investments in Securities, at Value | |
| Unaffiliated Issuers | | 21,214,239 |
| Affiliated Vanguard Funds | | 4,940 |
| Other Affiliated Issuers | | 1, 252,955 |
| Total Investments in Securities | 22,472,134 |
| Receivables for Investment | | |
| Securities Sold | | 29,208 |
| Other Assets | | 39,595 |
| Total Assets | | 22,540,937 |
| Liabilities | | |
| Payables for Investment | | |
| Securities Purchased | | 16,334 |
| Other Liabilities | | 86,741 |
| Total Liabilities | | 103,075 |
| Net Assets | | 22,437,862 |
15
Health Care Fund
| |
| At July 31, 2012, net assets consisted of: |
| | Amount |
| | ($000) |
| Paid-in Capital | 13,868,757 |
| Undistributed Net Investment Income | 185,804 |
| Accumulated Net Realized Gains | 171,443 |
| Unrealized Appreciation (Depreciation) | |
| Investment Securities | 8,218,190 |
| Forward Currency Contracts | (5,365) |
| Foreign Currencies | (967) |
| Net Assets | 22,437,862 |
| |
| Investor Shares—Net Assets | |
| Applicable to 62,588,419 outstanding | |
| $.001 par value shares of beneficial | |
| interest (unlimited authorization) | 8,769,999 |
| Net Asset Value Per Share— | |
| Investor Shares | $140.12 |
| |
| Admiral Shares—Net Assets | |
| Applicable to 231,141,010 outstanding | |
| $.001 par value shares of beneficial | |
| interest (unlimited authorization) | 13,667,863 |
| Net Asset Value Per Share— | |
| Admiral Shares | $59.13 |
See Note A in Notes to Financial Statements.
* Non-income-producing security.
^ Part of security position is on loan to broker-dealers. The total value of securities on loan is $4,748,000.
1 Considered an affiliated company of the fund as the fund owns more than 5% of the outstanding voting securities of such company.
2 Affiliated money market fund available only to Vanguard funds and certain trusts and accounts managed by Vanguard. Rate shown is the 7-day yield.
3 Includes $4,940,000 of collateral received for securities on loan.
4 Securities with a value of $5,205,000 have been segregated as collateral for open forward currency contracts.
ADR—American Depositary Receipt.
See accompanying Notes, which are an integral part of the Financial Statements.
16
Health Care Fund
| |
| Statement of Operations | |
| |
| | Six Months Ended |
| | July 31, 2012 |
| | ($000) |
| Investment Income | |
| Income | |
| Dividends1,2 | 282,750 |
| Interest | 1,377 |
| Security Lending | 1,989 |
| Total Income | 286,116 |
| Expenses | |
| Investment Advisory Fees—Note B | 16,390 |
| The Vanguard Group—Note C | |
| Management and Administrative—Investor Shares | 7,764 |
| Management and Administrative—Admiral Shares | 8,823 |
| Marketing and Distribution—Investor Shares | 768 |
| Marketing and Distribution—Admiral Shares | 1,065 |
| Custodian Fees | 46 |
| Shareholders’ Reports—Investor Shares | 56 |
| Shareholders’ Reports—Admiral Shares | 14 |
| Trustees’ Fees and Expenses | 23 |
| Total Expenses | 34,949 |
| Net Investment Income | 251,167 |
| Realized Net Gain (Loss) | |
| Investment Securities Sold2 | 161,567 |
| Foreign Currencies and Forward Currency Contracts | 9,319 |
| Realized Net Gain (Loss) | 170,886 |
| Change in Unrealized Appreciation (Depreciation) | |
| Investment Securities | 926,260 |
| Foreign Currencies and Forward Currency Contracts | (4,628) |
| Change in Unrealized Appreciation (Depreciation) | 921,632 |
| Net Increase (Decrease) in Net Assets Resulting from Operations | 1,343,685 |
| 1 Dividends are net of foreign withholding taxes of $12,422,000. |
| 2 Dividend income and realized net gain (loss) from affiliated companies of the fund were $2,107,000 and ($3,586,000), respectively. |
See accompanying Notes, which are an integral part of the Financial Statements.
17
Health Care Fund
| | |
| Statement of Changes in Net Assets | | |
| |
| | Six Months Ended | Year Ended |
| | July 31, | January 31, |
| | 2012 | 2012 |
| | ($000) | ($000) |
| Increase (Decrease) in Net Assets | | |
| Operations | | |
| Net Investment Income | 251,167 | 364,494 |
| Realized Net Gain (Loss) | 170,886 | 709,376 |
| Change in Unrealized Appreciation (Depreciation) | 921,632 | 1,356,581 |
| Net Increase (Decrease) in Net Assets Resulting from Operations | 1,343,685 | 2,430,451 |
| Distributions | | |
| Net Investment Income | | |
| Investor Shares | (6,123) | (137,158) |
| Admiral Shares | (10,213) | (217,791) |
| Realized Capital Gain1 | | |
| Investor Shares | (3,443) | (320,941) |
| Admiral Shares | (5,337) | (484,740) |
| Total Distributions | (25,116) | (1,160,630) |
| Capital Share Transactions | | |
| Investor Shares | (210,523) | (517,566) |
| Admiral Shares | (100,650) | 772,975 |
| Net Increase (Decrease) from Capital Share Transactions | (311,173) | 255,409 |
| Total Increase (Decrease) | 1,007,396 | 1,525,230 |
| Net Assets | | |
| Beginning of Period | 21,430,466 | 19,905,236 |
| End of Period2 | 22,437,862 | 21,430,466 |
1 Includes fiscal 2013 and 2012 short-term gain distributions totaling $0 and $79,746,000, respectively. Short-term gain distributions are treated as ordinary income dividends for tax purposes.
2 Net Assets—End of Period includes undistributed (overdistributed) net investment income of $185,804,000 and ($49,588,000).
See accompanying Notes, which are an integral part of the Financial Statements.
18
Health Care Fund
Financial Highlights
| | | | | | |
| Investor Shares | | | | | | |
| Six Months | | | | | |
| | Ended | | | | | |
| For a Share Outstanding | July 31, | | | Year Ended January 31, |
| Throughout Each Period | 2012 | 2012 | 2011 | 2010 | 2009 | 2008 |
| Net Asset Value, Beginning of Period | $131.96 | $124.30 | $120.06 | $99.12 | $133.80 | $149.69 |
| Investment Operations | | | | | | |
| Net Investment Income | 1.541 | 2.300 | 2.046 | 1.902 | 1.998 | 2.7661 |
| Net Realized and Unrealized Gain (Loss) | | | | | | |
| on Investments | 6.769 | 12.780 | 7.404 | 21.530 | (25.229) | (5.317) |
| Total from Investment Operations | 8.310 | 15.080 | 9.450 | 23.432 | (23.231) | (2.551) |
| Distributions | | | | | | |
| Dividends from Net Investment Income | (.096) | (2.237) | (2.007) | (1.761) | (1.925) | (2.747) |
| Distributions from Realized Capital Gains | (.054) | (5.183) | (3.203) | (.731) | (9.524) | (10.592) |
| Total Distributions | (.150) | (7.420) | (5.210) | (2.492) | (11.449) | (13.339) |
| Net Asset Value, End of Period | $140.12 | $131.96 | $124.30 | $120.06 | $99.12 | $133.80 |
| |
| Total Return2 | 6.30% | 12.50% | 7.95% | 23.63% | -17.44% | -1.97% |
| |
| Ratios/Supplemental Data | | | �� | | | |
| Net Assets, End of Period (Millions) | $8,770 | $8,462 | $8,447 | $11,692 | $10,478 | $14,314 |
| Ratio of Total Expenses to | | | | | | |
| Average Net Assets | 0.35% | 0.35% | 0.35% | 0.36% | 0.29% | 0.26% |
| Ratio of Net Investment Income to | | | | | | |
| Average Net Assets | 2.26% | 1.72% | 1.67% | 1.73% | 1.64% | 1.78%1 |
| Portfolio Turnover Rate | 4% | 8% | 9% | 6% | 12% | 9% |
The expense ratio, net income ratio, and turnover rate for the current period have been annualized.
1 Net investment income per share and the ratio of net investment income to average net assets include $.585 and 0.40%, respectively, resulting from a special dividend from Health Management Associates Class A in March 2007.
2 Total returns do not include transaction or account service fees that may have applied in the periods shown. Fund prospectuses provide information about any applicable transaction and account service fees.
See accompanying Notes, which are an integral part of the Financial Statements.
19
Health Care Fund
Financial Highlights
| | | | | | |
| Admiral Shares | | | | | | |
| Six Months | | | | | |
| | Ended | | | | | |
| For a Share Outstanding | July 31, | | | Year Ended January 31, |
| Throughout Each Period | 2012 | 2012 | 2011 | 2010 | 2009 | 2008 |
| Net Asset Value, Beginning of Period | $55.68 | $52.45 | $50.67 | $41.83 | $56.47 | $63.19 |
| Investment Operations | | | | | | |
| Net Investment Income | .666 | 1.005 | .891 | .835 | .879 | 1.2201 |
| Net Realized and Unrealized Gain (Loss) | | | | | | |
| on Investments | 2.851 | 5.392 | 3.115 | 9.091 | (10.648) | (2.257) |
| Total from Investment Operations | 3.517 | 6.397 | 4.006 | 9.926 | (9.769) | (1.037) |
| Distributions | | | | | | |
| Dividends from Net Investment Income | (.044) | (.980) | (.874) | (.777) | (.852) | (1.212) |
| Distributions from Realized Capital Gains | (.023) | (2.187) | (1.352) | (.309) | (4.019) | (4.471) |
| Total Distributions | (.067) | (3.167) | (2.226) | (1.086) | (4.871) | (5.683) |
| Net Asset Value, End of Period | $59.13 | $55.68 | $52.45 | $50.67 | $41.83 | $56.47 |
| |
| Total Return2 | 6.32% | 12.57% | 7.99% | 23.72% | -17.38% | -1.90% |
| |
| Ratios/Supplemental Data | | | | | | |
| Net Assets, End of Period (Millions) | $13,668 | $12,968 | $11,459 | $8,619 | $7,576 | $10,513 |
| Ratio of Total Expenses to | | | | | | |
| Average Net Assets | 0.30% | 0.30% | 0.30% | 0.29% | 0.22% | 0.18% |
| Ratio of Net Investment Income to | | | | | | |
| Average Net Assets | 2.31% | 1.77% | 1.72% | 1.80% | 1.71% | 1.86%1 |
| Portfolio Turnover Rate | 4% | 8% | 9% | 6% | 12% | 9% |
The expense ratio, net income ratio, and turnover rate for the current period have been annualized.
1 Net investment income per share and the ratio of net investment income to average net assets include $.247 and 0.40%, respectively, resulting from a special dividend from Health Management Associates Class A in March 2007.
2 Total returns do not include transaction or account service fees that may have applied in the periods shown. Fund prospectuses provide information about any applicable transaction and account service fees.
See accompanying Notes, which are an integral part of the Financial Statements.
20
Health Care Fund
Notes to Financial Statements
Vanguard Health Care Fund is registered under the Investment Company Act of 1940 as an open-end investment company, or mutual fund. The fund invests in securities of foreign issuers, which may subject it to investment risks not normally associated with investing in securities of U.S. corporations. The fund offers two classes of shares: Investor Shares and Admiral Shares. Investor Shares are available to any investor who meets the fund’s minimum purchase requirements. Admiral Shares are designed for investors who meet certain administrative, service, and account-size criteria.
A. The following significant accounting policies conform to generally accepted accounting principles for U.S. mutual funds. The fund consistently follows such policies in preparing its financial statements.
1. Security Valuation: Securities are valued as of the close of trading on the New York Stock Exchange (generally 4 p.m., Eastern time) on the valuation date. Equity securities are valued at the latest quoted sales prices or official closing prices taken from the primary market in which each security trades; such securities not traded on the valuation date are valued at the mean of the latest quoted bid and asked prices. Securities for which market quotations are not readily available, or whose values have been affected by events occurring before the fund’s pricing time but after the close of the securities’ primary markets, are valued at their fair values calculated according to procedures adopted by the board of trustees. These procedures include obtaining quotations from an independent pricing service, monitoring news to identify significant market- or security-specific events, and evaluating changes in the values of foreign market proxies (for example, ADRs, futures contracts, or exchange-traded funds), between the time the foreign markets close and the fund’s pricing time. When fair-value pricing is employed, the prices of securities used by a fund to calculate its net asset value may differ from quoted or published prices for the same securities. Investments in Vanguard Market Liquidity Fund are valued at that fund’s net asset value. Temporary cash investments acquired over 60 days to maturity are valued using the latest bid prices or using valuations based on a matrix system (which considers such factors as security prices, yields, maturities, and ratings), both as furnished by independent pricing services. Other temporary cash investments are valued at amortized cost, which approximates market value.
2. Foreign Currency: Securities and other assets and liabilities denominated in foreign currencies are translated into U.S. dollars using exchange rates obtained from an independent third party as of the fund’s pricing time on the valuation date. Realized gains (losses) and unrealized appreciation (depreciation) on investment securities include the effects of changes in exchange rates since the securities were purchased, combined with the effects of changes in security prices. Fluctuations in the value of other assets and liabilities resulting from changes in exchange rates are recorded as unrealized foreign currency gains (losses) until the assets or liabilities are settled in cash, at which time they are recorded as realized foreign currency gains (losses).
3. Forward Currency Contracts: The fund enters into forward currency contracts to protect the value of securities and related receivables and payables against changes in future foreign exchange rates. The fund’s risks in using these contracts include movement in the values of the foreign currencies relative to the U.S. dollar and the ability of the counterparties to fulfill their obligations under the contracts. Counterparty risk is mitigated by entering into forward currency contracts only with highly rated counterparties, by a master netting arrangement between the fund and the counterparty, and by the
21
Health Care Fund
posting of collateral by the counterparty. The forward currency contracts contain provisions whereby a counterparty may terminate open contracts if the fund’s net assets decline below a certain level, triggering a payment by the fund if the fund is in a net liability position at the time of the termination. The payment amount would be reduced by any collateral the fund has posted. Any securities posted as collateral for open contracts are noted in the Statement of Net Assets.
Forward currency contracts are valued at their quoted daily prices obtained from an independent third party, adjusted for currency risk based on the expiration date of each contract. The aggregate principal amounts of the contracts are not recorded in the Statement of Net Assets. Fluctuations in the value of the contracts are recorded in the Statement of Net Assets as an asset (liability) and in the Statement of Operations as unrealized appreciation (depreciation) until the contracts are closed, when they are recorded as realized forward currency contract gains (losses).
4. Repurchase Agreements: The fund may enter into repurchase agreements. Securities pledged as collateral for repurchase agreements are held by a custodian bank until the agreements mature. Each agreement requires that the market value of the collateral be sufficient to cover payments of interest and principal. In the event of default or bankruptcy by the other party to the agreement, the fund may sell or retain the collateral; however, such action may be subject to legal proceedings.
5. Federal Income Taxes: The fund intends to continue to qualify as a regulated investment company and distribute all of its taxable income. Management has analyzed the fund’s tax positions taken for all open federal income tax years (January 31, 2009–2012), and for the period ended July 31, 2012, and has concluded that no provision for federal income tax is required in the fund’s financial statements.
6. Distributions: Distributions to shareholders are recorded on the ex-dividend date.
7. Security Lending: The fund may lend its securities to qualified institutional borrowers to earn additional income. Security loans are required to be secured at all times by collateral at least equal to the market value of securities loaned. The fund invests cash collateral received in Vanguard Market Liquidity Fund, and records a liability for the return of the collateral, during the period the securities are on loan. Security lending income represents fees charged to borrowers plus income earned on investing cash collateral, less expenses associated with the loan.
8. Other: Dividend income is recorded on the ex-dividend date. Interest income is accrued daily. Premiums and discounts on debt securities purchased are amortized and accreted, respectively, to interest income over the lives of the respective securities. Security transactions are accounted for on the date securities are bought or sold. Costs used to determine realized gains (losses) on the sale of investment securities are those of the specific securities sold. Fees assessed on redemptions of capital shares are credited to paid-in capital.
Each class of shares has equal rights as to assets and earnings, except that each class separately bears certain class-specific expenses related to maintenance of shareholder accounts (included in Management and Administrative expenses) and shareholder reporting. Marketing and distribution expenses are allocated to each class of shares based on a method approved by the board of trustees. Income, other non-class-specific expenses, and gains and losses on investments are allocated to each class of shares based on its relative net assets.
22
Health Care Fund
B. Wellington Management Company, LLP, provides investment advisory services to the fund for a fee calculated at an annual percentage rate of average net assets. For the six months ended July 31, 2012, the investment advisory fee represented an effective annual rate of 0.15% of the fund’s average net assets.
C. The Vanguard Group furnishes at cost corporate management, administrative, marketing, and distribution services. The costs of such services are allocated to the fund under methods approved by the board of trustees. The fund has committed to provide up to 0.40% of its net assets in capital contributions to Vanguard. At July 31, 2012, the fund had contributed capital of $3,313,000 to Vanguard (included in Other Assets), representing 0.01% of the fund’s net assets and 1.33% of Vanguard’s capitalization. The fund’s trustees and officers are also directors and officers of Vanguard.
D. Various inputs may be used to determine the value of the fund’s investments. These inputs are summarized in three broad levels for financial statement purposes. The inputs or methodologies used to value securities are not necessarily an indication of the risk associated with investing in those securities.
Level 1—Quoted prices in active markets for identical securities.
Level 2—Other significant observable inputs (including quoted prices for similar securities, interest rates, prepayment speeds, credit risk, etc.).
Level 3—Significant unobservable inputs (including the fund’s own assumptions used to determine the fair value of investments).
The following table summarizes the market value of the fund’s investments as of July 31, 2012, based on the inputs used to value them:
| | | |
| | Level 1 | Level 2 | Level 3 |
| Investments | ($000) | ($000) | ($000) |
| Common Stocks—U.S. | 16,156,420 | — | — |
| Common Stocks—International | 615,093 | 4,338,545 | — |
| Temporary Cash Investments | 4,940 | 1,357,136 | — |
| Forward Currency Contracts—Liabilities | — | (5,365) | — |
| Total | 16,776,453 | 5,690,316 | — |
At July 31, 2012, the fund had open forward currency contracts to receive and deliver currencies as follows. Unrealized appreciation (depreciation) on open forward currency contracts is treated as realized gain (loss) for tax purposes.
| | | | | |
| | | | | | Unrealized |
| | Contract | | | | Appreciation |
| | Settlement | Contract Amount (000) | (Depreciation) |
| Counterparty | Date | | Receive | Deliver | ($000) |
| Bank of America NA | 8/23/12 | USD | 244,120 | JPY 19,062,436 | (5,365) |
| JPY—Japanese yen. |
| USD—U.S. dollar. |
23
Health Care Fund
E. Distributions are determined on a tax basis and may differ from net investment income and realized capital gains for financial reporting purposes. Differences may be permanent or temporary. Permanent differences are reclassified among capital accounts in the financial statements to reflect their tax character. Temporary differences arise when certain items of income, expense, gain, or loss are recognized in different periods for financial statement and tax purposes; these differences will reverse at some time in the future. Differences in classification may also result from the treatment of short-term gains as ordinary income for tax purposes. The fund’s tax-basis capital gains and losses are determined only at the end of each fiscal year.
During the six months ended July 31, 2012, the fund realized net foreign currency gains of $561,000, which increased distributable net income for tax purposes; accordingly, such gains have been reclassified from accumulated net realized gains to undistributed net investment income. Certain of the fund’s investments are in securities considered to be “passive foreign investment companies,” for which any unrealized appreciation and/or realized gains are required to be included in distributable net income for tax purposes. Passive foreign investment companies held at July 31, 2012, had unrealized appreciation of $23,466,000, as of January 31, 2012, the most recent mark-to-market date for tax purposes. This amount has been distributed and is reflected in the balance of undistributed net investment income.
At July 31, 2012, the cost of investment securities for tax purposes was $14,277,410,000. Net unrealized appreciation of investment securities for tax purposes was $8,194,724,000, consisting of unrealized gains of $8,715,054,000 on securities that had risen in value since their purchase and $520,330,000 in unrealized losses on securities that had fallen in value since their purchase.
F. During the six months ended July 31, 2012, the fund purchased $507,856,000 of investment securities and sold $461,767,000 of investment securities, other than temporary cash investments.
G. Capital share transactions for each class of shares were:
| | | | |
| | Six Months Ended | | Year Ended |
| | | July 31, 2012 | January 31, 2012 |
| | Amount | Shares | Amount | Shares |
| | $000) | (000) | ($000) | (000) |
| Investor Shares | | | | |
| Issued | 331,415 | 2,428 | 721,109 | 5,453 |
| Issued in Lieu of Cash Distributions | 9,097 | 67 | 436,880 | 3,494 |
| Redeemed1 | (551,035) | (4,035) | (1,675,555) | (12,775) |
| Net Increase (Decrease)—Investor Shares | (210,523) | (1,540) | (517,566) | (3,828) |
| Admiral Shares | | | | |
| Issued | 336,906 | 5,827 | 1,204,865 | 21,697 |
| Issued in Lieu of Cash Distributions | 14,160 | 247 | 640,586 | 12,144 |
| Redeemed1 | (451,716) | (7,854) | (1,072,476) | (19,374) |
| Net Increase (Decrease)—Admiral Shares | (100,650) | (1,780) | 772,975 | 14,467 |
1 Net of redemption fees for fiscal 2013 and 2012 of $378,000 and $1,116,000, respectively (fund totals). Effective May 23, 2012, the redemption fee was eliminated.
24
Health Care Fund
H. Certain of the fund’s investments are in companies that are considered to be affiliated companies of the fund because the fund owns more than 5% of the outstanding voting securities of the company. Transactions during the period in securities of these companies were as follows:
| | | | | |
| | | | Current Period Transactions | |
| | Jan. 31, 2012 | | Proceeds from | | July 31, 2012 |
| | Market | Purchases | Securities | Dividend | Market |
| | Value | at Cost | Sold | Income | Value |
| | ($000) | ($000) | ($000) | ($000) | ($000) |
| Coventry Health Care Inc. | 256,422 | 3,041 | 6,651 | 2,107 | 280,888 |
| Forest Laboratories Inc. | 823,198 | — | — | — | 869,045 |
| Health Management Associates Inc. | | | | |
| Class A | 99,720 | 665 | — | — | 103,022 |
| Health Net Inc. | 174,112 | 4,460 | 37,048 | — | NA1 |
| | 1,353,452 | | | 2,107 | 1,252,955 |
| 1 Not applicable—At July 31, 2012, the security was still held, but the issuer was no longer an affiliated company of the fund. |
I. In preparing the financial statements as of July 31, 2012, management considered the impact of subsequent events for potential recognition or disclosure in these financial statements.
25
About Your Fund’s Expenses
As a shareholder of the fund, you incur ongoing costs, which include costs for portfolio management, administrative services, and shareholder reports (like this one), among others. Operating expenses, which are deducted from a fund’s gross income, directly reduce the investment return of the fund.
A fund’s expenses are expressed as a percentage of its average net assets. This figure is known as the expense ratio. The following examples are intended to help you understand the ongoing costs (in dollars) of investing in your fund and to compare these costs with those of other mutual funds. The examples are based on an investment of $1,000 made at the beginning of the period shown and held for the entire period.
The accompanying table illustrates your fund’s costs in two ways:
• Based on actual fund return. This section helps you to estimate the actual expenses that you paid over the period. The ”Ending Account Value“ shown is derived from the fund‘s actual return, and the third column shows the dollar amount that would have been paid by an investor who started with $1,000 in the fund. You may use the information here, together with the amount you invested, to estimate the expenses that you paid over the period.
To do so, simply divide your account value by $1,000 (for example, an $8,600 account value divided by $1,000 = 8.6), then multiply the result by the number given for your fund under the heading ”Expenses Paid During Period.“
• Based on hypothetical 5% yearly return. This section is intended to help you compare your fund‘s costs with those of other mutual funds. It assumes that the fund had a yearly return of 5% before expenses, but that the expense ratio is unchanged. In this case—because the return used is not the fund’s actual return—the results do not apply to your investment. The example is useful in making comparisons because the Securities and Exchange Commission requires all mutual funds to calculate expenses based on a 5% return. You can assess your fund’s costs by comparing this hypothetical example with the hypothetical examples that appear in shareholder reports of other funds.
Note that the expenses shown in the table are meant to highlight and help you compare ongoing costs only and do not reflect transaction costs incurred by the fund for buying and selling securities. Further, the expenses do not include any purchase, redemption, or account service fees described in the fund prospectus. If such fees were applied to your account, your costs would be higher. Your fund does not carry a “sales load.”
The calculations assume no shares were bought or sold during the period. Your actual costs may have been higher or lower, depending on the amount of your investment and the timing of any purchases or redemptions.
You can find more information about the fund’s expenses, including annual expense ratios, in the Financial Statements section of this report. For additional information on operating expenses and other shareholder costs, please refer to your fund’s current prospectus.
26
| | | |
| Six Months Ended July 31, 2012 | | | |
| | Beginning | Ending | Expenses |
| | Account Value | Account Value | Paid During |
| Health Care Fund | 1/31/2012 | 7/31/2012 | Period |
| Based on Actual Fund Return | | | |
| Investor Shares | $1,000.00 | $1,063.01 | $1.80 |
| Admiral Shares | 1,000.00 | 1,063.20 | 1.54 |
| Based on Hypothetical 5% Yearly Return | | | |
| Investor Shares | $1,000.00 | $1,023.12 | $1.76 |
| Admiral Shares | 1,000.00 | 1,023.37 | 1.51 |
The calculations are based on expenses incurred in the most recent six-month period. The fund’s annualized six-month expense ratios for that period are 0.35% for Investor Shares and 0.30% for Admiral Shares. The dollar amounts shown as “Expenses Paid” are equal to the annualized expense ratio multiplied by the average account value over the period, multiplied by the number of days in the most recent six-month period, then divided by the number of days in the most recent 12-month period.
27
Trustees Approve Advisory Agreement
The board of trustees of Vanguard Health Care Fund has renewed the fund’s investment advisory agreement with Wellington Management Company, LLP. The board determined that the retention of the advisor was in the best interests of the fund and its shareholders.
The board based its decision upon an evaluation of the advisor’s investment staff, portfolio management process, and performance. The trustees considered the factors discussed below, among others. However, no single factor determined whether the board approved the agreement. Rather, it was the totality of the circumstances that drove the board’s decision.
Nature, extent, and quality of services
The board considered the quality of the fund’s investment management over both the short and long term, and the organizational depth and stability of the advisory firm. The board noted that Wellington Management, founded in 1928, is among the nation’s oldest and most respected institutional investment managers. Edward P. Owens has managed the Health Care Fund since its inception in 1984, and Jean M. Hynes has co-managed the fund since 2008. The managers are aided by a team of three experienced health care analysts. This health care team uses intensive fundamental analysis to identify companies with high-quality balance sheets, strong management, and the potential for new products that lead to above-average growth in revenue and earnings. The advisor invests in stocks broadly representing the health care industry, seeking to maintain exposure across five primary subsectors: health services, medical products, specialty pharmaceuticals, major pharmaceuticals, and international markets.
The board concluded that the advisor’s experience, stability, depth, and performance, among other factors, warranted continuation of the advisory agreement.
Investment performance
The board considered the short- and long-term performance of the fund, including any periods of outperformance or underperformance of a relevant benchmark and peer group. The board concluded that the advisor has carried out the fund’s investment strategy in disciplined fashion, and noted that the fund has outperformed its benchmark and peer group over the short and long term. Information about the fund’s most recent performance can be found in the Performance Summary section of this report.
Cost
The board concluded that the fund’s expense ratio was well below the average expense ratio charged by funds in its peer group and that the fund’s advisory fee rate was also well below its peer-group average. Information about the fund’s expenses appears in the About Your Fund’s Expenses section of this report as well as in the Financial Statements section, which also includes information about the advisory fee rate.
The board did not consider profitability of Wellington Management in determining whether to approve the advisory fee, because Wellington Management is independent of Vanguard, and the advisory fee is the result of arm’s-length negotiations.
The benefit of economies of scale
The board concluded that the fund’s shareholders benefit from economies of scale because of breakpoints in the fund’s advisory fee schedule. The breakpoints reduce the effective rate of the fee as the fund’s assets increase.
The board will consider whether to renew the advisory agreement again after a one-year period.
28
Glossary
30-Day SEC Yield. A fund’s 30-day SEC yield is derived using a formula specified by the U.S. Securities and Exchange Commission. Under the formula, data related to the fund’s security holdings in the previous 30 days are used to calculate the fund’s hypothetical net income for that period, which is then annualized and divided by the fund’s estimated average net assets over the calculation period. For the purposes of this calculation, a security’s income is based on its current market yield to maturity (for bonds), its actual income (for asset-backed securities), or its projected dividend yield (for stocks). Because the SEC yield represents hypothetical annualized income, it will differ—at times significantly—from the fund’s actual experience. As a result, the fund’s income distributions may be higher or lower than implied by the SEC yield.
Beta. A measure of the magnitude of a fund’s past share-price fluctuations in relation to the ups and downs of a given market index. The index is assigned a beta of 1.00. Compared with a given index, a fund with a beta of 1.20 typically would have seen its share price rise or fall by 12% when the index rose or fell by 10%. For this report, beta is based on returns over the past 36 months for both the fund and the index. Note that a fund’s beta should be reviewed in conjunction with its R-squared (see definition). The lower the R-squared, the less correlation there is between the fund and the index, and the less reliable beta is as an indicator of volatility.
Dividend Yield. Dividend income earned by stocks, expressed as a percentage of the aggregate market value (or of net asset value, for a fund). The yield is determined by dividing the amount of the annual dividends by the aggregate value (or net asset value) at the end of the period. For a fund, the dividend yield is based solely on stock holdings and does not include any income produced by other investments.
Earnings Growth Rate. The average annual rate of growth in earnings over the past five years for the stocks now in a fund.
Equity Exposure. A measure that reflects a fund’s investments in stocks and stock futures. Any holdings in short-term reserves are excluded.
Expense Ratio. A fund’s total annual operating expenses expressed as a percentage of the fund’s average net assets. The expense ratio includes management and administrative expenses, but does not include the transaction costs of buying and selling portfolio securities.
Foreign Holdings. The percentage of a fund represented by securities or depositary receipts of companies based outside the United States.
Inception Date. The date on which the assets of a fund (or one of its share classes) are first invested in accordance with the fund’s investment objective. For funds with a subscription period, the inception date is the day after that period ends. Investment performance is measured from the inception date.
Median Market Cap. An indicator of the size of companies in which a fund invests; the midpoint of market capitalization (market price x shares outstanding) of a fund’s stocks, weighted by the proportion of the fund’s assets invested in each stock. Stocks representing half of the fund’s assets have market capitalizations above the median, and the rest are below it.
Price/Book Ratio. The share price of a stock divided by its net worth, or book value, per share. For a fund, the weighted average price/book ratio of the stocks it holds.
29
Price/Earnings Ratio. The ratio of a stock’s current price to its per-share earnings over the past year. For a fund, the weighted average P/E of the stocks it holds. P/E is an indicator of market expectations about corporate prospects; the higher the P/E, the greater the expectations for a company’s future growth.
R-Squared. A measure of how much of a fund’s past returns can be explained by the returns from the market in general, as measured by a given index. If a fund’s total returns were precisely synchronized with an index’s returns, its R-squared would be 1.00. If the fund’s returns bore no relationship to the index’s returns, its R-squared would be 0. For this report, R-squared is based on returns over the past 36 months for both the fund and the index.
Return on Equity. The annual average rate of return generated by a company during the past five years for each dollar of shareholder’s equity (net income divided by shareholder’s equity). For a fund, the weighted average return on equity for the companies whose stocks it holds.
Short-Term Reserves. The percentage of a fund invested in highly liquid, short-term securities that can be readily converted to cash.
Turnover Rate. An indication of the fund’s trading activity. Funds with high turnover rates incur higher transaction costs and may be more likely to distribute capital gains (which may be taxable to investors). The turnover rate excludes in-kind transactions, which have minimal impact on costs.
30
This page intentionally left blank.
The People Who Govern Your Fund
The trustees of your mutual fund are there to see that the fund is operated and managed in your best interests since, as a shareholder, you are a part owner of the fund. Your fund’s trustees also serve on the board of directors of The Vanguard Group, Inc., which is owned by the Vanguard funds and provides services to them on an at-cost basis.
A majority of Vanguard’s board members are independent, meaning that they have no affiliation with Vanguard or the funds they oversee, apart from the sizable personal investments they have made as private individuals. The independent board members have distinguished backgrounds in business, academia, and public service. Each of the trustees and executive officers oversees 179 Vanguard funds.
The following table provides information for each trustee and executive officer of the fund. More information about the trustees is in the Statement of Additional Information, which can be obtained, without charge, by contacting Vanguard at 800-662-7447, or online at vanguard.com.
| |
| InterestedTrustee1 | and Delphi Automotive LLP (automotive components); |
| | Senior Advisor at New Mountain Capital; Trustee of |
| F. William McNabb III | The Conference Board. |
| Born 1957. Trustee Since July 2009. Chairman of the | |
| Board. Principal Occupation(s) During the Past Five | Amy Gutmann |
| Years: Chairman of the Board of The Vanguard Group, | Born 1949. Trustee Since June 2006. Principal |
| Inc., and of each of the investment companies served | Occupation(s) During the Past Five Years: President |
| by The Vanguard Group, since January 2010; Director | of the University of Pennsylvania; Christopher H. |
| of The Vanguard Group since 2008; Chief Executive | Browne Distinguished Professor of Political Science |
| Officer and President of The Vanguard Group and of | in the School of Arts and Sciences with secondary |
| each of the investment companies served by The | appointments at the Annenberg School for |
| Vanguard Group since 2008; Director of Vanguard | Communication and the Graduate School of Education |
| Marketing Corporation; Managing Director of The | of the University of Pennsylvania; Member of the |
| Vanguard Group (1995–2008). | National Commission on the Humanities and Social |
| Sciences; Trustee of Carnegie Corporation of New |
| York and of the National Constitution Center; Chair |
| of the U. S. Presidential Commission for the Study |
| IndependentTrustees | of Bioethical Issues. |
| |
| Emerson U. Fullwood | |
| Born 1948. Trustee Since January 2008. Principal | JoAnn Heffernan Heisen |
| Occupation(s) During the Past Five Years: Executive | Born 1950. Trustee Since July 1998. Principal |
| Chief Staff and Marketing Officer for North America | Occupation(s) During the Past Five Years: Corporate |
| and Corporate Vice President (retired 2008) of Xerox | Vice President and Chief Global Diversity Officer |
| Corporation (document management products and | (retired 2008) and Member of the Executive |
| services); Executive in Residence and 2010 | Committee (1997–2008) of Johnson & Johnson |
| Distinguished Minett Professor at the Rochester | (pharmaceuticals/medical devices/consumer |
| Institute of Technology; Director of SPX Corporation | products); Director of Skytop Lodge Corporation |
| (multi-industry manufacturing), the United Way of | (hotels), the University Medical Center at Princeton, |
| Rochester, Amerigroup Corporation (managed health | the Robert Wood Johnson Foundation, and the Center |
| care), the University of Rochester Medical Center, | for Talent Innovation; Member of the Advisory Board |
| Monroe Community College Foundation, and North | of the Maxwell School of Citizenship and Public Affairs |
| Carolina A&T University. | at Syracuse University. |
| | |
| |
| Rajiv L. Gupta | F. Joseph Loughrey |
| Born 1945. Trustee Since December 2001.2 | Born 1949. Trustee Since October 2009. Principal |
| Principal Occupation(s) During the Past Five Years: | Occupation(s) During the Past Five Years: President |
| Chairman and Chief Executive Officer (retired 2009) | and Chief Operating Officer (retired 2009) of Cummins |
| and President (2006–2008) of Rohm and Haas Co. | Inc. (industrial machinery); Director of SKF AB |
| (chemicals); Director of Tyco International, Ltd. | (industrial machinery), Hillenbrand, Inc. (specialized |
| (diversified manufacturing and services), Hewlett- | consumer services), the Lumina Foundation for |
| Packard Co. (electronic computer manufacturing), | |
| | |
| Education, and Oxfam America; Chairman of the | Executive Officers | |
| Advisory Council for the College of Arts and Letters | | |
| and Member of the Advisory Board to the Kellogg | Glenn Booraem | |
| Institute for International Studies at the University | Born 1967. Controller Since July 2010. Principal |
| of Notre Dame. | Occupation(s) During the Past Five Years: Principal |
| | of The Vanguard Group, Inc.; Controller of each of |
| Mark Loughridge | the investment companies served by The Vanguard |
| Born 1953. Trustee Since March 2012. Principal | Group; Assistant Controller of each of the investment |
| Occupation(s) During the Past Five Years: Senior Vice | companies served by The Vanguard Group (2001–2010). |
| President and Chief Financial Officer at IBM (information | | |
| technology services); Fiduciary Member of IBM’s | Thomas J. Higgins | |
| Retirement Plan Committee. | Born 1957. Chief Financial Officer Since September |
| | 2008. Principal Occupation(s) During the Past Five |
| Scott C. Malpass | Years: Principal of The Vanguard Group, Inc.; Chief |
| Born 1962. Trustee Since March 2012. Principal | Financial Officer of each of the investment companies |
| Occupation(s) During the Past Five Years: Chief | served by The Vanguard Group; Treasurer of each of |
| Investment Officer and Vice President at the University | the investment companies served by The Vanguard |
| of Notre Dame; Assistant Professor of Finance at the | Group (1998–2008). | |
| Mendoza College of Business at Notre Dame; Member | | |
| of the Notre Dame 403(b) Investment Committee; | Kathryn J. Hyatt | |
| Director of TIFF Advisory Services, Inc. (investment | Born 1955. Treasurer Since November 2008. Principal |
| advisor); Member of the Investment Advisory | Occupation(s) During the Past Five Years: Principal of |
| Committees of the Financial Industry Regulatory | The Vanguard Group, Inc.; Treasurer of each of the |
| Authority (FINRA) and of Major League Baseball. | investment companies served by The Vanguard |
| | Group; Assistant Treasurer of each of the investment |
| André F. Perold | companies served by The Vanguard Group (1988–2008). |
| Born 1952. Trustee Since December 2004. Principal | | |
| Occupation(s) During the Past Five Years: George | Heidi Stam | |
| Gund Professor of Finance and Banking at the Harvard | Born 1956. Secretary Since July 2005. Principal |
| Business School (retired 2011); Chief Investment | Occupation(s) During the Past Five Years: Managing |
| Officer and Managing Partner of HighVista Strategies | Director of The Vanguard Group, Inc.; General Counsel |
| LLC (private investment firm); Director of Rand | of The Vanguard Group; Secretary of The Vanguard |
| Merchant Bank; Overseer of the Museum of Fine | Group and of each of the investment companies |
| Arts Boston. | served by The Vanguard Group; Director and Senior |
| | Vice President of Vanguard Marketing Corporation. |
| Alfred M. Rankin, Jr. | | |
| Born 1941. Trustee Since January 1993. Principal | Vanguard Senior ManagementTeam |
| Occupation(s) During the Past Five Years: Chairman, | | |
| President, and Chief Executive Officer of NACCO | Mortimer J. Buckley | Michael S. Miller |
| Industries, Inc. (forklift trucks/housewares/lignite); | Kathleen C. Gubanich | James M. Norris |
| Director of Goodrich Corporation (industrial products/ | Paul A. Heller | Glenn W. Reed |
| aircraft systems and services) and the National | Martha G. King | George U. Sauter |
| Association of Manufacturers; Chairman of the Board | Chris D. McIsaac | |
| of the Federal Reserve Bank of Cleveland and of | | |
| University Hospitals of Cleveland; Advisory Chairman | | |
| of the Board of The Cleveland Museum of Art. | Chairman Emeritus and Senior Advisor |
| | |
| Peter F. Volanakis | John J. Brennan | |
| Born 1955. Trustee Since July 2009. Principal | Chairman, 1996–2009 | |
| Occupation(s) During the Past Five Years: President | Chief Executive Officer and President, 1996–2008 |
| and Chief Operating Officer (retired 2010) of Corning | | |
| Incorporated (communications equipment); Director | Founder | |
| of SPX Corporation (multi-industry manufacturing); | John C. Bogle | |
| Overseer of the Amos Tuck School of Business | Chairman and Chief Executive Officer, 1974–1996 |
| Administration at Dartmouth College; Advisor to the | | |
| Norris Cotton Cancer Center. | | |
1 Mr. McNabb is considered an “interested person,” as defined in the Investment Company Act of 1940, because he is an officer of the Vanguard funds.
2 December 2002 for Vanguard Equity Income Fund, Vanguard Growth Equity Fund, the Vanguard Municipal Bond Funds, and the Vanguard State Tax-Exempt Funds.
|  |
| P.O. Box 2600 |
| Valley Forge, PA 19482-2600 |
Connect with Vanguard® > vanguard.com
| |
| Fund Information > 800-662-7447 | CFA® is a trademark owned by CFA Institute. |
| Direct Investor Account Services > 800-662-2739 | |
| Institutional Investor Services > 800-523-1036 | |
| Text Telephone for People | |
| With Hearing Impairment > 800-749-7273 | |
| |
| This material may be used in conjunction | |
| with the offering of shares of any Vanguard | |
| fund only if preceded or accompanied by | |
| the fund’s current prospectus. | |
| |
| All comparative mutual fund data are from Lipper Inc. or | |
| Morningstar, Inc., unless otherwise noted. | |
| |
| You can obtain a free copy of Vanguard’s proxy voting | |
| guidelines by visiting vanguard.com/proxyreporting or by | |
| calling Vanguard at 800-662-2739. The guidelines are | |
| also available from the SEC’s website, sec.gov. In | |
| addition, you may obtain a free report on how your fund | |
| voted the proxies for securities it owned during the 12 | |
| months ended June 30. To get the report, visit either | |
| vanguard.com/proxyreporting or sec.gov. | |
| |
| You can review and copy information about your fund at | |
| the SEC’s Public Reference Room in Washington, D.C. To | |
| find out more about this public service, call the SEC at | |
| 202-551-8090. Information about your fund is also | |
| available on the SEC’s website, and you can receive | |
| copies of this information, for a fee, by sending a | |
| request in either of two ways: via e-mail addressed to | |
| publicinfo@sec.gov or via regular mail addressed to the | |
| Public Reference Section, Securities and Exchange | |
| Commission, Washington, DC 20549-1520. | |
| | © 2012 The Vanguard Group, Inc. |
| | All rights reserved. |
| | Vanguard Marketing Corporation, Distributor. |
| |
| | Q522 092012 |
 |
| |
| Semiannual Report | July 31, 2012 |
| Vanguard REIT Index Fund |
> For the six months ended July 31, 2012, Vanguard REIT Index Fund returned about 10%.
> The fund closely tracked its target index, the MSCI US REIT Index, and slightly outpaced the average return of its peers.
> REITs continued to perform well, outdistancing the broad stock market for the period.
| |
| Contents | |
| Your Fund’s Total Returns. | 1 |
| Chairman’s Letter. | 2 |
| Fund Profile. | 6 |
| Performance Summary. | 7 |
| Financial Statements. | 8 |
| About Your Fund’s Expenses. | 26 |
| Trustees Approve Advisory Arrangement. | 28 |
| Glossary. | 29 |
REIT Index Fund
Please note: The opinions expressed in this report are just that—informed opinions. They should not be considered promises or advice. Also, please keep in mind that the information and opinions cover the period through the date on the front of this report. Of course, the risks of investing in your fund are spelled out in the prospectus.
See the Glossary for definitions of investment terms used in this report.
About the cover: Vanguard was named for the HMS Vanguard, flagship of British Admiral Horatio Nelson. A ship—whose performance and safety depend on the work of all hands—has served as a fitting metaphor for the Vanguard crew as we strive to help clients reach their financial goals.
Your Fund’s Total Returns
| |
| Six Months Ended July 31, 2012 | |
| | Total |
| | Returns |
| Vanguard REIT Index Fund | |
| Investor Shares | 9.88% |
| Admiral™ Shares | 9.98 |
| Signal® Shares | 9.99 |
| Institutional Shares | 9.97 |
| ETF Shares | |
| Market Price | 9.99 |
| Net Asset Value | 9.98 |
| MSCI US REIT Index | 10.02 |
| Real Estate Funds Average | 9.42 |
| Real Estate Funds Average: Derived from data provided by Lipper Inc. | |
Admiral Shares carry lower expenses and are available to investors who meet certain account-balance requirements. Signal Shares and Institutional Shares are available to certain institutional investors who meet specific administrative, service, and account-size criteria. The Vanguard ETF® Shares shown are traded on the NYSE Arca exchange and are available only through brokers. The table provides ETF returns based on both the NYSE Arca market price and the net asset value for a share. U.S. Pat. No. 6,879,964 B2; 7,337,138; 7,720,749; 7,925,573; 8,090,646.
For the ETF Shares, the market price is determined by the midpoint of the bid-offer spread as of the closing time of the New York Stock Exchange (generally 4 p.m., Eastern time). The net asset value is also determined as of the NYSE closing time. For more information about how the ETF Shares' market prices have compared with their net asset value, visit vanguard.com, select your ETF, and then select the Price and Performance tab. The ETF premium/discount analysis there shows the percentages of days on which the ETF Shares' market price was above or below the NAV.
| | | | | |
| Your Fund’s Performance at a Glance | | | | | |
| January 31, 2012, Through July 31, 2012 | | | | | |
| | | | Distributions Per Share | |
| | Starting | Ending | Income | Capital | Return of |
| | Share Price | Share Price | Dividends | Gains | Capital |
| Vanguard REIT Index Fund | | | | | |
| Investor Shares | $20.50 | $22.18 | $0.324 | $0.000 | $0.000 |
| Admiral Shares | 87.47 | 94.65 | 1.445 | 0.000 | 0.000 |
| Signal Shares | 23.35 | 25.27 | 0.385 | 0.000 | 0.000 |
| Institutional Shares | 13.54 | 14.65 | 0.225 | 0.000 | 0.000 |
| ETF Shares | 61.72 | 66.79 | 1.021 | 0.000 | 0.000 |
1

Chairman’s Letter
Dear Shareholder,
For the six months ended July 31, 2012, Vanguard REIT Index Fund returned about 10%. The fund’s performance was in line with that of its benchmark, the MSCI US REIT Index, and slightly ahead of the average return of competitive real estate funds.
REITs have performed well over the past several years, and that trend continued. All six subsectors of the real estate market posted gains, with retail REITs making the largest contribution to performance.
Please note that Vanguard has eliminated the redemption fee for your fund, effective May 23. The fund’s trustees determined that the fee, one of several measures in place to protect the interests of long-term investors and discourage frequent trading, was no longer needed.
U.S. stocks delivered solid gains; international equities slumped
U.S. stocks outperformed their international counterparts handily, returning about 5% for the six months ended July 31. Stocks of large companies fared best as investors seemed to be seeking stability amid the uncertainty surrounding Europe’s debt troubles.
International stocks were generally weak, with currency effects further hindering results for U.S.-based investors. Though European stocks posted a modest advance
2
in local-currency terms, their return was negative once converted into U.S. dollars—a result of the dollar’s strengthening against the euro during the six months. Signs of slowing economic growth hurt returns for emerging markets and the developed markets of the Pacific region.
Questions about the finances of European governments and banks continued to preoccupy investors, and global stock markets moved sharply up and down in response to the latest headlines. Although the situation in Europe is very fluid, Vanguard economists believe the most likely scenario is that the Eurozone will “muddle through” for several years, with occasional spikes in market volatility, as fiscal tightening continues in the face of weak economic growth.
Bonds kept up a steady advance as Treasury yields kept dwindling
U.S. Treasury securities stretched their gains during the period, as investors lost more of their appetite for risk. Bond prices moved higher, and the yield of the 10-year U.S. Treasury note fell to a record low in July, closing below 1.5%. (Bond yields and prices move in opposite directions.) The broad U.S. taxable bond market posted a return of nearly 3%, and municipal bonds had about the same result for the six months.
Investors have enjoyed several years of strong bond returns, but they shouldn’t be surprised if future results are weaker. As yields tumble, the scope for further declines—and price increases—diminishes.
| | | |
| Market Barometer | | | |
| |
| | | | Total Returns |
| | | Periods Ended July 31, 2012 |
| | Six | One | Five Years |
| | Months | Year | (Annualized) |
| Stocks | | | |
| Russell 1000 Index (Large-caps) | 5.54% | 7.96% | 1.26% |
| Russell 2000 Index (Small-caps) | -0.03 | 0.19 | 1.69 |
| Dow Jones U.S. Total Stock Market Index | 5.01 | 7.07 | 1.50 |
| MSCI All Country World Index ex USA (International) | -2.40 | -12.16 | -4.29 |
| |
| Bonds | | | |
| Barclays U.S. Aggregate Bond Index (Broad taxable | | | |
| market) | 2.88% | 7.25% | 6.91% |
| Barclays Municipal Bond Index (Broad tax-exempt | | | |
| market) | 2.93 | 10.51 | 6.12 |
| Citigroup Three-Month U.S. Treasury Bill Index | 0.04 | 0.05 | 0.79 |
| |
| CPI | | | |
| Consumer Price Index | 1.08% | 1.41% | 1.92% |
3
As it has since December 2008, the Federal Reserve Board held its target for the shortest-term interest rates between 0% and 0.25%, keeping a tight lid on the returns from money market funds and savings accounts.
REITs continued to benefit from strong fundamentals
Positive industry fundamentals as well as attractive dividends helped real estate investment trusts deliver a strong performance for the six months ended July 31, 2012. The downturn in both commercial and residential construction in recent years continued to work in favor of REITs by limiting new supply coming onto the market. At the same time, expansion in some sectors of the economy pushed up demand for existing space. Low interest rates were another source of support for the capital-intensive real estate industry.
The REIT segment of the stock market also benefited from investors in search of income. The REIT Index Fund’s dividend yield (including dividend income, return of capital, and capital gains) stood at 3.14% on July 31—ahead of the broad U.S. stock market’s dividend figure of around 2%, but lower than REITs’ historical long-term yield advantage over the broad equity market.
It’s worth remembering, of course, that REITs offer high dividend yields not because they are necessarily any better than other companies at generating income, but because regulations require them to pay
| | | | | | |
| Expense Ratios | | | | | | |
| Your Fund Compared With Its Peer Group |
| | | | | | | Peer |
| | Investor | Admiral | Signal | Institutional | ETF | Group |
| | Shares | Shares | Shares | Shares | Shares | Average |
| REIT Index Fund | 0.24% | 0.10% | 0.10% | 0.08% | 0.10% | 1.33% |
The fund expense ratios shown are from the prospectus dated May 29, 2012, and represent estimated costs for the current fiscal year. For the six months ended July 31, 2012, the fund’s annualized expense ratios were 0.24% for Investor Shares, 0.10% for Admiral Shares, 0.10% for Signal Shares, 0.08% for Institutional Shares, and 0.10% for ETF Shares. The peer-group expense ratio is derived from data provided by Lipper Inc. and captures information through year-end 2011.
Peer group: Real Estate Funds.
4
out just about all of their earnings. These payouts may also include a return of capital or capital gains distributions, a determination made at the end of a REIT’s fiscal year.
Retail REITs provided the largest performance boost
The retail REIT subsector, which accounted for more than one-quarter of fund assets, provided the largest contribution to performance, returning about 16% for the six-month period. Demand has been strong for leased space in higher-end shopping centers and regional malls, which pushed rents higher and vacancy rates lower.
Returns were more modest from specialized REITs, which invest in hotels, self-storage firms, and health care facilities, and from residential REITs, which invest in apartment buildings. Each of these market segments returned about 9%.
More muted performances were posted by the other subsectors. Office REITs returned 7%, diversified REITs 6%, and industrial REITs 5% for the half-year.
Allocated carefully, REITs can provide useful diversification
The REIT Index Fund offers convenient, low-cost exposure to the U.S. real estate market. Like any fund that focuses on one sector, when used thoughtfully it can enhance the diversification of a portfolio that lacks exposure to a certain part of the market or is overly concentrated in a few market segments.
However, any fund that focuses on a single sector can be volatile. Although REITs have provided generous returns for the past several years, in other periods the fund’s returns have trailed those of the broad market.
That’s why we believe it’s prudent to build a diversified portfolio. A broad mix of stock, bond, and short-term investments can help you harvest the long-term gains that may come from all segments of the markets while also mitigating your risk exposure. The REIT Index Fund can play a useful role in this type of careful approach.
Thank you for your confidence in Vanguard.
Sincerely,

F. William McNabb III
Chairman and Chief Executive Officer
August 13, 2012
REIT Index Fund
Fund Profile
As of July 31, 2012
| | | | | |
| Share-Class Characteristics | | | | | |
| |
| |
| | Investor | Admiral | Signal | Institutional | ETF |
| | Shares | Shares | Shares | Shares | Shares |
| Ticker Symbol | VGSIX | VGSLX | VGRSX | VGSNX | VNQ |
| Expense Ratio1 | 0.24% | 0.10% | 0.10% | 0.08% | 0.10% |
| | | |
| Portfolio Characteristics | | |
| | | | DJ |
| | | | U.S. Total |
| | | MSCI US | Market |
| Fund | REIT Index | Index |
| Number of Stocks | 111 | 110 | 3,684 |
| Median Market Cap | $10.6B | $10.6B | $34.4B |
| Price/Earnings Ratio | 66.6x | 65.9x | 15.7x |
| Price/Book Ratio | 2.3x | 2.3x | 2.2x |
| Return on Equity | 4.7% | 4.7% | 18.1% |
| Earnings Growth Rate | 1.8% | 1.7% | 9.6% |
| Dividend Yield | 3.4% | 3.4% | 2.1% |
| Foreign Holdings | 0.0% | 0.0% | 0.0% |
| Turnover Rate | | | |
| (Annualized) | 7% | — | — |
| Short-Term Reserves | 0.6% | — | — |
Dividend Yield: This yield may include some payments that represent a return of capital, capital gains distributions, or both by the underlying REITs. These amounts are determined by each REIT at the end of its fiscal year.
| | |
| Subindustry Diversification (% of equity |
| exposure) | | |
| | | MSCI US |
| | Fund | REIT Index |
| Diversified REITs | 6.5% | 6.5% |
| Industrial REITs | 4.6 | 4.6 |
| Office REITs | 15.1 | 15.1 |
| Residential REITs | 18.7 | 18.6 |
| Retail REITs | 27.4 | 27.2 |
| Specialized REITs | 27.7 | 28.0 |
| | |
| Volatility Measures | | |
| | | DJ |
| | | U.S. Total |
| | MSCI US | Market |
| | REIT Index | Index |
| R-Squared | 1.00 | 0.72 |
| Beta | 1.00 | 1.05 |
These measures show the degree and timing of the fund’s fluctuations compared with the indexes over 36 months.
| | |
| Ten Largest Holdings (% of total net assets) |
| Simon Property Group | | |
| Inc. | Retail REITs | 11.1% |
| Public Storage | Specialized REITs | 5.0 |
| Ventas Inc. | Specialized REITs | 4.5 |
| HCP Inc. | Specialized REITs | 4.5 |
| Equity Residential | Residential REITs | 4.4 |
| Boston Properties Inc. | Office REITs | 3.8 |
| Prologis Inc. | Industrial REITs | 3.4 |
| AvalonBay Communities | | |
| Inc. | Residential REITs | 3.3 |
| Vornado Realty Trust | Diversified REITs | 3.2 |
| Health Care REIT Inc. | Specialized REITs | 3.0 |
| Top Ten | | 46.2% |
The holdings listed exclude any temporary cash investments and equity index products.
1 The expense ratios shown are from the prospectus dated May 29, 2012, and represent estimated costs for the current fiscal year. For the six months ended July 31, 2012, the annualized expense ratios were 0.24% for Investor Shares, 0.10% for Admiral Shares, 0.10% for Signal Shares, 0.08% for Institutional Shares, and 0.10% for ETF Shares.
6
REIT Index Fund
Performance Summary
All of the returns in this report represent past performance, which is not a guarantee of future results that may be achieved by the fund. (Current performance may be lower or higher than the performance data cited. For performance data current to the most recent month-end, visit our website at vanguard.com/performance.) Note, too, that both investment returns and principal value can fluctuate widely, so an investor’s shares, when sold, could be worth more or less than their original cost. The returns shown do not reflect taxes that a shareholder would pay on fund distributions or on the sale of fund shares.
Fiscal-Year Total Returns (%): January 31, 2002, Through July 31, 2012
REIT Spliced Index: MSCI US REIT Index adjusted to include a 2% cash position (Lipper Money Market Average) through April 30, 2009; MSCI US REIT Index thereafter.
Note: For 2013, performance data reflect the six months ended July 31, 2012.
Average Annual Total Returns: Periods Ended June 30, 2012
This table presents returns through the latest calendar quarter—rather than through the end of the fiscal period.
Securities and Exchange Commission rules require that we provide this information.
| | | | |
| | Inception | One | Five | Ten |
| | Date | Year | Years | Years |
| Investor Shares | 5/13/1996 | 12.95% | 3.05% | 10.34% |
| Admiral Shares | 11/12/2001 | 13.09 | 3.17 | 10.44 |
| Signal Shares | 6/4/2007 | 13.07 | 3.17 | 1.091 |
| Institutional Shares | 12/2/2003 | 13.16 | 3.20 | 9.751 |
| ETF Shares | 9/23/2004 | | | |
| Market Price | | 12.97 | 3.18 | 8.901 |
| Net Asset Value | | 13.08 | 3.17 | 8.911 |
| 1 Return since inception. |
See Financial Highlights for dividend and capital gains information.
7
REIT Index Fund
Financial Statements (unaudited)
Statement of Net Assets
As of July 31, 2012
The fund reports a complete list of its holdings in regulatory filings four times in each fiscal year, at the quarter-ends. For the second and fourth fiscal quarters, the lists appear in the fund’s semiannual and annual reports to shareholders. For the first and third fiscal quarters, the fund files the lists with the Securities and Exchange Commission on Form N-Q. Shareholders can look up the fund’s Forms N-Q on the SEC’s website at sec.gov. Forms N-Q may also be reviewed and copied at the SEC’s Public Reference Room (see the back cover of this report for further information).
| | | |
| | | | Market |
| | | | Value |
| | | Shares | ($000) |
| Real Estate Investment Trusts (99.4%)1 | |
| Diversified REITs (6.5%) | | |
| 2 | Vornado Realty Trust | 10,571,133 | 882,690 |
| 2 | Liberty Property Trust | 7,397,115 | 268,441 |
| 2 | Duke Realty Corp. | 16,439,622 | 237,717 |
| 2 | Washington REIT | 4,205,773 | 112,294 |
| 2 | PS Business Parks Inc. | 1,225,088 | 82,828 |
| | American Assets Trust | | |
| | Inc. | 2,119,176 | 55,099 |
| 2 | Cousins Properties Inc. | 5,948,374 | 45,148 |
| 2 | Investors Real Estate | | |
| | Trust | 5,334,609 | 43,530 |
| 2 | Winthrop Realty Trust | 1,887,227 | 22,949 |
| 2 | CapLease Inc. | 3,995,805 | 18,181 |
| | | | 1,768,877 |
| Industrial REITs (4.6%) | | |
| 2 | Prologis Inc. | 29,142,388 | 942,173 |
| 2 | DCT Industrial Trust Inc. | 15,680,870 | 98,162 |
| 2 | EastGroup Properties Inc. | 1,768,104 | 94,558 |
| *,2 | First Industrial Realty | | |
| | Trust Inc. | 5,222,484 | 66,535 |
| 2 | First Potomac Realty | | |
| | Trust | 3,191,719 | 36,992 |
| 2 | Monmouth Real Estate | | |
| | Investment Corp. | | |
| | Class A | 2,023,895 | 22,546 |
| | | | 1,260,966 |
| Office REITs (15.0%) | | |
| 2 | Boston Properties Inc. | 9,410,271 | 1,043,599 |
| 2 | Digital Realty Trust Inc. | 7,632,528 | 595,871 |
| 2 | SL Green Realty Corp. | 5,481,182 | 431,643 |
| 2 | Alexandria Real Estate | | |
| | Equities Inc. | 3,931,841 | 288,912 |
| 2 | Kilroy Realty Corp. | 4,337,727 | 205,348 |
| 2 | Douglas Emmett Inc. | 8,416,317 | 197,868 |
| 2 | Piedmont Office Realty | | |
| | Trust Inc. Class A | 10,955,566 | 186,902 |
| 2 | BioMed Realty Trust Inc. | 9,787,462 | 184,004 |
| | | |
| | | | Market |
| | | | Value |
| | | Shares | ($000) |
| 2 | Highwoods Properties | | |
| | Inc. | 4,611,581 | 156,194 |
| 2 | Mack-Cali Realty Corp. | 5,572,034 | 149,275 |
| 2 | Brandywine Realty Trust | 9,057,951 | 107,608 |
| 2 | DuPont Fabros | | |
| | Technology Inc. | 3,998,915 | 107,571 |
| 2 | Corporate Office | | |
| | Properties Trust | 4,568,455 | 101,694 |
| ^,2 | Lexington Realty Trust | 8,875,795 | 79,349 |
| | CommonWealth REIT | 3,463,267 | 63,170 |
| 2 | Government Properties | | |
| | Income Trust | 2,388,893 | 54,706 |
| 2 | Franklin Street Properties | | |
| | Corp. | 4,737,116 | 49,124 |
| | Hudson Pacific Properties | | |
| | Inc. | 2,165,690 | 38,506 |
| 2 | Coresite Realty Corp. | 1,316,733 | 35,104 |
| 2 | Parkway Properties Inc. | 1,395,939 | 15,537 |
| | | | 4,091,985 |
| Residential REITs (18.6%) | | |
| 2 | Equity Residential | 19,054,158 | 1,206,319 |
| 2 | AvalonBay Communities | | |
| | Inc. | 6,042,291 | 888,761 |
| 2 | UDR Inc. | 16,642,776 | 442,864 |
| 2 | Camden Property Trust | 5,001,151 | 356,632 |
| 2 | Essex Property Trust Inc. | 2,209,234 | 347,645 |
| 2 | American Campus | | |
| | Communities Inc. | 5,694,713 | 271,410 |
| 2 | BRE Properties Inc. | 4,779,219 | 251,769 |
| 2 | Apartment Investment | | |
| | & Management Co. | | |
| | Class A | 9,151,022 | 251,013 |
| 2 | Home Properties Inc. | 3,069,761 | 201,407 |
| 2 | Equity Lifestyle | | |
| | Properties Inc. | 2,489,823 | 179,068 |
| 2 | Mid-America Apartment | | |
| | Communities Inc. | 2,580,963 | 178,680 |
| 2 | Post Properties Inc. | 3,378,631 | 174,506 |
| 2 | Colonial Properties Trust | 5,297,513 | 119,989 |
8
REIT Index Fund
| | | |
| | | | Market |
| | | | Value |
| | | Shares | ($000) |
| 2 | Sun Communities Inc. | 1,594,751 | 74,299 |
| 2 | Education Realty Trust | | |
| | Inc. | 5,825,946 | 68,280 |
| 2 | Associated Estates | | |
| | Realty Corp. | 3,088,750 | 46,115 |
| 2 | Campus Crest | | |
| | Communities Inc. | 2,383,677 | 26,125 |
| | | | 5,084,882 |
| Retail REITs (27.2%) | | |
| 2 | Simon Property Group | | |
| | Inc. | 18,895,470 | 3,032,534 |
| 2 | Kimco Realty Corp. | 25,828,058 | 503,389 |
| 2 | Macerich Co. | 8,376,632 | 489,279 |
| | General Growth | | |
| | Properties Inc. | 26,776,151 | 485,184 |
| 2 | Federal Realty | | |
| | Investment Trust | 4,040,863 | 439,080 |
| 2 | Realty Income Corp. | 8,464,983 | 348,757 |
| 2 | Taubman Centers Inc. | 3,684,535 | 285,625 |
| 2 | Regency Centers Corp. | 5,706,850 | 273,073 |
| | DDR Corp. | 14,061,747 | 211,489 |
| 2 | Weingarten Realty | | |
| | Investors | 7,285,813 | 195,843 |
| ^,2 | National Retail | | |
| | Properties Inc. | 6,562,051 | 193,580 |
| 2 | Tanger Factory Outlet | | |
| | Centers | 5,761,293 | 185,514 |
| 2 | CBL & Associates | | |
| | Properties Inc. | 8,944,827 | 176,481 |
| 2 | Glimcher Realty Trust | 8,656,576 | 86,739 |
| | Equity One Inc. | 3,641,671 | 78,988 |
| 2 | Acadia Realty Trust | 2,713,902 | 64,971 |
| | Alexander’s Inc. | 129,600 | 55,374 |
| 2 | Pennsylvania REIT | 3,356,335 | 48,197 |
| 2 | Inland Real Estate Corp. | 5,650,214 | 45,089 |
| ^,2 | Retail Opportunity | | |
| | Investments Corp. | 3,151,696 | 38,419 |
| 2 | Ramco-Gershenson | | |
| | Properties Trust | 2,883,095 | 36,731 |
| 2 | Getty Realty Corp. | 1,694,513 | 31,484 |
| | Saul Centers Inc. | 733,022 | 30,523 |
| | Urstadt Biddle Properties | | |
| | Inc. Class A | 1,259,786 | 23,923 |
| 2 | Excel Trust Inc. | 1,921,171 | 23,515 |
| 2 | Kite Realty Group Trust | 3,818,879 | 19,209 |
| 2 | Cedar Realty Trust Inc. | 3,668,751 | 18,894 |
| | Rouse Properties Inc. | 1,240,903 | 17,174 |
| | Urstadt Biddle Properties | | |
| | Inc. | 69,255 | 1,276 |
| | | | 7,440,334 |
| Specialized REITs (27.5%) | | |
| 2 | Public Storage | 9,239,811 | 1,376,270 |
| 2 | Ventas Inc. | 18,335,361 | 1,233,053 |
| 2 | HCP Inc. | 25,989,376 | 1,226,958 |
| | | |
| | | | Market |
| | | | Value |
| | | Shares | ($000) |
| 2 | Health Care REIT Inc. | 13,344,696 | 830,440 |
| 2 | Host Hotels & Resorts | | |
| | Inc. | 44,903,711 | 659,187 |
| 2 | Extra Space Storage Inc. | 6,152,177 | 201,422 |
| | Senior Housing | | |
| | Properties Trust | 7,985,435 | 181,669 |
| ^,2 | Omega Healthcare | | |
| | Investors Inc. | 6,593,780 | 159,833 |
| 2 | LaSalle Hotel Properties | 5,434,425 | 142,708 |
| | Hospitality Properties | | |
| | Trust | 5,539,068 | 134,433 |
| 2 | Entertainment Properties | | |
| | Trust | 2,965,413 | 133,918 |
| 2 | Healthcare Realty Trust | | |
| | Inc. | 4,946,692 | 121,491 |
| 2 | DiamondRock Hospitality | | |
| | Co. | 11,926,623 | 112,826 |
| 2 | RLJ Lodging Trust | 6,070,145 | 106,835 |
| 2 | Sovran Self Storage Inc. | 1,838,451 | 104,976 |
| 2 | CubeSmart | 7,358,889 | 88,233 |
| *,2 | Sunstone Hotel Investors | | |
| | Inc. | 8,608,429 | 86,170 |
| 2 | Medical Properties Trust | | |
| | Inc. | 8,584,915 | 84,561 |
| 2 | Pebblebrook Hotel Trust | 3,599,567 | 81,782 |
| 2 | National Health Investors | | |
| | Inc. | 1,498,763 | 80,469 |
| 2 | LTC Properties Inc. | 1,929,413 | 68,880 |
| *,2 | Strategic Hotels & | | |
| | Resorts Inc. | 10,248,919 | 62,108 |
| 2 | Hersha Hospitality Trust | | |
| | Class A | 11,328,464 | 55,056 |
| 2 | Sabra Health Care REIT | | |
| | Inc. | 2,339,837 | 43,334 |
| *,2 | FelCor Lodging Trust Inc. | 7,510,912 | 36,353 |
| 2 | Chesapeake Lodging | | |
| | Trust | 2,038,894 | 34,600 |
| 2 | Universal Health Realty | | |
| | Income Trust | 763,679 | 33,251 |
| 2 | Ashford Hospitality Trust | | |
| | Inc. | 4,095,617 | 31,250 |
| 2 | Summit Hotel Properties | | |
| | Inc. | 1,731,205 | 14,369 |
| | | | 7,526,435 |
| Total Real Estate Investment Trusts | |
| (Cost $22,138,692) | | 27,173,479 |
9
REIT Index Fund
| | | |
| | | | Market |
| | | | Value |
| | | Shares | ($000) |
| Temporary Cash Investments (0.8%)1 | |
| Money Market Fund (0.7%) | | |
| 3,4 | Vanguard Market | | |
| | Liquidity Fund, | | |
| | 0.155% | 189,790,339 | 189,790 |
| |
| | | Face | |
| | | Amount | |
| | | ($000) | |
| U.S. Government and Agency Obligations (0.1%) |
| 5 | Fannie Mae | | |
| | Discount Notes, | | |
| | 0.130%, 8/15/12 | 1,600 | 1,600 |
| 5 | Fannie Mae | | |
| | Discount Notes, | | |
| | 0.110%, 8/29/12 | 4,300 | 4,299 |
| 5 | Fannie Mae | | |
| | Discount Notes, | | |
| | 0.170%, 9/17/12 | 2,000 | 2,000 |
| 6 | Federal Home Loan | | |
| | Bank Discount Notes, | | |
| | 0.120%, 8/21/12 | 2,300 | 2,300 |
| 5 | Freddie Mac | | |
| | Discount Notes, | | |
| | 0.125%, 8/21/12 | 4,400 | 4,400 |
| | United States | | |
| | Treasury Note/Bond, | | |
| | 1.375%, 9/15/12 | 1,000 | 1,001 |
| | United States | | |
| | Treasury Note/Bond, | | |
| | 4.250%, 9/30/12 | 2,500 | 2,517 |
| | | | 18,117 |
| Total Temporary Cash Investments | |
| (Cost $207,907) | | 207,907 |
| Total Investments (100.2%) | | |
| (Cost $22,346,599) | | 27,381,386 |
| Other Assets and Liabilities (-0.2%) | |
| Other Assets | | 49,860 |
| Liabilities4 | | (102,292) |
| | | | (52,432) |
| Net Assets (100%) | | 27,328,954 |
| |
| | Market |
| | Value |
| | ($000) |
| Statement of Assets and Liabilities | |
| Assets | |
| Investments in Securities, at Value | |
| Unaffiliated Issuers | 1,394,925 |
| Affiliated Vanguard Funds | 189,790 |
| Other Affiliated Issuers | 25,796,671 |
| Total Investments in Securities | 27,381,386 |
| Receivables for Capital Shares Issued | 22,484 |
| Receivables for Accrued Income | 23,470 |
| Other Assets | 3,906 |
| Total Assets | 27,431,246 |
| Liabilities | |
| Payables for Investment Securities | |
| Purchased | 40,813 |
| Security Lending Collateral Payable | |
| to Brokers | 28,972 |
| Other Liabilities | 32,507 |
| Total Liabilities | 102,292 |
| Net Assets | 27,328,954 |
| |
| At July 31, 2012, net assets consisted of: |
| | Amount |
| | ($000) |
| Paid-in Capital | 22,787,250 |
| Overdistributed Net Investment Income | (100,484) |
| Accumulated Net Realized Losses | (395,394) |
| Unrealized Appreciation (Depreciation) | |
| Investment Securities | 5,034,787 |
| Swap Contracts | 2,795 |
| Net Assets | 27,328,954 |
| |
| Investor Shares—Net Assets | |
| Applicable to 127,214,941 outstanding | |
| $.001 par value shares of beneficial | |
| interest (unlimited authorization) | 2,821,596 |
| Net Asset Value Per Share— | |
| Investor Shares | $22.18 |
10
REIT Index Fund
| |
| | Amount |
| | ($000) |
| Admiral Shares—Net Assets | |
| Applicable to 68,126,172 outstanding | |
| $.001 par value shares of beneficial | |
| interest (unlimited authorization) | 6,448,149 |
| Net Asset Value Per Share— | |
| Admiral Shares | $94.65 |
| |
| Signal Shares—Net Assets | |
| Applicable to 59,330,587 outstanding | |
| $.001 par value shares of beneficial | |
| interest (unlimited authorization) | 1,499,053 |
| Net Asset Value Per Share— | |
| Signal Shares | $25.27 |
| |
| Institutional Shares—Net Assets | |
| Applicable to 185,246,519 outstanding | |
| $.001 par value shares of beneficial | |
| interest (unlimited authorization) | 2,713,724 |
| Net Asset Value Per Share— | |
| Institutional Shares | $14.65 |
| |
| ETF Shares—Net Assets | |
| Applicable to 207,325,788 outstanding | |
| $.001 par value shares of beneficial | |
| interest (unlimited authorization) | 13,846,432 |
| Net Asset Value Per Share— | |
| ETF Shares | $66.79 |
See Note A in Notes to Financial Statements.
* Non-income-producing security.
^ Part of security position is on loan to broker-dealers. The total value of securities on loan is $27,958,000.
1The fund invests a portion of its assets in Real Estate Investment Trusts through the use of swap contracts. After giving effect to swap investments, the fund’s effective Real Estate Investment Trust and temporary cash investment positions represent 100.0% and 0.2%, respectively, of net assets.
2 Considered an affiliated company of the fund as the fund owns more than 5% of the outstanding voting securities of such company.
3 Affiliated money market fund available only to Vanguard funds and certain trusts and accounts managed by Vanguard. Rate shown is the 7-day yield.
4 Includes $28,972,000 of collateral received for securities on loan.
5 The issuer was placed under federal conservatorship in September 2008; since that time, its daily operations have been managed by the Federal Housing Finance Agency and it receives capital from the U.S. Treasury in exchange for senior preferred stock.
6 The issuer operates under a congressional charter; its securities are generally neither guaranteed by the U.S. Treasury nor backed by the full faith and credit of the U.S. government.
REIT—Real Estate Investment Trust.
See accompanying Notes, which are an integral part of the Financial Statements.
11
REIT Index Fund
| |
| Statement of Operations | |
| |
| | Six Months Ended |
| | July 31, 2012 |
| | ($000) |
| Investment Income | |
| Income | |
| Dividends1 | 297,656 |
| Interest1 | 93 |
| Security Lending | 57 |
| Total Income | 297,806 |
| Expenses | |
| The Vanguard Group—Note B | |
| Investment Advisory Services | 714 |
| Management and Administrative—Investor Shares | 2,666 |
| Management and Administrative—Admiral Shares | 2,240 |
| Management and Administrative—Signal Shares | 417 |
| Management and Administrative—Institutional Shares | 542 |
| Management and Administrative—ETF Shares | 3,633 |
| Marketing and Distribution—Investor Shares | 375 |
| Marketing and Distribution—Admiral Shares | 485 |
| Marketing and Distribution—Signal Shares | 192 |
| Marketing and Distribution—Institutional Shares | 354 |
| Marketing and Distribution—ETF Shares | 1,654 |
| Custodian Fees | 156 |
| Shareholders’ Reports—Investor Shares | 28 |
| Shareholders’ Reports—Admiral Shares | 10 |
| Shareholders’ Reports—Signal Shares | 6 |
| Shareholders’ Reports—Institutional Shares | 9 |
| Shareholders’ Reports—ETF Shares | 255 |
| Trustees’ Fees and Expenses | 12 |
| Total Expenses | 13,748 |
| Net Investment Income | 284,058 |
| Realized Net Gain (Loss) | |
| Investment Securities Sold | 287,197 |
| Swap Contracts | 8,944 |
| Realized Net Gain (Loss)1 | 296,141 |
| Change in Unrealized Appreciation (Depreciation) | |
| Investment Securities | 1,784,634 |
| Swap Contracts | (2,341) |
| Change in Unrealized Appreciation (Depreciation) | 1,782,293 |
| Net Increase (Decrease) in Net Assets Resulting from Operations | 2,362,492 |
1 Dividend income, interest income, and realized net gain (loss) from affiliated companies of the fund were $278,010,000, $87,000, and $269,993,000, respectively.
See accompanying Notes, which are an integral part of the Financial Statements.
12

| | |
| Statement of Changes in Net Assets | | |
| |
| |
| | Six Months Ended | Year Ended |
| | July 31, | January 31, |
| | 2012 | 2012 |
| | ($000) | ($000) |
| Increase (Decrease) in Net Assets | | |
| Operations | | |
| Net Investment Income | 284,058 | 470,697 |
| Realized Net Gain (Loss) | 296,141 | 220,389 |
| Change in Unrealized Appreciation (Depreciation) | 1,782,293 | 1,501,149 |
| Net Increase (Decrease) in Net Assets Resulting from Operations | 2,362,492 | 2,192,235 |
| Distributions | | |
| Net Investment Income | | |
| Investor Shares | (40,605) | (58,500) |
| Admiral Shares | (95,155) | (119,159) |
| Signal Shares | (21,381) | (25,078) |
| Institutional Shares | (40,306) | (45,416) |
| ETF Shares | (193,675) | (215,013) |
| Realized Capital Gain | | |
| Investor Shares | — | — |
| Admiral Shares | — | — |
| Signal Shares | — | — |
| Institutional Shares | — | — |
| ETF Shares | — | — |
| Return of Capital | | |
| Investor Shares | — | (28,724) |
| Admiral Shares | — | (58,509) |
| Signal Shares | — | (12,314) |
| Institutional Shares | — | (22,300) |
| ETF Shares | — | (105,574) |
| Total Distributions | (391,122) | (690,587) |
| Capital Share Transactions | | |
| Investor Shares | 43,382 | (279,552) |
| Admiral Shares | 358,073 | 489,968 |
| Signal Shares | 164,217 | 308,673 |
| Institutional Shares | 187,997 | 536,824 |
| ETF Shares | 2,466,611 | 1,682,526 |
| Net Increase (Decrease) from Capital Share Transactions | 3,220,280 | 2,738,439 |
| Total Increase (Decrease) | 5,191,650 | 4,240,087 |
| Net Assets | | |
| Beginning of Period | 22,137,304 | 17,897,217 |
| End of Period1 | 27,328,954 | 22,137,304 |
| 1 Net Assets—End of Period includes undistributed (overdistributed) net investment income of ($100,484,000) and ($2,364,000). |
See accompanying Notes, which are an integral part of the Financial Statements.
13
REIT Index Fund
Financial Highlights
| | | | | | |
| Investor Shares | | | | | | |
| Six Months | | | | | |
| | Ended | | | | | |
| For a Share Outstanding | July 31, | | | Year Ended January 31, |
| Throughout Each Period | 2012 | 2012 | 2011 | 2010 | 2009 | 2008 |
| Net Asset Value, Beginning of Period | $20.50 | $18.99 | $14.05 | $10.02 | $20.38 | $27.76 |
| Investment Operations | | | | | | |
| Net Investment Income | .244 | .442 | .399 | .477 | .593 | .615 |
| Net Realized and Unrealized Gain (Loss) | | | | | | |
| on Investments1 | 1.760 | 1.722 | 5.144 | 4.192 | (9.975) | (6.985) |
| Total from Investment Operations | 2.004 | 2.164 | 5.543 | 4.669 | (9.382) | (6.370) |
| Distributions | | | | | | |
| Dividends from Net Investment Income | (.324) | (.439) | (.603) | (.481) | (.571) | (.622) |
| Distributions from Realized Capital Gains | — | — | — | — | (.125) | (.199) |
| Return of Capital | — | (.215) | — | (.158) | (.282) | (.189) |
| Total Distributions | (.324) | (.654) | (.603) | (.639) | (.978) | (1.010) |
| Net Asset Value, End of Period | $22.18 | $20.50 | $18.99 | $14.05 | $10.02 | $20.38 |
| |
| Total Return2 | 9.88% | 11.80% | 40.02% | 48.51% | -47.82% | -23.28% |
| |
| Ratios/Supplemental Data | | | | | | |
| Net Assets, End of Period (Millions) | $2,822 | $2,565 | $2,658 | $3,572 | $2,274 | $4,046 |
| Ratio of Total Expenses to | | | | | | |
| Average Net Assets | 0.24% | 0.24% | 0.26% | 0.26% | 0.21% | 0.20% |
| Ratio of Net Investment Income to | | | | | | |
| Average Net Assets | 2.21% | 2.30% | 2.22% | 3.94% | 3.36% | 2.52% |
| Portfolio Turnover Rate3 | 7% | 10% | 12% | 16% | 10% | 13% |
The expense ratio, net income ratio, and turnover rate for the current period have been annualized.
1 Includes increases from redemption fees of $.00, $.00, $.00, $.00, $.00, and $.02.
2 Total returns do not include transaction or account service fees that may have applied in the periods shown. Fund prospectuses provide information about any applicable transaction and account service fees.
3 Excludes the value of portfolio securities received or delivered as a result of in-kind purchases or redemptions of the fund’s capital shares, including ETF Creation Units.
See accompanying Notes, which are an integral part of the Financial Statements.
14
REIT Index Fund
Financial Highlights
| | | | | | |
| Admiral Shares | | | | | | |
| Six Months | | | | | |
| | Ended | | | | | |
| For a Share Outstanding | July 31, | | | Year Ended January 31, |
| Throughout Each Period | 2012 | 2012 | 2011 | 2010 | 2009 | 2008 |
| Net Asset Value, Beginning of Period | $87.47 | $81.03 | $59.95 | $42.74 | $86.94 | $118.46 |
| Investment Operations | | | | | | |
| Net Investment Income | 1.107 | 1.960 | 1.806 | 2.083 | 2.581 | 2.707 |
| Net Realized and Unrealized Gain (Loss) | | | | | | |
| on Investments1 | 7.518 | 7.385 | 21.948 | 17.909 | (42.527) | (29.817) |
| Total from Investment Operations | 8.625 | 9.345 | 23.754 | 19.992 | (39.946) | (27.110) |
| Distributions | | | | | | |
| Dividends from Net Investment Income | (1.445) | (1.948) | (2.674) | (2.094) | (2.491) | (2.735) |
| Distributions from Realized Capital Gains | — | — | — | — | (.535) | (.849) |
| Return of Capital | — | (.957) | — | (.688) | (1.228) | (.826) |
| Total Distributions | (1.445) | (2.905) | (2.674) | (2.782) | (4.254) | (4.410) |
| Net Asset Value, End of Period | $94.65 | $87.47 | $81.03 | $59.95 | $42.74 | $86.94 |
| |
| Total Return2 | 9.98% | 11.95% | 40.21% | 48.73% | -47.77% | -23.23% |
| |
| Ratios/Supplemental Data | | | | | | |
| Net Assets, End of Period (Millions) | $6,448 | $5,612 | $4,715 | $1,296 | $873 | $1,706 |
| Ratio of Total Expenses to | | | | | | |
| Average Net Assets | 0.10% | 0.10% | 0.12% | 0.13% | 0.11% | 0.10% |
| Ratio of Net Investment Income to | | | | | | |
| Average Net Assets | 2.35% | 2.44% | 2.36% | 4.07% | 3.46% | 2.62% |
| Portfolio Turnover Rate3 | 7% | 10% | 12% | 16% | 10% | 13% |
The expense ratio, net income ratio, and turnover rate for the current period have been annualized.
1 Includes increases from redemption fees of $.00, $.01, $.00, $.01, $.02, and $.10.
2 Total returns do not include transaction or account service fees that may have applied in the periods shown. Fund prospectuses provide information about any applicable transaction and account service fees.
3 Excludes the value of portfolio securities received or delivered as a result of in-kind purchases or redemptions of the fund’s capital shares, including ETF Creation Units.
See accompanying Notes, which are an integral part of the Financial Statements.
15
REIT Index Fund
Financial Highlights
| | | | | | |
| Signal Shares | | | | | | |
| Six Months | | | | | June 4, |
| | Ended | | | | | 20071 to |
| For a Share Outstanding | July 31, | Year Ended January 31, | Jan. 31, |
| Throughout Each Period | 2012 | 2012 | 2011 | 2010 | 2009 | 2008 |
| Net Asset Value, Beginning of Period | $23.35 | $21.63 | $16.00 | $11.41 | $23.21 | $30.05 |
| Investment Operations | | | | | | |
| Net Investment Income | .295 | .522 | .483 | .557 | .688 | .470 |
| Net Realized and Unrealized Gain (Loss) | | | | | | |
| on Investments | 2.010 | 1.974 | 5.862 | 4.775 | (11.353) | (6.311) |
| Total from Investment Operations | 2.305 | 2.496 | 6.345 | 5.332 | (10.665) | (5.841) |
| Distributions | | | | | | |
| Dividends from Net Investment Income | (.385) | (.520) | (.715) | (.559) | (.664) | (.620) |
| Distributions from Realized Capital Gains | — | — | — | — | (.143) | (.192) |
| Return of Capital | — | (.256) | — | (.183) | (.328) | (.187) |
| Total Distributions | (.385) | (.776) | (.715) | (.742) | (1.135) | (.999) |
| Net Asset Value, End of Period | $25.27 | $23.35 | $21.63 | $16.00 | $11.41 | $23.21 |
| |
| Total Return2 | 9.99% | 11.96% | 40.25% | 48.68% | -47.77% | -19.68% |
| |
| Ratios/Supplemental Data | | | | | | |
| Net Assets, End of Period (Millions) | $1,499 | $1,226 | $835 | $489 | $350 | $538 |
| Ratio of Total Expenses to | | | | | | |
| Average Net Assets | 0.10% | 0.10% | 0.12% | 0.14% | 0.11% | 0.10%3 |
| Ratio of Net Investment Income to | | | | | | |
| Average Net Assets | 2.35% | 2.44% | 2.36% | 4.06% | 3.46% | 2.62%3 |
| Portfolio Turnover Rate4 | 7% | 10% | 12% | 16% | 10% | 13% |
The expense ratio, net income ratio, and turnover rate for the current period have been annualized.
1 Inception.
2 Total returns do not include transaction fees that may have applied in the periods shown. Fund prospectuses provide information about any applicable transaction fees.
3 Annualized.
4 Excludes the value of portfolio securities received or delivered as a result of in-kind purchases or redemptions of the fund’s capital shares, including ETF Creation Units.
See accompanying Notes, which are an integral part of the Financial Statements.
16
REIT Index Fund
Financial Highlights
| | | | | | |
| Institutional Shares | | | | | | |
| Six Months | | | | | |
| | Ended | | | | | |
| For a Share Outstanding | July 31, | | | Year Ended January 31, |
| Throughout Each Period | 2012 | 2012 | 2011 | 2010 | 2009 | 2008 |
| Net Asset Value, Beginning of Period | $13.54 | $12.54 | $9.28 | $6.61 | $13.46 | $18.33 |
| Investment Operations | | | | | | |
| Net Investment Income | .173 | .305 | .284 | .326 | .401 | .420 |
| Net Realized and Unrealized Gain (Loss) | | | | | | |
| on Investments1 | 1.162 | 1.148 | 3.395 | 2.777 | (6.591) | (4.605) |
| Total from Investment Operations | 1.335 | 1.453 | 3.679 | 3.103 | (6.190) | (4.185) |
| Distributions | | | | | | |
| Dividends from Net Investment Income | (.225) | (.304) | (.419) | (.326) | (.386) | (.426) |
| Distributions from Realized Capital Gains | — | — | — | — | (.083) | (.131) |
| Return of Capital | — | (.149) | — | (.107) | (.191) | (.128) |
| Total Distributions | (.225) | (.453) | (.419) | (.433) | (.660) | (.685) |
| Net Asset Value, End of Period | $14.65 | $13.54 | $12.54 | $9.28 | $6.61 | $13.46 |
| |
| Total Return2 | 9.97% | 12.01% | 40.24% | 48.90% | -47.82% | -23.18% |
| |
| Ratios/Supplemental Data | | | | | | |
| Net Assets, End of Period (Millions) | $2,714 | $2,324 | $1,614 | $907 | $504 | $722 |
| Ratio of Total Expenses to | | | | | | |
| Average Net Assets | 0.08% | 0.08% | 0.08% | 0.09% | 0.09% | 0.09% |
| Ratio of Net Investment Income to | | | | | | |
| Average Net Assets | 2.37% | 2.46% | 2.40% | 4.11% | 3.48% | 2.63% |
| Portfolio Turnover Rate3 | 7% | 10% | 12% | 16% | 10% | 13% |
The expense ratio, net income ratio, and turnover rate for the current period have been annualized.
1 Includes increases from redemption fees of $.00, $.00, $.00, $.00, $.00, and $.01.
2 Total returns do not include transaction fees that may have applied in the periods shown. Fund prospectuses provide information about any applicable transaction fees.
3 Excludes the value of portfolio securities received or delivered as a result of in-kind purchases or redemptions of the fund’s capital shares, including ETF Creation Units.
See accompanying Notes, which are an integral part of the Financial Statements.
17
REIT Index Fund
Financial Highlights
| | | | | | |
| ETF Shares | | | | | | |
| Six Months | | | | | |
| | Ended | | | | | |
| For a Share Outstanding | July 31, | | | Year Ended January 31, |
| Throughout Each Period | 2012 | 2012 | 2011 | 2010 | 2009 | 2008 |
| Net Asset Value, Beginning of Period | $61.72 | $57.17 | $42.30 | $30.14 | $61.31 | $83.55 |
| Investment Operations | | | | | | |
| Net Investment Income | .781 | 1.384 | 1.278 | 1.473 | 1.820 | 1.908 |
| Net Realized and Unrealized Gain (Loss) | | | | | | |
| on Investments1 | 5.310 | 5.216 | 15.483 | 12.651 | (29.990) | (21.037) |
| Total from Investment Operations | 6.091 | 6.600 | 16.761 | 14.124 | (28.170) | (19.129) |
| Distributions | | | | | | |
| Dividends from Net Investment Income | (1.021) | (1.375) | (1.891) | (1.478) | (1.757) | (1.931) |
| Distributions from Realized Capital Gains | — | — | — | — | (.377) | (.598) |
| Return of Capital | — | (.675) | — | (.486) | (.866) | (.582) |
| Total Distributions | (1.021) | (2.050) | (1.891) | (1.964) | (3.000) | (3.111) |
| Net Asset Value, End of Period | $66.79 | $61.72 | $57.17 | $42.30 | $30.14 | $61.31 |
| |
| Total Return | 9.98% | 11.94% | 40.19% | 48.74% | -47.77% | -23.23% |
| |
| Ratios/Supplemental Data | | | | | | |
| Net Assets, End of Period (Millions) | $13,846 | $10,410 | $8,075 | $4,678 | $1,414 | $2,082 |
| Ratio of Total Expenses to | | | | | | |
| Average Net Assets | 0.10% | 0.10% | 0.12% | 0.13% | 0.11% | 0.10% |
| Ratio of Net Investment Income to | | | | | | |
| Average Net Assets | 2.35% | 2.44% | 2.36% | 4.07% | 3.46% | 2.62% |
| Portfolio Turnover Rate2 | 7% | 10% | 12% | 16% | 10% | 13% |
The expense ratio, net income ratio, and turnover rate for the current period have been annualized.
1 Includes increases from redemption fees of $.00, $.01, $.01, $.01, $.01, and $.04.
2 Excludes the value of portfolio securities received or delivered as a result of in-kind purchases or redemptions of the fund’s capital shares, including ETF Creation Units.
See accompanying Notes, which are an integral part of the Financial Statements.
18
REIT Index Fund
Notes to Financial Statements
Vanguard REIT Index Fund is registered under the Investment Company Act of 1940 as an open-end investment company, or mutual fund. The fund offers five classes of shares: Investor Shares, Admiral Shares, Signal Shares, Institutional Shares, and ETF Shares. Investor Shares are available to any investor who meets the fund’s minimum purchase requirements. Admiral Shares, Signal Shares, and Institutional Shares are designed for investors who meet certain administrative, service, and account-size criteria. ETF Shares are listed for trading on NYSE Arca; they can be purchased and sold through a broker.
A. The following significant accounting policies conform to generally accepted accounting principles for U.S. mutual funds. The fund consistently follows such policies in preparing its financial statements.
1. Security Valuation: Securities are valued as of the close of trading on the New York Stock Exchange (generally 4 p.m., Eastern time) on the valuation date. Equity securities are valued at the latest quoted sales prices or official closing prices taken from the primary market in which each security trades; such securities not traded on the valuation date are valued at the mean of the latest quoted bid and asked prices. Securities for which market quotations are not readily available, or whose values have been materially affected by events occurring before the fund’s pricing time but after the close of the securities’ primary markets, are valued by methods deemed by the board of trustees to represent fair value. Investments in Vanguard Market Liquidity Fund are valued at that fund’s net asset value. Temporary cash investments acquired over 60 days to maturity are valued using the latest bid prices or using valuations based on a matrix system (which considers such factors as security prices, yields, maturities, and ratings), both as furnished by independent pricing services. Other temporary cash investments are valued at amortized cost, which approximates market value.
2. Swap Contracts: The fund enters into swap transactions to earn the total return on a specified security or index. Under the terms of the swaps, the fund receives the total return (either receiving the increase or paying the decrease) on a reference security or index, applied to a notional principal amount. In return, the fund agrees to pay the counterparty a floating rate, which is reset periodically based on short-term interest rates, applied to the same notional amount. At the same time, the fund invests an amount approximating the notional amount of the swap in high-quality temporary cash investments.
The notional amounts of swap contracts are not recorded in the Statement of Net Assets. Swaps are valued daily based on market quotations received from independent pricing services or recognized dealers and the change in value is recorded as unrealized appreciation (depreciation) until periodic payments are made, or the swap terminates, at which time realized gain (loss) is recorded. The primary risk associated with the swaps is that a counterparty will default on its obligation to pay net amounts due to the fund. The fund’s maximum risk of loss from counterparty credit risk is the amount of unrealized appreciation on the swap contract. This risk is mitigated by entering into swaps only with highly rated counterparties, by a master netting arrangement between the fund and the counterparty, and by the posting of collateral by the counterparty. The swap contracts contain provisions whereby a counterparty may terminate open contracts if the fund’s net assets decline below a certain level, triggering a payment by the fund if the fund is in a net liability position at the time of the termination. The payment amount would be reduced by any collateral the fund has posted. Any securities posted as collateral for open contracts are noted in the Statement of Net Assets.
3. Federal Income Taxes: The fund intends to continue to qualify as a regulated investment company and distribute all of its taxable income. Management has analyzed the fund’s tax positions taken for all open federal income tax years (January 31, 2009–2012), and for the period ended July 31, 2012, and has concluded that no provision for federal income tax is required in the fund’s financial statements.
19
REIT Index Fund
4. Distributions: Distributions to shareholders are recorded on the ex-dividend date. Distributions declared by the fund are reallocated at fiscal year-end to ordinary income, capital gain, and return of capital to reflect their tax character.
5. Security Lending: The fund may lend its securities to qualified institutional borrowers to earn additional income. Security loans are required to be secured at all times by collateral at least equal to the market value of securities loaned. The fund invests cash collateral received in Vanguard Market Liquidity Fund, and records a liability for the return of the collateral, during the period the securities are on loan. Security lending income represents fees charged to borrowers plus income earned on investing cash collateral, less expenses associated with the loan.
6. Other: Distributions received from REITs are recorded on the ex-dividend date. Each REIT reports annually the tax character of its distributions. Dividend income, capital gain distributions received, and unrealized appreciation (depreciation) reflect the amounts of taxable income, capital gain, and return of capital reported by the REITs, and management’s estimates of such amounts for REIT distributions for which actual information has not been reported. Interest income includes income distributions received from Vanguard Market Liquidity Fund and is accrued daily. Security transactions are accounted for on the date securities are bought or sold. Costs used to determine realized gains (losses) on the sale of investment securities are those of the specific securities sold. Fees assessed on redemptions of capital shares are credited to paid-in capital.
Each class of shares has equal rights as to assets and earnings, except that each class separately bears certain class-specific expenses related to maintenance of shareholder accounts (included in Management and Administrative expenses) and shareholder reporting. Marketing and distribution expenses are allocated to each class of shares based on a method approved by the board of trustees. Income, other non-class-specific expenses, and gains and losses on investments are allocated to each class of shares based on its relative net assets.
B. The Vanguard Group furnishes at cost investment advisory, corporate management, administrative, marketing, and distribution services. The costs of such services are allocated to the fund under methods approved by the board of trustees. The fund has committed to provide up to 0.40% of its net assets in capital contributions to Vanguard. At July 31, 2012, the fund had contributed capital of $3,858,000 to Vanguard (included in Other Assets), representing 0.01% of the fund’s net assets and 1.54% of Vanguard’s capitalization. The fund’s trustees and officers are also directors and officers of Vanguard.
C. Various inputs may be used to determine the value of the fund’s investments. These inputs are summarized in three broad levels for financial statement purposes. The inputs or methodologies used to value securities are not necessarily an indication of the risk associated with investing in those securities.
Level 1—Quoted prices in active markets for identical securities.
Level 2—Other significant observable inputs (including quoted prices for similar securities, interest rates, prepayment speeds, credit risk, etc.).
Level 3—Significant unobservable inputs (including the fund’s own assumptions used to determine the fair value of investments).
20
REIT Index Fund
The following table summarizes the market value of the fund’s investments as of July 31, 2012, based on the inputs used to value them:
| | | |
| | Level 1 | Level 2 | Level 3 |
| Investments | ($000) | ($000) | ($000) |
| Real Estate Investment Trusts | 27,173,479 | — | — |
| Temporary Cash Investments | 189,790 | 18,117 | — |
| Swap Contracts—Assets | — | 2,795 | — |
| Total | 27,363,269 | 20,912 | — |
D. At July 31, 2012, the fund had the following open total return swap contracts:
| | | | | |
| | | | | Floating | Unrealized |
| | | | Notional | Interest Rate | Appreciation |
| | Termination | | Amount | Received | (Depreciation) |
| Reference Entity | Date | Counterparty1 | ($000) | (Paid) | ($000) |
| CommonWealth REIT | 8/7/13 | GSI | 35,539 | (0.595%)2 | (887) |
| Hospitality Properties Trust | 8/30/12 | GSI | 54,786 | (0.591%)2 | 2,038 |
| Senior Housing Properties Trust | 8/9/13 | GSI | 70,029 | (0.599%)2 | 1,644 |
1 GSI—Goldman Sachs International.
2 Based on one-month London Interbank Offered Rate (LIBOR) as of the most recent payment date plus a 0.35% spread.
At July 31, 2012, the counterparty had deposited in segregated accounts securities with a value sufficient to cover substantially all amounts due to the fund in connection with open swap contracts.
E. Distributions are determined on a tax basis and may differ from net investment income and realized capital gains for financial reporting purposes. Differences may be permanent or temporary. Permanent differences are reclassified among capital accounts in the financial statements to reflect their tax character. Temporary differences arise when certain items of income, expense, gain, or loss are recognized in different periods for financial statement and tax purposes; these differences will reverse at some time in the future. Differences in classification may also result from the treatment of short-term gains as ordinary income for tax purposes.
Realized and unrealized gains (losses) on certain of the fund’s swap contracts are treated as ordinary income (loss) for tax purposes; the effect on the fund’s income dividends to shareholders is offset by a change in principal return. Realized gains of $8,944,000 on swap contracts have been reclassified from accumulated net realized losses to overdistributed net investment income.
During the six months ended July 31, 2012, the fund realized $135,678,000 of net capital gains resulting from in-kind redemptions—in which shareholders exchanged fund shares for securities held by the fund rather than for cash. Because such gains are not taxable to the fund, and are not distributed to shareholders, they have been reclassified from accumulated net realized losses to paid-in capital.
The fund’s tax-basis capital gains and losses are determined only at the end of each fiscal year. For tax purposes, at January 31, 2012, the fund had available capital loss carryforwards totaling $426,316,000 to offset future net capital gains. Of this amount, $73,864,000 is subject to expiration on January 31, 2018. Capital losses of $352,452,000 realized beginning in fiscal 2012 may be carried forward indefinitely but must be used before any expiring loss carryforwards. The fund will use these
21
REIT Index Fund
capital losses to offset net taxable capital gains, if any, realized during the year ending January 31, 2013; should the fund realize net capital losses for the year, the losses will be added to the loss carryforward balance above.
At July 31, 2012, the cost of investment securities for tax purposes was $22,346,599,000. Net unrealized appreciation of investment securities for tax purposes was $5,034,787,000, consisting of unrealized gains of $5,840,712,000 on securities that had risen in value since their purchase and $805,925,000 in unrealized losses on securities that had fallen in value since their purchase.
F. During the six months ended July 31, 2012, the fund purchased $4,268,850,000 of investment securities and sold $1,190,657,000 of investment securities, other than temporary cash investments.
G. Capital share transactions for each class of shares were:
| | | | |
| | Six Months Ended | | Year Ended |
| | | July 31, 2012 | January 31, 2012 |
| | Amount | Shares | Amount | Shares |
| | ($000) | (000) | ($000) | (000) |
| Investor Shares | | | | |
| Issued | 343,192 | 16,277 | 616,468 | 31,976 |
| Issued in Lieu of Cash Distributions | 38,770 | 1,862 | 83,897 | 4,515 |
| Redeemed1 | (338,580) | (16,038) | (979,917) | (51,365) |
| Net Increase (Decrease)—Investor Shares | 43,382 | 2,101 | (279,552) | (14,874) |
| Admiral Shares | | | | |
| Issued | 580,551 | 6,416 | 931,513 | 11,395 |
| Issued in Lieu of Cash Distributions | 84,997 | 956 | 158,554 | 1,998 |
| Redeemed1 | (307,475) | (3,408) | (600,099) | (7,419) |
| Net Increase (Decrease)—Admiral Shares | 358,073 | 3,964 | 489,968 | 5,974 |
| Signal Shares | | | | |
| Issued | 364,702 | 15,160 | 566,444 | 25,739 |
| Issued in Lieu of Cash Distributions | 18,524 | 781 | 31,742 | 1,500 |
| Redeemed1 | (219,009) | (9,122) | (289,513) | (13,351) |
| Net Increase (Decrease)—Signal Shares | 164,217 | 6,819 | 308,673 | 13,888 |
| Institutional Shares | | | | |
| Issued | 353,405 | 25,395 | 805,740 | 64,220 |
| Issued in Lieu of Cash Distributions | 35,953 | 2,614 | 60,743 | 4,947 |
| Redeemed1 | (201,361) | (14,425) | (329,659) | (26,151) |
| Net Increase (Decrease)—Institutional Shares | 187,997 | 13,584 | 536,824 | 43,016 |
| ETF Shares | | | | |
| Issued | 2,768,023 | 43,451 | 2,952,696 | 50,521 |
| Issued in Lieu of Cash Distributions | — | — | — | — |
| Redeemed1 | (301,412) | (4,800) | (1,270,170) | (23,100) |
| Net Increase (Decrease)—ETF Shares | 2,466,611 | 38,651 | 1,682,526 | 27,421 |
1 Net of redemption fees for fiscal 2013 and 2012 of $490,000 and $2,201,000, respectively (fund totals). Effective May 23, 2012, the redemption fee was eliminated.
22
REIT Index Fund
H. Certain of the fund’s investments are in companies that are considered to be affiliated companies of the fund because the fund owns more than 5% of the outstanding voting securities of the company. Transactions during the period in securities of these companies were as follows:
| | | | | |
| | | | Current Period Transactions | |
| Jan. 31, 2012 | | Proceeds From | | July 31, 2012 |
| | Market | Purchases | Securities | Dividend | Market |
| | Value | at Cost | Sold | Income | Value |
| | ($000) | ($000) | ($000) | ($000) | ($000) |
| Acadia Realty Trust | 51,097 | 8,762 | 2,307 | 906 | 64,971 |
| Alexandria Real Estate Equities Inc. | 255,999 | 41,055 | 11,988 | 3,397 | 288,912 |
| American Campus Communities Inc. | 169,885 | 82,714 | 6,465 | 808 | 271,410 |
| Apartment Investment & | | | | | |
| Management Co. Class A | 169,368 | 69,322 | 8,723 | 260 | 251,013 |
| Ashford Hospitality Trust Inc. | NA1 | 9,108 | 622 | 530 | 31,250 |
| Associated Estates Realty Corp. | 39,638 | 12,398 | 1,567 | 869 | 46,115 |
| AvalonBay Communities Inc. | 730,160 | 128,794 | 33,595 | 6,589 | 888,761 |
| BioMed Realty Trust Inc. | 163,067 | 26,528 | 7,346 | 2,288 | 184,004 |
| Boston Properties Inc. | 872,582 | 145,106 | 36,251 | 8,138 | 1,043,599 |
| Brandywine Realty Trust | 82,324 | 18,658 | 3,485 | 2,227 | 107,608 |
| BRE Properties Inc. | 221,085 | 35,894 | 9,721 | 2,291 | 251,769 |
| Camden Property Trust | 286,927 | 48,591 | 11,767 | 3,372 | 356,632 |
| Campus Crest Communities Inc. | 18,730 | 7,395 | 748 | 427 | 26,125 |
| CapLease Inc. | 15,361 | 2,282 | 983 | 165 | 18,181 |
| CBL & Associates Properties Inc. | 139,759 | 23,757 | 6,923 | 3,738 | 176,481 |
| Cedar Realty Trust Inc. | NA1 | 2,498 | 617 | 216 | 18,894 |
| Chesapeake Lodging Trust | 29,717 | 6,347 | 1,095 | 822 | 34,600 |
| Cogdell Spencer Inc. | 11,770 | 623 | 12,394 | — | — |
| Colonial Properties Trust | 100,689 | 16,922 | 4,049 | 1,206 | 119,989 |
| Coresite Realty Corp. | 22,717 | 5,330 | 896 | 442 | 35,104 |
| Corporate Office Properties Trust | 99,468 | 15,247 | 4,372 | 1,630 | 101,694 |
| Cousins Properties Inc. | 39,291 | 6,272 | 1,577 | 349 | 45,148 |
| CubeSmart | 73,791 | 14,099 | 3,750 | 937 | 88,233 |
| DCT Industrial Trust Inc. | 77,573 | 13,230 | 3,551 | 1,021 | 98,162 |
| DiamondRock Hospitality Co. | 100,713 | 28,639 | 4,438 | 1,445 | 112,826 |
| Digital Realty Trust Inc. | 401,986 | 159,227 | 16,296 | 9,340 | 595,871 |
| Douglas Emmett Inc. | 144,724 | 39,051 | 6,026 | — | 197,868 |
| Duke Realty Corp. | 193,225 | 36,641 | 7,988 | 1,658 | 237,717 |
| DuPont Fabros Technology Inc. | 90,899 | 14,736 | 3,642 | 1,040 | 107,571 |
| EastGroup Properties Inc. | 73,381 | 14,324 | 3,039 | 1,359 | 94,558 |
| Education Realty Trust Inc. | 55,041 | 10,103 | 2,653 | 114 | 68,280 |
| Entertainment Properties Trust | 118,450 | 18,932 | 5,302 | 2,946 | 133,918 |
| Equity Lifestyle Properties Inc. | 154,795 | 25,171 | 5,610 | 1,793 | 179,068 |
| Equity Residential | 1,007,899 | 172,325 | 40,654 | 5,396 | 1,206,319 |
23
REIT Index Fund
| | | | | |
| | | | Current Period Transactions | |
| Jan. 31, 2012 | | Proceeds From | | July 31, 2012 |
| | Market | Purchases | Securities | Dividend | Market |
| | Value | at Cost | Sold | Income | Value |
| | ($000) | ($000) | ($000) | ($000) | ($000) |
| Essex Property Trust Inc. | 277,977 | 53,336 | 10,990 | 3,457 | 347,645 |
| Excel Trust Inc. | 21,309 | 4,053 | 1,140 | 581 | 23,515 |
| Extra Space Storage Inc. | 134,550 | 37,138 | 7,158 | 2,249 | 201,422 |
| Federal Realty Investment Trust | 338,666 | 60,954 | 15,500 | 4,882 | 439,080 |
| FelCor Lodging Trust Inc. | 25,751 | 4,358 | 1,129 | — | 36,353 |
| First Industrial Realty Trust Inc. | 53,925 | 9,094 | 2,640 | — | 66,535 |
| First Potomac Realty Trust | 42,540 | 5,720 | 1,465 | 815 | 36,992 |
| Franklin Street Properties Corp. | 42,644 | 7,578 | 1,801 | 1,121 | 49,124 |
| Getty Realty Corp. | NA1 | 3,873 | 1,027 | 205 | 31,484 |
| Glimcher Realty Trust | 59,069 | 28,552 | 3,321 | 348 | 86,739 |
| Government Properties Income Trust | NA1 | 7,883 | 2,191 | 1,894 | 54,706 |
| HCP Inc. | 976,956 | 154,987 | 40,685 | 14,155 | 1,226,958 |
| Health Care REIT Inc. | 619,795 | 169,065 | 30,500 | 9,837 | 830,440 |
| Healthcare Realty Trust Inc. | 93,613 | 15,657 | 4,474 | 1,122 | 121,491 |
| Hersha Hospitality Trust Class A | 47,394 | 16,569 | 2,307 | 295 | 55,056 |
| Highwoods Properties Inc. | 136,758 | 22,112 | 6,026 | 1,919 | 156,194 |
| Home Properties Inc. | 162,439 | 28,285 | 7,181 | 1,963 | 201,407 |
| Host Hotels & Resorts Inc. | 661,904 | 103,294 | 29,324 | 5,573 | 659,187 |
| Inland Real Estate Corp. | 43,369 | 6,795 | 1,787 | 1,141 | 45,089 |
| Investors Real Estate Trust | 34,434 | 6,445 | 1,194 | 372 | 43,530 |
| Kilroy Realty Corp. | 138,935 | 51,670 | 6,923 | 374 | 205,348 |
| Kimco Realty Corp. | 424,002 | 70,270 | 20,892 | 6,665 | 503,389 |
| Kite Realty Group Trust | 17,237 | 2,708 | 769 | 22 | 19,209 |
| LaSalle Hotel Properties | 131,385 | 23,626 | 7,324 | 1,607 | 142,708 |
| Lexington Realty Trust | 69,756 | 11,096 | 4,321 | 1,426 | 79,349 |
| Liberty Property Trust | 219,807 | 37,908 | 9,610 | 5,389 | 268,441 |
| LTC Properties Inc. | 55,337 | 9,040 | 2,486 | 1,372 | 68,880 |
| Macerich Co. | 408,910 | 69,510 | 20,403 | 2,075 | 489,279 |
| Mack-Cali Realty Corp. | 142,918 | 22,627 | 5,396 | 3,908 | 149,275 |
| Medical Properties Trust Inc. | 68,359 | 23,850 | 2,730 | 1,557 | 84,561 |
| Mid-America Apartment |
| Communities Inc. | 135,528 | 36,333 | 5,508 | 2,202 | 178,680 |
| Monmouth Real Estate |
| Investment Corp. Class A | NA1 | 4,171 | 369 | 517 | 22,546 |
| National Health Investors Inc. | NA1 | 10,726 | 3,003 | 1,722 | 80,469 |
| National Retail Properties Inc. | 159,430 | 25,887 | 7,651 | 4,115 | 193,580 |
| Omega Healthcare Investors Inc. | 122,651 | 20,420 | 4,956 | 3,487 | 159,833 |
| Parkway Properties Inc. | 12,200 | 1,962 | 535 | 101 | 15,537 |
24
REIT Index Fund
| | | | | |
| | | | Current Period Transactions | |
| | Jan. 31, 2012 | | Proceeds From | | July 31, 2012 |
| | Market | Purchases | Securities | Dividend | Market |
| | Value | at Cost | Sold | Income | Value |
| | ($000) | ($000) | ($000) | ($000) | ($000) |
| Pebblebrook Hotel Trust | 64,445 | 18,799 | 3,043 | 783 | 81,782 |
| Pennsylvania REIT | 37,104 | 6,706 | 1,857 | 983 | 48,197 |
| Piedmont Office Realty Trust Inc. | | | | | |
| Class A | 182,718 | 27,408 | 8,255 | 3,170 | 186,902 |
| Post Properties Inc. | 128,765 | 28,789 | 5,242 | 140 | 174,506 |
| Prologis Inc. | 830,882 | 141,671 | 41,512 | 10,884 | 942,173 |
| PS Business Parks Inc. | NA1 | 11,784 | 5,208 | 1,021 | 82,828 |
| Public Storage | NA1 | 185,099 | 50,693 | 19,235 | 1,376,270 |
| Ramco-Gershenson | | | | | |
| Properties Trust | 25,476 | 9,407 | 1,214 | 595 | 36,731 |
| Realty Income Corp. | 276,781 | 47,744 | 13,868 | 5,373 | 348,757 |
| Regency Centers Corp. | 212,068 | 36,763 | 10,931 | 2,096 | 273,073 |
| Retail Opportunity | | | | | |
| Investments Corp. | 32,989 | 5,590 | 1,089 | 649 | 38,419 |
| RLJ Lodging Trust | 97,453 | 15,825 | 4,652 | 1,910 | 106,835 |
| Sabra Health Care REIT Inc. | 29,943 | 5,197 | 1,370 | 1,368 | 43,334 |
| Simon Property Group Inc. | 2,276,966 | 415,154 | 97,352 | 28,604 | 3,032,534 |
| SL Green Realty Corp. | 358,736 | 63,162 | 16,289 | 2,610 | 431,643 |
| Sovran Self Storage Inc. | 73,570 | 15,992 | 3,016 | 1,023 | 104,976 |
| Strategic Hotels & Resorts Inc. | NA1 | 14,107 | 2,590 | — | 62,108 |
| Summit Hotel Properties Inc. | 14,567 | 1,995 | 529 | 367 | 14,369 |
| Sun Communities Inc. | 56,230 | 10,609 | 2,334 | 443 | 74,299 |
| Sunstone Hotel Investors Inc. | 62,766 | 22,278 | 3,113 | — | 86,170 |
| Tanger Factory Outlet Centers | 144,685 | 32,275 | 5,777 | 2,024 | 185,514 |
| Taubman Centers Inc. | 221,511 | 39,063 | 10,892 | 2,201 | 285,625 |
| UDR Inc. | 325,415 | 120,755 | 13,228 | 3,717 | 442,864 |
| Universal Health Realty | | | | | |
| Income Trust | 27,415 | 4,240 | 1,083 | 591 | 33,251 |
| Ventas Inc. | 958,394 | 155,226 | 42,908 | 20,037 | 1,233,053 |
| Vornado Realty Trust | 766,367 | 127,635 | 35,242 | 5,914 | 882,690 |
| Washington REIT | 112,317 | 17,498 | 4,630 | 2,257 | 112,294 |
| Weingarten Realty Investors | 159,043 | 27,119 | 8,050 | 3,269 | 195,843 |
| Winthrop Realty Trust | 20,230 | 2,995 | 744 | 559 | 22,949 |
| | 19,388,495 | | | 278,010 | 25,796,671 |
| 1 Not applicable—At January 31, 2012, the issuer was not an affiliated company of the fund. | | |
I. In preparing the financial statements as of July 31, 2012, management considered the impact of subsequent events for potential recognition or disclosure in these financial statements.
25
About Your Fund’s Expenses
As a shareholder of the fund, you incur ongoing costs, which include costs for portfolio management, administrative services, and shareholder reports (like this one), among others. Operating expenses, which are deducted from a fund’s gross income, directly reduce the investment return of the fund.
A fund’s expenses are expressed as a percentage of its average net assets. This figure is known as the expense ratio. The following examples are intended to help you understand the ongoing costs (in dollars) of investing in your fund and to compare these costs with those of other mutual funds. The examples are based on an investment of $1,000 made at the beginning of the period shown and held for the entire period.
The accompanying table illustrates your fund’s costs in two ways:
• Based on actual fund return. This section helps you to estimate the actual expenses that you paid over the period. The ”Ending Account Value“ shown is derived from the fund‘s actual return, and the third column shows the dollar amount that would have been paid by an investor who started with $1,000 in the fund. You may use the information here, together with the amount you invested, to estimate the expenses that you paid over the period.
To do so, simply divide your account value by $1,000 (for example, an $8,600 account value divided by $1,000 = 8.6), then multiply the result by the number given for your fund under the heading ”Expenses Paid During Period.“
• Based on hypothetical 5% yearly return. This section is intended to help you compare your fund‘s costs with those of other mutual funds. It assumes that the fund had a yearly return of 5% before expenses, but that the expense ratio is unchanged. In this case—because the return used is not the fund’s actual return—the results do not apply to your investment. The example is useful in making comparisons because the Securities and Exchange Commission requires all mutual funds to calculate expenses based on a 5% return. You can assess your fund’s costs by comparing this hypothetical example with the hypothetical examples that appear in shareholder reports of other funds.
Note that the expenses shown in the table are meant to highlight and help you compare ongoing costs only and do not reflect transaction costs incurred by the fund for buying and selling securities. Further, the expenses do not include any purchase, redemption, or account service fees described in the fund prospectus. If such fees were applied to your account, your costs would be higher. Your fund does not carry a “sales load.”
The calculations assume no shares were bought or sold during the period. Your actual costs may have been higher or lower, depending on the amount of your investment and the timing of any purchases or redemptions.
You can find more information about the fund’s expenses, including annual expense ratios, in the Financial Statements section of this report. For additional information on operating expenses and other shareholder costs, please refer to your fund’s current prospectus.
26
| | | |
| Six Months Ended July 31, 2012 | | | |
| | Beginning | Ending | Expenses |
| | Account Value | Account Value | Paid During |
| REIT Index Fund | 1/31/2012 | 7/31/2012 | Period |
| Based on Actual Fund Return | | | |
| Investor Shares | $1,000.00 | $1,098.85 | $1.25 |
| Admiral Shares | 1,000.00 | 1,099.75 | 0.52 |
| Signal Shares | 1,000.00 | 1,099.86 | 0.52 |
| Institutional Shares | 1,000.00 | 1,099.75 | 0.42 |
| ETF Shares | 1,000.00 | 1,099.79 | 0.52 |
| Based on Hypothetical 5% Yearly Return | | | |
| Investor Shares | $1,000.00 | $1,023.67 | $1.21 |
| Admiral Shares | 1,000.00 | 1,024.37 | 0.50 |
| Signal Shares | 1,000.00 | 1,024.37 | 0.50 |
| Institutional Shares | 1,000.00 | 1,024.47 | 0.40 |
| ETF Shares | 1,000.00 | 1,024.37 | 0.50 |
The calculations are based on expenses incurred in the most recent six-month period. The fund’s annualized six-month expense ratios for that period are 0.24% for Investor Shares, 0.10% for Admiral Shares, 0.10% for Signal Shares, 0.08% for Institutional Shares, and 0.10% for ETF Shares. The dollar amounts shown as “Expenses Paid” are equal to the annualized expense ratio multiplied by the average account value over the period, multiplied by the number of days in the most recent six-month period, then divided by the number of days in the most recent 12-month period.
27
Trustees Approve Advisory Arrangement
The board of trustees of Vanguard REIT Index Fund has renewed the fund’s investment advisory arrangement with The Vanguard Group, Inc. Vanguard—through its Equity Investment Group—serves as the investment advisor for the fund. The board determined that continuing the fund’s internalized management structure was in the best interests of the fund and its shareholders.
The board based its decision upon an evaluation of the advisor’s investment staff, portfolio management process, and performance. The trustees considered the factors discussed below, among others. However, no single factor determined whether the board approved the arrangement. Rather, it was the totality of the circumstances that drove the board’s decision.
Nature, extent, and quality of services
The board considered the quality of the fund’s investment management over both the short and long term, and took into account the organizational depth and stability of the advisor. The board noted that Vanguard has been managing investments for more than three decades. The Equity Investment Group adheres to a sound, disciplined investment management process; the team has considerable experience, stability, and depth.
The board concluded that Vanguard’s experience, stability, depth, and performance, among other factors, warranted continuation of the advisory arrangement.
Investment performance
The board considered the short- and long-term performance of the fund, including any periods of outperformance or underperformance of its target index and peer group. The board concluded that the fund has performed in line with expectations, and that its results have been consistent with its investment strategy. Information about the fund’s most recent performance can be found in the Performance Summary section of this report.
Cost
The board concluded that the fund’s expense ratio was well below the average expense ratio charged by funds in its peer group and that the fund’s advisory fee rate was also well below its peer-group average. Information about the fund’s expenses appears in the About Your Fund’s Expenses section of this report as well as in the Financial Statements section.
The board does not conduct a profitability analysis of Vanguard, because of Vanguard’s unique “at-cost” structure. Unlike most other mutual fund management companies, Vanguard is owned by the funds it oversees, and produces “profits” only in the form of reduced expenses for fund shareholders.
The benefit of economies of scale
The board concluded that the fund’s low-cost arrangement with Vanguard ensures that the fund will realize economies of scale as it grows, with the cost to shareholders declining as the fund’s assets increase.
The board will consider whether to renew the advisory arrangement again after a one-year period.
28
Glossary
Beta. A measure of the magnitude of a fund’s past share-price fluctuations in relation to the ups and downs of a given market index. The index is assigned a beta of 1.00. Compared with a given index, a fund with a beta of 1.20 typically would have seen its share price rise or fall by 12% when the index rose or fell by 10%. For this report, beta is based on returns over the past 36 months for both the fund and the index. Note that a fund’s beta should be reviewed in conjunction with its R-squared (see definition). The lower the R-squared, the less correlation there is between the fund and the index, and the less reliable beta is as an indicator of volatility.
Dividend Yield. Dividend income earned by stocks, expressed as a percentage of the aggregate market value (or of net asset value, for a fund). The yield is determined by dividing the amount of the annual dividends by the aggregate value (or net asset value) at the end of the period. For a fund, the dividend yield is based solely on stock holdings and does not include any income produced by other investments. This yield may include some payments that represent a return of capital, capital gains distributions, or both by the underlying stocks.
Earnings Growth Rate. The average annual rate of growth in earnings over the past five years for the stocks now in a fund.
Expense Ratio. A fund’s total annual operating expenses expressed as a percentage of the fund’s average net assets. The expense ratio includes management and administrative expenses, but does not include the transaction costs of buying and selling portfolio securities.
Foreign Holdings. The percentage of a fund represented by securities or depositary receipts of companies based outside the United States.
Inception Date. The date on which the assets of a fund (or one of its share classes) are first invested in accordance with the fund’s investment objective. For funds with a subscription period, the inception date is the day after that period ends. Investment performance is measured from the inception date.
Median Market Cap. An indicator of the size of companies in which a fund invests; the midpoint of market capitalization (market price x shares outstanding) of a fund’s stocks, weighted by the proportion of the fund’s assets invested in each stock. Stocks representing half of the fund’s assets have market capitalizations above the median, and the rest are below it.
Price/Book Ratio. The share price of a stock divided by its net worth, or book value, per share. For a fund, the weighted average price/book ratio of the stocks it holds.
Price/Earnings Ratio. The ratio of a stock’s current price to its per-share earnings over the past year. For a fund, the weighted average P/E of the stocks it holds. P/E is an indicator of market expectations about corporate prospects; the higher the P/E, the greater the expectations for a company’s future growth.
R-Squared. A measure of how much of a fund’s past returns can be explained by the returns from the market in general, as measured by a given index. If a fund’s total returns were precisely synchronized with an index’s returns, its R-squared would be 1.00. If the fund’s returns bore no relationship to the index’s returns, its R-squared would be 0. For this report, R-squared is based on returns over the past 36 months for both the fund and the index.
29
Return on Equity. The annual average rate of return generated by a company during the past five years for each dollar of shareholder’s equity (net income divided by shareholder’s equity). For a fund, the weighted average return on equity for the companies whose stocks it holds.
Short-Term Reserves. The percentage of a fund invested in highly liquid, short-term securities that can be readily converted to cash.
Turnover Rate. An indication of the fund’s trading activity. Funds with high turnover rates incur higher transaction costs and may be more likely to distribute capital gains (which may be taxable to investors). The turnover rate excludes in-kind transactions, which have minimal impact on costs.
30
This page intentionally left blank.
The People Who Govern Your Fund
The trustees of your mutual fund are there to see that the fund is operated and managed in your best interests since, as a shareholder, you are a part owner of the fund. Your fund’s trustees also serve on the board of directors of The Vanguard Group, Inc., which is owned by the Vanguard funds and provides services to them on an at-cost basis.
A majority of Vanguard’s board members are independent, meaning that they have no affiliation with Vanguard or the funds they oversee, apart from the sizable personal investments they have made as private individuals. The independent board members have distinguished backgrounds in business, academia, and public service. Each of the trustees and executive officers oversees 179 Vanguard funds.
The following table provides information for each trustee and executive officer of the fund. More information about the trustees is in the Statement of Additional Information, which can be obtained, without charge, by contacting Vanguard at 800-662-7447, or online at vanguard.com.
| |
| InterestedTrustee1 | and Delphi Automotive LLP (automotive components); |
| | Senior Advisor at New Mountain Capital; Trustee of |
| F. William McNabb III | The Conference Board. |
| Born 1957. Trustee Since July 2009. Chairman of the | |
| Board. Principal Occupation(s) During the Past Five | Amy Gutmann |
| Years: Chairman of the Board of The Vanguard Group, | Born 1949. Trustee Since June 2006. Principal |
| Inc., and of each of the investment companies served | Occupation(s) During the Past Five Years: President |
| by The Vanguard Group, since January 2010; Director | of the University of Pennsylvania; Christopher H. |
| of The Vanguard Group since 2008; Chief Executive | Browne Distinguished Professor of Political Science |
| Officer and President of The Vanguard Group and of | in the School of Arts and Sciences with secondary |
| each of the investment companies served by The | appointments at the Annenberg School for |
| Vanguard Group since 2008; Director of Vanguard | Communication and the Graduate School of Education |
| Marketing Corporation; Managing Director of The | of the University of Pennsylvania; Member of the |
| Vanguard Group (1995–2008). | National Commission on the Humanities and Social |
| | Sciences; Trustee of Carnegie Corporation of New |
| | York and of the National Constitution Center; Chair |
| of the U. S. Presidential Commission for the Study |
| IndependentTrustees | of Bioethical Issues. |
| |
| Emerson U. Fullwood | |
| Born 1948. Trustee Since January 2008. Principal | JoAnn Heffernan Heisen |
| Occupation(s) During the Past Five Years: Executive | Born 1950. Trustee Since July 1998. Principal |
| Chief Staff and Marketing Officer for North America | Occupation(s) During the Past Five Years: Corporate |
| and Corporate Vice President (retired 2008) of Xerox | Vice President and Chief Global Diversity Officer |
| Corporation (document management products and | (retired 2008) and Member of the Executive |
| services); Executive in Residence and 2010 | Committee (1997–2008) of Johnson & Johnson |
| Distinguished Minett Professor at the Rochester | (pharmaceuticals/medical devices/consumer |
| Institute of Technology; Director of SPX Corporation | products); Director of Skytop Lodge Corporation |
| (multi-industry manufacturing), the United Way of | (hotels), the University Medical Center at Princeton, |
| Rochester, Amerigroup Corporation (managed health | the Robert Wood Johnson Foundation, and the Center |
| care), the University of Rochester Medical Center, | for Talent Innovation; Member of the Advisory Board |
| Monroe Community College Foundation, and North | of the Maxwell School of Citizenship and Public Affairs |
| Carolina A&T University. | at Syracuse University. |
| | |
| |
| Rajiv L. Gupta | F. Joseph Loughrey |
| Born 1945. Trustee Since December 2001.2 | Born 1949. Trustee Since October 2009. Principal |
| Principal Occupation(s) During the Past Five Years: | Occupation(s) During the Past Five Years: President |
| Chairman and Chief Executive Officer (retired 2009) | and Chief Operating Officer (retired 2009) of Cummins |
| and President (2006–2008) of Rohm and Haas Co. | Inc. (industrial machinery); Director of SKF AB |
| (chemicals); Director of Tyco International, Ltd. | (industrial machinery), Hillenbrand, Inc. (specialized |
| (diversified manufacturing and services), Hewlett- | consumer services), the Lumina Foundation for |
| Packard Co. (electronic computer manufacturing), | |
| | |
| Education, and Oxfam America; Chairman of the | Executive Officers | |
| Advisory Council for the College of Arts and Letters | | |
| and Member of the Advisory Board to the Kellogg | Glenn Booraem | |
| Institute for International Studies at the University | Born 1967. Controller Since July 2010. Principal |
| of Notre Dame. | Occupation(s) During the Past Five Years: Principal |
| | of The Vanguard Group, Inc.; Controller of each of |
| Mark Loughridge | the investment companies served by The Vanguard |
| Born 1953. Trustee Since March 2012. Principal | Group; Assistant Controller of each of the investment |
| Occupation(s) During the Past Five Years: Senior Vice | companies served by The Vanguard Group (2001–2010). |
| President and Chief Financial Officer at IBM (information | | |
| technology services); Fiduciary Member of IBM’s | Thomas J. Higgins | |
| Retirement Plan Committee. | Born 1957. Chief Financial Officer Since September |
| | 2008. Principal Occupation(s) During the Past Five |
| Scott C. Malpass | Years: Principal of The Vanguard Group, Inc.; Chief |
| Born 1962. Trustee Since March 2012. Principal | Financial Officer of each of the investment companies |
| Occupation(s) During the Past Five Years: Chief | served by The Vanguard Group; Treasurer of each of |
| Investment Officer and Vice President at the University | the investment companies served by The Vanguard |
| of Notre Dame; Assistant Professor of Finance at the | Group (1998–2008). | |
| Mendoza College of Business at Notre Dame; Member | | |
| of the Notre Dame 403(b) Investment Committee; | Kathryn J. Hyatt | |
| Director of TIFF Advisory Services, Inc. (investment | Born 1955. Treasurer Since November 2008. Principal |
| advisor); Member of the Investment Advisory | Occupation(s) During the Past Five Years: Principal of |
| Committees of the Financial Industry Regulatory | The Vanguard Group, Inc.; Treasurer of each of the |
| Authority (FINRA) and of Major League Baseball. | investment companies served by The Vanguard |
| | Group; Assistant Treasurer of each of the investment |
| André F. Perold | companies served by The Vanguard Group (1988–2008). |
| Born 1952. Trustee Since December 2004. Principal | | |
| Occupation(s) During the Past Five Years: George | Heidi Stam | |
| Gund Professor of Finance and Banking at the Harvard | Born 1956. Secretary Since July 2005. Principal |
| Business School (retired 2011); Chief Investment | Occupation(s) During the Past Five Years: Managing |
| Officer and Managing Partner of HighVista Strategies | Director of The Vanguard Group, Inc.; General Counsel |
| LLC (private investment firm); Director of Rand | of The Vanguard Group; Secretary of The Vanguard |
| Merchant Bank; Overseer of the Museum of Fine | Group and of each of the investment companies |
| Arts Boston. | served by The Vanguard Group; Director and Senior |
| | Vice President of Vanguard Marketing Corporation. |
| Alfred M. Rankin, Jr. | | |
| Born 1941. Trustee Since January 1993. Principal | Vanguard Senior ManagementTeam |
| Occupation(s) During the Past Five Years: Chairman, | | |
| President, and Chief Executive Officer of NACCO | Mortimer J. Buckley | Michael S. Miller |
| Industries, Inc. (forklift trucks/housewares/lignite); | Kathleen C. Gubanich | James M. Norris |
| Director of Goodrich Corporation (industrial products/ | Paul A. Heller | Glenn W. Reed |
| aircraft systems and services) and the National | Martha G. King | George U. Sauter |
| Association of Manufacturers; Chairman of the Board | Chris D. McIsaac | |
| of the Federal Reserve Bank of Cleveland and of | | |
| University Hospitals of Cleveland; Advisory Chairman | | |
| of the Board of The Cleveland Museum of Art. | Chairman Emeritus and Senior Advisor |
| John J. Brennan | |
| Peter F. Volanakis | Chairman, 1996–2009 | |
| Born 1955. Trustee Since July 2009. Principal | Chief Executive Officer and President, 1996–2008 |
| Occupation(s) During the Past Five Years: President | | |
| and Chief Operating Officer (retired 2010) of Corning | | |
| Incorporated (communications equipment); Director | Founder | |
| of SPX Corporation (multi-industry manufacturing); | John C. Bogle | |
| Overseer of the Amos Tuck School of Business | Chairman and Chief Executive Officer, 1974–1996 |
| Administration at Dartmouth College; Advisor to the | |
| Norris Cotton Cancer Center. | |
1 Mr. McNabb is considered an “interested person,” as defined in the Investment Company Act of 1940, because he is an officer of the Vanguard funds.
2 December 2002 for Vanguard Equity Income Fund, Vanguard Growth Equity Fund, the Vanguard Municipal Bond Funds, and the Vanguard State Tax-Exempt Funds.
|  |
| P.O. Box 2600 |
| Valley Forge, PA 19482-2600 |
Connect with Vanguard® > vanguard.com
| The funds or securities referred to herein are not |
| Fund Information > 800-662-7447 | sponsored, endorsed, or promoted by MSCI, and MSCI |
| Direct Investor Account Services > 800-662-2739 | bears no liability with respect to any such funds or |
| Institutional Investor Services > 800-523-1036 | securities. The prospectus or the Statement of |
| Text Telephone for People | Additional Information contains a more detailed |
| With Hearing Impairment > 800-749-7273 | description of the limited relationship MSCI has with |
| | Vanguard and any related funds. |
| This material may be used in conjunction | |
| with the offering of shares of any Vanguard | |
| fund only if preceded or accompanied by | |
| the fund’s current prospectus. | |
| |
| All comparative mutual fund data are from Lipper Inc. or | |
| Morningstar, Inc., unless otherwise noted. | |
| |
| You can obtain a free copy of Vanguard’s proxy voting | |
| guidelines by visiting vanguard.com/proxyreporting or by | |
| calling Vanguard at 800-662-2739. The guidelines are | |
| also available from the SEC’s website, sec.gov. In | |
| addition, you may obtain a free report on how your fund | |
| voted the proxies for securities it owned during the 12 | |
| months ended June 30. To get the report, visit either | |
| vanguard.com/proxyreporting or sec.gov. | |
| |
| You can review and copy information about your fund at | |
| the SEC’s Public Reference Room in Washington, D.C. To | |
| find out more about this public service, call the SEC at | |
| 202-551-8090. Information about your fund is also | |
| available on the SEC’s website, and you can receive | |
| copies of this information, for a fee, by sending a | |
| request in either of two ways: via e-mail addressed to | |
| publicinfo@sec.gov or via regular mail addressed to the | |
| Public Reference Section, Securities and Exchange | |
| Commission, Washington, DC 20549-1520. | |
| | © 2012 The Vanguard Group, Inc. |
| | All rights reserved. |
| | Vanguard Marketing Corporation, Distributor. |
| |
| | Q1232 092012 |
 |
| |
| Semiannual Report | July 31, 2012 |
| Vanguard Dividend Growth Fund |
> Vanguard Dividend Growth Fund returned 4.71% for the six months ended July 31, 2012.
> The fund’s return slightly exceeded that of the benchmark index as well as the average return of its large-capitalization core fund peers.
> Consumer staples stocks contributed most to the fund’s return.
| |
| Contents | |
| Your Fund’s Total Returns. | 1 |
| Chairman’s Letter. | 2 |
| Advisor’s Report. | 7 |
| Fund Profile. | 9 |
| Performance Summary. | 10 |
| Financial Statements. | 11 |
| About Your Fund’s Expenses. | 19 |
| Glossary. | 21 |
Please note: The opinions expressed in this report are just that—informed opinions. They should not be considered promises or advice. Also, please keep in mind that the information and opinions cover the period through the date on the front of this report. Of course, the risks of investing in your fund are spelled out in the prospectus.
See the Glossary for definitions of investment terms used in this report.
About the cover: Vanguard was named for the HMS Vanguard, flagship of British Admiral Horatio Nelson. A ship—whose performance and safety depend on the work of all hands—has served as a fitting metaphor for the Vanguard crew as we strive to help clients reach their financial goals.
Your Fund’s Total Returns
| |
| Six Months Ended July 31, 2012 | |
| | Total |
| | Returns |
| Vanguard Dividend Growth Fund | 4.71% |
| Dividend Achievers Select Index | 4.28 |
| Large-Cap Core Funds Average | 4.21 |
| Large-Cap Core Funds Average: Derived from data provided by Lipper Inc. |
| | | | |
| Your Fund’s Performance at a Glance | | | | |
| January 31, 2012, Through July 31, 2012 | | | | |
| | | | Distributions Per Share |
| | Starting | Ending | Income | Capital |
| | Share Price | Share Price | Dividends | Gains |
| Vanguard Dividend Growth Fund | $15.81 | $16.37 | $0.178 | $0.000 |
1

Chairman’s Letter
Dear Shareholder,
For the six months ended July 31, 2012, Vanguard Dividend Growth Fund returned 4.71%, outperforming its benchmark, the Dividend Achievers Select Index, as well as the average return for large-cap core funds. During the first half of the fiscal year, the fund’s dividend distribution increased by 14.8% over the same period a year earlier.
Stocks that deliver a high level of current income have been very much in favor with investors of late. Over the six months ended July 31, these high-yielding stocks generally outperformed the broader market. However, investors showed less interest in lower-yielding companies that are positioned to pay higher dividends in the future.
The Dividend Growth Fund focuses on high-quality, large-capitalization companies with strong potential for dividend growth. The fund isn’t focused on providing a high level of current dividend income.
U.S. stocks delivered solid gains; international equities slumped
U.S. stocks handily outperformed their international counterparts, returning about 5% for the six months ended July 31. Stocks of large companies fared best as investors seemed to be seeking stability amid the uncertainty surrounding Europe’s debt troubles.
International stocks were generally weak, with currency effects further hindering results for U.S.-based investors. Though European stocks posted a modest advance
2
in local-currency terms, their return was negative once converted into U.S. dollars—a result of the dollar’s strengthening against the euro during the six months. Signs of slowing economic growth hurt returns for emerging markets and the developed markets of the Pacific region.
Questions about the finances of European governments and banks continued to preoccupy investors, and global stock markets moved sharply up and down in response to the latest headlines. Although the situation in Europe is very fluid, Vanguard economists believe the most likely scenario is that the Eurozone will “muddle through” for several years, with occasional spikes in market volatility, as fiscal tightening continues in the face of weak economic growth.
Bonds kept up a steady advance as Treasury yields kept dwindling
U.S. Treasury securities stretched their gains during the period, as investors lost more of their appetite for risk. Bond prices moved higher, and the yield of the 10-year U.S. Treasury bill fell to a record low in July, closing below 1.5%. (Bond yields and prices move in opposite directions.) The broad U.S. taxable bond market posted a return of nearly 3%, and municipal bonds had about the same result for the six months.
Investors have enjoyed years of strong bond returns, but they shouldn’t be surprised if future results are weaker. As yields tumble, the scope for further declines—and price increases—diminishes.
| | | |
| Market Barometer | | | |
| |
| | | | Total Returns |
| | | Periods Ended July 31, 2012 |
| | Six | One | Five Years |
| | Months | Year | (Annualized) |
| Stocks | | | |
| Russell 1000 Index (Large-caps) | 5.54% | 7.96% | 1.26% |
| Russell 2000 Index (Small-caps) | -0.03 | 0.19 | 1.69 |
| Dow Jones U.S. Total Stock Market Index | 5.01 | 7.07 | 1.50 |
| MSCI All Country World Index ex USA (International) | -2.40 | -12.16 | -4.29 |
| |
| Bonds | | | |
| Barclays U.S. Aggregate Bond Index (Broad taxable | | | |
| market) | 2.88% | 7.25% | 6.91% |
| Barclays Municipal Bond Index (Broad tax-exempt | | | |
| market) | 2.93 | 10.51 | 6.12 |
| Citigroup Three-Month U.S. Treasury Bill Index | 0.04 | 0.05 | 0.79 |
| |
| CPI | | | |
| Consumer Price Index | 1.08% | 1.41% | 1.92% |
3
As it has since December 2008, the Federal Reserve Board held its target for the shortest-term interest rates between 0% and 0.25%, keeping a tight lid on the returns from money market funds and savings accounts.
Strong stock selection boosted the fund’s performance
As I mentioned, Vanguard Dividend Growth Fund finished the six-month period a few steps behind the broad U.S. stock market, but the fund’s performance was nevertheless solid.
The fund posted positive results in seven of its nine market sectors (it had no holdings in the telecommunication services sector during the period). Strong stock selection in several sectors added to the fund’s performance relative to the benchmark.
Stocks within the consumer staples sector contributed most to the overall return. This sector benefited from the market’s volatility during the period. The goods and services sold by consumer staples companies are typically things that consumers can’t do without, regardless of market conditions. For this reason, investors often consider stocks of these companies to be safer than others during volatile times. The sector added about 1.6 percentage points to the fund’s return.
Health care, the fund’s largest sector, was another key contributor. The advisor’s strong selections, especially among
| | |
| Expense Ratios | | |
| Your Fund Compared With Its Peer Group | | |
| | | Peer Group |
| | Fund | Average |
| Dividend Growth Fund | 0.31% | 1.19% |
The fund expense ratio shown is from the prospectus dated May 29, 2012, and represents estimated costs for the current fiscal year. For the six months ended July 31, 2012, the fund’s annualized expense ratio was 0.29%. The peer-group expense ratio is derived from data provided by Lipper Inc. and captures information through year-end 2011.
Peer group: Large-Cap Core Funds.
4
pharmaceuticals and biotechnology stocks, boosted performance compared with the benchmark.
Strong stock selection within the consumer discretionary sector also added to returns. The sector, which was hurt during the recession by a drastic falloff in consumer spending, has continued to benefit from a slow and at times uneven recovery in Americans’ purchases of discretionary items.
The industrial and energy sectors were the only ones in which the fund posted negative results. Its energy holdings turned in the poorest showing. The sector’s weakness can be attributed to a
|
| Dividends are bouncing back |
| During the financial crisis of 2008–2009, many companies slashed their dividend |
| payments in the face of plunging profits. But, in a welcome development for |
| investors, dividend payments have been rising over the last three years. |
| |
| As shown in the chart below, the aggregate dividend for companies in the |
| Standard & Poor’s 500 Index climbed to $7.45 per share for the second quarter |
| of 2012. That represents a 37% increase over the second quarter of 2009. |
| |
| The level of dividend payments is an indicator of corporate financial health, and, not |
| surprisingly, the recovery in dividend payments has followed a rebound in corporate |
| earnings. Still, the most recent quarterly figure for S&P 500 companies remains a bit |
| below the $7.62-per-share peak reached in late 2007. |
| |
| |
| Aggregate quarterly per-share dividends for S&P 500 Index companies (2007–2012) |
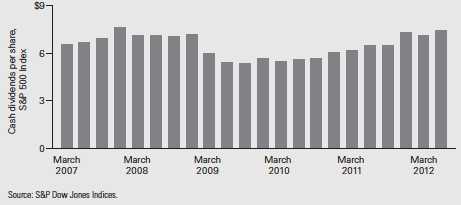 |
5
combination of factors, including the sharp decline in crude oil prices since March, historically low natural gas prices, and continued uncertainties about global economic growth. Poor stock selection among integrated oil and gas companies weighed on performance relative to the index.
Although returns from industrial stocks were also poor, your fund’s advisor managed to avoid some of the sector’s worst performers, which boosted results relative to the index.
The fund has traveled two paths during its first 20 years
In May, Vanguard Dividend Growth Fund celebrated its 20th anniversary. Longtime shareholders may recall that the fund began operations with a different name and a very different mandate.
Until 2002, the fund was a sector fund, Vanguard Utilities Income Fund, investing primarily in dividend-paying utility stocks. At that time, the fund’s trustees concluded that a decade of change in the sector and in the broader economy had diminished the investment merits of a utilities-focused fund.
The fund adopted a new strategy and a new name. What stayed constant was Vanguard’s partnership with Wellington Management Company, which has managed the fund since its inception. Wellington executed the original strategy with its customary skill and dedication, and then helped Vanguard to implement a new strategy that would better serve investors.
The new strategy has proved rewarding, and we salute Wellington Management for its efforts on behalf of the fund’s shareholders for the past two decades.
As always, thank you for entrusting your assets to Vanguard.
Sincerely,

F. William McNabb III
Chairman and Chief Executive Officer
August 14, 2012
6
Advisor’s Report
Vanguard Dividend Growth Fund gained 4.71% for the six months ended July 31, 2012, besting the 4.28% gain of the Dividend Achievers Select Index.
The investment environment
While our focus is on stock selection, we remain cognizant of macroeconomic developments across the global investing landscape. In that regard there are two things that worry us most right now. What will be the longer-term effects (unintended or otherwise) of this global liquidity injection that central banks have used to spur growth? The impact of the medicine has been modest, but the side effects may be far more dangerous.
We also worry about the risks that we cannot consider fully in this market environment and that are more difficult to predict and understand: geopolitical instability, global poverty and health concerns, challenging demographic trends, resource scarcity, terrorism, et cetera.
These all have a profound impact on the investment environment; however, there are too many other economic issues to worry about right now, notably the triple threats of a European calamity, a U.S. double-dip recession, and a hard landing in China.
The fund’s successes
On an absolute basis, all but two sectors enhanced the fund’s performance during the period, with holdings in the consumer staples, health care, and consumer discretionary sectors contributing the most. Some of the best results came from Target, Walt Disney, PepsiCo, and Amgen.
On a “run rate” basis, the current portfolio is expected to produce asset-weighted dividend growth of 17.4% for 2012 (the current portfolio produced dividend growth of 20.0% in calendar 2011). Our run-rate calculation is a rough estimate of potential dividend growth, as it merely takes a company’s current declared dividend rate, annualizes that rate, and compares it to the previous calendar year’s actual dividend rate. This calculation does not accurately reflect dividend increases that may be announced later in the year, nor does it take into account the actual dollar size of the increases. Therefore, companies in the early stages of dividend growth tend to show large percentage increases even though the absolute cash dividend may be small. Despite these shortcomings, we still view this estimate as a reasonable report card.
Among the more notable dividend run-rate increases thus far in 2012 were those by Western Union (29.0%) and Target (37.1%). Only two companies held in the fund have not yet announced any change in their expected dividend for 2012. In both cases, we expect increases.
The fund’s shortfalls
Industrials and energy were the only sectors that did not make a positive contribution to absolute performance. Within industrials, General Dynamics and C.H. Robinson Worldwide declined during the half-year. Energy holdings Occidental Petroleum and BG Group also had disappointing returns.
7
Other individual stocks that hurt the fund’s absolute performance included Western
Union, Nike, and McDonald’s. Although we would prefer to see all stocks in the fund perform well at all times, it is inevitable that some holdings will detract from performance over a given period. We assess a stock’s contribution to the fund over a longer time frame, always keeping an eye on dividend action. We expect the aforementioned three companies to raise their dividends meaningfully over the next five years.
The fund’s positioning and investment strategy
Our primary objective is to identify companies that we believe will steadily and reliably grow their dividend payments. We pursue this goal by carefully building the portfolio one stock at a time, giving central consideration to each company’s dividend growth prospects. Our industry weightings are an output of this process. As of the end of the period, the fund had significant positions in the health care, consumer discretionary, technology, and industrial sectors. It had less exposure to the utilities, telecommunication services, and materials sectors.
The most powerful force in investing is compounding—a mathematical law of nature that nobody can take credit for inventing. It is most powerful when steady income is combined with a stable and growing asset base. One of our principal tools in managing the fund is the power of compounding, so it is important not to limit that power. To say this another way, we are intent on preserving the value of the fund day to day, month to month, and year to year. Focusing on the dividend and the growth thereof is the best way to preserve and grow value over time.
Donald J. Kilbride
Senior Vice President and Equity Portfolio Manager
Wellington Management Company, LLP
August 10, 2012
8
Dividend Growth Fund
Fund Profile
As of July 31, 2012
| | | |
| Portfolio Characteristics | | |
| | | Dividend | DJ |
| | | Achievers | U.S. Total |
| | | Select | Market |
| | Fund | Index | Index |
| Number of Stocks | 49 | 132 | 3,684 |
| Median Market Cap | $58.0B | $40.9B | $34.4B |
| Price/Earnings Ratio | 14.8x | 15.1x | 15.7x |
| Price/Book Ratio | 2.8x | 3.1x | 2.2x |
| Return on Equity | 23.1% | 23.4% | 18.1% |
| Earnings Growth Rate | 7.0% | 7.3% | 9.6% |
| Dividend Yield | 2.6% | 2.4% | 2.1% |
| Foreign Holdings | 6.2% | 0.0% | 0.0% |
| Turnover Rate | | | |
| (Annualized) | 12% | — | — |
| Ticker Symbol | VDIGX | — | — |
| Expense Ratio1 | 0.31% | — | — |
| 30-Day SEC Yield | 2.21% | — | — |
| Short-Term Reserves | 3.8% | — | — |
| | | |
| Sector Diversification (% of equity exposure) |
| | | Dividend | DJ |
| | | Achievers | U.S. Total |
| | | Select | Market |
| | Fund | Index | Index |
| Consumer Discretionary | 15.1% | 14.4% | 11.8% |
| Consumer Staples | 13.2 | 25.6 | 10.0 |
| Energy | 12.4 | 10.2 | 10.3 |
| Financials | 8.6 | 6.0 | 15.8 |
| Health Care | 16.1 | 5.4 | 11.9 |
| Industrials | 15.0 | 21.1 | 10.7 |
| Information Technology | 14.3 | 6.5 | 19.0 |
| Materials | 3.7 | 8.8 | 3.8 |
| Telecommunication | | | |
| Services | 0.0 | 0.1 | 2.9 |
| Utilities | 1.6 | 1.9 | 3.8 |
| | |
| Volatility Measures | | |
| | | DJ |
| | Dividend | U.S. Total |
| | Growth | Market |
| | Spliced Index | Index |
| R-Squared | 0.96 | 0.92 |
| Beta | 0.94 | 0.74 |
These measures show the degree and timing of the fund’s fluctuations compared with the indexes over 36 months.
| | |
| Ten Largest Holdings (% of total net assets) |
| PepsiCo Inc. | Soft Drinks | 3.5% |
| Johnson & Johnson | Pharmaceuticals | 3.3 |
| Occidental Petroleum | Integrated Oil & | |
| Corp. | Gas | 3.3 |
| Target Corp. | General | |
| | Merchandise Stores | 3.2 |
| Exxon Mobil Corp. | Integrated Oil & | |
| | Gas | 3.0 |
| Automatic Data | Data Processing & | |
| Processing Inc. | Outsourced | |
| | Services | 3.0 |
| Microsoft Corp. | Systems Software | 2.6 |
| United Parcel Service | Air Freight & | |
| Inc. Class B | Logistics | 2.5 |
| Medtronic Inc. | Health Care | |
| | Equipment | 2.4 |
| International Business | IT Consulting & | |
| Machines Corp. | Other Services | 2.3 |
| Top Ten | | 29.1% |
The holdings listed exclude any temporary cash investments and equity index products.
Investment Focus
1 The expense ratio shown is from the prospectus dated May 29, 2012, and represents estimated costs for the current fiscal year. For the six months ended July 31, 2012, the annualized expense ratio was 0.29%.
9
Dividend Growth Fund
Performance Summary
All of the returns in this report represent past performance, which is not a guarantee of future results that may be achieved by the fund. (Current performance may be lower or higher than the performance data cited. For performance data current to the most recent month-end, visit our website at vanguard.com/performance.) Note, too, that both investment returns and principal value can fluctuate widely, so an investor’s shares, when sold, could be worth more or less than their original cost. The returns shown do not reflect taxes that a shareholder would pay on fund distributions or on the sale of fund shares.
Fiscal-Year Total Returns (%): January 31, 2002, Through July 31, 2012
Dividend Growth Spliced Index: Prior to December 6, 2002, the comparative benchmark was known as the Utilities Composite Index. The index weightings were: 40% S&P Utilities Index, 40% S&P Telephone Index, and 20% Lehman Brothers Utility Bond Index through April 30, 1999; 63.75% S&P Utilities Index, 21.25% S&P Telephone Index, and 15% Lehman Brothers Utility Bond Index through March 31, 2000; 75% S&P Utilities Index and 25% S&P Telephone Index through December 31, 2001; and 75% S&P Utilities Index and 25% S&P Integrated Telecommunication Services Index through December 6, 2002. The fund’s benchmark was the Russell 1000 Index through January 31, 2010, after which it was changed to the Dividend Achievers Select Index. The Dividend Achievers Select Index is administered exclusively for Vanguard by Mergent, Inc.
Note: Prior to December 6, 2002, the fund was known as the Utilities Income Fund. For 2013, performance data reflect the six months ended July 31, 2012.
Average Annual Total Returns: Periods Ended June 30, 2012
This table presents returns through the latest calendar quarter—rather than through the end of the fiscal period.
Securities and Exchange Commission rules require that we provide this information.
| | | | |
| | Inception | One | Five | Ten |
| | Date | Year | Years | Years |
| Dividend Growth Fund | 5/15/1992 | 7.53% | 3.25% | 6.30% |
See Financial Highlights for dividend and capital gains information.
10
Dividend Growth Fund
Financial Statements (unaudited)
Statement of Net Assets
As of July 31, 2012
The fund reports a complete list of its holdings in regulatory filings four times in each fiscal year, at the quarter-ends. For the second and fourth fiscal quarters, the lists appear in the fund’s semiannual and annual reports to shareholders. For the first and third fiscal quarters, the fund files the lists with the Securities and Exchange Commission on Form N-Q. Shareholders can look up the fund’s Forms N-Q on the SEC’s website at sec.gov. Forms N-Q may also be reviewed and copied at the SEC��s Public Reference Room (see the back cover of this report for further information).
| | |
| | | Market |
| | | Value |
| | Shares | ($000) |
| Common Stocks (95.9%) | | |
| Consumer Discretionary (14.5%) | |
| Target Corp. | 5,613,662 | 340,469 |
| Mattel Inc. | 5,558,615 | 195,496 |
| NIKE Inc. Class B | 2,061,646 | 192,455 |
| Walt Disney Co. | 3,797,955 | 186,632 |
| Lowe’s Cos. Inc. | 7,132,999 | 180,964 |
| McDonald’s Corp. | 1,898,070 | 169,612 |
| Omnicom Group Inc. | 3,217,757 | 161,467 |
| Comcast Corp. Class A | 4,076,602 | 132,693 |
| | | 1,559,788 |
| Consumer Staples (12.7%) | | |
| PepsiCo Inc. | 5,138,526 | 373,725 |
| Procter & Gamble Co. | 3,744,802 | 241,690 |
| Colgate-Palmolive Co. | 1,906,391 | 204,670 |
| CVS Caremark Corp. | 4,486,435 | 203,011 |
| Wal-Mart Stores Inc. | 2,541,029 | 189,129 |
| Coca-Cola Co. | 1,864,830 | 150,678 |
| | | 1,362,903 |
| Energy (11.9%) | | |
| Occidental Petroleum | | |
| Corp. | 4,034,835 | 351,152 |
| ExxonMobil Corp. | 3,692,083 | 320,657 |
| Enbridge Inc. | 5,276,632 | 215,603 |
| BG Group plc | 10,170,193 | 200,205 |
| Chevron Corp. | 1,746,639 | 191,397 |
| | | 1,279,014 |
| Financials (8.2%) | | |
| Wells Fargo & Co. | 6,691,342 | 226,234 |
| PNC Financial Services | | |
| Group Inc. | 3,672,059 | 217,019 |
| ACE Ltd. | 2,797,389 | 205,608 |
| Marsh & McLennan | | |
| Cos. Inc. | 3,578,985 | 118,858 |
| Chubb Corp. | 1,623,977 | 118,047 |
| | | 885,766 |
| | |
| | | Market |
| | | Value |
| | Shares | ($000) |
| Health Care (15.4%) | | |
| Johnson & Johnson | 5,172,382 | 358,032 |
| Medtronic Inc. | 6,651,141 | 262,188 |
| Roche Holding AG | 1,413,326 | 250,265 |
| Pfizer Inc. | 10,125,277 | 243,412 |
| Cardinal Health Inc. | 5,628,677 | 242,540 |
| Amgen Inc. | 2,522,584 | 208,365 |
| UnitedHealth Group Inc. | 1,868,130 | 95,443 |
| | | 1,660,245 |
| Industrials (14.4%) | | |
| United Parcel Service Inc. | | |
| Class B | 3,613,455 | 273,213 |
| Lockheed Martin Corp. | 2,435,266 | 217,396 |
| General Dynamics Corp. | 3,140,902 | 199,259 |
| Honeywell International | | |
| Inc. | 2,919,962 | 169,504 |
| C.H. Robinson | | |
| Worldwide Inc. | 3,031,410 | 160,210 |
| Northrop Grumman Corp. | 2,419,704 | 160,185 |
| United Technologies Corp. | 1,759,120 | 130,949 |
| Emerson Electric Co. | 2,638,535 | 126,043 |
| Waste Management Inc. | 3,166,316 | 108,921 |
| | | 1,545,680 |
| Information Technology (13.7%) | |
| Automatic Data | | |
| Processing Inc. | 5,620,656 | 317,848 |
| Microsoft Corp. | 9,533,512 | 280,952 |
| International Business | | |
| Machines Corp. | 1,284,232 | 251,684 |
| Oracle Corp. | 7,893,565 | 238,386 |
| Western Union Co. | 12,938,800 | 225,523 |
| Accenture plc Class A | 2,678,175 | 161,494 |
| | | 1,475,887 |
| Materials (3.5%) | | |
| Ecolab Inc. | 3,322,626 | 217,466 |
| Praxair Inc. | 1,553,076 | 161,147 |
| | | 378,613 |
11
Dividend Growth Fund
| | |
| | | Market |
| | | Value |
| | Shares | ($000) |
| Utilities (1.6%) | | |
| Dominion Resources Inc. | 3,144,416 | 170,773 |
| Total Common Stocks | | |
| (Cost $8,805,381) | | 10,318,669 |
| |
| | Face | |
| | Amount | |
| | ($000) | |
| Temporary Cash Investments (3.8%) | |
| Repurchase Agreements (3.8%) | |
| RBSSecurities, Inc. | | |
| 0.160%, 8/1/12 (Dated | | |
| 7/31/12, Repurchase | | |
| Value $253,301,000, | | |
| collateralized by | | |
| U.S. Treasury | | |
| 1.000%, 6/30/19) | 253,300 | 253,300 |
| Morgan Stanley & Co., | | |
| Inc. 0.190%, 8/1/12 (Dated | | |
| 7/31/12, Repurchase Value | | |
| $156,101,000, collateralized | | |
| by Federal National | | |
| Mortgage Assn. | | |
| 2.500%-5.000%, | | |
| 3/1/26-3/1/42) | 156,100 | 156,100 |
| | | 409,400 |
| Total Temporary Cash Investments | |
| (Cost $409,400) | | 409,400 |
| Total Investments (99.7%) | | |
| (Cost $9,214,781) | | 10,728,069 |
| Other Assets and Liabilities (0.3%) | |
| Other Assets | | 47,363 |
| Liabilities | | (19,983) |
| | | 27,380 |
| Net Assets (100%) | | |
| Applicable to 656,827,702 outstanding | |
| $.001 par value shares of beneficial | |
| interest (unlimited authorization) | 10,755,449 |
| Net Asset Value Per Share | | $16.37 |
| |
| At July 31, 2012, net assets consisted of: |
| | Amount |
| | ($000) |
| Paid-in Capital | 9,285,837 |
| Undistributed Net Investment Income | 3,606 |
| Accumulated Net Realized Losses | (47,213) |
| Unrealized Appreciation (Depreciation) | |
| Investment Securities | 1,513,288 |
| Foreign Currencies | (69) |
| Net Assets | 10,755,449 |
• See Note A in Notes to Financial Statements.
See accompanying Notes, which are an integral part of the Financial Statements.
12
Dividend Growth Fund
| |
| Statement of Operations | |
| |
| | SixMonths Ended |
| | July 31, 2012 |
| | ($000) |
| Investment Income | |
| Income | |
| Dividends1 | 124,848 |
| Interest | 291 |
| Security Lending | 311 |
| Total Income | 125,450 |
| Expenses | |
| Investment Advisory Fees—Note B | |
| Basic Fee | 5,177 |
| Performance Adjustment | (26) |
| The Vanguard Group—Note C | |
| Management and Administrative | 7,957 |
| Marketing and Distribution | 1,344 |
| Custodian Fees | 74 |
| Shareholders’ Reports | 66 |
| Trustees’ Fees and Expenses | 10 |
| Total Expenses | 14,602 |
| Net Investment Income | 110,848 |
| Realized Net Gain (Loss) | |
| Investment Securities Sold | 19,538 |
| Foreign Currencies | (97) |
| Realized Net Gain (Loss) | 19,441 |
| Change in Unrealized Appreciation (Depreciation) | |
| Investment Securities | 317,793 |
| Foreign Currencies | (69) |
| Change in Unrealized Appreciation (Depreciation) | 317,724 |
| Net Increase (Decrease) in Net Assets Resulting from Operations | 448,013 |
| 1 Dividends are net of foreign withholding taxes of $1,388,000. |
See accompanying Notes, which are an integral part of the Financial Statements.
13
Dividend Growth Fund
| | |
| Statement of Changes in Net Assets | | |
| |
| | Six Months Ended | Year Ended |
| | July 31, | January 31, |
| | 2012 | 2012 |
| | ($000) | ($000) |
| Increase (Decrease) in Net Assets | | |
| Operations | | |
| Net Investment Income | 110,848 | 139,217 |
| Realized Net Gain (Loss) | 19,441 | 43,067 |
| Change in Unrealized Appreciation (Depreciation) | 317,724 | 483,727 |
| Net Increase (Decrease) in Net Assets Resulting from Operations | 448,013 | 666,011 |
| Distributions | | |
| Net Investment Income | (113,706) | (135,265) |
| Realized Capital Gain | — | — |
| Total Distributions | (113,706) | (135,265) |
| Capital Share Transactions | | |
| Issued | 2,350,499 | 4,174,976 |
| Issued in Lieu of Cash Distributions | 99,573 | 117,021 |
| Redeemed | (857,633) | (989,177) |
| Net Increase (Decrease) from Capital Share Transactions | 1,592,439 | 3,302,820 |
| Total Increase (Decrease) | 1,926,746 | 3,833,566 |
| Net Assets | | |
| Beginning of Period | 8,828,703 | 4,995,137 |
| End of Period1 | 10,755,449 | 8,828,703 |
| 1 Net Assets—End of Period includes undistributed net investment income of $3,606,000 and $6,561,000. |
See accompanying Notes, which are an integral part of the Financial Statements.
14
Dividend Growth Fund
Financial Highlights
| | | | | | |
| Six Months | | | | | |
| | Ended | | | | | |
| For a Share Outstanding | July 31, | | | Year Ended January 31, |
| Throughout Each Period | 2012 | 2012 | 2011 | 2010 | 2009 | 2008 |
| Net Asset Value, Beginning of Period | $15.81 | $14.68 | $12.82 | $10.42 | $14.38 | $14.74 |
| Investment Operations | | | | | | |
| Net Investment Income | .171 | .317 | .283 | .291 | .264 | .290 |
| Net Realized and Unrealized Gain (Loss) | | | | | | |
| on Investments | .567 | 1.126 | 1.850 | 2.401 | (3.960) | (.270) |
| Total from Investment Operations | .738 | 1.443 | 2.133 | 2.692 | (3.696) | .020 |
| Distributions | | | | | | |
| Dividends from Net Investment Income | (.178) | (.313) | (.273) | (.292) | (.264) | (.280) |
| Distributions from Realized Capital Gains | — | — | — | — | — | (.100) |
| Total Distributions | (.178) | (.313) | (.273) | (.292) | (.264) | (.380) |
| Net Asset Value, End of Period | $16.37 | $15.81 | $14.68 | $12.82 | $10.42 | $14.38 |
| |
| Total Return1 | 4.71% | 9.90% | 16.85% | 26.01% | -25.97% | -0.01% |
| |
| Ratios/Supplemental Data | | | | | | |
| Net Assets, End of Period (Millions) | $10,755 | $8,829 | $4,995 | $2,814 | $1,745 | $1,326 |
| Ratio of Total Expenses to | | | | | | |
| Average Net Assets2 | 0.29% | 0.31% | 0.34% | 0.38% | 0.36% | 0.32% |
| Ratio of Net Investment Income to | | | | | | |
| Average Net Assets | 2.23% | 2.28% | 2.25% | 2.59% | 2.25% | 1.91% |
| Portfolio Turnover Rate | 12% | 13% | 17% | 24% | 28% | 36% |
The expense ratio, net income ratio, and turnover rate for the current period have been annualized.
1 Total returns do not include account service fees that may have applied in the periods shown. Fund prospectuses provide information about any applicable account service fees.
2 Includes performance-based investment advisory fee increases (decreases) of 0.00%, 0.00%, 0.03%, 0.03%, 0.03%, and 0.00%.
See accompanying Notes, which are an integral part of the Financial Statements.
15
Dividend Growth Fund
Notes to Financial Statements
Vanguard Dividend Growth Fund is registered under the Investment Company Act of 1940 as an open-end investment company, or mutual fund.
A. The following significant accounting policies conform to generally accepted accounting principles for U.S. mutual funds. The fund consistently follows such policies in preparing its financial statements.
1. Security Valuation: Securities are valued as of the close of trading on the New York Stock Exchange (generally 4 p.m., Eastern time) on the valuation date. Equity securities are valued at the latest quoted sales prices or official closing prices taken from the primary market in which each security trades; such securities not traded on the valuation date are valued at the mean of the latest quoted bid and asked prices. Securities for which market quotations are not readily available, or whose values have been affected by events occurring before the fund’s pricing time but after the close of the securities’ primary markets, are valued at their fair values calculated according to procedures adopted by the board of trustees. These procedures include obtaining quotations from an independent pricing service, monitoring news to identify significant market- or security-specific events, and evaluating changes in the values of foreign market proxies (for example, ADRs, futures contracts, or exchange-traded funds), between the time the foreign markets close and the fund’s pricing time. When fair-value pricing is employed, the prices of securities used by a fund to calculate its net asset value may differ from quoted or published prices for the same securities. Investments in Vanguard Market Liquidity Fund are valued at that fund’s net asset value. Temporary cash investments acquired over 60 days to maturity are valued using the latest bid prices or using valuations based on a matrix system (which considers such factors as security prices, yields, maturities, and ratings), both as furnished by independent pricing services. Other temporary cash investments are valued at amortized cost, which approximates market value.
2. Foreign Currency: Securities and other assets and liabilities denominated in foreign currencies are translated into U.S. dollars using exchange rates obtained from an independent third party as of the fund’s pricing time on the valuation date. Realized gains (losses) and unrealized appreciation (depreciation) on investment securities include the effects of changes in exchange rates since the securities were purchased, combined with the effects of changes in security prices. Fluctuations in the value of other assets and liabilities resulting from changes in exchange rates are recorded as unrealized foreign currency gains (losses) until the assets or liabilities are settled in cash, at which time they are recorded as realized foreign currency gains (losses).
3. Repurchase Agreements: The fund may enter into repurchase agreements. Securities pledged as collateral for repurchase agreements are held by a custodian bank until the agreements mature. Each agreement requires that the market value of the collateral be sufficient to cover payments of interest and principal. In the event of default or bankruptcy by the other party to the agreement, the fund may sell or retain the collateral; however, such action may be subject to legal proceedings.
4. Federal Income Taxes: The fund intends to continue to qualify as a regulated investment company and distribute all of its taxable income. Management has analyzed the fund’s tax positions taken for all open federal income tax years (January 31, 2009–2012), and for the period ended July 31, 2012, and has concluded that no provision for federal income tax is required in the fund’s financial statements.
5. Distributions: Distributions to shareholders are recorded on the ex-dividend date.
6. Security Lending: The fund may lend its securities to qualified institutional borrowers to earn additional income. Security loans are required to be secured at all times by collateral at least equal to the market value of securities loaned. The fund invests cash collateral received in Vanguard Market
16
Dividend Growth Fund
Liquidity Fund, and records a liability for the return of the collateral, during the period the securities are on loan. Security lending income represents fees charged to borrowers plus income earned on investing cash collateral, less expenses associated with the loan.
7. Other: Dividend income is recorded on the ex-dividend date. Interest income is accrued daily.
Security transactions are accounted for on the date securities are bought or sold. Costs used to determine realized gains (losses) on the sale of investment securities are those of the specific securities sold.
B. Wellington Management Company, LLP, provides investment advisory services to the fund for a fee calculated at an annual percentage rate of average net assets. The basic fee is subject to quarterly adjustments based on the fund’s performance for the preceding three years relative to the Russell 1000 Index for periods prior to February 1, 2010, and the current benchmark, the Dividend Achievers Select Index, beginning February 1, 2010. The benchmark change will be fully phased in by January
2013. For the six months ended July 31, 2012, the investment advisory fee represented an effective annual basic rate of 0.10% of the fund’s average net assets before a decrease of $26,000 (0.00%) based on performance.
C. The Vanguard Group furnishes at cost corporate management, administrative, marketing, and distribution services. The costs of such services are allocated to the fund under methods approved by the board of trustees. The fund has committed to provide up to 0.40% of its net assets in capital contributions to Vanguard. At July 31, 2012, the fund had contributed capital of $1,537,000 to Vanguard
(included in Other Assets), representing 0.01% of the fund’s net assets and 0.61% of Vanguard’s capitalization. The fund’s trustees and officers are also directors and officers of Vanguard.
D. Various inputs may be used to determine the value of the fund’s investments. These inputs are summarized in three broad levels for financial statement purposes. The inputs or methodologies used to value securities are not necessarily an indication of the risk associated with investing in those securities.
Level 1—Quoted prices in active markets for identical securities.
Level 2—Other significant observable inputs (including quoted prices for similar securities, interest rates, prepayment speeds, credit risk, etc.).
Level 3—Significant unobservable inputs (including the fund’s own assumptions used to determine the fair value of investments).
The following table summarizes the market value of the fund’s investments as of July 31, 2012, based on the inputs used to value them:
| | | |
| | Level 1 | Level 2 | Level 3 |
| Investments | ($000) | ($000) | ($000) |
| Common Stocks | 9,868,199 | 450,470 | — |
| Temporary Cash Investments | — | 409,400 | — |
| Total | 9,868,199 | 859,870 | — |
E. Distributions are determined on a tax basis and may differ from net investment income and realized capital gains for financial reporting purposes. Differences may be permanent or temporary. Permanent differences are reclassified among capital accounts in the financial statements to reflect their tax character. Temporary differences arise when certain items of income, expense, gain, or loss are
17
Dividend Growth Fund
recognized in different periods for financial statement and tax purposes; these differences will reverse at some time in the future. Differences in classification may also result from the treatment of short-term gains as ordinary income for tax purposes.
During the six months ended July 31, 2012, the fund realized net foreign currency losses of $97,000, which decreased distributable net income for tax purposes; accordingly, such losses have been reclassified from accumulated net realized losses to undistributed net investment income.
The fund’s tax-basis capital gains and losses are determined only at the end of each fiscal year. For tax purposes, at January 31, 2012, the fund had available capital loss carryforwards totaling $63,309,000 to offset future net capital gains through January 31, 2018. The fund will use these capital losses to offset net taxable capital gains, if any, realized during the year ending January 31, 2013; should the fund realize net capital losses for the year, the losses will be added to the loss carryforward balance above.
At July 31, 2012, the cost of investment securities for tax purposes was $9,214,781,000. Net unrealized appreciation of investment securities for tax purposes was $1,513,288,000, consisting of unrealized gains of $1,578,229,000 on securities that had risen in value since their purchase and $64,941,000 in unrealized losses on securities that had fallen in value since their purchase.
F. During the six months ended July 31, 2012, the fund purchased $2,346,951,000 of investment securities and sold $567,220,000 of investment securities, other than temporary cash investments.
G. Capital shares issued and redeemed were:
| | |
| | Six Months Ended | Year Ended |
| | July 31, 2012 | January 31, 2012 |
| | Shares | Shares |
| | (000) | (000) |
| Issued | 145,001 | 276,882 |
| Issued in Lieu of Cash Distributions | 6,290 | 7,601 |
| Redeemed | (52,953) | (66,333) |
| Net Increase (Decrease) in Shares Outstanding | 98,338 | 218,150 |
H. In preparing the financial statements as of July 31, 2012, management considered the impact of subsequent events for potential recognition or disclosure in these financial statements.
18
About Your Fund’s Expenses
As a shareholder of the fund, you incur ongoing costs, which include costs for portfolio management, administrative services, and shareholder reports (like this one), among others. Operating expenses, which are deducted from a fund’s gross income, directly reduce the investment return of the fund.
A fund’s expenses are expressed as a percentage of its average net assets. This figure is known as the expense ratio. The following examples are intended to help you understand the ongoing costs (in dollars) of investing in your fund and to compare these costs with those of other mutual funds. The examples are based on an investment of $1,000 made at the beginning of the period shown and held for the entire period.
The accompanying table illustrates your fund’s costs in two ways:
• Based on actual fund return. This section helps you to estimate the actual expenses that you paid over the period. The ”Ending Account Value“ shown is derived from the fund‘s actual return, and the third column shows the dollar amount that would have been paid by an investor who started with $1,000 in the fund. You may use the information here, together with the amount you invested, to estimate the expenses that you paid over the period.
To do so, simply divide your account value by $1,000 (for example, an $8,600 account value divided by $1,000 = 8.6), then multiply the result by the number given for your fund under the heading ”Expenses Paid During Period.“
• Based on hypothetical 5% yearly return. This section is intended to help you compare your fund‘s costs with those of other mutual funds. It assumes that the fund had a yearly return of 5% before expenses, but that the expense ratio is unchanged. In this case—because the return used is not the fund’s actual return—the results do not apply to your investment. The example is useful in making comparisons because the Securities and Exchange Commission requires all mutual funds to calculate expenses based on a 5% return. You can assess your fund’s costs by comparing this hypothetical example with the hypothetical examples that appear in shareholder reports of other funds.
Note that the expenses shown in the table are meant to highlight and help you compare ongoing costs only and do not reflect transaction costs incurred by the fund for buying and selling securities. Further, the expenses do not include any purchase, redemption, or account service fees described in the fund prospectus. If such fees were applied to your account, your costs would be higher. Your fund does not carry a “sales load.”
The calculations assume no shares were bought or sold during the period. Your actual costs may have been higher or lower, depending on the amount of your investment and the timing of any purchases or redemptions.
You can find more information about the fund’s expenses, including annual expense ratios, in the Financial Statements section of this report. For additional information on operating expenses and other shareholder costs, please refer to your fund’s current prospectus.
19
| | | |
| Six Months Ended July 31, 2012 | | | |
| | Beginning | Ending | Expenses |
| | Account Value | Account Value | Paid During |
| Dividend Growth Fund | 1/31/2012 | 7/31/2012 | Period |
| Based on Actual Fund Return | $1,000.00 | $1,047.06 | $1.48 |
| Based on Hypothetical 5% Yearly Return | 1,000.00 | 1,023.42 | 1.46 |
The calculations are based on expenses incurred in the most recent six-month period. The fund’s annualized six-month expense ratio for that period is 0.29%. The dollar amounts shown as “Expenses Paid” are equal to the annualized expense ratio multiplied by the average account value over the period, multiplied by the number of days in the most recent six-month period, then divided by the number of days in the most recent 12-month period.
20
Glossary
30-Day SEC Yield. A fund’s 30-day SEC yield is derived using a formula specified by the U.S. Securities and Exchange Commission. Under the formula, data related to the fund’s security holdings in the previous 30 days are used to calculate the fund’s hypothetical net income for that period, which is then annualized and divided by the fund’s estimated average net assets over the calculation period. For the purposes of this calculation, a security’s income is based on its current market yield to maturity (for bonds), its actual income (for asset-backed securities), or its projected dividend yield (for stocks). Because the SEC yield represents hypothetical annualized income, it will differ—at times significantly—from the fund’s actual experience. As a result, the fund’s income distributions may be higher or lower than implied by the SEC yield.
Beta. A measure of the magnitude of a fund’s past share-price fluctuations in relation to the ups and downs of a given market index. The index is assigned a beta of 1.00. Compared with a given index, a fund with a beta of 1.20 typically would have seen its share price rise or fall by 12% when the index rose or fell by 10%. For this report, beta is based on returns over the past 36 months for both the fund and the index. Note that a fund’s beta should be reviewed in conjunction with its R-squared (see definition). The lower the R-squared, the less correlation there is between the fund and the index, and the less reliable beta is as an indicator of volatility.
Dividend Yield. Dividend income earned by stocks, expressed as a percentage of the aggregate market value (or of net asset value, for a fund). The yield is determined by dividing the amount of the annual dividends by the aggregate value (or net asset value) at the end of the period. For a fund, the dividend yield is based solely on stock holdings and does not include any income produced by other investments.
Earnings Growth Rate. The average annual rate of growth in earnings over the past five years for the stocks now in a fund.
Equity Exposure. A measure that reflects a fund’s investments in stocks and stock futures. Any holdings in short-term reserves are excluded.
Expense Ratio. A fund’s total annual operating expenses expressed as a percentage of the fund’s average net assets. The expense ratio includes management and administrative expenses, but does not include the transaction costs of buying and selling portfolio securities.
Foreign Holdings. The percentage of a fund represented by securities or depositary receipts of companies based outside the United States.
Inception Date. The date on which the assets of a fund (or one of its share classes) are first invested in accordance with the fund’s investment objective. For funds with a subscription period, the inception date is the day after that period ends. Investment performance is measured from the inception date.
Median Market Cap. An indicator of the size of companies in which a fund invests; the midpoint of market capitalization (market price x shares outstanding) of a fund’s stocks, weighted by the proportion of the fund’s assets invested in each stock. Stocks representing half of the fund’s assets have market capitalizations above the median, and the rest are below it.
Price/Book Ratio. The share price of a stock divided by its net worth, or book value, per share. For a fund, the weighted average price/book ratio of the stocks it holds.
21
Price/Earnings Ratio. The ratio of a stock’s current price to its per-share earnings over the past year. For a fund, the weighted average P/E of the stocks it holds. P/E is an indicator of market expectations about corporate prospects; the higher the P/E, the greater the expectations for a company’s future growth.
R-Squared. A measure of how much of a fund’s past returns can be explained by the returns from the market in general, as measured by a given index. If a fund’s total returns were precisely synchronized with an index’s returns, its R-squared would be 1.00. If the fund’s returns bore no relationship to the index’s returns, its R-squared would be 0. For this report, R-squared is based on returns over the past 36 months for both the fund and the index.
Return on Equity. The annual average rate of return generated by a company during the past five years for each dollar of shareholder’s equity (net income divided by shareholder’s equity). For a fund, the weighted average return on equity for the companies whose stocks it holds.
Short-Term Reserves. The percentage of a fund invested in highly liquid, short-term securities that can be readily converted to cash.
Turnover Rate. An indication of the fund’s trading activity. Funds with high turnover rates incur higher transaction costs and may be more likely to distribute capital gains (which may be taxable to investors). The turnover rate excludes in-kind transactions, which have minimal impact on costs.
22
This page intentionally left blank.
The People Who Govern Your Fund
The trustees of your mutual fund are there to see that the fund is operated and managed in your best interests since, as a shareholder, you are a part owner of the fund. Your fund’s trustees also serve on the board of directors of The Vanguard Group, Inc., which is owned by the Vanguard funds and provides services to them on an at-cost basis.
A majority of Vanguard’s board members are independent, meaning that they have no affiliation with Vanguard or the funds they oversee, apart from the sizable personal investments they have made as private individuals. The independent board members have distinguished backgrounds in business, academia, and public service. Each of the trustees and executive officers oversees 179 Vanguard funds.
The following table provides information for each trustee and executive officer of the fund. More information about the trustees is in the Statement of Additional Information, which can be obtained, without charge, by contacting Vanguard at 800-662-7447, or online at vanguard.com.
| |
| InterestedTrustee1 | and Delphi Automotive LLP (automotive components); |
| | Senior Advisor at New Mountain Capital; Trustee of |
| F. William McNabb III | The Conference Board. |
| Born 1957. Trustee Since July 2009. Chairman of the | |
| Board. Principal Occupation(s) During the Past Five | Amy Gutmann |
| Years: Chairman of the Board of The Vanguard Group, | Born 1949. Trustee Since June 2006. Principal |
| Inc., and of each of the investment companies served | Occupation(s) During the Past Five Years: President |
| by The Vanguard Group, since January 2010; Director | of the University of Pennsylvania; Christopher H. |
| of The Vanguard Group since 2008; Chief Executive | Browne Distinguished Professor of Political Science |
| Officer and President of The Vanguard Group and of | in the School of Arts and Sciences with secondary |
| each of the investment companies served by The | appointments at the Annenberg School for |
| Vanguard Group since 2008; Director of Vanguard | Communication and the Graduate School of Education |
| Marketing Corporation; Managing Director of The | of the University of Pennsylvania; Member of the |
| Vanguard Group (1995–2008). | National Commission on the Humanities and Social |
| Sciences; Trustee of Carnegie Corporation of New |
| IndependentTrustees | York and of the National Constitution Center; Chair |
| of the U.S. Presidential Commission for the Study |
| Emerson U. Fullwood | of Bioethical Issues. |
| |
| Born 1948. Trustee Since January 2008. Principal | JoAnn Heffernan Heisen |
| Occupation(s) During the Past Five Years: Executive | Born 1950. Trustee Since July 1998. Principal |
| Chief Staff and Marketing Officer for North America | Occupation(s) During the Past Five Years: Corporate |
| and Corporate Vice President (retired 2008) of Xerox | Vice President and Chief Global Diversity Officer |
| Corporation (document management products and | (retired 2008) and Member of the Executive |
| services); Executive in Residence and 2010 | Committee (1997–2008) of Johnson & Johnson |
| Distinguished Minett Professor at the Rochester | (pharmaceuticals/medical devices/consumer |
| Institute of Technology; Director of SPX Corporation | products); Director of Skytop Lodge Corporation |
| (multi-industry manufacturing), the United Way of | (hotels), the University Medical Center at Princeton, |
| Rochester, Amerigroup Corporation (managed health | the Robert Wood Johnson Foundation, and the Center |
| care), the University of Rochester Medical Center, | for Talent Innovation; Member of the Advisory Board |
| Monroe Community College Foundation, and North | of the Maxwell School of Citizenship and Public Affairs |
| Carolina A&T University. | at Syracuse University. |
| |
| Rajiv L. Gupta | F. Joseph Loughrey |
| Born 1945. Trustee Since December 2001. 2 | Born 1949. Trustee Since October 2009. Principal |
| Principal Occupation(s) During the Past Five Years: | Occupation(s) During the Past Five Years: President |
| Chairman and Chief Executive Officer (retired 2009) | and Chief Operating Officer (retired 2009) of Cummins |
| and President (2006–2008) of Rohm and Haas Co. | Inc. (industrial machinery); Director of SKF AB |
| (chemicals); Director of Tyco International, Ltd. | (industrial machinery), Hillenbrand, Inc. (specialized |
| (diversified manufacturing and services), Hewlett- | consumer services), the Lumina Foundation for |
| Packard Co. (electronic computer manufacturing), | |
| | |
| Education, and Oxfam America; Chairman of the | Executive Officers | |
| Advisory Council for the College of Arts and Letters | | |
| and Member of the Advisory Board to the Kellogg | Glenn Booraem | |
| Institute for International Studies at the University | Born 1967. Controller Since July 2010. Principal |
| of Notre Dame. | Occupation(s) During the Past Five Years: Principal |
| | of The Vanguard Group, Inc.; Controller of each of |
| Mark Loughridge | the investment companies served by The Vanguard |
| Born 1953. Trustee Since March 2012. Principal | Group; Assistant Controller of each of the investment |
| Occupation(s) During the Past Five Years: Senior Vice | companies served by The Vanguard Group (2001–2010). |
| President and Chief Financial Officer at IBM (information | | |
| technology services); Fiduciary Member of IBM’s | Thomas J. Higgins | |
| Retirement Plan Committee. | Born 1957. Chief Financial Officer Since September |
| | 2008. Principal Occupation(s) During the Past Five |
| Scott C. Malpass | Years: Principal of The Vanguard Group, Inc.; Chief |
| Born 1962. Trustee Since March 2012. Principal | Financial Officer of each of the investment companies |
| Occupation(s) During the Past Five Years: Chief | served by The Vanguard Group; Treasurer of each of |
| Investment Officer and Vice President at the University | the investment companies served by The Vanguard |
| of Notre Dame; Assistant Professor of Finance at the | Group (1998–2008). | |
| Mendoza College of Business at Notre Dame; Member | | |
| of the Notre Dame 403(b) Investment Committee; | Kathryn J. Hyatt | |
| Director of TIFF Advisory Services, Inc. (investment | Born 1955. Treasurer Since November 2008. Principal |
| advisor); Member of the Investment Advisory | Occupation(s) During the Past Five Years: Principal of |
| Committees of the Financial Industry Regulatory | The Vanguard Group, Inc.; Treasurer of each of the |
| Authority (FINRA) and of Major League Baseball. | investment companies served by The Vanguard |
| | Group; Assistant Treasurer of each of the investment |
| André F. Perold | companies served by The Vanguard Group (1988–2008). |
| Born 1952. Trustee Since December 2004. Principal | | |
| Occupation(s) During the Past Five Years: George | Heidi Stam | |
| Gund Professor of Finance and Banking at the Harvard | Born 1956. Secretary Since July 2005. Principal |
| Business School (retired 2011); Chief Investment | Occupation(s) During the Past Five Years: Managing |
| Officer and Managing Partner of HighVista Strategies | Director of The Vanguard Group, Inc.; General Counsel |
| LLC (private investment firm); Director of Rand | of The Vanguard Group; Secretary of The Vanguard |
| Merchant Bank; Overseer of the Museum of Fine | Group and of each of the investment companies |
| Arts Boston. | served by The Vanguard Group; Director and Senior |
| | Vice President of Vanguard Marketing Corporation. |
| Alfred M. Rankin, Jr. | | |
| Born 1941. Trustee Since January 1993. Principal | | |
| | Vanguard Senior ManagementTeam |
| Occupation(s) During the Past Five Years: Chairman, | | |
| President, and Chief Executive Officer of NACCO | Mortimer J. Buckley | Michael S. Miller |
| Industries, Inc. (forklift trucks/housewares/lignite); | Kathleen C. Gubanich | James M. Norris |
| Director of Goodrich Corporation (industrial products/ | Paul A. Heller | Glenn W. Reed |
| aircraft systems and services) and the National | Martha G. King | George U. Sauter |
| Association of Manufacturers; Chairman of the Board | Chris D. McIsaac | |
| of the Federal Reserve Bank of Cleveland and of | | |
| University Hospitals of Cleveland; Advisory Chairman | Chairman Emeritus and Senior Advisor |
| of the Board of The Cleveland Museum of Art. | | |
| John J. Brennan |
| Peter F. Volanakis | Chairman, 1996–2009 |
| Born 1955. Trustee Since July 2009. Principal | Chief Executive Officer and President, 1996–2008 |
| Occupation(s) During the Past Five Years: President | | |
| and Chief Operating Officer (retired 2010) of Corning | | |
| Incorporated (communications equipment); Director | Founder | |
| of SPX Corporation (multi-industry manufacturing); | John C. Bogle | |
| Overseer of the Amos Tuck School of Business | Chairman and Chief Executive Officer, 1974–1996 |
| Administration at Dartmouth College; Advisor to the | | |
| Norris Cotton Cancer Center. | | |
1 Mr. McNabb is considered an “interested person,” as defined in the Investment Company Act of 1940, because he is an officer of the Vanguard funds.
2 December 2002 for Vanguard Equity Income Fund, Vanguard Growth Equity Fund, the Vanguard Municipal Bond Funds, and the Vanguard State Tax-Exempt Funds.
|  |
| P.O. Box 2600 |
| Valley Forge, PA 19482-2600 |
Connect with Vanguard® > vanguard.com
| |
| Fund Information > 800-662-7447 | |
| Direct Investor Account Services > 800-662-2739 | |
| Institutional Investor Services > 800-523-1036 | |
| Text Telephone for People | |
| With Hearing Impairment > 800-749-7273 | |
| |
| This material may be used in conjunction | |
| with the offering of shares of any Vanguard | |
| fund only if preceded or accompanied by | |
| the fund’s current prospectus. | |
| |
| All comparative mutual fund data are from Lipper Inc. or | |
| Morningstar, Inc., unless otherwise noted. | |
| |
| You can obtain a free copy of Vanguard’s proxy voting | |
| guidelines by visiting vanguard.com/proxyreporting or by | |
| calling Vanguard at 800-662-2739. The guidelines are | |
| also available from the SEC’s website, sec.gov. In | |
| addition, you may obtain a free report on how your fund | |
| voted the proxies for securities it owned during the 12 | |
| months ended June 30. To get the report, visit either | |
| vanguard.com/proxyreporting or sec.gov. | |
| |
| You can review and copy information about your fund at | |
| the SEC’s Public Reference Room in Washington, D.C. To | |
| find out more about this public service, call the SEC at | |
| 202-551-8090. Information about your fund is also | |
| available on the SEC’s website, and you can receive | |
| copies of this information, for a fee, by sending a | |
| request in either of two ways: via e-mail addressed to | |
| publicinfo@sec.gov or via regular mail addressed to the | |
| Public Reference Section, Securities and Exchange | |
| Commission, Washington, DC 20549-1520. | |
| | © 2012 The Vanguard Group, Inc. |
| | All rights reserved. |
| | Vanguard Marketing Corporation, Distributor. |
| |
| | Q572 092012 |
 |
| |
| Semiannual Report | July 31, 2012 |
| |
| Vanguard Dividend Appreciation |
| Index Fund |
> Vanguard Dividend Appreciation Index Fund returned more than 4% for the six months ended July 31, 2012.
> The fund’s return was in line with that of its target index, the Dividend Achievers Select Index, as well as the average return of large-capitalization core funds.
> Eight of the index’s ten market sectors posted positive results for the period, with consumer staples contributing most to returns.
| |
| Contents | |
| Your Fund’s Total Returns. | 1 |
| Chairman’s Letter. | 2 |
| Fund Profile. | 7 |
| Performance Summary. | 8 |
| Financial Statements. | 9 |
| About Your Fund’s Expenses. | 19 |
| Trustees Approve Advisory Arrangement. | 21 |
| Glossary. | 22 |
Please note: The opinions expressed in this report are just that—informed opinions. They should not be considered promises or advice. Also, please keep in mind that the information and opinions cover the period through the date on the front of this report. Of course, the risks of investing in your fund are spelled out in the prospectus.
See the Glossary for definitions of investment terms used in this report.
About the cover: Vanguard was named for the HMS Vanguard, flagship of British Admiral Horatio Nelson. A ship—whose performance and safety depend on the work of all hands—has served as a fitting metaphor for the Vanguard crew as we strive to help clients reach their financial goals.
Your Fund’s Total Returns
| |
| Six Months Ended July 31, 2012 | |
| | Total |
| | Returns |
| Vanguard Dividend Appreciation Index Fund | |
| Investor Shares | 4.18% |
| ETF Shares | |
| Market Price | 4.15 |
| Net Asset Value | 4.24 |
| Dividend Achievers Select Index | 4.28 |
| Large-Cap Core Funds Average | 4.21 |
| Large-Cap Core Funds Average: Derived from data provided by Lipper Inc. |
The Vanguard ETF® Shares shown are traded on the NYSE Arca exchange and are available only through brokers. The table provides ETF returns based on both the NYSE Arca market price and the net asset value for a share. U.S. Pat. No. 6,879,964 B2; 7,337,138; 7,720,749; 7,925,573; 8,090,646.
For the ETF Shares, the market price is determined by the midpoint of the bid-offer spread as of the closing time of the New York Stock Exchange (generally 4 p.m., Eastern time). The net asset value is also determined as of the NYSE closing time. For more information about how the ETF Shares' market prices have compared with their net asset value, visit vanguard.com, select your ETF, and then select the Price and Performance tab. The ETF premium/discount analysis there shows the percentages of days on which the ETF Shares' market price was above or below the NAV.
| | | | |
| Your Fund’s Performance at a Glance | | | | |
| January 31, 2012, Through July 31, 2012 | | | | |
| | | | Distributions Per Share |
| | Starting | Ending | Income | Capital |
| | Share Price | Share Price | Dividends | Gains |
| Vanguard Dividend Appreciation Index Fund | | | | |
| Investor Shares | $22.42 | $23.13 | $0.222 | $0.000 |
| ETF Shares | 56.04 | 57.81 | 0.589 | 0.000 |
1

Chairman’s Letter
Dear Shareholder,
Stocks that deliver a high level of current income have been very much in favor with investors of late, and for the six months ended July 31, 2012, they generally outperformed the broader market. However, investors showed less interest in companies that are positioned to pay higher dividends in the future, and that seemed to hinder the performance of Vanguard Dividend Appreciation Index Fund relative to the broad market during the period. The fund and its benchmark index focus on large-capitalization, high-quality companies that have both the ability and the commitment to increase their dividends over time.
For the half-year, the fund returned a bit more than 4%, while the broad market returned about 5%. The fund’s return was in line with that of its benchmark, the Dividend Achievers Select Index, as well as the average return of its peers.
U.S. stocks delivered solid gains; international equities slumped
U.S. stocks outperformed their international counterparts handily for the six months ended July 31. Stocks of large companies fared best as investors seemed to be seeking stability amid the uncertainty surrounding Europe’s debt troubles.
International stocks were generally weak, with currency effects further hindering results for U.S.-based investors. Though European stocks posted a modest advance in local-currency terms, their return was
2
negative once converted into U.S. dollars—a result of the dollar’s strengthening against the euro during the six months. Signs of slowing economic growth hurt returns for emerging markets and the developed markets of the Pacific region.
Questions about the finances of European governments and banks continued to preoccupy investors, and global stock markets moved sharply up and down in response to the latest headlines. Although the situation in Europe is very fluid, Vanguard economists believe the most likely scenario is that the Eurozone will “muddle through” for several years, with occasional spikes in market volatility, as fiscal tightening continues in the face of weak economic growth.
Bonds kept up a steady advance as Treasury yields kept dwindling
U.S. Treasury securities stretched their gains during the period, as investors lost more of their appetite for risk. Bond prices moved higher, and the yield of the 10-year U.S. Treasury note fell to a record low in July, closing below 1.5%. (Bond yields and prices move in opposite directions.) The broad U.S. taxable bond market posted a return of nearly 3%, and municipal bonds had about the same result for the six months.
Investors have enjoyed several years of strong bond returns, but they shouldn’t be surprised if future results are weaker. As yields tumble, the scope for further declines—and price increases—diminishes.
| | | |
| Market Barometer | | | |
| |
| | | | Total Returns |
| | | Periods Ended July 31, 2012 |
| | Six | One | Five Years |
| | Months | Year | (Annualized) |
| Stocks | | | |
| Russell 1000 Index (Large-caps) | 5.54% | 7.96% | 1.26% |
| Russell 2000 Index (Small-caps) | -0.03 | 0.19 | 1.69 |
| Dow Jones U.S. Total Stock Market Index | 5.01 | 7.07 | 1.50 |
| MSCI All Country World Index ex USA (International) | -2.40 | -12.16 | -4.29 |
| |
| Bonds | | | |
| Barclays U.S. Aggregate Bond Index (Broad taxable | | | |
| market) | 2.88% | 7.25% | 6.91% |
| Barclays Municipal Bond Index (Broad tax-exempt | | | |
| market) | 2.93 | 10.51 | 6.12 |
| Citigroup Three-Month U.S. Treasury Bill Index | 0.04 | 0.05 | 0.79 |
| |
| CPI | | | |
| Consumer Price Index | 1.08% | 1.41% | 1.92% |
3
As it has since December 2008, the Federal Reserve Board held its target for the shortest-term interest rates between 0% and 0.25%, keeping a tight lid on the returns from money market funds and savings accounts.
Consumer staples stocks bolstered returns
As I mentioned earlier, Vanguard Dividend Appreciation Index Fund finished the period a few steps behind the broad U.S. stock market, but the fund’s performance was nevertheless solid, as it posted positive results in eight of the ten market sectors.
Consumer staples stocks added most to performance. The sector benefited from the market’s volatility during the period.
Because the goods and services sold by these companies are typically things that people can’t do without, investors often consider their stocks to be safe havens during volatile times. The sector, which is also the index’s largest holding, added more than 3 percentage points to returns.
Consumer discretionary stocks were important contributors to performance as well, with specialty and multiline retailers producing the strongest results. The sector continued to benefit from the recovery in consumer spending, however slow and uneven, since the recession. Stocks within the materials sector also added to performance, with chemical companies leading the way.
| | | |
| Expense Ratios | | | |
| Your Fund Compared With Its Peer Group | | | |
| | Investor | ETF | Peer Group |
| | Shares | Shares | Average |
| Dividend Appreciation Index Fund | 0.25% | 0.13% | 1.19% |
The fund expense ratios shown are from the prospectus dated May 29, 2012, and represent estimated costs for the current fiscal year. For the six months ended July 31, 2012, the fund’s annualized expense ratios were 0.23% for Investor Shares and 0.10% for ETF Shares. The peer-group expense ratio is derived from data provided by Lipper Inc. and captures information through year-end 2011.
Peer group: Large-Cap Core Funds.
4
The biggest drag on performance came from industrials, which detracted almost a full percentage point from the fund’s return. Stocks within this sector retreated amid concerns that slower growth in emerging markets countries would soften demand for machinery and equipment.
A balanced portfolio can help offset volatility
Over the past several years, the financial markets have taken us on a wild roller-coaster ride—stocks have soared one day and plunged the next. As investors, if we’ve learned anything during this time, it’s that periods of extreme volatility really aren’t that unusual.
|
| Dividends are bouncing back |
| During the financial crisis of 2008–2009, many companies slashed their dividend |
| payments to conserve cash in the face of plunging profits. But, in a welcome |
| development for investors, dividend payments have been rising over the last |
| three years. |
| |
| As shown in the chart below, the aggregate dividends paid by companies in the |
| Standard & Poor’s 500 Index climbed to $7.45 per share for the second quarter |
| of 2012. That represents a 37% increase over the second quarter of 2009. |
| |
| The level of dividend payments is considered an indicator of corporate financial |
| health, and, not surprisingly, the recovery in dividend payments has followed a |
| rebound in corporate earnings. Still, the most recent quarterly figure for S&P 500 |
| companies remains a bit below the $7.62 per share peak reached in late 2007. |
|
Aggregate quarterly per-share dividends for S&P 500 Index companies (2007–2012) |
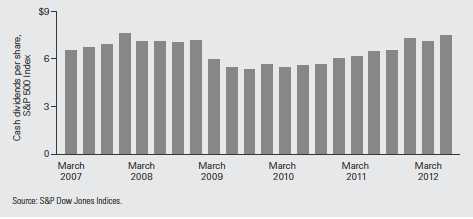 |
5
Research shows that a balanced portfolio that’s diversified across asset classes can help reduce volatility. In strong markets, the equity portion of a balanced portfolio can offer investors the opportunity for long-term growth. In volatile times like those we’ve experienced in recent years, bonds and short-term investments can provide a cushion from dramatic swings in the stock market.
For these reasons, Vanguard encourages you to create a long-term investment plan that includes a steady mix of stocks, bonds, and short-term investments appropriate for your goals and risk tolerance. Vanguard Dividend Appreciation Index Fund, with its low costs and broad exposure to companies expected to increase their dividends over time, can play a part in such a well-balanced portfolio.
As always, thank you for entrusting your assets to Vanguard.
Sincerely,

F. William McNabb III
Chairman and Chief Executive Officer
August 13, 2012
6
Dividend Appreciation Index Fund
Fund Profile
As of July 31, 2012
| | |
| Share-Class Characteristics | |
| |
| | Investor | ETF |
| | Shares | Shares |
| Ticker Symbol | VDAIX | VIG |
| Expense Ratio1 | 0.25% | 0.13% |
| 30-Day SEC Yield | 2.14% | 2.27% |
| | | |
| Portfolio Characteristics | | |
| | | Dividend | DJ |
| | | Achievers | U.S. Total |
| | | Select | Market |
| | Fund | Index | Index |
| Number of Stocks | 133 | 132 | 3,684 |
| Median Market Cap | $40.9B | $40.9B | $34.4B |
| Price/Earnings Ratio | 15.1x | 15.1x | 15.7x |
| Price/Book Ratio | 3.1x | 3.1x | 2.2x |
| Return on Equity | 23.4% | 23.4% | 18.1% |
| Earnings Growth Rate | 7.3% | 7.3% | 9.6% |
| Dividend Yield | 2.4% | 2.4% | 2.1% |
| Foreign Holdings | 0.0% | 0.0% | 0.0% |
| Turnover Rate | | | |
| (Annualized) | 7% | — | — |
| Short-Term Reserves | 0.0% | — | — |
| | | |
| Sector Diversification (% of equity exposure) |
| | | Dividend | DJ |
| | | Achievers | U.S. Total |
| | | Select | Market |
| | Fund | Index | Index |
| Consumer Discretionary | 14.5% | 14.4% | 11.8% |
| Consumer Staples | 25.6 | 25.6 | 10.0 |
| Energy | 10.2 | 10.2 | 10.3 |
| Financials | 6.0 | 6.0 | 15.8 |
| Health Care | 5.4 | 5.4 | 11.9 |
| Industrials | 21.1 | 21.1 | 10.7 |
| Information Technology | 6.4 | 6.5 | 19.0 |
| Materials | 8.8 | 8.8 | 3.8 |
| Telecommunication | | | |
| Services | 0.1 | 0.1 | 2.9 |
| Utilities | 1.9 | 1.9 | 3.8 |
| | |
| Volatility Measures | | |
| | Dividend | DJ |
| | Achievers | U.S. Total |
| | Select | Market |
| | Index | Index |
| R-Squared | 1.00 | 0.95 |
| Beta | 1.00 | 0.78 |
These measures show the degree and timing of the fund’s fluctuations compared with the indexes over 36 months.
| | |
| Ten Largest Holdings (% of total net assets) |
| Wal-Mart Stores Inc. | Hypermarkets & | |
| | Super Centers | 4.8% |
| Coca-Cola Co. | Soft Drinks | 4.6 |
| PepsiCo Inc. | Soft Drinks | 4.3 |
| International Business | IT Consulting & | |
| Machines Corp. | Other Services | 4.0 |
| Chevron Corp. | Integrated Oil & | |
| | Gas | 4.0 |
| Procter & Gamble Co. | Household | |
| | Products | 3.9 |
| Exxon Mobil Corp. | Integrated Oil & | |
| | Gas | 3.9 |
| United Technologies | Aerospace & | |
| Corp. | Defense | 3.4 |
| McDonald's Corp. | Restaurants | 3.4 |
| 3M Co. | Industrial | |
| | Conglomerates | 3.3 |
| Top Ten | | 39.6% |
The holdings listed exclude any temporary cash investments and equity index products.
Investment Focus
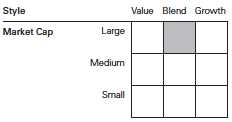
1 The expense ratios shown are from the prospectus dated May 29, 2012, and represent estimated costs for the current fiscal year. For the six months ended July 31, 2012, the annualized expense ratios were 0.23% for Investor Shares and 0.10% for ETF Shares.
7
Dividend Appreciation Index Fund
Performance Summary
All of the returns in this report represent past performance, which is not a guarantee of future results that may be achieved by the fund. (Current performance may be lower or higher than the performance data cited. For performance data current to the most recent month-end, visit our website at vanguard.com/performance.) Note, too, that both investment returns and principal value can fluctuate widely, so an investor’s shares, when sold, could be worth more or less than their original cost. The returns shown do not reflect taxes that a shareholder would pay on fund distributions or on the sale of fund shares.
Fiscal-Year Total Returns (%): April 27, 2006, Through July 31, 2012
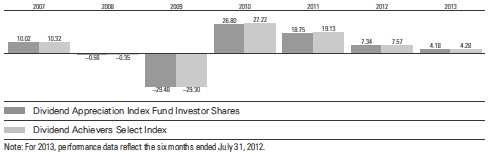
Average Annual Total Returns: Periods Ended June 30, 2012
This table presents returns through the latest calendar quarter—rather than through the end of the fiscal period.
Securities and Exchange Commission rules require that we provide this information.
| | | | |
| | Inception | One | Five | Since |
| | Date | Year | Years | Inception |
| Investor Shares | 4/27/2006 | 3.42% | 2.18% | 4.00% |
| ETF Shares | 4/21/2006 | | | |
| Market Price | | 3.59 | 2.32 | 4.16 |
| Net Asset Value | | 3.58 | 2.30 | 4.16 |
See Financial Highlights for dividend and capital gains information.
8
Dividend Appreciation Index Fund
Financial Statements (unaudited)
Statement of Net Assets
As of July 31, 2012
The fund reports a complete list of its holdings in regulatory filings four times in each fiscal year, at the quarter-ends. For the second and fourth fiscal quarters, the lists appear in the fund’s semiannual and annual reports to shareholders. For the first and third fiscal quarters, the fund files the lists with the Securities and Exchange Commission on Form N-Q. Shareholders can look up the fund’s Forms N-Q on the SEC’s website at sec.gov. Forms N-Q may also be reviewed and copied at the SEC’s Public Reference Room (see the back cover of this report for further information).
| | |
| | | Market |
| | | Value |
| | Shares | ($000) |
| Common Stocks (100.0%) | | |
| Consumer Discretionary (14.5%) | |
| McDonald’s Corp. | 5,316,302 | 475,065 |
| Target Corp. | 5,081,875 | 308,216 |
| NIKE Inc. Class B | 2,627,179 | 245,247 |
| TJX Cos. Inc. | 5,417,063 | 239,868 |
| Lowe’s Cos. Inc. | 8,945,050 | 226,936 |
| VF Corp. | 784,620 | 117,144 |
| Ross Stores Inc. | 1,557,083 | 103,453 |
| McGraw-Hill Cos. Inc. | 2,108,572 | 99,018 |
| Genuine Parts Co. | 1,097,966 | 70,303 |
| Family Dollar Stores Inc. | 902,514 | 59,638 |
| Polaris Industries Inc. | 466,783 | 35,083 |
| John Wiley & Sons Inc. | | |
| Class A | 362,188 | 17,258 |
| Matthews International | | |
| Corp. Class A | 206,966 | 6,002 |
| | | 2,003,231 |
| Consumer Staples (25.6%) | | |
| Wal-Mart Stores Inc. | 8,810,949 | 655,799 |
| Coca-Cola Co. | 7,831,266 | 632,766 |
| PepsiCo Inc. | 8,119,148 | 590,506 |
| Procter & Gamble Co. | 8,256,498 | 532,874 |
| Colgate-Palmolive Co. | 3,748,915 | 402,484 |
| Walgreen Co. | 6,318,639 | 229,746 |
| Archer-Daniels- | | |
| Midland Co. | 4,735,380 | 123,546 |
| JMSmucker Co. | 810,025 | 62,210 |
| Church& Dwight Co. Inc. | 1,050,031 | 60,492 |
| Brown-Forman Corp. | | |
| Class B | 620,206 | 58,027 |
| Hormel Foods Corp. | 1,946,533 | 54,328 |
| McCormick & Co. Inc. | 875,139 | 53,278 |
| Nu Skin Enterprises Inc. | | |
| Class A | 461,059 | 23,519 |
| Casey’s General Stores Inc. | 273,192 | 16,236 |
| Lancaster Colony Corp. | 200,263 | 13,876 |
| Tootsie Roll Industries Inc. | 273,916 | 6,705 |
| Sanderson Farms Inc. | 160,498 | 5,911 |
| | | 3,522,303 |
| | | |
| | | | Market |
| | | | Value |
| | | Shares | ($000) |
| Energy (10.2%) | | |
| | ChevronCorp. | 5,015,203 | 549,566 |
| | Exxon Mobil Corp. | 6,135,564 | 532,874 |
| | EOG Resources Inc. | 1,858,191 | 182,121 |
| | Murphy Oil Corp. | 1,310,398 | 70,316 |
| | Helmerich & Payne Inc. | 766,980 | 35,664 |
| | Energen Corp. | 503,471 | 25,783 |
| ^ | CARBO Ceramics Inc. | 165,830 | 10,643 |
| | | | 1,406,967 |
| Financials (6.0%) | | |
| | Franklin Resources Inc. | 1,529,763 | 175,846 |
| | ChubbCorp. | 2,008,296 | 145,983 |
| | AflacInc. | 3,113,560 | 136,312 |
| | T. Rowe Price Group Inc. | 1,771,314 | 107,607 |
| | WR Berkley Corp. | 992,815 | 36,367 |
| | Erie Indemnity Co. | | |
| | Class A | 368,394 | 26,263 |
| | Brown & Brown Inc. | 1,038,530 | 26,213 |
| | SEI Investments Co. | 1,223,990 | 25,924 |
| | Commerce | | |
| | Bancshares Inc. | 618,433 | 24,354 |
| | HCC Insurance | | |
| | Holdings Inc. | 763,017 | 23,379 |
| | Eaton Vance Corp. | 767,278 | 20,356 |
| | Prosperity Bancshares Inc. | 330,636 | 13,414 |
| | UMB Financial Corp. | 275,137 | 13,223 |
| | RLI Corp. | 153,687 | 9,899 |
| | Westamerica | | |
| | Bancorporation | 205,555 | 9,456 |
| | StanCorp Financial | | |
| | Group Inc. | 308,580 | 9,183 |
| | Bank of the Ozarks Inc. | 255,647 | 8,229 |
| | Bancfirst Corp. | 103,869 | 4,219 |
| | 1stSource Corp. | 178,790 | 3,973 |
| | Republic Bancorp Inc. | 128,680 | 3,038 |
| | First Financial Corp. | 94,783 | 2,810 |
| | Southside Bancshares Inc. | 130,464 | 2,721 |
| | | | 828,769 |
9
Dividend Appreciation Index Fund
| | |
| | | Market |
| | | Value |
| | Shares | ($000) |
| Health Care (5.4%) | | |
| Medtronic Inc. | 7,563,610 | 298,158 |
| Stryker Corp. | 2,669,258 | 138,881 |
| Becton Dickinson and Co. | 1,524,026 | 115,384 |
| Cardinal Health Inc. | 2,475,098 | 106,652 |
| CR Bard Inc. | 603,592 | 58,705 |
| Owens& Minor Inc. | 442,476 | 12,482 |
| West Pharmaceutical | | |
| Services Inc. | 238,181 | 11,857 |
| | | 742,119 |
| Industrials (21.1%) | | |
| United | | |
| Technologies Corp. | 6,383,641 | 475,198 |
| 3MCo. | 4,957,059 | 452,233 |
| Caterpillar Inc. | 4,080,411 | 343,611 |
| Emerson Electric Co. | 5,102,521 | 243,747 |
| Norfolk Southern Corp. | 2,388,819 | 176,892 |
| Illinois Tool Works Inc. | 3,243,744 | 176,265 |
| General Dynamics Corp. | 2,442,372 | 154,944 |
| WW Grainger Inc. | 477,416 | 97,789 |
| Fastenal Co. | 2,070,329 | 89,273 |
| Parker Hannifin Corp. | 1,044,521 | 83,896 |
| Stanley Black & | | |
| Decker Inc. | 1,194,687 | 79,913 |
| Dover Corp. | 1,330,370 | 72,465 |
| C.H. Robinson | | |
| Worldwide Inc. | 1,244,479 | 65,771 |
| Roper Industries Inc. | 659,593 | 65,597 |
| Expeditors International | | |
| of Washington Inc. | 1,454,768 | 51,746 |
| Donaldson Co. Inc. | 1,055,683 | 36,030 |
| Cintas Corp. | 891,595 | 35,334 |
| Pentair Inc. | 657,802 | 28,831 |
| Nordson Corp. | 439,022 | 22,504 |
| Valmont Industries Inc. | 174,480 | 21,615 |
| Carlisle Cos. Inc. | 420,804 | 21,246 |
| Graco Inc. | 417,974 | 19,177 |
| CLARCOR Inc. | 357,918 | 17,305 |
| AO Smith Corp. | 282,885 | 13,980 |
| Brady Corp. Class A | 341,026 | 9,047 |
| Mine Safety Appliances Co. | 260,499 | 8,940 |
| Franklin Electric Co. Inc. | 153,319 | 8,649 |
| Raven Industries Inc. | 255,268 | 8,355 |
| ABMIndustries Inc. | 375,943 | 6,993 |
| Tennant Co. | 141,512 | 5,897 |
| NACCO Industries Inc. | | |
| Class A | 47,745 | 4,782 |
| McGrath RentCorp | 170,144 | 4,528 |
| Gorman-Rupp Co. | 135,481 | 3,761 |
| | | 2,906,314 |
| Information Technology (6.4%) | |
| International Business | | |
| Machines Corp. | 2,824,893 | 553,622 |
| Automatic Data | | |
| Processing Inc. | 3,450,103 | 195,103 |
| | |
| | | Market |
| | | Value |
| | Shares | ($000) |
| Linear Technology Corp. | 1,527,491 | 49,262 |
| Harris Corp. | 795,405 | 33,129 |
| FactSet Research | | |
| Systems Inc. | 317,542 | 29,519 |
| Jack Henry & | | |
| Associates Inc. | 636,313 | 22,099 |
| Badger Meter Inc. | 102,100 | 3,460 |
| Cass Information | | |
| Systems Inc. | 75,629 | 2,874 |
| | | 889,068 |
| Materials (8.8%) | | |
| Monsanto Co. | 3,478,692 | 297,846 |
| Praxair Inc. | 2,165,998 | 224,744 |
| Ecolab Inc. | 2,129,920 | 139,403 |
| Air Products & | | |
| Chemicals Inc. | 1,477,702 | 118,851 |
| PPG Industries Inc. | 1,081,380 | 118,368 |
| Sherwin-WilliamsCo. | 721,762 | 96,969 |
| Sigma-Aldrich Corp. | 825,463 | 57,122 |
| Albemarle Corp. | 563,639 | 32,815 |
| Valspar Corp. | 643,271 | 32,292 |
| Royal Gold Inc. | 402,179 | 30,437 |
| Aptargroup Inc. | 494,937 | 24,752 |
| Bemis Co. Inc. | 764,933 | 23,522 |
| HBFuller Co. | 310,328 | 9,068 |
| Stepan Co. | 73,185 | 6,488 |
| | | 1,212,677 |
| Telecommunication Services (0.1%) | |
| Telephone & Data | | |
| Systems Inc. | 334,222 | 8,098 |
| Atlantic Tele-Network Inc. | 124,204 | 4,342 |
| | | 12,440 |
| Utilities (1.9%) | | |
| Northeast Utilities | 2,430,446 | 96,926 |
| National Fuel Gas Co. | 678,070 | 33,185 |
| MDU Resources | | |
| Group Inc. | 1,397,475 | 31,289 |
| Questar Corp. | 1,336,007 | 27,188 |
| AquaAmerica Inc. | 1,039,937 | 26,664 |
| New Jersey | | |
| Resources Corp. | 315,785 | 14,495 |
| South Jersey | | |
| Industries Inc. | 230,292 | 12,173 |
| MGE Energy Inc. | 180,965 | 8,675 |
| American States Water Co. | 136,065 | 5,531 |
| SJW Corp. | 141,523 | 3,302 |
| | | 259,428 |
| Total Common Stocks | | |
| (Cost $12,241,973) | | 13,783,316 |
10
Dividend Appreciation Index Fund
| | |
| | | Market |
| | | Value |
| | Shares | ($000) |
| Temporary Cash Investment (0.0%) | |
| Money Market Fund (0.0%) | |
| 1,2 Vanguard Market | | |
| Liquidity Fund, | | |
| 0.155% | | |
| (Cost $2,975) | 2,974,802 | 2,975 |
| Total Investments (100.0%) | |
| (Cost $12,244,948) | | 13,786,291 |
| Other Assets and Liabilities (0.0%) | |
| Other Assets | | 20,258 |
| Liabilities2 | | (24,735) |
| | | (4,477) |
| Net Assets (100%) | | 13,781,814 |
| |
| At July 31, 2012, net assets consisted of: |
| | Amount |
| | ($000) |
| Paid-in Capital | 12,507,698 |
| Undistributed Net Investment Income | 15,825 |
| Accumulated Net Realized Losses | (283,052) |
| Unrealized Appreciation (Depreciation) | 1,541,343 |
| Net Assets | 13,781,814 |
| |
| Investor Shares—Net Assets | |
| Applicable to 105,432,741 outstanding | |
| $.001 par value shares of beneficial | |
| interest (unlimited authorization) | 2,438,284 |
| Net Asset Value Per Share— | |
| Investor Shares | $23.13 |
| |
| ETF Shares—Net Assets | |
| Applicable to 196,226,146 outstanding | |
| $.001 par value shares of beneficial | |
| interest (unlimited authorization) | 11,343,530 |
| Net Asset Value Per Share— | |
| ETF Shares | $57.81 |
See Note A in Notes to Financial Statements.
^ Part of security position is on loan to broker-dealers. The total value of securities on loan is $2,850,000.
1 Affiliated money market fund available only to Vanguard funds and certain trusts and accounts managed by Vanguard. Rate shown is the 7-day yield.
2 Includes $2,975,000 of collateral received for securities on loan.
See accompanying Notes, which are an integral part of the Financial Statements.
11
Dividend Appreciation Index Fund
| |
| Statement of Operations | |
| |
| | Six Months Ended |
| | July 31, 2012 |
| | ($000) |
| Investment Income | |
| Income | |
| Dividends | 150,284 |
| Interest1 | 3 |
| Security Lending | 341 |
| Total Income | 150,628 |
| Expenses | |
| The Vanguard Group—Note B | |
| Investment Advisory Services | 398 |
| Management and Administrative—Investor Shares | 2,230 |
| Management and Administrative—ETF Shares | 3,305 |
| Marketing and Distribution—Investor Shares | 340 |
| Marketing and Distribution—ETF Shares | 1,553 |
| Custodian Fees | 42 |
| Shareholders’ Reports—Investor Shares | 3 |
| Shareholders’ Reports—ETF Shares | 131 |
| Trustees’ Fees and Expenses | 6 |
| Total Expenses | 8,008 |
| Net Investment Income | 142,620 |
| Realized Net Gain (Loss) on Investment Securities Sold | 127,890 |
| Change in Unrealized Appreciation (Depreciation) of Investment Securities | 252,303 |
| Net Increase (Decrease) in Net Assets Resulting from Operations | 522,813 |
| 1 Interest income from an affiliated company of the fund was $3,000. |
See accompanying Notes, which are an integral part of the Financial Statements.
12
Dividend Appreciation Index Fund
| | |
| Statement of Changes in Net Assets | | |
| |
| | Six Months Ended | Year Ended |
| | July 31, | January 31, |
| | 2012 | 2012 |
| | ($000) | ($000) |
| Increase (Decrease) in Net Assets | | |
| Operations | | |
| Net Investment Income | 142,620 | 195,210 |
| Realized Net Gain (Loss) | 127,890 | (953) |
| Change in Unrealized Appreciation (Depreciation) | 252,303 | 547,378 |
| Net Increase (Decrease) in Net Assets Resulting from Operations | 522,813 | 741,635 |
| Distributions | | |
| Net Investment Income | | |
| Investor Shares | (22,492) | (35,636) |
| ETFShares | (112,008) | (156,111) |
| Realized Capital Gain | | |
| Investor Shares | — | — |
| ETFShares | — | — |
| Total Distributions | (134,500) | (191,747) |
| Capital Share Transactions | | |
| Investor Shares | 157,199 | 687,152 |
| ETFShares | 1,353,681 | 4,240,039 |
| Net Increase (Decrease) from Capital Share Transactions | 1,510,880 | 4,927,191 |
| Total Increase (Decrease) | 1,899,193 | 5,477,079 |
| Net Assets | | |
| Beginning of Period | 11,882,621 | 6,405,542 |
| End of Period1 | 13,781,814 | 11,882,621 |
| 1 Net Assets—End of Period includes undistributed net investment income of $15,825,000 and $7,705,000. |
See accompanying Notes, which are an integral part of the Financial Statements.
13
Dividend Appreciation Index Fund
Financial Highlights
| | | | | | |
| Investor Shares | | | | | | |
| Six Months | | | | | |
| | Ended | | | | | |
| For a Share Outstanding | July 31, | | | Year Ended January 31, |
| Throughout Each Period | 2012 | 2012 | 2011 | 2010 | 2009 | 2008 |
| Net Asset Value, Beginning of Period | $22.42 | $21.33 | $18.33 | $14.79 | $21.40 | $21.84 |
| Investment Operations | | | | | | |
| Net Investment Income | .233 | .445 | .392 | .369 | .387 | .325 |
| Net Realized and Unrealized Gain (Loss) | | | | | | |
| on Investments | .699 | 1.089 | 3.006 | 3.543 | (6.614) | (.438) |
| Total from Investment Operations | .932 | 1.534 | 3.398 | 3.912 | (6.227) | (.113) |
| Distributions | | | | | | |
| Dividends from Net Investment Income | (.222) | (.444) | (.398) | (.372) | (.383) | (.327) |
| Distributions from Realized Capital Gains | — | — | — | — | — | — |
| Total Distributions | (.222) | (.444) | (.398) | (.372) | (.383) | (.327) |
| Net Asset Value, End of Period | $23.13 | $22.42 | $21.33 | $18.33 | $14.79 | $21.40 |
| |
| Total Return1 | 4.18% | 7.34% | 18.75% | 26.80% | -29.48% | -0.58% |
| |
| Ratios/Supplemental Data | | | | | | |
| Net Assets, End of Period (Millions) | $2,438 | $2,206 | $1,421 | $613 | $386 | $357 |
| Ratio of Total Expenses to | | | | | | |
| Average Net Assets | 0.23% | 0.25% | 0.30% | 0.35% | 0.36% | 0.40% |
| Ratio of Net Investment Income to | | | | | | |
| Average Net Assets | 2.08% | 2.14% | 2.13% | 2.24% | 2.25% | 1.56% |
| Portfolio Turnover Rate2 | 7% | 14% | 15% | 20% | 34% | 17% |
The expense ratio, net income ratio, and turnover rate for the current period have been annualized.
1 Total returns do not include account service fees that may have applied in the periods shown. Fund prospectuses provide information about any applicable account service fees.
2 Excludes the value of portfolio securities received or delivered as a result of in-kind purchases or redemptions of the fund’s capital shares, including ETF Creation Units.
See accompanying Notes, which are an integral part of the Financial Statements.
14
Dividend Appreciation Index Fund
Financial Highlights
| | | | | | |
| ETF Shares | | | | | | |
| Six Months | | | | | |
| | Ended | | | | | |
| For a Share Outstanding | July 31, | | | Year Ended January 31, |
| Throughout Each Period | 2012 | 2012 | 2011 | 2010 | 2009 | 2008 |
| Net Asset Value, Beginning of Period | $56.04 | $53.32 | $45.81 | $36.96 | $53.48 | $54.60 |
| Investment Operations | | | | | | |
| Net Investment Income | .619 | 1.173 | 1.034 | .973 | 1.032 | .873 |
| Net Realized and Unrealized Gain (Loss) | | | | | | |
| on Investments | 1.740 | 2.719 | 7.524 | 8.856 | (16.526) | (1.120) |
| Total from Investment Operations | 2.359 | 3.892 | 8.558 | 9.829 | (15.494) | (.247) |
| Distributions | | | | | | |
| Dividends from Net Investment Income | (.589) | (1.172) | (1.048) | (.979) | (1.026) | (.873) |
| Distributions from Realized Capital Gains | — | — | — | — | — | — |
| Total Distributions | (.589) | (1.172) | (1.048) | (.979) | (1.026) | (.873) |
| Net Asset Value, End of Period | $57.81 | $56.04 | $53.32 | $45.81 | $36.96 | $53.48 |
| |
| Total Return | 4.24% | 7.46% | 18.91% | 26.95% | -29.38% | -0.51% |
| |
| Ratios/Supplemental Data | | | | | | |
| Net Assets, End of Period (Millions) | $11,344 | $9,677 | $4,985 | $1,918 | $805 | $302 |
| Ratio of Total Expenses to | | | | | | |
| Average Net Assets | 0.10% | 0.13% | 0.18% | 0.23% | 0.24% | 0.28% |
| Ratio of Net Investment Income to | | | | | | |
| Average Net Assets | 2.21% | 2.26% | 2.25% | 2.36% | 2.37% | 1.68% |
| Portfolio Turnover Rate1 | 7% | 14% | 15% | 20% | 34% | 17% |
The expense ratio, net income ratio, and turnover rate for the current period have been annualized.
1 Excludes the value of portfolio securities received or delivered as a result of in-kind purchases or redemptions of the fund’s capital shares, including ETF Creation Units.
See accompanying Notes, which are an integral part of the Financial Statements.
15
Dividend Appreciation Index Fund
Notes to Financial Statements
Vanguard Dividend Appreciation Index Fund is registered under the Investment Company Act of 1940 as an open-end investment company, or mutual fund. The fund offers two classes of shares: Investor Shares and ETF Shares. Investor Shares are available to any investor who meets the fund’s minimum purchase requirements. ETF Shares are listed for trading on NYSE Arca; they can be purchased and sold through a broker.
A. The following significant accounting policies conform to generally accepted accounting principles for U.S. mutual funds. The fund consistently follows such policies in preparing its financial statements.
1. Security Valuation: Securities are valued as of the close of trading on the New York Stock Exchange (generally 4 p.m., Eastern time) on the valuation date. Equity securities are valued at the latest quoted sales prices or official closing prices taken from the primary market in which each security trades; such securities not traded on the valuation date are valued at the mean of the latest quoted bid and asked prices. Securities for which market quotations are not readily available, or whose values have been materially affected by events occurring before the fund’s pricing time but after the close of the securities’ primary markets, are valued by methods deemed by the board of trustees to represent fair value. Investments in Vanguard Market Liquidity Fund are valued at that fund’s net asset value.
2. Federal Income Taxes: The fund intends to continue to qualify as a regulated investment company and distribute all of its taxable income. Management has analyzed the fund’s tax positions taken for all open federal income tax years (January 31, 2009–2012), and for the period ended July 31, 2012, and has concluded that no provision for federal income tax is required in the fund’s financial statements.
3. Distributions: Distributions to shareholders are recorded on the ex-dividend date.
4. Security Lending: The fund may lend its securities to qualified institutional borrowers to earn additional income. Security loans are required to be secured at all times by collateral at least equal to the market value of securities loaned. The fund invests cash collateral received in Vanguard Market Liquidity Fund, and records a liability for the return of the collateral, during the period the securities are on loan. Security lending income represents fees charged to borrowers plus income earned on investing cash collateral, less expenses associated with the loan.
5. Other: Dividend income is recorded on the ex-dividend date. Interest income includes income distributions received from Vanguard Market Liquidity Fund and is accrued daily. Security transactions are accounted for on the date securities are bought or sold. Costs used to determine realized gains (losses) on the sale of investment securities are those of the specific securities sold.
Each class of shares has equal rights as to assets and earnings, except that each class separately bears certain class-specific expenses related to maintenance of shareholder accounts (included in Management and Administrative expenses) and shareholder reporting. Marketing and distribution expenses are allocated to each class of shares based on a method approved by the board of trustees. Income, other non-class-specific expenses, and gains and losses on investments are allocated to each class of shares based on its relative net assets.
B. The Vanguard Group furnishes at cost investment advisory, corporate management, administrative, marketing, and distribution services. The costs of such services are allocated to the fund under methods approved by the board of trustees. The fund has committed to provide up to 0.40% of its net assets in capital contributions to Vanguard. At July 31, 2012, the fund had contributed capital of $1,974,000 to Vanguard (included in Other Assets), representing 0.01% of the fund’s net assets and 0.79% of Vanguard’s capitalization. The fund’s trustees and officers are also directors and officers of Vanguard.
16
Dividend Appreciation Index Fund
C. Various inputs may be used to determine the value of the fund’s investments. These inputs are summarized in three broad levels for financial statement purposes. The inputs or methodologies used to value securities are not necessarily an indication of the risk associated with investing in those securities.
Level 1—Quoted prices in active markets for identical securities.
Level 2—Other significant observable inputs (including quoted prices for similar securities, interest rates, prepayment speeds, credit risk, etc.).
Level 3—Significant unobservable inputs (including the fund’s own assumptions used to determine the fair value of investments).
At July 31, 2012, 100% of the market value of the fund’s investments was determined based on Level 1 inputs.
D. Distributions are determined on a tax basis and may differ from net investment income and realized capital gains for financial reporting purposes. Differences may be permanent or temporary. Permanent differences are reclassified among capital accounts in the financial statements to reflect their tax character. Temporary differences arise when certain items of income, expense, gain, or loss are recognized in different periods for financial statement and tax purposes; these differences will reverse at some time in the future. Differences in classification may also result from the treatment of short-term gains as ordinary income for tax purposes.
During the six months ended July 31, 2012, the fund realized $108,134,000 of net capital gains resulting from in-kind redemptions—in which shareholders exchanged fund shares for securities held by the fund rather than for cash. Because such gains are not taxable to the fund, and are not distributed to shareholders, they have been reclassified from accumulated net realized losses to paid-in capital.
The fund’s tax-basis capital gains and losses are determined only at the end of each fiscal year. For tax purposes, at January 31, 2012, the fund had available capital loss carryforwards totaling $284,147,000 to offset future net capital gains. Of this amount, $191,649,000 is subject to expiration dates; $609,000 may be used to offset future net capital gains through January 31, 2016, $22,242,000 through January 31, 2017, $146,149,000 through January 31, 2018, and $22,649,000 through
January 31, 2019. Capital losses of $92,498,000 realized beginning in fiscal 2012 may be carried forward indefinitely but must be used before any expiring loss carryforwards. The fund will use these capital losses to offset net taxable capital gains, if any, realized during the year ending January 31, 2013; should the fund realize net capital losses for the year, the losses will be added to the loss carryforward balance above.
At July 31, 2012, the cost of investment securities for tax purposes was $12,244,948,000. Net unrealized appreciation of investment securities for tax purposes was $1,541,343,000, consisting of unrealized gains of $1,711,562,000 on securities that had risen in value since their purchase and $170,219,000 in unrealized losses on securities that had fallen in value since their purchase.
E. During the six months ended July 31, 2012, the fund purchased $2,164,402,000 of investment securities and sold $646,611,000 of investment securities, other than temporary cash investments.
17
Dividend Appreciation Index Fund
F. Capital share transactions for each class of shares were:
| | | | |
| | Six Months Ended | | Year Ended |
| | | July 31, 2012 | January 31, 2012 |
| | Amount | Shares | Amount | Shares |
| | ($000) | (000) | ($000) | (000) |
| Investor Shares | | | | |
| Issued | 474,395 | 20,823 | 1,067,783 | 49,431 |
| Issued in Lieu of Cash Distributions | 18,439 | 815 | 30,641 | 1,454 |
| Redeemed | (335,635) | (14,608) | (411,272) | (19,093) |
| Net Increase (Decrease)—Investor Shares | 157,199 | 7,030 | 687,152 | 31,792 |
| ETF Shares | | | | |
| Issued | 1,693,761 | 29,548 | 4,439,908 | 82,895 |
| Issued in Lieu of Cash Distributions | — | — | — | — |
| Redeemed | (340,080) | (6,000) | (199,869) | (3,700) |
| Net Increase (Decrease)—ETF Shares | 1,353,681 | 23,548 | 4,240,039 | 79,195 |
G. In preparing the financial statements as of July 31, 2012, management considered the impact of subsequent events for potential recognition or disclosure in these financial statements.
18
About Your Fund’s Expenses
As a shareholder of the fund, you incur ongoing costs, which include costs for portfolio management, administrative services, and shareholder reports (like this one), among others. Operating expenses, which are deducted from a fund’s gross income, directly reduce the investment return of the fund.
A fund’s expenses are expressed as a percentage of its average net assets. This figure is known as the expense ratio. The following examples are intended to help you understand the ongoing costs (in dollars) of investing in your fund and to compare these costs with those of other mutual funds. The examples are based on an investment of $1,000 made at the beginning of the period shown and held for the entire period.
The accompanying table illustrates your fund’s costs in two ways:
• Based on actual fund return. This section helps you to estimate the actual expenses that you paid over the period. The ”Ending Account Value“ shown is derived from the fund‘s actual return, and the third column shows the dollar amount that would have been paid by an investor who started with $1,000 in the fund. You may use the information here, together with the amount you invested, to estimate the expenses that you paid over the period.
To do so, simply divide your account value by $1,000 (for example, an $8,600 account value divided by $1,000 = 8.6), then multiply the result by the number given for your fund under the heading ”Expenses Paid During Period.“
• Based on hypothetical 5% yearly return. This section is intended to help you compare your fund‘s costs with those of other mutual funds. It assumes that the fund had a yearly return of 5% before expenses, but that the expense ratio is unchanged. In this case—because the return used is not the fund’s actual return—the results do not apply to your investment. The example is useful in making comparisons because the Securities and Exchange Commission requires all mutual funds to calculate expenses based on a 5% return. You can assess your fund’s costs by comparing this hypothetical example with the hypothetical examples that appear in shareholder reports of other funds.
Note that the expenses shown in the table are meant to highlight and help you compare ongoing costs only and do not reflect transaction costs incurred by the fund for buying and selling securities. Further, the expenses do not include any purchase, redemption, or account service fees described in the fund prospectus. If such fees were applied to your account, your costs would be higher. Your fund does not carry a “sales load.”
The calculations assume no shares were bought or sold during the period. Your actual costs may have been higher or lower, depending on the amount of your investment and the timing of any purchases or redemptions.
You can find more information about the fund’s expenses, including annual expense ratios, in the Financial Statements section of this report. For additional information on operating expenses and other shareholder costs, please refer to your fund’s current prospectus.
19
| | | |
| Six Months Ended July 31, 2012 | | | |
| | Beginning | Ending | Expenses |
| | Account Value | Account Value | Paid During |
| Dividend Appreciation Index Fund | 1/31/2012 | 7/31/2012 | Period |
| Based on Actual Fund Return | | | |
| Investor Shares | $1,000.00 | $1,041.81 | $1.17 |
| ETF Shares | 1,000.00 | 1,042.36 | 0.51 |
| Based on Hypothetical 5% Yearly Return | | | |
| Investor Shares | $1,000.00 | $1,023.72 | $1.16 |
| ETF Shares | 1,000.00 | 1,024.37 | 0.50 |
The calculations are based on expenses incurred in the most recent six-month period. The fund’s annualized six-month expense ratios for that period are 0.23% for Investor Shares and 0.10% for ETF Shares. The dollar amounts shown as “Expenses Paid” are equal to the annualized expense ratio multiplied by the average account value over the period, multiplied by the number of days in the most recent six-month period, then divided by the number of days in the most recent 12-month period.
20
Trustees Approve Advisory Arrangement
The board of trustees of Vanguard Dividend Appreciation Index Fund has renewed the fund’s investment advisory arrangement with The Vanguard Group, Inc. Vanguard—through its Equity Investment Groupserves as investment advisor for the fund. The board determined that continuing the fund’s internalized management structure was in the best interests of the fund and its shareholders.
The board based its decision upon an evaluation of the advisor’s investment staff, portfolio management process, and performance. The trustees considered the factors discussed below, among others. However, no single factor determined whether the board approved the arrangement. Rather, it was the totality of the circumstances that drove the board’s decision.
Nature, extent, and quality of services
The board considered the quality of the fund’s investment management since the fund’s inception in 2006, and took into account the organizational depth and stability of the advisor. The board noted that Vanguard has been managing investments for more than three decades. The Equity Investment Group adheres to a sound, disciplined investment management process; the team has considerable experience, stability, and depth.
The board concluded that Vanguard’s experience, stability, depth, and performance, among other factors, warranted continuation of the advisory arrangement.
Investment performance
The board considered the fund’s performance since inception, including any periods of outperformance or underperformance of its target index and peer group. The board concluded that the fund has performed in line with expectations, and that the results have been consistent with the fund’s investment strategy. Information about the fund’s most recent performance can be found in the Performance Summary section of this report.
Cost
The board concluded that the fund’s expense ratio was well below the average expense ratio charged by funds in its peer group and that the fund’s advisory fee rate was also well below its peer-group average. Information about the fund’s expenses appears in the About Your Fund’s Expenses section of this report as well as in the Financial Statements section.
The board does not conduct a profitability analysis of Vanguard, because of Vanguard’s unique “at-cost” structure. Unlike most other mutual fund management companies, Vanguard is owned by the funds it oversees, and produces “profits” only in the form of reduced expenses for fund shareholders.
The benefit of economies of scale
The board concluded that the fund’s low-cost arrangement with Vanguard ensures that the fund will realize economies of scale as it grows, with the cost to shareholders declining as the fund’s assets increase.
The board will consider whether to renew the advisory arrangement again after a one-year period.
21
Glossary
30-Day SEC Yield. A fund’s 30-day SEC yield is derived using a formula specified by the U.S. Securities and Exchange Commission. Under the formula, data related to the fund’s security holdings in the previous 30 days are used to calculate the fund’s hypothetical net income for that period, which is then annualized and divided by the fund’s estimated average net assets over the calculation period. For the purposes of this calculation, a security’s income is based on its current market yield to maturity (for bonds), its actual income (for asset-backed securities), or its projected dividend yield (for stocks). Because the SEC yield represents hypothetical annualized income, it will differ—at times significantly—from the fund’s actual experience. As a result, the fund’s income distributions may be higher or lower than implied by the SEC yield.
Beta. A measure of the magnitude of a fund’s past share-price fluctuations in relation to the ups and downs of a given market index. The index is assigned a beta of 1.00. Compared with a given index, a fund with a beta of 1.20 typically would have seen its share price rise or fall by 12% when the index rose or fell by 10%. For this report, beta is based on returns over the past 36 months for both the fund and the index. Note that a fund’s beta should be reviewed in conjunction with its R-squared (see definition). The lower the R-squared, the less correlation there is between the fund and the index, and the less reliable beta is as an indicator of volatility.
Dividend Yield. Dividend income earned by stocks, expressed as a percentage of the aggregate market value (or of net asset value, for a fund). The yield is determined by dividing the amount of the annual dividends by the aggregate value (or net asset value) at the end of the period. For a fund, the dividend yield is based solely on stock holdings and does not include any income produced by other investments.
Earnings Growth Rate. The average annual rate of growth in earnings over the past five years for the stocks now in a fund.
Equity Exposure. A measure that reflects a fund’s investments in stocks and stock futures. Any holdings in short-term reserves are excluded.
Expense Ratio. A fund’s total annual operating expenses expressed as a percentage of the fund’s average net assets. The expense ratio includes management and administrative expenses, but does not include the transaction costs of buying and selling portfolio securities.
Foreign Holdings. The percentage of a fund represented by securities or depositary receipts of companies based outside the United States.
Inception Date. The date on which the assets of a fund (or one of its share classes) are first invested in accordance with the fund’s investment objective. For funds with a subscription period, the inception date is the day after that period ends. Investment performance is measured from the inception date.
Median Market Cap. An indicator of the size of companies in which a fund invests; the midpoint of market capitalization (market price x shares outstanding) of a fund’s stocks, weighted by the proportion of the fund’s assets invested in each stock. Stocks representing half of the fund’s assets have market capitalizations above the median, and the rest are below it.
Price/Book Ratio. The share price of a stock divided by its net worth, or book value, per share. For a fund, the weighted average price/book ratio of the stocks it holds.
22
Price/Earnings Ratio. The ratio of a stock’s current price to its per-share earnings over the past year. For a fund, the weighted average P/E of the stocks it holds. P/E is an indicator of market expectations about corporate prospects; the higher the P/E, the greater the expectations for a company’s future growth.
R-Squared. A measure of how much of a fund’s past returns can be explained by the returns from the market in general, as measured by a given index. If a fund’s total returns were precisely synchronized with an index’s returns, its R-squared would be 1.00. If the fund’s returns bore no relationship to the index’s returns, its R-squared would be 0. For this report, R-squared is based on returns over the past 36 months for both the fund and the index.
Return on Equity. The annual average rate of return generated by a company during the past five years for each dollar of shareholder’s equity (net income divided by shareholder’s equity). For a fund, the weighted average return on equity for the companies whose stocks it holds.
Short-Term Reserves. The percentage of a fund invested in highly liquid, short-term securities that can be readily converted to cash.
Turnover Rate. An indication of the fund’s trading activity. Funds with high turnover rates incur higher transaction costs and may be more likely to distribute capital gains (which may be taxable to investors). The turnover rate excludes in-kind transactions, which have minimal impact on costs.
23
The People Who Govern Your Fund
The trustees of your mutual fund are there to see that the fund is operated and managed in your best interests since, as a shareholder, you are a part owner of the fund. Your fund’s trustees also serve on the board of directors of The Vanguard Group, Inc., which is owned by the Vanguard funds and provides services to them on an at-cost basis.
A majority of Vanguard’s board members are independent, meaning that they have no affiliation with Vanguard or the funds they oversee, apart from the sizable personal investments they have made as private individuals. The independent board members have distinguished backgrounds in business, academia, and public service. Each of the trustees and executive officers oversees 179 Vanguard funds.
The following table provides information for each trustee and executive officer of the fund. More information about the trustees is in the Statement of Additional Information, which can be obtained, without charge, by contacting Vanguard at 800-662-7447, or online at vanguard.com.
| |
| InterestedTrustee1 | and Delphi Automotive LLP (automotive components); |
| | Senior Advisor at New Mountain Capital; Trustee of |
| F. William McNabb III | The Conference Board. |
| Born 1957. Trustee Since July 2009. Chairman of the | |
| Board. Principal Occupation(s) During the Past Five | Amy Gutmann |
| Years: Chairman of the Board of The Vanguard Group, | Born 1949. Trustee Since June 2006. Principal |
| Inc., and of each of the investment companies served | Occupation(s) During the Past Five Years: President |
| by The Vanguard Group, since January 2010; Director | of the University of Pennsylvania; Christopher H. |
| of The Vanguard Group since 2008; Chief Executive | Browne Distinguished Professor of Political Science |
| Officer and President of The Vanguard Group and of | in the School of Arts and Sciences with secondary |
| each of the investment companies served by The | appointments at the Annenberg School for |
| Vanguard Group since 2008; Director of Vanguard | Communication and the Graduate School of Education |
| Marketing Corporation; Managing Director of The | of the University of Pennsylvania; Member of the |
| Vanguard Group (1995–2008). | National Commission on the Humanities and Social |
| Sciences; Trustee of Carnegie Corporation of New |
| York and of the National Constitution Center; Chair |
| IndependentTrustees | of the U.S. Presidential Commission for the Study |
| of Bioethical Issues. |
| Emerson U. Fullwood | |
| Born 1948. Trustee Since January 2008. Principal | JoAnn Heffernan Heisen |
| Occupation(s) During the Past Five Years: Executive | Born 1950. Trustee Since July 1998. Principal |
| Chief Staff and Marketing Officer for North America | Occupation(s) During the Past Five Years: Corporate |
| and Corporate Vice President (retired 2008) of Xerox | Vice President and Chief Global Diversity Officer |
| Corporation (document management products and | (retired 2008) and Member of the Executive |
| services); Executive in Residence and 2010 | Committee (1997–2008) of Johnson & Johnson |
| Distinguished Minett Professor at the Rochester | (pharmaceuticals/medical devices/consumer |
| Institute of Technology; Director of SPX Corporation | products); Director of Skytop Lodge Corporation |
| (multi-industry manufacturing), the United Way of | (hotels), the University Medical Center at Princeton, |
| Rochester, Amerigroup Corporation (managed health | the Robert Wood Johnson Foundation, and the Center |
| care), the University of Rochester Medical Center, | for Talent Innovation; Member of the Advisory Board |
| Monroe Community College Foundation, and North | of the Maxwell School of Citizenship and Public Affairs |
| Carolina A&T University. | at Syracuse University. |
| |
| Rajiv L. Gupta | F. Joseph Loughrey |
| Born 1945. Trustee Since December 2001. 2 | Born 1949. Trustee Since October 2009. Principal |
| Principal Occupation(s) During the Past Five Years: | Occupation(s) During the Past Five Years: President |
| Chairman and Chief Executive Officer (retired 2009) | and Chief Operating Officer (retired 2009) of Cummins |
| and President (2006–2008) of Rohm and Haas Co. | Inc. (industrial machinery); Director of SKF AB |
| (chemicals); Director of Tyco International, Ltd. | (industrial machinery), Hillenbrand, Inc. (specialized |
| (diversified manufacturing and services), Hewlett- | consumer services), the Lumina Foundation for |
| Packard Co. (electronic computer manufacturing), | |
| | |
| Education, and Oxfam America; Chairman of the | Executive Officers | |
| Advisory Council for the College of Arts and Letters | | |
| and Member of the Advisory Board to the Kellogg | Glenn Booraem | |
| Institute for International Studies at the University | Born 1967. Controller Since July 2010. Principal |
| of Notre Dame. | Occupation(s) During the Past Five Years: Principal |
| | of The Vanguard Group, Inc.; Controller of each of |
| Mark Loughridge | the investment companies served by The Vanguard |
| Born 1953. Trustee Since March 2012. Principal | Group; Assistant Controller of each of the investment |
| Occupation(s) During the Past Five Years: Senior Vice | companies served by The Vanguard Group (2001–2010). |
| President and Chief Financial Officer at IBM (information | | |
| technology services); Fiduciary Member of IBM’s | Thomas J. Higgins | |
| Retirement Plan Committee. | Born 1957. Chief Financial Officer Since September |
| | 2008. Principal Occupation(s) During the Past Five |
| Scott C. Malpass | Years: Principal of The Vanguard Group, Inc.; Chief |
| Born 1962. Trustee Since March 2012. Principal | Financial Officer of each of the investment companies |
| Occupation(s) During the Past Five Years: Chief | served by The Vanguard Group; Treasurer of each of |
| Investment Officer and Vice President at the University | the investment companies served by The Vanguard |
| of Notre Dame; Assistant Professor of Finance at the | Group (1998–2008). | |
| Mendoza College of Business at Notre Dame; Member | | |
| of the Notre Dame 403(b) Investment Committee; | Kathryn J. Hyatt | |
| Director of TIFF Advisory Services, Inc. (investment | Born 1955. Treasurer Since November 2008. Principal |
| advisor); Member of the Investment Advisory | Occupation(s) During the Past Five Years: Principal of |
| Committees of the Financial Industry Regulatory | The Vanguard Group, Inc.; Treasurer of each of the |
| Authority (FINRA) and of Major League Baseball. | investment companies served by The Vanguard |
| | Group; Assistant Treasurer of each of the investment |
| André F. Perold | companies served by The Vanguard Group (1988–2008). |
| Born 1952. Trustee Since December 2004. Principal | | |
| Occupation(s) During the Past Five Years: George | Heidi Stam | |
| Gund Professor of Finance and Banking at the Harvard | Born 1956. Secretary Since July 2005. Principal |
| Business School (retired 2011); Chief Investment | Occupation(s) During the Past Five Years: Managing |
| Officer and Managing Partner of HighVista Strategies | Director of The Vanguard Group, Inc.; General Counsel |
| LLC (private investment firm); Director of Rand | of The Vanguard Group; Secretary of The Vanguard |
| Merchant Bank; Overseer of the Museum of Fine | Group and of each of the investment companies |
| Arts Boston. | served by The Vanguard Group; Director and Senior |
| | Vice President of Vanguard Marketing Corporation. |
| Alfred M. Rankin, Jr. | | |
| Born 1941. Trustee Since January 1993. Principal | Vanguard Senior ManagementTeam |
| Occupation(s) During the Past Five Years: Chairman, | | |
| President, and Chief Executive Officer of NACCO | Mortimer J. Buckley | Michael S. Miller |
| Industries, Inc. (forklift trucks/housewares/lignite); | Kathleen C. Gubanich | James M. Norris |
| Director of Goodrich Corporation (industrial products/ | Paul A. Heller | Glenn W. Reed |
| aircraft systems and services) and the National | Martha G. King | George U. Sauter |
| Association of Manufacturers; Chairman of the Board | Chris D. McIsaac | |
| of the Federal Reserve Bank of Cleveland and of | | |
| University Hospitals of Cleveland; Advisory Chairman | | |
| of the Board of The Cleveland Museum of Art. | Chairman Emeritus and Senior Advisor |
| | John J. Brennan | |
| Peter F. Volanakis | Chairman, 1996–2009 | |
| Born 1955. Trustee Since July 2009. Principal | Chief Executive Officer and President, 1996–2008 |
| Occupation(s) During the Past Five Years: President | | |
| and Chief Operating Officer (retired 2010) of Corning | | |
| Incorporated (communications equipment); Director | Founder | |
| of SPX Corporation (multi-industry manufacturing); | John C. Bogle | |
| Overseer of the Amos Tuck School of Business | Chairman and Chief Executive Officer, 1974–1996 |
| Administration at Dartmouth College; Advisor to the | | |
| Norris Cotton Cancer Center. | | |
1 Mr. McNabb is considered an “interested person,” as defined in the Investment Company Act of 1940, because he is an officer of the Vanguard funds.
2 December 2002 for Vanguard Equity Income Fund, Vanguard Growth Equity Fund, the Vanguard Municipal Bond Funds, and the Vanguard State Tax-Exempt Funds.
|  |
| P.O. Box 2600 |
| Valley Forge, PA 19482-2600 |
Connect with Vanguard® > vanguard.com
| “Dividend Achievers” is a trademark of Mergent, Inc., |
| Fund Information > 800-662-7447 | and has been licensed for use by The Vanguard Group, |
| Direct Investor Account Services > 800-662-2739 | Inc. Vanguard mutual funds are not sponsored, |
| Institutional Investor Services > 800-523-1036 | endorsed, sold, or promoted by Mergent, and Mergent |
| Text Telephone for People | makes no representation regarding the advisability of |
| With Hearing Impairment > 800-749-7273 | investing in the funds. |
| |
| This material may be used in conjunction | |
| with the offering of shares of any Vanguard | |
| fund only if preceded or accompanied by | |
| the fund’s current prospectus. | |
| |
| All comparative mutual fund data are from Lipper Inc. or | |
| Morningstar, Inc., unless otherwise noted. | |
| |
| You can obtain a free copy of Vanguard’s proxy voting | |
| guidelines by visiting vanguard.com/proxyreporting or by | |
| calling Vanguard at 800-662-2739. The guidelines are | |
| also available from the SEC’s website, sec.gov. In | |
| addition, you may obtain a free report on how your fund | |
| voted the proxies for securities it owned during the 12 | |
| months ended June 30. To get the report, visit either | |
| vanguard.com/proxyreporting or sec.gov. | |
| |
| You can review and copy information about your fund at | |
| the SEC’s Public Reference Room in Washington, D.C. To | |
| find out more about this public service, call the SEC at | |
| 202-551-8090. Information about your fund is also | |
| available on the SEC’s website, and you can receive | |
| copies of this information, for a fee, by sending a | |
| request in either of two ways: via e-mail addressed to | |
| publicinfo@sec.gov or via regular mail addressed to the | |
| Public Reference Section, Securities and Exchange | |
| Commission, Washington, DC 20549-1520. | |
| | © 2012 The Vanguard Group, Inc. |
| | All rights reserved. |
| | Vanguard Marketing Corporation, Distributor. |
| |
| | Q6022 092012 |
Item 2:
Not Applicable.
Item 3:
Not Applicable.
Item 4: Principal Accountant Fees and Services.
Not Applicable.
Item 5: Audit Committee of Listed Registrants.
Not Applicable.
Item 6: Investments.
Not Applicable.
Item 7: Disclosure of Proxy Voting Policies and Procedures for Closed-End Management Investment Companies.
Not Applicable.
Item 8: Portfolio Managers of Closed-End Management Investment Companies.
Not Applicable.
Item 9: Purchase of Equity Securities by Closed-End Management Investment Company and Affiliated Purchasers.
Not Applicable.
Item 10: Submission of Matters to a Vote of Security Holders.
Not Applicable.
Item 11: Controls and Procedures.
(a) Disclosure Controls and Procedures. The Principal Executive and Financial Officers concluded that the Registrant's Disclosure Controls and Procedures are effective based on their evaluation of the Disclosure Controls and Procedures as of a date within 90 days of the filing date of this report.
(b) Internal Control Over Financial Reporting. There were no significant changes in Registrant’s Internal Control Over Financial Reporting or in other factors that could significantly affect this control subsequent to the date of the evaluation, including any corrective actions with regard to significant deficiencies and material weaknesses.
Item 12: Exhibits.
(a) Certifications.
Pursuant to the requirements of the Securities Exchange Act of 1934 and the Investment Company Act of 1940, the registrant has duly caused this report to be signed on its behalf by the undersigned, thereunto duly authorized.
| |
| | VANGUARD SPECIALIZED FUNDS |
| |
| By: | /s/ F. WILLIAM MCNABB III* |
| | F. WILLIAM MCNABB III |
| | CHIEF EXECUTIVE OFFICER |
| |
| Date: September 21, 2012 |
Pursuant to the requirements of the Securities Exchange Act of 1934 and the Investment Company Act of 1940, this report has been signed below by the following persons on behalf of the registrant and in the capacities and on the dates indicated.
| |
| | VANGUARD SPECIALIZED FUNDS |
| |
| By: | /s/ F. WILLIAM MCNABB III* |
| | F. WILLIAM MCNABB III |
| | CHIEF EXECUTIVE OFFICER |
| |
| Date: September 21, 2012 |
| |
| | VANGUARD SPECIALIZED FUNDS |
| |
| By: | /s/ THOMAS J. HIGGINS* |
| | THOMAS J. HIGGINS |
| | CHIEF FINANCIAL OFFICER |
| |
| Date: September 21, 2012 |
* By: /s/ Heidi Stam
Heidi Stam, pursuant to a Power of Attorney filed on March 27, 2012 see file Number 2-11444, Incorporated by Reference.
