UNITED STATES
SECURITIES AND EXCHANGE COMMISSION
Washington, D.C. 20549
FORM N-CSR
CERTIFIED SHAREHOLDER REPORT
OF
REGISTERED MANAGEMENT INVESTMENT COMPANIES
Investment Company Act file number: 811-03916
Name of Registrant: Vanguard Specialized Funds
Address of Registrant:
P.O. Box 2600
Valley Forge, PA 19482
Name and address of agent for service:
Heidi Stam, Esquire
P.O. Box 876
Valley Forge, PA 19482
Registrant’s telephone number, including area code: (610) 669-1000
Date of fiscal year end: January 31
Date of reporting period: February 1, 2014 – July 31, 2014
Item 1: Reports to Shareholders
Semiannual Report | July 31, 2014
Vanguard Energy Fund

Vanguard’s Principles for Investing Success
We want to give you the best chance of investment success. These principles, grounded in Vanguard’s research and experience, can put you on the right path.
Goals. Create clear, appropriate investment goals.
Balance. Develop a suitable asset allocation using broadly diversified funds.
Cost. Minimize cost.
Discipline. Maintain perspective and long-term discipline.
A single theme unites these principles: Focus on the things you can control. We believe there is no wiser course for any investor.
| |
| Contents | |
| Your Fund’s Total Returns. | 1 |
| Chairman’s Letter. | 2 |
| Advisors’ Report. | 7 |
| Fund Profile. | 12 |
| Performance Summary. | 14 |
| Financial Statements. | 15 |
| About Your Fund’s Expenses. | 28 |
| Trustees Approve Advisory Arrangements. | 30 |
| Glossary. | 32 |
Please note: The opinions expressed in this report are just that—informed opinions. They should not be considered promises or advice.
Also, please keep in mind that the information and opinions cover the period through the date on the front of this report. Of course, the
risks of investing in your fund are spelled out in the prospectus.
See the Glossary for definitions of investment terms used in this report.
About the cover: The ship’s wheel represents leadership and guidance, essential qualities in navigating difficult seas.
This one is a replica based on an 18th-century British vessel. The HMS Vanguard, another ship of that era, served as the
flagship for British Admiral Horatio Nelson when he defeated a French fleet at the Battle of the Nile.
Your Fund’s Total Returns
| |
| Six Months Ended July 31, 2014 | |
| | Total |
| | Returns |
| Vanguard Energy Fund | |
| Investor Shares | 14.68% |
| Admiral™ Shares | 14.71 |
| MSCI ACWI Energy Index | 16.11 |
| Global Natural Resources Funds Average | 12.22 |
Global Natural Resources Funds Average: Derived from data provided by Lipper, a Thomson Reuters Company.Admiral Shares carry lower expenses and are available to investors who meet certain account-balance requirements.Your Fund’s Performance at a Glance
January 31, 2014, Through July 31, 2014
| | | | |
| | | | Distributions Per Share |
| | Starting | Ending | Income | Capital |
| | Share Price | Share Price | Dividends | Gains |
| Vanguard Energy Fund | | | | |
| Investor Shares | $63.85 | $72.99 | $0.000 | $0.217 |
| Admiral Shares | 119.83 | 137.02 | 0.000 | 0.407 |
1

Chairman’s Letter
Dear Shareholder,
After lagging the broad U.S. stock market for three consecutive fiscal years, the energy sector leaped ahead. For the six months ended July 31, 2014, the MSCI ACWI Energy Index returned 16.11%, almost double the return of the Russell 3000 Index and well ahead of the approximately 9% return of the broad global market. Higher oil prices stemming from strife in Iraq and elsewhere helped make energy the U.S. broad market’s best-performing sector.
Even with a robust return of 14.68% for Investor Shares (and a bit more for Admiral Shares), Vanguard Energy Fund lagged its benchmark index. Rewarding choices among integrated energy giants were more than offset by outsized stakes in some U.S.-based oil and gas exploration and production companies that sustained double-digit declines. However, the fund was more than 2 percentage points ahead of the average return of its global natural resource peers, many of which have significant allocations to sectors other than energy.
Stocks posted strong returns despite finishing with a thud
For the six months ended July 31, the broad U.S. stock market returned about 8% despite ending on a negative note. On the cusp of eking out a sixth straight monthly advance, returns tumbled on the period’s final day.
2
Overall, generally strong corporate earnings, investors’ willingness to embrace risk, and the Federal Reserve’s resolve to sustain historically low interest rates for an extended time were supportive. The market withstood conflict in the Middle East and Ukraine, economic concerns in China and Europe, and the Fed’s gradual reduction of its stimulative bond-buying program.
International stocks returned almost 10%. Emerging markets, which slumped notably in 2013, led the charge. The developed markets of the Pacific region managed double-digit returns as well. European stocks, despite retreating in July, also finished on positive ground.
Bonds’ recent rebound showed signs of fatigue
The broad U.S. taxable bond market returned 2.16%. Although bonds have rebounded after posting negative returns for 2013, they gradually lost momentum in June and July. The yield of the benchmark 10-year U.S. Treasury note ended the period at 2.56%, down from 2.70% on January 31 but up from 2.47% at the end of May. (Bond prices and yields move in opposite directions.)
Municipal bonds, lifted by the broad bond market’s rally and less restrained by the later decline in Treasury prices, returned 4.15%. Investor demand for tax-exempt income and a limited supply of new issues also helped.
| | | |
| Market Barometer | | | |
| |
| | | | Total Returns |
| | Periods Ended July 31, 2014 |
| | Six | One | Five Years |
| | Months | Year | (Annualized) |
| Stocks | | | |
| Russell 1000 Index (Large-caps) | 9.02% | 17.06% | 17.13% |
| Russell 2000 Index (Small-caps) | -0.30 | 8.56 | 16.56 |
| Russell 3000 Index (Broad U.S. market) | 8.25 | 16.37 | 17.08 |
| FTSE All-World ex US Index (International) | 9.73 | 15.78 | 9.13 |
| |
| Bonds | | | |
| Barclays U.S. Aggregate Bond Index (Broad taxable market) | 2.16% | 3.97% | 4.47% |
| Barclays Municipal Bond Index (Broad tax-exempt market) | 4.15 | 7.27 | 5.50 |
| Citigroup Three-Month U.S. Treasury Bill Index | 0.00 | 0.04 | 0.07 |
| |
| CPI | | | |
| Consumer Price Index | 1.85% | 1.99% | 2.04% |
3
Results for money market funds and savings accounts remained tempered by the Fed’s target of 0%–0.25% for short-term interest rates.
International bond markets (as measured by the Barclays Global Aggregate Index ex USD) returned 3.35%.
The fund gained in all subsectors; equipment and services stood out
Amid a rising chorus of headlines proclaiming that the United States is becoming energy self-sufficient, one might expect that our energy costs would become more insulated from geopolitical tensions involving oil-producing nations. Although there is some truth to that, renewed hostilities—such as those that flared up in June in Iraq—did lead to higher oil prices everywhere. This effect eased by the end of the period, but many energy company stocks benefited from the run-up.
Booming production from shale deposits in North Dakota and elsewhere helped lift many equipment and services providers, including some of your fund’s largest holdings. This subsector of the fund, about 10% of total assets on average for the period, was the best performer, with a six-month return of more than 20%. Integrated multinational oil and gas giants and companies focused on exploration and production, representing about three-quarters of total assets, weren’t far behind.
Expense Ratios
Your Fund Compared With Its Peer Group
| | | |
| | Investor | Admiral | Peer Group |
| | Shares | Shares | Average |
| Energy Fund | 0.38% | 0.32% | 1.34% |
The fund expense ratios shown are from the prospectus dated May 27, 2014, and represent estimated costs for the current fiscal year. For thesix months ended July 31, 2014, the fund’s annualized expense ratios were 0.37% for Investor Shares and 0.31% for Admiral Shares. Thepeer-group expense ratio is derived from data provided by Lipper, a Thomson Reuters Company, and captures information through year-end2013.Peer group: Global Natural Resources Funds.4
As I’ve noted in past reports, higher oil prices can pinch the profit margins of refiners who process crude oil into other products such as gasoline. As a group, oil and gas refiners and marketers—a small slice of the fund—had some of the lowest returns.
In a turnabout from last year, the Energy Fund’s advisors added the most value relative to the benchmark with their choices among integrated multinationals. Selections among equipment and service providers were also rewarding. However, results were held back by above-benchmark stakes in some U.S.-based oil and gas explorers and producers that declined.
The Advisors’ Report that follows this letter provides additional details about the management of the fund during the six months. I would also like to acknowledge the Energy Fund’s 30th anniversary in May and thank Wellington Management Company, llp, for three decades of dedicated and continuing service as the fund’s lead advisor.
Don’t let complacency set your portfolio adrift
At Vanguard, we often warn against letting emotions become entangled with investments. When the financial markets are in turmoil, for example, we’ll caution investors not to let fear lead to rash decisions. But complacency—that mild-mannered counterpoint to fear—can also stand in the way of achieving your financial goals. And lately, conditions have been ripe for complacency.
In the more than five years since its March 2009 bottom, the broad U.S. stock market, as measured by the Russell 3000 Index, has produced average annual returns of nearly 25%. That’s more than double the historical average annual return. And in recent weeks, several indexes touched all-time highs.
The investment winds don’t always blow favorably, of course—a point underscored by the sharp drop for stocks on the last day of July. This unwelcome retreat served to remind us that the exceptionally smooth sailing in the preceding months created risks of its own.
When markets are unusually tranquil, it can be easy to lose sight of fundamentals, especially the importance of rebalancing. Without periodically adjusting your asset allocation so that it stays in line with your goals and risk tolerance, you can end up with a portfolio that’s very different from, and potentially riskier than, the one you intended to have.
5
Whether the market’s moving up, down, or sideways, we always encourage our clients to stay focused on our four principles for investment success: Create clear, appropriate investment goals; develop a suitable asset allocation using broadly diversified funds; minimize cost; and maintain perspective and long-term discipline. (You can read more in Vanguard’s Principles for Investment Success, available at vanguard.com/research.)
As always, thank you for investing with Vanguard.
Sincerely,

F. William McNabb III
Chairman and Chief Executive Officer
August 13, 2014
6
Advisors’ Report
Vanguard Energy Fund returned 14.68% for Investor Shares and 14.71% for Admiral Shares for the six months ended July 31. The fund’s result lagged the 16.11% return of its benchmark index but outperformed the average return of global natural resources peer funds. Your fund is managed by two advisors, a strategy that enhances the fund’s diversification by providing exposure to distinct yet complementary investment approaches. It’s not uncommon for different advisors to have different views about individual securities or the broader investment environment.
The advisors, the amount and percentage of fund assets each manages, and brief descriptions of their investment strategies are presented in the table below. The advisors have also provided a discussion of the investment environment that existed during the period and of how their portfolio positioning reflects this assessment. These reports were prepared on August 12, 2014.
| | | |
| Vanguard Energy Fund Investment Advisors | |
| |
| | Fund Assets Managed | |
| Investment Advisor | % | $ Million | Investment Strategy |
| Wellington Management | 94 | 12,581 | Emphasizes long-term total-return opportunities from |
| Company, LLP | | | the various energy subsectors: international oils, |
| | | | foreign integrated oils and foreign producers, North |
| | | | American producers, oil services and equipment, |
| | | | transportation and distribution, and refining and |
| | | | marketing. |
| Vanguard Equity Investment | 3 | 452 | Employs a quantitative fundamental management |
| Group | | | approach using models that assess valuation, |
| | | | management decisions, market sentiment, and |
| | | | earnings and balance-sheet quality of companies as |
| | | | compared with their peers. |
| Cash Investments | 3 | 390 | These short-term reserves are invested by Vanguard in |
| | | | equity index products to simulate investments in stock. |
| | | | Each advisor may also maintain a modest cash |
| | | | position. |
7
Wellington Management Company, LLP
Portfolio Manager:
Karl E. Bandtel, Senior Vice President
The investment environment
Global equities advanced during the six months ended July 31, 2014, but ended on a weaker note as the market pulled back in July. The global energy sector, benefiting from a supportive commodity backdrop, returned more than 16%, significantly outpacing the broad MSCI All Country World Index return of more than 9%.
Natural gas prices peaked in February as prolonged cold weather across the United States brought inventories there and in Canada to historically low levels. The Marcellus shale formation continued to drive supply growth, but production has declined in most other areas. Although much recent price activity, particularly during the winter, was centered on near-term U.S. contracts, longer-dated gas represents one of the lowest-priced hydrocarbons globally. Prices have appreciated from a year ago, but we think that higher prices are needed for natural gas supply to keep up with demand.
Our successes
Top individual contributors to relative returns included our positions in U.S.-based exploration and production companies Pioneer Natural Resources, EOG Resources, and Athlon Energy, all focused on oil shale assets in the Permian and Bakken basins. Our underweighting of Exxon Mobil also helped.
Pioneer Natural Resources has some of the best oil acreage in the Permian Basin, which we believe presents a solid opportunity for value capture and long-term value creation. We remain optimistic about the company’s growth prospects and we increased our position.
EOG Resources has a strong asset portfolio focused primarily in North America with what we believe to be significant upside to current resource estimates. The company has high-quality assets in the Bakken Basin and an experienced management team that is able to allocate capital efficiently. The shares remain attractively priced in our view; we trimmed our position on relative strength.
Our shortfalls
Stock selection within producers, especially among natural gas-focused exploration and production companies, was the main driver of our relative underperformance. A frictional cash position in a rising equity market also weighed on relative results.
Our most significant detractors, also U.S.-based, included Cabot Oil & Gas, Range Resources, and CONSOL Energy. Not owning benchmark constituent Williams Companies, which returned more than 40% during the period, hurt as well.
8
Cabot Oil & Gas develops and explores oil and gas properties in North America. Producers in the Marcellus Formation disappointed as a lack of pipeline infrastructure caused Marcellus gas to trade at a discount. We believe this is a short-term issue; additional pipelines are under construction. Based on Cabot’s high-quality, low-cost assets in the basin, we added to the position on weakness and continue to hold the stock.
U.S.-based independent natural gas exploration and production company Range Resources also underperformed because of the lack of pipeline infrastructure in the Marcellus Formation. We trimmed the holding but maintain a position; we expect that demand and pricing will boost margins, as Range remains well-positioned in the basin.
The fund’s positioning
Our investment strategy emphasizes long-term total-return opportunities from the various energy subsectors. These include international oils, foreign integrated oils, foreign producers, North American producers, oil services and equipment, transportation and distribution, and refining and marketing. The portfolio holds stocks domiciled in 15 different countries. More than 35% of its assets are invested in international stocks (including roughly 5% in emerging markets).
We are excited by several themes within energy, including North American shale first movers and natural gas. The ongoing retirement of coal plants and low gas prices will structurally support increased natural gas demand over a longer time horizon. Total supply levels are still higher than we anticipated, but their growth has slowed. Although rig counts are down, improving results in shale drilling have allowed production to remain at higher levels.
Demand for natural gas continues to grow, with the largest projects expected to come online in the next three to five years. We believe natural gas resource owners represent an attractive opportunity at current prices. We are also excited by select oil shale producers whose growth and value creation potential are under-appreciated by the market as technology advancements progress.
We continue to believe that returns in energy are driven by companies with a track record of capturing attractive reinvestment opportunities. As a result, we tend to favor producers over larger integrated oil companies. We also assess where we are in the capital cycle of each subsector. We currently have some contrarian exposure to several select exploration firms that are investing in areas that others are less excited about.
9
Our low-turnover investment process remains steady and focused on stocks of companies that have clean balance sheets, long-lived resources, and high-quality management teams.
Vanguard Equity Investment Group
Portfolio Managers:
James D. Troyer, CFA, Principal
James P. Stetler, Principal
Michael R. Roach, CFA
Following very strong 2013 results, global equities continued their march upward before pulling back a bit in July. Emerging markets stocks far outperformed those of developed markets.
Central bank policies remained accommodative, and volatility across financial markets stayed at historic lows. In mid-June, the Chicago Board Options Exchange Volatility Index (VIX) registered 10.6, its lowest level in the last five years. Real estate and labor markets persisted in their slow but consistent recovery.
In what now appears to be a short-term dip, first-quarter GDP results were hampered by a difficult winter. However, the economic growth trend then reversed back to 2013 levels, as indicated by strong second-quarter growth of 4%. Lastly, bond credit spreads have decreased to a level not seen since 2006, an indicator of risk-taking and optimism that can drive equity markets higher.
Energy stocks produced especially strong results relative to the rest of the market. Performance within the sector was broad-based, and most countries generated positive returns. Turkish and Brazilian companies had some of the highest returns; those domiciled in Greece and Hungary had the largest declines.
Although it’s important to understand how overall portfolio performance is affected by the macro factors described above, our approach to investing focuses on specific stock fundamentals. We do not take a stand on the overall market for energy stocks. Nor do we attempt to make predictions about different geographic regions.
Our process seeks to compare all stocks in our investment universe in order to identify those that have characteristics we believe will help them outperform over the long run. To do this, we use a strict quantitative process that focuses on a combination of valuation and other factors focused on fundamental growth. Using the results of our model, we then construct our portfolio, with the goal of maximizing expected return and minimizing exposure to risks that our research indicates do not improve returns, such as market capitalization and other risks relative to our benchmark.
10
Over this period, our most successful overweights included Newfield Exploration (+62.7%), Bharat Petroleum (+65.5%), and First Solar (+34.08%). An important part of our performance came from underweighting companies that did not do well, such as Cabot Oil & Gas (–17.5%) and Range Resources (–12.2%).
Results were dragged down by overweighted positions in MOL Hungarian Oil & Gas (–17.6%) and Aker Solutions (–13.55%). Not holding Concho Resources and Cheniere Energy also hurt, as both had exceptionally strong double-digit gains.
Although it is difficult to predict the direction of the overall market, let alone a specific subset, we are confident that our model should continue capturing the relative attractiveness of individual stocks. Solid fundamentals remain one of the main drivers of our strategy, which we believe the market will reward in the long run. We thank you for your investment and look forward to the second half of the fiscal year.
11
Energy Fund
Fund Profile
As of July 31, 2014
| | |
| Share-Class Characteristics | |
| | Investor | Admiral |
| | Shares | Shares |
| Ticker Symbol | VGENX | VGELX |
| Expense Ratio1 | 0.38% | 0.32% |
| 30-Day SEC Yield | 1.60% | 1.66% |
| | | |
| Portfolio Characteristics | | |
| | | | DJ |
| | | | U.S. |
| | | | Total |
| | | MSCI | Market |
| | | ACWI | FA |
| | Fund | Energy | Index |
| Number of Stocks | 137 | 167 | 3,718 |
| Median Market Cap | $54.0B | $69.7B | $48.5B |
| Price/Earnings Ratio | 16.9x | 16.1x | 20.2x |
| Price/Book Ratio | 1.9x | 1.7x | 2.6x |
| Return on Equity | 13.0% | 15.0% | 17.5% |
| Earnings Growth | | | |
| Rate | 2.8% | 4.9% | 14.8% |
| Dividend Yield | 2.0% | 2.9% | 1.9% |
| Foreign Holdings | 38.0% | 48.8% | 0.0% |
| Turnover Rate | | | |
| (Annualized) | 21% | — | — |
| Short-Term Reserves | 2.8% | — | — |
| | |
| Subindustry Diversification (% of equity | |
| exposure) | | |
| | | MSCI |
| | | ACWI |
| | Fund | Energy |
| Coal & Consumable Fuels | 2.6% | 1.2% |
| Industrials | 0.5 | 0.0 |
| Integrated Oil & Gas | 41.4 | 51.8 |
| Oil & Gas Drilling | 0.9 | 2.0 |
| Oil & Gas Equipment & | | |
| Services | 9.6 | 10.5 |
| Oil & Gas Exploration & | | |
| Production | 35.1 | 22.3 |
| Oil & Gas Refining & | | |
| Marketing | 4.9 | 5.5 |
| Oil & Gas Storage & | | |
| Transportation | 2.4 | 6.7 |
| Other | 2.6 | 0.0 |
| | |
| Volatility Measures | | |
| | | DJ |
| | MSCI | U.S. Total |
| | ACWI | Market |
| | Energy | FA Index |
| R-Squared | 0.98 | 0.80 |
| Beta | 1.05 | 1.43 |
| These measures show the degree and timing of the fund’s fluctuations compared with the indexes over 36 months. |
|
| | |
| Ten Largest Holdings (% of total net assets) |
| Exxon Mobil Corp. | Integrated Oil & Gas | 8.2% |
| Royal Dutch Shell plc | Integrated Oil & Gas | 5.1 |
| Chevron Corp. | Integrated Oil & Gas | 5.0 |
| Schlumberger Ltd. | Oil & Gas Equipment | |
| | & Services | 4.3 |
| Pioneer Natural | Oil & Gas Exploration | |
| Resources Co. | & Production | 3.7 |
| BP plc | Integrated Oil & Gas | 3.3 |
| EOG Resources Inc. | Oil & Gas Exploration | |
| | & Production | 3.2 |
| Total SA | Integrated Oil & Gas | 2.8 |
| Baker Hughes Inc. | Oil & Gas Equipment | |
| | & Services | 2.3 |
| Anadarko Petroleum | Oil & Gas Exploration | |
| Corp. | & Production | 2.3 |
| Top Ten | | 40.2% |
| The holdings listed exclude any temporary cash investments and equity index products. |
|
1 The expense ratios shown are from the prospectus dated May 27, 2014, and represent estimated costs for the current fiscal year. For the sixmonths ended July 31, 2014, the annualized expense ratios were 0.37% for Investor Shares and 0.31% for Admiral Shares.12
Energy Fund
Market Diversification (% of equity exposure)
| |
| Europe | |
| United Kingdom | 10.5% |
| France | 2.9 |
| Italy | 1.8 |
| Other | 2.7 |
| Subtotal | 17.9% |
| Pacific | |
| Japan | 1.3% |
| Other | 0.7 |
| Subtotal | 2.0% |
| Emerging Markets | |
| Russia | 2.2% |
| China | 1.7 |
| Brazil | 1.2 |
| India | 1.0 |
| Subtotal | 6.1% |
| North America | |
| United States | 63.4% |
| Canada | 10.6 |
| Subtotal | 74.0% |
13
Energy Fund
Performance Summary
All of the returns in this report represent past performance, which is not a guarantee of future results that may be achieved by the fund. (Current performance may be lower or higher than the performance data cited. For performance data current to the most recent month-end, visit our website at vanguard.com/performance.) Note, too, that both investment returns and principal value can fluctuate widely, so an investor’s shares, when sold, could be worth more or less than their original cost. The returns shown do not reflect taxes that a shareholder would pay on fund distributions or on the sale of fund shares.
Fiscal-Year Total Returns (%): January 31, 2004, Through July 31, 2014
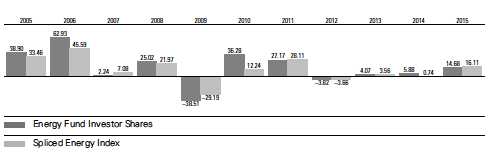
For a benchmark description, see the Glossary.
Note: For 2015, performance data reflect the six months ended July 31, 2014.
Average Annual Total Returns: Periods Ended June 30, 2014
This table presents returns through the latest calendar quarter—rather than through the end of the fiscal period.
Securities and Exchange Commission rules require that we provide this information.
| | | | |
| | Inception | One | Five | Ten |
| | Date | Year | Years | Years |
| Investor Shares | 5/23/1984 | 30.61% | 13.23% | 13.14% |
| Admiral Shares | 11/12/2001 | 30.70 | 13.30 | 13.21 |
See Financial Highlights for dividend and capital gains information.
14
Energy Fund
Financial Statements (unaudited)
Statement of Net Assets
As of July 31, 2014
The fund reports a complete list of its holdings in regulatory filings four times in each fiscal year, at the quarter-ends. For the second and fourth fiscal quarters, the lists appear in the fund’s semiannual and annual reports to shareholders. For the first and third fiscal quarters, the fund files the lists with the Securities and Exchange Commission on Form N-Q. Shareholders can look up the fund’s Forms N-Q on the SEC’s website at sec.gov. Forms N-Q may also be reviewed and copied at the SEC’s Public Reference Room (see the back cover of this report for further information).
| | | |
| | | | Market |
| | | | Value |
| | | Shares | ($000) |
| Common Stocks (94.9%)1 | | |
| United States (58.7%) | | |
| Construction & Engineering (0.3%) | |
| | KBR Inc. | 1,953,200 | 40,353 |
| |
| Energy Equipment & Services (10.0%) | |
| | Schlumberger Ltd. | 5,349,319 | 579,813 |
| | Baker Hughes Inc. | 4,442,170 | 305,488 |
| | Halliburton Co. | 3,854,872 | 265,948 |
| | Ensco plc Class A | 2,110,124 | 106,878 |
| * | SEACOR Holdings Inc. | 960,253 | 72,941 |
| | Helmerich & Payne Inc. | 33,300 | 3,538 |
| | Nabors Industries Ltd. | 121,600 | 3,303 |
| | Patterson-UTI Energy Inc. | 85,700 | 2,944 |
| * | Seventy Seven Energy Inc. | 94,900 | 2,128 |
| | National Oilwell Varco Inc. | 24,476 | 1,983 |
| | | | 1,344,964 |
| Oil, Gas & Consumable Fuels (48.0%) | |
| | Coal & Consumable Fuels (2.0%) | |
| | CONSOL Energy Inc. | 7,038,985 | 273,253 |
| |
| | Integrated Oil & Gas (15.5%) | |
| | Exxon Mobil Corp. | 11,124,594 | 1,100,667 |
| | Chevron Corp. | 5,172,040 | 668,434 |
| | Occidental | | |
| | Petroleum Corp. | 2,284,923 | 223,260 |
| | Hess Corp. | 938,339 | 92,877 |
| |
| | Oil & Gas Exploration & Production (27.0%) |
| | Pioneer Natural | | |
| | Resources Co. | 2,231,765 | 494,247 |
| | EOG Resources Inc. | 3,878,782 | 424,494 |
| | Anadarko Petroleum Corp. 2,831,400 | 302,535 |
| | Cabot Oil & Gas Corp. | 8,087,914 | 266,497 |
| | Range Resources Corp. | 2,981,190 | 225,348 |
| | Noble Energy Inc. | 3,015,678 | 200,512 |
| | ConocoPhillips | 2,259,309 | 186,393 |
| | EQT Corp. | 1,835,470 | 172,204 |
| * | Southwestern Energy Co. | 4,192,585 | 170,135 |
| * | Antero Resources Corp. | 2,769,605 | 159,972 |
| | | |
| | | | Market |
| | | | Value |
| | | Shares | ($000) |
| | Energen Corp. | 1,812,517 | 147,956 |
| | Denbury Resources Inc. | 8,530,204 | 144,587 |
| | Devon Energy Corp. | 1,422,725 | 107,416 |
| * | Athlon Energy Inc. | 2,099,476 | 100,061 |
| * | Whiting Petroleum Corp. | 1,072,555 | 94,910 |
| | Apache Corp. | 866,350 | 88,940 |
| * | Cobalt International | | |
| | Energy Inc. | 4,071,172 | 65,220 |
| * | Diamondback Energy Inc. | 701,425 | 57,678 |
| | Energy XXI Bermuda Ltd. | 2,855,600 | 56,998 |
| | QEP Resources Inc. | 1,652,573 | 54,618 |
| | Murphy Oil Corp. | 645,300 | 40,092 |
| * | Gulfport Energy Corp. | 591,400 | 31,587 |
| * | Memorial Resource | | |
| | Development Corp. | 411,800 | 9,463 |
| | Marathon Oil Corp. | 148,320 | 5,747 |
| | Chesapeake Energy Corp. | 167,200 | 4,409 |
| * | Newfield Exploration Co. | 77,000 | 3,103 |
| * | Ultra Petroleum Corp. | 100,900 | 2,313 |
| |
| | Oil & Gas Refining & Marketing (3.5%) |
| | Phillips 66 | 2,038,984 | 165,382 |
| | Marathon Petroleum Corp. 1,674,350 | 139,775 |
| | Valero Energy Corp. | 2,506,884 | 127,350 |
| | HollyFrontier Corp. | 727,100 | 34,181 |
| |
| | Oil & Gas Storage & Transportation (0.0%) |
| | Williams Cos. Inc. | 49,400 | 2,797 |
| | Kinder Morgan Inc. | 15,973 | 575 |
| | | | 6,445,986 |
| Other (0.4%) | | |
| ^,2 | Vanguard Energy ETF | 363,000 | 50,305 |
| |
| Semiconductors & | | |
| Semiconductor Equipment (0.0%) | |
| * | First Solar Inc. | 3,700 | 233 |
| |
| Trading Companies & Distributors (0.0%) | |
| * | NOW Inc. | 73,900 | 2,379 |
| Total United States | | 7,884,220 |
15
Energy Fund
| | | |
| | | | Market |
| | | | Value |
| | | Shares | ($000) |
| International (36.2%) | | |
| Australia (0.7%) | | |
| | Oil Search Ltd. | 10,115,898 | 88,478 |
| | Woodside Petroleum Ltd. | 44,269 | 1,738 |
| | | | 90,216 |
| Austria (0.0%) | | |
| | OMV AG | 65,295 | 2,626 |
| |
| Brazil (1.2%) | | |
| | Petroleo Brasileiro | | |
| | SA ADR | 9,828,525 | 156,667 |
| | Petroleo Brasileiro SA | | |
| | Preference Shares | 368,044 | 3,098 |
| | Petroleo Brasileiro SA | 249,132 | 1,975 |
| | Petroleo Brasileiro SA | | |
| | ADR Type A | 12,400 | 209 |
| | | | 161,949 |
| Canada (10.4%) | | |
| | Suncor Energy Inc. XNYS | 6,858,682 | 281,686 |
| | Canadian Natural | | |
| | Resources Ltd. XNYS | 4,813,443 | 209,866 |
| | Cenovus Energy Inc. | | |
| | XNYS | 5,064,180 | 155,470 |
| | Enbridge Inc. XTSE | 3,077,800 | 150,751 |
| | Encana Corp. XNYS | 4,668,790 | 100,612 |
| * | Tourmaline Oil Corp. | 2,090,870 | 98,431 |
| | TransCanada Corp. XNYS | 1,607,100 | 80,628 |
| | Pacific Rubiales | | |
| | Energy Corp. | 3,931,795 | 75,185 |
| | Cameco Corp. | 3,418,370 | 68,914 |
| * | Paramount Resources | | |
| | Ltd. Class A | 1,110,200 | 56,795 |
| | Imperial Oil Ltd. | 761,200 | 39,080 |
| ^ | Keyera Corp. | 377,400 | 28,251 |
| ^ | Trilogy Energy Corp. | 702,500 | 17,879 |
| | Suncor Energy Inc. XTSE | 246,534 | 10,123 |
| | Canadian Natural | | |
| | Resources Ltd. XTSE | 194,278 | 8,469 |
| | Encana Corp. XTSE | 198,600 | 4,277 |
| | Husky Energy Inc. | 103,700 | 3,155 |
| | Enbridge Inc. XNYS | 54,150 | 2,655 |
| | TransCanada Corp. XTSE | 36,796 | 1,846 |
| | Cenovus Energy Inc. XTSE | 21,739 | 668 |
| | | | 1,394,741 |
| China (1.7%) | | |
| ^ | PetroChina Co. Ltd. ADR | 1,132,485 | 146,170 |
| | Kunlun Energy Co. Ltd. | 37,747,555 | 64,111 |
| | PetroChina Co. Ltd. | 4,562,000 | 5,913 |
| | China Petroleum & | | |
| | Chemical Corp. | 5,725,600 | 5,605 |
| * | GCL-Poly Energy | | |
| | Holdings Ltd. | 8,615,000 | 2,781 |
| | CNOOC Ltd. | 697,717 | 1,234 |
| | China Oilfield Services Ltd. | 140,000 | 349 |
| | | | 226,163 |
| | | |
| | | | Market |
| | | | Value |
| | | Shares | ($000) |
| Denmark (0.0%) | | |
| * | Vestas Wind Systems A/S | 75,881 | 3,421 |
| |
| Finland (0.0%) | | |
| | Neste Oil Oyj | 138,698 | 2,563 |
| |
| France (2.9%) | | |
| | Total SA ADR | 5,638,520 | 363,685 |
| | Total SA | 289,354 | 18,662 |
| | | | 382,347 |
| Hong Kong (0.0%) | | |
| * | Brightoil Petroleum | | |
| | Holdings Ltd. | 2,679,000 | 815 |
| |
| Hungary (0.0%) | | |
| | MOL Hungarian Oil & | | |
| | Gas plc | 50,194 | 2,428 |
| |
| India (1.0%) | | |
| | Reliance Industries Ltd. | 7,258,700 | 119,899 |
| | Oil & Natural | | |
| | Gas Corp. Ltd. | 568,970 | 3,696 |
| * | Essar Oil Ltd. | 1,334,155 | 2,526 |
| | Bharat Petroleum | | |
| | Corp. Ltd. | 263,535 | 2,510 |
| | Indian Oil Corp. Ltd. | 450,622 | 2,457 |
| | Hindustan Petroleum | | |
| | Corp. Ltd. | 354,534 | 2,326 |
| * | Mangalore Refinery & | | |
| | Petrochemicals Ltd. | 1,071,676 | 1,146 |
| | GAIL India Ltd. | 45,395 | 326 |
| | Cairn India Ltd. | 55,189 | 287 |
| | | | 135,173 |
| Israel (0.0%) | | |
| | Paz Oil Co. Ltd. | 15,542 | 2,496 |
| |
| Italy (1.7%) | | |
| ^ | Eni SPA ADR | 4,482,005 | 227,686 |
| | Eni SPA | 240,352 | 6,116 |
| | | | 233,802 |
| Japan (1.3%) | | |
| | Inpex Corp. | 10,910,400 | 161,699 |
| | Showa Shell Sekiyu KK | 244,300 | 2,755 |
| | Cosmo Oil Co. Ltd. | 1,248,000 | 2,502 |
| | | | 166,956 |
| Netherlands (0.6%) | | |
| | Koninklijke Vopak NV | 1,433,327 | 66,349 |
| | Fugro NV | 285,967 | 11,012 |
| | | | 77,361 |
| Norway (0.7%) | | |
| ^ | Statoil ASA ADR | 2,476,590 | 70,434 |
| * | DNO ASA | 5,277,707 | 17,677 |
| | Statoil ASA | 197,859 | 5,654 |
| | Aker Solutions ASA | 160,224 | 2,365 |
| | | | 96,130 |
16
Energy Fund
| | |
| | | Market |
| | | Value |
| | Shares | ($000) |
| Poland (0.0%) | | |
| * Polskie Gornictwo | | |
| Naftowe i | | |
| Gazownictwo SA | 1,680,339 | 2,601 |
| |
| Portugal (0.7%) | | |
| Galp Energia SGPS SA | 5,442,953 | 96,609 |
| |
| Russia (2.2%) | | |
| Rosneft OAO GDR | 21,926,239 | 135,290 |
| Gazprom OAO ADR | 13,083,293 | 95,465 |
| Lukoil OAO ADR | 950,406 | 52,986 |
| Tatneft OAO ADR | 93,030 | 3,307 |
| Gazprom OAO | 124,674 | 457 |
| Surgutneftegas OAO ADR | 30,690 | 212 |
| | | 287,717 |
| Singapore (0.0%) | | |
| Sembcorp Industries Ltd. | 646,000 | 2,829 |
| |
| South Africa (0.1%) | | |
| Sasol Ltd. | 110,232 | 6,359 |
| |
| South Korea (0.0%) | | |
| SK Holdings Co. Ltd. | 16,388 | 2,776 |
| |
| Spain (0.7%) | | |
| Repsol SA | 3,678,522 | 91,734 |
| |
| Thailand (0.0%) | | |
| PTT Exploration & | | |
| Production PCL (Foreign) | 645,100 | 3,240 |
| * PTT Global Chemical PCL | 211,600 | 431 |
| PTT PCL (Foreign) | 36,900 | 365 |
| | | 4,036 |
| Turkey (0.0%) | | |
| Tupras Turkiye Petrol | | |
| Rafinerileri AS | 114,306 | 2,794 |
| |
| United Kingdom (10.3%) | | |
| Royal Dutch Shell | | |
| plc ADR | 7,946,585 | 650,269 |
| BP plc ADR | 8,689,185 | 425,509 |
| BG Group plc | 9,989,115 | 196,979 |
| * Ophir Energy plc | 13,649,538 | 49,497 |
| BP plc | 2,583,954 | 21,043 |
| | | |
| | | | Market |
| | | | Value |
| | | Shares | ($000) |
| | Royal Dutch Shell plc | | |
| | Class A | 331,089 | 13,613 |
| | Royal Dutch Shell plc | | |
| | Class B | 281,866 | 12,138 |
| ^ | Royal Dutch Shell plc | | |
| | Class A | | |
| | (Amsterdam Shares) | 142,991 | 5,880 |
| * | Cairn Energy plc | 1 | — |
| | | | 1,374,928 |
| Total International | | 4,851,570 |
| Total Common Stocks | | |
| (Cost $7,097,293) | | 12,735,790 |
| Temporary Cash Investments (6.0%)1 | |
| Money Market Fund (3.1%) | | |
| 3,4 | Vanguard Market Liquidity | |
| | Fund, 0.118% | 415,373,064 | 415,373 |
| |
| | | Face | |
| | | Amount | |
| | | ($000) | |
| Repurchase Agreement (2.8%) | |
| | RBS Securities, Inc. | | |
| | 0.070%, 8/1/14 (Dated | | |
| | 7/31/14, Repurchase | | |
| | Value $369,901,000, | | |
| | collateralized by U.S | | |
| | Treasury Note/Bonds | | |
| | 0.250%–4.250%, | | |
| | 8/15/14–8/15/23, with a | | |
| | value of $377,300,000) | 369,900 | 369,900 |
| |
| U.S. Government and Agency Obligations (0.1%) |
| 5, | Federal Home Loan | | |
| | Bank Discount Notes, | | |
| | 0.053%–0.060%, | | |
| | 8/1/14 | 2,600 | 2,600 |
| 5,6 | Federal Home Loan | | |
| | Bank Discount Notes, | | |
| | 0.060%, 8/13/14 | 1,000 | 1,000 |
| 5 | Federal Home Loan | | |
| | Bank Discount Notes, | | |
| | 0.075%, 9/3/14 | 500 | 500 |
| 5,6 | Federal Home Loan | | |
| | Bank Discount Notes, | | |
| | 0.081%, 9/19/14 | 1,000 | 1,000 |
17
Energy Fund
| | | |
| | | Face | Market |
| | | Amount | Value |
| | | ($000) | ($000) |
| 5,6 | Federal Home Loan | | |
| | Bank Discount Notes, | | |
| | 0.080%–0.090%, | | |
| | 9/24/14 | 5,000 | 5,000 |
| 5,6 | Federal Home Loan | | |
| | Bank Discount Notes, | | |
| | 0.078%, 10/1/14 | 5,800 | 5,799 |
| 5,6 | Federal Home Loan | | |
| | Bank Discount Notes, | | |
| | 0.079%–0.080%, 10/8/14 | 4,000 | 4,000 |
| 5,6 | Federal Home Loan | | |
| | Bank Discount Notes, | | |
| | 0.095%, 10/15/14 | 100 | 100 |
| | | | 19,999 |
| Total Temporary Cash Investments | |
| (Cost $805,271) | | 805,272 |
| Total Investments (100.9%) | | |
| (Cost $7,902,564) | | 13,541,062 |
| Other Assets and Liabilities (-0.9%) | |
| Other Assets | | 107,253 |
| Liabilities3 | | (225,425) |
| | | | (118,172) |
| Net Assets (100%) | | 13,422,890 |
| |
| At July 31, 2014, net assets consisted of: |
| | Amount |
| | ($000) |
| Paid-in Capital | 7,357,927 |
| Undistributed Net Investment Income | 102,192 |
| Accumulated Net Realized Gains | 325,872 |
| Unrealized Appreciation (Depreciation) | |
| Investment Securities | 5,638,498 |
| Futures Contracts | (1,604) |
| Foreign Currencies | 5 |
| Net Assets | 13,422,890 |
| |
| |
| Investor Shares—Net Assets | |
| Applicable to 60,985,775 outstanding | |
| $.001 par value shares of beneficial | |
| interest (unlimited authorization) | 4,451,266 |
| Net Asset Value Per Share— | |
| Investor Shares | $72.99 |
| |
| |
| Admiral Shares—Net Assets | |
| Applicable to 65,475,006 outstanding | |
| $.001 par value shares of beneficial | |
| interest (unlimited authorization) | 8,971,624 |
| Net Asset Value Per Share— | |
| Admiral Shares | $137.02 |
• See Note A in Notes to Financial Statements.
*Non-income-producing security.
^ Includes partial security positions on loan to broker-dealers. The total value of securities on loan is $78,639,000.
1 The fund invests a portion of its cash reserves in equity markets through the use of index futures contracts. After giving effect to furtures investments, the funds's effective common stock and temporary cash investment positions represents 97.5% and 3.4%, respectively, of net assets.
2 Considered an affiliated company of the fund as the issuer is another member of The Vanguard Group.
3 Includes $83,138,000 of collateral received for securities on loan.
4 Affiliated money market fund available only to Vanguard funds and certain trusts and accounts managed by Vanguard. Rate shown is the 7-day yield.
5The issuer operates under a congressional charter; its securities are generally neither guaranteed by the U.S. Treasury no backed by the full faith and credit of the U.S. governement.
6 Securities with a value of $16,699,000 have been segregated as initial margin for open futures contracts.
ADR-- American Depositary Receipt.
GDR-- Global Depositary Receipt.
See accompanying Notes, which are an integral part of the Financial Statements.
18
Energy Fund
Statement of Operations
| |
| | Six Months Ended |
| | July 31, 2014 |
| | ($000) |
| Investment Income | |
| Income | |
| Dividends1,2 | 145,899 |
| Interest2 | 205 |
| Securities Lending | 3,783 |
| Total Income | 149,887 |
| Expenses | |
| Investment Advisory Fees—Note B | |
| Basic Fee | 9,255 |
| Performance Adjustment | 2,249 |
| The Vanguard Group—Note C | |
| Management and Administrative—Investor Shares | 3,858 |
| Management and Administrative—Admiral Shares | 4,928 |
| Marketing and Distribution—Investor Shares | 388 |
| Marketing and Distribution—Admiral Shares | 659 |
| Custodian Fees | 196 |
| Shareholders’ Reports—Investor Shares | 38 |
| Shareholders’ Reports—Admiral Shares | 14 |
| Trustees’ Fees and Expenses | 12 |
| Total Expenses | 21,597 |
| Expenses Paid Indirectly | (71) |
| Net Expenses | 21,526 |
| Net Investment Income | 128,361 |
| Realized Net Gain (Loss) | |
| Investment Securities Sold2 | 312,890 |
| Futures Contracts | 10,216 |
| Foreign Currencies | (61) |
| Realized Net Gain (Loss) | 323,045 |
| Change in Unrealized Appreciation (Depreciation) | |
| Investment Securities | 1,247,984 |
| Futures Contracts | 2,408 |
| Foreign Currencies | 63 |
| Change in Unrealized Appreciation (Depreciation) | 1,250,455 |
| Net Increase (Decrease) in Net Assets Resulting from Operations | 1,701,861 |
1 Dividends are net of foreign withholding taxes of $12,182,000. 2 Dividend income, interest income, and realized net gain (loss) from affiliated companies of the fund were $0,$126,000, and $0, respectively.See accompanying Notes, which are an integral part of the Financial Statements.
19
Energy Fund
Statement of Changes in Net Assets
| | |
| | Six Months Ended | Year Ended |
| | July 31, | January 31, |
| | 2014 | 2014 |
| | ($000) | ($000) |
| Increase (Decrease) in Net Assets | | |
| Operations | | |
| Net Investment Income | 128,361 | 241,331 |
| Realized Net Gain (Loss) | 323,045 | 322,801 |
| Change in Unrealized Appreciation (Depreciation) | 1,250,455 | 126,151 |
| Net Increase (Decrease) in Net Assets Resulting from Operations | 1,701,861 | 690,283 |
| Distributions | | |
| Net Investment Income | | |
| Investor Shares | — | (84,107) |
| Admiral Shares | — | (153,175) |
| Realized Capital Gain1 | | |
| Investor Shares | (13,933) | (78,608) |
| Admiral Shares | (25,435) | (143,323) |
| Total Distributions | (39,368) | (459,213) |
| Capital Share Transactions | | |
| Investor Shares | (275,666) | (1,350,467) |
| Admiral Shares | 358,237 | 678,643 |
| Net Increase (Decrease) from Capital Share Transactions | 82,571 | (671,824) |
| Total Increase (Decrease) | 1,745,064 | (440,754) |
| Net Assets | | |
| Beginning of Period | 11,677,826 | 12,118,580 |
| End of Period2 | 13,422,890 | 11,677,826 |
1 Includes fiscal 2015 and 2014 short-term gain distributions totaling $0 and $6,818,000. Short-term gain distributions are treated as ordinary income dividends for tax purposes.2 Net Assets-- End of Period includes undistributed (overdistributed) net investment income of $102192,000 and ($26,108,000).See accompanying Notes, which are an integral part of the Financial Statements.
20
Energy Fund
Financial Highlights
| | | | | | |
| Investor Shares | | | | | | |
| Six Months | | | | | |
| | Ended | | | | | |
| For a Share Outstanding | July 31, | Year Ended January 31, |
| Throughout Each Period | 2014 | 2014 | 2013 | 2012 | 2011 | 2010 |
| Net Asset Value, Beginning of Period | $63.85 | $62.66 | $62.60 | $69.20 | $57.17 | $42.62 |
| Investment Operations | | | | | | |
| Net Investment Income | .682 | 1.291 | 1.336 | 1.072 | 1.053 | .910 |
| Net Realized and Unrealized Gain (Loss) | | | | | | |
| on Investments | 8.675 | 2.413 | 1.098 | (3.949) | 14.103 | 14.591 |
| Total from Investment Operations | 9.357 | 3.704 | 2.434 | (2.877) | 15.156 | 15.501 |
| Distributions | | | | | | |
| Dividends from Net Investment Income | — | (1.277) | (1.340) | (1.102) | (.977) | (.951) |
| Distributions from Realized Capital Gains | (.217) | (1.237) | (1.034) | (2.621) | (2.149) | — |
| Total Distributions | (.217) | (2.514) | (2.374) | (3.723) | (3.126) | (.951) |
| Net Asset Value, End of Period | $72.99 | $63.85 | $62.66 | $62.60 | $69.20 | $57.17 |
| |
| Total Return1 | 14.68% | 5.88% | 4.07% | -3.82% | 27.17% | 36.28% |
| |
| Ratios/Supplemental Data | | | | | | |
| Net Assets, End of Period (Millions) | $4,451 | $4,138 | $5,340 | $5,945 | $6,731 | $6,536 |
| Ratio of Total Expenses to | | | | | | |
| Average Net Assets2 | 0.37% | 0.38% | 0.31% | 0.34% | 0.34% | 0.38% |
| Ratio of Net Investment Income to | | | | | | |
| Average Net Assets | 1.95% | 1.97% | 2.15% | 1.67% | 1.74% | 1.73% |
| Portfolio Turnover Rate | 21% | 17% | 18% | 24% | 31% | 27% |
The expense ratio, net income ratio, and turnover rate for the current period have been annualized.1 Total returns do not include transaction or account service fees that may have applied in the periods shown. Fund prospectuses provide information about any applicable transaction and account services fees. 2 Includes performance-based investment advisory fee increases (decreases) of 0.03%, 0.04%, (0.02%), 0.01%, 0.00%, and 0.03%.See accompanying Notes, which are an integral part of the Financial Statements.
21
Energy Fund
Financial Highlights
| | | | | | |
| Admiral Shares | | | | | | |
| Six Months | | | | | |
| | Ended | | | | | |
| For a Share Outstanding | July 31, | Year Ended January 31, |
| Throughout Each Period | 2014 | 2014 | 2013 | 2012 | 2011 | 2010 |
| Net Asset Value, Beginning of Period | $119.83 | $117.63 | $117.52 | $129.93 | $107.34 | $80.02 |
| Investment Operations | | | | | | |
| Net Investment Income | 1.326 | 2.530 | 2.586 | 2.101 | 2.045 | 1.780 |
| Net Realized and Unrealized Gain (Loss) | | | | | | |
| on Investments | 16.271 | 4.491 | 2.060 | (7.432) | 26.479 | 27.395 |
| Total from Investment Operations | 17.597 | 7.021 | 4.646 | (5.331) | 28.524 | 29.175 |
| Distributions | | | | | | |
| Dividends from Net Investment Income | — | (2.500) | (2.595) | (2.159) | (1.899) | (1.855) |
| Distributions from Realized Capital Gains | (.407) | (2.321) | (1.941) | (4.920) | (4.035) | — |
| Total Distributions | (.407) | (4.821) | (4.536) | (7.079) | (5.934) | (1.855) |
| Net Asset Value, End of Period | $137.02 | $119.83 | $117.63 | $117.52 | $129.93 | $107.34 |
| |
| Total Return1 | 14.71% | 5.94% | 4.14% | -3.76% | 27.24% | 36.37% |
| |
| Ratios/Supplemental Data | | | | | | |
| Net Assets, End of Period (Millions) | $8,972 | $7,540 | $6,778 | $6,756 | $6,871 | $4,439 |
| Ratio of Total Expenses to | | | | | | |
| Average Net Assets2 | 0.31% | 0.32% | 0.26% | 0.28% | 0.28% | 0.31% |
| Ratio of Net Investment Income to | | | | | | |
| Average Net Assets | 2.01% | 2.03% | 2.20% | 1.73% | 1.80% | 1.80% |
| Portfolio Turnover Rate | 21% | 17% | 18% | 24% | 31% | 27% |
The expense ratio, net income ratio, and turnover rate for the current period have been annualized.
1 Total returns do not include transaction or account service fees that may have applied in the periods shown. Fund prospectuses provide information about any applicable transaction and account services fees.
2 Includes performance-based investment advisory fee increases (decreases) of 0.03%, 0.04%, (0.02%), 0.01%, 0.00%, and 0.03%.
See accompanying Notes, which are an integral part of the Financial Statements.
22
Energy Fund
Notes to Financial Statements
Vanguard Energy Fund is registered under the Investment Company Act of 1940 as an open-end investment company, or mutual fund. The fund invests in securities of foreign issuers, which may subject it to investment risks not normally associated with investing in securities of U.S. corporations. The fund offers two classes of shares: Investor Shares and Admiral Shares. Investor Shares are available to any investor who meets the fund’s minimum purchase requirements. Admiral Shares are designed for investors who meet certain administrative, service, and account-size criteria.
A. The following significant accounting policies conform to generally accepted accounting principles for U.S. investment companies. The fund consistently follows such policies in preparing its financial statements.
1. Security Valuation: Securities are valued as of the close of trading on the New York Stock Exchange (generally 4 p.m., Eastern time) on the valuation date. Equity securities are valued at the latest quoted sales prices or official closing prices taken from the primary market in which each security trades; such securities not traded on the valuation date are valued at the mean of the latest quoted bid and asked prices. Securities for which market quotations are not readily available, or whose values have been affected by events occurring before the fund’s pricing time but after the close of the securities’ primary markets, are valued at their fair values calculated according to procedures adopted by the board of trustees. These procedures include obtaining quotations from an independent pricing service, monitoring news to identify significant market- or security-specific events, and evaluating changes in the values of foreign market proxies (for example, ADRs, futures contracts, or exchange-traded funds), between the time the foreign markets close and the fund’s pricing time. When fair-value pricing is employed, the prices of securities used by a fund to calculate its net asset value may differ from quoted or published prices for the same securities. Investments in Vanguard Market Liquidity Fund are valued at that fund’s net asset value. Temporary cash investments acquired over 60 days to maturity are valued using the latest bid prices or using valuations based on a matrix system (which considers such factors as security prices, yields, maturities, and ratings), both as furnished by independent pricing services. Other temporary cash investments are valued at amortized cost, which approximates market value.
2. Foreign Currency: Securities and other assets and liabilities denominated in foreign currencies are translated into U.S. dollars using exchange rates obtained from an independent third party as of the fund’s pricing time on the valuation date. Realized gains (losses) and unrealized appreciation (depreciation) on investment securities include the effects of changes in exchange rates since the securities were purchased, combined with the effects of changes in security prices. Fluctuations in the value of other assets and liabilities resulting from changes in exchange rates are recorded as unrealized foreign currency gains (losses) until the assets or liabilities are settled in cash, at which time they are recorded as realized foreign currency gains (losses).
3. Futures Contracts: The fund uses index futures contracts to a limited extent, with the objective of maintaining full exposure to the stock market while maintaining liquidity. The fund may purchase or sell futures contracts to achieve a desired level of investment, whether to accommodate portfolio turnover or cash flows from capital share transactions. The primary risks associated with the use of futures contracts are imperfect correlation between changes in market values of stocks held by the fund and the prices of futures contracts, and the possibility of an illiquid market. Counterparty risk involving futures is mitigated because a regulated clearinghouse is the counterparty instead of the clearing broker. To further mitigate counterparty risk, the fund trades futures contracts on an exchange, monitors the financial strength of its clearing brokers and clearinghouse, and has entered
23
Energy Fund
into clearing agreements with its clearing brokers. The clearinghouse imposes initial margin requirements to secure the fund’s performance and requires daily settlement of variation margin representing changes in the market value of each contract.
Futures contracts are valued at their quoted daily settlement prices. The aggregate notional amounts of the contracts are not recorded in the Statement of Net Assets. Fluctuations in the value of the contracts are recorded in the Statement of Net Assets as an asset (liability) and in the Statement of Operations as unrealized appreciation (depreciation) until the contracts are closed, when they are recorded as realized futures gains (losses).
During the six months ended July 31, 2014, the fund’s average investments in long and short futures contracts represented 2% and 0% of net assets, respectively, based on the average of aggregate settlement values at each quarter-end during the period.
4. Repurchase Agreements: The fund enters into repurchase agreements with institutional counterparties. Securities pledged as collateral to the fund under repurchase agreements are held by a custodian bank until the agreements mature. Each agreement requires that the market value of the collateral be sufficient to cover payments of interest and principal. The fund further mitigates its counterparty risk by entering into repurchase agreements only with a diverse group of prequalified counterparties, monitoring their financial strength, and entering into master repurchase agreements with its counterparties. The master repurchase agreements provide that, in the event of a counterparty’s default (including bankruptcy), the fund may terminate any repurchase agreements with that counterparty, determine the net amount owed, and sell or retain the collateral up to the net amount owed to the fund. Such action may be subject to legal proceedings, which may delay or limit the disposition of collateral.
5. Federal Income Taxes: The fund intends to continue to qualify as a regulated investment company and distribute all of its taxable income. Management has analyzed the fund’s tax positions taken for all open federal income tax years (January 31, 2011–2014), and for the period ended July 31, 2014, and has concluded that no provision for federal income tax is required in the fund’s financial statements.
6. Distributions: Distributions to shareholders are recorded on the ex-dividend date.
7. Securities Lending: To earn additional income, the fund lends its securities to qualified institutional borrowers. Security loans are required to be secured at all times by collateral in an amount at least equal to the market value of securities loaned. Daily market fluctuations could cause the value of loaned securities to be more or less than the value of the collateral received. When this occurs, the collateral is adjusted and settled on the next business day. The fund further mitigates its counterparty risk by entering into securities lending transactions only with a diverse group of prequalified counter-parties, monitoring their financial strength, and entering into master securities lending agreements with its counterparties. The master securities lending agreements provide that, in the event of a counterparty’s default (including bankruptcy), the fund may terminate any loans with that borrower, determine the net amount owed, and sell or retain the collateral up to the net amount owed to the fund; however, such actions may be subject to legal proceedings. While collateral mitigates counterparty risk, in the absence of a default the fund may experience delays and costs in recovering the securities loaned. The fund invests cash collateral received in Vanguard Market Liquidity Fund, and records a liability in the Statement of Net Assets for the return of the collateral, during the period the securities are on loan. Securities lending income represents fees charged to borrowers plus income earned on invested cash collateral, less expenses associated with the loan.
24
Energy Fund
8. Credit Facility: The fund and certain other funds managed by The Vanguard Group participate in a $2.89 billion committed credit facility provided by a syndicate of lenders pursuant to a credit agreement that may be renewed annually; each fund is individually liable for its borrowings, if any, under the credit facility. Borrowings may be utilized for temporary and emergency purposes, and are subject to the fund’s regulatory and contractual borrowing restrictions. The participating funds are charged administrative fees and an annual commitment fee of 0.06% of the undrawn amount of the facility; these fees are allocated to the funds based on a method approved by the fund’s board of trustees and included in Management and Administrative expenses on the fund’s Statement of Operations. Any borrowings under this facility bear interest at a rate equal to the higher of the federal funds rate or LIBOR reference rate plus an agreed-upon spread.
The fund had no borrowings outstanding at July 31, 2014, or at any time during the period then ended.
9. Other: Dividend income is recorded on the ex-dividend date. Interest income includes income distributions received from Vanguard Market Liquidity Fund and is accrued daily. Premiums and discounts on debt securities purchased are amortized and accreted, respectively, to interest income over the lives of the respective securities. Security transactions are accounted for on the date securities are bought or sold. Costs used to determine realized gains (losses) on the sale of investment securities are those of the specific securities sold.
Each class of shares has equal rights as to assets and earnings, except that each class separately bears certain class-specific expenses related to maintenance of shareholder accounts (included in Management and Administrative expenses) and shareholder reporting. Marketing and distribution expenses are allocated to each class of shares based on a method approved by the board of trustees. Income, other non-class-specific expenses, and gains and losses on investments are allocated to each class of shares based on its relative net assets.
B. Wellington Management Company, LLP, provides investment advisory services to a portion of the fund for a fee calculated at an annual percentage rate of average net assets managed by the advisor. The basic fee is subject to quarterly adjustments based on performance for the preceding three years relative to the MSCI ACWI Energy Index.
The Vanguard Group provides investment advisory services to a portion of the fund on an at-cost basis; the fund paid Vanguard advisory fees of $287,000 for the six months ended July 31, 2014.
For the six months ended July 31, 2014, the aggregate investment advisory fee represented an effective annual basic rate of 0.14% of the fund’s average net assets, before an increase of $2,249,000 (0.03%) based on performance.
C. The Vanguard Group furnishes at cost corporate management, administrative, marketing, and distribution services. The costs of such services are allocated to the fund based on methods approved by the board of trustees. The fund has committed to provide up to 0.40% of its net assets in capital contributions to Vanguard. At July 31, 2014, the fund had contributed capital of $1,419,000 to Vanguard (included in Other Assets), representing 0.01% of the fund’s net assets and 0.57% of Vanguard’s capitalization. The fund’s trustees and officers are also directors and officers of Vanguard.
D. The fund has asked its investment advisors to direct certain security trades, subject to obtaining the best price and execution, to brokers who have agreed to rebate to the fund part of the commissions generated. Such rebates are used solely to reduce the fund’s management and administrative expenses. For the six months ended July 31, 2014, these arrangements reduced the fund’s expenses by $71,000 (an annual rate of 0.00% of average net assets).
25
Energy Fund
E. Various inputs may be used to determine the value of the fund’s investments. These inputs are summarized in three broad levels for financial statement purposes. The inputs or methodologies used to value securities are not necessarily an indication of the risk associated with investing in those securities.
Level 1—Quoted prices in active markets for identical securities.
Level 2—Other significant observable inputs (including quoted prices for similar securities, interest rates, prepayment speeds, credit risk, etc.).
Level 3—Significant unobservable inputs (including the fund’s own assumptions used to determine the fair value of investments).
The following table summarizes the market value of the fund’s investments as of July 31, 2014, based on the inputs used to value them:
| | | |
| | Level 1 | Level 2 | Level 3 |
| Investments | ($000) | ($000) | ($000) |
| Common Stocks—United States | 7,884,220 | — | — |
| Common Stocks—International | 3,440,443 | 1,411,127 | — |
| Temporary Cash Investments | 415,373 | 389,899 | — |
| Futures Contracts—Liabilities1 | (7,192) | — | — |
| Total | 11,732,844 | 1,801,026 | — |
| 1 Represents variation margin on the last day of the reporting period. |
F. At July 31, 2014, the aggregate settlement value of open futures contracts and the related unrealized appreciation (depreciation) were:
| | | | |
| | | | ($000) |
| | | | Aggregate | |
| | | Number of | Settlement | Unrealized |
| | | Long (Short) | Value | Appreciation |
| Futures Contracts | Expiration | Contracts | Long (Short) | (Depreciation) |
| S&P 500 Index | September 2014 | 545 | 262,254 | (412) |
| E-mini S&P 500 Index | September 2014 | 844 | 81,227 | (1,192) |
| | | | | (1,604) |
Unrealized appreciation (depreciation) on open futures contracts is required to be treated as realized gain (loss) for tax purposes.
G. Distributions are determined on a tax basis and may differ from net investment income and realized capital gains for financial reporting purposes. Differences may be permanent or temporary. Permanent differences are reclassified among capital accounts in the financial statements to reflect their tax character. Temporary differences arise when certain items of income, expense, gain, or loss are recognized in different periods for financial statement and tax purposes. These differences will reverse at some time in the future. Differences in classification may also result from the treatment of short-term gains as ordinary income for tax purposes. The fund’s tax-basis capital gains and losses are determined only at the end of each fiscal year.
During the six months ended July 31, 2014, the fund realized net foreign currency losses of $61,000, which decreased distributable net income for tax purposes; accordingly, such losses have been reclassified from accumulated net realized gains to undistributed net investment income.
26
Energy Fund
At July 31, 2014, the cost of investment securities for tax purposes was $7,905,314,000. Net unrealized appreciation of investment securities for tax purposes was $5,635,748,000, consisting of unrealized gains of $5,797,795,000 on securities that had risen in value since their purchase and $162,047,000 in unrealized losses on securities that had fallen in value since their purchase.
H. During the six months ended July 31, 2014, the fund purchased $1,268,785,000 of investment securities and sold $1,305,221,000 of investment securities, other than temporary cash investments.
I. Capital share transactions for each class of shares were:
| | | | |
| | Six Months Ended | | Year Ended |
| | July 31, 2014 | January 31, 2014 |
| | Amount | Shares | Amount | Shares |
| | ($000) | (000) | ($000) | (000) |
| Investor Shares | | | | |
| Issued | 347,428 | 4,819 | 502,609 | 7,800 |
| Issued in Lieu of Cash Distributions | 13,226 | 197 | 153,964 | 2,391 |
| Redeemed | (636,320) | (8,846) | (2,007,040) | (30,600) |
| Net Increase (Decrease)—Investor Shares | (275,666) | (3,830) | (1,350,467) | (20,409) |
| Admiral Shares | | | | |
| Issued | 842,421 | 6,191 | 1,701,087 | 13,744 |
| Issued in Lieu of Cash Distributions | 23,090 | 183 | 266,568 | 2,204 |
| Redeemed | (507,274) | (3,819) | (1,289,012) | (10,651) |
| Net Increase (Decrease)—Admiral Shares | 358,237 | 2,555 | 678,643 | 5,297 |
J. Management has determined that no material events or transactions occurred subsequent to July 31, 2014, that would require recognition or disclosure in these financial statements.
27
About Your Fund’s Expenses
As a shareholder of the fund, you incur ongoing costs, which include costs for portfolio management, administrative services, and shareholder reports (like this one), among others. Operating expenses, which are deducted from a fund’s gross income, directly reduce the investment return of the fund.
A fund’s expenses are expressed as a percentage of its average net assets. This figure is known as the expense ratio. The following examples are intended to help you understand the ongoing costs (in dollars) of investing in your fund and to compare these costs with those of other mutual funds. The examples are based on an investment of $1,000 made at the beginning of the period shown and held for the entire period.
The accompanying table illustrates your fund’s costs in two ways:
• Based on actual fund return. This section helps you to estimate the actual expenses that you paid over the period. The ”Ending Account Value“ shown is derived from the fund‘s actual return, and the third column shows the dollar amount that would have been paid by an investor who started with $1,000 in the fund. You may use the information here, together with the amount you invested, to estimate the expenses that you paid over the period.
To do so, simply divide your account value by $1,000 (for example, an $8,600 account value divided by $1,000 = 8.6), then multiply the result by the number given for your fund under the heading ”Expenses Paid During Period.“
• Based on hypothetical 5% yearly return. This section is intended to help you compare your fund‘s costs with those of other mutual funds. It assumes that the fund had a yearly return of 5% before expenses, but that the expense ratio is unchanged. In this case—because the return used is not the fund’s actual return—the results do not apply to your investment. The example is useful in making comparisons because the Securities and Exchange Commission requires all mutual funds to calculate expenses based on a 5% return. You can assess your fund’s costs by comparing this hypothetical example with the hypothetical examples that appear in shareholder reports of other funds.
Note that the expenses shown in the table are meant to highlight and help you compare ongoing costs only and do not reflect transaction costs incurred by the fund for buying and selling securities. Further, the expenses do not include any purchase, redemption, or account service fees described in the fund prospectus. If such fees were applied to your account, your costs would be higher. Your fund does not carry a “sales load.”
The calculations assume no shares were bought or sold during the period. Your actual costs may have been higher or lower, depending on the amount of your investment and the timing of any purchases or redemptions.
You can find more information about the fund’s expenses, including annual expense ratios, in the Financial Statements section of this report. For additional information on operating expenses and other shareholder costs, please refer to your fund’s current prospectus.
28
| | | |
| Six Months Ended July 31, 2014 | | | |
| | Beginning | Ending | Expenses |
| | Account Value | Account Value | Paid During |
| Energy Fund | 1/31/2014 | 7/31/2014 | Period |
| Based on Actual Fund Return | | | |
| Investor Shares | $1,000.00 | $1,146.84 | $1.97 |
| Admiral Shares | 1,000.00 | 1,147.14 | 1.65 |
| Based on Hypothetical 5% Yearly Return | | | |
| Investor Shares | $1,000.00 | $1,022.96 | $1.86 |
| Admiral Shares | 1,000.00 | 1,023.26 | 1.56 |
The calculations are based on expenses incurred in the most recent six-month period. The fund’s annualized six-month expense ratios for thatperiod are 0.37% for Investor Shares and 0.31% for Admiral Shares. The dollar amounts shown as “Expenses Paid” are equal to theannualized expense ratio multiplied by the average account value over the period, multiplied by the number of days in the most recentsix-month period, then divided by the number of days in the most recent 12-month period.29
Trustees Approve Advisory Arrangements
The board of trustees of Vanguard Energy Fund has renewed the fund’s investment advisory arrangements with The Vanguard Group, Inc. (Vanguard), through its Quantitative Equity Group, and Wellington Management Company, LLP (Wellington Management). The board determined that renewing the fund’s advisory arrangements was in the best interests of the fund and its shareholders.
The board based its decision upon an evaluation of each advisor’s investment staff, portfolio management process, and performance. The trustees considered the factors discussed below, among others. However, no single factor determined whether the board approved the arrangements. Rather, it was the totality of the circumstances that drove the board’s decision.
Nature, extent, and quality of services
The board considered the quality of the fund’s investment management services over both the short and long term, and took into account the organizational depth and stability of each advisor. The board noted the following:
Vanguard. Vanguard has been managing investments for more than three decades. The Quantitative Equity Group adheres to a sound, disciplined investment management process; the team has considerable experience, stability, and depth. Vanguard has managed a portion of the fund since 2005.
Wellington Management. Founded in 1928, Wellington Management is among the nation’s oldest and most respected institutional investment managers. The investment team uses a bottom-up approach in which stocks are selected based on the advisor’s estimates of fundamental investment value. The advisor’s investment process emphasizes company fundamentals, management track record, and security valuation. The firm has advised the fund since the fund’s inception in 1984.
The board concluded that each advisor’s experience, stability, depth, and performance, among other factors, warranted the continuation of the advisory arrangements.
Investment performance
The board considered the short- and long-term performance of the fund, including any periods of outperformance or underperformance relative to a benchmark index and peer group. The board concluded that the performance was such that the advisory arrangements should continue. Information about the fund’s most recent performance can be found in the Performance Summary section of this report.
Cost
The board concluded that the fund’s expense ratio was well below the average expense ratio charged by funds in its peer group and that the fund’s advisory fee rate was also well below its peer-group average. Information about the fund’s expenses appears in the About Your Fund’s Expenses section of this report as well as in the Financial Statements section, which also includes information about the fund’s advisory fee rate.
The board did not consider profitability of Wellington Management in determining whether to approve the advisory fee, because Wellington Management is independent of Vanguard, and the advisory fee is the result of arm’s-length negotiations. The board does not conduct a profitability analysis of Vanguard, because of Vanguard’s unique “at-cost” structure. Unlike most other mutual fund management companies, Vanguard is owned by the funds it oversees, and produces “profits” only in the form of reduced expenses for fund shareholders.
30
The benefit of economies of scale
The board concluded that the fund’s shareholders benefit from economies of scale because of breakpoints in the fund’s advisory fee schedule for Wellington Management. The breakpoints reduce the effective rate of the fee as the fund’s assets managed by Wellington Management increase. The board also concluded that the fund’s at-cost arrangement with Vanguard ensures that the fund will realize economies of scale as it grows, with the cost to shareholders declining as the fund’s assets managed by Vanguard increase.
The board will consider whether to renew the advisory arrangement again after a one-year period.
31
Glossary
30-Day SEC Yield. A fund’s 30-day SEC yield is derived using a formula specified by the U.S. Securities and Exchange Commission. Under the formula, data related to the fund’s security holdings in the previous 30 days are used to calculate the fund’s hypothetical net income for that period, which is then annualized and divided by the fund’s estimated average net assets over the calculation period. For the purposes of this calculation, a security’s income is based on its current market yield to maturity (for bonds), its actual income (for asset-backed securities), or its projected dividend yield (for stocks). Because the SEC yield represents hypothetical annualized income, it will differ—at times significantly—from the fund’s actual experience. As a result, the fund’s income distributions may be higher or lower than implied by the SEC yield.
Beta. A measure of the magnitude of a fund’s past share-price fluctuations in relation to the ups and downs of a given market index. The index is assigned a beta of 1.00. Compared with a given index, a fund with a beta of 1.20 typically would have seen its share price rise or fall by 12% when the index rose or fell by 10%. For this report, beta is based on returns over the past 36 months for both the fund and the index. Note that a fund’s beta should be reviewed in conjunction with its R-squared (see definition). The lower the R-squared, the less correlation there is between the fund and the index, and the less reliable beta is as an indicator of volatility.
Dividend Yield. Dividend income earned by stocks, expressed as a percentage of the aggregate market value (or of net asset value, for a fund). The yield is determined by dividing the amount of the annual dividends by the aggregate value (or net asset value) at the end of the period. For a fund, the dividend yield is based solely on stock holdings and does not include any income produced by other investments.
Earnings Growth Rate. The average annual rate of growth in earnings over the past five years for the stocks now in a fund.
Equity Exposure. A measure that reflects a fund’s investments in stocks and stock futures. Any holdings in short-term reserves are excluded.
Expense Ratio. A fund’s total annual operating expenses expressed as a percentage of the fund’s average net assets. The expense ratio includes management and administrative expenses, but does not include the transaction costs of buying and selling portfolio securities.
Foreign Holdings. The percentage of a fund represented by securities or depositary receipts of companies based outside the United States.
Inception Date. The date on which the assets of a fund (or one of its share classes) are first invested in accordance with the fund’s investment objective. For funds with a subscription period, the inception date is the day after that period ends. Investment performance is measured from the inception date.
Median Market Cap. An indicator of the size of companies in which a fund invests; the midpoint of market capitalization (market price x shares outstanding) of a fund’s stocks, weighted by the proportion of the fund’s assets invested in each stock. Stocks representing half of the fund’s assets have market capitalizations above the median, and the rest are below it.
Price/Book Ratio. The share price of a stock divided by its net worth, or book value, per share. For a fund, the weighted average price/book ratio of the stocks it holds.
32
Price/Earnings Ratio. The ratio of a stock’s current price to its per-share earnings over the past year. For a fund, the weighted average P/E of the stocks it holds. P/E is an indicator of market expectations about corporate prospects; the higher the P/E, the greater the expectations for a company’s future growth.
R-Squared. A measure of how much of a fund’s past returns can be explained by the returns from the market in general, as measured by a given index. If a fund’s total returns were precisely synchronized with an index’s returns, its R-squared would be 1.00. If the fund’s returns bore no relationship to the index’s returns, its R-squared would be 0. For this report, R-squared is based on returns over the past 36 months for both the fund and the index.
Return on Equity. The annual average rate of return generated by a company during the past five years for each dollar of shareholder’s equity (net income divided by shareholder’s equity). For a fund, the weighted average return on equity for the companies whose stocks it holds.
Short-Term Reserves. The percentage of a fund invested in highly liquid, short-term securities that can be readily converted to cash.
Turnover Rate. An indication of the fund’s trading activity. Funds with high turnover rates incur higher transaction costs and may be more likely to distribute capital gains (which may be taxable to investors). The turnover rate excludes in-kind transactions, which have minimal impact on costs.
Benchmark Information
Spliced Energy Index: S&P 500 Index through November 30, 2000; S&P Energy Sector Index through May 31, 2010; MSCI All Country World Energy Index thereafter.
33
This page intentionally left blank.
This page intentionally left blank.
The People Who Govern Your Fund
The trustees of your mutual fund are there to see that the fund is operated and managed in your best interests since, as a shareholder, you are a part owner of the fund. Your fund’s trustees also serve on the board of directors of The Vanguard Group, Inc., which is owned by the Vanguard funds and provides services to them on an at-cost basis.
A majority of Vanguard’s board members are independent, meaning that they have no affiliation with Vanguard or the funds they oversee, apart from the sizable personal investments they have made as private individuals. The independent board members have distinguished backgrounds in business, academia, and public service. Each of the trustees and executive officers oversees 177 Vanguard funds.
The following table provides information for each trustee and executive officer of the fund. More information about the trustees is in the Statement of Additional Information, which can be obtained, without charge, by contacting Vanguard at 800-662-7447, or online at vanguard.com.
| |
| InterestedTrustee1 | and Delphi Automotive LLP (automotive components); |
| | Senior Advisor at New Mountain Capital. |
| F. William McNabb III | |
| Born 1957. Trustee Since July 2009. Chairman of the | Amy Gutmann |
| Board. Principal Occupation(s) During the Past Five | Born 1949. Trustee Since June 2006. Principal |
| Years: Chairman of the Board of The Vanguard Group, | Occupation(s) During the Past Five Years: President of |
| Inc., and of each of the investment companies served | the University of Pennsylvania; Christopher H. Browne |
| by The Vanguard Group, since January 2010; Director | Distinguished Professor of Political Science, School of |
| of The Vanguard Group since 2008; Chief Executive | Arts and Sciences, and Professor of Communication, |
| Officer and President of The Vanguard Group, and of | Annenberg School for Communication, with secondary |
| each of the investment companies served by The | faculty appointments in the Department of Philosophy, |
| Vanguard Group, since 2008; Director of Vanguard | School of Arts and Sciences, and at the Graduate |
| Marketing Corporation; Managing Director of The | School of Education, University of Pennsylvania; |
| Vanguard Group (1995–2008). | Trustee of the National Constitution Center; Chair |
| | Bioethical Issues. |
| IndependentTrustees | |
| | JoAnn Heffernan Heisen |
| Emerson U. Fullwood | Born 1950. Trustee Since July 1998. Principal |
| Born 1948. Trustee Since January 2008. Principal | Occupation(s) During the Past Five Years: Corporate |
| Occupation(s) During the Past Five Years: Executive | Vice President and Chief Global Diversity Officer |
| Chief Staff and Marketing Officer for North America | (retired 2008) and Member of the Executive |
| and Corporate Vice President (retired 2008) of Xerox | Committee (1997–2008) of Johnson & Johnson |
| Corporation (document management products and | (pharmaceuticals/medical devices/consumer |
| services); Executive in Residence and 2009–2010 | products); Director of Skytop Lodge Corporation |
| Distinguished Minett Professor at the Rochester | (hotels), the University Medical Center at Princeton, |
| Institute of Technology; Director of SPX Corporation | the Robert Wood Johnson Foundation, and the Center |
| (multi-industry manufacturing), the United Way of | for Talent Innovation; Member of the Advisory Board |
| Rochester, Amerigroup Corporation (managed health | of the Maxwell School of Citizenship and Public Affairs |
| care), the University of Rochester Medical Center, | at Syracuse University. |
| Monroe Community College Foundation, and North | |
| Carolina A&T University. | F. Joseph Loughrey |
| | Born 1949. Trustee Since October 2009. Principal |
| Rajiv L. Gupta | Occupation(s) During the Past Five Years: President |
| Born 1945. Trustee Since December 2001.2 | and Chief Operating Officer (retired 2009) of Cummins |
| Principal Occupation(s) During the Past Five Years: | Inc. (industrial machinery); Chairman of the Board |
| Chairman and Chief Executive Officer (retired 2009) | of Hillenbrand, Inc. (specialized consumer services), |
| and President (2006–2008) of Rohm and Haas Co. | and of Oxfam America; Director of SKF AB (industrial |
| (chemicals); Director of Tyco International, Ltd. | machinery), Hyster-Yale Materials Handling, Inc. |
| (diversified manufacturing and services), Hewlett- | (forklift trucks), the Lumina Foundation for Education, |
| Packard Co. (electronic computer manufacturing), | |
| | |
| and the V Foundation for Cancer Research; Member | Executive Officers | |
| of the Advisory Council for the College of Arts and | | |
| Letters and of the Advisory Board to the Kellogg | Glenn Booraem | |
| Institute for International Studies, both at the | Born 1967. Controller Since July 2010. Principal |
| University of Notre Dame. | Occupation(s) During the Past Five Years: Principal |
| | of The Vanguard Group, Inc.; Controller of each of |
| Mark Loughridge | the investment companies served by The Vanguard |
| Born 1953. Trustee Since March 2012. Principal | Group; Assistant Controller of each of the investment |
| Occupation(s) During the Past Five Years: Senior Vice | companies served by The Vanguard Group (2001–2010). |
| President and Chief Financial Officer (retired 2013) | | |
| at IBM (information technology services); Fiduciary | Thomas J. Higgins | |
| Member of IBM’s Retirement Plan Committee (2004– | Born 1957. Chief Financial Officer Since September |
| 2013); Member of the Council on Chicago Booth. | 2008. Principal Occupation(s) During the Past Five |
| | Years: Principal of The Vanguard Group, Inc.; Chief |
| Scott C. Malpass | Financial Officer of each of the investment companies |
| Born 1962. Trustee Since March 2012. Principal | served by The Vanguard Group; Treasurer of each of |
| Occupation(s) During the Past Five Years: Chief | the investment companies served by The Vanguard |
| Investment Officer and Vice President at the University | Group (1998–2008). | |
| of Notre Dame; Assistant Professor of Finance at the | | |
| Mendoza College of Business at Notre Dame; Member | Kathryn J. Hyatt | |
| of the Notre Dame 403(b) Investment Committee; | Born 1955. Treasurer Since November 2008. Principal |
| Board Member of TIFF Advisory Services, Inc. | Occupation(s) During the Past Five Years: Principal of |
| (investment advisor); Member of the Investment | The Vanguard Group, Inc.; Treasurer of each of the |
| Advisory Committees of the Financial Industry | investment companies served by The Vanguard |
| Regulatory Authority (FINRA) and of Major League | Group; Assistant Treasurer of each of the investment |
| Baseball. | companies served by The Vanguard Group (1988–2008). |
| |
| André F. Perold | Heidi Stam | |
| Born 1952. Trustee Since December 2004. Principal | Born 1956. Secretary Since July 2005. Principal |
| Occupation(s) During the Past Five Years: George | Occupation(s) During the Past Five Years: Managing |
| Gund Professor of Finance and Banking, Emeritus | Director of The Vanguard Group, Inc.; General Counsel |
| at the Harvard Business School (retired 2011); | of The Vanguard Group; Secretary of The Vanguard |
| Chief Investment Officer and Managing Partner of | Group and of each of the investment companies |
| HighVista Strategies LLC (private investment firm); | served by The Vanguard Group; Director and Senior |
| Director of Rand Merchant Bank; Overseer of the | Vice President of Vanguard Marketing Corporation. |
| Museum of Fine Arts Boston. | | |
| | Vanguard Senior ManagementTeam |
| Alfred M. Rankin, Jr. | | |
| Born 1941. Trustee Since January 1993. Principal | Mortimer J. Buckley | Chris D. McIsaac |
| Occupation(s) During the Past Five Years: Chairman, | Kathleen C. Gubanich | Michael S. Miller |
| President, and Chief Executive Officer of NACCO | Paul A. Heller | James M. Norris |
| Industries, Inc. (housewares/lignite), and of Hyster- | Martha G. King | Glenn W. Reed |
| Yale Materials Handling, Inc. (forklift trucks); Chairman | John T. Marcante | |
| of the Board of University Hospitals of Cleveland. | | |
| |
| Peter F. Volanakis | Chairman Emeritus and Senior Advisor |
| Born 1955. Trustee Since July 2009. Principal | | |
| Occupation(s) During the Past Five Years: President | John J. Brennan | |
| and Chief Operating Officer (retired 2010) of Corning | Chairman, 1996–2009 | |
| Incorporated (communications equipment); Trustee of | Chief Executive Officer and President, 1996–2008 |
| Colby-Sawyer College; Member of the Advisory Board | | |
| of the Norris Cotton Cancer Center and of the Advisory | Founder | |
| Board of the Parthenon Group (strategy consulting). | | |
| | John C. Bogle | |
| | Chairman and Chief Executive Officer, 1974–1996 |
1 Mr. McNabb is considered an “interested person,” as defined in the Investment Company Act of 1940, because he is an officer of the
Vanguard funds.
2 December 2002 for Vanguard Equity Income Fund, the Vanguard Municipal Bond Funds, and the Vanguard State Tax-Exempt Funds.
|  |
| | P.O. Box 2600 |
| | Valley Forge, PA 19482-2600 |
| |
| |
| |
| Connect with Vanguard® > vanguard.com | |
| |
| |
| |
| Fund Information > 800-662-7447 | CFA® is a trademark owned by CFA Institute. |
| Direct Investor Account Services > 800-662-2739 | |
| Institutional Investor Services > 800-523-1036 | |
| Text Telephone for People | |
| With Hearing Impairment > 800-749-7273 | |
| |
| This material may be used in conjunction | |
| with the offering of shares of any Vanguard | |
| fund only if preceded or accompanied by | |
| the fund’s current prospectus. | |
| |
| All comparative mutual fund data are from Lipper, a | |
| Thomson Reuters Company, or Morningstar, Inc., unless | |
| otherwise noted. | |
| |
| You can obtain a free copy of Vanguard’s proxy voting | |
| guidelines by visiting vanguard.com/proxyreporting or by | |
| calling Vanguard at 800-662-2739. The guidelines are | |
| also available from the SEC’s website, sec.gov. In | |
| addition, you may obtain a free report on how your fund | |
| voted the proxies for securities it owned during the 12 | |
| months ended June 30. To get the report, visit either | |
| vanguard.com/proxyreporting or sec.gov. | |
| |
| You can review and copy information about your fund at | |
| the SEC’s Public Reference Room in Washington, D.C. To | |
| find out more about this public service, call the SEC at | |
| 202-551-8090. Information about your fund is also | |
| available on the SEC’s website, and you can receive | |
| copies of this information, for a fee, by sending a | |
| request in either of two ways: via e-mail addressed to | |
| publicinfo@sec.gov or via regular mail addressed to the | |
| Public Reference Section, Securities and Exchange | |
| Commission, Washington, DC 20549-1520. | |
| |
| | © 2014 The Vanguard Group, Inc. |
| | All rights reserved. |
| | Vanguard Marketing Corporation, Distributor. |
| |
| | Q512 092014 |

Semiannual Report | July 31, 2014
Vanguard Health Care Fund

Vanguard’s Principles for Investing Success
We want to give you the best chance of investment success. These principles, grounded in Vanguard’s research and experience, can put you on the right path.
Goals. Create clear, appropriate investment goals.
Balance. Develop a suitable asset allocation using broadly diversified funds.
Cost. Minimize cost.
Discipline. Maintain perspective and long-term discipline.
A single theme unites these principles: Focus on the things you can control. We believe there is no wiser course for any investor.
| |
| Contents | |
| Your Fund’s Total Returns. | 1 |
| Chairman’s Letter. | 2 |
| Advisor’s Report. | 7 |
| Fund Profile. | 11 |
| Performance Summary. | 12 |
| Financial Statements. | 13 |
| About Your Fund’s Expenses. | 26 |
| Trustees Approve Advisory Arrangement. | 28 |
| Glossary. | 30 |
Please note: The opinions expressed in this report are just that—informed opinions. They should not be considered promises or advice.
Also, please keep in mind that the information and opinions cover the period through the date on the front of this report. Of course, the
risks of investing in your fund are spelled out in the prospectus.
See the Glossary for definitions of investment terms used in this report.
About the cover: The ship’s wheel represents leadership and guidance, essential qualities in navigating difficult seas.
This one is a replica based on an 18th-century British vessel. The HMS Vanguard, another ship of that era, served as the
flagship for British Admiral Horatio Nelson when he defeated a French fleet at the Battle of the Nile.
Your Fund’s Total Returns
| |
| Six Months Ended July 31, 2014 | |
| | Total |
| | Returns |
| Vanguard Health Care Fund | |
| Investor Shares | 11.62% |
| Admiral™ Shares | 11.64 |
| MSCI All Country World Health Care Index | 9.44 |
| Global Health/Biotechnology Funds Average | 7.36 |
Global Health/Biotechnology Funds Average: Derived from data provided by Lipper, a Thomson Reuters Company.Admiral Shares carry lower expenses and are available to investors who meet certain account-balance requirements.Your Fund’s Performance at a Glance
January 31, 2014, Through July 31, 2014
| | | | |
| | | | Distributions Per Share |
| | Starting | Ending | Income | Capital |
| | Share Price | Share Price | Dividends | Gains |
| Vanguard Health Care Fund | | | | |
| Investor Shares | $191.63 | $204.99 | $0.172 | $8.276 |
| Admiral Shares | 80.84 | 86.49 | 0.078 | 3.491 |
1

Chairman’s Letter
Dear Shareholder,
Vanguard Health Care Fund delivered impressive results for the six months ended July 31, 2014, handily outperforming its comparative standards. The fund returned 11.62% for Investor Shares and 11.64% for Admiral Shares.
The benchmark MSCI All Country World Health Care Index advanced 9.44%, and peer funds gained an average of 7.36%. The Health Care Fund’s holdings among pharmaceutical companies were notably strong performers.
In May, Vanguard Health Care Fund marked its 30th anniversary. Since its inception on May 23, 1984, the fund has returned 17.24% annually through July 31, 2014. The benchmark index returned 11.38% annually for the same period. That record is a testament to the talents of the fund’s advisor, Wellington Management Company, llp, and we thank the Wellington team for its three decades of distinguished service to the fund’s shareholders. I’m confident that Wellington can continue to deliver the exemplary stewardship that investors in the Health Care Fund have come to expect.
2
Stocks posted strong returns despite finishing with a thud
For the six months ended July 31, the broad U.S. stock market returned about 8% despite ending on a negative note. On the cusp of eking out a sixth straight monthly advance, returns tumbled on the period’s final day.
Overall, generally strong corporate earnings, investors’ willingness to embrace risk, and the Federal Reserve’s resolve to sustain historically low interest rates for an extended time were supportive. The market withstood conflict in the Middle East and Ukraine, economic concerns in China and Europe, and the Fed’s gradual reduction of its stimulative bond-buying program.
International stocks returned almost 10%. Emerging markets, which slumped notably in 2013, led the charge. The developed markets of the Pacific region managed double-digit returns as well. European stocks, despite retreating in July, also finished on positive ground.
Bonds’ recent rebound showed signs of fatigue
The broad U.S. taxable bond market returned 2.16%. Although bonds have rebounded after posting negative returns for 2013, they gradually lost momentum in June and July. The yield of the benchmark 10-year U.S. Treasury note ended the period at 2.56%, down from 2.70% on January 31. (Bond prices and yields move in opposite directions.)
| | | |
| Market Barometer | | | |
| |
| | | | Total Returns |
| | Periods Ended July 31, 2014 |
| | Six | One | Five Years |
| | Months | Year | (Annualized) |
| Stocks | | | |
| Russell 1000 Index (Large-caps) | 9.02% | 17.06% | 17.13% |
| Russell 2000 Index (Small-caps) | -0.30 | 8.56 | 16.56 |
| Russell 3000 Index (Broad U.S. market) | 8.25 | 16.37 | 17.08 |
| FTSE All-World ex US Index (International) | 9.73 | 15.78 | 9.13 |
| |
| Bonds | | | |
| Barclays U.S. Aggregate Bond Index (Broad taxable market) | 2.16% | 3.97% | 4.47% |
| Barclays Municipal Bond Index (Broad tax-exempt market) | 4.15 | 7.27 | 5.50 |
| Citigroup Three-Month U.S. Treasury Bill Index | 0.00 | 0.04 | 0.07 |
| |
| CPI | | | |
| Consumer Price Index | 1.85% | 1.99% | 2.04% |
3
Municipal bonds, lifted by the broad bond market’s rally and less restrained by the later decline in Treasury prices, returned 4.15%. Investor demand for tax-exempt income and a limited supply of new issues also helped.
International bond markets (as measured by the Barclays Global Aggregate Index ex USD) returned 3.35%.
Results for money market funds and savings accounts remained tempered by the Fed’s target of 0%–0.25% for short-term interest rates.
Big Pharma generated big returns for the fund
Health care stocks outpaced the broad U.S. stock market by more than 1 percentage point over the half year. Support for the sector has come from mergers and acquisitions, new drug development, opportunities overseas, and the aging population’s need for increased health care. Also, despite some concerns, the Affordable Care Act may result in health care insurance for more people.
Expense Ratios
Your Fund Compared With Its Peer Group
| | | |
| | Investor | Admiral | Peer Group |
| | Shares | Shares | Average |
| Health Care Fund | 0.35% | 0.30% | 1.28% |
The fund expense ratios shown are from the prospectus dated May 27, 2014, and represent estimated costs for the current fiscal year. For thesix months ended July 31, 2014, the fund’s annualized expense ratios were 0.35% for Investor Shares and 0.30% for Admiral Shares. Thepeer-group expense ratio is derived from data provided by Lipper, a Thomson Reuters Company, and captures information through year-end2013.Peer group: Global Health/Biotechnology Funds.4
As I stated earlier, the fund has produced an enviable record in its 30 years of existence. Although six months provides limited insight into the performance of a long-term strategy, the fund’s showing over the recent period is noteworthy, as the Health Care Fund finished comfortably ahead of its benchmark index and the average return of its peers.
Jean M. Hynes, who has served as the fund’s sole portfolio manager since the retirement of Edward P. Owens in December 2012, has maintained the fund’s value-oriented approach.
The fund’s outperformance of its comparative standards was driven largely by its holdings among pharmaceutical companies, which accounted for more than 45% of assets during the period. The shares of several drug-makers soared because of merger and acquisition activity. Clinical trial advancements for potential new disease therapies helped as well. In addition, the fund benefited from not owning—or limiting its relative exposure to—the stocks of pharmaceutical companies whose performance lagged.
Health care providers and services companies, including facilities operators and managed care firms, were also sources of strength. Although the Affordable Care Act may bring health care insurance to more people, the new operating environment hasn’t been easy for companies to negotiate. The advisor has done a fine job of investing in those that appear to have the knowledge and resources to compete well amid the changes.
However, the fund parted ways with the market in the biotechnology subsector, where several strong performers weren’t enough to offset a handful of stocks that suffered double-digit declines. Earlier in the period, biotechnology stocks in general became an object of market skepticism, and less-than-stellar news was enough to send a company’s stock reeling.
The Advisor’s Report that follows this letter provides additional details about the management of the fund during the half year.
Don’t let complacency set your portfolio adrift
At Vanguard, we often warn against letting emotions become entangled with investments. When the financial markets are in turmoil, for example, we’ll caution investors not to let fear lead to rash decisions. But complacency—that mild-mannered counterpoint to fear—can also stand in the way of achieving your financial goals. And lately, conditions have been ripe for complacency.
In the more than five years since its March 2009 bottom, the broad U.S. stock market, as measured by the Russell 3000 Index, has produced average annual returns of nearly 25%. That’s more than double the
5
historical average annual return. And in recent weeks, several indexes touched all-time highs.
The investment winds don’t always blow favorably, of course—a point underscored by the sharp drop for stocks on the last day of July. This unwelcome retreat served to remind us that the exceptionally smooth sailing in the preceding months created risks of its own.
When markets are unusually tranquil, it can be easy to lose sight of fundamentals, especially the importance of rebalancing. Without periodically adjusting your asset allocation so that it stays in line with your goals and risk tolerance, you can end up with a portfolio that’s very different from, and potentially riskier than, the one you intended to have.
Whether the market’s moving up, down, or sideways, we always encourage our clients to stay focused on our four principles for investment success: Create clear, appropriate investment goals; develop a suitable asset allocation using broadly diversified funds; minimize cost; and maintain perspective and long-term discipline. (You can read more in Vanguard’s Principles for Investment Success, available at vanguard.com/research.)
As always, thank you for investing with Vanguard.
Sincerely,

F. William McNabb III
Chairman and Chief Executive Officer
August 13, 2014
6
Advisor’s Report
For the six months ended July 31, 2014, Vanguard Health Care Fund delivered solid absolute and relative returns, gaining 11.62% for Investor Shares and 11.64% for Admiral Shares. The fund outpaced the 9.44% return of its benchmark, the MSCI All Country World Health Care Index, and the 7.36% average return of global health/biotechnology funds.
| |
| Major Portfolio Changes | |
| Six Months Ended July 31, 2014 | |
| |
| Additions | Comments |
| Actavis | Actavis is a specialty pharmaceutical company that develops generic |
| | and branded products. We owned both Actavis and Forest Laboratories |
| | prior to the former’s acquisition of the latter, and we believe there will |
| | be meaningful cost and tax synergies from the merger. The combined |
| | company will have a diverse business mix (branded, generics, and |
| | biosimilars) and geographic footprint. We believe this deal makes |
| | strategic sense and should bolster earnings per share. Actavis is the |
| | fund’s third-largest holding as of the end of the period. |
| Bristol-Myers Squibb | We increased our position in biopharmaceutical company Bristol-Myers |
| | Squibb. We see its immuno-oncology franchise as a transformative |
| | driver in the years ahead and believe the market does not fully |
| | recognize the magnitude of the company’s potential in this area. Bristol- |
| | Myers Squibb is the fund’s largest holding at the end of the period. |
| Envision Healthcare | We initiated a position in Envision Healthcare during the period. |
| | Envision is a provider of outsourced emergency room management. |
| | Demand for its services should rise with the implementation of the |
| | Affordable Care Act, which should increase the number of insured |
| | patient visits. In addition, the company serves rural markets, a |
| | geographic area in need of novel health care service delivery models. |
| |
| Reductions | Comments |
| Teva Pharmaceuticals | We trimmed into strength our position in Teva, an Israel-based global |
| | biopharmaceutical company specializing in generic formulations. The |
| | stock rose substantially on a combination of speculation surrounding |
| | M&A in the sector, enthusiasm for the new CEO, and the strong |
| | conversion of once-daily MS drug Copaxone to a thrice-a-week version. |
| Baxter International | We eliminated our position in Baxter in favor of opportunities with |
| | better long-term fundamental prospects. This biopharmaceutical and |
| | medical products company focuses on plasma-based therapies as |
| | well as kidney dialysis systems. |
| AbbVie | We eliminated our position in AbbVie as we found more long-term |
| | value in other securities. The large-cap biopharmaceutical company has |
| | been a very strong outperformer since being spun off from Abbott in |
| | January 2013. We continue to believe its near-term performance will be |
| | solid, driven by rheumatoid arthritis drug Humira and its launch into the |
| | lucrative market for hepatitis C treatments later this year. |
7
The investment environment
The health care sector performed in line with the gain of the broader Standard & Poor’s 500 Index (9.44%). Throughout the period, we continued to focus on companies at the crux of medical innovation and those that we believe will benefit from the changing U.S. health care system. Holdings also included certain managed care organizations (MCOs) that we view as well-positioned irrespective of the path of industry reforms over time.
A notable market occurrence was the flurry of activity among biopharmaceutical firms, which included proposed large-scale acquisitions and mergers, asset swaps, and divestitures. Most relevant for the fund was the Actavis and Forest Laboratories merger. Also important was Pfizer’s public bid for AstraZeneca, which was ultimately turned down by AstraZeneca’s board but nonetheless drove AstraZeneca’s stock price forward.
Our successes
Our large biopharmaceutical holdings were key drivers of the fund’s returns. Selections among health care services also did well.
Top contributors to relative returns included biopharmaceutical companies Forest Laboratories and Actavis, our long-term holding UCB, and an underweight to Pfizer. Health care service companies Walgreen Co. (the company has added clinics to its drugstore line) and Humana also helped. Our position in pharmaceuticals giant AstraZeneca boosted absolute returns.
In the first quarter of this year it was announced that Actavis, the world’s third-largest generic manufacturer, would acquire Forest Laboratories. Actavis also has a significant branded pharmaceuticals business thanks to its merger last year with Warner Chilcott. We find the new acquisition very attractive and hold a large position in the company; as of the end of the period, it was our third-largest holding.
Pfizer’s stock price fell after the company’s plans to acquire AstraZeneca were rebuffed; our underweight position in Pfizer helped the fund’s relative returns. AstraZeneca’s decision was based largely on its belief that the final offer price undervalued its enviable early-stage pipeline, a view we share. Our exposure to AstraZeneca aided the fund’s absolute returns, as Pfizer’s bid shed light on the pipeline.
In health care services, MCOs got a boost from the proposed 2015 Medicare Advantage rates, which were more favorable than had been expected. We continue to believe that MCOs such as UnitedHealth Group and Aetna will play an increasingly important role in the U.S. health care system.
Walgreen Co. and CVS, another drugstore holding, should benefit from accelerating volume as more Americans obtain health insurance.
8
Our shortfalls
The fund’s exposure to select mid-cap biopharmaceuticals, including Alnylam Pharmaceuticals, Incyte, and The Medicines Company, detracted from relative performance, as did our avoidance of Shire and Johnson & Johnson.
Shares of Alnylam fell more than 35% as general sentiment toward small- and mid-cap biopharmaceuticals weakened. A leader in RNA interference technology, Alnylam has a number of programs in mid-stage clinical development targeting several serious liver diseases. The company offers significant upside potential if the technology passes efficacy and safety hurdles over the coming years.
Shares of The Medicines Company, which focuses on the acute-care (hospital-based) drug market, declined following a disappointing FDA decision regarding the use of antiplatelet agent Cangrelor in cardiac stent procedures. We maintain our positive outlook on the firm’s broader product pipeline, including a recently approved antibiotic.
The fund’s positioning
We currently hold 22% of the fund’s assets in non-U.S. investments, keeping to a strategy that has provided diversification and helped performance over longer periods of time. The Health Care Fund has exposure to 87 equity names as of the period’s close. We expect this number to hold steady or perhaps rise slightly, as we sometimes gain exposure to themes or subsectors by holding a “basket” of smaller positions.
This diversity notwithstanding, the top ten positions make up a meaningful portion—more than 37%—of the fund’s assets. Although we expect turnover to remain quite low, it will likely be higher than the single-digit annualized rate of the last few years. As of July 31, 2014, the fund’s annualized turnover was approximately 28%, in part because of acquisition-related turnover of large holdings and increased volatility in the health care market.
We are optimistic about the long-term outlook for the sector. We have exposure to a number of positive forces, such as new biological approaches to disease and delivery changes in the U.S. health care system. One exciting area is immuno-oncology, which may have broad applicability to cancer treatment and research. Leaders in this field include our holdings Bristol-Myers Squibb, Merck, Roche, AstraZeneca, and Incyte.
The U.S. health care system is undergoing dynamic structural changes that will bring opportunities and challenges for market participants. We seek companies that can benefit from these changes. Our holdings range from managed health care organizations UnitedHealth Group and Humana to firms that will facilitate transparency, such as health care information company Cerner and hospital leader HCA.
9
Our philosophy of using a long-term time horizon as we track secular themes and market trends should help us identify pockets that can generate sustainable growth at attractive valuations. We will remain diversified across subsectors and regions, focused on the long haul, and positioned in the most attractive stocks in order to generate shareholder returns while minimizing risk.
Jean M. Hynes, CFA
Senior Vice President and
Portfolio Manager
Wellington Management Company, LLP
August 12, 2014
10
Health Care Fund
Fund Profile
As of July 31, 2014
| | |
| Share-Class Characteristics | |
| | Investor | Admiral |
| | Shares | Shares |
| Ticker Symbol | VGHCX | VGHAX |
| Expense Ratio1 | 0.35% | 0.30% |
| 30-Day SEC Yield | 1.09% | 1.14% |
| | | |
| Portfolio Characteristics | | |
| | | | DJ |
| | | | U.S. |
| | | MSCI | Total |
| | | ACWI | Market |
| | | Health | FA |
| | Fund | Care | Index |
| Number of Stocks | 89 | 148 | 3,718 |
| Median Market Cap | $31.9B | $79.4B | $48.5B |
| Price/Earnings Ratio | 31.6x | 24.4x | 20.2x |
| Price/Book Ratio | 3.5x | 3.7x | 2.6x |
| Return on Equity | 16.0% | 20.6% | 17.5% |
| Earnings Growth | | | |
| Rate | 6.9% | 7.7% | 14.8% |
| Dividend Yield | 1.4% | 2.0% | 1.9% |
| Foreign Holdings | 21.5% | 42.5% | 0.0% |
| Turnover Rate | | | |
| (Annualized) | 28% | — | — |
| Short-Term Reserves | 3.8% | — | — |
| | |
| Subindustry Diversification (% of equity | |
| exposure) | | |
| | | MSCI |
| | | ACWI |
| | | Health |
| | Fund | Care |
| Biotechnology | 12.3% | 13.2% |
| Consumer Staples | 2.2 | 0.0 |
| Health Care Distributors | 4.5 | 2.8 |
| Health Care Equipment | 11.8 | 10.9 |
| Health Care Facilities | 2.9 | 1.4 |
| Health Care Services | 1.5 | 4.5 |
| Health Care Supplies | 0.3 | 0.9 |
| Health Care Technology | 2.9 | 0.5 |
| Life Sciences Tools & Services | 4.2 | 3.0 |
| Managed Health Care | 10.3 | 4.6 |
| Materials | 0.6 | 0.0 |
| Pharmaceuticals | 46.5 | 58.2 |
| | |
| Volatility Measures | | |
| | MSCI | DJ |
| | ACWI | U.S. Total |
| | Health | Market |
| | Care | FA Index |
| R-Squared | 0.89 | 0.64 |
| Beta | 0.91 | 0.64 |
| These measures show the degree and timing of the fund’s fluctuations compared with the indexes over 36 months. |
|
| | |
| Ten Largest Holdings (% of total net assets) |
| Bristol-Myers Squibb Co. | Pharmaceuticals | 5.0% |
| Merck & Co. Inc. | Pharmaceuticals | 4.9 |
| Actavis plc | Pharmaceuticals | 4.7 |
| UnitedHealth Group Inc. | Managed Health | |
| | Care | 4.2 |
| AstraZeneca plc | Pharmaceuticals | 3.9 |
| Eli Lilly & Co. | Pharmaceuticals | 3.4 |
| McKesson Corp. | Health Care | |
| | Distributors | 3.1 |
| Roche Holding AG | Pharmaceuticals | 3.1 |
| Vertex Pharmaceuticals | | |
| Inc. | Biotechnology | 2.7 |
| Amgen Inc. | Biotechnology | 2.4 |
| Top Ten | | 37.4% |
| The holdings listed exclude any temporary cash investments and equity index products. |
|
| |
| Market Diversification (% of equity exposure) |
| |
| Europe | |
| Switzerland | 5.9% |
| United Kingdom | 4.3 |
| Belgium | 2.3 |
| Other | 1.0 |
| Subtotal | 13.5% |
| Pacific | |
| Japan | 8.1% |
| North America | |
| United States | 77.6% |
| Middle East | 0.8% |
1 The expense ratios shown are from the prospectus dated May 27, 2014, and represent estimated costs for the current fiscal year. For the six
months ended July 31, 2014, the annualized expense ratios were 0.35% for Investor Shares and 0.30% for Admiral Shares.
11
Health Care Fund
Performance Summary
All of the returns in this report represent past performance, which is not a guarantee of future results that may be achieved by the fund. (Current performance may be lower or higher than the performance data cited. For performance data current to the most recent month-end, visit our website at vanguard.com/performance.) Note, too, that both investment returns and principal value can fluctuate widely, so an investor’s shares, when sold, could be worth more or less than their original cost. The returns shown do not reflect taxes that a shareholder would pay on fund distributions or on the sale of fund shares.
Fiscal-Year Total Returns (%): January 31, 2004, Through July 31, 2014
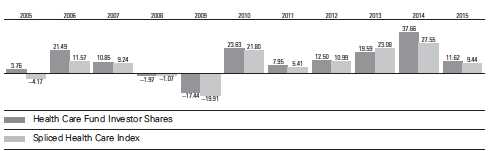
For a benchmark description, see the Glossary.
Note: For 2015, performance data reflect the six months ended July 31, 2014.
Average Annual Total Returns: Periods Ended June 30, 2014
This table presents returns through the latest calendar quarter—rather than through the end of the fiscal period.
Securities and Exchange Commission rules require that we provide this information.
| | | | |
| | Inception | One | Five | Ten |
| | Date | Year | Years | Years |
| Investor Shares | 5/23/1984 | 36.41% | 21.55% | 11.90% |
| Admiral Shares | 11/12/2001 | 36.49 | 21.62 | 11.97 |
See Financial Highlights for dividend and capital gains information.
12
Health Care Fund
Financial Statements (unaudited)
Statement of Net Assets
As of July 31, 2014
The fund reports a complete list of its holdings in regulatory filings four times in each fiscal year, at the quarter-ends. For the second and fourth fiscal quarters, the lists appear in the fund’s semiannual and annual reports to shareholders. For the first and third fiscal quarters, the fund files the lists with the Securities and Exchange Commission on Form N-Q. Shareholders can look up the fund’s Forms N-Q on the SEC’s website at sec.gov. Forms N-Q may also be reviewed and copied at the SEC’s Public Reference Room (see the back cover of this report for further information).
| | | |
| | | | Market |
| | | | Value |
| | | Shares | ($000) |
| Common Stocks (96.4%) | | |
| United States (74.9%) | | |
| Biotechnology (11.1%) | | |
| * | Vertex | | |
| | Pharmaceuticals Inc. | 11,807,500 | 1,049,805 |
| | Amgen Inc. | 7,448,955 | 948,922 |
| * | Regeneron | | |
| | Pharmaceuticals Inc. | 2,795,500 | 883,993 |
| *,1 | Incyte Corp. | 10,174,343 | 483,994 |
| *,1 | Alnylam | | |
| | Pharmaceuticals Inc. | 5,183,106 | 280,147 |
| * | Alkermes plc | 6,135,913 | 262,372 |
| * | Cubist | | |
| | Pharmaceuticals Inc. | 1,977,342 | 120,420 |
| * | Biogen Idec Inc. | 353,600 | 118,240 |
| * | Gilead Sciences Inc. | 1,133,700 | 103,790 |
| * | Ironwood | | |
| | Pharmaceuticals Inc. | | |
| | Class A | 3,901,498 | 57,742 |
| | | | 4,309,425 |
| Chemicals (0.5%) | | |
| | Monsanto Co. | 1,835,700 | 207,599 |
| |
| Food & Staples Retailing (2.1%) | |
| | Walgreen Co. | 7,128,300 | 490,213 |
| | CVS Caremark Corp. | 4,388,100 | 335,076 |
| | | | 825,289 |
| Health Care Equipment & Supplies (11.1%) |
| | Medtronic Inc. | 12,402,000 | 765,699 |
| * | Boston Scientific Corp. | 42,743,200 | 546,258 |
| * | Edwards | | |
| | Lifesciences Corp. | 4,920,000 | 444,030 |
| | Covidien plc | 4,994,700 | 432,092 |
| | Abbott Laboratories | 7,591,400 | 319,750 |
| | Becton Dickinson and Co. | 2,393,100 | 278,174 |
| | St. Jude Medical Inc. | 3,932,200 | 256,340 |
| * | CareFusion Corp. | 5,661,354 | 247,911 |
| * | Hologic Inc. | 7,379,300 | 192,378 |
| | | |
| | | | Market |
| | | | Value |
| | | Shares | ($000) |
| * | Intuitive Surgical Inc. | 414,400 | 189,609 |
| | CR Bard Inc. | 1,157,400 | 172,719 |
| | Zimmer Holdings Inc. | 1,589,200 | 159,031 |
| | DENTSPLY | | |
| | International Inc. | 2,826,100 | 131,188 |
| | Stryker Corp. | 1,433,500 | 114,350 |
| * | NuVasive Inc. | 1,628,303 | 60,866 |
| | | | 4,310,395 |
| Health Care Providers & Services (18.5%) | |
| | UnitedHealth Group Inc. | 20,115,900 | 1,630,394 |
| | McKesson Corp. | 6,342,800 | 1,216,930 |
| | Humana Inc. | 5,698,794 | 670,463 |
| | Aetna Inc. | 7,195,883 | 557,897 |
| | Cigna Corp. | 6,163,900 | 554,997 |
| | Universal Health | | |
| | Services Inc. Class B | 4,140,000 | 441,324 |
| * | HCA Holdings Inc. | 6,746,600 | 440,620 |
| | WellPoint Inc. | 3,675,200 | 403,574 |
| | Cardinal Health Inc. | 5,043,241 | 361,348 |
| * | Express Scripts | | |
| | Holding Co. | 3,621,200 | 252,217 |
| * | Catamaran Corp. | 4,221,183 | 192,022 |
| * | Community Health | | |
| | Systems Inc. | 2,536,704 | 121,001 |
| | Owens & Minor Inc. | 3,000,000 | 99,270 |
| * | Envision Healthcare | | |
| | Holdings Inc. | 2,283,400 | 81,631 |
| * | Tenet Healthcare Corp. | 1,460,000 | 77,044 |
| * | WellCare Health Plans Inc. | 1,189,900 | 74,226 |
| * | MEDNAX Inc. | 805,600 | 47,675 |
| * | Community Health | | |
| | Systems Inc. Rights | 18,834,700 | 1,036 |
| | | | 7,223,669 |
| Health Care Technology (2.8%) | |
| * | Cerner Corp. | 12,842,400 | 708,900 |
| * | IMS Health Holdings Inc. | 9,535,580 | 248,879 |
| * | Allscripts Healthcare | | |
| | Solutions Inc. | 8,542,653 | 135,999 |
| | | | 1,093,778 |
13
Health Care Fund
| | | |
| | | | Market |
| | | | Value• |
| | | Shares | ($000) |
| Life Sciences Tools & Services (4.1%) | |
| * | Illumina Inc. | 2,090,368 | 334,271 |
| | Agilent Technologies Inc. | 5,624,200 | 315,461 |
| * | Quintiles Transnational | | |
| | Holdings Inc. | 5,636,278 | 309,601 |
| *,1 | PAREXEL International | | |
| | Corp. | 5,077,400 | 271,946 |
| * | Covance Inc. | 2,486,000 | 208,625 |
| * | Bruker Corp. | 3,285,758 | 74,685 |
| | PerkinElmer Inc. | 1,441,400 | 66,621 |
| | | | 1,581,210 |
| Pharmaceuticals (24.7%) | | |
| | Bristol-Myers Squibb Co. | 38,480,761 | 1,947,896 |
| | Merck & Co. Inc. | 33,420,748 | 1,896,293 |
| * | Actavis plc | 8,555,596 | 1,833,122 |
| | Eli Lilly & Co. | 21,982,700 | 1,342,264 |
| * | Mylan Inc. | 11,087,000 | 547,365 |
| | Perrigo Co. plc | 3,210,552 | 483,028 |
| * | Hospira Inc. | 8,375,170 | 464,571 |
| | Pfizer Inc. | 14,934,022 | 428,606 |
| | Zoetis Inc. | 10,798,417 | 355,376 |
| * | Salix | | |
| | Pharmaceuticals Ltd. | 1,824,545 | 240,676 |
| *,1 | Medicines Co. | 4,733,730 | 110,627 |
| | | | 9,649,824 |
| Total United States | | 29,201,189 |
| International (21.5%) | | |
| Belgium (2.2%) | | |
| | UCB SA | 9,345,949 | 857,259 |
| |
| Denmark (0.1%) | | |
| | H Lundbeck A/S | 2,224,230 | 50,976 |
| |
| France (0.8%) | | |
| | Sanofi | 2,551,898 | 267,929 |
| | Ipsen SA | 1,094,832 | 48,657 |
| | | | 316,586 |
| Ireland (0.1%) | | |
| *,1 | Prothena Corp. plc | 1,662,794 | 28,866 |
| |
| Israel (0.7%) | | |
| | Teva Pharmaceutical | | |
| | Industries Ltd. ADR | 5,362,100 | 286,872 |
| | |
| | | Market |
| | | Value• |
| | Shares | ($000) |
| Japan (7.8%) | | |
| Astellas Pharma Inc. | 62,914,500 | 853,159 |
| Takeda Pharmaceutical | | |
| Co. Ltd. | 9,210,200 | 420,100 |
| Daiichi Sankyo Co. Ltd. | 21,341,600 | 388,069 |
| Shionogi & Co. Ltd. | 16,932,354 | 365,551 |
| Eisai Co. Ltd. | 7,375,800 | 312,438 |
| Chugai Pharmaceutical | | |
| Co. Ltd. | 6,885,200 | 229,159 |
| * Olympus Corp. | 4,588,200 | 165,101 |
| Ono Pharmaceutical | | |
| Co. Ltd. | 1,659,900 | 140,410 |
| Mitsubishi Tanabe | | |
| Pharma Corp. | 6,231,500 | 90,516 |
| Kyowa Hakko Kirin | | |
| Co. Ltd. | 5,250,000 | 72,128 |
| | | 3,036,631 |
| Switzerland (5.7%) | | |
| Roche Holding AG | 3,662,498 | 1,062,878 |
| Novartis AG | 8,481,724 | 737,899 |
| Actelion Ltd. | 2,403,582 | 288,684 |
| Roche Holding AG | | |
| (Bearer) | 454,604 | 129,693 |
| | | 2,219,154 |
| United Kingdom (4.1%) | | |
| AstraZeneca plc | 20,768,156 | 1,516,423 |
| Smith & Nephew plc | 5,047,506 | 86,866 |
| | | 1,603,289 |
| Total International | | 8,399,633 |
| Total Common Stocks | | |
| (Cost $20,879,702) | | 37,600,822 |
14
Health Care Fund
| | |
| | Face | Market |
| | Amount | Value• |
| | ($000) | ($000) |
| Temporary Cash Investments (3.8%) | |
| Repurchase Agreements (1.3%) | |
| Bank of America Securities, | | |
| LLC 0.080%, 8/1/14 | | |
| (Dated 7/31/14, Repurchase | | |
| Value $29,300,000, | | |
| collateralized by Federal | | |
| Home Loan Bank 3.190%, | | |
| 8/13/32, and Federal | | |
| National Mortgage Assn. | | |
| 5.375%, 6/12/17, with a | | |
| value of $29,886,000) | 29,300 | 29,300 |
| Barclays Capital Inc. 0.060%, | | |
| 8/1/14 (Dated 7/31/14, | | |
| Repurchase Value | | |
| $227,700,000, collateralized | | |
| by U.S. Treasury Note/Bond | |
| 0.750%–6.875%, 2/28/18– | | |
| 8/15/25, with a value of | | |
| $232,254,000) | 227,700 | 227,700 |
| Barclays Capital Inc. | | |
| 0.060%, 8/6/14 (Dated | | |
| 7/30/14, Repurchase Value | | |
| $50,001,000, collateralized | | |
| by Federal Home Loan | | |
| Mortgage Corp. 4.000%– | | |
| 4.500%, 5/1/43–5/1/44, | | |
| Federal National Mortgage | | |
| Assn. 2.500%–4.000%, | | |
| 12/1/26–2/1/44, and | | |
| Government National | | |
| Mortgage Assn. 4.000%, | | |
| 7/20/44, with a value of | | |
| $51,000,000) | 50,000 | 50,000 |
| BNP Paribas Securities Corp. | | |
| 0.090%, 8/1/14 (Dated | | |
| 7/31/14, Repurchase Value | | |
| $33,700,000, collateralized | | |
| by Federal Home Loan | | |
| Mortgage Corp. 3.000%– | | |
| 6.000%, 1/1/18–10/1/43, | | |
| Federal National Mortgage | | |
| Assn. 3.500%–9.000%, | | |
| 9/1/17–7/1/44, and | | |
| Government National | | |
| Mortgage Assn. 5.000%, | | |
| 6/15/41, with a value | | |
| of $34,374,000) | 33,700 | 33,700 |
| HSBC Bank USA 0.080%, | | |
| 8/1/14 (Dated 7/31/14, | | |
| Repurchase Value | | |
| $52,300,000, collateralized | | |
| by Federal National Mortgage | |
| Assn. 2.500%–4.500%, | | |
| 7/1/24–2/1/44, with | | |
| a value of $53,348,000) | 52,300 | 52,300 |
| | | |
| | | Face | Market |
| | | Amount | Value• |
| | | ($000) | ($000) |
| | Morgan Stanley & Co., Inc. | | |
| | 0.090%, 8/1/14 (Dated | | |
| | 7/31/14, Repurchase | | |
| | Value $138,200,000, | | |
| | collateralized by Federal | | |
| | Home Loan Mortgage | | |
| | Corp. 5.000%–6.750%, | | |
| | 7/18/16–3/15/31, and | | |
| | Federal National Mortgage | | |
| | Assn. 5.000%–7.250%, | | |
| | 3/15/16–5/15/30, with a | | |
| | value of $140,964,000) | 138,200 | 138,200 |
| | | | 531,200 |
| U.S. Government and Agency Obligations (0.7%) |
| 2 | Federal Home Loan Bank | | |
| | Discount Notes, 0.070%, | | |
| | 8/1/14 | 23,305 | 23,305 |
| 2 | Federal Home Loan Bank | | |
| | Discount Notes, 0.065%, | | |
| | 8/27/14 | 100,000 | 99,998 |
| 2 | Federal Home Loan Bank | | |
| | Discount Notes, 0.087%, | | |
| | 10/29/14 | 150,000 | 149,980 |
| 3 | United States Treasury Bill, | | |
| | 0.025%, 10/9/14 | 5,000 | 5,000 |
| | | | 278,283 |
| Commercial Paper (1.8%) | | |
| | General Electric Capital | | |
| | Corp., 0.170%, 9/9/14 | 200,000 | 199,989 |
| | General Electric Capital | | |
| | Corp., 0.160%, 12/5/14 | 200,000 | 199,905 |
| 4 | The Coca-Cola Co., | | |
| | 0.140%, 8/6/14 | 63,000 | 62,999 |
| 4 | The Coca-Cola Co., | | |
| | 0.170%, 9/18/14 | 50,000 | 49,994 |
| 4 | The Coca-Cola Co., | | |
| | 0.120%, 10/16/14 | 100,000 | 99,974 |
| 4 | The Coca-Cola Co., | | |
| | 0.120%, 11/7/14 | 75,000 | 74,973 |
| | | | 687,834 |
| Total Temporary Cash Investments | |
| (Cost $1,497,257) | | 1,497,317 |
| Total Investments (100.2%) | | |
| (Cost $22,376,959) | | 39,098,139 |
| Other Assets and Liabilities (-0.2%) | |
| Other Assets | | 156,244 |
| Liabilities | | (247,995) |
| | | | (91,751) |
| Net Assets (100%) | | 39,006,388 |
15
Health Care Fund
| |
| At July 31, 2014, net assets consisted of: |
| | Amount |
| | ($000) |
| Paid-in Capital | 19,420,174 |
| Undistributed Net Investment Income | 144,574 |
| Accumulated Net Realized Gains | 2,714,129 |
| Unrealized Appreciation (Depreciation) | |
| Investment Securities | 16,721,180 |
| Forward Currency Contracts | 6,425 |
| Foreign Currencies | (94) |
| Net Assets | 39,006,388 |
| |
| |
| Investor Shares—Net Assets | |
| Applicable to 50,253,996 outstanding | |
| $.001 par value shares of beneficial | |
| interest (unlimited authorization) | 10,301,577 |
| Net Asset Value Per Share— | |
| Investor Shares | $204.99 |
| |
| |
| Admiral Shares—Net Assets | |
| Applicable to 331,893,279 outstanding | |
| $.001 par value shares of beneficial | |
| interest (unlimited authorization) | 28,704,811 |
| Net Asset Value Per Share— | |
| Admiral Shares | $86.49 |
• See Note A in Notes to Financial Statements.
* Non-income-producing security.
1 Considered an affiliated company of the fund as the fund owns more than 5% of the outstanding voting securities of such company.
2 The issuer operates under a congressional charter; its securities are generally neither guaranteed by the U.S. Treasury nor backed by the full
faith and credit of the U.S. government.
3 Securities with a value of $1,134,000 have been segregated as collateral for open forward currency contracts.
4 Security exempt from registration under Section 4(2) of the Securities Act of 1933. Such securities may be sold in transactions exempt from
registration only to dealers in that program or other “accredited investors.” At July 31, 2014, the aggregate value of these securities was
$287,940,000, representing 0.7% of net assets.
ADR—American Depositary Receipt.
See accompanying Notes, which are an integral part of the Financial Statements.
16
Health Care Fund
Statement of Operations
| |
| | Six Months Ended |
| | July 31, 2014 |
| | ($000) |
| Investment Income | |
| Income | |
| Dividends1,2 | 316,265 |
| Interest | 612 |
| Securities Lending | 898 |
| Total Income | 317,775 |
| Expenses | |
| Investment Advisory Fees—Note B | 27,057 |
| The Vanguard Group—Note C | |
| Management and Administrative—Investor Shares | 9,156 |
| Management and Administrative—Admiral Shares | 17,883 |
| Marketing and Distribution—Investor Shares | 844 |
| Marketing and Distribution—Admiral Shares | 1,746 |
| Custodian Fees | 456 |
| Shareholders’ Reports—Investor Shares | 76 |
| Shareholders’ Reports—Admiral Shares | 35 |
| Trustees’ Fees and Expenses | 33 |
| Total Expenses | 57,286 |
| Net Investment Income | 260,489 |
| Realized Net Gain (Loss) | |
| Investment Securities Sold2 | 2,717,739 |
| Foreign Currencies and Forward Currency Contracts | 2,499 |
| Realized Net Gain (Loss) | 2,720,238 |
| Change in Unrealized Appreciation (Depreciation) | |
| Investment Securities | 1,062,400 |
| Foreign Currencies and Forward Currency Contracts | 822 |
| Change in Unrealized Appreciation (Depreciation) | 1,063,222 |
| Net Increase (Decrease) in Net Assets Resulting from Operations | 4,043,949 |
1 Dividends are net of foreign withholding taxes of $17,584,000.2 Dividend income and realized net gain (loss) from affiliated companies of the fund were $11,464,000 and $546,884,000, respectively.See accompanying Notes, which are an integral part of the Financial Statements.
17
Health Care Fund
Statement of Changes in Net Assets
| | |
| | Six Months Ended | Year Ended |
| | July 31, | January 31, |
| | 2014 | 2014 |
| | ($000) | ($000) |
| Increase (Decrease) in Net Assets | | |
| Operations | | |
| Net Investment Income | 260,489 | 405,185 |
| Realized Net Gain (Loss) | 2,720,238 | 3,351,986 |
| Change in Unrealized Appreciation (Depreciation) | 1,063,222 | 5,664,512 |
| Net Increase (Decrease) in Net Assets Resulting from Operations | 4,043,949 | 9,421,683 |
| Distributions | | |
| Net Investment Income | | |
| Investor Shares | (8,916) | (114,317) |
| Admiral Shares | (24,179) | (298,735) |
| Realized Capital Gain1 | | |
| Investor Shares | (429,002) | (709,234) |
| Admiral Shares | (1,082,154) | (1,636,385) |
| Total Distributions | (1,544,251) | (2,758,671) |
| Capital Share Transactions | | |
| Investor Shares | (284,469) | (941,911) |
| Admiral Shares | 2,064,606 | 4,322,361 |
| Net Increase (Decrease) from Capital Share Transactions | 1,780,137 | 3,380,450 |
| Total Increase (Decrease) | 4,279,835 | 10,043,462 |
| Net Assets | | |
| Beginning of Period | 34,726,553 | 24,683,091 |
| End of Period2 | 39,006,388 | 34,726,553 |
1 Includes fiscal 2015 and 2014 short-term gain distributions totaling $103,531,000 and $146,863,000, respectively. Short-term gaindistributions are treated as ordinary income dividends for tax purposes.2 Net Assets—End of Period includes undistributed (overdistributed) net investment income of $144,574,000 and ($83,069,000).See accompanying Notes, which are an integral part of the Financial Statements.
18
Health Care Fund
Financial Highlights
| | | | | | |
| Investor Shares | | | | | | |
| Six Months | | | | | |
| | Ended | | | | | |
| For a Share Outstanding | July 31, | Year Ended January 31, |
| Throughout Each Period | 2014 | 2014 | 2013 | 2012 | 2011 | 2010 |
| Net Asset Value, Beginning of Period | $191.63 | $152.58 | $131.96 | $124.30 | $120.06 | $99.12 |
| Investment Operations | | | | | | |
| Net Investment Income | 1.357 | 2.350 | 2.777 | 2.300 | 2.046 | 1.902 |
| Net Realized and Unrealized Gain (Loss) | | | | | | |
| on Investments | 20.451 | 53.058 | 22.791 | 12.780 | 7.404 | 21.530 |
| Total from Investment Operations | 21.808 | 55.408 | 25.568 | 15.080 | 9.450 | 23.432 |
| Distributions | | | | | | |
| Dividends from Net Investment Income | (.172) | (2.357) | (2.757) | (2.237) | (2.007) | (1.761) |
| Distributions from Realized Capital Gains | (8.276) | (14.001) | (2.191) | (5.183) | (3.203) | (.731) |
| Total Distributions | (8.448) | (16.358) | (4.948) | (7.420) | (5.210) | (2.492) |
| Net Asset Value, End of Period | $204.99 | $191.63 | $152.58 | $131.96 | $124.30 | $120.06 |
| |
| Total Return1 | 11.62% | 37.66% | 19.59% | 12.50% | 7.95% | 23.63% |
| |
| Ratios/Supplemental Data | | | | | | |
| Net Assets, End of Period (Millions) | $10,302 | $9,905 | $8,681 | $8,462 | $8,447 | $11,692 |
| Ratio of Total Expenses to | | | | | | |
| Average Net Assets | 0.35% | 0.35% | 0.35% | 0.35% | 0.35% | 0.36% |
| Ratio of Net Investment Income to | | | | | | |
| Average Net Assets | 1.37% | 1.33% | 1.94% | 1.72% | 1.67% | 1.73% |
| Portfolio Turnover Rate | 28% | 21% | 8% | 8% | 9% | 6% |
The expense ratio, net income ratio, and turnover rate for the current period have been annualized. 1 Total returns do not include transaction fees that may have applied in the periods shown. Fund prospectuses provide information about any applicable transaction fees. See accompanying Notes, which are an integral part of the Financial Statements.
19
Health Care Fund
Financial Highlights
| | | | | | |
| Admiral Shares | | | | | | |
| Six Months | | | | | |
| | Ended | | | | | |
| For a Share Outstanding | July 31, | Year Ended January 31, |
| Throughout Each Period | 2014 | 2014 | 2013 | 2012 | 2011 | 2010 |
| Net Asset Value, Beginning of Period | $80.84 | $64.37 | $55.68 | $52.45 | $50.67 | $41.83 |
| Investment Operations | | | | | | |
| Net Investment Income | .596 | 1.040 | 1.211 | 1.005 | .891 | .835 |
| Net Realized and Unrealized Gain (Loss) | | | | | | |
| on Investments | 8.623 | 22.378 | 9.605 | 5.392 | 3.115 | 9.091 |
| Total from Investment Operations | 9.219 | 23.418 | 10.816 | 6.397 | 4.006 | 9.926 |
| Distributions | | | | | | |
| Dividends from Net Investment Income | (.078) | (1.042) | (1.201) | (.980) | (.874) | (.777) |
| Distributions from Realized Capital Gains | (3.491) | (5.906) | (.925) | (2.187) | (1.352) | (.309) |
| Total Distributions | (3.569) | (6.948) | (2.126) | (3.167) | (2.226) | (1.086) |
| Net Asset Value, End of Period | $86.49 | $80.84 | $64.37 | $55.68 | $52.45 | $50.67 |
| |
| Total Return1 | 11.64% | 37.74% | 19.65% | 12.57% | 7.99% | 23.72% |
| |
| Ratios/Supplemental Data | | | | | | |
| Net Assets, End of Period (Millions) | $28,705 | $24,821 | $16,002 | $12,968 | $11,459 | $8,619 |
| Ratio of Total Expenses to | | | | | | |
| Average Net Assets | 0.30% | 0.30% | 0.30% | 0.30% | 0.30% | 0.29% |
| Ratio of Net Investment Income to | | | | | | |
| Average Net Assets | 1.42% | 1.38% | 1.99% | 1.77% | 1.72% | 1.80% |
| Portfolio Turnover Rate | 28% | 21% | 8% | 8% | 9% | 6% |
The expense ratio, net income ratio, and turnover rate for the current period have been annualized. 1 Total returns do not include transaction fees that may have applied in the periods shown. Fund prospectuses provide information about any applicable transaction fees. See accompanying Notes, which are an integral part of the Financial Statements.
20
Health Care Fund
Notes to Financial Statements
Vanguard Health Care Fund is registered under the Investment Company Act of 1940 as an open-end investment company, or mutual fund. The fund invests in securities of foreign issuers, which may subject it to investment risks not normally associated with investing in securities of U.S. corporations. The fund offers two classes of shares: Investor Shares and Admiral Shares. Investor Shares are available to any investor who meets the fund’s minimum purchase requirements. Admiral Shares are designed for investors who meet certain administrative, service, and account-size criteria.
A. The following significant accounting policies conform to generally accepted accounting principles for U.S. investment companies. The fund consistently follows such policies in preparing its financial statements.
1. Security Valuation: Securities are valued as of the close of trading on the New York Stock Exchange (generally 4 p.m., Eastern time) on the valuation date. Equity securities are valued at the latest quoted sales prices or official closing prices taken from the primary market in which each security trades; such securities not traded on the valuation date are valued at the mean of the latest quoted bid and asked prices. Securities for which market quotations are not readily available, or whose values have been affected by events occurring before the fund’s pricing time but after the close of the securities’ primary markets, are valued at their fair values calculated according to procedures adopted by the board of trustees. These procedures include obtaining quotations from an independent pricing service, monitoring news to identify significant market- or security-specific events, and evaluating changes in the values of foreign market proxies (for example, ADRs, futures contracts, or exchange-traded funds), between the time the foreign markets close and the fund’s pricing time. When fair-value pricing is employed, the prices of securities used by a fund to calculate its net asset value may differ from quoted or published prices for the same securities. Temporary cash investments acquired over 60 days to maturity are valued using the latest bid prices or using valuations based on a matrix system (which considers such factors as security prices, yields, maturities, and ratings), both as furnished by independent pricing services. Other temporary cash investments are valued at amortized cost, which approximates market value.
2. Foreign Currency: Securities and other assets and liabilities denominated in foreign currencies are translated into U.S. dollars using exchange rates obtained from an independent third party as of the fund’s pricing time on the valuation date. Realized gains (losses) and unrealized appreciation (depreciation) on investment securities include the effects of changes in exchange rates since the securities were purchased, combined with the effects of changes in security prices. Fluctuations in the value of other assets and liabilities resulting from changes in exchange rates are recorded as unrealized foreign currency gains (losses) until the assets or liabilities are settled in cash, at which time they are recorded as realized foreign currency gains (losses).
3. Forward Currency Contracts: The fund enters into forward currency contracts to protect the value of securities and related receivables and payables against changes in future foreign exchange rates. The fund’s risks in using these contracts include movement in the values of the foreign currencies relative to the U.S. dollar and the ability of the counterparties to fulfill their obligations under the contracts. The fund mitigates its counterparty risk by entering into forward currency contracts only with a diverse group of prequalified counterparties, monitoring their financial strength, entering into master netting arrangements with its counterparties, and requiring its counterparties to transfer collateral as security for their performance. The master netting arrangements provide that, in the event of a counterparty’s default (including bankruptcy), the fund may terminate the forward currency contracts, determine the net amount owed by either party in accordance with its master netting arrangements, and sell or retain any collateral held up to the net amount owed to the fund under the master netting arrangements. The forward currency contracts contain provisions whereby a counterparty may terminate open contracts if
21
Health Care Fund
the fund’s net assets decline below a certain level, triggering a payment by the fund if the fund is in a net liability position at the time of the termination. The payment amount would be reduced by any collateral the fund has pledged. Any assets pledged as collateral for open contracts are noted in the Statement of Net Assets. The value of collateral received or pledged is compared daily to the value of the forward currency contracts exposure with each counterparty, and any difference, if in excess of a specified minimum transfer amount, is adjusted and settled within two business days.
Forward currency contracts are valued at their quoted daily prices obtained from an independent third party, adjusted for currency risk based on the expiration date of each contract. The aggregate notional amounts of the contracts are not recorded in the Statement of Net Assets. Fluctuations in the value of the contracts are recorded in the Statement of Net Assets as an asset (liability) and in the Statement of Operations as unrealized appreciation (depreciation) until the contracts are closed, when they are recorded as realized forward currency contract gains (losses).
During the six months ended July 31, 2014, the fund’s average investment in forward currency contracts represented 1% of net assets, based on the average of notional amounts at each quarter-end during the period.
4. Repurchase Agreements: The fund enters into repurchase agreements with institutional counterparties. Securities pledged as collateral to the fund under repurchase agreements are held by a custodian bank until the agreements mature. Each agreement requires that the market value of the collateral be sufficient to cover payments of interest and principal. The fund further mitigates its counterparty risk by entering into repurchase agreements only with a diverse group of prequalified counterparties, monitoring their financial strength, and entering into master repurchase agreements with its counterparties. The master repurchase agreements provide that, in the event of a counterparty’s default (including bankruptcy), the fund may terminate any repurchase agreements with that counterparty, determine the net amount owed, and sell or retain the collateral up to the net amount owed to the fund. Such action may be subject to legal proceedings, which may delay or limit the disposition of collateral.
5. Federal Income Taxes: The fund intends to continue to qualify as a regulated investment company and distribute all of its taxable income. Management has analyzed the fund’s tax positions taken for all open federal income tax years (January 31, 2011–2014), and for the period ended July 31, 2014, and has concluded that no provision for federal income tax is required in the fund’s financial statements. 6. Distributions: Distributions to shareholders are recorded on the ex-dividend date.
7. Securities Lending: To earn additional income, the fund lends its securities to qualified institutional borrowers. Security loans are required to be secured at all times by collateral in an amount at least equal to the market value of securities loaned. Daily market fluctuations could cause the value of loaned securities to be more or less than the value of the collateral received. When this occurs, the collateral is adjusted and settled on the next business day. The fund further mitigates its counterparty risk by entering into securities lending transactions only with a diverse group of prequalified counterparties, monitoring their financial strength, and entering into master securities lending agreements with its counterparties. The master securities lending agreements provide that, in the event of a counterparty’s default (including bankruptcy), the fund may terminate any loans with that borrower, determine the net amount owed, and sell or retain the collateral up to the net amount owed to the fund; however, such actions may be subject to legal proceedings. While collateral mitigates counterparty risk, in the absence of a default the fund may experience delays and costs in recovering the securities loaned. The fund invests cash collateral received in Vanguard Market Liquidity Fund, and
22
Health Care Fund
records a liability in the Statement of Net Assets for the return of the collateral, during the period the securities are on loan. Securities lending income represents fees charged to borrowers plus income earned on invested cash collateral, less expenses associated with the loan.
8. Credit Facility: The fund and certain other funds managed by The Vanguard Group participate in a $2.89 billion committed credit facility provided by a syndicate of lenders pursuant to a credit agreement that may be renewed annually; each fund is individually liable for its borrowings, if any, under the credit facility. Borrowings may be utilized for temporary and emergency purposes, and are subject to the fund’s regulatory and contractual borrowing restrictions. The participating funds are charged administrative fees and an annual commitment fee of 0.06% of the undrawn amount of the facility; these fees are allocated to the funds based on a method approved by the fund’s board of trustees and included in Management and Administrative expenses on the fund’s Statement of Operations. Any borrowings under this facility bear interest at a rate equal to the higher of the federal funds rate or LIBOR reference rate plus an agreed-upon spread.
The fund had no borrowings outstanding at July 31, 2014, or at any time during the period then ended.
9. Other: Dividend income is recorded on the ex-dividend date. Interest income is accrued daily. Premiums and discounts on debt securities purchased are amortized and accreted, respectively, to interest income over the lives of the respective securities. Security transactions are accounted for on the date securities are bought or sold. Costs used to determine realized gains (losses) on the sale of investment securities are those of the specific securities sold.
Each class of shares has equal rights as to assets and earnings, except that each class separately bears certain class-specific expenses related to maintenance of shareholder accounts (included in Management and Administrative expenses) and shareholder reporting. Marketing and distribution expenses are allocated to each class of shares based on a method approved by the board of trustees. Income, other non-class-specific expenses, and gains and losses on investments are allocated to each class of shares based on its relative net assets.
B. Wellington Management Company, llp, provides investment advisory services to the fund for a fee calculated at an annual percentage rate of average net assets. For the six months ended July 31, 2014, the investment advisory fee represented an effective annual rate of 0.15% of the fund’s average net assets.
Beginning in May 2015, the investment advisory fee will be subject to quarterly adjustments based on performance since May 1, 2014, relative to the MSCI ACW Health Care Index.
C. The Vanguard Group furnishes at cost corporate management, administrative, marketing, and distribution services. The costs of such services are allocated to the fund based on methods approved by the board of trustees. The fund has committed to provide up to 0.40% of its net assets in capital contributions to Vanguard. At July 31, 2014, the fund had contributed capital of $3,933,000 to Vanguard (included in Other Assets), representing 0.01% of the fund’s net assets and 1.57% of Vanguard’s capitalization. The fund’s trustees and officers are also directors and officers of Vanguard.
D. Various inputs may be used to determine the value of the fund’s investments. These inputs are summarized in three broad levels for financial statement purposes. The inputs or methodologies used to value securities are not necessarily an indication of the risk associated with investing in those securities.
Level 1—Quoted prices in active markets for identical securities.
Level 2—Other significant observable inputs (including quoted prices for similar securities, interest rates, prepayment speeds, credit risk, etc.).
Level 3—Significant unobservable inputs (including the fund’s own assumptions used to determine the fair value of investments).
23
Health Care Fund
The following table summarizes the market value of the fund’s investments as of July 31, 2014, based on the inputs used to value them:
| | | |
| | Level 1 | Level 2 | Level 3 |
| Investments | ($000) | ($000) | ($000) |
| Common Stocks—U.S. | 29,201,189 | — | — |
| Common Stocks—International | 315,738 | 8,083,895 | — |
| Temporary Cash Investments | — | 1,497,317 | — |
| Forward Currency Contracts—Assets | — | 6,425 | — |
| Total | 29,516,927 | 9,587,637 | — |
At July 31, 2014, the fund had open forward currency contracts to receive and deliver currencies as follows. Unrealized appreciation (depreciation) on open forward currency contracts is treated as realized gain (loss) for tax purposes.
| | | | | | |
| | | | | | | Unrealized |
| | Contract | | | | | Appreciation |
| | Settlement | Contract Amount (000) | (Depreciation) |
| Counterparty | Date | | Receive | | Deliver | ($000) |
| BNP Paribas | 9/17/14 | USD | 355,146 | JPY | 36,190,108 | 3,217 |
| Bank of America NA | 9/17/14 | USD | 355,138 | JPY | 36,190,109 | 3,208 |
| | | | | | | 6,425 |
JPY—Japanese yen.
USD—U.S. dollar.
After July 31, 2014, the counterparty posted collateral of $6,107,000 in connection with open forward currency contracts as of July 31, 2014.
E. Distributions are determined on a tax basis and may differ from net investment income and realized capital gains for financial reporting purposes. Differences may be permanent or temporary. Permanent differences are reclassified among capital accounts in the financial statements to reflect their tax character. Temporary differences arise when certain items of income, expense, gain, or loss are recognized in different periods for financial statement and tax purposes. These differences will reverse at some time in the future. Differences in classification may also result from the treatment of short-term gains as ordinary income for tax purposes. The fund’s tax-basis capital gains and losses are determined only at the end of each fiscal year.
During the six months ended July 31, 2014, the fund realized net foreign currency gains of $249,000, which increased distributable net income for tax purposes; accordingly, such gains have been reclassified from accumulated net realized gains to undistributed net investment income.
At July 31, 2014, the cost of investment securities for tax purposes was $22,445,964,000. Net unrealized appreciation of investment securities for tax purposes was $16,652,175,000, consisting of unrealized gains of $16,768,984,000 on securities that had risen in value since their purchase and $116,809,000 in unrealized losses on securities that had fallen in value since their purchase.
F. During the six months ended July 31, 2014, the fund purchased $5,566,563,000 of investment securities and sold $5,065,533,000 of investment securities, other than temporary cash investments.
24
Health Care Fund
G. Capital share transactions for each class of shares were:
| | | | |
| | Six Months Ended | | Year Ended |
| | July 31, 2014 | January 31, 2014 |
| | Amount | Shares | Amount | Shares |
| | ($000) | (000) | ($000) | (000) |
| Investor Shares | | | | |
| Issued | 960,200 | 4,815 | 1,769,228 | 10,118 |
| Issued in Lieu of Cash Distributions | 418,686 | 2,151 | 784,653 | 4,547 |
| Redeemed | (1,663,355) | (8,402) | (3,495,792) | (19,870) |
| Net Increase (Decrease)—Investor Shares | (284,469) | (1,436) | (941,911) | (5,205) |
| Admiral Shares | | | | |
| Issued | 2,072,841 | 24,719 | 4,148,023 | 55,782 |
| Issued in Lieu of Cash Distributions | 1,020,070 | 12,425 | 1,775,274 | 24,189 |
| Redeemed | (1,028,305) | (12,303) | (1,600,936) | (21,502) |
| Net Increase (Decrease)—Admiral Shares | 2,064,606 | 24,841 | 4,322,361 | 58,469 |
H. Certain of the fund’s investments are in companies that are considered to be affiliated companies of the fund because the fund owns more than 5% of the outstanding voting securities of the company. Transactions during the period in securities of these companies were as follows:
| | | | | |
| | | Current Period Transactions | |
| | Jan. 31, 2014 | | Proceeds from | | July 31, 2014 |
| | Market | Purchases | Securities | Dividend | Market |
| | Value | at Cost | Sold | Income | Value |
| | ($000) | ($000) | ($000) | ($000) | ($000) |
| Alnylam Pharmaceuticals Inc. | 343,441 | 66,750 | — | — | 280,147 |
| Forest Laboratories Inc. | 1,768,013 | — | 1,010,160 | — | — |
| Incyte Corp. | NA1 | 278,091 | — | — | 483,994 |
| Medicines Co. | 159,864 | 3,983 | — | — | 110,627 |
| PAREXEL International Corp. | 234,566 | 12,150 | — | — | 271,946 |
| Prothena Corp. plc | 41,074 | 7,544 | — | — | 28,866 |
| UCB SA | 661,141 | — | — | 11,464 | NA2 |
| Total | 3,208,099 | | | 11,464 | 1,175,580 |
1 Not applicable—At January 31, 2014, the issuer was not an affiliated company of the fund.2 Not applicable—At July 31, 2014, the security was still held, but the issuer was no longer an affiliated company of the fund.I. The fund determined that a corporate action previously recorded as a non-taxable transaction was taxable in the fiscal year ended January 31, 2014. As a result, the fund will distribute additional long-term capital gains of $113,000,000 to shareholders in October 2014. Management has determined that no other material events or transactions occurred subsequent to July 31, 2014, that would require recognition or disclosure in these financial statements.
25
About Your Fund’s Expenses
As a shareholder of the fund, you incur ongoing costs, which include costs for portfolio management, administrative services, and shareholder reports (like this one), among others. Operating expenses, which are deducted from a fund’s gross income, directly reduce the investment return of the fund.
A fund’s expenses are expressed as a percentage of its average net assets. This figure is known as the expense ratio. The following examples are intended to help you understand the ongoing costs (in dollars) of investing in your fund and to compare these costs with those of other mutual funds. The examples are based on an investment of $1,000 made at the beginning of the period shown and held for the entire period.
The accompanying table illustrates your fund’s costs in two ways:
• Based on actual fund return. This section helps you to estimate the actual expenses that you paid over the period. The ”Ending Account Value“ shown is derived from the fund‘s actual return, and the third column shows the dollar amount that would have been paid by an investor who started with $1,000 in the fund. You may use the information here, together with the amount you invested, to estimate the expenses that you paid over the period.
To do so, simply divide your account value by $1,000 (for example, an $8,600 account value divided by $1,000 = 8.6), then multiply the result by the number given for your fund under the heading ”Expenses Paid During Period.“
• Based on hypothetical 5% yearly return. This section is intended to help you compare your fund‘s costs with those of other mutual funds. It assumes that the fund had a yearly return of 5% before expenses, but that the expense ratio is unchanged. In this case—because the return used is not the fund’s actual return—the results do not apply to your investment. The example is useful in making comparisons because the Securities and Exchange Commission requires all mutual funds to calculate expenses based on a 5% return. You can assess your fund’s costs by comparing this hypothetical example with the hypothetical examples that appear in shareholder reports of other funds.
Note that the expenses shown in the table are meant to highlight and help you compare ongoing costs only and do not reflect transaction costs incurred by the fund for buying and selling securities. Further, the expenses do not include any purchase, redemption, or account service fees described in the fund prospectus. If such fees were applied to your account, your costs would be higher. Your fund does not carry a “sales load.”
The calculations assume no shares were bought or sold during the period. Your actual costs may have been higher or lower, depending on the amount of your investment and the timing of any purchases or redemptions.
You can find more information about the fund’s expenses, including annual expense ratios, in the Financial Statements section of this report. For additional information on operating expenses and other shareholder costs, please refer to your fund’s current prospectus.
26
| | | |
| Six Months Ended July 31, 2014 | | | |
| | Beginning | Ending | Expenses |
| | Account Value | Account Value | Paid During |
| Health Care Fund | 1/31/2014 | 7/31/2014 | Period |
| Based on Actual Fund Return | | | |
| Investor Shares | $1,000.00 | $1,116.15 | $1.84 |
| Admiral Shares | 1,000.00 | 1,116.40 | 1.57 |
| Based on Hypothetical 5% Yearly Return | | | |
| Investor Shares | $1,000.00 | $1,023.06 | $1.76 |
| Admiral Shares | 1,000.00 | 1,023.31 | 1.51 |
The calculations are based on expenses incurred in the most recent six-month period. The fund’s annualized six-month expense ratios for thatperiod are 0.35% for Investor Shares and 0.30% for Admiral Shares. The dollar amounts shown as “Expenses Paid” are equal to theannualized expense ratio multiplied by the average account value over the period, multiplied by the number of days in the most recentsix-month period, then divided by the number of days in the most recent 12-month period.27
Trustees Approve Advisory Arrangement
The board of trustees of Vanguard Health Care Fund has renewed the fund’s investment advisory arrangement with Wellington Management Company, LLP (Wellington Management). In addition, the board approved the addition of a performance adjustment schedule to the fee arrangement in the advisory agreement, effective May 1, 2014, to further align the interests of the advisor and the fund’s shareholders. The performance adjustment will increase or decrease the asset-based fee proportionately with the investment performance of the fund’s assets managed by Wellington Management. The adjustment will be based on the cumulative total performance over a trailing 36-month period (subject to certain transition rules that will be in place until 36 months have elapsed from the date of the new agreement) as compared with that of the MSCI ACW Health Care Index over the same period. Other terms of the advisory agreement have not changed. The board determined that renewing the fund’s advisory arrangement and adding the performance adjustment schedule was in the best interests of the fund and its shareholders.
The board based its decision upon an evaluation of the advisor’s investment staff, portfolio management process, and performance. The trustees considered the factors discussed below, among others. However, no single factor determined whether the board approved the arrangement. Rather, it was the totality of the circumstances that drove the board’s decision.
Nature, extent, and quality of services
The board considered the quality of the fund’s investment management services over both the short and long term, and the organizational depth and stability of the advisory firm. The board noted that Wellington Management, founded in 1928, is among the nation’s oldest and most respected institutional investment managers. The portfolio manager is aided by a team of five experienced health care analysts. This health care team uses intensive fundamental analysis to identify companies with high-quality balance sheets, strong management, and the potential for new products that lead to above-average growth in revenue and earnings. The advisor invests in stocks broadly representing the health care industry, seeking to maintain exposure across five primary subsectors: health services, medical products, specialty pharmaceuticals, major pharmaceuticals, and international markets. Wellington Management has advised the Health Care Fund since the fund’s inception in 1984.
The board concluded that the advisor’s experience, stability, depth, and performance, among other factors, warranted approval and continuation of the advisory arrangement.
Investment performance
The board considered the short- and long-term performance of the fund, including any periods of outperformance or underperformance relative to a benchmark index and peer group. The board concluded that the performance was such that the advisory arrangement should continue. Information about the fund’s most recent performance can be found in the Performance Summary section of this report.
Cost
The board concluded that the fund’s expense ratio was well below the average expense ratio charged by funds in its peer group and that the fund’s advisory fee rate was also well below its peer-group average. Information about the fund’s expenses appears in the About Your Fund’s Expenses section of this report as well as in the Financial Statements section, which also includes information about the advisory fee rate.
The board did not consider profitability of Wellington Management in determining whether to approve the advisory fee, because Wellington Management is independent of Vanguard, and the advisory fee is the result of arm’s-length negotiations.
28
The benefit of economies of scale
The board concluded that the fund’s shareholders benefit from economies of scale because of breakpoints in the fund’s advisory fee schedule. The breakpoints reduce the effective rate of the fee as the fund’s assets increase.
The board will consider whether to renew the advisory arrangement again after a one-year period.
29
Glossary
30-Day SEC Yield. A fund’s 30-day SEC yield is derived using a formula specified by the U.S. Securities and Exchange Commission. Under the formula, data related to the fund’s security holdings in the previous 30 days are used to calculate the fund’s hypothetical net income for that period, which is then annualized and divided by the fund’s estimated average net assets over the calculation period. For the purposes of this calculation, a security’s income is based on its current market yield to maturity (for bonds), its actual income (for asset-backed securities), or its projected dividend yield (for stocks). Because the SEC yield represents hypothetical annualized income, it will differ—at times significantly—from the fund’s actual experience. As a result, the fund’s income distributions may be higher or lower than implied by the SEC yield.
Beta. A measure of the magnitude of a fund’s past share-price fluctuations in relation to the ups and downs of a given market index. The index is assigned a beta of 1.00. Compared with a given index, a fund with a beta of 1.20 typically would have seen its share price rise or fall by 12% when the index rose or fell by 10%. For this report, beta is based on returns over the past 36 months for both the fund and the index. Note that a fund’s beta should be reviewed in conjunction with its R-squared (see definition). The lower the R-squared, the less correlation there is between the fund and the index, and the less reliable beta is as an indicator of volatility.
Dividend Yield. Dividend income earned by stocks, expressed as a percentage of the aggregate market value (or of net asset value, for a fund). The yield is determined by dividing the amount of the annual dividends by the aggregate value (or net asset value) at the end of the period. For a fund, the dividend yield is based solely on stock holdings and does not include any income produced by other investments.
Earnings Growth Rate. The average annual rate of growth in earnings over the past five years for the stocks now in a fund.
Equity Exposure. A measure that reflects a fund’s investments in stocks and stock futures. Any holdings in short-term reserves are excluded.
Expense Ratio. A fund’s total annual operating expenses expressed as a percentage of the fund’s average net assets. The expense ratio includes management and administrative expenses, but does not include the transaction costs of buying and selling portfolio securities.
Foreign Holdings. The percentage of a fund represented by securities or depositary receipts of companies based outside the United States.
Inception Date. The date on which the assets of a fund (or one of its share classes) are first invested in accordance with the fund’s investment objective. For funds with a subscription period, the inception date is the day after that period ends. Investment performance is measured from the inception date.
Median Market Cap. An indicator of the size of companies in which a fund invests; the midpoint of market capitalization (market price x shares outstanding) of a fund’s stocks, weighted by the proportion of the fund’s assets invested in each stock. Stocks representing half of the fund’s assets have market capitalizations above the median, and the rest are below it.
Price/Book Ratio. The share price of a stock divided by its net worth, or book value, per share. For a fund, the weighted average price/book ratio of the stocks it holds.
30
Price/Earnings Ratio. The ratio of a stock’s current price to its per-share earnings over the past year. For a fund, the weighted average P/E of the stocks it holds. P/E is an indicator of market expectations about corporate prospects; the higher the P/E, the greater the expectations for a company’s future growth.
R-Squared. A measure of how much of a fund’s past returns can be explained by the returns from the market in general, as measured by a given index. If a fund’s total returns were precisely synchronized with an index’s returns, its R-squared would be 1.00. If the fund’s returns bore no relationship to the index’s returns, its R-squared would be 0. For this report, R-squared is based on returns over the past 36 months for both the fund and the index.
Return on Equity. The annual average rate of return generated by a company during the past five years for each dollar of shareholder’s equity (net income divided by shareholder’s equity). For a fund, the weighted average return on equity for the companies whose stocks it holds.
Short-Term Reserves. The percentage of a fund invested in highly liquid, short-term securities that can be readily converted to cash.
Turnover Rate. An indication of the fund’s trading activity. Funds with high turnover rates incur higher transaction costs and may be more likely to distribute capital gains (which may be taxable to investors). The turnover rate excludes in-kind transactions, which have minimal impact on costs.
Benchmark Information
Spliced Health Care Index: S&P 500 Index through December 31, 2001; S&P Health Care Index through May 31, 2010; MSCI All Country World Health Care Index thereafter.
31
The People Who Govern Your Fund
The trustees of your mutual fund are there to see that the fund is operated and managed in your best interests since, as a shareholder, you are a part owner of the fund. Your fund’s trustees also serve on the board of directors of The Vanguard Group, Inc., which is owned by the Vanguard funds and provides services to them on an at-cost basis.
A majority of Vanguard’s board members are independent, meaning that they have no affiliation with Vanguard or the funds they oversee, apart from the sizable personal investments they have made as private individuals. The independent board members have distinguished backgrounds in business, academia, and public service. Each of the trustees and executive officers oversees 177 Vanguard funds.
The following table provides information for each trustee and executive officer of the fund. More information about the trustees is in the Statement of Additional Information, which can be obtained, without charge, by contacting Vanguard at 800-662-7447, or online at vanguard.com.
| |
| InterestedTrustee1 | and Delphi Automotive LLP (automotive components); |
| | Senior Advisor at New Mountain Capital. |
| F. William McNabb III | |
| Born 1957. Trustee Since July 2009. Chairman of the | Amy Gutmann |
| Board. Principal Occupation(s) During the Past Five | Born 1949. Trustee Since June 2006. Principal |
| Years: Chairman of the Board of The Vanguard Group, | Occupation(s) During the Past Five Years: President of |
| Inc., and of each of the investment companies served | the University of Pennsylvania; Christopher H. Browne |
| by The Vanguard Group, since January 2010; Director | Distinguished Professor of Political Science, School of |
| of The Vanguard Group since 2008; Chief Executive | Arts and Sciences, and Professor of Communication, |
| Officer and President of The Vanguard Group, and of | Annenberg School for Communication, with secondary |
| each of the investment companies served by The | faculty appointments in the Department of Philosophy, |
| Vanguard Group, since 2008; Director of Vanguard | School of Arts and Sciences, and at the Graduate |
| Marketing Corporation; Managing Director of The | School of Education, University of Pennsylvania; |
| Vanguard Group (1995–2008). | Trustee of the National Constitution Center; Chair |
| | of the Presidential Commission for the Study of |
| | Bioethical Issues. |
| IndependentTrustees | |
| | JoAnn Heffernan Heisen |
| Emerson U. Fullwood | Born 1950. Trustee Since July 1998. Principal |
| Born 1948. Trustee Since January 2008. Principal | Occupation(s) During the Past Five Years: Corporate |
| Occupation(s) During the Past Five Years: Executive | Vice President and Chief Global Diversity Officer |
| Chief Staff and Marketing Officer for North America | (retired 2008) and Member of the Executive |
| and Corporate Vice President (retired 2008) of Xerox | Committee (1997–2008) of Johnson & Johnson |
| Corporation (document management products and | (pharmaceuticals/medical devices/consumer |
| services); Executive in Residence and 2009–2010 | products); Director of Skytop Lodge Corporation |
| Distinguished Minett Professor at the Rochester | (hotels), the University Medical Center at Princeton, |
| Institute of Technology; Director of SPX Corporation | the Robert Wood Johnson Foundation, and the Center |
| (multi-industry manufacturing), the United Way of | for Talent Innovation; Member of the Advisory Board |
| Rochester, Amerigroup Corporation (managed health | of the Maxwell School of Citizenship and Public Affairs |
| care), the University of Rochester Medical Center, | at Syracuse University. |
| Monroe Community College Foundation, and North | |
| Carolina A&T University. | F. Joseph Loughrey |
| | Born 1949. Trustee Since October 2009. Principal |
| Rajiv L. Gupta | Occupation(s) During the Past Five Years: President |
| Born 1945. Trustee Since December 2001.2 | and Chief Operating Officer (retired 2009) of Cummins |
| Principal Occupation(s) During the Past Five Years: | Inc. (industrial machinery); Chairman of the Board |
| Chairman and Chief Executive Officer (retired 2009) | of Hillenbrand, Inc. (specialized consumer services), |
| and President (2006–2008) of Rohm and Haas Co. | and of Oxfam America; Director of SKF AB (industrial |
| (chemicals); Director of Tyco International, Ltd. | machinery), Hyster-Yale Materials Handling, Inc. |
| (diversified manufacturing and services), Hewlett- | (forklift trucks), the Lumina Foundation for Education, |
| Packard Co. (electronic computer manufacturing), | |
| | |
| and the V Foundation for Cancer Research; Member | Executive Officers | |
| of the Advisory Council for the College of Arts and | | |
| Letters and of the Advisory Board to the Kellogg | Glenn Booraem | |
| Institute for International Studies, both at the | Born 1967. Controller Since July 2010. Principal |
| University of Notre Dame. | Occupation(s) During the Past Five Years: Principal |
| | of The Vanguard Group, Inc.; Controller of each of |
| Mark Loughridge | the investment companies served by The Vanguard |
| Born 1953. Trustee Since March 2012. Principal | Group; Assistant Controller of each of the investment |
| Occupation(s) During the Past Five Years: Senior Vice | companies served by The Vanguard Group (2001–2010). |
| President and Chief Financial Officer (retired 2013) | | |
| at IBM (information technology services); Fiduciary | Thomas J. Higgins | |
| Member of IBM’s Retirement Plan Committee (2004– | Born 1957. Chief Financial Officer Since September |
| 2013); Member of the Council on Chicago Booth. | 2008. Principal Occupation(s) During the Past Five |
| | Years: Principal of The Vanguard Group, Inc.; Chief |
| Scott C. Malpass | Financial Officer of each of the investment companies |
| Born 1962. Trustee Since March 2012. Principal | served by The Vanguard Group; Treasurer of each of |
| Occupation(s) During the Past Five Years: Chief | the investment companies served by The Vanguard |
| Investment Officer and Vice President at the University | Group (1998–2008). | |
| of Notre Dame; Assistant Professor of Finance at the | | |
| Mendoza College of Business at Notre Dame; Member | Kathryn J. Hyatt | |
| of the Notre Dame 403(b) Investment Committee; | Born 1955. Treasurer Since November 2008. Principal |
| Board Member of TIFF Advisory Services, Inc. | Occupation(s) During the Past Five Years: Principal of |
| (investment advisor); Member of the Investment | The Vanguard Group, Inc.; Treasurer of each of the |
| Advisory Committees of the Financial Industry | investment companies served by The Vanguard |
| Regulatory Authority (FINRA) and of Major League | Group; Assistant Treasurer of each of the investment |
| Baseball. | companies served by The Vanguard Group (1988–2008). |
| |
| André F. Perold | Heidi Stam | |
| Born 1952. Trustee Since December 2004. Principal | Born 1956. Secretary Since July 2005. Principal |
| Occupation(s) During the Past Five Years: George | Occupation(s) During the Past Five Years: Managing |
| Gund Professor of Finance and Banking, Emeritus | Director of The Vanguard Group, Inc.; General Counsel |
| at the Harvard Business School (retired 2011); | of The Vanguard Group; Secretary of The Vanguard |
| Chief Investment Officer and Managing Partner of | Group and of each of the investment companies |
| HighVista Strategies LLC (private investment firm); | served by The Vanguard Group; Director and Senior |
| Director of Rand Merchant Bank; Overseer of the | Vice President of Vanguard Marketing Corporation. |
| Museum of Fine Arts Boston. | | |
| | Vanguard Senior ManagementTeam |
| Alfred M. Rankin, Jr. | | |
| Born 1941. Trustee Since January 1993. Principal | Mortimer J. Buckley | Chris D. McIsaac |
| Occupation(s) During the Past Five Years: Chairman, | Kathleen C. Gubanich | Michael S. Miller |
| President, and Chief Executive Officer of NACCO | Paul A. Heller | James M. Norris |
| Industries, Inc. (housewares/lignite), and of Hyster- | Martha G. King | Glenn W. Reed |
| Yale Materials Handling, Inc. (forklift trucks); Chairman | John T. Marcante | |
| of the Board of University Hospitals of Cleveland. | | |
| |
| Peter F. Volanakis | Chairman Emeritus and Senior Advisor |
| Born 1955. Trustee Since July 2009. Principal | | |
| Occupation(s) During the Past Five Years: President | John J. Brennan | |
| and Chief Operating Officer (retired 2010) of Corning | Chairman, 1996–2009 | |
| Incorporated (communications equipment); Trustee of | Chief Executive Officer and President, 1996–2008 |
| Colby-Sawyer College; Member of the Advisory Board | | |
| of the Norris Cotton Cancer Center and of the Advisory | Founder | |
| Board of the Parthenon Group (strategy consulting). | | |
| | John C. Bogle | |
| | Chairman and Chief Executive Officer, 1974–1996 |
1 Mr. McNabb is considered an “interested person,” as defined in the Investment Company Act of 1940, because he is an officer of the
Vanguard funds.
2 December 2002 for Vanguard Equity Income Fund, the Vanguard Municipal Bond Funds, and the Vanguard State Tax-Exempt Funds.
| |  |
| | |
| | | P.O. Box 2600 |
| | | Valley Forge, PA 19482-2600 |
| |
| |
| |
| Connect with Vanguard® > vanguard.com | |
| |
| |
| |
| Fund Information > 800-662-7447 | | CFA® is a trademark owned by CFA Institute. |
| Direct Investor Account Services > 800-662-2739 | |
| Institutional Investor Services > 800-523-1036 | |
| Text Telephone for People | | |
| With Hearing Impairment > 800-749-7273 | |
| |
| This material may be used in conjunction | |
| with the offering of shares of any Vanguard | |
| fund only if preceded or accompanied by | |
| the fund’s current prospectus. | |
| |
| All comparative mutual fund data are from Lipper, a | |
| Thomson Reuters Company, or Morningstar, Inc., unless | |
| otherwise noted. | | |
| |
| You can obtain a free copy of Vanguard’s proxy voting | |
| guidelines by visiting vanguard.com/proxyreporting or by | |
| calling Vanguard at 800-662-2739. The guidelines are | |
| also available from the SEC’s website, sec.gov. In | |
| addition, you may obtain a free report on how your fund | |
| voted the proxies for securities it owned during the 12 | |
| months ended June 30. To get the report, visit either | |
| vanguard.com/proxyreporting or sec.gov. | |
| |
| You can review and copy information about your fund at | |
| the SEC’s Public Reference Room in Washington, D.C. To | |
| find out more about this public service, call the SEC at | |
| 202-551-8090. Information about your fund is also | |
| available on the SEC’s website, and you can receive | |
| copies of this information, for a fee, by sending a | |
| request in either of two ways: via e-mail addressed to | |
| publicinfo@sec.gov or via regular mail addressed to the | |
| Public Reference Section, Securities and Exchange | |
| Commission, Washington, DC 20549-1520. | |
| |
| | | © 2014 The Vanguard Group, Inc. |
| | | All rights reserved. |
| | | Vanguard Marketing Corporation, Distributor. |
| |
| | | Q522 092014 |

Semiannual Report | July 31, 2014
Vanguard Precious Metals and Mining Fund

Vanguard’s Principles for Investing Success
We want to give you the best chance of investment success. These principles, grounded in Vanguard’s research and experience, can put you on the right path.
Goals. Create clear, appropriate investment goals.
Balance. Develop a suitable asset allocation using broadly diversified funds.
Cost. Minimize cost.
Discipline. Maintain perspective and long-term discipline.
A single theme unites these principles: Focus on the things you can control. We believe there is no wiser course for any investor.
| |
| Contents | |
| Your Fund’s Total Returns. | 1 |
| Chairman’s Letter. | 2 |
| Advisor’s Report. | 7 |
| Fund Profile. | 10 |
| Performance Summary. | 11 |
| Financial Statements. | 12 |
| About Your Fund’s Expenses. | 21 |
| Trustees Approve Advisory Arrangement. | 23 |
| Glossary. | 24 |
Please note: The opinions expressed in this report are just that—informed opinions. They should not be considered promises or advice.
Also, please keep in mind that the information and opinions cover the period through the date on the front of this report. Of course, the
risks of investing in your fund are spelled out in the prospectus.
See the Glossary for definitions of investment terms used in this report.
About the cover: The ship’s wheel represents leadership and guidance, essential qualities in navigating difficult seas.
This one is a replica based on an 18th-century British vessel. The HMS Vanguard, another ship of that era, served as the
flagship for British Admiral Horatio Nelson when he defeated a French fleet at the Battle of the Nile.
Your Fund’s Total Returns
| |
| Six Months Ended July 31, 2014 | |
| | Total |
| | Returns |
| Vanguard Precious Metals and Mining Fund | 12.43% |
| S&P Global Custom Metals and Mining Index | 14.25 |
| Precious Metals Equity Funds Average | 13.77 |
| Precious Metals Equity Funds Average: Derived from data provided by Lipper, a Thomson Reuters Company. |
Your Fund’s Performance at a Glance
January 31, 2014, Through July 31, 2014
| | | | |
| | | | Distributions Per Share |
| | Starting | Ending | Income | Capital |
| | Share Price | Share Price | Dividends | Gains |
| Vanguard Precious Metals and Mining Fund | $10.38 | $11.67 | $0.000 | $0.000 |
1

Chairman’s Letter
Dear Shareholder,
After retreating—often markedly—for more than three straight years, precious metals and mining stocks staged a comeback that began the period strongly, then waned and waxed. Against this volatile backdrop, Vanguard Precious Metals and Mining Fund returned about 12% for the half year ended July 31, 2014. It under-performed its benchmark, the S&P Global Custom Metals and Mining Index, and the average return of its peer funds.
Turbulence is a hallmark of precious metals and mining stocks, which represent less than 5% of the broad global stock market. Investors with exposure to this sector should be aware of its extreme highs and lows and its tendency toward volatility. Its potential for higher rewards is accompanied by a higher degree of risk.
Stocks posted strong returns despite finishing with a thud
The broad U.S. stock market returned about 8% for the period despite ending on a negative note. On the cusp of eking out a sixth straight positive monthly advance, returns tumbled on the period’s final day.
Overall, generally strong corporate earnings, investors’ willingness to embrace risk, and the Federal Reserve’s resolve to sustain historically low interest rates for an extended time were supportive. The market withstood conflict in the Middle East and Ukraine, economic concerns in China and Europe, and the Fed’s gradual reduction of its stimulative bond-buying program.
2
International stocks returned almost 10%. Emerging markets, which slumped notably in 2013, led the charge. The developed markets of the Pacific region managed double-digit returns as well. European stocks, despite retreating in July, also finished on positive ground.
Bonds’ recent rebound showed signs of fatigue
The broad U.S. taxable bond market returned 2.16%. Although bonds have rebounded well after posting negative returns for 2013, they gradually lost momentum in June and July. The yield of the benchmark 10-year U.S. Treasury note ended the period at 2.56%, down from 2.70% on January 31. (Bond prices and yields move in opposite directions.)
Municipal bonds, lifted by the broad bond market rally and less restrained by the later decline in Treasury prices, returned 4.15%. Investor demand for tax-exempt income and a limited supply of new issues also helped.
International bond markets (as measured by the Barclays Global Aggregate Index ex USD) returned 3.35%.
Results for money market funds and savings accounts remained tempered by the Fed’s target of 0%–0.25% for short-term interest rates.
| | | |
| Market Barometer | | | |
| |
| | | | Total Returns |
| | Periods Ended July 31, 2014 |
| | Six | One | Five Years |
| | Months | Year | (Annualized) |
| Stocks | | | |
| Russell 1000 Index (Large-caps) | 9.02% | 17.06% | 17.13% |
| Russell 2000 Index (Small-caps) | -0.30 | 8.56 | 16.56 |
| Russell 3000 Index (Broad U.S. market) | 8.25 | 16.37 | 17.08 |
| FTSE All-World ex US Index (International) | 9.73 | 15.78 | 9.13 |
| |
| Bonds | | | |
| Barclays U.S. Aggregate Bond Index (Broad taxable market) | 2.16% | 3.97% | 4.47% |
| Barclays Municipal Bond Index (Broad tax-exempt market) | 4.15 | 7.27 | 5.50 |
| Citigroup Three-Month U.S. Treasury Bill Index | 0.00 | 0.04 | 0.07 |
| |
| CPI | | | |
| Consumer Price Index | 1.85% | 1.99% | 2.04% |
3
The fund was boosted by rising prices of gold and other precious metals
Because sector funds are focused on one segment of the market, they are by nature more unpredictable and less stable than more balanced and diversified funds. The precious metals and mining industry, a subset of the larger materials sector, is subject to particularly wide price swings. Moreover, these fluctuations can occur quickly and with little or no warning as investors react to economic and geopolitical events.
The tone was set at the start of the period. The fund increased 10% in February as investors sought a potential hedge against inflation and a safe haven amid geopolitical concerns and questions about the U.S. and global economies. After three months of mostly negative or flat returns, the fund surged again in June. As tensions in Ukraine and the Middle East intensified, investors again sought an alternative to bonds and the broad stock market.
The Fed’s statement that it plans to keep short-term interest rates low for a “considerable time” after the end of its bond-buying program also helped. When interest rates are low, investors can be drawn to gold and other precious metals, which, of course, have zero yields.
Vanguard Precious Metals and Mining Fund features an element of diversification that makes it unique among its peers and different from its benchmark. Although it holds only about 50 companies––compared to the more than 250 tracked
Expense Ratios
Your Fund Compared With Its Peer Group
| | |
| | | Peer Group |
| | Fund | Average |
| Precious Metals and Mining Fund | 0.25% | 1.30% |
The fund expense ratio shown is from the prospectus dated May 27, 2014, and represents estimated costs for the current fiscal year. For thesix months ended July 31, 2014, the fund’s annualized expense ratio was 0.29%. The peer-group expense ratio is derived from data providedby Lipper, a Thomson Reuters Company, and captures information through year-end 2013.Peer group: Precious Metals Equity Funds.4
by the benchmark—these holdings are further diversified into subsectors, including specialty chemical firms. This breadth can dampen some of the volatility inherent in precious metals stocks.
Of course, compared to the broad market, the fund’s path can still be quite rocky. When the sector’s stocks are in peak form, the fund generally lags its benchmark and peers. Over the half year, its broad approach to this narrow segment held back relative results when returns outside the core precious metals and mining precincts lagged.
The fund’s advisor, M&G Investment Management Limited, has recently taken steps to reduce exposure to the “off-benchmark” subsectors and increase its allocations to gold and diversified metals and mining. But stock selection was subpar overall, despite pockets of strength. And the fund’s cash holdings and greater exposure to small-capitalization stocks further dragged down performance.
Although these factors didn’t weigh in the fund’s favor, the rise of gold and other precious metals prices ultimately helped it get back on track. As noted above, its allocations to these areas were less than those of the benchmark, but the stocks it did hold outperformed.
Don’t let complacency set your portfolio adrift
At Vanguard, we often warn against letting emotions become entangled with investments. When the financial markets are in turmoil, for example, we’ll caution investors not to let fear lead to rash decisions. But complacency—that mild-mannered counterpoint to fear—can also stand in the way of achieving your financial goals. And lately, conditions have been ripe for complacency.
In the more than five years since its March 2009 bottom, the broad U.S. stock market, as measured by the Russell 3000 Index, has produced average annual returns of nearly 25%. That’s more than double the historical average. And in recent weeks, several indexes touched all-time highs.
The investment winds don’t always blow favorably, of course—a point underscored by the sharp drop for stocks on the last day of July. This unwelcome retreat served to remind us that the exceptionally smooth sailing in the preceding months created risks of its own.
When markets are unusually tranquil, it can be easy to lose sight of fundamentals, especially the importance of rebalancing. Without periodically adjusting your asset allocation so that it stays in line with your goals and risk tolerance, you can end up with a portfolio that’s very different from, and potentially riskier than, the one you intended to have.
5
��
Whether the market’s moving up, down, or sideways, we always encourage our clients to stay focused on four principles for investment success: create clear, appropriate investment goals; develop a suitable asset allocation using broadly diversified funds; minimize cost; and maintain perspective and long-term discipline. (You can read more in Vanguard’s Principles for Investment Success, available at vanguard.com/research.)
As always, thank you for investing with Vanguard.
Sincerely,

F. William McNabb III
Chairman and Chief Executive Officer
August 15, 2014
6
Advisor’s Report
Vanguard Precious Metals and Mining Fund produced a return of 12.43% for the six-month period ended July 31, 2014, lagging the results of its benchmark index (14.25%) and peers (13.77%).
The markets
Emerging markets remain the largest consumers of metals and minerals. Concerns about slowing growth, political uncertainty, and the effects of the U.S. Federal Reserve’s “tapering” on these markets further weakened sentiment in an already underperforming industry.
Much of the share price decline in miners stemmed from wasteful capital allocation But recently, new management teams have changed their policies significantly, and the industry outperformed the wider market during the period. Miners are trading at levels last seen at the end of 2008 and the start of the century, and this opportunity is not going unnoticed by investors. Add in China’s decision to support growth at 7.5%, the election success of India’s economically minded BJP party, the breaking of political deadlock in several countries, and stabilizing local currencies, and the outlook is more positive still.
Commodity prices are a clear sign of underlying demand. They remain strong and indicative of an appetite to secure future supply. Whereas Chinese firms, for example, previously tended to use minority stakes and offtake agreements to secure access to commodities, they now increasingly look to mergers and acquisitions.
Earlier this year, China recorded its largest-ever purchase of an overseas mining project: Hong Kong-listed MMG and partners bought Glencore’s Chile-based copper mine Las Bambas, valued at $7 billion. Chinese M&A laws have been relaxed, enabling state-owned enterprises to purchase any asset worth less than $1 billion without prior approval. Acquisitions involving China have risen sharply. As miners cut production, effectively reducing future output, well-managed companies with quality assets are likely to see additional pricing support.
The fund’s performance
Two of the fund’s long-term holdings were subject to bidding wars, adding significant value. Australian coal and iron ore miner Aquila Resources was the target of a takeover bid by Chinese steel manufacturer Baosteel. The share price rose on the news, leading to further attention by other interested parties. We sold our significant stake in the company to a consortium led by Australian-listed Aurizon at an attractive valuation. U.S.-listed AMCOL International, which mines bentonite, a substance with unique absorption properties, was targeted by two companies seeking to add to and diversify their portfolios. Its share price materially increased on U.S.-based Minerals Technologies’ successful bid.
Australian copper miner OZ Minerals also performed well as its cost reduction measures continued to improve margins. After a challenging 2013, its share price has been supported by signs of increased production and extended mine life.
7
Canadian-listed Centerra Gold and U.K.-listed African Barrick contributed to the returns of our gold holdings. Centerra’s key Kumtor mine is located in the politically challenged Kyrgyz Republic. The company’s share price recovered after an agreement was reached with local government allowing production to resume. African Barrick benefited from operational improvements as the management team under new CEO Brad Gordon executed its business strategy. We believe the company’s intrinsic value is still under-appreciated by the market. It has quality management, a strong balance sheet, and technical teams that are able to make the most of its large resource base in Tanzania. It remains one of our core holdings.
Turning to negatives, U.S.-listed Kinross Gold was the largest detractor. With nearly a quarter of its gold production in Russia, the company has suffered in the wake of the annexation of Crimea and international pressure surrounding the conflict in Ukraine. Meanwhile, its new CEO is engaging with the government in Mauritania to make good the Tasiast mine, which the company bought in 2010 with the aim of converting it to a major, low-cost asset.
After a strong year following its 2013 decision to sell luxury brand Harry Winston, Inc., and acquire BHP Billiton’s Ekati mine, Canadian Dominion Diamond weakened during the period. Despite share price declines, the company continued to increase production at its key assets, supported by rising rough diamond prices.
U.K.-listed platinum recycler and auto-catalyst manufacturer Johnson Matthey also underperformed, although it posted solid six-month results. The company has been hurt by the relative idleness of South African refineries. Recent strikes have resulted in lower metal processing and earnings from that high-margin part of the business.
Purchases and sales
The year has been marked by higher- than-usual levels of portfolio activity as we reposition the fund toward precious metals, particularly gold, that have a more favorable outlook. The key is to be selective, because the collapse in the price of gold has exposed many companies that are geared toward finances and operations. To mitigate future execution risk, we look to identify and back those with a shareholder focus, experienced and proven management and technical teams, and secure balance sheets. This means investing in companies that have clear growth profiles of producing or near-production assets, advanced exploration and suitable greenfield projects, and low all-in sustaining costs.
U.S.-listed Primero Mining, a recent purchase, fills these criteria. After seven years transforming IAMGOLD, CEO Joseph Conway and his technical team took over management of Primero, widely considered a broken company. Since joining in 2010, Conway has increased production and revenues and diversified the business across mines and geographies. All-in sustaining costs have fallen, and the growth profile has improved. Last year, the company was in the rare position of being
8
able to “write-up” assets. Another acquisition this year has further bolstered production and future growth, most of which has yet to be recognized by the market.
We also bought shares in U.K.-listed Randgold Resources. The management team stands out as an effective unit that has worked together for many years. Operationally, the company is very strong and adept at building mines on time and to budget. Founder and CEO Mark Bristow is exceptional, and he has the expertise to extract great value from Randgold’s high-grade, low-cost producing assets.
We reopened a position in Canadian-based Eldorado Gold. Its ill-timed purchase of European Goldfields in 2011, we believe, has been fully reflected in the share price, which now sits below historic levels. It is well-diversified geographically and therefore does not depend on a single mine. The management team has a sound operational track record, and the company’s quality, growth, and valuation support a significant investment.
We exited our positions in Aquila Resources, AMCOL International, and Australian gold exploration company Glory Resources after their successful M&A activities. We also sold our remaining holdings in Russian potash company Uralkali and its U.S.-based peer Mosaic. On a relative basis, the fund benefited from its exposure to potash as base and precious metal miners underperformed. Last year, however, the industry suffered a setback when Uralkali broke its production agreements and share prices in the sector fell. Since then the sector has recovered somewhat, giving us the opportunity to exit and allocate capital to other, more attractive areas.
In precious metals, we took profits in Johnson Matthey and Belgium-based platinum recycler Umicore, which performed well, particularly in light of recent challenges faced by South Africa’s platinum industry. We eliminated our position in Petropavlosk, a Russian-listed gold and iron ore mining and exploration company, because of production concerns and the company’s increasingly strained balance sheet.
Looking ahead
M&A activity in the gold industry has increased as the large producers look to streamline their asset base. Small- and mid- cap miners are taking the opportunity to acquire discarded assets to bolster future growth prospects. Skilled management teams who can identify low-cost, quality assets and have a pedigree in project execution will enhance production—and, crucially, future operating and free cash flow. We continue to find companies with sound capital discipline, an improved portfolio mix, and more secure balance sheets at what we consider to be very attractive valuation levels.
Portfolio Managers:
Randeep Somel, CFA
Jamie J. Horvat
M&G Investment Management Limited
August 21, 2014
9
Precious Metals and Mining Fund
Fund Profile
As of July 31, 2014
| | | |
| Portfolio Characteristics | | |
| | | S&P | DJ |
| | | Global | U.S. |
| | | Custom | Total |
| | | Metals and | Market |
| | | Mining | FA |
| | Fund | Index | Index |
| Number of Stocks | 54 | 277 | 3,718 |
| Median Market Cap | $5.3B | $13.8B | $48.5B |
| Price/Earnings Ratio | -22.8x | -84.2x | 20.2x |
| Price/Book Ratio | 1.4x | 1.5x | 2.6x |
| Return on Equity | 8.2% | 10.2% | 17.5% |
| Earnings Growth | | | |
| Rate | 7.4% | 1.3% | 14.8% |
| Dividend Yield | 1.6% | 2.0% | 1.9% |
| Foreign Holdings | 89.7% | 88.7% | 0.0% |
| Turnover Rate | | | |
| (Annualized) | 56% | — | — |
| Ticker Symbol | VGPMX | | |
| | | — | — |
| Expense Ratio1 | 0.25% | — | — |
| Short-Term Reserves | 0.5% | — | — |
| |
| Market Diversification (% of equity exposure) |
| |
| Europe | |
| United Kingdom | 26.3% |
| Belgium | 8.1 |
| France | 1.3 |
| Subtotal | 35.7% |
| Pacific | |
| Australia | 7.3% |
| North America | |
| Canada | 47.0% |
| United States | 10.0 |
| Subtotal | 57.0% |
| | |
| Volatility Measures | | |
| | S&P | |
| | Global | |
| | Custom | DJ |
| | Metals and | U.S. Total |
| | Mining | Market |
| | Index | FA Index |
| R-Squared | 0.91 | 0.29 |
| Beta | 0.99 | 1.17 |
| These measures show the degree and timing of the fund’s fluctuations compared with the indexes over 36 months. |
|
| | |
| Ten Largest Holdings (% of total net assets) |
| Umicore SA | Specialty Chemicals | 8.0% |
| BHP Billiton Ltd. | Diversified Metals & | |
| | Mining | 6.4 |
| Dominion Diamond | Precious Metals & | |
| Corp. | Minerals | 6.0 |
| Johnson Matthey plc | Specialty Chemicals | 5.6 |
| Nevsun Resources Ltd. | Diversified Metals & | |
| | Mining | 5.5 |
| OZ Minerals Ltd. | Diversified Metals & | |
| | Mining | 4.9 |
| Potash Corp. of | Fertilizers & | |
| Saskatchewan Inc. | Agricultural | |
| | Chemicals | 4.8 |
| Goldcorp Inc. | Gold | 4.6 |
| Kinross Gold Corp. | Gold | 4.3 |
| Hochschild Mining plc | Precious Metals & | |
| | Minerals | 4.0 |
| Top Ten | | 54.1% |
| The holdings listed exclude any temporary cash investments and equity index products. |
|
Allocation by Region (% of equity exposure)
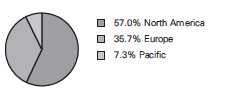
1 The expense ratio shown is from the prospectus dated May 27, 2014, and represents estimated costs for the current fiscal year. For the six months ended July 31, 2014, the annualized expense ratio was 0.29%.
10
Precious Metals and Mining Fund
Performance Summary
All of the returns in this report represent past performance, which is not a guarantee of future results that may be achieved by the fund. (Current performance may be lower or higher than the performance data cited. For performance data current to the most recent month-end, visit our website at vanguard.com/performance.) Note, too, that both investment returns and principal value can fluctuate widely, so an investor’s shares, when sold, could be worth more or less than their original cost. The returns shown do not reflect taxes that a shareholder would pay on fund distributions or on the sale of fund shares.
Fiscal-Year Total Returns (%): January 31, 2004, Through July 31, 2014

For a benchmark description, see the Glossary.
Note: For 2015, performance data reflect the six months ended July 31, 2014.
Average Annual Total Returns: Periods Ended June 30, 2014
This table presents returns through the latest calendar quarter—rather than through the end of the fiscal period.
Securities and Exchange Commission rules require that we provide this information.
| | | | |
| | Inception | One | Five | Ten |
| | Date | Year | Years | Years |
| Precious Metals and Mining Fund | 5/23/1984 | 12.43% | -1.26% | 5.86% |
See Financial Highlights for dividend and capital gains information.
11
Precious Metals and Mining Fund
Financial Statements (unaudited)
Statement of Net Assets
As of July 31, 2014
The fund reports a complete list of its holdings in regulatory filings four times in each fiscal year, at the quarter-ends. For the second and fourth fiscal quarters, the lists appear in the fund’s semiannual and annual reports to shareholders. For the first and third fiscal quarters, the fund files the lists with the Securities and Exchange Commission on Form N-Q. Shareholders can look up the fund’s Forms N-Q on the SEC’s website at sec.gov. Forms N-Q may also be reviewed and copied at the SEC’s Public Reference Room (see the back cover of this report for further information).
| | | |
| | | | Market |
| | | | Value |
| | | Shares | ($000) |
| Common Stocks (99.6%) | | |
| Australia (7.3%) | | |
| 1 | OZ Minerals Ltd. | 30,000,000 | 127,539 |
| | Iluka Resources Ltd. | 6,303,822 | 51,072 |
| *,1 | Galaxy Resources Ltd. | 86,393,638 | 4,598 |
| *,1 | St. Barbara Ltd. | 33,669,000 | 3,379 |
| *,1 | Equatorial Resources Ltd. | 9,172,500 | 2,816 |
| * | Galaxy Resources Ltd. | | |
| | Warrants Exp. | | |
| | 12/31/2014 | 18,750,000 | 105 |
| *,1 | Apex Minerals NL | 55,654,166 | — |
| | | | 189,509 |
| Belgium (8.0%) | | |
| | Umicore SA | 4,300,000 | 207,816 |
| |
| Canada (46.9%) | | |
| *,1 | Dominion Diamond Corp. | 11,045,837 | 154,896 |
| 1 | Nevsun Resources Ltd. | 37,839,800 | 143,676 |
| | Potash Corp. of | | |
| | Saskatchewan Inc. | 3,500,000 | 124,258 |
| | Goldcorp Inc. | | |
| | (NYSE Shares) | 4,140,558 | 113,451 |
| * | Kinross Gold Corp. | 28,000,000 | 111,720 |
| | Yamana Gold Inc. | | |
| | (NYSE Shares) | 7,832,232 | 66,731 |
| * | Eldorado Gold Corp. | | |
| | (NYSE Shares) | 8,045,489 | 59,698 |
| * | B2Gold Corp. | | |
| | (AMEX Shares) | 22,800,544 | 59,054 |
| | Agnico Eagle Mines Ltd. | | |
| | (NYSE Shares) | 1,424,564 | 52,980 |
| * | Primero Mining Corp. | 5,769,300 | 44,182 |
| * | First Majestic Silver Corp. | 3,675,941 | 38,965 |
| * | New Gold Inc. | 6,305,066 | 38,801 |
| | Agnico Eagle Mines Ltd. | 814,545 | 30,285 |
| | Yamana Gold Inc. | 3,451,012 | 29,435 |
| * | SEMAFO Inc. | 5,891,186 | 25,448 |
| | Alamos Gold Inc. | 2,500,000 | 22,241 |
| | | |
| | | | Market |
| | | | Value |
| | | Shares | ($000) |
| | Centerra Gold Inc. | 4,000,000 | 20,801 |
| * | Osisko Gold | | |
| | Royalties Ltd. | 1,121,345 | 15,992 |
| *,^ | Mountain Province | | |
| | Diamonds Inc. | 3,000,000 | 15,325 |
| ^ | Alacer Gold Corp. | 4,950,000 | 11,304 |
| *,^ | Kirkland Lake Gold Inc. | 1,860,000 | 6,465 |
| * | Continental Gold Ltd. | 1,700,000 | 6,018 |
| | Eldorado Gold Corp. | 710,600 | 5,272 |
| * | True Gold Mining Inc. | 13,000,000 | 5,186 |
| | Goldcorp Inc. | 183,500 | 5,025 |
| * | B2Gold Corp. | 1,860,800 | 4,813 |
| *,2 | Kaminak Gold Corp. | | |
| | Class A | 3,660,000 | 2,954 |
| * | True Gold Mining Inc. | | |
| | Warrants Exp. | | |
| | 08/18/2014 | 6,500,000 | 30 |
| | | | 1,215,006 |
| France (1.3%) | | |
| | Imerys SA | 413,418 | 32,281 |
| |
| Papua New Guinea (0.0%) | | |
| * | Bougainville Copper Ltd. | 1,112,091 | 427 |
| |
| United Kingdom (26.2%) | | |
| | BHP Billiton plc | 4,861,221 | 165,827 |
| | Johnson Matthey plc | 2,925,000 | 145,744 |
| *,1 | Hochschild Mining plc | 37,269,103 | 102,357 |
| 1 | African Barrick Gold plc | 22,255,000 | 98,231 |
| ^ | Randgold Resources Ltd. | | |
| | ADR (NASDAQ Shares) | 832,162 | 71,683 |
| | Anglo American plc | 2,441,006 | 65,556 |
| | Randgold Resources | | |
| | Ltd. ADR | 180,850 | 15,578 |
| | Randgold Resources Ltd. | 100,000 | 8,611 |
| * | Petra Diamonds Ltd. | 1,483,912 | 4,993 |
| | | | 678,580 |
12
| | |
| Precious Metals and Mining Fund | |
| |
| |
| |
| | | Market |
| | | Value |
| | Shares | ($000) |
| United States (9.9%) | | |
| Royal Gold Inc. | 1,197,507 | 90,496 |
| Newmont Mining Corp. | 3,600,000 | 89,676 |
| * Tahoe Resources Inc. | 1,620,383 | 42,859 |
| Mosaic Co. | 634,337 | 29,249 |
| Gold Resource Corp. | 500,000 | 2,640 |
| | | 254,920 |
| Total Common Stocks | | |
| (Cost $2,921,414) | | 2,578,539 |
| Precious Metals (0.1%) | | |
| * Platinum Bullion | | |
| (In Troy Ounces) | 2,009 | 2,932 |
| Total Precious Metals | | |
| (Cost $1,213) | | 2,932 |
| Temporary Cash Investment (1.8%) | |
| Money Market Fund (1.8%) | | |
| 3,4 Vanguard Market | | |
| Liquidity Fund, 0.118% | | |
| (Cost $45,656) | 45,655,949 | 45,656 |
| Total Investments (101.5%) | | |
| (Cost $2,968,283) | | 2,627,127 |
| Other Assets and Liabilities (-1.5%) | |
| Other Assets | | 12,925 |
| Liabilities4 | | (50,858) |
| | | (37,933) |
| Net Assets (100%) | | |
| Applicable to 221,959,729 outstanding | |
| $.001 par value shares of beneficial | |
| interest (unlimited authorization) | 2,589,194 |
| Net Asset Value Per Share | | $11.67 |
| |
| | Amount |
| | ($000) |
| Statement of Assets and Liabilities | |
| Assets | |
| Investments in Securities, at Value5 | |
| Unaffiliated Issuers5 | 1,943,979 |
| Affiliated Vanguard Funds | 45,656 |
| Other Affiliated Issuers | 637,492 |
| Total Investments in Securities | 2,627,127 |
| Receivables for | |
| Investment Securities Sold | 5,953 |
| Receivables for Capital Shares Issued | 2,429 |
| Other Assets | 4,543 |
| Total Assets | 2,640,052 |
| Liabilities | |
| Payables for | |
| Investment Securities Purchased | 32,751 |
| Securities Lending Collateral | |
| Payable to Brokers | 8,238 |
| Other Liabilities | 9,869 |
| Total Liabilities | 50,858 |
| Net Assets | 2,589,194 |
| |
| |
| At July 31, 2014, net assets consisted of: | |
| | Amount |
| | ($000) |
| Paid-in Capital | 4,117,134 |
| Overdistributed Net Investment Income | (151,519) |
| Accumulated Net Realized Losses | (1,035,272) |
| Unrealized Appreciation (Depreciation) | |
| Investment Securities5 | (341,156) |
| Foreign Currencies | 7 |
| Net Assets | 2,589,194 |
See Note A in Notes to Financial Statements.
* Non-income-producing security.
^ Includes partial security positions on loan to broker-dealers. The total value of securities on loan is $7,499,000.
1 Considered an affiliated company of the fund as the fund owns more than 5% of the outstanding voting securities of such company.
2 Restricted security represents 0.1% of net assets.
3 Affiliated money market fund available only to Vanguard funds and certain trusts and accounts managed by Vanguard. Rate shown is
the 7-day yield.
4 Includes $8,238,000 of collateral received for securities on loan.
5 Includes precious metals.
ADR—American Depositary Receipt.
See accompanying Notes, which are an integral part of the Financial Statements.
13
Precious Metals and Mining Fund
Statement of Operations
| |
| | Six Months Ended |
| | July 31, 2014 |
| | ($000) |
| Investment Income | |
| Income | |
| Dividends1,2 | 20,115 |
| Interest2 | 89 |
| Securities Lending | 468 |
| Total Income | 20,672 |
| Expenses | |
| Investment Advisory Fees—Note B | |
| Basic Fee | 1,751 |
| Performance Adjustment | (1,046) |
| The Vanguard Group—Note C | |
| Management and Administrative | 2,472 |
| Marketing and Distribution | 298 |
| Custodian Fees | 85 |
| Shareholders’ Reports | 51 |
| Trustees’ Fees and Expenses | 3 |
| Total Expenses | 3,614 |
| Net Investment Income | 17,058 |
| Realized Net Gain (Loss) | |
| Investment Securities Sold2 | (250,914) |
| Foreign Currencies | 558 |
| Realized Net Gain (Loss) | (250,356) |
| Change in Unrealized Appreciation (Depreciation) | |
| Investment Securities3 | 520,976 |
| Foreign Currencies | (14) |
| Change in Unrealized Appreciation (Depreciation) | 520,962 |
| Net Increase (Decrease) in Net Assets Resulting from Operations | 287,664 |
1 Dividends are net of foreign withholding taxes of $1,578,000.2 Dividend income, interest income, and realized net gain (loss) from affiliated companies of the fund were $6,024,000, $89,000, and($232,685,000), respectively.3 Includes precious metals.See accompanying Notes, which are an integral part of the Financial Statements.
14
Precious Metals and Mining Fund
Statement of Changes in Net Assets
| | |
| | Six Months Ended | Year Ended |
| | July 31, | January 31, |
| | 2014 | 2014 |
| | ($000) | ($000) |
| Increase (Decrease) in Net Assets | | |
| Operations | | |
| Net Investment Income | 17,058 | 52,446 |
| Realized Net Gain (Loss) | (250,356) | (537,734) |
| Change in Unrealized Appreciation (Depreciation) | 520,962 | (575,290) |
| Net Increase (Decrease) in Net Assets Resulting from Operations | 287,664 | (1,060,578) |
| Distributions | | |
| Net Investment Income | — | (1,513) |
| Realized Capital Gain | — | — |
| Return of Capital | — | (113) |
| Total Distributions | — | (1,626) |
| Capital Share Transactions | | |
| Issued | 353,458 | 1,113,198 |
| Issued in Lieu of Cash Distributions | — | 1,497 |
| Redeemed | (354,424) | (861,854) |
| Net Increase (Decrease) from Capital Share Transactions | (966) | 252,841 |
| Total Increase (Decrease) | 286,698 | (809,363) |
| Net Assets | | |
| Beginning of Period | 2,302,496 | 3,111,859 |
| End of Period1 | 2,589,194 | 2,302,496 |
| 1 Net Assets—End of Period includes undistributed (overdistributed) net investment income of ($151,519,000) and ($169,135,000). |
See accompanying Notes, which are an integral part of the Financial Statements.
15
Precious Metals and Mining Fund
Financial Highlights
| | | | | | |
| Six Months | | | | | |
| | Ended | | | | | |
| For a Share Outstanding | July 31, | Year Ended January 31, |
| Throughout Each Period | 2014 | 2014 | 2013 | 2012 | 2011 | 2010 |
| Net Asset Value, Beginning of Period | $10.38 | $15.46 | $22.14 | $24.15 | $18.74 | $10.74 |
| Investment Operations | | | | | | |
| Net Investment Income | . 077 | . 2431 | .292 | .3342 | .181 | .0933 |
| Net Realized and Unrealized Gain (Loss) | | | | | | |
| on Investments 4 | 1.213 | (5.315) | (5.962) | (.760) | 6.521 | 8.207 |
| Total from Investment Operations | 1.290 | (5.072) | (5.670) | (.426) | 6.702 | 8.300 |
| Distributions | | | | | | |
| Dividends from Net Investment Income | — | (.007) | (.710) | (.123) | (1.101) | (.300) |
| Distributions from Realized Capital Gains | — | — | (.300) | (1.461) | (.191) | — |
| Return of Capital | — | (.001) | — | — | — | — |
| Total Distributions | — | (.008) | (1.010) | (1.584) | (1.292) | (.300) |
| Net Asset Value, End of Period | $11.67 | $10.38 | $15.46 | $22.14 | $24.15 | $18.74 |
| |
| Total Return5 | 12.43% | -32.82% | -26.13% | -0.97% | 35.35% | 77.75% |
| |
| Ratios/Supplemental Data | | | | | | |
| Net Assets, End of Period (Millions) | $2,589 | $2,302 | $3,112 | $4,415 | $5,030 | $3,684 |
| Ratio of Total Expenses to | | | | | | |
| Average Net Assets6 | 0.29% | 0.25% | 0.26% | 0.29% | 0.27% | 0.27% |
| Ratio of Net Investment Income to | | | | | | |
| Average Net Assets | 1.35% | 2.10% | 1.62% | 1.54%2 | 0.61% | 0.59%3 |
| Portfolio Turnover Rate | 56% | 34% | 30% | 22% | 34% | 17% |
The expense ratio, net income ratio, and turnover rate for the current period have been annualized.1 Calculated based on average shares outstanding.2 Net investment income per share and the ratio of net investment income to average net assets include $.103 and 0.40%, respectively,resulting from a special dividend from OZ Minerals Ltd. in May 2011.3 The fund received a special dividend from Centennial Coal Co. Ltd. in January 2008. Based on additional information reported by thecompany in 2009, a portion of the special dividend was reallocated to return of capital. The reallocation reduced net investment incomeper share and the ratio of net investment income to average net assets for the year ended January 31, 2010, by $.134 and 0.90%,respectively. The reallocation had no impact on net assets, net asset values per share, or total returns.4 Includes increases from redemption fees of $.00, $.00, $.00, $.01, $.01, and $.01. Effective May 23, 2012, the redemption feewas eliminated.5 Total returns do not include transaction or account service fees that may have applied in the periods shown. Fund prospectuses provideinformation about any applicable transaction and account service fees.6 Includes performance-based investment advisory fee increases (decreases) of (0.08%), (0.09%), (0.07%), (0.03%), (0.05%), and (0.08%).See accompanying Notes, which are an integral part of the Financial Statements.
16
Precious Metals and Mining Fund
Notes to Financial Statements
Vanguard Precious Metals and Mining Fund is registered under the Investment Company Act of 1940 as an open-end investment company, or mutual fund. The fund invests in securities of foreign issuers, which may subject it to investment risks not normally associated with investing in securities of United States corporations.
A. The following significant accounting policies conform to generally accepted accounting principles for U.S. investment companies. The fund consistently follows such policies in preparing its financial statements.
1. Security Valuation: Securities are valued as of the close of trading on the New York Stock Exchange (generally 4 p.m., Eastern time) on the valuation date. Equity securities are valued at the latest quoted sales prices or official closing prices taken from the primary market in which each security trades; such securities not traded on the valuation date are valued at the mean of the latest quoted bid and asked prices. Securities for which market quotations are not readily available, or whose values have been affected by events occurring before the fund’s pricing time but after the close of the securities’ primary markets, are valued at their fair values calculated according to procedures adopted by the board of trustees. These procedures include obtaining quotations from an independent pricing service, monitoring news to identify significant market- or security-specific events, and evaluating changes in the values of foreign market proxies (for example, ADRs, futures contracts, or exchange-traded funds), between the time the foreign markets close and the fund’s pricing time. When fair-value pricing is employed, the prices of securities used by a fund to calculate its net asset value may differ from quoted or published prices for the same securities. Precious metals are valued at the latest quoted bid prices. Investments in Vanguard Market Liquidity Fund are valued at that fund’s net asset value.
2. Foreign Currency: Securities and other assets and liabilities denominated in foreign currencies are translated into U.S. dollars using exchange rates obtained from an independent third party as of the fund’s pricing time on the valuation date. Realized gains (losses) and unrealized appreciation (depreciation) on investment securities include the effects of changes in exchange rates since the securities were purchased, combined with the effects of changes in security prices. Fluctuations in the value of other assets and liabilities resulting from changes in exchange rates are recorded as unrealized foreign currency gains (losses) until the assets or liabilities are settled in cash, at which time they are recorded as realized foreign currency gains (losses).
3. Federal Income Taxes: The fund intends to continue to qualify as a regulated investment company and distribute all of its taxable income. Management has analyzed the fund’s tax positions taken for all open federal income tax years (January 31, 2011–2014), and for the period ended July 31, 2014, and has concluded that no provision for federal income tax is required in the fund’s financial statements.
4. Distributions: Distributions to shareholders are recorded on the ex-dividend date.
5. Securities Lending: To earn additional income, the fund lends its securities to qualified institutional borrowers. Security loans are required to be secured at all times by collateral in an amount at least equal to the market value of securities loaned. Daily market fluctuations could cause the value of loaned securities to be more or less than the value of the collateral received. When this occurs, the collateral is adjusted and settled on the next business day. The fund further mitigates its counterparty risk by entering into securities lending transactions only with a diverse group of prequalified counterparties, monitoring their financial strength, and entering into master securities lending agreements with its counterparties. The master securities lending agreements provide that, in the event of a counterparty’s default (including bankruptcy), the fund may terminate any loans with that borrower, determine the net amount owed, and sell or retain the collateral up to the net amount owed to the fund; however, such actions may be subject to legal proceedings.
17
Precious Metals and Mining Fund
While collateral mitigates counterparty risk, in the absence of a default the fund may experience delays and costs in recovering the securities loaned. The fund invests cash collateral received in Vanguard Market Liquidity Fund, and records a liability in the Statement of Net Assets for the return of the collateral, during the period the securities are on loan. Securities lending income represents fees charged to borrowers plus income earned on invested cash collateral, less expenses associated with the loan.
6. Credit Facility: The fund and certain other funds managed by The Vanguard Group participate in a $2.89 billion committed credit facility provided by a syndicate of lenders pursuant to a credit agreement that may be renewed annually; each fund is individually liable for its borrowings, if any, under the credit facility. Borrowings may be utilized for temporary and emergency purposes, and are subject to the fund’s regulatory and contractual borrowing restrictions. The participating funds are charged administrative fees and an annual commitment fee of 0.06% of the undrawn amount of the facility; these fees are allocated to the funds based on a method approved by the fund’s board of trustees and included in Management and Administrative expenses on the fund’s Statement of Operations. Any borrowings under this facility bear interest at a rate equal to the higher of the federal funds rate or LIBOR reference rate plus an agreed-upon spread.
The fund had no borrowings outstanding at July 31, 2014, or at any time during the period then ended.
7. Other: Dividend income is recorded on the ex-dividend date. Interest income includes income distributions received from Vanguard Market Liquidity Fund and is accrued daily. Security transactions are accounted for on the date securities are bought or sold. Costs used to determine realized gains (losses) on the sale of investment securities are those of the specific securities sold.
B. M&G Investment Management Limited provides investment advisory services to the fund for a fee calculated at an annual percentage rate of average net assets. The basic fee is subject to quarterly adjustments based on the fund’s performance for the preceding three years relative to the S&P Global Custom Metals and Mining Index. For the six months ended July 31, 2014, the investment advisory fee represented an effective annual basic rate of 0.14% of the fund’s average net assets before a decrease of $1,046,000 (0.08%) based on performance.
C. The Vanguard Group furnishes at cost corporate management, administrative, marketing, and distribution services. The costs of such services are allocated to the fund based on methods approved by the board of trustees. The fund has committed to provide up to 0.40% of its net assets in capital contributions to Vanguard. At July 31, 2014, the fund had contributed capital of $264,000 to Vanguard (included in Other Assets), representing 0.01% of the fund’s net assets and 0.11% of Vanguard’s capitalization. The fund’s trustees and officers are also directors and officers of Vanguard.
D. Various inputs may be used to determine the value of the fund’s investments. These inputs are summarized in three broad levels for financial statement purposes. The inputs or methodologies used to value securities are not necessarily an indication of the risk associated with investing in those securities.
Level 1—Quoted prices in active markets for identical securities.
Level 2—Other significant observable inputs (including quoted prices for similar securities, interest rates, prepayment speeds, credit risk, etc.).
Level 3—Significant unobservable inputs (including the fund’s own assumptions used to determine the fair value of investments).
18
Precious Metals and Mining Fund
The following table summarizes the market value of the fund’s investments as of July 31, 2014, based on the inputs used to value them:
| | | |
| | Level 1 | Level 2 | Level 3 |
| Investments | ($000) | ($000) | ($000) |
| Common Stocks—North America | 1,466,972 | 2,954 | — |
| Common Stocks—Other | 71,683 | 1,036,930 | — |
| Precious Metals | — | 2,932 | — |
| Temporary Cash Investments | 45,656 | — | — |
| Total | 1,584,311 | 1,042,816 | — |
E. Distributions are determined on a tax basis and may differ from net investment income and realized capital gains for financial reporting purposes. Differences may be permanent or temporary. Permanent differences are reclassified among capital accounts in the financial statements to reflect their tax character. Temporary differences arise when certain items of income, expense, gain, or loss are recognized in different periods for financial statement and tax purposes; such differences are primarily attributed to the tax treatment of unrealized appreciation on passive foreign investment companies. These differences will reverse at some time in the future. Differences in classification may also result from the treatment of short-term gains as ordinary income for tax purposes.
During the six months ended July 31, 2014, the fund realized net foreign currency gains of $558,000, which increased distributable net income for tax purposes; accordingly, such gains have been reclassified from accumulated net realized losses to overdistributed net investment income. Certain of the fund’s investments are in securities considered to be passive foreign investment companies, for which any unrealized appreciation and/or realized gains are required to be included in distributable net investment income for tax purposes. Passive foreign investment companies held at July 31, 2014, had unrealized appreciation of $161,965,000 as of January 31, 2014, the most recent mark-to-market date for tax purposes. This amount has been distributed and is reflected in the balance of over-distributed net investment income.
The fund’s tax-basis capital gains and losses are determined only at the end of each fiscal year. For tax purposes, at January 31, 2014, the fund had available capital losses totaling $784,391,000 that may be carried forward indefinitely to offset future net capital gains. The fund will use these capital losses to offset net taxable capital gains, if any, realized during the year ending January 31, 2015; should the fund realize net capital losses for the year, the losses will be added to the loss carryforward balance above.
At July 31, 2014, the cost of investment securities for tax purposes was $3,130,248,000. Net unrealized depreciation of investment securities for tax purposes was $503,121,000, consisting of unrealized gains of $108,888,000 on securities that had risen in value since their purchase and $612,009,000 in unrealized losses on securities that had fallen in value since their purchase.
F. During the six months ended July 31, 2014, the fund purchased $857,909,000 of investment securities and sold $679,677,000 of investment securities, other than temporary cash investments.
19
Precious Metals and Mining Fund
G. Capital shares issued and redeemed were:
| | |
| | Six Months Ended | Year Ended |
| | July 31, 2014 | January 31, 2014 |
| | Shares | Shares |
| | (000) | (000) |
| Issued | 31,290 | 95,795 |
| Issued in Lieu of Cash Distributions | — | 108 |
| Redeemed | (31,252) | (75,233) |
| Net Increase (Decrease) in Shares Outstanding | 38 | 20,670 |
H. Certain of the fund’s investments are in companies that are considered to be affiliated companies of the fund because the fund owns more than 5% of the outstanding voting securities of the company. Transactions during the period in securities of these companies were as follows:
| | | | | |
| | | Current Period Transactions | |
| | Jan. 31, 2014 | | Proceeds from | | July 31, 2014 |
| | Market | Purchases | Securities | Dividend | Market |
| | Value | at Cost | Sold | Income | Value |
| | ($000) | ($000) | ($000) | ($000) | ($000) |
| African Barrick Gold plc | 82,897 | — | 3,245 | 444 | 98,231 |
| AMCOL International Corp. | 102,142 | — | 137,159 | 600 | — |
| Apex Minerals NL | — | — | — | — | — |
| Aquila Resources Ltd. | 52,981 | — | 86,585 | — | — |
| Belo Sun Mining Corp. | 7,093 | — | 3,877 | — | — |
| Dominion Diamond Corp. | 165,650 | — | 4,607 | — | 154,896 |
| Equatorial Resources Ltd. | 5,118 | — | 299 | — | 2,816 |
| Galaxy Resources Ltd. | 5,066 | — | — | — | 4,598 |
| Glory Resources Ltd. | 4,912 | — | 5,132 | — | — |
| Hochschild Mining plc | 98,261 | — | 5,327 | — | 102,357 |
| Nevsun Resources Ltd. | 138,958 | — | — | 2,272 | 143,676 |
| OZ Minerals Ltd. | 92,430 | — | — | 2,708 | 127,539 |
| Panoramic Resources Ltd. | 4,509 | — | 8,194 | — | — |
| Petropavlovsk plc | 15,010 | — | 12,189 | — | — |
| Reed Resources Ltd. | 3,377 | — | 1,505 | — | — |
| St. Barbara Ltd. | 16,588 | — | 3,155 | — | 3,379 |
| Total | 794,992 | | | 6,024 | 637,492 |
I. Management has determined that no material events or transactions occurred subsequent to July 31, 2014, that would require recognition or disclosure in these financial statements.
20
About Your Fund’s Expenses
As a shareholder of the fund, you incur ongoing costs, which include costs for portfolio management, administrative services, and shareholder reports (like this one), among others. Operating expenses, which are deducted from a fund’s gross income, directly reduce the investment return of the fund.
A fund’s expenses are expressed as a percentage of its average net assets. This figure is known as the expense ratio. The following examples are intended to help you understand the ongoing costs (in dollars) of investing in your fund and to compare these costs with those of other mutual funds. The examples are based on an investment of $1,000 made at the beginning of the period shown and held for the entire period.
The accompanying table illustrates your fund’s costs in two ways:
• Based on actual fund return. This section helps you to estimate the actual expenses that you paid over the period. The ”Ending Account Value“ shown is derived from the fund‘s actual return, and the third column shows the dollar amount that would have been paid by an investor who started with $1,000 in the fund. You may use the information here, together with the amount you invested, to estimate the expenses that you paid over the period.
To do so, simply divide your account value by $1,000 (for example, an $8,600 account value divided by $1,000 = 8.6), then multiply the result by the number given for your fund under the heading ”Expenses Paid During Period.“
• Based on hypothetical 5% yearly return. This section is intended to help you compare your fund‘s costs with those of other mutual funds. It assumes that the fund had a yearly return of 5% before expenses, but that the expense ratio is unchanged. In this case—because the return used is not the fund’s actual return—the results do not apply to your investment. The example is useful in making comparisons because the Securities and Exchange Commission requires all mutual funds to calculate expenses based on a 5% return. You can assess your fund’s costs by comparing this hypothetical example with the hypothetical examples that appear in shareholder reports of other funds.
Note that the expenses shown in the table are meant to highlight and help you compare ongoing costs only and do not reflect transaction costs incurred by the fund for buying and selling securities. Further, the expenses do not include any purchase, redemption, or account service fees described in the fund prospectus. If such fees were applied to your account, your costs would be higher. Your fund does not carry a “sales load.”
The calculations assume no shares were bought or sold during the period. Your actual costs may have been higher or lower, depending on the amount of your investment and the timing of any purchases or redemptions.
You can find more information about the fund’s expenses, including annual expense ratios, in the Financial Statements section of this report. For additional information on operating expenses and other shareholder costs, please refer to your fund’s current prospectus.
21
| | | |
| Six Months Ended July 31, 2014 | | | |
| | Beginning | Ending | Expenses |
| | Account Value | Account Value | Paid During |
| Precious Metals and Mining Fund | 1/31/2014 | 7/31/2014 | Period |
| Based on Actual Fund Return | $1,000.00 | $1,124.28 | $1.53 |
| Based on Hypothetical 5% Yearly Return | 1,000.00 | 1,023.36 | 1.45 |
The calculations are based on expenses incurred in the most recent six-month period. The fund’s annualized six-month expense ratio for thatperiod is 0.29%. The dollar amounts shown as “Expenses Paid” are equal to the annualized expense ratio multiplied by the average accountvalue over the period, multiplied by the number of days in the most recent six-month period, then divided by the number of days in the mostrecent 12-month period.22
Trustees Approve Advisory Arrangement
The board of trustees of Vanguard Precious Metals and Mining Fund has renewed the fund’s investment advisory arrangement with M&G Investment Management Limited (M&G). The board determined that renewing the fund’s advisory arrangement was in the best interests of the fund and its shareholders.
The board based its decision upon an evaluation of the advisor’s investment staff, portfolio management process, and performance. The trustees considered the factors discussed below, among others. However, no single factor determined whether the board approved the arrangement. Rather, it was the totality of the circumstances that drove the board’s decision.
Nature, extent, and quality of services
The board considered the quality of the fund’s investment management services over both the short and long term, and took into account the organizational depth and stability of the advisor. The board noted that M&G, founded in 1931, offers a broad range of investment products. M&G continues to employ a sound process, selecting companies that are broadly representative of the metals and mining industries, with an emphasis on well-managed, returns-focused companies. The fund may be invested in rare minerals (such as diamonds), in precious metals (such as gold, silver, and platinum), and in base metals and minerals (such as coal). The advisor’s global equity research team conducts intensive fundamental analysis on companies in the industry, including regular company visits. M&G has advised the fund since the fund’s inception in 1984.
The board concluded that the advisor’s experience, stability, depth, and performance, among other factors, warranted continuation of the advisory arrangement.
Investment performance
The board considered the short- and long-term performance of the fund, including any periods of outperformance or underperformance relative to a benchmark index and peer group. The board concluded that the performance was such that the advisory arrangement should continue. Information about the fund’s most recent performance can be found in the Performance Summary section of this report.
Cost
The board concluded that the fund’s expense ratio was well below the average expense ratio charged by funds in its peer group and that the fund’s advisory fee rate was also well below its peer-group average. Information about the fund’s expenses appears in the About Your Fund’s Expenses section of this report as well as in the Financial Statements section, which also includes information about the advisory fee rate.
The board did not consider profitability of M&G in determining whether to approve the advisory fee, because M&G is independent of Vanguard, and the advisory fee is the result of arm’s-length negotiations.
The benefit of economies of scale
The board concluded that the fund’s shareholders benefit from economies of scale because of breakpoints in the advisory fee schedule. The breakpoints reduce the effective rate of the fee as the fund’s assets increase.
The board will consider whether to renew the advisory arrangement again after a one-year period.
23
Glossary
Beta. A measure of the magnitude of a fund’s past share-price fluctuations in relation to the ups and downs of a given market index. The index is assigned a beta of 1.00. Compared with a given index, a fund with a beta of 1.20 typically would have seen its share price rise or fall by 12% when the index rose or fell by 10%. For this report, beta is based on returns over the past 36 months for both the fund and the index. Note that a fund’s beta should be reviewed in conjunction with its R-squared (see definition). The lower the R-squared, the less correlation there is between the fund and the index, and the less reliable beta is as an indicator of volatility.
Dividend Yield. Dividend income earned by stocks, expressed as a percentage of the aggregate market value (or of net asset value, for a fund). The yield is determined by dividing the amount of the annual dividends by the aggregate value (or net asset value) at the end of the period. For a fund, the dividend yield is based solely on stock holdings and does not include any income produced by other investments.
Earnings Growth Rate. The average annual rate of growth in earnings over the past five years for the stocks now in a fund.
Equity Exposure. A measure that reflects a fund’s investments in stocks and stock futures. Any holdings in short-term reserves are excluded.
Expense Ratio. A fund’s total annual operating expenses expressed as a percentage of the fund’s average net assets. The expense ratio includes management and administrative expenses, but does not include the transaction costs of buying and selling portfolio securities.
Foreign Holdings. The percentage of a fund represented by securities or depositary receipts of companies based outside the United States.
Inception Date. The date on which the assets of a fund (or one of its share classes) are first invested in accordance with the fund’s investment objective. For funds with a subscription period, the inception date is the day after that period ends. Investment performance is measured from the inception date.
Median Market Cap. An indicator of the size of companies in which a fund invests; the midpoint of market capitalization (market price x shares outstanding) of a fund’s stocks, weighted by the proportion of the fund’s assets invested in each stock. Stocks representing half of the fund’s assets have market capitalizations above the median, and the rest are below it.
Price/Book Ratio. The share price of a stock divided by its net worth, or book value, per share. For a fund, the weighted average price/book ratio of the stocks it holds.
Price/Earnings Ratio. The ratio of a stock’s current price to its per-share earnings over the past year. For a fund, the weighted average P/E of the stocks it holds. P/E is an indicator of market expectations about corporate prospects; the higher the P/E, the greater the expectations for a company’s future growth.
R-Squared. A measure of how much of a fund’s past returns can be explained by the returns from the market in general, as measured by a given index. If a fund’s total returns were precisely synchronized with an index’s returns, its R-squared would be 1.00. If the fund’s returns bore no relationship to the index’s returns, its R-squared would be 0. For this report, R-squared is based on returns over the past 36 months for both the fund and the index.
24
Return on Equity. The annual average rate of return generated by a company during the past five years for each dollar of shareholder’s equity (net income divided by shareholder’s equity). For a fund, the weighted average return on equity for the companies whose stocks it holds.
Short-Term Reserves. The percentage of a fund invested in highly liquid, short-term securities that can be readily converted to cash.
Turnover Rate. An indication of the fund’s trading activity. Funds with high turnover rates incur higher transaction costs and may be more likely to distribute capital gains (which may be taxable to investors). The turnover rate excludes in-kind transactions, which have minimal impact on costs.
Benchmark Information
Spliced Global Custom Metals and Mining Index: S&P/Citigroup World Equity Gold Index through June 30, 2005; S&P Global Custom Metals and Mining Index thereafter.
25
This page intentionally left blank.
This page intentionally left blank.
The People Who Govern Your Fund
The trustees of your mutual fund are there to see that the fund is operated and managed in your best interests since, as a shareholder, you are a part owner of the fund. Your fund’s trustees also serve on the board of directors of The Vanguard Group, Inc., which is owned by the Vanguard funds and provides services to them on an at-cost basis.
A majority of Vanguard’s board members are independent, meaning that they have no affiliation with Vanguard or the funds they oversee, apart from the sizable personal investments they have made as private individuals. The independent board members have distinguished backgrounds in business, academia, and public service. Each of the trustees and executive officers oversees 177 Vanguard funds.
The following table provides information for each trustee and executive officer of the fund. More information about the trustees is in the Statement of Additional Information, which can be obtained, without charge, by contacting Vanguard at 800-662-7447, or online at vanguard.com.
| |
| InterestedTrustee1 | and Delphi Automotive LLP (automotive components); |
| | Senior Advisor at New Mountain Capital. |
| F. William McNabb III | |
| Born 1957. Trustee Since July 2009. Chairman of the | Amy Gutmann |
| Board. Principal Occupation(s) During the Past Five | Born 1949. Trustee Since June 2006. Principal |
| Years: Chairman of the Board of The Vanguard Group, | Occupation(s) During the Past Five Years: President of |
| by The Vanguard Group, since January 2010; Director | Distinguished Professor of Political Science, School of |
| of The Vanguard Group since 2008; Chief Executive | Arts and Sciences, and Professor of Communication, |
| Officer and President of The Vanguard Group, and of | Annenberg School for Communication, with secondary |
| each of the investment companies served by The | faculty appointments in the Department of Philosophy, |
| Vanguard Group, since 2008; Director of Vanguard | School of Arts and Sciences, and at the Graduate |
| Marketing Corporation; Managing Director of The | School of Education, University of Pennsylvania; |
| Vanguard Group (1995–2008). | Trustee of the National Constitution Center; Chair |
| | of the Presidential Commission for the Study of |
| | Bioethical Issues. |
| IndependentTrustees | |
| | JoAnn Heffernan Heisen |
| Emerson U. Fullwood | Born 1950. Trustee Since July 1998. Principal |
| Born 1948. Trustee Since January 2008. Principal | Occupation(s) During the Past Five Years: Corporate |
| Occupation(s) During the Past Five Years: Executive | Vice President and Chief Global Diversity Officer |
| Chief Staff and Marketing Officer for North America | (retired 2008) and Member of the Executive |
| and Corporate Vice President (retired 2008) of Xerox | Committee (1997–2008) of Johnson & Johnson |
| Corporation (document management products and | (pharmaceuticals/medical devices/consumer |
| services); Executive in Residence and 2009–2010 | products); Director of Skytop Lodge Corporation |
| Distinguished Minett Professor at the Rochester | (hotels), the University Medical Center at Princeton, |
| Institute of Technology; Director of SPX Corporation | the Robert Wood Johnson Foundation, and the Center |
| (multi-industry manufacturing), the United Way of | for Talent Innovation; Member of the Advisory Board |
| Rochester, Amerigroup Corporation (managed health | of the Maxwell School of Citizenship and Public Affairs |
| care), the University of Rochester Medical Center, | at Syracuse University. |
| Monroe Community College Foundation, and North | |
| Carolina A&T University. | F. Joseph Loughrey |
| | Born 1949. Trustee Since October 2009. Principal |
| Rajiv L. Gupta | Occupation(s) During the Past Five Years: President |
| Born 1945. Trustee Since December 2001.2 | and Chief Operating Officer (retired 2009) of Cummins |
| Principal Occupation(s) During the Past Five Years: | Inc. (industrial machinery); Chairman of the Board |
| Chairman and Chief Executive Officer (retired 2009) | of Hillenbrand, Inc. (specialized consumer services), |
| and President (2006–2008) of Rohm and Haas Co. | and of Oxfam America; Director of SKF AB (industrial |
| (chemicals); Director of Tyco International, Ltd. | machinery), Hyster-Yale Materials Handling, Inc. |
| (diversified manufacturing and services), Hewlett- | (forklift trucks), the Lumina Foundation for Education, |
| Packard Co. (electronic computer manufacturing), | |
| | |
| and the V Foundation for Cancer Research; Member | Executive Officers | |
| of the Advisory Council for the College of Arts and | | |
| Letters and of the Advisory Board to the Kellogg | Glenn Booraem | |
| Institute for International Studies, both at the | Born 1967. Controller Since July 2010. Principal |
| University of Notre Dame. | Occupation(s) During the Past Five Years: Principal |
| | of The Vanguard Group, Inc.; Controller of each of |
| Mark Loughridge | the investment companies served by The Vanguard |
| Born 1953. Trustee Since March 2012. Principal | Group; Assistant Controller of each of the investment |
| Occupation(s) During the Past Five Years: Senior Vice | companies served by The Vanguard Group (2001–2010). |
| President and Chief Financial Officer (retired 2013) | | |
| at IBM (information technology services); Fiduciary | Thomas J. Higgins | |
| Member of IBM’s Retirement Plan Committee (2004– | Born 1957. Chief Financial Officer Since September |
| 2013); Member of the Council on Chicago Booth. | 2008. Principal Occupation(s) During the Past Five |
| | Years: Principal of The Vanguard Group, Inc.; Chief |
| Scott C. Malpass | Financial Officer of each of the investment companies |
| Born 1962. Trustee Since March 2012. Principal | served by The Vanguard Group; Treasurer of each of |
| Occupation(s) During the Past Five Years: Chief | the investment companies served by The Vanguard |
| Investment Officer and Vice President at the University | Group (1998–2008). | |
| of Notre Dame; Assistant Professor of Finance at the | | |
| Mendoza College of Business at Notre Dame; Member | Kathryn J. Hyatt | |
| of the Notre Dame 403(b) Investment Committee; | Born 1955. Treasurer Since November 2008. Principal |
| Board Member of TIFF Advisory Services, Inc. | Occupation(s) During the Past Five Years: Principal of |
| (investment advisor); Member of the Investment | The Vanguard Group, Inc.; Treasurer of each of the |
| Advisory Committees of the Financial Industry | investment companies served by The Vanguard |
| Regulatory Authority (FINRA) and of Major League | Group; Assistant Treasurer of each of the investment |
| Baseball. | companies served by The Vanguard Group (1988–2008). |
| |
| André F. Perold | Heidi Stam | |
| Born 1952. Trustee Since December 2004. Principal | Born 1956. Secretary Since July 2005. Principal |
| Occupation(s) During the Past Five Years: George | Occupation(s) During the Past Five Years: Managing |
| Gund Professor of Finance and Banking, Emeritus | Director of The Vanguard Group, Inc.; General Counsel |
| at the Harvard Business School (retired 2011); | of The Vanguard Group; Secretary of The Vanguard |
| Chief Investment Officer and Managing Partner of | Group and of each of the investment companies |
| HighVista Strategies LLC (private investment firm); | served by The Vanguard Group; Director and Senior |
| Director of Rand Merchant Bank; Overseer of the | Vice President of Vanguard Marketing Corporation. |
| Museum of Fine Arts Boston. | | |
| | Vanguard Senior ManagementTeam |
| Alfred M. Rankin, Jr. | | |
| Born 1941. Trustee Since January 1993. Principal | Mortimer J. Buckley | Chris D. McIsaac |
| Occupation(s) During the Past Five Years: Chairman, | Kathleen C. Gubanich | Michael S. Miller |
| President, and Chief Executive Officer of NACCO | Paul A. Heller | James M. Norris |
| Industries, Inc. (housewares/lignite), and of Hyster- | Martha G. King | Glenn W. Reed |
| Yale Materials Handling, Inc. (forklift trucks); Chairman | John T. Marcante | |
| of the Board of University Hospitals of Cleveland. | | |
| |
| Peter F. Volanakis | Chairman Emeritus and Senior Advisor |
| Born 1955. Trustee Since July 2009. Principal | | |
| Occupation(s) During the Past Five Years: President | John J. Brennan | |
| and Chief Operating Officer (retired 2010) of Corning | Chairman, 1996–2009 | |
| Incorporated (communications equipment); Trustee of | Chief Executive Officer and President, 1996–2008 |
| Colby-Sawyer College; Member of the Advisory Board | | |
| of the Norris Cotton Cancer Center and of the Advisory | Founder | |
| Board of the Parthenon Group (strategy consulting). | | |
| | John C. Bogle | |
| | Chairman and Chief Executive Officer, 1974–1996 |
1 Mr. McNabb is considered an “interested person,” as defined in the Investment Company Act of 1940, because he is an officer of the
Vanguard funds.
2 December 2002 for Vanguard Equity Income Fund, the Vanguard Municipal Bond Funds, and the Vanguard State Tax-Exempt Funds.
|  |
| |
| | P.O. Box 2600 |
| | Valley Forge, PA 19482-2600 |
| |
| |
| |
| Connect with Vanguard® > vanguard.com | |
| |
| |
| |
| Fund Information > 800-662-7447 | CFA® is a trademark owned by CFA Institute. |
| Direct Investor Account Services > 800-662-2739 | |
| Institutional Investor Services > 800-523-1036 | |
| Text Telephone for People | |
| With Hearing Impairment > 800-749-7273 | |
| |
| This material may be used in conjunction | |
| with the offering of shares of any Vanguard | |
| fund only if preceded or accompanied by | |
| the fund’s current prospectus. | |
| |
| All comparative mutual fund data are from Lipper, a | |
| Thomson Reuters Company, or Morningstar, Inc., unless | |
| otherwise noted. | |
| |
| You can obtain a free copy of Vanguard’s proxy voting | |
| guidelines by visiting vanguard.com/proxyreporting or by | |
| calling Vanguard at 800-662-2739. The guidelines are | |
| also available from the SEC’s website, sec.gov. In | |
| addition, you may obtain a free report on how your fund | |
| voted the proxies for securities it owned during the 12 | |
| months ended June 30. To get the report, visit either | |
| vanguard.com/proxyreporting or sec.gov. | |
| |
| You can review and copy information about your fund at | |
| the SEC’s Public Reference Room in Washington, D.C. To | |
| find out more about this public service, call the SEC at | |
| 202-551-8090. Information about your fund is also | |
| available on the SEC’s website, and you can receive | |
| copies of this information, for a fee, by sending a | |
| request in either of two ways: via e-mail addressed to | |
| publicinfo@sec.gov or via regular mail addressed to the | |
| Public Reference Section, Securities and Exchange | |
| Commission, Washington, DC 20549-1520. | |
| |
| | © 2014 The Vanguard Group, Inc. |
| | All rights reserved. |
| | Vanguard Marketing Corporation, Distributor. |
| |
| | Q532 092014 |

Semiannual Report | July 31, 2014
Vanguard Dividend Growth Fund

Vanguard’s Principles for Investing Success
We want to give you the best chance of investment success. These principles, grounded in Vanguard’s research and experience, can put you on the right path.
Goals. Create clear, appropriate investment goals.
Balance. Develop a suitable asset allocation using broadly diversified funds.
Cost. Minimize cost.
Discipline. Maintain perspective and long-term discipline.
A single theme unites these principles: Focus on the things you can control. We believe there is no wiser course for any investor.
| |
| Contents | |
| Your Fund’s Total Returns. | 1 |
| Chairman’s Letter. | 2 |
| Advisor’s Report. | 7 |
| Fund Profile. | 9 |
| Performance Summary. | 10 |
| Financial Statements. | 11 |
| About Your Fund’s Expenses. | 20 |
| Glossary. | 22 |
Please note: The opinions expressed in this report are just that—informed opinions. They should not be considered promises or advice.
Also, please keep in mind that the information and opinions cover the period through the date on the front of this report. Of course, the
risks of investing in your fund are spelled out in the prospectus.
See the Glossary for definitions of investment terms used in this report.
About the cover: The ship’s wheel represents leadership and guidance, essential qualities in navigating difficult seas.
This one is a replica based on an 18th-century British vessel. The HMS Vanguard, another ship of that era, served as the
flagship for British Admiral Horatio Nelson when he defeated a French fleet at the Battle of the Nile.
Your Fund’s Total Returns
| |
| Six Months Ended July 31, 2014 | |
| | Total |
| | Returns |
| Vanguard Dividend Growth Fund | 7.22% |
| NASDAQ US Dividend Achievers Select Index | 6.51 |
| Large-Cap Core Funds Average | 8.45 |
| Large-Cap Core Funds Average: Derived from data provided by Lipper, a Thomson Reuters Company. |
Your Fund’s Performance at a Glance
January 31, 2014, Through July 31, 2014
| | | | |
| | | | Distributions Per Share |
| | Starting | Ending | Income | Capital |
| | Share Price | Share Price | Dividends | Gains |
| Vanguard Dividend Growth Fund | $20.45 | $21.68 | $0.222 | $0.028 |
1

Chairman’s Letter
Dear Shareholder,
Despite challenges facing the U.S. economy and heightened geopolitical instability abroad, the U.S. stock market delivered solid results for the six months ended July 31, 2014. Dividend-paying stocks were in demand by investors looking for alternatives to low bond yields.
Vanguard Dividend Growth Fund returned 7.22%, ahead of its benchmark index, for the half year. The fund trailed the average return of its large-capitalization core peers. This peer group includes a diverse collection of funds. In contrast to your fund, many of the peer funds have no mandate to invest in stocks that boast a long track record of increasing their dividends.
The fund posted a positive result for all nine industry sectors in which it invested. Its advisor’s stock selections in health care, energy, and information technology contributed most to performance. The fund’s 30-day SEC yield declined a bit, from 2.05% at the start of the period to 2.03% at the end.
Stocks posted strong returns despite finishing with a thud
For the six months ended July 31, the broad U.S. stock market returned about 8% despite ending on a negative note. U.S. stocks, which were on the cusp of eking out a sixth straight positive monthly return, tumbled on the period’s final day. Still, generally strong corporate earnings, investors’ willingness to embrace risk, and
2
the Federal Reserve’s resolve to sustain historically low interest rates for an extended time have supported the market.
During the six months, stocks withstood conflict in the Middle East and Ukraine, economic concerns in China and Europe, and the Fed’s gradual reduction of its stimulative bond-buying program.
International stocks returned almost 10%. Emerging markets, which notably slumped in 2013, led the charge. Stocks in the developed markets of the Pacific region also managed double-digit returns. European stocks, despite retreating in July, finished on positive ground.
Bonds’ recent rebound showed signs of fatigue
The broad U.S. taxable bond market returned 2.16% for the six months. Although bonds have rebounded well after posting negative returns for 2013, their recent rally gradually lost momentum over June and July. The yield of the benchmark 10-year U.S. Treasury note ended July at 2.56%, down from 2.70% on January 31. (Bond prices and yields move in opposite directions.)
Municipal bonds, lifted by the broad bond market rally and less restrained by July’s decline in Treasury prices, returned 4.15%. Investor demand for tax-exempt income and a limited supply of new issues also benefited munis.
| | | |
| Market Barometer | | | |
| |
| | | | Total Returns |
| | Periods Ended July 31, 2014 |
| | Six | One | Five Years |
| | Months | Year | (Annualized) |
| Stocks | | | |
| Russell 1000 Index (Large-caps) | 9.02% | 17.06% | 17.13% |
| Russell 2000 Index (Small-caps) | -0.30 | 8.56 | 16.56 |
| Russell 3000 Index (Broad U.S. market) | 8.25 | 16.37 | 17.08 |
| FTSE All-World ex US Index (International) | 9.73 | 15.78 | 9.13 |
| |
| Bonds | | | |
| Barclays U.S. Aggregate Bond Index (Broad taxable market) | 2.16% | 3.97% | 4.47% |
| Barclays Municipal Bond Index (Broad tax-exempt market) | 4.15 | 7.27 | 5.50 |
| Citigroup Three-Month U.S. Treasury Bill Index | 0.00 | 0.04 | 0.07 |
| |
| CPI | | | |
| Consumer Price Index | 1.85% | 1.99% | 2.04% |
3
International bond markets (as measured by the Barclays Global Aggregate Index ex USD) returned 3.35%.
Results for money market funds and savings accounts remained tempered by the Fed’s target of 0%–0.25% for short-term interest rates.
Health care and energy stocks bolstered the fund’s performance
The Dividend Growth Fund’s advisor, Wellington Management Company, manages a relatively small portfolio—about 50 stocks—of what it views as undervalued, high-quality companies with potential for increasing their dividends over time. Unlike other dividend funds, which are more focused on the highest-yielding stocks, Dividend Growth’s strategy is to identify companies with strong prospects for raising their dividends, regardless of their current yield.
The fund’s benchmark, the NASDAQ US Dividend Achievers Select Index, is made up of about 160 stocks that have increased their annual dividends for at least ten consecutive years. Although the advisor is not bound by the index’s parameters, it is meticulous about selecting stocks that meet its own high standards.
Over the six months, the advisor’s approach produced a benchmark-beating return that nevertheless fell a few steps short of its peer-group result. Compared with peers, the fund had limited exposure to some of the market’s better performers—including, oddly enough,
Expense Ratios
Your Fund Compared With Its Peer Group
| | |
| | | Peer Group |
| | Fund | Average |
| Dividend Growth Fund | 0.31% | 1.15% |
The fund expense ratio shown is from the prospectus dated May 27, 2014, and represents estimated costs for the current fiscal year. For thesix months ended July 31, 2014, the fund’s annualized expense ratio was 0.33%. The peer-group expense ratio is derived from data providedby Lipper, a Thomson Reuters Company, and captures information through year-end 2013.Peer group: Large-Cap Core Funds.4
stocks with the highest yields. Investors were hungry for yield and for ways to increase their current income. Stocks with more modest yields but a record of steady dividend increases—the focus of your fund—performed less strongly.
The fund’s largest sector, health care, added the most to its performance, helped by an overweighting of the sector and by the advisor’s stock selection. Health care stocks outpaced the broad U.S. market by about 1 percentage point over the half year. Nearly every segment of the sector performed well, with pharmaceuticals and health care providers and suppliers contributing most to the fund. Mergers and acquisitions, new drug development, opportunities overseas, and the aging population’s need for increased health care were supportive, too.
Energy stocks, the market’s best-performing industry for the period, also lifted the fund. Integrated oil and gas companies benefited from higher oil prices resulting from renewed hostilities in Iraq. Although prices eased by the end of the period, the run-up helped the stocks of many energy companies. Companies that specialize in storing and transporting oil products were another source of strength.
Information technology stocks stood out as well. The advisor’s avoidance of certain poorly performing segments of that industry, including electronics manufacturers, helped shield the fund from detractors among the index’s holdings. The fund also benefited from owning shares in some software manufacturers not held in the benchmark.
The fund’s small utilities and materials sectors contributed little to its overall result. Poor stock selection within the fund’s sizable consumer discretionary and consumer staples sectors detracted from its relative performance.
Don’t let complacency set your portfolio adrift
At Vanguard, we often warn against letting emotions become entangled with investments. When the financial markets are in turmoil, for example, we’ll caution investors not to let fear lead to rash decisions. But complacency can also stand in the way of achieving financial goals. And lately, conditions may have been leading some investors to feel a little too comfortable.
Since its March 2009 bottom, the broad U.S. stock market, as measured by the Russell 3000 Index, has produced average annual returns in excess of 24%. That’s more than double the market’s historical average annual return. And in recent months, several indexes achieved record highs.
The investment winds don’t always blow favorably, of course—as we saw on the last day of July, when stocks fell sharply. Although the decline at the end of the
5
reporting period was unwelcome, it served to remind us that exceptionally smooth sailing can create risks of its own.
When markets are unusually tranquil, it can be easy to lose sight of fundamentals, especially the importance of rebalancing. Without periodically adjusting your asset allocation so that it stays in line with your goals and risk tolerance, you can end up with a portfolio that’s very different from, and potentially riskier than, your intended one.
Whatever way the market is moving, we always encourage our clients to stay focused on our four principles for investment success: Create clear, appropriate investment goals; develop a suitable asset allocation using broadly diversified funds; minimize cost; and maintain perspective and long-term discipline. (You can read more in Vanguard’s Principles for Investment Success, available at vanguard.com/ research.)
As always, thank you for investing with Vanguard.
Sincerely,

F. William McNabb III
Chairman and Chief Executive Officer
August 14, 2014
6
Advisor’s Report
Vanguard Dividend Growth Fund gained 7.22% for the six months ended July 31, 2014, outperforming the 6.51% return of its benchmark, the NASDAQ US Dividend Achievers Select Index.
The investment environment
The balance sheets of the major central banks across the globe remain bloated. As we have said before, we are concerned that the buoyant effects of central bank liquidity on global markets will not be followed by significantly better economic and business conditions in the near term. Market valuation therefore seems disconnected from fundamentals. We are also concerned about the tightness in spreads and what that implies for the current price of risk. Put another way, the markets’ extremely low volatility and relatively high level of complacency in the face of mediocre global conditions are notable.
The fund’s successes
For the six months, all sectors contributed to absolute performance except for telecommunication services, where we own no stocks. The fund’s holdings in health care, energy, information technology, and industrials produced the largest absolute contributions, while utilities and materials produced the smallest. We are glad to see a turnaround in our energy holdings since our last writing, as this sector had been a detractor.
Among the top absolute contributors for the six months were BG Group (energy), Chevron (energy), Microsoft (information technology), Canadian National Railway (industrials), and Johnson & Johnson (health care). The top contributor, BG Group, is a British oil and gas exploration company that we believe should see rising cash flow and improving dividend growth as several large investment projects come into production over the next several years. We are also happy that Canadian National Railway, an operator that spans Canada and extends through Chicago to the Gulf of Mexico, has aided performance; we added it during the first quarter of 2014. Relative to the benchmark, our lack of holdings in poorly performing Qualcomm (information technology) also aided results.
On a “run-rate” basis, the fund is expected to produce asset-weighted dividend growth of 14.1% for 2014. Our run-rate calculation is a rough estimate of potential dividend growth; it takes a company’s current declared dividend rate, annualizes it, and compares it with the previous calendar year’s actual dividend rate. This calculation does not accurately reflect, nor factor in the dollar size of, dividend increases that may be announced later in the year. Therefore, companies in the early stages of dividend growth tend to show large percentage increases, yet the absolute cash dividend may be small. Despite these shortcomings, we view this estimate as a reasonable report card.
7
Among the more notable dividend run-rate increases thus far in 2014 have been by Lowe’s (+35.3%) and UnitedHealth (+42.5%).
The fund’s shortfalls
On an absolute basis, our holdings in utilities and materials produced the smallest contributions. Relative to the benchmark, our stock selection in the consumer discretionary and consumer staples sectors also hurt performance. Our biggest absolute detractors included TJX Companies (consumer discretionary), United Technologies (industrials), Mattel (consumer discretionary), Omnicom Group (consumer discretionary), and Pfizer (health care). The biggest detractor, TJX Companies, is an off-price apparel retailer that reported disappointing earnings in the first half of the year, but it has an excellent long-term track record of dividend growth, which we expect to continue. Compared with the benchmark, not owning strong performers EOG Resources (energy) and Walgreens (consumer staples) also detracted.
Although we would prefer that all stocks in the fund perform well at all times, it is inevitable that some will detract from the fund’s performance over a given period. We assess a stock’s contribution to the fund over a longer time and with an eye consistently focused on dividend action.
The fund’s positioning and investment strategy
Our primary objective is to identify companies that we believe will steadily and reliably increase their dividend payments.
We seek to fulfill this objective by carefully building the Dividend Growth Fund one stock at a time, giving central consideration to each company’s dividend growth prospects. Our industry and sector weightings are a result of this process. As of the end of the period, the fund had significant allocations to the health care, industrial, and consumer discretionary sectors and less exposure (below 5% allocation) to utilities and materials. We hold no telecommunications stocks.
There has been some modest change to the fund’s positioning, though certainly no change in our investment strategy, since our last report. Some additions were made to the fund over the six months, driven largely by price opportunity. We also continue to manage the fund by constantly assessing the weightings of our existing positions and adjusting them accordingly. We remain true to our process and believe that the Dividend Growth Fund is well-positioned to deliver superior dividend growth and solid capital appreciation for shareholders over time.
Donald J. Kilbride
Senior Vice President and
Equity Portfolio Manager
Wellington Management Company, llp
August 20, 2014
8
Dividend Growth Fund
Fund Profile
As of July 31, 2014
| | | |
| Portfolio Characteristics | | |
| | | NASDAQ | DJ |
| | | US | U.S. |
| | | Dividend | Total |
| | | Achievers | Market |
| | | Select | FA |
| | Fund | Index | Index |
| Number of Stocks | 50 | 163 | 3,718 |
| Median Market Cap | $67.7B | $59.8B | $48.5B |
| Price/Earnings Ratio | 18.6x | 18.2x | 20.2x |
| Price/Book Ratio | 3.4x | 3.3x | 2.6x |
| Return on Equity | 23.5% | 21.6% | 17.5% |
| Earnings Growth | | | |
| Rate | 8.9% | 10.1% | 14.8% |
| Dividend Yield | 2.3% | 2.2% | 1.9% |
| Foreign Holdings | 12.4% | 0.0% | 0.0% |
| Turnover Rate | | | |
| (Annualized) | 22% | — | — |
| Ticker Symbol | VDIGX | — | — |
| Expense Ratio1 | 0.31% | — | — |
| 30-Day SEC Yield | 2.03% | — | — |
| Short-Term Reserves | 2.0% | — | — |
Sector Diversification (% of equity exposure)
| | | |
| | | NASDAQ | DJ |
| | | US | U.S. |
| | | Dividend | Total |
| | | Achievers | Market |
| | | Select | FA |
| | Fund | Index | Index |
| Consumer Discretionary | 13.7% | 8.4% | 12.6% |
| Consumer Staples | 13.3 | 21.7 | 8.1 |
| Energy | 10.7 | 9.6 | 9.8 |
| Financials | 11.1 | 6.9 | 17.3 |
| Health Care | 19.0 | 10.9 | 13.2 |
| Industrials | 16.3 | 21.2 | 11.2 |
| Information Technology | 10.6 | 11.9 | 18.6 |
| Materials | 4.3 | 8.5 | 3.9 |
| Telecommunication | | | |
| Services | 0.0 | 0.1 | 2.3 |
| Utilities | 1.0 | 0.8 | 3.0 |
| | |
| Volatility Measures | | |
| | NASDAQ | |
| | US Dividend | DJ |
| | Achievers | U.S. Total |
| | Select | Market |
| | Index | FA Index |
| R-Squared | 0.94 | 0.90 |
| Beta | 0.86 | 0.73 |
These measures show the degree and timing of the fund’s fluctuations compared with the indexes over 36 months.
Ten Largest Holdings (% of total net assets)
| | |
| United Parcel Service | Air Freight & | |
| Inc. | Logistics | 2.9% |
| UnitedHealth Group Inc. | Managed Health | |
| | Care | 2.9 |
| Lockheed Martin Corp. | Aerospace & | |
| | Defense | 2.8 |
| Wal-Mart Stores Inc. | Hypermarkets & | |
| | Super Centers | 2.7 |
| TJX Cos. Inc. | Apparel Retail | 2.7 |
| Microsoft Corp. | Systems Software | 2.6 |
| BG Group plc | Integrated Oil & Gas | 2.6 |
| Chevron Corp. | Integrated Oil & Gas | 2.5 |
| Medtronic Inc. | Health Care | |
| | Equipment | 2.5 |
| Cardinal Health Inc. | Health Care | |
| | Distributors | 2.5 |
| Top Ten | | 26.7% |
The holdings listed exclude any temporary cash investments and equity index products.Investment Focus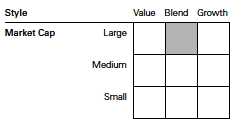
1 The expense ratio shown is from the prospectus dated May 27, 2014, and represents estimated costs for the current fiscal year. For the six months ended July 31, 2014, the annualized expense ratio was 0.33%.
9
Dividend Growth Fund
Performance Summary
All of the returns in this report represent past performance, which is not a guarantee of future results that may be achieved by the fund. (Current performance may be lower or higher than the performance data cited. For performance data current to the most recent month-end, visit our website at vanguard.com/performance.) Note, too, that both investment returns and principal value can fluctuate widely, so an investor’s shares, when sold, could be worth more or less than their original cost. The returns shown do not reflect taxes that a shareholder would pay on fund distributions or on the sale of fund shares.
Fiscal-Year Total Returns (%): January 31, 2004, Through July 31, 2014
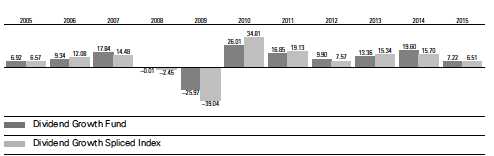
For a benchmark description, see the Glossary.
Note: For 2015, performance data reflect the six months ended July 31, 2014.
Average Annual Total Returns: Periods Ended June 30, 2014
This table presents returns through the latest calendar quarter—rather than through the end of the fiscal period.
Securities and Exchange Commission rules require that we provide this information.
| | | | |
| | Inception | One | Five | Ten |
| | Date | Year | Years | Years |
| Dividend Growth Fund | 5/15/1992 | 19.39% | 17.33% | 9.16% |
See Financial Highlights for dividend and capital gains information.
10
Dividend Growth Fund
Financial Statements (unaudited)
Statement of Net Assets
As of July 31, 2014
The fund reports a complete list of its holdings in regulatory filings four times in each fiscal year, at the quarter-ends. For the second and fourth fiscal quarters, the lists appear in the fund’s semiannual and annual reports to shareholders. For the first and third fiscal quarters, the fund files the lists with the Securities and Exchange Commission on Form N-Q. Shareholders can look up the fund’s Forms N-Q on the SEC’s website at sec.gov. Forms N-Q may also be reviewed and copied at the SEC’s Public Reference Room (see the back cover of this report for further information).
| | |
| | | Market |
| | | Value |
| | Shares | ($000) |
| Common Stocks (98.0%) | | |
| Consumer Discretionary (13.4%) | |
| TJX Cos. Inc. | 10,613,662 | 565,602 |
| NIKE Inc. Class B | 6,361,851 | 490,689 |
| Lowe’s Cos. Inc. | 9,312,971 | 445,626 |
| McDonald’s Corp. | 4,688,708 | 443,364 |
| Mattel Inc. | 9,828,786 | 348,185 |
| Walt Disney Co. | 3,627,325 | 311,515 |
| Omnicom Group Inc. | 2,944,330 | 206,074 |
| | | 2,811,055 |
| Consumer Staples (13.0%) | | |
| Wal-Mart Stores Inc. | 7,691,004 | 565,904 |
| Procter & Gamble Co. | 5,279,966 | 408,247 |
| Anheuser-Busch InBev | | |
| NV | 3,529,151 | 380,915 |
| CVS Caremark Corp. | 4,849,880 | 370,337 |
| Coca-Cola Co. | 9,023,826 | 354,546 |
| Diageo plc | 11,500,790 | 345,397 |
| Colgate-Palmolive Co. | 4,621,362 | 292,994 |
| | | 2,718,340 |
| Energy (10.5%) | | |
| BG Group plc | 27,832,645 | 548,841 |
| Chevron Corp. | 4,125,796 | 533,218 |
| Exxon Mobil Corp. | 4,175,733 | 413,147 |
| Enbridge Inc. | 7,762,908 | 380,227 |
| Schlumberger Ltd. | 2,969,096 | 321,820 |
| | | 2,197,253 |
| Financials (10.9%) | | |
| ACE Ltd. | 4,099,199 | 410,330 |
| BlackRock Inc. | 1,195,245 | 364,227 |
| Wells Fargo & Co. | 6,264,918 | 318,884 |
| Marsh & McLennan | | |
| Cos. Inc. | 6,265,214 | 318,085 |
| PNC Financial Services | | |
| Group Inc. | 3,666,899 | 302,739 |
| Chubb Corp. | 3,417,522 | 296,333 |
| Public Storage | 1,566,632 | 268,850 |
| | | 2,279,448 |
| | |
| | | Market |
| | | Value |
| | Shares | ($000) |
| Health Care (18.6%) | | |
| UnitedHealth Group Inc. | 7,433,654 | 602,498 |
| Medtronic Inc. | 8,552,873 | 528,054 |
| Cardinal Health Inc. | 7,336,192 | 525,638 |
| Johnson & Johnson | 5,208,507 | 521,320 |
| Merck & Co. Inc. | 9,023,408 | 511,988 |
| Roche Holding AG | 1,711,113 | 496,575 |
| Amgen Inc. | 3,187,192 | 406,016 |
| Pfizer Inc. | 10,697,032 | 307,005 |
| | | 3,899,094 |
| Industrials (16.0%) | | |
| United Parcel Service | | |
| Inc. Class B | 6,283,893 | 610,103 |
| Lockheed Martin Corp. | 3,530,842 | 589,545 |
| Canadian National | | |
| Railway Co. | 6,659,245 | 445,171 |
| United Technologies | | |
| Corp. | 4,080,887 | 429,105 |
| Honeywell International | | |
| Inc. | 4,185,967 | 384,397 |
| Northrop Grumman Corp. | 3,022,472 | 372,580 |
| General Dynamics Corp. | 2,228,602 | 260,234 |
| Emerson Electric Co. | 3,983,639 | 253,559 |
| | | 3,344,694 |
| Information Technology (10.4%) | |
| Microsoft Corp. | 12,750,696 | 550,320 |
| Automatic Data | | |
| Processing Inc. | 6,434,280 | 523,171 |
| Accenture plc Class A | 5,987,045 | 474,653 |
| Oracle Corp. | 10,094,093 | 407,701 |
| International Business | | |
| Machines Corp. | 1,144,583 | 219,382 |
| | | 2,175,227 |
| Materials (4.2%) | | |
| Praxair Inc. | 4,040,410 | 517,738 |
| Ecolab Inc. | 3,437,481 | 373,070 |
| | | 890,808 |
11
Dividend Growth Fund
| | |
| | | Market |
| | | Value |
| | Shares | ($000) |
| Utilities (1.0%) | | |
| Dominion Resources Inc. | 3,020,057 | 204,277 |
| Total Common Stocks | | |
| (Cost $15,029,431) | | 20,520,196 |
| |
| | Face | |
| | Amount | |
| | ($000) | |
| Temporary Cash Investments (2.0%) | |
| Repurchase Agreements (2.0%) | |
| RBS Securities, Inc. | | |
| 0.070%, 8/1/14 | | |
| (Dated 7/31/14, | | |
| Repurchase Value | | |
| $251,300,000, | | |
| collateralized by | | |
| U.S. Treasury Note/Bond, | | |
| 0.000%–3.000%, | | |
| 8/15/15–3/21/21, with a | | |
| value of $256,328,000) | 251,300 | 251,300 |
| Morgan Stanley & Co., Inc. | | |
| 0.090%, 8/1/14 | | |
| (Dated 7/31/14, | | |
| Repurchase Value | | |
| $169,300,000, | | |
| collateralized by | | |
| Federal National | | |
| Mortgage Assn. | | |
| 4.000%–9.000%, | | |
| 5/1/16–9/1/40 and | | |
| Federal Home Loan | | |
| Mortgage Corp. | | |
| 3.500%–8.500%, | | |
| 5/1/17–11/1/42, with a | | |
| value of $172,686,000) | 169,300 | 169,300 |
| | | 420,600 |
| Total Temporary Cash Investments | |
| (Cost $420,600) | | 420,600 |
| Total Investments (100.0%) | | |
| (Cost $15,450,031) | | 20,940,796 |
| |
| | Market |
| | Value |
| | ($000) |
| Other Assets and Liabilities (0.0%) | |
| Other Assets | 46,982 |
| Liabilities | (52,491) |
| | (5,509) |
| Net Assets (100%) | |
| Applicable to 965,826,965 outstanding | |
| $.001 par value shares of beneficial | |
| interest (unlimited authorization) | 20,935,287 |
| Net Asset Value Per Share | $21.68 |
At July 31, 2014, net assets consisted of:
| |
| | Amount |
| | ($000) |
| Paid-in Capital | 15,226,106 |
| Undistributed Net Investment Income | 792 |
| Accumulated Net Realized Gains | 217,595 |
| Unrealized Appreciation (Depreciation) | |
| Investment Securities | 5,490,765 |
| Foreign Currencies | 29 |
| Net Assets | 20,935,287 |
See Note A in Notes to Financial Statements.
See accompanying Notes, which are an integral part of the Financial Statements.
12
Dividend Growth Fund
Statement of Operations
| |
| | Six Months Ended |
| | July 31, 2014 |
| | ($000) |
| Investment Income | |
| Income | |
| Dividends1 | 243,219 |
| Interest | 131 |
| Securities Lending | 1,013 |
| Total Income | 244,363 |
| Expenses | |
| Investment Advisory Fees—Note B | |
| Basic Fee | 11,469 |
| Performance Adjustment | 3,401 |
| The Vanguard Group—Note C | |
| Management and Administrative | 16,413 |
| Marketing and Distribution | 2,204 |
| Custodian Fees | 130 |
| Shareholders’ Reports | 125 |
| Trustees’ Fees and Expenses | 19 |
| Total Expenses | 33,761 |
| Net Investment Income | 210,602 |
| Realized Net Gain (Loss) | |
| Investment Securities Sold | 221,599 |
| Foreign Currencies | (175) |
| Realized Net Gain (Loss) | 221,424 |
| Change in Unrealized Appreciation (Depreciation) | |
| Investment Securities | 952,191 |
| Foreign Currencies | (110) |
| Change in Unrealized Appreciation (Depreciation) | 952,081 |
| Net Increase (Decrease) in Net Assets Resulting from Operations | 1,384,107 |
| 1 Dividends are net of foreign withholding taxes of $4,468,000. |
See accompanying Notes, which are an integral part of the Financial Statements.
13
Dividend Growth Fund
Statement of Changes in Net Assets
| | |
| | Six Months Ended | Year Ended |
| | July 31, | January 31, |
| | 2014 | 2014 |
| | ($000) | ($000) |
| Increase (Decrease) in Net Assets | | |
| Operations | | |
| Net Investment Income | 210,602 | 330,187 |
| Realized Net Gain (Loss) | 221,424 | 223,809 |
| Change in Unrealized Appreciation (Depreciation) | 952,081 | 2,176,752 |
| Net Increase (Decrease) in Net Assets Resulting from Operations | 1,384,107 | 2,730,748 |
| Distributions | | |
| Net Investment Income | (212,212) | (329,157) |
| Realized Capital Gain1 | (26,350) | (93,833) |
| Total Distributions | (238,562) | (422,990) |
| Capital Share Transactions | | |
| Issued | 2,007,094 | 6,120,018 |
| Issued in Lieu of Cash Distributions | 212,665 | 378,204 |
| Redeemed | (1,567,313) | (2,372,492) |
| Net Increase (Decrease) from Capital Share Transactions | 652,446 | 4,125,730 |
| Total Increase (Decrease) | 1,797,991 | 6,433,488 |
| Net Assets | | |
| Beginning of Period | 19,137,296 | 12,703,808 |
| End of Period2 | 20,935,287 | 19,137,296 |
1 Includes fiscal 2014 short-term gain distributions totaling $11,293,000. Short-term gain distributions are treated as ordinary incomedividends for tax purposes.2 Net Assets—End of Period includes undistributed (overdistributed) net investment income of $792,000 and $2,577,000.See accompanying Notes, which are an integral part of the Financial Statements.
14
Dividend Growth Fund
Financial Highlights
| | | | | | |
| Six Months | | | | | |
| | Ended | | | | | |
| For a Share Outstanding | July 31, | Year Ended January 31, |
| Throughout Each Period | 2014 | 2014 | 2013 | 2012 | 2011 | 2010 |
| Net Asset Value, Beginning of Period | $20.45 | $17.52 | $15.81 | $14.68 | $12.82 | $10.42 |
| Investment Operations | | | | | | |
| Net Investment Income | .220 | .385 | .357 | .317 | .283 | .291 |
| Net Realized and Unrealized Gain (Loss) | | | | | | |
| on Investments | 1.260 | 3.033 | 1.721 | 1.126 | 1.850 | 2.401 |
| Total from Investment Operations | 1.480 | 3.418 | 2.078 | 1.443 | 2.133 | 2.692 |
| Distributions | | | | | | |
| Dividends from Net Investment Income | (. 222) | (. 384) | (. 368) | (. 313) | (. 273) | (. 292) |
| Distributions from Realized Capital Gains | (.028) | (.104) | — | — | — | — |
| Total Distributions | (. 250) | (. 488) | (. 368) | (. 313) | (. 273) | (. 292) |
| Net Asset Value, End of Period | $21.68 | $20.45 | $17.52 | $15.81 | $14.68 | $12.82 |
| |
| Total Return1 | 7.22% | 19.60% | 13.36% | 9.90% | 16.85% | 26.01% |
| |
| Ratios/Supplemental Data | | | | | | |
| Net Assets, End of Period (Millions) | $20,935 | $19,137 | $12,704 | $8,829 | $4,995 | $2,814 |
| Ratio of Total Expenses to | | | | | | |
| Average Net Assets2 | 0.33% | 0.31% | 0.29% | 0.31% | 0.34% | 0.38% |
| Ratio of Net Investment Income to | | | | | | |
| Average Net Assets | 2.06% | 2.03% | 2.22% | 2.28% | 2.25% | 2.59% |
| Portfolio Turnover Rate | 22% | 18% | 11% | 13% | 17% | 24% |
The expense ratio, net income ratio, and turnover rate for the current period have been annualized.1 Total returns do not include account service fees that may have applied in the periods shown. Fund prospectuses provide information aboutany applicable account service fees.2 Includes performance-based investment advisory fee increases (decreases) of 0.03%, 0.02%, 0.00%, 0.00%, 0.03%, and 0.03%.See accompanying Notes, which are an integral part of the Financial Statements.
15
Dividend Growth Fund
Notes to Financial Statements
Vanguard Dividend Growth Fund is registered under the Investment Company Act of 1940 as an open-end investment company, or mutual fund.
A. The following significant accounting policies conform to generally accepted accounting principles for U.S. investment companies. The fund consistently follows such policies in preparing its financial statements.
1. Security Valuation: Securities are valued as of the close of trading on the New York Stock Exchange (generally 4 p.m., Eastern time) on the valuation date. Equity securities are valued at the latest quoted sales prices or official closing prices taken from the primary market in which each security trades; such securities not traded on the valuation date are valued at the mean of the latest quoted bid and asked prices. Securities for which market quotations are not readily available, or whose values have been affected by events occurring before the fund’s pricing time but after the close of the securities’ primary markets, are valued at their fair values calculated according to procedures adopted by the board of trustees. These procedures include obtaining quotations from an independent pricing service, monitoring news to identify significant market- or security-specific events, and evaluating changes in the values of foreign market proxies (for example, ADRs, futures contracts, or exchange-traded funds), between the time the foreign markets close and the fund’s pricing time. When fair-value pricing is employed, the prices of securities used by a fund to calculate its net asset value may differ from quoted or published prices for the same securities. Investments in Vanguard Market Liquidity Fund are valued at that fund’s net asset value. Temporary cash investments acquired over 60 days to maturity are valued using the latest bid prices or using valuations based on a matrix system (which considers such factors as security prices, yields, maturities, and ratings), both as furnished by independent pricing services. Other temporary cash investments are valued at amortized cost, which approximates market value.
2. Foreign Currency: Securities and other assets and liabilities denominated in foreign currencies are translated into U.S. dollars using exchange rates obtained from an independent third party as of the fund’s pricing time on the valuation date. Realized gains (losses) and unrealized appreciation (depreciation) on investment securities include the effects of changes in exchange rates since the securities were purchased, combined with the effects of changes in security prices. Fluctuations in the value of other assets and liabilities resulting from changes in exchange rates are recorded as unrealized foreign currency gains (losses) until the assets or liabilities are settled in cash, at which time they are recorded as realized foreign currency gains (losses).
3. Repurchase Agreements: The fund enters into repurchase agreements with institutional counterparties. Securities pledged as collateral to the fund under repurchase agreements are held by a custodian bank until the agreements mature. Each agreement requires that the market value of the collateral be sufficient to cover payments of interest and principal. The fund further mitigates its counterparty risk by entering into repurchase agreements only with a diverse group of prequalified counterparties, monitoring their financial strength, and entering into master repurchase agreements with its counterparties. The master repurchase agreements provide that, in the event of a counterparty’s default (including bankruptcy), the fund may terminate any repurchase agreements with that counterparty, determine the net amount owed, and sell or retain the collateral up to the net amount owed to the fund. Such action may be subject to legal proceedings, which may delay or limit the disposition of collateral.
4. Federal Income Taxes: The fund intends to continue to qualify as a regulated investment company and distribute all of its taxable income. Management has analyzed the fund’s tax positions taken for all open federal income tax years (January 31, 2011–2014), and for the period ended July 31, 2014, and has concluded that no provision for federal income tax is required in the fund’s financial statements.
16
Dividend Growth Fund
5. Distributions: Distributions to shareholders are recorded on the ex-dividend date.
6. Securities Lending: To earn additional income, the fund lends its securities to qualified institutional borrowers. Security loans are required to be secured at all times by collateral in an amount at least equal to the market value of securities loaned. Daily market fluctuations could cause the value of loaned securities to be more or less than the value of the collateral received. When this occurs, the collateral is adjusted and settled on the next business day. The fund further mitigates its counterparty risk by entering into securities lending transactions only with a diverse group of prequalified counter-parties, monitoring their financial strength, and entering into master securities lending agreements with its counterparties. The master securities lending agreements provide that, in the event of a counterparty’s default (including bankruptcy), the fund may terminate any loans with that borrower, determine the net amount owed, and sell or retain the collateral up to the net amount owed to the fund; however, such actions may be subject to legal proceedings. While collateral mitigates counter-party risk, in the absence of a default the fund may experience delays and costs in recovering the securities loaned. The fund invests cash collateral received in Vanguard Market Liquidity Fund, and records a liability in the Statement of Net Assets for the return of the collateral, during the period the securities are on loan. Securities lending income represents fees charged to borrowers plus income earned on invested cash collateral, less expenses associated with the loan.
7. Credit Facility: The fund and certain other funds managed by The Vanguard Group participate in a $2.89 billion committed credit facility provided by a syndicate of lenders pursuant to a credit agreement that may be renewed annually; each fund is individually liable for its borrowings, if any, under the credit facility. Borrowings may be utilized for temporary and emergency purposes, and are subject to the fund’s regulatory and contractual borrowing restrictions. The participating funds are charged administrative fees and an annual commitment fee of 0.06% of the undrawn amount of the facility; these fees are allocated to the funds based on a method approved by the fund’s board of trustees and included in Management and Administrative expenses on the fund’s Statement of Operations. Any borrowings under this facility bear interest at a rate equal to the higher of the federal funds rate or LIBOR reference rate plus an agreed-upon spread.
The fund had no borrowings outstanding at July 31, 2014, or at any time during the period then ended.
8. Other: Dividend income is recorded on the ex-dividend date. Interest income is accrued daily. Security transactions are accounted for on the date securities are bought or sold. Costs used to determine realized gains (losses) on the sale of investment securities are those of the specific securities sold.
B. Wellington Management Company, LLP, provides investment advisory services to the fund for a fee calculated at an annual percentage rate of average net assets. The basic fee is subject to quarterly adjustments based on the fund’s performance for the preceding three years relative to the NASDAQ US Dividend Achievers Select Index. For the six months ended July 31, 2014, the investment advisory fee represented an effective annual basic rate of 0.11% of the fund’s average net assets before an increase of $3,401,000 (0.03%) based on performance.
C. The Vanguard Group furnishes at cost corporate management, administrative, marketing, and distribution services. The costs of such services are allocated to the fund based on methods approved by the board of trustees. The fund has committed to provide up to 0.40% of its net assets in capital contributions to Vanguard. At July 31, 2014, the fund had contributed capital of $2,151,000 to Vanguard (included in Other Assets), representing 0.01% of the fund’s net assets and 0.86% of Vanguard’s capitalization. The fund’s trustees and officers are also directors and officers of Vanguard.
17
Dividend Growth Fund
D. Various inputs may be used to determine the value of the fund’s investments. These inputs are summarized in three broad levels for financial statement purposes. The inputs or methodologies used to value securities are not necessarily an indication of the risk associated with investing in those securities.
Level 1—Quoted prices in active markets for identical securities.
Level 2—Other significant observable inputs (including quoted prices for similar securities, interest rates, prepayment speeds, credit risk, etc.).
Level 3—Significant unobservable inputs (including the fund’s own assumptions used to determine the fair value of investments).
The following table summarizes the market value of the fund’s investments as of July 31, 2014, based on the inputs used to value them:
| | | |
| | Level 1 | Level 2 | Level 3 |
| Investments | ($000) | ($000) | ($000) |
| Common Stocks | 18,748,468 | 1,771,728 | — |
| Temporary Cash Investments | — | 420,600 | — |
| Total | 18,748,468 | 2,192,328 | — |
E. Distributions are determined on a tax basis and may differ from net investment income and realized capital gains for financial reporting purposes. Differences may be permanent or temporary. Permanent differences are reclassified among capital accounts in the financial statements to reflect their tax character. Temporary differences arise when certain items of income, expense, gain, or loss are recognized in different periods for financial statement and tax purposes. These differences will reverse at some time in the future. Differences in classification may also result from the treatment of short-term gains as ordinary income for tax purposes. The fund’s tax-basis capital gains and losses are determined only at the end of each fiscal year.
During the six months ended July 31, 2014, the fund realized net foreign currency losses of $175,000, which decreased distributable net income for tax purposes; accordingly, such losses have been reclassified from accumulated net realized gains to undistributed net investment income.
At July 31, 2014, the cost of investment securities for tax purposes was $15,450,031,000. Net unrealized appreciation of investment securities for tax purposes was $5,490,765,000, consisting of unrealized gains of $5,528,764,000 on securities that had risen in value since their purchase and $37,999,000 in unrealized losses on securities that had fallen in value since their purchase.
F. During the six months ended July 31, 2014, the fund purchased $3,040,957,000 of investment securities and sold $2,255,767,000 of investment securities, other than temporary cash investments.
18
Dividend Growth Fund
G. Capital shares issued and redeemed were:
| | |
| | Six Months Ended | Year Ended |
| | July 31, 2014 | January 31, 2014 |
| | Shares | Shares |
| | (000) | (000) |
| Issued | 92,904 | 311,805 |
| Issued in Lieu of Cash Distributions | 9,659 | 18,932 |
| Redeemed | (72,468) | (120,255) |
| Net Increase (Decrease) in Shares Outstanding | 30,095 | 210,482 |
H. Management has determined that no material events or transactions occurred subsequent to July 31, 2014, that would require recognition or disclosure in these financial statements.
19
About Your Fund’s Expenses
As a shareholder of the fund, you incur ongoing costs, which include costs for portfolio management, administrative services, and shareholder reports (like this one), among others. Operating expenses, which are deducted from a fund’s gross income, directly reduce the investment return of the fund.
A fund’s expenses are expressed as a percentage of its average net assets. This figure is known as the expense ratio. The following examples are intended to help you understand the ongoing costs (in dollars) of investing in your fund and to compare these costs with those of other mutual funds. The examples are based on an investment of $1,000 made at the beginning of the period shown and held for the entire period.
The accompanying table illustrates your fund’s costs in two ways:
• Based on actual fund return. This section helps you to estimate the actual expenses that you paid over the period. The ”Ending Account Value“ shown is derived from the fund‘s actual return, and the third column shows the dollar amount that would have been paid by an investor who started with $1,000 in the fund. You may use the information here, together with the amount you invested, to estimate the expenses that you paid over the period.
To do so, simply divide your account value by $1,000 (for example, an $8,600 account value divided by $1,000 = 8.6), then multiply the result by the number given for your fund under the heading ”Expenses Paid During Period.“
• Based on hypothetical 5% yearly return. This section is intended to help you compare your fund‘s costs with those of other mutual funds. It assumes that the fund had a yearly return of 5% before expenses, but that the expense ratio is unchanged. In this case—because the return used is not the fund’s actual return—the results do not apply to your investment. The example is useful in making comparisons because the Securities and Exchange Commission requires all mutual funds to calculate expenses based on a 5% return. You can assess your fund’s costs by comparing this hypothetical example with the hypothetical examples that appear in shareholder reports of other funds.
Note that the expenses shown in the table are meant to highlight and help you compare ongoing costs only and do not reflect transaction costs incurred by the fund for buying and selling securities. Further, the expenses do not include any purchase, redemption, or account service fees described in the fund prospectus. If such fees were applied to your account, your costs would be higher. Your fund does not carry a “sales load.”
The calculations assume no shares were bought or sold during the period. Your actual costs may have been higher or lower, depending on the amount of your investment and the timing of any purchases or redemptions.
You can find more information about the fund’s expenses, including annual expense ratios, in the Financial Statements section of this report. For additional information on operating expenses and other shareholder costs, please refer to your fund’s current prospectus.
20
| | | |
| Six Months Ended July 31, 2014 | | | |
| | Beginning | Ending | Expenses |
| | Account Value | Account Value | Paid During |
| Dividend Growth Fund | 1/31/2014 | 7/31/2014 | Period |
| Based on Actual Fund Return | $1,000.00 | $1,072.21 | $1.70 |
| Based on Hypothetical 5% Yearly Return | 1,000.00 | 1,023.16 | 1.66 |
The calculations are based on expenses incurred in the most recent six-month period. The fund’s annualized six-month expense ratio for thatperiod is 0.33%. The dollar amounts shown as “Expenses Paid” are equal to the annualized expense ratio multiplied by the average accountvalue over the period, multiplied by the number of days in the most recent six-month period, then divided by the number of days in the mostrecent 12-month period.21
Glossary
30-Day SEC Yield. A fund’s 30-day SEC yield is derived using a formula specified by the U.S. Securities and Exchange Commission. Under the formula, data related to the fund’s security holdings in the previous 30 days are used to calculate the fund’s hypothetical net income for that period, which is then annualized and divided by the fund’s estimated average net assets over the calculation period. For the purposes of this calculation, a security’s income is based on its current market yield to maturity (for bonds), its actual income (for asset-backed securities), or its projected dividend yield (for stocks). Because the SEC yield represents hypothetical annualized income, it will differ—at times significantly—from the fund’s actual experience. As a result, the fund’s income distributions may be higher or lower than implied by the SEC yield.
Beta. A measure of the magnitude of a fund’s past share-price fluctuations in relation to the ups and downs of a given market index. The index is assigned a beta of 1.00. Compared with a given index, a fund with a beta of 1.20 typically would have seen its share price rise or fall by 12% when the index rose or fell by 10%. For this report, beta is based on returns over the past 36 months for both the fund and the index. Note that a fund’s beta should be reviewed in conjunction with its R-squared (see definition). The lower the R-squared, the less correlation there is between the fund and the index, and the less reliable beta is as an indicator of volatility.
Dividend Yield. Dividend income earned by stocks, expressed as a percentage of the aggregate market value (or of net asset value, for a fund). The yield is determined by dividing the amount of the annual dividends by the aggregate value (or net asset value) at the end of the period. For a fund, the dividend yield is based solely on stock holdings and does not include any income produced by other investments.
Earnings Growth Rate. The average annual rate of growth in earnings over the past five years for the stocks now in a fund.
Equity Exposure. A measure that reflects a fund’s investments in stocks and stock futures. Any holdings in short-term reserves are excluded.
Expense Ratio. A fund’s total annual operating expenses expressed as a percentage of the fund’s average net assets. The expense ratio includes management and administrative expenses, but does not include the transaction costs of buying and selling portfolio securities.
Foreign Holdings. The percentage of a fund represented by securities or depositary receipts of companies based outside the United States.
Inception Date. The date on which the assets of a fund (or one of its share classes) are first invested in accordance with the fund’s investment objective. For funds with a subscription period, the inception date is the day after that period ends. Investment performance is measured from the inception date.
Median Market Cap. An indicator of the size of companies in which a fund invests; the midpoint of market capitalization (market price x shares outstanding) of a fund’s stocks, weighted by the proportion of the fund’s assets invested in each stock. Stocks representing half of the fund’s assets have market capitalizations above the median, and the rest are below it.
Price/Book Ratio. The share price of a stock divided by its net worth, or book value, per share. For a fund, the weighted average price/book ratio of the stocks it holds.
22
Price/Earnings Ratio. The ratio of a stock’s current price to its per-share earnings over the past year. For a fund, the weighted average P/E of the stocks it holds. P/E is an indicator of market expectations about corporate prospects; the higher the P/E, the greater the expectations for a company’s future growth.
R-Squared. A measure of how much of a fund’s past returns can be explained by the returns from the market in general, as measured by a given index. If a fund’s total returns were precisely synchronized with an index’s returns, its R-squared would be 1.00. If the fund’s returns bore no relationship to the index’s returns, its R-squared would be 0. For this report, R-squared is based on returns over the past 36 months for both the fund and the index.
Return on Equity. The annual average rate of return generated by a company during the past five years for each dollar of shareholder’s equity (net income divided by shareholder’s equity). For a fund, the weighted average return on equity for the companies whose stocks it holds.
Short-Term Reserves. The percentage of a fund invested in highly liquid, short-term securities that can be readily converted to cash.
Turnover Rate. An indication of the fund’s trading activity. Funds with high turnover rates incur higher transaction costs and may be more likely to distribute capital gains (which may be taxable to investors). The turnover rate excludes in-kind transactions, which have minimal impact on costs.
Benchmark Information
Dividend Growth Spliced Index: Russell 1000 Index through January 31, 2010; NASDAQ US Dividend Achievers Select Index (formerly known as the Dividend Achievers Select Index) thereafter.
23
The People Who Govern Your Fund
The trustees of your mutual fund are there to see that the fund is operated and managed in your best interests since, as a shareholder, you are a part owner of the fund. Your fund’s trustees also serve on the board of directors of The Vanguard Group, Inc., which is owned by the Vanguard funds and provides services to them on an at-cost basis.
A majority of Vanguard’s board members are independent, meaning that they have no affiliation with Vanguard or the funds they oversee, apart from the sizable personal investments they have made as private individuals. The independent board members have distinguished backgrounds in business, academia, and public service. Each of the trustees and executive officers oversees 177 Vanguard funds.
The following table provides information for each trustee and executive officer of the fund. More information about the trustees is in the Statement of Additional Information, which can be obtained, without charge, by contacting Vanguard at 800-662-7447, or online at vanguard.com.
| |
| InterestedTrustee1 | and Delphi Automotive LLP (automotive components); |
| | Senior Advisor at New Mountain Capital. |
| F. William McNabb III | |
| Born 1957. Trustee Since July 2009. Chairman of the | Amy Gutmann |
| Board. Principal Occupation(s) During the Past Five | Born 1949. Trustee Since June 2006. Principal |
| Years: Chairman of the Board of The Vanguard Group, | Occupation(s) During the Past Five Years: President of |
| Inc., and of each of the investment companies served | the University of Pennsylvania; Christopher H. Browne |
| by The Vanguard Group, since January 2010; Director | Distinguished Professor of Political Science, School of |
| of The Vanguard Group since 2008; Chief Executive | Arts and Sciences, and Professor of Communication, |
| Officer and President of The Vanguard Group, and of | Annenberg School for Communication, with secondary |
| each of the investment companies served by The | faculty appointments in the Department of Philosophy, |
| Vanguard Group, since 2008; Director of Vanguard | School of Arts and Sciences, and at the Graduate |
| Marketing Corporation; Managing Director of The | School of Education, University of Pennsylvania; |
| Vanguard Group (1995–2008). | Trustee of the National Constitution Center; Chair |
| | of the Presidential Commission for the Study of |
| | Bioethical Issues. |
| IndependentTrustees | |
| | JoAnn Heffernan Heisen |
| Emerson U. Fullwood | Born 1950. Trustee Since July 1998. Principal |
| Born 1948. Trustee Since January 2008. Principal | Occupation(s) During the Past Five Years: Corporate |
| Occupation(s) During the Past Five Years: Executive | Vice President and Chief Global Diversity Officer |
| Chief Staff and Marketing Officer for North America | (retired 2008) and Member of the Executive |
| and Corporate Vice President (retired 2008) of Xerox | Committee (1997–2008) of Johnson & Johnson |
| Corporation (document management products and | (pharmaceuticals/medical devices/consumer |
| services); Executive in Residence and 2009–2010 | products); Director of Skytop Lodge Corporation |
| Distinguished Minett Professor at the Rochester | (hotels), the University Medical Center at Princeton, |
| Institute of Technology; Director of SPX Corporation | the Robert Wood Johnson Foundation, and the Center |
| (multi-industry manufacturing), the United Way of | for Talent Innovation; Member of the Advisory Board |
| Rochester, Amerigroup Corporation (managed health | of the Maxwell School of Citizenship and Public Affairs |
| care), the University of Rochester Medical Center, | at Syracuse University. |
| Monroe Community College Foundation, and North | |
| Carolina A&T University. | F. Joseph Loughrey |
| | Born 1949. Trustee Since October 2009. Principal |
| Rajiv L. Gupta | Occupation(s) During the Past Five Years: President |
| Born 1945. Trustee Since December 2001.2 | and Chief Operating Officer (retired 2009) of Cummins |
| Principal Occupation(s) During the Past Five Years: | Inc. (industrial machinery); Chairman of the Board |
| Chairman and Chief Executive Officer (retired 2009) | of Hillenbrand, Inc. (specialized consumer services), |
| and President (2006–2008) of Rohm and Haas Co. | and of Oxfam America; Director of SKF AB (industrial |
| (chemicals); Director of Tyco International, Ltd. | machinery), Hyster-Yale Materials Handling, Inc. |
| (diversified manufacturing and services), Hewlett- | (forklift trucks), the Lumina Foundation for Education, |
| Packard Co. (electronic computer manufacturing), | |
| | |
| and the V Foundation for Cancer Research; Member | Executive Officers | |
| of the Advisory Council for the College of Arts and | | |
| Letters and of the Advisory Board to the Kellogg | Glenn Booraem | |
| Institute for International Studies, both at the | Born 1967. Controller Since July 2010. Principal |
| University of Notre Dame. | Occupation(s) During the Past Five Years: Principal |
| | of The Vanguard Group, Inc.; Controller of each of |
| Mark Loughridge | the investment companies served by The Vanguard |
| Born 1953. Trustee Since March 2012. Principal | Group; Assistant Controller of each of the investment |
| Occupation(s) During the Past Five Years: Senior Vice | companies served by The Vanguard Group (2001–2010). |
| President and Chief Financial Officer (retired 2013) | | |
| at IBM (information technology services); Fiduciary | Thomas J. Higgins | |
| Member of IBM’s Retirement Plan Committee (2004– | Born 1957. Chief Financial Officer Since September |
| 2013); Member of the Council on Chicago Booth. | 2008. Principal Occupation(s) During the Past Five |
| | Years: Principal of The Vanguard Group, Inc.; Chief |
| Scott C. Malpass | Financial Officer of each of the investment companies |
| Born 1962. Trustee Since March 2012. Principal | served by The Vanguard Group; Treasurer of each of |
| Occupation(s) During the Past Five Years: Chief | the investment companies served by The Vanguard |
| Investment Officer and Vice President at the University | Group (1998–2008). | |
| of Notre Dame; Assistant Professor of Finance at the | | |
| Mendoza College of Business at Notre Dame; Member | Kathryn J. Hyatt | |
| of the Notre Dame 403(b) Investment Committee; | Born 1955. Treasurer Since November 2008. Principal |
| Board Member of TIFF Advisory Services, Inc. | Occupation(s) During the Past Five Years: Principal of |
| (investment advisor); Member of the Investment | The Vanguard Group, Inc.; Treasurer of each of the |
| Advisory Committees of the Financial Industry | investment companies served by The Vanguard |
| Regulatory Authority (FINRA) and of Major League | Group; Assistant Treasurer of each of the investment |
| Baseball. | companies served by The Vanguard Group (1988–2008). |
| |
| André F. Perold | Heidi Stam | |
| Born 1952. Trustee Since December 2004. Principal | Born 1956. Secretary Since July 2005. Principal |
| Occupation(s) During the Past Five Years: George | Occupation(s) During the Past Five Years: Managing |
| Gund Professor of Finance and Banking, Emeritus | Director of The Vanguard Group, Inc.; General Counsel |
| at the Harvard Business School (retired 2011); | of The Vanguard Group; Secretary of The Vanguard |
| Chief Investment Officer and Managing Partner of | Group and of each of the investment companies |
| HighVista Strategies LLC (private investment firm); | served by The Vanguard Group; Director and Senior |
| Director of Rand Merchant Bank; Overseer of the | Vice President of Vanguard Marketing Corporation. |
| Museum of Fine Arts Boston. | | |
| | Vanguard Senior ManagementTeam |
| Alfred M. Rankin, Jr. | | |
| Born 1941. Trustee Since January 1993. Principal | Mortimer J. Buckley | Chris D. McIsaac |
| Occupation(s) During the Past Five Years: Chairman, | Kathleen C. Gubanich | Michael S. Miller |
| President, and Chief Executive Officer of NACCO | Paul A. Heller | James M. Norris |
| Industries, Inc. (housewares/lignite), and of Hyster- | Martha G. King | Glenn W. Reed |
| Yale Materials Handling, Inc. (forklift trucks); Chairman | John T. Marcante | |
| of the Board of University Hospitals of Cleveland. | | |
| |
| Peter F. Volanakis | Chairman Emeritus and Senior Advisor |
| Born 1955. Trustee Since July 2009. Principal | | |
| Occupation(s) During the Past Five Years: President | John J. Brennan | |
| and Chief Operating Officer (retired 2010) of Corning | Chairman, 1996–2009 | |
| Incorporated (communications equipment); Trustee of | Chief Executive Officer and President, 1996–2008 |
| Colby-Sawyer College; Member of the Advisory Board | | |
| of the Norris Cotton Cancer Center and of the Advisory | Founder | |
| Board of the Parthenon Group (strategy consulting). | | |
| | John C. Bogle | |
| | Chairman and Chief Executive Officer, 1974–1996 |
1 Mr. McNabb is considered an “interested person,” as defined in the Investment Company Act of 1940, because he is an officer of the
Vanguard funds.
2 December 2002 for Vanguard Equity Income Fund, the Vanguard Municipal Bond Funds, and the Vanguard State Tax-Exempt Funds.
|  |
| |
| | P.O. Box 2600 |
| | Valley Forge, PA 19482-2600 |
| |
| |
| |
| Connect with Vanguard® > vanguard.com | |
| |
| |
| |
| Fund Information > 800-662-7447 | |
| Direct Investor Account Services > 800-662-2739 | |
| Institutional Investor Services > 800-523-1036 | |
| Text Telephone for People | |
| With Hearing Impairment > 800-749-7273 | |
| |
| This material may be used in conjunction | |
| with the offering of shares of any Vanguard | |
| fund only if preceded or accompanied by | |
| the fund’s current prospectus. | |
| |
| All comparative mutual fund data are from Lipper, a | |
| Thomson Reuters Company, or Morningstar, Inc., unless | |
| otherwise noted. | |
| |
| You can obtain a free copy of Vanguard’s proxy voting | |
| guidelines by visiting vanguard.com/proxyreporting or by | |
| calling Vanguard at 800-662-2739. The guidelines are | |
| also available from the SEC’s website, sec.gov. In | |
| addition, you may obtain a free report on how your fund | |
| voted the proxies for securities it owned during the 12 | |
| months ended June 30. To get the report, visit either | |
| vanguard.com/proxyreporting or sec.gov. | |
| |
| You can review and copy information about your fund at | |
| the SEC’s Public Reference Room in Washington, D.C. To | |
| find out more about this public service, call the SEC at | |
| 202-551-8090. Information about your fund is also | |
| available on the SEC’s website, and you can receive | |
| copies of this information, for a fee, by sending a | |
| request in either of two ways: via e-mail addressed to | |
| publicinfo@sec.gov or via regular mail addressed to the | |
| Public Reference Section, Securities and Exchange | |
| Commission, Washington, DC 20549-1520. | |
| |
| | © 2014 The Vanguard Group, Inc. |
| | All rights reserved. |
| | Vanguard Marketing Corporation, Distributor. |
| |
| | Q572 092014 |

Semiannual Report | July 31, 2014
Vanguard Dividend Appreciation Index Fund

Vanguard’s Principles for Investing Success
We want to give you the best chance of investment success. These principles, grounded in Vanguard’s research and experience, can put you on the right path.
Goals. Create clear, appropriate investment goals.
Balance. Develop a suitable asset allocation using broadly diversified funds.
Cost. Minimize cost.
Discipline. Maintain perspective and long-term discipline.
A single theme unites these principles: Focus on the things you can control. We believe there is no wiser course for any investor.
| |
| Contents | |
| Your Fund’s Total Returns. | 1 |
| Chairman’s Letter. | 2 |
| Fund Profile. | 7 |
| Performance Summary. | 9 |
| Financial Statements. | 10 |
| About Your Fund’s Expenses. | 24 |
| Trustees Approve Advisory Arrangement. | 26 |
| Glossary. | 27 |
Please note: The opinions expressed in this report are just that—informed opinions. They should not be considered promises or advice.
Also, please keep in mind that the information and opinions cover the period through the date on the front of this report. Of course, the
risks of investing in your fund are spelled out in the prospectus.
See the Glossary for definitions of investment terms used in this report.
About the cover: The ship’s wheel represents leadership and guidance, essential qualities in navigating difficult seas.
This one is a replica based on an 18th-century British vessel. The HMS Vanguard, another ship of that era, served as the
flagship for British Admiral Horatio Nelson when he defeated a French fleet at the Battle of the Nile.
Your Fund’s Total Returns
| |
| Six Months Ended July 31, 2014 | |
| | Total |
| | Returns |
| Vanguard Dividend Appreciation Index Fund | |
| Investor Shares | 6.45% |
| Admiral™ Shares | 6.48 |
| ETF Shares | |
| Market Price | 6.51 |
| Net Asset Value | 6.51 |
| NASDAQ US Dividend Achievers Select Index | 6.51 |
| Large-Cap Core Funds Average | 8.45 |
Large-Cap Core Funds Average: Derived from data provided by Lipper, a Thomson Reuters Company.The Vanguard ETF® Shares shown are traded on the NYSE Arca exchange and are available only through brokers. The table provides ETFreturns based on both the NYSE Arca market price and the net asset value for a share. U.S. Pat. Nos. 6,879,964; 7,337,138; 7,720,749;7,925,573; 8,090,646; and 8,417,623.For the ETF Shares, the market price is determined by the midpoint of the bid-offer spread as of the closing time of the New York StockExchange (generally 4 p.m., Eastern time). The net asset value is also determined as of the NYSE closing time. For more information abouthow the ETF Shares' market prices have compared with their net asset value, visit vanguard.com, select your ETF, and then select the Priceand Performance tab. The ETF premium/discount analysis there shows the percentages of days on which the ETF Shares' market price wasabove or below the NAV.Your Fund’s Performance at a Glance
January 31, 2014, Through July 31, 2014
| | | | |
| | | | Distributions Per Share |
| | Starting | Ending | Income | Capital |
| | Share Price | Share Price | Dividends | Gains |
| Vanguard Dividend Appreciation Index Fund | | | | |
| Investor Shares | $28.59 | $30.16 | $0.278 | $0.000 |
| Admiral Shares | 19.40 | 20.46 | 0.200 | 0.000 |
| ETF Shares | 71.47 | 75.39 | 0.737 | 0.000 |
1

Chairman’s Letter
Dear Shareholder,
Dividend-paying stocks produced solid results over the six months ended July 31, 2014—a period marked by slow U.S. economic growth, heightened geopolitical instability, and low bond yields. Vanguard Dividend Appreciation Index Fund returned more than 6% for the half year, in line with its benchmark index.
The fund trailed the average return of its large-capitalization core peers. This peer group includes a diverse collection of funds. In contrast to your fund, many have no mandate to invest in stocks that boast a long track record of increasing their dividends.
Over the period, the fund benefited most from its holdings in the consumer goods, oil and gas, and industrial sectors.
The fund’s 30-day SEC yield for Investor Shares declined slightly over the half year, from 2.05% at the start to 1.97% at the end.
Stocks posted strong returns despite finishing with a thud
For the six months ended July 31, the broad U.S. stock market returned about 8% despite ending on a negative note. U.S. stocks, which were on the cusp of eking out a sixth straight positive monthly return, tumbled on the period’s final day.
2
Still, generally strong corporate earnings, investors’ willingness to embrace risk, and the Federal Reserve’s resolve to sustain historically low interest rates for an extended time have supported the market.
During the six months, stocks withstood conflict in the Middle East and Ukraine, economic concerns in China and Europe, and the Fed’s gradual reduction of its stimulative bond-buying program.
International stocks returned almost 10%. Emerging markets, which notably slumped in 2013, led the charge. Stocks in the developed markets of the Pacific region also managed double-digit returns. European stocks, despite retreating in July, finished on positive ground.
The pace of bond gains slackened over the latter part of the period
The broad U.S. taxable bond market returned 2.16% for the six months. Although bonds have rebounded well after posting negative returns for 2013, their recent rally gradually lost momentum over June and July. The yield of the benchmark 10-year U.S. Treasury note ended July at 2.56%, down from 2.70% on January 31. (Bond prices and yields move in opposite directions.)
Municipal bonds, lifted by the broad bond market rally and less restrained by July’s decline in Treasury prices, returned 4.15%. Investor demand for tax-exempt income and a limited supply of new issues also benefited munis.
| | | |
| Market Barometer | | | |
| |
| | | | Total Returns |
| | Periods Ended July 31, 2014 |
| | Six | One | Five Years |
| | Months | Year | (Annualized) |
| Stocks | | | |
| Russell 1000 Index (Large-caps) | 9.02% | 17.06% | 17.13% |
| Russell 2000 Index (Small-caps) | -0.30 | 8.56 | 16.56 |
| Russell 3000 Index (Broad U.S. market) | 8.25 | 16.37 | 17.08 |
| FTSE All-World ex US Index (International) | 9.73 | 15.78 | 9.13 |
| |
| Bonds | | | |
| Barclays U.S. Aggregate Bond Index (Broad taxable market) | 2.16% | 3.97% | 4.47% |
| Barclays Municipal Bond Index (Broad tax-exempt market) | 4.15 | 7.27 | 5.50 |
| Citigroup Three-Month U.S. Treasury Bill Index | 0.00 | 0.04 | 0.07 |
| |
| CPI | | | |
| Consumer Price Index | 1.85% | 1.99% | 2.04% |
3
International bond markets (as measured by the Barclays Global Aggregate Index ex USD) returned 3.35%.
Results for money market funds and savings accounts remained tempered by the Fed’s target of 0%–0.25% for short-term interest rates.
The index’s selection criterion moderated the fund’s performance
The Dividend Appreciation Index Fund’s benchmark index includes about 160 stocks that have raised their dividends for ten or more consecutive years. As I mentioned earlier, the index’s focus on long-term dividend growth distinguishes it from some of the fund’s large-cap core peers, many of which follow strategies without an explicit focus on dividends.
For a company to increase its dividend year after year, it must be on sound financial footing. The stocks in the index are primarily high-quality companies that generate consistent cash flow. Over the six months, this collection of relatively strong, mature companies trailed the broader stock market. Some of the market’s better performers, oddly enough, were stocks with high dividend yields such as utilities. Stocks with more modest yields but a record of steady dividend increases—the focus of your fund—performed less strongly.
Nine of the fund’s ten industry sectors turned in positive results. Its smallest sector, telecommunications, was the only one that declined.
Expense Ratios
Your Fund Compared With Its Peer Group
| | | | |
| | Investor | Admiral | ETF | Peer Group |
| | Shares | Shares | Shares | Average |
| Dividend Appreciation Index Fund | 0.20% | 0.10% | 0.10% | 1.15% |
The fund expense ratios shown are from the prospectus dated May 27, 2014, and represent estimated costs for the current fiscal year. For thesix months ended July 31, 2014, the fund’s annualized expense ratios were 0.20% for Investor Shares, 0.10% for Admiral Shares, and 0.10%for ETF Shares. The peer-group expense ratio is derived from data provided by Lipper, a Thomson Reuters Company, and captures informationthrough year-end 2013.Peer group: Large-Cap Core Funds.4
The consumer goods, oil and gas, and industrial sectors contributed most to the fund’s return. Consumer goods, the second-largest sector after industrials, benefited from strong results for beverage companies, particularly soft-drink manufacturers and wine-and-spirits producers. Giant agricultural food processors also did well, thanks to strong demand for ethanol and a rebound in U.S. grain exports.
Oil and gas, the stock market’s best-performing industry for the period, also bolstered the fund. Producers benefited from higher oil prices resulting from renewed hostilities in Iraq. Although prices eased by the end of the period, the run-up helped the stocks of many energy companies.
Industrials delivered positive but lackluster results, weighed down by aerospace and electronic equipment stocks. Demand for those companies’ products was weak both in the United States and abroad.
Because its index filters out companies that don’t regularly increase their dividends, the fund had smaller allocations to some of the market’s other top-performing sectors, including health care and basic materials.
Don’t let complacency set your portfolio adrift
At Vanguard, we often warn against letting emotions become entangled with investments. When the financial markets are in turmoil, for example, we’ll caution investors not to let fear lead to rash decisions. But complacency can also stand in the way of achieving financial goals. And lately, conditions may have been leading some investors to feel a little too comfortable.
Since its March 2009 bottom, the broad U.S. stock market, as measured by the Russell 3000 Index, has produced average annual returns of nearly 25%. That’s more than double the market’s historical average annual return. And in recent months, several indexes achieved record highs.
The investment winds don’t always blow favorably, of course—as we saw on the last day of July, when stocks fell sharply. Although the decline at the end of the reporting period was unwelcome, it served to remind us that exceptionally smooth sailing can create risks of its own.
When markets are unusually tranquil, it can be easy to lose sight of fundamentals, especially the importance of rebalancing. Without periodically adjusting your asset allocation so that it stays in line with your goals and risk tolerance, you can end up with a portfolio that’s very different from, and potentially riskier than, your intended one.
Whatever way the market is moving, we always encourage our clients to stay focused on our four principles for investment success: Create clear,
5
appropriate investment goals; develop a suitable asset allocation using broadly diversified funds; minimize cost; and maintain perspective and long-term discipline. (You can read more in Vanguard’s Principles for Investment Success, available at vanguard.com/ research.)
As always, thank you for investing with Vanguard.
Sincerely,

F. William McNabb III
Chairman and Chief Executive Officer
August 13, 2014
6
Dividend Appreciation Index Fund
Fund Profile
As of July 31, 2014
| | | |
| Share-Class Characteristics | | |
| |
| | Investor | Admiral | ETF |
| | Shares | Shares | Shares |
| Ticker Symbol | VDAIX | VDADX | VIG |
| Expense Ratio1 | 0.20% | 0.10% | 0.10% |
| 30-Day SEC Yield | 1.97% | 2.07% | 2.07% |
| | | |
| Portfolio Characteristics | | |
| | | NASDAQ | DJ |
| | | US | U.S. |
| | | Dividend | Total |
| | | Achievers | Market |
| | | Select | FA |
| | Fund | Index | Index |
| Number of Stocks | 163 | 163 | 3,718 |
| Median Market Cap | $59.8B | $59.8B | $48.5B |
| Price/Earnings Ratio | 18.2x | 18.2x | 20.2x |
| Price/Book Ratio | 3.3x | 3.3x | 2.6x |
| Return on Equity | 21.6% | 21.6% | 17.5% |
| Earnings Growth | | | |
| Rate | 10.1% | 10.1% | 14.8% |
| Dividend Yield | 2.2% | 2.2% | 1.9% |
| Foreign Holdings | 0.0% | 0.0% | 0.0% |
| Turnover Rate | | | |
| (Annualized) | 24% | — | — |
| Short-Term Reserves | 0.0% | — | — |
| | |
| Volatility Measures | | |
| | NASDAQ | |
| | US Dividend | DJ |
| | Achievers | U.S. Total |
| | Select | Market |
| | Index | FA Index |
| R-Squared | 1.00 | 0.91 |
| Beta | 1.00 | 0.83 |
| These measures show the degree and timing of the fund’s |
| fluctuations compared with the indexes over 36 months. |
| | |
| Ten Largest Holdings (% of total net assets) |
| Johnson & Johnson | Pharmaceuticals | 4.3% |
| International Business | | |
| Machines Corp. | Computer Services | 4.1 |
| Coca-Cola Co. | Soft Drinks | 4.1 |
| Exxon Mobil Corp. | Integrated Oil & Gas | 4.0 |
| PepsiCo Inc. | Soft Drinks | 4.0 |
| Wal-Mart Stores Inc. | Broadline Retailers | 3.9 |
| QUALCOMM Inc. | Semiconductors | 3.8 |
| United Technologies | | |
| Corp. | Aerospace | 2.9 |
| 3M Co. | Diversified Industrials | 2.8 |
| CVS Caremark Corp. | Drug Retailers | 2.7 |
| Top Ten | | 36.6% |
| The holdings listed exclude any temporary cash investments and equity index products. |
|
Investment Focus
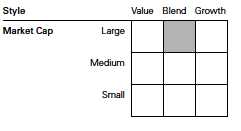
1 The expense ratios shown are from the prospectus dated May 27, 2014, and represent estimated costs for the current fiscal year. For the six
months ended July 31, 2014, the annualized expense ratios were 0.20% for Investor Shares, 0.10% for Admiral Shares, and 0.10% for ETF Shares.
7
Dividend Appreciation Index Fund
Sector Diversification (% of equity exposure)
| | | |
| | | NASDAQ | DJ |
| | | US | U.S. |
| | | Dividend | Total |
| | | Achievers | Market |
| | | Select | FA |
| | Fund | Index | Index |
| Basic Materials | 5.7% | 5.7% | 3.1% |
| Consumer Goods | 18.5 | 18.6 | 9.7 |
| Consumer Services | 14.8 | 14.7 | 13.3 |
| Financials | 6.9 | 6.9 | 18.3 |
| Health Care | 10.2 | 10.2 | 12.4 |
| Industrials | 23.2 | 23.2 | 12.6 |
| Oil & Gas | 9.2 | 9.2 | 9.7 |
| Technology | 10.4 | 10.4 | 15.5 |
| Telecommunications | 0.1 | 0.1 | 2.3 |
| Utilities | 1.0 | 1.0 | 3.1 |
8
Dividend Appreciation Index Fund
Performance Summary
All of the returns in this report represent past performance, which is not a guarantee of future results that may be achieved by the fund. (Current performance may be lower or higher than the performance data cited. For performance data current to the most recent month-end, visit our website at vanguard.com/performance.) Note, too, that both investment returns and principal value can fluctuate widely, so an investor’s shares, when sold, could be worth more or less than their original cost. The returns shown do not reflect taxes that a shareholder would pay on fund distributions or on the sale of fund shares.
Fiscal-Year Total Returns (%): April 27, 2006, Through July 31, 2014
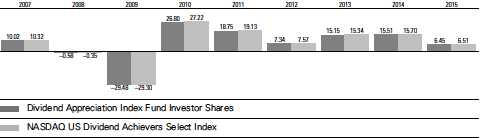
Note: For 2015, performance data reflect the six months ended July 31, 2014.
Average Annual Total Returns: Periods Ended June 30, 2014
This table presents returns through the latest calendar quarter—rather than through the end of the fiscal period.
Securities and Exchange Commission rules require that we provide this information.
| | | | |
| | Inception | One | Five | Since |
| | Date | Year | Years | Inception |
| Investor Shares | 4/27/2006 | 19.96% | 16.86% | 7.64% |
| Admiral Shares | 12/19/2013 | — | — | 6.77 |
| ETF Shares | 4/21/2006 | | | |
| Market Price | | 20.10 | 16.98 | 7.78 |
| Net Asset Value | | 20.12 | 16.99 | 7.78 |
See Financial Highlights for dividend and capital gains information.
9
Dividend Appreciation Index Fund
Financial Statements (unaudited)
Statement of Net Assets
As of July 31, 2014
The fund reports a complete list of its holdings in regulatory filings four times in each fiscal year, at the quarter-ends. For the second and fourth fiscal quarters, the lists appear in the fund’s semiannual and annual reports to shareholders. For the first and third fiscal quarters, the fund files the lists with the Securities and Exchange Commission on Form N-Q. Shareholders can look up the fund’s Forms N-Q on the SEC’s website at sec.gov. Forms N-Q may also be reviewed and copied at the SEC’s Public Reference Room (see the back cover of this report for further information).
| | |
| | | Market |
| | | Value |
| | Shares | ($000) |
| Common Stocks (99.9%)1 | | |
| Basic Materials (5.7%) | | |
| Praxair Inc. | 2,100,909 | 269,211 |
| Ecolab Inc. | 2,149,466 | 233,282 |
| Air Products & | | |
| Chemicals Inc. | 1,512,620 | 199,590 |
| PPG Industries Inc. | 989,864 | 196,349 |
| Nucor Corp. | 2,275,072 | 114,254 |
| Sigma-Aldrich Corp. | 853,708 | 85,729 |
| International Flavors & | | |
| Fragrances Inc. | 580,833 | 58,658 |
| Airgas Inc. | 528,481 | 56,505 |
| RPM International Inc. | 951,520 | 42,038 |
| Albemarle Corp. | 568,216 | 34,854 |
| Royal Gold Inc. | 460,483 | 34,799 |
| HB Fuller Co. | 357,514 | 15,963 |
| Stepan Co. | 159,756 | 7,688 |
| | | 1,348,920 |
| Consumer Goods (18.5%) | | |
| Coca-Cola Co. | 24,436,602 | 960,114 |
| PepsiCo Inc. | 10,880,148 | 958,541 |
| Monsanto Co. | 3,750,970 | 424,197 |
| Colgate-Palmolive Co. | 6,567,192 | 416,360 |
| NIKE Inc. Class B | 5,056,328 | 389,995 |
| Archer-Daniels-Midland | | |
| Co. | 4,705,065 | 218,315 |
| VF Corp. | 3,147,031 | 192,819 |
| Stanley Black & Decker | | |
| Inc. | 1,112,065 | 97,250 |
| Genuine Parts Co. | 1,098,698 | 90,994 |
| Hormel Foods Corp. | 1,884,369 | 85,286 |
| Bunge Ltd. | 1,054,183 | 83,112 |
| Brown-Forman Corp. | | |
| Class B | 920,017 | 79,719 |
| JM Smucker Co. | 740,904 | 73,824 |
| Polaris Industries Inc. | 469,759 | 69,308 |
| Church & Dwight Co. | | |
| Inc. | 980,430 | 62,924 |
| McCormick & Co. Inc. | 850,491 | 55,945 |
| | |
| | | Market |
| | | Value |
| | Shares | ($000) |
| Hasbro Inc. | 935,809 | 46,753 |
| Flowers Foods Inc. | 1,490,666 | 28,457 |
| Nu Skin Enterprises Inc. | | |
| Class A | 425,074 | 24,948 |
| Lancaster Colony Corp. | 194,924 | 17,027 |
| Andersons Inc. | 201,597 | 10,890 |
| Tootsie Roll Industries | | |
| Inc. | 270,839 | 7,131 |
| | | 4,393,909 |
| Consumer Services (14.7%) | | |
| Wal-Mart Stores Inc. | 12,496,425 | 919,487 |
| CVS Caremark Corp. | 8,450,068 | 645,247 |
| Walgreen Co. | 6,790,356 | 466,973 |
| Lowe’s Cos. Inc. | 7,360,807 | 352,215 |
| TJX Cos. Inc. | 5,082,597 | 270,852 |
| Target Corp. | 4,523,206 | 269,538 |
| Cardinal Health Inc. | 2,450,533 | 175,581 |
| Ross Stores Inc. | 1,535,938 | 98,914 |
| Tiffany & Co. | 915,148 | 89,328 |
| Family Dollar Stores Inc. | 813,024 | 60,773 |
| FactSet Research | | |
| Systems Inc. | 305,692 | 36,723 |
| Rollins Inc. | 1,043,858 | 29,552 |
| John Wiley & Sons Inc. | | |
| Class A | 353,607 | 21,248 |
| Casey’s General Stores | | |
| Inc. | 274,857 | 18,187 |
| Cracker Barrel Old | | |
| Country Store Inc. | 170,210 | 16,503 |
| Aaron’s Inc. | 514,093 | 13,562 |
| Matthews International | | |
| Corp. Class A | 195,448 | 8,500 |
| | | 3,493,183 |
| Financials (6.9%) | | |
| Franklin Resources Inc. | 4,508,344 | 244,127 |
| ACE Ltd. | 2,405,773 | 240,818 |
| Aflac Inc. | 3,257,495 | 194,603 |
| McGraw Hill Financial Inc. | 1,936,554 | 155,350 |
| Chubb Corp. | 1,755,009 | 152,177 |
10
Dividend Appreciation Index Fund
| | |
| | | Market |
| | | Value |
| | Shares | ($000) |
| T. Rowe Price Group Inc. | 1,873,977 | 145,533 |
| SEI Investments Co. | 1,210,948 | 43,376 |
| WR Berkley Corp. | 918,359 | 40,968 |
| PartnerRe Ltd. | 369,069 | 38,516 |
| Axis Capital Holdings Ltd. | 800,679 | 34,549 |
| Cullen/Frost Bankers Inc. | 434,133 | 33,849 |
| HCC Insurance Holdings | | |
| Inc. | 713,162 | 33,290 |
| Brown & Brown Inc. | 1,039,173 | 31,986 |
| Commerce Bancshares | | |
| Inc. | 685,717 | 30,898 |
| Eaton Vance Corp. | 866,462 | 30,439 |
| RenaissanceRe Holdings | | |
| Ltd. | 297,724 | 29,120 |
| Prosperity Bancshares Inc. 473,280 | 27,512 |
| StanCorp Financial Group | | |
| Inc. | 312,283 | 18,843 |
| UMB Financial Corp. | 323,088 | 18,297 |
| Bank of the Ozarks Inc. | 527,024 | 16,217 |
| RLI Corp. | 307,007 | 13,122 |
| American Equity | | |
| Investment Life Holding | | |
| Co. | 510,063 | 11,293 |
| Community Bank System | | |
| Inc. | 288,819 | 10,175 |
| Westamerica | | |
| Bancorporation | 188,732 | 9,025 |
| BancFirst Corp. | 109,465 | 6,666 |
| Infinity Property & | | |
| Casualty Corp. | 82,108 | 5,317 |
| 1st Source Corp. | 173,662 | 4,930 |
| Community Trust Bancorp | |
| Inc. | 124,126 | 4,343 |
| Westwood Holdings | | |
| Group Inc. | 59,031 | 3,177 |
| | | 1,628,516 |
| Health Care (10.2%) | | |
| Johnson & Johnson | 10,133,312 | 1,014,243 |
| Abbott Laboratories | 11,027,367 | 464,473 |
| Medtronic Inc. | 7,134,598 | 440,490 |
| Stryker Corp. | 2,700,261 | 215,400 |
| Becton Dickinson and Co. | 1,379,343 | 160,335 |
| CR Bard Inc. | 554,396 | 82,732 |
| West Pharmaceutical | | |
| Services Inc. | 502,423 | 20,474 |
| Owens & Minor Inc. | 450,947 | 14,922 |
| Healthcare Services | | |
| Group Inc. | 501,027 | 13,097 |
| | | 2,426,166 |
| Industrials (23.2%) | | |
| United Technologies | | |
| Corp. | 6,540,685 | 687,753 |
| 3M Co. | 4,735,913 | 667,243 |
| Caterpillar Inc. | 4,558,204 | 459,239 |
| | | |
| | | | Market |
| | | | Value |
| | | Shares | ($000) |
| | FedEx Corp. | 2,231,363 | 327,743 |
| | Emerson Electric Co. | 5,023,888 | 319,770 |
| | General Dynamics Corp. | 2,445,900 | 285,608 |
| | Automatic Data | | |
| | Processing Inc. | 3,443,366 | 279,980 |
| | Illinois Tool Works Inc. | 3,036,334 | 250,103 |
| | Norfolk Southern Corp. | 2,213,258 | 225,000 |
| | Deere & Co. | 2,642,134 | 224,872 |
| | Northrop Grumman Corp. | 1,548,846 | 190,926 |
| | Sherwin-Williams Co. | 716,713 | 147,808 |
| | Parker Hannifin Corp. | 1,065,719 | 122,504 |
| | WW Grainger Inc. | 491,626 | 115,606 |
| | Dover Corp. | 1,214,975 | 104,196 |
| | Roper Industries Inc. | 711,351 | 102,484 |
| | Fastenal Co. | 2,120,982 | 94,066 |
| | Pentair plc | 1,410,501 | 90,371 |
| | CH Robinson Worldwide | | |
| | Inc. | 1,083,507 | 73,093 |
| | Expeditors International | | |
| | of Washington Inc. | 1,447,998 | 62,525 |
| | Cintas Corp. | 856,613 | 53,624 |
| | Valspar Corp. | 610,163 | 45,793 |
| | MDU Resources Group | | |
| | Inc. | 1,353,280 | 42,642 |
| | Donaldson Co. Inc. | 1,038,156 | 40,270 |
| | Lincoln Electric Holdings | | |
| | Inc. | 578,865 | 38,460 |
| | Carlisle Cos. Inc. | 456,224 | 36,507 |
| | Jack Henry & Associates | | |
| | Inc. | 610,813 | 35,641 |
| | Nordson Corp. | 459,806 | 34,564 |
| | Graco Inc. | 434,911 | 32,249 |
| | ITT Corp. | 653,194 | 30,027 |
| | MSC Industrial Direct | | |
| | Co. Inc. Class A | 343,019 | 29,256 |
| | AptarGroup Inc. | 468,306 | 28,613 |
| | Bemis Co. Inc. | 726,710 | 28,349 |
| | Valmont Industries Inc. | 191,665 | 27,912 |
| | AO Smith Corp. | 557,666 | 26,043 |
| | Toro Co. | 406,035 | 24,090 |
| | CLARCOR Inc. | 360,338 | 21,372 |
| | MSA Safety Inc. | 265,815 | 13,764 |
| | Franklin Electric Co. Inc. | 340,784 | 12,490 |
| | ABM Industries Inc. | 398,663 | 9,811 |
| | Tennant Co. | 132,020 | 9,631 |
| | Brady Corp. Class A | 348,813 | 9,121 |
| ^ | Lindsay Corp. | 92,280 | 7,470 |
| | Raven Industries Inc. | 259,782 | 7,240 |
| | McGrath RentCorp | 184,177 | 6,363 |
| | Gorman-Rupp Co. | 187,238 | 5,426 |
| | Badger Meter Inc. | 102,812 | 5,130 |
| | Cass Information | | |
| | Systems Inc. | 82,384 | 3,718 |
| | Mesa Laboratories Inc. | 24,618 | 1,883 |
| | | | 5,498,349 |
11
Dividend Appreciation Index Fund
| | |
| | | Market |
| | | Value |
| | Shares | ($000) |
| Oil & Gas (9.2%) | | |
| Exxon Mobil Corp. | 9,696,505 | 959,372 |
| Occidental Petroleum | | |
| Corp. | 5,688,568 | 555,830 |
| EOG Resources Inc. | 3,903,630 | 427,213 |
| Helmerich & Payne Inc. | 768,397 | 81,650 |
| Murphy Oil Corp. | 1,309,203 | 81,341 |
| Energen Corp. | 519,379 | 42,397 |
| CARBO Ceramics Inc. | 165,086 | 20,560 |
| | | 2,168,363 |
| Technology (10.4%) | | |
| International Business | | |
| Machines Corp. | 5,041,257 | 966,258 |
| QUALCOMM Inc. | 12,085,131 | 890,674 |
| Texas Instruments Inc. | 7,748,206 | 358,354 |
| Analog Devices Inc. | 2,233,327 | 110,840 |
| Linear Technology Corp. | 1,686,068 | 74,415 |
| Harris Corp. | 763,269 | 52,108 |
| | | 2,452,649 |
| Telecommunications (0.1%) | | |
| Telephone & Data | | |
| Systems Inc. | 725,657 | 18,142 |
| Atlantic Tele-Network Inc. | 112,464 | 6,580 |
| | | 24,722 |
| Utilities (1.0%) | | |
| ONEOK Inc. | 1,485,157 | 95,689 |
| National Fuel Gas Co. | 598,590 | 41,249 |
| UGI Corp. | 819,942 | 39,800 |
| Aqua America Inc. | 1,262,854 | 30,031 |
| MGE Energy Inc. | 247,822 | 9,323 |
| American States Water | | |
| Co. | 276,963 | 8,461 |
| California Water Service | | |
| Group | 341,254 | 7,770 |
| Chesapeake Utilities Corp. | 68,834 | 4,480 |
| Connecticut Water | | |
| Service Inc. | 78,837 | 2,514 |
| | | 239,317 |
| Total Common Stocks | | |
| (Cost $18,929,749) | | 23,674,094 |
| Temporary Cash Investments (0.1%)1 | |
| Money Market Fund (0.1%) | | |
| 2,3 Vanguard Market | | |
| Liquidity Fund, 0.118% | 19,899,850 | 19,900 |
| | | |
| | | Face | Market |
| | | Amount | Value |
| | | ($000) | ($000) |
| U.S. Government and Agency Obligations (0.0%) |
| 4,5 | Federal Home Loan | | |
| | Bank Discount Notes, | | |
| | 0.080%, 9/24/14 | 500 | 500 |
| |
| 5,6 | Freddie Mac Discount | | |
| | Notes, 0.065%, 9/10/14 | 800 | 800 |
| | | | 1,300 |
| Total Temporary Cash Investments | |
| (Cost $21,200) | | 21,200 |
| Total Investments (100.0%) | | |
| (Cost $18,950,949) | | 23,695,294 |
| Other Assets and Liabilities (0.0%) | |
| Other Assets | | 31,860 |
| Liabilities3 | | (33,652) |
| | | | (1,792) |
| Net Assets (100%) | | 23,693,502 |
| |
| At July 31, 2014, net assets consisted of: |
| | Amount |
| | ($000) |
| Paid-in Capital | 19,156,835 |
| Undistributed Net Investment Income | 26,717 |
| Accumulated Net Realized Losses | (234,286) |
| Unrealized Appreciation (Depreciation) | |
| Investment Securities | 4,744,345 |
| Futures Contracts | (109) |
| Net Assets | 23,693,502 |
| |
| |
| Investor Shares—Net Assets | |
| Applicable to 52,285,053 outstanding | |
| $.001 par value shares of beneficial | |
| interest (unlimited authorization) | 1,576,937 |
| Net Asset Value Per Share— | |
| Investor Shares | $30.16 |
| |
| |
| Admiral Shares—Net Assets | |
| Applicable to 120,331,624 outstanding | |
| $.001 par value shares of beneficial | |
| interest (unlimited authorization) | 2,461,825 |
| Net Asset Value Per Share— | |
| Admiral Shares | $20.46 |
12
Dividend Appreciation Index Fund
| |
| | Market |
| | Value |
| | ($000) |
| ETF Shares—Net Assets | |
| Applicable to 260,705,556 outstanding | |
| $.001 par value shares of beneficial | |
| interest (unlimited authorization) | 19,654,740 |
| Net Asset Value Per Share— | |
| ETF Shares | $75.39 |
• See Note A in Notes to Financial Statements.
^ Includes partial security positions on loan to broker-dealers. The total value of securities on loan is $291,000.
1 The fund invests a portion of its cash reserves in equity markets through the use of index futures contracts. After giving effect to futures investments, the fund's effective common stock and temporary cash investment positions represent 100.0% and 0.0%, respectively, of net assets.
2 Affiliated money market fund available only to Vanguard funds and certain trusts and accounts managed by Vanguard. Rate shown is the 7-day yield.
3 Includes $7302,000 of collateral received for securities on loan.
4 The issuer operates under a congressional charter; its securities are generally neither guaranteed by the U.S. Treasury nor backed by the full faith and credit of the U.S. governement.
5 Securities with a value of $1,000,000 have been segregated as initial margin for open futures contracts.
6 The issuer was place under federal conservatorship in September 2008; since that time, its daily operation have been managed by the Federal Housing Finance Agency and it receives captial from the U.S. Treasury, as needed to maintain a positive net worth, in exchange for senior preferred stock.
See accompanying Notes, which are an integral part of the Financial Statements.
13
Dividend Appreciation Index Fund
Statement of Operations
| |
| | Six Months Ended |
| | July 31, 2014 |
| | ($000) |
| Investment Income | |
| Income | |
| Dividends | 247,314 |
| Interest1 | 7 |
| Securities Lending | 60 |
| Total Income | 247,381 |
| Expenses | |
| The Vanguard Group—Note B | |
| Investment Advisory Services | 1,048 |
| Management and Administrative—Investor Shares | 1,753 |
| Management and Administrative—Admiral Shares | 718 |
| Management and Administrative—ETF Shares | 6,198 |
| Marketing and Distribution—Investor Shares | 361 |
| Marketing and Distribution—Admiral Shares | 66 |
| Marketing and Distribution—ETF Shares | 2,230 |
| Custodian Fees | 97 |
| Shareholders’ Reports—Investor Shares | 22 |
| Shareholders’ Reports—Admiral Shares | 5 |
| Shareholders’ Reports—ETF Shares | 224 |
| Trustees’ Fees and Expenses | 9 |
| Total Expenses | 12,731 |
| Net Investment Income | 234,650 |
| Realized Net Gain (Loss) | |
| Investment Securities Sold | 949,622 |
| Futures Contracts | 742 |
| Realized Net Gain (Loss) | 950,364 |
| Change in Unrealized Appreciation (Depreciation) | |
| Investment Securities | 187,520 |
| Futures Contracts | (43) |
| Change in Unrealized Appreciation (Depreciation) | 187,477 |
| Net Increase (Decrease) in Net Assets Resulting from Operations | 1,372,491 |
| 1 Interest income from an affiliated company of the fund was $7,000. |
See accompanying Notes, which are an integral part of the Financial Statements.
14
Dividend Appreciation Index Fund
Statement of Changes in Net Assets
| | |
| | Six Months Ended | Year Ended |
| | July 31, | January 31, |
| | 2014 | 2014 |
| | ($000) | ($000) |
| Increase (Decrease) in Net Assets | | |
| Operations | | |
| Net Investment Income | 234,650 | 414,487 |
| Realized Net Gain (Loss) | 950,364 | 242,192 |
| Change in Unrealized Appreciation (Depreciation) | 187,477 | 2,075,258 |
| Net Increase (Decrease) in Net Assets Resulting from Operations | 1,372,491 | 2,731,937 |
| Distributions | | |
| Net Investment Income | | |
| Investor Shares | (19,533) | (65,045) |
| Admiral Shares | (18,301) | — |
| ETF Shares | (188,830) | (337,724) |
| Realized Capital Gain | | |
| Investor Shares | — | — |
| Admiral Shares | — | — |
| ETF Shares | — | — |
| Total Distributions | (226,664) | (402,769) |
| Capital Share Transactions | | |
| Investor Shares | (1,552,902) | (265,587) |
| Admiral Shares | 1,659,385 | 789,364 |
| ETF Shares | 204,076 | 3,461,648 |
| Net Increase (Decrease) from Capital Share Transactions | 310,559 | 3,985,425 |
| Total Increase (Decrease) | 1,456,386 | 6,314,593 |
| Net Assets | | |
| Beginning of Period | 22,237,116 | 15,922,523 |
| End of Period1 | 23,693,502 | 22,237,116 |
1 Net Assets—End of Period includes undistributed net investment income of $26,717,000 and $18,731,000.See accompanying Notes, which are an integral part of the Financial Statements.
15
Dividend Appreciation Index Fund
Financial Highlights
| | | | | | |
| Investor Shares | | | | | | |
| Six Months | | | | | |
| | Ended | | | | | |
| For a Share Outstanding | July 31, | Year Ended January 31, |
| Throughout Each Period | 2014 | 2014 | 2013 | 2012 | 2011 | 2010 |
| Net Asset Value, Beginning of Period | $28.59 | $25.23 | $22.42 | $21.33 | $18.33 | $14.79 |
| Investment Operations | | | | | | |
| Net Investment Income | .288 | .540 | .538 | .445 | .392 | .369 |
| Net Realized and Unrealized Gain (Loss) | | | | | | |
| on Investments | 1.560 | 3.350 | 2.812 | 1.089 | 3.006 | 3.543 |
| Total from Investment Operations | 1.848 | 3.890 | 3.350 | 1.534 | 3.398 | 3.912 |
| Distributions | | | | | | |
| Dividends from Net Investment Income | (. 278) | (. 530) | (. 540) | (. 444) | (. 398) | (. 372) |
| Distributions from Realized Capital Gains | — | — | — | — | — | — |
| Total Distributions | (. 278) | (. 530) | (. 540) | (. 444) | (. 398) | (. 372) |
| Net Asset Value, End of Period | $30.16 | $28.59 | $25.23 | $22.42 | $21.33 | $18.33 |
| |
| Total Return1 | 6.45% | 15.51% | 15.15% | 7.34% | 18.75% | 26.80% |
| |
| Ratios/Supplemental Data | | | | | | |
| Net Assets, End of Period (Millions) | $1,577 | $2,966 | $2,804 | $2,206 | $1,421 | $613 |
| Ratio of Total Expenses to | | | | | | |
| Average Net Assets | 0.20% | 0.20% | 0.20% | 0.25% | 0.30% | 0.35% |
| Ratio of Net Investment Income to | | | | | | |
| Average Net Assets | 1.93% | 1.98% | 2.32% | 2.14% | 2.13% | 2.24% |
| Portfolio Turnover Rate 2 | 24% | 3% | 15% | 14% | 15% | 20% |
The expense ratio, net income ratio, and turnover rate for the current period have been annualized.1 Total returns do not include account service fees that may have applied in the periods shown. Fund prospectuses provide information aboutany applicable account service fees.2 Excludes the value of portfolio securities received or delivered as a result of in-kind purchases or redemptions of the fund’s capital shares,including ETF Creation Units.See accompanying Notes, which are an integral part of the Financial Statements.
16
Dividend Appreciation Index Fund
Financial Highlights
| | |
| Admiral Shares | | |
| | Six Months | Dec. 19, |
| | Ended | 20131 to |
| | July 31, | Jan. 31, |
| For a Share Outstanding Throughout Each Period | 2014 | 2014 |
| Net Asset Value, Beginning of Period | $19.40 | $20.00 |
| Investment Operations | | |
| Net Investment Income | . 206 | . 030 |
| Net Realized and Unrealized Gain (Loss) on Investments | 1.054 | (.630) |
| Total from Investment Operations | 1.260 | (.600) |
| Distributions | | |
| Dividends from Net Investment Income | (.200) | — |
| Distributions from Realized Capital Gains | — | — |
| Total Distributions | (.200) | — |
| Net Asset Value, End of Period | $20.46 | $19.40 |
| |
| Total Return2 | 6.48% | -3.00% |
| |
| Ratios/Supplemental Data | | |
| Net Assets, End of Period (Millions) | $2,462 | $760 |
| Ratio of Total Expenses to Average Net Assets | 0.10% | 0.10%3 |
| Ratio of Net Investment Income to Average Net Assets | 2.03% | 2.08%3 |
| Portfolio Turnover Rate 4 | 24% | 3% |
The expense ratio, net income ratio, and turnover rate for the current period have been annualized.1 Inception.2 Total returns do not include account service fees that may have applied in the periods shown. Fund prospectuses provide information aboutapplicable account service fees.3 Annualized.4 Excludes the value of portfolio securities received or delivered as a result of in-kind purchases or redemptions of the fund’s capital shares,including ETF Creation Units.See accompanying Notes, which are an integral part of the Financial Statements.
17
Dividend Appreciation Index Fund
Financial Highlights
| | | | | | |
| ETF Shares | | | | | | |
| Six Months | | | | | |
| | Ended | | | | | |
| For a Share Outstanding | July 31, | Year Ended January 31, |
| Throughout Each Period | 2014 | 2014 | 2013 | 2012 | 2011 | 2010 |
| Net Asset Value, Beginning of Period | $71.47 | $63.08 | $56.04 | $53.32 | $45.81 | $36.96 |
| Investment Operations | | | | | | |
| Net Investment Income | .761 | 1.421 | 1.401 | 1.173 | 1.034 | .973 |
| Net Realized and Unrealized Gain (Loss) | | | | | | |
| on Investments | 3.896 | 8.357 | 7.049 | 2.719 | 7.524 | 8.856 |
| Total from Investment Operations | 4.657 | 9.778 | 8.450 | 3.892 | 8.558 | 9.829 |
| Distributions | | | | | | |
| Dividends from Net Investment Income | (.737) | (1.388) | (1.410) | (1.172) | (1.048) | (.979) |
| Distributions from Realized Capital Gains — | — | — | — | — | — |
| Total Distributions | (.737) | (1.388) | (1.410) | (1.172) | (1.048) | (.979) |
| Net Asset Value, End of Period | $75.39 | $71.47 | $63.08 | $56.04 | $53.32 | $45.81 |
| |
| Total Return | 6.51% | 15.60% | 15.29% | 7.46% | 18.91% | 26.95% |
| |
| Ratios/Supplemental Data | | | | | | |
| Net Assets, End of Period (Millions) | $19,655 | $18,511 | $13,119 | $9,677 | $4,985 | $1,918 |
| Ratio of Total Expenses to | | | | | | |
| Average Net Assets | 0.10% | 0.10% | 0.10% | 0.13% | 0.18% | 0.23% |
| Ratio of Net Investment Income to | | | | | | |
| Average Net Assets | 2.03% | 2.08% | 2.42% | 2.26% | 2.25% | 2.36% |
| Portfolio Turnover Rate1 | 24% | 3% | 15% | 14% | 15% | 20% |
The expense ratio, net income ratio, and turnover rate for the current period have been annualized.1 Excludes the value of portfolio securities received or delivered as a result of in-kind purchases or redemptions of the fund’s capital shares,including ETF Creation Units.See accompanying Notes, which are an integral part of the Financial Statements.
18
Dividend Appreciation Index Fund
Notes to Financial Statements
Vanguard Dividend Appreciation Index Fund is registered under the Investment Company Act of 1940 as an open-end investment company, or mutual fund. The fund offers three classes of shares: Investor Shares, Admiral Shares, and ETF Shares. Investor Shares are available to any investor who meets the fund’s minimum purchase requirements. Admiral Shares are designed for investors who meet certain administrative, service, and account-size criteria. ETF Shares are listed for trading on NYSE Arca; they can be purchased and sold through a broker.
A. The following significant accounting policies conform to generally accepted accounting principles for U.S. investment companies. The fund consistently follows such policies in preparing its financial statements.
1. Security Valuation: Securities are valued as of the close of trading on the New York Stock Exchange (generally 4 p.m., Eastern time) on the valuation date. Equity securities are valued at the latest quoted sales prices or official closing prices taken from the primary market in which each security trades; such securities not traded on the valuation date are valued at the mean of the latest quoted bid and asked prices. Securities for which market quotations are not readily available, or whose values have been materially affected by events occurring before the fund’s pricing time but after the close of the securities’ primary markets, are valued by methods deemed by the board of trustees to represent fair value. Investments in Vanguard Market Liquidity Fund are valued at that fund’s net asset value. Temporary cash investments acquired over 60 days to maturity are valued using the latest bid prices or using valuations based on a matrix system (which considers such factors as security prices, yields, maturities, and ratings), both as furnished by independent pricing services. Other temporary cash investments are valued at amortized cost, which approximates market value.
2. Futures Contracts: The fund uses index futures contracts to a limited extent, with the objectives of maintaining full exposure to the stock market, enhancing returns, maintaining liquidity, and minimizing transaction costs. The fund may purchase futures contracts to immediately invest incoming cash in the market, or sell futures in response to cash outflows, thereby simulating a fully invested position in the underlying index while maintaining a cash balance for liquidity. The fund may seek to enhance returns by using futures contracts instead of the underlying securities when futures are believed to be priced more attractively than the underlying securities. The primary risks associated with the use of futures contracts are imperfect correlation between changes in market values of stocks held by the fund and the prices of futures contracts, and the possibility of an illiquid market. Counterparty risk involving futures is mitigated because a regulated clearinghouse is the counterparty instead of the clearing broker. To further mitigate counterparty risk, the fund trades futures contracts on an exchange, monitors the financial strength of its clearing brokers and clearinghouse, and has entered into clearing agreements with its clearing brokers. The clearinghouse imposes initial margin requirements to secure the fund’s performance and requires daily settlement of variation margin representing changes in the market value of each contract.
Futures contracts are valued at their quoted daily settlement prices. The aggregate notional amounts of the contracts are not recorded in the Statement of Net Assets. Fluctuations in the value of the contracts are recorded in the Statement of Net Assets as an asset (liability) and in the Statement of Operations as unrealized appreciation (depreciation) until the contracts are closed, when they are recorded as realized futures gains (losses).
During the six months ended July 31, 2014, the fund’s average investments in long and short futures contracts represented less than 1% and 0% of net assets, respectively, based on the average of aggregate settlement values at each quarter-end during the period.
19
Dividend Appreciation Index Fund
3. Federal Income Taxes: The fund intends to continue to qualify as a regulated investment company and distribute all of its taxable income. Management has analyzed the fund’s tax positions taken for all open federal income tax years (January 31, 2011–2014), and for the period ended July 31, 2014, and has concluded that no provision for federal income tax is required in the fund’s financial statements.
4. Distributions: Distributions to shareholders are recorded on the ex-dividend date.
5. Securities Lending: To earn additional income, the fund lends its securities to qualified institutional borrowers. Security loans are required to be secured at all times by collateral in an amount at least equal to the market value of securities loaned. Daily market fluctuations could cause the value of loaned securities to be more or less than the value of the collateral received. When this occurs, the collateral is adjusted and settled on the next business day. The fund further mitigates its counterparty risk by entering into securities lending transactions only with a diverse group of prequalified counter-parties, monitoring their financial strength, and entering into master securities lending agreements with its counterparties. The master securities lending agreements provide that, in the event of a counterparty’s default (including bankruptcy), the fund may terminate any loans with that borrower, determine the net amount owed, and sell or retain the collateral up to the net amount owed to the fund; however, such actions may be subject to legal proceedings. While collateral mitigates counter-party risk, in the absence of a default the fund may experience delays and costs in recovering the securities loaned. The fund invests cash collateral received in Vanguard Market Liquidity Fund, and records a liability in the Statement of Net Assets for the return of the collateral, during the period the securities are on loan. Securities lending income represents fees charged to borrowers plus income earned on invested cash collateral, less expenses associated with the loan.
6. Credit Facility: The fund and certain other funds managed by The Vanguard Group participate in a $2.89 billion committed credit facility provided by a syndicate of lenders pursuant to a credit agreement that may be renewed annually; each fund is individually liable for its borrowings, if any, under the credit facility. Borrowings may be utilized for temporary and emergency purposes, and are subject to the fund’s regulatory and contractual borrowing restrictions. The participating funds are charged administrative fees and an annual commitment fee of 0.06% of the undrawn amount of the facility; these fees are allocated to the funds based on a method approved by the fund’s board of trustees and included in Management and Administrative expenses on the fund’s Statement of Operations. Any borrowings under this facility bear interest at a rate equal to the higher of the federal funds rate or LIBOR reference rate plus an agreed-upon spread.
The fund had no borrowings outstanding at July 31, 2014, or at any time during the period then ended.
7. Other: Dividend income is recorded on the ex-dividend date. Interest income includes income distributions received from Vanguard Market Liquidity Fund and is accrued daily. Premiums and discounts on debt securities purchased are amortized and accreted, respectively, to interest income over the lives of the respective securities. Security transactions are accounted for on the date securities are bought or sold. Costs used to determine realized gains (losses) on the sale of investment securities are those of the specific securities sold.
Each class of shares has equal rights as to assets and earnings, except that each class separately bears certain class-specific expenses related to maintenance of shareholder accounts (included in Management and Administrative expenses) and shareholder reporting. Marketing and distribution expenses are allocated to each class of shares based on a method approved by the board of trustees. Income, other non-class-specific expenses, and gains and losses on investments are allocated to each class of shares based on its relative net assets.
20
Dividend Appreciation Index Fund
B. The Vanguard Group furnishes at cost investment advisory, corporate management, administrative, marketing, and distribution services. The costs of such services are allocated to the fund based on methods approved by the board of trustees. The fund has committed to provide up to 0.40% of its net assets in capital contributions to Vanguard. At July 31, 2014, the fund had contributed capital of $2,471,000 to Vanguard (included in Other Assets), representing 0.01% of the fund’s net assets and 0.99% of Vanguard’s capitalization. The fund’s trustees and officers are also directors and officers of Vanguard.
C. Various inputs may be used to determine the value of the fund’s investments. These inputs are summarized in three broad levels for financial statement purposes. The inputs or methodologies used to value securities are not necessarily an indication of the risk associated with investing in those securities.
Level 1—Quoted prices in active markets for identical securities.
Level 2—Other significant observable inputs (including quoted prices for similar securities, interest rates, prepayment speeds, credit risk, etc.).
Level 3—Significant unobservable inputs (including the fund’s own assumptions used to determine the fair value of investments).
The following table summarizes the market value of the fund’s investments as of July 31, 2014, based on the inputs used to value them:
| | | |
| | Level 1 | Level 2 | Level 3 |
| Investments | ($000) | ($000) | ($000) |
| Common Stocks | 23,674,094 | — | — |
| Temporary Cash Investments | 19,900 | 1,300 | — |
| Futures Contracts—Liabilities1 | (415) | — | — |
| Total | 23,693,579 | 1,300 | — |
| 1 Represents variation margin on the last day of the reporting period. |
D. At July 31, 2014, the aggregate settlement value of open futures contracts and the related unrealized appreciation (depreciation) were:
| | | | |
| | | | ($000) |
| | | | Aggregate | |
| | | Number of | Settlement | Unrealized |
| | | Long (Short) | Value | Appreciation |
| Futures Contracts | Expiration | Contracts | Long (Short) | (Depreciation) |
| S&P 500 Index | September 2014 | 32 | 15,398 | (24) |
| E-mini S&P 500 Index | September 2014 | 46 | 4,427 | (85) |
| | | | | (109) |
Unrealized appreciation (depreciation) on open futures contracts is required to be treated as realized gain (loss) for tax purposes.
21
Dividend Appreciation Index Fund
E. Distributions are determined on a tax basis and may differ from net investment income and realized capital gains for financial reporting purposes. Differences may be permanent or temporary. Permanent differences are reclassified among capital accounts in the financial statements to reflect their tax character. Temporary differences arise when certain items of income, expense, gain, or loss are recognized in different periods for financial statement and tax purposes. These differences will reverse at some time in the future. Differences in classification may also result from the treatment of short-term gains as ordinary income for tax purposes.
During the six months ended July 31, 2014, the fund realized $953,236,000 of net capital gains resulting from in-kind redemptions—in which shareholders exchanged fund shares for securities held by the fund rather than for cash. Because such gains are not taxable to the fund, and are not distributed to shareholders, they have been reclassified from accumulated net realized losses to paid-in capital.
The fund’s tax-basis capital gains and losses are determined only at the end of each fiscal year. For tax purposes, at January 31, 2014, the fund had available capital losses totaling $231,480,000 to offset future net capital gains. Of this amount, $191,649,000 is subject to expiration dates; $609,000 may be used to offset future net capital gains through January 31, 2016, $22,242,000 through January 31, 2017, $146,149,000 through January 31, 2018, and $22,649,000 through January 31, 2019. Capital losses of $39,831,000 realized beginning in fiscal 2012 may be carried forward indefinitely under the Regulated Investment Company Modernization Act of 2010, but must be used before any expiring loss carryforwards. The fund will use these capital losses to offset net taxable capital gains, if any, realized during the year ending January 31, 2015; should the fund realize net capital losses for the year, the losses will be added to the loss carryforward balance above.
At July 31, 2014, the cost of investment securities for tax purposes was $18,950,949,000. Net unrealized appreciation of investment securities for tax purposes was $4,744,345,000, consisting of unrealized gains of $4,857,675,000 on securities that had risen in value since their purchase and $113,330,000 in unrealized losses on securities that had fallen in value since their purchase.
F. During the six months ended July 31, 2014, the fund purchased $8,670,288,000 of investment securities and sold $8,367,775,000 of investment securities, other than temporary cash investments. Purchases and sales include $4,009,974,000 and $3,882,510,000, respectively, in connection with in-kind purchases and redemptions of the fund’s capital shares.
22
Dividend Appreciation Index Fund
| | | | |
| G. Capital share transactions for each class of shares were: | | | |
| | Six Months Ended | | Year Ended |
| | July 31, 2014 | January 31, 2014 |
| | Amount | Shares | Amount | Shares |
| | ($000) | (000) | ($000) | (000) |
| Investor Shares | | | | |
| Issued | 154,822 | 5,133 | 1,116,394 | 40,789 |
| Issued in Lieu of Cash Distributions | 15,311 | 503 | 53,392 | 1,935 |
| Redeemed | (1,723,035) | (57,078) | (1,435,373) | (50,108) |
| Net Increase (Decrease)—Investor Shares | (1,552,902) | (51,442) | (265,587) | (7,384) |
| Admiral Shares1 | | | | |
| Issued | 1,794,781 | 87,684 | 808,063 | 40,135 |
| Issued in Lieu of Cash Distributions | 16,514 | 790 | — | — |
| Redeemed | (151,910) | (7,343) | (18,699) | (935) |
| Net Increase (Decrease)—Admiral Shares | 1,659,385 | 81,131 | 789,364 | 39,200 |
| ETF Shares | | | | |
| Issued | 4,129,306 | 54,503 | 4,104,546 | 60,317 |
| Issued in Lieu of Cash Distributions | — | — | — | — |
| Redeemed | (3,925,230) | (52,800) | (642,898) | (9,300) |
| Net Increase (Decrease)—ETF Shares | 204,076 | 1,703 | 3,461,648 | 51,017 |
| 1 Inception was December 19, 2013, for Admiral Shares. |
H. Management has determined that no material events or transactions occurred subsequent to July 31, 2014, that would require recognition or disclosure in these financial statements.
23
About Your Fund’s Expenses
As a shareholder of the fund, you incur ongoing costs, which include costs for portfolio management, administrative services, and shareholder reports (like this one), among others. Operating expenses, which are deducted from a fund’s gross income, directly reduce the investment return of the fund.
A fund’s expenses are expressed as a percentage of its average net assets. This figure is known as the expense ratio. The following examples are intended to help you understand the ongoing costs (in dollars) of investing in your fund and to compare these costs with those of other mutual funds. The examples are based on an investment of $1,000 made at the beginning of the period shown and held for the entire period.
The accompanying table illustrates your fund’s costs in two ways:
• Based on actual fund return. This section helps you to estimate the actual expenses that you paid over the period. The ”Ending Account Value“ shown is derived from the fund‘s actual return, and the third column shows the dollar amount that would have been paid by an investor who started with $1,000 in the fund. You may use the information here, together with the amount you invested, to estimate the expenses that you paid over the period.
To do so, simply divide your account value by $1,000 (for example, an $8,600 account value divided by $1,000 = 8.6), then multiply the result by the number given for your fund under the heading ”Expenses Paid During Period.“
• Based on hypothetical 5% yearly return. This section is intended to help you compare your fund‘s costs with those of other mutual funds. It assumes that the fund had a yearly return of 5% before expenses, but that the expense ratio is unchanged. In this case—because the return used is not the fund’s actual return—the results do not apply to your investment. The example is useful in making comparisons because the Securities and Exchange Commission requires all mutual funds to calculate expenses based on a 5% return. You can assess your fund’s costs by comparing this hypothetical example with the hypothetical examples that appear in shareholder reports of other funds.
Note that the expenses shown in the table are meant to highlight and help you compare ongoing costs only and do not reflect transaction costs incurred by the fund for buying and selling securities. Further, the expenses do not include any purchase, redemption, or account service fees described in the fund prospectus. If such fees were applied to your account, your costs would be higher. Your fund does not carry a “sales load.”
The calculations assume no shares were bought or sold during the period. Your actual costs may have been higher or lower, depending on the amount of your investment and the timing of any purchases or redemptions.
You can find more information about the fund’s expenses, including annual expense ratios, in the Financial Statements section of this report. For additional information on operating expenses and other shareholder costs, please refer to your fund’s current prospectus.
24
| | | |
| Six Months Ended July 31, 2014 | | | |
| | Beginning | Ending | Expenses |
| | Account Value | Account Value | Paid During |
| Dividend Appreciation Index Fund | 1/31/2014 | 7/31/2014 | Period |
| Based on Actual Fund Return | | | |
| Investor Shares | $1,000.00 | $1,064.51 | $1.02 |
| Admiral Shares | 1,000.00 | 1,064.82 | 0.51 |
| ETF Shares | 1,000.00 | 1,065.06 | 0.51 |
| Based on Hypothetical 5% Yearly Return | | | |
| Investor Shares | $1,000.00 | $1,023.80 | $1.00 |
| Admiral Shares | 1,000.00 | 1,024.30 | 0.50 |
| ETF Shares | 1,000.00 | 1,024.30 | 0.50 |
The calculations are based on expenses incurred in the most recent six-month period. The fund’s annualized six-month expense ratios for thatperiod are 0.20% for Investor Shares, 0.10% for Admiral Shares, and 0.10% for ETF Shares. The dollar amounts shown as “Expenses Paid”are equal to the annualized expense ratio multiplied by the average account value over the period, multiplied by the number of days in themost recent six-month period, then divided by the number of days in the most recent 12-month period.25
Trustees Approve Advisory Arrangement
The board of trustees of Vanguard Dividend Appreciation Index Fund has renewed the fund’s investment advisory arrangement with The Vanguard Group, Inc. (Vanguard). Vanguard’s Equity Investment Group—through its Equity Index Group—serves as investment advisor for the fund. The board determined that continuing the fund’s internalized management structure was in the best interests of the fund and its shareholders.
The board based its decision upon an evaluation of the advisor’s investment staff, portfolio management process, and performance. The trustees considered the factors discussed below, among others. However, no single factor determined whether the board approved the arrangement. Rather, it was the totality of the circumstances that drove the board’s decision.
Nature, extent, and quality of services
The board considered the quality of the fund’s investment management services over both the short and long term, and took into account the organizational depth and stability of the advisor. The board noted that Vanguard has been managing investments for more than three decades. The Equity Index Group adheres to a sound, disciplined investment management process; the team has considerable experience, stability, and depth.
The board concluded that Vanguard’s experience, stability, depth, and performance, among other factors, warranted continuation of the advisory arrangement.
Investment performance
The board considered the short- and long-term performance of the fund, including any periods of outperformance or underperformance relative to a target index and peer group. The board concluded that the performance was such that the advisory arrangement should continue. Information about the fund’s most recent performance can be found in the Performance Summary section of this report.
Cost
The board concluded that the fund’s expense ratio was well below the average expense ratio charged by funds in its peer group and that the fund’s advisory fee rate was also well below its peer-group average. Information about the fund’s expenses appears in the About Your Fund’s Expenses section of this report as well as in the Financial Statements section.
The board does not conduct a profitability analysis of Vanguard, because of Vanguard’s unique “at-cost” structure. Unlike most other mutual fund management companies, Vanguard is owned by the funds it oversees, and produces “profits” only in the form of reduced expenses for fund shareholders.
The benefit of economies of scale
The board concluded that the fund’s at-cost arrangement with Vanguard ensures that the fund will realize economies of scale as it grows, with the cost to shareholders declining as the fund’s assets increase.
The board will consider whether to renew the advisory arrangement again after a one-year period.
26
Glossary
30-Day SEC Yield. A fund’s 30-day SEC yield is derived using a formula specified by the U.S. Securities and Exchange Commission. Under the formula, data related to the fund’s security holdings in the previous 30 days are used to calculate the fund’s hypothetical net income for that period, which is then annualized and divided by the fund’s estimated average net assets over the calculation period. For the purposes of this calculation, a security’s income is based on its current market yield to maturity (for bonds), its actual income (for asset-backed securities), or its projected dividend yield (for stocks). Because the SEC yield represents hypothetical annualized income, it will differ—at times significantly—from the fund’s actual experience. As a result, the fund’s income distributions may be higher or lower than implied by the SEC yield.
Beta. A measure of the magnitude of a fund’s past share-price fluctuations in relation to the ups and downs of a given market index. The index is assigned a beta of 1.00. Compared with a given index, a fund with a beta of 1.20 typically would have seen its share price rise or fall by 12% when the index rose or fell by 10%. For this report, beta is based on returns over the past 36 months for both the fund and the index. Note that a fund’s beta should be reviewed in conjunction with its R-squared (see definition). The lower the R-squared, the less correlation there is between the fund and the index, and the less reliable beta is as an indicator of volatility.
Dividend Yield. Dividend income earned by stocks, expressed as a percentage of the aggregate market value (or of net asset value, for a fund). The yield is determined by dividing the amount of the annual dividends by the aggregate value (or net asset value) at the end of the period. For a fund, the dividend yield is based solely on stock holdings and does not include any income produced by other investments.
Earnings Growth Rate. The average annual rate of growth in earnings over the past five years for the stocks now in a fund.
Equity Exposure. A measure that reflects a fund’s investments in stocks and stock futures. Any holdings in short-term reserves are excluded.
Expense Ratio. A fund’s total annual operating expenses expressed as a percentage of the fund’s average net assets. The expense ratio includes management and administrative expenses, but does not include the transaction costs of buying and selling portfolio securities.
Foreign Holdings. The percentage of a fund represented by securities or depositary receipts of companies based outside the United States.
Inception Date. The date on which the assets of a fund (or one of its share classes) are first invested in accordance with the fund’s investment objective. For funds with a subscription period, the inception date is the day after that period ends. Investment performance is measured from the inception date.
Median Market Cap. An indicator of the size of companies in which a fund invests; the midpoint of market capitalization (market price x shares outstanding) of a fund’s stocks, weighted by the proportion of the fund’s assets invested in each stock. Stocks representing half of the fund’s assets have market capitalizations above the median, and the rest are below it.
Price/Book Ratio. The share price of a stock divided by its net worth, or book value, per share. For a fund, the weighted average price/book ratio of the stocks it holds.
27
Price/Earnings Ratio. The ratio of a stock’s current price to its per-share earnings over the past year. For a fund, the weighted average P/E of the stocks it holds. P/E is an indicator of market expectations about corporate prospects; the higher the P/E, the greater the expectations for a company’s future growth.
R-Squared. A measure of how much of a fund’s past returns can be explained by the returns from the market in general, as measured by a given index. If a fund’s total returns were precisely synchronized with an index’s returns, its R-squared would be 1.00. If the fund’s returns bore no relationship to the index’s returns, its R-squared would be 0. For this report, R-squared is based on returns over the past 36 months for both the fund and the index.
Return on Equity. The annual average rate of return generated by a company during the past five years for each dollar of shareholder’s equity (net income divided by shareholder’s equity). For a fund, the weighted average return on equity for the companies whose stocks it holds.
Short-Term Reserves. The percentage of a fund invested in highly liquid, short-term securities that can be readily converted to cash.
Turnover Rate. An indication of the fund’s trading activity. Funds with high turnover rates incur higher transaction costs and may be more likely to distribute capital gains (which may be taxable to investors). The turnover rate excludes in-kind transactions, which have minimal impact on costs.
28
This page intentionally left blank.
This page intentionally left blank.
This page intentionally left blank.
The People Who Govern Your Fund
The trustees of your mutual fund are there to see that the fund is operated and managed in your best interests since, as a shareholder, you are a part owner of the fund. Your fund’s trustees also serve on the board of directors of The Vanguard Group, Inc., which is owned by the Vanguard funds and provides services to them on an at-cost basis.
A majority of Vanguard’s board members are independent, meaning that they have no affiliation with Vanguard or the funds they oversee, apart from the sizable personal investments they have made as private individuals. The independent board members have distinguished backgrounds in business, academia, and public service. Each of the trustees and executive officers oversees 177 Vanguard funds.
The following table provides information for each trustee and executive officer of the fund. More information about the trustees is in the Statement of Additional Information, which can be obtained, without charge, by contacting Vanguard at 800-662-7447, or online at vanguard.com.
| |
| InterestedTrustee1 | and Delphi Automotive LLP (automotive components); |
| | Senior Advisor at New Mountain Capital. |
| F. William McNabb III | |
| Born 1957. Trustee Since July 2009. Chairman of the | Amy Gutmann |
| Board. Principal Occupation(s) During the Past Five | Born 1949. Trustee Since June 2006. Principal |
| Years: Chairman of the Board of The Vanguard Group, | Occupation(s) During the Past Five Years: President of |
| Inc., and of each of the investment companies served | the University of Pennsylvania; Christopher H. Browne |
| by The Vanguard Group, since January 2010; Director | Distinguished Professor of Political Science, School of |
| of The Vanguard Group since 2008; Chief Executive | Arts and Sciences, and Professor of Communication, |
| Officer and President of The Vanguard Group, and of | Annenberg School for Communication, with secondary |
| each of the investment companies served by The | faculty appointments in the Department of Philosophy, |
| Vanguard Group, since 2008; Director of Vanguard | School of Arts and Sciences, and at the Graduate |
| Marketing Corporation; Managing Director of The | School of Education, University of Pennsylvania; |
| Vanguard Group (1995–2008). | Trustee of the National Constitution Center; Chair |
| | of the Presidential Commission for the Study of |
| | Bioethical Issues. |
| IndependentTrustees | |
| | JoAnn Heffernan Heisen |
| Emerson U. Fullwood | Born 1950. Trustee Since July 1998. Principal |
| Born 1948. Trustee Since January 2008. Principal | Occupation(s) During the Past Five Years: Corporate |
| Occupation(s) During the Past Five Years: Executive | Vice President and Chief Global Diversity Officer |
| Chief Staff and Marketing Officer for North America | (retired 2008) and Member of the Executive |
| and Corporate Vice President (retired 2008) of Xerox | Committee (1997–2008) of Johnson & Johnson |
| Corporation (document management products and | (pharmaceuticals/medical devices/consumer |
| services); Executive in Residence and 2009–2010 | products); Director of Skytop Lodge Corporation |
| Distinguished Minett Professor at the Rochester | (hotels), the University Medical Center at Princeton, |
| Institute of Technology; Director of SPX Corporation | the Robert Wood Johnson Foundation, and the Center |
| (multi-industry manufacturing), the United Way of | for Talent Innovation; Member of the Advisory Board |
| Rochester, Amerigroup Corporation (managed health | of the Maxwell School of Citizenship and Public Affairs |
| care), the University of Rochester Medical Center, | at Syracuse University. |
| Monroe Community College Foundation, and North | |
| Carolina A&T University. | F. Joseph Loughrey |
| | Born 1949. Trustee Since October 2009. Principal |
| Rajiv L. Gupta | Occupation(s) During the Past Five Years: President |
| Born 1945. Trustee Since December 2001.2 | and Chief Operating Officer (retired 2009) of Cummins |
| Principal Occupation(s) During the Past Five Years: | Inc. (industrial machinery); Chairman of the Board |
| Chairman and Chief Executive Officer (retired 2009) | of Hillenbrand, Inc. (specialized consumer services), |
| and President (2006–2008) of Rohm and Haas Co. | and of Oxfam America; Director of SKF AB (industrial |
| (chemicals); Director of Tyco International, Ltd. | machinery), Hyster-Yale Materials Handling, Inc. |
| (diversified manufacturing and services), Hewlett- | (forklift trucks), the Lumina Foundation for Education, |
| Packard Co. (electronic computer manufacturing), | |
| | |
| and the V Foundation for Cancer Research; Member | Executive Officers | |
| of the Advisory Council for the College of Arts and | | |
| Letters and of the Advisory Board to the Kellogg | Glenn Booraem | |
| Institute for International Studies, both at the | Born 1967. Controller Since July 2010. Principal |
| University of Notre Dame. | Occupation(s) During the Past Five Years: Principal |
| | of The Vanguard Group, Inc.; Controller of each of |
| Mark Loughridge | the investment companies served by The Vanguard |
| Born 1953. Trustee Since March 2012. Principal | Group; Assistant Controller of each of the investment |
| Occupation(s) During the Past Five Years: Senior Vice | companies served by The Vanguard Group (2001–2010). |
| President and Chief Financial Officer (retired 2013) | | |
| at IBM (information technology services); Fiduciary | Thomas J. Higgins | |
| Member of IBM’s Retirement Plan Committee (2004– | Born 1957. Chief Financial Officer Since September |
| 2013); Member of the Council on Chicago Booth. | 2008. Principal Occupation(s) During the Past Five |
| | Years: Principal of The Vanguard Group, Inc.; Chief |
| Scott C. Malpass | Financial Officer of each of the investment companies |
| Born 1962. Trustee Since March 2012. Principal | served by The Vanguard Group; Treasurer of each of |
| Occupation(s) During the Past Five Years: Chief | the investment companies served by The Vanguard |
| Investment Officer and Vice President at the University | Group (1998–2008). | |
| of Notre Dame; Assistant Professor of Finance at the | | |
| Mendoza College of Business at Notre Dame; Member | Kathryn J. Hyatt | |
| of the Notre Dame 403(b) Investment Committee; | Born 1955. Treasurer Since November 2008. Principal |
| Board Member of TIFF Advisory Services, Inc. | Occupation(s) During the Past Five Years: Principal of |
| (investment advisor); Member of the Investment | The Vanguard Group, Inc.; Treasurer of each of the |
| Advisory Committees of the Financial Industry | investment companies served by The Vanguard |
| Regulatory Authority (FINRA) and of Major League | Group; Assistant Treasurer of each of the investment |
| Baseball. | companies served by The Vanguard Group (1988–2008). |
| |
| André F. Perold | Heidi Stam | |
| Born 1952. Trustee Since December 2004. Principal | Born 1956. Secretary Since July 2005. Principal |
| Occupation(s) During the Past Five Years: George | Occupation(s) During the Past Five Years: Managing |
| Gund Professor of Finance and Banking, Emeritus | Director of The Vanguard Group, Inc.; General Counsel |
| at the Harvard Business School (retired 2011); | of The Vanguard Group; Secretary of The Vanguard |
| Chief Investment Officer and Managing Partner of | Group and of each of the investment companies |
| HighVista Strategies LLC (private investment firm); | served by The Vanguard Group; Director and Senior |
| Director of Rand Merchant Bank; Overseer of the | Vice President of Vanguard Marketing Corporation. |
| Museum of Fine Arts Boston. | | |
| | Vanguard Senior ManagementTeam |
| Alfred M. Rankin, Jr. | | |
| Born 1941. Trustee Since January 1993. Principal | Mortimer J. Buckley | Chris D. McIsaac |
| Occupation(s) During the Past Five Years: Chairman, | Kathleen C. Gubanich | Michael S. Miller |
| President, and Chief Executive Officer of NACCO | Paul A. Heller | James M. Norris |
| Industries, Inc. (housewares/lignite), and of Hyster- | Martha G. King | Glenn W. Reed |
| Yale Materials Handling, Inc. (forklift trucks); Chairman | John T. Marcante | |
| of the Board of University Hospitals of Cleveland. | | |
| |
| Peter F. Volanakis | Chairman Emeritus and Senior Advisor |
| Born 1955. Trustee Since July 2009. Principal | | |
| Occupation(s) During the Past Five Years: President | John J. Brennan | |
| and Chief Operating Officer (retired 2010) of Corning | Chairman, 1996–2009 | |
| Incorporated (communications equipment); Trustee of | Chief Executive Officer and President, 1996–2008 |
| Colby-Sawyer College; Member of the Advisory Board | | |
| of the Norris Cotton Cancer Center and of the Advisory | Founder | |
| Board of the Parthenon Group (strategy consulting). | | |
| | John C. Bogle | |
| | Chairman and Chief Executive Officer, 1974–1996 |
1 Mr. McNabb is considered an “interested person,” as defined in the Investment Company Act of 1940, because he is an officer of the
Vanguard funds.
2 December 2002 for Vanguard Equity Income Fund, the Vanguard Municipal Bond Funds, and the Vanguard State Tax-Exempt Funds.
|  |
| |
| | P.O. Box 2600 |
| | Valley Forge, PA 19482-2600 |
| |
| |
| |
| Connect with Vanguard® > vanguard.com | |
| |
| |
| |
| Fund Information > 800-662-7447 | “Dividend Achievers” is a trademark of The NASDAQ |
| Direct Investor Account Services > 800-662-2739 | OMX Group, Inc. (collectively, with its affiliates |
| | “NASDAQ OMX”), and has been licensed for use by The |
| Institutional Investor Services > 800-523-1036 | Vanguard Group, Inc. Vanguard mutual funds are not |
| Text Telephone for People | sponsored, endorsed, sold, or promoted by NASDAQ |
| With Hearing Impairment > 800-749-7273 | OMX and NASDAQ OMX makes no representation |
| | regarding the advisability of investing in the funds. |
| This material may be used in conjunction | NASDAQ OMX makes no warranties and bears no |
| with the offering of shares of any Vanguard | liability with respect to the Vanguard mutual funds. |
| fund only if preceded or accompanied by | |
| the fund’s current prospectus. | |
| |
| All comparative mutual fund data are from Lipper, a | |
| Thomson Reuters Company, or Morningstar, Inc., unless | |
| otherwise noted. | |
| |
| You can obtain a free copy of Vanguard’s proxy voting | |
| guidelines by visiting vanguard.com/proxyreporting or by | |
| calling Vanguard at 800-662-2739. The guidelines are | |
| also available from the SEC’s website, sec.gov. In | |
| addition, you may obtain a free report on how your fund | |
| voted the proxies for securities it owned during the 12 | |
| months ended June 30. To get the report, visit either | |
| vanguard.com/proxyreporting or sec.gov. | |
| |
| You can review and copy information about your fund at | |
| the SEC’s Public Reference Room in Washington, D.C. To | |
| find out more about this public service, call the SEC at | |
| 202-551-8090. Information about your fund is also | |
| available on the SEC’s website, and you can receive | |
| copies of this information, for a fee, by sending a | |
| request in either of two ways: via e-mail addressed to | |
| publicinfo@sec.gov or via regular mail addressed to the | |
| Public Reference Section, Securities and Exchange | |
| Commission, Washington, DC 20549-1520. | |
| |
| | © 2014 The Vanguard Group, Inc. |
| | All rights reserved. |
| | Vanguard Marketing Corporation, Distributor. |
| |
| | Q6022 092014 |

Semiannual Report | July 31, 2014
Vanguard REIT Index Fund

Vanguard’s Principles for Investing Success
We want to give you the best chance of investment success. These principles, grounded in Vanguard’s research and experience, can put you on the right path.
Goals. Create clear, appropriate investment goals.
Balance. Develop a suitable asset allocation using broadly diversified funds.
Cost. Minimize cost.
Discipline. Maintain perspective and long-term discipline.
A single theme unites these principles: Focus on the things you can control. We believe there is no wiser course for any investor.
| |
| Contents | |
| Your Fund’s Total Returns. | 1 |
| Chairman’s Letter. | 2 |
| Fund Profile. | 6 |
| Performance Summary. | 7 |
| Financial Statements. | 8 |
| About Your Fund’s Expenses. | 27 |
| Trustees Approve Advisory Arrangement. | 29 |
| Glossary. | 30 |
Please note: The opinions expressed in this report are just that—informed opinions. They should not be considered promises or advice.
Also, please keep in mind that the information and opinions cover the period through the date on the front of this report. Of course, the
risks of investing in your fund are spelled out in the prospectus.
See the Glossary for definitions of investment terms used in this report.
About the cover: The ship’s wheel represents leadership and guidance, essential qualities in navigating difficult seas.
This one is a replica based on an 18th-century British vessel. The HMS Vanguard, another ship of that era, served as the
flagship for British Admiral Horatio Nelson when he defeated a French fleet at the Battle of the Nile.
Your Fund’s Total Returns
| |
| Six Months Ended July 31, 2014 | |
| | Total |
| | Returns |
| Vanguard REIT Index Fund | |
| Investor Shares | 12.91% |
| Admiral™ Shares | 13.00 |
| Signal® Shares | 13.03 |
| Institutional Shares | 12.95 |
| ETF Shares | |
| Market Price | 13.08 |
| Net Asset Value | 12.99 |
| MSCI US REIT Index | 12.99 |
| Real Estate Funds Average | 12.47 |
Real Estate Funds Average: Derived from data provided by Lipper, a Thomson Reuters Company.Admiral Shares carry lower expenses and are available to investors who meet certain account-balance requirements. Signal Shares andInstitutional Shares are available to certain institutional investors who meet specific administrative, service, and account-size criteria. TheVanguard ETF® Shares shown are traded on the NYSE Arca exchange and are available only through brokers. The table provides ETF returnsbased on both the NYSE Arca market price and the net asset value for a share. U.S. Pat. Nos. 6,879,964; 7,337,138; 7,720,749; 7,925,573;8,090,646; and 8,417,623.For the ETF Shares, the market price is determined by the midpoint of the bid-offer spread as of the closing time of the New York StockExchange (generally 4 p.m., Eastern time). The net asset value is also determined as of the NYSE closing time. For more information abouthow the ETF Shares' market prices have compared with their net asset value, visit vanguard.com, select your ETF, and then select the Priceand Performance tab. The ETF premium/discount analysis there shows the percentages of days on which the ETF Shares' market price wasabove or below the NAV.Your Fund’s Performance at a Glance
January 31, 2014, Through July 31, 2014
| | | | | |
| | | | Distributions Per Share | |
| | Starting | Ending | Income | Capital | Return of |
| | Share Price | Share Price | Dividends | Gains | Capital |
| Vanguard REIT Index Fund | | | | | |
| Investor Shares | $22.37 | $24.88 | $0.365 | $0.000 | $0.000 |
| Admiral Shares | 95.46 | 106.18 | 1.627 | 0.000 | 0.000 |
| Signal Shares | 25.48 | 28.35 | 0.433 | 0.000 | 0.000 |
| Institutional Shares | 14.78 | 16.43 | 0.254 | 0.000 | 0.000 |
| ETF Shares | 67.36 | 74.92 | 1.148 | 0.000 | 0.000 |
1

Chairman’s Letter
Dear Shareholder,
Real estate investment trusts bounced back strongly from a sluggish 2013, easily outperforming the broad U.S. market as lower interest rates boosted demand for REITs.
For the six months ended July 31, 2014, Vanguard REIT Index Fund returned about 13%. The fund’s performance was in line with its target benchmark, the MSCI US REIT Index, and slightly ahead of the average return of competing real estate funds.
Most areas of the real estate market posted gains, with retail and residential REITs contributing the most to performance.
Stocks posted strong returns despite finishing with a thud
For the six months ended July 31, the broad U.S. stock market returned about 8% despite ending on a negative note. U.S. stocks, which were on the cusp of eking out a sixth straight positive monthly return, tumbled on the period’s final day. Still, generally strong corporate earnings, investors’ willingness to embrace risk, and the Federal Reserve’s resolve to sustain historically low interest rates for an extended time have supported the market.
During the six months, stocks withstood conflict in the Middle East and Ukraine, economic concerns in China and Europe, and the Fed’s gradual reduction of its stimulative bond-buying program.
2
International stocks returned almost 10%. Emerging markets, which notably slumped in 2013, led the charge. Stocks in the developed markets of the Pacific region also managed double-digit returns. European stocks, despite retreating in July, finished on positive ground.
Bonds’ recent rebound showed signs of fatigue
The broad U.S. taxable bond market returned 2.16% for the six months. Although bonds have recovered well after posting negative returns for 2013, their recent rally gradually lost momentum over June and July. The yield of the benchmark 10-year U.S. Treasury note ended July at 2.56%, down from 2.70% on January 31. (Bond prices and yields move in opposite directions.)
Municipal bonds, lifted by the broad bond market rally and less restrained by July’s decline in Treasury prices, returned 4.15%. Investor demand for tax-exempt income and a limited supply of new issues also benefited munis.
International bond markets (as measured by the Barclays Global Aggregate Index ex USD) returned 3.35%.
| | | |
| Market Barometer | | | |
| |
| | | | Total Returns |
| | Periods Ended July 31, 2014 |
| | Six | One | Five Years |
| | Months | Year | (Annualized) |
| Stocks | | | |
| Russell 1000 Index (Large-caps) | 9.02% | 17.06% | 17.13% |
| Russell 2000 Index (Small-caps) | -0.30 | 8.56 | 16.56 |
| Russell 3000 Index (Broad U.S. market) | 8.25 | 16.37 | 17.08 |
| FTSE All-World ex US Index (International) | 9.73 | 15.78 | 9.13 |
| |
| Bonds | | | |
| Barclays U.S. Aggregate Bond Index (Broad taxable market) | 2.16% | 3.97% | 4.47% |
| Barclays Municipal Bond Index (Broad tax-exempt market) | 4.15 | 7.27 | 5.50 |
| Citigroup Three-Month U.S. Treasury Bill Index | 0.00 | 0.04 | 0.07 |
| |
| CPI | | | |
| Consumer Price Index | 1.85% | 1.99% | 2.04% |
3
Results for money market funds and savings accounts remained tempered by the Fed’s target of 0%–0.25% for short-term interest rates.
As interest rates fell, REITs recovered from last year’s hit
After rising in 2013, bond yields reversed course in 2014. The drop in interest rates helped REITs rebound from their decline through the last three quarters of 2013.
Falling interest rates often help REITs. They’re required to pay out at least 90% of their income as dividends to their investors, which makes REITs rely heavily on the markets to raise cash to finance growth. That can help their profit margins when capital becomes less expensive.
REITs also compete for market attention with other income-generating investments, including bonds. When those other assets offer lower yields, the income generated by REITs can look more attractive, even though REITs, as equity investments, carry higher risks.
Over the most recent six months, retail and residential REITs added most significantly to performance. Retail REITs (+14%), the largest subset of the REIT market, benefited from falling vacancy rates that allowed landlords to raise rents on choice properties. Residential REITs (+18%) rose as the improving job market, along with relatively tight credit conditions for home buyers, proved favorable for apartment building owners. Office REITs
Expense Ratios
Your Fund Compared With Its Peer Group
| | | | | | |
| | | | | | | Peer |
| | Investor | Admiral | Signal | Institutional | ETF | Group |
| | Shares | Shares | Shares | Shares | Shares | Average |
| REIT Index Fund | 0.24% | 0.10% | 0.10% | 0.08% | 0.10% | 1.30% |
The fund expense ratios shown are from the prospectus dated May 27, 2014, and represent estimated costs for the current fiscal year. For thesix months ended July 31, 2014, the fund’s annualized expense ratios were 0.26% for Investor Shares, 0.12% for Admiral Shares, 0.12% forSignal Shares, 0.10% for Institutional Shares, and 0.12% for ETF Shares. The peer-group expense ratio is derived from data provided byLipper, a Thomson Reuters Company, and captures information through year-end 2013.Peer group: Real Estate Funds.4
(+15%) also did well as the commercial real estate market showed strength across many regions of the country.
Industrial REITs, the smallest subsector, recorded the most modest returns.
Don’t let complacency set your portfolio adrift
At Vanguard, we often warn against letting emotions become entangled with investments. When the financial markets are in turmoil, for example, we’ll caution investors not to let fear lead to rash decisions. But complacency can also stand in the way of achieving financial goals. And lately, conditions may have been leading investors to feel a little too comfortable.
Since its March 2009 bottom, the broad U.S. stock market, as measured by the Russell 3000 Index, has produced average annual returns of nearly 25%. That’s more than double the market’s historical average annual return. And in recent months, several indexes achieved record highs.
The investment winds don’t always blow favorably, of course—as we saw on the last day of July, when stocks fell sharply. Although the decline at the end of the reporting period was unwelcome, it served to remind us that exceptionally smooth sailing can create risks of its own.
When markets are unusually tranquil, it can be easy to lose sight of fundamentals, especially the importance of rebalancing. Without periodically adjusting your asset allocation so that it stays in line with your goals and risk tolerance, you can end up with a portfolio that’s very different from, and potentially riskier than, your intended one.
Whatever way the market is moving, we always encourage our clients to stay focused on our four principles for investment success: Create clear, appropriate investment goals; develop a suitable asset allocation using broadly diversified funds; minimize cost; and maintain perspective and long-term discipline. (You can read more in Vanguard’s Principles for Investment Success, available at vanguard.com/research.)
As always, thank you for investing with Vanguard.
Sincerely,

F. William McNabb III
Chairman and Chief Executive Officer
August 15, 2014
REIT Index Fund
Fund Profile
As of July 31, 2014
| | | | | |
| Share-Class Characteristics | | | | | |
| | Investor | Admiral | Signal | Institutional | |
| | Shares | Shares | Shares | Shares | ETF Shares |
| Ticker Symbol | VGSIX | VGSLX | VGRSX | VGSNX | VNQ |
| Expense Ratio1 | 0.24% | 0.10% | 0.10% | 0.08% | 0.10% |
| | | |
| Portfolio Characteristics | | |
| | | | DJ |
| | | | U.S. |
| | | | Total |
| | | | Market |
| | | MSCI US | FA |
| | Fund REIT Index | Index |
| Number of Stocks | 138 | 137 | 3,718 |
| Median Market Cap | $9.5B | $9.5B | $48.5B |
| Price/Earnings Ratio | 60.5x | 60.5x | 20.2x |
| Price/Book Ratio | 2.3x | 2.3x | 2.6x |
| Return on Equity | 4.4% | 4.4% | 17.5% |
| Earnings Growth | | | |
| Rate | 13.9% | 13.9% | 14.8% |
| Dividend Yield | 3.8% | 3.8% | 1.9% |
| Foreign Holdings | 0.0% | 0.0% | 0.0% |
| Turnover Rate | | | |
| (Annualized) | 9% | — | — |
| Short-Term Reserves | 0.0% | — | — |
Dividend Yield: This yield may include some payments that represent a return of capital, capital gains distributions, or both by the underlying REITs. These amounts are determined by each REIT at the end of its fiscal year.
| | |
| Subindustry Diversification (% of equity |
| exposure) | | |
| | | MSCI US |
| | Fund | REIT Index |
| Diversified REITs | 11.0% | 11.0% |
| Health Care REITs | 13.0 | 13.0 |
| Hotel & Resort REITs | 7.8 | 7.8 |
| Industrial REITs | 4.7 | 4.7 |
| Office REITs | 13.5 | 13.5 |
| Residential REITs | 16.6 | 16.6 |
| Retail REITs | 25.5 | 25.5 |
| Specialized REITs | 7.9 | 7.9 |
| | |
| Volatility Measures | | |
| | | DJ |
| | | U.S. Total |
| | MSCI US | Market |
| | REIT Index | FA Index |
| R-Squared | 1.00 | 0.49 |
| Beta | 1.00 | 0.89 |
These measures show the degree and timing of the fund’s fluctuations compared with the indexes over 36 months.
| | |
| Ten Largest Holdings (% of total net assets) |
| Simon Property Group | | |
| Inc. | Retail REITs | 8.7% |
| Public Storage | Specialized REITs | 4.1 |
| Equity Residential | Residential REITs | 3.7 |
| Prologis Inc. | Industrial REITs | 3.4 |
| AvalonBay Communities | | |
| Inc. | Residential REITs | 3.2 |
| HCP Inc. | Health Care REITs | 3.1 |
| Ventas Inc. | Health Care REITs | 3.1 |
| Health Care REIT Inc. | Health Care REITs | 3.0 |
| Boston Properties Inc. | Office REITs | 3.0 |
| Vornado Realty Trust | Diversified REITs | 2.9 |
| Top Ten | | 38.2% |
| The holdings listed exclude any temporary cash investments and equity index products. |
|
1 The expense ratios shown are from the prospectus dated May 27, 2014, and represent estimated costs for the current fiscal year. For the six
months ended July 31, 2014, the annualized expense ratios were 0.26% for Investor Shares, 0.12% for Admiral Shares, 0.12% for Signal Shares,
0.10% for Institutional Shares, and 0.12% for ETF Shares.
6
REIT Index Fund
Performance Summary
All of the returns in this report represent past performance, which is not a guarantee of future results that may be achieved by the fund. (Current performance may be lower or higher than the performance data cited. For performance data current to the most recent month-end, visit our website at vanguard.com/performance.) Note, too, that both investment returns and principal value can fluctuate widely, so an investor’s shares, when sold, could be worth more or less than their original cost. The returns shown do not reflect taxes that a shareholder would pay on fund distributions or on the sale of fund shares.
Fiscal-Year Total Returns (%): January 31, 2004, Through July 31, 2014
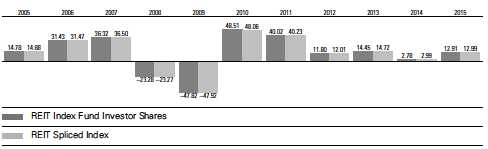
For a benchmark description, see the Glossary.
Note: For 2015, performance data reflect the six months ended July 31, 2014.
Average Annual Total Returns: Periods Ended June 30, 2014
This table presents returns through the latest calendar quarter—rather than through the end of the fiscal period.
Securities and Exchange Commission rules require that we provide this information.
| | | | |
| | Inception | One | Five | Ten |
| | Date | Year | Years | Years |
| Investor Shares | 5/13/1996 | 13.21% | 23.62% | 9.69% |
| Admiral Shares | 11/12/2001 | 13.37 | 23.80 | 9.81 |
| Signal Shares | 6/4/2007 | 13.36 | 23.80 | 3.831 |
| Institutional Shares | 12/2/2003 | 13.40 | 23.82 | 9.84 |
| ETF Shares | 9/23/2004 | | | |
| Market Price | | 13.32 | 23.79 | 9.361 |
| Net Asset Value | | 13.37 | 23.80 | 9.371 |
| 1 Return since inception. |
See Financial Highlights for dividend and capital gains information.
7
REIT Index Fund
Financial Statements (unaudited)
Statement of Net Assets
As of July 31, 2014
The fund reports a complete list of its holdings in regulatory filings four times in each fiscal year, at the quarter-ends. For the second and fourth fiscal quarters, the lists appear in the fund’s semiannual and annual reports to shareholders. For the first and third fiscal quarters, the fund files the lists with the Securities and Exchange Commission on Form N-Q. Shareholders can look up the fund’s Forms N-Q on the SEC’s website at sec.gov. Forms N-Q may also be reviewed and copied at the SEC’s Public Reference Room (see the back cover of this report for further information).
| | | |
| | | | Market |
| | | | Value• |
| | | Shares | ($000) |
| Real Estate Investment Trusts (100.0%) | |
| Diversified REITs (11.0%) | | |
| 1 | Vornado Realty Trust | 12,365,051 | 1,310,943 |
| 1 | American Realty Capital | | |
| | Properties Inc. | 65,288,909 | 855,938 |
| 1 | Duke Realty Corp. | 23,990,920 | 431,597 |
| 1 | WP Carey Inc. | 6,545,413 | 430,230 |
| 1 | Liberty Property Trust | 10,787,423 | 379,394 |
| 1 | Spirit Realty Capital Inc. | 28,998,978 | 335,518 |
| 1 | Cousins Properties Inc. | 15,335,246 | 189,850 |
| 1 | Lexington Realty Trust | 15,134,768 | 165,574 |
| 1 | Washington REIT | 4,886,719 | 132,528 |
| 1 | PS Business Parks Inc. | 1,477,822 | 121,920 |
| ^ | Empire State Realty | | |
| | Trust Inc. | 6,583,349 | 106,914 |
| 1 | American Assets | | |
| | Trust Inc. | 2,519,446 | 86,392 |
| | Select Income REIT | 2,806,328 | 77,876 |
| 1 | Investors Real | | |
| | Estate Trust | 7,849,434 | 66,877 |
| 1 | First Potomac | | |
| | Realty Trust | 4,313,221 | 56,891 |
| 1 | RAIT Financial Trust | 5,973,191 | 45,993 |
| 1 | Winthrop Realty Trust | 2,539,070 | 38,264 |
| 1 | Whitestone REIT | 1,611,325 | 24,105 |
| 1 | One Liberty | | |
| | Properties Inc. | 917,562 | 19,012 |
| | | | 4,875,816 |
| Health Care REITs (13.0%) | | |
| 1 | HCP Inc. | 33,537,219 | 1,392,801 |
| 1 | Ventas Inc. | 21,588,035 | 1,370,840 |
| 1 | Health Care REIT Inc. | 21,271,785 | 1,353,524 |
| 1 | Senior Housing | | |
| | Properties Trust | 14,796,238 | 338,242 |
| 1 | Omega Healthcare | | |
| | Investors Inc. | 9,113,071 | 332,991 |
| 1 | Healthcare Trust | | |
| | of America Inc. Class A | 17,406,098 | 207,307 |
| | | |
| | | | Market |
| | | | Value• |
| | | Shares | ($000) |
| 1 | Healthcare Realty | | |
| | Trust Inc. | 7,041,889 | 173,935 |
| 1 | Medical Properties | | |
| | Trust Inc. | 12,416,421 | 167,125 |
| 1 | National Health | | |
| | Investors Inc. | 2,061,453 | 123,254 |
| 1 | LTC Properties Inc. | 2,553,130 | 97,861 |
| 1 | Sabra Health Care | | |
| | REIT Inc. | 3,390,361 | 93,913 |
| | Aviv REIT Inc. | 1,852,440 | 52,702 |
| 1 | Universal Health Realty | | |
| | Income Trust | 896,735 | 37,717 |
| †,1 | CareTrust REIT Inc. | 1,465,410 | 25,000 |
| | | | 5,767,212 |
| Hotel & Resort REITs (7.8%) | | |
| 1 | Host Hotels & | | |
| | Resorts Inc. | 55,513,197 | 1,206,857 |
| 1 | Hospitality | | |
| | Properties Trust | 10,975,671 | 313,575 |
| 1 | RLJ Lodging Trust | 9,602,845 | 269,264 |
| 1 | LaSalle Hotel Properties | 7,628,202 | 265,385 |
| 1 | Sunstone Hotel | | |
| | Investors Inc. | 14,774,238 | 209,646 |
| *,1 | Strategic Hotels & | | |
| | Resorts Inc. | 16,855,399 | 192,320 |
| 1 | DiamondRock | | |
| | Hospitality Co. | 14,339,460 | 175,802 |
| 1 | Pebblebrook Hotel Trust | 4,687,268 | 170,616 |
| ^,1 | Ryman Hospitality | | |
| | Properties Inc. | 3,336,988 | 159,341 |
| 1 | Chesapeake | | |
| | Lodging Trust | 3,669,224 | 108,903 |
| 1 | Hersha Hospitality Trust | | |
| | Class A | 14,872,973 | 98,310 |
| 1 | FelCor Lodging Trust Inc. | 8,203,293 | 85,888 |
| *,1 | Ashford Hospitality | | |
| | Trust Inc. | 6,165,662 | 70,967 |
| 1 | Summit Hotel | | |
| | Properties Inc. | 6,247,724 | 64,164 |
8
REIT Index Fund
| | | |
| | | | Market |
| | | | Value• |
| | | Shares | ($000) |
| 1 | Chatham Lodging Trust | 1,936,257 | 40,991 |
| 1 | Ashford Hospitality | | |
| | Prime Inc. | 1,770,676 | 29,482 |
| | | | 3,461,511 |
| Industrial REITs (4.7%) | | |
| 1 | Prologis Inc. | 36,650,817 | 1,495,720 |
| 1 | DCT Industrial Trust Inc. | 23,787,913 | 186,259 |
| 1 | First Industrial Realty | | |
| | Trust Inc. | 8,067,437 | 145,617 |
| 1 | EastGroup Properties Inc. | 2,267,368 | 141,393 |
| 1 | STAG Industrial Inc. | 3,307,077 | 75,534 |
| 1 | Monmouth Real Estate | | |
| | Investment Corp. | 3,826,392 | 39,335 |
| | | | 2,083,858 |
| Office REITs (13.5%) | | |
| 1 | Boston Properties Inc. | 11,224,314 | 1,340,744 |
| 1 | SL Green Realty Corp. | 6,972,615 | 751,648 |
| ^,1 | Digital Realty Trust Inc. | 9,422,295 | 606,702 |
| 1 | Alexandria Real Estate | | |
| | Equities Inc. | 5,255,470 | 413,080 |
| 1 | Kilroy Realty Corp. | 6,024,991 | 372,585 |
| 1 | BioMed Realty Trust Inc. | 14,126,740 | 303,725 |
| 1 | Douglas Emmett Inc. | 9,978,974 | 284,301 |
| 1 | Highwoods | | |
| | Properties Inc. | 6,596,819 | 277,528 |
| 1 | Piedmont Office Realty | | |
| | Trust Inc. Class A | 11,318,389 | 220,143 |
| *,1 | CommonWealth REIT | 7,816,721 | 209,957 |
| 1 | Brandywine Realty Trust | 12,917,860 | 200,873 |
| 1 | Corporate Office | | |
| | Properties Trust | 6,413,020 | 181,937 |
| 1 | DuPont Fabros | | |
| | Technology Inc. | 4,817,342 | 132,043 |
| 1 | Mack-Cali Realty Corp. | 6,175,153 | 130,296 |
| 1 | Government Properties | | |
| | Income Trust | 5,006,685 | 116,906 |
| 1 | Hudson Pacific | | |
| | Properties Inc. | 4,178,537 | 106,971 |
| 1 | Parkway Properties Inc. | 5,085,553 | 105,423 |
| 1 | Franklin Street | | |
| | Properties Corp. | 6,612,420 | 80,275 |
| 1 | CyrusOne Inc. | 2,547,653 | 63,309 |
| 1 | CoreSite Realty Corp. | 1,563,859 | 51,076 |
| 1 | Gramercy Property | | |
| | Trust Inc. | 7,774,893 | 45,950 |
| | QTS Realty Trust Inc. | | |
| | Class A | 952,113 | 25,945 |
| | | | 6,021,417 |
| Residential REITs (16.6%) | | |
| 1 | Equity Residential | 25,163,732 | 1,626,835 |
| 1 | AvalonBay | | |
| | Communities Inc. | 9,493,886 | 1,405,855 |
| 1 | Essex Property Trust Inc. | 4,525,678 | 857,933 |
| 1 | UDR Inc. | 18,444,902 | 536,378 |
| | | |
| | | | Market |
| | | | Value• |
| | | Shares | ($000) |
| 1 | Camden Property Trust | 6,266,396 | 453,436 |
| 1 | Mid-America Apartment | | |
| | Communities Inc. | 5,499,709 | 384,540 |
| 1 | Apartment Investment & | | |
| | Management Co. | | |
| | Class A | 10,717,639 | 366,329 |
| 1 | American Campus | | |
| | Communities Inc. | 7,686,748 | 299,168 |
| 1 | Home Properties Inc. | 4,185,345 | 275,354 |
| 1 | Equity Lifestyle | | |
| | Properties Inc. | 5,806,920 | 257,188 |
| 1 | Post Properties Inc. | 3,984,943 | 215,984 |
| | American Homes 4 Rent | | |
| | Class A | 10,170,382 | 185,304 |
| 1 | Sun Communities Inc. | 2,961,238 | 155,850 |
| 1 | Education Realty | | |
| | Trust Inc. | 9,997,511 | 105,574 |
| †,1 | Starwood Waypoint | | |
| | Residential Trust | 2,865,520 | 75,334 |
| 1 | Associated Estates | | |
| | Realty Corp. | 4,223,700 | 74,633 |
| 1 | Silver Bay Realty | | |
| | Trust Corp. | 2,702,329 | 43,670 |
| *,1 | American Residential | | |
| | Properties Inc. | 2,240,967 | 40,606 |
| 1 | Campus Crest | | |
| | Communities Inc. | 4,730,744 | 37,846 |
| | | | 7,397,817 |
| Retail REITs (25.5%) | | |
| 1 | Simon Property | | |
| | Group Inc. | 23,052,935 | 3,877,273 |
| | General Growth | | |
| | Properties Inc. | 38,895,118 | 908,979 |
| ^,1 | Realty Income Corp. | 16,111,524 | 693,601 |
| 1 | Kimco Realty Corp. | 30,060,236 | 672,748 |
| 1 | Macerich Co. | 10,310,767 | 670,303 |
| 1 | Federal Realty | | |
| | Investment Trust | 4,901,953 | 598,529 |
| 1 | DDR Corp. | 22,394,187 | 392,794 |
| 1 | Regency Centers Corp. | 6,773,532 | 368,209 |
| 1 | Taubman Centers Inc. | 4,630,964 | 340,654 |
| 1 | National Retail | | |
| | Properties Inc. | 8,949,140 | 318,321 |
| 1 | Weingarten | | |
| | Realty Investors | 8,498,756 | 279,694 |
| 1 | Retail Properties | | |
| | of America Inc. | 17,334,792 | 260,889 |
| 1 | Tanger Factory Outlet | | |
| | Centers Inc. | 7,001,260 | 242,594 |
| 1 | CBL & Associates | | |
| | Properties Inc. | 12,474,466 | 233,273 |
| †,1 | Washington Prime | | |
| | Group Inc. | 11,382,873 | 215,023 |
| | Brixmor Property | | |
| | Group Inc. | 6,222,007 | 140,929 |
9
REIT Index Fund
| | | |
| | | | Market |
| | | | Value• |
| | | Shares | ($000) |
| 1 | Acadia Realty Trust | 4,099,540 | 115,730 |
| 1 | Glimcher Realty Trust | 10,638,134 | 114,254 |
| | Equity One Inc. | 4,745,215 | 110,184 |
| 1 | Retail Opportunity | | |
| | Investments Corp. | 6,482,334 | 100,022 |
| 1 | Pennsylvania REIT | 5,018,840 | 96,512 |
| 1 | Ramco-Gershenson | | |
| | Properties Trust | 5,461,102 | 90,654 |
| 1 | Inland Real Estate Corp. | 6,589,105 | 68,131 |
| | Alexander’s Inc. | 168,453 | 61,149 |
| | Kite Realty Group Trust | 9,593,491 | 58,520 |
| 1 | Excel Trust Inc. | 4,358,669 | 56,445 |
| | Saul Centers Inc. | 902,795 | 43,036 |
| | Rouse Properties Inc. | 2,491,823 | 42,236 |
| 1 | Getty Realty Corp. | 1,961,349 | 36,030 |
| | Urstadt Biddle | | |
| | Properties Inc. Class A | 1,664,144 | 34,098 |
| 1 | Agree Realty Corp. | 1,093,590 | 32,020 |
| 1 | AmREIT Inc. | 1,368,854 | 31,675 |
| 1 | Cedar Realty Trust Inc. | 4,934,511 | 31,087 |
| | Urstadt Biddle | | |
| | Properties Inc. | 69,255 | 1,208 |
| | | | 11,336,804 |
| Specialized REITs (7.9%) | | |
| 1 | Public Storage | 10,732,595 | 1,841,821 |
| 1 | Extra Space Storage Inc. | 8,067,086 | 417,310 |
| 1 | Corrections Corp. | | |
| | of America | 8,506,196 | 274,070 |
| 1 | Gaming and Leisure | | |
| | Properties Inc. | 6,495,223 | 218,694 |
| 1 | EPR Properties | 3,882,464 | 209,265 |
| 1 | CubeSmart | 10,291,482 | 187,408 |
| 1 | Sovran Self Storage Inc. | 2,390,000 | 183,361 |
| 1 | Geo Group Inc. | 5,288,779 | 181,987 |
| | | | 3,513,916 |
| Total Real Estate Investment Trusts | |
| (Cost $36,752,142) | | 44,458,351 |
| Temporary Cash Investment (0.2%) | |
| Money Market Fund (0.2%) | | |
| 2,3 | Vanguard Market | | |
| | Liquidity Fund, 0.118% | | |
| | (Cost $83,703) | 83,703,363 | 83,703 |
| Total Investments (100.2%) | | |
| (Cost $36,835,845) | | 44,542,054 |
| Other Assets and Liabilities (-0.2%) | |
| Other Assets | | 130,921 |
| Liabilities3 | | (212,088) |
| | | | (81,167) |
| Net Assets (100%) | | 44,460,887 |
| |
| | Amount |
| | ($000) |
| Statement of Assets and Liabilities | |
| Assets | |
| Investments in Securities, at Value | |
| Unaffiliated Issuers | 1,849,080 |
| Affiliated Vanguard Funds | 83,703 |
| Other Affiliated Issuers | 42,609,271 |
| Total Investments in Securities | 44,542,054 |
| Receivables for Accrued Income | 34,165 |
| Receivables for Investment | |
| Securities Sold | 38,885 |
| Other Assets | 57,871 |
| Total Assets | 44,672,975 |
| Liabilities | |
| Securities Lending Collateral Payable | |
| to Brokers | 73,392 |
| Payables for Investment | |
| Securities Purchased | 78,062 |
| Other Liabilities | 60,634 |
| Total Liabilities | 212,088 |
| Net Assets | 44,460,887 |
At July 31, 2014, net assets consisted of:
| |
| | Amount |
| | ($000) |
| Paid-in Capital | 37,219,016 |
| Overdistributed Net Investment Income | (126,631) |
| Accumulated Net Realized Losses | (337,707) |
| Unrealized Appreciation (Depreciation) | 7,706,209 |
| Net Assets | 44,460,887 |
| |
| |
| Investor Shares—Net Assets | |
| Applicable to 112,470,877 outstanding | |
| $.001 par value shares of beneficial | |
| interest (unlimited authorization) | 2,798,686 |
| Net Asset Value Per Share— | |
| Investor Shares | $24.88 |
| |
| |
| Admiral Shares—Net Assets | |
| Applicable to 99,439,721 outstanding | |
| $.001 par value shares of beneficial | |
| interest (unlimited authorization) | 10,558,253 |
| Net Asset Value Per Share— | |
| Admiral Shares | $106.18 |
10
REIT Index Fund
| |
| | Amount |
| | ($000) |
| Signal Shares—Net Assets | |
| Applicable to 67,035,639 outstanding | |
| $.001 par value shares of beneficial | |
| interest (unlimited authorization) | 1,900,166 |
| Net Asset Value Per Share— | |
| Signal Shares | $28.35 |
| |
| |
| Institutional Shares—Net Assets | |
| Applicable to 319,975,419 outstanding | |
| $.001 par value shares of beneficial | |
| interest (unlimited authorization) | 5,258,358 |
| Net Asset Value Per Share— | |
| Institutional Shares | $16.43 |
| |
| |
| ETF Shares—Net Assets | |
| Applicable to 319,608,469 outstanding | |
| $.001 par value shares of beneficial | |
| interest (unlimited authorization) | 23,945,424 |
| Net Asset Value Per Share— | |
| ETF Shares | $74.92 |
• See Note A in Notes to Financial Statements.
^ Includes partial security positions on loan to broker-dealers. The total value of securities on loan is $70,327,000.
*Non-income-producing security..
+ Non-income-producing security. New issue that has not paid a dividend as of July 31, 2014.
1 Considered an affiliated company of the fund as the issuer is another member of The Vanguard Group.Includes $83,138,000 of collateral received for securities on loan.
2 Affiliated money market fund available only to Vanguard funds and certain trusts and accounts managed by Vanguard. Rate shown is the 7-day yield.
3 Includes $73,392,000 of collateral received for securities on loan.
REIT-- Real Estate Investment Trust.
See accompanying Notes, which are an integral part of the Financial Statements.
11
REIT Index Fund
Statement of Operations
| |
| | Six Months Ended |
| | July 31, 2014 |
| | ($000) |
| Investment Income | |
| Income | |
| Dividends1 | 582,420 |
| Interest1 | 10 |
| Securities Lending | 575 |
| Total Income | 583,005 |
| Expenses | |
| The Vanguard Group—Note B | |
| Investment Advisory Services | 1,345 |
| Management and Administrative—Investor Shares | 3,014 |
| Management and Administrative—Admiral Shares | 4,464 |
| Management and Administrative—Signal Shares | 982 |
| Management and Administrative—Institutional Shares | 1,607 |
| Management and Administrative—ETF Shares | 9,353 |
| Marketing and Distribution—Investor Shares | 314 |
| Marketing and Distribution—Admiral Shares | 681 |
| Marketing and Distribution—Signal Shares | 306 |
| Marketing and Distribution—Institutional Shares | 516 |
| Marketing and Distribution—ETF Shares | 2,422 |
| Custodian Fees | 212 |
| Shareholders’ Reports—Investor Shares | 37 |
| Shareholders’ Reports—Admiral Shares | 15 |
| Shareholders’ Reports—Signal Shares | 25 |
| Shareholders’ Reports—Institutional Shares | 24 |
| Shareholders’ Reports—ETF Shares | 508 |
| Trustees’ Fees and Expenses | 16 |
| Total Expenses | 25,841 |
| Net Investment Income | 557,164 |
| Realized Net Gain (Loss) | |
| Capital Gain Distributions Received | 108,517 |
| Investment Securities Sold | 516,095 |
| Realized Net Gain (Loss)1 | 624,612 |
| Change in Unrealized Appreciation (Depreciation) of Investment Securities | 3,615,022 |
| Net Increase (Decrease) in Net Assets Resulting from Operations | 4,796,798 |
1 Dividend income, interest income, and realized net gain (loss) from affiliated companies of the fund were $567,754,000, $10,000, and $567,720,000, respectively.See accompanying Notes, which are an integral part of the Financial Statements.
12
REIT Index Fund
Statement of Changes in Net Assets
| | |
| | Six Months Ended | Year Ended |
| | July 31, | January 31, |
| | 2014 | 2014 |
| | ($000) | ($000) |
| Increase (Decrease) in Net Assets | | |
| Operations | | |
| Net Investment Income | 557,164 | 918,800 |
| Realized Net Gain (Loss) | 624,612 | 1,351,579 |
| Change in Unrealized Appreciation (Depreciation) | 3,615,022 | (1,507,158) |
| Net Increase (Decrease) in Net Assets Resulting from Operations | 4,796,798 | 763,221 |
| Distributions | | |
| Net Investment Income | | |
| Investor Shares | (40,674) | (73,658) |
| Admiral Shares | (149,311) | (224,168) |
| Signal Shares | (35,381) | (65,893) |
| Institutional Shares | (75,095) | (106,402) |
| ETF Shares | (359,185) | (520,883) |
| Realized Capital Gain | | |
| Investor Shares | — | — |
| Admiral Shares | — | — |
| Signal Shares | — | — |
| Institutional Shares | — | — |
| ETF Shares | — | — |
| Return of Capital | | |
| Investor Shares | — | (31,477) |
| Admiral Shares | — | (95,796) |
| Signal Shares | — | (28,159) |
| Institutional Shares | — | (45,470) |
| ETF Shares | — | (222,594) |
| Total Distributions | (659,646) | (1,414,500) |
| Capital Share Transactions | | |
| Investor Shares | 36,126 | (304,730) |
| Admiral Shares | 1,648,612 | 720,250 |
| Signal Shares | (771,083) | 572,687 |
| Institutional Shares | 866,778 | 799,400 |
| ETF Shares | 3,222,784 | 1,928,162 |
| Net Increase (Decrease) from Capital Share Transactions | 5,003,217 | 3,715,769 |
| Total Increase (Decrease) | 9,140,369 | 3,064,490 |
| Net Assets | | |
| Beginning of Period | 35,320,518 | 32,256,028 |
| End of Period1 | 44,460,887 | 35,320,518 |
1 Net Assets --- End of Period includes undistributed (overdistributed) net investment income of ($12,631,000) and ($24,149,000). See accompanying Notes, which are an integral part of the Financial Statements.13
REIT Index Fund
Financial Highlights
| | | | | | |
| Investor Shares | | | | | | |
| Six Months | | | | | |
| | Ended | | | | | |
| For a Share Outstanding | July 31, | Year Ended January 31, |
| Throughout Each Period | 2014 | 2014 | 2013 | 2012 | 2011 | 2010 |
| Net Asset Value, Beginning of Period | $22.37 | $22.66 | $20.50 | $18.99 | $14.05 | $10.02 |
| Investment Operations | | | | | | |
| Net Investment Income | . 309 | . 579 | . 514 | . 442 | . 399 | . 477 |
| Net Realized and Unrealized Gain (Loss) | | | | | | |
| on Investments | 2.566 | .025 | 2.393 | 1.722 | 5.144 | 4.192 |
| Total from Investment Operations | 2.875 | .604 | 2.907 | 2.164 | 5.543 | 4.669 |
| Distributions | | | | | | |
| Dividends from Net Investment Income | (.365) | (.626) | (.514) | (.439) | (.603) | (.481) |
| Distributions from Realized Capital Gains | — | — | — | — | — | — |
| Return of Capital | — | (. 268) | (. 233) | (. 215) | — | (.158) |
| Total Distributions | (. 365) | (. 894) | (.747) | (. 654) | (. 603) | (. 639) |
| Net Asset Value, End of Period | $24.88 | $22.37 | $22.66 | $20.50 | $18.99 | $14.05 |
| |
| Total Return1 | 12.91% | 2.78% | 14.45% | 11.80% | 40.02% | 48.51% |
| |
| Ratios/Supplemental Data | | | | | | |
| Net Assets, End of Period (Millions) | $2,799 | $2,482 | $2,817 | $2,565 | $2,658 | $3,572 |
| Ratio of Total Expenses to | | | | | | |
| Average Net Assets | 0.26% | 0.24% | 0.24% | 0.24% | 0.26% | 0.26% |
| Ratio of Net Investment Income to | | | | | | |
| Average Net Assets | 2.60% | 2.51% | 2.39% | 2.30% | 2.22% | 3.94% |
| Portfolio Turnover Rate2 | 9% | 11% | 9% | 10% | 12% | 16% |
The Expense ratio, net income ratio, and turnover rate for the current period have been annualized.1 Total returns do not include transaction or account service fees that may have applied in the periods shown. Fund prospectuses provide information about any applicable transaction and account service fees.2 Excludes the value of portfolio securities received or delivered as a result of in-kind purchases or redemptions of the funds' captial shares, including ETF Creation Units. See accompanying Notes, which are an integral part of the Financial Statements.
14
REIT Index Fund
Financial Highlights
| | | | | | |
| Admiral Shares | | | | | | |
| Six Months | | | | | |
| | Ended | | | | | |
| For a Share Outstanding | July 31, | Year Ended January 31, |
| Throughout Each Period | 2014 | 2014 | 2013 | 2012 | 2011 | 2010 |
| Net Asset Value, Beginning of Period | $95.46 | $96.70 | $87.47 | $81.03 | $59.95 | $42.74 |
| Investment Operations | | | | | | |
| Net Investment Income | 1.390 | 2.569 | 2.285 | 1.960 | 1.806 | 2.083 |
| Net Realized and Unrealized Gain (Loss) | | | | | | |
| on Investments | 10.957 | .148 | 10.263 | 7.385 | 21.948 | 17.909 |
| Total from Investment Operations | 12.347 | 2.717 | 12.548 | 9.345 | 23.754 | 19.992 |
| Distributions | | | | | | |
| Dividends from Net Investment Income | (1.627) | (2.772) | (2.283) | (1.948) | (2.674) | (2.094) |
| Distributions from Realized Capital Gains — | — | — | — | — | — |
| Return of Capital | — | (1.185) | (1.035) | (.957) | — | (.688) |
| Total Distributions | (1.627) | (3.957) | (3.318) | (2.905) | (2.674) | (2.782) |
| Net Asset Value, End of Period | $106.18 | $95.46 | $96.70 | $87.47 | $81.03 | $59.95 |
| |
| Total Return1 | 13.00% | 2.94% | 14.63% | 11.95% | 40.21% | 48.73% |
| |
| Ratios/Supplemental Data | | | | | | |
| Net Assets, End of Period (Millions) | $10,558 | $7,987 | $7,399 | $5,612 | $4,715 | $1,296 |
| Ratio of Total Expenses to | | | | | | |
| Average Net Assets | 0.12% | 0.10% | 0.10% | 0.10% | 0.12% | 0.13% |
| Ratio of Net Investment Income to | | | | | | |
| Average Net Assets | 2.74% | 2.65% | 2.53% | 2.44% | 2.36% | 4.07% |
| Portfolio Turnover Rate2 | 9% | 11% | 9% | 10% | 12% | 16% |
The Expense ratio, net income ratio, and turnover rate for the current period have been annualized.
1 Total returns do not include transaction or account service fees that may have applied in the periods shown. Fund prospectuses provide information about any applicable transaction and account service fees.
2 Excludes the value of portfolio securities received or delivered as a result of in-kind purchases or redemptions of the funds' captial shares, including ETF Creation Units.
See accompanying Notes, which are an integral part of the Financial Statements.
15
REIT Index Fund
Financial Highlights
| | | | | | |
| Signal Shares | | | | | | |
| Six Months | | | | | |
| | Ended | | | | | |
| For a Share Outstanding | July 31, | Year Ended January 31, |
| Throughout Each Period | 2014 | 2014 | 2013 | 2012 | 2011 | 2010 |
| Net Asset Value, Beginning of Period | $25.48 | $25.82 | $23.35 | $21.63 | $16.00 | $11.41 |
| Investment Operations | | | | | | |
| Net Investment Income | . 369 | . 687 | . 610 | . 522 | . 483 | . 557 |
| Net Realized and Unrealized Gain (Loss) | | | | | | |
| on Investments | 2.934 | .030 | 2.744 | 1.974 | 5.862 | 4.775 |
| Total from Investment Operations | 3.303 | .717 | 3.354 | 2.496 | 6.345 | 5.332 |
| Distributions | | | | | | |
| Dividends from Net Investment Income | (.433) | (.741) | (.608) | (.520) | (.715) | (.559) |
| Distributions from Realized Capital Gains | — | — | — | — | — | — |
| Return of Capital | — | (. 316) | (. 276) | (. 256) | — | (.183) |
| Total Distributions | (. 433) | (1.057) | (. 884) | (.776) | (.715) | (.742) |
| Net Asset Value, End of Period | $28.35 | $25.48 | $25.82 | $23.35 | $21.63 | $16.00 |
| |
| Total Return1 | 13.03% | 2.90% | 14.65% | 11.96% | 40.25% | 48.68% |
| |
| Ratios/Supplemental Data | | | | | | |
| Net Assets, End of Period (Millions) | $1,900 | $2,402 | $1,873 | $1,226 | $835 | $489 |
| Ratio of Total Expenses to | | | | | | |
| Average Net Assets | 0.12% | 0.10% | 0.10% | 0.10% | 0.12% | 0.14% |
| Ratio of Net Investment Income to | | | | | | |
| Average Net Assets | 2.74% | 2.65% | 2.53% | 2.44% | 2.36% | 4.06% |
| Portfolio Turnover Rate2 | 9% | 11% | 9% | 10% | 12% | 16% |
The Expense ratio, net income ratio, and turnover rate for the current period have been annualized.
1 Total returns do not include transaction or account service fees that may have applied in the periods shown. Fund prospectuses provide information about any applicable transaction and account service fees.
2 Excludes the value of portfolio securities received or delivered as a result of in-kind purchases or redemptions of the funds' captial shares, including ETF Creation Units.
See accompanying Notes, which are an integral part of the Financial Statements.
16
REIT Index Fund
Financial Highlights
| | | | | | |
| Institutional Shares | | | | | | |
| Six Months | | | | | |
| | Ended | | | | | |
| For a Share Outstanding | July 31, | Year Ended January 31, |
| Throughout Each Period | 2014 | 2014 | 2013 | 2012 | 2011 | 2010 |
| Net Asset Value, Beginning of Period | $14.78 | $14.97 | $13.54 | $12.54 | $9.28 | $6.61 |
| Investment Operations | | | | | | |
| Net Investment Income | .217 | .400 | .356 | .305 | .284 | .326 |
| Net Realized and Unrealized Gain (Loss) | | | | | | |
| on Investments | 1.687 | .025 | 1.590 | 1.148 | 3.395 | 2.777 |
| Total from Investment Operations | 1.904 | .425 | 1.946 | 1.453 | 3.679 | 3.103 |
| Distributions | | | | | | |
| Dividends from Net Investment Income | (.254) | (.431) | (.355) | (.304) | (.419) | (.326) |
| Distributions from Realized Capital Gains | — | — | — | — | — | — |
| Return of Capital | — | (.184) | (.161) | (.149) | — | (.107) |
| Total Distributions | (. 254) | (. 615) | (. 516) | (. 453) | (. 419) | (. 433) |
| Net Asset Value, End of Period | $16.43 | $14.78 | $14.97 | $13.54 | $12.54 | $9.28 |
| |
| Total Return1 | 12.95% | 2.97% | 14.66% | 12.01% | 40.24% | 48.90% |
| |
| Ratios/Supplemental Data | | | | | | |
| Net Assets, End of Period (Millions) | $5,258 | $3,922 | $3,185 | $2,324 | $1,614 | $907 |
| Ratio of Total Expenses to | | | | | | |
| Average Net Assets | 0.10% | 0.08% | 0.08% | 0.08% | 0.08% | 0.09% |
| Ratio of Net Investment Income to | | | | | | |
| Average Net Assets | 2.76% | 2.67% | 2.55% | 2.46% | 2.40% | 4.11% |
| Portfolio Turnover Rate 2 | 9% | 11% | 9% | 10% | 12% | 16% |
The Expense ratio, net income ratio, and turnover rate for the current period have been annualized.
1 Total returns do not include transaction or account service fees that may have applied in the periods shown. Fund prospectuses provide information about any applicable transaction and account service fees.
2 Excludes the value of portfolio securities received or delivered as a result of in-kind purchases or redemptions of the funds' captial shares, including ETF Creation Units.
See accompanying Notes, which are an integral part of the Financial Statements.
17
REIT Index Fund
Financial Highlights
| | | | | | |
| ETF Shares | | | | | | |
| Six Months | | | | | |
| | Ended | | | | | |
| For a Share Outstanding | July 31, | Year Ended January 31, |
| Throughout Each Period | 2014 | 2014 | 2013 | 2012 | 2011 | 2010 |
| Net Asset Value, Beginning of Period | $67.36 | $68.24 | $61.72 | $57.17 | $42.30 | $30.14 |
| Investment Operations | | | | | | |
| Net Investment Income | .980 | 1.814 | 1.613 | 1.384 | 1.278 | 1.473 |
| Net Realized and Unrealized Gain (Loss) | | | | | | |
| on Investments | 7.728 | .097 | 7.250 | 5.216 | 15.483 | 12.651 |
| Total from Investment Operations | 8.708 | 1.911 | 8.863 | 6.600 | 16.761 | 14.124 |
| Distributions | | | | | | |
| Dividends from Net Investment Income | (1.148) | (1.955) | (1.612) | (1.375) | (1.891) | (1.478) |
| Distributions from Realized Capital Gains | — | — | — | — | — | — |
| Return of Capital | — | (. 836) | (.731) | (. 675) | — | (. 486) |
| Total Distributions | (1.148) | (2.791) | (2.343) | (2.050) | (1.891) | (1.964) |
| Net Asset Value, End of Period | $74.92 | $67.36 | $68.24 | $61.72 | $57.17 | $42.30 |
| |
| Total Return | 12.99% | 2.93% | 14.64% | 11.94% | 40.19% | 48.74% |
| |
| Ratios/Supplemental Data | | | | | | |
| Net Assets, End of Period (Millions) | $23,945 | $18,528 | $16,983 | $10,410 | $8,075 | $4,678 |
| Ratio of Total Expenses to | | | | | | |
| Average Net Assets | 0.12% | 0.10% | 0.10% | 0.10% | 0.12% | 0.13% |
| Ratio of Net Investment Income to | | | | | | |
| Average Net Assets | 2.74% | 2.65% | 2.53% | 2.44% | 2.36% | 4.07% |
| Portfolio Turnover Rate1 | 9% | 11% | 9% | 10% | 12% | 16% |
The Expense ratio, net income ratio, and turnover rate for the current period have been annualized.
1 Excludes the value of portfolio securities received or delivered as a result of in-kind purchases or redemptions of the funds' captial shares, including ETF Creation Units.
See accompanying Notes, which are an integral part of the Financial Statements.
18
REIT Index Fund
Notes to Financial Statements
Vanguard REIT Index Fund is registered under the Investment Company Act of 1940 as an open-end investment company, or mutual fund. The fund offers five classes of shares: Investor Shares, Admiral Shares, Signal Shares, Institutional Shares, and ETF Shares. Investor Shares are available to any investor who meets the fund’s minimum purchase requirements. Admiral Shares, Signal Shares, and Institutional Shares are designed for investors who meet certain administrative, service, and account-size criteria. ETF Shares are listed for trading on NYSE Arca; they can be purchased and sold through a broker.
A. The following significant accounting policies conform to generally accepted accounting principles for U.S. investment companies. The fund consistently follows such policies in preparing its financial statements.
1. Security Valuation: Securities are valued as of the close of trading on the New York Stock Exchange (generally 4 p.m., Eastern time) on the valuation date. Equity securities are valued at the latest quoted sales prices or official closing prices taken from the primary market in which each security trades; such securities not traded on the valuation date are valued at the mean of the latest quoted bid and asked prices. Securities for which market quotations are not readily available, or whose values have been materially affected by events occurring before the fund’s pricing time but after the close of the securities’ primary markets, are valued by methods deemed by the board of trustees to represent fair value. Investments in Vanguard Market Liquidity Fund are valued at that fund’s net asset value.
2. Federal Income Taxes: The fund intends to continue to qualify as a regulated investment company and distribute all of its taxable income. Management has analyzed the fund’s tax positions taken for all open federal income tax years (January 31, 2011–2014), and for the period ended July 31, 2014, and has concluded that no provision for federal income tax is required in the fund’s financial statements.
3. Distributions: Distributions to shareholders are recorded on the ex-dividend date. Distributions declared by the fund are reallocated at fiscal year-end to ordinary income, capital gain, and return of capital to reflect their tax character.
4. Securities Lending: To earn additional income, the fund lends its securities to qualified institutional borrowers. Security loans are required to be secured at all times by collateral in an amount at least equal to the market value of securities loaned. Daily market fluctuations could cause the value of loaned securities to be more or less than the value of the collateral received. When this occurs, the collateral is adjusted and settled on the next business day. The fund further mitigates its counterparty risk by entering into securities lending transactions only with a diverse group of prequalified counterparties, monitoring their financial strength, and entering into master securities lending agreements with its counterparties. The master securities lending agreements provide that, in the event of a counterparty’s default (including bankruptcy), the fund may terminate any loans with that borrower, determine the net amount owed, and sell or retain the collateral up to the net amount owed to the fund; however, such actions may be subject to legal proceedings. While collateral mitigates counterparty risk, in the absence of a default the fund may experience delays and costs in recovering the securities loaned. The fund invests cash collateral received in Vanguard Market Liquidity Fund, and records a liability in the Statement of Net Assets for the return of the collateral, during the period the securities are on loan. Securities lending income represents fees charged to borrowers plus income earned on invested cash collateral, less expenses associated with the loan.
19
REIT Index Fund
5. Credit Facility: The fund and certain other funds managed by The Vanguard Group participate in a $2.89 billion committed credit facility provided by a syndicate of lenders pursuant to a credit agreement that may be renewed annually; each fund is individually liable for its borrowings, if any, under the credit facility. Borrowings may be utilized for temporary and emergency purposes, and are subject to the fund’s regulatory and contractual borrowing restrictions. The participating funds are charged administrative fees and an annual commitment fee of 0.06% of the undrawn amount of the facility; these fees are allocated to the funds based on a method approved by the fund’s board of trustees and included in Management and Administrative expenses on the fund’s Statement of Operations. Any borrowings under this facility bear interest at a rate equal to the higher of the federal funds rate or LIBOR reference rate plus an agreed-upon spread.
The fund had no borrowings outstanding at July 31, 2014, or at any time during the period then ended.
6. Other: Distributions received from REITs are recorded on the ex-dividend date. Each REIT reports annually the tax character of its distributions. Dividend income, capital gain distributions received, and unrealized appreciation (depreciation) reflect the amounts of taxable income, capital gain, and return of capital reported by the REITs, and management’s estimates of such amounts for REIT distributions for which actual information has not been reported. Interest income includes income distributions received from Vanguard Market Liquidity Fund and is accrued daily. Security transactions are accounted for on the date securities are bought or sold. Costs used to determine realized gains (losses) on the sale of investment securities are those of the specific securities sold.
Each class of shares has equal rights as to assets and earnings, except that each class separately bears certain class-specific expenses related to maintenance of shareholder accounts (included in Management and Administrative expenses) and shareholder reporting. Marketing and distribution expenses are allocated to each class of shares based on a method approved by the board of trustees. Income, other non-class-specific expenses, and gains and losses on investments are allocated to each class of shares based on its relative net assets.
B. The Vanguard Group furnishes at cost investment advisory, corporate management, administrative, marketing, and distribution services. The costs of such services are allocated to the fund based on methods approved by the board of trustees. The fund has committed to provide up to 0.40% of its net assets in capital contributions to Vanguard. At July 31, 2014, the fund had contributed capital of $4,449,000 to Vanguard (included in Other Assets), representing 0.01% of the fund’s net assets and 1.78% of Vanguard’s capitalization. The fund’s trustees and officers are also directors and officers of Vanguard.
C. Various inputs may be used to determine the value of the fund’s investments. These inputs are summarized in three broad levels for financial statement purposes. The inputs or methodologies used to value securities are not necessarily an indication of the risk associated with investing in those securities.
Level 1—Quoted prices in active markets for identical securities.
Level 2—Other significant observable inputs (including quoted prices for similar securities, interest rates, prepayment speeds, credit risk, etc.).
Level 3—Significant unobservable inputs (including the fund’s own assumptions used to determine the fair value of investments).
At July 31, 2014, 100% of the market value of the fund’s investments was determined based on Level 1 inputs.
20
REIT Index Fund
D. Distributions are determined on a tax basis and may differ from net investment income and realized capital gains for financial reporting purposes. Differences may be permanent or temporary. Permanent differences are reclassified among capital accounts in the financial statements to reflect their tax character. Temporary differences arise when certain items of income, expense, gain, or loss are recognized in different periods for financial statement and tax purposes. These differences will reverse at some time in the future. Differences in classification may also result from the treatment of short-term gains as ordinary income for tax purposes.
During the six months ended July 31, 2014, the fund realized $472,066,000 of net capital gains resulting from in-kind redemptions—in which shareholders exchanged fund shares for securities held by the fund rather than for cash. Because such gains are not taxable to the fund, and are not distributed to shareholders, they have been reclassified from accumulated net realized losses to paid-in capital.
The fund’s tax-basis capital gains and losses are determined only at the end of each fiscal year. For tax purposes, at January 31, 2014, the fund had available capital losses totaling $403,596,000 to offset future net capital gains. Of this amount, $73,864,000 is subject to expiration on January 31, 2018. Capital losses of $329,732,000 realized beginning in fiscal 2012 may be carried forward indefinitely under the Regulated Investment Company Modernization Act of 2010, but must be used before any expiring loss carryforwards. The fund will use these capital losses to offset net taxable capital gains, if any, realized during the year ending January 31, 2015; should the fund realize net capital losses for the year, the losses will be added to the loss carryforward balance above.
At July 31, 2014, the cost of investment securities for tax purposes was $36,835,845,000. Net unrealized appreciation of investment securities for tax purposes was $7,706,209,000, consisting of unrealized gains of $7,956,473,000 on securities that had risen in value since their purchase and $250,264,000 in unrealized losses on securities that had fallen in value since their purchase.
E. During the six months ended July 31, 2014, the fund purchased $8,052,652,000 of investment securities and sold $2,922,154,000 of investment securities, other than temporary cash investments. Purchases and sales include $3,983,184,000 and $1,145,847,000, respectively, in connection with in-kind purchases and redemptions of the fund’s capital shares.
| | | | |
| F. Capital share transactions for each class of shares were: | | | |
| | Six Months Ended | | Year Ended |
| | July 31, 2014 | January 31, 2014 |
| | Amount | Shares | Amount | Shares |
| | ($000) | (000) | ($000) | (000) |
| Investor Shares | | | | |
| Issued | 335,114 | 13,905 | 690,690 | 29,921 |
| Issued in Lieu of Cash Distributions | 38,450 | 1,596 | 99,859 | 4,526 |
| Redeemed | (337,438) | (13,982) | (1,095,279) | (47,793) |
| Net Increase (Decrease)—Investor Shares | 36,126 | 1,519 | (304,730) | (13,346) |
| Admiral Shares | | | | |
| Issued | 2,111,654 | 20,288 | 2,061,271 | 20,919 |
| Issued in Lieu of Cash Distributions | 134,080 | 1,303 | 287,172 | 3,054 |
| Redeemed | (597,122) | (5,814) | (1,628,193) | (16,819) |
| Net Increase (Decrease) —Admiral Shares | 1,648,612 | 15,777 | 720,250 | 7,154 |
21
REIT Index Fund
| | | | |
| | Six Months Ended | | Year Ended |
| | July 31, 2014 | January 31, 2014 |
| | Amount | Shares | Amount | Shares |
| | ($000) | (000) | ($000) | (000) |
| Signal Shares | | | | |
| Issued | 396,220 | 14,569 | 1,307,317 | 50,253 |
| Issued in Lieu of Cash Distributions | 31,261 | 1,146 | 83,873 | 3,346 |
| Redeemed | (1,198,564) | (42,930) | (818,503) | (31,910) |
| Net Increase (Decrease)—Signal Shares | (771,083) | (27,215) | 572,687 | 21,689 |
| Institutional Shares | | | | |
| Issued | 1,116,709 | 70,086 | 1,361,402 | 90,266 |
| Issued in Lieu of Cash Distributions | 67,706 | 4,254 | 136,949 | 9,423 |
| Redeemed | (317,637) | (19,813) | (698,951) | (47,012) |
| Net Increase (Decrease)—Institutional Shares | 866,778 | 54,527 | 799,400 | 52,677 |
| ETF Shares | | | | |
| Issued | 4,368,844 | 60,354 | 5,442,281 | 78,370 |
| Issued in Lieu of Cash Distributions | — | — | — | — |
| Redeemed | (1,146,060) | (15,800) | (3,514,119) | (52,200) |
| Net Increase (Decrease)—ETF Shares | 3,222,784 | 44,554 | 1,928,162 | 26,170 |
G. Certain of the fund’s investments are in companies that are considered to be affiliated companies of the fund because the fund owns more than 5% of the outstanding voting securities of the company. Transactions during the period in securities of these companies were as follows:
| | | | | | |
| | | Current Period Transactions | |
| | January 31, | | Proceeds | | | July 31, |
| | 2014 | | from | | Capital Gain | 2014 |
| | Market | Purchases | Securities | Dividend | Distributions | Market |
| | Value | at Cost | Sold | Income | Received | Value |
| | ($000) | ($000) | ($000) | ($000) | ($000) | ($000) |
| Acadia Realty Trust | 96,367 | 15,697 | 7,241 | 1,516 | 319 | 115,730 |
| Agree Realty Corp. | 29,034 | 4,581 | 2,233 | 867 | — | 32,020 |
| Alexandria Real Estate | | | | | | |
| Equities Inc. | 342,129 | 56,021 | 28,001 | 6,471 | 345 | 413,080 |
| American Assets Trust Inc. | 78,578 | 11,907 | 6,093 | 697 | — | 86,392 |
| American Campus | | | | | | |
| Communities Inc. | 248,719 | 41,565 | 21,688 | 3,082 | 789 | 299,168 |
| American Realty Capital | | | | | | |
| Properties Inc. | 174,745 | 281,303 | 56,981 | 21,443 | — | 855,938 |
| American Residential | | | | | | |
| Properties Inc. | 38,557 | 5,469 | 2,589 | — | — | 40,606 |
| AmREIT Inc. | 20,700 | 3,181 | 1,464 | 489 | 47 | 31,675 |
| Apartment Investment & | | | | | | |
| Management Co. Class A | 278,685 | 47,361 | 24,111 | 195 | 5,161 | 366,329 |
22
REIT Index Fund
| | | | | | |
| | | Current Period Transactions | |
| January 31, | | Proceeds | | | July 31, |
| | 2014 | | from | | Capital Gain | 2014 |
| | Market | Purchases | Securities | Dividend | Distributions | Market |
| | Value | at Cost | Sold | Income | Received | Value |
| | ($000) | ($000) | ($000) | ($000) | ($000) | ($000) |
| Ashford Hospitality Prime Inc. | 27,125 | 3,888 | 1,808 | 173 | — | 29,482 |
| Ashford Hospitality Trust Inc. | 49,152 | 14,326 | 4,449 | — | 122 | 70,967 |
| Associated Estates Realty Corp. | 55,026 | 16,993 | 3,570 | 1,102 | 280 | 74,633 |
| AvalonBay Communities Inc. | 1,036,765 | 224,691 | 73,329 | 8,594 | 12,366 | 1,405,855 |
| BioMed Realty Trust Inc. | 255,970 | 42,532 | 21,517 | 5,309 | — | 303,725 |
| Boston Properties Inc. | 1,124,832 | 185,529 | 91,266 | 12,623 | 1,618 | 1,340,744 |
| Brandywine Realty Trust | 152,490 | 46,649 | 12,439 | 2,400 | — | 200,873 |
| BRE Properties Inc. | 311,430 | 21,820 | 11,914 | 13,124 | 15,198 | NA1 |
| Camden Property Trust | 359,939 | 61,480 | 31,124 | 4,138 | 3,215 | 453,436 |
| Campus Crest Communities Inc. | 38,927 | 5,616 | 2,732 | 177 | 15 | 37,846 |
| CareTrust REIT Inc. | — | 30,650 | 321 | — | — | 25,000 |
| CBL & Associates Properties Inc. | 187,272 | 39,394 | 12,681 | 5,815 | — | 233,273 |
| Cedar Realty Trust Inc. | 31,995 | 4,371 | 5,163 | 86 | 88 | 31,087 |
| Chatham Lodging Trust | — | 44,148 | 539 | 309 | — | 40,991 |
| Chesapeake Lodging Trust | 80,802 | 14,142 | 4,638 | 2,052 | — | 108,903 |
| Cole Real Estate Investment Inc. | 485,625 | 2,379 | 884 | 1,680 | 65 | NA2 |
| CommonWealth REIT | 198,594 | 31,479 | 38,339 | — | — | 209,957 |
| CoreSite Realty Corp. | 44,859 | 7,021 | 3,790 | 1,070 | — | 51,076 |
| Corporate Office | | | | | | |
| Properties Trust | 148,243 | 24,542 | 12,493 | 1,857 | 364 | 181,937 |
| Corrections Corp. of America | 265,239 | 40,159 | 20,287 | 7,488 | — | 274,070 |
| Cousins Properties Inc. | 126,010 | 51,563 | 7,900 | 1,547 | 307 | 189,850 |
| CubeSmart | 144,461 | 34,371 | 7,011 | 1,571 | 600 | 187,408 |
| CyrusOne Inc. | 24,387 | 36,005 | 2,825 | 810 | — | 63,309 |
| DCT Industrial Trust Inc. | 154,075 | 27,542 | 8,816 | 1,162 | 150 | 186,259 |
| DDR Corp. | 291,170 | 84,241 | 20,565 | 67 | 344 | 392,794 |
| DiamondRock Hospitality Co. | 154,574 | 24,987 | 12,895 | 2,086 | 277 | 175,802 |
| Digital Realty Trust Inc. | 447,188 | 74,893 | 38,794 | 13,589 | 1,310 | 606,702 |
| Douglas Emmett Inc. | 235,253 | 39,421 | 19,442 | 771 | — | 284,301 |
| Duke Realty Corp. | 348,700 | 58,866 | 28,184 | 1,821 | 1,119 | 431,597 |
| DuPont Fabros Technology Inc. | 114,836 | 17,410 | 7,153 | 3,122 | — | 132,043 |
| EastGroup Properties Inc. | 123,371 | 20,233 | 8,349 | 1,981 | 66 | 141,393 |
| Education Realty Trust Inc. | 70,800 | 28,665 | 6,366 | 748 | — | 105,574 |
| EPR Properties | 177,081 | 34,014 | 11,757 | 5,713 | — | 209,265 |
| Equity Lifestyle Properties Inc. | 212,567 | 34,640 | 18,015 | 3,033 | 436 | 257,188 |
| Equity Residential | 1,294,578 | 216,307 | 108,800 | 12,963 | 11,657 | 1,626,835 |
23
REIT Index Fund
| | | | | | |
| | | Current Period Transactions | |
| | January 31, | | Proceeds | | | July 31, |
| | 2014 | | from | | Capital Gain | 2014 |
| | Market | Purchases | Securities | Dividend | Distributions | Market |
| | Value | at Cost | Sold | Income | Received | Value |
| | ($000) | ($000) | ($000) | ($000) | ($000) | ($000) |
| Essex Property Trust Inc. | 411,321 | 103,828 | 49,174 | 6,404 | 1,552 | 857,933 |
| Excel Trust Inc. | 37,565 | 19,743 | 5,748 | 996 | 13 | 56,445 |
| Extra Space Storage Inc. | 329,463 | 64,705 | 22,348 | 6,361 | 19 | 417,310 |
| Federal Realty Investment Trust | 488,995 | 87,244 | 38,261 | 7,025 | 222 | 598,529 |
| FelCor Lodging Trust Inc. | 62,250 | 10,813 | 5,551 | 322 | — | 85,888 |
| First Industrial Realty Trust Inc. | 122,413 | 25,907 | 8,524 | 1,574 | — | 145,617 |
| First Potomac Realty Trust | 52,345 | 7,737 | 3,745 | 204 | — | 56,891 |
| Franklin Street Properties Corp. | 73,834 | 11,551 | 5,936 | 1,329 | 310 | 80,275 |
| Gaming and Leisure | | | | | | |
| Properties Inc. | — | 257,930 | 11,197 | 6,572 | — | 218,694 |
| Geo Group Inc. | 164,618 | 24,906 | 12,553 | 5,841 | — | 181,987 |
| Getty Realty Corp. | 34,606 | 5,157 | 2,474 | 523 | 147 | 36,030 |
| Glimcher Realty Trust | 84,782 | 15,422 | 7,992 | 701 | — | 114,254 |
| Government Properties | | | | | | |
| Income Trust | 92,220 | 37,581 | 7,312 | 2,903 | 85 | 116,906 |
| Gramercy Property Trust Inc. | — | 46,359 | 579 | 270 | — | 45,950 |
| HCP Inc. | 1,218,577 | 192,313 | 95,317 | 24,112 | 2,606 | 1,392,801 |
| Health Care REIT Inc. | 1,132,528 | 185,256 | 80,523 | 15,942 | 964 | 1,353,524 |
| Healthcare Realty Trust Inc. | 150,037 | 24,274 | 12,203 | 1,395 | 234 | 173,935 |
| Healthcare Trust of America Inc. | | | | | | |
| Class A | 127,369 | 72,991 | 6,695 | 2,999 | 2 | 207,307 |
| Hersha Hospitality Trust Class A | 67,635 | 19,567 | 4,659 | 661 | — | 98,310 |
| Highwoods Properties Inc. | 225,216 | 37,169 | 16,362 | 3,904 | 533 | 277,528 |
| Home Properties Inc. | 216,497 | 36,405 | 17,993 | 3,929 | 762 | 275,354 |
| Hospitality Properties Trust | 260,325 | 44,536 | 20,442 | 10,446 | — | 313,575 |
| Host Hotels & Resorts Inc. | 941,903 | 164,571 | 76,231 | 15,527 | 183 | 1,206,857 |
| Hudson Pacific Properties Inc. | 78,084 | 20,370 | 6,840 | 508 | — | 106,971 |
| Inland Real Estate Corp. | 64,548 | 9,618 | 4,722 | 1,438 | — | 68,131 |
| Investors Real Estate Trust | 61,446 | 9,806 | 2,962 | 458 | 283 | 66,877 |
| Kilroy Realty Corp. | 293,633 | 51,036 | 23,702 | 1,535 | 20 | 372,585 |
| Kimco Realty Corp. | 584,925 | 96,278 | 49,686 | 8,348 | 1,007 | 672,748 |
| Kite Realty Group Trust | 55,438 | 9,401 | 3,184 | 111 | 132 | NA3 |
| LaSalle Hotel Properties | 216,270 | 35,352 | 16,004 | 4,866 | — | 265,385 |
| Lexington Realty Trust | 143,757 | 28,656 | 8,031 | 3,041 | 34 | 165,574 |
| Liberty Property Trust | 355,136 | 59,780 | 20,932 | 7,648 | 1,674 | 379,394 |
| LTC Properties Inc. | 90,062 | 13,819 | 6,871 | 2,102 | 37 | 97,861 |
| Macerich Co. | 543,191 | 93,586 | 48,205 | 4,853 | 5,156 | 670,303 |
24
REIT Index Fund
| | | | | | |
| | | Current Period Transactions | |
| January 31, | | Proceeds | | | July 31, |
| | 2014 | | from | | Capital Gain | 2014 |
| | Market | Purchases | Securities | Dividend | Distributions | Market |
| | Value | at Cost | Sold | Income | Received | Value |
| | ($000) | ($000) | ($000) | ($000) | ($000) | ($000) |
| Mack-Cali Realty Corp. | 115,506 | 18,600 | 8,737 | 1,844 | 122 | 130,296 |
| Medical Properties Trust Inc. | 145,055 | 29,805 | 10,056 | 3,190 | 415 | 167,125 |
| Mid-America Apartment | | | | | | |
| Communities Inc. | 329,311 | 54,953 | 27,243 | 6,355 | 1,225 | 384,540 |
| Monmouth Real Estate | | | | | | |
| Investment Corp. | 24,698 | 12,770 | 2,167 | 646 | 14 | 39,335 |
| National Health Investors Inc. | 118,344 | 18,523 | 7,208 | 2,827 | 181 | 123,254 |
| National Retail Properties Inc. | 274,761 | 45,003 | 21,513 | 5,554 | 110 | 318,321 |
| Omega Healthcare Investors Inc. | 255,531 | 50,850 | 13,200 | 5,972 | — | 332,991 |
| One Liberty Properties Inc. | 17,710 | 2,411 | 917 | 584 | 82 | 19,012 |
| Parkway Properties Inc. | NA4 | 13,752 | 5,874 | 427 | 80 | 105,423 |
| Pebblebrook Hotel Trust | 126,718 | 24,600 | 8,324 | 2,101 | — | 170,616 |
| Pennsylvania REIT | 86,791 | 12,660 | 6,003 | 650 | — | 96,512 |
| Piedmont Office Realty Trust Inc. | | | | | | |
| Class A | 189,405 | 29,201 | 30,226 | 3,083 | 682 | 220,143 |
| Post Properties Inc. | 175,010 | 28,483 | 15,589 | 1,812 | 143 | 215,984 |
| Prologis Inc. | 1,319,733 | 215,152 | 108,121 | 4,976 | 18,572 | 1,495,720 |
| PS Business Parks Inc. | 107,244 | 17,566 | 8,115 | 1,439 | — | 121,920 |
| Public Storage | 1,573,408 | 260,237 | 133,646 | 29,367 | 6 | 1,841,821 |
| RAIT Financial Trust | 46,948 | 6,921 | 3,544 | 2,048 | — | 45,993 |
| Ramco-Gershenson | | | | | | |
| Properties Trust | 72,608 | 20,837 | 5,743 | 1,138 | 137 | 90,654 |
| Realty Income Corp. | 546,288 | 162,780 | 50,131 | 12,205 | — | 693,601 |
| Regency Centers Corp. | 303,399 | 50,664 | 26,087 | 4,073 | 165 | 368,209 |
| Retail Opportunity | | | | | | |
| Investments Corp. | 70,948 | 33,069 | 8,872 | 897 | — | 100,022 |
| Retail Properties of America Inc. | 169,103 | 76,854 | 13,504 | 4,505 | — | 260,889 |
| RLJ Lodging Trust | 188,430 | 72,785 | 17,415 | 3,805 | — | 269,264 |
| Ryman Hospitality | | | | | | |
| Properties Inc. | 128,374 | 21,123 | 10,717 | 3,486 | 19 | 159,341 |
| Sabra Health Care REIT Inc. | 73,758 | 28,769 | 4,818 | 1,290 | — | 93,913 |
| Senior Housing Properties Trust | 289,249 | 68,249 | 24,263 | 7,110 | 709 | 338,242 |
| Silver Bay Realty Trust Corp. | 40,505 | 6,245 | 3,882 | 106 | — | 43,670 |
| Simon Property Group Inc. | 3,281,268 | 545,706 | 234,938 | 55,010 | 873 | 3,877,273 |
| SL Green Realty Corp. | 588,966 | 112,515 | 40,027 | 6,387 | 317 | 751,648 |
| Sovran Self Storage Inc. | 145,817 | 25,481 | 7,300 | 2,930 | 32 | 183,361 |
| Spirit Realty Capital Inc. | 254,720 | 77,163 | 22,245 | 8,707 | 192 | 335,518 |
| STAG Industrial Inc. | 62,049 | 17,033 | 7,321 | 1,849 | 14 | 75,534 |
25
REIT Index Fund
| | | | | | |
| | | Current Period Transactions | |
| | January 31, | | Proceeds | | | July 31, |
| | 2014 | | from | | Capital Gain | 2014 |
| | Market | Purchases | Securities | Dividend | Distributions | Market |
| | Value | at Cost | Sold | Income | Received | Value |
| | ($000) | ($000) | ($000) | ($000) | ($000) | ($000) |
| Starwood Waypoint | | | | | | |
| Residential Trust | — | 88,840 | 4,091 | — | — | 75,334 |
| Strategic Hotels & Resorts Inc. | 104,533 | 67,862 | 8,136 | — | — | 192,320 |
| Summit Hotel Properties Inc. | 49,408 | 9,689 | 3,094 | 1,015 | — | 64,164 |
| Sun Communities Inc. | 109,513 | 37,816 | 9,507 | 1,337 | — | 155,850 |
| Sunstone Hotel Investors Inc. | 160,220 | 46,590 | 13,621 | 1,376 | — | 209,646 |
| Tanger Factory Outlet | | | | | | |
| Centers Inc. | 215,240 | 35,051 | 15,557 | 3,177 | 14 | 242,594 |
| Taubman Centers Inc. | 283,451 | 48,151 | 28,592 | 3,800 | — | 340,654 |
| UDR Inc. | 416,768 | 70,475 | 35,189 | 5,132 | 4,248 | 536,378 |
| Universal Health Realty | | | | | | |
| Income Trust | 34,965 | 5,084 | 1,983 | 639 | 352 | 37,717 |
| Ventas Inc. | 1,249,299 | 196,793 | 96,964 | 28,949 | 1,238 | 1,370,840 |
| Vornado Realty Trust | 1,055,342 | 178,884 | 90,830 | 8,194 | 628 | 1,310,943 |
| WP Carey Inc. | NA4 | 303,774 | 21,508 | 11,451 | — | 430,230 |
| Washington Prime Group Inc. | — | 8,960 | 6,912 | — | — | 215,023 |
| Washington REIT | 105,809 | 17,003 | 8,526 | 1,910 | 191 | 132,528 |
| Weingarten Realty Investors | 229,316 | 37,964 | 19,653 | 4,318 | 1,007 | 279,694 |
| Whitestone REIT | 19,857 | 3,270 | 1,036 | 711 | 1 | 24,105 |
| Winthrop Realty Trust | 25,639 | 5,859 | 1,647 | 783 | — | 38,264 |
| Total | 34,042,854 | 7,358,544 | 2,768,106 | 567,754 | 104,002 | 42,609,271 |
1 Not applicable—In April 2014, BRE Properties Inc. merged with Essex Property Trust Inc.2 Not Applicable—In February 2014, Cole Real Estate Investment Inc. merged with American Realty Capital Properties Inc.3 Not applicable—At July 31, 2014, the security was still held, but the issuer was no longer an affiliated company of the fund.4 Not applicable—At January 31, 2014, the issuer was not an affiliated company of the fund.H. Management has determined that no material events or transactions occurred subsequent to July 31, 2014, that would require recognition or disclosure in these financial statements.
26
About Your Fund’s Expenses
As a shareholder of the fund, you incur ongoing costs, which include costs for portfolio management, administrative services, and shareholder reports (like this one), among others. Operating expenses, which are deducted from a fund’s gross income, directly reduce the investment return of the fund.
A fund’s expenses are expressed as a percentage of its average net assets. This figure is known as the expense ratio. The following examples are intended to help you understand the ongoing costs (in dollars) of investing in your fund and to compare these costs with those of other mutual funds. The examples are based on an investment of $1,000 made at the beginning of the period shown and held for the entire period.
The accompanying table illustrates your fund’s costs in two ways:
• Based on actual fund return. This section helps you to estimate the actual expenses that you paid over the period. The ”Ending Account Value“ shown is derived from the fund‘s actual return, and the third column shows the dollar amount that would have been paid by an investor who started with $1,000 in the fund. You may use the information here, together with the amount you invested, to estimate the expenses that you paid over the period.
To do so, simply divide your account value by $1,000 (for example, an $8,600 account value divided by $1,000 = 8.6), then multiply the result by the number given for your fund under the heading ”Expenses Paid During Period.“
• Based on hypothetical 5% yearly return. This section is intended to help you compare your fund‘s costs with those of other mutual funds. It assumes that the fund had a yearly return of 5% before expenses, but that the expense ratio is unchanged. In this case—because the return used is not the fund’s actual return—the results do not apply to your investment. The example is useful in making comparisons because the Securities and Exchange Commission requires all mutual funds to calculate expenses based on a 5% return. You can assess your fund’s costs by comparing this hypothetical example with the hypothetical examples that appear in shareholder reports of other funds.
Note that the expenses shown in the table are meant to highlight and help you compare ongoing costs only and do not reflect transaction costs incurred by the fund for buying and selling securities. Further, the expenses do not include any purchase, redemption, or account service fees described in the fund prospectus. If such fees were applied to your account, your costs would be higher. Your fund does not carry a “sales load.”
The calculations assume no shares were bought or sold during the period. Your actual costs may have been higher or lower, depending on the amount of your investment and the timing of any purchases or redemptions.
You can find more information about the fund’s expenses, including annual expense ratios, in the Financial Statements section of this report. For additional information on operating expenses and other shareholder costs, please refer to your fund’s current prospectus.
27
| | | |
| Six Months Ended July 31, 2014 | | | |
| | Beginning | Ending | Expenses |
| | Account Value | Account Value | Paid During |
| REIT Index Fund | 1/31/2014 | 7/31/2014 | Period |
| Based on Actual Fund Return | | | |
| Investor Shares | $1,000.00 | $1,129.12 | $1.37 |
| Admiral Shares | 1,000.00 | 1,129.98 | 0.63 |
| Signal Shares | 1,000.00 | 1,130.27 | 0.63 |
| Institutional Shares | 1,000.00 | 1,129.47 | 0.53 |
| ETF Shares | 1,000.00 | 1,129.86 | 0.63 |
| Based on Hypothetical 5% Yearly Return | | | |
| Investor Shares | $1,000.00 | $1,023.51 | $1.30 |
| Admiral Shares | 1,000.00 | 1,024.20 | 0.60 |
| Signal Shares | 1,000.00 | 1,024.20 | 0.60 |
| Institutional Shares | 1,000.00 | 1,024.30 | 0.50 |
| ETF Shares | 1,000.00 | 1,024.20 | 0.60 |
The calculations are based on expenses incurred in the most recent six-month period. The fund’s annualized six-month expense ratios for thatperiod are 0.26% for Investor Shares, 0.12% for Admiral Shares, 0.12% for Signal Shares, 0.10% for Institutional Shares, and 0.12% for ETFShares. The dollar amounts shown as “Expenses Paid” are equal to the annualized expense ratio multiplied by the average account value overthe period, multiplied by the number of days in the most recent six-month period, then divided by the number of days in the most recent12-month period.28
Trustees Approve Advisory Arrangement
The board of trustees of Vanguard REIT Index Fund has renewed the fund’s investment advisory arrangement with The Vanguard Group, Inc. (Vanguard). Vanguard’s Equity Investment Group—through its Equity Index Group—serves as the investment advisor for the fund. The board determined that continuing the fund’s internalized management structure was in the best interests of the fund and its shareholders.
The board based its decision upon an evaluation of the advisor’s investment staff, portfolio management process, and performance. The trustees considered the factors discussed below, among others. However, no single factor determined whether the board approved the arrangement. Rather, it was the totality of the circumstances that drove the board’s decision.
Nature, extent, and quality of services
The board considered the quality of the fund’s investment management services over both the short and long term, and took into account the organizational depth and stability of the advisor. The board noted that Vanguard has been managing investments for more than three decades. The Equity Index Group adheres to a sound, disciplined investment management process; the team has considerable experience, stability, and depth.
The board concluded that Vanguard’s experience, stability, depth, and performance, among other factors, warranted continuation of the advisory arrangement.
Investment performance
The board considered the short- and long-term performance of the fund, including any periods of outperformance or underperformance relative to a target index and peer group. The board concluded that the performance was such that the advisory arrangement should continue. Information about the fund’s most recent performance can be found in the Performance Summary section of this report.
Cost
The board concluded that the fund’s expense ratio was well below the average expense ratio charged by funds in its peer group and that the fund’s advisory fee rate was also well below its peer-group average. Information about the fund’s expenses appears in the About Your Fund’s Expenses section of this report as well as in the Financial Statements section.
The board does not conduct a profitability analysis of Vanguard, because of Vanguard’s unique “at-cost” structure. Unlike most other mutual fund management companies, Vanguard is owned by the funds it oversees, and produces “profits” only in the form of reduced expenses for fund shareholders.
The benefit of economies of scale
The board concluded that the fund’s at-cost arrangement with Vanguard ensures that the fund will realize economies of scale as it grows, with the cost to shareholders declining as the fund’s assets increase.
The board will consider whether to renew the advisory arrangement again after a one-year period.
29
Glossary
Beta. A measure of the magnitude of a fund’s past share-price fluctuations in relation to the ups and downs of a given market index. The index is assigned a beta of 1.00. Compared with a given index, a fund with a beta of 1.20 typically would have seen its share price rise or fall by 12% when the index rose or fell by 10%. For this report, beta is based on returns over the past 36 months for both the fund and the index. Note that a fund’s beta should be reviewed in conjunction with its R-squared (see definition). The lower the R-squared, the less correlation there is between the fund and the index, and the less reliable beta is as an indicator of volatility.
Dividend Yield. Dividend income earned by stocks, expressed as a percentage of the aggregate market value (or of net asset value, for a fund). The yield is determined by dividing the amount of the annual dividends by the aggregate value (or net asset value) at the end of the period. For a fund, the dividend yield is based solely on stock holdings and does not include any income produced by other investments. This yield may include some payments that represent a return of capital, capital gains distributions, or both by the underlying stocks.
Earnings Growth Rate. The average annual rate of growth in earnings over the past five years for the stocks now in a fund.
Expense Ratio. A fund’s total annual operating expenses expressed as a percentage of the fund’s average net assets. The expense ratio includes management and administrative expenses, but does not include the transaction costs of buying and selling portfolio securities.
Foreign Holdings. The percentage of a fund represented by securities or depositary receipts of companies based outside the United States.
Inception Date. The date on which the assets of a fund (or one of its share classes) are first invested in accordance with the fund’s investment objective. For funds with a subscription period, the inception date is the day after that period ends. Investment performance is measured from the inception date.
Median Market Cap. An indicator of the size of companies in which a fund invests; the midpoint of market capitalization (market price x shares outstanding) of a fund’s stocks, weighted by the proportion of the fund’s assets invested in each stock. Stocks representing half of the fund’s assets have market capitalizations above the median, and the rest are below it.
Price/Book Ratio. The share price of a stock divided by its net worth, or book value, per share. For a fund, the weighted average price/book ratio of the stocks it holds.
Price/Earnings Ratio. The ratio of a stock’s current price to its per-share earnings over the past year. For a fund, the weighted average P/E of the stocks it holds. P/E is an indicator of market expectations about corporate prospects; the higher the P/E, the greater the expectations for a company’s future growth.
R-Squared. A measure of how much of a fund’s past returns can be explained by the returns from the market in general, as measured by a given index. If a fund’s total returns were precisely synchronized with an index’s returns, its R-squared would be 1.00. If the fund’s returns bore no relationship to the index’s returns, its R-squared would be 0. For this report, R-squared is based on returns over the past 36 months for both the fund and the index.
30
Return on Equity. The annual average rate of return generated by a company during the past five years for each dollar of shareholder’s equity (net income divided by shareholder’s equity). For a fund, the weighted average return on equity for the companies whose stocks it holds.
Short-Term Reserves. The percentage of a fund invested in highly liquid, short-term securities that can be readily converted to cash.
Turnover Rate. An indication of the fund’s trading activity. Funds with high turnover rates incur higher transaction costs and may be more likely to distribute capital gains (which may be taxable to investors). The turnover rate excludes in-kind transactions, which have minimal impact on costs.
Benchmark Information
REIT Spliced Index: MSCI US REIT Index adjusted to include a 2% cash position (Lipper Money Market Average) through April 30, 2009; MSCI US REIT Index thereafter.
31
The People Who Govern Your Fund
The trustees of your mutual fund are there to see that the fund is operated and managed in your best interests since, as a shareholder, you are a part owner of the fund. Your fund’s trustees also serve on the board of directors of The Vanguard Group, Inc., which is owned by the Vanguard funds and provides services to them on an at-cost basis.
A majority of Vanguard’s board members are independent, meaning that they have no affiliation with Vanguard or the funds they oversee, apart from the sizable personal investments they have made as private individuals. The independent board members have distinguished backgrounds in business, academia, and public service. Each of the trustees and executive officers oversees 177 Vanguard funds.
The following table provides information for each trustee and executive officer of the fund. More information about the trustees is in the Statement of Additional Information, which can be obtained, without charge, by contacting Vanguard at 800-662-7447, or online at vanguard.com.
| |
| InterestedTrustee1 | and Delphi Automotive LLP (automotive components); |
| | Senior Advisor at New Mountain Capital. |
| F. William McNabb III | |
| Born 1957. Trustee Since July 2009. Chairman of the | Amy Gutmann |
| Board. Principal Occupation(s) During the Past Five | Born 1949. Trustee Since June 2006. Principal |
| Years: Chairman of the Board of The Vanguard Group, | Occupation(s) During the Past Five Years: President of |
| Inc., and of each of the investment companies served | the University of Pennsylvania; Christopher H. Browne |
| by The Vanguard Group, since January 2010; Director | Distinguished Professor of Political Science, School of |
| of The Vanguard Group since 2008; Chief Executive | Arts and Sciences, and Professor of Communication, |
| Officer and President of The Vanguard Group, and of | Annenberg School for Communication, with secondary |
| each of the investment companies served by The | faculty appointments in the Department of Philosophy, |
| Vanguard Group, since 2008; Director of Vanguard | School of Arts and Sciences, and at the Graduate |
| Marketing Corporation; Managing Director of The | School of Education, University of Pennsylvania; |
| Vanguard Group (1995–2008). | Trustee of the National Constitution Center; Chair |
| | of the Presidential Commission for the Study of |
| | Bioethical Issues. |
| IndependentTrustees | |
| | JoAnn Heffernan Heisen |
| Emerson U. Fullwood | Born 1950. Trustee Since July 1998. Principal |
| Born 1948. Trustee Since January 2008. Principal | Occupation(s) During the Past Five Years: Corporate |
| Occupation(s) During the Past Five Years: Executive | Vice President and Chief Global Diversity Officer |
| Chief Staff and Marketing Officer for North America | (retired 2008) and Member of the Executive |
| and Corporate Vice President (retired 2008) of Xerox | Committee (1997–2008) of Johnson & Johnson |
| Corporation (document management products and | (pharmaceuticals/medical devices/consumer |
| services); Executive in Residence and 2009–2010 | products); Director of Skytop Lodge Corporation |
| Distinguished Minett Professor at the Rochester | (hotels), the University Medical Center at Princeton, |
| Institute of Technology; Director of SPX Corporation | the Robert Wood Johnson Foundation, and the Center |
| (multi-industry manufacturing), the United Way of | for Talent Innovation; Member of the Advisory Board |
| Rochester, Amerigroup Corporation (managed health | of the Maxwell School of Citizenship and Public Affairs |
| care), the University of Rochester Medical Center, | at Syracuse University. |
| Monroe Community College Foundation, and North | |
| Carolina A&T University. | F. Joseph Loughrey |
| | Born 1949. Trustee Since October 2009. Principal |
| Rajiv L. Gupta | Occupation(s) During the Past Five Years: President |
| Born 1945. Trustee Since December 2001.2 | and Chief Operating Officer (retired 2009) of Cummins |
| Principal Occupation(s) During the Past Five Years: | Inc. (industrial machinery); Chairman of the Board |
| Chairman and Chief Executive Officer (retired 2009) | of Hillenbrand, Inc. (specialized consumer services), |
| and President (2006–2008) of Rohm and Haas Co. | and of Oxfam America; Director of SKF AB (industrial |
| (chemicals); Director of Tyco International, Ltd. | machinery), Hyster-Yale Materials Handling, Inc. |
| (diversified manufacturing and services), Hewlett- | (forklift trucks), the Lumina Foundation for Education, |
| Packard Co. (electronic computer manufacturing), | |
| | |
| and the V Foundation for Cancer Research; Member | Executive Officers | |
| of the Advisory Council for the College of Arts and | | |
| Letters and of the Advisory Board to the Kellogg | Glenn Booraem | |
| Institute for International Studies, both at the | Born 1967. Controller Since July 2010. Principal |
| University of Notre Dame. | Occupation(s) During the Past Five Years: Principal |
| | of The Vanguard Group, Inc.; Controller of each of |
| Mark Loughridge | the investment companies served by The Vanguard |
| Born 1953. Trustee Since March 2012. Principal | Group; Assistant Controller of each of the investment |
| Occupation(s) During the Past Five Years: Senior Vice | companies served by The Vanguard Group (2001–2010). |
| President and Chief Financial Officer (retired 2013) | | |
| at IBM (information technology services); Fiduciary | Thomas J. Higgins | |
| Member of IBM’s Retirement Plan Committee (2004– | Born 1957. Chief Financial Officer Since September |
| 2013); Member of the Council on Chicago Booth. | 2008. Principal Occupation(s) During the Past Five |
| | Years: Principal of The Vanguard Group, Inc.; Chief |
| Scott C. Malpass | Financial Officer of each of the investment companies |
| Born 1962. Trustee Since March 2012. Principal | served by The Vanguard Group; Treasurer of each of |
| Occupation(s) During the Past Five Years: Chief | the investment companies served by The Vanguard |
| Investment Officer and Vice President at the University | Group (1998–2008). | |
| of Notre Dame; Assistant Professor of Finance at the | | |
| Mendoza College of Business at Notre Dame; Member | Kathryn J. Hyatt | |
| of the Notre Dame 403(b) Investment Committee; | Born 1955. Treasurer Since November 2008. Principal |
| Board Member of TIFF Advisory Services, Inc. | Occupation(s) During the Past Five Years: Principal of |
| (investment advisor); Member of the Investment | The Vanguard Group, Inc.; Treasurer of each of the |
| Advisory Committees of the Financial Industry | investment companies served by The Vanguard |
| Regulatory Authority (FINRA) and of Major League | Group; Assistant Treasurer of each of the investment |
| Baseball. | companies served by The Vanguard Group (1988–2008). |
| |
| André F. Perold | Heidi Stam | |
| Born 1952. Trustee Since December 2004. Principal | Born 1956. Secretary Since July 2005. Principal |
| Occupation(s) During the Past Five Years: George | Occupation(s) During the Past Five Years: Managing |
| Gund Professor of Finance and Banking, Emeritus | Director of The Vanguard Group, Inc.; General Counsel |
| at the Harvard Business School (retired 2011); | of The Vanguard Group; Secretary of The Vanguard |
| Chief Investment Officer and Managing Partner of | Group and of each of the investment companies |
| HighVista Strategies LLC (private investment firm); | served by The Vanguard Group; Director and Senior |
| Director of Rand Merchant Bank; Overseer of the | Vice President of Vanguard Marketing Corporation. |
| Museum of Fine Arts Boston. | | |
| | Vanguard Senior ManagementTeam |
| Alfred M. Rankin, Jr. | | |
| Born 1941. Trustee Since January 1993. Principal | Mortimer J. Buckley | Chris D. McIsaac |
| Occupation(s) During the Past Five Years: Chairman, | Kathleen C. Gubanich | Michael S. Miller |
| President, and Chief Executive Officer of NACCO | Paul A. Heller | James M. Norris |
| Industries, Inc. (housewares/lignite), and of Hyster- | Martha G. King | Glenn W. Reed |
| Yale Materials Handling, Inc. (forklift trucks); Chairman | John T. Marcante | |
| of the Board of University Hospitals of Cleveland. | | |
| |
| Peter F. Volanakis | Chairman Emeritus and Senior Advisor |
| Born 1955. Trustee Since July 2009. Principal | | |
| Occupation(s) During the Past Five Years: President | John J. Brennan | |
| and Chief Operating Officer (retired 2010) of Corning | Chairman, 1996–2009 | |
| Incorporated (communications equipment); Trustee of | Chief Executive Officer and President, 1996–2008 |
| Colby-Sawyer College; Member of the Advisory Board | | |
| of the Norris Cotton Cancer Center and of the Advisory | Founder | |
| Board of the Parthenon Group (strategy consulting). | | |
| | John C. Bogle | |
| | Chairman and Chief Executive Officer, 1974–1996 |
1 Mr. McNabb is considered an “interested person,” as defined in the Investment Company Act of 1940, because he is an officer of the
Vanguard funds.
2 December 2002 for Vanguard Equity Income Fund, the Vanguard Municipal Bond Funds, and the Vanguard State Tax-Exempt Funds.
|  |
| |
| | P.O. Box 2600 |
| | Valley Forge, PA 19482-2600 |
| |
| |
| |
| Connect with Vanguard® > vanguard.com | |
| |
| |
| |
| Fund Information > 800-662-7447 | The funds or securities referred to herein are not |
| Direct Investor Account Services > 800-662-2739 | sponsored, endorsed, or promoted by MSCI, and MSCI |
| | bears no liability with respect to any such funds or |
| Institutional Investor Services > 800-523-1036 | securities. The prospectus or the Statement of |
| Text Telephone for People | Additional Information contains a more detailed |
| With Hearing Impairment > 800-749-7273 | description of the limited relationship MSCI has with |
| | Vanguard and any related funds. |
| This material may be used in conjunction | |
| with the offering of shares of any Vanguard | |
| fund only if preceded or accompanied by | |
| the fund’s current prospectus. | |
| |
| All comparative mutual fund data are from Lipper, a | |
| Thomson Reuters Company, or Morningstar, Inc., unless | |
| otherwise noted. | |
| |
| You can obtain a free copy of Vanguard’s proxy voting | |
| guidelines by visiting vanguard.com/proxyreporting or by | |
| calling Vanguard at 800-662-2739. The guidelines are | |
| also available from the SEC’s website, sec.gov. In | |
| addition, you may obtain a free report on how your fund | |
| voted the proxies for securities it owned during the 12 | |
| months ended June 30. To get the report, visit either | |
| vanguard.com/proxyreporting or sec.gov. | |
| |
| You can review and copy information about your fund at | |
| the SEC’s Public Reference Room in Washington, D.C. To | |
| find out more about this public service, call the SEC at | |
| 202-551-8090. Information about your fund is also | |
| available on the SEC’s website, and you can receive | |
| copies of this information, for a fee, by sending a | |
| request in either of two ways: via e-mail addressed to | |
| publicinfo@sec.gov or via regular mail addressed to the | |
| Public Reference Section, Securities and Exchange | |
| Commission, Washington, DC 20549-1520. | |
| |
| | © 2014 The Vanguard Group, Inc. |
| | All rights reserved. |
| | Vanguard Marketing Corporation, Distributor. |
| |
| | Q1232 092014 |
Item 2: Code of Ethics.
Not Applicable.
Item 3:
Not Applicable.
Item 4: Principal Accountant Fees and Services.
Not. Applicable.
Item 5: Audit Committee of Listed Registrants.
Not Applicable.
Item 6: Investments.
Not Applicable.
Item 7: Disclosure of Proxy Voting Policies and Procedures for Closed-End Management Investment Companies.
Not Applicable.
Item 8: Portfolio Managers of Closed-End Management Investment Companies.
Not Applicable.
Item 9: Purchase of Equity Securities by Closed-End Management Investment Company and Affiliated Purchasers.
Not Applicable.
Item 10: Submission of Matters to a Vote of Security Holders.
Not Applicable.
Item 11: Controls and Procedures.
(a) Disclosure Controls and Procedures. The Principal Executive and Financial Officers concluded that the Registrant’s Disclosure Controls and Procedures are effective based on their evaluation of the Disclosure Controls and Procedures as of a date within 90 days of the filing date of this report.
(b) Internal Control Over Financial Reporting. There were no significant changes in Registrant’s Internal Control Over Financial Reporting or in other factors that could
significantly affect this control subsequent to the date of the evaluation, including any corrective actions with regard to significant deficiencies and material weaknesses.
Item 12: Exhibits.
(a) Certifications.
Pursuant to the requirements of the Securities Exchange Act of 1934 and the Investment Company Act of 1940, the registrant has duly caused this report to be signed on its behalf by the undersigned, thereunto duly authorized.
| |
| | VANGUARD SPECIALIZED FUNDS |
| |
| |
| BY: | /s/ F. WILLIAM MCNABB III* |
| | F. WILLIAM MCNABB III |
| | CHIEF EXECUTIVE OFFICER |
| |
| Date: September 18, 2014 |
Pursuant to the requirements of the Securities Exchange Act of 1934 and the Investment Company Act of 1940, this report has been signed below by the following persons on behalf of the registrant and in the capacities and on the dates indicated.
| |
| | VANGUARD SPECIALIZED FUNDS |
| |
| BY: | /s/ F. WILLIAM MCNABB III* |
| | F. WILLIAM MCNABB III |
| | CHIEF EXECUTIVE OFFICER |
| Date: September 18, 2014 |
|
| | VANGUARD SPECIALIZED FUNDS |
| |
| BY: | /s/ THOMAS J. HIGGINS* |
| THOMAS J. HIGGINS |
| | CHIEF FINANCIAL OFFICER |
| Date: September 18, 2014 |
* By: /s/ Heidi Stam
Heidi Stam, pursuant to a Power of Attorney filed on April 22, 2014 see file Number 2-17620, Incorporated by Reference.