UNITED STATES
SECURITIES AND EXCHANGE COMMISSION
Washington, D.C. 20549
FORM N-CSR
CERTIFIED SHAREHOLDER REPORT
OF
REGISTERED MANAGEMENT INVESTMENT COMPANIES
Investment Company Act file number: 811-03916
Name of Registrant: Vanguard Specialized Funds
Address of Registrant:
P.O. Box 2600
Valley Forge, PA 19482
Name and address of agent for service:
Heidi Stam, Esquire
P.O. Box 876
Valley Forge, PA 19482
Registrant’s telephone number, including area code: (610) 669-1000
Date of fiscal year end: January 31
Date of reporting period: February 1, 2013 – July 31, 2013
Item 1: Reports to Shareholders
| 
|
| Semiannual Report | July 31, 2013 |
|
| Vanguard Energy Fund |
|
 |
> For the six months ended July 31, 2013, the energy sector advanced at a slower pace than the broad U.S. stock market, which saw double-digit gains.
> Vanguard Energy Fund returned almost 3%; the returns of its comparative standards were negative.
> Holdings in U.S.-based oil and gas exploration and production companies helped boost the fund’s return compared with that of its benchmark index.
| |
| Contents | |
| Your Fund’s Total Returns. | 1 |
| Chairman’s Letter. | 2 |
| Advisors’ Report. | 7 |
| Fund Profile. | 11 |
| Performance Summary. | 13 |
| Financial Statements. | 14 |
| About Your Fund’s Expenses. | 27 |
| Trustees Approve Advisory Arrangements. | 29 |
| Glossary. | 31 |
Please note: The opinions expressed in this report are just that—informed opinions. They should not be considered promises or advice.
Also, please keep in mind that the information and opinions cover the period through the date on the front of this report. Of course, the risks of investing in your fund are spelled out in the prospectus.
See the Glossary for definitions of investment terms used in this report.
About the cover: Our cover photograph shows rigging on the HMSSurprise, a replica of an 18th-century Royal Navy frigate. It was featured in the 2003 movie Master and Commander: The Far Side of the World, which was based on Patrick O’Brian’s sea novels, set amid the Napoleonic Wars. Vanguard was named for another ship of that era, the HMSVanguard, which was the flagship of British Admiral Horatio Nelson at the Battle of the Nile.
Your Fund’s Total Returns
Six Months Ended July 31, 2013
| |
| | Total |
| | Returns |
| Vanguard Energy Fund | |
| Investor Shares | 2.83% |
| Admiral™ Shares | 2.85 |
| MSCI ACWI Energy Index | -0.40 |
| Global Natural Resources Funds Average | -2.42 |
Global Natural Resources Funds Average: Derived from data provided by Lipper, a Thomson Reuters Company.
Admiral Shares carry lower expenses and are available to investors who meet certain account-balance requirements.
Your Fund’s Performance at a Glance
January 31, 2013, Through July 31, 2013
| | | | |
| | | | Distributions Per Share |
| | Starting | Ending | Income | Capital |
| | Share Price | Share Price | Dividends | Gains |
| Vanguard Energy Fund | | | | |
| Investor Shares | $62.66 | $64.28 | $0.149 | $0.000 |
| Admiral Shares | 117.63 | 120.68 | 0.289 | 0.000 |
1

Chairman’s Letter
Dear Shareholder,
Vanguard Energy Fund returned 2.83% for Investor Shares for the six months ended July 31, 2013. The advisors’ decision to overweight some U.S.-based oil and gas exploration companies helped the fund outpace the –0.40% return of its benchmark index.
The fund’s performance was even stronger compared with the –2.42% average return of global natural resources funds. Many of these peer funds have significant allocations to nonenergy sectors such as materials, industrials, and utilities. Materials, in particular, suffered as declining demand pulled down prices for metals and many other natural resources.
In contrast, crude oil prices climbed during the period, in part because of lower production and some supply disruptions among OPEC members. U.S. natural gas prices also rose.
Even so, the energy sector as a whole lagged the broad U.S. stock market, as it has for the last two fiscal years. To a degree, this lag may reflect investors’ assessment of the possible effects of slower growth in energy demand on the profitability of the sector.
2
U.S. stocks set a brisk pace; international markets struggled
U.S. stocks returned about 14% for the half year, posting positive returns for five of the six months. The exception was June, when stocks slid after Federal Reserve Chairman Ben Bernanke said the central bank could begin unwinding its stimulative bond-buying program later this year. July saw domestic stocks rebound sharply, helped by favorable economic news and reassuring words from Fed officials.
Despite rising in July, international stocks finished the period with a return of less than 1%. Much of the weakness came from emerging markets, where the slowing rate of growth, especially in China and Brazil, has been a concern. Developed markets in the Pacific region and Europe posted modest gains.
Bonds encountered obstacles as market uncertainty increased
Bonds, which also suffered in June amid concerns that the Fed could start tapering its bond buying, posted negative six-month returns. Although July brought a little relief, the broad U.S. taxable bond market returned –1.62%. The yield of the 10-year Treasury note finished the period at 2.60%, up from 1.67% at the end of April. (Bond yields and prices move in opposite directions.)
| | | |
| Market Barometer | | | |
| |
| | | | Total Returns |
| | | Periods Ended July 31, 2013 |
| | Six | One | Five Years |
| | Months | Year | (Annualized) |
| Stocks | | | |
| Russell 1000 Index (Large-caps) | 13.83% | 26.23% | 8.49% |
| Russell 2000 Index (Small-caps) | 16.66 | 34.76 | 9.45 |
| Russell 3000 Index (Broad U.S. market) | 14.05 | 26.86 | 8.57 |
| MSCI All Country World Index ex USA (International) | 0.26 | 16.96 | 0.79 |
| |
| Bonds | | | |
| Barclays U.S. Aggregate Bond Index (Broad taxable market) | -1.62% | -1.91% | 5.23% |
| Barclays Municipal Bond Index (Broad tax-exempt market) | -3.94 | -2.19 | 5.07 |
| Citigroup Three-Month U.S. Treasury Bill Index | 0.03 | 0.08 | 0.20 |
| |
| CPI | | | |
| Consumer Price Index | 1.44% | 1.96% | 1.21% |
3
Municipal bonds fared worse, returning –3.94%. Although the municipal market was roiled in July by Detroit’s bankruptcy filing, it bears remembering that Detroit debt represents a tiny fraction—just 0.05%—of the entire muni bond market. We continue to believe that municipal bonds may make sense as part of a diversified portfolio for investors in higher tax brackets. As Sarah Hammer, a senior investment analyst with Vanguard Investment Strategy Group, put it, “State and local governments have the ability and willingness to continue to make their debt service payments.”
The Fed’s target for short-term rates remained between 0% and 0.25%, capping the returns from money market funds and savings accounts.
Exploration and production firms sprinted ahead of integrated giants
There are many lenses through which to view the energy sector and to help make sense of the often divergent performance of its various segments. Perhaps the most commonly used lens is price, where there was a noteworthy development during the period. The price of West Texas Intermediate (WTI) crude oil—the U.S. oil price benchmark—reconnected to that of the global market, represented by Brent crude from the North Sea.
Historically, WTI and Brent prices have traded within a few dollars of each other. They became disconnected in 2010, when a boom in Canadian oil production and oil shale drilling strained the U.S. transport
Expense Ratios
Your Fund Compared With Its Peer Group
| | | |
| | Investor | Admiral | Peer Group |
| | Shares | Shares | Average |
| Energy Fund | 0.31% | 0.26% | 1.32% |
The fund expense ratios shown are from the prospectus dated May 28, 2013, and represent estimated costs for the current fiscal year. For the six months ended July 31, 2013, the fund’s annualized expense ratios were 0.37% for Investor Shares and 0.31% for Admiral Shares. This increase from the estimated expense ratio reflects a performance-based investment advisory fee adjustment. When the performance adjustment is positive, the fund’s expenses increase; when it is negative, expenses decrease. The peer-group expense ratio is derived from data provided by Lipper, a Thomson Reuters Company, and captures information through year-end 2012.
Peer group: Global Natural Resources Funds.
4
and refining network. The resulting oversupply of oil in the midsection of the country that could not reach Gulf Coast refineries pulled down WTI prices. This summer, more pipeline and refining capacity became available and onshore production in Canada and the United States dropped. Accordingly, WTI prices rose, coming close to parity with Brent in July for the first time in nearly three years.
Because higher prices tend to benefit producers and pinch the profit margins of refiners, they can be a mixed blessing for integrated companies that do both. These effects played out, to varying degrees, among the Energy Fund’s holdings.
The standouts were U.S. exploration and production companies. Natural gas producers in Pennsylvania did best—including one of the fund’s top ten holdings (as of July 31), which returned more than 43% for the half year. In contrast, refining and marketing companies overall lost ground as their raw material costs increased.
Performance was mixed among the integrated behemoths whose operations span the globe. These companies represented more than 45% of fund assets on average during the period. Two of the fund’s largest holdings, both headquartered in the United States, advanced, but some overseas holdings declined.
Compared with the benchmark index, rewarding selections outnumbered disappointments. As noted, the advisors added the most value with their choices of U.S. exploration and production companies. Some integrated giants detracted from results.
The Advisors’ Report that follows this letter provides additional details about the management of the fund during the fiscal half year.
Predicting the future is tricky, but preparing for it is prudent
Now that much of 2013 is in the rearview mirror, it’s clear that few of us anticipated several big events—such as record highs in some stock market indexes, the powerful rally in long-slumbering Japan, and renewed upheaval in Egypt. Of course, such unpredictability underscores the challenge of forecasting.
Vanguard’s approach to forecasting differs from that of many other investment firms. Joe Davis, our chief economist, is fond of saying that we “treat the future with the deference it deserves.”
Each January, our economists publish Vanguard’s Economic and Investment Outlook (available at vanguard.com/ research). They update their perspectives periodically and address significant developments—such as Detroit’s bankruptcy filing—with thoughtful, timely analysis and commentary. But, in keeping with Joe’s comment, our economists don’t make the pinpoint projections that you’ll see elsewhere.
5
Instead, using sophisticated statistical models, we provide a range and probability of potential outcomes—for the inflation rate or the 10-year Treasury yield, for example. And we explain our rationale for such outcomes.
In short, our forecasts acknowledge that no one has a crystal ball or can envision every scenario. And that underlines one of our core investment principles: Develop a suitable asset allocation using broadly diversified funds. Having a balanced portfolio can help you get through unforeseen events and achieve your goals—even without a crystal ball.
As always, thank you for investing with Vanguard.
Sincerely,

F. William McNabb III
Chairman and Chief Executive Officer
August 14, 2013
6
Advisors’ Report
Vanguard Energy Fund returned 2.83% for Investor Shares and 2.85% for Admiral Shares in the six months ended July 31, 2013, outpacing both its benchmark index and the average return of global natural resources funds. Your fund is managed by two advisors, a strategy that enhances the fund’s diversification by providing exposure to distinct yet complementary investment approaches. It’s not uncommon for different advisors to have different views about individual securities or the broader investment environment.
The advisors, the amount and percentage of fund assets each manages, and brief descriptions of their investment strategies are presented in the table below. The advisors have also provided a discussion of the investment environment that existed during the year and of how their portfolio positioning reflects this assessment. These reports were prepared on August 14, 2013.
Wellington Management Company, LLP
Portfolio Manager:
Karl E. Bandtel, Senior Vice President
The investment environment
Global equities shook off June’s pullback and advanced in July for the eighth time in the last nine calendar months. The MSCI All Country World Index rose 6.23% (in U.S. dollar terms) for the six months ended July 31, 2013. Accommodative rhetoric from the European Central Bank and the U.S. Federal Reserve increased investors’ risk appetites for U.S. stocks and, to a lesser extent, those of a number of other
| | | |
| Vanguard Energy Fund Investment Advisors | |
| |
| | Fund Assets Managed | |
| Investment Advisor | % | $ Million | Investment Strategy |
| Wellington Management | 96 | 11,296 | Emphasizes long-term total-return opportunities from |
| Company, LLP | | | the various energy subsectors: international oils, |
| | | | foreign integrated oils and foreign producers, North |
| | | | American producers, oil services and equipment, |
| | | | transportation and distribution, and refining and |
| | | | marketing. |
| Vanguard Equity Investment | 3 | 382 | Employs a quantitative fundamental management |
| Group | | | approach, using models that assess valuation, market |
| | | | sentiment, earnings quality, and management |
| | | | decisions of companies relative to their peers. |
| Cash Investments | 1 | 148 | These short-term reserves are invested by Vanguard in |
| | | | equity index products to simulate investments in stock. |
| | | | Each advisor may also maintain a modest cash |
| | | | position. |
7
developed markets. Emerging markets equity was a notable exception; the MSCI Emerging Markets Index declined almost 10% (in U.S. dollar terms).
The price of crude oil rose late in the period along with mounting tensions in Egypt. Natural gas prices remained lackluster amidst cooler weather and expectations of lower demand. They began the fiscal year just above $3.30 per million BTUs (U.S. Henry Hub) and exceeded $4 in the spring before dropping to finish below $3.50.
Our successes
Stock selection within the oil and gas subsector helped the portfolio outperform for the period. Cabot Oil & Gas was again the top contributor. The fund also benefited from positions in a number of other U.S. stocks, including EQT, Pioneer Natural Resources, EOG Resources, Noble Energy, and Range Resources.
Cabot’s strong results were driven largely by robust production in Pennsylvania’s Marcellus Shale. The company is a low-cost producer with a strong balance sheet. We believe the stock should benefit from reduced natural gas production industry-wide and ultimately from higher natural gas prices, which have remained below the industry’s marginal cost for an extended period. We trimmed our exposure on the stock’s strength, but Cabot remains one of our largest positions in both absolute and benchmark-relative terms.
Our shortfalls
The portfolio’s international exposure weighed on returns. Nine of the top ten absolute detractors were in stocks of companies domiciled outside of the United States. This list included Petrobras (Brazil), Inpex (Japan), Gazprom and Rosneft (Russia), Eni (Italy), and PetroChina (China).
Integrated oil and gas company Petrobras lost one-quarter of its value during the period. Production delays related to deployment of drilling platforms coupled with a broader sell-off across emerging markets in general created downward pressure on the stock. We believe that production growth will improve in the second half of the year and accelerate into 2014. Downstream retail margins should also improve to more normal levels. The company is expanding its deep sea production, with a number of rigs expected to come online in the next two years.
Petrobras shares are attractively valued on investor concern about continued losses in downstream refined products. We believe this concern is fully reflected in the share price and that sentiment will begin to turn as production improves and downstream losses narrow. We took advantage of the stock’s weakness to increase our position.
The fund’s positioning
Our long-term outlook remains favorable for the energy sector. However, as we always do, we urge caution regarding the near-term direction of commodity prices and the inherent volatility that accompanies investing in stocks of energy companies.
8
The portfolio remains skewed in favor of low-cost producers with compelling valuations based on our assessment of their respective long-term resource bases. We believe many of these companies have the ability to create value for shareholders absent generally rising commodity prices.
We believe that the eventual substitution of natural gas for oil, not only in the United States but also in Europe and Asia, is a significant opportunity for patient investors. Combined with the impact of several projects under way to enable the export of U.S. natural gas, it should continue to narrow the current wide price disparity between global energy prices and North American natural gas.
A significant portion of the portfolio’s assets are invested in international stocks (including emerging markets) domiciled in several countries. We will likely seek opportunities to increase our exposure to foreign stocks as we pare back positions in North America and redeploy the proceeds into more attractively valued investments.
Our low-turnover investment process remains steady, as does our emphasis on finding mid- and large-cap integrated oil and exploration and production companies that are attractively valued. We will continue to focus on stocks of companies that have clean balance sheets, long-lived resources, and high-quality management teams.
Vanguard Equity Investment Group
Portfolio Managers:
James D. Troyer, CFA, Principal
James P. Stetler, Principal
Michael R. Roach, CFA
The fund’s benchmark returned –0.40% for the six months ended July 31, 2013, lagging the 6.23% return of global equities (as measured by the MSCI All Country World Index). After a strong start to 2013, the capital markets saw a return of volatility in the second quarter. Initially, strong corporate earnings and economic optimism ushered stock markets to fresh highs. Rising interest rates in May tempered investor enthusiasm, however, and June brought a Federal Reserve statement that many interpreted as the beginning of a more hawkish approach to monetary policy. Markets swung wildly in the wake of the Fed’s comments, and bond yields climbed to a level last seen in 2011. Energy stocks were not immune to these fluctuations, and as a whole they provided investors with nearly flat returns.
Our model-based investment approach produced results in line with expectations. Our process has similarities to that of traditional fundamental managers but features a strict quantitative method of comparing stocks to identify those with potential to outperform over the long run. Our in-house research efforts center
9
on a combination of valuation and other factors focused on fundamental growth, allowing us to take advantage of market inefficiencies caused by persistent investor biases. We then use the results of our model to construct our portfolio, with the goal of minimizing exposure to risks that our research indicates do not improve returns, such as variances from the benchmark in market capitalization and volatility. In our view, these risk exposures are not justified by the possible rewards.
For the period, our most successful holdings were spread throughout various regions across the globe: First Solar (+75%) and Ultra Petroleum (+19%) in the United States, SBM Offshore (+28%) in the Netherlands, and Repsol (+10%) in Spain. Equally as important to our performance was our ability to limit exposure to underperforming stocks such as Ecopetrol (–24%) in Brazil and Pacific Rubiales Energy (–16%) in Canada.
Our results were dampened by overweighted positions in Inpex (–24%) and Cairn India (–18%), two stocks that underperformed the benchmark as a whole. Underweight positions in stronger performers such as Pioneer Natural Resources (+32%) and EQT (+46%) also hurt relative returns.
Overall, the increased volatility in the markets was not surprising, considering how quickly stocks had been rising domestically and internationally. Markets will always be subject to short-term fluctuations brought on by new headline risks. Too often, investors focus on short-term market gyrations, the most recent economic headlines, and short-term performance—and not enough on the fundamental principles that give them the best chance of success.
Strategies such as ours shift the focus back to fundamentals by seeking to capture the spread between undervalued and overvalued stocks. We believe that our approach can provide worthwhile returns for long-term investors and play an important role in building a diversified investment plan.
10
Energy Fund
Fund Profile
As of July 31, 2013
| | |
| Share-Class Characteristics | |
| | Investor | Admiral |
| | Shares | Shares |
| Ticker Symbol | VGENX | VGELX |
| Expense Ratio1 | 0.31% | 0.26% |
| 30-Day SEC Yield | 1.78% | 1.84% |
| | | |
| Portfolio Characteristics | | |
| | | | DJ U.S. |
| | | | Total |
| | | MSCI | Market |
| | | ACWI | FA |
| | Fund | Energy | Index |
| Number of Stocks | 127 | 173 | 3,619 |
| Median Market Cap | $42.1B | $71.7B | $40.3B |
| Price/Earnings Ratio | 14.2x | 11.7x | 18.9x |
| Price/Book Ratio | 1.6x | 1.5x | 2.5x |
| Return on Equity | 14.3% | 16.6% | 16.5% |
| Earnings Growth | | | |
| Rate | -2.9% | 1.8% | 10.4% |
| Dividend Yield | 2.2% | 3.0% | 1.9% |
| Foreign Holdings | 36.8% | 49.7% | 0.0% |
| Turnover Rate | | | |
| (Annualized) | 22% | — | — |
| Short-Term Reserves | 3.5% | — | — |
| | |
| Subindustry Diversification (% of equity exposure) | |
| | |
| | | MSCI |
| | | ACWI |
| | Fund | Energy |
| Coal & Consumable Fuels | 3.0% | 1.4% |
| Integrated Oil & Gas | 45.9 | 54.2 |
| Oil & Gas Drilling | 1.6 | 2.5 |
| Oil & Gas Equipment & | | |
| Services | 9.7 | 10.0 |
| Oil & Gas Exploration & | | |
| Production | 32.4 | 20.8 |
| Oil & Gas Refining & | | |
| Marketing | 4.9 | 5.6 |
| Oil & Gas Storage & | | |
| Transportation | 1.8 | 5.5 |
| Other | 0.7 | 0.0 |
| | |
| Volatility Measures | | |
| |
| | MSCI | DJ U.S. |
| | ACWI | Total Market |
| | Energy | FA Index |
| R-Squared | 0.98 | 0.83 |
| Beta | 1.05 | 1.42 |
These measures show the degree and timing of the fund’s fluctuations compared with the indexes over 36 months.
| | |
| Ten Largest Holdings (% of total net assets) |
| Exxon Mobil Corp. | Integrated Oil & Gas | 8.8% |
| Royal Dutch Shell plc | Integrated Oil & Gas | 6.0 |
| Chevron Corp. | Integrated Oil & Gas | 5.5 |
| Schlumberger Ltd. | Oil & Gas Equipment | |
| | & Services | 3.7 |
| BP plc | Integrated Oil & Gas | 3.3 |
| Total SA | Integrated Oil & Gas | 3.0 |
| Cabot Oil & Gas Corp. | Oil & Gas Exploration | |
| | & Production | 2.9 |
| Pioneer Natural | Oil & Gas Exploration | |
| Resources Co. | & Production | 2.6 |
| Eni SPA | Integrated Oil & Gas | 2.3 |
| EOG Resources Inc. | Oil & Gas Exploration | |
| | & Production | 2.3 |
| Top Ten | | 40.4% |
The holdings listed exclude any temporary cash investments and equity index products.
1 The expense ratios shown are from the prospectus dated May 28, 2013, and represent estimated costs for the current fiscal year. For the six months ended July 31, 2013, the annualized expense ratios were 0.37% for Investor Shares and 0.31% for Admiral Shares.
11
Energy Fund
Market Diversification (% of equity exposure)
| |
| Europe | |
| United Kingdom | 11.9% |
| France | 3.7 |
| Italy | 2.4 |
| Other | 2.5 |
| Subtotal | 20.5% |
| Pacific | |
| Japan | 1.6% |
| Other | 0.3 |
| Subtotal | 1.9% |
| Emerging Markets | |
| China | 2.1% |
| Russia | 1.8 |
| Brazil | 1.3 |
| Other | 0.9 |
| Subtotal | 6.1% |
| North America | |
| United States | 62.1% |
| Canada | 9.4 |
| Subtotal | 71.5% |
12
Energy Fund
Performance Summary
All of the returns in this report represent past performance, which is not a guarantee of future results that may be achieved by the fund. (Current performance may be lower or higher than the performance data cited. For performance data current to the most recent month-end, visit our website at vanguard.com/performance.) Note, too, that both investment returns and principal value can fluctuate widely, so an investor’s shares, when sold, could be worth more or less than their original cost. The returns shown do not reflect taxes that a shareholder would pay on fund distributions or on the sale of fund shares.
Fiscal-Year Total Returns (%): January 31, 2003, Through July 31, 2013
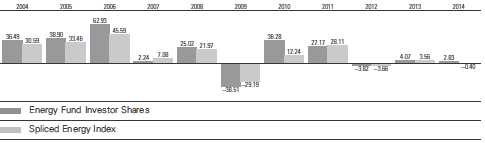
For a benchmark description, see the Glossary.
Note: For 2014, performance data reflect the six months ended July 31, 2013.
Average Annual Total Returns: Periods Ended June 30, 2013
This table presents returns through the latest calendar quarter—rather than through the end of the fiscal period.
Securities and Exchange Commission rules require that we provide this information.
| | | | |
| | Inception | One | Five | Ten |
| | Date | Year | Years | Years |
| Investor Shares | 5/23/1984 | 11.00% | -3.92% | 13.63% |
| Admiral Shares | 11/12/2001 | 11.06 | -3.86 | 13.70 |
See Financial Highlights for dividend and capital gains information.
13
Energy Fund
Financial Statements (unaudited)
Statement of Net Assets
As of July 31, 2013
The fund reports a complete list of its holdings in regulatory filings four times in each fiscal year, at the quarter-ends. For the second and fourth fiscal quarters, the lists appear in the fund’s semiannual and annual reports to shareholders. For the first and third fiscal quarters, the fund files the lists with the Securities and Exchange Commission on Form N-Q. Shareholders can look up the fund’s Forms N-Q on the SEC’s website at sec.gov. Forms N-Q may also be reviewed and copied at the SEC’s Public Reference Room (see the back cover of this report for further information).
| | |
| | | Market |
| | | Value |
| | Shares | ($000) |
| Common Stocks (96.0%)1 | | |
| United States (59.2%) | | |
| Energy Equipment & Services (10.2%) | | |
| Schlumberger Ltd. | 5,341,519 | 434,426 |
| Baker Hughes Inc. | 5,431,170 | 257,600 |
| Halliburton Co. | 3,844,097 | 173,715 |
| Ensco plc Class A | 2,955,824 | 169,487 |
| National Oilwell Varco Inc. | 1,238,296 | 86,891 |
| SEACOR Holdings Inc. | 875,753 | 76,681 |
| Transocean Ltd. | 79,394 | 3,744 |
| Patterson-UTI Energy Inc. | 108,100 | 2,137 |
| Diamond Offshore | | |
| Drilling Inc. | 30,300 | 2,044 |
| Nabors Industries Ltd. | 125,800 | 1,936 |
| | | 1,208,661 |
| Exchange-Traded Fund (0.7%) | |
| ^,2 Vanguard Energy ETF | 663,000 | 78,439 |
| |
| Oil, Gas & Consumable Fuels (48.3%) | |
| Coal & Consumable Fuels (2.2%) | |
| CONSOL Energy Inc. | 8,387,185 | 260,255 |
| |
| Integrated Oil & Gas (17.6%) | |
| Exxon Mobil Corp. | 11,127,444 | 1,043,198 |
| Chevron Corp. | 5,201,240 | 654,784 |
| Occidental Petroleum | | |
| Corp. | 2,854,773 | 254,218 |
| Hess Corp. | 941,839 | 70,129 |
| Murphy Oil Corp. | 791,700 | 53,614 |
| |
| Oil & Gas Exploration & Production (24.6%) |
| Cabot Oil & Gas Corp. | 4,447,807 | 337,233 |
| Pioneer Natural | | |
| Resources Co. | 1,969,495 | 304,799 |
| EOG Resources Inc. | 1,858,641 | 270,414 |
| Anadarko | | |
| Petroleum Corp. | 2,994,167 | 265,044 |
| | | |
| | | | Market |
| | | | Value |
| | | Shares | ($000) |
| | EQT Corp. | 2,775,770 | 240,104 |
| * | Southwestern | | |
| | Energy Co. | 4,944,185 | 191,785 |
| | Noble Energy Inc. | 3,026,078 | 189,100 |
| | Range Resources Corp. | 2,180,290 | 172,461 |
| * | Denbury Resources Inc. | 8,669,104 | 151,709 |
| | Devon Energy Corp. | 2,448,625 | 134,699 |
| | ConocoPhillips | 2,053,309 | 133,178 |
| * | Cobalt International | | |
| | Energy Inc. | 3,745,172 | 108,048 |
| | Apache Corp. | 982,650 | 78,858 |
| | Chesapeake | | |
| | Energy Corp. | 2,947,232 | 68,670 |
| | Marathon Oil Corp. | 1,857,046 | 67,522 |
| * | Whiting | | |
| | Petroleum Corp. | 1,085,355 | 55,863 |
| * | Newfield | | |
| | Exploration Co. | 1,855,658 | 45,649 |
| * | WPX Energy Inc. | 2,247,486 | 43,174 |
| | Energen Corp. | 718,861 | 43,052 |
| * | Ultra Petroleum Corp. | 107,200 | 2,321 |
| |
| | Oil & Gas Refining & Marketing (3.4%) |
| | Phillips 66 | 2,230,984 | 137,205 |
| | Marathon | | |
| | Petroleum Corp. | 1,824,650 | 133,802 |
| | Valero Energy Corp. | 3,540,884 | 126,657 |
| | HollyFrontier Corp. | 68,600 | 3,125 |
| |
| | Oil & Gas Storage & Transportation (0.5%) |
| | Kinder Morgan Inc. | 1,629,416 | 61,527 |
| | Williams Cos. Inc. | 27,900 | 953 |
| | | | 5,703,150 |
| Semiconductors & | | |
| Semiconductor Equipment (0.0%) | |
| * | First Solar Inc. | 47,850 | 2,356 |
| Total United States | | 6,992,606 |
14
| | | |
| Energy Fund | | |
| |
| |
| |
| | | | Market |
| | | | Value |
| | | Shares | ($000) |
| International (36.8%) | | |
| Australia (0.3%) | | |
| | Oil Search Ltd. | 3,907,545 | 28,428 |
| | Caltex Australia Ltd. | 127,094 | 2,137 |
| | Woodside Petroleum Ltd. | 20,294 | 685 |
| | | | 31,250 |
| Austria (0.0%) | | |
| | OMV AG | 59,944 | 2,652 |
| |
| Brazil (1.3%) | | |
| | Petroleo Brasileiro SA | | |
| | ADR | 10,894,275 | 148,598 |
| | Petroleo Brasileiro SA | | |
| | Prior Pfd. | 385,244 | 2,751 |
| | Petroleo Brasileiro SA | 249,132 | 1,679 |
| | | | 153,028 |
| Canada (9.1%) | | |
| | Suncor Energy Inc. | 7,576,682 | 239,650 |
| | Canadian Natural | | |
| | Resources Ltd. | 5,263,443 | 163,272 |
| | Cenovus Energy Inc. | 5,084,180 | 150,492 |
| | Encana Corp. | 6,938,890 | 121,569 |
| * | Tourmaline Oil Corp. | 2,412,470 | 92,990 |
| | TransCanada Corp. | 1,530,901 | 69,949 |
| | Canadian Oil Sands Ltd. | 3,462,710 | 67,201 |
| | Enbridge Inc. | 1,326,300 | 58,954 |
| | Cameco Corp. | 2,573,670 | 52,297 |
| | Pacific Rubiales Energy | | |
| | Corp. | 1,949,295 | 37,900 |
| ^ | Petrominerales Ltd. | 1,615,180 | 8,791 |
| | Suncor Energy Inc. | 249,434 | 7,883 |
| | Husky Energy Inc. | 104,200 | 3,003 |
| | Canadian Natural | | |
| | Resources Ltd. | 86,378 | 2,677 |
| | Enbridge Inc. | 52,350 | 2,323 |
| | Cenovus Energy Inc. | 26,539 | 786 |
| | Canadian Oil Sands Ltd. | 20,300 | 394 |
| | | | 1,080,131 |
| China (2.0%) | | |
| | PetroChina Co. Ltd. ADR | 1,240,895 | 144,664 |
| | Kunlun Energy Co. Ltd. | 32,151,555 | 47,305 |
| | China Shenhua | | |
| | Energy Co. Ltd. | 11,588,390 | 33,449 |
| | China Petroleum & | | |
| | Chemical Corp. | 5,749,600 | 4,270 |
| | China Oilfield | | |
| | Services Ltd. | 1,052,000 | 2,365 |
| | CNOOC Ltd. | 1,188,717 | 2,149 |
| | China Gas Holdings Ltd. | 1,828,000 | 2,065 |
| | China Longyuan | | |
| | Power Group Corp. | 1,676,000 | 1,763 |
| | PetroChina Co. Ltd. | 982,000 | 1,147 |
| | Xinjiang Goldwind Science | |
| | & Technology Co. Ltd. | 1,000,400 | 560 |
| | | | 239,737 |
| | |
| | | Market |
| | | Value |
| | Shares | ($000) |
| Finland (0.0%) | | |
| Neste Oil Oyj | 149,450 | 2,160 |
| |
| France (3.5%) | | |
| Total SA ADR | 6,512,720 | 345,500 |
| Technip SA | 522,614 | 57,665 |
| Total SA | 284,420 | 15,156 |
| | | 418,321 |
| Greece (0.0%) | | |
| Hellenic Petroleum SA | 64,940 | 638 |
| |
| Hungary (0.0%) | | |
| MOL Hungarian Oil | | |
| & Gas plc | 31,787 | 2,388 |
| |
| India (0.7%) | | |
| Reliance Industries Ltd. | 5,747,788 | 82,351 |
| Cairn India Ltd. | 430,743 | 2,092 |
| Oil India Ltd. | 136,255 | 1,158 |
| Hindustan Petroleum | | |
| Corp. Ltd. | 128,139 | 446 |
| Indian Oil Corp. Ltd. | 76,880 | 259 |
| | | 86,306 |
| Israel (0.0%) | | |
| Delek Group Ltd. | 3,000 | 842 |
| * Oil Refineries Ltd. | 809,908 | 348 |
| | | 1,190 |
| Italy (2.3%) | | |
| Eni SPA ADR | 5,952,505 | 262,803 |
| Eni SPA | 384,971 | 8,503 |
| | | 271,306 |
| Japan (1.6%) | | |
| Inpex Corp. | 27,276 | 119,259 |
| JX Holdings Inc. | 11,283,170 | 59,890 |
| Showa Shell Sekiyu KK | 253,900 | 2,339 |
| Idemitsu Kosan Co. Ltd. | 26,900 | 2,240 |
| | | 183,728 |
| Netherlands (0.0%) | | |
| * SBM Offshore NV | 131,514 | 2,545 |
| |
| Norway (0.8%) | | |
| Statoil ASA ADR | 4,090,890 | 88,322 |
| Statoil ASA | 200,381 | 4,350 |
| | | 92,672 |
| Poland (0.0%) | | |
| Polskie Gornictwo | | |
| Naftowe i Gazownictwo | | |
| SA | 1,225,230 | 2,375 |
| * Grupa Lotos SA | 147,504 | 1,521 |
| | | 3,896 |
| Portugal (0.9%) | | |
| Galp Energia SGPS SA | 6,436,169 | 102,806 |
15
| | | |
| Energy Fund | | |
| |
| |
| |
| | | | Market |
| | | | Value• |
| | | Shares | ($000) |
| Russia (1.8%) | | |
| | Gazprom OAO ADR | 13,040,733 | 100,773 |
| | Rosneft OAO GDR | 13,844,021 | 97,811 |
| | Lukoil OAO ADR | 103,280 | 6,077 |
| | AK Transneft OAO | | |
| | Prior Pfd. | 1,010 | 2,394 |
| | TMK OAO GDR | 128,997 | 1,741 |
| | Tatneft OAO ADR | 17,933 | 659 |
| | Surgutneftegas OAO | | |
| | ADR | 61,630 | 486 |
| | Gazprom OAO | 124,674 | 485 |
| | | | 210,426 |
| South Africa (0.1%) | | |
| | Sasol Ltd. | 111,032 | 5,101 |
| |
| South Korea (0.0%) | | |
| | SK Holdings Co. Ltd. | 15,884 | 2,495 |
| |
| Spain (0.8%) | | |
| | Repsol SA | 4,026,158 | 96,496 |
| |
| Thailand (0.1%) | | |
| | PTT PCL (Foreign) | 282,300 | 2,985 |
| * | PTT Global Chemical PCL | 1,061,200 | 2,239 |
| | PTT Exploration & | | |
| | Production PCL (Foreign) | 189,100 | 939 |
| | | | 6,163 |
| United Kingdom (11.5%) | | |
| | Royal Dutch Shell plc | | |
| | ADR | 7,778,285 | 531,646 |
| | BP plc ADR | 8,889,185 | 368,368 |
| | BG Group plc | 9,972,896 | 179,834 |
| | Royal Dutch Shell plc | | |
| | Class B | 4,426,895 | 156,582 |
| * | Ophir Energy plc | 10,826,161 | 62,040 |
| * | Genel Energy plc | 1,705,482 | 24,896 |
| | BP plc | 2,573,179 | 17,778 |
| | Royal Dutch Shell plc | | |
| | Class A | 330,410 | 11,274 |
| | Royal Dutch | | |
| | Shell plc Class A | | |
| | (Amsterdam Shares) | 158,539 | 5,412 |
| * | Essar Energy plc | 417,156 | 843 |
| * | Cairn Energy plc | 1 | — |
| | | | 1,358,673 |
| Total International | | 4,354,108 |
| Total Common Stocks | | |
| (Cost $7,132,598) | | 11,346,714 |
| | | | |
| | | | | Market |
| | | | | Value• |
| | | | Shares | ($000) |
| Temporary Cash Investments (4.3%)1 | |
| Money Market Fund (0.8%) | | |
| 3,4 | Vanguard Market Liquidity | | |
| | Fund, 0.124% | 94,787,797 | 94,788 |
| |
| | | | Face | |
| | | | Amount | |
| | | | ($000) | |
| Repurchase Agreement (3.4%) | | |
| | RBS Securities, Inc. | | | |
| | 0.060%, 8/1/13 | | | |
| | (Dated 7/31/13, | | | |
| | Repurchase Value | | | |
| | $408,501,000, | | | |
| | collateralized by | | | |
| | U.S. Treasury Note/ | | |
| | Bonds 2.000%, | | | |
| | 7/31/20, with a value | | |
| | of $416,671,000) | | 408,500 | 408,500 |
| |
| U.S. Government and Agency Obligations (0.1%) |
| 5,6 | Fannie Mae Discount | | |
| | Notes, 0.110%, 8/21/13 | 5,000 | 5,000 |
| 5,6 | Fannie Mae Discount | | |
| | Notes, 0.100%, 11/13/13 | 500 | 500 |
| 5,6 | Freddie Mac Discount | | |
| | Notes, 0.130%, 9/16/13 | 3,000 | 2,999 |
| | | | | 8,499 |
| Total Temporary Cash Investments | |
| (Cost $511,787) | | | 511,787 |
| Total Investments (100.3%) | | |
| (Cost $7,644,385) | | | 11,858,501 |
| Other Assets and Liabilities (-0.3%) | |
| Other Assets | | | 36,296 |
| Liabilities4 | | | (68,723) |
| | | | | (32,427) |
| Net Assets (100%) | | | 11,826,074 |
16
Energy Fund
| |
| At July 31, 2013, net assets consisted of: |
| | Amount |
| | ($000) |
| Paid-in Capital | 7,316,326 |
| Undistributed Net Investment Income | 86,645 |
| Accumulated Net Realized Gains | 208,486 |
| Unrealized Appreciation (Depreciation) | |
| Investment Securities | 4,214,116 |
| Futures Contracts | 544 |
| Foreign Currencies | (43) |
| Net Assets | 11,826,074 |
| |
| |
| Investor Shares—Net Assets | |
| Applicable to 77,901,603 outstanding | |
| $.001 par value shares of beneficial | |
| interest (unlimited authorization) | 5,007,142 |
| Net Asset Value Per Share— | |
| Investor Shares | $64.28 |
| |
| |
| Admiral Shares—Net Assets | |
| Applicable to 56,502,758 outstanding | |
| $.001 par value shares of beneficial | |
| interest (unlimited authorization) | 6,818,932 |
| Net Asset Value Per Share— | |
| Admiral Shares | $120.68 |
See Note A in Notes to Financial Statements.
^ Part of security position is on loan to broker-dealers. The total value of securities on loan is $6,370,000.
* Non-income-producing security.
1 The fund invests a portion of its cash reserves in equity markets through the use of index futures contracts. After giving effect to futures investments, the fund’s effective common stock and temporary cash investment positions represent 96.7% and 3.6%, respectively, of net assets.
2 Considered an affiliated company of the fund as the issuer is another member of The Vanguard Group.
3 Affiliated money market fund available only to Vanguard funds and certain trusts and accounts managed by Vanguard. Rate shown is the 7-day yield.
4 Includes $6,609,000 of collateral received for securities on loan.
5 The issuer was placed under federal conservatorship in September 2008; since that time, its daily operations have been managed by the Federal Housing Finance Agency and it receives capital from the U.S. Treasury, as needed to maintain a positive net worth, in exchange for senior preferred stock.
6 Securities with a value of $4,300,000 have been segregated as initial margin for open futures contracts.
ADR—American Depositary Receipt.
GDR—Global Depositary Receipt.
See accompanying Notes, which are an integral part of the Financial Statements.
17
| |
| Energy Fund | |
| |
| |
| Statement of Operations | |
| |
| | Six Months Ended |
| | July 31, 2013 |
| | ($000) |
| Investment Income | |
| Income | |
| Dividends1,2 | 154,456 |
| Interest2 | 194 |
| Securities Lending | 3,737 |
| Total Income | 158,387 |
| Expenses | |
| Investment Advisory Fees—Note B | |
| Basic Fee | 8,487 |
| Performance Adjustment | 1,868 |
| The Vanguard Group—Note C | |
| Management and Administrative—Investor Shares | 4,326 |
| Management and Administrative—Admiral Shares | 3,832 |
| Marketing and Distribution—Investor Shares | 500 |
| Marketing and Distribution—Admiral Shares | 559 |
| Custodian Fees | 214 |
| Shareholders’ Reports—Investor Shares | 37 |
| Shareholders’ Reports—Admiral Shares | 10 |
| Trustees’ Fees and Expenses | 14 |
| Total Expenses | 19,847 |
| Net Investment Income | 138,540 |
| Realized Net Gain (Loss) | |
| Investment Securities Sold2 | 221,444 |
| Futures Contracts | 15,080 |
| Foreign Currencies | (462) |
| Realized Net Gain (Loss) | 236,062 |
| Change in Unrealized Appreciation (Depreciation) | |
| Investment Securities | (41,574) |
| Futures Contracts | (4,039) |
| Foreign Currencies | (63) |
| Change in Unrealized Appreciation (Depreciation) | (45,676) |
| Net Increase (Decrease) in Net Assets Resulting from Operations | 328,926 |
1 Dividends are net of foreign withholding taxes of $11,295,000.
2 Dividend income, interest income, and realized net gain (loss) from affiliated companies of the fund were $0, $51,000, and $0, respectively.
See accompanying Notes, which are an integral part of the Financial Statements.
18
| | |
| Energy Fund | | |
| |
| |
| Statement of Changes in Net Assets | | |
| |
| | Six Months Ended | Year Ended |
| | July 31, | January 31, |
| | 2013 | 2013 |
| | ($000) | ($000) |
| Increase (Decrease) in Net Assets | | |
| Operations | | |
| Net Investment Income | 138,540 | 262,512 |
| Realized Net Gain (Loss) | 236,062 | 25,428 |
| Change in Unrealized Appreciation (Depreciation) | (45,676) | 161,584 |
| Net Increase (Decrease) in Net Assets Resulting from Operations | 328,926 | 449,524 |
| Distributions | | |
| Net Investment Income | | |
| Investor Shares | (12,426) | (114,465) |
| Admiral Shares | (16,644) | (147,695) |
| Realized Capital Gain | | |
| Investor Shares | — | (98,885) |
| Admiral Shares | — | (111,067) |
| Total Distributions | (29,070) | (472,112) |
| Capital Share Transactions | | |
| Investor Shares | (460,177) | (570,595) |
| Admiral Shares | (132,185) | 10,358 |
| Net Increase (Decrease) from Capital Share Transactions | (592,362) | (560,237) |
| Total Increase (Decrease) | (292,506) | (582,825) |
| Net Assets | | |
| Beginning of Period | 12,118,580 | 12,701,405 |
| End of Period1 | 11,826,074 | 12,118,580 |
1 Net Assets—End of Period includes undistributed (overdistributed) net investment income of $86,645,000 and ($22,363,000).
See accompanying Notes, which are an integral part of the Financial Statements.
19
| | | | | | |
| Energy Fund | | | | | | |
| |
| |
| Financial Highlights | | | | | | |
| |
| |
| Investor Shares | | | | | | |
| Six Months | | | | | |
| | Ended | | | | | |
| For a Share Outstanding | July 31, | | | Year Ended January 31, |
| Throughout Each Period | 2013 | 2013 | 2012 | 2011 | 2010 | 2009 |
| Net Asset Value, Beginning of Period | $62.66 | $62.60 | $69.20 | $57.17 | $42.62 | $73.93 |
| Investment Operations | | | | | | |
| Net Investment Income | .729 | 1.336 | 1.072 | 1.053 | . 910 | 1.2761 |
| Net Realized and Unrealized Gain (Loss) | | | | | | |
| on Investments | 1.040 | 1.098 | (3.949) | 14.103 | 14.591 | (28.853) |
| Total from Investment Operations | 1.769 | 2.434 | (2.877) | 15.156 | 15.501 | (27.577) |
| Distributions | | | | | | |
| Dividends from Net Investment Income | (.149) | (1.340) | (1.102) | (. 977) | (. 951) | (1.264) |
| Distributions from Realized Capital Gains | — | (1.034) | (2.621) | (2.149) | — | (2.469) |
| Total Distributions | (.149) | (2.374) | (3.723) | (3.126) | (. 951) | (3.733) |
| Net Asset Value, End of Period | $64.28 | $62.66 | $62.60 | $69.20 | $57.17 | $42.62 |
| |
| Total Return2 | 2.83% | 4.07% | -3.82% | 27.17% | 36.28% | -38.51% |
| |
| Ratios/Supplemental Data | | | | | | |
| Net Assets, End of Period (Millions) | $5,007 | $5,340 | $5,945 | $6,731 | $6,536 | $4,434 |
| Ratio of Total Expenses to | | | | | | |
| Average Net Assets3 | 0.37% | 0.31% | 0.34% | 0.34% | 0.38% | 0.28% |
| Ratio of Net Investment Income to | | | | | | |
| Average Net Assets | 2.33% | 2.15% | 1.67% | 1.74% | 1.73% | 1.84% |
| Portfolio Turnover Rate | 22% | 18% | 24% | 31% | 27% | 21% |
The expense ratio, net income ratio, and turnover rate for the current period have been annualized.
1 Calculated based on average shares outstanding.
2 Total returns do not include transaction or account service fees that may have applied in the periods shown. Fund prospectuses provide information about any applicable transaction and account service fees.
3 Includes performance-based investment advisory fee increases (decreases) of 0.03%, (0.02%), 0.01%, 0.00%, 0.03%, and 0.01%.
See accompanying Notes, which are an integral part of the Financial Statements.
20
| | | | | | |
| Energy Fund | | | | | | |
| |
| |
| Financial Highlights | | | | | | |
| |
| |
| |
| Admiral Shares | | | | | | |
| Six Months | | | | | |
| | Ended | | | | | |
| For a Share Outstanding | July 31, | | | Year Ended January 31, |
| Throughout Each Period | 2013 | 2013 | 2012 | 2011 | 2010 | 2009 |
| Net Asset Value, Beginning of Period | $117.63 | $117.52 | $129.93 | $107.34 | $80.02 | $138.86 |
| Investment Operations | | | | | | |
| Net Investment Income | 1.408 | 2.586 | 2.101 | 2.045 | 1.780 | 2.480 1 |
| Net Realized and Unrealized Gain (Loss) | | | | | | |
| on Investments | 1.931 | 2.060 | (7.432) | 26.479 | 27.395 | (54.203) |
| Total from Investment Operations | 3.339 | 4.646 | (5.331) | 28.524 | 29.175 | (51.723) |
| Distributions | | | | | | |
| Dividends from Net Investment Income | (. 289) | (2.595) | (2.159) | (1.899) | (1.855) | (2.480) |
| Distributions from Realized Capital Gains — | (1.941) | (4.920) | (4.035) | — | (4.637) |
| Total Distributions | (. 289) | (4.536) | (7.079) | (5.934) | (1.855) | (7.117) |
| Net Asset Value, End of Period | $120.68 | $117.63 | $117.52 | $129.93 | $107.34 | $80.02 |
| |
| Total Return2 | 2.85% | 4.14% | -3.76% | 27.24% | 36.37% | -38.46% |
| |
| Ratios/Supplemental Data | | | | | | |
| Net Assets, End of Period (Millions) | $6,819 | $6,778 | $6,756 | $6,871 | $4,439 | $2,889 |
| Ratio of Total Expenses to | | | | | | |
| Average Net Assets3 | 0.31% | 0.26% | 0.28% | 0.28% | 0.31% | 0.21% |
| Ratio of Net Investment Income to | | | | | | |
| Average Net Assets | 2.39% | 2.20% | 1.73% | 1.80% | 1.80% | 1.91% |
| Portfolio Turnover Rate | 22% | 18% | 24% | 31% | 27% | 21% |
The expense ratio, net income ratio, and turnover rate for the current period have been annualized.
1 Calculated based on average shares outstanding.
2 Total returns do not include transaction fees or account service fees that may have applied in the periods shown. Fund prospectuses provide information about any applicable transaction and account service fees.
3 Includes performance-based investment advisory fee increases (decreases) of 0.03%, (0.02%), 0.01%, 0.00%, 0.03%, and 0.01%.
See accompanying Notes, which are an integral part of the Financial Statements.
21
Energy Fund
Notes to Financial Statements
Vanguard Energy Fund is registered under the Investment Company Act of 1940 as an open-end investment company, or mutual fund. The fund invests in securities of foreign issuers, which may subject it to investment risks not normally associated with investing in securities of U.S. corporations. The fund offers two classes of shares: Investor Shares and Admiral Shares. Investor Shares are available to any investor who meets the fund’s minimum purchase requirements. Admiral Shares are designed for investors who meet certain administrative, service, and account-size criteria.
A. The following significant accounting policies conform to generally accepted accounting principles for U.S. mutual funds. The fund consistently follows such policies in preparing its financial statements.
1. Security Valuation: Securities are valued as of the close of trading on the New York Stock Exchange (generally 4 p.m., Eastern time) on the valuation date. Equity securities are valued at the latest quoted sales prices or official closing prices taken from the primary market in which each security trades; such securities not traded on the valuation date are valued at the mean of the latest quoted bid and asked prices. Securities for which market quotations are not readily available, or whose values have been affected by events occurring before the fund’s pricing time but after the close of the securities’ primary markets, are valued at their fair values calculated according to procedures adopted by the board of trustees. These procedures include obtaining quotations from an independent pricing service, monitoring news to identify significant market- or security-specific events, and evaluating changes in the values of foreign market proxies (for example, ADRs, futures contracts, or exchange-traded funds), between the time the foreign markets close and the fund’s pricing time. When fair-value pricing is employed, the prices of securities used by a fund to calculate its net asset value may differ from quoted or published prices for the same securities. Investments in Vanguard Market Liquidity Fund are valued at that fund’s net asset value. Temporary cash investments acquired over 60 days to maturity are valued using the latest bid prices or using valuations based on a matrix system (which considers such factors as security prices, yields, maturities, and ratings), both as furnished by independent pricing services. Other temporary cash investments are valued at amortized cost, which approximates market value.
2. Foreign Currency: Securities and other assets and liabilities denominated in foreign currencies are translated into U.S. dollars using exchange rates obtained from an independent third party as of the fund’s pricing time on the valuation date. Realized gains (losses) and unrealized appreciation (depreciation) on investment securities include the effects of changes in exchange rates since the securities were purchased, combined with the effects of changes in security prices. Fluctuations in the value of other assets and liabilities resulting from changes in exchange rates are recorded as unrealized foreign currency gains (losses) until the assets or liabilities are settled in cash, at which time they are recorded as realized foreign currency gains (losses).
3. Futures Contracts: The fund uses index futures contracts to a limited extent, with the objective of maintaining full exposure to the stock market while maintaining liquidity. The fund may purchase or sell futures contracts to achieve a desired level of investment, whether to accommodate portfolio turnover or cash flows from capital share transactions. The primary risks associated with the use of futures contracts are imperfect correlation between changes in market values of stocks held by the fund and the prices of futures contracts, and the possibility of an illiquid market.
Futures contracts are valued at their quoted daily settlement prices. The aggregate notional amounts of the contracts are not recorded in the Statement of Net Assets. Fluctuations in the value of the contracts are recorded in the Statement of Net Assets as an asset (liability) and in the Statement of Operations as unrealized appreciation (depreciation) until the contracts are closed, when they are recorded as realized futures gains (losses). Counterparty risk involving futures is mitigated because
22
Energy Fund
a regulated clearinghouse is the counterparty instead of the clearing broker. To further mitigate counterparty risk, the fund trades futures contracts on an exchange; monitors the financial strength of its clearing brokers and clearinghouse; and has entered into clearing agreements with its clearing brokers. The clearinghouse imposes initial margin requirements to secure the fund’s performance and requires daily settlement of variation margin representing changes in the market value of each contract.
During the six months ended July 31, 2013, the fund’s average investments in long and short futures contracts represented less than 1% and 0% of net assets, respectively, based on quarterly average aggregate settlement values.
4. Repurchase Agreements: The fund may enter into repurchase agreements with institutional counterparties. Securities pledged as collateral to the fund under repurchase agreements are held by a custodian bank until the agreements mature. Each agreement requires that the market value of the collateral be sufficient to cover payments of interest and principal. The fund further mitigates its counterparty risk by entering into repurchase agreements only with a diverse group of pre-qualified counterparties, monitoring their financial strength, and entering into master repurchase agreements with its counterparties. The master repurchase agreements provide that, in the event of a counterparty’s default (including bankruptcy), the fund may terminate any repurchase agreements with that counterparty, determine the net amount owed, and sell or retain the collateral up to the net amount owed to the fund.
5. Federal Income Taxes: The fund intends to continue to qualify as a regulated investment company and distribute all of its taxable income. Management has analyzed the fund’s tax positions taken for all open federal income tax years (January 31, 2010–2013), and for the period ended July 31, 2013, and has concluded that no provision for federal income tax is required in the fund’s financial statements.
6. Distributions: Distributions to shareholders are recorded on the ex-dividend date.
7. Securities Lending: To earn additional income, the fund may lend its securities to qualified institutional borrowers. Security loans are required to be secured at all times by collateral in an amount at least equal to the market value of securities loaned. Daily market fluctuations could cause the value of loaned securities to be more or less than the value of the collateral received. When this occurs, the collateral is adjusted and settled on the next business day. The fund further mitigates its counterparty risk by entering into securities lending transactions only with a diverse group of pre-qualified counterparties, monitoring their financial strength, and entering into master securities lending agreements with its counterparties. The master securities lending agreements provide that, in the event of a counterparty’s default (including bankruptcy), the fund may terminate any loans with that borrower, determine the net amount owed, and sell or retain the collateral up to the net amount owed to the fund. The fund invests cash collateral received in Vanguard Market Liquidity Fund, and records a liability for the return of the collateral, during the period the securities are on loan. Securities lending income represents fees charged to borrowers plus income earned on invested cash collateral, less expenses associated with the loan.
8. Other: Dividend income is recorded on the ex-dividend date. Interest income is accrued daily. Premiums and discounts on debt securities purchased are amortized and accreted, respectively, to interest income over the lives of the respective securities. Security transactions are accounted for on the date securities are bought or sold. Costs used to determine realized gains (losses) on the sale of investment securities are those of the specific securities sold.
23
Energy Fund
Each class of shares has equal rights as to assets and earnings, except that each class separately bears certain class-specific expenses related to maintenance of shareholder accounts (included in Management and Administrative expenses) and shareholder reporting. Marketing and distribution expenses are allocated to each class of shares based on a method approved by the board of trustees. Income, other non-class-specific expenses, and gains and losses on investments are allocated to each class of shares based on its relative net assets.
B. Wellington Management Company, LLP, provides investment advisory services to a portion of the fund for a fee calculated at an annual percentage rate of average net assets managed by the advisor. The basic fee is subject to quarterly adjustments based on performance for the preceding three years relative to the MSCI ACWI Energy Index.
The Vanguard Group provides investment advisory services to a portion of the fund on an at-cost basis; the fund paid Vanguard advisory fees of $184,000 for the six months ended July 31, 2013.
For the six months ended July 31, 2013, the aggregate investment advisory fee represented an effective annual basic rate of 0.14% of the fund’s average net assets, before an increase of $1,868,000 (0.03%) based on performance.
C. The Vanguard Group furnishes at cost corporate management, administrative, marketing, and distribution services. The costs of such services are allocated to the fund under methods approved by the board of trustees. The fund has committed to provide up to 0.40% of its net assets in capital contributions to Vanguard. At July 31, 2013, the fund had contributed capital of $1,412,000 to Vanguard (included in Other Assets), representing 0.01% of the fund’s net assets and 0.56% of Vanguard’s capitalization. The fund’s trustees and officers are also directors and officers of Vanguard.
D. Various inputs may be used to determine the value of the fund’s investments. These inputs are summarized in three broad levels for financial statement purposes. The inputs or methodologies used to value securities are not necessarily an indication of the risk associated with investing in those securities.
Level 1—Quoted prices in active markets for identical securities.
Level 2—Other significant observable inputs (including quoted prices for similar securities, interest rates, prepayment speeds, credit risk, etc.).
Level 3—Significant unobservable inputs (including the fund’s own assumptions used to determine the fair value of investments).
The following table summarizes the market value of the fund’s investments as of July 31, 2013, based on the inputs used to value them:
| | | |
| | Level 1 | Level 2 | Level 3 |
| Investments | ($000) | ($000) | ($000) |
| Common Stocks—United States | 6,992,606 | — | — |
| Common Stocks—International | 2,974,462 | 1,379,646 | — |
| Temporary Cash Investments | 94,788 | 416,999 | — |
| Futures Contracts—Liabilities1 | (236) | — | — |
| Total | 10,061,620 | 1,796,645 | — |
| 1 Represents variation margin on the last day of the reporting period. |
24
Energy Fund
E. At July 31, 2013, the aggregate settlement value of open futures contracts and the related unrealized appreciation (depreciation) were:
| | | | |
| | | | | ($000) |
| | | | Aggregate | |
| | | Number of | Settlement | Unrealized |
| | | Long (Short) | Value | Appreciation |
| Futures Contracts | Expiration | Contracts | Long (Short) | (Depreciation) |
| E-mini S&P 500 Index | September 2013 | 940 | 78,984 | 245 |
| S&P 500 Index | September 2013 | 34 | 14,284 | 299 |
Unrealized appreciation (depreciation) on open futures contracts is required to be treated as realized gain (loss) for tax purposes.
F. Distributions are determined on a tax basis and may differ from net investment income and realized capital gains for financial reporting purposes. Differences may be permanent or temporary. Permanent differences are reclassified among capital accounts in the financial statements to reflect their tax character. Temporary differences arise when certain items of income, expense, gain, or loss are recognized in different periods for financial statement and tax purposes; these differences will reverse at some time in the future. Differences in classification may also result from the treatment of short-term gains as ordinary income for tax purposes.
During the six months ended July 31, 2013, the fund realized net foreign currency losses of $462,000, which decreased distributable net income for tax purposes; accordingly, such losses have been reclassified from accumulated net realized gains to undistributed net investment income. Certain of the fund’s investments are in securities considered to be “passive foreign investment companies,” for which any unrealized appreciation and/or realized gains are required to be included in distributable net income for tax purposes. Passive foreign investment companies held at July 31, 2013, had unrealized appreciation of $28,015,000, as of January 31, 2013, the most recent mark-to-market date for tax purposes. This amount has been distributed and is reflected in the balance of undistributed net investment income.
The fund’s tax-basis capital gains and losses are determined only at the end of each fiscal year. For tax purposes, at January 31, 2013, the fund had available capital losses totaling $15,701,000 that may be carried forward indefinitely to offset future net capital gains. The fund will use these capital losses to offset net taxable capital gains, if any, realized during the year ending January 31, 2014; should the fund realize net capital losses for the year, the losses will be added to the loss carryforward balance above.
At July 31, 2013, the cost of investment securities for tax purposes was $7,672,400,000. Net unrealized appreciation of investment securities for tax purposes was $4,186,101,000, consisting of unrealized gains of $4,414,448,000 on securities that had risen in value since their purchase and $228,347,000 in unrealized losses on securities that had fallen in value since their purchase.
G. During the six months ended July 31, 2013, the fund purchased $1,239,449,000 of investment securities and sold $1,577,970,000 of investment securities, other than temporary cash investments.
25
Energy Fund
H. Capital share transactions for each class of shares were:
| | | | |
| | Six Months Ended | | Year Ended |
| | | July 31, 2013 | January 31, 2013 |
| | Amount | Shares | Amount | Shares |
| | ($000) | (000) | ($000) | (000) |
| Investor Shares | | | | |
| Issued | 257,019 | 4,116 | 695,926 | 11,544 |
| Issued in Lieu of Cash Distributions | 11,879 | 191 | 204,348 | 3,375 |
| Redeemed1 | (729,075) | (11,630) | (1,470,869) | (24,672) |
| Net Increase (Decrease)—Investor Shares | (460,177) | (7,323) | (570,595) | (9,753) |
| Admiral Shares | | | | |
| Issued | 508,368 | 4,330 | 1,015,171 | 9,110 |
| Issued in Lieu of Cash Distributions | 14,941 | 128 | 233,904 | 2,064 |
| Redeemed1 | (655,494) | (5,578) | (1,238,717) | (11,038) |
| Net Increase (Decrease)—Admiral Shares | (132,185) | (1,120) | 10,358 | 136 |
1 Net of redemption fees for fiscal 2013 of $642,000 (fund total). Effective May 23, 2012, the redemption fee was eliminated.
I. Management has determined that no material events or transactions occurred subsequent to July 31, 2013, that would require recognition or disclosure in these financial statements.
26
About Your Fund’s Expenses
As a shareholder of the fund, you incur ongoing costs, which include costs for portfolio management, administrative services, and shareholder reports (like this one), among others. Operating expenses, which are deducted from a fund’s gross income, directly reduce the investment return of the fund.
A fund’s expenses are expressed as a percentage of its average net assets. This figure is known as the expense ratio. The following examples are intended to help you understand the ongoing costs (in dollars) of investing in your fund and to compare these costs with those of other mutual funds. The examples are based on an investment of $1,000 made at the beginning of the period shown and held for the entire period.
The accompanying table illustrates your fund’s costs in two ways:
• Based on actual fund return. This section helps you to estimate the actual expenses that you paid over the period. The ”Ending Account Value“ shown is derived from the fund‘s actual return, and the third column shows the dollar amount that would have been paid by an investor who started with $1,000 in the fund. You may use the information here, together with the amount you invested, to estimate the expenses that you paid over the period.
To do so, simply divide your account value by $1,000 (for example, an $8,600 account value divided by $1,000 = 8.6), then multiply the result by the number given for your fund under the heading ”Expenses Paid During Period.“
• Based on hypothetical 5% yearly return. This section is intended to help you compare your fund‘s costs with those of other mutual funds. It assumes that the fund had a yearly return of 5% before expenses, but that the expense ratio is unchanged. In this case—because the return used is not the fund’s actual return—the results do not apply to your investment. The example is useful in making comparisons because the Securities and Exchange Commission requires all mutual funds to calculate expenses based on a 5% return. You can assess your fund’s costs by comparing this hypothetical example with the hypothetical examples that appear in shareholder reports of other funds.
Note that the expenses shown in the table are meant to highlight and help you compare ongoing costs only and do not reflect transaction costs incurred by the fund for buying and selling securities. Further, the expenses do not include any purchase, redemption, or account service fees described in the fund prospectus. If such fees were applied to your account, your costs would be higher. Your fund does not carry a “sales load.”
The calculations assume no shares were bought or sold during the period. Your actual costs may have been higher or lower, depending on the amount of your investment and the timing of any purchases or redemptions.
You can find more information about the fund’s expenses, including annual expense ratios, in the Financial Statements section of this report. For additional information on operating expenses and other shareholder costs, please refer to your fund’s current prospectus.
27
| | | |
| Six Months Ended July 31, 2013 | | | |
| | Beginning | Ending | Expenses |
| | Account Value | Account Value | Paid During |
| Energy Fund | 1/31/2013 | 7/31/2013 | Period |
| Based on Actual Fund Return | | | |
| Investor Shares | $1,000.00 | $1,028.31 | $1.86 |
| Admiral Shares | 1,000.00 | 1,028.46 | 1.56 |
| Based on Hypothetical 5% Yearly Return | | | |
| Investor Shares | $1,000.00 | $1,022.96 | $1.86 |
| Admiral Shares | 1,000.00 | 1,023.26 | 1.56 |
The calculations are based on expenses incurred in the most recent six-month period. The fund’s annualized six-month expense ratios for that period are 0.37% for Investor Shares and 0.31% for Admiral Shares. The dollar amounts shown as “Expenses Paid” are equal to the annualized expense ratio multiplied by the average account value over the period, multiplied by the number of days in the most recent six-month period, then divided by the number of days in the most recent 12-month period.
28
Trustees Approve Advisory Arrangements
The board of trustees of Vanguard Energy Fund has renewed the fund’s investment advisory arrangements with The Vanguard Group, Inc. (Vanguard), through its Equity Investment Group, and Wellington Management Company, LLP (Wellington Management). The board determined that renewing the fund’s advisory arrangement was in the best interests of the fund and its shareholders.
The board based its decision upon an evaluation of each advisor’s investment staff, portfolio management process, and performance. The trustees considered the factors discussed below, among others. However, no single factor determined whether the board approved the arrangements. Rather, it was the totality of the circumstances that drove the board’s decision.
Nature, extent, and quality of services
The board considered the quality of the fund’s investment management services over both the short and long term, and took into account the organizational depth and stability of each advisor. The board noted the following:
Vanguard. Vanguard has been managing investments for more than three decades. The Equity Investment Group adheres to a sound, disciplined investment management process; the team has considerable experience, stability, and depth. Vanguard has managed a portion of the fund since 2005.
Wellington Management. Founded in 1928, Wellington Management is among the nation’s oldest and most respected institutional investment managers. The investment team uses a bottom-up approach in which stocks are selected based on the advisor’s estimates of fundamental investment value. The advisor’s investment process emphasizes company fundamentals, management track record, and security valuation. The firm has advised the fund since the fund’s inception in 1984.
The board concluded that each advisor’s experience, stability, depth, and performance, among other factors, warranted the continuation of the advisory arrangements.
Investment performance
The board considered the short- and long-term performance of the fund, including any periods of outperformance or underperformance relative to a benchmark index and peer group. The board concluded that the performance was such that the advisory arrangement should continue. Information about the fund’s most recent performance can be found in the Performance Summary section of this report.
Cost
The board concluded that the fund’s expense ratio was well below the average expense ratio charged by funds in its peer group and that the fund’s advisory fee rate was also well below its peer-group average. Information about the fund’s expenses appears in the About Your Fund’s Expenses section of this report as well as in the Financial Statements section, which also includes information about the fund’s advisory fee rate.
The board did not consider profitability of Wellington Management in determining whether to approve the advisory fee, because Wellington Management is independent of Vanguard, and the advisory fee is the result of arm’s-length negotiations. The board does not conduct a profitability analysis of Vanguard, because of Vanguard’s unique “at-cost” structure. Unlike most other mutual fund management companies, Vanguard is owned by the funds it oversees, and produces “profits” only in the form of reduced expenses for fund shareholders.
29
The benefit of economies of scale
The board concluded that the fund’s shareholders benefit from economies of scale because of breakpoints in the fund’s advisory fee schedule for Wellington Management. The breakpoints reduce the effective rate of the fee as the fund’s assets managed by Wellington Management increase. The board also concluded that the fund’s at-cost arrangement with Vanguard ensures that the fund will realize economies of scale as it grows, with the cost to shareholders declining as the fund’s assets managed by Vanguard increase.
The board will consider whether to renew the advisory arrangement again after a one-year period.
30
Glossary
30-Day SEC Yield. A fund’s 30-day SEC yield is derived using a formula specified by the U.S. Securities and Exchange Commission. Under the formula, data related to the fund’s security holdings in the previous 30 days are used to calculate the fund’s hypothetical net income for that period, which is then annualized and divided by the fund’s estimated average net assets over the calculation period. For the purposes of this calculation, a security’s income is based on its current market yield to maturity (for bonds), its actual income (for asset-backed securities), or its projected dividend yield (for stocks). Because the SEC yield represents hypothetical annualized income, it will differ—at times significantly—from the fund’s actual experience. As a result, the fund’s income distributions may be higher or lower than implied by the SEC yield.
Beta. A measure of the magnitude of a fund’s past share-price fluctuations in relation to the ups and downs of a given market index. The index is assigned a beta of 1.00. Compared with a given index, a fund with a beta of 1.20 typically would have seen its share price rise or fall by 12% when the index rose or fell by 10%. For this report, beta is based on returns over the past 36 months for both the fund and the index. Note that a fund’s beta should be reviewed in conjunction with its R-squared (see definition). The lower the R-squared, the less correlation there is between the fund and the index, and the less reliable beta is as an indicator of volatility.
Dividend Yield. Dividend income earned by stocks, expressed as a percentage of the aggregate market value (or of net asset value, for a fund). The yield is determined by dividing the amount of the annual dividends by the aggregate value (or net asset value) at the end of the period. For a fund, the dividend yield is based solely on stock holdings and does not include any income produced by other investments.
Earnings Growth Rate. The average annual rate of growth in earnings over the past five years for the stocks now in a fund.
Equity Exposure. A measure that reflects a fund’s investments in stocks and stock futures. Any holdings in short-term reserves are excluded.
Expense Ratio. A fund’s total annual operating expenses expressed as a percentage of the fund’s average net assets. The expense ratio includes management and administrative expenses, but does not include the transaction costs of buying and selling portfolio securities.
Foreign Holdings. The percentage of a fund represented by securities or depositary receipts of companies based outside the United States.
Inception Date. The date on which the assets of a fund (or one of its share classes) are first invested in accordance with the fund’s investment objective. For funds with a subscription period, the inception date is the day after that period ends. Investment performance is measured from the inception date.
Median Market Cap. An indicator of the size of companies in which a fund invests; the midpoint of market capitalization (market price x shares outstanding) of a fund’s stocks, weighted by the proportion of the fund’s assets invested in each stock. Stocks representing half of the fund’s assets have market capitalizations above the median, and the rest are below it.
Price/Book Ratio. The share price of a stock divided by its net worth, or book value, per share. For a fund, the weighted average price/book ratio of the stocks it holds.
31
Price/Earnings Ratio. The ratio of a stock’s current price to its per-share earnings over the past year. For a fund, the weighted average P/E of the stocks it holds. P/E is an indicator of market expectations about corporate prospects; the higher the P/E, the greater the expectations for a company’s future growth.
R-Squared. A measure of how much of a fund’s past returns can be explained by the returns from the market in general, as measured by a given index. If a fund’s total returns were precisely synchronized with an index’s returns, its R-squared would be 1.00. If the fund’s returns bore no relationship to the index’s returns, its R-squared would be 0. For this report, R-squared is based on returns over the past 36 months for both the fund and the index.
Return on Equity. The annual average rate of return generated by a company during the past five years for each dollar of shareholder’s equity (net income divided by shareholder’s equity). For a fund, the weighted average return on equity for the companies whose stocks it holds.
Short-Term Reserves. The percentage of a fund invested in highly liquid, short-term securities that can be readily converted to cash.
Turnover Rate. An indication of the fund’s trading activity. Funds with high turnover rates incur higher transaction costs and may be more likely to distribute capital gains (which may be taxable to investors). The turnover rate excludes in-kind transactions, which have minimal impact on costs.
Benchmark Information
Spliced Energy Index: S&P 500 Index through November 30, 2000; S&P Energy Sector Index through May 31, 2010; MSCI All Country World Energy Index thereafter.
32
This page intentionally left blank.
This page intentionally left blank.
This page intentionally left blank.
The People Who Govern Your Fund
The trustees of your mutual fund are there to see that the fund is operated and managed in your best interests since, as a shareholder, you are a part owner of the fund. Your fund’s trustees also serve on the board of directors of The Vanguard Group, Inc., which is owned by the Vanguard funds and provides services to them on an at-cost basis.
A majority of Vanguard’s board members are independent, meaning that they have no affiliation with Vanguard or the funds they oversee, apart from the sizable personal investments they have made as private individuals. The independent board members have distinguished backgrounds in business, academia, and public service. Each of the trustees and executive officers oversees 181 Vanguard funds.
The following table provides information for each trustee and executive officer of the fund. More information about the trustees is in the Statement of Additional Information, which can be obtained, without charge, by contacting Vanguard at 800-662-7447, or online at vanguard.com.
| |
| InterestedTrustee1 | and Delphi Automotive LLP (automotive components); |
| | Senior Advisor at New Mountain Capital; Trustee of |
| | The Conference Board. |
| F. William McNabb III | |
| Born 1957. Trustee Since July 2009. Chairman of the | |
| Board. Principal Occupation(s) During the Past Five | Amy Gutmann |
| Years: Chairman of the Board of The Vanguard Group, | Born 1949. Trustee Since June 2006. Principal |
| Inc., and of each of the investment companies served | Occupation(s) During the Past Five Years: President |
| by The Vanguard Group, since January 2010; Director | of the University of Pennsylvania; Christopher H. |
| of The Vanguard Group since 2008; Chief Executive | Browne Distinguished Professor of Political Science |
| Officer and President of The Vanguard Group and of | in the School of Arts and Sciences with secondary |
| each of the investment companies served by The | appointments at the Annenberg School for |
| Vanguard Group since 2008; Director of Vanguard | Communication and the Graduate School of Education |
| Marketing Corporation; Managing Director of The | of the University of Pennsylvania; Member of the |
| Vanguard Group (1995–2008). | National Commission on the Humanities and Social |
| | Sciences; Trustee of Carnegie Corporation of New |
| | York and of the National Constitution Center; Chair |
| IndependentTrustees | of the U. S. Presidential Commission for the Study |
| | of Bioethical Issues. |
| |
| Emerson U. Fullwood | JoAnn Heffernan Heisen |
| Born 1948. Trustee Since January 2008. Principal | Born 1950. Trustee Since July 1998. Principal |
| Occupation(s) During the Past Five Years: Executive | Occupation(s) During the Past Five Years: Corporate |
| Chief Staff and Marketing Officer for North America | Vice President and Chief Global Diversity Officer |
| and Corporate Vice President (retired 2008) of Xerox | (retired 2008) and Member of the Executive |
| Corporation (document management products and | Committee (1997–2008) of Johnson & Johnson |
| services); Executive in Residence and 2010 | (pharmaceuticals/medical devices/consumer |
| Distinguished Minett Professor at the Rochester | products); Director of Skytop Lodge Corporation |
| Institute of Technology; Director of SPX Corporation | (hotels), the University Medical Center at Princeton, |
| (multi-industry manufacturing), the United Way of | the Robert Wood Johnson Foundation, and the Center |
| Rochester, Amerigroup Corporation (managed health | for Talent Innovation; Member of the Advisory Board |
| care), the University of Rochester Medical Center, | of the Maxwell School of Citizenship and Public Affairs |
| Monroe Community College Foundation, and North | at Syracuse University. |
| Carolina A&T University. | |
| |
| Rajiv L. Gupta | F. Joseph Loughrey |
| Born 1945. Trustee Since December 2001.2 | Born 1949. Trustee Since October 2009. Principal |
| Principal Occupation(s) During the Past Five Years: | Occupation(s) During the Past Five Years: President |
| Chairman and Chief Executive Officer (retired 2009) | and Chief Operating Officer (retired 2009) of Cummins |
| and President (2006–2008) of Rohm and Haas Co. | Inc. (industrial machinery); Chairman of the Board of |
| (chemicals); Director of Tyco International, Ltd. | Hillenbrand, Inc. (specialized consumer services) and |
| (diversified manufacturing and services), Hewlett- | of Oxfam America; Director of SKF AB (industrial |
| Packard Co. (electronic computer manufacturing), | |
| | |
| machinery) and the Lumina Foundation for Education; | Executive Officers | |
| Member of the Advisory Council for the College of | | |
| Arts and Letters and of the Advisory Board to the | Glenn Booraem | |
| Kellogg Institute for International Studies, both at | Born 1967. Controller Since July 2010. Principal |
| the University of Notre Dame. | Occupation(s) During the Past Five Years: Principal |
| | of The Vanguard Group, Inc.; Controller of each of |
| Mark Loughridge | the investment companies served by The Vanguard |
| Born 1953. Trustee Since March 2012. Principal | Group; Assistant Controller of each of the investment |
| Occupation(s) During the Past Five Years: Senior Vice | companies served by The Vanguard Group (2001–2010). |
| President and Chief Financial Officer at IBM (information | | |
| technology services); Fiduciary Member of IBM’s | Thomas J. Higgins | |
| Retirement Plan Committee. | Born 1957. Chief Financial Officer Since September |
| | 2008. Principal Occupation(s) During the Past Five |
| Scott C. Malpass | Years: Principal of The Vanguard Group, Inc.; Chief |
| Born 1962. Trustee Since March 2012. Principal | Financial Officer of each of the investment companies |
| Occupation(s) During the Past Five Years: Chief | served by The Vanguard Group; Treasurer of each of |
| Investment Officer and Vice President at the University | the investment companies served by The Vanguard |
| of Notre Dame; Assistant Professor of Finance at the | Group (1998–2008). | |
| Mendoza College of Business at Notre Dame; Member | | |
| of the Notre Dame 403(b) Investment Committee; | Kathryn J. Hyatt | |
| Director of TIFF Advisory Services, Inc. (investment | Born 1955. Treasurer Since November 2008. Principal |
| advisor); Member of the Investment Advisory | Occupation(s) During the Past Five Years: Principal of |
| Committees of the Financial Industry Regulatory | The Vanguard Group, Inc.; Treasurer of each of the |
| Authority (FINRA) and of Major League Baseball. | investment companies served by The Vanguard |
| | Group; Assistant Treasurer of each of the investment |
| André F. Perold | companies served by The Vanguard Group (1988–2008). |
| Born 1952. Trustee Since December 2004. Principal | | |
| Occupation(s) During the Past Five Years: George | Heidi Stam | |
| Gund Professor of Finance and Banking at the Harvard | Born 1956. Secretary Since July 2005. Principal |
| Business School (retired 2011); Chief Investment | Occupation(s) During the Past Five Years: Managing |
| Officer and Managing Partner of HighVista Strategies | Director of The Vanguard Group, Inc.; General Counsel |
| LLC (private investment firm); Director of Rand | of The Vanguard Group; Secretary of The Vanguard |
| Merchant Bank; Overseer of the Museum of Fine | Group and of each of the investment companies |
| Arts Boston. | served by The Vanguard Group; Director and Senior |
| | Vice President of Vanguard Marketing Corporation. |
| Alfred M. Rankin, Jr. | | |
| Born 1941. Trustee Since January 1993. Principal | | |
| Occupation(s) During the Past Five Years: Chairman, | Vanguard Senior ManagementTeam |
| President, and Chief Executive Officer of NACCO | | |
| Industries, Inc. (housewares/lignite) and of Hyster-Yale | Mortimer J. Buckley | Chris D. McIsaac |
| Materials Handling, Inc. (forklift trucks); Director of | Kathleen C. Gubanich | Michael S. Miller |
| the National Association of Manufacturers; Chairman | Paul A. Heller | James M. Norris |
| of the Board of University Hospitals of Cleveland; | Martha G. King | Glenn W. Reed |
| Advisory Chairman of the Board of The Cleveland | John T. Marcante | |
| Museum of Art. | | |
| | |
| Peter F. Volanakis | Chairman Emeritus and Senior Advisor |
| Born 1955. Trustee Since July 2009. Principal | | |
| Occupation(s) During the Past Five Years: President | John J. Brennan | |
| and Chief Operating Officer (retired 2010) of Corning | Chairman, 1996–2009 | |
| Incorporated (communications equipment); Director | Chief Executive Officer and President, 1996–2008 |
| of SPX Corporation (multi-industry manufacturing); | | |
| Overseer of the Amos Tuck School of Business | | |
| Administration at Dartmouth College; Advisor to the | Founder | |
| Norris Cotton Cancer Center. | | |
| | John C. Bogle | |
| Chairman and Chief Executive Officer, 1974–1996 | |
| | |
| | |
1 Mr. McNabb is considered an “interested person,” as defined in the Investment Company Act of 1940, because he is an officer of the Vanguard funds.
2 December 2002 for Vanguard Equity Income Fund, Vanguard Growth Equity Fund, the Vanguard Municipal Bond Funds, and the Vanguard State Tax-Exempt Funds.
| 
|
| P.O. Box 2600 | |
| Valley Forge, PA 19482-2600 | |
Connect with Vanguard® > vanguard.com
| |
| Fund Information > 800-662-7447 | CFA® is a trademark owned by CFA Institute. |
| Direct Investor Account Services > 800-662-2739 | |
| Institutional Investor Services > 800-523-1036 | |
| Text Telephone for People | |
| With Hearing Impairment > 800-749-7273 | |
| |
| This material may be used in conjunction | |
| with the offering of shares of any Vanguard | |
| fund only if preceded or accompanied by | |
| the fund’s current prospectus. | |
| |
| All comparative mutual fund data are from Lipper, a | |
| Thomson Reuters Company, or Morningstar, Inc., unless | |
| otherwise noted. | |
| |
| You can obtain a free copy of Vanguard’s proxy voting | |
| guidelines by visiting vanguard.com/proxyreporting or by | |
| calling Vanguard at 800-662-2739. The guidelines are | |
| also available from the SEC’s website, sec.gov. In | |
| addition, you may obtain a free report on how your fund | |
| voted the proxies for securities it owned during the 12 | |
| months ended June 30. To get the report, visit either | |
| vanguard.com/proxyreporting or sec.gov. | |
| |
| You can review and copy information about your fund at | |
| the SEC’s Public Reference Room in Washington, D.C. To | |
| find out more about this public service, call the SEC at | |
| 202-551-8090. Information about your fund is also | |
| available on the SEC’s website, and you can receive | |
| copies of this information, for a fee, by sending a | |
| request in either of two ways: via e-mail addressed to | |
| publicinfo@sec.gov or via regular mail addressed to the | |
| Public Reference Section, Securities and Exchange | |
| Commission, Washington, DC 20549-1520. | |
| |
| | © 2013 The Vanguard Group, Inc. |
| | All rights reserved. |
| | Vanguard Marketing Corporation, Distributor. |
| |
| | Q512 092013 |
| 
|
| Semiannual Report | July 31, 2013 |
| Vanguard Health Care Fund |
|
 |
|
> For the six months ended July 31, 2013, Vanguard Health Care Fund returned about 19%, outpacing both its benchmark and the average return of peer funds.
> The fund’s advance was broadly based, with groups ranging from biotechnology firms to health insurers to medical device makers notching strong results.
> Health care stocks outperformed the broader market, both domestically and internationally.
| |
| Contents | |
| Your Fund’s Total Returns. | 1 |
| Chairman’s Letter. | 2 |
| Advisor’s Report. | 7 |
| Fund Profile. | 11 |
| Performance Summary. | 12 |
| Financial Statements. | 13 |
| About Your Fund’s Expenses. | 26 |
| Trustees Approve Advisory Agreement. | 28 |
| Glossary. | 29 |
Please note: The opinions expressed in this report are just that—informed opinions. They should not be considered promises or advice.
Also, please keep in mind that the information and opinions cover the period through the date on the front of this report. Of course, the
risks of investing in your fund are spelled out in the prospectus.
See the Glossary for definitions of investment terms used in this report.
About the cover: Our cover photograph shows rigging on the HMSSurprise, a replica of an 18th-century Royal Navy frigate. It was featured in the 2003 movie Master and Commander: The Far Side of the World, which was based on Patrick O’Brian’s sea novels, set amid the Napoleonic Wars. Vanguard was named for another ship of that era, the HMSVanguard, which was the flagship of British Admiral Horatio Nelson at the Battle of the Nile.
Your Fund’s Total Returns
Six Months Ended July 31, 2013
| |
| | Total |
| | Returns |
| Vanguard Health Care Fund | |
| Investor Shares | 19.18% |
| Admiral™ Shares | 19.21 |
| MSCI All Country World Health Care Index | 15.54 |
| Global Health/Biotechnology Funds Average | 18.61 |
Global Health/Biotechnology Funds Average: Derived from data provided by Lipper, a Thomson Reuters Company.
Admiral Shares carry lower expenses and are available to investors who meet certain account-balance requirements.
Your Fund’s Performance at a Glance
January 31, 2013, Through July 31, 2013
| | | | |
| | | | Distributions Per Share |
| | Starting | Ending | Income | Capital |
| | Share Price | Share Price | Dividends | Gains |
| Vanguard Health Care Fund | | | | |
| Investor Shares | $152.58 | $177.41 | $0.038 | $3.854 |
| Admiral Shares | 64.37 | 74.86 | 0.020 | 1.625 |
1

Chairman’s Letter
Dear Shareholder,
Capitalizing on a robust performance by health care stocks around the world, Vanguard Health Care Fund delivered impressive results for the six months ended July 31, 2013. The fund returned 19.18% for Investor Shares and 19.21% for Admiral Shares, outpacing its comparative standards.
Peer funds, on average, returned 18.61%, and the benchmark MSCI All Country World Health Care Index gained 15.54%. The Health Care Fund’s advisor had success across the industry spectrum, with biotechnology firms, health insurers, and medical device makers recording double-digit advances.
U.S. stocks set a brisk pace; international markets struggled
U.S. stocks, which returned about 14% for the half year, posted positive returns in five of the six months. The exception was June, when stocks slid after Federal Reserve Chairman Ben Bernanke said the central bank could begin unwinding its stimulative bond-buying program later this year. July saw domestic stocks rebound sharply, helped by favorable economic news and reassuring words from Fed officials.
Despite rising in July, international stocks finished the period with a return of less than 1%. Much of the weakness came from emerging markets, where the slowing rate of growth, especially in
2
China and Brazil, has been a concern. Developed markets in the Pacific region and Europe posted modest gains.
Bonds encountered obstacles as market uncertainty increased
Bonds, which also suffered in June amid concerns that the Fed could start tapering its bond buying, posted negative returns for the six months. Although July brought a little relief, the broad U.S. taxable bond market returned –1.62%. The yield of the 10-year Treasury note finished the six months at 2.60%, up from 2.47% in June and 1.67% at the end of April. (Bond yields and prices move in opposite directions.)
Municipal bonds fared worse, returning –3.94% for the period. Although the municipal market was roiled in July by Detroit’s bankruptcy filing, it’s worth remembering that Detroit debt represents a tiny fraction—just 0.05%—of the entire muni bond market. We continue to believe that municipal bonds may make sense as part of a diversified portfolio for those in higher tax brackets. As Sarah Hammer, a senior investment analyst with Vanguard Investment Strategy Group, put it, “State and local governments have the ability and willingness to continue to make their debt service payments.”
| | | |
| Market Barometer | | | |
| |
| | | | Total Returns |
| | | Periods Ended July 31, 2013 |
| | Six | One | Five Years |
| | Months | Year | (Annualized) |
| Stocks | | | |
| Russell 1000 Index (Large-caps) | 13.83% | 26.23% | 8.49% |
| Russell 2000 Index (Small-caps) | 16.66 | 34.76 | 9.45 |
| Russell 3000 Index (Broad U.S. market) | 14.05 | 26.86 | 8.57 |
| MSCI All Country World Index ex USA (International) | 0.26 | 16.96 | 0.79 |
| |
| Bonds | | | |
| Barclays U.S. Aggregate Bond Index (Broad taxable market) | -1.62% | -1.91% | 5.23% |
| Barclays Municipal Bond Index (Broad tax-exempt market) | -3.94 | -2.19 | 5.07 |
| Citigroup Three-Month U.S. Treasury Bill Index | 0.03 | 0.08 | 0.20 |
| |
| CPI | | | |
| Consumer Price Index | 1.44% | 1.96% | 1.21% |
3
The Fed’s target for short-term rates remained between 0% and 0.25%, keeping the returns from money market funds and savings accounts exceptionally low.
Health care stocks delivered another strong showing
Health care stocks, both domestically and internationally, outperformed the broader market in the six-month period. The MSCI All Country World Health Care Index returned 15.54%, far above the 6.57% gain of the broader MSCI All Country World Index. The health care sector’s performance edge has persisted over the past couple of years. The success of biotechnology, medical device, and pharmaceutical companies in winning regulatory approval for new products has contributed to this relative strength.
Of course, we don’t expect the sector to outperform in all periods. Indeed, before 2011, health care stocks globally had significantly lagged the broad market for two consecutive years. The variability in outperformance among sectors is one of the reasons Vanguard counsels that a diversified portfolio should include broad market exposure and avoid overconcentra-tion in a narrow segment. (For more about the increased volatility associated with sector investments, please see the Investment Insight box on page 5.)
As I mentioned, the fund’s advisor, Wellington Management Company, was able to capitalize on the favorable environment for health care stocks in the fiscal half year. The fund produced gains in each of the six months.
Expense Ratios
Your Fund Compared With Its Peer Group
| | | |
| | Investor | Admiral | Peer Group |
| | Shares | Shares | Average |
| Health Care Fund | 0.35% | 0.30% | 1.32% |
The fund expense ratios shown are from the prospectus dated May 28, 2013, and represent estimated costs for the current fiscal year. For the six months ended July 31, 2013, the fund’s annualized expense ratios were 0.35% for Investor Shares and 0.30% for Admiral Shares. The peer-group expense ratio is derived from data provided by Lipper, a Thomson Reuters Company, and captures information through year-end 2012.
Peer group: Global Health/Biotechnology Funds.
4
Holdings among health insurers, in particular, helped boost performance. The advisor has made substantial investments in these companies, seeing their shares as attractively valued. Insurers may also benefit over time, if, as expected, more people receive coverage as a result of the Affordable Care Act. As of July 31, almost 13% of the fund was invested in the stocks of health insurance or managed care companies, more than double the allocation in the benchmark.
| Investment insight |
| A reminder about volatility |
| The health care sector, like most other sectors, tends to be more volatile than |
| the broad market. During the past ten years, Vanguard Health Care Fund has often |
| risen or fallen farther, month by month, than the S&P 500 Index, as the chart below |
| shows. Such a result should be no surprise. After all, less diversification generally |
| means more risk. |
| |
| In the health care sector, the ups and downs are also influenced by dynamic |
| variables inherent to the industry. These include legal and regulatory risks, the threat |
| of patent expirations on key products, and intense competitive pressures—all of |
| which have affected the performance of health care stocks in recent years. The |
| sector’s volatility is one reason we suggest that the Health Care Fund should |
| typically represent no more than a modest portion of a stock portfolio. |
| |
| |
| Performance difference between the Health Care Fund and the S&P 500 Index |
| (June 30, 2003–June 30, 2013) |
|
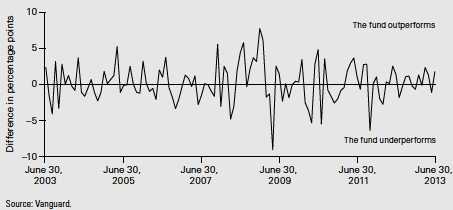 |
|
5
The fund’s investments in the biotechnology, medical device, and pharmaceutical arenas generally fared well. Its holdings in a few drugmakers based outside the United States slumped, but those declines didn’t detract much from the fund’s overall return.
I want to note that this was the first full reporting period in which Jean M. Hynes was the fund’s sole portfolio manager. As I wrote to you in the annual report, Edward P. Owens retired at the end of 2012 after nearly three decades of adroitly managing the Health Care Fund. I am confident that Jean, who was part of Ed’s team for about two decades and had been associate portfolio manager since 2008, can carry on the fund’s tradition of excellence.
The Advisor’s Report that follows this letter provides additional details about the management of the fund during the half year.
Predicting the future is tricky, but preparing for it is prudent
Now that much of 2013 is in the rearview mirror, it’s clear that few of us had anticipated several big events—such as record highs in some stock market indexes, the powerful rally in long-slumbering Japan, and renewed upheaval in Egypt. Of course, such unpredictability underscores the challenge of forecasting.
Vanguard’s approach to forecasting differs from that of many other investment firms. Joe Davis, our chief economist, is fond of saying that we “treat the future with the deference it deserves.”
Each January, our economists publish Vanguard’s Economic and Investment Outlook (available at vanguard.com/ research). They update their perspectives periodically and address significant developments—such as Detroit’s bankruptcy filing—with thoughtful, timely analysis and commentary. But, in keeping with Joe’s observation, our economists don’t make the pinpoint projections that you’ll see elsewhere.
Instead, using sophisticated statistical models, we provide a range and probability of potential outcomes—for the inflation rate or the 10-year Treasury yield, for example. And we explain our rationale for such outcomes.
In short, our forecasts acknowledge that no one has a crystal ball or can envision every scenario. And that underlines one of our core investment principles: Develop a suitable asset allocation using broadly diversified funds. Having a balanced portfolio can help you get through unforeseen events and achieve your goals—even without a crystal ball.
As always, thank you for investing with Vanguard.
Sincerely,

F. William McNabb III
Chairman and Chief Executive Officer
August 14, 2013
6
Advisor’s Report
For the six months ended July 31, 2013, Vanguard Health Care Fund delivered solid absolute and relative returns, generating 19.18% for Investor Shares and 19.21% for Admiral Shares. The fund’s benchmark, the MSCI All Country World Health Care Index, posted a 15.54% gain. Although we view the index as a good, representative proxy for what is happening in our market, it is important to note that we do not base portfolio construction decisions for the fund on this or any other benchmark.
Major Portfolio Changes
Six Months Ended July 31, 2013
| |
| Additions | Comments |
| Vertex Pharmaceuticals | We added to our position in this biotechnology firm. We are most |
| | interested in Vertex’s development of drugs for cystic fibrosis. Vertex |
| | continues to do interesting work on hepatitis C treatment, which may have |
| | promise in the intermediate term. |
| Bristol-Myers Squibb | We also bought more shares of this global biopharmaceutical company. Its |
| | outlook has strengthened over the past year, with global approval of Eliquis |
| | and exciting phase-two data on an antibody-based treatment for cancer. |
| | Growth products, such as Sprycel and Orencia, are gaining traction. We |
| | believe the firm’s assets will offer revenue beyond the more modest |
| | consensus expectations. |
| UCB | First-quarter sales were disappointing to market participants, weakening the |
| | stock. There is a patent challenge to one of UCB’s main growth drivers, |
| | Vimpat, a drug for epilepsy. However, we are confident that Vimpat will be |
| | protected from generic competition at least until 2022. We took advantage |
| | of the stock’s weakness to add to our position. |
| |
| Reductions | Comments |
| AbbVie | Trimmed into strength. On January 1, Abbott Laboratories was split into |
| | two companies: an innovation-focused pharmaceutical company called |
| | AbbVie and a diversified medical products company retaining the Abbott |
| | name. AbbVie’s successful drug Humira offers patients pain relief and |
| | reduction in inflammation related to various autoimmune diseases. We took |
| | some profits following strong relative performance versus other |
| | pharmaceutical companies. |
| Quest Diagnostics | We eliminated our position; we increasingly lacked confidence in Quest’s |
| | ability to capture market share and anticipated weak volume growth in the |
| | near term. In addition, we expect pressure from reimbursement cuts to |
| | continue. |
| Johnson & Johnson | We trimmed our holding in this U.S.-based diversified health care products |
| | company, which remains the fund’s most significantly underweighted |
| | position relative to our benchmark. Johnson & Johnson is a solid company, |
| | but we believe its near-term potential is limited relative to other |
| opportunities on a risk-adjusted basis. |
|
7
The investment environment
It was a strong period for stocks in general and the health care sector in particular. Health care stocks far outperformed the world equity markets as a whole, with the MSCI All Country World Index returning 6.57%.
Throughout the period, we endeavored to focus on companies at the center of medical innovation and those that will benefit from the changes in the U.S. health care system, including certain managed care organizations that we view as well-positioned irrespective of the path of industry reforms over time.
Our successes
Our health services holdings were key drivers of the fund’s returns. Our positioning within the medical product/ technology subsector was also favorable. Top contributors included managed care stocks UnitedHealth Group and WellPoint and biopharmaceutical holdings Amgen, Merck, Forest Laboratories, and Roche.
Given the stock’s favorable performance and the fund’s large position in it, UnitedHealth Group was the fund’s greatest absolute contributor for the period. We believe that this U.S.-based company, a provider of health care benefits and services, is competitively positioned to grow steadily over the next few years, benefiting from a favorable environment in which medical cost trend acceleration continues to lag premium price increases. Although we expect pressure on UnitedHealth’s Medicare Advantage fees in the future, growth for another business line, Optum, should offset these pressures. The stock’s valuation remains attractive in our view. Relative to the index, UnitedHealth Group is a significantly overweight position for the fund, and it was our second-largest holding at the period’s close.
Amgen was another strong performer for the fund. The company has a solid growth outlook thanks to a pipeline that includes two potential blockbuster drugs for cholesterol and osteoporosis. We slightly trimmed our position in Amgen, however, redeploying the proceeds to other stocks that, on the margin, we view as more attractive at this time.
Our largest holding at the period’s close, Merck, was again among our most significant contributors to absolute performance. We are attracted to the growth potential of the company’s current global lineup, including its diabetes drug Januvia and its vaccine business. In addition, we think that Merck’s late-stage pipeline of new medications in development, including a novel osteoporosis drug and an antibody-based cancer treatment, will likely augment growth through the rest of this decade.
8
Our shortfalls
The environment for the health care sector was favorable during this period. Given that background, not many holdings had a materially adverse effect on the fund’s performance.
However, despite very strong performance in the Japanese market, our Japanese biopharmaceutical holdings (particularly Takeda Pharmaceutical and Eisai) hindered returns on the margin because of the depreciation of the yen. Our partial hedge did mitigate the depreciation to some extent. The share price of Astellas Pharma, another Japan-based holding, rose only modestly and was therefore a drag on performance relative to the index.
Our relative returns were also impeded somewhat because we did not own three stocks that did quite well during the period: Celgene, Valeant Pharmaceuticals, and Express Scripts.
The fund’s positioning
With total net assets of approximately $30 billion as of July 31, Vanguard Health Care Fund is the largest mutual fund of its kind. And the fund’s size has put a floor on stocks we consider for new investment at roughly $3 billion in market capitalization, although most of our investments are in much larger companies. The asset-weighted average market cap of the fund’s holdings was $56 billion at the close of the period.
At the end of the half year, a little more than 20% of the fund’s assets were invested outside the United States, a strategy that has provided diversification and improved performance over longer periods. The portfolio is diversified, with about 90 holdings across health care subsectors as of July 31. We expect that the number of holdings will stay near that level or perhaps get slightly higher. At times, we may elect to gain exposure to certain themes or subsectors of the market through more and smaller positions rather than fewer and larger positions. Still, the top five holdings represent a meaningful portion of assets—more than 20% at the period’s close.
The fund’s cash position ranged from 3% to 4% during most of the semiannual period, but stood at roughly 5% on July 31 as we raised cash after the strong climb in health care stocks. We expect the fund’s cash level will be in the approximate range of 3% to 5%, which is somewhat lower than the historical cash level.
Turnover will remain quite low, but it will likely be higher than the single-digit annualized rate seen over the last few years. The fund’s annualized turnover as of July 31 was approximately 18%.
9
The health care industry continues to offer many long-term opportunities, albeit with some challenges. After a decade of lower productivity, we are beginning to see evidence of more biopharmaceutical innovation. We see a bright future for the industry despite an uncertain and potentially challenging regulatory outlook.
We will strive for early identification of the drugs and devices with the best chances of changing medicine, as well as of the service companies that are best positioned to capture opportunities along the health care chain. We will remain diversified across subsectors and regions, focused on the long haul, and invested in what we view as the most attractive health care stocks.
Jean M. Hynes, CFA
Senior Vice President and
Portfolio Manager
Wellington Management Company, LLP
August 19, 2013
10
Health Care Fund
Fund Profile
As of July 31, 2013
| | |
| Share-Class Characteristics | |
| | Investor | Admiral |
| | Shares | Shares |
| Ticker Symbol | VGHCX | VGHAX |
| Expense Ratio1 | 0.35% | 0.30% |
| 30-Day SEC | | |
| Yield | 1.38% | 1.43% |
| | | |
| Portfolio Characteristics | | |
| | | MSCI | DJ U.S. |
| | | ACWI | Total |
| | | Health | Market |
| | Fund | Care | FA Index |
| Number of Stocks | 90 | 145 | 3,619 |
| Median Market Cap | $27.8B | $72.0B | $40.3B |
| Price/Earnings Ratio | 22.3x | 20.6x | 18.9x |
| Price/Book Ratio | 2.9x | 3.4x | 2.5x |
| Return on Equity | 17.2% | 21.0% | 16.5% |
| Earnings Growth | | | |
| Rate | 7.1% | 7.8% | 10.4% |
| Dividend Yield | 1.8% | 2.2% | 1.9% |
| Foreign Holdings | 21.4% | 40.3% | 0.0% |
| Turnover Rate | | | |
| (Annualized) | 18% | — | — |
| Short-Term Reserves | 5.0% | — | — |
| | |
| Subindustry Diversification (% of equity exposure) | |
| | | MSCI |
| | | ACWI |
| | | Health |
| | Fund | Care |
| Biotechnology | 13.1% | 12.7% |
| Consumer Staples | 2.9 | 0.0 |
| Health Care Distributors | 5.5 | 2.5 |
| Health Care Equipment | 11.5 | 11.5 |
| Health Care Facilities | 2.6 | 0.8 |
| Health Care Services | 0.1 | 4.0 |
| Health Care Supplies | 0.3 | 1.1 |
| Health Care Technology | 2.3 | 0.5 |
| Life Sciences Tools & Services | 3.1 | 2.7 |
| Managed Health Care | 12.7 | 4.9 |
| Pharmaceuticals | 45.9 | 59.3 |
| | |
| Volatility Measures | | |
| | MSCI | |
| | ACWI | DJ U.S. |
| | Health | Total Market |
| | Care | FA Index |
| R-Squared | 0.93 | 0.71 |
| Beta | 0.86 | 0.63 |
These measures show the degree and timing of the fund’s fluctuations compared with the indexes over 36 months.
| | |
| Ten Largest Holdings (% of total net assets) |
| Merck & Co. Inc. | Pharmaceuticals | 5.8% |
| UnitedHealth Group Inc. | Managed Health | |
| | Care | 4.6 |
| Roche Holding AG | Pharmaceuticals | 4.0 |
| Amgen Inc. | Biotechnology | 3.9 |
| Forest Laboratories Inc. | Pharmaceuticals | 3.9 |
| McKesson Corp. | Health Care | |
| | Distributors | 3.5 |
| Bristol-Myers Squibb Co. Pharmaceuticals | 3.1 |
| Eli Lilly & Co. | Pharmaceuticals | 2.8 |
| AstraZeneca plc | Pharmaceuticals | 2.7 |
| Astellas Pharma Inc. | Pharmaceuticals | 2.6 |
| Top Ten | | 36.9% |
The holdings listed exclude any temporary cash investments and equity index products.
| |
| Market Diversification (% of equity exposure) |
| |
| Europe | |
| Switzerland | 5.8% |
| United Kingdom | 3.1 |
| Belgium | 1.9 |
| Ireland | 1.1 |
| Other | 1.4 |
| Subtotal | 13.3% |
| Pacific | |
| Japan | 7.6% |
| North America | |
| United States | 77.5% |
| Middle East | |
| Israel | 1.6% |
1 The expense ratios shown are from the prospectus dated May 28, 2013, and represent estimated costs for the current fiscal year. For the six months ended July 31, 2013, the annualized expense ratios were 0.35% for Investor Shares and 0.30% for Admiral Shares.
11
Health Care Fund
Performance Summary
All of the returns in this report represent past performance, which is not a guarantee of future results that may be achieved by the fund. (Current performance may be lower or higher than the performance data cited. For performance data current to the most recent month-end, visit our website at vanguard.com/performance.) Note, too, that both investment returns and principal value can fluctuate widely, so an investor’s shares, when sold, could be worth more or less than their original cost. The returns shown do not reflect taxes that a shareholder would pay on fund distributions or on the sale of fund shares.
Fiscal-Year Total Returns (%): January 31, 2003, Through July 31, 2013
For a benchmark description, see the Glossary.
Note: For 2014, performance data reflect the six months ended July 31, 2013.
Average Annual Total Returns: Periods Ended June 30, 2013
This table presents returns through the latest calendar quarter—rather than through the end of the fiscal period.
Securities and Exchange Commission rules require that we provide this information.
| | | | |
| | Inception | One | Five | Ten |
| | Date | Year | Years | Years |
| Investor Shares | 5/23/1984 | 26.41% | 12.21% | 10.22% |
| Admiral Shares | 11/12/2001 | 26.47 | 12.27 | 10.30 |
See Financial Highlights for dividend and capital gains information.
12
Health Care Fund
Financial Statements (unaudited)
Statement of Net Assets
As of July 31, 2013
The fund reports a complete list of its holdings in regulatory filings four times in each fiscal year, at the quarter-ends. For the second and fourth fiscal quarters, the lists appear in the fund’s semiannual and annual reports to shareholders. For the first and third fiscal quarters, the fund files the lists with the Securities and Exchange Commission on Form N-Q. Shareholders can look up the fund’s Forms N-Q on the SEC’s website at sec.gov. Forms N-Q may also be reviewed and copied at the SEC’s Public Reference Room (see the back cover of this report for further information).
| | | |
| | | | Market |
| | | | Value |
| | | Shares | ($000) |
| Common Stocks (95.1%) | | |
| United States (73.7%) | | |
| Biotechnology (10.8%) | | |
| | Amgen Inc. | 10,758,455 | 1,165,033 |
| * | Vertex | | |
| | Pharmaceuticals Inc. | 5,990,000 | 478,002 |
| * | Gilead Sciences Inc. | 6,487,800 | 398,675 |
| * | Regeneron | | |
| | Pharmaceuticals Inc. | 1,412,100 | 381,352 |
| * | Biogen Idec Inc. | 1,451,300 | 316,572 |
| * | Onyx | | |
| | Pharmaceuticals Inc. | 1,022,700 | 134,281 |
| * | Incyte Corp. Ltd. | 3,807,443 | 89,132 |
| * | Alkermes plc | 2,563,918 | 86,096 |
| * | Cubist | | |
| | Pharmaceuticals Inc. | 1,323,142 | 82,472 |
| * | Quintiles Transnational | | |
| | Holdings Inc. | 1,164,961 | 52,249 |
| * | Ironwood | | |
| | Pharmaceuticals Inc. | | |
| | Class A | 3,278,128 | 40,124 |
| | | | 3,223,988 |
| Food & Staples Retailing (2.8%) | |
| | Walgreen Co. | 12,465,900 | 626,412 |
| | CVS Caremark Corp. | 3,335,100 | 205,075 |
| | | | 831,487 |
| Health Care Equipment & Supplies (10.9%) |
| | Medtronic Inc. | 10,532,800 | 581,832 |
| * | Boston Scientific Corp. | 43,137,300 | 471,059 |
| | St. Jude Medical Inc. | 6,297,900 | 329,947 |
| | Abbott Laboratories | 7,591,400 | 278,073 |
| | Becton Dickinson and Co. | 2,571,700 | 266,737 |
| | Covidien plc | 4,002,600 | 246,680 |
| | Baxter International Inc. | 3,179,300 | 232,216 |
| * | CareFusion Corp. | 4,970,354 | 191,707 |
| | Zimmer Holdings Inc. | 2,294,900 | 191,578 |
| | Stryker Corp. | 1,433,500 | 101,004 |
| | DENTSPLY | | |
| | International Inc. | 2,285,400 | 97,998 |
| | | |
| | | | Market |
| | | | Value |
| | | Shares | ($000) |
| * | Hologic Inc. | 4,304,500 | 97,712 |
| * | Edwards Lifesciences | | |
| | Corp. | 1,311,100 | 93,586 |
| * | NuVasive Inc. | 1,628,303 | 37,158 |
| | STERIS Corp. | 803,083 | 36,155 |
| | | | 3,253,442 |
| Health Care Providers & Services (19.8%) | |
| | UnitedHealth Group Inc. | 19,001,100 | 1,384,230 |
| | McKesson Corp. | 8,439,000 | 1,035,128 |
| | Humana Inc. | 6,966,994 | 635,808 |
| | WellPoint Inc. | 7,187,500 | 614,963 |
| | Cigna Corp. | 6,267,800 | 487,823 |
| | Cardinal Health Inc. | 8,304,241 | 415,959 |
| | Aetna Inc. | 5,936,383 | 380,938 |
| | Universal Health | | |
| | Services Inc. Class B | 3,873,600 | 270,958 |
| *,1 | Health Management | | |
| | Associates Inc. | | |
| | Class A | 18,834,700 | 253,892 |
| | HCA Holdings Inc. | 3,771,600 | 147,092 |
| | Owens & Minor Inc. | 3,000,000 | 107,880 |
| * | Health Net Inc. | 2,234,358 | 68,528 |
| * | Tenet Healthcare Corp. | 1,400,000 | 62,510 |
| * | WellCare Health Plans Inc. | 793,989 | 48,457 |
| | | | 5,914,166 |
| Health Care Technology (2.2%) | |
| * | Cerner Corp. | 10,765,200 | 527,495 |
| * | Allscripts Healthcare | | |
| | Solutions Inc. | 8,473,403 | 133,964 |
| | | | 661,459 |
| Life Sciences Tools & Services (2.9%) | |
| | Agilent Technologies Inc. | 5,899,000 | 263,862 |
| * | Covance Inc. | 2,246,400 | 185,328 |
| * | Illumina Inc. | 2,240,200 | 178,813 |
| *,1 | PAREXEL International | | |
| | Corp. | 2,936,400 | 145,205 |
| * | Bruker Corp. | 3,285,758 | 58,881 |
| | PerkinElmer Inc. | 1,441,400 | 49,137 |
| | | | 881,226 |
13
| | | |
| Health Care Fund | | |
| |
| |
| |
| | | | Market |
| | | | Value |
| | | Shares | ($000) |
| Pharmaceuticals (24.3%) | | |
| | Merck & Co. Inc. | 35,919,648 | 1,730,249 |
| *,1 | Forest Laboratories Inc. | 26,666,866 | 1,161,609 |
| | Bristol-Myers Squibb Co. | 21,704,461 | 938,501 |
| | Eli Lilly & Co. | 15,923,800 | 845,713 |
| | Pfizer Inc. | 23,968,322 | 700,594 |
| | AbbVie Inc. | 8,459,700 | 384,747 |
| * | Hospira Inc. | 6,826,070 | 277,821 |
| | Johnson & Johnson | 2,897,600 | 270,926 |
| | Zoetis Inc. | 8,412,017 | 250,762 |
| | Perrigo Co. | 1,607,400 | 199,945 |
| * | Mylan Inc. | 4,775,700 | 160,273 |
| * | Salix Pharmaceuticals Ltd. | 2,147,945 | 158,733 |
| * | Actavis Inc. | 986,000 | 132,390 |
| * | Medicines Co. | 1,721,500 | 53,194 |
| * | Mallinckrodt plc | 500,325 | 22,960 |
| | | | 7,288,417 |
| Total United States | | 22,054,185 |
| International (21.4%) | | |
| Belgium (1.8%) | | |
| 1 | UCB SA | 9,345,949 | 538,148 |
| |
| Denmark (0.0%) | | |
| | H Lundbeck A/S | 73,965 | 1,489 |
| |
| France (0.4%) | | |
| | Sanofi | 671,976 | 70,345 |
| | Ipsen SA | 1,094,832 | 43,912 |
| | | | 114,257 |
| Germany (0.9%) | | |
| | Bayer AG | 1,929,452 | 224,270 |
| | Fresenius Medical Care | | |
| | AG & Co. KGaA | 511,950 | 32,327 |
| | | | 256,597 |
| Ireland (1.0%) | | |
| * | Elan Corp. plc ADR | 19,470,300 | 299,842 |
| * | Prothena Corp. plc | 249,624 | 4,336 |
| | | | 304,178 |
| Israel (1.5%) | | |
| | Teva Pharmaceutical | | |
| | Industries Ltd. ADR | 11,361,300 | 451,044 |
| |
| Japan (7.2%) | | |
| | Astellas Pharma Inc. | 14,365,700 | 768,320 |
| | Eisai Co. Ltd. | 6,188,800 | 261,596 |
| | Takeda Pharmaceutical | | |
| | Co. Ltd. | 5,599,900 | 249,723 |
| | Shionogi & Co. Ltd. | 12,066,234 | 244,767 |
| | Daiichi Sankyo Co. Ltd. | 13,910,900 | 226,379 |
| * | Olympus Corp. | 3,797,100 | 116,054 |
| | Chugai Pharmaceutical | | |
| | Co. Ltd. | 5,621,700 | 111,468 |
| | Mitsubishi Tanabe | | |
| | Pharma Corp. | 7,100,000 | 95,642 |
| | |
| | | Market |
| | | Value |
| | Shares | ($000) |
| Ono Pharmaceutical | | |
| Co. Ltd. | 1,415,800 | 90,742 |
| | | 2,164,691 |
| Norway (0.1%) | | |
| * Algeta ASA | 565,247 | 23,106 |
| |
| Switzerland (5.5%) | | |
| Roche Holding AG | 4,159,833 | 1,023,689 |
| Novartis AG | 4,311,324 | 309,928 |
| Roche Holding | | |
| AG (Bearer) | 664,320 | 164,427 |
| Actelion Ltd. | 2,403,582 | 159,734 |
| | | 1,657,778 |
| United Kingdom (3.0%) | | |
| AstraZeneca plc | 15,960,472 | 809,612 |
| GlaxoSmithKline plc ADR | 1,438,781 | 73,320 |
| | | 882,932 |
| Total International | | 6,394,220 |
| Total Common Stocks | | |
| (Cost $15,143,891) | | 28,448,405 |
| |
| | Face | |
| | Amount | |
| | ($000) | |
| Temporary Cash Investments (5.1%) | |
| Repurchase Agreements (3.8%) | | |
| Bank of America Securities, | |
| LLC 0.070%, 8/1/13 | | |
| (Dated 7/31/13, Repurchase | |
| Value $106,300,000, | | |
| collateralized by Government | |
| National Mortgage Assn. | | |
| 4.500%–5.000%, 5/20/41– | |
| 6/20/42, with a value of | | |
| $108,426,000) | 106,300 | 106,300 |
| Barclays Capital Inc. | | |
| 0.070%, 8/1/13 (Dated | | |
| 7/31/13, Repurchase Value | |
| $187,400,000, collateralized | |
| by U.S. Treasury Note/Bond | |
| 2.125%, 8/15/21, with a | | |
| value of $191,148,000) | 187,400 | 187,400 |
| Barclays Capital Inc. | | |
| 0.050%, 8/7/13 (Dated | | |
| 7/31/13, Repurchase Value | |
| $165,002,000, collateralized | |
| by Federal Home Loan | | |
| Mortgage Corp. 3.500%, | |
| 8/1/42, and Federal National | |
| Mortgage Assn. 3.500%, | |
| 4/1/42, with a value of | | |
| $168,300,000) | 165,000 | 165,000 |
14
| | |
| Health Care Fund | | |
| |
| |
| |
| | Face | Market |
| | Amount | Value |
| | ($000) | ($000) |
| BNP Paribas Securities Corp. | | |
| 0.080%, 8/1/13 (Dated | | |
| 7/31/13, Repurchase Value | | |
| $77,100,000, collateralized | | |
| by U.S. Treasury Note/Bond | |
| 0.000%, 7/24/14, with a | | |
| value of $78,642,000) | 77,100 | 77,100 |
| HSBC Bank USA | | |
| 0.100%, 8/1/13 (Dated | | |
| 7/31/13, Repurchase | | |
| Value $382,701,000, | | |
| collateralized by Federal | | |
| Home Loan Mortgage | | |
| Corp. 3.500%–6.500%, | | |
| 5/1/22–9/1/42, with a value | | |
| of $390,356,000) | 382,700 | 382,700 |
| Morgan Stanley & Co., Inc. | | |
| 0.080%, 8/1/13 (Dated | | |
| 7/31/13, Repurchase Value | | |
| $205,100,000, collateralized | | |
| by Federal National Mortgage | |
| Assn. 2.500%–5.000%, | | |
| 7/1/28–8/1/43, with a value | | |
| of $209,202,000) | 205,100 | 205,100 |
| | | 1,123,600 |
| Commercial Paper (1.3%) | | |
| General Electric Capital | | |
| Corp., 0.200%, 10/7/13 | 200,000 | 199,936 |
| General Electric Capital | | |
| Services, 0.200%, | | |
| 12/11/13 | 200,000 | 199,874 |
| | | 399,810 |
| Total Temporary Cash Investments | |
| (Cost $1,523,379) | | 1,523,410 |
| Total Investments (100.2%) | | |
| (Cost $16,667,270) | | 29,971,815 |
| Other Assets and Liabilities (-0.2%) | |
| Other Assets | | 74,190 |
| Liabilities | | (130,628) |
| | | (56,438) |
| Net Assets (100%) | | 29,915,377 |
| |
| At July 31, 2013, net assets consisted of: |
| | Amount |
| | ($000) |
| Paid-in Capital | 15,245,645 |
| Undistributed Net Investment Income | 180,214 |
| Accumulated Net Realized Gains | 1,175,423 |
| Unrealized Appreciation (Depreciation) | |
| Investment Securities | 13,304,545 |
| Forward Currency Contracts | 9,378 |
| Foreign Currencies | 172 |
| Net Assets | 29,915,377 |
| |
| |
| Investor Shares—Net Assets | |
| Applicable to 52,662,831 outstanding | |
| $.001 par value shares of beneficial | |
| interest (unlimited authorization) | 9,343,117 |
| Net Asset Value Per Share— | |
| Investor Shares | $177.41 |
| |
| |
| Admiral Shares—Net Assets | |
| Applicable to 274,803,187 outstanding | |
| $.001 par value shares of beneficial | |
| interest (unlimited authorization) | 20,572,260 |
| Net Asset Value Per Share— | |
| Admiral Shares | $74.86 |
See Note A in Notes to Financial Statements.
* Non-income-producing security.
1 Considered an affiliated company of the fund as the fund owns more than 5% of the outstanding voting securities of such company.
ADR—American Depositary Receipt.
See accompanying Notes, which are an integral part of the Financial Statements.
15
Health Care Fund
Statement of Assets and Liabilities
As of July 31, 2013
| |
| | Market |
| | Value |
| | ($000) |
| Assets | |
| Investments in Securities, at Value | |
| Unaffiliated Issuers | 27,872,961 |
| Affiliated Issuers | 2,098,854 |
| Total Investments in Securities | 29,971,815 |
| Receivables for Investment Securities Sold | 10,584 |
| Receivables for Capital Shares Issued | 8,863 |
| Receivables for Accrued Income | 20,932 |
| Other Assets | 33,811 |
| Total Assets | 30,046,005 |
| Liabilities | |
| Payables for Investment Securities Purchased | 50,922 |
| Payables for Capital Shares Redeemed | 10,170 |
| Other Liabilities | 69,536 |
| Total Liabilities | 130,628 |
| Net Assets | 29,915,377 |
See Note A in Notes to Financial Statements.
See accompanying Notes, which are an integral part of the Financial Statements.
16
Health Care Fund
Statement of Operations
| |
| | Six Months Ended |
| | July 31, 2013 |
| | ($000) |
| Investment Income | |
| Income | |
| Dividends1,2 | 288,935 |
| Interest | 767 |
| Securities Lending | 1,421 |
| Total Income | 291,123 |
| Expenses | |
| Investment Advisory Fees—Note B | 20,082 |
| The Vanguard Group—Note C | |
| Management and Administrative—Investor Shares | 8,235 |
| Management and Administrative—Admiral Shares | 11,933 |
| Marketing and Distribution—Investor Shares | 696 |
| Marketing and Distribution—Admiral Shares | 1,136 |
| Custodian Fees | 327 |
| Shareholders’ Reports—Investor Shares | 74 |
| Shareholders’ Reports—Admiral Shares | 28 |
| Trustees’ Fees and Expenses | 30 |
| Total Expenses | 42,541 |
| Net Investment Income | 248,582 |
| Realized Net Gain (Loss) | |
| Investment Securities Sold2 | 1,170,807 |
| Foreign Currencies and Forward Currency Contracts | 32,144 |
| Realized Net Gain (Loss) | 1,202,951 |
| Change in Unrealized Appreciation (Depreciation) | |
| Investment Securities | 3,334,789 |
| Foreign Currencies and Forward Currency Contracts | (20,471) |
| Change in Unrealized Appreciation (Depreciation) | 3,314,318 |
| Net Increase (Decrease) in Net Assets Resulting from Operations | 4,765,851 |
1 Dividends are net of foreign withholding taxes of $13,632,000.
2 Dividend income and realized net gain (loss) from affiliated companies of the fund were $7,462,000 and ($966,000), respectively.
See accompanying Notes, which are an integral part of the Financial Statements.
17
Health Care Fund
Statement of Changes in Net Assets
| | |
| | Six Months Ended | Year Ended |
| | July 31, | January 31, |
| | 2013 | 2013 |
| | ($000) | ($000) |
| Increase (Decrease) in Net Assets | | |
| Operations | | |
| Net Investment Income | 248,582 | 446,924 |
| Realized Net Gain (Loss) | 1,202,951 | 954,764 |
| Change in Unrealized Appreciation (Depreciation) | 3,314,318 | 2,709,551 |
| Net Increase (Decrease) in Net Assets Resulting from Operations | 4,765,851 | 4,111,239 |
| Distributions | | |
| Net Investment Income | | |
| Investor Shares | (2,155) | (153,444) |
| Admiral Shares | (4,996) | (289,547) |
| Realized Capital Gain1 | | |
| Investor Shares | (218,463) | (121,753) |
| Admiral Shares | (405,974) | (223,106) |
| Total Distributions | (631,588) | (787,850) |
| Capital Share Transactions | | |
| Investor Shares | (748,507) | (1,034,400) |
| Admiral Shares | 1,846,530 | 963,636 |
| Net Increase (Decrease) from Capital Share Transactions | 1,098,023 | (70,764) |
| Total Increase (Decrease) | 5,232,286 | 3,252,625 |
| Net Assets | | |
| Beginning of Period | 24,683,091 | 21,430,466 |
| End of Period2 | 29,915,377 | 24,683,091 |
1 Includes fiscal 2014 and 2013 short-term gain distributions totaling $33,215,000 and $27,207,000, respectively. Short-term gain distributions are treated as ordinary income dividends for tax purposes.
2 Net Assets—End of Period includes undistributed (overdistributed) net investment income of $180,214,000 and ($58,424,000).
See accompanying Notes, which are an integral part of the Financial Statements.
18
Health Care Fund
Financial Highlights
Investor Shares
| | | | | | |
| Six Months | | | | | |
| | Ended | | | | | |
| For a Share Outstanding | July 31, | | | Year Ended January 31, |
| Throughout Each Period | 2013 | 2013 | 2012 | 2011 | 2010 | 2009 |
| Net Asset Value, Beginning | | | | | | |
| of Period | $152.58 | $131.96 | $124.30 | $120.06 | $99.12 | $133.80 |
| Investment Operations | | | | | | |
| Net Investment Income | 1.455 | 2.777 | 2.300 | 2.046 | 1.902 | 1.998 |
| Net Realized and Unrealized Gain (Loss) | | | | | | |
| on Investments | 27.267 | 22.791 | 12.780 | 7.404 | 21.530 | (25.229) |
| Total from Investment Operations | 28.722 | 25.568 | 15.080 | 9.450 | 23.432 | (23.231) |
| Distributions | | | | | | |
| Dividends from Net Investment Income | (. 038) | (2.757) | (2.237) | (2.007) | (1.761) | (1.925) |
| Distributions from Realized Capital Gains | (3.854) | (2.191) | (5.183) | (3.203) | (.731) | (9.524) |
| Total Distributions | (3.892) | (4.948) | (7.420) | (5.210) | (2.492) | (11.449) |
| Net Asset Value, End of Period | $177.41 | $152.58 | $131.96 | $124.30 | $120.06 | $99.12 |
| |
| Total Return1 | 19.18% | 19.59% | 12.50% | 7.95% | 23.63% | -17.44% |
| |
| Ratios/Supplemental Data | | | | | | |
| Net Assets, End of Period (Millions) | $9,343 | $8,681 | $8,462 | $8,447 | $11,692 | $10,478 |
| Ratio of Total Expenses to | | | | | | |
| Average Net Assets | 0.35% | 0.35% | 0.35% | 0.35% | 0.36% | 0.29% |
| Ratio of Net Investment Income to | | | | | | |
| Average Net Assets | 1.80% | 1.94% | 1.72% | 1.67% | 1.73% | 1.64% |
| Portfolio Turnover Rate | 18% | 8% | 8% | 9% | 6% | 12% |
The expense ratio, net income ratio, and turnover rate for the current period have been annualized.
1 Total returns do not include transaction or account service fees that may have applied in the periods shown. Fund prospectuses provide information about any applicable transaction and account service fees.
See accompanying Notes, which are an integral part of the Financial Statements.
19
Health Care Fund
Financial Highlights
Admiral Shares
| | | | | | |
| Six Months | | | | | |
| | Ended | | | | | |
| For a Share Outstanding | July 31, | | | Year Ended January 31, |
| Throughout Each Period | 2013 | 2013 | 2012 | 2011 | 2010 | 2009 |
| Net Asset Value, Beginning | | | | | | |
| of Period | $64.37 | $55.68 | $52.45 | $50.67 | $41.83 | $56.47 |
| Investment Operations | | | | | | |
| Net Investment Income | . 636 | 1.211 | 1.005 | . 891 | . 835 | . 879 |
| Net Realized and Unrealized Gain (Loss) | | | | | | |
| on Investments | 11.499 | 9.605 | 5.392 | 3.115 | 9.091 | (10.648) |
| Total from Investment Operations | 12.135 | 10.816 | 6.397 | 4.006 | 9.926 | (9.769) |
| Distributions | | | | | | |
| Dividends from Net Investment Income | (. 020) | (1.201) | (. 980) | (. 874) | (.777) | (. 852) |
| Distributions from Realized Capital Gains (1.625) | (. 925) | (2.187) | (1.352) | (. 309) | (4.019) |
| Total Distributions | (1.645) | (2.126) | (3.167) | (2.226) | (1.086) | (4.871) |
| Net Asset Value, End of Period | $74.86 | $64.37 | $55.68 | $52.45 | $50.67 | $41.83 |
| |
| Total Return1 | 19.21% | 19.65% | 12.57% | 7.99% | 23.72% | -17.38% |
| |
| Ratios/Supplemental Data | | | | | | |
| Net Assets, End of Period (Millions) | $20,572 | $16,002 | $12,968 | $11,459 | $8,619 | $7,576 |
| Ratio of Total Expenses to | | | | | | |
| Average Net Assets | 0.30% | 0.30% | 0.30% | 0.30% | 0.29% | 0.22% |
| Ratio of Net Investment Income to | | | | | | |
| Average Net Assets | 1.85% | 1.99% | 1.77% | 1.72% | 1.80% | 1.71% |
| Portfolio Turnover Rate | 18% | 8% | 8% | 9% | 6% | 12% |
The expense ratio, net income ratio, and turnover rate for the current period have been annualized.
1 Total returns do not include transaction or account service fees that may have applied in the periods shown. Fund prospectuses provide information about any applicable transaction and account service fees.
See accompanying Notes, which are an integral part of the Financial Statements.
20
Health Care Fund
Notes to Financial Statements
Vanguard Health Care Fund is registered under the Investment Company Act of 1940 as an open-end investment company, or mutual fund. The fund invests in securities of foreign issuers, which may subject it to investment risks not normally associated with investing in securities of U.S. corporations. The fund offers two classes of shares: Investor Shares and Admiral Shares. Investor Shares are available to any investor who meets the fund’s minimum purchase requirements. Admiral Shares are designed for investors who meet certain administrative, service, and account-size criteria.
A. The following significant accounting policies conform to generally accepted accounting principles for U.S. mutual funds. The fund consistently follows such policies in preparing its financial statements.
1. Security Valuation: Securities are valued as of the close of trading on the New York Stock Exchange (generally 4 p.m., Eastern time) on the valuation date. Equity securities are valued at the latest quoted sales prices or official closing prices taken from the primary market in which each security trades; such securities not traded on the valuation date are valued at the mean of the latest quoted bid and asked prices. Securities for which market quotations are not readily available, or whose values have been affected by events occurring before the fund’s pricing time but after the close of the securities’ primary markets, are valued at their fair values calculated according to procedures adopted by the board of trustees. These procedures include obtaining quotations from an independent pricing service, monitoring news to identify significant market- or security-specific events, and evaluating changes in the values of foreign market proxies (for example, ADRs, futures contracts, or exchange-traded funds), between the time the foreign markets close and the fund’s pricing time. When fair-value pricing is employed, the prices of securities used by a fund to calculate its net asset value may differ from quoted or published prices for the same securities. Temporary cash investments acquired over 60 days to maturity are valued using the latest bid prices or using valuations based on a matrix system (which considers such factors as security prices, yields, maturities, and ratings), both as furnished by independent pricing services. Other temporary cash investments are valued at amortized cost, which approximates market value.
2. Foreign Currency: Securities and other assets and liabilities denominated in foreign currencies are translated into U.S. dollars using exchange rates obtained from an independent third party as of the fund’s pricing time on the valuation date. Realized gains (losses) and unrealized appreciation (depreciation) on investment securities include the effects of changes in exchange rates since the securities were purchased, combined with the effects of changes in security prices. Fluctuations in the value of other assets and liabilities resulting from changes in exchange rates are recorded as unrealized foreign currency gains (losses) until the assets or liabilities are settled in cash, at which time they are recorded as realized foreign currency gains (losses).
3. Forward Currency Contracts: The fund may enter into forward currency contracts to protect the value of securities and related receivables and payables against changes in future foreign exchange rates. The fund’s risks in using these contracts include movement in the values of the foreign currencies relative to the U.S. dollar and the ability of the counterparties to fulfill their obligations under the contracts. The fund mitigates its counterparty risk by entering into forward currency contracts only with a diverse group of prequalified counterparties, monitoring their financial strength, entering into master netting arrangements with its counterparties, and requiring its counterparties to transfer collateral as security for their performance. The master netting arrangements provide that, in the event of a counterparty’s default (including bankruptcy), the fund may terminate the forward currency contracts, determine the net amount owed by either party in accordance with its master netting arrangements, and sell or retain any collateral held up to the net amount owed to the fund under the master netting arrangements. The forward currency contracts contain provisions whereby a counterparty may terminate open contracts if the fund’s net assets decline below a certain level,
21
Health Care Fund
triggering a payment by the fund if the fund is in a net liability position at the time of the termination. The payment amount would be reduced by any collateral the fund has pledged. Any assets pledged as collateral for open contracts are noted in the Statement of Net Assets. The value of collateral received or pledged is compared daily to the value of the forward currency contracts exposure with each counterparty, and any difference, if in excess of a specified minimum transfer amount, is adjusted and settled within two business days.
Forward currency contracts are valued at their quoted daily prices obtained from an independent third party, adjusted for currency risk based on the expiration date of each contract. The aggregate principal amounts of the contracts are not recorded in the Statement of Net Assets. Fluctuations in the value of the contracts are recorded in the Statement of Net Assets as an asset (liability) and in the Statement of Operations as unrealized appreciation (depreciation) until the contracts are closed, when they are recorded as realized forward currency contract gains (losses).
During the six months ended July 31, 2013, the fund’s average investment in forward currency contracts represented less than 1% of net assets, based on quarterly average notional amounts.
4. Repurchase Agreements: The fund may enter into repurchase agreements with institutional counterparties. Securities pledged as collateral to the fund under repurchase agreements are held by a custodian bank until the agreements mature. Each agreement requires that the market value of the collateral be sufficient to cover payments of interest and principal. The fund further mitigates its counterparty risk by entering into repurchase agreements only with a diverse group of pre-qualified counterparties, monitoring their financial strength, and entering into master repurchase agreements with its counterparties. The master repurchase agreements provide that, in the event of a counterparty’s default (including bankruptcy), the fund may terminate any repurchase agreements with that counterparty, determine the net amount owed, and sell or retain the collateral up to the net amount owed to the fund.
5. Federal Income Taxes: The fund intends to continue to qualify as a regulated investment company and distribute all of its taxable income. Management has analyzed the fund’s tax positions taken for all open federal income tax years (January 31, 2010–2013), and for the period ended July 31, 2013, and has concluded that no provision for federal income tax is required in the fund’s financial statements.
6. Distributions: Distributions to shareholders are recorded on the ex-dividend date.
7. Securities Lending: To earn additional income, the fund may lend its securities to qualified institutional borrowers. Security loans are required to be secured at all times by collateral in an amount at least equal to the market value of securities loaned. Daily market fluctuations could cause the value of loaned securities to be more or less than the value of the collateral received. When this occurs, the collateral is adjusted and settled on the next business day. The fund further mitigates its counterparty risk by entering into securities lending transactions only with a diverse group of pre-qualified counterparties, monitoring their financial strength, and entering into master securities lending agreements with its counterparties. The master securities lending agreements provide that, in the event of a counterparty’s default (including bankruptcy), the fund may terminate any loans with that borrower, determine the net amount owed, and sell or retain the collateral up to the net amount owed to the fund. The fund invests cash collateral received in Vanguard Market Liquidity Fund, and records a liability for the return of the collateral, during the period the securities are on loan. Securities lending income represents fees charged to borrowers plus income earned on invested cash collateral, less expenses associated with the loan.
22
Health Care Fund
8. Other: Dividend income is recorded on the ex-dividend date. Interest income is accrued daily. Premiums and discounts on debt securities purchased are amortized and accreted, respectively, to interest income over the lives of the respective securities. Security transactions are accounted for on the date securities are bought or sold. Costs used to determine realized gains (losses) on the sale of investment securities are those of the specific securities sold.
Each class of shares has equal rights as to assets and earnings, except that each class separately bears certain class-specific expenses related to maintenance of shareholder accounts (included in Management and Administrative expenses) and shareholder reporting. Marketing and distribution expenses are allocated to each class of shares based on a method approved by the board of trustees. Income, other non-class-specific expenses, and gains and losses on investments are allocated to each class of shares based on its relative net assets.
B. Wellington Management Company, LLP, provides investment advisory services to the fund for a fee calculated at an annual percentage rate of average net assets. For the six months ended July 31, 2013, the investment advisory fee represented an effective annual rate of 0.15% of the fund’s average net assets.
C. The Vanguard Group furnishes at cost corporate management, administrative, marketing, and distribution services. The costs of such services are allocated to the fund under methods approved by the board of trustees. The fund has committed to provide up to 0.40% of its net assets in capital contributions to Vanguard. At July 31, 2013, the fund had contributed capital of $3,504,000 to Vanguard (included in Other Assets), representing 0.01% of the fund’s net assets and 1.40% of Vanguard’s capitalization. The fund’s trustees and officers are also directors and officers of Vanguard.
D. Various inputs may be used to determine the value of the fund’s investments. These inputs are summarized in three broad levels for financial statement purposes. The inputs or methodologies used to value securities are not necessarily an indication of the risk associated with investing in those securities.
Level 1—Quoted prices in active markets for identical securities.
Level 2—Other significant observable inputs (including quoted prices for similar securities, interest rates, prepayment speeds, credit risk, etc.).
Level 3—Significant unobservable inputs (including the fund’s own assumptions used to determine the fair value of investments).
The following table summarizes the market value of the fund’s investments as of July 31, 2013, based on the inputs used to value them:
| | | |
| | Level 1 | Level 2 | Level 3 |
| Investments | ($000) | ($000) | ($000) |
| Common Stocks—U.S. | 22,054,185 | — | — |
| Common Stocks—International | 828,542 | 5,565,678 | — |
| Temporary Cash Investments | — | 1,523,410 | — |
| Forward Currency Contracts—Assets | — | 9,378 | — |
| Total | 22,882,727 | 7,098,466 | — |
23
Health Care Fund
At July 31, 2013, the fund had open forward currency contracts to receive and deliver currencies as follows. Unrealized appreciation (depreciation) on open forward currency contracts is treated as realized gain (loss) for tax purposes.
| | | | | | |
| | | | | | | Unrealized |
| | Contract | | | | | Appreciation |
| | Settlement | Contract Amount (000) | (Depreciation) |
| Counterparty | Date | | Receive | | Deliver | ($000) |
| Bank of America NA | 8/16/13 | USD | 204,088 | JPY | 19,062,436 | 9,378 |
JPY—Japanese yen.
USD—U.S. dollar.
At July 31, 2013, the counterparty had deposited in segregated accounts securities with a value of $9,384,000 in connection with amounts due to the fund for open forward currency contracts.
E. Distributions are determined on a tax basis and may differ from net investment income and realized capital gains for financial reporting purposes. Differences may be permanent or temporary. Permanent differences are reclassified among capital accounts in the financial statements to reflect their tax character. Temporary differences arise when certain items of income, expense, gain, or loss are recognized in different periods for financial statement and tax purposes; these differences will reverse at some time in the future. Differences in classification may also result from the treatment of short-term gains as ordinary income for tax purposes. The fund’s tax-basis capital gains and losses are determined only at the end of each fiscal year.
During the six months ended July 31, 2013, the fund realized net foreign currency losses of $2,793,000, which decreased distributable net income for tax purposes; accordingly, such losses have been reclassified from accumulated net realized gains to undistributed net investment income. Certain of the fund’s investments are in securities considered to be “passive foreign investment companies,” for which any unrealized appreciation and/or realized gains are required to be included in distributable net income for tax purposes. Passive foreign investment companies held at July 31, 2013, had unrealized appreciation of $19,835,000, as of January 31, 2013, the most recent mark-to-market date for tax purposes. This amount has been distributed and is reflected in the balance of undistributed net investment income.
At July 31, 2013, the cost of investment securities for tax purposes was $16,687,105,000. Net unrealized appreciation of investment securities for tax purposes was $13,284,710,000, consisting of unrealized gains of $13,357,361,000 on securities that had risen in value since their purchase and $72,651,000 in unrealized losses on securities that had fallen in value since their purchase.
F. During the six months ended July 31, 2013, the fund purchased $3,147,071,000 of investment securities and sold $2,335,563,000 of investment securities, other than temporary cash investments.
24
Health Care Fund
G. Capital share transactions for each class of shares were:
| | | | |
| | Six Months Ended | | Year Ended |
| | | July 31, 2013 | January 31, 2013 |
| | Amount | Shares | Amount | Shares |
| | ($000) | (000) | ($000) | (000) |
| Investor Shares | | | | |
| Issued | 877,118 | 5,326 | 795,411 | 5,590 |
| Issued in Lieu of Cash Distributions | 210,327 | 1,351 | 261,109 | 1,808 |
| Redeemed1 | (1,835,952) | (10,909) | (2,090,920) | (14,631) |
| Net Increase (Decrease)—Investor Shares | (748,507) | (4,232) | (1,034,400) | (7,233) |
| Admiral Shares | | | | |
| Issued | 2,122,546 | 29,912 | 1,750,549 | 28,857 |
| Issued in Lieu of Cash Distributions | 377,487 | 5,748 | 467,163 | 7,666 |
| Redeemed1 | (653,503) | (9,440) | (1,254,076) | (20,860) |
| Net Increase (Decrease) —Admiral Shares | 1,846,530 | 26,220 | 963,636 | 15,663 |
| 1 Net of redemption fees for fiscal 2013 of $378,000 (fund total). Effective May 23, 2012, the redemption fee was eliminated. |
H. Certain of the fund’s investments are in companies that are considered to be affiliated companies of the fund because the fund owns more than 5% of the outstanding voting securities of the company. Transactions during the period in securities of these companies were as follows:
| | | | | |
| | | | Current Period Transactions | |
| | Jan. 31, 2013 | | Proceeds from | | July 31, 2013 |
| | Market | Purchases | Securities | Dividend | Market |
| | Value | at Cost | Sold | Income | Value |
| | ($000) | ($000) | ($000) | ($000) | ($000) |
| Forest Laboratories Inc. | 956,887 | 12,310 | — | — | 1,161,609 |
| Health Management Associates Inc. | | | | |
| Class A | 163,458 | 38,387 | 4,981 | — | 253,892 |
| PAREXEL International Corp. | NA1 | 15,892 | — | — | 145,205 |
| UCB SA | NA1 | 180,039 | — | 7,462 | 538,148 |
| | 1,120,345 | | | 7,462 | 2,098,854 |
| 1 Not applicable — At January 31, 2013, the issuer was not an affiliated company of the fund. |
I. Management has determined that no material events or transactions occurred subsequent to July 31, 2013, that would require recognition or disclosure in these financial statements.
25
About Your Fund’s Expenses
As a shareholder of the fund, you incur ongoing costs, which include costs for portfolio management, administrative services, and shareholder reports (like this one), among others. Operating expenses, which are deducted from a fund’s gross income, directly reduce the investment return of the fund.
A fund’s expenses are expressed as a percentage of its average net assets. This figure is known as the expense ratio. The following examples are intended to help you understand the ongoing costs (in dollars) of investing in your fund and to compare these costs with those of other mutual funds. The examples are based on an investment of $1,000 made at the beginning of the period shown and held for the entire period.
The accompanying table illustrates your fund’s costs in two ways:
• Based on actual fund return. This section helps you to estimate the actual expenses that you paid over the period. The ”Ending Account Value“ shown is derived from the fund‘s actual return, and the third column shows the dollar amount that would have been paid by an investor who started with $1,000 in the fund. You may use the information here, together with the amount you invested, to estimate the expenses that you paid over the period.
To do so, simply divide your account value by $1,000 (for example, an $8,600 account value divided by $1,000 = 8.6), then multiply the result by the number given for your fund under the heading ”Expenses Paid During Period.“
• Based on hypothetical 5% yearly return. This section is intended to help you compare your fund‘s costs with those of other mutual funds. It assumes that the fund had a yearly return of 5% before expenses, but that the expense ratio is unchanged. In this case—because the return used is not the fund’s actual return—the results do not apply to your investment. The example is useful in making comparisons because the Securities and Exchange Commission requires all mutual funds to calculate expenses based on a 5% return. You can assess your fund’s costs by comparing this hypothetical example with the hypothetical examples that appear in shareholder reports of other funds.
Note that the expenses shown in the table are meant to highlight and help you compare ongoing costs only and do not reflect transaction costs incurred by the fund for buying and selling securities. Further, the expenses do not include any purchase, redemption, or account service fees described in the fund prospectus. If such fees were applied to your account, your costs would be higher. Your fund does not carry a “sales load.”
The calculations assume no shares were bought or sold during the period. Your actual costs may have been higher or lower, depending on the amount of your investment and the timing of any purchases or redemptions.
You can find more information about the fund’s expenses, including annual expense ratios, in the Financial Statements section of this report. For additional information on operating expenses and other shareholder costs, please refer to your fund’s current prospectus.
26
| | | |
| Six Months Ended July 31, 2013 | | | |
| | Beginning | Ending | Expenses |
| | Account Value | Account Value | Paid During |
| Health Care Fund | 1/31/2013 | 7/31/2013 | Period |
| Based on Actual Fund Return | | | |
| Investor Shares | $1,000.00 | $1,191.81 | $1.90 |
| Admiral Shares | 1,000.00 | 1,192.10 | 1.63 |
| Based on Hypothetical 5% Yearly Return | | | |
| Investor Shares | $1,000.00 | $1,023.06 | $1.76 |
| Admiral Shares | 1,000.00 | 1,023.31 | 1.51 |
The calculations are based on expenses incurred in the most recent six-month period. The fund’s annualized six-month expense ratios for that period are 0.35% for Investor Shares and 0.30% for Admiral Shares. The dollar amounts shown as “Expenses Paid” are equal to the annualized expense ratio multiplied by the average account value over the period, multiplied by the number of days in the most recent six-month period, then divided by the number of days in the most recent 12-month period.
27
Trustees Approve Advisory Agreement
The board of trustees of Vanguard Health Care Fund has renewed the fund’s investment advisory agreement with Wellington Management Company, LLP (Wellington Management). The board determined that renewing the fund’s advisory arrangement was in the best interests of the fund and its shareholders.
The board based its decision upon an evaluation of the advisor’s investment staff, portfolio management process, and performance. The trustees considered the factors discussed below, among others. However, no single factor determined whether the board approved the agreement. Rather, it was the totality of the circumstances that drove the board’s decision.
Nature, extent, and quality of services
The board considered the quality of the fund’s investment management services over both the short and long term, and the organizational depth and stability of the advisory firm. The board noted that Wellington Management, founded in 1928, is among the nation’s oldest and most respected institutional investment managers. The portfolio manager is aided by a team of four experienced health care analysts. This health care team uses intensive fundamental analysis to identify companies with high-quality balance sheets, strong management, and the potential for new products that lead to above-average growth in revenue and earnings. The advisor invests in stocks broadly representing the health care industry, seeking to maintain exposure across five primary subsectors: health services, medical products, specialty pharmaceuticals, major pharmaceuticals, and international markets. Wellington Management has advised the Health Care Fund since the fund’s inception in 1984.
The board concluded that the advisor’s experience, stability, depth, and performance, among other factors, warranted continuation of the advisory agreement.
Investment performance
The board considered the short- and long-term performance of the fund, including any periods of outperformance or underperformance relative to a benchmark index and peer group. The board concluded that the performance was such that the advisory arrangement should continue. Information about the fund’s most recent performance can be found in the Performance Summary section of this report.
Cost
The board concluded that the fund’s expense ratio was well below the average expense ratio charged by funds in its peer group and that the fund’s advisory fee rate was also well below its peer-group average. Information about the fund’s expenses appears in the About Your Fund’s Expenses section of this report as well as in the Financial Statements section, which also includes information about the advisory fee rate.
The board did not consider profitability of Wellington Management in determining whether to approve the advisory fee, because Wellington Management is independent of Vanguard, and the advisory fee is the result of arm’s-length negotiations.
The benefit of economies of scale
The board concluded that the fund’s shareholders benefit from economies of scale because of breakpoints in the fund’s advisory fee schedule. The breakpoints reduce the effective rate of the fee as the fund’s assets increase.
The board will consider whether to renew the advisory agreement again after a one-year period.
28
Glossary
30-Day SEC Yield. A fund’s 30-day SEC yield is derived using a formula specified by the U.S. Securities and Exchange Commission. Under the formula, data related to the fund’s security holdings in the previous 30 days are used to calculate the fund’s hypothetical net income for that period, which is then annualized and divided by the fund’s estimated average net assets over the calculation period. For the purposes of this calculation, a security’s income is based on its current market yield to maturity (for bonds), its actual income (for asset-backed securities), or its projected dividend yield (for stocks). Because the SEC yield represents hypothetical annualized income, it will differ—at times significantly—from the fund’s actual experience. As a result, the fund’s income distributions may be higher or lower than implied by the SEC yield.
Beta. A measure of the magnitude of a fund’s past share-price fluctuations in relation to the ups and downs of a given market index. The index is assigned a beta of 1.00. Compared with a given index, a fund with a beta of 1.20 typically would have seen its share price rise or fall by 12% when the index rose or fell by 10%. For this report, beta is based on returns over the past 36 months for both the fund and the index. Note that a fund’s beta should be reviewed in conjunction with its R-squared (see definition). The lower the R-squared, the less correlation there is between the fund and the index, and the less reliable beta is as an indicator of volatility.
Dividend Yield. Dividend income earned by stocks, expressed as a percentage of the aggregate market value (or of net asset value, for a fund). The yield is determined by dividing the amount of the annual dividends by the aggregate value (or net asset value) at the end of the period. For a fund, the dividend yield is based solely on stock holdings and does not include any income produced by other investments.
Earnings Growth Rate. The average annual rate of growth in earnings over the past five years for the stocks now in a fund.
Equity Exposure. A measure that reflects a fund’s investments in stocks and stock futures. Any holdings in short-term reserves are excluded.
Expense Ratio. A fund’s total annual operating expenses expressed as a percentage of the fund’s average net assets. The expense ratio includes management and administrative expenses, but does not include the transaction costs of buying and selling portfolio securities.
Foreign Holdings. The percentage of a fund represented by securities or depositary receipts of companies based outside the United States.
Inception Date. The date on which the assets of a fund (or one of its share classes) are first invested in accordance with the fund’s investment objective. For funds with a subscription period, the inception date is the day after that period ends. Investment performance is measured from the inception date.
Median Market Cap. An indicator of the size of companies in which a fund invests; the midpoint of market capitalization (market price x shares outstanding) of a fund’s stocks, weighted by the proportion of the fund’s assets invested in each stock. Stocks representing half of the fund’s assets have market capitalizations above the median, and the rest are below it.
Price/Book Ratio. The share price of a stock divided by its net worth, or book value, per share. For a fund, the weighted average price/book ratio of the stocks it holds.
29
Price/Earnings Ratio. The ratio of a stock’s current price to its per-share earnings over the past year. For a fund, the weighted average P/E of the stocks it holds. P/E is an indicator of market expectations about corporate prospects; the higher the P/E, the greater the expectations for a company’s future growth.
R-Squared. A measure of how much of a fund’s past returns can be explained by the returns from the market in general, as measured by a given index. If a fund’s total returns were precisely synchronized with an index’s returns, its R-squared would be 1.00. If the fund’s returns bore no relationship to the index’s returns, its R-squared would be 0. For this report, R-squared is based on returns over the past 36 months for both the fund and the index.
Return on Equity. The annual average rate of return generated by a company during the past five years for each dollar of shareholder’s equity (net income divided by shareholder’s equity). For a fund, the weighted average return on equity for the companies whose stocks it holds.
Short-Term Reserves. The percentage of a fund invested in highly liquid, short-term securities that can be readily converted to cash.
Turnover Rate. An indication of the fund’s trading activity. Funds with high turnover rates incur higher transaction costs and may be more likely to distribute capital gains (which may be taxable to investors). The turnover rate excludes in-kind transactions, which have minimal impact on costs.
Benchmark Information
Spliced Health Care Index: S&P 500 Index through December 31, 2001; S&P Health Care Index through May 31, 2010; MSCI All Country World Health Care Index thereafter.
30
This page intentionally left blank.
The People Who Govern Your Fund
The trustees of your mutual fund are there to see that the fund is operated and managed in your best interests since, as a shareholder, you are a part owner of the fund. Your fund’s trustees also serve on the board of directors of The Vanguard Group, Inc., which is owned by the Vanguard funds and provides services to them on an at-cost basis.
A majority of Vanguard’s board members are independent, meaning that they have no affiliation with Vanguard or the funds they oversee, apart from the sizable personal investments they have made as private individuals. The independent board members have distinguished backgrounds in business, academia, and public service. Each of the trustees and executive officers oversees 181 Vanguard funds.
The following table provides information for each trustee and executive officer of the fund. More information about the trustees is in the Statement of Additional Information, which can be obtained, without charge, by contacting Vanguard at 800-662-7447, or online at vanguard.com.
| InterestedTrustee1 |
| | and Delphi Automotive LLP (automotive components); |
| | Senior Advisor at New Mountain Capital; Trustee of |
| F. William McNabb III | The Conference Board. |
| Born 1957. Trustee Since July 2009. Chairman of the | |
| Board. Principal Occupation(s) During the Past Five | Amy Gutmann |
| Years: Chairman of the Board of The Vanguard Group, | Born 1949. Trustee Since June 2006. Principal |
| Inc., and of each of the investment companies served | Occupation(s) During the Past Five Years: President |
| by The Vanguard Group, since January 2010; Director | of the University of Pennsylvania; Christopher H. |
| of The Vanguard Group since 2008; Chief Executive | Browne Distinguished Professor of Political Science |
| Officer and President of The Vanguard Group and of | in the School of Arts and Sciences with secondary |
| each of the investment companies served by The | appointments at the Annenberg School for |
| Vanguard Group since 2008; Director of Vanguard | Communication and the Graduate School of Education |
| Marketing Corporation; Managing Director of The | of the University of Pennsylvania; Member of the |
| Vanguard Group (1995–2008). | National Commission on the Humanities and Social |
| | Sciences; Trustee of Carnegie Corporation of New |
| | York and of the National Constitution Center; Chair |
| IndependentTrustees | of the U. S. Presidential Commission for the Study |
| | of Bioethical Issues. |
| |
| Emerson U. Fullwood | JoAnn Heffernan Heisen |
| Born 1948. Trustee Since January 2008. Principal | Born 1950. Trustee Since July 1998. Principal |
| Occupation(s) During the Past Five Years: Executive | Occupation(s) During the Past Five Years: Corporate |
| Chief Staff and Marketing Officer for North America | Vice President and Chief Global Diversity Officer |
| and Corporate Vice President (retired 2008) of Xerox | (retired 2008) and Member of the Executive |
| Corporation (document management products and | Committee (1997–2008) of Johnson & Johnson |
| services); Executive in Residence and 2010 | (pharmaceuticals/medical devices/consumer |
| Distinguished Minett Professor at the Rochester | products); Director of Skytop Lodge Corporation |
| Institute of Technology; Director of SPX Corporation | (hotels), the University Medical Center at Princeton, |
| (multi-industry manufacturing), the United Way of | the Robert Wood Johnson Foundation, and the Center |
| Rochester, Amerigroup Corporation (managed health | for Talent Innovation; Member of the Advisory Board |
| care), the University of Rochester Medical Center, | of the Maxwell School of Citizenship and Public Affairs |
| Monroe Community College Foundation, and North | at Syracuse University. |
| Carolina A&T University. | |
| | F. Joseph Loughrey |
| Rajiv L. Gupta | Born 1949. Trustee Since October 2009. Principal |
| Born 1945. Trustee Since December 2001.2 | Occupation(s) During the Past Five Years: President |
| Principal Occupation(s) During the Past Five Years: | and Chief Operating Officer (retired 2009) of Cummins |
| Chairman and Chief Executive Officer (retired 2009) | Inc. (industrial machinery); Chairman of the Board of |
| and President (2006–2008) of Rohm and Haas Co. | Hillenbrand, Inc. (specialized consumer services) and |
| (chemicals); Director of Tyco International, Ltd. | of Oxfam America; Director of SKF AB (industrial |
| (diversified manufacturing and services), Hewlett- | |
| Packard Co. (electronic computer manufacturing), | |
| | |
| machinery) and the Lumina Foundation for Education; | Executive Officers | |
| Member of the Advisory Council for the College of | | |
| Arts and Letters and of the Advisory Board to the | Glenn Booraem | |
| Kellogg Institute for International Studies, both at | Born 1967. Controller Since July 2010. Principal |
| the University of Notre Dame. | Occupation(s) During the Past Five Years: Principal |
| | of The Vanguard Group, Inc.; Controller of each of |
| Mark Loughridge | the investment companies served by The Vanguard |
| Born 1953. Trustee Since March 2012. Principal | Group; Assistant Controller of each of the investment |
| Occupation(s) During the Past Five Years: Senior Vice | companies served by The Vanguard Group (2001–2010). |
| President and Chief Financial Officer at IBM (information | | |
| technology services); Fiduciary Member of IBM’s | Thomas J. Higgins | |
| Retirement Plan Committee. | Born 1957. Chief Financial Officer Since September |
| | 2008. Principal Occupation(s) During the Past Five |
| Scott C. Malpass | Years: Principal of The Vanguard Group, Inc.; Chief |
| Born 1962. Trustee Since March 2012. Principal | Financial Officer of each of the investment companies |
| Occupation(s) During the Past Five Years: Chief | served by The Vanguard Group; Treasurer of each of |
| Investment Officer and Vice President at the University | the investment companies served by The Vanguard |
| of Notre Dame; Assistant Professor of Finance at the | Group (1998–2008). | |
| Mendoza College of Business at Notre Dame; Member | | |
| of the Notre Dame 403(b) Investment Committee; | Kathryn J. Hyatt | |
| Director of TIFF Advisory Services, Inc. (investment | Born 1955. Treasurer Since November 2008. Principal |
| advisor); Member of the Investment Advisory | Occupation(s) During the Past Five Years: Principal of |
| Committees of the Financial Industry Regulatory | The Vanguard Group, Inc.; Treasurer of each of the |
| Authority (FINRA) and of Major League Baseball. | investment companies served by The Vanguard |
| | Group; Assistant Treasurer of each of the investment |
| André F. Perold | companies served by The Vanguard Group (1988–2008). |
| Born 1952. Trustee Since December 2004. Principal | | |
| Occupation(s) During the Past Five Years: George | Heidi Stam | |
| Gund Professor of Finance and Banking at the Harvard | Born 1956. Secretary Since July 2005. Principal |
| Business School (retired 2011); Chief Investment | Occupation(s) During the Past Five Years: Managing |
| Officer and Managing Partner of HighVista Strategies | Director of The Vanguard Group, Inc.; General Counsel |
| LLC (private investment firm); Director of Rand | of The Vanguard Group; Secretary of The Vanguard |
| Merchant Bank; Overseer of the Museum of Fine | Group and of each of the investment companies |
| Arts Boston. | served by The Vanguard Group; Director and Senior |
| | Vice President of Vanguard Marketing Corporation. |
| Alfred M. Rankin, Jr. | | |
| Born 1941. Trustee Since January 1993. Principal | | |
| Occupation(s) During the Past Five Years: Chairman, | Vanguard Senior ManagementTeam |
| President, and Chief Executive Officer of NACCO | | |
| Industries, Inc. (housewares/lignite) and of Hyster-Yale | Mortimer J. Buckley | Chris D. McIsaac |
| Materials Handling, Inc. (forklift trucks); Director of | Kathleen C. Gubanich | Michael S. Miller |
| the National Association of Manufacturers; Chairman | Paul A. Heller | James M. Norris |
| of the Board of University Hospitals of Cleveland; | Martha G. King | Glenn W. Reed |
| Advisory Chairman of the Board of The Cleveland | John T. Marcante | |
| Museum of Art. | | |
| | Chairman Emeritus and Senior Advisor |
| Peter F. Volanakis | |
| Born 1955. Trustee Since July 2009. Principal | John J. Brennan | |
| Occupation(s) During the Past Five Years: President | Chairman, 1996–2009 | |
| and Chief Operating Officer (retired 2010) of Corning | Chief Executive Officer and President, 1996–2008 |
| Incorporated (communications equipment); Director | | |
| of SPX Corporation (multi-industry manufacturing); | Founder | |
| Overseer of the Amos Tuck School of Business | | |
| Administration at Dartmouth College; Advisor to the | John C. Bogle | |
| Norris Cotton Cancer Center. | Chairman and Chief Executive Officer, 1974–1996 | |
| | |
| | |
| | |
1 Mr. McNabb is considered an “interested person,” as defined in the Investment Company Act of 1940, because he is an officer of the
Vanguard funds.
2 December 2002 for Vanguard Equity Income Fund, Vanguard Growth Equity Fund, the Vanguard Municipal Bond Funds, and the Vanguard
State Tax-Exempt Funds.
|  |
| P.O. Box 2600 |
| Valley Forge, PA 19482-2600 |
Connect with Vanguard® > vanguard.com
| |
| Fund Information > 800-662-7447 | CFA® is a trademark owned by CFA Institute. |
| Direct Investor Account Services > 800-662-2739 | |
| Institutional Investor Services > 800-523-1036 | |
| Text Telephone for People | |
| With Hearing Impairment > 800-749-7273 | |
| |
| This material may be used in conjunction | |
| with the offering of shares of any Vanguard | |
| fund only if preceded or accompanied by | |
| the fund’s current prospectus. | |
| |
| All comparative mutual fund data are from Lipper, a | |
| Thomson Reuters Company, or Morningstar, Inc., unless | |
| otherwise noted. | |
| |
| You can obtain a free copy of Vanguard’s proxy voting | |
| guidelines by visiting vanguard.com/proxyreporting or by | |
| calling Vanguard at 800-662-2739. The guidelines are | |
| also available from the SEC’s website, sec.gov. In | |
| addition, you may obtain a free report on how your fund | |
| voted the proxies for securities it owned during the 12 | |
| months ended June 30. To get the report, visit either | |
| vanguard.com/proxyreporting or sec.gov. | |
| |
| You can review and copy information about your fund at | |
| the SEC’s Public Reference Room in Washington, D.C. To | |
| find out more about this public service, call the SEC at | |
| 202-551-8090. Information about your fund is also | |
| available on the SEC’s website, and you can receive | |
| copies of this information, for a fee, by sending a | |
| request in either of two ways: via e-mail addressed to | |
| publicinfo@sec.gov or via regular mail addressed to the | |
| Public Reference Section, Securities and Exchange | |
| Commission, Washington, DC 20549-1520. | |
| |
| | © 2013 The Vanguard Group, Inc. |
| | All rights reserved. |
| | Vanguard Marketing Corporation, Distributor. |
| |
| | Q522 092013 |
| 
|
|
| Semiannual Report | July 31, 2013 |
| Vanguard Dividend Growth Fund |
|
 |
|
> For the six months ended July 31, 2013, Vanguard Dividend Growth Fund returned almost 14%, exceeding the return of its benchmark index and the average return of its large-capitalization core fund peers.
> The broad U.S. stock market also returned about 14%, advancing in all but one month of the period.
> All nine industry sectors held by the fund tallied positive results, with health care and industrials contributing the most to the return.
| |
| Contents | |
| Your Fund’s Total Returns. | 1 |
| Chairman’s Letter. | 2 |
| Advisor’s Report. | 7 |
| Fund Profile. | 9 |
| Performance Summary. | 10 |
| Financial Statements. | 11 |
| About Your Fund’s Expenses. | 20 |
| Glossary. | 22 |
Please note: The opinions expressed in this report are just that—informed opinions. They should not be considered promises or advice.
Also, please keep in mind that the information and opinions cover the period through the date on the front of this report. Of course, the risks of investing in your fund are spelled out in the prospectus.
See the Glossary for definitions of investment terms used in this report.
About the cover: Our cover photograph shows rigging on the HMSSurprise, a replica of an 18th-century Royal Navy frigate. It was featured in the 2003 movie Master and Commander: The Far Side of the World, which was based on Patrick O’Brian’s sea novels, set amid the Napoleonic Wars. Vanguard was named for another ship of that era, the HMSVanguard, which was the flagship of British Admiral Horatio Nelson at the Battle of the Nile.
Your Fund’s Total Returns
| |
| Six Months Ended July 31, 2013 | |
| | Total |
| | Returns |
| Vanguard Dividend Growth Fund | 13.99% |
| NASDAQ US Dividend Achievers Select Index | 11.66 |
| Large-Cap Core Funds Average | 12.98 |
| Large-Cap Core Funds Average: Derived from data provided by Lipper, a Thomson Reuters Company. |
Your Fund’s Performance at a Glance
January 31, 2013, Through July 31, 2013
| | | | |
| | | | Distributions Per Share |
| | Starting | Ending | Income | Capital |
| | Share Price | Share Price | Dividends | Gains |
| Vanguard Dividend Growth Fund | $17.52 | $19.78 | $0.184 | $0.000 |
1
Chairman’s Letter
Dear Shareholder,
The broad U.S. stock market’s successful showing for the six months ended July 31, 2013, boosted equities of nearly every size and stripe. Companies with a history of increasing dividends were among them, though they didn’t lead the procession. Vanguard Dividend Growth Fund’s skilled and experienced advisor, Wellington Management Company, llp, made the most of a strategy that emphasizes future growth over current income.
Over the half year, the fund returned 13.99%, surpassing its benchmark index and the average return of its peers and nearly equaling the return of the broad U.S. stock market. The advisor’s stock choices, mostly in health care and industrials, helped the fund’s relative performance. The fund’s 30-day SEC yield declined a bit, from 2.24% at the start of the period to 2.06% at the end.
Please note that the name of the fund’s benchmark changed from Mergent’s Dividend Achievers Select Index to the NASDAQ US Dividend Achievers Select Index. The name changed because Nasdaq acquired Mergent’s index business, but the index’s methodology remains the same.
U.S. stocks set a brisk pace; international markets struggled
U.S. stocks, which returned about 14% for the half year, posted positive returns for five of the six months. The exception was June, when stocks slid after Federal Reserve Chairman Ben Bernanke said the central bank might begin unwinding its
2
stimulative bond-buying program later this year. July saw domestic stocks rebound sharply, helped by favorable economic news and reassuring words from Fed officials.
Despite rising in July, international stocks finished the period with a return of less than 1%. Much of the weakness came from emerging markets, where the slowing rate of growth, especially in China and Brazil, has been a concern. Developed markets in the Pacific region and Europe posted modest gains.
Bonds encountered obstacles as market uncertainty increased
Bonds, which also suffered in June amid concerns about the Fed’s intentions, posted negative returns for the six months.
Although July brought a little relief, the broad U.S. taxable bond market returned –1.62%. The yield of the 10-year Treasury note finished at 2.60%, up from 2.47% in June and 1.67% at the end of April. (Bond yields and prices move in opposite directions.)
Municipal bonds fared worse, returning –3.94%. Although Detroit filed for bankruptcy in July, it bears remembering that Detroit debt constitutes just 0.05% of the entire muni bond market. We continue to believe that municipal bonds may make sense as part of a diversified portfolio for investors in higher tax brackets. As Sarah Hammer, a senior investment analyst with Vanguard Investment Strategy Group, said,
| | | |
| Market Barometer | | | |
| |
| | | | Total Returns |
| | | Periods Ended July 31, 2013 |
| | Six | One | Five Years |
| | Months | Year | (Annualized) |
| Stocks | | | |
| Russell 1000 Index (Large-caps) | 13.83% | 26.23% | 8.49% |
| Russell 2000 Index (Small-caps) | 16.66 | 34.76 | 9.45 |
| Russell 3000 Index (Broad U.S. market) | 14.05 | 26.86 | 8.57 |
| MSCI All Country World Index ex USA (International) | 0.26 | 16.96 | 0.79 |
| |
| Bonds | | | |
| Barclays U.S. Aggregate Bond Index (Broad taxable market) | -1.62% | -1.91% | 5.23% |
| Barclays Municipal Bond Index (Broad tax-exempt market) | -3.94 | -2.19 | 5.07 |
| Citigroup Three-Month U.S. Treasury Bill Index | 0.03 | 0.08 | 0.20 |
| |
| CPI | | | |
| Consumer Price Index | 1.44% | 1.96% | 1.21% |
3
“State and local governments have the ability and willingness to continue to make their debt service payments.”
The Fed’s target for short-term rates remained between 0% and 0.25%, capping the returns from money market funds and savings accounts.
Health care and industrial stocks drove the fund’s outperformance
As its name indicates, Vanguard Dividend Growth Fund focuses on companies with a track record of increasing their dividends over time. These stocks typically differ from those with the highest yields, which usually have less room for further dividend increases.
The fund may invest in companies with unexceptional current yields if they have the potential for steady dividend growth. Although the NASDAQ US Dividend Achievers Select Index comprises companies with at least ten straight years of increasing their regular annual dividends, the fund isn’t locked into these parameters. Still, the advisor brings meticulous standards to its stock selection.
Dividend-oriented strategies didn’t deliver the period’s most robust returns, but the advisor’s strategy and selection process, combined with the stock market’s overall rise, resulted in strong fund performance. In choosing stocks, Wellington strives to ensure that a company is able and willing to consistently increase dividends. Its assessment considers a company’s overall
Expense Ratios
Your Fund Compared With Its Peer Group
| | |
| | | Peer Group |
| | Fund | Average |
| Dividend Growth Fund | 0.29% | 1.15% |
The fund expense ratio shown is from the prospectus dated May 28, 2013, and represents estimated costs for the current fiscal year. For the six months ended July 31, 2013, the fund’s annualized expense ratio was 0.31%. The peer-group expense ratio is derived from data provided by Lipper, a Thomson Reuters Company, and captures information through year-end 2012.
Peer group: Large-Cap Core Funds.
4
quality, balance sheet, cash flow, and other factors and includes interviews with top management.
Stocks in the health care sector—the fund’s largest, constituting about 20% of its assets on average—added the most to results. The fund’s exposure to the sector, more than double that of the benchmark, and the advisor’s stock choices both helped. As the population has aged, growth expectations for health care firms have risen. The fund’s giant pharmaceutical and biotechnology companies have benefited from improving pipelines and expanding international markets, and its managed-care firms from large and diverse memberships.
| Investment insight |
| Dividend-growth focus leads to divergence from the broad market |
| As an investor in Vanguard Dividend Growth Fund, you should be aware that its |
| holdings differ notably from the broad stock market’s, and that its results may too. |
| Your fund’s benchmark is the NASDAQ US Dividend Achievers Select Index, which |
| excludes the stocks of companies that haven’t consistently increased dividends. |
| By contrast, broad market indexes, such as the Russell 3000 Index, include all |
| stocks, those that pay dividends and those that don’t. |
| |
| The difference in approaches is reflected in the weightings of various industry |
| sectors in the fund and the broad market index (see the accompanying chart). |
| |
| Vanguard Dividend Growth Fund (Sector diversi cation as of 7/31/2013) |
|
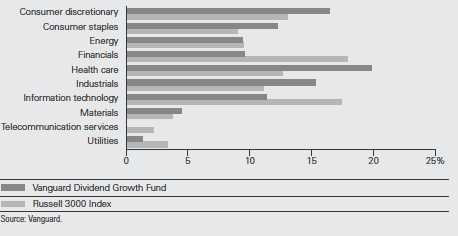 |
|
5
The industrial sector––most notably aerospace and defense––also lifted the fund, with a handful of companies returning 20% or more. Cost-cutting, the diversity of business lines, and international sales offset concerns about defense spending cuts in the United States.
Dividend Growth’s consumer discretionary, financial, and materials stocks posted double-digit returns that exceeded those of the benchmark. The fund was hurt, however, by holding fewer consumer staples stocks than the benchmark and by some of its energy stock choices.
Predicting the future is tricky, but preparing for it is prudent
Now that much of 2013 is in the rearview mirror, it’s clear that few of us anticipated several big events—such as record highs in some stock market indexes, the powerful rally in long-slumbering Japan, and renewed upheaval in Egypt. Of course, such unpredictability underscores the challenge of forecasting.
Vanguard’s approach to forecasting differs from that of many other investment firms. Joe Davis, our chief economist, is fond of saying that we “treat the future with the deference it deserves.”
Each January, our economists publish Vanguard’s Economic and Investment Outlook (available at vanguard.com/ research). They update their perspectives periodically and address significant developments—such as Detroit’s bankruptcy filing—with thoughtful, timely analysis and commentary. But, in keeping with Joe’s comment, our economists don’t make the pinpoint projections that you’ll see elsewhere. Instead, using sophisticated statistical models, we provide a range and probability of potential outcomes—for the inflation rate or the 10-year Treasury yield, for example. And we explain our rationale for such outcomes.
In short, our forecasts acknowledge that no one has a crystal ball or can envision every scenario. And that underlines one of our core investment principles: Develop a suitable asset allocation using broadly diversified funds. Having a balanced portfolio can help you get through unforeseen events and achieve your goals—even without a crystal ball.
As always, thank you for investing with Vanguard.
Sincerely,

F. William McNabb III
Chairman and Chief Executive Officer
August 15, 2013
6
Advisor’s Report
Vanguard Dividend Growth Fund returned 13.99% for the six months ended July 31, 2013, surpassing the 11.66% return of its benchmark, the NASDAQ US Dividend Achievers Select Index.
The investment environment
We continue to believe that investors worldwide appear too optimistic about the global economy’s underlying health. Although the easy-money policies of key central banks appear to have nudged employment upward, we remain concerned about the private sector’s ability to take the momentum to the next level. Indeed, the rather dramatic equity market sell-off that followed the mere suggestion of a slowdown in the Federal Reserve’s asset purchases seems to validate that concern. Second-quarter earnings results are likely to confirm this continued softness. As always, we will aggressively use any price weakness that may occur to raise the quality of the fund’s portfolio.
The fund’s successes
All nine industry sectors represented in the fund boosted absolute performance for the six months, led by the fund’s health care, industrial, and consumer discretionary holdings. Among the top individual contributors were Johnson & Johnson, Lockheed Martin, and Microsoft.
On a “run-rate” basis, the portfolio is expected to produce asset-weighted dividend growth of 8.9% for calendar 2013. The 2012 figure was about 27.7%. Our run-rate calculation is a rough estimate of potential dividend growth; it takes a company’s declared dividend rate, annualizes it, and compares it with the previous calendar year’s actual rate. It does not accurately reflect, nor factor in the dollar size of, dividend increases that may be announced later in the year. Therefore, companies in the early stages of dividend growth tend to show large percentage increases, yet the absolute cash dividend may be small. Despite these shortcomings, we view this estimate as a reasonable report card.
The 8.9% we expect for 2013 is likely to be lower than actual results, but these will still be well below those of 2012. Many companies held by the fund accelerated their planned 2013 payments into 2012 to try to protect shareholders from the higher dividend tax rates that were anticipated for this year. We expect a more normal growth environment in 2014.
Among the notable dividend run-rate increases thus far in 2013 were those of Cardinal Health (33.7%) and Lowe’s (20.0%).
The fund’s shortfalls
The fund’s consumer staples and energy sectors lagged despite contributing to absolute performance for the period. Information technology companies, notably IBM and Oracle, were among the biggest detractors. C.H. Robinson Worldwide, in industrials, also disappointed. Although we would prefer that all stocks in the fund perform well at all times, it is inevitable that some will retreat over a given period. We assess a stock’s contribution over a longer time frame and stay focused on dividend action.
7
The fund’s positioning and investment strategy
Our primary objective is to identify companies that we believe will steadily and reliably grow their dividend payments. We carefully build the portfolio one stock at a time, giving central consideration to each company’s dividend growth prospects. Our industry and sector weightings are an output of this process. As of the end of the period, the fund had significant allocations to the health care, consumer discretionary, and technology sectors, with less exposure to materials and utilities and no holdings in telecommunication services.
Since our last report, little has changed in the fund’s positioning, and our investment strategy remains the same. If anything, we are simply trying to trim stocks that have appreciated significantly and add to those that have lagged the broader market. So the top ten positions have changed modestly; otherwise, we remain steady.
Donald J. Kilbride
Senior Vice President and Equity Portfolio Manager
Wellington Management Company, LLP
August 12, 2013
8
Dividend Growth Fund
Fund Profile
As of July 31, 2013
| | | |
| Portfolio Characteristics | | |
| | | NASDAQ | |
| | | US | DJ U.S. |
| | | Dividend | Total |
| | | Achievers | Market |
| | | Select | FA |
| | Fund | Index | Index |
| Number of Stocks | 52 | 146 | 3,619 |
| Median Market Cap | $65.3B | $54.5B | $40.3B |
| Price/Earnings Ratio | 17.7x | 16.9x | 18.9x |
| Price/Book Ratio | 3.2x | 3.2x | 2.5x |
| Return on Equity | 22.2% | 22.6% | 16.5% |
| Earnings Growth | | | |
| Rate | 7.3% | 6.9% | 10.4% |
| Dividend Yield | 2.4% | 2.2% | 1.9% |
| Foreign Holdings | 8.6% | 0.0% | 0.0% |
| Turnover Rate | | | |
| (Annualized) | 11% | — | — |
| Ticker Symbol | VDIGX | — | — |
| Expense Ratio1 | 0.29% | — | — |
| 30-Day SEC Yield | 2.06% | — | — |
| Short-Term Reserves | 4.3% | — | — |
| | | |
| Sector Diversification (% of equity exposure) |
| | | NASDAQ | |
| | | US | DJ U.S. |
| | | Dividend | Total |
| | | Achievers | Market |
| | | Select | FA |
| | Fund | Index | Index |
| Consumer Discretionary 15.9% | 13.0% | 13.0% |
| Consumer Staples | 11.9 | 23.5 | 9.1 |
| Energy | 9.2 | 12.6 | 9.7 |
| Financials | 10.4 | 7.5 | 17.9 |
| Health Care | 21.2 | 8.6 | 12.6 |
| Industrials | 14.8 | 19.1 | 11.2 |
| Information Technology | 11.0 | 6.0 | 17.2 |
| Materials | 4.3 | 8.3 | 3.7 |
| Telecommunication | | | |
| Services | 0.0 | 0.1 | 2.3 |
| Utilities | 1.3 | 1.3 | 3.3 |
| | |
| Volatility Measures | | |
| | NASDAQ | |
| | US Dividend | |
| | Achievers | DJ U.S. |
| | Select | Total Market |
| | Index | FA Index |
| R-Squared | 0.94 | 0.93 |
| Beta | 0.89 | 0.72 |
These measures show the degree and timing of the fund’s fluctuations compared with the indexes over 36 months.
| | |
| Ten Largest Holdings (% of total net assets) |
| Johnson & Johnson | Pharmaceuticals | 3.1% |
| McDonald's Corp. | Restaurants | 3.0 |
| Microsoft Corp. | Systems Software | 2.9 |
| United Parcel Service | Air Freight & | |
| Inc. | Logistics | 2.8 |
| Lockheed Martin Corp. | Aerospace & | |
| | Defense | 2.4 |
| Roche Holding AG | Pharmaceuticals | 2.4 |
| Medtronic Inc. | Health Care | |
| | Equipment | 2.4 |
| Target Corp. | General Merchandise | |
| | Stores | 2.4 |
| Automatic Data | Data Processing & | |
| Processing Inc. | Outsourced Services | 2.4 |
| Praxair Inc. | Industrial Gases | 2.4 |
| Top Ten | | 26.2% |
The holdings listed exclude any temporary cash investments and equity index products.
Investment Focus
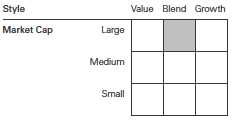
1 The expense ratio shown is from the prospectus dated May 28, 2013, and represents estimated costs for the current fiscal year. For the six months ended July 31, 2013, the annualized expense ratio was 0.31%.
9
Dividend Growth Fund
Performance Summary
All of the returns in this report represent past performance, which is not a guarantee of future results that may be achieved by the fund. (Current performance may be lower or higher than the performance data cited. For performance data current to the most recent month-end, visit our website at vanguard.com/performance.) Note, too, that both investment returns and principal value can fluctuate widely, so an investor’s shares, when sold, could be worth more or less than their original cost. The returns shown do not reflect taxes that a shareholder would pay on fund distributions or on the sale of fund shares.
Fiscal-Year Total Returns (%): January 31, 2003, Through July 31, 2013
For a benchmark description, see the Glossary.
Note: For 2014, performance data reflect the six months ended July 31, 2013.
Average Annual Total Returns: Periods Ended June 30, 2013
This table presents returns through the latest calendar quarter—rather than through the end of the fiscal period.
Securities and Exchange Commission rules require that we provide this information.
| | | | |
| | Inception | One | Five | Ten |
| | Date | Year | Years | Years |
| Dividend Growth Fund | 5/15/1992 | 19.65% | 8.64% | 9.21% |
See Financial Highlights for dividend and capital gains information.
10
Dividend Growth Fund
Financial Statements (unaudited)
Statement of Net Assets
As of July 31, 2013
The fund reports a complete list of its holdings in regulatory filings four times in each fiscal year, at the quarter-ends. For the second and fourth fiscal quarters, the lists appear in the fund’s semiannual and annual reports to shareholders. For the first and third fiscal quarters, the fund files the lists with the Securities and Exchange Commission on Form N-Q. Shareholders can look up the fund’s Forms N-Q on the SEC’s website at sec.gov. Forms N-Q may also be reviewed and copied at the SEC’s Public Reference Room (see the back cover of this report for further information).
| | |
| | | Market |
| | | Value |
| | Shares | ($000) |
| Common Stocks (95.7%) | | |
| Consumer Discretionary (15.2%) | |
| McDonald’s Corp. | 5,087,670 | 498,999 |
| Target Corp. | 5,635,662 | 401,541 |
| Omnicom Group Inc. | 5,538,757 | 355,976 |
| Lowe’s Cos. Inc. | 7,800,199 | 347,733 |
| NIKE Inc. Class B | 4,508,992 | 283,706 |
| Mattel Inc. | 5,956,115 | 250,335 |
| Walt Disney Co. | 3,467,655 | 224,184 |
| TJX Cos. Inc. | 3,122,320 | 162,485 |
| | | 2,524,959 |
| Consumer Staples (11.4%) | | |
| Wal-Mart Stores Inc. | 4,628,829 | 360,771 |
| Procter & Gamble Co. | 4,461,702 | 358,275 |
| CVS Caremark Corp. | 4,906,035 | 301,672 |
| Colgate-Palmolive Co. | 4,169,582 | 249,633 |
| PepsiCo Inc. | 2,871,496 | 239,885 |
| Coca-Cola Co. | 5,109,160 | 204,775 |
| Diageo plc | 5,448,560 | 170,752 |
| | | 1,885,763 |
| Energy (8.8%) | | |
| Exxon Mobil Corp. | 3,897,183 | 365,361 |
| Occidental | | |
| Petroleum Corp. | 3,338,975 | 297,336 |
| Enbridge Inc. | 6,253,832 | 277,983 |
| BG Group plc | 14,991,306 | 270,327 |
| Chevron Corp. | 1,910,039 | 240,455 |
| | | 1,451,462 |
| Financials (9.9%) | | |
| PNC Financial Services | | |
| Group Inc. | 3,885,059 | 295,459 |
| Wells Fargo & Co. | 6,785,242 | 295,158 |
| ACE Ltd. | 3,058,989 | 279,530 |
| BlackRock Inc. | 990,629 | 279,318 |
| Public Storage | 1,111,500 | 176,973 |
| Marsh & | | |
| McLennan Cos. Inc. | 3,913,785 | 163,870 |
| Chubb Corp. | 1,775,877 | 153,613 |
| | | 1,643,921 |
| | |
| | | Market |
| | | Value |
| | Shares | ($000) |
| Health Care (20.3%) | | |
| Johnson & Johnson | 5,441,382 | 508,769 |
| Roche Holding AG | 1,638,745 | 403,277 |
| Medtronic Inc. | 7,273,341 | 401,779 |
| Cardinal Health Inc. | 7,841,377 | 392,775 |
| Merck & Co. Inc. | 8,012,200 | 385,948 |
| UnitedHealth Group Inc. | 4,904,900 | 357,322 |
| Teva Pharmaceutical | | |
| Industries Ltd. ADR | 7,860,400 | 312,058 |
| Pfizer Inc. | 10,513,977 | 307,323 |
| Amgen Inc. | 2,758,584 | 298,727 |
| | | 3,367,978 |
| Industrials (14.2%) | | |
| United Parcel Service Inc. | | |
| Class B | 5,325,045 | 462,214 |
| Lockheed Martin Corp. | 3,377,866 | 405,749 |
| United Technologies Corp. | 3,431,400 | 362,253 |
| General Dynamics Corp. | 3,620,502 | 308,974 |
| Honeywell | | |
| International Inc. | 3,193,062 | 264,960 |
| Northrop Grumman Corp. | 2,303,804 | 212,088 |
| Emerson Electric Co. | 2,885,335 | 177,073 |
| CH Robinson | | |
| Worldwide Inc. | 2,715,185 | 161,880 |
| | | 2,355,191 |
| Information Technology (10.5%) | |
| Microsoft Corp. | 15,105,472 | 480,807 |
| Automatic Data | | |
| Processing Inc. | 5,561,376 | 400,920 |
| International Business | | |
| Machines Corp. | 1,736,632 | 338,713 |
| Oracle Corp. | 9,637,265 | 311,765 |
| Accenture plc Class A | 2,928,775 | 216,173 |
| | | 1,748,378 |
| Materials (4.2%) | | |
| Praxair Inc. | 3,333,376 | 400,572 |
| Ecolab Inc. | 3,122,726 | 287,728 |
| | | 688,300 |
11
Dividend Growth Fund
| | |
| | | Market |
| | | Value |
| | Shares | ($000) |
| Utilities (1.2%) | | |
| Dominion Resources Inc. | 3,438,516 | 203,938 |
| Total Common Stocks | | |
| (Cost $11,842,283) | | 15,869,890 |
| |
| | Face | |
| | Amount | |
| | ($000) | |
| Temporary Cash Investments (4.3%) | |
| Repurchase Agreements (4.3%) | |
| RBS Securities, Inc. | | |
| 0.060%, 8/1/13 (Dated | | |
| 7/31/13, Repurchase | | |
| Value $351,001,000, | | |
| collaterized by U.S. | | |
| Treasury Note/Bond, | | |
| 0.250%-3.250%, | | |
| 2/28/14–5/31/16, | | |
| with a value of | | |
| $358,020,000) | 351,000 | 351,000 |
| Morgan Stanley & Co., Inc. | | |
| 0.080%, 8/1/13 (Dated | | |
| 7/31/13, Repurchase | | |
| Value $355,801,000, | | |
| collaterized by Federal | | |
| National Mortgage Assn. | | |
| 2.500%–3.500%, | | |
| 7/1/27–5/1/43 and | | |
| Federal Home Loan | | |
| Mortgage Corp. 3.000%, | | |
| 7/1/43, with a value of | | |
| $362,916,000) | 355,800 | 355,800 |
| | | 706,800 |
| Total Temporary Cash Investments | |
| (Cost $706,800) | | 706,800 |
| Total Investments (100.0%) | | |
| (Cost $12,549,083) | | 16,576,690 |
| |
| | Market |
| | Value |
| | ($000) |
| Other Assets and Liabilities (0.0%) | |
| Other Assets | 42,576 |
| Liabilities | (35,562) |
| | 7,014 |
| Net Assets (100%) | |
| Applicable to 838,218,380 outstanding | |
| $.001 par value shares of beneficial | |
| interest (unlimited authorization) | 16,583,704 |
| Net Asset Value Per Share | $19.78 |
| |
| |
| At July 31, 2013, net assets consisted of: |
| | Amount |
| | ($000) |
| Paid-in Capital | 12,571,308 |
| Undistributed Net Investment Income | 6,479 |
| Accumulated Net Realized Losses | (21,748) |
| Unrealized Appreciation (Depreciation) | |
| Investment Securities | 4,027,607 |
| Foreign Currencies | 58 |
| Net Assets | 16,583,704 |
See Note A in Notes to Financial Statements.
ADR—American Depositary Receipt.
See accompanying Notes, which are an integral part of the Financial Statements.
12
Dividend Growth Fund
Statement of Operations
| |
| | Six Months Ended |
| | July 31, 2013 |
| | ($000) |
| Investment Income | |
| Income | |
| Dividends1 | 175,651 |
| Interest | 264 |
| Securities Lending | 442 |
| Total Income | 176,357 |
| Expenses | |
| Investment Advisory Fees—Note B | |
| Basic Fee | 7,474 |
| Performance Adjustment | 1,158 |
| The Vanguard Group—Note C | |
| Management and Administrative | 11,947 |
| Marketing and Distribution | 1,706 |
| Custodian Fees | 68 |
| Shareholders’ Reports | 81 |
| Trustees’ Fees and Expenses | 16 |
| Total Expenses | 22,450 |
| Net Investment Income | 153,907 |
| Realized Net Gain (Loss) | |
| Investment Securities Sold | 77,149 |
| Foreign Currencies | 256 |
| Realized Net Gain (Loss) | 77,405 |
| Change in Unrealized Appreciation (Depreciation) | |
| Investment Securities | 1,665,665 |
| Foreign Currencies | 39 |
| Change in Unrealized Appreciation (Depreciation) | 1,665,704 |
| Net Increase (Decrease) in Net Assets Resulting from Operations | 1,897,016 |
| 1 Dividends are net of foreign withholding taxes of $3,058,000. |
See accompanying Notes, which are an integral part of the Financial Statements.
13
Dividend Growth Fund
Statement of Changes in Net Assets
| | |
| | Six Months Ended | Year Ended |
| | July 31, | January 31, |
| | 2013 | 2013 |
| | ($000) | ($000) |
| Increase (Decrease) in Net Assets | | |
| Operations | | |
| Net Investment Income | 153,907 | 241,028 |
| Realized Net Gain (Loss) | 77,405 | (32,138) |
| Change in Unrealized Appreciation (Depreciation) | 1,665,704 | 1,166,466 |
| Net Increase (Decrease) in Net Assets Resulting from Operations | 1,897,016 | 1,375,356 |
| Distributions | | |
| Net Investment Income | (148,707) | (246,574) |
| Realized Capital Gain | — | — |
| Total Distributions | (148,707) | (246,574) |
| Capital Share Transactions | | |
| Issued | 3,016,338 | 4,594,475 |
| Issued in Lieu of Cash Distributions | 131,869 | 216,370 |
| Redeemed | (1,016,620) | (2,064,522) |
| Net Increase (Decrease) from Capital Share Transactions | 2,131,587 | 2,746,323 |
| Total Increase (Decrease) | 3,879,896 | 3,875,105 |
| Net Assets | | |
| Beginning of Period | 12,703,808 | 8,828,703 |
| End of Period1 | 16,583,704 | 12,703,808 |
| 1 Net Assets—End of Period includes undistributed net investment income of $6,479,000 and $1,023,000. |
See accompanying Notes, which are an integral part of the Financial Statements.
14
Dividend Growth Fund
Financial Highlights
| | | | | | |
| Six Months | | | | | |
| | Ended | | | | | |
| For a Share Outstanding | July 31, | | | Year Ended January 31, |
| Throughout Each Period | 2013 | 2013 | 2012 | 2011 | 2010 | 2009 |
| Net Asset Value, Beginning of Period | $17.52 | $15.81 | $14.68 | $12.82 | $10.42 | $14.38 |
| Investment Operations | | | | | | |
| Net Investment Income | .190 | . 357 | . 317 | . 283 | . 291 | . 264 |
| Net Realized and Unrealized Gain (Loss) | | | | | | |
| on Investments | 2.254 | 1.721 | 1.126 | 1.850 | 2.401 | (3.960) |
| Total from Investment Operations | 2.444 | 2.078 | 1.443 | 2.133 | 2.692 | (3.696) |
| Distributions | | | | | | |
| Dividends from Net Investment Income | (.184) | (. 368) | (. 313) | (. 273) | (. 292) | (. 264) |
| Distributions from Realized Capital Gains | — | — | — | — | — | — |
| Total Distributions | (.184) | (. 368) | (. 313) | (. 273) | (. 292) | (. 264) |
| Net Asset Value, End of Period | $19.78 | $17.52 | $15.81 | $14.68 | $12.82 | $10.42 |
| |
| Total Return1 | 13.99% | 13.36% | 9.90% | 16.85% | 26.01% | -25.97% |
| |
| Ratios/Supplemental Data | | | | | | |
| Net Assets, End of Period (Millions) | $16,584 | $12,704 | $8,829 | $4,995 | $2,814 | $1,745 |
| Ratio of Total Expenses to | | | | | | |
| Average Net Assets2 | 0.31% | 0.29% | 0.31% | 0.34% | 0.38% | 0.36% |
| Ratio of Net Investment Income to | | | | | | |
| Average Net Assets | 2.12% | 2.22% | 2.28% | 2.25% | 2.59% | 2.25% |
| Portfolio Turnover Rate | 11% | 11% | 13% | 17% | 24% | 28% |
The expense ratio, net income ratio, and turnover rate for the current period have been annualized.
1 Total returns do not include account service fees that may have applied in the periods shown. Fund prospectuses provide information about any applicable account service fees.
2 Includes performance-based investment advisory fee increases (decreases) of 0.02%, 0.00%, 0.00%, 0.03%, 0.03%, and 0.03%.
See accompanying Notes, which are an integral part of the Financial Statements.
15
Dividend Growth Fund
Notes to Financial Statements
Vanguard Dividend Growth Fund is registered under the Investment Company Act of 1940 as an open-end investment company, or mutual fund.
A. The following significant accounting policies conform to generally accepted accounting principles for U.S. mutual funds. The fund consistently follows such policies in preparing its financial statements.
1. Security Valuation: Securities are valued as of the close of trading on the New York Stock Exchange (generally 4 p.m., Eastern time) on the valuation date. Equity securities are valued at the latest quoted sales prices or official closing prices taken from the primary market in which each security trades; such securities not traded on the valuation date are valued at the mean of the latest quoted bid and asked prices. Securities for which market quotations are not readily available, or whose values have been affected by events occurring before the fund’s pricing time but after the close of the securities’ primary markets, are valued at their fair values calculated according to procedures adopted by the board of trustees. These procedures include obtaining quotations from an independent pricing service, monitoring news to identify significant market- or security-specific events, and evaluating changes in the values of foreign market proxies (for example, ADRs, futures contracts, or exchange-traded funds), between the time the foreign markets close and the fund’s pricing time. When fair-value pricing is employed, the prices of securities used by a fund to calculate its net asset value may differ from quoted or published prices for the same securities. Temporary cash investments acquired over 60 days to maturity are valued using the latest bid prices or using valuations based on a matrix system (which considers such factors as security prices, yields, maturities, and ratings), both as furnished by independent pricing services. Other temporary cash investments are valued at amortized cost, which approximates market value.
2. Foreign Currency: Securities and other assets and liabilities denominated in foreign currencies are translated into U.S. dollars using exchange rates obtained from an independent third party as of the fund’s pricing time on the valuation date. Realized gains (losses) and unrealized appreciation (depreciation) on investment securities include the effects of changes in exchange rates since the securities were purchased, combined with the effects of changes in security prices. Fluctuations in the value of other assets and liabilities resulting from changes in exchange rates are recorded as unrealized foreign currency gains (losses) until the assets or liabilities are settled in cash, at which time they are recorded as realized foreign currency gains (losses).
3. Repurchase Agreements: The fund may enter into repurchase agreements with institutional counterparties. Securities pledged as collateral to the fund under repurchase agreements are held by a custodian bank until the agreements mature. Each agreement requires that the market value of the collateral be sufficient to cover payments of interest and principal. The fund further mitigates its counterparty risk by entering into repurchase agreements only with a diverse group of pre-qualified counterparties, monitoring their financial strength, and entering into master repurchase agreements with its counterparties. The master repurchase agreements provide that, in the event of a counterparty’s default (including bankruptcy), the fund may terminate any repurchase agreements with that counterparty, determine the net amount owed, and sell or retain the collateral up to the net amount owed to the fund.
16
Dividend Growth Fund
4. Federal Income Taxes: The fund intends to continue to qualify as a regulated investment company and distribute all of its taxable income. Management has analyzed the fund’s tax positions taken for all open federal income tax years (January 31, 2010–2013), and for the period ended July 31, 2013, and has concluded that no provision for federal income tax is required in the fund’s financial statements.
5. Distributions: Distributions to shareholders are recorded on the ex-dividend date.
6. Securities Lending: To earn additional income, the fund may lend its securities to qualified institutional borrowers. Security loans are required to be secured at all times by collateral in an amount at least equal to the market value of securities loaned. Daily market fluctuations could cause the value of loaned securities to be more or less than the value of the collateral received. When this occurs, the collateral is adjusted and settled on the next business day. The fund further mitigates its counterparty risk by entering into securities lending transactions only with a diverse group of pre-qualified counterparties, monitoring their financial strength, and entering into master securities lending agreements with its counterparties. The master securities lending agreements provide that, in the event of a counterparty’s default (including bankruptcy), the fund may terminate any loans with that borrower, determine the net amount owed, and sell or retain the collateral up to the net amount owed to the fund. The fund invests cash collateral received in Vanguard Market Liquidity Fund, and records a liability for the return of the collateral, during the period the securities are on loan. Securities lending income represents fees charged to borrowers plus income earned on invested cash collateral, less expenses associated with the loan.
7. Other: Dividend income is recorded on the ex-dividend date. Interest income is accrued daily. Security transactions are accounted for on the date securities are bought or sold. Costs used to determine realized gains (losses) on the sale of investment securities are those of the specific securities sold.
B. Wellington Management Company, LLP, provides investment advisory services to the fund for a fee calculated at an annual percentage rate of average net assets. The basic fee is subject to quarterly adjustments based on the fund’s performance for the preceding three years relative to the NASDAQ US Dividend Achievers Select Index. For the six months ended July 31, 2013, the investment advisory fee represented an effective annual basic rate of 0.10% of the fund’s average net assets before an increase of $1,158,000 (0.02%) based on performance.
C. The Vanguard Group furnishes at cost corporate management, administrative, marketing, and distribution services. The costs of such services are allocated to the fund under methods approved by the board of trustees. The fund has committed to provide up to 0.40% of its net assets in capital contributions to Vanguard. At July 31, 2013, the fund had contributed capital of $1,929,000 to Vanguard (included in Other Assets), representing 0.01% of the fund’s net assets and 0.77% of Vanguard’s capitalization. The fund’s trustees and officers are also directors and officers of Vanguard.
D. Various inputs may be used to determine the value of the fund’s investments. These inputs are summarized in three broad levels for financial statement purposes. The inputs or methodologies used to value securities are not necessarily an indication of the risk associated with investing in those securities.
17
Dividend Growth Fund
Level 1—Quoted prices in active markets for identical securities.
Level 2—Other significant observable inputs (including quoted prices for similar securities, interest rates, prepayment speeds, credit risk, etc.).
Level 3—Significant unobservable inputs (including the fund’s own assumptions used to determine the fair value of investments).
The following table summarizes the market value of the fund’s investments as of July 31, 2013, based on the inputs used to value them:
| | | |
| | Level 1 | Level 2 | Level 3 |
| Investments | ($000) | ($000) | ($000) |
| Common Stocks | 15,025,534 | 844,356 | — |
| Temporary Cash Investments | — | 706,800 | — |
| Total | 15,025,534 | 1,551,156 | — |
E. Distributions are determined on a tax basis and may differ from net investment income and realized capital gains for financial reporting purposes. Differences may be permanent or temporary. Permanent differences are reclassified among capital accounts in the financial statements to reflect their tax character. Temporary differences arise when certain items of income, expense, gain, or loss are recognized in different periods for financial statement and tax purposes; these differences will reverse at some time in the future. Differences in classification may also result from the treatment of short-term gains as ordinary income for tax purposes.
During the six months ended July 31, 2013, the fund realized net foreign currency gains of $256,000, which increased distributable net income for tax purposes; accordingly, such gains have been reclassified from accumulated net realized losses to undistributed net investment income.
The fund’s tax-basis capital gains and losses are determined only at the end of each fiscal year. For tax purposes, at January 31, 2013, the fund had available capital losses totaling $98,481,000 to offset future net capital gains. Of this amount, $45,895,000 is subject to expiration on January 31, 2018. Capital losses of $52,586,000 realized beginning in fiscal 2012 may be carried forward indefinitely under the Regulated Investment Company Modernization Act of 2010, but must be used before any expiring loss carryforwards. The fund will use these capital losses to offset net taxable capital gains, if any, realized during the year ending January 31, 2014; should the fund realize net capital losses for the year, the losses will be added to the loss carryforward balance above.
At July 31, 2013, the cost of investment securities for tax purposes was $12,549,083,000. Net unrealized appreciation of investment securities for tax purposes was $4,027,607,000, consisting of unrealized gains of $4,044,927,000 on securities that had risen in value since their purchase and $17,320,000 in unrealized losses on securities that had fallen in value since their purchase.
F. During the six months ended July 31, 2013, the fund purchased $2,772,131,000 of investment securities and sold $777,215,000 of investment securities, other than temporary cash investments.
18
Dividend Growth Fund
G. Capital shares issued and redeemed were:
| | |
| | Six Months Ended | Year Ended |
| | July 31, 2013 | January 31, 2013 |
| | Shares | Shares |
| | (000) | (000) |
| Issued | 160,073 | 278,157 |
| Issued in Lieu of Cash Distributions | 6,904 | 13,395 |
| Redeemed | (54,008) | (124,792) |
| Net Increase (Decrease) in Shares Outstanding | 112,969 | 166,760 |
H. Management has determined that no material events or transactions occurred subsequent to July 31, 2013, that would require recognition or disclosure in these financial statements.
19
About Your Fund’s Expenses
As a shareholder of the fund, you incur ongoing costs, which include costs for portfolio management, administrative services, and shareholder reports (like this one), among others. Operating expenses, which are deducted from a fund’s gross income, directly reduce the investment return of the fund.
A fund’s expenses are expressed as a percentage of its average net assets. This figure is known as the expense ratio. The following examples are intended to help you understand the ongoing costs (in dollars) of investing in your fund and to compare these costs with those of other mutual funds. The examples are based on an investment of $1,000 made at the beginning of the period shown and held for the entire period.
The accompanying table illustrates your fund’s costs in two ways:
• Based on actual fund return. This section helps you to estimate the actual expenses that you paid over the period. The ”Ending Account Value“ shown is derived from the fund‘s actual return, and the third column shows the dollar amount that would have been paid by an investor who started with $1,000 in the fund. You may use the information here, together with the amount you invested, to estimate the expenses that you paid over the period.
To do so, simply divide your account value by $1,000 (for example, an $8,600 account value divided by $1,000 = 8.6), then multiply the result by the number given for your fund under the heading ”Expenses Paid During Period.“
• Based on hypothetical 5% yearly return. This section is intended to help you compare your fund‘s costs with those of other mutual funds. It assumes that the fund had a yearly return of 5% before expenses, but that the expense ratio is unchanged. In this case—because the return used is not the fund’s actual return—the results do not apply to your investment. The example is useful in making comparisons because the Securities and Exchange Commission requires all mutual funds to calculate expenses based on a 5% return. You can assess your fund’s costs by comparing this hypothetical example with the hypothetical examples that appear in shareholder reports of other funds.
Note that the expenses shown in the table are meant to highlight and help you compare ongoing costs only and do not reflect transaction costs incurred by the fund for buying and selling securities. Further, the expenses do not include any purchase, redemption, or account service fees described in the fund prospectus. If such fees were applied to your account, your costs would be higher. Your fund does not carry a “sales load.”
The calculations assume no shares were bought or sold during the period. Your actual costs may have been higher or lower, depending on the amount of your investment and the timing of any purchases or redemptions.
You can find more information about the fund’s expenses, including annual expense ratios, in the Financial Statements section of this report. For additional information on operating expenses and other shareholder costs, please refer to your fund’s current prospectus.
20
Six Months Ended July 31, 2013
| | | |
| | Beginning | Ending | Expenses |
| | Account Value | Account Value | Paid During |
| Dividend Growth Fund | 1/31/2013 | 7/31/2013 | Period |
| Based on Actual Fund Return | $1,000.00 | $1,139.87 | $1.64 |
| Based on Hypothetical 5% Yearly Return | 1,000.00 | 1,023.26 | 1.56 |
The calculations are based on expenses incurred in the most recent six-month period. The fund’s annualized six-month expense ratio for that period is 0.31%. The dollar amounts shown as “Expenses Paid” are equal to the annualized expense ratio multiplied by the average account value over the period, multiplied by the number of days in the most recent six-month period, then divided by the number of days in the most recent 12-month period.
21
Glossary
30-Day SEC Yield. A fund’s 30-day SEC yield is derived using a formula specified by the U.S. Securities and Exchange Commission. Under the formula, data related to the fund’s security holdings in the previous 30 days are used to calculate the fund’s hypothetical net income for that period, which is then annualized and divided by the fund’s estimated average net assets over the calculation period. For the purposes of this calculation, a security’s income is based on its current market yield to maturity (for bonds), its actual income (for asset-backed securities), or its projected dividend yield (for stocks). Because the SEC yield represents hypothetical annualized income, it will differ—at times significantly—from the fund’s actual experience. As a result, the fund’s income distributions may be higher or lower than implied by the SEC yield.
Beta. A measure of the magnitude of a fund’s past share-price fluctuations in relation to the ups and downs of a given market index. The index is assigned a beta of 1.00. Compared with a given index, a fund with a beta of 1.20 typically would have seen its share price rise or fall by 12% when the index rose or fell by 10%. For this report, beta is based on returns over the past 36 months for both the fund and the index. Note that a fund’s beta should be reviewed in conjunction with its R-squared (see definition). The lower the R-squared, the less correlation there is between the fund and the index, and the less reliable beta is as an indicator of volatility.
Dividend Yield. Dividend income earned by stocks, expressed as a percentage of the aggregate market value (or of net asset value, for a fund). The yield is determined by dividing the amount of the annual dividends by the aggregate value (or net asset value) at the end of the period. For a fund, the dividend yield is based solely on stock holdings and does not include any income produced by other investments.
Earnings Growth Rate. The average annual rate of growth in earnings over the past five years for the stocks now in a fund.
Equity Exposure. A measure that reflects a fund’s investments in stocks and stock futures. Any holdings in short-term reserves are excluded.
Expense Ratio. A fund’s total annual operating expenses expressed as a percentage of the fund’s average net assets. The expense ratio includes management and administrative expenses, but does not include the transaction costs of buying and selling portfolio securities.
Foreign Holdings. The percentage of a fund represented by securities or depositary receipts of companies based outside the United States.
Inception Date. The date on which the assets of a fund (or one of its share classes) are first invested in accordance with the fund’s investment objective. For funds with a subscription period, the inception date is the day after that period ends. Investment performance is measured from the inception date.
Median Market Cap. An indicator of the size of companies in which a fund invests; the midpoint of market capitalization (market price x shares outstanding) of a fund’s stocks, weighted by the proportion of the fund’s assets invested in each stock. Stocks representing half of the fund’s assets have market capitalizations above the median, and the rest are below it.
Price/Book Ratio. The share price of a stock divided by its net worth, or book value, per share. For a fund, the weighted average price/book ratio of the stocks it holds.
22
Price/Earnings Ratio. The ratio of a stock’s current price to its per-share earnings over the past year. For a fund, the weighted average P/E of the stocks it holds. P/E is an indicator of market expectations about corporate prospects; the higher the P/E, the greater the expectations for a company’s future growth.
R-Squared. A measure of how much of a fund’s past returns can be explained by the returns from the market in general, as measured by a given index. If a fund’s total returns were precisely synchronized with an index’s returns, its R-squared would be 1.00. If the fund’s returns bore no relationship to the index’s returns, its R-squared would be 0. For this report, R-squared is based on returns over the past 36 months for both the fund and the index.
Return on Equity. The annual average rate of return generated by a company during the past five years for each dollar of shareholder’s equity (net income divided by shareholder’s equity). For a fund, the weighted average return on equity for the companies whose stocks it holds.
Short-Term Reserves. The percentage of a fund invested in highly liquid, short-term securities that can be readily converted to cash.
Turnover Rate. An indication of the fund’s trading activity. Funds with high turnover rates incur higher transaction costs and may be more likely to distribute capital gains (which may be taxable to investors). The turnover rate excludes in-kind transactions, which have minimal impact on costs.
Benchmark Information
Dividend Growth Spliced Index: Russell 1000 Index through January 31, 2010; NASDAQ US Dividend Achievers Select Index (formerly known as the Dividend Achievers Select Index) thereafter. Prior to December 6, 2002, the comparative benchmark was known as the Utilities Composite Index. The index weightings were: 40% S&P Utilities Index, 40% S&P Telephone Index, and 20% Lehman Brothers Utility Bond Index through April 30, 1999; 63.75% S&P Utilities Index, 21.25% S&P Telephone Index, and 15% Lehman Brothers Utility Bond Index through March 31, 2000; 75% S&P Utilities Index and 25% S&P Telephone Index through December 31, 2001; and 75% S&P Utilities Index and 25% S&P Integrated Telecommunication Services Index through December 6, 2002.
23
The People Who Govern Your Fund
The trustees of your mutual fund are there to see that the fund is operated and managed in your best interests since, as a shareholder, you are a part owner of the fund. Your fund’s trustees also serve on the board of directors of The Vanguard Group, Inc., which is owned by the Vanguard funds and provides services to them on an at-cost basis.
A majority of Vanguard’s board members are independent, meaning that they have no affiliation with Vanguard or the funds they oversee, apart from the sizable personal investments they have made as private individuals. The independent board members have distinguished backgrounds in business, academia, and public service. Each of the trustees and executive officers oversees 181 Vanguard funds.
The following table provides information for each trustee and executive officer of the fund. More information about the trustees is in the Statement of Additional Information, which can be obtained, without charge, by contacting Vanguard at 800-662-7447, or online at vanguard.com.
| |
| InterestedTrustee1 | |
| | and Delphi Automotive LLP (automotive components); |
| | Senior Advisor at New Mountain Capital; Trustee of |
| F. William McNabb III | The Conference Board. |
| Born 1957. Trustee Since July 2009. Chairman of the | |
| Board. Principal Occupation(s) During the Past Five | Amy Gutmann |
| Years: Chairman of the Board of The Vanguard Group, | Born 1949. Trustee Since June 2006. Principal |
| Inc., and of each of the investment companies served | Occupation(s) During the Past Five Years: President |
| by The Vanguard Group, since January 2010; Director | of the University of Pennsylvania; Christopher H. |
| of The Vanguard Group since 2008; Chief Executive | Browne Distinguished Professor of Political Science |
| Officer and President of The Vanguard Group and of | in the School of Arts and Sciences with secondary |
| each of the investment companies served by The | appointments at the Annenberg School for |
| Vanguard Group since 2008; Director of Vanguard | Communication and the Graduate School of Education |
| Marketing Corporation; Managing Director of The | of the University of Pennsylvania; Member of the |
| Vanguard Group (1995–2008). | National Commission on the Humanities and Social |
| | Sciences; Trustee of Carnegie Corporation of New |
| | York and of the National Constitution Center; Chair |
| IndependentTrustees | of the U. S. Presidential Commission for the Study |
| | of Bioethical Issues. |
| |
| Emerson U. Fullwood | JoAnn Heffernan Heisen |
| Born 1948. Trustee Since January 2008. Principal | Born 1950. Trustee Since July 1998. Principal |
| Occupation(s) During the Past Five Years: Executive | Occupation(s) During the Past Five Years: Corporate |
| Chief Staff and Marketing Officer for North America | Vice President and Chief Global Diversity Officer |
| and Corporate Vice President (retired 2008) of Xerox | (retired 2008) and Member of the Executive |
| Corporation (document management products and | Committee (1997–2008) of Johnson & Johnson |
| services); Executive in Residence and 2010 | (pharmaceuticals/medical devices/consumer |
| Distinguished Minett Professor at the Rochester | products); Director of Skytop Lodge Corporation |
| Institute of Technology; Director of SPX Corporation | (hotels), the University Medical Center at Princeton, |
| (multi-industry manufacturing), the United Way of | the Robert Wood Johnson Foundation, and the Center |
| Rochester, Amerigroup Corporation (managed health | for Talent Innovation; Member of the Advisory Board |
| care), the University of Rochester Medical Center, | of the Maxwell School of Citizenship and Public Affairs |
| Monroe Community College Foundation, and North | at Syracuse University. |
| Carolina A&T University. | |
| | F. Joseph Loughrey |
| Rajiv L. Gupta | Born 1949. Trustee Since October 2009. Principal |
| Born 1945. Trustee Since December 2001.2 | Occupation(s) During the Past Five Years: President |
| Principal Occupation(s) During the Past Five Years: | and Chief Operating Officer (retired 2009) of Cummins |
| Chairman and Chief Executive Officer (retired 2009) | Inc. (industrial machinery); Chairman of the Board of |
| and President (2006–2008) of Rohm and Haas Co. | Hillenbrand, Inc. (specialized consumer services) and |
| (chemicals); Director of Tyco International, Ltd. | of Oxfam America; Director of SKF AB (industrial |
| (diversified manufacturing and services), Hewlett- | |
| Packard Co. (electronic computer manufacturing), | |
| |
| | |
| machinery) and the Lumina Foundation for Education; | Executive Officers | |
| Member of the Advisory Council for the College of | | |
| Arts and Letters and of the Advisory Board to the | Glenn Booraem | |
| Kellogg Institute for International Studies, both at | Born 1967. Controller Since July 2010. Principal |
| the University of Notre Dame. | Occupation(s) During the Past Five Years: Principal |
| | of The Vanguard Group, Inc.; Controller of each of |
| Mark Loughridge | the investment companies served by The Vanguard |
| Born 1953. Trustee Since March 2012. Principal | Group; Assistant Controller of each of the investment |
| Occupation(s) During the Past Five Years: Senior Vice | companies served by The Vanguard Group (2001–2010). |
| President and Chief Financial Officer at IBM (information | | |
| technology services); Fiduciary Member of IBM’s | Thomas J. Higgins | |
| Retirement Plan Committee. | Born 1957. Chief Financial Officer Since September |
| | 2008. Principal Occupation(s) During the Past Five |
| Scott C. Malpass | Years: Principal of The Vanguard Group, Inc.; Chief |
| Born 1962. Trustee Since March 2012. Principal | Financial Officer of each of the investment companies |
| Occupation(s) During the Past Five Years: Chief | served by The Vanguard Group; Treasurer of each of |
| Investment Officer and Vice President at the University | the investment companies served by The Vanguard |
| of Notre Dame; Assistant Professor of Finance at the | Group (1998–2008). | |
| Mendoza College of Business at Notre Dame; Member | | |
| of the Notre Dame 403(b) Investment Committee; | Kathryn J. Hyatt | |
| Director of TIFF Advisory Services, Inc. (investment | Born 1955. Treasurer Since November 2008. Principal |
| advisor); Member of the Investment Advisory | Occupation(s) During the Past Five Years: Principal of |
| Committees of the Financial Industry Regulatory | The Vanguard Group, Inc.; Treasurer of each of the |
| Authority (FINRA) and of Major League Baseball. | investment companies served by The Vanguard |
| | Group; Assistant Treasurer of each of the investment |
| André F. Perold | companies served by The Vanguard Group (1988–2008). |
| Born 1952. Trustee Since December 2004. Principal | | |
| Occupation(s) During the Past Five Years: George | Heidi Stam | |
| Gund Professor of Finance and Banking at the Harvard | Born 1956. Secretary Since July 2005. Principal |
| Business School (retired 2011); Chief Investment | Occupation(s) During the Past Five Years: Managing |
| Officer and Managing Partner of HighVista Strategies | Director of The Vanguard Group, Inc.; General Counsel |
| LLC (private investment firm); Director of Rand | of The Vanguard Group; Secretary of The Vanguard |
| Merchant Bank; Overseer of the Museum of Fine | Group and of each of the investment companies |
| Arts Boston. | served by The Vanguard Group; Director and Senior |
| | Vice President of Vanguard Marketing Corporation. |
| Alfred M. Rankin, Jr. | | |
| Born 1941. Trustee Since January 1993. Principal | | |
| Occupation(s) During the Past Five Years: Chairman, | Vanguard Senior ManagementTeam |
| President, and Chief Executive Officer of NACCO | | |
| Industries, Inc. (housewares/lignite) and of Hyster-Yale | Mortimer J. Buckley | Chris D. McIsaac |
| Materials Handling, Inc. (forklift trucks); Director of | Kathleen C. Gubanich | Michael S. Miller |
| the National Association of Manufacturers; Chairman | Paul A. Heller | James M. Norris |
| of the Board of University Hospitals of Cleveland; | Martha G. King | Glenn W. Reed |
| Advisory Chairman of the Board of The Cleveland | John T. Marcante | |
| Museum of Art. | | |
| | |
| Peter F. Volanakis | Chairman Emeritus and Senior Advisor |
| Born 1955. Trustee Since July 2009. Principal | | |
| Occupation(s) During the Past Five Years: President | John J. Brennan | |
| and Chief Operating Officer (retired 2010) of Corning | Chairman, 1996–2009 | |
| Incorporated (communications equipment); Director | Chief Executive Officer and President, 1996–2008 |
| of SPX Corporation (multi-industry manufacturing); | | |
| Overseer of the Amos Tuck School of Business | | |
| Administration at Dartmouth College; Advisor to the | Founder | |
| Norris Cotton Cancer Center. | | |
| John C. Bogle | |
| Chairman and Chief Executive Officer, 1974–1996 | |
1 Mr. McNabb is considered an “interested person,” as defined in the Investment Company Act of 1940, because he is an officer of the Vanguard funds.
2 December 2002 for Vanguard Equity Income Fund, Vanguard Growth Equity Fund, the Vanguard Municipal Bond Funds, and the Vanguard State Tax-Exempt Funds.
|  |
| P.O. Box 2600 |
| Valley Forge, PA 19482-2600 |
Connect with Vanguard® > vanguard.com
| |
| Fund Information > 800-662-7447 | |
| Direct Investor Account Services > 800-662-2739 | |
| Institutional Investor Services > 800-523-1036 | |
| Text Telephone for People | |
| With Hearing Impairment > 800-749-7273 | |
| |
| This material may be used in conjunction | |
| with the offering of shares of any Vanguard | |
| fund only if preceded or accompanied by | |
| the fund’s current prospectus. | |
| |
| All comparative mutual fund data are from Lipper, a | |
| Thomson Reuters Company, or Morningstar, Inc., unless | |
| otherwise noted. | |
| |
| You can obtain a free copy of Vanguard’s proxy voting | |
| guidelines by visiting vanguard.com/proxyreporting or by | |
| calling Vanguard at 800-662-2739. The guidelines are | |
| also available from the SEC’s website, sec.gov. In | |
| addition, you may obtain a free report on how your fund | |
| voted the proxies for securities it owned during the 12 | |
| months ended June 30. To get the report, visit either | |
| vanguard.com/proxyreporting or sec.gov. | |
| |
| You can review and copy information about your fund at | |
| the SEC’s Public Reference Room in Washington, D.C. To | |
| find out more about this public service, call the SEC at | |
| 202-551-8090. Information about your fund is also | |
| available on the SEC’s website, and you can receive | |
| copies of this information, for a fee, by sending a | |
| request in either of two ways: via e-mail addressed to | |
| publicinfo@sec.gov or via regular mail addressed to the | |
| Public Reference Section, Securities and Exchange | |
| Commission, Washington, DC 20549-1520. | |
| |
| | © 2013 The Vanguard Group, Inc. |
| | All rights reserved. |
| | Vanguard Marketing Corporation, Distributor. |
| |
| | Q572 092013 |
| 
|
| Semiannual Report | July 31, 2013 |
| Vanguard Dividend Appreciation Index Fund |
|
 |
> For the six months ended July 31, 2013, Vanguard Dividend Appreciation Index Fund returned almost 12%, closely tracking the return of its target benchmark.
> The broad U.S. stock market advanced about 14% as the economy’s halting recovery continued.
> Nine of the fund’s ten market sectors advanced, with consumer goods, consumer services, and industrials contributing the most to return.
| |
| Contents | |
| Your Fund’s Total Returns. | 1 |
| Chairman’s Letter. | 2 |
| Fund Profile. | 7 |
| Performance Summary. | 8 |
| Financial Statements. | 9 |
| About Your Fund’s Expenses. | 20 |
| Trustees Approve Advisory Arrangement. | 22 |
| Glossary. | 23 |
Please note: The opinions expressed in this report are just that—informed opinions. They should not be considered promises or advice.
Also, please keep in mind that the information and opinions cover the period through the date on the front of this report. Of course, the risks of investing in your fund are spelled out in the prospectus.
See the Glossary for definitions of investment terms used in this report.
About the cover: Our cover photograph shows rigging on the HMSSurprise, a replica of an 18th-century Royal Navy frigate. It was featured in the 2003 movie Master and Commander: The Far Side of the World, which was based on Patrick O’Brian’s sea novels, set amid the Napoleonic Wars. Vanguard was named for another ship of that era, the HMSVanguard, which was the flagship of British Admiral Horatio Nelson at the Battle of the Nile.
Your Fund’s Total Returns
Six Months Ended July 31, 2013
| |
| | Total |
| | Returns |
| Vanguard Dividend Appreciation Index Fund | |
| Investor Shares | 11.61% |
| ETF Shares | |
| Market Price | 11.70 |
| Net Asset Value | 11.62 |
| NASDAQ US Dividend Achievers Select Index | 11.66 |
| Large-Cap Core Funds Average | 12.98 |
| Large-Cap Core Funds Average: Derived from data provided by Lipper, a Thomson Reuters Company. |
The Vanguard ETF® Shares shown are traded on the NYSE Arca exchange and are available only through brokers. The table provides ETF returns based on both the NYSE Arca market price and the net asset value for a share. U.S. Pat. No. 6,879,964; 7,337,138; 7,720,749; 7,925,573; 8,090,646.
For the ETF Shares, the market price is determined by the midpoint of the bid-offer spread as of the closing time of the New York Stock Exchange (generally 4 p.m., Eastern time). The net asset value is also determined as of the NYSE closing time. For more information about how the ETF Shares' market prices have compared with their net asset value, visit vanguard.com, select your ETF, and then select the Price and Performance tab. The ETF premium/discount analysis there shows the percentages of days on which the ETF Shares' market price was above or below the NAV.
Your Fund’s Performance at a Glance
January 31, 2013, Through July 31, 2013
| | | | |
| | | | Distributions Per Share |
| | Starting | Ending | Income | Capital |
| | Share Price | Share Price | Dividends | Gains |
| Vanguard Dividend Appreciation Index Fund | | | | |
| Investor Shares | $25.23 | $27.90 | $0.242 | $0.000 |
| ETF Shares | 63.08 | 69.73 | 0.633 | 0.000 |
1

Chairman’s Letter
Dear Shareholder,
Stocks of companies that have histories of increasing their dividends were among the many that flourished over the six months ended July 31, but they weren’t the top performers. Vanguard Dividend Appreciation Index Fund returned almost 12% for the period, closely tracking its target benchmark but trailing the average return of its large-capitalization peers (about 13%) and the gain of the broad market (about 14%).
Like its benchmark, the fund had relatively little exposure to two of the broad market’s leading sectors, financials and health care. Companies in those sectors––while often generous with their dividends––haven’t raised their payouts consistently. The target index includes stocks of companies that have raised their dividends for at least ten straight years.
The fund’s 30-day SEC yield for Investor Shares declined slightly during the half year, from 2.06% at the start to 1.97%.
Please be aware that the name of the fund’s target index has changed; it is now the NASDAQ US Dividend Achievers Select Index. The name change is the result of NASDAQ’s acquiring the index business of Mergent, the former provider. The methodology used to construct the index is unaltered.
2
U.S. stocks set a brisk pace; international markets struggled
U.S. stocks posted positive returns in five of the six months. The exception was June, when stocks slid after Federal Reserve Chairman Ben Bernanke said the central bank could begin unwinding its stimulative bond-buying program later this year. July saw domestic stocks rebound sharply, helped by favorable economic news and reassuring words from Fed officials.
Despite rising in July, international stocks finished the period with a return of less than 1%. Much of the weakness came from emerging markets, where the slowing rate of growth, especially in
China and Brazil, has been a concern. Developed markets in the Pacific region and Europe posted modest gains.
Bonds encountered obstacles as market uncertainty increased
Bonds, which also suffered in June amid concerns that the Fed could start tapering its bond buying, posted negative returns for the six months. Although July brought a little relief, the broad U.S. taxable bond market returned –1.62% for the period. The yield of the 10-year Treasury note finished the six months at 2.60%, up from 2.47% in June and 1.67% at the end of April. (Bond yields and prices move in opposite directions.)
| | | |
| Market Barometer | | | |
| |
| | | | Total Returns |
| | | Periods Ended July 31, 2013 |
| | Six | One | Five Years |
| | Months | Year | (Annualized) |
| Stocks | | | |
| Russell 1000 Index (Large-caps) | 13.83% | 26.23% | 8.49% |
| Russell 2000 Index (Small-caps) | 16.66 | 34.76 | 9.45 |
| Russell 3000 Index (Broad U.S. market) | 14.05 | 26.86 | 8.57 |
| MSCI All Country World Index ex USA (International) | 0.26 | 16.96 | 0.79 |
| |
| Bonds | | | |
| Barclays U.S. Aggregate Bond Index (Broad taxable market) | -1.62% | -1.91% | 5.23% |
| Barclays Municipal Bond Index (Broad tax-exempt market) | -3.94 | -2.19 | 5.07 |
| Citigroup Three-Month U.S. Treasury Bill Index | 0.03 | 0.08 | 0.20 |
| |
| CPI | | | |
| Consumer Price Index | 1.44% | 1.96% | 1.21% |
3
Municipal bonds fared worse, returning –3.94% for the period. Although Detroit filed for bankruptcy in July, it’s worth remembering that Detroit debt represents a tiny fraction—just 0.05%—of the entire muni bond market. We continue to believe that municipal bonds may make sense as part of a diversified portfolio for those in higher tax brackets. As Sarah Hammer, a senior investment analyst with Vanguard Investment Strategy Group, put it, “State and local governments have the ability and willingness to continue to make their debt service payments.”
The Fed’s target for short-term rates remained between 0% and 0.25%, keeping returns from money market funds and savings accounts exceptionally low.
Consumer and industrial stocks paced the fund’s performance
The investment climate changed in May and June as longer-term interest rates rose, creating issues and opportunities for shareholders who pursue dividend-oriented strategies. Some types of traditionally well-paying dividend stocks—most notably utilities—slumped in those months as higher bond yields reduced the demand for them among investors seeking income.
However, the target index of the Dividend Appreciation Index Fund focuses not on the highest-yielding stocks but on those of companies that regularly increase their dividends. Therefore, the dividend-rich utilities and telecommunications sectors have only a tiny presence in the fund;
Expense Ratios
Your Fund Compared With Its Peer Group
| | | |
| | Investor | ETF | Peer Group |
| | Shares | Shares | Average |
| Dividend Appreciation Index Fund | 0.20% | 0.10% | 1.15% |
The fund expense ratios shown are from the prospectus dated May 28, 2013, and represent estimated costs for the current fiscal year. For the six months ended July 31, 2013, the fund’s annualized expense ratios were 0.20% for Investor Shares and 0.10% for ETF Shares. The peer-group expense ratio is derived from data provided by Lipper, a Thomson Reuters Company, and captures information through year-end 2012.
Peer group: Large-Cap Core Funds.
4
these companies generally lack both a record of raising their dividends and the capacity to do so in the future.
Well represented in the fund, by contrast, are high-quality companies in the consumer goods and consumer services sectors that haven’t been shy about increasing their dividends as their profits have swelled and the economy has gradually expanded. In the hyper-competitive quest for consumer dollars, top companies are benefiting from strong management practices and economies of scale along with improvement in shoppers’ ability and willingness to spend.
Especially productive was the consumer goods sector, the fund’s largest, representing almost one-quarter of assets on average during the half year. Giant soft drink companies and multinational household product corporations were strong performers. Also strong were the fund’s consumer services stocks, especially those of huge broad-line retailers, drugstores, and home improvement firms.
Industrial stocks, the second-largest sector, were important to the fund’s climb as well. For aerospace and defense companies, cost-cutting measures and diversity of business lines offset investors’ concerns about defense spending cuts in the United States. Industrial conglomerates and manufacturers profited from infrastructure development and economic growth, and their revenue streams and earnings benefited from increased corporate spending.
As I mentioned earlier, the index’s allocation to the prosperous health care and financial sectors was much smaller than the two sectors’ share of the broad market. Although the index’s stocks in those sectors generated solid returns, they didn’t include some of the best-performing companies, as these firms didn’t meet the criterion of increasing their dividends for ten straight years.
Technology was the fund’s only sector to decline during the half year, as shortfalls in hardware and software sales hurt profits.
Predicting the future is tricky, but preparing for it is prudent
Now that much of 2013 is in the rearview mirror, it’s clear that few of us had anticipated several big events—such as record highs in some stock market indexes, the powerful rally in long-slumbering Japan, and renewed upheaval in Egypt. Of course, such unpredictability underscores the challenge of forecasting.
Vanguard’s approach to forecasting differs from that of many other investment firms. Joe Davis, our chief economist, is fond of saying that we “treat the future with the deference it deserves.”
5
Each January, our economists publish Vanguard’s Economic and Investment Outlook (available at vanguard.com/ research). They update their perspectives periodically and address significant developments—such as Detroit’s bankruptcy filing—with thoughtful, timely analysis and commentary. But, in keeping with Joe’s observation, our economists don’t make the pinpoint projections that you’ll see elsewhere.
Instead, using sophisticated statistical models, we provide a range and probability of potential outcomes—for the inflation rate or the 10-year Treasury yield, for example. And we explain our rationale for such outcomes.
In short, our forecasts acknowledge that no one has a crystal ball or can envision every scenario. And that underlines one of our core investment principles: Develop a suitable asset allocation using broadly diversified funds. Having a balanced portfolio can help you get through unforeseen events and achieve your goals—even without a crystal ball.
As always, thank you for investing with Vanguard.
Sincerely,

F. William McNabb III
Chairman and Chief Executive Officer
August 14, 2013
6
Dividend Appreciation Index Fund
Fund Profile
As of July 31, 2013
| | |
| Share-Class Characteristics | |
| | Investor | ETF |
| | Shares | Shares |
| Ticker Symbol | VDAIX | VIG |
| Expense Ratio1 | 0.20% | 0.10% |
| 30-Day SEC Yield | 1.97% | 2.08% |
| | | |
| Portfolio Characteristics | | |
| | | NASDAQ | |
| | | US | DJ U.S. |
| | | Dividend | Total |
| | | Achievers | Market |
| | | Select | FA |
| | Fund | Index | Index |
| Number of Stocks | 146 | 146 | 3,619 |
| Median Market Cap | $54.5B | $54.5B | $40.3B |
| Price/Earnings Ratio | 16.9x | 16.9x | 18.9x |
| Price/Book Ratio | 3.2x | 3.2x | 2.5x |
| Return on Equity | 22.6% | 22.6% | 16.5% |
| Earnings Growth | | | |
| Rate | 6.9% | 6.9% | 10.4% |
| Dividend Yield | 2.2% | 2.2% | 1.9% |
| Foreign Holdings | 0.0% | 0.0% | 0.0% |
| Turnover Rate | | | |
| (Annualized) | 5% | — | — |
| Short-Term Reserves | 0.0% | — | — |
| | | |
| Sector Diversification (% of equity exposure) |
| | | NASDAQ | |
| | | US | |
| | | Dividend | DJ U.S. |
| | | Achievers | Total |
| | | Select | Market |
| | Fund | Index | FA Index |
| Basic Materials | 5.3% | 5.3% | 2.9% |
| Consumer Goods | 23.2 | 23.5 | 10.5 |
| Consumer Services | 16.5 | 16.6 | 13.6 |
| Financials | 7.5 | 6.8 | 18.7 |
| Health Care | 8.0 | 8.1 | 12.0 |
| Industrials | 21.3 | 21.5 | 12.9 |
| Oil & Gas | 12.6 | 12.7 | 9.5 |
| Technology | 4.4 | 4.4 | 14.2 |
| Telecommunications | 0.1 | 0.0 | 2.3 |
| Utilities | 1.1 | 1.1 | 3.4 |
| | |
| Volatility Measures | | |
| | NASDAQ | |
| | US Dividend | |
| | Achievers | DJ U.S. |
| | Select | Total Market |
| | Index | FA Index |
| R-Squared | 1.00 | 0.94 |
| Beta | 1.00 | 0.79 |
These measures show the degree and timing of the fund’s fluctuations compared with the indexes over 36 months.
| | |
| Ten Largest Holdings (% of total net assets) |
| PepsiCo Inc. | Soft Drinks | 4.2% |
| Procter & Gamble Co. | Nondurable | |
| | Household Products | 4.1 |
| Wal-Mart Stores Inc. | Broadline Retailers | 4.0 |
| Abbott Laboratories | Pharmaceuticals | 4.0 |
| Chevron Corp. | Integrated Oil & Gas | 3.9 |
| Coca-Cola Co. | Soft Drinks | 3.9 |
| Exxon Mobil Corp. | Integrated Oil & Gas | 3.7 |
| McDonald's Corp. | Restaurants & Bars | 3.5 |
| International Business | | |
| Machines Corp. | Computer Services | 3.4 |
| United Technologies | | |
| Corp. | Aerospace | 3.4 |
| Top Ten | | 38.1% |
The holdings listed exclude any temporary cash investments and equity index products.
Investment Focus
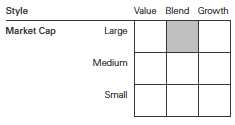
1 The expense ratios shown are from the prospectus dated May 28, 2013, and represent estimated costs for the current fiscal year. For the six months ended July 31, 2013, the annualized expense ratios were 0.20% for Investor Shares and 0.10% for ETF Shares.
7
Dividend Appreciation Index Fund
Performance Summary
All of the returns in this report represent past performance, which is not a guarantee of future results that may be achieved by the fund. (Current performance may be lower or higher than the performance data cited. For performance data current to the most recent month-end, visit our website at vanguard.com/performance.) Note, too, that both investment returns and principal value can fluctuate widely, so an investor’s shares, when sold, could be worth more or less than their original cost. The returns shown do not reflect taxes that a shareholder would pay on fund distributions or on the sale of fund shares.
Fiscal-Year Total Returns (%): April 27, 2006, Through July 31, 2013
Note: For 2014, performance data reflect the six months ended July 31, 2013.
Average Annual Total Returns: Periods Ended June 30, 2013
This table presents returns through the latest calendar quarter—rather than through the end of the fiscal period.
Securities and Exchange Commission rules require that we provide this information.
| | | | |
| | Inception | One | Five | Since |
| | Date | Year | Years | Inception |
| Investor Shares | 4/27/2006 | 19.40% | 8.06% | 6.02% |
| ETF Shares | 4/21/2006 | | | |
| Market Price | | 19.48 | 8.19 | 6.17 |
| Net Asset Value | | 19.46 | 8.18 | 6.17 |
See Financial Highlights for dividend and capital gains information.
8
Dividend Appreciation Index Fund
Financial Statements (unaudited)
Statement of Net Assets
As of July 31, 2013
The fund reports a complete list of its holdings in regulatory filings four times in each fiscal year, at the quarter-ends. For the second and fourth fiscal quarters, the lists appear in the fund’s semiannual and annual reports to shareholders. For the first and third fiscal quarters, the fund files the lists with the Securities and Exchange Commission on Form N-Q. Shareholders can look up the fund’s Forms N-Q on the SEC’s website at sec.gov. Forms N-Q may also be reviewed and copied at the SEC’s Public Reference Room (see the back cover of this report for further information).
| | |
| | | Market |
| | | Value |
| | Shares | ($000) |
| Common Stocks (99.9%)1 | | |
| Basic Materials (5.3%) | | |
| Praxair Inc. | 2,281,927 | 274,219 |
| Ecolab Inc. | 2,244,233 | 206,784 |
| PPG Industries Inc. | 1,124,051 | 180,343 |
| Air Products & | | |
| Chemicals Inc. | 1,549,898 | 168,381 |
| Sigma-Aldrich Corp. | 899,611 | 75,172 |
| International Flavors & | | |
| Fragrances Inc. | 597,754 | 48,227 |
| Albemarle Corp. | 695,846 | 43,149 |
| RPM International Inc. | 958,322 | 33,771 |
| Royal Gold Inc. | 515,924 | 26,668 |
| HB Fuller Co. | 341,314 | 13,704 |
| Stepan Co. | 157,003 | 9,398 |
| | | 1,079,816 |
| Consumer Goods (23.2%) | | |
| PepsiCo Inc. | 10,238,116 | 855,292 |
| Procter & Gamble Co. | 10,501,252 | 843,251 |
| Coca-Cola Co. | 19,927,075 | 798,677 |
| Colgate-Palmolive Co. | 7,016,849 | 420,099 |
| Monsanto Co. | 3,816,122 | 376,956 |
| NIKE Inc. Class B | 5,347,917 | 336,491 |
| Archer-Daniels-Midland | | |
| Co. | 4,844,880 | 176,693 |
| VF Corp. | 889,559 | 175,243 |
| Stanley Black & Decker | | |
| Inc. | 1,260,679 | 106,679 |
| Genuine Parts Co. | 1,154,762 | 94,679 |
| JM Smucker Co. | 809,145 | 91,045 |
| Bunge Ltd. | 1,053,405 | 80,069 |
| Hormel Foods Corp. | 1,818,855 | 77,028 |
| Brown-Forman Corp. | | |
| Class B | 987,038 | 71,570 |
| McCormick & Co. Inc. | 953,704 | 68,295 |
| Church & Dwight Co. | | |
| Inc. | 1,022,608 | 65,140 |
| Polaris Industries Inc. | 493,070 | 55,293 |
| | | |
| | | | Market |
| | | | Value |
| | | Shares | ($000) |
| | Nu Skin Enterprises Inc. | | |
| | Class A | 381,239 | 31,887 |
| | Lancaster Colony Corp. | 203,046 | 16,859 |
| ^ | Tootsie Roll Industries Inc. | 283,309 | 9,593 |
| | Andersons Inc. | 134,516 | 7,979 |
| | | | 4,758,818 |
| Consumer Services (16.5%) | | |
| | Wal-Mart Stores Inc. | 10,596,043 | 825,856 |
| | McDonald’s Corp. | 7,400,150 | 725,807 |
| | Lowe’s Cos. Inc. | 8,109,334 | 361,514 |
| | Walgreen Co. | 6,915,026 | 347,480 |
| | Target Corp. | 4,853,614 | 345,820 |
| | TJX Cos. Inc. | 5,379,385 | 279,943 |
| | Cardinal Health Inc. | 2,439,078 | 122,173 |
| | Ross Stores Inc. | 1,533,782 | 103,484 |
| | Tiffany & Co. | 909,699 | 72,330 |
| | Family Dollar Stores Inc. | 973,155 | 66,914 |
| ^ | FactSet Research | | |
| | Systems Inc. | 324,783 | 35,460 |
| | Rollins Inc. | 1,015,790 | 25,903 |
| | Casey’s General Stores | | |
| | Inc. | 293,386 | 19,431 |
| | Cracker Barrel Old | | |
| | Country Store Inc. | 184,171 | 18,030 |
| | John Wiley & Sons Inc. | | |
| | Class A | 397,445 | 17,937 |
| | Matthews International | | |
| | Corp. Class A | 210,232 | 8,132 |
| | | | 3,376,214 |
| Financials (7.5%) | | |
| | Franklin Resources Inc. | 4,697,174 | 229,598 |
| | ACE Ltd. | 2,500,461 | 228,492 |
| | Aflac Inc. | 3,622,722 | 223,450 |
| | Chubb Corp. | 1,905,380 | 164,815 |
| | T. Rowe Price Group Inc. | 1,804,852 | 135,797 |
| | McGraw Hill Financial Inc. | 2,078,963 | 128,605 |
| | WR Berkley Corp. | 961,812 | 40,752 |
| | PartnerRe Ltd. | 449,420 | 40,241 |
| | SEI Investments Co. | 1,246,216 | 39,393 |
9
Dividend Appreciation Index Fund
| | |
| | | Market |
| | | Value |
| | Shares | ($000) |
| Brown & Brown Inc. | 1,043,194 | 34,415 |
| HCC Insurance Holdings | | |
| Inc. | 748,113 | 33,313 |
| Eaton Vance Corp. | 809,303 | 32,752 |
| RenaissanceRe Holdings | | |
| Ltd. | 368,016 | 32,006 |
| Commerce Bancshares | | |
| Inc. | 672,565 | 30,689 |
| Erie Indemnity Co. | | |
| Class A | 365,881 | 29,406 |
| Prosperity Bancshares | | |
| Inc. | 404,352 | 23,865 |
| UMB Financial Corp. | 311,508 | 18,628 |
| StanCorp Financial Group | | |
| Inc. | 318,740 | 16,922 |
| RLI Corp. | 154,333 | 12,739 |
| Bank of the Ozarks Inc. | 247,991 | 11,849 |
| Bancfirst Corp. | 122,265 | 6,392 |
| 1st Source Corp. | 188,579 | 5,144 |
| Republic Bancorp Inc. | 139,540 | 3,652 |
| First Financial Corp. | 105,511 | 3,499 |
| | | 1,526,414 |
| Health Care (8.0%) | | |
| Abbott Laboratories | 22,545,587 | 825,845 |
| Medtronic Inc. | 6,963,827 | 384,682 |
| Stryker Corp. | 2,561,261 | 180,467 |
| Becton Dickinson and Co. | 1,424,580 | 147,757 |
| CR Bard Inc. | 606,094 | 69,458 |
| West Pharmaceutical | | |
| Services Inc. | 249,513 | 18,404 |
| Owens & Minor Inc. | 460,417 | 16,557 |
| | | 1,643,170 |
| Industrials (21.3%) | | |
| United Technologies | | |
| Corp. | 6,590,954 | 695,807 |
| 3M Co. | 5,025,822 | 590,182 |
| Caterpillar Inc. | 4,729,701 | 392,139 |
| Emerson Electric Co. | 5,217,204 | 320,180 |
| Automatic Data | | |
| Processing Inc. | 3,609,063 | 260,177 |
| Illinois Tool Works Inc. | 3,389,463 | 244,177 |
| General Dynamics Corp. | 2,699,518 | 230,377 |
| Norfolk Southern Corp. | 2,182,313 | 159,658 |
| WW Grainger Inc. | 511,670 | 134,129 |
| Sherwin-Williams Co. | 745,898 | 129,913 |
| Dover Corp. | 1,367,668 | 117,127 |
| Fastenal Co. | 2,219,649 | 108,785 |
| Parker Hannifin Corp. | 1,052,981 | 108,752 |
| Pentair Ltd. | 1,544,592 | 94,344 |
| Roper Industries Inc. | 720,835 | 90,796 |
| CH Robinson Worldwide | | |
| Inc. | 1,182,250 | 70,486 |
| | |
| | | Market |
| | | Value |
| | Shares | ($000) |
| Expeditors International | | |
| of Washington Inc. | 1,492,187 | 60,165 |
| Cintas Corp. | 927,174 | 44,050 |
| Valspar Corp. | 646,266 | 44,024 |
| MDU Resources Group | | |
| Inc. | 1,382,638 | 38,769 |
| Donaldson Co. Inc. | 1,015,377 | 36,807 |
| Lincoln Electric Holdings | | |
| Inc. | 596,885 | 35,240 |
| Nordson Corp. | 472,118 | 34,068 |
| Bemis Co. Inc. | 753,656 | 31,043 |
| Carlisle Cos. Inc. | 456,402 | 30,917 |
| Jack Henry & Associates | | |
| Inc. | 632,071 | 30,529 |
| Graco Inc. | 435,684 | 30,402 |
| Aptargroup Inc. | 474,354 | 27,697 |
| Valmont Industries Inc. | 194,038 | 27,095 |
| AO Smith Corp. | 561,513 | 23,202 |
| CLARCOR Inc. | 373,911 | 20,558 |
| Mine Safety Appliances | | |
| Co. | 272,550 | 14,481 |
| Franklin Electric Co. Inc. | 346,916 | 12,926 |
| Brady Corp. Class A | 359,118 | 11,948 |
| ABM Industries Inc. | 394,392 | 10,215 |
| Raven Industries Inc. | 268,898 | 8,244 |
| Tennant Co. | 137,514 | 7,096 |
| McGrath RentCorp | 193,245 | 6,617 |
| Lindsay Corp. | 85,616 | 6,430 |
| Gorman-Rupp Co. | 162,270 | 5,636 |
| Cass Information Systems | | |
| Inc. | 95,846 | 5,292 |
| Badger Meter Inc. | 104,588 | 4,982 |
| NACCO Industries Inc. | | |
| Class A | 48,861 | 2,997 |
| | | 4,358,459 |
| Oil & Gas (12.6%) | | |
| Chevron Corp. | 6,402,553 | 806,017 |
| Exxon Mobil Corp. | 8,095,191 | 758,924 |
| Occidental Petroleum | | |
| Corp. | 5,802,780 | 516,738 |
| EOG Resources Inc. | 2,041,106 | 296,960 |
| Murphy Oil Corp. | 1,467,773 | 99,398 |
| Helmerich & Payne Inc. | 745,352 | 47,106 |
| Energen Corp. | 524,573 | 31,417 |
| ^ CARBO Ceramics Inc. | 175,895 | 15,454 |
| | | 2,572,014 |
| Technology (4.3%) | | |
| International Business | | |
| Machines Corp. | 3,617,533 | 705,564 |
| Linear Technology Corp. | 1,701,100 | 68,996 |
| Maxim Integrated | | |
| Products Inc. | 2,156,961 | 61,689 |
| Harris Corp. | 875,869 | 49,986 |
| | | 886,235 |
10
Dividend Appreciation Index Fund
| | |
| | | Market |
| | | Value |
| | Shares | ($000) |
| Telecommunications (0.1%) | | |
| Telephone & Data | | |
| Systems Inc. | 711,075 | 18,850 |
| Atlantic Tele-Network Inc. | 101,526 | 5,178 |
| | | 24,028 |
| Utilities (1.1%) | | |
| ONEOK Inc. | 1,440,480 | 76,273 |
| National Fuel Gas Co. | 615,725 | 39,918 |
| UGI Corp. | 827,473 | 34,746 |
| Aqua America Inc. | 1,021,302 | 34,581 |
| South Jersey Industries | | |
| Inc. | 228,320 | 13,950 |
| MGE Energy Inc. | 175,574 | 10,308 |
| American States Water | | |
| Co. | 142,048 | 9,122 |
| SJW Corp. | 144,249 | 4,023 |
| Connecticut Water | | |
| Service Inc. | 81,257 | 2,430 |
| York Water Co. | 96,381 | 2,032 |
| | | 227,383 |
| Total Common Stocks | | |
| (Cost $16,282,065) | | 20,452,551 |
| Temporary Cash Investments (0.2%)1 | |
| Money Market Fund (0.2%) | | |
| 2,3 Vanguard Market | | |
| Liquidity Fund, | | |
| 0.124% | 44,047,759 | 44,048 |
| |
| | Face | |
| | Amount | |
| | ($000) | |
| U.S. Government and Agency Obligations (0.0%) |
| 4,5 Federal Home Loan | | |
| Bank Discount Notes, | | |
| 0.095%, 10/4/13 | 1,400 | 1,399 |
| Total Temporary Cash Investments | |
| (Cost $45,447) | | 45,447 |
| Total Investments (100.1%) | | |
| (Cost $16,327,512) | | 20,497,998 |
| |
| | Market |
| | Value |
| | ($000) |
| Other Assets and Liabilities (-0.1%) | |
| Other Assets | 50,074 |
| Liabilities3 | (63,172) |
| | (13,098) |
| Net Assets (100%) | 20,484,900 |
| |
| |
| At July 31, 2013, net assets consisted of: |
| | Amount |
| | ($000) |
| Paid-in Capital | 16,525,236 |
| Undistributed Net Investment Income | 24,122 |
| Accumulated Net Realized Losses | (236,327) |
| Unrealized Appreciation (Depreciation) | |
| Investment Securities | 4,170,486 |
| Futures Contracts | 1,383 |
| Net Assets | 20,484,900 |
| |
| |
| Investor Shares—Net Assets | |
| Applicable to 125,171,272 outstanding | |
| $.001 par value shares of beneficial | |
| interest (unlimited authorization) | 3,491,921 |
| Net Asset Value Per Share— | |
| Investor Shares | $27.90 |
| |
| |
| ETF Shares—Net Assets | |
| Applicable to 243,680,359 outstanding | |
| $.001 par value shares of beneficial | |
| interest (unlimited authorization) | 16,992,979 |
| Net Asset Value Per Share— | |
| ETF Shares | $69.73 |
See Note A in Notes to Financial Statements.
^ Part of security position is on loan to broker-dealers. The total value of securities on loan is $11,977,000.
1 The fund invests a portion of its cash reserves in equity markets through the use of index futures contracts. After giving effect to futures investments, the fund’s effective common stock and temporary cash investment positions represent 100.0% and 0.1%, respectively, of net assets.
2 Affiliated money market fund available only to Vanguard funds and certain trusts and accounts managed by Vanguard. Rate shown is the 7-day yield.
3 Includes $12,266,000 of collateral received for securities on loan.
4 Securities with a value of $1,399,000 have been segregated as initial margin for open futures contracts.
5 The issuer operates under a congressional charter; its securities are generally neither guaranteed by the U.S. Treasury nor backed by the full faith and credit of the U.S. government.
See accompanying Notes, which are an integral part of the Financial Statements.
11
Dividend Appreciation Index Fund
Statement of Operations
| |
| | Six Months Ended |
| | July 31, 2013 |
| | ($000) |
| Investment Income | |
| Income | |
| Dividends | 201,908 |
| Interest1 | 20 |
| Securities Lending | 839 |
| Total Income | 202,767 |
| Expenses | |
| The Vanguard Group—Note B | |
| Investment Advisory Services | 538 |
| Management and Administrative—Investor Shares | 2,539 |
| Management and Administrative—ETF Shares | 4,938 |
| Marketing and Distribution—Investor Shares | 394 |
| Marketing and Distribution—ETF Shares | 1,897 |
| Custodian Fees | 103 |
| Shareholders’ Reports—Investor Shares | 21 |
| Shareholders’ Reports—ETF Shares | 178 |
| Trustees’ Fees and Expenses | 9 |
| Total Expenses | 10,617 |
| Net Investment Income | 192,150 |
| Realized Net Gain (Loss) | |
| Investment Securities Sold | 120,514 |
| Futures Contracts | 2,856 |
| Realized Net Gain (Loss) | 123,370 |
| Change in Unrealized Appreciation (Depreciation) | |
| Investment Securities | 1,688,883 |
| Futures Contracts | 1,485 |
| Change in Unrealized Appreciation (Depreciation) | 1,690,368 |
| Net Increase (Decrease) in Net Assets Resulting from Operations | 2,005,888 |
| 1 Interest income from an affiliated company of the fund was $19,000. |
See accompanying Notes, which are an integral part of the Financial Statements.
12
Dividend Appreciation Index Fund
Statement of Changes in Net Assets
| | |
| | Six Months Ended | Year Ended |
| | July 31, | January 31, |
| | 2013 | 2013 |
| | ($000) | ($000) |
| Increase (Decrease) in Net Assets | | |
| Operations | | |
| Net Investment Income | 192,150 | 332,151 |
| Realized Net Gain (Loss) | 123,370 | 481,383 |
| Change in Unrealized Appreciation (Depreciation) | 1,690,368 | 1,192,461 |
| Net Increase (Decrease) in Net Assets Resulting from Operations | 2,005,888 | 2,005,995 |
| Distributions | | |
| Net Investment Income | | |
| Investor Shares | (28,842) | (56,344) |
| ETF Shares | (146,199) | (276,499) |
| Realized Capital Gain | | |
| Investor Shares | — | — |
| ETF Shares | — | — |
| Total Distributions | (175,041) | (332,843) |
| Capital Share Transactions | | |
| Investor Shares | 371,382 | 295,165 |
| ETF Shares | 2,360,148 | 2,071,585 |
| Net Increase (Decrease) from Capital Share Transactions | 2,731,530 | 2,366,750 |
| Total Increase (Decrease) | 4,562,377 | 4,039,902 |
| Net Assets | | |
| Beginning of Period | 15,922,523 | 11,882,621 |
| End of Period1 | 20,484,900 | 15,922,523 |
| 1 Net Assets—End of Period includes undistributed net investment income of $24,122,000 and $7,013,000. |
See accompanying Notes, which are an integral part of the Financial Statements.
13
Dividend Appreciation Index Fund
Financial Highlights
Investor Shares
| | | | | | |
| Six Months | | | | | |
| | Ended | | | | | |
| For a Share Outstanding | July 31, | | | Year Ended January 31, |
| Throughout Each Period | 2013 | 2013 | 2012 | 2011 | 2010 | 2009 |
| Net Asset Value, Beginning of Period | $25.23 | $22.42 | $21.33 | $18.33 | $14.79 | $21.40 |
| Investment Operations | | | | | | |
| Net Investment Income | . 262 | . 538 | . 445 | . 392 | . 369 | . 387 |
| Net Realized and Unrealized Gain (Loss) | | | | | | |
| on Investments | 2.650 | 2.812 | 1.089 | 3.006 | 3.543 | (6.614) |
| Total from Investment Operations | 2.912 | 3.350 | 1.534 | 3.398 | 3.912 | (6.227) |
| Distributions | | | | | | |
| Dividends from Net Investment Income | (. 242) | (. 540) | (. 444) | (. 398) | (. 372) | (. 383) |
| Distributions from Realized Capital Gains | — | — | — | — | — | — |
| Total Distributions | (. 242) | (. 540) | (. 444) | (. 398) | (. 372) | (. 383) |
| Net Asset Value, End of Period | $27.90 | $25.23 | $22.42 | $21.33 | $18.33 | $14.79 |
| |
| Total Return1 | 11.61% | 15.15% | 7.34% | 18.75% | 26.80% | -29.48% |
| |
| Ratios/Supplemental Data | | | | | | |
| Net Assets, End of Period (Millions) | $3,492 | $2,804 | $2,206 | $1,421 | $613 | $386 |
| Ratio of Total Expenses to | | | | | | |
| Average Net Assets | 0.20% | 0.20% | 0.25% | 0.30% | 0.35% | 0.36% |
| Ratio of Net Investment Income to | | | | | | |
| Average Net Assets | 2.02% | 2.32% | 2.14% | 2.13% | 2.24% | 2.25% |
| Portfolio Turnover Rate 2 | 5% | 15% | 14% | 15% | 20% | 34% |
The expense ratio, net income ratio, and turnover rate for the current period have been annualized.
1 Total returns do not include account service fees that may have applied in the periods shown. Fund prospectuses provide information about any applicable account service fees.
2 Excludes the value of portfolio securities received or delivered as a result of in-kind purchases or redemptions of the fund’s capital shares, including ETF Creation Units.
See accompanying Notes, which are an integral part of the Financial Statements.
14
Dividend Appreciation Index Fund
Financial Highlights
ETF Shares
| | | | | | |
| Six Months | | | | | |
| | Ended | | | | | |
| For a Share Outstanding | July 31, | | | Year Ended January 31, |
| Throughout Each Period | 2013 | 2013 | 2012 | 2011 | 2010 | 2009 |
| Net Asset Value, Beginning of Period | $63.08 | $56.04 | $53.32 | $45.81 | $36.96 | $53.48 |
| Investment Operations | | | | | | |
| Net Investment Income | . 687 | 1.401 | 1.173 | 1.034 | . 973 | 1.032 |
| Net Realized and Unrealized Gain (Loss) | | | | | | |
| on Investments | 6.596 | 7.049 | 2.719 | 7.524 | 8.856 | (16.526) |
| Total from Investment Operations | 7.283 | 8.450 | 3.892 | 8.558 | 9.829 | (15.494) |
| Distributions | | | | | | |
| Dividends from Net Investment Income | (. 633) | (1.410) | (1.172) | (1.048) | (. 979) | (1.026) |
| Distributions from Realized Capital Gains | — | — | — | — | — | — |
| Total Distributions | (. 633) | (1.410) | (1.172) | (1.048) | (. 979) | (1.026) |
| Net Asset Value, End of Period | $69.73 | $63.08 | $56.04 | $53.32 | $45.81 | $36.96 |
| |
| Total Return | 11.62% | 15.29% | 7.46% | 18.91% | 26.95% | -29.38% |
| |
| Ratios/Supplemental Data | | | | | | |
| Net Assets, End of Period (Millions) | $16,993 | $13,119 | $9,677 | $4,985 | $1,918 | $805 |
| Ratio of Total Expenses to | | | | | | |
| Average Net Assets | 0.10% | 0.10% | 0.13% | 0.18% | 0.23% | 0.24% |
| Ratio of Net Investment Income to | | | | | | |
| Average Net Assets | 2.12% | 2.42% | 2.26% | 2.25% | 2.36% | 2.37% |
| Portfolio Turnover Rate1 | 5% | 15% | 14% | 15% | 20% | 34% |
The expense ratio, net income ratio, and turnover rate for the current period have been annualized.
1 Excludes the value of portfolio securities received or delivered as a result of in-kind purchases or redemptions of the fund’s capital shares, including ETF Creation Units.
See accompanying Notes, which are an integral part of the Financial Statements.
15
Dividend Appreciation Index Fund
Notes to Financial Statements
Vanguard Dividend Appreciation Index Fund is registered under the Investment Company Act of 1940 as an open-end investment company, or mutual fund. The fund offers two classes of shares: Investor Shares and ETF Shares. Investor Shares are available to any investor who meets the fund’s minimum purchase requirements. ETF Shares are listed for trading on NYSE Arca; they can be purchased and sold through a broker.
A. The following significant accounting policies conform to generally accepted accounting principles for U.S. mutual funds. The fund consistently follows such policies in preparing its financial statements.
1. Security Valuation: Securities are valued as of the close of trading on the New York Stock Exchange (generally 4 p.m., Eastern time) on the valuation date. Equity securities are valued at the latest quoted sales prices or official closing prices taken from the primary market in which each security trades; such securities not traded on the valuation date are valued at the mean of the latest quoted bid and asked prices. Securities for which market quotations are not readily available, or whose values have been materially affected by events occurring before the fund’s pricing time but after the close of the securities’ primary markets, are valued by methods deemed by the board of trustees to represent fair value. Investments in Vanguard Market Liquidity Fund are valued at that fund’s net asset value. Temporary cash investments acquired over 60 days to maturity are valued using the latest bid prices or using valuations based on a matrix system (which considers such factors as security prices, yields, maturities, and ratings), both as furnished by independent pricing services. Other temporary cash investments are valued at amortized cost, which approximates market value.
2. Futures Contracts: The fund uses index futures contracts to a limited extent, with the objectives of maintaining full exposure to the stock market, enhancing returns, maintaining liquidity, and minimizing transaction costs. The fund may purchase futures contracts to immediately invest incoming cash in the market, or sell futures in response to cash outflows, thereby simulating a fully invested position in the underlying index while maintaining a cash balance for liquidity. The fund may seek to enhance returns by using futures contracts instead of the underlying securities when futures are believed to be priced more attractively than the underlying securities. The primary risks associated with the use of futures contracts are imperfect correlation between changes in market values of stocks held by the fund and the prices of futures contracts, and the possibility of an illiquid market.
Futures contracts are valued at their quoted daily settlement prices. The aggregate notional amounts of the contracts are not recorded in the Statement of Net Assets. Fluctuations in the value of the contracts are recorded in the Statement of Net Assets as an asset (liability) and in the Statement of Operations as unrealized appreciation (depreciation) until the contracts are closed, when they are recorded as realized futures gains (losses). Counterparty risk involving futures is mitigated because a regulated clearinghouse is the counterparty instead of the clearing broker. To further mitigate counterparty risk, the fund trades futures contracts on an exchange; monitors the financial strength of its clearing brokers and clearinghouse; and has entered into clearing agreements with its clearing brokers. The clearinghouse imposes initial margin requirements to secure the fund’s performance and requires daily settlement of variation margin representing changes in the market value of each contract.
During the six months ended July 31, 2013, the fund’s average investments in long and short futures contracts represented less than 1% and 0% of net assets, respectively, based on quarterly average aggregate settlement values.
16
Dividend Appreciation Index Fund
3. Federal Income Taxes: The fund intends to continue to qualify as a regulated investment company and distribute all of its taxable income. Management has analyzed the fund’s tax positions taken for all open federal income tax years (January 31, 2010–2013), and for the period ended July 31, 2013, and has concluded that no provision for federal income tax is required in the fund’s financial statements.
4. Distributions: Distributions to shareholders are recorded on the ex-dividend date.
5. Securities Lending: To earn additional income, the fund may lend its securities to qualified institutional borrowers. Security loans are required to be secured at all times by collateral in an amount at least equal to the market value of securities loaned. Daily market fluctuations could cause the value of loaned securities to be more or less than the value of the collateral received. When this occurs, the collateral is adjusted and settled on the next business day. The fund further mitigates its counterparty risk by entering into securities lending transactions only with a diverse group of pre-qualified counterparties, monitoring their financial strength, and entering into master securities lending agreements with its counterparties. The master securities lending agreements provide that, in the event of a counterparty’s default (including bankruptcy), the fund may terminate any loans with that borrower, determine the net amount owed, and sell or retain the collateral up to the net amount owed to the fund. The fund invests cash collateral received in Vanguard Market Liquidity Fund, and records a liability for the return of the collateral, during the period the securities are on loan. Securities lending income represents fees charged to borrowers plus income earned on invested cash collateral, less expenses associated with the loan.
6. Other: Dividend income is recorded on the ex-dividend date. Interest income includes income distributions received from Vanguard Market Liquidity Fund and is accrued daily. Security transactions are accounted for on the date securities are bought or sold. Costs used to determine realized gains (losses) on the sale of investment securities are those of the specific securities sold.
Each class of shares has equal rights as to assets and earnings, except that each class separately bears certain class-specific expenses related to maintenance of shareholder accounts (included in Management and Administrative expenses) and shareholder reporting. Marketing and distribution expenses are allocated to each class of shares based on a method approved by the board of trustees. Income, other non-class-specific expenses, and gains and losses on investments are allocated to each class of shares based on its relative net assets.
B. The Vanguard Group furnishes at cost investment advisory, corporate management, administrative, marketing, and distribution services. The costs of such services are allocated to the fund under methods approved by the board of trustees. The fund has committed to provide up to 0.40% of its net assets in capital contributions to Vanguard. At July 31, 2013, the fund had contributed capital of $2,372,000 to Vanguard (included in Other Assets), representing 0.01% of the fund’s net assets and 0.95% of Vanguard’s capitalization. The fund’s trustees and officers are also directors and officers of Vanguard.
17
Dividend Appreciation Index Fund
C. Various inputs may be used to determine the value of the fund’s investments. These inputs are summarized in three broad levels for financial statement purposes. The inputs or methodologies used to value securities are not necessarily an indication of the risk associated with investing in those securities.
Level 1—Quoted prices in active markets for identical securities.
Level 2—Other significant observable inputs (including quoted prices for similar securities, interest rates, prepayment speeds, credit risk, etc.).
Level 3—Significant unobservable inputs (including the fund’s own assumptions used to determine the fair value of investments).
The following table summarizes the market value of the fund’s investments as of July 31, 2013, based on the inputs used to value them:
| | | |
| | Level 1 | Level 2 | Level 3 |
| Investments | ($000) | ($000) | ($000) |
| Common Stocks | 20,452,551 | — | — |
| Temporary Cash Investments | 44,048 | 1,399 | — |
| Futures Contracts—Liabilities1 | (81) | — | — |
| Total | 20,496,518 | 1,399 | — |
| 1 Represents variation margin on the last day of the reporting period. |
D. At July 31, 2013, the aggregate settlement value of open futures contracts and the related unrealized appreciation (depreciation) were:
| | | | |
| | | | | ($000) |
| | | | Aggregate | |
| | | Number of | Settlement | Unrealized |
| | | Long (Short) | Value | Appreciation |
| Futures Contracts | Expiration | Contracts | Long (Short) | (Depreciation) |
| S&P 500 Index | September 2013 | 67 | 28,148 | 1,138 |
| E-mini S&P 500 Index | September 2013 | 50 | 4,202 | 245 |
Unrealized appreciation (depreciation) on open futures contracts is required to be treated as realized gain (loss) for tax purposes.
E. Distributions are determined on a tax basis and may differ from net investment income and realized capital gains for financial reporting purposes. Differences may be permanent or temporary. Permanent differences are reclassified among capital accounts in the financial statements to reflect their tax character. Temporary differences arise when certain items of income, expense, gain, or loss are recognized in different periods for financial statement and tax purposes; these differences will reverse at some time in the future. Differences in classification may also result from the treatment of short-term gains as ordinary income for tax purposes.
18
Dividend Appreciation Index Fund
During the six months ended July 31, 2013, the fund realized $112,927,000 of net capital gains resulting from in-kind redemptions—in which shareholders exchanged fund shares for securities held by the fund rather than for cash. Because such gains are not taxable to the fund, and are not distributed to shareholders, they have been reclassified from accumulated net realized losses to paid-in capital.
The fund’s tax-basis capital gains and losses are determined only at the end of each fiscal year. For tax purposes, at January 31, 2013, the fund had available capital losses totaling $246,844,000 to offset future net capital gains. Of this amount, $191,649,000 is subject to expiration dates; $609,000 may be used to offset future net capital gains through January 31, 2016, $22,242,000 through January 31, 2017, $146,149,000 through January 31, 2018, and $22,649,000 through January 31, 2019. Capital losses of $55,195,000 realized beginning in fiscal 2012 may be carried forward indefinitely under the Regulated Investment Company Modernization Act of 2010, but must be used before any expiring loss carryforwards. The fund will use these capital losses to offset net taxable capital gains, if any, realized during the year ending January 31, 2014; should the fund realize net capital losses for the year, the losses will be added to the loss carryforward balance above.
At July 31, 2013, the cost of investment securities for tax purposes was $16,327,512,000. Net unrealized appreciation of investment securities for tax purposes was $4,170,486,000, consisting of unrealized gains of $4,218,354,000 on securities that had risen in value since their purchase and $47,868,000 in unrealized losses on securities that had fallen in value since their purchase.
F. During the six months ended July 31, 2013, the fund purchased $3,626,889,000 of investment securities and sold $807,666,000 of investment securities, other than temporary cash investments. Purchases and sales include $2,628,127,000 and $347,514,000, respectively, in connection with in-kind purchases and redemptions of the fund’s capital shares.
G. Capital share transactions for each class of shares were:
| | | | |
| | Six Months Ended | | Year Ended |
| | | July 31, 2013 | January 31, 2013 |
| | Amount | Shares | Amount | Shares |
| | ($000) | (000) | ($000) | (000) |
| Investor Shares | | | | |
| Issued | 669,701 | 25,240 | 952,479 | 40,707 |
| Issued in Lieu of Cash Distributions | 23,908 | 914 | 46,434 | 1,980 |
| Redeemed | (322,227) | (12,094) | (703,748) | (29,978) |
| Net Increase (Decrease) —Investor Shares | 371,382 | 14,060 | 295,165 | 12,709 |
| ETF Shares | | | | |
| Issued | 2,711,279 | 40,995 | 3,350,319 | 56,407 |
| Issued in Lieu of Cash Distributions | — | — | — | — |
| Redeemed | (351,131) | (5,300) | (1,278,734) | (21,100) |
| Net Increase (Decrease)—ETF Shares | 2,360,148 | 35,695 | 2,071,585 | 35,307 |
H. In preparing the financial statements as of July 31, 2013, management considered the impact of subsequent events for potential recognition or disclosure in these financial statements.
19
About Your Fund’s Expenses
As a shareholder of the fund, you incur ongoing costs, which include costs for portfolio management, administrative services, and shareholder reports (like this one), among others. Operating expenses, which are deducted from a fund’s gross income, directly reduce the investment return of the fund.
A fund’s expenses are expressed as a percentage of its average net assets. This figure is known as the expense ratio. The following examples are intended to help you understand the ongoing costs (in dollars) of investing in your fund and to compare these costs with those of other mutual funds. The examples are based on an investment of $1,000 made at the beginning of the period shown and held for the entire period.
The accompanying table illustrates your fund’s costs in two ways:
• Based on actual fund return. This section helps you to estimate the actual expenses that you paid over the period. The ”Ending Account Value“ shown is derived from the fund‘s actual return, and the third column shows the dollar amount that would have been paid by an investor who started with $1,000 in the fund. You may use the information here, together with the amount you invested, to estimate the expenses that you paid over the period.
To do so, simply divide your account value by $1,000 (for example, an $8,600 account value divided by $1,000 = 8.6), then multiply the result by the number given for your fund under the heading ”Expenses Paid During Period.“
• Based on hypothetical 5% yearly return. This section is intended to help you compare your fund‘s costs with those of other mutual funds. It assumes that the fund had a yearly return of 5% before expenses, but that the expense ratio is unchanged. In this case—because the return used is not the fund’s actual return—the results do not apply to your investment. The example is useful in making comparisons because the Securities and Exchange Commission requires all mutual funds to calculate expenses based on a 5% return. You can assess your fund’s costs by comparing this hypothetical example with the hypothetical examples that appear in shareholder reports of other funds.
Note that the expenses shown in the table are meant to highlight and help you compare ongoing costs only and do not reflect transaction costs incurred by the fund for buying and selling securities. Further, the expenses do not include any purchase, redemption, or account service fees described in the fund prospectus. If such fees were applied to your account, your costs would be higher. Your fund does not carry a “sales load.”
The calculations assume no shares were bought or sold during the period. Your actual costs may have been higher or lower, depending on the amount of your investment and the timing of any purchases or redemptions.
You can find more information about the fund’s expenses, including annual expense ratios, in the Financial Statements section of this report. For additional information on operating expenses and other shareholder costs, please refer to your fund’s current prospectus.
20
| | | |
| Six Months Ended July 31, 2013 | | | |
| | Beginning | Ending | Expenses |
| | Account Value | Account Value | Paid During |
| Dividend Appreciation Index Fund | 1/31/2013 | 7/31/2013 | Period |
| Based on Actual Fund Return | | | |
| Investor Shares | $1,000.00 | $1,116.09 | $1.05 |
| ETF Shares | 1,000.00 | 1,116.17 | 0.52 |
| Based on Hypothetical 5% Yearly Return | | | |
| Investor Shares | $1,000.00 | $1,023.80 | $1.00 |
| ETF Shares | 1,000.00 | 1,024.30 | 0.50 |
The calculations are based on expenses incurred in the most recent six-month period. The fund’s annualized six-month expense ratios for that period are 0.20% for Investor Shares and 0.10% for ETF Shares. The dollar amounts shown as “Expenses Paid” are equal to the annualized expense ratio multiplied by the average account value over the period, multiplied by the number of days in the most recent six-month period, then divided by the number of days in the most recent 12-month period.
21
Trustees Approve Advisory Arrangement
The board of trustees of Vanguard Dividend Appreciation Index Fund has renewed the fund’s investment advisory arrangement with The Vanguard Group, Inc. (Vanguard). Vanguard—through its Equity Investment Group—serves as investment advisor for the fund. The board determined that continuing the fund’s internalized management structure was in the best interests of the fund and its shareholders.
The board based its decision upon an evaluation of the advisor’s investment staff, portfolio management process, and performance. The trustees considered the factors discussed below, among others. However, no single factor determined whether the board approved the arrangement. Rather, it was the totality of the circumstances that drove the board’s decision.
Nature, extent, and quality of services
The board considered the quality of the fund’s investment management services over both the short and long term, and took into account the organizational depth and stability of the advisor. The board noted that Vanguard has been managing investments for more than three decades. The Equity Investment Group adheres to a sound, disciplined investment management process; the team has considerable experience, stability, and depth.
The board concluded that Vanguard’s experience, stability, depth, and performance, among other factors, warranted continuation of the advisory arrangement.
Investment performance
The board considered the short- and long-term performance of the fund, including any periods of outperformance or underperformance relative to a target index and peer group. The board concluded that the performance was such that the advisory arrangement should continue. Information about the fund’s most recent performance can be found in the Performance Summary section of this report.
Cost
The board concluded that the fund’s expense ratio was well below the average expense ratio charged by funds in its peer group and that the fund’s advisory fee rate was also well below its peer-group average. Information about the fund’s expenses appears in the About Your Fund’s Expenses section of this report as well as in the Financial Statements section.
The board does not conduct a profitability analysis of Vanguard, because of Vanguard’s unique “at-cost” structure. Unlike most other mutual fund management companies, Vanguard is owned by the funds it oversees, and produces “profits” only in the form of reduced expenses for fund shareholders.
The benefit of economies of scale
The board concluded that the fund’s at-cost arrangement with Vanguard ensures that the fund will realize economies of scale as it grows, with the cost to shareholders declining as the fund’s assets increase.
The board will consider whether to renew the advisory arrangement again after a one-year period.
22
Glossary
30-Day SEC Yield. A fund’s 30-day SEC yield is derived using a formula specified by the U.S. Securities and Exchange Commission. Under the formula, data related to the fund’s security holdings in the previous 30 days are used to calculate the fund’s hypothetical net income for that period, which is then annualized and divided by the fund’s estimated average net assets over the calculation period. For the purposes of this calculation, a security’s income is based on its current market yield to maturity (for bonds), its actual income (for asset-backed securities), or its projected dividend yield (for stocks). Because the SEC yield represents hypothetical annualized income, it will differ—at times significantly—from the fund’s actual experience. As a result, the fund’s income distributions may be higher or lower than implied by the SEC yield.
Beta. A measure of the magnitude of a fund’s past share-price fluctuations in relation to the ups and downs of a given market index. The index is assigned a beta of 1.00. Compared with a given index, a fund with a beta of 1.20 typically would have seen its share price rise or fall by 12% when the index rose or fell by 10%. For this report, beta is based on returns over the past 36 months for both the fund and the index. Note that a fund’s beta should be reviewed in conjunction with its R-squared (see definition). The lower the R-squared, the less correlation there is between the fund and the index, and the less reliable beta is as an indicator of volatility.
Dividend Yield. Dividend income earned by stocks, expressed as a percentage of the aggregate market value (or of net asset value, for a fund). The yield is determined by dividing the amount of the annual dividends by the aggregate value (or net asset value) at the end of the period. For a fund, the dividend yield is based solely on stock holdings and does not include any income produced by other investments.
Earnings Growth Rate. The average annual rate of growth in earnings over the past five years for the stocks now in a fund.
Equity Exposure. A measure that reflects a fund’s investments in stocks and stock futures. Any holdings in short-term reserves are excluded.
Expense Ratio. A fund’s total annual operating expenses expressed as a percentage of the fund’s average net assets. The expense ratio includes management and administrative expenses, but does not include the transaction costs of buying and selling portfolio securities.
Foreign Holdings. The percentage of a fund represented by securities or depositary receipts of companies based outside the United States.
Inception Date. The date on which the assets of a fund (or one of its share classes) are first invested in accordance with the fund’s investment objective. For funds with a subscription period, the inception date is the day after that period ends. Investment performance is measured from the inception date.
Median Market Cap. An indicator of the size of companies in which a fund invests; the midpoint of market capitalization (market price x shares outstanding) of a fund’s stocks, weighted by the proportion of the fund’s assets invested in each stock. Stocks representing half of the fund’s assets have market capitalizations above the median, and the rest are below it.
Price/Book Ratio. The share price of a stock divided by its net worth, or book value, per share. For a fund, the weighted average price/book ratio of the stocks it holds.
23
Price/Earnings Ratio. The ratio of a stock’s current price to its per-share earnings over the past year. For a fund, the weighted average P/E of the stocks it holds. P/E is an indicator of market expectations about corporate prospects; the higher the P/E, the greater the expectations for a company’s future growth.
R-Squared. A measure of how much of a fund’s past returns can be explained by the returns from the market in general, as measured by a given index. If a fund’s total returns were precisely synchronized with an index’s returns, its R-squared would be 1.00. If the fund’s returns bore no relationship to the index’s returns, its R-squared would be 0. For this report, R-squared is based on returns over the past 36 months for both the fund and the index.
Return on Equity. The annual average rate of return generated by a company during the past five years for each dollar of shareholder’s equity (net income divided by shareholder’s equity). For a fund, the weighted average return on equity for the companies whose stocks it holds.
Short-Term Reserves. The percentage of a fund invested in highly liquid, short-term securities that can be readily converted to cash.
Turnover Rate. An indication of the fund’s trading activity. Funds with high turnover rates incur higher transaction costs and may be more likely to distribute capital gains (which may be taxable to investors). The turnover rate excludes in-kind transactions, which have minimal impact on costs.
24
This page intentionally left blank.
This page intentionally left blank.
This page intentionally left blank.
The People Who Govern Your Fund
The trustees of your mutual fund are there to see that the fund is operated and managed in your best interests since, as a shareholder, you are a part owner of the fund. Your fund’s trustees also serve on the board of directors of The Vanguard Group, Inc., which is owned by the Vanguard funds and provides services to them on an at-cost basis.
A majority of Vanguard’s board members are independent, meaning that they have no affiliation with Vanguard or the funds they oversee, apart from the sizable personal investments they have made as private individuals. The independent board members have distinguished backgrounds in business, academia, and public service. Each of the trustees and executive officers oversees 181 Vanguard funds.
The following table provides information for each trustee and executive officer of the fund. More information about the trustees is in the Statement of Additional Information, which can be obtained, without charge, by contacting Vanguard at 800-662-7447, or online at vanguard.com.
| InterestedTrustee1 | |
| | and Delphi Automotive LLP (automotive components); |
| | Senior Advisor at New Mountain Capital; Trustee of |
| F. William McNabb III | The Conference Board. |
| Born 1957. Trustee Since July 2009. Chairman of the | |
| Board. Principal Occupation(s) During the Past Five | Amy Gutmann |
| Years: Chairman of the Board of The Vanguard Group, | Born 1949. Trustee Since June 2006. Principal |
| Inc., and of each of the investment companies served | Occupation(s) During the Past Five Years: President |
| by The Vanguard Group, since January 2010; Director | of the University of Pennsylvania; Christopher H. |
| of The Vanguard Group since 2008; Chief Executive | Browne Distinguished Professor of Political Science |
| Officer and President of The Vanguard Group and of | in the School of Arts and Sciences with secondary |
| each of the investment companies served by The | appointments at the Annenberg School for |
| Vanguard Group since 2008; Director of Vanguard | Communication and the Graduate School of Education |
| Marketing Corporation; Managing Director of The | of the University of Pennsylvania; Member of the |
| Vanguard Group (1995–2008). | National Commission on the Humanities and Social |
| | Sciences; Trustee of Carnegie Corporation of New |
| | York and of the National Constitution Center; Chair |
| IndependentTrustees | of the U. S. Presidential Commission for the Study |
| | of Bioethical Issues. |
| |
| Emerson U. Fullwood | JoAnn Heffernan Heisen |
| Born 1948. Trustee Since January 2008. Principal | Born 1950. Trustee Since July 1998. Principal |
| Occupation(s) During the Past Five Years: Executive | Occupation(s) During the Past Five Years: Corporate |
| Chief Staff and Marketing Officer for North America | Vice President and Chief Global Diversity Officer |
| and Corporate Vice President (retired 2008) of Xerox | (retired 2008) and Member of the Executive |
| Corporation (document management products and | Committee (1997–2008) of Johnson & Johnson |
| services); Executive in Residence and 2010 | (pharmaceuticals/medical devices/consumer |
| Distinguished Minett Professor at the Rochester | products); Director of Skytop Lodge Corporation |
| Institute of Technology; Director of SPX Corporation | (hotels), the University Medical Center at Princeton, |
| (multi-industry manufacturing), the United Way of | the Robert Wood Johnson Foundation, and the Center |
| Rochester, Amerigroup Corporation (managed health | for Talent Innovation; Member of the Advisory Board |
| care), the University of Rochester Medical Center, | of the Maxwell School of Citizenship and Public Affairs |
| Monroe Community College Foundation, and North | at Syracuse University. |
| Carolina A&T University. | |
| | F. Joseph Loughrey |
| Rajiv L. Gupta | Born 1949. Trustee Since October 2009. Principal |
| Born 1945. Trustee Since December 2001.2 | Occupation(s) During the Past Five Years: President |
| Principal Occupation(s) During the Past Five Years: | and Chief Operating Officer (retired 2009) of Cummins |
| Chairman and Chief Executive Officer (retired 2009) | Inc. (industrial machinery); Chairman of the Board of |
| and President (2006–2008) of Rohm and Haas Co. | Hillenbrand, Inc. (specialized consumer services) and |
| (chemicals); Director of Tyco International, Ltd. | of Oxfam America; Director of SKF AB (industrial |
| (diversified manufacturing and services), Hewlett- | |
| Packard Co. (electronic computer manufacturing), | |
| | |
| machinery) and the Lumina Foundation for Education; | Executive Officers | |
| Member of the Advisory Council for the College of | | |
| Arts and Letters and of the Advisory Board to the | Glenn Booraem | |
| Kellogg Institute for International Studies, both at | Born 1967. Controller Since July 2010. Principal |
| the University of Notre Dame. | Occupation(s) During the Past Five Years: Principal |
| | of The Vanguard Group, Inc.; Controller of each of |
| Mark Loughridge | the investment companies served by The Vanguard |
| Born 1953. Trustee Since March 2012. Principal | Group; Assistant Controller of each of the investment |
| Occupation(s) During the Past Five Years: Senior Vice | companies served by The Vanguard Group (2001–2010). |
| President and Chief Financial Officer at IBM (information | | |
| technology services); Fiduciary Member of IBM’s | Thomas J. Higgins | |
| Retirement Plan Committee. | Born 1957. Chief Financial Officer Since September |
| | 2008. Principal Occupation(s) During the Past Five |
| Scott C. Malpass | Years: Principal of The Vanguard Group, Inc.; Chief |
| Born 1962. Trustee Since March 2012. Principal | Financial Officer of each of the investment companies |
| Occupation(s) During the Past Five Years: Chief | served by The Vanguard Group; Treasurer of each of |
| Investment Officer and Vice President at the University | the investment companies served by The Vanguard |
| of Notre Dame; Assistant Professor of Finance at the | Group (1998–2008). | |
| Mendoza College of Business at Notre Dame; Member | | |
| of the Notre Dame 403(b) Investment Committee; | Kathryn J. Hyatt | |
| Director of TIFF Advisory Services, Inc. (investment | Born 1955. Treasurer Since November 2008. Principal |
| advisor); Member of the Investment Advisory | Occupation(s) During the Past Five Years: Principal of |
| Committees of the Financial Industry Regulatory | The Vanguard Group, Inc.; Treasurer of each of the |
| Authority (FINRA) and of Major League Baseball. | investment companies served by The Vanguard |
| | Group; Assistant Treasurer of each of the investment |
| André F. Perold | companies served by The Vanguard Group (1988–2008). |
| Born 1952. Trustee Since December 2004. Principal | | |
| Occupation(s) During the Past Five Years: George | Heidi Stam | |
| Gund Professor of Finance and Banking at the Harvard | Born 1956. Secretary Since July 2005. Principal |
| Business School (retired 2011); Chief Investment | Occupation(s) During the Past Five Years: Managing |
| Officer and Managing Partner of HighVista Strategies | Director of The Vanguard Group, Inc.; General Counsel |
| LLC (private investment firm); Director of Rand | of The Vanguard Group; Secretary of The Vanguard |
| Merchant Bank; Overseer of the Museum of Fine | Group and of each of the investment companies |
| Arts Boston. | served by The Vanguard Group; Director and Senior |
| | Vice President of Vanguard Marketing Corporation. |
| Alfred M. Rankin, Jr. | | |
| Born 1941. Trustee Since January 1993. Principal | | |
| Occupation(s) During the Past Five Years: Chairman, | Vanguard Senior ManagementTeam |
| President, and Chief Executive Officer of NACCO | | |
| Industries, Inc. (housewares/lignite) and of Hyster-Yale | Mortimer J. Buckley | Chris D. McIsaac |
| Materials Handling, Inc. (forklift trucks); Director of | Kathleen C. Gubanich | Michael S. Miller |
| the National Association of Manufacturers; Chairman | Paul A. Heller | James M. Norris |
| of the Board of University Hospitals of Cleveland; | Martha G. King | Glenn W. Reed |
| Advisory Chairman of the Board of The Cleveland | John T. Marcante | |
| Museum of Art. | | |
| | |
| Peter F. Volanakis | Chairman Emeritus and Senior Advisor |
| Born 1955. Trustee Since July 2009. Principal | | |
| Occupation(s) During the Past Five Years: President | John J. Brennan | |
| and Chief Operating Officer (retired 2010) of Corning | Chairman, 1996–2009 | |
| Incorporated (communications equipment); Director | Chief Executive Officer and President, 1996–2008 | |
| of SPX Corporation (multi-industry manufacturing); | | |
| Overseer of the Amos Tuck School of Business | |
| Administration at Dartmouth College; Advisor to the | Founder | |
| Norris Cotton Cancer Center. | | |
| John C. Bogle | |
| Chairman and Chief Executive Officer, 1974–1996 | |
1 Mr. McNabb is considered an “interested person,” as defined in the Investment Company Act of 1940, because he is an officer of the Vanguard funds.
2 December 2002 for Vanguard Equity Income Fund, Vanguard Growth Equity Fund, the Vanguard Municipal Bond Funds, and the Vanguard State Tax-Exempt Funds.
|  |
| P.O. Box 2600 |
| Valley Forge, PA 19482-2600 |
Connect with Vanguard® > vanguard.com
| |
| Fund Information > 800-662-7447 | “Dividend Achievers” is a trademark of The NASDAQ |
| Direct Investor Account Services > 800-662-2739 | OMX Group, Inc. (collectively, with its affiliates |
| | “NASDAQ OMX”) and has been licensed for use by The |
| Institutional Investor Services > 800-523-1036 | Vanguard Group, Inc. Vanguard mutual funds are not |
| Text Telephone for People | sponsored, endorsed, sold, or promoted by NASDAQ |
| With Hearing Impairment > 800-749-7273 | OMX and NASDAQ OMX makes no representation |
| | regarding the advisability of investing in the funds. |
| This material may be used in conjunction | NASDAQ OMX makes no warranties and bears no |
| with the offering of shares of any Vanguard | liability with respect to the Vanguard mutual funds. |
| fund only if preceded or accompanied by | |
| the fund’s current prospectus. | |
| |
| All comparative mutual fund data are from Lipper, a | |
| Thomson Reuters Company, or Morningstar, Inc., unless | |
| otherwise noted. | |
| |
| You can obtain a free copy of Vanguard’s proxy voting | |
| guidelines by visiting vanguard.com/proxyreporting or by | |
| calling Vanguard at 800-662-2739. The guidelines are | |
| also available from the SEC’s website, sec.gov. In | |
| addition, you may obtain a free report on how your fund | |
| voted the proxies for securities it owned during the 12 | |
| months ended June 30. To get the report, visit either | |
| vanguard.com/proxyreporting or sec.gov. | |
| |
| You can review and copy information about your fund at | |
| the SEC’s Public Reference Room in Washington, D.C. To | |
| find out more about this public service, call the SEC at | |
| 202-551-8090. Information about your fund is also | |
| available on the SEC’s website, and you can receive | |
| copies of this information, for a fee, by sending a | |
| request in either of two ways: via e-mail addressed to | |
| publicinfo@sec.gov or via regular mail addressed to the | |
| Public Reference Section, Securities and Exchange | |
| Commission, Washington, DC 20549-1520. | |
| |
| | © 2013 The Vanguard Group, Inc. |
| | All rights reserved. |
| | Vanguard Marketing Corporation, Distributor. |
| |
| | Q6022 092013 |
Item 2: Code of Ethics.
Not Applicable.
Item 3: Audit Committee Financial Expert.
Not Applicable.
Item 4: Principal Accountant Fees and Services.
Not Applicable.
Item 5: Audit Committee of Listed Registrants.
Not Applicable.
Item 6: Investments.
Not Applicable.
Item 7: Disclosure of Proxy Voting Policies and Procedures for Closed-End Management Investment Companies.
Not Applicable.
Item 8: Portfolio Managers of Closed-End Management Investment Companies.
Not Applicable.
Item 9: Purchase of Equity Securities by Closed-End Management Investment Company and Affiliated Purchasers.
Not Applicable.
Item 10: Submission of Matters to a Vote of Security Holders.
Not Applicable.
Item 11: Controls and Procedures.
(a) Disclosure Controls and Procedures. The Principal Executive and Financial Officers concluded that the Registrant’s Disclosure Controls and Procedures are effective based on their evaluation of the Disclosure Controls and Procedures as of a date within 90 days of the filing date of this report.
(b) Internal Control Over Financial Reporting. There were no significant changes in Registrant’s Internal Control Over Financial Reporting or in other factors that could significantly affect this control subsequent to the date of the evaluation, including any corrective actions with regard to significant deficiencies and material weaknesses.
Item 12: Exhibits.
(a) Certifications.
Pursuant to the requirements of the Securities Exchange Act of 1934 and the Investment Company Act of 1940, the registrant has duly caused this report to be signed on its behalf by the undersigned, thereunto duly authorized.
| |
| | VANGUARD SPECIALIZED FUNDS |
| |
| By: | /s/ F. WILLIAM MCNABB III* |
| | F. WILLIAM MCNABB III |
| | CHIEF EXECUTIVE OFFICER |
| |
| Date: September 18, 2013 |
Pursuant to the requirements of the Securities Exchange Act of 1934 and the Investment Company Act of 1940, this report has been signed below by the following persons on behalf of the registrant and in the capacities and on the dates indicated.
| |
| | VANGUARD SPECIALIZED FUNDS |
| |
| By: | /s/ F. WILLIAM MCNABB III* |
| | F. WILLIAM MCNABB III |
| | CHIEF EXECUTIVE OFFICER |
| |
| Date: September 18, 2013 |
| |
| | VANGUARD SPECIALIZED FUNDS |
| |
| By: | /s/ THOMAS J. HIGGINS* |
| | THOMAS J. HIGGINS |
| | CHIEF FINANCIAL OFFICER |
| |
| Date: September 18, 2013 |
* By: /s/ Heidi Stam
Heidi Stam, pursuant to a Power of Attorney filed on March 27, 2012 see file Number 2-11444, Incorporated by Reference.