UNITED STATES
SECURITIES AND EXCHANGE COMMISSION
Washington, D.C. 20549
FORM N-CSR
CERTIFIED SHAREHOLDER REPORT
OF
REGISTERED MANAGEMENT INVESTMENT COMPANIES
| | |
| Investment Company Act file number: | 811-03916 |
Name of Registrant: | Vanguard Specialized Funds |
Address of Registrant: | P.O. Box 2600 |
| | Valley Forge, PA 19482 |
Name and address of agent for service: | Heidi Stam, Esquire |
| | P.O. Box 876 |
| | Valley Forge, PA 19482 |
Registrant’s telephone number, including area code: (610) 669-1000 |
Date of fiscal year end: January 31 |
Date of reporting period: February 1, 2016 – July 31, 2016 |
Item 1: Reports to Shareholders |

Semiannual Report | July 31, 2016
Vanguard Energy Fund
Vanguard’s Principles for Investing Success
We want to give you the best chance of investment success. These principles, grounded in Vanguard’s research and experience, can put you on the right path.
Goals. Create clear, appropriate investment goals.
Balance. Develop a suitable asset allocation using broadly diversified funds. Cost. Minimize cost.
Discipline. Maintain perspective and long-term discipline.
A single theme unites these principles: Focus on the things you can control.
We believe there is no wiser course for any investor.
| |
| Contents | |
| Your Fund’s Total Returns. | 1 |
| Chairman’s Letter. | 2 |
| Advisors’ Report. | 6 |
| Fund Profile. | 10 |
| Performance Summary. | 12 |
| Financial Statements. | 13 |
| About Your Fund’s Expenses. | 26 |
| Trustees Approve Advisory Arrangements. | 28 |
| Glossary. | 30 |
Please note: The opinions expressed in this report are just that—informed opinions. They should not be considered promises or advice.
Also, please keep in mind that the information and opinions cover the period through the date on the front of this report. Of course, the
risks of investing in your fund are spelled out in the prospectus.
See the Glossary for definitions of investment terms used in this report.
About the cover: Pictured is a sailing block on the Brilliant, a 1932 schooner docked in Mystic, Connecticut. A type of pulley, the
sailing block helps coordinate the setting of the sails. At Vanguard, the intricate coordination of technology and people allows
us to help millions of clients around the world reach their financial goals.
Your Fund’s Total Returns
| |
| Six Months Ended July 31, 2016 | |
| | Total |
| | Returns |
| Vanguard Energy Fund | |
| Investor Shares | 21.77% |
| Admiral™ Shares | 21.81 |
| MSCI ACWI Energy Index | 18.07 |
| Global Natural Resources Funds Average | 21.19 |
| Global Natural Resources Funds Average: Derived from data provided by Lipper, a Thomson Reuters Company. |
| Admiral Shares carry lower expenses and are available to investors who meet certain account-balance requirements. |
| | | | |
| Your Fund’s Performance at a Glance | | | | |
| January 31, 2016, Through July 31, 2016 | | | | |
| | | | Distributions Per Share |
| | Starting | Ending | Income | Capital |
| | Share Price | Share Price | Dividends | Gains |
| Vanguard Energy Fund | | | | |
| Investor Shares | $40.43 | $49.23 | $0.000 | $0.000 |
| Admiral Shares | 75.85 | 92.39 | 0.000 | 0.000 |
1

Chairman’s Letter
Dear Shareholder,
For the six months ended July 31, 2016, energy stocks posted a strong double-digit gain, a reversal from the past two fiscal years of double-digit declines. The sector went from being the broad U.S. stock market’s worst performer for five consecutive fiscal years to being one of the best for the half year.
With oil prices largely on the upswing during the period, Vanguard Energy Fund returned almost 22%, outpacing its benchmark index and the average return of global natural resource funds. (Many peers have significant allocations to sectors other than energy, such as materials.)
By late July, however, the fragile balance of supply and demand had shifted once more, and oil prices slid again. Such movements are a reminder that, as I have cautioned in previous reports, a narrowly focused sector fund is better suited to play a complementary—rather than a core—role in a portfolio that is already balanced and diversified across and within asset classes.
U.S. stocks continued to surge despite signs of uncertainty
U.S. stocks proved resilient over the half year, returning about 14%, although the global environment was far from tranquil.
Stocks tumbled after the momentous June 23 decision by U.K. voters to leave the European Union. But the market
2
quickly recovered. Worries about the effects of “Brexit” on trade and economic growth seemed to diminish as expectations rose that major central banks would be responsive to any fallout.
International stocks also performed well, returning nearly 12%. European stocks finished solidly but still lagged as the Brexit referendum hit close to home. Emerging-market stocks and those from developed Pacific markets recorded double-digit returns.
Bonds drew support given economic factors and low yields
The broad U.S. taxable bond market advanced in each of the six months en route to returning 4.54%. With the stock market volatile at times and the global growth pace uncertain, investors sought safe-haven assets. Foreign investors flocked to U.S. Treasury debt amid exceptionally low or negative yields abroad.
The yield of the 10-year Treasury note closed July at 1.45%, down from 1.98% at the end of January. (Bond prices and yields move in opposite directions.)
The Federal Reserve has held its target for short-term interest rates at 0.25%–0.5% since raising it by a quarter percentage point last December. Money market funds and savings accounts stayed restrained by these historically low rates.
International bond markets (as measured by the Barclays Global Aggregate Index ex USD) returned more than 12% for U.S.
| | | |
| Market Barometer | | | |
| |
| | Total Returns |
| | Periods Ended July 31, 2016 |
| | Six | One | Five Years |
| | Months | Year | (Annualized) |
| Stocks | | | |
| Russell 1000 Index (Large-caps) | 13.82% | 4.84% | 13.22% |
| Russell 2000 Index (Small-caps) | 18.76 | 0.00 | 10.43 |
| Russell 3000 Index (Broad U.S. market) | 14.18 | 4.44 | 12.99 |
| FTSE All-World ex US Index (International) | 11.69 | -4.95 | 1.76 |
| |
| Bonds | | | |
| Barclays U.S. Aggregate Bond Index (Broad taxable market) | 4.54% | 5.94% | 3.57% |
| Barclays Municipal Bond Index (Broad tax-exempt market) | 3.16 | 6.94 | 5.13 |
| Citigroup Three-Month U.S. Treasury Bill Index | 0.12 | 0.16 | 0.05 |
| |
| CPI | | | |
| Consumer Price Index | 1.57% | 0.84% | 1.27% |
3
investors. A number of foreign currencies strengthened against the dollar, lifting returns when translated into U.S. dollars, but the bond returns were robust even without this currency benefit.
Most energy segments advanced, aside from refiners and marketers
Since oil prices began their steep descent in the summer of 2014, hardly a day has gone by without a headline about these prices rising or falling, oil-related companies slashing capital budgets and operations, weak profits in the energy sector, and more. While U.S. consumers have benefited from lower prices at the gas pump, citizens of emerging-market oil exporters such as Brazil and Venezuela have felt the pain of living in struggling, resource-dependent economies.
Similarly, there have been “winners and losers” among the various segments of the energy business. The holdings of your fund, selected by its advisors, Wellington Management Company and Vanguard Quantitative Equity Group, were largely among the winners.
For the six months, some of the strongest performers were exploration and production companies and those who provide equipment and services to them, as rising prices spurred activity. Relative to the benchmark index, your fund benefited from the advisors’ selections among such stocks and from a double-the-benchmark stake in exploration and production companies—especially those based in North America.
| | | |
| Expense Ratios | | | |
| Your Fund Compared With Its Peer Group | | | |
| | Investor | Admiral | Peer Group |
| | Shares | Shares | Average |
| Energy Fund | 0.37% | 0.31% | 1.43% |
The fund expense ratios shown are from the prospectus dated May 25, 2016, and represent estimated costs for the current fiscal year. For the
six months ended July 31, 2016, the fund’s annualized expense ratios were 0.38% for Investor Shares and 0.32% for Admiral Shares. The
peer-group expense ratio is derived from data provided by Lipper, a Thomson Reuters Company, and captures information through year-end
2015.
Peer group: Global Natural Resources Funds.
4
At the other end of the spectrum, refiners and marketers, which have to pay for crude oil for their operations, generally declined. A slightly lighter-than-benchmark allocation to such companies helped the fund.
Returns for the integrated oil and gas behemoths, whose operations span exploration, production, and marketing, generally fell somewhere in between. The fund’s below-benchmark allocations here modestly held back results.
The Advisors’ Report that follows this letter provides additional details about the management of the fund during the period.
Consider rebalancing to manage your risk
After you’ve created an investment portfolio—with a diversified mix of stock, bond, and money market funds tailored to your goals, time horizon, and risk tolerance—what next?
As stocks and bonds rise or fall over time, and that portfolio drifts from its original asset allocation, you should consider rebalancing back to your targets. Just one year of outsized returns can throw your allocation out of whack.
Consider 2013, when the broad U.S. stock market returned nearly 34% and the broad taxable bond market declined. A hypothetical simple portfolio that tracked the broad U.S. market indexes and started the year with 60% stocks and 40% bonds would have ended with a more aggressive mix of 67% stocks and 33% bonds.
Rebalancing means shifting assets away from areas that have performed well toward those that have fallen behind, to restore the portfolio’s original asset allocation. That isn’t easy or intuitive, but it helps manage risk, because over time, riskier assets tend to grow faster. (For more on this, see Best Practices for Portfolio Rebalancing, at vanguard.com/ research.)
You might consider, for example, monitoring your portfolio annually or semiannually and rebalancing when your allocations shift about 5 percentage points from their targets. And be aware of the tax implications.
Keeping your asset allocation from drifting too far off target can help you stay on track with the investment plan you’ve crafted to meet your financial goals.
As always, thank you for investing with Vanguard.
Sincerely,

F. William McNabb III
Chairman and Chief Executive Officer
August 10, 2016
Advisors’ Report
Vanguard Energy Fund returned 21.77% for Investor Shares and 21.81% for Admiral Shares for the six months ended July 31, 2016, ahead of its benchmark index and the average return of its global natural resources peer funds. Your fund is managed by two advisors, a strategy that enhances the fund’s diversification by providing exposure to distinct yet complementary investment approaches. It’s not uncommon for different advisors to have different views about individual securities or the broader investment environment.
The advisors, the amount and percentage of fund assets each manages, and brief descriptions of their investment strategies are presented in the table below. The advisors have also provided a discussion of the investment environment that existed during the period and of how their portfolio positioning reflects this assessment. These reports were prepared on August 10, 2016.
Wellington Management Company llp
Portfolio Manager:
Gregory LeBlanc, CFA,
Senior Managing Director,
Global Industry Analyst
The investment environment
Global energy equities enjoyed a strong six months. The MSCI All Country World Energy Index (net of withholding taxes) returned 18.07%, outpacing global equities, as measured by the MSCI All Country World Index, which returned almost 13%.
| | | |
| Vanguard Energy Fund Investment Advisors | |
| |
| | Fund Assets Managed | |
| Investment Advisor | % | $ Million | Investment Strategy |
| Wellington Management | 95 | 9,445 | Emphasizes long-term total-return opportunities from |
| Company LLP | | | the various energy subsectors: international oils, |
| | | | foreign integrated oils and foreign producers, North |
| | | | American producers, oil services and equipment, |
| | | | transportation and distribution, and refining and |
| | | | marketing. |
| Vanguard Quantitative Equity | 4 | 348 | Employs a quantitative fundamental management |
| Group | | | approach using models that assess valuation, |
| | | | management decisions, market sentiment, and |
| | | | earnings and balance-sheet quality of companies as |
| | | | compared with their peers. |
| Cash Investments | 1 | 104 | These short-term reserves are invested by Vanguard in |
| | | | equity index products to simulate investments in stock. |
| | | | Each advisor may also maintain a modest cash |
| | | | position. |
6
Crude oil prices marched higher, and in May they touched $50 for the first time in 2016. The massive capital retrenchment seen over the last few quarters has taken a toll on the global oil supply. U.S. oil production continued its steady decline, and non-OPEC oil supply came under severe pressure because of a lack of sanctioned projects. Supply outages in Canada, Nigeria, Libya, and Venezuela during the second quarter only exacerbated the downward trend. In addition, OPEC supply growth seemed likely to be contained.
As the oil market realized that the supply overhang was not nearly as large as had been feared and was rapidly dissipating, oil prices and energy stocks posted strong gains. Concerns, however, have now shifted to the prospect of U.S. shale production once again flooding the market.
Our successes
Our strategy emphasizes long-term total-return opportunities from the various energy subsectors: international oils, foreign integrated oils and foreign producers, North American producers, oil services and equipment, transportation and distribution, and refining and marketing.
Security selection, particularly within U.S. exploration and production companies, lifted relative results, with Newfield Exploration, Pioneer Natural Resources, and Energen contributing notably. Our underweight exposure to refiners, a subsector that posted negative returns, also helped.
Newfield Exploration, which holds key positions in the Anadarko Basin, increased its second-quarter and full-year 2016 production guidance. The increase was driven by strong production in the Basin and benefited Newfield’s stock price. We are encouraged by the company’s improving oil well results and operating efficiencies, and we increased our position.
Pioneer Natural Resources continues to exceed production expectations, thanks to an increase in well productivity and operational efficiencies. We believe Pioneer remains a compelling investment, given its asset quality, strong balance sheet, and access to capital, all of which should help it weather commodity price volatility.
Energen, which has primary operations in the Permian, Delaware, and Midland Basins, recently buttressed its already strong balance sheet by selling its noncore assets. We maintain our position, as we believe that the market has underappre-ciated Energen’s Delaware assets and that the company could be a candidate for acquisition.
Our shortfalls
Our most significant relative detractors included our holdings of Antero Resources and our underweight exposure to Petrobras and Royal Dutch Shell. A frictional cash position also weighed on results.
Shares of Antero Resources, an independent exploration and production company, retreated slightly. We maintained our position as we believe Antero’s recent
7
acquisition of Marcellus core acreage has boosted its acreage quality. The company also has well-hedged positions that should help them weather near-term volatility in natural gas prices.
Petrobras and Royal Dutch Shell posted significant gains, so our underweights weighed on relative results. The stock price of Petrobras, a Brazilian integrated oil and gas producer, surged as the company took further steps to reduce debts by selling assets. An appreciating Brazilian real further helped its cash flows. Royal Dutch Shell, a U.K.-based integrated oil and gas producer, also saw stock gains on the back of recovering oil prices. We remain cautious on both names and continue to favor producers, which we believe have greater upside.
The fund’s positioning
Overall, we still see increasing dispersion of asset quality and well results within the producer subsegment of the energy sector. This dispersion is creating valuable opportunities in select North American oil and natural gas producers. Improvements in well results in both the Permian Basin and the Anadarko Basin have driven asset value and cash-flow revisions higher for some of the companies that have tier-1 acreage. We think the improvement potential for productivity in these basins is likely underappreciated by the market.
We continue to focus on producers with a growing cost advantage, the ability to benefit from new technology, and positive revisions to the depth and quality of their future drilling inventory relative to consensus.
Vanguard Quantitative Equity Group
Portfolio Managers:
James P. Stetler, Principal
Michael R. Roach, CFA
Binbin Guo, Principal, Head of Equity
Research and Portfolio Strategies
Energy stocks returned more than 18% for the half year, a welcome departure from their double-digit decline for the previous six months. The sector outperformed the aggregate global equity market by several percentage points. The U.S. equity market bested international developed markets but lagged emerging markets.
Following historically low oil prices early this year, coordination between Russia and OPEC member countries to limit production gained traction and encouraged other nations to consider similar actions. As prices stabilized and then rose, oil companies saw some reprieve from concerns regarding their liquidity and profit margins. While Britain’s decision to leave the European Union prompted a short plunge in prices, it also highlighted the commodity’s volatility. However, the United Kingdom represents a minor portion of global demand and core oil fundamentals remained largely unchanged.
U.S. natural gas production slowed because of a large inventory buildup during last year’s tepid winter, which drove prices down and decreased drilling profitability. But natural gas demand has increased significantly over the past few years as the United States transitions away
8
from coal-fired power plants. As winter approaches, prices may continue to rise, particularly if production does not increase.
Although it’s important to understand how overall portfolio performance is affected by such macroeconomic factors, our approach to investing focuses on specific stock fundamentals and portfolio characteristics. We use a disciplined selection process that compares all the stocks in our investment universe to identify those with characteristics that we believe will help them outperform over the long run.
To do this, we use a strict quantitative process that focuses on four key themes: 1) high quality—healthy balance sheets and consistent cash flow generation; 2) effective use of capital—sound investment policies that favor internal over external funding; 3) strong market sentiment—market confirmation of our view; and 4) reasonable valuation—avoidance of overpriced stocks.
Using these models, we generate a composite expected return for all the stocks we follow each day, seeking to capitalize on investor biases across the market. We then construct our portfolio with the goal of maximizing expected return while minimizing exposure to risks that our research indicates do not improve returns.
For the six months, results from our stock selection models were mixed. Our valuation and management decisions models contributed positively, but our sentiment and quality models held back results.
Our most successful holdings included WorleyParsons (+133.9%), Seadrill (+39.0%), and Subsea 7 (+81.6%).
Our overweighting Valero Energy (–21.9%), HollyFrontier (–29.7%), and Petrofac (–8.8%) held back results, as did our underweighting Petroleo Brasileiro (+202.8%) and Canadian Natural Resources (+45.6%).
9
Energy Fund
Fund Profile
As of July 31, 2016
| | |
| Share-Class Characteristics | |
| |
| | Investor | Admiral |
| | Shares | Shares |
| Ticker Symbol | VGENX | VGELX |
| Expense Ratio1 | 0.37% | 0.31% |
| 30-Day SEC Yield | 1.92% | 1.98% |
| | | |
| Portfolio Characteristics | | |
| | | | DJ |
| | | | U.S. |
| | | | Total |
| | | MSCI | Market |
| | | ACWI | FA |
| | Fund | Energy | Index |
| Number of Stocks | 142 | 136 | 3,839 |
| Median Market Cap | $27.8B | $55.1B | $54.0B |
| Price/Earnings Ratio | 110.6x | 800.0x | 23.5x |
| Price/Book Ratio | 1.6x | 1.4x | 2.8x |
| Return on Equity | 7.7% | 10.8% | 16.3% |
| Earnings Growth | | | |
| Rate | -17.6% | -18.1% | 7.3% |
| Dividend Yield | 2.3% | 3.7% | 2.0% |
| Foreign Holdings | 29.3% | 46.0% | 0.0% |
| Turnover Rate | | | |
| (Annualized) | 22% | — | — |
| Short-Term | | | |
| Reserves | 2.6% | — | — |
| | |
| Volatility Measures | | |
| | | DJ |
| | MSCI | U.S. Total |
| | ACWI | Market |
| | Energy | FA Index |
| R-Squared | 0.97 | 0.33 |
| Beta | 1.03 | 1.02 |
| These measures show the degree and timing of the fund’s fluctuations compared with the indexes over 36 months. |
| | |
| Ten Largest Holdings (% of total net assets) |
| Exxon Mobil Corp. | Integrated Oil & Gas | 9.4% |
| Pioneer Natural | Oil & Gas Exploration | |
| Resources Co. | & Production | 5.8 |
| Chevron Corp. | Integrated Oil & Gas | 4.9 |
| Royal Dutch Shell plc | Integrated Oil & Gas | 4.5 |
| Schlumberger Ltd. | Oil & Gas Equipment | |
| | & Services | 3.8 |
| EOG Resources Inc. | Oil & Gas Exploration | |
| | & Production | 3.0 |
| TOTAL SA | Integrated Oil & Gas | 2.7 |
| Newfield Exploration Co. Oil & Gas Exploration | |
| | & Production | 2.3 |
| EQT Corp. | Oil & Gas Exploration | |
| | & Production | 2.3 |
| BP plc | Integrated Oil & Gas | 2.2 |
| Top Ten | | 40.9% |
| The holdings listed exclude any temporary cash investments and equity index products. |
1 The expense ratios shown are from the prospectus dated May 25, 2016, and represent estimated costs for the current fiscal year. For the six
months ended July 31, 2016, the annualized expense ratios were 0.38% for Investor Shares and 0.32% for Admiral Shares.
10
Energy Fund
| | |
| Subindustry Diversification (% of equity | |
| exposure) | | |
| | | MSCI |
| | | ACWI |
| | Fund | Energy |
| Coal & Consumable Fuels | 0.1% | 0.8% |
| Industrials | 0.1 | 0.0 |
| Integrated Oil & Gas | 36.2 | 54.7 |
| Oil & Gas Drilling | 1.7 | 0.3 |
| Oil & Gas Equipment & | | |
| Services | 8.1 | 8.8 |
| Oil & Gas Exploration & | | |
| Production | 41.0 | 19.2 |
| Oil & Gas Refining & | | |
| Marketing | 6.0 | 7.4 |
| Oil & Gas Storage & | | |
| Transportation | 4.5 | 8.8 |
| Utilities | 2.3 | 0.0 |
| |
| Market Diversification (% of equity exposure) |
| |
| Europe | |
| United Kingdom | 7.0% |
| France | 2.8 |
| Italy | 2.2 |
| Portugal | 1.7 |
| Other | 0.3 |
| Subtotal | 14.0% |
| Pacific | |
| Australia | 1.1% |
| Other | 0.9 |
| Subtotal | 2.0% |
| Emerging Markets | |
| Russia | 2.4% |
| India | 2.4 |
| Other | 1.8 |
| Subtotal | 6.6% |
| North America | |
| United States | 69.9% |
| Canada | 7.5 |
| Subtotal | 77.4% |
11
Energy Fund
Performance Summary
All of the returns in this report represent past performance, which is not a guarantee of future results that may be achieved by the fund. (Current performance may be lower or higher than the performance data cited. For performance data current to the most recent month-end, visit our website at vanguard.com/performance.) Note, too, that both investment returns and principal value can fluctuate widely, so an investor’s shares, when sold, could be worth more or less than their original cost. The returns shown do not reflect taxes that a shareholder would pay on fund distributions or on the sale of fund shares.
Fiscal-Year Total Returns (%): January 31, 2006, Through July 31, 2016

For a benchmark description, see the Glossary.
Note: For 2017, performance data reflect the six months ended July 31, 2016.
Average Annual Total Returns: Periods Ended June 30, 2016
This table presents returns through the latest calendar quarter—rather than through the end of the fiscal period.
Securities and Exchange Commission rules require that we provide this information.
| | | | |
| | Inception | One | Five | Ten |
| | Date | Year | Years | Years |
| Investor Shares | 5/23/1984 | -2.36% | -2.44% | 2.07% |
| Admiral Shares | 11/12/2001 | -2.30 | -2.38 | 2.13 |
See Financial Highlights for dividend and capital gains information.
12
Energy Fund
Financial Statements (unaudited)
Statement of Net Assets
As of July 31, 2016
The fund reports a complete list of its holdings in regulatory filings four times in each fiscal year, at the quarter-ends. For the second and fourth fiscal quarters, the lists appear in the fund’s semiannual and annual reports to shareholders. For the first and third fiscal quarters, the fund files the lists with the Securities and Exchange Commission on Form N-Q. Shareholders can look up the fund’s Forms N-Q on the SEC’s website at sec.gov. Forms N-Q may also be reviewed and copied at the SEC’s Public Reference Room (see the back cover of this report for further information).
| | | |
| | | | Market |
| | | | Value• |
| | | Shares | ($000) |
| Common Stocks (96.9%)1 | | |
| United States (67.6%) | | |
| Electric Utilities (1.2%) | | |
| | OGE Energy Corp. | 3,529,461 | 113,543 |
| |
| Energy Equipment & Services (8.8%) | |
| | Schlumberger Ltd. | 4,615,524 | 371,642 |
| | Halliburton Co. | 4,347,616 | 189,817 |
| | Patterson-UTI Energy Inc. | 6,971,092 | 135,170 |
| | Baker Hughes Inc. | 2,589,945 | 123,877 |
| | Ensco plc Class A | 2,418,588 | 22,178 |
| * | SEACOR Holdings Inc. | 373,003 | 21,082 |
| | Transocean Ltd. | 204,346 | 2,246 |
| | | | 866,012 |
| Oil, Gas & Consumable Fuels (57.1%) | |
| | Integrated Oil & Gas (16.1%) | |
| | Exxon Mobil Corp. | 10,420,264 | 926,883 |
| | Chevron Corp. | 4,702,159 | 481,877 |
| | Occidental Petroleum | | |
| | Corp. | 2,462,214 | 184,001 |
| |
| | Oil & Gas Exploration & Production (34.0%) |
| | Pioneer Natural | | |
| | Resources Co. | 3,543,081 | 575,999 |
| | EOG Resources Inc. | 3,582,127 | 292,660 |
| * | Newfield Exploration Co. | 5,233,755 | 226,622 |
| | EQT Corp. | 3,107,968 | 226,446 |
| | Energen Corp. | 3,931,179 | 186,259 |
| | Cabot Oil & Gas Corp. | 7,084,853 | 174,783 |
| | Hess Corp. | 3,238,438 | 173,742 |
| * | Diamondback Energy Inc. | 1,831,893 | 160,822 |
| | QEP Resources Inc. | 8,705,016 | 158,431 |
| * | Antero Resources Corp. | 5,433,012 | 142,291 |
| * | Concho Resources Inc. | 1,143,903 | 142,073 |
| | ConocoPhillips | 3,078,880 | 125,680 |
| | Anadarko Petroleum | | |
| | Corp. | 2,277,088 | 124,170 |
| | Cimarex Energy Co. | 907,924 | 108,969 |
| | Marathon Oil Corp. | 7,884,811 | 107,549 |
| | | |
| | Noble Energy Inc. | 2,474,955 | 88,405 |
| | Devon Energy Corp. | 1,596,246 | 61,104 |
| * | Continental Resources | | |
| | Inc. | 1,216,701 | 53,596 |
| * | WPX Energy Inc. | 5,098,400 | 50,933 |
| * | Synergy Resources Corp. | 7,528,551 | 49,011 |
| * | Parsley Energy Inc. | | |
| | Class A | 1,593,901 | 45,442 |
| | Apache Corp. | 823,928 | 43,256 |
| * | Rice Energy Inc. | 1,821,512 | 42,478 |
| * | Cobalt International | | |
| | Energy Inc. | 3,620,372 | 5,394 |
| | Range Resources Corp. | 37,502 | 1,512 |
| |
| | Oil & Gas Refining & Marketing (3.7%) |
| | Marathon Petroleum | | |
| | Corp. | 3,266,669 | 128,674 |
| | Phillips 66 | 1,647,742 | 125,327 |
| | Valero Energy Corp. | 2,153,937 | 112,608 |
| |
| | Oil & Gas Storage & Transportation (3.3%) |
| | Spectra Energy Corp. | 3,623,390 | 130,333 |
| | Kinder Morgan Inc. | 6,001,539 | 122,011 |
| * | Cheniere Energy Inc. | 909,300 | 38,036 |
| | Targa Resources Corp. | 890,616 | 33,184 |
| | Williams Cos. Inc. | 28,014 | 672 |
| | | | 5,651,233 |
| Other (0.5%) | | |
| ^,2 | Vanguard Energy ETF | 578,000 | 53,921 |
| Total United States | | 6,684,709 |
| International (29.3%) | | |
| Australia (1.0%) | | |
| | Oil Search Ltd. | 11,029,601 | 60,441 |
| | Santos Ltd. | 11,932,187 | 40,790 |
| | WorleyParsons Ltd. | 339,354 | 1,943 |
| | Woodside Petroleum Ltd. | 15,530 | 317 |
| | | | 103,491 |
| Austria (0.0%) | | |
| | OMV AG | 84,948 | 2,269 |
13
Energy Fund
| | | |
| | | | Market |
| | | | Value• |
| | | Shares | ($000) |
| Brazil (0.6%) | | |
| *,^ | Petroleo Brasileiro SA | | |
| | ADR | 6,012,539 | 52,189 |
| * | Petroleo Brasileiro SA | 966,232 | 4,175 |
| * | Petroleo Brasileiro SA | | |
| | Preference Shares | 64,300 | 235 |
| | | | 56,599 |
| Canada (7.3%) | | |
| | Suncor Energy Inc. | | |
| | (New York Shares) | 5,110,310 | 137,518 |
| | Canadian Natural | | |
| | Resources Ltd. | | |
| | (New York Shares) | 4,359,983 | 131,802 |
| | TransCanada Corp. | | |
| | (New York Shares) | 1,861,267 | 86,270 |
| | Cenovus Energy Inc. | | |
| | (New York Shares) | 4,328,541 | 61,898 |
| ^ | Crescent Point Energy | | |
| | Corp. | 3,588,600 | 52,469 |
| ^ | ARC Resources Ltd. | 2,956,311 | 52,010 |
| | Keyera Corp. | 1,560,800 | 44,804 |
| * | Seven Generations | | |
| | Energy Ltd. Class A | 1,502,729 | 31,536 |
| | Encana Corp. | | |
| | (New York Shares) | 3,563,207 | 28,684 |
| * | Seven Generations | | |
| | Energy Ltd. | 1,309,400 | 27,368 |
| ^ | PrairieSky Royalty Ltd. | | |
| | (Toronto Shares) | 840,348 | 16,354 |
| | Cameco Corp. | 1,510,098 | 14,437 |
| | Pembina Pipeline Corp. | 327,100 | 9,540 |
| | Canadian Natural | | |
| | Resources Ltd. | 177,844 | 5,386 |
| | Suncor Energy Inc. | 165,702 | 4,460 |
| | Enbridge Inc. | 85,518 | 3,518 |
| | Cenovus Energy Inc. | 240,938 | 3,449 |
| | TransCanada Corp. | 71,117 | 3,298 |
| | PrairieSky Royalty Ltd. | 93,253 | 1,800 |
| | Encana Corp. | 126,002 | 1,013 |
| * | Paramount Resources Ltd. | | |
| | Class A | 21,498 | 202 |
| | | | 717,816 |
| China (0.5%) | | |
| | PetroChina Co. Ltd. ADR | 636,058 | 43,347 |
| | China Petroleum | | |
| | & Chemical Corp. | 6,049,600 | 4,339 |
| | Kunlun Energy Co. Ltd. | 2,752,000 | 2,093 |
| | Huaneng Renewables | | |
| | Corp. Ltd. | 6,160,000 | 1,977 |
| | China Longyuan Power | | |
| | Group Corp. Ltd. | 1,750,000 | 1,409 |
| | CNOOC Ltd. | 823,717 | 993 |
| | PetroChina Co. Ltd. | 452,000 | 310 |
| | | | 54,468 |
| Colombia (0.4%) | | |
| *,^ | Ecopetrol SA ADR | 4,575,802 | 39,123 |
| | | |
| Denmark (0.0%) | | |
| | Vestas Wind Systems A/S | 56,780 | 3,970 |
| |
| Finland (0.0%) | | |
| | Neste Oyj | 69,447 | 2,636 |
| |
| France (2.8%) | | |
| | TOTAL SA ADR | 5,275,716 | 253,762 |
| | TOTAL SA | 336,183 | 16,168 |
| | Technip SA | 47,415 | 2,659 |
| | | | 272,589 |
| Greece (0.0%) | | |
| | Motor Oil Hellas Corinth | | |
| | Refineries SA | 67,448 | 789 |
| |
| Hungary (0.0%) | | |
| | MOL Hungarian Oil | | |
| | & Gas plc | 36,638 | 2,299 |
| |
| India (2.3%) | | |
| | Reliance Industries Ltd. | 7,816,124 | 118,559 |
| | Power Grid Corp. of | | |
| | India Ltd. | 38,217,414 | 100,545 |
| | Indian Oil Corp. Ltd. | 343,643 | 2,793 |
| | Bharat Petroleum Corp. | | |
| | Ltd. | 277,505 | 2,455 |
| | Hindustan Petroleum | | |
| | Corp. Ltd. | 129,497 | 2,437 |
| | GAIL India Ltd. | 351,186 | 2,007 |
| | | | 228,796 |
| Israel (0.0%) | | |
| * | Oil Refineries Ltd. | 3,301,179 | 1,190 |
| |
| Italy (2.1%) | | |
| | Eni SPA ADR | 5,235,705 | 160,474 |
| | Tenaris SA ADR | 1,822,700 | 48,703 |
| | Eni SPA | 235,939 | 3,619 |
| | | | 212,796 |
| Japan (0.8%) | | |
| | Inpex Corp. | 9,053,500 | 71,974 |
| | JX Holdings Inc. | 813,100 | 3,081 |
| | TonenGeneral Sekiyu KK | 235,000 | 2,123 |
| | Idemitsu Kosan Co. Ltd. | 106,700 | 2,089 |
| | Cosmo Energy Holdings | | |
| | Co. Ltd. | 143,000 | 1,575 |
| | | | 80,842 |
| Malaysia (0.0%) | | |
| | Petronas Dagangan Bhd. | 161,100 | 922 |
| |
| Norway (0.2%) | | |
| *,^ | DNO ASA | 18,136,636 | 18,776 |
| * | Subsea 7 SA | 186,960 | 2,020 |
| *,^ | Seadrill Ltd. | 424,483 | 1,285 |
| | Statoil ASA | 30,235 | 481 |
| | | | 22,562 |
14
Energy Fund
| | | |
| | | | Market |
| | | | Value• |
| | | Shares | ($000) |
| Poland (0.1%) | | |
| | Polski Koncern Naftowy | | |
| | ORLEN SA | 151,412 | 2,426 |
| * | Grupa Lotos SA | 239,891 | 1,801 |
| | Polskie Gornictwo | | |
| | Naftowe i Gazownictwo | | |
| | SA | 781,377 | 1,084 |
| | | | 5,311 |
| Portugal (1.7%) | | |
| | Galp Energia SGPS SA | 11,958,292 | 163,805 |
| |
| Russia (2.4%) | | |
| | Rosneft PJSC GDR | 27,233,977 | 132,423 |
| | Lukoil PJSC ADR | 2,041,146 | 87,856 |
| | Gazprom PJSC ADR | 949,310 | 3,889 |
| | AK Transneft OAO | | |
| | Preference Shares | 894 | 2,255 |
| | Tatneft PJSC ADR | 71,907 | 2,048 |
| | Bashneft PJSC | 37,734 | 1,658 |
| | Gazprom PJSC | 453,804 | 946 |
| | Lukoil PJSC | 16,448 | 716 |
| | Tatneft PAO | 136,690 | 658 |
| | Rosneft OAO | 60,170 | 297 |
| | | | 232,746 |
| South Korea (0.1%) | | |
| | SK Innovation Co. Ltd. | 23,072 | 3,040 |
| | Doosan Heavy Industries | | |
| | & Construction Co. Ltd. | 95,683 | 2,250 |
| | S-Oil Corp. | 32,401 | 2,231 |
| | GS Holdings Corp. | 48,837 | 2,110 |
| | | | 9,631 |
| Spain (0.1%) | | |
| * | Repsol SA | 290,111 | 3,675 |
| | Gamesa Corp. | | |
| | Tecnologica SA | 117,406 | 2,491 |
| | | | 6,166 |
| Taiwan (0.0%) | | |
| | Formosa Petrochemical | | |
| | Corp. | 879,000 | 2,501 |
| |
| Thailand (0.1%) | | |
| * | PTT Exploration and | | |
| | Production PCL (Local) | 929,800 | 2,229 |
| | PTT PCL (Foreign) | 220,000 | 2,105 |
| * | Thai Oil PCL | 808,300 | 1,416 |
| * | PTT PCL | 95,700 | 916 |
| | Thai Oil PCL (Foreign) | 317,600 | 556 |
| | | | 7,222 |
| United Kingdom (6.8%) | | |
| | Royal Dutch Shell plc | | |
| | ADR | 8,123,002 | 420,690 |
| | BP plc ADR | 5,970,863 | 205,398 |
| | BP plc | 2,274,428 | 12,868 |
| | | | |
| | Royal Dutch Shell plc | | |
| | Class B | | 471,540 | 12,542 |
| | Royal Dutch Shell plc | | |
| | Class A (London Shares) | 331,089 | 8,549 |
| | Royal Dutch Shell plc | | |
| | Class A | | 247,382 | 6,444 |
| | John Wood Group plc | 251,906 | 2,204 |
| | Petrofac Ltd. | | 203,926 | 2,016 |
| | | | | 670,711 |
| Total International | | | 2,901,250 |
| Total Common Stocks | | | |
| (Cost $7,106,790) | | | 9,585,959 |
| Temporary Cash Investments (4.7%)1 | |
| Money Market Fund (2.1%) | | |
| 3,4 | Vanguard Market | | | |
| | Liquidity Fund, | | | |
| | 0.561% | 208,406,104 | 208,406 |
| |
| | | | Face | |
| | | | Amount | |
| | | | ($000) | |
| Repurchase Agreements (1.8%) | |
| | RBS Securities, Inc. | | |
| | 0.340%, 8/1/16 (Dated | | |
| | 7/29/16, Repurchase | | |
| | Value $96,903,000, | | |
| | collateralized by U.S. | | |
| | Treasury Note/Bond | | |
| | 3.125%, 5/15/21, with | | |
| | a value of $98,840,000) | 96,900 | 96,900 |
| | Societe Generale | | | |
| | 0.330%, 8/1/16 (Dated | | |
| | 7/29/16, Repurchase | | |
| | Value $82,302,000, | | |
| | collateralized by | | | |
| | Government National | | |
| | Mortgage Assn. | | | |
| | 3.300%–3.950%, | | | |
| | 2/15/55–4/15/57, and | | |
| | U.S. Treasury Note/ | | |
| | Bond 1.625%–3.125%, | | |
| | 7/31/19–5/15/21, with | | |
| | a value of $83,946,000) | 82,300 | 82,300 |
| | | | | 179,200 |
| U.S. Government and Agency Obligations (0.8%) |
| 5,6 | Federal Home Loan | | | |
| | Bank Discount Notes, | | |
| | 0.476%, 8/12/16 | | 2,000 | 2,000 |
| 5 | Federal Home Loan | | | |
| | Bank Discount Notes, | | |
| | 0.390%, 9/7/16 | | 75,000 | 74,977 |
15
Energy Fund
| | | |
| | | Face | Market |
| | | Amount | Value• |
| | | ($000) | ($000) |
| 5 | Federal Home Loan | | |
| | Bank Discount Notes, | | |
| | 0.531%, 10/21/16 | 100 | 100 |
| 6 | United States Treasury Bill, | | |
| | 0.318%, 10/20/16 | 1,100 | 1,099 |
| | | | 78,176 |
| Total Temporary Cash Investments | |
| (Cost $465,775) | | 465,782 |
| Total Investments (101.6%) | | |
| (Cost $7,572,565) | | 10,051,741 |
| |
| | | | Amount |
| | | | ($000) |
| Other Assets and Liabilities (-1.6%) | |
| Other Assets | | |
| Investment in Vanguard | | 813 |
| Receivables for Investment | | |
| | Securities Sold | | 26,400 |
| Receivables for Accrued Income | | 11,543 |
| Receivables for Capital Shares Issued | 4,463 |
| Other Assets | | 3,898 |
| Total Other Assets | | 47,117 |
| Liabilities | | |
| Payables for Investment Securities | |
| | Purchased | | (5,223) |
| Payables to Investment Advisor | | (4,217) |
| Collateral for Securities on Loan | | (157,736) |
| Payables for Capital Shares Redeemed | (7,514) |
| Payables to Vanguard | | (20,038) |
| Other Liabilities | | (6,858) |
| Total Liabilities | | (201,586) |
| Net Assets (100%) | | 9,897,272 |
| |
| At July 31, 2016, net assets consisted of: | |
| | Amount |
| | ($000) |
| Paid-in Capital | 8,165,182 |
| Undistributed Net Investment Income | 83,304 |
| Accumulated Net Realized Losses | (832,728) |
| Unrealized Appreciation (Depreciation) | |
| Investment Securities | 2,479,176 |
| Futures Contracts | 2,322 |
| Foreign Currencies | 16 |
| Net Assets | 9,897,272 |
| |
| |
| Investor Shares—Net Assets | |
| Applicable to 66,392,772 outstanding | |
| $.001 par value shares of beneficial | |
| interest (unlimited authorization) | 3,268,575 |
| Net Asset Value Per Share— | |
| Investor Shares | $49.23 |
| |
| |
| Admiral Shares—Net Assets | |
| Applicable to 71,745,925 outstanding | |
| $.001 par value shares of beneficial | |
| interest (unlimited authorization) | 6,628,697 |
| Net Asset Value Per Share— | |
| Admiral Shares | $92.39 |
• See Note A in Notes to Financial Statements.
* Non-income-producing security.
^ Includes partial security positions on loan to broker-dealers. The total value of securities on loan is $141,163,000.
1 The fund invests a portion of its cash reserves in equity markets through the use of index futures contracts. After giving effect to futures
investments, the fund’s effective common stock and temporary cash investment positions represent 97.4% and 4.2%, respectively, of
net assets.
2 Considered an affiliated company of the fund as the issuer is another member of The Vanguard Group.
3 Affiliated money market fund available only to Vanguard funds and certain trusts and accounts managed by Vanguard. Rate shown is the
7-day yield.
4 Includes $157,736,000 of collateral received for securities on loan.
5 The issuer operates under a congressional charter; its securities are generally neither guaranteed by the U.S. Treasury nor backed by the
full faith and credit of the U.S. government.
6 Securities with a value of $2,200,000 have been segregated as initial margin for open futures contracts.
ADR—American Depositary Receipt.
GDR—Global Depositary Receipt.
See accompanying Notes, which are an integral part of the Financial Statements.
16
Energy Fund
Statement of Operations
| |
| | Six Months Ended |
| | July 31, 2016 |
| | ($000) |
| Investment Income | |
| Income | |
| Dividends1,2 | 117,843 |
| Interest2 | 832 |
| Securities Lending | 5,120 |
| Total Income | 123,795 |
| Expenses | |
| Investment Advisory Fees—Note B | |
| Basic Fee | 6,619 |
| Performance Adjustment | 1,695 |
| The Vanguard Group—Note C | |
| Management and Administrative—Investor Shares | 2,427 |
| Management and Administrative—Admiral Shares | 3,443 |
| Marketing and Distribution—Investor Shares | 330 |
| Marketing and Distribution—Admiral Shares | 284 |
| Custodian Fees | 670 |
| Shareholders’ Reports—Investor Shares | 67 |
| Shareholders’ Reports—Admiral Shares | 28 |
| Trustees’ Fees and Expenses | 8 |
| Total Expenses | 15,571 |
| Expenses Paid Indirectly | (84) |
| Net Expenses | 15,487 |
| Net Investment Income | 108,308 |
| Realized Net Gain (Loss) | |
| Investment Securities Sold2 | (286,377) |
| Futures Contracts | 18,277 |
| Foreign Currencies | (3,488) |
| Realized Net Gain (Loss) | (271,588) |
| Change in Unrealized Appreciation (Depreciation) | |
| Investment Securities | 1,944,618 |
| Futures Contracts | 3,117 |
| Foreign Currencies | 89 |
| Change in Unrealized Appreciation (Depreciation) | 1,947,824 |
| Net Increase (Decrease) in Net Assets Resulting from Operations | 1,784,544 |
| 1 Dividends are net of foreign withholding taxes of $8,070,000. |
| 2 Dividend income, interest income, and realized net gain (loss) from affiliated companies of the fund were $705,000, $384,000, and $0, respectively. |
See accompanying Notes, which are an integral part of the Financial Statements.
17
Energy Fund
Statement of Changes in Net Assets
| | |
| | Six Months Ended | Year Ended |
| | July 31, | January 31, |
| | 2016 | 2016 |
| | ($000) | ($000) |
| Increase (Decrease) in Net Assets | | |
| Operations | | |
| Net Investment Income | 108,308 | 216,759 |
| Realized Net Gain (Loss) | (271,588) | (510,522) |
| Change in Unrealized Appreciation (Depreciation) | 1,947,824 | (1,688,529) |
| Net Increase (Decrease) in Net Assets Resulting from Operations | 1,784,544 | (1,982,292) |
| Distributions | | |
| Net Investment Income | | |
| Investor Shares | — | (69,234) |
| Admiral Shares | — | (145,041) |
| Realized Capital Gain | | |
| Investor Shares | — | — |
| Admiral Shares | — | — |
| Total Distributions | | (214,275) |
| Capital Share Transactions | | |
| Investor Shares | (24,054) | 74,549 |
| Admiral Shares | 15,609 | 340,406 |
| Net Increase (Decrease) from Capital Share Transactions | (8,445) | 414,955 |
| Total Increase (Decrease) | 1,776,099 | (1,781,612) |
| Net Assets | | |
| Beginning of Period | 8,121,173 | 9,902,785 |
| End of Period1 | 9,897,272 | 8,121,173 |
| 1 Net Assets—End of Period includes undistributed (overdistributed) net investment income of $83,304,000 and ($21,516,000). |
See accompanying Notes, which are an integral part of the Financial Statements.
18
Energy Fund
Financial Highlights
| | | | | | |
| Investor Shares | | | | | | |
| Six Months | | | | | |
| | Ended | | | | | |
| For a Share Outstanding | July 31, | Year Ended January 31, |
| Throughout Each Period | 2016 | 2016 | 2015 | 2014 | 2013 | 2012 |
| Net Asset Value, Beginning of Period | $40.43 | $51.53 | $63.85 | $62.66 | $62.60 | $69.20 |
| Investment Operations | | | | | | |
| Net Investment Income | .530 | 1.096 | 1.276 | 1.291 | 1.336 | 1.072 |
| Net Realized and Unrealized Gain (Loss) | | | | | | |
| on Investments | 8.270 | (11.118) | (9.436) | 2.413 | 1.098 | (3.949) |
| Total from Investment Operations | 8.800 | (10.022) | (8.160) | 3.704 | 2.434 | (2.877) |
| Distributions | | | | | | |
| Dividends from Net Investment Income | — | (1.078) | (1.206) | (1.277) | (1.340) | (1.102) |
| Distributions from Realized Capital Gains | — | — | (2.954) | (1.237) | (1.034) | (2.621) |
| Total Distributions | — | (1.078) | (4.160) | (2.514) | (2.374) | (3.723) |
| Net Asset Value, End of Period | $49.23 | $40.43 | $51.53 | $63.85 | $62.66 | $62.60 |
| |
| Total Return1 | 21.77% | -19.53% | -13.16% | 5.88% | 4.07% | -3.82% |
| |
| Ratios/Supplemental Data | | | | | | |
| Net Assets, End of Period (Millions) | $3,269 | $2,693 | $3,334 | $4,138 | $5,340 | $5,945 |
| Ratio of Total Expenses to | | | | | | |
| Average Net Assets2 | 0.38% | 0.37% | 0.37% | 0.38% | 0.31% | 0.34% |
| Ratio of Net Investment Income to | | | | | | |
| Average Net Assets | 2.30% | 2.20% | 1.84% | 1.97% | 2.15% | 1.67% |
| Portfolio Turnover Rate | 22% | 23% | 31% | 17% | 18% | 24% |
The expense ratio, net investment income ratio, and turnover rate for the current period have been annualized.
1 Total returns do not include transaction or account service fees that may have applied in the periods shown. Fund prospectuses provide
information about any applicable transaction and account service fees.
2 Includes performance-based investment advisory fee increases (decreases) of 0.04%, 0.03%, 0.03%, 0.04%, (0.02%), and 0.01%.
See accompanying Notes, which are an integral part of the Financial Statements.
19
Energy Fund
Financial Highlights
| | | | | | |
| Admiral Shares | | | | | | |
| Six Months | | | | | |
| | Ended | | | | | |
| For a Share Outstanding | July 31, | Year Ended January 31, |
| Throughout Each Period | 2016 | 2016 | 2015 | 2014 | 2013 | 2012 |
| Net Asset Value, Beginning of Period | $75.85 | $96.69 | $119.83 | $117.63 | $117.52 | $129.93 |
| Investment Operations | | | | | | |
| Net Investment Income | 1.021 | 2.113 | 2.479 | 2.530 | 2.586 | 2.101 |
| Net Realized and Unrealized Gain (Loss) | | | | | | |
| on Investments | 15.519 | (20.872) | (17.726) | 4.491 | 2.060 | (7.432) |
| Total from Investment Operations | 16.540 | (18.759) | (15.247) | 7.021 | 4.646 | (5.331) |
| Distributions | | | | | | |
| Dividends from Net Investment Income | — | (2.081) | (2.351) | (2.500) | (2.595) | (2.159) |
| Distributions from Realized Capital Gains | — | — | (5.542) | (2.321) | (1.941) | (4.920) |
| Total Distributions | — | (2.081) | (7.893) | (4.821) | (4.536) | (7.079) |
| Net Asset Value, End of Period | $92.39 | $75.85 | $96.69 | $119.83 | $117.63 | $117.52 |
| |
| Total Return1 | 21.81% | -19.48% | -13.11% | 5.94% | 4.14% | -3.76% |
| |
| Ratios/Supplemental Data | | | | | | |
| Net Assets, End of Period (Millions) | $6,629 | $5,428 | $6,569 | $7,540 | $6,778 | $6,756 |
| Ratio of Total Expenses to | | | | | | |
| Average Net Assets2 | 0.32% | 0.31% | 0.31% | 0.32% | 0.26% | 0.28% |
| Ratio of Net Investment Income to | | | | | | |
| Average Net Assets | 2.36% | 2.26% | 1.90% | 2.03% | 2.20% | 1.73% |
| Portfolio Turnover Rate | 22% | 23% | 31% | 17% | 18% | 24% |
The expense ratio, net investment income ratio, and turnover rate for the current period have been annualized.
1 Total returns do not include transaction or account service fees that may have applied in the periods shown. Fund prospectuses provide
information about any applicable transaction and account service fees.
2 Includes performance-based investment advisory fee increases (decreases) of 0.04%, 0.03%, 0.03%, 0.04%, (0.02%), and 0.01%.
See accompanying Notes, which are an integral part of the Financial Statements.
20
Energy Fund
Notes to Financial Statements
Vanguard Energy Fund is registered under the Investment Company Act of 1940 as an open-end investment company, or mutual fund. The fund invests in securities of foreign issuers, which may subject it to investment risks not normally associated with investing in securities of U.S. corporations. The fund offers two classes of shares: Investor Shares and Admiral Shares. Investor Shares are available to any investor who meets the fund’s minimum purchase requirements. Admiral Shares are designed for investors who meet certain administrative, service, and account-size criteria.
A. The following significant accounting policies conform to generally accepted accounting principles for U.S. investment companies. The fund consistently follows such policies in preparing its financial statements.
1. Security Valuation: Securities are valued as of the close of trading on the New York Stock Exchange (generally 4 p.m., Eastern time) on the valuation date. Equity securities are valued at the latest quoted sales prices or official closing prices taken from the primary market in which each security trades; such securities not traded on the valuation date are valued at the mean of the latest quoted bid and asked prices. Securities for which market quotations are not readily available, or whose values have been affected by events occurring before the fund’s pricing time but after the close of the securities’ primary markets, are valued at their fair values calculated according to procedures adopted by the board of trustees. These procedures include obtaining quotations from an independent pricing service, monitoring news to identify significant market- or security-specific events, and evaluating changes in the values of foreign market proxies (for example, ADRs, futures contracts, or exchange-traded funds), between the time the foreign markets close and the fund’s pricing time. When fair-value pricing is employed, the prices of securities used by a fund to calculate its net asset value may differ from quoted or published prices for the same securities. Investments in Vanguard Market Liquidity Fund are valued at that fund’s net asset value. Temporary cash investments acquired over 60 days to maturity are valued using the latest bid prices or using valuations based on a matrix system (which considers such factors as security prices, yields, maturities, and ratings), both as furnished by independent pricing services. Other temporary cash investments are valued at amortized cost, which approximates market value.
2. Foreign Currency: Securities and other assets and liabilities denominated in foreign currencies are translated into U.S. dollars using exchange rates obtained from an independent third party as of the fund’s pricing time on the valuation date. Realized gains (losses) and unrealized appreciation (depreciation) on investment securities include the effects of changes in exchange rates since the securities were purchased, combined with the effects of changes in security prices. Fluctuations in the value of other assets and liabilities resulting from changes in exchange rates are recorded as unrealized foreign currency gains (losses) until the assets or liabilities are settled in cash, at which time they are recorded as realized foreign currency gains (losses).
3. Futures Contracts: The fund uses index futures contracts to a limited extent, with the objective of maintaining full exposure to the stock market while maintaining liquidity. The fund may purchase or sell futures contracts to achieve a desired level of investment, whether to accommodate portfolio turnover or cash flows from capital share transactions. The primary risks associated with the use of futures contracts are imperfect correlation between changes in market values of stocks held by the fund and the prices of futures contracts, and the possibility of an illiquid market. Counterparty risk involving futures is mitigated because a regulated clearinghouse is the counterparty instead of the clearing broker. To further mitigate counterparty risk, the fund trades futures contracts on an exchange, monitors the financial strength of its clearing brokers and clearinghouse, and has entered into clearing
21
Energy Fund
agreements with its clearing brokers. The clearinghouse imposes initial margin requirements to secure the fund’s performance and requires daily settlement of variation margin representing changes in the market value of each contract.
Futures contracts are valued at their quoted daily settlement prices. The aggregate settlement values of the contracts are not recorded in the Statement of Net Assets. Fluctuations in the value of the contracts are recorded in the Statement of Net Assets as an asset (liability) and in the Statement of Operations as unrealized appreciation (depreciation) until the contracts are closed, when they are recorded as realized futures gains (losses).
During the six months ended July 31, 2016, the fund’s average investments in long and short futures contracts represented 1% and 0% of net assets, respectively, based on the average of aggregate settlement values at each quarter-end during the period.
4. Repurchase Agreements: The fund enters into repurchase agreements with institutional counterparties. Securities pledged as collateral to the fund under repurchase agreements are held by a custodian bank until the agreements mature. Each agreement requires that the market value of the collateral be sufficient to cover payments of interest and principal. The fund further mitigates its counterparty risk by entering into repurchase agreements only with a diverse group of prequalified counterparties, monitoring their financial strength, and entering into master repurchase agreements with its counterparties. The master repurchase agreements provide that, in the event of a counter-party’s default (including bankruptcy), the fund may terminate any repurchase agreements with that counterparty, determine the net amount owed, and sell or retain the collateral up to the net amount owed to the fund. Such action may be subject to legal proceedings, which may delay or limit the disposition of collateral.
5. Federal Income Taxes: The fund intends to continue to qualify as a regulated investment company and distribute all of its taxable income. Management has analyzed the fund’s tax positions taken for all open federal income tax years (January, 2013–2016), and for the period ended July 31, 2016, and has concluded that no provision for federal income tax is required in the fund’s financial statements.
6. Distributions: Distributions to shareholders are recorded on the ex-dividend date.
7. Securities Lending: To earn additional income, the fund lends its securities to qualified institutional borrowers. Security loans are subject to termination by the fund at any time, and are required to be secured at all times by collateral in an amount at least equal to the market value of securities loaned. Daily market fluctuations could cause the value of loaned securities to be more or less than the value of the collateral received. When this occurs, the collateral is adjusted and settled on the next business day. The fund further mitigates its counterparty risk by entering into securities lending transactions only with a diverse group of prequalified counterparties, monitoring their financial strength, and entering into master securities lending agreements with its counterparties. The master securities lending agreements provide that, in the event of a counterparty’s default (including bankruptcy), the fund may terminate any loans with that borrower, determine the net amount owed, and sell or retain the collateral up to the net amount owed to the fund; however, such actions may be subject to legal proceedings. While collateral mitigates counterparty risk, in the absence of a default the fund may experience delays and costs in recovering the securities loaned. The fund invests cash collateral received in Vanguard Market Liquidity Fund, and records a liability in the Statement of Net Assets for the return of the collateral, during the period the securities are on loan. Securities lending income represents fees charged to borrowers plus income earned on invested cash collateral, less expenses associated with the loan.
22
Energy Fund
8. Credit Facility: The fund and certain other funds managed by The Vanguard Group (“Vanguard”) participate in a $3.1 billion committed credit facility provided by a syndicate of lenders pursuant to a credit agreement that may be renewed annually; each fund is individually liable for its borrowings, if any, under the credit facility. Borrowings may be utilized for temporary and emergency purposes, and are subject to the fund’s regulatory and contractual borrowing restrictions. The participating funds are charged administrative fees and an annual commitment fee of 0.10% of the undrawn amount of the facility; these fees are allocated to the funds based on a method approved by the fund’s board of trustees and included in Management and Administrative expenses on the fund’s Statement of Operations. Any borrowings under this facility bear interest at a rate based upon the higher of the one-month London Interbank Offered Rate, federal funds effective rate, or overnight bank funding rate plus an agreed-upon spread.
The fund had no borrowings outstanding at July 31, 2016, or at any time during the period then ended.
9. Other: Dividend income is recorded on the ex-dividend date. Interest income includes income distributions received from Vanguard Market Liquidity Fund and is accrued daily. Premiums and discounts on debt securities purchased are amortized and accreted, respectively, to interest income over the lives of the respective securities. Security transactions are accounted for on the date securities are bought or sold. Costs used to determine realized gains (losses) on the sale of investment securities are those of the specific securities sold.
Each class of shares has equal rights as to assets and earnings, except that each class separately bears certain class-specific expenses related to maintenance of shareholder accounts (included in Management and Administrative expenses) and shareholder reporting. Marketing and distribution expenses are allocated to each class of shares based on a method approved by the board of trustees. Income, other non-class-specific expenses, and gains and losses on investments are allocated to each class of shares based on its relative net assets.
B. The investment advisory firm Wellington Management Company LLP provides investment advisory services to a portion of the fund for a fee calculated at an annual percentage rate of average net assets managed by the advisor. The basic fee is subject to quarterly adjustments based on performance relative to the MSCI ACWI Energy Index for the preceding three years.
Vanguard provides investment advisory services to a portion of the fund as described below; the fund paid Vanguard advisory fees of $151,000 for the six months ended July 31, 2016.
For the six months ended July 31, 2016, the aggregate investment advisory fee paid to all advisors represented an effective annual basic rate of 0.14% of the fund’s average net assets, before an increase of $1,695,000 (0.04%) based on performance.
C. In accordance with the terms of a Funds’ Service Agreement (the “FSA”) between Vanguard and the fund, Vanguard furnishes to the fund investment advisory, corporate management, administrative, marketing, and distribution services at Vanguard’s cost of operations (as defined by the FSA). These costs of operations are allocated to the fund based on methods and guidelines approved by the board of trustees. Vanguard does not require reimbursement in the current period for certain costs of operations (such as deferred compensation/benefits and risk/insurance costs); the fund’s liability for these costs of operations is included in Payables to Vanguard on the Statement of Net Assets.
23
Energy Fund
Upon the request of Vanguard, the fund may invest up to 0.40% of its net assets as capital in Vanguard. At July 31, 2016, the fund had contributed to Vanguard capital in the amount of $813,000, representing 0.01% of the fund’s net assets and 0.33% of Vanguard’s capitalization. The fund’s trustees and officers are also directors and employees, respectively, of Vanguard.
D. The fund has asked its investment advisor to direct certain security trades, subject to obtaining the best price and execution, to brokers who have agreed to rebate to the fund part of the commissions generated. Such rebates are used solely to reduce the fund’s management and administrative expenses. For the six months ended July 31, 2016, these arrangements reduced the fund’s expenses by $84,000 (an annual rate of 0.00% of average net assets).
E. Various inputs may be used to determine the value of the fund’s investments. These inputs are summarized in three broad levels for financial statement purposes. The inputs or methodologies used to value securities are not necessarily an indication of the risk associated with investing in those securities.
Level 1—Quoted prices in active markets for identical securities.
Level 2—Other significant observable inputs (including quoted prices for similar securities, interest rates, prepayment speeds, credit risk, etc.).
Level 3—Significant unobservable inputs (including the fund’s own assumptions used to determine the fair value of investments).
The following table summarizes the market value of the fund’s investments as of July 31, 2016, based on the inputs used to value them:
| | | |
| | Level 1 | Level 2 | Level 3 |
| Investments | ($000) | ($000) | ($000) |
| Common Stocks—United States | 6,684,709 | — | — |
| Common Stocks—International | 1,945,913 | 955,337 | — |
| Temporary Cash Investments | 208,406 | 257,376 | — |
| Futures Contracts—Assets1 | 88 | — | — |
| Futures Contracts—Liabilities1 | (2) | — | — |
| Total | 8,839,114 | 1,212,713 | — |
| 1 Represents variation margin on the last day of the reporting period. |
F. At July 31, 2016, the aggregate settlement value of open futures contracts and the related unrealized appreciation (depreciation) were:
| | | | |
| | | | ($000) |
| | | | Aggregate | |
| | | Number of | Settlement | Unrealized |
| | | Long (Short) | Value | Appreciation |
| Futures Contracts | Expiration | Contracts | Long (Short) | (Depreciation) |
| E-mini S&P 500 Index | September 2016 | 483 | 52,362 | 2,322 |
Unrealized appreciation (depreciation) on open futures contracts is required to be treated as realized gain (loss) for tax purposes.
24
Energy Fund
G. Distributions are determined on a tax basis and may differ from net investment income and realized capital gains for financial reporting purposes. Differences may be permanent or temporary. Permanent differences are reclassified among capital accounts in the financial statements to reflect their tax character. Temporary differences arise when certain items of income, expense, gain, or loss are recognized in different periods for financial statement and tax purposes. These differences will reverse at some time in the future. Differences in classification may also result from the treatment of short-term gains as ordinary income for tax purposes.
During the six months ended July 31, 2016, the fund realized net foreign currency losses of $3,488,000, which decreased distributable net income for tax purposes; accordingly, such losses have been reclassified from accumulated net realized losses to undistributed net investment income.
The fund’s tax-basis capital gains and losses are determined only at the end of each fiscal year. For tax purposes, at January 31, 2016, the fund had available capital losses totaling $555,042,000 that may be carried forward indefinitely to offset future net capital gains. The fund will use these capital losses to offset net taxable capital gains, if any, realized during the year ending January 31, 2017; should the fund realize net capital losses for the year, the losses will be added to the loss carryforward balance above.
At July 31, 2016, the cost of investment securities for tax purposes was $7,572,565,000. Net unrealized appreciation of investment securities for tax purposes was $2,479,176,000, consisting of unrealized gains of $2,982,066,000 on securities that had risen in value since their purchase and $502,890,000 in unrealized losses on securities that had fallen in value since their purchase.
H. During the six months ended July 31, 2016, the fund purchased $1,220,098,000 of investment securities and sold $986,399,000 of investment securities, other than temporary cash investments.
I. Capital share transactions for each class of shares were:
| | | | |
| | Six Months Ended | Year Ended |
| | July 31, 2016 | January 31, 2016 |
| | Amount | Shares | Amount | Shares |
| | ($000) | (000) | ($000) | (000) |
| Investor Shares | | | | |
| Issued | 401,332 | 8,959 | 1,000,377 | 20,740 |
| Issued in Lieu of Cash Distributions | — | — | 65,317 | 1,556 |
| Redeemed | (425,386) | (9,178) | (991,145) | (20,374) |
| Net Increase (Decrease)—Investor Shares | (24,054) | (219) | 74,549 | 1,922 |
| Admiral Shares | | | | |
| Issued | 614,002 | 7,226 | 1,661,392 | 18,288 |
| Issued in Lieu of Cash Distributions | — | — | 130,396 | 1,656 |
| Redeemed | (598,393) | (7,041) | (1,451,382) | (16,322) |
| Net Increase (Decrease)—Admiral Shares | 15,609 | 185 | 340,406 | 3,622 |
J. Management has determined that no material events or transactions occurred subsequent to
July 31, 2016, that would require recognition or disclosure in these financial statements.
25
About Your Fund’s Expenses
As a shareholder of the fund, you incur ongoing costs, which include costs for portfolio management, administrative services, and shareholder reports (like this one), among others. Operating expenses, which are deducted from a fund’s gross income, directly reduce the investment return of the fund.
A fund’s expenses are expressed as a percentage of its average net assets. This figure is known as the expense ratio. The following examples are intended to help you understand the ongoing costs (in dollars) of investing in your fund and to compare these costs with those of other mutual funds. The examples are based on an investment of $1,000 made at the beginning of the period shown and held for the entire period.
The accompanying table illustrates your fund’s costs in two ways:
• Based on actual fund return. This section helps you to estimate the actual expenses that you paid over the period. The ”Ending Account Value“ shown is derived from the fund‘s actual return, and the third column shows the dollar amount that would have been paid by an investor who started with $1,000 in the fund. You may use the information here, together with the amount you invested, to estimate the expenses that you paid over the period.
To do so, simply divide your account value by $1,000 (for example, an $8,600 account value divided by $1,000 = 8.6), then multiply the result by the number given for your fund under the heading ”Expenses Paid During Period.“
• Based on hypothetical 5% yearly return. This section is intended to help you compare your fund‘s costs with those of other mutual funds. It assumes that the fund had a yearly return of 5% before expenses, but that the expense ratio is unchanged. In this case—because the return used is not the fund’s actual return—the results do not apply to your investment. The example is useful in making comparisons because the Securities and Exchange Commission requires all mutual funds to calculate expenses based on a 5% return. You can assess your fund’s costs by comparing this hypothetical example with the hypothetical examples that appear in shareholder reports of other funds.
Note that the expenses shown in the table are meant to highlight and help you compare ongoing costs only and do not reflect transaction costs incurred by the fund for buying and selling securities. Further, the expenses do not include any purchase, redemption, or account service fees described in the fund prospectus. If such fees were applied to your account, your costs would be higher. Your fund does not carry a “sales load.”
The calculations assume no shares were bought or sold during the period. Your actual costs may have been higher or lower, depending on the amount of your investment and the timing of any purchases or redemptions.
You can find more information about the fund’s expenses, including annual expense ratios, in the Financial Statements section of this report. For additional information on operating expenses and other shareholder costs, please refer to your fund’s current prospectus.
26
| | | |
| Six Months Ended July 31, 2016 | | | |
| | Beginning | Ending | Expenses |
| | Account Value | Account Value | Paid During |
| Energy Fund | 1/31/2016 | 7/31/2016 | Period |
| Based on Actual Fund Return | | | |
| Investor Shares | $1,000.00 | $1,217.66 | $2.10 |
| Admiral Shares | 1,000.00 | 1,218.06 | 1.76 |
| Based on Hypothetical 5% Yearly Return | | | |
| Investor Shares | $1,000.00 | $1,022.97 | $1.91 |
| Admiral Shares | 1,000.00 | 1,023.27 | 1.61 |
The calculations are based on expenses incurred in the most recent six-month period. The fund’s annualized six-month expense ratios for that
period are 0.38% for Investor Shares and 0.32% for Admiral Shares. The dollar amounts shown as “Expenses Paid” are equal to the
annualized expense ratio multiplied by the average account value over the period, multiplied by the number of days in the most recent
six-month period, then divided by the number of days in the most recent 12-month period (182/366).
27
Trustees Approve Advisory Arrangements
The board of trustees of Vanguard Energy Fund has renewed the fund’s investment advisory arrangement with The Vanguard Group, Inc. (Vanguard), through its Quantitative Equity Group, and Wellington Management Company LLP (Wellington Management). The board determined that renewing the fund’s advisory arrangements was in the best interests of the fund and its shareholders.
The board based its decision upon an evaluation of each advisor’s investment staff, portfolio management process, and performance. The trustees considered the factors discussed below, among others. However, no single factor determined whether the board approved the arrangements. Rather, it was the totality of the circumstances that drove the board’s decision.
Nature, extent, and quality of services
The board reviewed the quality of the fund’s investment management services over both the short and long term, and took into account the organizational depth and stability of each advisor. The board considered the following:
Vanguard. Vanguard has been managing investments for more than three decades. The Quantitative Equity Group adheres to a sound, disciplined investment management process; the team has considerable experience, stability, and depth. Vanguard has managed a portion of the fund since 2005.
Wellington Management. Founded in 1928, Wellington Management is among the nation’s oldest and most respected institutional investment managers. The investment team uses a bottom-up approach in which stocks are selected based on the advisor’s estimates of fundamental investment value. Fundamental research focuses on the quality of a company’s assets, its internal reinvestment opportunities, and management quality. The firm has advised the fund since the fund’s inception in 1984.
The board concluded that each advisor’s experience, stability, depth, and performance, among other factors, warranted the continuation of the advisory arrangements.
Investment performance
The board considered the short- and long-term performance of the fund, including any periods of outperformance or underperformance relative to a benchmark index and peer group. The board concluded that the performance was such that the advisory arrangements should continue. Information about the fund’s most recent performance can be found in the Performance Summary section of this report.
Cost
The board concluded that the fund’s expense ratio was well below the average expense ratio charged by funds in its peer group and that the fund’s advisory fee rate was also well below its peer-group average. Information about the fund’s expenses appears in the About Your Fund’s Expenses section of this report as well as in the Financial Statements section, which also includes information about the fund’s advisory fee rate.
The board did not consider profitability of Wellington Management in determining whether to approve the advisory fee, because Wellington Management is independent of Vanguard, and the advisory fee is the result of arm’s-length negotiations. The board does not conduct a profitability analysis of Vanguard, because of Vanguard’s unique “at-cost” structure. Unlike most other mutual fund management companies, Vanguard is owned by the funds it oversees, and produces “profits” only in the form of reduced expenses for fund shareholders.
28
The benefit of economies of scale
The board concluded that the fund’s shareholders benefit from economies of scale because of breakpoints in the fund’s advisory fee schedule for Wellington Management. The breakpoints reduce the effective rate of the fee as the fund’s assets managed by Wellington Management increase. The board also concluded that the fund’s at-cost arrangement with Vanguard ensures that the fund will realize economies of scale as it grows, with the cost to shareholders declining as the fund’s assets managed by Vanguard increase.
The board will consider whether to renew the advisory arrangements again after a one-year period.
29
Glossary
30-Day SEC Yield. A fund’s 30-day SEC yield is derived using a formula specified by the U.S. Securities and Exchange Commission. Under the formula, data related to the fund’s security holdings in the previous 30 days are used to calculate the fund’s hypothetical net income for that period, which is then annualized and divided by the fund’s estimated average net assets over the calculation period. For the purposes of this calculation, a security’s income is based on its current market yield to maturity (for bonds), its actual income (for asset-backed securities), or its projected dividend yield (for stocks). Because the SEC yield represents hypothetical annualized income, it will differ—at times significantly—from the fund’s actual experience. As a result, the fund’s income distributions may be higher or lower than implied by the SEC yield.
Beta. A measure of the magnitude of a fund’s past share-price fluctuations in relation to the ups and downs of a given market index. The index is assigned a beta of 1.00. Compared with a given index, a fund with a beta of 1.20 typically would have seen its share price rise or fall by 12% when the index rose or fell by 10%. For this report, beta is based on returns over the past 36 months for both the fund and the index. Note that a fund’s beta should be reviewed in conjunction with its R-squared (see definition). The lower the R-squared, the less correlation there is between the fund and the index, and the less reliable beta is as an indicator of volatility.
Dividend Yield. Dividend income earned by stocks, expressed as a percentage of the aggregate market value (or of net asset value, for a fund). The yield is determined by dividing the amount of the annual dividends by the aggregate value (or net asset value) at the end of the period. For a fund, the dividend yield is based solely on stock holdings and does not include any income produced by other investments.
Earnings Growth Rate. The average annual rate of growth in earnings over the past five years for the stocks now in a fund.
Equity Exposure. A measure that reflects a fund’s investments in stocks and stock futures. Any holdings in short-term reserves are excluded.
Expense Ratio. A fund’s total annual operating expenses expressed as a percentage of the fund’s average net assets. The expense ratio includes management and administrative expenses, but does not include the transaction costs of buying and selling portfolio securities.
Foreign Holdings. The percentage of a fund represented by securities or depositary receipts of companies based outside the United States.
Inception Date. The date on which the assets of a fund (or one of its share classes) are first invested in accordance with the fund’s investment objective. For funds with a subscription period, the inception date is the day after that period ends. Investment performance is measured from the inception date.
Median Market Cap. An indicator of the size of companies in which a fund invests; the midpoint of market capitalization (market price x shares outstanding) of a fund’s stocks, weighted by the proportion of the fund’s assets invested in each stock. Stocks representing half of the fund’s assets have market capitalizations above the median, and the rest are below it.
Price/Book Ratio. The share price of a stock divided by its net worth, or book value, per share. For a fund, the weighted average price/book ratio of the stocks it holds.
30
Price/Earnings Ratio. The ratio of a stock’s current price to its per-share earnings over the past year. For a fund, the weighted average P/E of the stocks it holds. P/E is an indicator of market expectations about corporate prospects; the higher the P/E, the greater the expectations for a company’s future growth.
R-Squared. A measure of how much of a fund’s past returns can be explained by the returns from the market in general, as measured by a given index. If a fund’s total returns were precisely synchronized with an index’s returns, its R-squared would be 1.00. If the fund’s returns bore no relationship to the index’s returns, its R-squared would be 0. For this report, R-squared is based on returns over the past 36 months for both the fund and the index.
Return on Equity. The annual average rate of return generated by a company during the past five years for each dollar of shareholder’s equity (net income divided by shareholder’s equity). For a fund, the weighted average return on equity for the companies whose stocks it holds.
Short-Term Reserves. The percentage of a fund invested in highly liquid, short-term securities that can be readily converted to cash.
Turnover Rate. An indication of the fund’s trading activity. Funds with high turnover rates incur higher transaction costs and may be more likely to distribute capital gains (which may be taxable to investors). The turnover rate excludes in-kind transactions, which have minimal impact on costs.
Benchmark Information
Spliced Energy Index: S&P 500 Index through November 30, 2000; S&P Energy Sector Index through May 31, 2010; MSCI All Country World Energy Index thereafter.
31
The People Who Govern Your Fund
The trustees of your mutual fund are there to see that the fund is operated and managed in your best interests since, as a shareholder, you are a part owner of the fund. Your fund’s trustees also serve on the board of directors of The Vanguard Group, Inc., which is owned by the Vanguard funds and provides services to them on an at-cost basis.
A majority of Vanguard’s board members are independent, meaning that they have no affiliation with Vanguard or the funds they oversee, apart from the sizable personal investments they have made as private individuals. The independent board members have distinguished backgrounds in business, academia, and public service. Each of the trustees and executive officers oversees 198 Vanguard funds.
The following table provides information for each trustee and executive officer of the fund. More information about the trustees is in the Statement of Additional Information, which can be obtained, without charge, by contacting Vanguard at 800-662-7447, or online at vanguard.com.
| |
| InterestedTrustee1 | Rajiv L. Gupta |
| | Born 1945. Trustee Since December 2001.2 Principal |
| F. William McNabb III | Occupation(s) During the Past Five Years and Other |
| Born 1957. Trustee Since July 2009. Chairman of | Experience: Chairman and Chief Executive Officer |
| the Board. Principal Occupation(s) During the Past | (retired 2009) and President (2006–2008) of |
| Five Years and Other Experience: Chairman of the | Rohm and Haas Co. (chemicals); Director of Tyco |
| Board of The Vanguard Group, Inc., and of each of | International plc (diversified manufacturing and |
| the investment companies served by The Vanguard | services), HP Inc. (printer and personal computer |
| Group, since January 2010; Director of The Vanguard | manufacturing), and Delphi Automotive plc |
| Group since 2008; Chief Executive Officer and | (automotive components); Senior Advisor at |
| President of The Vanguard Group, and of each of | New Mountain Capital. |
| the investment companies served by The Vanguard | |
| Group, since 2008; Director of Vanguard Marketing | Amy Gutmann |
| Corporation; Managing Director of The Vanguard | Born 1949. Trustee Since June 2006. Principal |
| Group (1995–2008). | Occupation(s) During the Past Five Years and |
| | Other Experience: President of the University of |
| IndependentTrustees | Pennsylvania; Christopher H. Browne Distinguished |
| | Professor of Political Science, School of Arts and |
| Emerson U. Fullwood | Sciences, and Professor of Communication, Annenberg |
| Born 1948. Trustee Since January 2008. Principal | School for Communication, with secondary faculty |
| Occupation(s) During the Past Five Years and Other | appointments in the Department of Philosophy, School |
| Experience: Executive Chief Staff and Marketing | of Arts and Sciences, and at the Graduate School of |
| Officer for North America and Corporate Vice President | Education, University of Pennsylvania; Trustee of the |
| (retired 2008) of Xerox Corporation (document manage- | National Constitution Center; Chair of the Presidential |
| ment products and services); Executive in Residence | Commission for the Study of Bioethical Issues. |
| and 2009–2010 Distinguished Minett Professor at | |
| the Rochester Institute of Technology; Lead Director | JoAnn Heffernan Heisen |
| of SPX FLOW, Inc. (multi-industry manufacturing); | Born 1950. Trustee Since July 1998. Principal |
| Director of the United Way of Rochester, the University | Occupation(s) During the Past Five Years and |
| of Rochester Medical Center, Monroe Community | Other Experience: Corporate Vice President and |
| College Foundation, North Carolina A&T University, | Chief Global Diversity Officer (retired 2008) and |
| and Roberts Wesleyan College. | Member of the Executive Committee (1997–2008) |
| | of Johnson & Johnson (pharmaceuticals/medical |
| | devices/consumer products); Director of Skytop |
| | Lodge Corporation (hotels) and the Robert Wood |
| | Johnson Foundation; Member of the Advisory |
| | Board of the Institute for Women’s Leadership |
| | at Rutgers University. |
| | |
| F. Joseph Loughrey | Executive Officers | |
| Born 1949. Trustee Since October 2009. Principal | | |
| Occupation(s) During the Past Five Years and Other | Glenn Booraem | |
| Experience: President and Chief Operating Officer | Born 1967. Treasurer Since May 2015. Principal |
| (retired 2009) of Cummins Inc. (industrial machinery); | Occupation(s) During the Past Five Years and |
| Chairman of the Board of Hillenbrand, Inc. (specialized | Other Experience: Principal of The Vanguard Group, |
| consumer services), and of Oxfam America; Director | Inc.; Treasurer of each of the investment companies |
| of SKF AB (industrial machinery), Hyster-Yale Materials | served by The Vanguard Group; Controller of each of |
| Handling, Inc. (forklift trucks), the Lumina Foundation | the investment companies served by The Vanguard |
| for Education, and the V Foundation for Cancer | Group (2010–2015); Assistant Controller of each of |
| Research; Member of the Advisory Council for the | the investment companies served by The Vanguard |
| College of Arts and Letters and of the Advisory Board | Group (2001–2010). | |
| to the Kellogg Institute for International Studies, both | | |
| at the University of Notre Dame. | Thomas J. Higgins | |
| Born 1957. Chief Financial Officer Since September |
| Mark Loughridge | 2008. Principal Occupation(s) During the Past Five |
| Born 1953. Trustee Since March 2012. Principal | Years and Other Experience: Principal of The Vanguard |
| Occupation(s) During the Past Five Years and Other | Group, Inc.; Chief Financial Officer of each of the |
| Experience: Senior Vice President and Chief Financial | investment companies served by The Vanguard Group; |
| Officer (retired 2013) at IBM (information technology | Treasurer of each of the investment companies served |
| services); Fiduciary Member of IBM’s Retirement Plan | by The Vanguard Group (1998–2008). |
| Committee (2004–2013); Director of the Dow Chemical | | |
| Company; Member of the Council on Chicago Booth. | Peter Mahoney | |
| Born 1974. Controller Since May 2015. Principal |
| Scott C. Malpass | Occupation(s) During the Past Five Years and |
| Born 1962. Trustee Since March 2012. Principal | Other Experience: Head of Global Fund Accounting |
| Occupation(s) During the Past Five Years and Other | at The Vanguard Group, Inc.; Controller of each of the |
| Experience: Chief Investment Officer and Vice | investment companies served by The Vanguard Group; |
| President at the University of Notre Dame; Assistant | Head of International Fund Services at The Vanguard |
| Professor of Finance at the Mendoza College of | Group (2008–2014). | |
| Business at Notre Dame; Member of the Notre Dame | | |
| 403(b) Investment Committee, the Board of Advisors | Heidi Stam | |
| for Spruceview Capital Partners, and the Investment | Born 1956. Secretary Since July 2005. Principal |
| Advisory Committee of Major League Baseball; Board | Occupation(s) During the Past Five Years and Other |
| Member of TIFF Advisory Services, Inc., and Catholic | Experience: Managing Director of The Vanguard |
| Investment Services, Inc. (investment advisors). | Group, Inc.; General Counsel of The Vanguard Group; |
| Secretary of The Vanguard Group and of each of the |
| André F. Perold | investment companies served by The Vanguard Group; |
| Born 1952. Trustee Since December 2004. Principal | Director and Senior Vice President of Vanguard |
| Occupation(s) During the Past Five Years and Other | Marketing Corporation. | |
| Experience: George Gund Professor of Finance and | | |
| Banking, Emeritus at the Harvard Business School | Vanguard Senior ManagementTeam |
| (retired 2011); Chief Investment Officer and Managing | Mortimer J. Buckley | James M. Norris |
| Partner of HighVista Strategies LLC (private investment | Kathleen C. Gubanich | Thomas M. Rampulla |
| firm); Director of Rand Merchant Bank; Overseer of | Martha G. King | Glenn W. Reed |
| the Museum of Fine Arts Boston. | John T. Marcante | Karin A. Risi |
| Chris D. McIsaac | Michael Rollings |
| Peter F. Volanakis | | |
| Born 1955. Trustee Since July 2009. Principal | | |
| Occupation(s) During the Past Five Years and | Chairman Emeritus and Senior Advisor |
| Other Experience: President and Chief Operating | John J. Brennan | |
| Officer (retired 2010) of Corning Incorporated | Chairman, 1996–2009 | |
| (communications equipment); Chairman of the | Chief Executive Officer and President, 1996–2008 |
| Board of Trustees of Colby-Sawyer College; | | |
| Member of the Advisory Board of the Norris | | |
| Cotton Cancer Center. | Founder | |
| | John C. Bogle | |
| | Chairman and Chief Executive Officer, 1974–1996 |
1 Mr. McNabb is considered an “interested person,” as defined in the Investment Company Act of 1940, because he is an officer of the Vanguard funds.
2 December 2002 for Vanguard Equity Income Fund, the Vanguard Municipal Bond Funds, and the Vanguard State Tax-Exempt Funds.
| |  |
| | | P.O. Box 2600 |
| | | Valley Forge, PA 19482-2600 |
| |
| |
| |
| Connect with Vanguard® > vanguard.com |
| |
| |
| |
| Fund Information > 800-662-7447 | | CFA® is a registered trademark owned by CFA Institute. |
| Direct Investor Account Services > 800-662-2739 | |
| Institutional Investor Services > 800-523-1036 | |
| Text Telephone for People | | |
| Who Are Deaf or Hard of Hearing> 800-749-7273 | |
| |
| This material may be used in conjunction | |
| with the offering of shares of any Vanguard | |
| fund only if preceded or accompanied by | |
| the fund’s current prospectus. | |
| |
| All comparative mutual fund data are from Lipper, a | |
| Thomson Reuters Company, or Morningstar, Inc., unless | |
| otherwise noted. | | |
| |
| You can obtain a free copy of Vanguard’s proxy voting | |
| guidelines by visiting vanguard.com/proxyreporting or by | |
| calling Vanguard at 800-662-2739. The guidelines are | |
| also available from the SEC’s website, sec.gov. In | |
| addition, you may obtain a free report on how your fund | |
| voted the proxies for securities it owned during the 12 | |
| months ended June 30. To get the report, visit either | |
| vanguard.com/proxyreporting or sec.gov. | |
| |
| You can review and copy information about your fund at | |
| the SEC’s Public Reference Room in Washington, D.C. To | |
| find out more about this public service, call the SEC at | |
| 202-551-8090. Information about your fund is also | |
| available on the SEC’s website, and you can receive | |
| copies of this information, for a fee, by sending a | |
| request in either of two ways: via email addressed to | |
| publicinfo@sec.gov or via regular mail addressed to the | |
| Public Reference Section, Securities and Exchange | |
| Commission, Washington, DC 20549-1520. | |
| |
| | | © 2016 The Vanguard Group, Inc. |
| | | All rights reserved. |
| | | Vanguard Marketing Corporation, Distributor. |
| |
| | | Q512 092016 |

Semiannual Report | July 31, 2016
Vanguard Precious Metals and Mining Fund
Vanguard’s Principles for Investing Success
We want to give you the best chance of investment success. These principles, grounded in Vanguard’s research and experience, can put you on the right path.
Goals. Create clear, appropriate investment goals.
Balance. Develop a suitable asset allocation using broadly diversified funds. Cost. Minimize cost.
Discipline. Maintain perspective and long-term discipline.
A single theme unites these principles: Focus on the things you can control.
We believe there is no wiser course for any investor.
| |
| Contents | |
| Your Fund’s Total Returns. | 1 |
| Chairman’s Letter. | 2 |
| Advisor’s Report. | 7 |
| Fund Profile. | 10 |
| Performance Summary. | 11 |
| Financial Statements. | 12 |
| About Your Fund’s Expenses. | 22 |
| Trustees Approve Advisory Arrangement. | 24 |
| Glossary. | 25 |
Please note: The opinions expressed in this report are just that—informed opinions. They should not be considered promises or advice.
Also, please keep in mind that the information and opinions cover the period through the date on the front of this report. Of course, the
risks of investing in your fund are spelled out in the prospectus.
See the Glossary for definitions of investment terms used in this report.
About the cover: Pictured is a sailing block on the Brilliant, a 1932 schooner docked in Mystic, Connecticut. A type of pulley, the
sailing block helps coordinate the setting of the sails. At Vanguard, the intricate coordination of technology and people allows
us to help millions of clients around the world reach their financial goals.
Your Fund’s Total Returns
| |
| Six Months Ended July 31, 2016 | |
| | Total |
| | Returns |
| Vanguard Precious Metals and Mining Fund | 102.54% |
| S&P Global Custom Metals and Mining Index | 82.95 |
| Precious Metals Equity Funds Average | 117.30 |
| Precious Metals Equity Funds Average: Derived from data provided by Lipper, a Thomson Reuters Company. |
| | | | |
| Your Fund’s Performance at a Glance | | | | |
| January 31, 2016, Through July 31, 2016 | | | | |
| | | | Distributions Per Share |
| | Starting | Ending | Income | Capital |
| | Share Price | Share Price | Dividends | Gains |
| Vanguard Precious Metals and Mining Fund | $6.22 | $12.36 | $0.161 | $0.000 |
1

Chairman’s Letter
Dear Shareholder,
After an extended period of steep declines, the precious metals and mining sector rebounded dramatically in the six months ended July 31, 2016. Rising precious metals prices and a spike in demand for gold sent the industry soaring.
In this environment, Vanguard Precious Metals and Mining Fund returned 102.54%. The fund easily outpaced its benchmark, the Standard & Poor’s Global Custom Metals and Mining Index (+82.95%), but lagged the average return of its peers (+117.30%).
Although your fund’s most recent result is undoubtedly impressive, it should nevertheless be viewed with extreme caution. In this highly volatile segment, performance can turn quickly, and the peaks and valleys can be extreme. Take for example fiscal years 2008, 2009, and 2010: The fund returned 33.97%, –60.16%, and 77.75%, respectively. More recently, the fund has recorded negative returns for the last four fiscal years.
These tendencies are consistent with the dynamic variables inherent to the industry, including dramatic price spikes or declines, limited resources, government regulation, and geopolitical tumult—all of which have affected metals and mining stocks in recent years. Keep in mind also that the sector is a narrow segment, accounting for less than 5% of global stock market capitalization.
2
Because of its risk characteristics, the fund should be considered a complement to an already diversified portfolio with a long time horizon.
U.S. stocks continued to surge despite signs of uncertainty
U.S. stocks proved resilient over the half year, returning about 14%, although the global environment was far from tranquil.
Stocks tumbled after the momentous June 23 decision by U.K. voters to leave the European Union. But the market quickly recovered. Worries about the effects of “Brexit” on trade and economic growth seemed to diminish as expectations rose that major central banks would be responsive to any fallout.
International stocks also performed well, returning nearly 12%. European stocks finished solidly but still lagged as the Brexit referendum hit close to home. Emerging-market stocks and those from developed Pacific markets recorded double-digit returns.
Bonds drew support given economic factors and low yields
The broad U.S. bond market advanced in each of the six months en route to returning 4.54%. With the stock market volatile at times, the global growth pace uncertain, and inflation low, investors sought safe-haven assets. Foreign investors flocked to U.S. Treasury debt amid exceptionally low or negative yields abroad.
| | | |
| Market Barometer | | | |
| |
| | Total Returns |
| | Periods Ended July 31, 2016 |
| | Six | One | Five Years |
| | Months | Year | (Annualized) |
| Stocks | | | |
| Russell 1000 Index (Large-caps) | 13.82% | 4.84% | 13.22% |
| Russell 2000 Index (Small-caps) | 18.76 | 0.00 | 10.43 |
| Russell 3000 Index (Broad U.S. market) | 14.18 | 4.44 | 12.99 |
| FTSE All-World ex US Index (International) | 11.69 | -4.95 | 1.76 |
| |
| Bonds | | | |
| Barclays U.S. Aggregate Bond Index (Broad taxable market) | 4.54% | 5.94% | 3.57% |
| Barclays Municipal Bond Index (Broad tax-exempt market) | 3.16 | 6.94 | 5.13 |
| Citigroup Three-Month U.S. Treasury Bill Index | 0.12 | 0.16 | 0.05 |
| |
| CPI | | | |
| Consumer Price Index | 1.57% | 0.84% | 1.27% |
3
The yield of the 10-year Treasury note closed July at 1.45%, down from 1.98% at the end of January. (Bond prices and yields move in opposite directions.)
The Federal Reserve has held its target for short-term interest rates at 0.25%–0.5% since raising it by a quarter percentage point last December. Money market funds and savings accounts stayed restrained by these historically low rates.
International bond markets (as measured by the Barclays Global Aggregate Index ex USD) returned 12.31%. A number of foreign currencies strengthened against the dollar, but the bond returns were robust even without this currency benefit.
A larger stake in gold-oriented firms led to the fund’s triple-digit advance
Your fund invests in companies that are involved in the mining of, or exploration for, precious and rare metals and minerals. As I mentioned, the embattled sector experienced a significant rebound during the fiscal half year, amid increased demand and higher prices. Gold, in particular, did well.
Although prices of some other precious metals, such as silver (+42.6%) and platinum (+31.9%), had larger advances, gold (+20.8%) has a much larger market share, and an increase in its price can provide a huge boost to the precious metals and mining industry, just as it did over the period.
| | |
| Expense Ratios | | |
| Your Fund Compared With Its Peer Group | | |
| | | Peer Group |
| | Fund | Average |
| Precious Metals and Mining Fund | 0.35% | 1.45% |
The fund expense ratio shown is from the prospectus dated May 25, 2016, and represents estimated costs for the current fiscal year. For the
six months ended July 31, 2016, the fund’s annualized expense ratio was 0.44%. The peer-group expense ratio is derived from data provided
by Lipper, a Thomson Reuters Company, and captures information through year-end 2015.
Peer group: Precious Metals Equity Funds.
4
Demand for gold, long considered a safe haven during times of financial turmoil, surged as investors sought perceived safety amid uncertainty in the equity and fixed income markets. Gold-oriented stocks, such as those held by your fund, reaped the rewards.
Historically, relative to its benchmark and peers, your fund has been underweighted in stocks of companies whose businesses are closely tied to gold and other precious metals. More recently, the fund’s advisor, M&G Investment Management, has increased the portfolio’s holdings in this category above those of the benchmark. This change in allocation provided a significant boost to the fund’s absolute return, as well as to its performance relative to the index.
To accommodate the fund’s larger position in precious metals-related companies, the advisor trimmed the position in diversified metals and mining stocks—another move that helped boost performance in comparison to the benchmark. On average, these stocks accounted for about 15% of the fund’s holdings, compared with an average of about 40% in the benchmark. Despite producing generally strong results, diversified metals and mining stocks lagged the triple-digit returns that were common among gold stocks for the period.
For a more detailed discussion of the management of the fund, please see the Advisor’s Report that follows this letter.
Consider rebalancing to manage your risk
Let’s say you’ve taken the time to carefully create an appropriate asset allocation for your investment portfolio. Your efforts have produced a diversified mix of stock, bond, and money market funds tailored to your goals, time horizon, and risk tolerance.
But what should you do when your portfolio drifts from its original asset allocation as the financial markets rise or fall? Consider rebalancing to bring it back to the proper mix. Just one year of outsized returns can throw your allocation out of whack. Take 2013 as an example. That year, the broad stock market (as measured by the Russell 3000 Index) returned 33.55% and the broad taxable bond market (as measured by the Barclays U.S. Aggregate Bond Index) returned –2.02%. A hypothetical portfolio that tracked the broad domestic market indexes and started the year with 60% stocks and 40% bonds would have ended with a more aggressive mix of 67% stocks and 33% bonds.
Rebalancing to bring your portfolio back to its original targets would require you to shift assets away from areas that have been performing well toward those that have been falling behind. That isn’t easy or intuitive. It’s a way to minimize risk rather than maximize returns and to stick with your investment plan through different types of markets. (You can read more about our approach in Best Practices for Portfolio Rebalancing at vanguard.com/research.)
5
It’s not necessary to check your portfolio every day or every month, much less rebalance it that frequently. It may be more appropriate to monitor it annually or semiannually and rebalance when your allocation swings 5 percentage points or more from its target. It’s important, of course, to be aware of the tax implications. You’ll want to consult with your tax advisor, but generally speaking, it may be a good idea to make any asset changes within a tax-advantaged retirement account or to direct new cash flows into the underweighted asset class.
However you go about it, keeping your asset allocation from drifting too far off target can help you stay on track with the investment plan you’ve crafted to meet your financial goals.
As always, thank you for investing with Vanguard.
Sincerely,

F. William McNabb III
Chairman and Chief Executive Officer
August 12, 2016
6
Advisor’s Report
Vanguard Precious Metals and Mining Fund returned 102.54% for the six months ended July 31, 2016. It finished significantly ahead of its customized benchmark, which returned 82.95%, but lagged the 117.30% average return of its peers.
The markets
Global stock markets recovered from a troubled start to deliver positive returns for the six months. Despite turbulence surrounding the United Kingdom’s shocking vote in June to leave the European Union, investors’ appetite for risk quickly recovered, and markets resumed their upward momentum to end the period at the highest level of 2016.
At the beginning of the period, investors were worried about a potential U.S. recession and the strength of Chinese economic growth. Weak commodity prices also dampened investor sentiment. Confidence gradually improved as robust data suggested that the U.S. economic recovery was gaining momentum, although the Federal Reserve held off raising interest rates again (following its first hike in December 2015) in light of uncertainty. China’s economy appeared to stabilize, arguably with the support of government stimulus measures.
Precious metals performed well, with the prices of gold and silver surging to their highest levels since 2014. Gold benefited from investors’ demand for a perceived “safe haven” amid worries about Brexit, a potential banking crisis in Italy, and the prospect of persistent low—or, in some cases, negative—interest rates, coupled with quantitative easing programs in a number of economies.
Against the backdrop of rising commodity prices, mining companies—and precious metals producers in particular—experienced significant gains and were top performers.
The fund’s performance
After a challenging couple of years for commodities and mining companies, we were pleased to see such a strong rebound in share prices over the period. This helped the fund deliver an impressive absolute return of more than 100%. On a relative basis, the fund outperformed its customized benchmark by nearly 20 percentage points. The fund was a bit behind its precious metals fund peers, which are mainly composed of pure precious metals stocks. Your fund includes a few diversified mining companies, and it has less exposure to the more speculative names.
The main driver of the fund’s outperformance relative to the benchmark was its allocation to precious metals companies, which were by far the best-performing category. First Majestic Silver and Hochschild Mining both returned over 400%. Hochschild benefited from higher silver prices and better-than-expected operational performance, particularly at its new mine in Peru, as well as an improved political situation in Argentina with the election of President Mauricio Macri at the end of 2015.
7
B2Gold, a Canadian gold producer with assets in Africa, was another leading contributor as its share price bounced back after a weak period. Investors had been concerned that the miner would run into difficulties by developing a new project when gold prices were low. But with gold prices rising, we are more comfortable about the company’s financial position, and we believe the mine is an attractive asset. Similarly, investors’ concerns about the amount of leverage Yamana Gold had on its balance sheet during the period of declining prices have largely been set aside.
Alamos Gold, Kaminak Gold, and Acacia Mining also made positive contributions. The share price of Kaminak, a junior miner, was boosted by a takeover approach from Goldcorp, one of the world’s largest gold producers, which is also held in the portfolio.
Relative performance also was enhanced by avoiding U.K.-listed miner Rio Tinto, which, despite making gains, significantly underperformed the benchmark. Similarly, being underweighted in BHP Billiton added value.
In contrast, the biggest detractor from relative performance was the fund’s large overweight holding in Dominion Diamond. The diamond sector has suffered lately on concerns about a slowdown in consumer sentiment, especially for luxury goods. Dominion’s share price fell during the period after the company reported disappointing results. The diamond miner also was hurt by a fire at one of its mines, which led to a reduced production forecast.
One of our biggest disappointments was the U.K.-listed mining company Anglo American, which we had invested in for its De Beers diamond exposure. The stock was hurt by weakness in the diamond market, and we sold the position in its entirety. We also sold our holding in Petra Diamonds.
With investors preferring precious metals during the period, the fund’s large above-index position in Canadian copper miner Nevsun Resources also detracted from performance relative to the benchmark. Similarly, fertilizer company PotashCorp was a notable detractor.
Meanwhile, not holding some of the more speculative gold mining companies also hurt relative results, as they were among the period’s top performers.
Purchases and sales
We added a number of gold producers to the portfolio, including Barkerville Gold Mines and Kinross Gold. We remain positive on gold producers over diversified metals and mining companies, given the heightened market risks. Furthermore, we believe that gold companies are benefiting from lower energy costs and higher gold prices, together with a lower cost base, after recent cost-cutting initiatives. Combined, these factors should deliver higher cash flows over the next few years.
We also initiated a position in U.S.-based agribusiness Bunge. The company’s operations are linked to the agricultural commodity cycle, and we purchased the shares on an attractive valuation at the low end of this cycle. We regard Bunge as a
8
well-managed, cash-generative, geographically diverse business with a strong balance sheet.
In terms of sales, we closed out our position in Kirkland Lake Gold after the chief executive was replaced. We attach great importance to company management, strategy, and execution, and we will assess the new executive.
As previously mentioned, we sold our holdings in Anglo American and Petra Diamonds; our position in Lakeshore Gold was dissolved after the company was acquired.
Looking ahead
We continue to believe that the precious metals and mining stocks are the most attractive, and we remain overweighted in this subsector. The diversified miners are still going through the restructuring process and, in this respect, continue to lag the gold miners by about 21/2 years in the commodities cycle. For this reason, we are significantly underweighted in diversified metals and mining stocks compared with the benchmark.
We maintain that 2016 will be a good year for gold. A number of heightened market risks continue, including the forthcoming election in the United States, the troubled European banking system, and negative interest rate policies. Gold companies are benefiting from lower costs (specifically, energy) and a gold price that’s risen 25% since the start of 2016, which should lead to growth in free cash flow and a positive free cash flow yield for the next couple of years.
We will continue to implement our investment philosophy and process: maintaining a long-term approach and identifying high-quality companies with strong management teams, best-in-class assets, and costs that compare favorably with those of their competitors.
Jamie J. Horvat
Portfolio Manager
M&G Investment Management Limited
August 11, 2016
9
Precious Metals and Mining Fund
Fund Profile
As of July 31, 2016
| | | |
| Portfolio Characteristics | | |
| | | S&P | DJ |
| | | Global | U.S. |
| | | Custom | Total |
| | | Metals and | Market |
| | | Mining | FA |
| | Fund | Index | Index |
| Number of Stocks | 71 | 221 | 3,839 |
| Median Market Cap | $3.0B | $13.7B | $54.0B |
| Price/Earnings Ratio | -22.6x | -19.1x | 23.5x |
| Price/Book Ratio | 1.8x | 1.5x | 2.8x |
| Return on Equity | -0.4% | 3.4% | 16.3% |
| Earnings Growth | | | |
| Rate | -10.2% | -15.9% | 7.3% |
| Dividend Yield | 0.9% | 2.0% | 2.0% |
| Foreign Holdings | 90.7% | 87.5% | 0.0% |
| Turnover Rate | | | |
| (Annualized) | 22% | — | — |
| Ticker Symbol | VGPMX | — | — |
| Expense Ratio1 | 0.35% | — | — |
| Short-Term | | | |
| Reserves | 1.2% | — | — |
| | |
| Subindustry Diversification (% of equity |
| exposure) | | |
| | | S&P |
| | | Global |
| | | Custom |
| | | Metals and |
| | | Mining |
| | Fund | Index |
| Aluminum | 0.0% | 5.1% |
| Agricultural Products | 0.9 | 0.0 |
| Diversified Metals & Mining | 11.1 | 44.7 |
| Fertilizers & Agricultural | | |
| Chemicals | 0.7 | 0.0 |
| Gold | 65.1 | 40.4 |
| Precious Metals & Minerals | 8.8 | 5.1 |
| Silver | 10.7 | 4.7 |
| Specialty Chemicals | 2.3 | 0.0 |
| Other | 0.4 | 0.0 |
| | |
| Volatility Measures | | |
| | S&P | |
| | Global | |
| | Custom | DJ |
| | Metals and | U.S. Total |
| | Mining | Market |
| | Index | FA Index |
| R-Squared | 0.94 | 0.03 |
| Beta | 1.00 | 0.49 |
| These measures show the degree and timing of the fund’s fluctuations compared with the indexes over 36 months. |
| | |
| Ten Largest Holdings (% of total net assets) |
| Agnico Eagle Mines Ltd. Gold | 5.6% |
| Hochschild Mining plc | Silver | 5.1 |
| Barrick Gold Corp. | Gold | 4.7 |
| Randgold Resources Ltd. Gold | 4.5 |
| Newmont Mining Corp. | Gold | 4.5 |
| Acacia Mining plc | Gold | 4.1 |
| B2Gold Corp. | Gold | 4.1 |
| Nevsun Resources Ltd. | Diversified Metals & | |
| | Mining | 4.0 |
| Tahoe Resources Inc. | Gold | 3.8 |
| Yamana Gold Inc. | Gold | 3.7 |
| Top Ten | | 44.1% |
| The holdings listed exclude any temporary cash investments and equity index products. |
1 The expense ratio shown is from the prospectus dated May 25, 2016, and represents estimated costs for the current fiscal year. For the six months
ended July 31, 2016, the annualized expense ratio was 0.44%.
10
Precious Metals and Mining Fund
Performance Summary
All of the returns in this report represent past performance, which is not a guarantee of future results that may be achieved by the fund. (Current performance may be lower or higher than the performance data cited. For performance data current to the most recent month-end, visit our website at vanguard.com/performance.) Note, too, that both investment returns and principal value can fluctuate widely, so an investor’s shares, when sold, could be worth more or less than their original cost. The returns shown do not reflect taxes that a shareholder would pay on fund distributions or on the sale of fund shares.
Fiscal-Year Total Returns (%): January 31, 2006, Through July 31, 2016
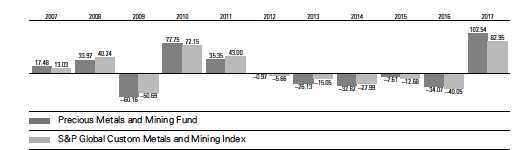
Note: For 2017, performance data reflect the six months ended July 31, 2016.
Average Annual Total Returns: Periods Ended June 30, 2016
This table presents returns through the latest calendar quarter—rather than through the end of the fiscal period.
Securities and Exchange Commission rules require that we provide this information.
| | | | |
| | Inception | One | Five | Ten |
| | Date | Year | Years | Years |
| Precious Metals and Mining Fund | 5/23/1984 | 30.74% | -12.42% | -2.79% |
See Financial Highlights for dividend and capital gains information.
11
Precious Metals and Mining Fund
Financial Statements (unaudited)
Statement of Net Assets
As of July 31, 2016
The fund reports a complete list of its holdings in regulatory filings four times in each fiscal year, at the quarter-ends. For the second and fourth fiscal quarters, the lists appear in the fund’s semiannual and annual reports to shareholders. For the first and third fiscal quarters, the fund files the lists with the Securities and Exchange Commission on Form N-Q. Shareholders can look up the fund’s Forms N-Q on the SEC’s website at sec.gov. Forms N-Q may also be reviewed and copied at the SEC’s Public Reference Room (see the back cover of this report for further information).
| | | |
| | | | Market |
| | | | Value• |
| | | Shares | ($000) |
| Common Stocks (98.9%) | | |
| Agricultural Products (0.9%) | | |
| | Bunge Ltd. | 403,236 | 26,549 |
| |
| Diversified Metals & Mining (11.0%) | |
| 1 | Nevsun Resources Ltd. | 36,609,597 | 121,130 |
| | Boliden AB | 2,580,000 | 56,786 |
| * | Lundin Mining Corp. | 12,932,010 | 54,079 |
| | BHP Billiton Ltd. | 2,644,661 | 39,200 |
| | BHP Billiton plc | 2,530,120 | 31,901 |
| | Antofagasta plc | 3,358,480 | 22,229 |
| * | Balmoral Resources Ltd. | 5,552,174 | 4,125 |
| *,1 | Aguia Resources Ltd. | 23,529,412 | 1,823 |
| | | | 331,273 |
| Fertilizers & Agricultural Chemicals (0.7%) | |
| | Potash Corp. of | | |
| | Saskatchewan Inc. | 1,356,629 | 21,145 |
| |
| Gold (64.4%) | | |
| | Barrick Gold Corp. | 6,534,215 | 142,838 |
| ^ | Randgold Resources | | |
| | Ltd. ADR | 1,162,627 | 136,737 |
| | Newmont Mining Corp. | 3,095,390 | 136,197 |
| | Acacia Mining plc | 16,812,622 | 124,369 |
| | Agnico Eagle Mines | | |
| | Ltd. (New York Shares) | 2,093,423 | 121,712 |
| *,^ | B2Gold Corp. | 37,190,786 | 116,407 |
| ^ | Franco-Nevada Corp. | 1,397,403 | 107,642 |
| *,1 | SEMAFO Inc. | 16,874,948 | 90,860 |
| * | Kinross Gold Corp. | 15,000,000 | 77,550 |
| | Tahoe Resources Inc. | | |
| | (New York Shares) | 4,678,633 | 72,800 |
| | Yamana Gold Inc. | | |
| | (New York Shares) | 12,445,517 | 71,064 |
| | Royal Gold Inc. | 723,226 | 61,142 |
| ^ | Goldcorp Inc. | | |
| | (Toronto Shares) | 3,415,891 | 61,037 |
| | | |
| | Alamos Gold Inc. | | |
| | (New York Shares) | 5,612,430 | 52,420 |
| | Agnico Eagle Mines Ltd. | | |
| | (Toronto Shares) | 814,545 | 47,401 |
| *,^ | Pretium Resources Inc. | 3,965,862 | 47,114 |
| | Tahoe Resources Inc. | | |
| | (Toronto Shares) | 2,689,463 | 41,753 |
| | Yamana Gold Inc. | | |
| | (Toronto Shares) | 7,291,086 | 41,714 |
| *,^,1Roxgold Inc. | 29,379,356 | 38,253 |
| *,^,1Premier Gold Mines Ltd. | 10,004,859 | 38,007 |
| * | Asanko Gold Inc. | 8,479,366 | 37,018 |
| | Goldcorp Inc. | | |
| | (New York Shares) | 1,974,450 | 35,303 |
| | Alamos Gold Inc. | | |
| | (Toronto Shares) | 3,627,542 | 33,868 |
| | Eldorado Gold Corp. | | |
| | (New York Shares) | 7,439,096 | 30,426 |
| *,^ | Torex Gold Resources | | |
| | Inc. | 1,075,398 | 22,304 |
| ^ | Osisko Gold Royalties | | |
| | Ltd. | 1,634,820 | 21,712 |
| * | Guyana Goldfields Inc. | 3,019,501 | 19,426 |
| * | Primero Mining Corp. | 8,506,500 | 19,350 |
| * | Saracen Mineral | | |
| | Holdings Ltd. | 11,853,814 | 15,735 |
| * | Alacer Gold Corp. | 5,752,073 | 14,670 |
| * | Perseus Mining Ltd. | 25,753,128 | 12,742 |
| | Endeavour Mining Corp. | 630,058 | 12,243 |
| * | Gold Road Resources | | |
| | Ltd. | 21,692,756 | 11,280 |
| *,^ | Continental Gold Inc. | 2,600,000 | 7,687 |
| * | B2Gold Corp. (Toronto | | |
| | Shares) | 1,860,800 | 5,829 |
| * | Newmarket Gold Inc. | 1,527,600 | 5,066 |
| * | Beadell Resources Ltd. | 8,529,590 | 3,388 |
| | Eldorado Gold Corp. | | |
| | (Toronto Shares) | 710,600 | 2,912 |
12
Precious Metals and Mining Fund
| | | |
| | | | Market |
| | | | Value• |
| | | Shares | ($000) |
| * | Osisko Gold Royalties | | |
| | Warrants Exp. | | |
| | 02/26/2019 | 231,787 | 719 |
| * | Primero Mining Corp. | | |
| | Warrants Exp. | | |
| | 06/25/2018 | 638,250 | 391 |
| *,1 | Apex Minerals NL | 55,654,166 | — |
| | | | 1,939,086 |
| Other (0.3%) | | |
| *,2 | Orezone Gold Corp. PP | 5,000,000 | 4,032 |
| *,2 | Barkerville Gold Mines | | |
| | Ltd. PP | 6,387,000 | 3,038 |
| * | Dalradian Resources | | |
| | Warrants Exp. | | |
| | 10/07/2017 | 22,812,500 | 2,097 |
| *,2 | Osisko Mining Inc. PP | 500,000 | 851 |
| * | Continental Gold Inc | | |
| | Warrants Exp. | | |
| | 11/27/2017 | 450,000 | — |
| *,2 | Rescue Radio Corp. | 15,955 | — |
| | | | 10,018 |
| Precious Metals & Minerals (8.7%) | |
| ^,1 | Dominion Diamond Corp. | 8,061,001 | 74,025 |
| | Fresnillo plc | 2,637,666 | 67,498 |
| * | Stillwater Mining Co. | 3,173,012 | 48,547 |
| | Lucara Diamond Corp. | 8,331,525 | 25,716 |
| *,1 | Dalradian Resources Inc. | 22,812,500 | 20,268 |
| * | Mountain Province | | |
| | Diamonds Inc. | 3,997,539 | 19,809 |
| *,2 | Osisko Mining Inc. | | |
| | (Placing) | 3,350,000 | 5,704 |
| *,^ | Osisko Mining Inc. | 203,200 | 384 |
| | | | 261,951 |
| Silver (10.6%) | | |
| *,1 | Hochschild Mining plc | 43,296,137 | 153,838 |
| *,^ | First Majestic Silver | | |
| | Corp. | 4,513,000 | 78,255 |
| * | Fortuna Silver Mines Inc. | 6,326,871 | 55,145 |
| *,^ | MAG Silver Corp. | 1,424,523 | 22,366 |
| *,1 | Americas Silver Corp. | 28,433,334 | 8,711 |
| | | | 318,315 |
| Specialty Chemicals (2.3%) | | |
| | Umicore SA | 773,783 | 44,771 |
| | Johnson Matthey plc | 554,463 | 24,029 |
| | | | 68,800 |
| Total Common Stocks | | |
| (Cost $2,342,131) | | 2,977,137 |
| | |
| | | Market |
| | | Value• |
| | Shares | ($000) |
| Precious Metals (0.1%) | |
| * Platinum Bullion | | |
| (In Troy Ounces) | 2,009 | 2,304 |
| Total Precious Metals | | |
| (Cost $1,213) | | 2,304 |
| Temporary Cash Investment (4.0%) | |
| Money Market Fund (4.0%) | |
| 3,4 Vanguard Market Liquidity | |
| Fund, 0.561% | | |
| (Cost $121,764) | 121,764,173 | 121,764 |
| Total Investments (103.0%) | |
| (Cost $2,465,108) | | 3,101,205 |
| Other Assets and Liabilities (-3.0%) | |
| Other Assets | | 5,947 |
| Liabilities 4 | | (97,264) |
| | | (91,317) |
| Net Assets (100%) | | |
| Applicable to 243,434,864 outstanding | |
| $.001 par value shares of beneficial | |
| interest (unlimited authorization) | 3,009,888 |
| Net Asset Value Per Share | $12.36 |
13
Precious Metals and Mining Fund
| |
| | Amount |
| | ($000) |
| Statement of Assets and Liabilities | |
| Assets | |
| Investments in Securities, at Value | |
| Unaffiliated Issuers 5 | 2,432,526 |
| Affiliated Vanguard Funds | 121,764 |
| Other Affiliated Issuers | 546,915 |
| Total Investments in Securities | 3,101,205 |
| Investment in Vanguard | 217 |
| Receivables for Capital Shares Issued | 4,631 |
| Receivables for Accrued Income | 1,075 |
| Other Assets | 24 |
| Total Assets | 3,107,152 |
| Liabilities | |
| Collateral for Securities on Loan | 84,168 |
| Payables to Vanguard | 5,970 |
| Payables for Capital Shares Redeemed | 4,648 |
| Payables to Investment Advisor | 1,279 |
| Other Liabilities | 1,199 |
| Total Liabilities | 97,264 |
| Net Assets | 3,009,888 |
| |
| At July 31, 2016, net assets consisted of: |
| | Amount |
| | ($000) |
| Paid-in Capital | 4,293,437 |
| Overdistributed Net Investment Income | (160,988) |
| Accumulated Net Realized Losses | (1,758,613) |
| Unrealized Appreciation (Depreciation) | |
| Investment Securities 5 | 636,097 |
| Foreign Currencies | (45) |
| Net Assets | 3,009,888 |
• See Note A in Notes to Financial Statements.
* Non-income-producing security.
^ Includes partial security positions on loan to broker-dealers. The total value of securities on loan is $83,580,000.
1 Considered an affiliated company of the fund as the fund owns more than 5% of the outstanding voting securities of such company.
2 Restricted securities totaling $13,625,000, representing 0.5% of net assets.
3 Affiliated money market fund available only to Vanguard funds and certain trusts and accounts managed by Vanguard. Rate shown is the
7-day yield.
4 Includes $84,168,000 of collateral received for securities on loan.
5 Includes precious metals.
ADR—American Depositary Receipt.
PP—Private Placement.
See accompanying Notes, which are an integral part of the Financial Statements.
14
Precious Metals and Mining Fund
Statement of Operations
| |
| | Six Months Ended |
| | July 31, 2016 |
| | ($000) |
| Investment Income | |
| Income | |
| Dividends1 | 11,950 |
| Interest | 113 |
| Securities Lending | 652 |
| Total Income | 12,715 |
| Expenses | |
| Investment Advisory Fees—Note B | |
| Basic Fee | 1,626 |
| Performance Adjustment | 779 |
| The Vanguard Group—Note C | |
| Management and Administrative | 2,347 |
| Marketing and Distribution | 221 |
| Custodian Fees | 35 |
| Shareholders’ Reports | 24 |
| Trustees’ Fees and Expenses | 2 |
| Total Expenses | 5,034 |
| Net Investment Income | 7,681 |
| Realized Net Gain (Loss) | |
| Investment Securities Sold2 | (151,349) |
| Foreign Currencies | (35) |
| Realized Net Gain (Loss) | (151,384) |
| Change in Unrealized Appreciation (Depreciation) | |
| Investment Securities2 | 1,670,916 |
| Foreign Currencies | (11) |
| Change in Unrealized Appreciation (Depreciation) | 1,670,905 |
| Net Increase (Decrease) in Net Assets Resulting from Operations | 1,527,202 |
| 1 Dividends are net of foreign withholding taxes of $1,488,000. |
| 2 Includes precious metals. |
See accompanying Notes, which are an integral part of the Financial Statements.
15
Precious Metals and Mining Fund
Statement of Changes in Net Assets
| | |
| | Six Months Ended | Year Ended |
| | July 31, | January 31, |
| | 2016 | 2016 |
| | ($000) | ($000) |
| Increase (Decrease) in Net Assets | | |
| Operations | | |
| Net Investment Income | 7,681 | 40,401 |
| Realized Net Gain (Loss) | (151,384) | (134,435) |
| Change in Unrealized Appreciation (Depreciation) | 1,670,905 | (655,329) |
| Net Increase (Decrease) in Net Assets Resulting from Operations | 1,527,202 | (749,363) |
| Distributions | | |
| Net Investment Income | (39,022) | (32,309) |
| Realized Capital Gain | — | — |
| Total Distributions | (39,022) | (32,309) |
| Capital Share Transactions | | |
| Issued | 595,418 | 631,267 |
| Issued in Lieu of Cash Distributions | 36,059 | 29,970 |
| Redeemed | (574,290) | (501,592) |
| Net Increase (Decrease) from Capital Share Transactions | 57,187 | 159,645 |
| Total Increase (Decrease) | 1,545,367 | (622,027) |
| Net Assets | | |
| Beginning of Period | 1,464,521 | 2,086,548 |
| End of Period1 | 3,009,888 | 1,464,521 |
| 1 Net Assets—End of Period includes undistributed (overdistributed) net investment income of ($160,988,000) and ($129,612,000). |
See accompanying Notes, which are an integral part of the Financial Statements.
16
Precious Metals and Mining Fund
Financial Highlights
| | | | | | |
| Six Months | | | | | |
| | Ended | | | | | |
| For a Share Outstanding | July 31, | Year Ended January 31, |
| Throughout Each Period | 2016 | 2016 | 2015 | 2014 | 2013 | 2012 |
| Net Asset Value, Beginning of Period | $6.22 | $9.59 | $10.38 | $15.46 | $22.14 | $24.15 |
| Investment Operations | | | | | | |
| Net Investment Income | . 0321 | .1751,2 | .130 | .2431 | .292 | .334 3 |
| Net Realized and Unrealized Gain (Loss) | | | | | | |
| on Investments 4 | 6.269 | (3.397) | (. 920) | (5.315) | (5.962) | (.760) |
| Total from Investment Operations | 6.301 | (3.222) | (.790) | (5.072) | (5.670) | (.426) |
| Distributions | | | | | | |
| Dividends from Net Investment Income | (.161) | (.148) | — | (. 007) | (.710) | (.123) |
| Distributions from Realized Capital Gains | — | — | — | — | (.300) | (1.461) |
| Return of Capital | — | — | — | (.001) | — | — |
| Total Distributions | (.161) | (.148) | — | (.008) | (1.010) | (1.584) |
| Net Asset Value, End of Period | $12.36 | $6.22 | $9.59 | $10.38 | $15.46 | $22.14 |
| |
| Total Return5 | 102.54% | -34.07% | -7.61% | -32.82% | -26.13% | -0.97% |
| |
| Ratios/Supplemental Data | | | | | | |
| Net Assets, End of Period (Millions) | $3,010 | $1,465 | $2,087 | $2,302 | $3,112 | $4,415 |
| Ratio of Total Expenses to | | | | | | |
| Average Net Assets6 | 0.44% | 0.35% | 0.29% | 0.25% | 0.26% | 0.29% |
| Ratio of Net Investment Income to | | | | | | |
| Average Net Assets | 0.67% | 2.22%2 | 1.33% | 2.10% | 1.62% | 1.54%3 |
| Portfolio Turnover Rate | 22% | 8% | 62% | 34% | 30% | 22% |
The expense ratio, net investment income ratio, and turnover rate for the current period have been annualized.
1 Calculated based on average shares outstanding.
2 Net investment income per share and the ratio of net investment income to average net assets include $.037 and 0.47%, respectively,
resulting from a spin-off from BHP Billiton plc in May 2015.
3 Net investment income per share and the ratio of net investment income to average net assets include $.103 and 0.40%, respectively,
resulting from a special dividend from OZ Minerals Ltd. in May 2011.
4 Includes increases from redemption fees of $.00, $.00, $.00, $.00, $.00, and $.01. Effective May 23, 2012, the redemption fee
was eliminated.
5 Total returns do not include transaction or account service fees that may have applied in the periods shown. Fund prospectuses provide
information about any applicable transaction and account service fees.
6 Includes performance-based investment advisory fee increases (decreases) of 0.07%, (0.02%), (0.08%), (0.09%), (0.07%), and (0.03%).
See accompanying Notes, which are an integral part of the Financial Statements.
17
Precious Metals and Mining Fund
Notes to Financial Statements
Vanguard Precious Metals and Mining Fund is registered under the Investment Company Act of 1940 as an open-end investment company, or mutual fund. The fund invests in securities of foreign issuers, which may subject it to investment risks not normally associated with investing in securities of U.S. corporations.
A. The following significant accounting policies conform to generally accepted accounting principles for U.S. investment companies. The fund consistently follows such policies in preparing its financial statements.
1. Security Valuation: Securities are valued as of the close of trading on the New York Stock Exchange (generally 4 p.m., Eastern time) on the valuation date. Equity securities are valued at the latest quoted sales prices or official closing prices taken from the primary market in which each security trades; such securities not traded on the valuation date are valued at the mean of the latest quoted bid and asked prices. Securities for which market quotations are not readily available, or whose values have been affected by events occurring before the fund’s pricing time but after the close of the securities’ primary markets, are valued at their fair values calculated according to procedures adopted by the board of trustees. These procedures include obtaining quotations from an independent pricing service, monitoring news to identify significant market- or security-specific events, and evaluating changes in the values of foreign market proxies (for example, ADRs, futures contracts, or exchange-traded funds), between the time the foreign markets close and the fund’s pricing time. When fair-value pricing is employed, the prices of securities used by a fund to calculate its net asset value may differ from quoted or published prices for the same securities. Precious metals are valued at the latest quoted bid prices. Investments in Vanguard Market Liquidity Fund are valued at that fund’s net asset value.
2. Foreign Currency: Securities and other assets and liabilities denominated in foreign currencies are translated into U.S. dollars using exchange rates obtained from an independent third party as of the fund’s pricing time on the valuation date. Realized gains (losses) and unrealized appreciation (depreciation) on investment securities include the effects of changes in exchange rates since the securities were purchased, combined with the effects of changes in security prices. Fluctuations in the value of other assets and liabilities resulting from changes in exchange rates are recorded as unrealized foreign currency gains (losses) until the assets or liabilities are settled in cash, at which time they are recorded as realized foreign currency gains (losses).
3. Federal Income Taxes: The fund intends to continue to qualify as a regulated investment company and distribute all of its taxable income. Management has analyzed the fund’s tax positions taken for all open federal income tax years (January 31, 2013–2016), and for the period ended July 31, 2016, and has concluded that no provision for federal income tax is required in the fund’s financial statements.
4. Distributions: Distributions to shareholders are recorded on the ex-dividend date.
5. Securities Lending: To earn additional income, the fund lends its securities to qualified institutional borrowers. Security loans are subject to termination by the fund at any time, and are required to be secured at all times by collateral in an amount at least equal to the market value of securities loaned. Daily market fluctuations could cause the value of loaned securities to be more or less than the value of the collateral received. When this occurs, the collateral is adjusted and settled on the next business day. The fund further mitigates its counterparty risk by entering into securities lending transactions only with a diverse group of prequalified counterparties, monitoring their financial strength, and entering into master securities lending agreements with its counterparties. The master securities lending agreements provide that, in the event of a counterparty’s default (including bankruptcy), the fund may terminate any loans with that borrower, determine the net amount owed, and sell or retain
18
Precious Metals and Mining Fund
the collateral up to the net amount owed to the fund; however, such actions may be subject to legal proceedings. While collateral mitigates counterparty risk, in the absence of a default the fund may experience delays and costs in recovering the securities loaned. The fund invests cash collateral received in Vanguard Market Liquidity Fund, and records a liability in the Statement of Assets and Liabilities for the return of the collateral, during the period the securities are on loan. Securities lending income represents fees charged to borrowers plus income earned on invested cash collateral, less expenses associated with the loan.
6. Credit Facility: The fund and certain other funds managed by The Vanguard Group (“Vanguard”) participate in a $3.1 billion committed credit facility provided by a syndicate of lenders pursuant to a credit agreement that may be renewed annually; each fund is individually liable for its borrowings, if any, under the credit facility. Borrowings may be utilized for temporary and emergency purposes, and are subject to the fund’s regulatory and contractual borrowing restrictions. The participating funds are charged administrative fees and an annual commitment fee of 0.10% of the undrawn amount of the facility; these fees are allocated to the funds based on a method approved by the fund’s board of trustees and included in Management and Administrative expenses on the fund’s Statement of Operations. Any borrowings under this facility bear interest at a rate based upon the higher of the one-month London Interbank Offered Rate, federal funds effective rate, or overnight bank funding rate plus an agreed-upon spread.
The fund had no borrowings outstanding at July 31, 2016, or at any time during the period then ended.
7. Other: Dividend income is recorded on the ex-dividend date. Interest income includes income distributions received from Vanguard Market Liquidity Fund and is accrued daily. Security transactions are accounted for on the date securities are bought or sold. Costs used to determine realized gains (losses) on the sale of investment securities are those of the specific securities sold.
B. M&G Investment Management Limited provides investment advisory services to the fund for a fee calculated at an annual percentage rate of average net assets. The basic fee is subject to quarterly adjustments based on the fund’s performance relative to the S&P Global Custom Metals and Mining Index for the preceding three years. For the six months ended July 31, 2016, the investment advisory fee represented an effective annual basic rate of 0.14% of the fund’s average net assets before an increase of $779,000 (0.07%) based on performance.
C. In accordance with the terms of a Funds’ Service Agreement (the “FSA”) between Vanguard and the fund, Vanguard furnishes to the fund corporate management, administrative, marketing, and distribution services at Vanguard’s cost of operations (as defined by the FSA). These costs of operations are allocated to the fund based on methods and guidelines approved by the board of trustees. Vanguard does not require reimbursement in the current period for certain costs of operations (such as deferred compensation/benefits and risk/insurance costs); the fund’s liability for these costs of operations is included in Payables to Vanguard on the Statement of Assets and Liabilities.
Upon the request of Vanguard, the fund may invest up to 0.40% of its net assets as capital in Vanguard. At July 31, 2016, the fund had contributed to Vanguard capital in the amount of $217,000, representing 0.01% of the fund’s net assets and 0.09% of Vanguard’s capitalization. The fund’s trustees and officers are also directors and employees, respectively, of Vanguard.
19
Precious Metals and Mining Fund
D. Various inputs may be used to determine the value of the fund’s investments. These inputs are summarized in three broad levels for financial statement purposes. The inputs or methodologies used to value securities are not necessarily an indication of the risk associated with investing in those securities.
Level 1—Quoted prices in active markets for identical securities.
Level 2—Other significant observable inputs (including quoted prices for similar securities, interest rates, prepayment speeds, credit risk, etc.).
Level 3—Significant unobservable inputs (including the fund’s own assumptions used to determine the fair value of investments).
The following table summarizes the market value of the fund’s investments as of July 31, 2016, based on the inputs used to value them:
| | | |
| | Level 1 | Level 2 | Level 3 |
| Investments | ($000) | ($000) | ($000) |
| Common Stocks | 2,351,826 | 625,311 | — |
| Precious Metals | — | 2,304 | — |
| Temporary Cash Investments | 121,764 | — | — |
| Total | 2,473,590 | 627,615 | — |
E. Distributions are determined on a tax basis and may differ from net investment income and realized capital gains for financial reporting purposes. Differences may be permanent or temporary. Permanent differences are reclassified among capital accounts in the financial statements to reflect their tax character. Temporary differences arise when certain items of income, expense, gain, or loss are recognized in different periods for financial statement and tax purposes; such differences are primarily attributed to the tax treatment of unrealized appreciation on passive foreign investment companies. These differences will reverse at some time in the future. Differences in classification may also result from the treatment of short-term gains as ordinary income for tax purposes.
During the six months ended July 31, 2016, the fund realized net foreign currency losses of $35,000, which decreased distributable net income for tax purposes; accordingly, such losses have been reclassified from accumulated net realized losses to overdistributed net investment income. Certain of the fund’s investments are in securities considered to be passive foreign investment companies, for which any unrealized appreciation and/or realized gains are required to be included in distributable net investment income for tax purposes. Passive foreign investment companies had unrealized appreciation of $158,084,000 at July 31, 2016.
The fund’s tax-basis capital gains and losses are determined only at the end of each fiscal year. For tax purposes, at January 31, 2016, the fund had available capital losses totaling $1,607,297,000 that may be carried forward indefinitely to offset future net capital gains. The fund will use these capital losses to offset net taxable capital gains, if any, realized during the year ending January 31, 2017; should the fund realize net capital losses for the year, the losses will be added to the loss carryforward balance above.
At July 31, 2016, the cost of investment securities for tax purposes was $2,623,192,000. Net unrealized appreciation of investment securities for tax purposes was $478,013,000, consisting of unrealized gains of $770,967,000 on securities that had risen in value since their purchase and $292,954,000 in unrealized losses on securities that had fallen in value since their purchase.
20
Precious Metals and Mining Fund
F. During the six months ended July 31, 2016, the fund purchased $293,520,000 of investment securities and sold $251,707,000 of investment securities, other than temporary cash investments.
G. Capital shares issued and redeemed were:
| | |
| | Six Months Ended | Year Ended |
| | July 31, 2016 | January 31, 2016 |
| | Shares | Shares |
| | (000) | (000) |
| Issued | 62,834 | 82,312 |
| Issued in Lieu of Cash Distributions | 4,303 | 3,349 |
| Redeemed | (59,292) | (67,553) |
| Net Increase (Decrease) in Shares Outstanding | 7,845 | 18,108 |
H. Certain of the fund’s investments are in companies that are considered to be affiliated companies of the fund because the fund owns more than 5% of the outstanding voting securities of the company or the issuer is another member of The Vanguard Group. Transactions during the period in securities of these companies were as follows:
| | | | | | |
| | | Current Period Transactions | |
| | Jan. 31, | | Proceeds | | | July 31, |
| | 2016 | | from | | Capital Gain | 2016 |
| | Market | Purchases | Securities | | Distributions | Market |
| | Value | at Cost | Sold1 | Income | Received | Value |
| | ($000) | ($000) | ($000) | ($000) | ($000) | ($000) |
| Aguia Resources Ltd. | 1,818 | — | — | — | — | 1,823 |
| Americas Silver Corp. | — | 6,529 | — | — | — | 8,711 |
| Apex Minerals NL | — | — | — | — | — | — |
| Dalradian Resources Inc. | 11,725 | — | — | — | — | 20,268 |
| Dominion Diamond Corp. | 86,371 | — | 355 | 1,369 | — | 74,025 |
| Hochschild Mining plc | 34,217 | — | 14,842 | — | — | 153,838 |
| Kaminak Gold Corp. Class A | 15,418 | 4,225 | — | — | — | NA2 |
| Nevsun Resources Ltd. | 102,912 | — | 4,221 | 2,489 | — | 121,130 |
| Premier Gold Mines Ltd. | 17,783 | — | — | — | — | 38,007 |
| Roxgold Inc. | 13,223 | 4,555 | — | — | — | 38,253 |
| SEMAFO Inc. | 39,824 | 3,091 | — | — | — | 90,860 |
| Vanguard Market Liquidity Fund | 73,121 | NA3 | NA 3 | 112 | — | 121,764 |
| Total | 396,412 | | | 3,970 | — | 668,679 |
1 Includes net realized gain (loss) on affiliated investment securities sold of ($26,626,000).
2 Not applicable—in July 2016, Kaminak Gold Corp. Class A merged into Goldcorp Inc. At July 31, 2016, the issuer was not an affiliated company of the fund.
3 Not applicable—purchases and sales are for temporary cash investment purposes.
I. Management has determined that no material events or transactions occurred subsequent to July 31, 2016, that would require recognition or disclosure in these financial statements.
21
About Your Fund’s Expenses
As a shareholder of the fund, you incur ongoing costs, which include costs for portfolio management, administrative services, and shareholder reports (like this one), among others. Operating expenses, which are deducted from a fund’s gross income, directly reduce the investment return of the fund.
A fund’s expenses are expressed as a percentage of its average net assets. This figure is known as the expense ratio. The following examples are intended to help you understand the ongoing costs (in dollars) of investing in your fund and to compare these costs with those of other mutual funds. The examples are based on an investment of $1,000 made at the beginning of the period shown and held for the entire period.
The accompanying table illustrates your fund’s costs in two ways:
• Based on actual fund return. This section helps you to estimate the actual expenses that you paid over the period. The ”Ending Account Value“ shown is derived from the fund‘s actual return, and the third column shows the dollar amount that would have been paid by an investor who started with $1,000 in the fund. You may use the information here, together with the amount you invested, to estimate the expenses that you paid over the period.
To do so, simply divide your account value by $1,000 (for example, an $8,600 account value divided by $1,000 = 8.6), then multiply the result by the number given for your fund under the heading ”Expenses Paid During Period.“
• Based on hypothetical 5% yearly return. This section is intended to help you compare your fund‘s costs with those of other mutual funds. It assumes that the fund had a yearly return of 5% before expenses, but that the expense ratio is unchanged. In this case—because the return used is not the fund’s actual return—the results do not apply to your investment. The example is useful in making comparisons because the Securities and Exchange Commission requires all mutual funds to calculate expenses based on a 5% return. You can assess your fund’s costs by comparing this hypothetical example with the hypothetical examples that appear in shareholder reports of other funds.
Note that the expenses shown in the table are meant to highlight and help you compare ongoing costs only and do not reflect transaction costs incurred by the fund for buying and selling securities. Further, the expenses do not include any purchase, redemption, or account service fees described in the fund prospectus. If such fees were applied to your account, your costs would be higher. Your fund does not carry a “sales load.”
The calculations assume no shares were bought or sold during the period. Your actual costs may have been higher or lower, depending on the amount of your investment and the timing of any purchases or redemptions.
You can find more information about the fund’s expenses, including annual expense ratios, in the Financial Statements section of this report. For additional information on operating expenses and other shareholder costs, please refer to your fund’s current prospectus.
22
| | | |
| Six Months Ended July 31, 2016 | | | |
| | Beginning | Ending | Expenses |
| | Account Value | Account Value | Paid During |
| Precious Metals and Mining Fund | 1/31/2016 | 7/31/2016 | Period |
| Based on Actual Fund Return | $1,000.00 | $2,025.39 | $3.31 |
| Based on Hypothetical 5% Yearly Return | 1,000.00 | 1,022.68 | 2.21 |
The calculations are based on expenses incurred in the most recent six-month period. The fund’s annualized six-month expense ratio for that
period is 0.44%. The dollar amounts shown as “Expenses Paid” are equal to the annualized expense ratio multiplied by the average account
value over the period, multiplied by the number of days in the most recent six-month period, then divided by the number of days in the most
recent 12-month period (182/366).
23
Trustees Approve Advisory Arrangement
The board of trustees of Vanguard Precious Metals and Mining Fund has renewed the fund’s investment advisory arrangement with M&G Investment Management Limited (M&G). The board determined that renewing the fund’s advisory arrangement was in the best interests of the fund and its shareholders.
The board based its decision upon an evaluation of the advisor’s investment staff, portfolio management process, and performance. The trustees considered the factors discussed below, among others. However, no single factor determined whether the board approved the arrangement. Rather, it was the totality of the circumstances that drove the board’s decision.
Nature, extent, and quality of services
The board reviewed the quality of the fund’s investment management services over both the short and long term, and took into account the organizational depth and stability of the advisor. The board considered that M&G, founded in 1931, offers a broad range of investment products. M&G seeks to identify mining companies with high-quality reserves that can be mined profitably at low all-in sustaining costs, quality management teams with a track record of success in the industry, and expansion projects that will increase reserves and create value over the long-term. Valuation factors are also considered alongside technical factors such as ore quality and the efficiency of mine operations. M&G has advised the fund since the fund’s inception in 1984.
The board concluded that the advisor’s experience, stability, depth, and performance, among other factors, warranted continuation of the advisory arrangement.
Investment performance
The board considered the short- and long-term performance of the fund, including any periods of outperformance or underperformance relative to a benchmark index and peer group. The board concluded that the performance was such that the advisory arrangement should continue. Information about the fund’s most recent performance can be found in the Performance Summary section of this report.
Cost
The board concluded that the fund’s expense ratio was well below the average expense ratio charged by funds in its peer group and that the fund’s advisory fee rate was also well below its peer-group average. Information about the fund’s expenses appears in the About Your Fund’s Expenses section of this report as well as in the Financial Statements section, which also includes information about the advisory fee rate.
The board did not consider profitability of M&G in determining whether to approve the advisory fee, because M&G is independent of Vanguard, and the advisory fee is the result of arm’s-length negotiations.
The benefit of economies of scale
The board concluded that the fund’s shareholders benefit from economies of scale because of breakpoints in the advisory fee schedule. The breakpoints reduce the effective rate of the fee as the fund’s assets increase.
The board will consider whether to renew the advisory arrangement again after a one-year period.
24
Glossary
Beta. A measure of the magnitude of a fund’s past share-price fluctuations in relation to the ups and downs of a given market index. The index is assigned a beta of 1.00. Compared with a given index, a fund with a beta of 1.20 typically would have seen its share price rise or fall by 12% when the index rose or fell by 10%. For this report, beta is based on returns over the past 36 months for both the fund and the index. Note that a fund’s beta should be reviewed in conjunction with its R-squared (see definition). The lower the R-squared, the less correlation there is between the fund and the index, and the less reliable beta is as an indicator of volatility.
Dividend Yield. Dividend income earned by stocks, expressed as a percentage of the aggregate market value (or of net asset value, for a fund). The yield is determined by dividing the amount of the annual dividends by the aggregate value (or net asset value) at the end of the period. For a fund, the dividend yield is based solely on stock holdings and does not include any income produced by other investments.
Earnings Growth Rate. The average annual rate of growth in earnings over the past five years for the stocks now in a fund.
Equity Exposure. A measure that reflects a fund’s investments in stocks and stock futures. Any holdings in short-term reserves are excluded.
Expense Ratio. A fund’s total annual operating expenses expressed as a percentage of the fund’s average net assets. The expense ratio includes management and administrative expenses, but does not include the transaction costs of buying and selling portfolio securities.
Foreign Holdings. The percentage of a fund represented by securities or depositary receipts of companies based outside the United States.
Inception Date. The date on which the assets of a fund (or one of its share classes) are first invested in accordance with the fund’s investment objective. For funds with a subscription period, the inception date is the day after that period ends. Investment performance is measured from the inception date.
Median Market Cap. An indicator of the size of companies in which a fund invests; the midpoint of market capitalization (market price x shares outstanding) of a fund’s stocks, weighted by the proportion of the fund’s assets invested in each stock. Stocks representing half of the fund’s assets have market capitalizations above the median, and the rest are below it.
Price/Book Ratio. The share price of a stock divided by its net worth, or book value, per share. For a fund, the weighted average price/book ratio of the stocks it holds.
Price/Earnings Ratio. The ratio of a stock’s current price to its per-share earnings over the past year. For a fund, the weighted average P/E of the stocks it holds. P/E is an indicator of market expectations about corporate prospects; the higher the P/E, the greater the expectations for a company’s future growth.
R-Squared. A measure of how much of a fund’s past returns can be explained by the returns from the market in general, as measured by a given index. If a fund’s total returns were precisely synchronized with an index’s returns, its R-squared would be 1.00. If the fund’s returns bore no relationship to the index’s returns, its R-squared would be 0. For this report, R-squared is based on returns over the past 36 months for both the fund and the index.
25
Return on Equity. The annual average rate of return generated by a company during the past five years for each dollar of shareholder’s equity (net income divided by shareholder’s equity). For a fund, the weighted average return on equity for the companies whose stocks it holds.
Short-Term Reserves. The percentage of a fund invested in highly liquid, short-term securities that can be readily converted to cash.
Turnover Rate. An indication of the fund’s trading activity. Funds with high turnover rates incur higher transaction costs and may be more likely to distribute capital gains (which may be taxable to investors). The turnover rate excludes in-kind transactions, which have minimal impact on costs.
26
This page intentionally left blank.
The People Who Govern Your Fund
The trustees of your mutual fund are there to see that the fund is operated and managed in your best interests since, as a shareholder, you are a part owner of the fund. Your fund’s trustees also serve on the board of directors of The Vanguard Group, Inc., which is owned by the Vanguard funds and provides services to them on an at-cost basis.
A majority of Vanguard’s board members are independent, meaning that they have no affiliation with Vanguard or the funds they oversee, apart from the sizable personal investments they have made as private individuals. The independent board members have distinguished backgrounds in business, academia, and public service. Each of the trustees and executive officers oversees 198 Vanguard funds.
The following table provides information for each trustee and executive officer of the fund. More information about the trustees is in the Statement of Additional Information, which can be obtained, without charge, by contacting Vanguard at 800-662-7447, or online at vanguard.com.
| |
| InterestedTrustee1 | Rajiv L. Gupta |
| | Born 1945. Trustee Since December 2001.2 Principal |
| F. William McNabb III | Occupation(s) During the Past Five Years and Other |
| Born 1957. Trustee Since July 2009. Chairman of | Experience: Chairman and Chief Executive Officer |
| the Board. Principal Occupation(s) During the Past | (retired 2009) and President (2006–2008) of |
| Five Years and Other Experience: Chairman of the | Rohm and Haas Co. (chemicals); Director of Tyco |
| Board of The Vanguard Group, Inc., and of each of | International plc (diversified manufacturing and |
| the investment companies served by The Vanguard | services), HP Inc. (printer and personal computer |
| Group, since January 2010; Director of The Vanguard | manufacturing), and Delphi Automotive plc |
| Group since 2008; Chief Executive Officer and | (automotive components); Senior Advisor at |
| President of The Vanguard Group, and of each of | New Mountain Capital. |
| the investment companies served by The Vanguard | |
| Group, since 2008; Director of Vanguard Marketing | Amy Gutmann |
| Corporation; Managing Director of The Vanguard | Born 1949. Trustee Since June 2006. Principal |
| Group (1995–2008). | Occupation(s) During the Past Five Years and |
| | Other Experience: President of the University of |
| IndependentTrustees | Pennsylvania; Christopher H. Browne Distinguished |
| | Professor of Political Science, School of Arts and |
| Emerson U. Fullwood | Sciences, and Professor of Communication, Annenberg |
| Born 1948. Trustee Since January 2008. Principal | School for Communication, with secondary faculty |
| Occupation(s) During the Past Five Years and Other | appointments in the Department of Philosophy, School |
| Experience: Executive Chief Staff and Marketing | of Arts and Sciences, and at the Graduate School of |
| Officer for North America and Corporate Vice President | Education, University of Pennsylvania; Trustee of the |
| (retired 2008) of Xerox Corporation (document manage- | National Constitution Center; Chair of the Presidential |
| ment products and services); Executive in Residence | Commission for the Study of Bioethical Issues. |
| and 2009–2010 Distinguished Minett Professor at | |
| the Rochester Institute of Technology; Lead Director | JoAnn Heffernan Heisen |
| of SPX FLOW, Inc. (multi-industry manufacturing); | Born 1950. Trustee Since July 1998. Principal |
| Director of the United Way of Rochester, the University | Occupation(s) During the Past Five Years and |
| of Rochester Medical Center, Monroe Community | Other Experience: Corporate Vice President and |
| College Foundation, North Carolina A&T University, | Chief Global Diversity Officer (retired 2008) and |
| and Roberts Wesleyan College. | Member of the Executive Committee (1997–2008) |
| | of Johnson & Johnson (pharmaceuticals/medical |
| | devices/consumer products); Director of Skytop |
| | Lodge Corporation (hotels) and the Robert Wood |
| | Johnson Foundation; Member of the Advisory |
| | Board of the Institute for Women’s Leadership |
| | at Rutgers University. |
| | |
| F. Joseph Loughrey | Executive Officers | |
| Born 1949. Trustee Since October 2009. Principal | | |
| Occupation(s) During the Past Five Years and Other | Glenn Booraem | |
| Experience: President and Chief Operating Officer | Born 1967. Treasurer Since May 2015. Principal |
| (retired 2009) of Cummins Inc. (industrial machinery); | Occupation(s) During the Past Five Years and |
| Chairman of the Board of Hillenbrand, Inc. (specialized | Other Experience: Principal of The Vanguard Group, |
| consumer services), and of Oxfam America; Director | Inc.; Treasurer of each of the investment companies |
| of SKF AB (industrial machinery), Hyster-Yale Materials | served by The Vanguard Group; Controller of each of |
| Handling, Inc. (forklift trucks), the Lumina Foundation | the investment companies served by The Vanguard |
| for Education, and the V Foundation for Cancer | Group (2010–2015); Assistant Controller of each of |
| Research; Member of the Advisory Council for the | the investment companies served by The Vanguard |
| College of Arts and Letters and of the Advisory Board | Group (2001–2010). | |
| to the Kellogg Institute for International Studies, both | | |
| at the University of Notre Dame. | Thomas J. Higgins | |
| Born 1957. Chief Financial Officer Since September |
| Mark Loughridge | 2008. Principal Occupation(s) During the Past Five |
| Born 1953. Trustee Since March 2012. Principal | Years and Other Experience: Principal of The Vanguard |
| Occupation(s) During the Past Five Years and Other | Group, Inc.; Chief Financial Officer of each of the |
| Experience: Senior Vice President and Chief Financial | investment companies served by The Vanguard Group; |
| Officer (retired 2013) at IBM (information technology | Treasurer of each of the investment companies served |
| services); Fiduciary Member of IBM’s Retirement Plan | by The Vanguard Group (1998–2008). |
| Committee (2004–2013); Director of the Dow Chemical | | |
| Company; Member of the Council on Chicago Booth. | Peter Mahoney | |
| Born 1974. Controller Since May 2015. Principal |
| Scott C. Malpass | Occupation(s) During the Past Five Years and |
| Born 1962. Trustee Since March 2012. Principal | Other Experience: Head of Global Fund Accounting |
| Occupation(s) During the Past Five Years and Other | at The Vanguard Group, Inc.; Controller of each of the |
| Experience: Chief Investment Officer and Vice | investment companies served by The Vanguard Group; |
| President at the University of Notre Dame; Assistant | Head of International Fund Services at The Vanguard |
| Professor of Finance at the Mendoza College of | Group (2008–2014). | |
| Business at Notre Dame; Member of the Notre Dame | | |
| 403(b) Investment Committee, the Board of Advisors | Heidi Stam | |
| for Spruceview Capital Partners, and the Investment | Born 1956. Secretary Since July 2005. Principal |
| Advisory Committee of Major League Baseball; Board | Occupation(s) During the Past Five Years and Other |
| Member of TIFF Advisory Services, Inc., and Catholic | Experience: Managing Director of The Vanguard |
| Investment Services, Inc. (investment advisors). | Group, Inc.; General Counsel of The Vanguard Group; |
| Secretary of The Vanguard Group and of each of the |
| André F. Perold | investment companies served by The Vanguard Group; |
| Born 1952. Trustee Since December 2004. Principal | Director and Senior Vice President of Vanguard |
| Occupation(s) During the Past Five Years and Other | Marketing Corporation. | |
| Experience: George Gund Professor of Finance and | | |
| Banking, Emeritus at the Harvard Business School | Vanguard Senior ManagementTeam |
| (retired 2011); Chief Investment Officer and Managing | Mortimer J. Buckley | James M. Norris |
| Partner of HighVista Strategies LLC (private investment | Kathleen C. Gubanich | Thomas M. Rampulla |
| firm); Director of Rand Merchant Bank; Overseer of | Martha G. King | Glenn W. Reed |
| the Museum of Fine Arts Boston. | John T. Marcante | Karin A. Risi |
| Chris D. McIsaac | Michael Rollings |
| Peter F. Volanakis | | |
| Born 1955. Trustee Since July 2009. Principal | | |
| Occupation(s) During the Past Five Years and | Chairman Emeritus and Senior Advisor |
| Other Experience: President and Chief Operating | | |
| Officer (retired 2010) of Corning Incorporated | John J. Brennan | |
| (communications equipment); Chairman of the | Chairman, 1996–2009 | |
| Board of Trustees of Colby-Sawyer College; | Chief Executive Officer and President, 1996–2008 |
| Member of the Advisory Board of the Norris | | |
| Cotton Cancer Center. | Founder | |
| | John C. Bogle | |
| | Chairman and Chief Executive Officer, 1974–1996 |
1 Mr. McNabb is considered an “interested person,” as defined in the Investment Company Act of 1940, because he is an officer of the Vanguard funds.
2 December 2002 for Vanguard Equity Income Fund, the Vanguard Municipal Bond Funds, and the Vanguard State Tax-Exempt Funds.
|  |
| | P.O. Box 2600 |
| | Valley Forge, PA 19482-2600 |
| |
| |
| |
| Connect with Vanguard® > vanguard.com |
| |
| |
| |
| Fund Information > 800-662-7447 | |
| Direct Investor Account Services > 800-662-2739 | |
| Institutional Investor Services > 800-523-1036 | |
| Text Telephone for People | |
| Who Are Deaf or Hard of Hearing> 800-749-7273 | |
| |
| This material may be used in conjunction | |
| with the offering of shares of any Vanguard | |
| fund only if preceded or accompanied by | |
| the fund’s current prospectus. | |
| |
| All comparative mutual fund data are from Lipper, a | |
| Thomson Reuters Company, or Morningstar, Inc., unless | |
| otherwise noted. | |
| |
| You can obtain a free copy of Vanguard’s proxy voting | |
| guidelines by visiting vanguard.com/proxyreporting or by | |
| calling Vanguard at 800-662-2739. The guidelines are | |
| also available from the SEC’s website, sec.gov. In | |
| addition, you may obtain a free report on how your fund | |
| voted the proxies for securities it owned during the 12 | |
| months ended June 30. To get the report, visit either | |
| vanguard.com/proxyreporting or sec.gov. | |
| |
| You can review and copy information about your fund at | |
| the SEC’s Public Reference Room in Washington, D.C. To | |
| find out more about this public service, call the SEC at | |
| 202-551-8090. Information about your fund is also | |
| available on the SEC’s website, and you can receive | |
| copies of this information, for a fee, by sending a | |
| request in either of two ways: via email addressed to | |
| publicinfo@sec.gov or via regular mail addressed to the | |
| Public Reference Section, Securities and Exchange | |
| Commission, Washington, DC 20549-1520. | |
| |
| | © 2016 The Vanguard Group, Inc. |
| | All rights reserved. |
| | Vanguard Marketing Corporation, Distributor. |
| |
| | Q532 092016 |

Semiannual Report | July 31, 2016
Vanguard Health Care Fund
Vanguard’s Principles for Investing Success
We want to give you the best chance of investment success. These principles, grounded in Vanguard’s research and experience, can put you on the right path.
Goals. Create clear, appropriate investment goals.
Balance. Develop a suitable asset allocation using broadly diversified funds. Cost. Minimize cost.
Discipline. Maintain perspective and long-term discipline.
A single theme unites these principles: Focus on the things you can control.
We believe there is no wiser course for any investor.
| |
| Contents | |
| Your Fund’s Total Returns. | 1 |
| Chairman’s Letter. | 2 |
| Advisor’s Report. | 7 |
| Fund Profile. | 11 |
| Performance Summary. | 12 |
| Financial Statements. | 13 |
| About Your Fund’s Expenses. | 26 |
| Trustees Approve Advisory Arrangement. | 28 |
| Glossary. | 29 |
Please note: The opinions expressed in this report are just that—informed opinions. They should not be considered promises or advice.
Also, please keep in mind that the information and opinions cover the period through the date on the front of this report. Of course, the
risks of investing in your fund are spelled out in the prospectus.
See the Glossary for definitions of investment terms used in this report.
About the cover: Pictured is a sailing block on the Brilliant, a 1932 schooner docked in Mystic, Connecticut. A type of pulley, the
sailing block helps coordinate the setting of the sails. At Vanguard, the intricate coordination of technology and people allows
us to help millions of clients around the world reach their financial goals.
Your Fund’s Total Returns
| |
| Six Months Ended July 31, 2016 | |
| | Total |
| | Returns |
| Vanguard Health Care Fund | |
| Investor Shares | 11.00% |
| Admiral™ Shares | 11.03 |
| MSCI All Country World Health Care Index | 11.60 |
| Global Health/Biotechnology Funds Average | 10.37 |
| Global Health/Biotechnology Funds Average: Derived from data provided by Lipper, a Thomson Reuters Company. |
| Admiral Shares carry lower expenses and are available to investors who meet certain account-balance requirements. |
| | | | |
| Your Fund’s Performance at a Glance | | | | |
| January 31, 2016, Through July 31, 2016 | | | | |
| | | | Distributions Per Share |
| | Starting | Ending | Income | Capital |
| | Share Price | Share Price | Dividends | Gains |
| Vanguard Health Care Fund | | | | |
| Investor Shares | $200.67 | $217.28 | $0.000 | $4.857 |
| Admiral Shares | 84.64 | 91.67 | 0.000 | 2.049 |
1

Chairman’s Letter
Dear Shareholder,
Health care stocks rebounded strongly over the six months ended July 31, 2016, but didn’t keep pace with the broad U.S. market’s even sharper rally. Vanguard Health Care Fund returned 11.00% for Investor Shares, slightly behind its benchmark, the MSCI All Country World Health Care Index, but a bit ahead of the average return of its peers.
Health care stocks had retreated over the fiscal year ended January 31, with most of the downturn coming in its second half. In the most recent six months, health care stocks were strong across the board.
All groups in the sector produced gains, ranging from solid to sizable. The Health Care Fund’s advisor was most successful with its holdings among providers, equipment firms, and biotechnology companies, while its pharmaceutical holdings lagged those in the benchmark.
U.S. stocks continued to surge despite signs of uncertainty
U.S. stocks proved resilient over the half year, returning about 14%, although the global environment was far from tranquil.
Stocks tumbled after the momentous June 23 decision by U.K. voters to leave the European Union. But the market quickly recovered. Worries about the effects of “Brexit” on trade and economic growth seemed to diminish as expectations rose that major central banks would be responsive to any fallout.
2
International stocks also performed well, returning nearly 12%. European stocks finished solidly but still lagged as the Brexit referendum hit close to home. Emergingmarket stocks and those from developed Pacific markets recorded doubledigit returns.
Bonds drew support given economic factors and low yields
The broad U.S. bond market advanced in each of the six months en route to returning 4.54%. With the stock market volatile at times and the global growth pace uncertain, investors sought safehaven assets. Foreign investors flocked to U.S. Treasury debt amid exceptionally low or negative yields abroad.
The yield of the 10year Treasury note closed July at 1.45%, down from 1.98% at the end of January. (Bond prices and yields move in opposite directions.)
The Federal Reserve has held its target for shortterm interest rates at 0.25%–0.5% since raising it by a quarter percentage point last December. Money market funds and savings accounts stayed restrained by these historically low rates.
International bond markets (as measured by the Barclays Global Aggregate Index ex USD) returned 12.31%. A number of foreign currencies strengthened against the dollar, but the bond returns were robust even without this currency benefit.
| | | |
| Market Barometer | | | |
| |
| | Total Returns |
| | Periods Ended July 31, 2016 |
| | Six | One | Five Years |
| | Months | Year | (Annualized) |
| Stocks | | | |
| Russell 1000 Index (Large-caps) | 13.82% | 4.84% | 13.22% |
| Russell 2000 Index (Small-caps) | 18.76 | 0.00 | 10.43 |
| Russell 3000 Index (Broad U.S. market) | 14.18 | 4.44 | 12.99 |
| FTSE All-World ex US Index (International) | 11.69 | -4.95 | 1.76 |
| |
| Bonds | | | |
| Barclays U.S. Aggregate Bond Index (Broad taxable market) | 4.54% | 5.94% | 3.57% |
| Barclays Municipal Bond Index (Broad tax-exempt market) | 3.16 | 6.94 | 5.13 |
| Citigroup Three-Month U.S. Treasury Bill Index | 0.12 | 0.16 | 0.05 |
| |
| CPI | | | |
| Consumer Price Index | 1.57% | 0.84% | 1.27% |
3
Gains across subsectors buoyed the fund’s performance
Vanguard Health Care Fund’s outcome over the six months marked a welcome change from the preceding fiscal year, when the fund returned less than 1% after four straight years of doubledigit returns. The possibility of increased government regulation of pharmaceutical and biotechnology companies and the high valuations of biotech stocks troubled the sector during that period.
Longterm trends, though, have continued to favor the health care market, which has been boosted by greater consumption across the United States and the globe and by product and service innovations. Health care has become more accessible worldwide, and the aging population requires more care. Also, with health insurance mandated in the United States by the Affordable Care Act and expanded coverage options available, more people are seeking treatment.
Wellington Management Company, the fund’s advisor, has been effective over the years in enhancing its performance beyond the sector’s overall strength. The advisor has a significant allocation to largecapitalization companies for their stability and reliability, and it manages the fund with a valueoriented approach. Over the half year, largecap stocks trailed smallcaps, though Wellington’s stocks generally held their own against the benchmark overall.
| | | |
| Expense Ratios | | | |
| Your Fund Compared With Its Peer Group | | | |
| | Investor | Admiral | Peer Group |
| | Shares | Shares | Average |
| Health Care Fund | 0.36% | 0.31% | 1.32% |
The fund expense ratios shown are from the prospectus dated May 25, 2016, and represent estimated costs for the current fiscal year. For the
six months ended July 31, 2016, the fund’s annualized expense ratios were 0.37% for Investor Shares and 0.32% for Admiral Shares. The
peer-group expense ratio is derived from data provided by Lipper, a Thomson Reuters Company, and captures information through year-end
2015.
Peer group: Global Health/Biotechnology Funds.
4
In many reporting periods, Wellington’s pharmaceutical holdings have helped the fund outpace its benchmark, but that was not the case this time. Its pharmaceutical stocks, which averaged about 45% of fund assets during the period, rose about 7%, compared with about 9% for those in the benchmark.
Most of the relative shortfall was due to the fund’s minimal or zero exposure during the six months to some of the industry’s leading firms. Similarly, the fund’s health care technology and life sciences stocks climbed, but not as high as those of the benchmark.
These differences were largely offset by Wellington’s superior holdings among providers, equipment firms, and biotech companies. The fund’s equipment firms climbed about 25% and its health care distributors nearly 16%. Biotech companies bounced back as their growth prospects improved.
Of course, six months isn’t nearly enough time to measure longterm success, especially for a sector fund that tends to be much more volatile than the broader stock market. We believe that the Health Care Fund is best suited for helping to diversify a portfolio and for investors who can tolerate the fund’s inevitable highs and lows.
Consider rebalancing to manage your risk
After you’ve taken the time to carefully create an investment portfolio—with a diversified mix of stock, bond, and money market funds tailored to your goals, time horizon, and risk tolerance—what next?
As stocks and bonds rise or fall over time, and your portfolio drifts from its original asset allocation, you should consider rebalancing back to your targets.
Just one year of outsized returns can throw your allocation out of whack. Take, for example, a year like 2013, when the broad stock market returned nearly 34% and the broad taxable bond market declined. A hypothetical simple portfolio that started the year with 60% stocks and 40% bonds would have ended with a more aggressive mix of 67% stocks and 33% bonds.
Rebalancing means shifting dollars from assets that have performed well toward those that have fallen behind. That isn’t easy or intuitive—but it helps to manage
5
risk, because over time, riskier assets tend to grow faster. (You can read more about our approach in Best Practices for Portfolio Rebalancing, at vanguard.com/research.)
You might consider, for example, monitoring your portfolio annually or semiannually and rebalancing when your allocations shift about 5 percentage points from their targets.
It’s important, of course, to be aware of the tax implications. You’ll want to consult with your tax advisor, but generally speaking, it may be a good idea to make any asset changes within a taxadvantaged retirement account, or to direct new cash flows into the underweighted asset class.
However you go about it, keeping your asset allocation from drifting too far off target can help you stay on track with the investment plan you’ve crafted to meet your financial goals.
As always, thank you for investing with Vanguard.
Sincerely,

F. William McNabb III
Chairman and Chief Executive Officer
August 10, 2016
6
Advisor’s Report
For the six months ended July 31, 2016, Vanguard Health Care Fund returned 11.00% for Investor Shares and 11.03% for Admiral Shares. It lagged the 11.60% return of its benchmark, the MSCI All Country World Health Care Index, but surpassed the 10.37% average return of global health/biotechnology funds.
The investment environment
We view the health care sector through a custom lens of subsectors. We combine biotechnology and pharmaceuticals and think of them in terms of capitalization: biopharma smallcap, biopharma midcap, and biopharma largecap. The other subsectors are health care services and medical technology.
Over the six months, medical technology was the top performer for the benchmark. Health care services stocks were secondbest, while biopharma stocks across all market capitalizations underperformed.
Biopharmaceutical stocks, which have been particularly strong in recent years, were hit hard during the period by a combination of negative sentiment and, in a handful of instances, disappointing clinical trial results, but they partly recovered toward the end of the period. A backlash over high drug prices took a toll on the sector, particularly on smallcap biotech companies, where, in several cases, more than 12 months’ worth of gains were wiped out.
| |
| Major Portfolio Changes | |
| Six Months Ended July 31, 2016 | |
| |
| Additions | Comments |
| Allergan | Allergan remains a unique largecap biopharmaceutical player |
| | because of its differentiated, cashpay product portfolio. This stock |
| | significantly underperformed after its merger deal with Pfizer ended. |
| | We liked the idea of a combined new company, but we have owned |
| | Allergan since well before the deal announcement and think it |
| | remains extremely attractive on a standalone basis. |
| Regeneron Pharmaceuticals | We increased our stake in this U.S.based biopharmaceutical |
| | company when the share price declined because of the outcome |
| | of a lawsuit between Regeneron and Amgen. Regeneron has |
| | multiple avenues for success going forward, with a blockbuster |
| | drug treatment on the market for macular degeneration, as well as |
| | potential success with its antiPCSK9 drug for high cholesterol and |
| | its new atopic dermatitis drug, dupilumab. |
| |
| Reductions | Comments |
| CVS Health | We eliminated CVS Health from the fund at what we believe was |
| | a fair valuation. |
| Pfizer | We eliminated our position amid the stock’s strong performance in |
| | early April after the potential Pfizer/Allergan merger was terminated. |
7
This has been exacerbated by electionyear rhetoric, which has fueled volatility and negative money flows. Largecap biopharmaceutical companies were not immune to the unfavorable headlines, with the majority experiencing significant declines in the first quarter of 2016 and a relatively weak half year overall.
Our successes
Strong stock selection within the midcap biopharmaceutical and medical technology subsectors aided relative performance. By region, our underweighting of developed European markets outside the United Kingdom also helped.
Among midcap biopharmaceutical holdings, our position in Incyte stood out, returning about 29% for the period as the company posted solid firstquarter results and announced the acquisition of ARIAD’s European business. The fund’s relative results in the subsector were further driven by our decision to avoid certain stocks, including Valeant Pharmaceuticals, Perrigo, and Endo International.
In medical technology, our large position in Boston Scientific performed well. The company’s shares surged after it reported strong organic growth across its portfolio and a longterm path to increased operating leverage. In addition, our holdings in St. Jude Medical and Baxter International were relative contributors in the subsector. After spinning out its biopharmaceutical business, Baxter International’s management is focused on margin expansion, while St. Jude Medical rose on the announcement of its acquisition by Abbott Laboratories.
Managedcare leader UnitedHealth Group and biopharma largecap BristolMyers Squibb also performed well, aiding the fund’s relative performance. We believe that UnitedHealth Group is exceptionally wellpositioned to add market share in its core benefits business, and its Optum division is driving strong growth and margin expansion. UnitedHealth remains one of the fund’s largest positions. Growing enthusiasm for BristolMyers Squibb’s immunooncology combination—Opdivo and Yervoy—in firstline lung cancer treatment led the stock to outperform for the period.
Our shortfalls
Our stock selection was weaker in the largecap biopharmaceutical and health care services subsectors. The portfolio’s approximately 3% cash position in a relatively strong market environment for health care stocks also dragged on relative performance.
Among largecap biopharmaceutical companies, our positions in Allergan and Mylan hurt relative results the most, along with our avoidance of Johnson & Johnson, which performed strongly. Allergan’s stock declined after its merger deal with Pfizer was called off following the U.S. Treasury’s issuance of new limits on corporate tax inversions. Despite the deal’s unraveling, our view of Allergan’s standalone pipeline
8
and growth prospects remains positive, and we still hold a position. Mylan performed poorly given overall weakness among generic pharmaceutical companies.
In health care services, our positions in Cigna, Walgreens Boots Alliance, and athenahealth were relative detractors.
The fund’s positioning
We currently hold about 20% of the fund’s assets in nonU.S. investments, a level that has remained fairly stable over recent years. Our nonU.S. holdings are primarily domiciled in Japan, the United Kingdom, Switzerland, Belgium, Israel, and Denmark, but many of our holdings operate globally. We believe this strategy provides diversification for the fund’s shareholders over the long term.
The portfolio is distributed among 70 companies across all subsectors of health care; that figure is lower than a year ago as we consolidated our positioning during a time of intense volatility. At the period’s close, the fund’s ten largest holdings constituted a significant portion—approximately 44%—of its assets. We expect turnover to remain quite low. The fund’s 18% 12month turnover as of the end of July is within our normal range, although it may increase modestly when opportunities arise.
We remain enthusiastic about the longerterm fundamental outlook for health care stocks. We believe that innovation in biopharma is greater than at any other period we have witnessed. In addition, the industry is benefiting from the aging population of developed countries as well as the rising wealth of emergingmarket economies. Given our longer time horizon, we will use periods of market volatility to take advantage of longerterm themes, while remaining mindful of shorterterm risks.
In biopharmaceuticals, the largest part of our investment universe, we anticipate a future in which payers globally will rapidly adopt biosimilar products and will increasingly pressure undifferentiated products or drug classes that do not offer economic value, in order to fund and reward the highly innovative and novel treatments that serve society’s unmet needs. In fact, with innovation exploding, biopharmaceuticals could represent a larger share of the health care pie over the next decade.
We have focused on companies dedicated to discovering and delivering highly innovative new drug categories, such as immunooncology, which is changing the treatment of cancer; Alzheimer’s disease, which is ripe for meaningful advancement; and orphan diseases, which are becoming more manageable with novel delivery platforms, one example being ribonucleic acid (RNA) interference.
In health care services and medical technology, we remain focused on companies that will benefit from and/or
9
facilitate the transition to a valuebased health care system, initially in the United States but eventually worldwide.
In addition, the growing cost burden of, and likely significant changes to, health care systems globally will lead to a greater divergence between “winners” and “losers.” A health care world more focused on value and innovation will raise the bar for biopharmaceutical and medical technology companies. We believe this will create a particularly attractive environment for dedicated investors in the sector.
As always, a core tenet of our philosophy is the importance of using a longer time horizon to evaluate secular themes and trends, as well as individual companies,
on a global scale. This should enable our team to identify pockets of opportunity in health care that are best positioned to generate sustainable, innovationdriven, differentiated growth and value creation. We will remain diversified across subsectors and regions, focused on the long haul, and positioned in what we believe to be the most attractive stocks, as we seek to generate strong riskadjusted returns for shareholders.
Jean M. Hynes, CFA
Senior Managing Director and
Portfolio Manager
Wellington Management Company llp
August 16, 2016
10
Health Care Fund
Fund Profile
As of July 31, 2016
| | |
| Share-Class Characteristics | |
| | Investor | Admiral |
| | Shares | Shares |
| Ticker Symbol | VGHCX | VGHAX |
| Expense Ratio1 | 0.36% | 0.31% |
| 30-Day SEC Yield | 0.93% | 0.98% |
| | | |
| Portfolio Characteristics | | |
| | | | DJ |
| | | | U.S. |
| | | MSCI | Total |
| | | ACWI | Market |
| | | Health | FA |
| | Fund | Care | Index |
| Number of Stocks | 71 | 168 | 3,839 |
| Median Market Cap | $44.7B | $91.5B | $54.0B |
| Price/Earnings Ratio | 33.0x | 24.8x | 23.5x |
| Price/Book Ratio | 3.8x | 3.8x | 2.8x |
| Return on Equity | 12.8% | 18.9% | 16.3% |
| Earnings Growth | | | |
| Rate | 5.2% | 9.0% | 7.3% |
| Dividend Yield | 1.3% | 1.9% | 2.0% |
| Foreign Holdings | 20.2% | 39.8% | 0.0% |
| Turnover Rate | | | |
| (Annualized) | 11% | — | — |
| Short-Term Reserves | 3.1% | — | — |
| | |
| Subindustry Diversification (% of equity exposure) | |
| | |
| | | MSCI |
| | | ACWI |
| | | Health |
| | Fund | Care |
| Biotechnology | 15.8% | 17.1% |
| Consumer Staples | 1.3 | 0.0 |
| Health Care Distributors | 3.9 | 2.7 |
| Health Care Equipment | 11.3 | 13.0 |
| Health Care Facilities | 3.2 | 1.6 |
| Health Care Services | 0.9 | 3.5 |
| Health Care Supplies | 0.2 | 1.7 |
| Health Care Technology | 3.7 | 0.7 |
| Life Sciences Tools & Services | 3.3 | 3.3 |
| Managed Health Care | 11.5 | 6.2 |
| Pharmaceuticals | 44.9 | 50.2 |
| | |
| Volatility Measures | | |
| | MSCI | DJ |
| | ACWI | U.S. Total |
| | Health | Market |
| | Care | FA Index |
| R-Squared | 0.90 | 0.60 |
| Beta | 1.01 | 0.85 |
These measures show the degree and timing of the fund’s
fluctuations compared with the indexes over 36 months.
| | |
| Ten Largest Holdings (% of total net assets) |
| Bristol-Myers Squibb Co. Pharmaceuticals | 6.5% |
| UnitedHealth Group Inc. | Managed Health | |
| | Care | 6.3 |
| Allergan plc | Pharmaceuticals | 5.9 |
| Merck & Co. Inc. | Pharmaceuticals | 5.2 |
| Eli Lilly & Co. | Pharmaceuticals | 4.2 |
| AstraZeneca plc | Pharmaceuticals | 4.2 |
| Medtronic plc | Health Care | |
| | Equipment | 3.2 |
| Incyte Corp. | Biotechnology | 2.9 |
| McKesson Corp. | Health Care | |
| | Distributors | 2.8 |
| Regeneron | | |
| Pharmaceuticals Inc. | Biotechnology | 2.8 |
| Top Ten | | 44.0% |
The holdings listed exclude any temporary cash investments and
equity index products.
| |
| Market Diversification (% of equity exposure) |
| |
| Europe | |
| United Kingdom | 5.1% |
| Switzerland | 4.6 |
| Belgium | 1.8 |
| Other | 0.3 |
| Subtotal | 11.8% |
| Pacific | |
| Japan | 8.4% |
| North America | |
| United States | 79.1% |
| Middle East | 0.7% |
1 The expense ratios shown are from the prospectus dated May 25, 2016, and represent estimated costs for the current fiscal year. For the six
months ended July 31, 2016, the annualized expense ratios were 0.37% for Investor Shares and 0.32% for Admiral Shares.
11
Health Care Fund
Performance Summary
All of the returns in this report represent past performance, which is not a guarantee of future results that may be achieved by the fund. (Current performance may be lower or higher than the performance data cited. For performance data current to the most recent month-end, visit our website at vanguard.com/performance.) Note, too, that both investment returns and principal value can fluctuate widely, so an investor’s shares, when sold, could be worth more or less than their original cost. The returns shown do not reflect taxes that a shareholder would pay on fund distributions or on the sale of fund shares.
Fiscal-Year Total Returns (%): January 31, 2006, Through July 31, 2016
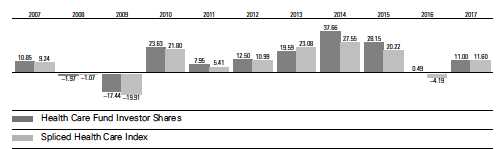
For a benchmark description, see the Glossary.
Note: For 2017, performance data reflect the six months ended July 31, 2016.
Average Annual Total Returns: Periods Ended June 30, 2016
This table presents returns through the latest calendar quarter—rather than through the end of the fiscal period.
Securities and Exchange Commission rules require that we provide this information.
| | | | |
| | Inception | One | Five | Ten |
| | Date | Year | Years | Years |
| Investor Shares | 5/23/1984 | -4.88% | 17.28% | 11.71% |
| Admiral Shares | 11/12/2001 | -4.83 | 17.34 | 11.77 |
See Financial Highlights for dividend and capital gains information.
12
Health Care Fund
Financial Statements (unaudited)
Statement of Net Assets
As of July 31, 2016
The fund reports a complete list of its holdings in regulatory filings four times in each fiscal year, at the quarter-ends. For the second and fourth fiscal quarters, the lists appear in the fund’s semiannual and annual reports to shareholders. For the first and third fiscal quarters, the fund files the lists with the Securities and Exchange Commission on Form N-Q. Shareholders can look up the fund’s Forms N-Q on the SEC’s website at sec.gov. Forms N-Q may also be reviewed and copied at the SEC’s Public Reference Room (see the back cover of this report for further information).
| | | |
| | | | Market |
| | | | Value• |
| | | Shares | ($000) |
| Common Stocks (97.0%) | | |
| United States (76.8%) | | |
| Biotechnology (14.5%) | | |
| *,1 | Incyte Corp. | 16,227,748 | 1,463,905 |
| * | Regeneron | | |
| | Pharmaceuticals Inc. | 3,279,190 | 1,394,049 |
| *,1 | Vertex | | |
| | Pharmaceuticals Inc. | 12,914,741 | 1,252,730 |
| * | Biogen Inc. | 3,842,963 | 1,114,190 |
| | Amgen Inc. | 4,597,355 | 790,883 |
| *,1 | Alnylam | | |
| | Pharmaceuticals Inc. | 8,512,270 | 579,515 |
| *,1 | Alkermes plc | 8,603,676 | 429,324 |
| *,^,1Agios | | |
| | Pharmaceuticals Inc. | 3,348,034 | 151,432 |
| *,1 | Prothena Corp. plc | 2,150,294 | 118,374 |
| * | Ironwood | | |
| | Pharmaceuticals Inc. | | |
| | Class A | 4,522,387 | 63,901 |
| | | | 7,358,303 |
| Food & Staples Retailing (1.3%) | |
| | Walgreens Boots | | |
| | Alliance Inc. | 8,048,160 | 637,817 |
| |
| Health Care Equipment & Supplies (10.5%) |
| | Medtronic plc | 18,747,933 | 1,642,881 |
| * | Boston Scientific Corp. | 52,073,914 | 1,264,355 |
| | St. Jude Medical Inc. | 6,123,679 | 508,510 |
| | Abbott Laboratories | 10,508,900 | 470,273 |
| | Baxter International Inc. | 6,572,480 | 315,610 |
| * | Hologic Inc. | 7,306,800 | 281,239 |
| | Becton Dickinson | | |
| | and Co. | 1,548,936 | 272,613 |
| | Stryker Corp. | 2,235,700 | 259,967 |
| * | Intuitive Surgical Inc. | 275,950 | 191,995 |
| | Dentsply Sirona Inc. | 1,904,590 | 121,970 |
| | | | 5,329,413 |
| Health Care Providers & Services (18.9%) | |
| | UnitedHealth Group Inc. | 22,413,854 | 3,209,664 |
| | McKesson Corp. | 7,165,280 | 1,394,077 |
| | | |
| | Cigna Corp. | 7,533,631 | 971,537 |
| | Aetna Inc. | 8,174,089 | 941,737 |
| * | HCA Holdings Inc. | 11,682,053 | 901,037 |
| | Cardinal Health Inc. | 6,385,231 | 533,805 |
| | Universal Health | | |
| | Services Inc. Class B | 3,939,340 | 510,263 |
| | Anthem Inc. | 3,209,633 | 421,553 |
| *,1 | Envision Healthcare | | |
| | Holdings Inc. | 10,993,895 | 270,340 |
| * | WellCare Health | | |
| | Plans Inc. | 1,189,900 | 127,081 |
| * | Acadia Healthcare | | |
| | Co. Inc. | 2,067,400 | 116,808 |
| * | Team Health | | |
| | Holdings Inc. | 2,445,100 | 99,858 |
| * | MEDNAX Inc. | 805,600 | 55,514 |
| * | LifePoint Health Inc. | 341,100 | 20,186 |
| * | Community Health | | |
| | Systems Inc. CVR | 18,834,700 | 79 |
| | | | 9,573,539 |
| Health Care Technology (3.6%) | |
| *,1 | Cerner Corp. | 16,949,730 | 1,057,494 |
| * | IMS Health Holdings Inc. | 9,956,380 | 298,891 |
| * | athenahealth Inc. | 1,883,780 | 240,728 |
| *,1 | Allscripts Healthcare | | |
| | Solutions Inc. | 11,198,893 | 158,128 |
| *,^ | Inovalon Holdings Inc. | | |
| | Class A | 2,748,060 | 51,169 |
| | | | 1,806,410 |
| Life Sciences Tools & Services (3.1%) | |
| | Thermo Fisher | | |
| | Scientific Inc. | 4,097,300 | 650,815 |
| * | Illumina Inc. | 3,030,566 | 504,135 |
| * | Quintiles Transnational | | |
| | Holdings Inc. | 2,929,638 | 227,457 |
| | Agilent Technologies Inc. | 2,831,150 | 136,207 |
| * | PAREXEL International | | |
| | Corp. | 1,168,440 | 78,110 |
| | | | 1,596,724 |
13
Health Care Fund
| | | |
| | | | Market |
| | | | Value• |
| | | Shares | ($000) |
| Pharmaceuticals (24.9%) | | |
| | Bristol-Myers Squibb Co. | 44,357,397 | 3,318,377 |
| * | Allergan plc | 11,806,839 | 2,986,540 |
| | Merck & Co. Inc. | 44,547,928 | 2,613,181 |
| | Eli Lilly & Co. | 25,959,710 | 2,151,800 |
| *,1 | Mylan NV | 27,965,385 | 1,308,500 |
| *,1 | Medicines Co. | 5,564,220 | 217,617 |
| | | | 12,596,015 |
| Total United States | | 38,898,221 |
| International (20.2%) | | |
| Belgium (1.8%) | | |
| 1 | UCB SA | 11,342,503 | 887,486 |
| |
| Denmark (0.3%) | | |
| * | H Lundbeck A/S | 3,563,634 | 144,860 |
| |
| Israel (0.7%) | | |
| | Teva Pharmaceutical | | |
| | Industries Ltd. ADR | 6,356,700 | 340,084 |
| |
| Japan (8.1%) | | |
| | Eisai Co. Ltd. | 14,110,475 | 825,061 |
| | Shionogi & Co. Ltd. | 15,755,454 | 817,201 |
| | Astellas Pharma Inc. | 38,758,400 | 645,782 |
| | Chugai Pharmaceutical | | |
| | Co. Ltd. | 14,574,200 | 544,659 |
| | Takeda Pharmaceutical | | |
| | Co. Ltd. | 10,005,000 | 445,805 |
| | Ono Pharmaceutical | | |
| | Co. Ltd. | 10,928,200 | 393,064 |
| | Olympus Corp. | 5,944,700 | 205,139 |
| | Daiichi Sankyo Co. Ltd. | 5,318,600 | 126,830 |
| | Kyowa Hakko Kirin | | |
| | Co. Ltd. | 6,291,000 | 109,915 |
| | | | 4,113,456 |
| Switzerland (4.4%) | | |
| | Roche Holding AG | 3,656,951 | 933,503 |
| | Novartis AG | 9,859,218 | 817,755 |
| | Actelion Ltd. | 2,233,722 | 395,663 |
| | Roche Holding AG | | |
| | (Bearer) | 376,066 | 96,806 |
| | | | 2,243,727 |
| United Kingdom (4.9%) | | |
| | AstraZeneca plc | 31,741,453 | 2,125,036 |
| | Hikma | | |
| | Pharmaceuticals plc | 6,461,134 | 224,981 |
| | Smith & Nephew plc | 8,976,157 | 147,650 |
| | | | 2,497,667 |
| Total International | | 10,227,280 |
| Total Common Stocks | | |
| (Cost $29,033,121) | | 49,125,501 |
| | |
| | | Market |
| | | Value• |
| | Shares | ($000) |
| Temporary Cash Investments (3.1%) | |
| Money Market Fund (0.0%) | | |
| 2,3 Vanguard Market | | |
| Liquidity Fund, 0.561% 20,515,600 | 20,516 |
| |
| | Face | |
| | Amount | |
| | ($000) | |
| Repurchase Agreements (0.9%) | |
| Bank of America Securities, | | |
| LLC 0.350%, 8/1/16 (Dated | | |
| 7/29/16, Repurchase Value | | |
| $10,200,000, collateralized | | |
| by Government National | | |
| Mortgage Assn. 4.000%, | | |
| 11/20/45, with a value of | | |
| $10,404,000) | 10,200 | 10,200 |
| Bank of Nova Scotia | | |
| 0.320%, 8/1/16 (Dated | | |
| 7/29/16, Repurchase Value | | |
| $20,301,000, collateralized | | |
| by U.S. Treasury Note/Bond | | |
| 0.875%–1.625%, 7/15/18– | | |
| 8/31/19, with a value of | | |
| $20,707,000) | 20,300 | 20,300 |
| Barclays Capital Inc. | | |
| 0.320%, 8/1/16 (Dated | | |
| 7/29/16, Repurchase Value | | |
| $65,902,000, collateralized | | |
| by U.S. Treasury Note/Bond | | |
| 2.000%–2.500%, 11/30/20– | | |
| 5/15/46, with a value of | | |
| $67,218,000) | 65,900 | 65,900 |
| BNP Paribas Securities | | |
| Corp. 0.350%, 8/1/16 | | |
| (Dated 7/29/16, Repurchase | | |
| Value $24,001,000, | | |
| collateralized by Federal | | |
| Home Loan Mortgage | | |
| Corp. 2.394%–3.000%, | | |
| 2/1/29–10/1/43, Federal | | |
| National Mortgage Assn. | | |
| 2.218%–3.742%, 7/1/34– | | |
| 5/1/46, and Government | | |
| National Mortgage Assn. | | |
| 2.750%–4.000%, 4/20/40– | | |
| 1/20/46, with a value of | | |
| $24,480,000) | 24,000 | 24,000 |
14
Health Care Fund
| | | |
| | | Face | Market |
| | | Amount | Value• |
| | | ($000) | ($000) |
| | HSBC Bank USA | | |
| | 0.320%, 8/1/16 (Dated | | |
| | 7/29/16, Repurchase | | |
| | Value $119,703,000, | | |
| | collateralized by Federal | | |
| | National Mortgage Assn. | | |
| | 3.500%–5.000%, 8/1/38– | | |
| | 3/1/46, with a value | | |
| | of $122,101,000) | 119,700 | 119,700 |
| | RBC Capital Markets LLC | | |
| | 0.320%, 8/1/16 (Dated | | |
| | 7/29/16, Repurchase Value | | |
| | $1,600,000, collateralized | | |
| | by Federal National | | |
| | Mortgage Assn. 3.000%– | | |
| | 3.500%, 3/1/46–7/1/46, | | |
| | with a value of $1,632,000) | 1,600 | 1,600 |
| | Wells Fargo & Co. | | |
| | 0.360%, 8/1/16 (Dated | | |
| | 7/29/16, Repurchase Value | | |
| | $228,807,000, collateralized | | |
| | by Federal Home Loan | | |
| | Mortgage Corp. 3.000%, | | |
| | 3/1/43, and Federal National | |
| | Mortgage Assn. 3.000%, | | |
| | 11/1/42, with a value of | | |
| | $233,376,000) | 228,800 | 228,800 |
| | | | 470,500 |
| U.S. Government and Agency Obligations (2.0%) |
| 4 | Federal Home Loan | | |
| | Bank Discount Notes, | | |
| | 0.410%, 8/8/16 | 100,000 | 99,995 |
| 4 | Federal Home Loan | | |
| | Bank Discount Notes, | | |
| | 0.365%, 8/17/16 | 200,000 | 199,976 |
| 4 | Federal Home Loan | | |
| | Bank Discount Notes, | | |
| | 0.390%, 9/7/16 | 50,000 | 49,984 |
| 4 | Federal Home Loan | | |
| | Bank Discount Notes, | | |
| | 0.405%, 9/14/16 | 150,000 | 149,946 |
| 4 | Federal Home Loan | | |
| | Bank Discount Notes, | | |
| | 0.340%, 9/22/16 | 100,000 | 99,957 |
| 4 | Federal Home Loan | | |
| | Bank Discount Notes, | | |
| | 0.340%, 9/29/16 | 100,000 | 99,951 |
| 4 | Federal Home Loan | | |
| | Bank Discount Notes, | | |
| | 0.350%, 10/17/16 | 150,000 | 149,886 |
| 4 | Federal Home Loan | | |
| | Bank Discount Notes, | | |
| | 0.370%, 10/21/16 | 150,000 | 149,880 |
| | | | 999,575 |
| | |
| | Face | Market |
| | Amount | Value• |
| | ($000) | ($000) |
| Commercial Paper (0.2%) | | |
| GE Capital Treasury | | |
| Services US LLC, | | |
| 0.430%, 8/1/16 | 50,000 | 49,999 |
| GE Capital Treasury | | |
| Services US LLC, | | |
| 0.410%, 9/6/16 | 50,000 | 49,969 |
| | | 99,968 |
| Total Temporary Cash Investments | |
| (Cost $1,590,518) | | 1,590,559 |
| Total Investments (100.1%) | | |
| (Cost $30,623,639) | | 50,716,060 |
| Other Assets and Liabilities (-0.1%) | |
| Other Assets | | 131,101 |
| Liabilities 3 | | (182,554) |
| | | (51,453) |
| Net Assets (100%) | | 50,664,607 |
| |
| | | Amount |
| | | ($000) |
| Statement of Assets and Liabilities | |
| Assets | | |
| Investments in Securities, at Value | |
| Unaffiliated Issuers | | 42,800,699 |
| Affiliated Vanguard Funds | | 20,516 |
| Other Affiliated Issuers | | 7,894,845 |
| Total Investments in Securities | | 50,716,060 |
| Investment in Vanguard | | 3,915 |
| Receivables for Investment | | |
| Securities Sold | | 24,243 |
| Receivables for Accrued Income | | 93,375 |
| Receivables for Capital Shares Issued | 8,493 |
| Other Assets | | 1,075 |
| Total Assets | | 50,847,161 |
| Liabilities | | |
| Payables for Investment | | |
| Securities Purchased | | 43,605 |
| Collateral for Securities on Loan | | 20,516 |
| Payables to Investment Advisor | | 21,709 |
| Payables for Capital Shares Redeemed | 23,828 |
| Payables to Vanguard | | 51,816 |
| Other Liabilities | | 21,080 |
| Total Liabilities | | 182,554 |
| Net Assets | | 50,664,607 |
15
Health Care Fund
| |
| At July 31, 2016, net assets consisted of: |
| | Amount |
| | ($000) |
| Paid-in Capital | 29,332,897 |
| Undistributed Net Investment Income | 168,267 |
| Accumulated Net Realized Gains | 1,072,186 |
| Unrealized Appreciation (Depreciation) | |
| Investment Securities | 20,092,421 |
| Foreign Currencies | (1,164) |
| Net Assets | 50,664,607 |
| |
| |
| Investor Shares—Net Assets | |
| Applicable to 52,941,064 outstanding | |
| $.001 par value shares of beneficial | |
| interest (unlimited authorization) | 11,502,826 |
| Net Asset Value Per Share— | |
| Investor Shares | $217.28 |
| |
| |
| Admiral Shares—Net Assets | |
| Applicable to 427,201,396 outstanding | |
| $.001 par value shares of beneficial | |
| interest (unlimited authorization) | 39,161,781 |
| Net Asset Value Per Share— | |
| Admiral Shares | $91.67 |
• See Note A in Notes to Financial Statements.
* Non-income-producing security.
^ Includes partial security positions on loan to broker-dealers. The total value of securities on loan is $20,424,000.
1 Considered an affiliated company of the fund as the fund owns more than 5% of the outstanding voting securities of such company.
2 Affiliated money market fund available only to Vanguard funds and certain trusts and accounts managed by Vanguard. Rate shown
is the 7-day yield.
3 Includes $20,516,000 of collateral received for securities on loan.
4 The issuer operates under a congressional charter; its securities are generally neither guaranteed by the U.S. Treasury nor backed
by the full faith and credit of the U.S. government.
ADR—American Depositary Receipt.
CVR—Contingent Value Rights.
See accompanying Notes, which are an integral part of the Financial Statements.
16
Health Care Fund
Statement of Operations
| |
| | Six Months Ended |
| | July 31, 2016 |
| | ($000) |
| Investment Income | |
| Income | |
| Dividends1 | 363,844 |
| Interest | 2,696 |
| Securities Lending | 1,886 |
| Total Income | 368,426 |
| Expenses | |
| Investment Advisory Fees—Note B | |
| Basic Fee | 34,453 |
| Performance Adjustment | 7,933 |
| The Vanguard Group—Note C | |
| Management and Administrative—Investor Shares | 9,448 |
| Management and Administrative—Admiral Shares | 25,389 |
| Marketing and Distribution—Investor Shares | 1,063 |
| Marketing and Distribution—Admiral Shares | 1,062 |
| Custodian Fees | 445 |
| Shareholders’ Reports—Investor Shares | 109 |
| Shareholders’ Reports—Admiral Shares | 52 |
| Trustees’ Fees and Expenses | 34 |
| Total Expenses | 79,988 |
| Net Investment Income | 288,438 |
| Realized Net Gain (Loss) | |
| Investment Securities Sold | 1,096,537 |
| Foreign Currencies | 205 |
| Realized Net Gain (Loss) | 1,096,742 |
| Change in Unrealized Appreciation (Depreciation) | |
| Investment Securities | 3,689,498 |
| Foreign Currencies | 2,213 |
| Change in Unrealized Appreciation (Depreciation) | 3,691,711 |
| Net Increase (Decrease) in Net Assets Resulting from Operations | 5,076,891 |
| 1 Dividends are net of foreign withholding taxes of $14,914,000. |
See accompanying Notes, which are an integral part of the Financial Statements.
17
Health Care Fund
Statement of Changes in Net Assets
| | |
| | Six Months Ended | Year Ended |
| | July 31, | January 31, |
| | 2016 | 2016 |
| | ($000) | ($000) |
| Increase (Decrease) in Net Assets | | |
| Operations | | |
| Net Investment Income | 288,438 | 449,895 |
| Realized Net Gain (Loss) | 1,096,742 | 3,464,015 |
| Change in Unrealized Appreciation (Depreciation) | 3,691,711 | (3,823,799) |
| Net Increase (Decrease) in Net Assets Resulting from Operations | 5,076,891 | 90,111 |
| Distributions | | |
| Net Investment Income | | |
| Investor Shares | — | (137,657) |
| Admiral Shares | — | (466,453) |
| Realized Capital Gain1 | | |
| Investor Shares | (262,783) | (811,843) |
| Admiral Shares | (878,090) | (2,604,058) |
| Total Distributions | (1,140,873) | (4,020,011) |
| Capital Share Transactions | | |
| Investor Shares | (311,365) | 67,555 |
| Admiral Shares | (481,825) | 5,352,587 |
| Net Increase (Decrease) from Capital Share Transactions | (793,190) | 5,420,142 |
| Total Increase (Decrease) | 3,142,828 | 1,490,242 |
| Net Assets | | |
| Beginning of Period | 47,521,779 | 46,031,537 |
| End of Period2 | 50,664,607 | 47,521,779 |
| 1 Includes fiscal 2017 and 2016 short-term gain distributions totaling $0 and $416,632,000, respectively. Short-term gain distributions are |
| treated as ordinary income dividends for tax purposes. |
| 2 Net Assets—End of Period includes undistributed (overdistributed) net investment income of $168,267,000 and ($120,376,000). |
See accompanying Notes, which are an integral part of the Financial Statements.
18
Health Care Fund
Financial Highlights
| | | | | | |
| Investor Shares | | | | | | |
| Six Months | | | | | |
| | Ended | | | | | |
| For a Share Outstanding | July 31, | | | Year Ended January 31, |
| Throughout Each Period | 2016 | 2016 | 2015 | 2014 | 2013 | 2012 |
| Net Asset Value, Beginning of Period | $200.67 | $216.14 | $191.63 | $152.58 | $131.96 | $124.30 |
| Investment Operations | | | | | | |
| Net Investment Income | 1.188 | 1.934 | 2.941 | 2.350 | 2.777 | 2.300 |
| Net Realized and Unrealized Gain (Loss) | | | | | | |
| on Investments | 20.279 | .566 | 49.127 | 53.058 | 22.791 | 12.780 |
| Total from Investment Operations | 21.467 | 2.500 | 52.068 | 55.408 | 25.568 | 15.080 |
| Distributions | | | | | | |
| Dividends from Net Investment Income | — | (2.611) | (2.115) | (2.357) | (2.757) | (2.237) |
| Distributions from Realized Capital Gains | (4.857) | (15.359) | (25.443) | (14.001) | (2.191) | (5.183) |
| Total Distributions | (4.857) | (17.970) | (27.558) | (16.358) | (4.948) | (7.420) |
| Net Asset Value, End of Period | $217.28 | $200.67 | $216.14 | $191.63 | $152.58 | $131.96 |
| |
| Total Return1 | 11.00% | 0.49% | 28.15% | 37.66% | 19.59% | 12.50% |
| |
| Ratios/Supplemental Data | | | | | | |
| Net Assets, End of Period (Millions) | $11,503 | $10,916 | $11,660 | $9,905 | $8,681 | $8,462 |
| Ratio of Total Expenses to | | | | | | |
| Average Net Assets2 | 0.37% | 0.36% | 0.34% | 0.35% | 0.35% | 0.35% |
| Ratio of Net Investment Income to | | | | | | |
| Average Net Assets | 1.17% | 0.84% | 1.44% | 1.33% | 1.94% | 1.72% |
| Portfolio Turnover Rate | 11% | 18% | 20% | 21% | 8% | 8% |
The expense ratio, net investment income ratio, and turnover rate for the current period have been annualized.
1 Total returns do not include transaction or account service fees that may have applied in the periods shown. Fund prospectuses provide
information about any applicable transaction and account service fees.
2 Includes performance-based investment advisory fee increases (decreases) of 0.03% for fiscal 2017 and 0.02% for fiscal 2016.
Performance-based investment advisory fees did not apply before fiscal 2016.
See accompanying Notes, which are an integral part of the Financial Statements.
19
Health Care Fund
Financial Highlights
| | | | | | |
| Admiral Shares | | | | | | |
| Six Months | | | | | |
| | Ended | | | | | |
| For a Share Outstanding | July 31, | Year Ended January 31, |
| Throughout Each Period | 2016 | 2016 | 2015 | 2014 | 2013 | 2012 |
| Net Asset Value, Beginning of Period | $84.64 | $91.17 | $80.84 | $64.37 | $55.68 | $52.45 |
| Investment Operations | | | | | | |
| Net Investment Income | .524 | .868 | 1.290 | 1.040 | 1.211 | 1.005 |
| Net Realized and Unrealized Gain (Loss) | | | | | | |
| on Investments | 8.555 | .236 | 20.715 | 22.378 | 9.605 | 5.392 |
| Total from Investment Operations | 9.079 | 1.104 | 22.005 | 23.418 | 10.816 | 6.397 |
| Distributions | | | | | | |
| Dividends from Net Investment Income | — | (1.155) | (.942) | (1.042) | (1.201) | (.980) |
| Distributions from Realized Capital Gains | (2.049) | (6.479) | (10.733) | (5.906) | (.925) | (2.187) |
| Total Distributions | (2.049) | (7.634) | (11.675) | (6.948) | (2.126) | (3.167) |
| Net Asset Value, End of Period | $91.67 | $84.64 | $91.17 | $80.84 | $64.37 | $55.68 |
| |
| Total Return1 | 11.03% | 0.54% | 28.20% | 37.74% | 19.65% | 12.57% |
| |
| Ratios/Supplemental Data | | | | | | |
| Net Assets, End of Period (Millions) | $39,162 | $36,606 | $34,371 | $24,821 | $16,002 | $12,968 |
| Ratio of Total Expenses to | | | | | | |
| Average Net Assets2 | 0.32% | 0.31% | 0.29% | 0.30% | 0.30% | 0.30% |
| Ratio of Net Investment Income to | | | | | | |
| Average Net Assets | 1.22% | 0.89% | 1.49% | 1.38% | 1.99% | 1.77% |
| Portfolio Turnover Rate | 11% | 18% | 20% | 21% | 8% | 8% |
The expense ratio, net investment income ratio, and turnover rate for the current period have been annualized.
1 Total returns do not include transaction or account service fees that may have applied in the periods shown. Fund prospectuses provide
information about any applicable transaction and account service fees.
2 Includes performance-based investment advisory fee increases (decreases) of 0.03% for fiscal 2017 and 0.02% for fiscal 2016.
Performance-based investment advisory fees did not apply before fiscal 2016.
See accompanying Notes, which are an integral part of the Financial Statements.
20
Health Care Fund
Notes to Financial Statements
Vanguard Health Care Fund is registered under the Investment Company Act of 1940 as an open-end investment company, or mutual fund. The fund invests in securities of foreign issuers, which may subject it to investment risks not normally associated with investing in securities of U.S. corporations. The fund offers two classes of shares: Investor Shares and Admiral Shares. Investor Shares are available to any investor who meets the fund’s minimum purchase requirements. Admiral Shares are designed for investors who meet certain administrative, service, and account-size criteria.
A. The following significant accounting policies conform to generally accepted accounting principles for U.S. investment companies. The fund consistently follows such policies in preparing its financial statements.
1. Security Valuation: Securities are valued as of the close of trading on the New York Stock Exchange (generally 4 p.m., Eastern time) on the valuation date. Equity securities are valued at the latest quoted sales prices or official closing prices taken from the primary market in which each security trades; such securities not traded on the valuation date are valued at the mean of the latest quoted bid and asked prices. Securities for which market quotations are not readily available, or whose values have been affected by events occurring before the fund’s pricing time but after the close of the securities’ primary markets, are valued at their fair values calculated according to procedures adopted by the board of trustees. These procedures include obtaining quotations from an independent pricing service, monitoring news to identify significant market- or security-specific events, and evaluating changes in the values of foreign market proxies (for example, ADRs, futures contracts, or exchange-traded funds), between the time the foreign markets close and the fund’s pricing time. When fair-value pricing is employed, the prices of securities used by a fund to calculate its net asset value may differ from quoted or published prices for the same securities. Investments in Vanguard Market Liquidity Fund are valued at that fund’s net asset value. Temporary cash investments acquired over 60 days to maturity are valued using the latest bid prices or using valuations based on a matrix system (which considers such factors as security prices, yields, maturities, and ratings), both as furnished by independent pricing services. Other temporary cash investments are valued at amortized cost, which approximates market value.
2. Foreign Currency: Securities and other assets and liabilities denominated in foreign currencies are translated into U.S. dollars using exchange rates obtained from an independent third party as of the fund’s pricing time on the valuation date. Realized gains (losses) and unrealized appreciation (depreciation) on investment securities include the effects of changes in exchange rates since the securities were purchased, combined with the effects of changes in security prices. Fluctuations in the value of other assets and liabilities resulting from changes in exchange rates are recorded as unrealized foreign currency gains (losses) until the assets or liabilities are settled in cash, at which time they are recorded as realized foreign currency gains (losses).
3. Repurchase Agreements: The fund enters into repurchase agreements with institutional counterparties. Securities pledged as collateral to the fund under repurchase agreements are held by a custodian bank until the agreements mature. Each agreement requires that the market value of the collateral be sufficient to cover payments of interest and principal. The fund further mitigates its counterparty risk by entering into repurchase agreements only with a diverse group of prequalified counterparties, monitoring their financial strength, and entering into master repurchase agreements with its counterparties. The master repurchase agreements provide that, in the event of a counter-party’s default (including bankruptcy), the fund may terminate any repurchase agreements with that counterparty, determine the net amount owed, and sell or retain the collateral up to the net amount owed to the fund. Such action may be subject to legal proceedings, which may delay or limit the disposition of collateral.
21
Health Care Fund
4. Federal Income Taxes: The fund intends to continue to qualify as a regulated investment company and distribute all of its taxable income. Management has analyzed the fund’s tax positions taken for all open federal income tax years (January 31, 2013–2016), and for the period ended July 31, 2016, and has concluded that no provision for federal income tax is required in the fund’s financial statements.
5. Distributions: Distributions to shareholders are recorded on the ex-dividend date.
6. Securities Lending: To earn additional income, the fund lends its securities to qualified institutional borrowers. Security loans are subject to termination by the fund at any time, and are required to be secured at all times by collateral in an amount at least equal to the market value of securities loaned. Daily market fluctuations could cause the value of loaned securities to be more or less than the value of the collateral received. When this occurs, the collateral is adjusted and settled on the next business day. The fund further mitigates its counterparty risk by entering into securities lending transactions only with a diverse group of prequalified counterparties, monitoring their financial strength, and entering into master securities lending agreements with its counterparties. The master securities lending agreements provide that, in the event of a counterparty’s default (including bankruptcy), the fund may terminate any loans with that borrower, determine the net amount owed, and sell or retain the collateral up to the net amount owed to the fund; however, such actions may be subject to legal proceedings. While collateral mitigates counterparty risk, in the absence of a default the fund may experience delays and costs in recovering the securities loaned. The fund invests cash collateral received in Vanguard Market Liquidity Fund, and records a liability in the Statement of Net Assets for the return of the collateral, during the period the securities are on loan. Securities lending income represents fees charged to borrowers plus income earned on invested cash collateral, less expenses associated with the loan.
7. Credit Facility: The fund and certain other funds managed by The Vanguard Group (“Vanguard”) participate in a $3.1 billion committed credit facility provided by a syndicate of lenders pursuant to a credit agreement that may be renewed annually; each fund is individually liable for its borrowings, if any, under the credit facility. Borrowings may be utilized for temporary and emergency purposes, and are subject to the fund’s regulatory and contractual borrowing restrictions. The participating funds are charged administrative fees and an annual commitment fee of 0.10% of the undrawn amount of the facility; these fees are allocated to the funds based on a method approved by the fund’s board of trustees and included in Management and Administrative expenses on the fund’s Statement of Operations. Any borrowings under this facility bear interest at a rate based upon the higher of the one-month London Interbank Offered Rate, federal funds effective rate, or overnight bank funding rate plus an agreed-upon spread.
The fund had no borrowings outstanding at July 31, 2016, or at any time during the period then ended.
8. Other: Dividend income is recorded on the ex-dividend date. Interest income includes income distributions received from Vanguard Market Liquidity Fund and is accrued daily. Premiums and discounts on debt securities purchased are amortized and accreted, respectively, to interest income over the lives of the respective securities. Security transactions are accounted for on the date securities are bought or sold. Costs used to determine realized gains (losses) on the sale of investment securities are those of the specific securities sold.
Each class of shares has equal rights as to assets and earnings, except that each class separately bears certain class-specific expenses related to maintenance of shareholder accounts (included in Management and Administrative expenses) and shareholder reporting. Marketing and distribution
22
Health Care Fund
expenses are allocated to each class of shares based on a method approved by the board of trustees. Income, other non-class-specific expenses, and gains and losses on investments are allocated to each class of shares based on its relative net assets.
B. Wellington Management Company LLP provides investment advisory services to the fund for a fee calculated at an annual percentage rate of average net assets. The basic fee is subject to quarterly adjustments based on the fund’s performance relative to the MSCI ACWI Health Care Index since April 30, 2014. For the six months ended July 31, 2016, the investment advisory fee represented an effective annual basic rate of 0.14% of the fund’s average net assets before an increase of $7,933,000 (0.03%) based on performance.
C. In accordance with the terms of a Funds’ Service Agreement (the “FSA”) between Vanguard and the fund, Vanguard furnishes to the fund corporate management, administrative, marketing, and distribution services at Vanguard’s cost of operations (as defined by the FSA). These costs of operations are allocated to the fund based on methods and guidelines approved by the board of trustees. Vanguard does not require reimbursement in the current period for certain costs of operations (such as deferred compensation/benefits and risk/insurance costs); the fund’s liability for these costs of operations is included in Payables to Vanguard on the Statement of Net Assets.
Upon the request of Vanguard, the fund may invest up to 0.40% of its net assets as capital in Vanguard. At July 31, 2016, the fund had contributed to Vanguard capital in the amount of $3,915,000, representing 0.01% of the fund’s net assets and 1.57% of Vanguard’s capitalization. The fund’s trustees and officers are also directors and employees, respectively, of Vanguard.
D. Various inputs may be used to determine the value of the fund’s investments. These inputs are summarized in three broad levels for financial statement purposes. The inputs or methodologies used to value securities are not necessarily an indication of the risk associated with investing in those securities.
Level 1—Quoted prices in active markets for identical securities.
Level 2—Other significant observable inputs (including quoted prices for similar securities, interest rates, prepayment speeds, credit risk, etc.).
Level 3—Significant unobservable inputs (including the fund’s own assumptions used to determine the fair value of investments).
The following table summarizes the market value of the fund’s investments as of July 31, 2016, based on the inputs used to value them:
| | | |
| | Level 1 | Level 2 | Level 3 |
| Investments | ($000) | ($000) | ($000) |
| Common Stocks—United States | 38,898,221 | — | — |
| Common Stocks—International | 340,084 | 9,887,196 | — |
| Temporary Cash Investments | 20,516 | 1,570,043 | — |
| Total | 39,258,821 | 11,457,239 | — |
23
Health Care Fund
E. Distributions are determined on a tax basis and may differ from net investment income and realized capital gains for financial reporting purposes. Differences may be permanent or temporary. Permanent differences are reclassified among capital accounts in the financial statements to reflect their tax character. Temporary differences arise when certain items of income, expense, gain, or loss are recognized in different periods for financial statement and tax purposes. These differences will reverse at some time in the future. Differences in classification may also result from the treatment of short-term gains as ordinary income for tax purposes.
During the six months ended July 31, 2016, the fund realized net foreign currency gains of $205,000, which increased distributable net income for tax purposes; accordingly, such gains have been reclassified from accumulated net realized gains to undistributed net investment income.
The fund’s tax-basis capital gains and losses are determined only at the end of each fiscal year.
For tax purposes, at January 31, 2016, the fund had available capital losses totaling $24,288,000 that may be carried forward indefinitely to offset future net capital gains. The fund will use these capital losses to offset net taxable capital gains, if any, realized during the year ending January 31, 2017; should the fund realize net capital losses for the year, the losses will be added to the loss carryforward balance above.
At July 31, 2016, the cost of investment securities for tax purposes was $30,692,644,000. Net unrealized appreciation of investment securities for tax purposes was $20,023,416,000, consisting of unrealized gains of $20,798,178,000 on securities that had risen in value since their purchase and $774,762,000 in unrealized losses on securities that had fallen in value since their purchase.
F. During the six months ended July 31, 2016, the fund purchased $2,485,810,000 of investment securities and sold $4,178,174,000 of investment securities, other than temporary cash investments.
G. Capital share transactions for each class of shares were:
| | | | |
| | Six Months Ended | Year Ended |
| | July 31, 2016 | January 31, 2016 |
| | Amount | Shares | Amount | Shares |
| | ($000) | (000) | ($000) | (000) |
| Investor Shares | | | | |
| Issued | 683,792 | 3,397 | 2,981,987 | 13,073 |
| Issued in Lieu of Cash Distributions | 250,538 | 1,295 | 905,320 | 4,073 |
| Redeemed | (1,245,695) | (6,150) | (3,819,752) | (16,695) |
| Net Increase (Decrease)—Investor Shares | (311,365) | (1,458) | 67,555 | 451 |
| Admiral Shares | | | | |
| Issued | 1,117,863 | 13,097 | 5,917,072 | 61,196 |
| Issued in Lieu of Cash Distributions | 805,614 | 9,873 | 2,816,045 | 30,054 |
| Redeemed | (2,405,302) | (28,247) | (3,380,530) | (35,758) |
| Net Increase (Decrease)—Admiral Shares | (481,825) | (5,277) | 5,352,587 | 55,492 |
24
Health Care Fund
H. Certain of the fund’s investments are in companies that are considered to be affiliated companies of the fund because the fund owns more than 5% of the outstanding voting securities of the company or the issuer is another member of The Vanguard Group. Transactions during the period in securities of these companies were as follows:
| | | | | | |
| | | Current Period Transactions | |
| | Jan. 31, | | Proceeds | | | July 31, |
| | 2016 | | from | | Capital Gain | 2016 |
| | Market | Purchases | Securities | | Distributions | Market |
| | Value | at Cost | Sold1 | Income | Received | Value |
| | ($000) | ($000) | ($000) | ($000) | ($000) | ($000) |
| Agios Pharmaceuticals Inc. | 107,433 | 29,244 | — | — | — | 151,432 |
| Alkermes plc | 260,756 | 14,598 | — | — | — | 429,324 |
| Allscripts Healthcare | | | | | | |
| Solutions Inc. | 154,321 | — | — | — | — | 158,128 |
| Alnylam Pharmaceuticals Inc. | 583,564 | 3,011 | — | — | — | 579,515 |
| Cerner Corp. | NA2 | 26,968 | — | — | — | 1,057,494 |
| Envision Healthcare Holdings Inc. | NA2 | 40,130 | — | — | — | 270,340 |
| Incyte Corp. | 953,139 | 177,331 | — | — | — | 1,463,905 |
| Medicines Co. | 192,299 | — | — | — | — | 217,617 |
| Mylan NV | NA 2 | 162,004 | 7,248 | — | — | 1,308,500 |
| Prothena Corp. plc | NA2 | 17,203 | — | — | — | 118,374 |
| UCB SA | 914,626 | 46,090 | — | 11,510 | — | 887,486 |
| Vanguard Market Liquidity Fund | 12,794 | NA 3 | NA 3 | — | — | 20,516 |
| Vertex Pharmaceuticals Inc. | NA2 | 128,652 | — | — | — | 1,252,730 |
| Total | 3,178,932 | | | 11,510 | — | 7,915,361 |
1 Includes net realized gain (loss) on affiliated investment securities sold of $2,857,000.
2 Not applicable—at January 31, 2016, the issuer was not an affiliated company of the fund.
3 Not applicable—purchases and sales are for temporary cash investment purposes.
I. Management has determined that no material events or transactions occurred subsequent to July 31, 2016, that would require recognition or disclosure in these financial statements.
25
About Your Fund’s Expenses
As a shareholder of the fund, you incur ongoing costs, which include costs for portfolio management, administrative services, and shareholder reports (like this one), among others. Operating expenses, which are deducted from a fund’s gross income, directly reduce the investment return of the fund.
A fund’s expenses are expressed as a percentage of its average net assets. This figure is known as the expense ratio. The following examples are intended to help you understand the ongoing costs (in dollars) of investing in your fund and to compare these costs with those of other mutual funds. The examples are based on an investment of $1,000 made at the beginning of the period shown and held for the entire period.
The accompanying table illustrates your fund’s costs in two ways:
• Based on actual fund return. This section helps you to estimate the actual expenses that you paid over the period. The ”Ending Account Value“ shown is derived from the fund‘s actual return, and the third column shows the dollar amount that would have been paid by an investor who started with $1,000 in the fund. You may use the information here, together with the amount you invested, to estimate the expenses that you paid over the period.
To do so, simply divide your account value by $1,000 (for example, an $8,600 account value divided by $1,000 = 8.6), then multiply the result by the number given for your fund under the heading ”Expenses Paid During Period.“
• Based on hypothetical 5% yearly return. This section is intended to help you compare your fund‘s costs with those of other mutual funds. It assumes that the fund had a yearly return of 5% before expenses, but that the expense ratio is unchanged. In this case—because the return used is not the fund’s actual return—the results do not apply to your investment. The example is useful in making comparisons because the Securities and Exchange Commission requires all mutual funds to calculate expenses based on a 5% return. You can assess your fund’s costs by comparing this hypothetical example with the hypothetical examples that appear in shareholder reports of other funds.
Note that the expenses shown in the table are meant to highlight and help you compare ongoing costs only and do not reflect transaction costs incurred by the fund for buying and selling securities. Further, the expenses do not include any purchase, redemption, or account service fees described in the fund prospectus. If such fees were applied to your account, your costs would be higher. Your fund does not carry a “sales load.”
The calculations assume no shares were bought or sold during the period. Your actual costs may have been higher or lower, depending on the amount of your investment and the timing of any purchases or redemptions.
You can find more information about the fund’s expenses, including annual expense ratios, in the Financial Statements section of this report. For additional information on operating expenses and other shareholder costs, please refer to your fund’s current prospectus.
26
| | | |
| Six Months Ended July 31, 2016 | | | |
| | Beginning | Ending | Expenses |
| | Account Value | Account Value | Paid During |
| Health Care Fund | 1/31/2016 | 7/31/2016 | Period |
| Based on Actual Fund Return | | | |
| Investor Shares | $1,000.00 | $1,109.96 | $1.94 |
| Admiral Shares | 1,000.00 | 1,110.25 | 1.68 |
| Based on Hypothetical 5% Yearly Return | | | |
| Investor Shares | $1,000.00 | $1,023.02 | $1.86 |
| Admiral Shares | 1,000.00 | 1,023.27 | 1.61 |
The calculations are based on expenses incurred in the most recent six-month period. The fund’s annualized six-month expense ratios for that
period are 0.37% for Investor Shares and 0.32% for Admiral Shares. The dollar amounts shown as “Expenses Paid” are equal to the
annualized expense ratio multiplied by the average account value over the period, multiplied by the number of days in the most recent
six-month period, then divided by the number of days in the most recent 12-month period (182/366).
27
Trustees Approve Advisory Arrangement
The board of trustees of Vanguard Health Care Fund has renewed the fund’s investment advisory arrangement with Wellington Management Company LLP (Wellington Management). The board determined that renewing the fund’s advisory arrangement was in the best interests of the fund and its shareholders.
The board based its decision upon an evaluation of the advisor’s investment staff, portfolio management process, and performance. The trustees considered the factors discussed below, among others. However, no single factor determined whether the board approved the arrangement. Rather, it was the totality of the circumstances that drove the board’s decision.
Nature, extent, and quality of services
The board reviewed the quality of the fund’s investment management services over both the short and long term, and the organizational depth and stability of the advisor. The board considered that Wellington Management, founded in 1928, is among the nation’s oldest and most respected institutional investment managers. The portfolio manager is aided by a team of experienced global industry analysts who cover health care industries. This health care team uses intensive fundamental analysis and deep knowledge of health care science and technology to identify companies with high-quality balance sheets, strong management, and the potential for new products that will lead to above-average growth in revenue and earnings. The advisor invests in stocks broadly representing the health care industry, seeking to maintain exposure across five primary subsectors: large-cap biotech/ pharmaceuticals, mid-cap biotech/pharmaceuticals, small-cap biotech/pharmaceuticals, health care services, and medical technology. Wellington Management has advised the fund since the fund’s inception in 1984.
The board concluded that the advisor’s experience, stability, depth, and performance, among other factors, warranted approval and continuation of the advisory arrangement.
Investment performance
The board considered the short- and long-term performance of the fund, including any periods of outperformance or underperformance relative to a benchmark index and peer group. The board concluded that the performance was such that the advisory arrangement should continue. Information about the fund’s most recent performance can be found in the Performance Summary section of this report.
Cost
The board concluded that the fund’s expense ratio was well below the average expense ratio charged by funds in its peer group and that the fund’s advisory fee rate was also well below its peer-group average. Information about the fund’s expenses appears in the About Your Fund’s Expenses section of this report as well as in the Financial Statements section, which also includes information about the advisory fee rate.
The board did not consider profitability of Wellington Management in determining whether to approve the advisory fee, because Wellington Management is independent of Vanguard, and the advisory fee is the result of arm’s-length negotiations.
The benefit of economies of scale
The board concluded that the fund’s shareholders benefit from economies of scale because of breakpoints in the fund’s advisory fee schedule. The breakpoints reduce the effective rate of the fee as the fund’s assets increase.
The board will consider whether to renew the advisory arrangement again after a one-year period.
28
Glossary
30-Day SEC Yield. A fund’s 30-day SEC yield is derived using a formula specified by the U.S. Securities and Exchange Commission. Under the formula, data related to the fund’s security holdings in the previous 30 days are used to calculate the fund’s hypothetical net income for that period, which is then annualized and divided by the fund’s estimated average net assets over the calculation period. For the purposes of this calculation, a security’s income is based on its current market yield to maturity (for bonds), its actual income (for asset-backed securities), or its projected dividend yield (for stocks). Because the SEC yield represents hypothetical annualized income, it will differ—at times significantly—from the fund’s actual experience. As a result, the fund’s income distributions may be higher or lower than implied by the SEC yield.
Beta. A measure of the magnitude of a fund’s past share-price fluctuations in relation to the ups and downs of a given market index. The index is assigned a beta of 1.00. Compared with a given index, a fund with a beta of 1.20 typically would have seen its share price rise or fall by 12% when the index rose or fell by 10%. For this report, beta is based on returns over the past 36 months for both the fund and the index. Note that a fund’s beta should be reviewed in conjunction with its R-squared (see definition). The lower the R-squared, the less correlation there is between the fund and the index, and the less reliable beta is as an indicator of volatility.
Dividend Yield. Dividend income earned by stocks, expressed as a percentage of the aggregate market value (or of net asset value, for a fund). The yield is determined by dividing the amount of the annual dividends by the aggregate value (or net asset value) at the end of the period. For a fund, the dividend yield is based solely on stock holdings and does not include any income produced by other investments.
Earnings Growth Rate. The average annual rate of growth in earnings over the past five years for the stocks now in a fund.
Equity Exposure. A measure that reflects a fund’s investments in stocks and stock futures. Any holdings in short-term reserves are excluded.
Expense Ratio. A fund’s total annual operating expenses expressed as a percentage of the fund’s average net assets. The expense ratio includes management and administrative expenses, but does not include the transaction costs of buying and selling portfolio securities.
Foreign Holdings. The percentage of a fund represented by securities or depositary receipts of companies based outside the United States.
Inception Date. The date on which the assets of a fund (or one of its share classes) are first invested in accordance with the fund’s investment objective. For funds with a subscription period, the inception date is the day after that period ends. Investment performance is measured from the inception date.
Median Market Cap. An indicator of the size of companies in which a fund invests; the midpoint of market capitalization (market price x shares outstanding) of a fund’s stocks, weighted by the proportion of the fund’s assets invested in each stock. Stocks representing half of the fund’s assets have market capitalizations above the median, and the rest are below it.
Price/Book Ratio. The share price of a stock divided by its net worth, or book value, per share. For a fund, the weighted average price/book ratio of the stocks it holds.
29
Price/Earnings Ratio. The ratio of a stock’s current price to its per-share earnings over the past year. For a fund, the weighted average P/E of the stocks it holds. P/E is an indicator of market expectations about corporate prospects; the higher the P/E, the greater the expectations for a company’s future growth.
R-Squared. A measure of how much of a fund’s past returns can be explained by the returns from the market in general, as measured by a given index. If a fund’s total returns were precisely synchronized with an index’s returns, its R-squared would be 1.00. If the fund’s returns bore no relationship to the index’s returns, its R-squared would be 0. For this report, R-squared is based on returns over the past 36 months for both the fund and the index.
Return on Equity. The annual average rate of return generated by a company during the past five years for each dollar of shareholder’s equity (net income divided by shareholder’s equity). For a fund, the weighted average return on equity for the companies whose stocks it holds.
Short-Term Reserves. The percentage of a fund invested in highly liquid, short-term securities that can be readily converted to cash.
Turnover Rate. An indication of the fund’s trading activity. Funds with high turnover rates incur higher transaction costs and may be more likely to distribute capital gains (which may be taxable to investors). The turnover rate excludes in-kind transactions, which have minimal impact on costs.
Benchmark Information
Spliced Health Care Index: S&P 500 Index through December 31, 2001; S&P Health Care Index
through May 31, 2010; MSCI All Country World Health Care Index thereafter.
30
This page intentionally left blank.
The People Who Govern Your Fund
The trustees of your mutual fund are there to see that the fund is operated and managed in your best interests since, as a shareholder, you are a part owner of the fund. Your fund’s trustees also serve on the board of directors of The Vanguard Group, Inc., which is owned by the Vanguard funds and provides services to them on an at-cost basis.
A majority of Vanguard’s board members are independent, meaning that they have no affiliation with Vanguard or the funds they oversee, apart from the sizable personal investments they have made as private individuals. The independent board members have distinguished backgrounds in business, academia, and public service. Each of the trustees and executive officers oversees 198 Vanguard funds.
The following table provides information for each trustee and executive officer of the fund. More information about the trustees is in the Statement of Additional Information, which can be obtained, without charge, by contacting Vanguard at 800-662-7447, or online at vanguard.com.
| |
| InterestedTrustee1 | Rajiv L. Gupta |
| | Born 1945. Trustee Since December 2001.2 Principal |
| F. William McNabb III | Occupation(s) During the Past Five Years and Other |
| Born 1957. Trustee Since July 2009. Chairman of | Experience: Chairman and Chief Executive Officer |
| the Board. Principal Occupation(s) During the Past | (retired 2009) and President (2006–2008) of |
| Five Years and Other Experience: Chairman of the | Rohm and Haas Co. (chemicals); Director of Tyco |
| Board of The Vanguard Group, Inc., and of each of | International plc (diversified manufacturing and |
| the investment companies served by The Vanguard | services), HP Inc. (printer and personal computer |
| Group, since January 2010; Director of The Vanguard | manufacturing), and Delphi Automotive plc |
| Group since 2008; Chief Executive Officer and | (automotive components); Senior Advisor at |
| President of The Vanguard Group, and of each of | New Mountain Capital. |
| the investment companies served by The Vanguard | |
| Group, since 2008; Director of Vanguard Marketing | Amy Gutmann |
| Corporation; Managing Director of The Vanguard | Born 1949. Trustee Since June 2006. Principal |
| Group (1995–2008). | Occupation(s) During the Past Five Years and |
| | Other Experience: President of the University of |
| IndependentTrustees | Pennsylvania; Christopher H. Browne Distinguished |
| | Professor of Political Science, School of Arts and |
| Emerson U. Fullwood | Sciences, and Professor of Communication, Annenberg |
| Born 1948. Trustee Since January 2008. Principal | School for Communication, with secondary faculty |
| Occupation(s) During the Past Five Years and Other | appointments in the Department of Philosophy, School |
| Experience: Executive Chief Staff and Marketing | of Arts and Sciences, and at the Graduate School of |
| Officer for North America and Corporate Vice President | Education, University of Pennsylvania; Trustee of the |
| (retired 2008) of Xerox Corporation (document manage- | National Constitution Center; Chair of the Presidential |
| ment products and services); Executive in Residence | Commission for the Study of Bioethical Issues. |
| and 2009–2010 Distinguished Minett Professor at | |
| the Rochester Institute of Technology; Lead Director | JoAnn Heffernan Heisen |
| of SPX FLOW, Inc. (multi-industry manufacturing); | Born 1950. Trustee Since July 1998. Principal |
| Director of the United Way of Rochester, the University | Occupation(s) During the Past Five Years and |
| of Rochester Medical Center, Monroe Community | Other Experience: Corporate Vice President and |
| College Foundation, North Carolina A&T University, | Chief Global Diversity Officer (retired 2008) and |
| and Roberts Wesleyan College. | Member of the Executive Committee (1997–2008) |
| | of Johnson & Johnson (pharmaceuticals/medical |
| | devices/consumer products); Director of Skytop |
| | Lodge Corporation (hotels) and the Robert Wood |
| | Johnson Foundation; Member of the Advisory |
| | Board of the Institute for Women’s Leadership |
| | at Rutgers University. |
| | |
| F. Joseph Loughrey | Executive Officers | |
| Born 1949. Trustee Since October 2009. Principal | | |
| Occupation(s) During the Past Five Years and Other | Glenn Booraem | |
| Experience: President and Chief Operating Officer | Born 1967. Treasurer Since May 2015. Principal |
| (retired 2009) of Cummins Inc. (industrial machinery); | Occupation(s) During the Past Five Years and |
| Chairman of the Board of Hillenbrand, Inc. (specialized | Other Experience: Principal of The Vanguard Group, |
| consumer services), and of Oxfam America; Director | Inc.; Treasurer of each of the investment companies |
| of SKF AB (industrial machinery), Hyster-Yale Materials | served by The Vanguard Group; Controller of each of |
| Handling, Inc. (forklift trucks), the Lumina Foundation | the investment companies served by The Vanguard |
| for Education, and the V Foundation for Cancer | Group (2010–2015); Assistant Controller of each of |
| Research; Member of the Advisory Council for the | the investment companies served by The Vanguard |
| College of Arts and Letters and of the Advisory Board | Group (2001–2010). | |
| to the Kellogg Institute for International Studies, both | | |
| at the University of Notre Dame. | Thomas J. Higgins | |
| Born 1957. Chief Financial Officer Since September |
| Mark Loughridge | 2008. Principal Occupation(s) During the Past Five |
| Born 1953. Trustee Since March 2012. Principal | Years and Other Experience: Principal of The Vanguard |
| Occupation(s) During the Past Five Years and Other | Group, Inc.; Chief Financial Officer of each of the |
| Experience: Senior Vice President and Chief Financial | investment companies served by The Vanguard Group; |
| Officer (retired 2013) at IBM (information technology | Treasurer of each of the investment companies served |
| services); Fiduciary Member of IBM’s Retirement Plan | by The Vanguard Group (1998–2008). |
| Committee (2004–2013); Director of the Dow Chemical | | |
| Company; Member of the Council on Chicago Booth. | Peter Mahoney | |
| Born 1974. Controller Since May 2015. Principal |
| Scott C. Malpass | Occupation(s) During the Past Five Years and |
| Born 1962. Trustee Since March 2012. Principal | Other Experience: Head of Global Fund Accounting |
| Occupation(s) During the Past Five Years and Other | at The Vanguard Group, Inc.; Controller of each of the |
| Experience: Chief Investment Officer and Vice | investment companies served by The Vanguard Group; |
| President at the University of Notre Dame; Assistant | Head of International Fund Services at The Vanguard |
| Professor of Finance at the Mendoza College of | Group (2008–2014). | |
| Business at Notre Dame; Member of the Notre Dame | | |
| 403(b) Investment Committee, the Board of Advisors | Heidi Stam | |
| for Spruceview Capital Partners, and the Investment | Born 1956. Secretary Since July 2005. Principal |
| Advisory Committee of Major League Baseball; Board | Occupation(s) During the Past Five Years and Other |
| Member of TIFF Advisory Services, Inc., and Catholic | Experience: Managing Director of The Vanguard |
| Investment Services, Inc. (investment advisors). | Group, Inc.; General Counsel of The Vanguard Group; |
| Secretary of The Vanguard Group and of each of the |
| André F. Perold | investment companies served by The Vanguard Group; |
| Born 1952. Trustee Since December 2004. Principal | Director and Senior Vice President of Vanguard |
| Occupation(s) During the Past Five Years and Other | Marketing Corporation. | |
| Experience: George Gund Professor of Finance and | | |
| Banking, Emeritus at the Harvard Business School | Vanguard Senior ManagementTeam |
| (retired 2011); Chief Investment Officer and Managing | Mortimer J. Buckley | James M. Norris |
| Partner of HighVista Strategies LLC (private investment | Kathleen C. Gubanich | Thomas M. Rampulla |
| firm); Director of Rand Merchant Bank; Overseer of | Martha G. King | Glenn W. Reed |
| the Museum of Fine Arts Boston. | John T. Marcante | Karin A. Risi |
| Chris D. McIsaac | Michael Rollings |
| Peter F. Volanakis | | |
| Born 1955. Trustee Since July 2009. Principal | | |
| Occupation(s) During the Past Five Years and | Chairman Emeritus and Senior Advisor |
| Other Experience: President and Chief Operating | | |
| Officer (retired 2010) of Corning Incorporated | John J. Brennan | |
| (communications equipment); Chairman of the | Chairman, 1996–2009 | |
| Board of Trustees of Colby-Sawyer College; | Chief Executive Officer and President, 1996–2008 |
| Member of the Advisory Board of the Norris | | |
| Cotton Cancer Center. | Founder | |
| | John C. Bogle | |
| | Chairman and Chief Executive Officer, 1974–1996 |
1 Mr. McNabb is considered an “interested person,” as defined in the Investment Company Act of 1940, because he is an officer of the Vanguard funds.
2 December 2002 for Vanguard Equity Income Fund, the Vanguard Municipal Bond Funds, and the Vanguard State Tax-Exempt Funds.
| |  |
| | | P.O. Box 2600 |
| | | Valley Forge, PA 19482-2600 |
| |
| |
| |
| Connect with Vanguard® > vanguard.com |
| |
| |
| |
| Fund Information > 800-662-7447 | | CFA® is a registered trademark owned by CFA Institute. |
| Direct Investor Account Services > 800-662-2739 | |
| Institutional Investor Services > 800-523-1036 | |
| Text Telephone for People | | |
| Who Are Deaf or Hard of Hearing> 800-749-7273 | |
| |
| This material may be used in conjunction | |
| with the offering of shares of any Vanguard | |
| fund only if preceded or accompanied by | |
| the fund’s current prospectus. | |
| |
| All comparative mutual fund data are from Lipper, a | |
| Thomson Reuters Company, or Morningstar, Inc., unless | |
| otherwise noted. | | |
| |
| You can obtain a free copy of Vanguard’s proxy voting | |
| guidelines by visiting vanguard.com/proxyreporting or by | |
| calling Vanguard at 800-662-2739. The guidelines are | |
| also available from the SEC’s website, sec.gov. In | |
| addition, you may obtain a free report on how your fund | |
| voted the proxies for securities it owned during the 12 | |
| months ended June 30. To get the report, visit either | |
| vanguard.com/proxyreporting or sec.gov. | |
| |
| You can review and copy information about your fund at | |
| the SEC’s Public Reference Room in Washington, D.C. To | |
| find out more about this public service, call the SEC at | |
| 202-551-8090. Information about your fund is also | |
| available on the SEC’s website, and you can receive | |
| copies of this information, for a fee, by sending a | |
| request in either of two ways: via email addressed to | |
| publicinfo@sec.gov or via regular mail addressed to the | |
| Public Reference Section, Securities and Exchange | |
| Commission, Washington, DC 20549-1520. | |
| |
| | | © 2016 The Vanguard Group, Inc. |
| | | All rights reserved. |
| | | Vanguard Marketing Corporation, Distributor. |
| |
| | | Q522 092016 |

Semiannual Report | July 31, 2016
Vanguard REIT Index Fund
Vanguard’s Principles for Investing Success
We want to give you the best chance of investment success. These principles, grounded in Vanguard’s research and experience, can put you on the right path.
Goals. Create clear, appropriate investment goals.
Balance. Develop a suitable asset allocation using broadly diversified funds. Cost. Minimize cost.
Discipline. Maintain perspective and long-term discipline.
A single theme unites these principles: Focus on the things you can control.
We believe there is no wiser course for any investor.
| |
| Contents | |
| Your Fund’s Total Returns. | 1 |
| Chairman’s Letter. | 2 |
| Fund Profile. | 7 |
| Performance Summary. | 8 |
| Financial Statements. | 9 |
| About Your Fund’s Expenses. | 30 |
| Trustees Approve Advisory Arrangement. | 32 |
| Glossary. | 33 |
 REIT Index Fund
Please note: The opinions expressed in this report are just that—informed opinions. They should not be considered promises or advice.
Also, please keep in mind that the information and opinions cover the period through the date on the front of this report. Of course, the
risks of investing in your fund are spelled out in the prospectus.
See the Glossary for definitions of investment terms used in this report.
About the cover: Pictured is a sailing block on the Brilliant, a 1932 schooner docked in Mystic, Connecticut. A type of pulley, the
sailing block helps coordinate the setting of the sails. At Vanguard, the intricate coordination of technology and people allows
us to help millions of clients around the world reach their financial goals.
Your Fund’s Total Returns
| |
| Six Months Ended July 31, 2016 | |
| | Total |
| | Returns |
| Vanguard REIT Index Fund | |
| Investor Shares | 22.28% |
| ETF Shares | |
| Market Price | 22.50 |
| Net Asset Value | 22.35 |
| Admiral™ Shares | 22.35 |
| Institutional Shares | 22.38 |
| MSCI US REIT Index | 22.42 |
| Real Estate Funds Average | 19.46 |
Real Estate Funds Average: Derived from data provided by Lipper, a Thomson Reuters Company.
Admiral Shares carry lower expenses and are available to investors who meet certain account-balance requirements. Institutional Shares are
available to certain institutional investors who meet specific administrative, service, and account-size criteria. The Vanguard ETF® Shares
shown are traded on the NYSE Arca exchange and are available only through brokers. The table provides ETF returns based on both the NYSE
Arca market price and the net asset value for a share. U.S. Pat. Nos. 6,879,964; 7,337,138; 7,720,749; 7,925,573; 8,090,646; and 8,417,623.
For the ETF Shares, the market price is determined by the midpoint of the bid-offer spread as of the closing time of the New York Stock
Exchange (generally 4 p.m., Eastern time). The net asset value is also determined as of the NYSE closing time. For more information about
how the ETF Shares' market prices have compared with their net asset value, visit vanguard.com, select your ETF, and then select the Price
and Performance tab. The ETF premium/discount analysis there shows the percentages of days on which the ETF Shares' market price was
above or below the NAV.
| | | | | |
| Your Fund’s Performance at a Glance | | | | | |
| January 31, 2016, Through July 31, 2016 | | | | | |
| |
| | | | Distributions Per Share | |
| | Starting | Ending | Income | Capital | Return of |
| | Share Price | Share Price | Dividends | Gains | Capital |
| Vanguard REIT Index Fund | | | | | |
| Investor Shares | $25.59 | $30.69 | $0.539 | $0.000 | $0.000 |
| ETF Shares | 77.05 | 92.39 | 1.683 | 0.000 | 0.000 |
| Admiral Shares | 109.19 | 130.94 | 2.384 | 0.000 | 0.000 |
| Institutional Shares | 16.90 | 20.27 | 0.370 | 0.000 | 0.000 |
1

Chairman’s Letter
Dear Shareholder,
After a negative result for the prior 12 months, real estate investment trusts (REITs) rebounded as income-hungry investors sought reliable income generators.
Vanguard REIT Index Fund posted a strong 22.28% return for Investor Shares for the six months ended July 31, 2016. The fund’s performance closely tracked its target index (+22.42%) and outperformed the average return of competing funds (+19.46%).
U.S. stocks continued to surge despite signs of uncertainty
U.S. stocks proved resilient over the half year, returning about 14%, although the global environment was far from tranquil.
Stocks tumbled after the momentous June 23 decision by U.K. voters to leave the European Union, but the market quickly recovered. Worries about the effects of “Brexit” on trade and economic growth seemed to diminish as expectations rose that major central banks would be responsive to any fallout.
International equities also performed well, returning nearly 12%. European stocks finished solidly but still lagged as the Brexit referendum hit close to home. Emerging-market stocks and those from developed Pacific markets recorded double-digit returns.
2
Bonds drew support from economic factors and low yields
The broad U.S. bond market advanced in each of the six months en route to returning 4.54%. With the stock market volatile at times, the pace of global growth uncertain, and inflation low, investors sought safe-haven assets. Foreign investors flocked to U.S. Treasury debt amid exceptionally low or negative yields abroad.
The yield of the 10-year Treasury note closed July at 1.45%, down from 1.98% at the end of January. (Bond prices and yields move in opposite directions.)
The Federal Reserve has held its target for short-term interest rates at 0.25%–0.5% since raising it by a quarter of a percentage point last December. Money market funds and savings accounts continued to be restrained by these historically low rates.
International bond markets (as measured by the Barclays Global Aggregate Index ex USD) returned 12.31%. A number of foreign currencies strengthened against the dollar, but returns were robust even without this currency benefit.
| | | |
| Market Barometer | | | |
| |
| | Total Returns |
| | Periods Ended July 31, 2016 |
| | Six | One | Five Years |
| | Months | Year | (Annualized) |
| Stocks | | | |
| Russell 1000 Index (Large-caps) | 13.82% | 4.84% | 13.22% |
| Russell 2000 Index (Small-caps) | 18.76 | 0.00 | 10.43 |
| Russell 3000 Index (Broad U.S. market) | 14.18 | 4.44 | 12.99 |
| FTSE All-World ex US Index (International) | 11.69 | -4.95 | 1.76 |
| |
| Bonds | | | |
| Barclays U.S. Aggregate Bond Index (Broad taxable market) | 4.54% | 5.94% | 3.57% |
| Barclays Municipal Bond Index (Broad tax-exempt market) | 3.16 | 6.94 | 5.13 |
| Citigroup Three-Month U.S. Treasury Bill Index | 0.12 | 0.16 | 0.05 |
| |
| CPI | | | |
| Consumer Price Index | 1.57% | 0.84% | 1.27% |
3
Yield-hungry investors helped restart REIT rally
A combination of economic trends and monetary policies exerted downward pressure on interest rates over the past six months, causing bond yields to fall in the United States and in many international markets. As a result, investors gravitated toward assets that generated regular income, including REITs, which are required to pay out at least 90% of their income as investor dividends.
Falling rates can also benefit REITs because lower capital costs can increase their profit margins, particularly in a growing economy. Although the U.S. economy’s growth rate has not been robust, it has avoided a recession for seven consecutive years. And the real estate sector has enjoyed a healthy rebound from the financial crisis of 2008–2009.
Consequently, all subsets of the REIT market posted double-digit returns for the period. The best result came from industrial REITs. Although the subsector is the second-smallest in the REIT arena, it had an outsized impact with its 42% return. Industrial REITs were aided by the expansion of warehouse and distribution centers needed to accommodate the growth in U.S. online sales.
| | | | | |
| Expense Ratios | | | | | |
| Your Fund Compared With Its Peer Group | | | | | |
| | Investor | ETF | Admiral | Institutional | Peer Group |
| | Shares | Shares | Shares | Shares | Average |
| REIT Index Fund | 0.26% | 0.12% | 0.12% | 0.10% | 1.30% |
The fund expense ratios shown are from the prospectus dated May 25, 2016, and represent estimated costs for the current fiscal year. For the
six months ended July 31, 2016, the fund’s annualized expense ratios were 0.26% for Investor Shares, 0.12% for ETF Shares, 0.12% for
Admiral Shares, and 0.10% for Institutional Shares. The peer-group expense ratio is derived from data provided by Lipper, a Thomson Reuters
Company, and captures information through year-end 2015.
Peer group: Real Estate Funds.
4
Other outperforming subsectors included diversified REITs (+35%) and health care REITs (+29%). Diversified REITs manage a variety of property types, most of which rode the wave of REIT enthusiasm. The health care subsector was helped by the expectation that expanded insurance coverage for an aging U.S. population would continue to increase demand for services.
Hotel and resort REITs (+26%) also did well, boosted by optimism about consumers’ appetite for travel this year—probably at least partly because of below-average summer fuel prices. The largest subsector, retail REITs, returned about 22% and had the largest impact on the portfolio’s overall performance because of its size (about a quarter of the fund’s assets). Consumer spending rose at a modest clip, and demand for commercial real estate remained healthy; this caused vacancies to fall and rents to rise, bolstering the market.
Two subsectors, specialized REITs (+14%) and residential REITs (+13%), turned in healthy, but below-average, results relative to the sector overall.
Whether a fund is indexed or active, low costs and talent matter
If you listen to some investing pundits, you might think index investing and actively managed investing are incompatible opposites. We at Vanguard don’t see it that way.
To us, it’s not index versus active. Depending on your goals, it could well be both.
Vanguard is a pioneer in index investing. In 1976, we opened the first index mutual fund, giving shareholders an opportunity to track the performance of the S&P 500 Index. But our roots in active management—which aims to choose investments that will outperform the market—go back to the 1929 launch of what became Vanguard Wellington™ Fund.
Our index and active funds share important traits. Both are low-cost, and as their assets grow, we can take advantage of the economies of scale by further reducing expense ratios. That allows you to keep more of your fund’s returns.
But low costs aren’t the whole story. Talent and experience are vital no matter a fund’s management style.
When it comes to indexing, portfolio managers in our Equity Index and Fixed Income Groups have honed their expertise over decades. That knowledge helps our index funds meet their objectives of closely tracking their benchmarks.
Our active funds, too, benefit from world-class managers—both our own experts and premier money managers we hire around the globe. There’s no
5
guarantee that active management will lead to market-beating results, but the combination of talent and low costs can give investors a better chance of success.
If you’d like to know more, see Keys to Improving the Odds of Active Management Success and The Case for Index-Fund Investing, available at vanguard.com/research.
As always, thank you for investing with Vanguard.
Sincerely,

F. William McNabb III
Chairman and Chief Executive Officer
August 12, 2016
6
REIT Index Fund
Fund Profile
As of July 31, 2016
| | | | |
| Share-Class Characteristics | | | | |
| |
| | Investor | | Admiral | Institutional |
| | Shares | ETF Shares | Shares | Shares |
| Ticker Symbol | VGSIX | VNQ | VGSLX | VGSNX |
| Expense Ratio1 | 0.26% | 0.12% | 0.12% | 0.10% |
| | | |
| Portfolio Characteristics | | |
| | | | DJ |
| | | | U.S. |
| | | | Total |
| | | | Market |
| | | MSCI US | FA |
| | Fund REIT Index | Index |
| Number of Stocks | 150 | 149 | 3,839 |
| Median Market Cap | $12.0B | $12.0B | $54.0B |
| Price/Earnings Ratio | 36.5x | 36.5x | 23.5x |
| Price/Book Ratio | 2.7x | 2.7x | 2.8x |
| Return on Equity | 8.1% | 8.1% | 16.3% |
| Earnings Growth | | | |
| Rate | 18.4% | 18.4% | 7.3% |
| Dividend Yield | 3.5% | 3.5% | 2.0% |
| Foreign Holdings | 0.0% | 0.0% | 0.0% |
| Turnover Rate | | | |
| (Annualized) | 7% | — | — |
| Short-Term | | | |
| Reserves | 0.1% | — | — |
Dividend Yield: This yield may include some payments that represent a return of capital, capital gains distributions, or both by
the underlying REITs. These amounts are determined by each REIT at the end of its fiscal year.
| | |
| Subindustry Diversification (% of equity |
| exposure) | | |
| | | MSCI US |
| | Fund | REIT Index |
| Diversified REITs | 7.5% | 7.5% |
| Health Care REITs | 12.6 | 12.6 |
| Hotel & Resort REITs | 5.2 | 5.2 |
| Industrial REITs | 6.2 | 6.2 |
| Office REITs | 12.6 | 12.6 |
| Residential REITs | 14.9 | 14.9 |
| Retail REITs | 24.9 | 24.9 |
| Specialized REITs | 16.1 | 16.1 |
| | |
| Volatility Measures | | |
| | | DJ |
| | | U.S. Total |
| | MSCI US | Market |
| | REIT Index | FA Index |
| R-Squared | 1.00 | 0.20 |
| Beta | 1.00 | 0.61 |
These measures show the degree and timing of the fund’s fluctuations compared with the indexes over 36 months.
| | |
| Ten Largest Holdings (% of total net assets) |
| Simon Property Group | | |
| Inc. | Retail REITs | 8.0% |
| Public Storage | Specialized REITs | 4.0 |
| Prologis Inc. | Industrial REITs | 3.3 |
| Welltower Inc. | Health Care REITs | 3.2 |
| Equinix Inc. | Specialized REITs | 2.9 |
| Ventas Inc. | Health Care REITs | 2.9 |
| AvalonBay Communities | | |
| Inc. | Residential REITs | 2.9 |
| Equity Residential | Residential REITs | 2.8 |
| Boston Properties Inc. | Office REITs | 2.5 |
| General Growth | | |
| Properties Inc. | Retail REITs | 2.1 |
| Top Ten | | 34.6% |
The holdings listed exclude any temporary cash investments and equity index products.
1 The expense ratios shown are from the prospectus dated May 25, 2016, and represent estimated costs for the current fiscal year. For the six
months ended July 31, 2016, the annualized expense ratios were 0.26% for Investor Shares, 0.12% for ETF Shares, 0.12% for Admiral Shares, and
0.10% for Institutional Shares.
7
REIT Index Fund
Performance Summary
All of the returns in this report represent past performance, which is not a guarantee of future results that may be achieved by the fund. (Current performance may be lower or higher than the performance data cited. For performance data current to the most recent month-end, visit our website at vanguard.com/performance.) Note, too, that both investment returns and principal value can fluctuate widely, so an investor’s shares, when sold, could be worth more or less than their original cost. The returns shown do not reflect taxes that a shareholder would pay on fund distributions or on the sale of fund shares.
Fiscal-Year Total Returns (%): January 31, 2006, Through July 31, 2016

For a benchmark description, see the Glossary.
Note: For 2017, performance data reflect the six months ended July 31, 2016.
Average Annual Total Returns: Periods Ended June 30, 2016
This table presents returns through the latest calendar quarter—rather than through the end of the fiscal period.
Securities and Exchange Commission rules require that we provide this information.
| | | | |
| | Inception | One | Five | Ten |
| | Date | Year | Years | Years |
| Investor Shares | 5/13/1996 | 23.75% | 12.29% | 7.46% |
| ETF Shares | 9/23/2004 | | | |
| Market Price | | 23.92 | 12.43 | 7.59 |
| Net Asset Value | | 23.93 | 12.43 | 7.59 |
| Admiral Shares | 11/12/2001 | 23.93 | 12.44 | 7.59 |
| Institutional Shares | 12/2/2003 | 23.94 | 12.47 | 7.62 |
See Financial Highlights for dividend and capital gains information.
8
REIT Index Fund
Financial Statements (unaudited)
Statement of Net Assets
As of July 31, 2016
The fund reports a complete list of its holdings in regulatory filings four times in each fiscal year, at the quarter-ends. For the second and fourth fiscal quarters, the lists appear in the fund’s semiannual and annual reports to shareholders. For the first and third fiscal quarters, the fund files the lists with the Securities and Exchange Commission on Form N-Q. Shareholders can look up the fund’s Forms N-Q on the SEC’s website at sec.gov. Forms N-Q may also be reviewed and copied at the SEC’s Public Reference Room (see the back cover of this report for further information).
| | | |
| | | | Market |
| | | | Value• |
| | | Shares | ($000) |
| Real Estate Investment Trusts (100.0%)1 | |
| Diversified REITs (7.5%) | | |
| 2 | VEREIT Inc. | 66,186,525 | 732,023 |
| 2 | WP Carey Inc. | 7,646,339 | 555,506 |
| 2 | Spirit Realty Capital Inc. | 36,587,297 | 500,148 |
| 2 | Liberty Property Trust | 11,258,302 | 465,869 |
| | Forest City Realty Trust | | |
| | Inc. Class A | 18,573,716 | 439,268 |
| 2 | STORE Capital Corp. | 11,675,925 | 364,172 |
| 2 | Gramercy Property | | |
| | Trust | 32,370,841 | 323,385 |
| 2 | Washington REIT | 5,617,780 | 192,634 |
| 2 | NorthStar Realty | | |
| | Finance Corp. | 14,203,932 | 190,333 |
| | Empire State Realty | | |
| | Trust Inc. | 8,733,623 | 183,319 |
| 2 | Lexington Realty Trust | 16,301,113 | 177,193 |
| 2 | PS Business Parks Inc. | 1,561,471 | 173,151 |
| 2 | Cousins Properties Inc. | 15,467,996 | 164,579 |
| 2 | Select Income REIT | 5,162,111 | 143,300 |
| 2 | American Assets Trust | | |
| | Inc. | 2,624,112 | 120,394 |
| ^,2 | Global Net Lease Inc. | 13,011,634 | 113,592 |
| 2 | Investors Real Estate | | |
| | Trust | 9,434,937 | 62,459 |
| 2 | First Potomac Realty | | |
| | Trust | 4,474,090 | 45,233 |
| 2 | Whitestone REIT | 2,079,510 | 33,626 |
| 2 | One Liberty Properties | | |
| | Inc. | 967,017 | 24,195 |
| 2 | RAIT Financial Trust | 7,032,794 | 22,294 |
| 2 | Winthrop Realty Trust | 2,379,616 | 21,750 |
| | | | 5,048,423 |
| Health Care REITs (12.6%) | | |
| 2 | Welltower Inc. | 27,345,645 | 2,169,330 |
| 2 | Ventas Inc. | 25,877,245 | 1,970,811 |
| 2 | HCP Inc. | 35,845,725 | 1,406,228 |
| 2 | Omega Healthcare | | |
| | Investors Inc. | 14,486,082 | 499,770 |
| | | |
| 2 | Senior Housing | | |
| | Properties Trust | 18,285,381 | 406,118 |
| 2 | Healthcare Trust of | | |
| | America Inc. Class A | 10,049,877 | 342,198 |
| 2 | Healthcare Realty Trust | | |
| | Inc. | 8,828,928 | 319,254 |
| 2 | Medical Properties Trust | | |
| | Inc. | 18,231,373 | 286,233 |
| 2 | National Health | | |
| | Investors Inc. | 2,958,062 | 232,415 |
| 2 | Physicians Realty Trust | 10,086,205 | 219,072 |
| 2 | Care Capital Properties | | |
| | Inc. | 6,455,922 | 190,966 |
| 2 | LTC Properties Inc. | 2,889,615 | 154,681 |
| 2 | Sabra Health Care REIT | | |
| | Inc. | 5,020,729 | 120,046 |
| 2 | New Senior Investment | | |
| | Group Inc. | 6,007,772 | 72,033 |
| 2 | CareTrust REIT Inc. | 4,395,041 | 63,508 |
| 2 | Universal Health Realty | | |
| | Income Trust | 974,996 | 58,178 |
| | | | 8,510,841 |
| Hotel & Resort REITs (5.2%) | | |
| 2 | Host Hotels & Resorts | | |
| | Inc. | 57,924,950 | 1,027,589 |
| 2 | Hospitality Properties | | |
| | Trust | 11,669,432 | 372,372 |
| ^,2 | Apple Hospitality REIT | | |
| | Inc. | 12,755,599 | 259,832 |
| 2 | LaSalle Hotel Properties | 8,699,088 | 239,660 |
| 2 | RLJ Lodging Trust | 9,598,852 | 227,877 |
| 2 | Sunstone Hotel | | |
| | Investors Inc. | 16,637,249 | 221,275 |
| 2 | Ryman Hospitality | | |
| | Properties Inc. | 3,554,151 | 199,885 |
| 2 | Pebblebrook Hotel Trust | 5,540,681 | 164,281 |
| 2 | Xenia Hotels & Resorts | | |
| | Inc. | 8,600,491 | 154,465 |
| 2 | DiamondRock | | |
| | Hospitality Co. | 15,460,921 | 151,826 |
9
REIT Index Fund
| | | |
| | | | Market |
| | | | Value• |
| | | Shares | ($000) |
| 2 | Chesapeake Lodging | | |
| | Trust | 4,629,640 | 116,991 |
| 2 | Summit Hotel Properties | | |
| | Inc. | 6,688,376 | 94,841 |
| 2 | Chatham Lodging Trust | 2,950,199 | 70,746 |
| 2 | FelCor Lodging Trust | | |
| | Inc. | 10,213,463 | 64,856 |
| 2 | Hersha Hospitality Trust | | |
| | Class A | 3,425,361 | 64,739 |
| 2 | Ashford Hospitality | | |
| | Trust Inc. | 7,358,944 | 43,859 |
| 2 | Ashford Hospitality | | |
| | Prime Inc. | 1,975,209 | 29,707 |
| | | | 3,504,801 |
| Industrial REITs (6.2%) | | |
| 2 | Prologis Inc. | 40,407,334 | 2,201,796 |
| 2 | Duke Realty Corp. | 26,634,181 | 766,798 |
| 2 | DCT Industrial Trust Inc. | 6,813,285 | 342,163 |
| 2 | First Industrial Realty | | |
| | Trust Inc. | 8,998,686 | 265,191 |
| 2 | EastGroup Properties Inc. | 2,494,889 | 183,674 |
| 2 | STAG Industrial Inc. | 5,251,529 | 133,284 |
| 2 | Rexford Industrial | | |
| | Realty Inc. | 4,980,151 | 113,846 |
| 2 | Terreno Realty Corp. | 3,344,690 | 93,150 |
| 2 | Monmouth Real Estate | | |
| | Investment Corp. | 4,459,553 | 61,631 |
| | | | 4,161,533 |
| Office REITs (12.6%) | | |
| 2 | Boston Properties Inc. | 11,826,546 | 1,680,907 |
| 2 | Vornado Realty Trust | 13,068,321 | 1,403,538 |
| 2 | SL Green Realty Corp. | 7,704,251 | 907,715 |
| 2 | Alexandria Real Estate | | |
| | Equities Inc. | 5,650,129 | 634,509 |
| 2 | Kilroy Realty Corp. | 7,105,248 | 520,175 |
| 2 | Highwoods Properties | | |
| | Inc. | 7,400,031 | 412,330 |
| 2 | Douglas Emmett Inc. | 10,777,940 | 409,993 |
| 2 | Hudson Pacific | | |
| | Properties Inc. | 8,271,609 | 279,663 |
| *,2 | Equity Commonwealth | 9,213,145 | 276,579 |
| 2 | Piedmont Office Realty | | |
| | Trust Inc. Class A | 11,172,766 | 245,130 |
| 2 | Paramount Group Inc. | 13,069,614 | 230,417 |
| 2 | Brandywine Realty Trust 13,466,531 | 227,180 |
| 2 | Columbia Property Trust | | |
| | Inc. | 9,035,599 | 219,565 |
| 2 | Corporate Office | | |
| | Properties Trust | 7,281,071 | 218,141 |
| 2 | Mack-Cali Realty Corp. | 6,554,502 | 184,837 |
| ^,2 | Government Properties | | |
| | Income Trust | 5,478,381 | 130,714 |
| 2 | New York REIT Inc. | 12,713,998 | 121,292 |
| 2 | Parkway Properties Inc. | 6,452,167 | 112,074 |
| 2 | Franklin Street Properties | | |
| | Corp. | 6,943,106 | 89,011 |
| | | |
| 2 | Tier REIT Inc. | 3,682,161 | 64,180 |
| 2 | Easterly Government | | |
| | Properties Inc. | 2,370,025 | 48,562 |
| 2 | NorthStar Realty Europe | | |
| | Corp. | 4,861,520 | 44,969 |
| | | | 8,461,481 |
| Residential REITs (14.9%) | | |
| 2 | AvalonBay Communities | | |
| | Inc. | 10,549,130 | 1,958,446 |
| 2 | Equity Residential | 28,115,687 | 1,911,586 |
| 2 | Essex Property Trust | | |
| | Inc. | 5,036,654 | 1,177,973 |
| 2 | UDR Inc. | 20,184,062 | 751,453 |
| 2 | Mid-America Apartment | | |
| | Communities Inc. | 5,808,241 | 615,790 |
| 2 | Camden Property Trust | 6,693,409 | 599,662 |
| 2 | Apartment Investment | | |
| | & Management Co. | 12,058,099 | 554,311 |
| 2 | American Campus | | |
| | Communities Inc. | 10,044,101 | 543,084 |
| 2 | Equity LifeStyle | | |
| | Properties Inc. | 6,188,067 | 508,907 |
| 2 | Sun Communities Inc. | 4,666,340 | 369,341 |
| | American Homes 4 | | |
| | Rent Class A | 13,070,937 | 283,639 |
| 2 | Post Properties Inc. | 4,131,698 | 262,735 |
| 2 | Education Realty Trust | | |
| | Inc. | 4,806,301 | 231,375 |
| 2 | Monogram Residential | | |
| | Trust Inc. | 12,191,966 | 130,576 |
| | Colony Starwood Homes | 3,169,089 | 103,819 |
| 2 | Silver Bay Realty Trust | | |
| | Corp. | 2,645,513 | 47,672 |
| | | | 10,050,369 |
| Retail REITs (24.9%) | | |
| 2 | Simon Property Group | | |
| | Inc. | 23,824,984 | 5,409,224 |
| 2 | General Growth | | |
| | Properties Inc. | 44,168,992 | 1,411,199 |
| 2 | Realty Income Corp. | 19,282,008 | 1,378,085 |
| 2 | Kimco Realty Corp. | 31,855,516 | 1,022,562 |
| 2 | Federal Realty | | |
| | Investment Trust | 5,364,626 | 910,377 |
| 2 | Macerich Co. | 9,761,823 | 871,145 |
| 2 | Regency Centers Corp. | 7,515,691 | 638,308 |
| 2 | National Retail Properties | | |
| | Inc. | 10,983,885 | 583,903 |
| 2 | Brixmor Property Group | | |
| | Inc. | 18,547,556 | 526,751 |
| 2 | DDR Corp. | 23,909,497 | 471,973 |
| 2 | Weingarten Realty | | |
| | Investors | 9,067,211 | 391,613 |
| 2 | Taubman Centers Inc. | 4,638,435 | 375,342 |
| 2 | Retail Properties of | | |
| | America Inc. | 18,270,918 | 322,116 |
10
REIT Index Fund
| | | |
| | | | Market |
| | | | Value• |
| | | Shares | ($000) |
| 2 | Tanger Factory Outlet | | |
| | Centers Inc. | 7,383,537 | 308,189 |
| | Equity One Inc. | 7,095,492 | 236,067 |
| 2 | Urban Edge Properties | 7,648,371 | 228,763 |
| 2 | Acadia Realty Trust | 5,428,216 | 204,427 |
| 2 | Kite Realty Group Trust | 6,425,784 | 195,408 |
| 2 | Retail Opportunity | | |
| | Investments Corp. | 8,150,633 | 186,079 |
| 2 | WP Glimcher Inc. | 14,276,394 | 181,025 |
| 2 | CBL & Associates | | |
| | Properties Inc. | 13,129,195 | 161,358 |
| 2 | Pennsylvania REIT | 5,334,914 | 135,720 |
| 2 | Ramco-Gershenson | | |
| | Properties Trust | 6,099,370 | 121,011 |
| 2 | Agree Realty Corp. | 1,791,358 | 90,858 |
| ^,2 | Seritage Growth | | |
| | Properties Class A | 1,716,133 | 85,910 |
| | Alexander’s Inc. | 176,977 | 75,971 |
| | Saul Centers Inc. | 980,090 | 65,833 |
| | Urstadt Biddle Properties | | |
| | Inc. Class A | 2,181,946 | 53,894 |
| ^,2 | Cedar Realty Trust Inc. | 6,549,075 | 52,655 |
| 2 | Getty Realty Corp. | 2,060,408 | 46,812 |
| | Urstadt Biddle Properties | | |
| | Inc. | 69,255 | 1,489 |
| | | | 16,744,067 |
| Specialized REITs (16.1%) | | |
| 2 | Public Storage | 11,340,387 | 2,709,445 |
| 2 | Equinix Inc. | 5,314,915 | 1,981,772 |
| 2 | Digital Realty Trust Inc. | 11,489,681 | 1,200,212 |
| 2 | Extra Space Storage Inc. | 9,557,168 | 822,108 |
| 2 | Iron Mountain Inc. | 19,434,730 | 800,905 |
| 2 | Gaming and Leisure | | |
| | Properties Inc. | 14,288,615 | 511,961 |
| 2 | EPR Properties | 4,874,778 | 409,579 |
| 2 | CubeSmart | 13,531,184 | 402,011 |
| 2 | Sovran Self Storage Inc. | 3,501,168 | 358,415 |
| 2 | CyrusOne Inc. | 5,423,919 | 297,339 |
| 2 | Corrections Corp. of | | |
| | America | 9,028,839 | 289,374 |
| 2 | DuPont Fabros | | |
| | Technology Inc. | 5,642,817 | 269,896 |
| 2 | QTS Realty Trust Inc. | | |
| | Class A | 3,604,385 | 206,351 |
| 2 | GEO Group Inc. | 5,752,141 | 199,082 |
| | CoreSite Realty Corp. | 2,361,295 | 194,878 |
| 2 | Four Corners Property | | |
| | Trust Inc. | 4,380,318 | 95,097 |
| 2 | National Storage | | |
| | Affiliates Trust | 2,594,317 | 55,440 |
| | | | 10,803,865 |
| Total Real Estate Investment Trusts | |
| (Cost $51,522,831) | | 67,285,380 |
| | |
| | | Market |
| | | Value• |
| | Shares | ($000) |
| Temporary Cash Investments (0.1%)1 | |
| Money Market Fund (0.1%) | |
| 3,4 Vanguard Market | | |
| Liquidity Fund, | | |
| 0.561% | 113,686,269 | 113,686 |
| |
| | Face | |
| | Amount | |
| | ($000) | |
| U.S. Government and Agency Obligations (0.0%) |
| United States | | |
| Treasury Bill, | | |
| 0.391%, 8/4/16 | 3,100 | 3,100 |
| Total Temporary Cash Investments | |
| (Cost $116,786) | | 116,786 |
| Total Investments (100.1%) | |
| (Cost $51,639,617) | | 67,402,166 |
| Other Assets and Liabilities (-0.1%) | |
| Other Assets | | 100,852 |
| Liabilities 4 | | (201,496) |
| | | (100,644) |
| Net Assets (100%) | | 67,301,522 |
| |
| | | Amount |
| | | ($000) |
| Statement of Assets and Liabilities | |
| Assets | | |
| Investments in Securities, at Value | |
| Unaffiliated Issuers | | 1,641,277 |
| Affiliated Vanguard Funds | 113,686 |
| Other Affiliated Issuers | 65,647,203 |
| Total Investments in Securities | 67,402,166 |
| Investment in Vanguard | 5,124 |
| Receivables for Accrued Income | 58,564 |
| Receivables for Capital Shares Issued | 36,672 |
| Other Assets | | 492 |
| Total Assets | | 67,503,018 |
| Liabilities | | |
| Payables for Investment Securities | |
| Purchased | | 112,801 |
| Collateral for Securities on Loan | 40,779 |
| Payables for Capital Shares Redeemed | 19,020 |
| Payables to Vanguard | | 28,896 |
| Total Liabilities | | 201,496 |
| Net Assets | | 67,301,522 |
11
REIT Index Fund
| |
| At July 31, 2016, net assets consisted of: |
| | Amount |
| | ($000) |
| Paid-in Capital | 51,578,269 |
| Overdistributed Net Investment Income | (249,568) |
| Accumulated Net Realized Gains | 209,490 |
| Unrealized Appreciation (Depreciation) | |
| Investment Securities | 15,762,549 |
| Swap Contracts | 782 |
| Net Assets | 67,301,522 |
| |
| |
| Investor Shares—Net Assets | |
| Applicable to 99,395,320 outstanding | |
| $.001 par value shares of beneficial | |
| interest (unlimited authorization) | 3,050,382 |
| Net Asset Value Per Share— | |
| Investor Shares | $30.69 |
| |
| |
| ETF Shares—Net Assets | |
| Applicable to 395,295,552 outstanding | |
| $.001 par value shares of beneficial | |
| interest (unlimited authorization) | 36,523,008 |
| Net Asset Value Per Share— | |
| ETF Shares | $92.39 |
| |
| | Amount |
| | ($000) |
| Admiral Shares—Net Assets | |
| Applicable to 147,799,187 outstanding | |
| $.001 par value shares of beneficial | |
| interest (unlimited authorization) | 19,353,488 |
| Net Asset Value Per Share— | |
| Admiral Shares | $130.94 |
| |
| |
| Institutional Shares—Net Assets | |
| Applicable to 413,209,628 outstanding | |
| $.001 par value shares of beneficial | |
| interest (unlimited authorization) | 8,374,644 |
| Net Asset Value Per Share— | |
| Institutional Shares | $20.27 |
• See Note A in Notes to Financial Statements.
^ Includes partial security positions on loan to broker-dealers. The total value of securities on loan is $39,668,000.
* Non-income-producing security.
1 The fund invests a portion of its assets in Real Estate Investment Trusts through the use of swap contracts. After giving effect to swap
investments, the fund’s effective Real Estate Investment Trust and temporary cash investment positions represent 100.0% and 0.1%,
respectively, of net assets.
2 Considered an affiliated company of the fund as the fund owns more than 5% of the outstanding voting securities of such company.
3 Affiliated money market fund available only to Vanguard funds and certain trusts and accounts managed by Vanguard. Rate shown is the
7-day yield.
4 Includes $40,779,000 of collateral received for securities on loan.
REIT—Real Estate Investment Trust.
See accompanying Notes, which are an integral part of the Financial Statements.
12
REIT Index Fund
Statement of Operations
| |
| | Six Months Ended |
| | July 31, 2016 |
| | ($000) |
| Investment Income | |
| Income | |
| Dividends | 869,502 |
| Interest | 124 |
| Securities Lending | 745 |
| Total Income | 870,371 |
| Expenses | |
| The Vanguard Group—Note B | |
| Investment Advisory Services | 2,215 |
| Management and Administrative—Investor Shares | 3,145 |
| Management and Administrative—ETF Shares | 15,554 |
| Management and Administrative—Admiral Shares | 8,391 |
| Management and Administrative—Institutional Shares | 3,203 |
| Marketing and Distribution—Investor Shares | 293 |
| Marketing and Distribution—ETF Shares | 954 |
| Marketing and Distribution—Admiral Shares | 753 |
| Marketing and Distribution—Institutional Shares | 91 |
| Custodian Fees | 328 |
| Shareholders’ Reports—Investor Shares | 43 |
| Shareholders’ Reports—ETF Shares | 520 |
| Shareholders’ Reports—Admiral Shares | 84 |
| Shareholders’ Reports—Institutional Shares | 36 |
| Trustees’ Fees and Expenses | 18 |
| Total Expenses | 35,628 |
| Net Investment Income | 834,743 |
| Realized Net Gain (Loss) | |
| Capital Gain Distributions Received | 331,291 |
| Investment Securities Sold | 597,567 |
| Futures Contracts | 757 |
| Swap Contracts | 8,763 |
| Realized Net Gain (Loss) | 938,378 |
| Change in Unrealized Appreciation (Depreciation) | |
| Investment Securities | 10,073,071 |
| Swap Contracts | 3,662 |
| Change in Unrealized Appreciation (Depreciation) | 10,076,733 |
| Net Increase (Decrease) in Net Assets Resulting from Operations | 11,849,854 |
See accompanying Notes, which are an integral part of the Financial Statements.
13
REIT Index Fund
Statement of Changes in Net Assets
| | |
| | Six Months Ended | Year Ended |
| | July 31, | January 31, |
| | 2016 | 2016 |
| | ($000) | ($000) |
| Increase (Decrease) in Net Assets | | |
| Operations | | |
| Net Investment Income | 834,743 | 1,425,510 |
| Realized Net Gain (Loss) | 938,378 | 2,873,988 |
| Change in Unrealized Appreciation (Depreciation) | 10,076,733 | (8,494,863) |
| Net Increase (Decrease) in Net Assets Resulting from Operations | 11,849,854 | (4,195,365) |
| Distributions | | |
| Net Investment Income | | |
| Investor Shares | (53,496) | (72,647) |
| ETF Shares | (626,173) | (728,106) |
| Admiral Shares | (336,324) | (407,189) |
| Institutional Shares | (148,781) | (184,580) |
| Realized Capital Gain | | |
| Investor Shares | — | — |
| ETF Shares | — | — |
| Admiral Shares | — | — |
| Institutional Shares | — | — |
| Return of Capital | | |
| Investor Shares | — | (31,917) |
| ETF Shares | — | (319,892) |
| Admiral Shares | — | (178,898) |
| Institutional Shares | — | (81,095) |
| Total Distributions | (1,164,774) | (2,004,324) |
| Capital Share Transactions | | |
| Investor Shares | (78,209) | (257,705) |
| ETF Shares | 3,806,213 | 836,661 |
| Admiral Shares | 1,220,229 | 1,058,869 |
| Institutional Shares | 225,634 | 773,129 |
| Net Increase (Decrease) from Capital Share Transactions | 5,173,867 | 2,410,954 |
| Total Increase (Decrease) | 15,858,947 | (3,788,735) |
| Net Assets | | |
| Beginning of Period | 51,442,575 | 55,231,310 |
| End of Period1 | 67,301,522 | 51,442,575 |
| 1 Net Assets—End of Period includes undistributed (overdistributed) net investment income of ($249,568,000) and $71,700,000. |
See accompanying Notes, which are an integral part of the Financial Statements.
14
REIT Index Fund
Financial Highlights
| | | | | | |
| Investor Shares | | | | | | |
| Six Months | | | | | |
| | Ended | | | | | |
| For a Share Outstanding | July 31, | Year Ended January 31, |
| Throughout Each Period | 2016 | 2016 | 2015 | 2014 | 2013 | 2012 |
| Net Asset Value, Beginning of Period | $25.59 | $28.73 | $22.37 | $22.66 | $20.50 | $18.99 |
| Investment Operations | | | | | | |
| Net Investment Income | .385 | .711 | .645 | .579 | .514 | .442 |
| Net Realized and Unrealized Gain (Loss) | | | | | | |
| on Investments | 5.254 | (2.851) | 6.650 | .025 | 2.393 | 1.722 |
| Total from Investment Operations | 5.639 | (2.140) | 7.295 | .604 | 2.907 | 2.164 |
| Distributions | | | | | | |
| Dividends from Net Investment Income | (.539) | (.695) | (.624) | (.626) | (.514) | (.439) |
| Distributions from Realized Capital Gains | — | — | — | — | — | — |
| Return of Capital | — | (.305) | (.311) | (.268) | (.233) | (.215) |
| Total Distributions | (.539) | (1.000) | (.935) | (.894) | (.747) | (.654) |
| Net Asset Value, End of Period | $30.69 | $25.59 | $28.73 | $22.37 | $22.66 | $20.50 |
| |
| Total Return1 | 22.28% | -7.44% | 33.29% | 2.78% | 14.45% | 11.80% |
| |
| Ratios/Supplemental Data | | | | | | |
| Net Assets, End of Period (Millions) | $3,050 | $2,621 | $3,231 | $2,482 | $2,817 | $2,565 |
| Ratio of Total Expenses to | | | | | | |
| Average Net Assets | 0.26% | 0.26% | 0.26% | 0.24% | 0.24% | 0.24% |
| Ratio of Net Investment Income to | | | | | | |
| Average Net Assets | 2.77% | 2.66% | 2.56% | 2.51% | 2.39% | 2.30% |
| Portfolio Turnover Rate2 | 7% | 11% | 8% | 11% | 9% | 10% |
The expense ratio, net investment income ratio, and turnover rate for the current period have been annualized.
1 Total returns do not include transaction or account service fees that may have applied in the periods shown. Fund prospectuses provide
information about any applicable transaction and account service fees.
2 Excludes the value of portfolio securities received or delivered as a result of in-kind purchases or redemptions of the fund’s capital shares,
including ETF Creation Units.
See accompanying Notes, which are an integral part of the Financial Statements.
15
REIT Index Fund
Financial Highlights
| | | | | | |
| ETF Shares | | | | | | |
| Six Months | | | | | |
| | Ended | | | | | |
| For a Share Outstanding | July 31, | Year Ended January 31, |
| Throughout Each Period | 2016 | 2016 | 2015 | 2014 | 2013 | 2012 |
| Net Asset Value, Beginning of Period | $77.05 | $86.49 | $67.36 | $68.24 | $61.72 | $57.17 |
| Investment Operations | | | | | | |
| Net Investment Income | 1.221 | 2.217 | 2.011 | 1.814 | 1.613 | 1.384 |
| Net Realized and Unrealized Gain (Loss) | | | | | | |
| on Investments | 15.802 | (8.533) | 20.038 | .097 | 7.250 | 5.216 |
| Total from Investment Operations | 17.023 | (6.316) | 22.049 | 1.911 | 8.863 | 6.600 |
| Distributions | | | | | | |
| Dividends from Net Investment Income | (1.683) | (2.170) | (1.947) | (1.955) | (1.612) | (1.375) |
| Distributions from Realized Capital Gains | — | — | — | — | — | — |
| Return of Capital | — | (.954) | (.972) | (.836) | (.731) | (.675) |
| Total Distributions | (1.683) | (3.124) | (2.919) | (2.791) | (2.343) | (2.050) |
| Net Asset Value, End of Period | $92.39 | $77.05 | $86.49 | $67.36 | $68.24 | $61.72 |
| |
| Total Return | 22.35% | -7.31% | 33.41% | 2.93% | 14.64% | 11.94% |
| |
| Ratios/Supplemental Data | | | | | | |
| Net Assets, End of Period (Millions) | $36,523 | $27,007 | $29,487 | $18,528 | $16,983 | $10,410 |
| Ratio of Total Expenses to | | | | | | |
| Average Net Assets | 0.12% | 0.12% | 0.12% | 0.10% | 0.10% | 0.10% |
| Ratio of Net Investment Income to | | | | | | |
| Average Net Assets | 2.91% | 2.80% | 2.70% | 2.65% | 2.53% | 2.44% |
| Portfolio Turnover Rate1 | 7% | 11% | 8% | 11% | 9% | 10% |
The expense ratio, net investment income ratio, and turnover rate for the current period have been annualized.
1 Excludes the value of portfolio securities received or delivered as a result of in-kind purchases or redemptions of the fund’s capital shares,
including ETF Creation Units.
See accompanying Notes, which are an integral part of the Financial Statements.
16
REIT Index Fund
Financial Highlights
| | | | | | |
| Admiral Shares | | | | | | |
| Six Months | | | | | |
| | Ended | | | | | |
| For a Share Outstanding | July 31, | Year Ended January 31, |
| Throughout Each Period | 2016 | 2016 | 2015 | 2014 | 2013 | 2012 |
| Net Asset Value, Beginning of Period | $109.19 | $122.58 | $95.46 | $96.70 | $87.47 | $81.03 |
| Investment Operations | | | | | | |
| Net Investment Income | 1.729 | 3.142 | 2.852 | 2.569 | 2.285 | 1.960 |
| Net Realized and Unrealized Gain (Loss) | | | | | | |
| on Investments | 22.405 | (12.105) | 28.403 | .148 | 10.263 | 7.385 |
| Total from Investment Operations | 24.134 | (8.963) | 31.255 | 2.717 | 12.548 | 9.345 |
| Distributions | | | | | | |
| Dividends from Net Investment Income | (2.384) | (3.076) | (2.758) | (2.772) | (2.283) | (1.948) |
| Distributions from Realized Capital Gains | — | — | — | — | — | — |
| Return of Capital | — | (1.351) | (1.377) | (1.185) | (1.035) | (.957) |
| Total Distributions | (2.384) | (4.427) | (4.135) | (3.957) | (3.318) | (2.905) |
| Net Asset Value, End of Period | $130.94 | $109.19 | $122.58 | $95.46 | $96.70 | $87.47 |
| |
| Total Return1 | 22.35% | -7.30% | 33.46% | 2.94% | 14.63% | 11.95% |
| |
| Ratios/Supplemental Data | | | | | | |
| Net Assets, End of Period (Millions) | $19,353 | $15,029 | $15,725 | $7,987 | $7,399 | $5,612 |
| Ratio of Total Expenses to | | | | | | |
| Average Net Assets | 0.12% | 0.12% | 0.12% | 0.10% | 0.10% | 0.10% |
| Ratio of Net Investment Income to | | | | | | |
| Average Net Assets | 2.91% | 2.80% | 2.70% | 2.65% | 2.53% | 2.44% |
| Portfolio Turnover Rate2 | 7% | 11% | 8% | 11% | 9% | 10% |
The expense ratio, net investment income ratio, and turnover rate for the current period have been annualized.
1 Total returns do not include transaction or account service fees that may have applied in the periods shown. Fund prospectuses provide
information about any applicable transaction and account service fees.
2 Excludes the value of portfolio securities received or delivered as a result of in-kind purchases or redemptions of the fund’s capital shares,
including ETF Creation Units.
See accompanying Notes, which are an integral part of the Financial Statements.
17
REIT Index Fund
Financial Highlights
| | | | | | |
| Institutional Shares | | | | | | |
| Six Months | | | | | |
| | Ended | | | | | |
| For a Share Outstanding | July 31, | Year Ended January 31, |
| Throughout Each Period | 2016 | 2016 | 2015 | 2014 | 2013 | 2012 |
| Net Asset Value, Beginning of Period | $16.90 | $18.97 | $14.78 | $14.97 | $13.54 | $12.54 |
| Investment Operations | | | | | | |
| Net Investment Income | .268 | .489 | .444 | .400 | .356 | .305 |
| Net Realized and Unrealized Gain (Loss) | | | | | | |
| on Investments | 3.472 | (1.870) | 4.390 | .025 | 1.590 | 1.148 |
| Total from Investment Operations | 3.740 | (1.381) | 4.834 | .425 | 1.946 | 1.453 |
| Distributions | | | | | | |
| Dividends from Net Investment Income | (.370) | (.479) | (.430) | (.431) | (.355) | (.304) |
| Distributions from Realized Capital Gains | — | — | — | — | — | — |
| Return of Capital | — | (.210) | (.214) | (.184) | (.161) | (.149) |
| Total Distributions | (.370) | (.689) | (.644) | (.615) | (.516) | (.453) |
| Net Asset Value, End of Period | $20.27 | $16.90 | $18.97 | $14.78 | $14.97 | $13.54 |
| |
| Total Return1 | 22.38% | -7.27% | 33.43% | 2.97% | 14.66% | 12.01% |
| |
| Ratios/Supplemental Data | | | | | | |
| Net Assets, End of Period (Millions) | $8,375 | $6,785 | $6,788 | $3,922 | $3,185 | $2,324 |
| Ratio of Total Expenses to | | | | | | |
| Average Net Assets | 0.10% | 0.10% | 0.10% | 0.08% | 0.08% | 0.08% |
| Ratio of Net Investment Income to | | | | | | |
| Average Net Assets | 2.93% | 2.82% | 2.72% | 2.67% | 2.55% | 2.46% |
| Portfolio Turnover Rate2 | 7% | 11% | 8% | 11% | 9% | 10% |
The expense ratio, net investment income ratio, and turnover rate for the current period have been annualized.
1 Total returns do not include transaction fees that may have applied in the periods shown. Fund prospectuses provide information about any
applicable transaction fees.
2 Excludes the value of portfolio securities received or delivered as a result of in-kind purchases or redemptions of the fund’s capital shares,
including ETF Creation Units.
See accompanying Notes, which are an integral part of the Financial Statements.
18
REIT Index Fund
Notes to Financial Statements
Vanguard REIT Index Fund is registered under the Investment Company Act of 1940 as an open-end investment company, or mutual fund. The fund offers four classes of shares: Investor Shares, ETF Shares, Admiral Shares, and Institutional Shares. Investor Shares are available to any investor who meets the fund’s minimum purchase requirements. ETF Shares are listed for trading on NYSE Arca; they can be purchased and sold through a broker. Admiral Shares and Institutional Shares are designed for investors who meet certain administrative, service, and account-size criteria.
A. The following significant accounting policies conform to generally accepted accounting principles for U.S. investment companies. The fund consistently follows such policies in preparing its financial statements.
1. Security Valuation: Securities are valued as of the close of trading on the New York Stock Exchange (generally 4 p.m., Eastern time) on the valuation date. Equity securities are valued at the latest quoted sales prices or official closing prices taken from the primary market in which each security trades; such securities not traded on the valuation date are valued at the mean of the latest quoted bid and asked prices. Securities for which market quotations are not readily available, or whose values have been materially affected by events occurring before the fund’s pricing time but after the close of the securities’ primary markets, are valued by methods deemed by the board of trustees to represent fair value. Investments in Vanguard Market Liquidity Fund are valued at that fund’s net asset value. Temporary cash investments acquired over 60 days to maturity are valued using the latest bid prices or using valuations based on a matrix system (which considers such factors as security prices, yields, maturities, and ratings), both as furnished by independent pricing services. Other temporary cash investments are valued at amortized cost, which approximates market value.
2. Futures Contracts: The fund uses index futures contracts to a limited extent, with the objectives of maintaining full exposure to the stock market, enhancing returns, maintaining liquidity, and minimizing transaction costs. The fund may purchase futures contracts to immediately invest incoming cash in the market, or sell futures in response to cash outflows, thereby simulating a fully invested position in the underlying index while maintaining a cash balance for liquidity. The fund may seek to enhance returns by using futures contracts instead of the underlying securities when futures are believed to be priced more attractively than the underlying securities. The primary risks associated with the use of futures contracts are imperfect correlation between changes in market values of stocks held by the fund and the prices of futures contracts, and the possibility of an illiquid market. Counterparty risk involving futures is mitigated because a regulated clearinghouse is the counterparty instead of the clearing broker. To further mitigate counterparty risk, the fund trades futures contracts on an exchange, monitors the financial strength of its clearing brokers and clearinghouse, and has entered into clearing agreements with its clearing brokers. The clearinghouse imposes initial margin requirements to secure the fund’s performance and requires daily settlement of variation margin representing changes in the market value of each contract.
Futures contracts are valued at their quoted daily settlement prices. The aggregate settlement values of the contracts are not recorded in the Statement of Assets and Liabilities. Fluctuations in the value of the contracts are recorded in the Statement of Assets and Liabilities as an asset (liability) and in the Statement of Operations as unrealized appreciation (depreciation) until the contracts are closed, when they are recorded as realized futures gains (losses).
19
REIT Index Fund
During the six months ended July 31, 2016, the fund’s average investments in long and short futures contracts represented less than 1% and 0% of net assets, respectively, based on the average of aggregate settlement values at each quarter-end during the period. The fund had no open futures contracts at July 31, 2016.
3. Swap Contracts: The fund has entered into equity swap contracts to earn the total return on selected reference stocks in the fund’s target index. Under the terms of the swaps, the fund receives the total return on the referenced stock (i.e., receiving the increase or paying the decrease in value of the selected reference stock and receiving the equivalent of any dividends in respect of the selected referenced stock) over a specified period of time, applied to a notional amount that represents the value of a designated number of shares of the selected reference stock at the beginning of the equity swap contract. The fund also pays a floating rate that is based on short-term interest rates, applied to the notional amount. At the same time, the fund invests an amount approximating the notional amount of the swap in high-quality temporary cash investments.
The notional amounts of swap contracts are not recorded in the Statement of Assets and Liabilities. Swaps are valued daily based on market quotations received from independent pricing services or recognized dealers and the change in value is recorded in the Statement of Assets and Liabilities as an asset (liability) and in the Statement of Operations as unrealized appreciation (depreciation) until termination of the swap, at which time realized gain (loss) is recorded. A risk associated with all types of swaps is the possibility that a counterparty may default on its obligation to pay net amounts due to the fund. The fund’s maximum amount subject to counterparty risk is the unrealized appreciation on the swap contract. The fund mitigates its counterparty risk by entering into swaps only with a diverse group of prequalified counterparties, monitoring their financial strength, entering into master netting arrangements with its counterparties, and requiring its counterparties to transfer collateral as security for their performance. In the event of a counterparty’s default (including bankruptcy), the fund may terminate any swap contracts with that counterparty, determine the net amount owed by either party in accordance with its master netting arrangements, and sell or retain any collateral held up to the net amount owed to the fund under the master netting arrangements. The swap contracts contain provisions whereby a counterparty may terminate open contracts if the fund net assets decline below a certain level, triggering a payment by the fund if the fund is in a net liability position at the time of the termination. The payment amount would be reduced by any collateral the fund has pledged. Any securities pledged as collateral for open contracts are noted in the Statement of Net Assets. The value of collateral received or pledged is compared daily to the value of the swap contracts exposure with each counterparty, and any difference, if in excess of a specified minimum transfer amount, is adjusted and settled within two business days.
During the six months ended July 31, 2016, the fund’s average amounts of investments in total return swaps represented less than 1% of net assets, based on the average of notional amounts at each quarter-end during the period.
4. Federal Income Taxes: The fund intends to continue to qualify as a regulated investment company and distribute all of its taxable income. Management has analyzed the fund’s tax positions taken for all open federal income tax years (January, 2013–2016), and for the period ended July 31, 2016, and has concluded that no provision for federal income tax is required in the fund’s financial statements.
20
REIT Index Fund
5. Distributions: Distributions to shareholders are recorded on the ex-dividend date. Distributions declared by the fund are reallocated at fiscal year-end to ordinary income, capital gain, and return of capital to reflect their tax character.
6. Securities Lending: To earn additional income, the fund lends its securities to qualified institutional borrowers. Security loans are subject to termination by the fund at any time, and are required to be secured at all times by collateral in an amount at least equal to the market value of securities loaned. Daily market fluctuations could cause the value of loaned securities to be more or less than the value of the collateral received. When this occurs, the collateral is adjusted and settled on the next business day. The fund further mitigates its counterparty risk by entering into securities lending transactions only with a diverse group of prequalified counterparties, monitoring their financial strength, and entering into master securities lending agreements with its counterparties. The master securities lending agreements provide that, in the event of a counterparty’s default (including bankruptcy), the fund may terminate any loans with that borrower, determine the net amount owed, and sell or retain the collateral up to the net amount owed to the fund; however, such actions may be subject to legal proceedings. While collateral mitigates counterparty risk, in the absence of a default the fund may experience delays and costs in recovering the securities loaned. The fund invests cash collateral received in Vanguard Market Liquidity Fund, and records a liability in the Statement of Assets and Liabilities for the return of the collateral, during the period the securities are on loan. Securities lending income represents fees charged to borrowers plus income earned on invested cash collateral, less expenses associated with the loan.
7. Credit Facility: The fund and certain other funds managed by The Vanguard Group (“Vanguard”) participate in a $3.1 billion committed credit facility provided by a syndicate of lenders pursuant to a credit agreement that may be renewed annually; each fund is individually liable for its borrowings, if any, under the credit facility. Borrowings may be utilized for temporary and emergency purposes, and are subject to the fund’s regulatory and contractual borrowing restrictions. The participating funds are charged administrative fees and an annual commitment fee of 0.10% of the undrawn amount of the facility; these fees are allocated to the funds based on a method approved by the fund’s board of trustees and included in Management and Administrative expenses on the fund’s Statement of Operations. Any borrowings under this facility bear interest at a rate based upon the higher of the one-month London Interbank Offered Rate, federal funds effective rate, or overnight bank funding rate plus an agreed-upon spread.
The fund had no borrowings outstanding at July 31, 2016, or at any time during the period then ended.
8. Other: Distributions received from REITs are recorded on the ex-dividend date. Each REIT reports annually the tax character of its distributions. Dividend income, capital gain distributions received, and unrealized appreciation (depreciation) reflect the amounts of taxable income, capital gain, and return of capital reported by the REITs, and management’s estimates of such amounts for REIT distributions for which actual information has not been reported. Interest income includes income distributions received from Vanguard Market Liquidity Fund and is accrued daily. Premiums and discounts on debt securities purchased are amortized and accreted, respectively, to interest income over the lives of the respective securities. Security transactions are accounted for on the date securities are bought or sold. Costs used to determine realized gains (losses) on the sale of investment securities are those of the specific securities sold.
21
REIT Index Fund
Each class of shares has equal rights as to assets and earnings, except that each class separately bears certain class-specific expenses related to maintenance of shareholder accounts (included in Management and Administrative expenses) and shareholder reporting. Marketing and distribution expenses are allocated to each class of shares based on a method approved by the board of trustees. Income, other non-class-specific expenses, and gains and losses on investments are allocated to each class of shares based on its relative net assets.
B. In accordance with the terms of a Funds’ Service Agreement (the “FSA”) between Vanguard and the fund, Vanguard furnishes to the fund investment advisory, corporate management, administrative, marketing, and distribution services at Vanguard’s cost of operations (as defined by the FSA). These costs of operations are allocated to the fund based on methods and guidelines approved by the board of trustees. Vanguard does not require reimbursement in the current period for certain costs of operations (such as deferred compensation/benefits and risk/insurance costs); the fund’s liability for these costs of operations is included in Payables to Vanguard on the Statement of Assets and Liabilities.
Upon the request of Vanguard, the fund may invest up to 0.40% of its net assets as capital in Vanguard. At July 31, 2016, the fund had contributed to Vanguard capital in the amount of $5,124,000, representing 0.01% of the fund’s net assets and 2.05% of Vanguard’s capitalization. The fund’s trustees and officers are also directors and employees, respectively, of Vanguard.
C. Various inputs may be used to determine the value of the fund’s investments. These inputs are summarized in three broad levels for financial statement purposes. The inputs or methodologies used to value securities are not necessarily an indication of the risk associated with investing in those securities.
Level 1—Quoted prices in active markets for identical securities.
Level 2—Other significant observable inputs (including quoted prices for similar securities, interest rates, prepayment speeds, credit risk, etc.).
Level 3—Significant unobservable inputs (including the fund’s own assumptions used to determine the fair value of investments).
The following table summarizes the market value of the fund’s investments as of July 31, 2016, based on the inputs used to value them:
| | | |
| | Level 1 | Level 2 | Level 3 |
| Investments | ($000) | ($000) | ($000) |
| Real Estate Investment Trusts | 67,285,380 | — | — |
| Temporary Cash Investments | 113,686 | 3,100 | — |
| Swap Contracts—Assets | 782 | — | — |
| Total | 67,399,848 | 3,100 | — |
22
REIT Index Fund
D. At July 31, 2016, the fund had the following open total return swap contracts:
| | | | | |
| | | | | Floating | Unrealized |
| | | | Notional | Interest Rate | Appreciation |
| | Termination | | Amount | Received | (Depreciation) |
| Reference Entity | Date | Counterparty | ($000) | (Paid) | ($000) |
| Empire State Realty Trust Inc. | 10/19/16 | GSBUSA | 10,004 | (0.479%) | 782 |
| GSBUSA—Goldman Sachs Bank USA. | | | | | |
At July 31, 2016, the counterparty had deposited in segregated accounts securities with a value of $1,724,000 in connection with amounts due to the fund for open swap contracts.
E. Distributions are determined on a tax basis and may differ from net investment income and realized capital gains for financial reporting purposes. Differences may be permanent or temporary. Permanent differences are reclassified among capital accounts in the financial statements to reflect their tax character. Temporary differences arise when certain items of income, expense, gain, or loss are recognized in different periods for financial statement and tax purposes. These differences will reverse at some time in the future. Differences in classification may also result from the treatment of short-term gains as ordinary income for tax purposes.
During the six months ended July 31, 2016, the fund realized $657,721,000 of net capital gains resulting from in-kind redemptions—in which shareholders exchanged fund shares for securities held by the fund rather than for cash. Because such gains are not taxable to the fund, and are not distributed to shareholders, they have been reclassified from accumulated net realized gains to paid-in capital.
Realized and unrealized gains (losses) on certain of the fund’s swap contracts are treated as ordinary income (loss) for tax purposes. Realized gains of $8,763,000 on swap contracts have been reclassified from accumulated net realized gains to overdistributed net investment income.
The fund’s tax-basis capital gains and losses are determined only at the end of each fiscal year. For tax purposes, at January 31, 2016, the fund had available capital losses totaling $62,404,000 to offset future net capital gains. Of this amount, $49,403,000 is subject to expiration on January 31, 2018. Capital losses of $13,001,000 realized beginning in fiscal 2012 may be carried forward indefinitely under the Regulated Investment Company Modernization Act of 2010, but must be used before any expiring loss carryforwards. The fund will use these capital losses to offset net taxable capital gains, if any, realized during the year ending January 31, 2017; should the fund realize net capital losses for the year, the losses will be added to the loss carryforward balance above.
At July 31, 2016, the cost of investment securities for tax purposes was $51,639,617,000. Net unrealized appreciation of investment securities for tax purposes was $15,762,549,000, consisting of unrealized gains of $16,417,770,000 on securities that had risen in value since their purchase and $655,221,000 in unrealized losses on securities that had fallen in value since their purchase.
23
REIT Index Fund
F. During the six months ended July 31, 2016, the fund purchased $9,012,234,000 of investment securities and sold $3,659,070,000 of investment securities, other than temporary cash investments. Purchases and sales include $4,700,675,000 and $1,723,311,000, respectively, in connection with in-kind purchases and redemptions of the fund’s capital shares.
G. Capital share transactions for each class of shares were:
| | | | |
| | Six Months Ended | Year Ended |
| | July 31, 2016 | January 31, 2016 |
| | Amount | Shares | Amount | Shares |
| | ($000) | (000) | ($000) | (000) |
| Investor Shares | | | | |
| Issued | 297,642 | 10,645 | 559,943 | 20,973 |
| Issued in Lieu of Cash Distributions | 50,443 | 1,823 | 98,734 | 3,809 |
| Redeemed | (426,294) | (15,508) | (916,382) | (34,822) |
| Net Increase (Decrease)—Investor Shares | (78,209) | (3,040) | (257,705) | (10,040) |
| ETF Shares | | | | |
| Issued | 5,372,650 | 63,761 | 8,300,504 | 104,710 |
| Issued in Lieu of Cash Distributions | — | — | — | — |
| Redeemed | (1,566,437) | (19,000) | (7,463,843) | (95,100) |
| Net Increase (Decrease)—ETF Shares | 3,806,213 | 44,761 | 836,661 | 9,610 |
| Admiral Shares | | | | |
| Issued | 2,206,602 | 18,576 | 3,269,367 | 28,897 |
| Issued in Lieu of Cash Distributions | 299,523 | 2,535 | 524,621 | 4,749 |
| Redeemed | (1,285,896) | (10,951) | (2,735,119) | (24,294) |
| Net Increase (Decrease)—Admiral Shares | 1,220,229 | 10,160 | 1,058,869 | 9,352 |
| Institutional Shares | | | | |
| Issued | 927,045 | 50,108 | 1,828,326 | 104,466 |
| Issued in Lieu of Cash Distributions | 138,247 | 7,561 | 244,166 | 14,282 |
| Redeemed | (839,658) | (45,967) | (1,299,363) | (75,011) |
| Net Increase (Decrease)—Institutional Shares | 225,634 | 11,702 | 773,129 | 43,737 |
24
REIT Index Fund
H. Certain of the fund’s investments are in companies that are considered to be affiliated companies of the fund because the fund owns more than 5% of the outstanding voting securities of the company or the issuer is another member of The Vanguard Group. Transactions during the period in securities of these companies were as follows:
| | | | | | |
| | | Current Period Transactions | |
| January 31, | | Proceeds | | | July 31, |
| | 2016 | | from | | Capital Gain | 2016 |
| | Market | Purchases | Securities | | Distributions | Market |
| | Value | at Cost | Sold1 | Income | Received | Value |
| | ($000) | ($000) | ($000) | ($000) | ($000) | ($000) |
| Acadia Realty Trust | 170,801 | 24,258 | 9,559 | 1,933 | 654 | 204,427 |
| Agree Realty Corp. | 52,050 | 19,459 | 3,209 | 1,231 | — | 90,858 |
| Alexandria Real Estate Equities | | | | | | |
| Inc. | 416,568 | 65,554 | 27,499 | 6,574 | 1,284 | 634,509 |
| American Assets Trust Inc. | 91,654 | 11,756 | 4,600 | 1,014 | 18 | 120,394 |
| American Campus Communities | | | | | | |
| Inc. | 344,896 | 109,316 | 25,434 | 3,741 | 1,854 | 543,084 |
| American Homes 4 Rent Class A | 183,983 | 24,845 | 46,239 | 692 | — | NA2 |
| American Residential Properties | | | | | | |
| Inc. | 37,742 | 330 | 262 | — | — | NA2 |
| Apartment Investment & | | | | | | |
| Management Co. Class A | 445,234 | 58,174 | 28,787 | 1,244 | 6,359 | 554,311 |
| Apple Hospitality REIT Inc. | 221,790 | 27,363 | 15,087 | 6,724 | 321 | 259,832 |
| Ashford Hospitality Prime Inc. | 22,738 | 2,681 | 3,447 | 440 | — | 29,707 |
| Ashford Hospitality Trust Inc. | 38,693 | 4,381 | 2,089 | — | 150 | 43,859 |
| AvalonBay Communities Inc. | 1,658,413 | 254,833 | 96,559 | 17,095 | 10,330 | 1,958,446 |
| Boston Properties Inc. | 1,298,614 | 175,226 | 89,381 | 12,313 | 2,497 | 1,680,907 |
| Brandywine Realty Trust | 167,964 | 22,055 | 14,986 | 2,900 | 361 | 227,180 |
| Brixmor Property Group Inc. | — | 165,835 | 22,090 | 7,246 | — | 526,751 |
| Camden Property Trust | 482,237 | 64,858 | 32,858 | 5,460 | 4,208 | 599,662 |
| Campus Crest Communities Inc. | 32,564 | 227 | 33,252 | — | — | — |
| Care Capital Properties Inc. | 181,040 | 19,327 | 8,206 | 6,987 | — | 190,966 |
| CareTrust REIT Inc. | 34,305 | 15,195 | 2,572 | 1,302 | — | 63,508 |
| CBL & Associates Properties Inc. | 133,340 | 16,204 | 8,207 | 6,696 | — | 161,358 |
| Cedar Realty Trust Inc. | 37,071 | 10,715 | 1,687 | 35 | — | 52,655 |
| Chatham Lodging Trust | 52,607 | 6,518 | 2,947 | 1,804 | 37 | 70,746 |
| Chesapeake Lodging Trust | 109,064 | 13,098 | 5,941 | 3,431 | — | 116,991 |
| Columbia Property Trust Inc. | 192,576 | 22,361 | 13,442 | 3,492 | — | 219,565 |
| CoreSite Realty Corp. | 140,593 | 22,330 | 9,016 | 2,390 | — | NA3 |
| Corporate Office Properties Trust | 153,354 | 22,277 | 10,981 | 2,245 | 1,164 | 218,141 |
| Corrections Corp. of America | 245,510 | 33,650 | 16,664 | 7,563 | — | 289,374 |
| Cousins Properties Inc. | 129,102 | 17,879 | 12,323 | 2,406 | 5 | 164,579 |
| CubeSmart | 385,206 | 57,621 | 19,251 | 4,552 | 901 | 402,011 |
| CyrusOne Inc. | 168,756 | 49,891 | 13,417 | 2,088 | — | 297,339 |
25
REIT Index Fund
| | | | | | |
| | | Current Period Transactions | |
| | January 31, | | Proceeds | | | July 31, |
| | 2016 | | from | | Capital Gain | 2016 |
| | Market | Purchases | Securities | | Distributions | Market |
| | Value | at Cost | Sold1 | Income | Received | Value |
| | ($000) | ($000) | ($000) | ($000) | ($000) | ($000) |
| DCT Industrial Trust Inc. | 230,020 | 32,811 | 15,654 | 3,622 | 113 | 342,163 |
| DDR Corp. | 383,192 | 50,716 | 23,308 | 1,585 | 424 | 471,973 |
| DiamondRock Hospitality Co. | 121,225 | 16,244 | 8,061 | 3,028 | 360 | 151,826 |
| Digital Realty Trust Inc. | 791,470 | 192,303 | 48,894 | 17,218 | 2,012 | 1,200,212 |
| Douglas Emmett Inc. | 299,109 | 39,720 | 17,478 | 1,505 | — | 409,993 |
| Duke Realty Corp. | 505,731 | 72,965 | 35,446 | 3,535 | 5,402 | 766,798 |
| DuPont Fabros Technology Inc. | 157,777 | 48,779 | 12,520 | 5,118 | — | 269,896 |
| Easterly Government Properties | | | | | | |
| Inc. | — | 25,036 | 828 | 776 | — | 48,562 |
| EastGroup Properties Inc. | 125,524 | 17,724 | 8,281 | 2,658 | 80 | 183,674 |
| Education Realty Trust Inc. | 177,424 | 23,159 | 11,510 | 3,066 | 2 | 231,375 |
| EPR Properties | 252,113 | 61,872 | 14,694 | 7,095 | — | 409,579 |
| Equinix Inc. | 1,507,139 | 263,249 | 97,258 | 17,138 | — | 1,981,772 |
| Equity Commonwealth | 241,186 | 28,685 | 21,055 | — | — | 276,579 |
| Equity LifeStyle Properties Inc. | 384,029 | 52,950 | 25,442 | 4,532 | 490 | 508,907 |
| Equity Residential | 2,042,285 | 228,750 | 116,178 | 38,263 | 198,975 | 1,911,586 |
| Essex Property Trust Inc. | 1,019,484 | 132,127 | 75,099 | 12,824 | 2,774 | 1,177,973 |
| Extra Space Storage Inc. | 770,152 | 143,231 | 42,514 | 11,377 | 51 | 822,108 |
| Federal Realty Investment Trust | 758,676 | 98,263 | 44,810 | 9,562 | 129 | 910,377 |
| FelCor Lodging Trust Inc. | 68,987 | 7,639 | 5,387 | 403 | — | 64,856 |
| First Industrial Realty Trust Inc. | 165,937 | 34,390 | 11,643 | 2,866 | 343 | 265,191 |
| First Potomac Realty Trust | 41,900 | 3,951 | 2,141 | 491 | 69 | 45,233 |
| Four Corners Property Trust Inc. | — | 78,162 | 3,012 | 2,012 | — | 95,097 |
| Franklin Street Properties Corp. | 64,052 | 7,936 | 3,521 | 1,904 | 100 | 89,011 |
| Gaming and Leisure Properties | | | | | | |
| Inc. | 173,869 | 251,748 | 7,483 | 11,113 | 299 | 511,961 |
| General Growth Properties Inc. | — | 147,897 | 80,051 | 12,565 | 3,775 | 1,411,199 |
| GEO Group Inc. | 160,673 | 21,543 | 10,634 | 9,257 | — | 199,082 |
| Getty Realty Corp. | 34,742 | 4,480 | 2,023 | 746 | 246 | 46,812 |
| Global Net Lease Inc. | 86,098 | 11,939 | 5,884 | 3,499 | — | 113,592 |
| Government Properties Income | | | | | | |
| Trust | 71,036 | 11,134 | 4,818 | 2,863 | 384 | 130,714 |
| Gramercy Property Trust | 223,553 | 31,840 | 15,592 | 6,859 | — | 323,385 |
| HCP Inc. | 1,209,735 | 142,329 | 66,222 | 35,429 | 1,657 | 1,406,228 |
| Healthcare Realty Trust Inc. | 212,202 | 64,151 | 12,372 | 1,706 | 796 | 319,254 |
| Healthcare Trust of America Inc. | | | | | | |
| Class A | 259,182 | 40,761 | 15,777 | 4,440 | — | 342,198 |
| Hersha Hospitality Trust Class A | 54,991 | 10,610 | 5,358 | 1,668 | — | 64,739 |
26
REIT Index Fund
| | | | | | |
| | | Current Period Transactions | |
| January 31, | | Proceeds | | | July 31, |
| | 2016 | | from | | Capital Gain | 2016 |
| | Market | Purchases | Securities | | Distributions | Market |
| | Value | at Cost | Sold1 | Income | Received | Value |
| | ($000) | ($000) | ($000) | ($000) | ($000) | ($000) |
| Highwoods Properties Inc. | 289,601 | 43,219 | 15,963 | 4,746 | 801 | 412,330 |
| Hospitality Properties Trust | 260,007 | 35,769 | 17,658 | 11,195 | — | 372,372 |
| Host Hotels & Resorts Inc. | 756,975 | 108,093 | 54,364 | 16,872 | 5,438 | 1,027,589 |
| Hudson Pacific Properties Inc. | 140,618 | 92,755 | 9,978 | 1,303 | — | 279,663 |
| Inland Real Estate Corp. | 70,486 | 1,647 | 71,409 | 285 | — | — |
| Investors Real Estate Trust | 59,539 | 6,583 | 4,436 | 719 | 304 | 62,459 |
| Iron Mountain Inc. | 401,371 | 208,425 | 34,098 | 15,507 | — | 800,905 |
| Kilroy Realty Corp. | 374,829 | 51,495 | 25,774 | 3,254 | 507 | 520,175 |
| Kimco Realty Corp. | 817,371 | 107,708 | 53,825 | 4,259 | 7,666 | 1,022,562 |
| Kite Realty Group Trust | 160,639 | 14,834 | 4,787 | 2,918 | 147 | 195,408 |
| LaSalle Hotel Properties | 182,397 | 23,778 | 12,182 | 7,457 | 83 | 239,660 |
| Lexington Realty Trust | 113,445 | 16,488 | 8,392 | 2,710 | 37 | 177,193 |
| Liberty Property Trust | 319,745 | 45,393 | 30,906 | 7,506 | 2,346 | 465,869 |
| LTC Properties Inc. | 112,602 | 22,698 | 5,578 | 2,266 | 215 | 154,681 |
| Macerich Co. | 763,505 | 94,181 | 95,196 | 6,469 | 6,260 | 871,145 |
| Mack-Cali Realty Corp. | 128,020 | 18,144 | 7,874 | 1,406 | 148 | 184,837 |
| Medical Properties Trust Inc. | 187,231 | 29,556 | 12,741 | 5,942 | 154 | 286,233 |
| Mid-America Apartment | | | | | | |
| Communities Inc. | 514,589 | 67,926 | 34,472 | 8,618 | 479 | 615,790 |
| Monmouth Real Estate | | | | | | |
| Investment Corp. | 41,025 | 7,828 | 2,071 | 439 | 91 | 61,631 |
| Monogram Residential Trust Inc. | 100,378 | 13,395 | 6,441 | 1,762 | — | 130,576 |
| National Health Investors Inc. | 157,530 | 35,799 | 10,138 | 4,187 | 423 | 232,415 |
| National Retail Properties Inc. | 420,011 | 80,505 | 23,291 | 7,505 | 81 | 583,903 |
| National Storage Affiliates Trust | — | 55,096 | 433 | 381 | — | 55,440 |
| New Senior Investment Group Inc. | 57,894 | 6,829 | 9,676 | 2,101 | — | 72,033 |
| New York REIT Inc. | 121,559 | 14,797 | 6,224 | 925 | 19 | 121,292 |
| NorthStar Realty Europe Corp. | 39,755 | 9,213 | 2,549 | 1,350 | — | 44,969 |
| NorthStar Realty Finance Corp. | 157,525 | 25,024 | 13,498 | 7,396 | — | 190,333 |
| Omega Healthcare Investors Inc. | 426,777 | 57,691 | 22,917 | 12,538 | — | 499,770 |
| One Liberty Properties Inc. | 19,954 | 2,505 | 2,367 | 435 | 354 | 24,195 |
| Paramount Group Inc. | 189,849 | 34,894 | 10,396 | 1,628 | — | 230,417 |
| Parkway Properties Inc. | 82,026 | 10,829 | 4,767 | 1,313 | 101 | 112,074 |
| Pebblebrook Hotel Trust | 127,666 | 16,867 | 8,240 | 4,054 | — | 164,281 |
| Pennsylvania REIT | 98,553 | 12,823 | 6,040 | 95 | — | 135,720 |
| Physicians Realty Trust | 131,251 | 54,415 | 9,776 | 3,049 | — | 219,072 |
| Piedmont Office Realty Trust Inc. | | | | | | |
| Class A | 203,823 | 24,428 | 19,937 | 1,913 | 1,048 | 245,130 |
27
REIT Index Fund
| | | | | | |
| | | Current Period Transactions | |
| January 31, | | Proceeds | | | July 31, |
| | 2016 | | from | | Capital Gain | 2016 |
| | Market | Purchases | Securities | | Distributions | Market |
| | Value | at Cost | Sold1 | Income | Received | Value |
| | ($000) | ($000) | ($000) | ($000) | ($000) | ($000) |
| Post Properties Inc. | 227,617 | 27,843 | 18,040 | 1,245 | 2,512 | 262,735 |
| Prologis Inc. | 1,505,298 | 215,873 | 106,306 | 8,702 | 23,861 | 2,201,796 |
| PS Business Parks Inc. | 127,430 | 17,728 | 8,380 | 2,249 | — | 173,151 |
| Public Storage | 2,712,576 | 339,494 | 171,851 | 38,134 | — | 2,709,445 |
| QTS Realty Trust Inc. Class A | 130,933 | 46,244 | 9,434 | 2,289 | — | 206,351 |
| RAIT Financial Trust | 16,910 | 2,239 | 938 | 504 | 218 | 22,294 |
| Ramco-Gershenson Properties | | | | | | |
| Trust | 98,454 | 12,360 | 5,979 | 2,135 | 64 | 121,011 |
| Realty Income Corp. | 953,458 | 194,029 | 57,550 | 15,622 | — | 1,378,085 |
| Regency Centers Corp. | 495,998 | 83,294 | 31,150 | 5,550 | 624 | 638,308 |
| Retail Opportunity Investments | | | | | | |
| Corp. | 132,869 | 27,646 | 7,047 | 1,551 | 111 | 186,079 |
| Retail Properties of America Inc. | 267,703 | 33,658 | 16,797 | 3,567 | — | 322,116 |
| Rexford Industrial Realty Inc. | 50,087 | 38,233 | 4,580 | 1,181 | 24 | 113,846 |
| RLJ Lodging Trust | 174,044 | 22,355 | 19,958 | 6,128 | — | 227,877 |
| Rouse Properties Inc. | 51,719 | 4,990 | 1,660 | — | — | — |
| Ryman Hospitality Properties Inc. | 157,637 | 20,739 | 10,495 | 4,829 | 204 | 199,885 |
| Sabra Health Care REIT Inc. | 87,029 | 11,630 | 5,511 | 1,696 | 89 | 120,046 |
| Select Income REIT | 92,154 | 13,662 | 6,456 | 4,316 | 760 | 143,300 |
| Senior Housing Properties Trust | 250,111 | 39,021 | 19,000 | 8,017 | 582 | 406,118 |
| Seritage Growth Properties | | | | | | |
| Class A | 70,269 | 9,131 | 12,812 | 878 | — | 85,910 |
| Silver Bay Realty Trust Corp. | 34,765 | 4,330 | 1,894 | — | — | 47,672 |
| Simon Property Group Inc. | 4,193,915 | 569,001 | 289,920 | 70,898 | 1,976 | 5,409,224 |
| SL Green Realty Corp. | 700,929 | 89,370 | 43,025 | 5,308 | 5,361 | 907,715 |
| Sovran Self Storage Inc. | 319,859 | 89,656 | 20,008 | 6,024 | — | 358,415 |
| Spirit Realty Capital Inc. | 336,675 | 76,057 | 24,099 | 7,392 | 1,104 | 500,148 |
| STAG Industrial Inc. | 83,885 | 11,496 | 4,905 | 2,278 | 23 | 133,284 |
| STORE Capital Corp. | — | 166,201 | 13,672 | 5,145 | — | 364,172 |
| Summit Hotel Properties Inc. | 63,978 | 8,421 | 3,563 | 693 | — | 94,841 |
| Sun Communities Inc. | 252,039 | 79,506 | 17,825 | 2,064 | 1,045 | 369,341 |
| Sunstone Hotel Investors Inc. | 185,934 | 24,685 | 12,082 | 1,319 | 284 | 221,275 |
| Tanger Factory Outlet Centers | | | | | | |
| Inc. | 223,094 | 30,972 | 15,212 | 4,203 | 45 | 308,189 |
| Taubman Centers Inc. | 314,608 | 37,878 | 22,343 | 4,727 | 1 | 375,342 |
| Terreno Realty Corp. | 66,683 | 12,600 | 3,690 | 1,159 | — | 93,150 |
| Tier REIT Inc. | 48,720 | 10,128 | 2,324 | 1,271 | — | 64,180 |
| UDR Inc. | 678,523 | 84,792 | 43,677 | 8,387 | 3,207 | 751,453 |
28
REIT Index Fund
| | | | | | |
| | | Current Period Transactions | |
| | January 31, | | Proceeds | | | July 31, |
| | 2016 | | from | | Capital Gain | 2016 |
| | Market | Purchases | Securities | | Distributions | Market |
| | Value | at Cost | Sold1 | Income | Received | Value |
| | ($000) | ($000) | ($000) | ($000) | ($000) | ($000) |
| Universal Health Realty Income | | | | | | |
| Trust | 46,780 | 5,671 | 2,543 | 1,044 | 167 | 58,178 |
| Urban Edge Properties | 175,563 | 23,159 | 11,307 | 2,936 | — | 228,763 |
| Vanguard Market Liquidity Fund | 229,188 | NA4 | NA 4 | 115 | — | 113,686 |
| Ventas Inc. | 1,331,908 | 204,079 | 82,891 | 34,637 | 1,171 | 1,970,811 |
| VEREIT Inc. | 507,748 | 73,159 | 71,660 | 16,541 | 1,447 | 732,023 |
| Vornado Realty Trust | 1,091,975 | 144,746 | 73,793 | 5,285 | 2,642 | 1,403,538 |
| Washington REIT | 125,120 | 27,984 | 8,507 | 1,893 | 81 | 192,634 |
| Weingarten Realty Investors | 298,894 | 39,981 | 20,100 | 4,157 | 2,105 | 391,613 |
| Welltower Inc. | 1,593,124 | 225,586 | 99,038 | 38,545 | 5,775 | 2,169,330 |
| Whitestone REIT | 21,604 | 3,048 | 1,367 | 680 | 120 | 33,626 |
| Winthrop Realty Trust | 29,655 | 2,735 | 1,336 | — | — | 21,750 |
| WP Carey Inc. | 420,341 | 56,821 | 28,243 | 13,967 | 75 | 555,506 |
| WP Glimcher Inc. | 122,417 | 16,334 | 7,625 | 6,770 | — | 181,025 |
| Xenia Hotels & Resorts Inc. | 112,932 | 21,048 | 6,673 | 4,445 | — | 154,465 |
| | 49,463,656 | | | 869,300 | 331,004 | 65,760,889 |
1 Includes net realized gain (loss) on affiliated investment securities sold of $546,474,000.
2 Not applicable—in March 2016, American Residential Properties Inc. merged with American Homes 4 Rent Class A.
3 Not applicable—at July 31, 2016, the security was still held, but issuer was no longer an affiliated company of the fund.
4 Not applicable—purchases and sales are for temporary cash investment purposes.
I. Management has determined that no material events or transactions occurred subsequent to July 31, 2016, that would require recognition or disclosure in these financial statements.
29
About Your Fund’s Expenses
As a shareholder of the fund, you incur ongoing costs, which include costs for portfolio management, administrative services, and shareholder reports (like this one), among others. Operating expenses, which are deducted from a fund’s gross income, directly reduce the investment return of the fund.
A fund’s expenses are expressed as a percentage of its average net assets. This figure is known as the expense ratio. The following examples are intended to help you understand the ongoing costs (in dollars) of investing in your fund and to compare these costs with those of other mutual funds. The examples are based on an investment of $1,000 made at the beginning of the period shown and held for the entire period.
The accompanying table illustrates your fund’s costs in two ways:
• Based on actual fund return. This section helps you to estimate the actual expenses that you paid over the period. The ”Ending Account Value“ shown is derived from the fund‘s actual return, and the third column shows the dollar amount that would have been paid by an investor who started with $1,000 in the fund. You may use the information here, together with the amount you invested, to estimate the expenses that you paid over the period.
To do so, simply divide your account value by $1,000 (for example, an $8,600 account value divided by $1,000 = 8.6), then multiply the result by the number given for your fund under the heading ”Expenses Paid During Period.“
• Based on hypothetical 5% yearly return. This section is intended to help you compare your fund‘s costs with those of other mutual funds. It assumes that the fund had a yearly return of 5% before expenses, but that the expense ratio is unchanged. In this case—because the return used is not the fund’s actual return—the results do not apply to your investment. The example is useful in making comparisons because the Securities and Exchange Commission requires all mutual funds to calculate expenses based on a 5% return. You can assess your fund’s costs by comparing this hypothetical example with the hypothetical examples that appear in shareholder reports of other funds.
Note that the expenses shown in the table are meant to highlight and help you compare ongoing costs only and do not reflect transaction costs incurred by the fund for buying and selling securities. Further, the expenses do not include any purchase, redemption, or account service fees described in the fund prospectus. If such fees were applied to your account, your costs would be higher. Your fund does not carry a “sales load.”
The calculations assume no shares were bought or sold during the period. Your actual costs may have been higher or lower, depending on the amount of your investment and the timing of any purchases or redemptions.
You can find more information about the fund’s expenses, including annual expense ratios, in the Financial Statements section of this report. For additional information on operating expenses and other shareholder costs, please refer to your fund’s current prospectus.
30
| | | |
| Six Months Ended July 31, 2016 | | | |
| | Beginning | Ending | Expenses |
| | Account Value | Account Value | Paid During |
| REIT Index Fund | 1/31/2016 | 7/31/2016 | Period |
| Based on Actual Fund Return | | | |
| Investor Shares | $1,000.00 | $1,222.76 | $1.44 |
| ETF Shares | 1,000.00 | 1,223.50 | 0.66 |
| Admiral Shares | 1,000.00 | 1,223.52 | 0.66 |
| Institutional Shares | 1,000.00 | 1,223.80 | 0.55 |
| Based on Hypothetical 5% Yearly Return | | | |
| Investor Shares | $1,000.00 | $1,023.57 | $1.31 |
| ETF Shares | 1,000.00 | 1,024.27 | 0.60 |
| Admiral Shares | 1,000.00 | 1,024.27 | 0.60 |
| Institutional Shares | 1,000.00 | 1,024.37 | 0.50 |
The calculations are based on expenses incurred in the most recent six-month period. The fund’s annualized six-month expense ratios for that
period are 0.26% for Investor Shares, 0.12% for ETF Shares, 0.12% for Admiral Shares, and 0.10% for Institutional Shares. The dollar
amounts shown as “Expenses Paid” are equal to the annualized expense ratio multiplied by the average account value over the period,
multiplied by the number of days in the most recent six-month period, then divided by the number of days in the most recent 12-month period
(182/366).
31
Trustees Approve Advisory Arrangement
The board of trustees of Vanguard REIT Index Fund has renewed the fund’s investment advisory arrangement with The Vanguard Group, Inc. (Vanguard)—through its Equity Index Group. The board determined that continuing the fund’s internalized management structure was in the best interests of the fund and its shareholders.
The board based its decision upon an evaluation of the advisor’s investment staff, portfolio management process, and performance. The trustees considered the factors discussed below, among others. However, no single factor determined whether the board approved the arrangement. Rather, it was the totality of the circumstances that drove the board’s decision.
Nature, extent, and quality of services
The board reviewed the quality of the fund’s investment management services over both the short and long term and took into account the organizational depth and stability of the advisor. The board considered that Vanguard has been managing investments for more than three decades. The Equity Index Group adheres to a sound, disciplined investment management process; the team has considerable experience, stability, and depth.
The board concluded that Vanguard’s experience, stability, depth, and performance, among other factors, warranted continuation of the advisory arrangement.
Investment performance
The board considered the short- and long-term performance of the fund, including any periods of outperformance or underperformance relative to a target index and peer group. The board concluded that the performance was such that the advisory arrangement should continue. Information about the fund’s most recent performance can be found in the Performance Summary section of this report.
Cost
The board concluded that the fund’s expense ratio was well below the average expense ratio charged by funds in its peer group and that the fund’s advisory fee rate was also well below its peer-group average. Information about the fund’s expenses appears in the About Your Fund’s Expenses section of this report as well as in the Financial Statements section.
The board does not conduct a profitability analysis of Vanguard because of Vanguard’s unique “at-cost” structure. Unlike most other mutual fund management companies, Vanguard is owned by the funds it oversees and produces “profits” only in the form of reduced expenses for fund shareholders.
The benefit of economies of scale
The board concluded that the fund’s at-cost arrangement with Vanguard ensures that the fund will realize economies of scale as it grows, with the cost to shareholders declining as the fund’s assets increase.
The board will consider whether to renew the advisory arrangement again after a one-year period.
32
Glossary
Beta. A measure of the magnitude of a fund’s past share-price fluctuations in relation to the ups and downs of a given market index. The index is assigned a beta of 1.00. Compared with a given index, a fund with a beta of 1.20 typically would have seen its share price rise or fall by 12% when the index rose or fell by 10%. For this report, beta is based on returns over the past 36 months for both the fund and the index. Note that a fund’s beta should be reviewed in conjunction with its R-squared (see definition). The lower the R-squared, the less correlation there is between the fund and the index, and the less reliable beta is as an indicator of volatility.
Dividend Yield. Dividend income earned by stocks, expressed as a percentage of the aggregate market value (or of net asset value, for a fund). The yield is determined by dividing the amount of the annual dividends by the aggregate value (or net asset value) at the end of the period. For a fund, the dividend yield is based solely on stock holdings and does not include any income produced by other investments. This yield may include some payments that represent a return of capital, capital gains distributions, or both by the underlying stocks.
Earnings Growth Rate. The average annual rate of growth in earnings over the past five years for the stocks now in a fund.
Expense Ratio. A fund’s total annual operating expenses expressed as a percentage of the fund’s average net assets. The expense ratio includes management and administrative expenses, but does not include the transaction costs of buying and selling portfolio securities.
Foreign Holdings. The percentage of a fund represented by securities or depositary receipts of companies based outside the United States.
Inception Date. The date on which the assets of a fund (or one of its share classes) are first invested in accordance with the fund’s investment objective. For funds with a subscription period, the inception date is the day after that period ends. Investment performance is measured from the inception date.
Median Market Cap. An indicator of the size of companies in which a fund invests; the midpoint of market capitalization (market price x shares outstanding) of a fund’s stocks, weighted by the proportion of the fund’s assets invested in each stock. Stocks representing half of the fund’s assets have market capitalizations above the median, and the rest are below it.
Price/Book Ratio. The share price of a stock divided by its net worth, or book value, per share. For a fund, the weighted average price/book ratio of the stocks it holds.
Price/Earnings Ratio. The ratio of a stock’s current price to its per-share earnings over the past year. For a fund, the weighted average P/E of the stocks it holds. P/E is an indicator of market expectations about corporate prospects; the higher the P/E, the greater the expectations for a company’s future growth.
R-Squared. A measure of how much of a fund’s past returns can be explained by the returns from the market in general, as measured by a given index. If a fund’s total returns were precisely synchronized with an index’s returns, its R-squared would be 1.00. If the fund’s returns bore no relationship to the index’s returns, its R-squared would be 0. For this report, R-squared is based on returns over the past 36 months for both the fund and the index.
33
Return on Equity. The annual average rate of return generated by a company during the past five years for each dollar of shareholder’s equity (net income divided by shareholder’s equity). For a fund, the weighted average return on equity for the companies whose stocks it holds.
Short-Term Reserves. The percentage of a fund invested in highly liquid, short-term securities that can be readily converted to cash.
Turnover Rate. An indication of the fund’s trading activity. Funds with high turnover rates incur higher transaction costs and may be more likely to distribute capital gains (which may be taxable to investors). The turnover rate excludes in-kind transactions, which have minimal impact on costs.
Benchmark Information
REIT Spliced Index: MSCI US REIT Index adjusted to include a 2% cash position (Lipper Money
Market Average) through April 30, 2009; MSCI US REIT Index thereafter.
34
This page intentionally left blank.
The People Who Govern Your Fund
The trustees of your mutual fund are there to see that the fund is operated and managed in your best interests since, as a shareholder, you are a part owner of the fund. Your fund’s trustees also serve on the board of directors of The Vanguard Group, Inc., which is owned by the Vanguard funds and provides services to them on an at-cost basis.
A majority of Vanguard’s board members are independent, meaning that they have no affiliation with Vanguard or the funds they oversee, apart from the sizable personal investments they have made as private individuals. The independent board members have distinguished backgrounds in business, academia, and public service. Each of the trustees and executive officers oversees 198 Vanguard funds.
The following table provides information for each trustee and executive officer of the fund. More information about the trustees is in the Statement of Additional Information, which can be obtained, without charge, by contacting Vanguard at 800-662-7447, or online at vanguard.com.
| |
| InterestedTrustee1 | Rajiv L. Gupta |
| | Born 1945. Trustee Since December 2001.2 Principal |
| F. William McNabb III | Occupation(s) During the Past Five Years and Other |
| Born 1957. Trustee Since July 2009. Chairman of | Experience: Chairman and Chief Executive Officer |
| the Board. Principal Occupation(s) During the Past | (retired 2009) and President (2006–2008) of |
| Five Years and Other Experience: Chairman of the | Rohm and Haas Co. (chemicals); Director of Tyco |
| Board of The Vanguard Group, Inc., and of each of | International plc (diversified manufacturing and |
| the investment companies served by The Vanguard | services), HP Inc. (printer and personal computer |
| Group, since January 2010; Director of The Vanguard | manufacturing), and Delphi Automotive plc |
| Group since 2008; Chief Executive Officer and | (automotive components); Senior Advisor at |
| President of The Vanguard Group, and of each of | New Mountain Capital. |
| the investment companies served by The Vanguard | |
| Group, since 2008; Director of Vanguard Marketing | Amy Gutmann |
| Corporation; Managing Director of The Vanguard | Born 1949. Trustee Since June 2006. Principal |
| Group (1995–2008). | Occupation(s) During the Past Five Years and |
| | Other Experience: President of the University of |
| IndependentTrustees | Pennsylvania; Christopher H. Browne Distinguished |
| | Professor of Political Science, School of Arts and |
| Emerson U. Fullwood | Sciences, and Professor of Communication, Annenberg |
| Born 1948. Trustee Since January 2008. Principal | School for Communication, with secondary faculty |
| Occupation(s) During the Past Five Years and Other | appointments in the Department of Philosophy, School |
| Experience: Executive Chief Staff and Marketing | of Arts and Sciences, and at the Graduate School of |
| Officer for North America and Corporate Vice President | Education, University of Pennsylvania; Trustee of the |
| (retired 2008) of Xerox Corporation (document manage- | National Constitution Center; Chair of the Presidential |
| ment products and services); Executive in Residence | Commission for the Study of Bioethical Issues. |
| and 2009–2010 Distinguished Minett Professor at | |
| the Rochester Institute of Technology; Lead Director | JoAnn Heffernan Heisen |
| of SPX FLOW, Inc. (multi-industry manufacturing); | Born 1950. Trustee Since July 1998. Principal |
| Director of the United Way of Rochester, the University | Occupation(s) During the Past Five Years and |
| of Rochester Medical Center, Monroe Community | Other Experience: Corporate Vice President and |
| College Foundation, North Carolina A&T University, | Chief Global Diversity Officer (retired 2008) and |
| and Roberts Wesleyan College. | Member of the Executive Committee (1997–2008) |
| | of Johnson & Johnson (pharmaceuticals/medical |
| | devices/consumer products); Director of Skytop |
| | Lodge Corporation (hotels) and the Robert Wood |
| | Johnson Foundation; Member of the Advisory |
| | Board of the Institute for Women’s Leadership |
| | at Rutgers University. |
| | |
| F. Joseph Loughrey | Executive Officers | |
| Born 1949. Trustee Since October 2009. Principal | | |
| Occupation(s) During the Past Five Years and Other | Glenn Booraem | |
| Experience: President and Chief Operating Officer | Born 1967. Treasurer Since May 2015. Principal |
| (retired 2009) of Cummins Inc. (industrial machinery); | Occupation(s) During the Past Five Years and |
| Chairman of the Board of Hillenbrand, Inc. (specialized | Other Experience: Principal of The Vanguard Group, |
| consumer services), and of Oxfam America; Director | Inc.; Treasurer of each of the investment companies |
| of SKF AB (industrial machinery), Hyster-Yale Materials | served by The Vanguard Group; Controller of each of |
| Handling, Inc. (forklift trucks), the Lumina Foundation | the investment companies served by The Vanguard |
| for Education, and the V Foundation for Cancer | Group (2010–2015); Assistant Controller of each of |
| Research; Member of the Advisory Council for the | the investment companies served by The Vanguard |
| College of Arts and Letters and of the Advisory Board | Group (2001–2010). | |
| to the Kellogg Institute for International Studies, both | | |
| at the University of Notre Dame. | Thomas J. Higgins | |
| Born 1957. Chief Financial Officer Since September |
| Mark Loughridge | 2008. Principal Occupation(s) During the Past Five |
| Born 1953. Trustee Since March 2012. Principal | Years and Other Experience: Principal of The Vanguard |
| Occupation(s) During the Past Five Years and Other | Group, Inc.; Chief Financial Officer of each of the |
| Experience: Senior Vice President and Chief Financial | investment companies served by The Vanguard Group; |
| Officer (retired 2013) at IBM (information technology | Treasurer of each of the investment companies served |
| services); Fiduciary Member of IBM’s Retirement Plan | by The Vanguard Group (1998–2008). |
| Committee (2004–2013); Director of the Dow Chemical | | |
| Company; Member of the Council on Chicago Booth. | Peter Mahoney | |
| Born 1974. Controller Since May 2015. Principal |
| Scott C. Malpass | Occupation(s) During the Past Five Years and |
| Born 1962. Trustee Since March 2012. Principal | Other Experience: Head of Global Fund Accounting |
| Occupation(s) During the Past Five Years and Other | at The Vanguard Group, Inc.; Controller of each of the |
| Experience: Chief Investment Officer and Vice | investment companies served by The Vanguard Group; |
| President at the University of Notre Dame; Assistant | Head of International Fund Services at The Vanguard |
| Professor of Finance at the Mendoza College of | Group (2008–2014). | |
| Business at Notre Dame; Member of the Notre Dame | | |
| 403(b) Investment Committee, the Board of Advisors | Heidi Stam | |
| for Spruceview Capital Partners, and the Investment | Born 1956. Secretary Since July 2005. Principal |
| Advisory Committee of Major League Baseball; Board | Occupation(s) During the Past Five Years and Other |
| Member of TIFF Advisory Services, Inc., and Catholic | Experience: Managing Director of The Vanguard |
| Group, Inc.; General Counsel of The Vanguard Group; |
| Investment Services, Inc. (investment advisors). | Secretary of The Vanguard Group and of each of the |
| André F. Perold | investment companies served by The Vanguard Group; |
| Born 1952. Trustee Since December 2004. Principal | Director and Senior Vice President of Vanguard |
| Occupation(s) During the Past Five Years and Other | Marketing Corporation. | |
| Experience: George Gund Professor of Finance and | | |
| Banking, Emeritus at the Harvard Business School | Vanguard Senior ManagementTeam |
| (retired 2011); Chief Investment Officer and Managing | Mortimer J. Buckley | James M. Norris |
| Partner of HighVista Strategies LLC (private investment | Kathleen C. Gubanich | Thomas M. Rampulla |
| firm); Director of Rand Merchant Bank; Overseer of | Martha G. King | Glenn W. Reed |
| the Museum of Fine Arts Boston. | John T. Marcante | Karin A. Risi |
| Chris D. McIsaac | Michael Rollings |
| Peter F. Volanakis | | |
| Born 1955. Trustee Since July 2009. Principal | | |
| Occupation(s) During the Past Five Years and | Chairman Emeritus and Senior Advisor |
| Other Experience: President and Chief Operating | | |
| Officer (retired 2010) of Corning Incorporated | John J. Brennan | |
| (communications equipment); Chairman of the | Chairman, 1996–2009 | |
| Board of Trustees of Colby-Sawyer College; | Chief Executive Officer and President, 1996–2008 |
| Member of the Advisory Board of the Norris | | |
| Cotton Cancer Center. | Founder | |
| | John C. Bogle | |
| | Chairman and Chief Executive Officer, 1974–1996 |
1 Mr. McNabb is considered an “interested person,” as defined in the Investment Company Act of 1940, because he is an officer of the Vanguard funds.
2 December 2002 for Vanguard Equity Income Fund, the Vanguard Municipal Bond Funds, and the Vanguard State Tax-Exempt Funds.
|  |
| | P.O. Box 2600 |
| | Valley Forge, PA 19482-2600 |
| |
| |
| |
| Connect with Vanguard® > vanguard.com |
| |
| |
| |
| Fund Information > 800-662-7447 | The funds or securities referred to herein are not |
| Direct Investor Account Services > 800-662-2739 | sponsored, endorsed, or promoted by MSCI, and MSCI |
| | bears no liability with respect to any such funds or |
| Institutional Investor Services > 800-523-1036 | securities. The prospectus or the Statement of |
| Text Telephone for People | Additional Information contains a more detailed |
| Who Are Deaf or Hard of Hearing> 800-749-7273 | description of the limited relationship MSCI has with |
| | Vanguard and any related funds. |
| This material may be used in conjunction | |
| with the offering of shares of any Vanguard | |
| fund only if preceded or accompanied by | |
| the fund’s current prospectus. | |
| |
| All comparative mutual fund data are from Lipper, a | |
| Thomson Reuters Company, or Morningstar, Inc., unless | |
| otherwise noted. | |
| |
| You can obtain a free copy of Vanguard’s proxy voting | |
| guidelines by visiting vanguard.com/proxyreporting or by | |
| calling Vanguard at 800-662-2739. The guidelines are | |
| also available from the SEC’s website, sec.gov. In | |
| addition, you may obtain a free report on how your fund | |
| voted the proxies for securities it owned during the 12 | |
| months ended June 30. To get the report, visit either | |
| vanguard.com/proxyreporting or sec.gov. | |
| |
| You can review and copy information about your fund at | |
| the SEC’s Public Reference Room in Washington, D.C. To | |
| find out more about this public service, call the SEC at | |
| 202-551-8090. Information about your fund is also | |
| available on the SEC’s website, and you can receive | |
| copies of this information, for a fee, by sending a | |
| request in either of two ways: via email addressed to | |
| publicinfo@sec.gov or via regular mail addressed to the | |
| Public Reference Section, Securities and Exchange | |
| Commission, Washington, DC 20549-1520. | |
| |
| | © 2016 The Vanguard Group, Inc. |
| | All rights reserved. |
| | Vanguard Marketing Corporation, Distributor. |
| |
| | Q1232 092016 |

Semiannual Report | July 31, 2016
Vanguard Dividend Growth Fund
Vanguard’s Principles for Investing Success
We want to give you the best chance of investment success. These principles, grounded in Vanguard’s research and experience, can put you on the right path.
Goals. Create clear, appropriate investment goals.
Balance. Develop a suitable asset allocation using broadly diversified funds. Cost. Minimize cost.
Discipline. Maintain perspective and long-term discipline.
A single theme unites these principles: Focus on the things you can control.
We believe there is no wiser course for any investor.
| |
| Contents | |
| Your Fund’s Total Returns. | 1 |
| Chairman’s Letter. | 2 |
| Advisor’s Report. | 7 |
| Fund Profile. | 10 |
| Performance Summary. | 11 |
| Financial Statements. | 12 |
| About Your Fund’s Expenses. | 21 |
| Glossary. | 23 |
Please note: The opinions expressed in this report are just that—informed opinions. They should not be considered promises or advice.
Also, please keep in mind that the information and opinions cover the period through the date on the front of this report. Of course, the
risks of investing in your fund are spelled out in the prospectus.
See the Glossary for definitions of investment terms used in this report.
About the cover: Pictured is a sailing block on the Brilliant, a 1932 schooner docked in Mystic, Connecticut. A type of pulley, the
sailing block helps coordinate the setting of the sails. At Vanguard, the intricate coordination of technology and people allows
us to help millions of clients around the world reach their financial goals.
Your Fund’s Total Returns
| |
| Six Months Ended July 31, 2016 | |
| | Total |
| | Returns |
| Vanguard Dividend Growth Fund | 10.65% |
| NASDAQ US Dividend Achievers Select Index | 13.35 |
| Large-Cap Core Funds Average | 11.90 |
| Large-Cap Core Funds Average: Derived from data provided by Lipper, a Thomson Reuters Company. |
| | | | |
| Your Fund’s Performance at a Glance | | | | |
| January 31, 2016, Through July 31, 2016 | | | | |
| | | | Distributions Per Share |
| | Starting | Ending | Income | Capital |
| | Share Price | Share Price | Dividends | Gains |
| Vanguard Dividend Growth Fund | $21.78 | $23.83 | $0.202 | $0.057 |
1

Chairman’s Letter
Dear Shareholder,
Dividend-paying stocks produced solid results over the six months ended July 31, 2016, but didn’t keep pace with the broad U.S. market’s even stronger rally.
For the fiscal half year, Vanguard Dividend Growth Fund returned 10.65%. Although it was a robust six-month result, the fund’s performance trailed that of both its benchmark, the NASDAQ US Dividend Achievers Select Index, and the average return of its large-capitalization core peers.
Each of the eight industry sectors in which the fund invests posted positive results. The advisor’s stock selections in information technology, consumer discretionary, and financials weighed most on the fund’s performance relative to its benchmark. The fund’s holdings in consumer staples and health care helped.
The fund’s 30-day SEC yield fell from 2.01% at the start of the period to 1.91% at the end.
Please note that on July 28, the Dividend Growth Fund closed to new investors, although it remains open for additional investments from current shareholders. The closure is intended to help the fund’s advisor, Wellington Management Company, maintain its disciplined investment approach in deploying the fund’s assets. The fund’s solid long-term performance has resulted in strong cash flows and asset growth.
2
U.S. stocks continued to surge despite signs of uncertainty
U.S. stocks proved resilient over the half year, returning about 14%, although the global environment was far from tranquil.
Stocks tumbled after the momentous June 23 decision by U.K. voters to leave the European Union. But the market quickly recovered. Worries about the effects of “Brexit” on trade and economic growth seemed to diminish as expectations rose that major central banks would be responsive to any fallout.
International stocks also performed well, returning nearly 12%. European stocks finished solidly but still lagged as the Brexit referendum hit close to home. Emerging-market stocks and those from developed Pacific markets recorded double-digit returns.
Bonds drew support given economic factors and low yields
The broad U.S. bond market advanced in each of the six months en route to returning 4.54%. With the stock market volatile at times, the global growth pace uncertain, and inflation low, investors sought safe-haven assets. Foreign investors flocked to U.S. Treasury debt amid exceptionally low or negative yields abroad.
The yield of the 10-year Treasury note closed July at 1.45%, down from 1.98% at the end of January. (Bond prices and yields move in opposite directions.)
| | | |
| Market Barometer | | | |
| |
| | Total Returns |
| | Periods Ended July 31, 2016 |
| | Six | One | Five Years |
| | Months | Year | (Annualized) |
| Stocks | | | |
| Russell 1000 Index (Large-caps) | 13.82% | 4.84% | 13.22% |
| Russell 2000 Index (Small-caps) | 18.76 | 0.00 | 10.43 |
| Russell 3000 Index (Broad U.S. market) | 14.18 | 4.44 | 12.99 |
| FTSE All-World ex US Index (International) | 11.69 | -4.95 | 1.76 |
| |
| Bonds | | | |
| Barclays U.S. Aggregate Bond Index (Broad taxable market) | 4.54% | 5.94% | 3.57% |
| Barclays Municipal Bond Index (Broad tax-exempt market) | 3.16 | 6.94 | 5.13 |
| Citigroup Three-Month U.S. Treasury Bill Index | 0.12 | 0.16 | 0.05 |
| |
| CPI | | | |
| Consumer Price Index | 1.57% | 0.84% | 1.27% |
3
The Federal Reserve has held its target for short-term interest rates at 0.25%–0.5% since raising it by a quarter percentage point last December. Money market funds and savings accounts stayed restrained by these historically low rates.
International bond markets (as measured by the Barclays Global Aggregate Index ex USD) returned 12.31%. A number of foreign currencies strengthened against the dollar, but the bond returns were robust even without this currency benefit.
The fund’s stock selections hampered its performance
The Dividend Growth Fund invests in large, financially sound companies with the ability and commitment to grow their dividends over time. Unlike other dividend-oriented
funds, it doesn’t strive to hold stocks with the highest yields, focusing instead on the stocks of companies with the strong potential to increase their dividends. In fact, the fund sometimes invests in stocks with relatively low current yields if its advisor sees potential for growth.
And the fund, unlike its benchmark, is not limited to stocks that have consistently raised their dividends for ten or more years. This flexibility gives the advisor more leeway in choosing top-performing stocks that for one reason or another fall short of the benchmark’s criteria.
Over the six-month period, the Dividend Growth Fund benefited from investors’ interest in steady income given the historically low interest rate environment.
| | |
| Expense Ratios | | |
| Your Fund Compared With Its Peer Group | | |
| | | Peer Group |
| | Fund | Average |
| Dividend Growth Fund | 0.33% | 1.11% |
The fund expense ratio shown is from the prospectus dated May 25, 2016, and represents estimated costs for the current fiscal year. For the
six months ended July 31, 2016, the fund’s annualized expense ratio was 0.33%. The peer-group expense ratio is derived from data provided
by Lipper, a Thomson Reuters Company, and captures information through year-end 2015.
Peer group: Large-Cap Core Funds.
4
However, the fund’s distinct approach to stock selection did not always work in its favor. Most of the shortfall relative to the benchmark occurred because the fund had minimal or no exposure to some of the leading stocks and sectors over the six months.
In information technology, the fund’s lack of exposure to top-performing computer services providers and semiconductor companies subtracted from its result. The fund’s return for the sector was about half that of its benchmark’s.
The fund’s consumer discretionary holdings also produced weaker results. Specialty retail stocks turned in strong results, but the advisor’s picks among apparel manufacturers, media companies, and fast-food restaurants produced low or negative returns.
A larger allocation to financials—more than double the benchmark’s—was not as beneficial to the fund’s performance as in the past. Gains by insurance companies, credit card companies, and asset managers were largely overshadowed by negative results from banks and specialized real estate investment trusts (REITs). Banks have struggled over the past year as persistently low interest rates have eaten away at their lending margins. The benchmark excludes many of these banks from its holdings because they reduced or eliminated dividend payments during the 2008–2009 financial crisis.
Consumer staples and health care, among the largest holdings of the fund, were the only two sectors that added to relative performance. In consumer staples, household product manufacturers and food and staples retailers stood out.
In health care, the advisor’s picks among managed care providers, pharmaceuticals, and biotechnology boosted results.
You can find more information about the fund’s performance and positioning in the Advisor’s Report that follows this letter.
Consider rebalancing to manage your risk
Let’s say you’ve taken the time to carefully create an appropriate asset allocation for your investment portfolio. Your efforts have produced a diversified mix of stock, bond, and money market funds tailored to your goals, time horizon, and risk tolerance.
But what should you do when your portfolio drifts from its original asset allocation as the financial markets rise or fall? Consider rebalancing to bring it back to the proper mix.
Just one year of outsized returns can throw your allocation out of whack. Take 2013 as an example. That year, the broad stock market (as measured by the Russell 3000 Index) returned 33.55% and the broad taxable bond market (as measured by the Barclays U.S. Aggregate Bond Index) returned –2.02%. A hypothetical portfolio that tracked the broad domestic
5
market indexes and started the year with 60% stocks and 40% bonds would have ended with a more aggressive mix of 67% stocks and 33% bonds.
Rebalancing to bring your portfolio back to its original targets would require you to shift assets away from areas that have been performing well toward those that have been falling behind. That isn’t easy or intuitive. It’s a way to minimize risk rather than maximize returns and to stick with your investment plan through different types of markets. (You can read more about our approach in Best Practices for Portfolio Rebalancing at vanguard.com/ research.)
It’s not necessary to check your portfolio every day or every month, much less rebalance it that frequently. It may be more appropriate to monitor it annually or semiannually and rebalance when your allocation swings 5 percentage points or more from its target.
It’s important, of course, to be aware of the tax implications. You’ll want to consult with your tax advisor, but generally speaking, it may be a good idea to make any asset changes within a tax-advantaged retirement account or to direct new cash flows into the underweighted asset class.
However you go about it, keeping your asset allocation from drifting too far off target can help you stay on track with the investment plan you’ve crafted to meet your financial goals.
As always, thank you for investing with Vanguard.
Sincerely,

F. William McNabb III
Chairman and Chief Executive Officer
August 11, 2016
6
Advisor’s Report
Vanguard Dividend Growth Fund gained 10.65% for the six months ended July 31, 2016, underperforming the 13.35% return of its benchmark, the NASDAQ US Dividend Achievers Select Index.
The investment environment
We had previously suggested that the global investment narrative was increasingly focusing on China. Despite other important factors, we thought news about China would likely dominate the investment landscape. And then along came “Brexit.”
For most observers, the decision by the electorate in the United Kingdom to leave the European Union was a surprise, and global markets reacted strongly. The potential economic implications of Brexit are profound. This applies not only to the United Kingdom, but also to the EU and the wider world. While it’s important to consider the ultimate impact of this decision on global economics and markets, certain realities must not be overlooked. First, this referendum was advisory rather than mandatory. Although it is highly likely that the United Kingdom will move forward with a formal separation, there is a constitutional process that must be followed. That process, which requires approval by 20 of the 27 remaining member states, will no doubt result in highly contentious negotiations. The two-year period set aside for negotiation (from the date the U.K. government formally announces its intention) could be rocky indeed.
The fund’s successes
We had positive absolute returns in all sectors in which we invested during the period. (We didn’t have any holdings in utilities and telecommunication services.) The fund’s holdings in industrials, health care, financials, and consumer staples were the biggest absolute contributors.
The fund’s top absolute contributors were Marsh & McLennan (financials), Union Pacific (industrials), UnitedHealth Group (health care), United Parcel Service (industrials), and United Technologies (industrials).
One of the top contributors to performance during the period was United Parcel Service (UPS), a global package delivery and supply chain management company. Part of our recent thesis on UPS was that the company had learned from its missteps during the past two holiday seasons and was well positioned to handle the 2015 holiday surge. As we anticipated, the company’s solid execution helped it post strong fourth-quarter earnings, which pushed the stock higher. UPS posted robust domestic and international margins and management increased its earnings guidance for the fiscal year. We continue to hold the stock because we view UPS as a strong free cash flow generator and dividend growth story, with an e-commerce secular advantage that should persist as a source of growth.
On a “run-rate” basis, the portfolio is expected to produce asset-weighted dividend growth of 11.8% for calendar
7
year 2016. Our run-rate calculation is a rough estimate of potential dividend growth: It takes a company’s current declared dividend rate, annualizes it, and compares it with the previous calendar year’s actual dividend rate. This calculation does not accurately reflect dividend increases that may be announced later in the year nor does it take into account the dollar amounts of the increases. Therefore, companies in the early stages of dividend growth tend to show large percentage increases, yet the absolute cash dividend may be small. The run-rate calculation also is not an accurate reflection of the growth in the fund’s dividend payments to shareholders. Despite these shortcomings, we view this estimate as a reasonable report card.
Among the more notable dividend run-rate increases thus far in 2016 were those for VF and Amgen.
The fund’s shortfalls
On an absolute basis, our holdings in the energy and consumer discretionary sectors produced the smallest contributions. As mentioned earlier, we had no holdings in the telecommunication services or utilities sectors during the period.
Our biggest absolute detractors included Nike (consumer discretionary), PNC Financial Services (financials), CVS Health (consumer staples), Wells Fargo (financials), and Public Storage (financials).
The top detractor from absolute performance was Nike, a provider of athletic footwear, apparel, equipment, and accessories. In our opinion, investors were overly concerned about basketball-related sales slowing in the United States (it represents only about 3% of total sales). Basketball gets a lot of press but it’s not that meaningful to Nike’s overall business. The other issue during the period was some backed-up inventory that Nike was dealing with related to Sports Authority’s bankruptcy. We believe that the company is already working through the inventory issues and that it is a short-term issue. The company’s growth appears healthy in our view and we used the weakness in the stock to add to our position. Nike has a new manufacturing process (Flyknit), which is much more flexible and cheaper and should have positive implications for margins. The company is also selling a lot more through its own channel (direct-to-consumer), which is a higher-margin business. We continue to believe Nike is one of the great franchises in the world.
Although we would prefer that all stocks in the fund perform well at all times, some will inevitably hinder performance over a given period. We assess a stock’s contribution to the fund over a longer timeframe and with a consistent focus on dividend action.
8
The fund’s positioning and investment strategy
Our primary objective is to identify companies that we believe will steadily and reliably grow their dividend payments. We seek to fulfill this objective by carefully building Vanguard Dividend Growth Fund one stock at a time, giving central consideration to each company’s dividend growth prospects. As has always been the case, we are agnostic about sector positioning versus a benchmark as our weightings result from this bottom-up stock selection. As of the end of the period, the fund had significant absolute weights in the industrial, consumer staples, and health care sectors, while having less exposure (below 5% allocation) to the materials and energy sectors. We currently do not hold any stocks in the utilities or telecommunication services sectors.
Since our last report, there have been modest changes in the fund’s positioning, but certainly no change in our overall investment strategy. Additions were made to the fund over the last six months that were driven largely by price opportunity. We also continue to manage the fund by constantly assessing the weightings of our existing positions and adjusting them accordingly.
Given the long road ahead, we feel it unwise to draw any firm conclusion on how Brexit will resolve itself. As a consequence, we believe making meaningful changes to the portfolio in anticipation of any resolution is unwise.
The portfolio continues to have many strong global enterprises with terrific value-creation opportunities and strong dividend growth prospects. Therefore, while it is likely that the bumps on the road to Brexit resolution will affect the portfolio along the way, we remain highly confident that the portfolio is well-positioned.
Whatever view we may have over the next month, next year, or even the next five years will have little bearing on our portfolio decisions. We continue to believe in the power of compounding and in a growing dividend as the tool through which this power is expressed. We believe time is our friend, whereas many investors believe it to be the enemy. We believe a long-term outlook characterized by patience and low turnover is our best recipe for managing the fund. We remain true to our process and believe that Vanguard Dividend Growth Fund is well-positioned to deliver superior dividend growth and solid capital appreciation for shareholders over the long term.
Donald J. Kilbride
Senior Managing Director and
Equity Portfolio Manager
Wellington Management Company llp
August 17, 2016
9
Dividend Growth Fund
Fund Profile
As of July 31, 2016
| | | |
| Portfolio Characteristics | | |
| | | NASDAQ | DJ |
| | | US | U.S. |
| | | Dividend | Total |
| | | Achievers | Market |
| | | Select | FA |
| | Fund | Index | Index |
| Number of Stocks | 45 | 185 | 3,839 |
| Median Market Cap | $78.4B | $54.0B | $54.0B |
| Price/Earnings Ratio | 22.6x | 24.6x | 23.5x |
| Price/Book Ratio | 4.1x | 4.3x | 2.8x |
| Return on Equity | 21.5% | 20.4% | 16.3% |
| Earnings Growth | | | |
| Rate | 7.2% | 4.6% | 7.3% |
| Dividend Yield | 2.2% | 2.2% | 2.0% |
| Foreign Holdings | 6.5% | 0.0% | 0.0% |
| Turnover Rate | | | |
| (Annualized) | 21% | — | — |
| Ticker Symbol | VDIGX | — | — |
| Expense Ratio1 | 0.33% | — | — |
| 30-Day SEC Yield | 1.91% | — | — |
| Short-Term Reserves | 2.9% | — | — |
| | | |
| Sector Diversification (% of equity exposure) |
| | | NASDAQ | DJ |
| | | US | U.S. |
| | | Dividend | Total |
| | | Achievers | Market |
| | | Select | FA |
| | Fund | Index | Index |
| Consumer Discretionary | 12.8% | 12.6% | 13.0% |
| Consumer Staples | 18.6 | 24.6 | 9.0 |
| Energy | 3.0 | 1.1 | 6.3 |
| Financials | 14.7 | 7.9 | 17.5 |
| Health Care | 18.5 | 13.2 | 14.6 |
| Industrials | 18.6 | 20.1 | 10.4 |
| Information Technology | 10.2 | 10.7 | 19.9 |
| Materials | 3.6 | 6.7 | 3.3 |
| Telecommunication | | | |
| Services | 0.0 | 0.1 | 2.5 |
| Utilities | 0.0 | 3.0 | 3.5 |
| | |
| Volatility Measures | | |
| | NASDAQ | |
| | US Dividend | DJ |
| | Achievers | U.S. Total |
| | Select | Market |
| | Index | FA Index |
| R-Squared | 0.95 | 0.90 |
| Beta | 0.92 | 0.83 |
| These measures show the degree and timing of the fund’s fluctuations compared with the indexes over 36 months. |
| | |
| Ten Largest Holdings (% of total net assets) |
| Microsoft Corp. | Systems Software | 3.5% |
| NIKE Inc. | Footwear | 3.2 |
| Costco Wholesale Corp. | Hypermarkets & | |
| | Super Centers | 3.1 |
| Medtronic plc | Health Care | |
| | Equipment | 2.9 |
| United Parcel Service | Air Freight & | |
| Inc. | Logistics | 2.9 |
| Colgate-Palmolive Co. | Household Products | 2.7 |
| Honeywell International | Aerospace & | |
| Inc. | Defense | 2.7 |
| Canadian National | | |
| Railway Co. | Railroads | 2.6 |
| Cardinal Health Inc. | Health Care | |
| | Distributors | 2.6 |
| Chubb Ltd. | Casualty Insurance | 2.6 |
| Top Ten | | 28.8% |
| The holdings listed exclude any temporary cash investments and equity index products. |
Investment Focus

1 The expense ratio shown is from the prospectus dated May 25, 2016, and represents estimated costs for the current fiscal year. For the six months
ended July 31, 2016, the annualized expense ratio was 0.33%.
10
Dividend Growth Fund
Performance Summary
All of the returns in this report represent past performance, which is not a guarantee of future results that may be achieved by the fund. (Current performance may be lower or higher than the performance data cited. For performance data current to the most recent month-end, visit our website at vanguard.com/performance.) Note, too, that both investment returns and principal value can fluctuate widely, so an investor’s shares, when sold, could be worth more or less than their original cost. The returns shown do not reflect taxes that a shareholder would pay on fund distributions or on the sale of fund shares.
Fiscal-Year Total Returns (%): January 31, 2006, Through July 31, 2016

For a benchmark description, see the Glossary.
Note: For 2017, performance data reflect the six months ended July 31, 2016.
Average Annual Total Returns: Periods Ended June 30, 2016
This table presents returns through the latest calendar quarter—rather than through the end of the fiscal period.
Securities and Exchange Commission rules require that we provide this information.
| | | | |
| | Inception | One | Five | Ten |
| | Date | Year | Years | Years |
| Dividend Growth Fund | 5/15/1992 | 9.13% | 12.22% | 9.08% |
See Financial Highlights for dividend and capital gains information.
11
Dividend Growth Fund
Financial Statements (unaudited)
Statement of Net Assets
As of July 31, 2016
The fund reports a complete list of its holdings in regulatory filings four times in each fiscal year, at the quarter-ends. For the second and fourth fiscal quarters, the lists appear in the fund’s semiannual and annual reports to shareholders. For the first and third fiscal quarters, the fund files the lists with the Securities and Exchange Commission on Form N-Q. Shareholders can look up the fund’s Forms N-Q on the SEC’s website at sec.gov. Forms N-Q may also be reviewed and copied at the SEC’s Public Reference Room (see the back cover of this report for further information).
| | |
| | | Market |
| | | Value• |
| | Shares | ($000) |
| Common Stocks (97.1%) | | |
| Consumer Discretionary (12.4%) | |
| NIKE Inc. Class B | 17,968,391 | 997,246 |
| TJX Cos. Inc. | 9,957,783 | 813,750 |
| Lowe’s Cos. Inc. | 7,818,831 | 643,333 |
| McDonald’s Corp. | 5,054,408 | 594,651 |
| VF Corp. | 7,534,209 | 470,361 |
| Walt Disney Co. | 3,906,212 | 374,801 |
| | | 3,894,142 |
| Consumer Staples (18.1%) | | |
| Costco Wholesale Corp. | 5,897,330 | 986,151 |
| Colgate-Palmolive Co. | 11,425,196 | 850,377 |
| Coca-Cola Co. | 16,538,688 | 721,583 |
| Diageo plc | 24,744,679 | 709,101 |
| PepsiCo Inc. | 5,755,239 | 626,861 |
| Procter & Gamble Co. | 7,143,879 | 611,445 |
| CVS Health Corp. | 6,426,325 | 595,849 |
| Walgreens Boots | | |
| Alliance Inc. | 7,308,081 | 579,165 |
| | | 5,680,532 |
| Energy (2.9%) | | |
| Schlumberger Ltd. | 5,896,950 | 474,823 |
| Exxon Mobil Corp. | 5,032,651 | 447,654 |
| | | 922,477 |
| Financials (14.3%) | | |
| Chubb Ltd. | 6,506,907 | 815,055 |
| Marsh & McLennan | | |
| Cos. Inc. | 11,288,122 | 742,194 |
| PNC Financial Services | | |
| Group Inc. | 7,742,902 | 639,951 |
| Wells Fargo & Co. | 13,208,662 | 633,620 |
| BlackRock Inc. | 1,589,137 | 582,021 |
| American Express Co. | 9,029,172 | 582,021 |
| Public Storage | 2,100,076 | 501,750 |
| | | 4,496,612 |
| | |
| Health Care (18.0%) | | |
| Medtronic plc | 10,517,592 | 921,657 |
| Cardinal Health Inc. | 9,752,846 | 815,338 |
| Johnson & Johnson | 6,240,003 | 781,435 |
| UnitedHealth Group Inc. | 5,389,694 | 771,804 |
| Merck & Co. Inc. | 13,154,546 | 771,646 |
| Amgen Inc. | 3,956,528 | 680,641 |
| Roche Holding AG | 2,049,225 | 523,102 |
| McKesson Corp. | 2,027,690 | 394,507 |
| | | 5,660,130 |
| Industrials (18.0%) | | |
| United Parcel Service Inc. | | |
| Class B | 8,493,501 | 918,147 |
| Honeywell International | | |
| Inc. | 7,177,629 | 834,974 |
| Canadian National | | |
| Railway Co. | 12,925,475 | 819,394 |
| Union Pacific Corp. | 8,753,615 | 814,524 |
| Lockheed Martin Corp. | 3,057,845 | 772,809 |
| United Technologies | | |
| Corp. | 6,066,092 | 653,015 |
| Northrop Grumman Corp. | 2,066,254 | 447,613 |
| General Dynamics Corp. | 2,756,159 | 404,852 |
| | | 5,665,328 |
| Information Technology (9.9%) | |
| Microsoft Corp. | 19,399,344 | 1,099,555 |
| Accenture plc Class A | 6,745,950 | 761,011 |
| Automatic Data | | |
| Processing Inc. | 8,176,668 | 727,314 |
| Oracle Corp. | 13,043,368 | 535,300 |
| | | 3,123,180 |
| Materials (3.5%) | | |
| Praxair Inc. | 6,159,548 | 717,834 |
| Ecolab Inc. | 3,200,855 | 378,917 |
| | | 1,096,751 |
| Total Common Stocks | | |
| (Cost $22,409,543) | | 30,539,152 |
12
Dividend Growth Fund
| | |
| | Face | Market |
| | Amount | Value• |
| | ($000) | ($000) |
| Temporary Cash Investments (2.9%) | |
| Repurchase Agreements (2.6%) | |
| RBS Securities, Inc. | | |
| 0.340%, 8/1/16 (Dated | | |
| 7/29/16, Repurchase | | |
| Value $496,714,000, | | |
| collateralized by U.S. | | |
| Treasury Note/Bond | | |
| 1.000%–2.750%, 2/15/18– | | |
| 11/15/42, with a value of | | |
| $506,635,000) | 496,700 | 496,700 |
| Societe Generale | | |
| 0.330%, 8/1/16 (Dated | | |
| 7/29/16, Repurchase | | |
| Value $324,509,000, | | |
| collateralized by Federal | | |
| National Mortgage Assn. | | |
| 1.000%, 5/21/18, and | | |
| U.S. Treasury Note/Bond | | |
| 1.500%–2.750%, 7/31/19– | | |
| 11/15/23, with a value of | | |
| $330,990,000) | 324,500 | 324,500 |
| | | 821,200 |
| U.S. Government and Agency Obligations (0.3%) |
| 1 Federal Home Loan | | |
| Bank Discount Notes, | | |
| 0.365%, 10/7/16 | 100,000 | 99,934 |
| Total Temporary Cash Investments | |
| (Cost $921,132) | | 921,134 |
| Total Investments (100.0%) | | |
| (Cost $23,330,675) | | 31,460,286 |
| |
| | Amount |
| | ($000) |
| Other Assets and Liabilities (0.0%) | |
| Other Assets | |
| Investment in Vanguard | 2,467 |
| Receivables for Accrued Income | 37,932 |
| Receivable for Capital Shares Issued | 16,039 |
| Other Assets | 64 |
| Total Other Assets | 56,502 |
| Liabilities | |
| Payables to Investment Advisor | (12,500) |
| Payables for Capital Shares Redeemed | (11,464) |
| Payables to Vanguard | (23,671) |
| Total Liabilities | (47,635) |
| Net Assets (100%) | |
| Applicable to 1,320,700,707 outstanding |
| $.001 par value shares of beneficial | |
| interest (unlimited authorization) | 31,469,153 |
| Net Asset Value Per Share | $23.83 |
| |
| |
| At July 31, 2016, net assets consisted of: |
| | Amount |
| | ($000) |
| Paid-in Capital | 23,392,632 |
| Undistributed Net Investment Income | 16,809 |
| Accumulated Net Realized Losses | (69,778) |
| Unrealized Appreciation (Depreciation) | |
| Investment Securities | 8,129,611 |
| Foreign Currencies | (121) |
| Net Assets | 31,469,153 |
• See Note A in Notes to Financial Statements.
1 The issuer operates under a congressional charter; its securities are generally neither guaranteed by the U.S. Treasury nor backed by the
full faith and credit of the U.S. government.
See accompanying Notes, which are an integral part of the Financial Statements.
13
Dividend Growth Fund
Statement of Operations
| |
| | Six Months Ended |
| | July 31, 2016 |
| | ($000) |
| Investment Income | |
| Income | |
| Dividends1 | 320,698 |
| Interest | 1,464 |
| Securities Lending | 392 |
| Total Income | 322,554 |
| Expenses | |
| Investment Advisory Fees—Note B | |
| Basic Fee | 18,807 |
| Performance Adjustment | 5,808 |
| The Vanguard Group—Note C | |
| Management and Administrative | 19,401 |
| Marketing and Distribution | 2,768 |
| Custodian Fees | 140 |
| Shareholders’ Reports | 174 |
| Trustees’ Fees and Expenses | 20 |
| Total Expenses | 47,118 |
| Net Investment Income | 275,436 |
| Realized Net Gain (Loss) | |
| Investment Securities Sold | (58,548) |
| Foreign Currencies | 146 |
| Realized Net Gain (Loss) | (58,402) |
| Change in Unrealized Appreciation (Depreciation) | |
| Investment Securities | 2,665,359 |
| Foreign Currencies | 430 |
| Change in Unrealized Appreciation (Depreciation) | 2,665,789 |
| Net Increase (Decrease) in Net Assets Resulting from Operations | 2,882,823 |
| 1 Dividends are net of foreign withholding taxes of $3,440,000. |
See accompanying Notes, which are an integral part of the Financial Statements.
14
Dividend Growth Fund
Statement of Changes in Net Assets
| | |
| | Six Months Ended | Year Ended |
| | July 31, | January 31, |
| | 2016 | 2016 |
| | ($000) | ($000) |
| Increase (Decrease) in Net Assets | | |
| Operations | | |
| Net Investment Income | 275,436 | 487,197 |
| Realized Net Gain (Loss) | (58,402) | 658,531 |
| Change in Unrealized Appreciation (Depreciation) | 2,665,789 | (592,958) |
| Net Increase (Decrease) in Net Assets Resulting from Operations | 2,882,823 | 552,770 |
| Distributions | | |
| Net Investment Income | (258,264) | (476,748) |
| Realized Capital Gain1 | (69,168) | (928,751) |
| Total Distributions | (327,432) | (1,405,499) |
| Capital Share Transactions | | |
| Issued | 4,826,248 | 5,744,103 |
| Issued in Lieu of Cash Distributions | 292,794 | 1,268,037 |
| Redeemed | (1,836,978) | (3,594,784) |
| Net Increase (Decrease) from Capital Share Transactions | 3,282,064 | 3,417,356 |
| Total Increase (Decrease) | 5,837,455 | 2,564,627 |
| Net Assets | | |
| Beginning of Period | 25,631,698 | 23,067,071 |
| End of Period2 | 31,469,153 | 25,631,698 |
| 1 Includes fiscal 2017 and 2016 short-term gain distributions totaling $0 and $121,739,000, respectively. Short-term gain distributions are |
| treated as ordinary income dividends for tax purposes. |
| 2 Net Assets—End of Period includes undistributed (overdistributed) net investment income of $16,809,000 and ($509,000). |
See accompanying Notes, which are an integral part of the Financial Statements.
15
Dividend Growth Fund
Financial Highlights
| | | | | | |
| Six Months | | | | | |
| | Ended | | | | | |
| For a Share Outstanding | July 31, | | | Year Ended January 31, |
| Throughout Each Period | 2016 | 2016 | 2015 | 2014 | 2013 | 2012 |
| Net Asset Value, Beginning of Period | $21.78 | $22.47 | $20.45 | $17.52 | $15.81 | $14.68 |
| Investment Operations | | | | | | |
| Net Investment Income | .215 | .442 | .430 | .385 | .357 | .317 |
| Net Realized and Unrealized Gain (Loss) | | | | | | |
| on Investments | 2.094 | .145 | 2.378 | 3.033 | 1.721 | 1.126 |
| Total from Investment Operations | 2.309 | .587 | 2.808 | 3.418 | 2.078 | 1.443 |
| Distributions | | | | | | |
| Dividends from Net Investment Income | (. 202) | (. 432) | (. 440) | (. 384) | (. 368) | (. 313) |
| Distributions from Realized Capital Gains | (. 057) | (. 845) | (. 348) | (.104) | — | — |
| Total Distributions | (. 259) | (1.277) | (.788) | (. 488) | (. 368) | (. 313) |
| Net Asset Value, End of Period | $23.83 | $21.78 | $22.47 | $20.45 | $17.52 | $15.81 |
| |
| Total Return1 | 10.65% | 2.44% | 13.69% | 19.60% | 13.36% | 9.90% |
| |
| Ratios/Supplemental Data | | | | | | |
| Net Assets, End of Period (Millions) | $31,469 | $25,632 | $23,067 | $19,137 | $12,704 | $8,829 |
| Ratio of Total Expenses to | | | | | | |
| Average Net Assets2 | 0.33% | 0.33% | 0.32% | 0.31% | 0.29% | 0.31% |
| Ratio of Net Investment Income to | | | | | | |
| Average Net Assets | 1.93% | 1.95% | 1.94% | 2.03% | 2.22% | 2.28% |
| Portfolio Turnover Rate | 21% | 26% | 23% | 18% | 11% | 13% |
The expense ratio, net investment income ratio, and turnover rate for the current period have been annualized.
1 Total returns do not include account service fees that may have applied in the periods shown. Fund prospectuses provide information about
any applicable account service fees.
2 Includes performance-based investment advisory fee increases (decreases) of 0.04%, 0.04%, 0.03%, 0.02%, 0.00%, and 0.00%.
See accompanying Notes, which are an integral part of the Financial Statements.
16
Dividend Growth Fund
Notes to Financial Statements
Vanguard Dividend Growth Fund is registered under the Investment Company Act of 1940 as an open-end investment company, or mutual fund.
A. The following significant accounting policies conform to generally accepted accounting principles for U.S. investment companies. The fund consistently follows such policies in preparing its financial statements.
1. Security Valuation: Securities are valued as of the close of trading on the New York Stock Exchange (generally 4 p.m., Eastern time) on the valuation date. Equity securities are valued at the latest quoted sales prices or official closing prices taken from the primary market in which each security trades; such securities not traded on the valuation date are valued at the mean of the latest quoted bid and asked prices. Securities for which market quotations are not readily available, or whose values have been affected by events occurring before the fund’s pricing time but after the close of the securities’ primary markets, are valued at their fair values calculated according to procedures adopted by the board of trustees. These procedures include obtaining quotations from an independent pricing service, monitoring news to identify significant market- or security-specific events, and evaluating changes in the values of foreign market proxies (for example, ADRs, futures contracts, or exchange-traded funds), between the time the foreign markets close and the fund’s pricing time. When fair-value pricing is employed, the prices of securities used by a fund to calculate its net asset value may differ from quoted or published prices for the same securities. Temporary cash investments acquired over 60 days to maturity are valued using the latest bid prices or using valuations based on a matrix system (which considers such factors as security prices, yields, maturities, and ratings), both as furnished by independent pricing services. Other temporary cash investments are valued at amortized cost, which approximates market value.
2. Foreign Currency: Securities and other assets and liabilities denominated in foreign currencies are translated into U.S. dollars using exchange rates obtained from an independent third party as of the fund’s pricing time on the valuation date. Realized gains (losses) and unrealized appreciation (depreciation) on investment securities include the effects of changes in exchange rates since the securities were purchased, combined with the effects of changes in security prices. Fluctuations in the value of other assets and liabilities resulting from changes in exchange rates are recorded as unrealized foreign currency gains (losses) until the assets or liabilities are settled in cash, at which time they are recorded as realized foreign currency gains (losses).
3. Repurchase Agreements: The fund enters into repurchase agreements with institutional counterparties. Securities pledged as collateral to the fund under repurchase agreements are held by a custodian bank until the agreements mature. Each agreement requires that the market value of the collateral be sufficient to cover payments of interest and principal. The fund further mitigates its counterparty risk by entering into repurchase agreements only with a diverse group of prequalified counterparties, monitoring their financial strength, and entering into master repurchase agreements with its counterparties. The master repurchase agreements provide that, in the event of a counterparty’s default (including bankruptcy), the fund may terminate any repurchase agreements with that counterparty, determine the net amount owed, and sell or retain the collateral up to the net amount owed to the fund. Such action may be subject to legal proceedings, which may delay or limit the disposition of collateral.
4. Federal Income Taxes: The fund intends to continue to qualify as a regulated investment company and distribute all of its taxable income. Management has analyzed the fund’s tax positions taken for all open federal income tax years (January, 2013–2016), and for the period ended July 31, 2016, and has concluded that no provision for federal income tax is required in the fund’s financial statements.
17
Dividend Growth Fund
5. Distributions: Distributions to shareholders are recorded on the ex-dividend date.
6. Securities Lending: To earn additional income, the fund lends its securities to qualified institutional borrowers. Security loans are subject to termination by the fund at any time, and are required to be secured at all times by collateral in an amount at least equal to the market value of securities loaned. Daily market fluctuations could cause the value of loaned securities to be more or less than the value of the collateral received. When this occurs, the collateral is adjusted and settled on the next business day. The fund further mitigates its counterparty risk by entering into securities lending transactions only with a diverse group of prequalified counterparties, monitoring their financial strength, and entering into master securities lending agreements with its counterparties. The master securities lending agreements provide that, in the event of a counterparty’s default (including bankruptcy), the fund may terminate any loans with that borrower, determine the net amount owed, and sell or retain the collateral up to the net amount owed to the fund; however, such actions may be subject to legal proceedings. While collateral mitigates counterparty risk, in the absence of a default the fund may experience delays and costs in recovering the securities loaned. The fund invests cash collateral received in Vanguard Market Liquidity Fund, and records a liability in the Statement of Net Assets for the return of the collateral, during the period the securities are on loan. Securities lending income represents fees charged to borrowers plus income earned on invested cash collateral, less expenses associated with the loan.
7. Credit Facility: The fund and certain other funds managed by The Vanguard Group (“Vanguard”) participate in a $3.1 billion committed credit facility provided by a syndicate of lenders pursuant to a credit agreement that may be renewed annually; each fund is individually liable for its borrowings, if any, under the credit facility. Borrowings may be utilized for temporary and emergency purposes, and are subject to the fund’s regulatory and contractual borrowing restrictions. The participating funds are charged administrative fees and an annual commitment fee of 0.10% of the undrawn amount of the facility; these fees are allocated to the funds based on a method approved by the fund’s board of trustees and included in Management and Administrative expenses on the fund’s Statement of Operations. Any borrowings under this facility bear interest at a rate based upon the higher of the one-month London Interbank Offered Rate, federal funds effective rate, or overnight bank funding rate plus an agreed-upon spread.
The fund had no borrowings outstanding at July 31, 2016, or at any time during the period then ended.
8. Other: Dividend income is recorded on the ex-dividend date. Interest income is accrued daily. Premiums and discounts on debt securities purchased are amortized and accreted, respectively, to interest income over the lives of the respective securities. Security transactions are accounted for on the date securities are bought or sold. Costs used to determine realized gains (losses) on the sale of investment securities are those of the specific securities sold.
B. Wellington Management Company LLP provides investment advisory services to the fund for a fee calculated at an annual percentage rate of average net assets. The basic fee is subject to quarterly adjustments based on the fund’s performance relative to the NASDAQ US Dividend Achievers Select Index for the preceding three years. For the six months ended July 31, 2016, the investment advisory fee represented an effective annual basic rate of 0.13% of the fund’s average net assets before an increase of $5,808,000 (0.04%) based on performance.
C. In accordance with the terms of a Funds’ Service Agreement (the “FSA”) between Vanguard and the fund, Vanguard furnishes to the fund corporate management, administrative, marketing, and distribution services at Vanguard’s cost of operations (as defined by the FSA). These costs of
18
Dividend Growth Fund
operations are allocated to the fund based on methods and guidelines approved by the board of trustees. Vanguard does not require reimbursement in the current period for certain costs of operations (such as deferred compensation/benefits and risk/insurance costs); the fund’s liability for these costs of operations is included in Payables to Vanguard on the Statement of Net Assets.
Upon the request of Vanguard, the fund may invest up to 0.40% of its net assets as capital in Vanguard. At July 31, 2016, the fund had contributed to Vanguard capital in the amount of $2,467,000, representing 0.01% of the fund’s net assets and 0.99% of Vanguard’s capitalization. The fund’s trustees and officers are also directors and employees, respectively, of Vanguard.
D. Various inputs may be used to determine the value of the fund’s investments. These inputs are summarized in three broad levels for financial statement purposes. The inputs or methodologies used to value securities are not necessarily an indication of the risk associated with investing in those securities.
Level 1—Quoted prices in active markets for identical securities.
Level 2—Other significant observable inputs (including quoted prices for similar securities, interest rates, prepayment speeds, credit risk, etc.).
Level 3—Significant unobservable inputs (including the fund’s own assumptions used to determine the fair value of investments).
The following table summarizes the market value of the fund’s investments as of July 31, 2016, based on the inputs used to value them:
| | | |
| | Level 1 | Level 2 | Level 3 |
| Investments | ($000) | ($000) | ($000) |
| Common Stocks | 29,306,949 | 1,232,203 | — |
| Temporary Cash Investments | — | 921,134 | — |
| Total | 29,306,949 | 2,153,337 | — |
E. Distributions are determined on a tax basis and may differ from net investment income and realized capital gains for financial reporting purposes. Differences may be permanent or temporary. Permanent differences are reclassified among capital accounts in the financial statements to reflect their tax character. Temporary differences arise when certain items of income, expense, gain, or loss are recognized in different periods for financial statement and tax purposes. These differences will reverse at some time in the future. Differences in classification may also result from the treatment of short-term gains as ordinary income for tax purposes.
During the six months ended July 31, 2016, the fund realized net foreign currency gains of $146,000, which increased distributable net income for tax purposes; accordingly, such gains have been reclassified from accumulated net realized losses to undistributed net investment income.
The fund’s tax-basis capital gains and losses are determined only at the end of each fiscal year. For tax purposes, at January 31, 2016, the fund had available capital losses totaling $5,177,000 that may be carried forward indefinitely to offset future net capital gains. The fund will use these capital losses to offset net taxable capital gains, if any, realized during the year ending January 31, 2017; should the fund realize net capital losses for the year, the losses will be added to the loss carryforward balance above.
19
Dividend Growth Fund
At July 31, 2016, the cost of investment securities for tax purposes was $23,330,675,000. Net unrealized appreciation of investment securities for tax purposes was $8,129,611,000, consisting of unrealized gains of $8,251,296,000 on securities that had risen in value since their purchase and $121,685,000 in unrealized losses on securities that had fallen in value since their purchase.
F. During the six months ended July 31, 2016, the fund purchased $5,909,888,000 of investment securities and sold $2,917,300,000 of investment securities, other than temporary cash investments.
G. Capital shares issued and redeemed were:
| | |
| | Six Months Ended | Year Ended |
| | July 31, 2016 | January 31, 2016 |
| | Shares | Shares |
| | (000) | (000) |
| Issued | 211,560 | 253,289 |
| Issued in Lieu of Cash Distributions | 12,794 | 55,584 |
| Redeemed | (80,507) | (158,371) |
| Net Increase (Decrease) in Shares Outstanding | 143,847 | 150,502 |
H. Management has determined that no material events or transactions occurred subsequent to July 31, 2016, that would require recognition or disclosure in these financial statements.
20
About Your Fund’s Expenses
As a shareholder of the fund, you incur ongoing costs, which include costs for portfolio management, administrative services, and shareholder reports (like this one), among others. Operating expenses, which are deducted from a fund’s gross income, directly reduce the investment return of the fund.
A fund’s expenses are expressed as a percentage of its average net assets. This figure is known as the expense ratio. The following examples are intended to help you understand the ongoing costs (in dollars) of investing in your fund and to compare these costs with those of other mutual funds. The examples are based on an investment of $1,000 made at the beginning of the period shown and held for the entire period.
The accompanying table illustrates your fund’s costs in two ways:
• Based on actual fund return. This section helps you to estimate the actual expenses that you paid over the period. The ”Ending Account Value“ shown is derived from the fund‘s actual return, and the third column shows the dollar amount that would have been paid by an investor who started with $1,000 in the fund. You may use the information here, together with the amount you invested, to estimate the expenses that you paid over the period.
To do so, simply divide your account value by $1,000 (for example, an $8,600 account value divided by $1,000 = 8.6), then multiply the result by the number given for your fund under the heading ”Expenses Paid During Period.“
• Based on hypothetical 5% yearly return. This section is intended to help you compare your fund‘s costs with those of other mutual funds. It assumes that the fund had a yearly return of 5% before expenses, but that the expense ratio is unchanged. In this case—because the return used is not the fund’s actual return—the results do not apply to your investment. The example is useful in making comparisons because the Securities and Exchange Commission requires all mutual funds to calculate expenses based on a 5% return. You can assess your fund’s costs by comparing this hypothetical example with the hypothetical examples that appear in shareholder reports of other funds.
Note that the expenses shown in the table are meant to highlight and help you compare ongoing costs only and do not reflect transaction costs incurred by the fund for buying and selling securities. Further, the expenses do not include any purchase, redemption, or account service fees described in the fund prospectus. If such fees were applied to your account, your costs would be higher. Your fund does not carry a “sales load.”
The calculations assume no shares were bought or sold during the period. Your actual costs may have been higher or lower, depending on the amount of your investment and the timing of any purchases or redemptions.
You can find more information about the fund’s expenses, including annual expense ratios, in the Financial Statements section of this report. For additional information on operating expenses and other shareholder costs, please refer to your fund’s current prospectus.
21
| | | |
| Six Months Ended July 31, 2016 | | | |
| | Beginning | Ending | Expenses |
| | Account Value | Account Value | Paid During |
| Dividend Growth Fund | 1/31/2016 | 7/31/2016 | Period |
| Based on Actual Fund Return | $1,000.00 | $1,106.54 | $1.73 |
| Based on Hypothetical 5% Yearly Return | 1,000.00 | 1,023.22 | 1.66 |
The calculations are based on expenses incurred in the most recent six-month period. The fund’s annualized six-month expense ratio for that
period is 0.33%. The dollar amounts shown as “Expenses Paid” are equal to the annualized expense ratio multiplied by the average account
value over the period, multiplied by the number of days in the most recent six-month period, then divided by the number of days in the most
recent 12-month period (182/366).
22
Glossary
30-Day SEC Yield. A fund’s 30-day SEC yield is derived using a formula specified by the U.S. Securities and Exchange Commission. Under the formula, data related to the fund’s security holdings in the previous 30 days are used to calculate the fund’s hypothetical net income for that period, which is then annualized and divided by the fund’s estimated average net assets over the calculation period. For the purposes of this calculation, a security’s income is based on its current market yield to maturity (for bonds), its actual income (for asset-backed securities), or its projected dividend yield (for stocks). Because the SEC yield represents hypothetical annualized income, it will differ—at times significantly—from the fund’s actual experience. As a result, the fund’s income distributions may be higher or lower than implied by the SEC yield.
Beta. A measure of the magnitude of a fund’s past share-price fluctuations in relation to the ups and downs of a given market index. The index is assigned a beta of 1.00. Compared with a given index, a fund with a beta of 1.20 typically would have seen its share price rise or fall by 12% when the index rose or fell by 10%. For this report, beta is based on returns over the past 36 months for both the fund and the index. Note that a fund’s beta should be reviewed in conjunction with its R-squared (see definition). The lower the R-squared, the less correlation there is between the fund and the index, and the less reliable beta is as an indicator of volatility.
Dividend Yield. Dividend income earned by stocks, expressed as a percentage of the aggregate market value (or of net asset value, for a fund). The yield is determined by dividing the amount of the annual dividends by the aggregate value (or net asset value) at the end of the period. For a fund, the dividend yield is based solely on stock holdings and does not include any income produced by other investments.
Earnings Growth Rate. The average annual rate of growth in earnings over the past five years for the stocks now in a fund.
Equity Exposure. A measure that reflects a fund’s investments in stocks and stock futures. Any holdings in short-term reserves are excluded.
Expense Ratio. A fund’s total annual operating expenses expressed as a percentage of the fund’s average net assets. The expense ratio includes management and administrative expenses, but does not include the transaction costs of buying and selling portfolio securities.
Foreign Holdings. The percentage of a fund represented by securities or depositary receipts of companies based outside the United States.
Inception Date. The date on which the assets of a fund (or one of its share classes) are first invested in accordance with the fund’s investment objective. For funds with a subscription period, the inception date is the day after that period ends. Investment performance is measured from the inception date.
Median Market Cap. An indicator of the size of companies in which a fund invests; the midpoint of market capitalization (market price x shares outstanding) of a fund’s stocks, weighted by the proportion of the fund’s assets invested in each stock. Stocks representing half of the fund’s assets have market capitalizations above the median, and the rest are below it.
Price/Book Ratio. The share price of a stock divided by its net worth, or book value, per share. For a fund, the weighted average price/book ratio of the stocks it holds.
23
Price/Earnings Ratio. The ratio of a stock’s current price to its per-share earnings over the past year. For a fund, the weighted average P/E of the stocks it holds. P/E is an indicator of market expectations about corporate prospects; the higher the P/E, the greater the expectations for a company’s future growth.
R-Squared. A measure of how much of a fund’s past returns can be explained by the returns from the market in general, as measured by a given index. If a fund’s total returns were precisely synchronized with an index’s returns, its R-squared would be 1.00. If the fund’s returns bore no relationship to the index’s returns, its R-squared would be 0. For this report, R-squared is based on returns over the past 36 months for both the fund and the index.
Return on Equity. The annual average rate of return generated by a company during the past five years for each dollar of shareholder’s equity (net income divided by shareholder’s equity). For a fund, the weighted average return on equity for the companies whose stocks it holds.
Short-Term Reserves. The percentage of a fund invested in highly liquid, short-term securities that can be readily converted to cash.
Turnover Rate. An indication of the fund’s trading activity. Funds with high turnover rates incur higher transaction costs and may be more likely to distribute capital gains (which may be taxable to investors). The turnover rate excludes in-kind transactions, which have minimal impact on costs.
Benchmark Information
Dividend Growth Spliced Index: Russell 1000 Index through January 31, 2010; NASDAQ US Dividend Achievers Select Index (formerly known as the Dividend Achievers Select Index) thereafter. Prior to December 6, 2002, the comparative benchmark was known as the Utilities Composite Index. The index weightings were: 40% S&P Utilities Index, 40% S&P Telephone Index, and 20% Lehman Brothers Utility Bond Index through April 30, 1999; 63.75% S&P Utilities Index, 21.25% S&P Telephone Index, and 15% Lehman Brothers Utility Bond Index through March 31, 2000; 75% S&P Utilities Index and 25% S&P Telephone Index through December 31, 2001; and 75% S&P Utilities Index and 25% S&P Integrated Telecommunication Services Index through December 6, 2002.
24
This page intentionally left blank.
This page intentionally left blank.
This page intentionally left blank.
The People Who Govern Your Fund
The trustees of your mutual fund are there to see that the fund is operated and managed in your best interests since, as a shareholder, you are a part owner of the fund. Your fund’s trustees also serve on the board of directors of The Vanguard Group, Inc., which is owned by the Vanguard funds and provides services to them on an at-cost basis.
A majority of Vanguard’s board members are independent, meaning that they have no affiliation with Vanguard or the funds they oversee, apart from the sizable personal investments they have made as private individuals. The independent board members have distinguished backgrounds in business, academia, and public service. Each of the trustees and executive officers oversees 198 Vanguard funds.
The following table provides information for each trustee and executive officer of the fund. More information about the trustees is in the Statement of Additional Information, which can be obtained, without charge, by contacting Vanguard at 800-662-7447, or online at vanguard.com.
| |
| InterestedTrustee1 | Rajiv L. Gupta |
| | Born 1945. Trustee Since December 2001.2 Principal |
| F. William McNabb III | Occupation(s) During the Past Five Years and Other |
| Born 1957. Trustee Since July 2009. Chairman of | Experience: Chairman and Chief Executive Officer |
| the Board. Principal Occupation(s) During the Past | (retired 2009) and President (2006–2008) of |
| Five Years and Other Experience: Chairman of the | Rohm and Haas Co. (chemicals); Director of Tyco |
| Board of The Vanguard Group, Inc., and of each of | International plc (diversified manufacturing and |
| the investment companies served by The Vanguard | services), HP Inc. (printer and personal computer |
| Group, since January 2010; Director of The Vanguard | manufacturing), and Delphi Automotive plc |
| Group since 2008; Chief Executive Officer and | (automotive components); Senior Advisor at |
| President of The Vanguard Group, and of each of | New Mountain Capital. |
| the investment companies served by The Vanguard | |
| Group, since 2008; Director of Vanguard Marketing | Amy Gutmann |
| Corporation; Managing Director of The Vanguard | Born 1949. Trustee Since June 2006. Principal |
| Group (1995–2008). | Occupation(s) During the Past Five Years and |
| | Other Experience: President of the University of |
| IndependentTrustees | Pennsylvania; Christopher H. Browne Distinguished |
| | Professor of Political Science, School of Arts and |
| Emerson U. Fullwood | Sciences, and Professor of Communication, Annenberg |
| Born 1948. Trustee Since January 2008. Principal | School for Communication, with secondary faculty |
| Occupation(s) During the Past Five Years and Other | appointments in the Department of Philosophy, School |
| Experience: Executive Chief Staff and Marketing | of Arts and Sciences, and at the Graduate School of |
| Officer for North America and Corporate Vice President | Education, University of Pennsylvania; Trustee of the |
| (retired 2008) of Xerox Corporation (document manage- | National Constitution Center; Chair of the Presidential |
| ment products and services); Executive in Residence | Commission for the Study of Bioethical Issues. |
| and 2009–2010 Distinguished Minett Professor at | |
| the Rochester Institute of Technology; Lead Director | JoAnn Heffernan Heisen |
| of SPX FLOW, Inc. (multi-industry manufacturing); | Born 1950. Trustee Since July 1998. Principal |
| Director of the United Way of Rochester, the University | Occupation(s) During the Past Five Years and |
| of Rochester Medical Center, Monroe Community | Other Experience: Corporate Vice President and |
| College Foundation, North Carolina A&T University, | Chief Global Diversity Officer (retired 2008) and |
| and Roberts Wesleyan College. | Member of the Executive Committee (1997–2008) |
| | of Johnson & Johnson (pharmaceuticals/medical |
| | devices/consumer products); Director of Skytop |
| | Lodge Corporation (hotels) and the Robert Wood |
| | Johnson Foundation; Member of the Advisory |
| | Board of the Institute for Women’s Leadership |
| | at Rutgers University. |
| | |
| F. Joseph Loughrey | Executive Officers | |
| Born 1949. Trustee Since October 2009. Principal | | |
| Occupation(s) During the Past Five Years and Other | Glenn Booraem | |
| Experience: President and Chief Operating Officer | Born 1967. Treasurer Since May 2015. Principal |
| (retired 2009) of Cummins Inc. (industrial machinery); | Occupation(s) During the Past Five Years and |
| Chairman of the Board of Hillenbrand, Inc. (specialized | Other Experience: Principal of The Vanguard Group, |
| consumer services), and of Oxfam America; Director | Inc.; Treasurer of each of the investment companies |
| of SKF AB (industrial machinery), Hyster-Yale Materials | served by The Vanguard Group; Controller of each of |
| Handling, Inc. (forklift trucks), the Lumina Foundation | the investment companies served by The Vanguard |
| for Education, and the V Foundation for Cancer | Group (2010–2015); Assistant Controller of each of |
| Research; Member of the Advisory Council for the | the investment companies served by The Vanguard |
| College of Arts and Letters and of the Advisory Board | Group (2001–2010). | |
| to the Kellogg Institute for International Studies, both | | |
| at the University of Notre Dame. | Thomas J. Higgins | |
| Born 1957. Chief Financial Officer Since September |
| Mark Loughridge | 2008. Principal Occupation(s) During the Past Five |
| Born 1953. Trustee Since March 2012. Principal | Years and Other Experience: Principal of The Vanguard |
| Occupation(s) During the Past Five Years and Other | Group, Inc.; Chief Financial Officer of each of the |
| Experience: Senior Vice President and Chief Financial | investment companies served by The Vanguard Group; |
| Officer (retired 2013) at IBM (information technology | Treasurer of each of the investment companies served |
| services); Fiduciary Member of IBM’s Retirement Plan | by The Vanguard Group (1998–2008). |
| Committee (2004–2013); Director of the Dow Chemical | | |
| Company; Member of the Council on Chicago Booth. | Peter Mahoney | |
| Born 1974. Controller Since May 2015. Principal |
| Scott C. Malpass | Occupation(s) During the Past Five Years and |
| Born 1962. Trustee Since March 2012. Principal | Other Experience: Head of Global Fund Accounting |
| Occupation(s) During the Past Five Years and Other | at The Vanguard Group, Inc.; Controller of each of the |
| Experience: Chief Investment Officer and Vice | investment companies served by The Vanguard Group; |
| President at the University of Notre Dame; Assistant | Head of International Fund Services at The Vanguard |
| Professor of Finance at the Mendoza College of | Group (2008–2014). | |
| Business at Notre Dame; Member of the Notre Dame | | |
| 403(b) Investment Committee, the Board of Advisors | Heidi Stam | |
| for Spruceview Capital Partners, and the Investment | Born 1956. Secretary Since July 2005. Principal |
| Advisory Committee of Major League Baseball; Board | Occupation(s) During the Past Five Years and Other |
| Member of TIFF Advisory Services, Inc., and Catholic | Experience: Managing Director of The Vanguard |
| Investment Services, Inc. (investment advisors). | Group, Inc.; General Counsel of The Vanguard Group; |
| Secretary of The Vanguard Group and of each of the |
| André F. Perold | investment companies served by The Vanguard Group; |
| Born 1952. Trustee Since December 2004. Principal | Director and Senior Vice President of Vanguard |
| Occupation(s) During the Past Five Years and Other | Marketing Corporation. | |
| Experience: George Gund Professor of Finance and | | |
| Banking, Emeritus at the Harvard Business School | Vanguard Senior ManagementTeam |
| (retired 2011); Chief Investment Officer and Managing | Mortimer J. Buckley | James M. Norris |
| Partner of HighVista Strategies LLC (private investment | Kathleen C. Gubanich | Thomas M. Rampulla |
| firm); Director of Rand Merchant Bank; Overseer of | Martha G. King | Glenn W. Reed |
| the Museum of Fine Arts Boston. | John T. Marcante | Karin A. Risi |
| Chris D. McIsaac | Michael Rollings |
| Peter F. Volanakis | | |
| Born 1955. Trustee Since July 2009. Principal | | |
| Occupation(s) During the Past Five Years and | Chairman Emeritus and Senior Advisor |
| Other Experience: President and Chief Operating | John J. Brennan | |
| Officer (retired 2010) of Corning Incorporated | Chairman, 1996–2009 | |
| (communications equipment); Chairman of the | Chief Executive Officer and President, 1996–2008 |
| Board of Trustees of Colby-Sawyer College; | | |
| Member of the Advisory Board of the Norris | | |
| Cotton Cancer Center. | Founder | |
| | John C. Bogle | |
| | Chairman and Chief Executive Officer, 1974–1996 |
1 Mr. McNabb is considered an “interested person,” as defined in the Investment Company Act of 1940, because he is an officer of the Vanguard funds.
2 December 2002 for Vanguard Equity Income Fund, the Vanguard Municipal Bond Funds, and the Vanguard State Tax-Exempt Funds.
|  |
| | P.O. Box 2600 |
| | Valley Forge, PA 19482-2600 |
| |
| |
| |
| Connect with Vanguard® > vanguard.com |
| |
| |
| |
| Fund Information > 800-662-7447 | |
| Direct Investor Account Services > 800-662-2739 | |
| Institutional Investor Services > 800-523-1036 | |
| Text Telephone for People | |
| Who Are Deaf or Hard of Hearing> 800-749-7273 | |
| |
| This material may be used in conjunction | |
| with the offering of shares of any Vanguard | |
| fund only if preceded or accompanied by | |
| the fund’s current prospectus. | |
| |
| All comparative mutual fund data are from Lipper, a | |
| Thomson Reuters Company, or Morningstar, Inc., unless | |
| otherwise noted. | |
| |
| You can obtain a free copy of Vanguard’s proxy voting | |
| guidelines by visiting vanguard.com/proxyreporting or by | |
| calling Vanguard at 800-662-2739. The guidelines are | |
| also available from the SEC’s website, sec.gov. In | |
| addition, you may obtain a free report on how your fund | |
| voted the proxies for securities it owned during the 12 | |
| months ended June 30. To get the report, visit either | |
| vanguard.com/proxyreporting or sec.gov. | |
| |
| You can review and copy information about your fund at | |
| the SEC’s Public Reference Room in Washington, D.C. To | |
| find out more about this public service, call the SEC at | |
| 202-551-8090. Information about your fund is also | |
| available on the SEC’s website, and you can receive | |
| copies of this information, for a fee, by sending a | |
| request in either of two ways: via email addressed to | |
| publicinfo@sec.gov or via regular mail addressed to the | |
| Public Reference Section, Securities and Exchange | |
| Commission, Washington, DC 20549-1520. | |
| |
| | © 2016 The Vanguard Group, Inc. |
| | All rights reserved. |
| | Vanguard Marketing Corporation, Distributor. |
| |
| | Q572 092016 |

Semiannual Report | July 31, 2016
Vanguard Dividend Appreciation Index Fund
Vanguard’s Principles for Investing Success
We want to give you the best chance of investment success. These principles, grounded in Vanguard’s research and experience, can put you on the right path.
Goals. Create clear, appropriate investment goals.
Balance. Develop a suitable asset allocation using broadly diversified funds. Cost. Minimize cost.
Discipline. Maintain perspective and long-term discipline.
A single theme unites these principles: Focus on the things you can control.
We believe there is no wiser course for any investor.
| |
| Contents | |
| Your Fund’s Total Returns. | 1 |
| Chairman’s Letter. | 2 |
| Fund Profile. | 7 |
| Performance Summary. | 9 |
| Financial Statements. | 10 |
| About Your Fund’s Expenses. | 24 |
| Trustees Approve Advisory Arrangement. | 26 |
| Glossary. | 27 |
Please note: The opinions expressed in this report are just that—informed opinions. They should not be considered promises or advice.
Also, please keep in mind that the information and opinions cover the period through the date on the front of this report. Of course, the
risks of investing in your fund are spelled out in the prospectus.
See the Glossary for definitions of investment terms used in this report.
About the cover: Pictured is a sailing block on the Brilliant, a 1932 schooner docked in Mystic, Connecticut. A type of pulley, the
sailing block helps coordinate the setting of the sails. At Vanguard, the intricate coordination of technology and people allows
us to help millions of clients around the world reach their financial goals.
Your Fund’s Total Returns
| |
| Six Months Ended July 31, 2016 | |
| | Total |
| | Returns |
| Vanguard Dividend Appreciation Index Fund | |
| Investor Shares | 13.23% |
| ETF Shares | |
| Market Price | 13.34 |
| Net Asset Value | 13.28 |
| Admiral™ Shares | 13.26 |
| NASDAQ US Dividend Achievers Select Index | 13.35 |
| Large-Cap Core Funds Average | 11.90 |
Large-Cap Core Funds Average: Derived from data provided by Lipper, a Thomson Reuters Company.
The Vanguard ETF® Shares shown are traded on the NYSE Arca exchange and are available only through brokers. The table provides ETF
returns based on both the NYSE Arca market price and the net asset value for a share. U.S. Pat. Nos. 6,879,964; 7,337,138; 7,720,749;
7,925,573; 8,090,646; and 8,417,623.
For the ETF Shares, the market price is determined by the midpoint of the bid-offer spread as of the closing time of the New York Stock
Exchange (generally 4 p.m., Eastern time). The net asset value is also determined as of the NYSE closing time. For more information about
how the ETF Shares' market prices have compared with their net asset value, visit vanguard.com, select your ETF, and then select the Price
and Performance tab. The ETF premium/discount analysis there shows the percentages of days on which the ETF Shares' market price was
above or below the NAV.
| | | | |
| Your Fund’s Performance at a Glance | | | | |
| January 31, 2016, Through July 31, 2016 | | | | |
| | | | Distributions Per Share |
| | Starting | Ending | Income | Capital |
| | Share Price | Share Price | Dividends | Gains |
| Vanguard Dividend Appreciation Index Fund | | | | |
| Investor Shares | $30.40 | $34.08 | $0.326 | $0.000 |
| ETF Shares | 75.98 | 85.17 | 0.856 | 0.000 |
| Admiral Shares | 20.62 | 23.11 | 0.232 | 0.000 |
1

Chairman’s Letter
Dear Shareholder,
Dividend-paying stocks delivered robust results over the six months ended July 31, 2016, but didn’t quite keep pace with the broad U.S. market’s even sharper rally.
Vanguard Dividend Appreciation Index Fund returned about 13%, in line with its benchmark, the NASDAQ US Dividend Achievers Select Index, and ahead of the average return of its large-cap core fund peers.
Each of the index’s ten industry sectors advanced during the period. Industrial, health care, and technology stocks contributed most to performance.
The 30-day SEC yield for the fund’s Investor Shares fell from 2.25% at the start of the period to 2.01% at the end.
U.S. stocks continued to surge despite signs of uncertainty
U.S. stocks proved resilient over the half year, returning about 14%, although the global environment was far from tranquil.
Stocks tumbled after the momentous June 23 decision by U.K. voters to leave the European Union. But the market quickly recovered. Worries about the effects of “Brexit” on trade and economic growth seemed to diminish as expectations rose that major central banks would be responsive to any fallout.
2
International stocks also performed well, returning nearly 12%. European stocks finished solidly but still lagged as the Brexit referendum hit close to home. Emerging-market stocks and those from developed Pacific markets recorded double-digit returns.
Bonds drew support given economic factors and low yields
The broad U.S. taxable bond market advanced in each of the six months en route to returning 4.54%. With the stock market volatile at times, the global growth pace uncertain, and inflation low, investors sought safe-haven assets. Foreign investors flocked to U.S. Treasury debt amid exceptionally low or negative yields abroad.
The yield of the 10-year Treasury note closed July at 1.45%, down from 1.98% at the end of January. (Bond prices and yields move in opposite directions.)
The Federal Reserve has held its target for short-term interest rates at 0.25%–0.5% since raising it by a quarter percentage point in December. Money market funds and savings accounts stayed restrained by these historically low rates.
International bond markets (as measured by the Barclays Global Aggregate Index ex USD) returned 12.31%. A number of foreign currencies strengthened against the dollar, but the bond returns were robust even without this currency benefit.
| | | |
| Market Barometer | | | |
| |
| | Total Returns |
| | Periods Ended July 31, 2016 |
| | Six | One | Five Years |
| | Months | Year | (Annualized) |
| Stocks | | | |
| Russell 1000 Index (Large-caps) | 13.82% | 4.84% | 13.22% |
| Russell 2000 Index (Small-caps) | 18.76 | 0.00 | 10.43 |
| Russell 3000 Index (Broad U.S. market) | 14.18 | 4.44 | 12.99 |
| FTSE All-World ex US Index (International) | 11.69 | -4.95 | 1.76 |
| |
| Bonds | | | |
| Barclays U.S. Aggregate Bond Index (Broad taxable market) | 4.54% | 5.94% | 3.57% |
| Barclays Municipal Bond Index (Broad tax-exempt market) | 3.16 | 6.94 | 5.13 |
| Citigroup Three-Month U.S. Treasury Bill Index | 0.12 | 0.16 | 0.05 |
| |
| CPI | | | |
| Consumer Price Index | 1.57% | 0.84% | 1.27% |
3
Strong returns across the board bolstered the fund’s performance
The Dividend Appreciation Index Fund tracks a benchmark that includes U.S. companies that have increased their dividends for ten or more consecutive years. Unlike other dividend-oriented funds, it doesn’t strive to hold stocks with the highest yields; instead, it focuses on companies with the ability and commitment to grow their dividends over time.
The requirements of the index tilt exposure toward certain sectors and away from others. For example, the index excludes certain subsectors such as real estate investment trusts (REITs) that have low potential for dividend growth.
Over the six months, the fund benefited from investors’ interest in steady income given the historically low interest rate environment.
Industrials, the largest sector, contributed most to the index’s advance. Gains were evident across most of the sector, with defense and aerospace, machinery, and transportation companies making solid contributions.
In health care, medical equipment and medical supplies firms delivered strong results, thanks in part to innovation by some top manufacturers.
In technology, semiconductor companies and those providing computer services boosted performance. Chip makers
| | | | |
| Expense Ratios | | | | |
| Your Fund Compared With Its Peer Group | | | | |
| | Investor | ETF | Admiral | Peer Group |
| | Shares | Shares | Shares | Average |
| Dividend Appreciation Index Fund | 0.19% | 0.09% | 0.09% | 1.11% |
The fund expense ratios shown are from the prospectus dated May 25, 2016, and represent estimated costs for the current fiscal year. For the
six months ended July 31, 2016, the fund’s annualized expense ratios were 0.18% for Investor Shares, 0.09% for ETF Shares, and 0.09% for
Admiral Shares. The peer-group expense ratio is derived from data provided by Lipper, a Thomson Reuters Company, and captures information
through year-end 2015.
Peer group: Large-Cap Core Funds.
4
benefited from improved earnings and industry consolidations. One of the larger tech companies venturing into cloud computing services also posted gains.
The two consumer-oriented sectors—the index’s second- and third-largest segments—also were strong contributors. Among consumer goods stocks, food producers and soft drink manufacturers were bright spots. General retailers added most to the consumer services sector.
Several of the smaller sectors posted double-digit gains. Of this group, financial stocks contributed most, thanks in part to strong results from financial services firms and non-life insurance companies. The index also benefited from its limited exposure to banks. Large banks have struggled over the past year as persistently low interest rates have eaten away at their lending margins. The benchmark excludes many of these banks from its holdings because they reduced or eliminated dividend payments during the 2008–2009 financial crisis.
Consider rebalancing to manage your risk
Let’s say you’ve taken the time to carefully create an appropriate asset allocation for your investment portfolio. Your efforts have produced a diversified mix of stock, bond, and money market funds tailored to your goals, time horizon, and risk tolerance.
But what should you do when your portfolio drifts from its original asset allocation as the financial markets rise or fall? Consider rebalancing to bring it back to the proper mix.
Just one year of outsized returns can throw your allocation out of whack. Take 2013 as an example. That year, the broad stock market (as measured by the Russell 3000 Index) returned 33.55% and the broad taxable bond market (as measured by the Barclays U.S. Aggregate Bond Index) returned –2.02%. A hypothetical portfolio that tracked the broad domestic market indexes and started the year with 60% stocks and 40% bonds would have ended with a more aggressive mix of 67% stocks and 33% bonds.
Rebalancing to bring your portfolio back to its original targets would require you to shift assets away from areas that have been performing well toward those that have been falling behind. That isn’t easy or intuitive. It’s a way to minimize risk rather than maximize returns and to stick with your investment plan through different types of markets. (You can read more about our approach in Best Practices for Portfolio Rebalancing at vanguard.com/research.)
It’s not necessary to check your portfolio every day or every month, much less rebalance it that frequently. It may be more appropriate to monitor it annually or semiannually and rebalance when your allocation swings 5 percentage points or more from its target.
5
It’s important, of course, to be aware of the tax implications. You’ll want to consult with your tax advisor, but generally speaking, it may be a good idea to make any asset changes within a tax-advantaged retirement account or to direct new cash flows into the underweighted asset class.
However you go about it, keeping your asset allocation from drifting too far off target can help you stay on track with the investment plan you’ve crafted to meet your financial goals.
As always, thank you for investing with Vanguard.
Sincerely,
F. William McNabb III
Chairman and Chief Executive Officer
August 11, 2016
6
Dividend Appreciation Index Fund
Fund Profile
As of July 31, 2016
| | | |
| Share-Class Characteristics | | |
| |
| |
| | Investor | ETF | Admiral |
| | Shares | Shares | Shares |
| Ticker Symbol | VDAIX | VIG | VDADX |
| Expense Ratio1 | 0.19% | 0.09% | 0.09% |
| 30-Day SEC Yield | 2.01% | 2.09% | 2.09% |
| | | |
| Portfolio Characteristics | | |
| | | NASDAQ | DJ |
| | | US | U.S. |
| | | Dividend | Total |
| | | Achievers | Market |
| | | Select | FA |
| | Fund | Index | Index |
| Number of Stocks | 185 | 185 | 3,839 |
| Median Market Cap | $54.0B | $54.0B | $54.0B |
| Price/Earnings Ratio | 24.6x | 24.6x | 23.5x |
| Price/Book Ratio | 4.3x | 4.3x | 2.8x |
| Return on Equity | 21.2% | 20.4% | 16.3% |
| Earnings Growth | | | |
| Rate | 4.6% | 4.6% | 7.3% |
| Dividend Yield | 2.2% | 2.2% | 2.0% |
| Foreign Holdings | 0.0% | 0.0% | 0.0% |
| Turnover Rate | | | |
| (Annualized) | 21% | — | — |
| Short-Term | | | |
| Reserves | 0.0% | — | — |
| | |
| Volatility Measures | | |
| | NASDAQ | |
| | US Dividend | DJ |
| | Achievers | U.S. Total |
| | Select | Market |
| | Index | FA Index |
| R-Squared | 1.00 | 0.89 |
| Beta | 1.00 | 0.89 |
| These measures show the degree and timing of the fund’s |
| fluctuations compared with the indexes over 36 months. |
| | |
| Ten Largest Holdings (% of total net assets) |
| Johnson & Johnson | Pharmaceuticals | 4.3% |
| Microsoft Corp. | Software | 4.0 |
| PepsiCo Inc. | Soft Drinks | 3.9 |
| Coca-Cola Co. | Soft Drinks | 3.6 |
| Medtronic plc | Medical Equipment | 3.0 |
| 3M Co. | Diversified Industrials | 2.7 |
| McDonald's Corp. | Restaurants & Bars | 2.6 |
| CVS Health Corp. | Drug Retailers | 2.5 |
| United Technologies | | |
| Corp. | Aerospace | 2.2 |
| Walgreens Boots | | |
| Alliance Inc. | Drug Retailers | 2.1 |
| Top Ten | | 30.9% |
| The holdings listed exclude any temporary cash investments and equity index products. |
Investment Focus
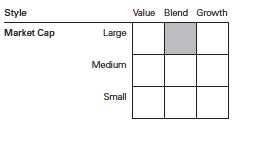
1 The expense ratios shown are from the prospectus dated May 25, 2016, and represent estimated costs for the current fiscal year. For the six
months ended July 31, 2016, the annualized expense ratios were 0.18% for Investor Shares, 0.09% for ETF Shares, and 0.09% for Admiral Shares.
7
Dividend Appreciation Index Fund
| | | |
| Sector Diversification (% of equity exposure) |
| | | NASDAQ | DJ |
| | | US | U.S. |
| | | Dividend | Total |
| | | Achievers | Market |
| | | Select | FA |
| | Fund | Index | Index |
| Basic Materials | 4.3% | 4.3% | 2.5% |
| Consumer Goods | 22.4 | 22.4 | 10.4 |
| Consumer Services | 17.9 | 17.9 | 13.6 |
| Financials | 7.7 | 7.7 | 18.7 |
| Health Care | 12.2 | 12.2 | 13.6 |
| Industrials | 23.6 | 23.6 | 12.6 |
| Oil & Gas | 1.1 | 1.1 | 6.3 |
| Technology | 7.7 | 7.7 | 16.3 |
| Telecommunications | 0.1 | 0.1 | 2.5 |
| Utilities | 3.0 | 3.0 | 3.5 |
8
Dividend Appreciation Index Fund
Performance Summary
All of the returns in this report represent past performance, which is not a guarantee of future results that may be achieved by the fund. (Current performance may be lower or higher than the performance data cited. For performance data current to the most recent month-end, visit our website at vanguard.com/performance.) Note, too, that both investment returns and principal value can fluctuate widely, so an investor’s shares, when sold, could be worth more or less than their original cost. The returns shown do not reflect taxes that a shareholder would pay on fund distributions or on the sale of fund shares.
Fiscal-Year Total Returns (%): April 27, 2006, Through July 31, 2016

Note: For 2017, performance data reflect the six months ended July 31, 2016.
Average Annual Total Returns: Periods Ended June 30, 2016
This table presents returns through the latest calendar quarter—rather than through the end of the fiscal period.
Securities and Exchange Commission rules require that we provide this information.
| | | | |
| | Inception | One | Five | Ten |
| | Date | Year | Years | Years |
| Investor Shares | 4/27/2006 | 8.26% | 10.55% | 7.55% |
| ETF Shares | 4/21/2006 | | | |
| Market Price | | 8.29 | 10.66 | 7.66 |
| Net Asset Value | | 8.35 | 10.66 | 7.67 |
| Admiral Shares | 12/19/2013 | 8.33 | — | 7.191 |
| 1 Return since inception. |
See Financial Highlights for dividend and capital gains information.
9
Dividend Appreciation Index Fund
Financial Statements (unaudited)
Statement of Net Assets
As of July 31, 2016
The fund reports a complete list of its holdings in regulatory filings four times in each fiscal year, at the quarter-ends. For the second and fourth fiscal quarters, the lists appear in the fund’s semiannual and annual reports to shareholders. For the first and third fiscal quarters, the fund files the lists with the Securities and Exchange Commission on Form N-Q. Shareholders can look up the fund’s Forms N-Q on the SEC’s website at sec.gov. Forms N-Q may also be reviewed and copied at the SEC’s Public Reference Room (see the back cover of this report for further information).
| | |
| | | Market |
| | | Value• |
| | Shares | ($000) |
| Common Stocks (99.8%)1 | | |
| Basic Materials (4.3%) | | |
| Ecolab Inc. | 1,972,103 | 233,458 |
| Praxair Inc. | 1,897,493 | 221,134 |
| Air Products & | | |
| Chemicals Inc. | 1,436,840 | 214,693 |
| PPG Industries Inc. | 1,777,075 | 186,077 |
| International Flavors & | | |
| Fragrances Inc. | 534,719 | 71,251 |
| Albemarle Corp. | 747,593 | 62,925 |
| RPM International Inc. | 885,068 | 48,024 |
| Westlake Chemical Corp. | 867,176 | 39,665 |
| Royal Gold Inc. | 434,908 | 36,767 |
| Sensient Technologies | | |
| Corp. | 299,324 | 22,099 |
| HB Fuller Co. | 332,869 | 15,498 |
| Stepan Co. | 148,325 | 9,539 |
| | | 1,161,130 |
| Consumer Goods (22.4%) | | |
| PepsiCo Inc. | 9,629,638 | 1,048,860 |
| Coca-Cola Co. | 22,540,268 | 983,432 |
| NIKE Inc. Class B | 8,993,285 | 499,127 |
| Reynolds American Inc. | 9,509,256 | 476,034 |
| Colgate-Palmolive Co. | 5,947,601 | 442,680 |
| Monsanto Co. | 2,933,187 | 313,177 |
| Kimberly-Clark Corp. | 2,404,422 | 311,493 |
| General Mills Inc. | 3,953,069 | 284,186 |
| Kellogg Co. | 2,333,224 | 192,981 |
| Archer-Daniels-Midland | | |
| Co. | 3,956,263 | 178,348 |
| VF Corp. | 2,839,815 | 177,290 |
| Hormel Foods Corp. | 3,520,461 | 131,489 |
| Stanley Black & Decker | | |
| Inc. | 1,014,908 | 123,514 |
| JM Smucker Co. | 797,284 | 122,909 |
| Clorox Co. | 862,465 | 113,043 |
| Genuine Parts Co. | 996,061 | 101,837 |
| Church & Dwight Co. Inc. | 864,142 | 84,893 |
| McCormick & Co. Inc. | 768,595 | 78,589 |
| | | |
| | Brown-Forman Corp. | | |
| | Class B | 778,054 | 76,397 |
| | Hasbro Inc. | 831,278 | 67,525 |
| | Bunge Ltd. | 939,277 | 61,842 |
| | Leggett & Platt Inc. | 903,900 | 47,518 |
| | Polaris Industries Inc. | 432,711 | 42,730 |
| | Flowers Foods Inc. | 1,413,592 | 25,996 |
| | Lancaster Colony Corp. | 182,417 | 23,707 |
| | J&J Snack Foods Corp. | 124,467 | 15,137 |
| ^ | Tootsie Roll Industries Inc. | 254,763 | 9,459 |
| | Andersons Inc. | 186,124 | 6,883 |
| | | | 6,041,076 |
| Consumer Services (17.9%) | | |
| | McDonald’s Corp. | 6,006,738 | 706,693 |
| | CVS Health Corp. | 7,318,354 | 678,558 |
| | Walgreens Boots | | |
| | Alliance Inc. | 7,186,812 | 569,555 |
| | Lowe’s Cos. Inc. | 6,062,675 | 498,837 |
| | Costco Wholesale Corp. | 2,929,978 | 489,951 |
| | TJX Cos. Inc. | 4,460,551 | 364,516 |
| | Target Corp. | 4,012,181 | 302,237 |
| | Yum! Brands Inc. | 2,723,026 | 243,493 |
| | Sysco Corp. | 3,761,741 | 194,820 |
| | Cardinal Health Inc. | 2,193,788 | 183,401 |
| | Ross Stores Inc. | 2,697,931 | 166,813 |
| | AmerisourceBergen Corp. | | |
| | Class A | 1,369,032 | 116,628 |
| | Best Buy Co. Inc. | 2,157,492 | 72,492 |
| | Tiffany & Co. | 854,381 | 55,125 |
| | FactSet Research | | |
| | Systems Inc. | 274,505 | 47,204 |
| | Rollins Inc. | 1,457,963 | 41,085 |
| | Casey’s General Stores | | |
| | Inc. | 259,973 | 34,717 |
| | John Wiley & Sons Inc. | | |
| | Class A | 323,494 | 18,666 |
| | Monro Muffler Brake Inc. | 214,198 | 13,413 |
| | Matthews International | | |
| | Corp. Class A | 219,914 | 13,219 |
10
Dividend Appreciation Index Fund
| | | |
| | | | Market |
| | | | Value• |
| | | Shares | ($000) |
| | Aaron’s Inc. | 483,404 | 11,577 |
| | International Speedway | | |
| | Corp. Class A | 177,643 | 5,999 |
| | | | 4,828,999 |
| Financials (7.7%) | | |
| | Chubb Ltd. | 3,075,821 | 385,277 |
| | Travelers Cos. Inc. | 1,965,254 | 228,402 |
| | S&P Global Inc. | 1,767,597 | 216,000 |
| | Aflac Inc. | 2,798,318 | 202,262 |
| | Franklin Resources Inc. | 3,948,068 | 142,881 |
| | T. Rowe Price Group Inc. | 1,653,527 | 116,888 |
| | Ameriprise Financial Inc. | 1,125,889 | 107,905 |
| | Cincinnati Financial Corp. | 1,094,840 | 81,784 |
| | Torchmark Corp. | 807,670 | 49,970 |
| | SEI Investments Co. | 1,090,494 | 49,072 |
| | WR Berkley Corp. | 816,429 | 47,508 |
| | American Financial Group | | |
| | Inc. | 577,091 | 42,185 |
| | Assurant Inc. | 431,440 | 35,814 |
| | Axis Capital Holdings Ltd. | 632,387 | 35,148 |
| | Brown & Brown Inc. | 923,509 | 33,856 |
| | RenaissanceRe Holdings | | |
| | Ltd. | 287,369 | 33,772 |
| | Commerce Bancshares Inc. | 644,894 | 30,497 |
| | Erie Indemnity Co. Class A | 307,903 | 30,079 |
| | Eaton Vance Corp. | 768,916 | 29,073 |
| ^ | BOK Financial Corp. | 440,321 | 28,722 |
| | Prosperity Bancshares Inc. | 465,500 | 23,782 |
| | Hanover Insurance Group | | |
| | Inc. | 285,520 | 23,510 |
| | Bank of the Ozarks Inc. | 604,270 | 21,748 |
| | RLI Corp. | 290,236 | 19,785 |
| | UMB Financial Corp. | 329,701 | 18,269 |
| | Community Bank System | | |
| | Inc. | 292,290 | 12,899 |
| | American Equity | | |
| | Investment Life Holding | | |
| | Co. | 545,434 | 8,689 |
| | Tompkins Financial Corp. | 99,646 | 7,248 |
| | BancFirst Corp. | 103,642 | 6,796 |
| | Infinity Property & | | |
| | Casualty Corp. | 73,764 | 6,052 |
| | 1st Source Corp. | 172,355 | 5,793 |
| | | | 2,081,666 |
| Health Care (12.1%) | | |
| | Johnson & Johnson | 9,240,189 | 1,157,149 |
| | Medtronic plc | 9,368,119 | 820,928 |
| | Abbott Laboratories | 9,815,104 | 439,226 |
| | Stryker Corp. | 2,485,029 | 288,959 |
| | Becton Dickinson and Co. | 1,411,225 | 248,376 |
| | CR Bard Inc. | 491,259 | 109,909 |
| | Perrigo Co. plc | 953,981 | 87,184 |
| | STERIS plc | 572,264 | 40,602 |
| | West Pharmaceutical | | |
| | Services Inc. | 481,903 | 38,687 |
| | |
| Healthcare Services Group | | |
| Inc. | 480,459 | 18,647 |
| Owens & Minor Inc. | 417,327 | 14,903 |
| National HealthCare Corp. | 99,828 | 6,449 |
| Atrion Corp. | 12,162 | 5,799 |
| | | 3,276,818 |
| Industrials (23.5%) | | |
| 3M Co. | 4,030,935 | 718,958 |
| United Technologies | | |
| Corp. | 5,572,497 | 599,879 |
| ^ Lockheed Martin Corp. | 2,035,221 | 514,361 |
| Accenture plc Class A | 4,183,329 | 471,921 |
| General Dynamics Corp. | 2,073,120 | 304,521 |
| FedEx Corp. | 1,836,292 | 297,296 |
| Illinois Tool Works Inc. | 2,423,638 | 279,688 |
| Raytheon Co. | 1,992,055 | 277,951 |
| Automatic Data | | |
| Processing Inc. | 3,047,713 | 271,094 |
| Northrop Grumman Corp. | 1,205,503 | 261,148 |
| Waste Management Inc. | 2,969,272 | 196,328 |
| Sherwin-Williams Co. | 614,656 | 184,231 |
| CSX Corp. | 6,415,945 | 181,764 |
| Norfolk Southern Corp. | 1,986,479 | 178,346 |
| Republic Services Inc. | | |
| Class A | 2,297,537 | 117,772 |
| Roper Technologies Inc. | 673,230 | 114,691 |
| Parker-Hannifin Corp. | 899,932 | 102,763 |
| WW Grainger Inc. | 411,301 | 90,013 |
| Fastenal Co. | 1,922,069 | 82,168 |
| L-3 Communications | | |
| Holdings Inc. | 518,576 | 78,632 |
| Cintas Corp. | 720,490 | 77,287 |
| Dover Corp. | 1,032,640 | 73,762 |
| CH Robinson Worldwide | | |
| Inc. | 954,426 | 66,447 |
| JB Hunt Transport | | |
| Services Inc. | 751,385 | 62,463 |
| Expeditors International | | |
| of Washington Inc. | 1,213,003 | 59,959 |
| Valspar Corp. | 526,248 | 56,030 |
| Jack Henry & Associates | | |
| Inc. | 525,384 | 46,891 |
| AO Smith Corp. | 497,690 | 46,230 |
| Carlisle Cos. Inc. | 427,528 | 44,159 |
| Toro Co. | 365,839 | 33,639 |
| Nordson Corp. | 379,530 | 33,509 |
| AptarGroup Inc. | 418,840 | 32,745 |
| Bemis Co. Inc. | 630,962 | 32,204 |
| Donaldson Co. Inc. | 884,011 | 31,939 |
| Robert Half International | | |
| Inc. | 873,730 | 31,926 |
| Lincoln Electric Holdings | | |
| Inc. | 470,672 | 29,210 |
| Graco Inc. | 366,993 | 27,161 |
| Crane Co. | 388,021 | 24,174 |
11
Dividend Appreciation Index Fund
| | | |
| | | | Market |
| | | | Value• |
| | | Shares | ($000) |
| | Ryder System Inc. | 356,546 | 23,496 |
| ^ | MSC Industrial Direct Co. | | |
| | Inc. Class A | 321,213 | 23,073 |
| | CLARCOR Inc. | 322,851 | 20,101 |
| | Silgan Holdings Inc. | 402,579 | 19,960 |
| | Valmont Industries Inc. | 151,665 | 19,861 |
| | ITT Inc. | 596,436 | 18,913 |
| | Regal Beloit Corp. | 297,594 | 18,156 |
| | MSA Safety Inc. | 248,993 | 13,914 |
| | ABM Industries Inc. | 372,958 | 13,878 |
| | Franklin Electric Co. Inc. | 309,074 | 11,967 |
| | G&K Services Inc. Class A | 132,699 | 10,644 |
| | Tennant Co. | 117,272 | 7,515 |
| | Badger Meter Inc. | 96,463 | 6,727 |
| ^ | Lindsay Corp. | 74,202 | 5,206 |
| | Gorman-Rupp Co. | 173,911 | 4,711 |
| | Cass Information Systems | |
| | Inc. | 75,782 | 3,938 |
| | Mesa Laboratories Inc. | 24,076 | 2,784 |
| | | | 6,358,104 |
| Oil & Gas (1.1%) | | |
| | EOG Resources Inc. | 3,663,562 | 299,313 |
| |
| Technology (7.7%) | | |
| | Microsoft Corp. | 19,106,951 | 1,082,982 |
| | Texas Instruments Inc. | 6,697,224 | 467,131 |
| | Analog Devices Inc. | 2,065,483 | 131,840 |
| | Linear Technology Corp. | 1,594,459 | 95,652 |
| | Xilinx Inc. | 1,702,361 | 86,957 |
| | Maxim Integrated | | |
| | Products Inc. | 1,907,975 | 77,807 |
| | Microchip Technology | | |
| | Inc. | 1,357,253 | 75,517 |
| | Harris Corp. | 830,328 | 71,923 |
| | | | 2,089,809 |
| Telecommunications (0.1%) | | |
| | Telephone & Data | | |
| | Systems Inc. | 677,477 | 21,333 |
| | ATN International Inc. | 106,934 | 7,862 |
| | | | 29,195 |
| Utilities (3.0%) | | |
| | NextEra Energy Inc. | 3,068,666 | 393,679 |
| | Edison International | 2,170,415 | 167,947 |
| | Atmos Energy Corp. | 680,115 | 54,266 |
| | UGI Corp. | 1,145,508 | 51,846 |
| | Aqua America Inc. | 1,179,930 | 40,873 |
| | WGL Holdings Inc. | 332,076 | 23,508 |
| | New Jersey Resources | | |
| | Corp. | 572,623 | 21,324 |
| | MGE Energy Inc. | 230,676 | 12,952 |
| | California Water Service | | |
| | Group | 318,347 | 10,738 |
| | | | |
| | American States Water Co. | 243,489 | 10,519 |
| | Chesapeake Utilities Corp. | 101,527 | 6,505 |
| | SJW Corp. | | 136,072 | 5,764 |
| | Connecticut Water Service | | |
| | Inc. | | 74,163 | 3,786 |
| | | | | 803,707 |
| Total Common Stocks | | | |
| (Cost $21,990,363) | | | 26,969,817 |
| Temporary Cash Investments (0.3%)1 | |
| Money Market Fund (0.3%) | | |
| 2,3 | Vanguard Market Liquidity | | |
| | Fund, 0.561% | 68,312,221 | 68,312 |
| |
| | | | Face | |
| | | | Amount | |
| | | | ($000) | |
| U.S. Government and Agency Obligations (0.0%) |
| 4 | Federal Home Loan | | | |
| | Bank Discount Notes, | | |
| | 0.501%, 8/19/16 | | 1,700 | 1,700 |
| 4,5 | Federal Home Loan | | | |
| | Bank Discount Notes, | | |
| | 0.491%, 9/16/16 | | 2,600 | 2,599 |
| | | | | 4,299 |
| Total Temporary Cash Investments | |
| (Cost $72,610) | | | 72,611 |
| Total Investments (100.1%) | | |
| (Cost $22,062,973) | | | 27,042,428 |
12
Dividend Appreciation Index Fund
| |
| | Amount |
| | ($000) |
| Other Assets and Liabilities (-0.1%) | |
| Other Assets | |
| Investment in Vanguard | 2,112 |
| Receivables for Accrued Income | 23,352 |
| Receivables for Capital Shares Issued | 8,920 |
| Other Assets | 1,072 |
| Total Other Assets | 35,456 |
| Liabilities | |
| Payables for Investment Securities | |
| Purchased | (11,951) |
| Collateral for Securities on Loan | (47,145) |
| Payables for Capital Shares Redeemed | (2,224) |
| Payables to Vanguard | (10,148) |
| Total Liabilities | (71,468) |
| Net Assets (100%) | 27,006,416 |
| |
| |
| At July 31, 2016, net assets consisted of: |
| | Amount |
| | ($000) |
| Paid-in Capital | 22,675,995 |
| Undistributed Net Investment Income | 29,516 |
| Accumulated Net Realized Losses | (680,486) |
| Unrealized Appreciation (Depreciation) | |
| Investment Securities | 4,979,455 |
| Futures Contracts | 1,936 |
| Net Assets | 27,006,416 |
| |
| | Amount |
| | ($000) |
| Investor Shares—Net Assets | |
| Applicable to 26,466,752 outstanding | |
| $.001 par value shares of beneficial | |
| interest (unlimited authorization) | 901,933 |
| Net Asset Value Per Share— | |
| Investor Shares | $34.08 |
| |
| |
| ETF Shares—Net Assets | |
| Applicable to 260,342,690 outstanding | |
| $.001 par value shares of beneficial | |
| interest (unlimited authorization) | 22,174,651 |
| Net Asset Value Per Share— | |
| ETF Shares | $85.17 |
| |
| |
| Admiral Shares—Net Assets | |
| Applicable to 170,023,081 outstanding | |
| $.001 par value shares of beneficial | |
| interest (unlimited authorization) | 3,929,832 |
| Net Asset Value Per Share— | |
| Admiral Shares | $23.11 |
|
| • See Note A in Notes to Financial Statements. |
| ^ Includes partial security positions on loan to broker-dealers. The total value of securities on loan is $45,560,000. |
| 1 The fund invests a portion of its cash reserves in equity markets through the use of index futures contracts. After giving effect to futures |
| investments, the fund’s effective common stock and temporary cash investment positions represent 100.0% and 0.1%, respectively, |
| of net assets. |
| 2 Affiliated money market fund available only to Vanguard funds and certain trusts and accounts managed by Vanguard. Rate shown is the |
| 7-day yield. |
| 3 Includes $47,145,000 of collateral received for securities on loan. |
| 4 The issuer operates under a congressional charter; its securities are generally neither guaranteed by the U.S. Treasury nor backed by the full |
| faith and credit of the U.S. government. |
| 5 Securities with a value of $1,399,000 have been segregated as initial margin for open futures contracts. |
| See accompanying Notes, which are an integral part of the Financial Statements. |
13
Dividend Appreciation Index Fund
Statement of Operations
| |
| | Six Months Ended |
| | July 31, 2016 |
| | ($000) |
| Investment Income | |
| Income | |
| Dividends | 285,781 |
| Interest1 | 44 |
| Securities Lending | 283 |
| Total Income | 286,108 |
| Expenses | |
| The Vanguard Group—Note B | |
| Investment Advisory Services | 1,491 |
| Management and Administrative—Investor Shares | 628 |
| Management and Administrative—ETF Shares | 6,802 |
| Management and Administrative—Admiral Shares | 1,126 |
| Marketing and Distribution—Investor Shares | 96 |
| Marketing and Distribution—ETF Shares | 451 |
| Marketing and Distribution—Admiral Shares | 148 |
| Custodian Fees | 153 |
| Shareholders’ Reports—Investor Shares | 14 |
| Shareholders’ Reports—ETF Shares | 257 |
| Shareholders’ Reports—Admiral Shares | 21 |
| Trustees’ Fees and Expenses | 7 |
| Total Expenses | 11,194 |
| Net Investment Income | 274,914 |
| Realized Net Gain (Loss) | |
| Investment Securities Sold | (268,250) |
| Futures Contracts | 3,131 |
| Realized Net Gain (Loss) | (265,119) |
| Change in Unrealized Appreciation (Depreciation) | |
| Investment Securities | 3,102,074 |
| Futures Contracts | 1,927 |
| Change in Unrealized Appreciation (Depreciation) | 3,104,001 |
| Net Increase (Decrease) in Net Assets Resulting from Operations | 3,113,796 |
| 1 Interest income from an affiliated company of the fund was $35,000. |
See accompanying Notes, which are an integral part of the Financial Statements.
14
Dividend Appreciation Index Fund
Statement of Changes in Net Assets
| | |
| | Six Months Ended | Year Ended |
| | July 31, | January 31, |
| | 2016 | 2016 |
| | ($000) | ($000) |
| Increase (Decrease) in Net Assets | | |
| Operations | | |
| Net Investment Income | 274,914 | 533,935 |
| Realized Net Gain (Loss) | (265,119) | 2,703,169 |
| Change in Unrealized Appreciation (Depreciation) | 3,104,001 | (3,303,415) |
| Net Increase (Decrease) in Net Assets Resulting from Operations | 3,113,796 | (66,311) |
| Distributions | | |
| Net Investment Income | | |
| Investor Shares | (8,728) | (24,306) |
| ETF Shares | (217,671) | (456,267) |
| Admiral Shares | (37,582) | (73,040) |
| Realized Capital Gain | | |
| Investor Shares | — | — |
| ETF Shares | — | — |
| Admiral Shares | — | — |
| Total Distributions | (263,981) | (553,613) |
| Capital Share Transactions | | |
| Investor Shares | (73,584) | (554,813) |
| ETF Shares | 1,057,958 | (1,350,433) |
| Admiral Shares | 311,217 | 550,641 |
| Net Increase (Decrease) from Capital Share Transactions | 1,295,591 | (1,354,605) |
| Total Increase (Decrease) | 4,145,406 | (1,974,529) |
| Net Assets | | |
| Beginning of Period | 22,861,010 | 24,835,539 |
| End of Period1 | 27,006,416 | 22,861,010 |
| 1 Net Assets—End of Period includes undistributed (overdistributed) net investment income of $29,516,000 and $18,583,000. |
See accompanying Notes, which are an integral part of the Financial Statements.
15
Dividend Appreciation Index Fund
Financial Highlights
| | | | | | |
| Investor Shares | | | | | | |
| Six Months | | | | | |
| | Ended | | | | | |
| For a Share Outstanding | July 31, | Year Ended January 31, |
| Throughout Each Period | 2016 | 2016 | 2015 | 2014 | 2013 | 2012 |
| Net Asset Value, Beginning of Period | $30.40 | $31.37 | $28.59 | $25.23 | $22.42 | $21.33 |
| Investment Operations | | | | | | |
| Net Investment Income | . 338 | . 670 | . 627 | . 540 | . 538 | . 445 |
| Net Realized and Unrealized Gain (Loss) | | | | | | |
| on Investments | 3.668 | (.947) | 2.756 | 3.350 | 2.812 | 1.089 |
| Total from Investment Operations | 4.006 | (.277) | 3.383 | 3.890 | 3.350 | 1.534 |
| Distributions | | | | | | |
| Dividends from Net Investment Income | (. 326) | (. 693) | (. 603) | (. 530) | (. 540) | (. 444) |
| Distributions from Realized Capital Gains | — | — | — | — | — | — |
| Total Distributions | (. 326) | (. 693) | (. 603) | (. 530) | (. 540) | (. 444) |
| Net Asset Value, End of Period | $34.08 | $30.40 | $31.37 | $28.59 | $25.23 | $22.42 |
| |
| Total Return1 | 13.23% | -0.93% | 11.86% | 15.51% | 15.15% | 7.34% |
| |
| Ratios/Supplemental Data | | | | | | |
| Net Assets, End of Period (Millions) | $902 | $875 | $1,450 | $2,966 | $2,804 | $2,206 |
| Ratio of Total Expenses to | | | | | | |
| Average Net Assets | 0.18% | 0.19% | 0.20% | 0.20% | 0.20% | 0.25% |
| Ratio of Net Investment Income to | | | | | | |
| Average Net Assets | 2.11% | 2.11% | 2.04% | 1.98% | 2.32% | 2.14% |
| Portfolio Turnover Rate2 | 21% | 22% | 20% | 3% | 15% | 14% |
The expense ratio, net investment income ratio, and turnover rate for the current period have been annualized.
1 Total returns do not include account service fees that may have applied in the periods shown. Fund prospectuses provide information about
any applicable account service fees.
2 Excludes the value of portfolio securities received or delivered as a result of in-kind purchases or redemptions of the fund’s capital shares,
including ETF Creation Units.
See accompanying Notes, which are an integral part of the Financial Statements.
16
Dividend Appreciation Index Fund
Financial Highlights
| | | | | | |
| ETF Shares | | | | | | |
| Six Months | | | | | |
| | Ended | | | | | |
| For a Share Outstanding | July 31, | Year Ended January 31, |
| Throughout Each Period | 2016 | 2016 | 2015 | 2014 | 2013 | 2012 |
| Net Asset Value, Beginning of Period | $75.98 | $78.42 | $71.47 | $63.08 | $56.04 | $53.32 |
| Investment Operations | | | | | | |
| Net Investment Income | .886 | 1.759 | 1.645 | 1.421 | 1.401 | 1.173 |
| Net Realized and Unrealized Gain (Loss) | | | | | | |
| on Investments | 9.160 | (2.380) | 6.890 | 8.357 | 7.049 | 2.719 |
| Total from Investment Operations | 10.046 | (.621) | 8.535 | 9.778 | 8.450 | 3.892 |
| Distributions | | | | | | |
| Dividends from Net Investment Income | (.856) | (1.819) | (1.585) | (1.388) | (1.410) | (1.172) |
| Distributions from Realized Capital Gains | — | — | — | — | — | — |
| Total Distributions | (.856) | (1.819) | (1.585) | (1.388) | (1.410) | (1.172) |
| Net Asset Value, End of Period | $85.17 | $75.98 | $78.42 | $71.47 | $63.08 | $56.04 |
| |
| Total Return | 13.28% | -0.84% | 11.97% | 15.60% | 15.29% | 7.46% |
| |
| Ratios/Supplemental Data | | | | | | |
| Net Assets, End of Period (Millions) | $22,175 | $18,771 | $20,610 | $18,511 | $13,119 | $9,677 |
| Ratio of Total Expenses to | | | | | | |
| Average Net Assets | 0.09% | 0.09% | 0.10% | 0.10% | 0.10% | 0.13% |
| Ratio of Net Investment Income to | | | | | | |
| Average Net Assets | 2.20% | 2.21% | 2.14% | 2.08% | 2.42% | 2.26% |
| Portfolio Turnover Rate1 | 21% | 22% | 20% | 3% | 15% | 14% |
The expense ratio, net investment income ratio, and turnover rate for the current period have been annualized.
1 Excludes the value of portfolio securities received or delivered as a result of in-kind purchases or redemptions of the fund’s capital shares,
including ETF Creation Units.
See accompanying Notes, which are an integral part of the Financial Statements.
17
Dividend Appreciation Index Fund
Financial Highlights
| | | | |
| Admiral Shares | | | | |
| | Six Months | | | Dec. 19, |
| | Ended | Year Ended | 20131 to |
| | July 31, | January 31, | Jan. 31, |
| For a Share Outstanding Throughout Each Period | 2016 | 2016 | 2015 | 2014 |
| Net Asset Value, Beginning of Period | $20.62 | $21.28 | $19.40 | $20.00 |
| Investment Operations | | | | |
| Net Investment Income | . 241 | . 478 | . 445 | . 030 |
| Net Realized and Unrealized Gain (Loss) on Investments | 2.481 | (.644) | 1.865 | (.630) |
| Total from Investment Operations | 2.722 | (.166) | 2.310 | (.600) |
| Distributions | | | | |
| Dividends from Net Investment Income | (. 232) | (. 494) | (. 430) | — |
| Distributions from Realized Capital Gains | — | — | — | — |
| Total Distributions | (. 232) | (. 494) | (. 430) | — |
| Net Asset Value, End of Period | $23.11 | $20.62 | $21.28 | $19.40 |
| |
| Total Return2 | 13.26% | -0.83% | 11.94% | -3.00% |
| |
| Ratios/Supplemental Data | | | | |
| Net Assets, End of Period (Millions) | $3,930 | $3,215 | $2,776 | $760 |
| Ratio of Total Expenses to Average Net Assets | 0.09% | 0.09% | 0.10% | 0.10%3 |
| Ratio of Net Investment Income to Average Net Assets | 2.20% | 2.21% | 2.14% | 2.08%3 |
| Portfolio Turnover Rate 4 | 21% | 22% | 20% | 3% |
The expense ratio, net investment income ratio, and turnover rate for the current period have been annualized.
1 Inception.
2 Total returns do not include account service fees that may have applied in the periods shown. Fund prospectuses provide information
about any applicable account service fees.
3 Annualized.
4 Excludes the value of portfolio securities received or delivered as a result of in-kind purchases or redemptions of the fund’s capital
shares, including ETF Creation Units.
See accompanying Notes, which are an integral part of the Financial Statements.
18
Dividend Appreciation Index Fund
Notes to Financial Statements
Vanguard Dividend Appreciation Index Fund is registered under the Investment Company Act of 1940 as an open-end investment company, or mutual fund. The fund offers three classes of shares: Investor Shares, ETF Shares, and Admiral Shares. Investor Shares are available to any investor who meets the fund’s minimum purchase requirements. ETF Shares are listed for trading on NYSE Arca; they can be purchased and sold through a broker. Admiral Shares are designed for investors who meet certain administrative, service, and account-size criteria.
A. The following significant accounting policies conform to generally accepted accounting principles for U.S. investment companies. The fund consistently follows such policies in preparing its financial statements.
1. Security Valuation: Securities are valued as of the close of trading on the New York Stock Exchange (generally 4 p.m., Eastern time) on the valuation date. Equity securities are valued at the latest quoted sales prices or official closing prices taken from the primary market in which each security trades; such securities not traded on the valuation date are valued at the mean of the latest quoted bid and asked prices. Securities for which market quotations are not readily available, or whose values have been materially affected by events occurring before the fund’s pricing time but after the close of the securities’ primary markets, are valued by methods deemed by the board of trustees to represent fair value. Investments in Vanguard Market Liquidity Fund are valued at that fund’s net asset value. Temporary cash investments acquired over 60 days to maturity are valued using the latest bid prices or using valuations based on a matrix system (which considers such factors as security prices, yields, maturities, and ratings), both as furnished by independent pricing services. Other temporary cash investments are valued at amortized cost, which approximates market value.
2. Futures Contracts: The fund uses index futures contracts to a limited extent, with the objectives of maintaining full exposure to the stock market, enhancing returns, maintaining liquidity, and minimizing transaction costs. The fund may purchase futures contracts to immediately invest incoming cash in the market, or sell futures in response to cash outflows, thereby simulating a fully invested position in the underlying index while maintaining a cash balance for liquidity. The fund may seek to enhance returns by using futures contracts instead of the underlying securities when futures are believed to be priced more attractively than the underlying securities. The primary risks associated with the use of futures contracts are imperfect correlation between changes in market values of stocks held by the fund and the prices of futures contracts, and the possibility of an illiquid market. Counterparty risk involving futures is mitigated because a regulated clearinghouse is the counterparty instead of the clearing broker. To further mitigate counterparty risk, the fund trades futures contracts on an exchange, monitors the financial strength of its clearing brokers and clearinghouse, and has entered into clearing agreements with its clearing brokers. The clearinghouse imposes initial margin requirements to secure the fund’s performance and requires daily settlement of variation margin representing changes in the market value of each contract.
Futures contracts are valued at their quoted daily settlement prices. The aggregate settlement values of the contracts are not recorded in the Statement of Net Assets. Fluctuations in the value of the contracts are recorded in the Statement of Net Assets as an asset (liability) and in the Statement of Operations as unrealized appreciation (depreciation) until the contracts are closed, when they are recorded as realized futures gains (losses).
During the six months ended July 31, 2016, the fund’s average investments in long and short futures contracts represented less than 1% and 0% of net assets, respectively, based on the average of aggregate settlement values at each quarter-end during the period.
19
Dividend Appreciation Index Fund
3. Federal Income Taxes: The fund intends to continue to qualify as a regulated investment company and distribute all of its taxable income. Management has analyzed the fund’s tax positions taken for all open federal income tax years (January, 2013–2016), and for the period ended July 31, 2016, and has concluded that no provision for federal income tax is required in the fund’s financial statements.
4. Distributions: Distributions to shareholders are recorded on the ex-dividend date.
5. Securities Lending: To earn additional income, the fund lends its securities to qualified institutional borrowers. Security loans are subject to termination by the fund at any time, and are required to be secured at all times by collateral in an amount at least equal to the market value of securities loaned. Daily market fluctuations could cause the value of loaned securities to be more or less than the value of the collateral received. When this occurs, the collateral is adjusted and settled on the next business day. The fund further mitigates its counterparty risk by entering into securities lending transactions only with a diverse group of prequalified counterparties, monitoring their financial strength, and entering into master securities lending agreements with its counterparties. The master securities lending agreements provide that, in the event of a counterparty’s default (including bankruptcy), the fund may terminate any loans with that borrower, determine the net amount owed, and sell or retain the collateral up to the net amount owed to the fund; however, such actions may be subject to legal proceedings. While collateral mitigates counterparty risk, in the absence of a default the fund may experience delays and costs in recovering the securities loaned. The fund invests cash collateral received in Vanguard Market Liquidity Fund, and records a liability in the Statement of Net Assets for the return of the collateral, during the period the securities are on loan. Securities lending income represents fees charged to borrowers plus income earned on invested cash collateral, less expenses associated with the loan.
6. Credit Facility: The fund and certain other funds managed by The Vanguard Group (“Vanguard”) participate in a $3.1 billion committed credit facility provided by a syndicate of lenders pursuant to a credit agreement that may be renewed annually; each fund is individually liable for its borrowings, if any, under the credit facility. Borrowings may be utilized for temporary and emergency purposes, and are subject to the fund’s regulatory and contractual borrowing restrictions. The participating funds are charged administrative fees and an annual commitment fee of 0.10% of the undrawn amount of the facility; these fees are allocated to the funds based on a method approved by the fund’s board of trustees and included in Management and Administrative expenses on the fund’s Statement of Operations. Any borrowings under this facility bear interest at a rate based upon the higher of the one-month London Interbank Offered Rate, federal funds effective rate, or overnight bank funding rate plus an agreed-upon spread.
The fund had no borrowings outstanding at July 31, 2016, or at any time during the period then ended.
7. Other: Dividend income is recorded on the ex-dividend date. Interest income includes income distributions received from Vanguard Market Liquidity Fund and is accrued daily. Premiums and discounts on debt securities purchased are amortized and accreted, respectively, to interest income over the lives of the respective securities. Security transactions are accounted for on the date securities are bought or sold. Costs used to determine realized gains (losses) on the sale of investment securities are those of the specific securities sold.
20
Dividend Appreciation Index Fund
Each class of shares has equal rights as to assets and earnings, except that each class separately bears certain class-specific expenses related to maintenance of shareholder accounts (included in Management and Administrative expenses) and shareholder reporting. Marketing and distribution expenses are allocated to each class of shares based on a method approved by the board of trustees. Income, other non-class-specific expenses, and gains and losses on investments are allocated to each class of shares based on its relative net assets.
B. In accordance with the terms of a Funds’ Service Agreement (the “FSA”) between Vanguard and the fund, Vanguard furnishes to the fund investment advisory, corporate management, administrative, marketing, and distribution services at Vanguard’s cost of operations (as defined by the FSA). These costs of operations are allocated to the fund based on methods and guidelines approved by the board of trustees. Vanguard does not require reimbursement in the current period for certain costs of operations (such as deferred compensation/benefits and risk/insurance costs); the fund’s liability for these costs of operations is included in Payables to Vanguard on the Statement of Net Assets.
Upon the request of Vanguard, the fund may invest up to 0.40% of its net assets as capital in Vanguard. At July 31, 2016, the fund had contributed to Vanguard capital in the amount of $2,112,000, representing 0.01% of the fund’s net assets and 0.84% of Vanguard’s capitalization. The fund’s trustees and officers are also directors and employees, respectively, of Vanguard.
C. Various inputs may be used to determine the value of the fund’s investments. These inputs are summarized in three broad levels for financial statement purposes. The inputs or methodologies used to value securities are not necessarily an indication of the risk associated with investing in those securities.
Level 1—Quoted prices in active markets for identical securities.
Level 2—Other significant observable inputs (including quoted prices for similar securities, interest rates, prepayment speeds, credit risk, etc.).
Level 3—Significant unobservable inputs (including the fund’s own assumptions used to determine the fair value of investments).
The following table summarizes the market value of the fund’s investments as of July 31, 2016, based on the inputs used to value them:
| | | |
| | Level 1 | Level 2 | Level 3 |
| Investments | ($000) | ($000) | ($000) |
| Common Stocks | 26,969,817 | — | — |
| Temporary Cash Investments | 68,312 | 4,299 | — |
| Futures Contracts—Assets1 | 54 | — | — |
| Total | 27,038,183 | 4,299 | — |
| 1 Represents variation margin on the last day of the reporting period. |
21
Dividend Appreciation Index Fund
D. At July 31, 2016, the aggregate settlement value of open futures contracts and the related unrealized appreciation (depreciation) were:
| | | | |
| | | | ($000) |
| | | | Aggregate | |
| | | Number of | Settlement | Unrealized |
| | | Long (Short) | Value | Appreciation |
| Futures Contracts | Expiration | Contracts | Long (Short) | (Depreciation) |
| E-mini S&P 500 Index | September 2016 | 306 | 33,173 | 1,936 |
Unrealized appreciation (depreciation) on open futures contracts is required to be treated as realized gain (loss) for tax purposes.
E. Distributions are determined on a tax basis and may differ from net investment income and realized capital gains for financial reporting purposes. Differences may be permanent or temporary. Permanent differences are reclassified among capital accounts in the financial statements to reflect their tax character. Temporary differences arise when certain items of income, expense, gain, or loss are recognized in different periods for financial statement and tax purposes. These differences will reverse at some time in the future. Differences in classification may also result from the treatment of short-term gains as ordinary income for tax purposes.
During the six months ended July 31, 2016, the fund realized $257,862,000 of net capital gains resulting from in-kind redemptions—in which shareholders exchanged fund shares for securities held by the fund rather than for cash. Because such gains are not taxable to the fund, and are not distributed to shareholders, they have been reclassified from accumulated net realized losses to paid-in capital.
The fund’s tax-basis capital gains and losses are determined only at the end of each fiscal year. For tax purposes, at January 31, 2016, the fund had available capital losses totaling $157,496,000 to offset future net capital gains. Of this amount, $11,128,000 is subject to expiration on January 31, 2019. Capital losses of $146,368,000 realized beginning in fiscal 2012 may be carried forward indefinitely under the Regulated Investment Company Modernization Act of 2010, but must be used before any expiring loss carryforwards. The fund will use these capital losses to offset net taxable capital gains, if any, realized during the year ending January 31, 2017; should the fund realize net capital losses for the year, the losses will be added to the loss carryforward balance above.
At July 31, 2016, the cost of investment securities for tax purposes was $22,062,973,000. Net unrealized appreciation of investment securities for tax purposes was $4,979,455,000, consisting of unrealized gains of $5,317,111,000 on securities that had risen in value since their purchase and $337,656,000 in unrealized losses on securities that had fallen in value since their purchase.
F. During the six months ended July 31, 2016, the fund purchased $6,940,012,000 of investment securities and sold $5,650,860,000 of investment securities, other than temporary cash investments. Purchases and sales include $1,876,254,000 and $954,934,000, respectively, in connection with in-kind purchases and redemptions of the fund’s capital shares.
22
Dividend Appreciation Index Fund
G. Capital share transactions for each class of shares were:
| | | | |
| | Six Months Ended | Year Ended |
| | July 31, 2016 | January 31, 2016 |
| | Amount | Shares | Amount | Shares |
| | ($000) | (000) | ($000) | (000) |
| Investor Shares | | | | |
| Issued | 101,694 | 3,137 | 156,453 | 4,950 |
| Issued in Lieu of Cash Distributions | 7,998 | 246 | 20,734 | 661 |
| Redeemed | (183,276) | (5,687) | (732,000) | (23,050) |
| Net Increase (Decrease)—Investor Shares | (73,584) | (2,304) | (554,813) | (17,439) |
| ETF Shares | | | | |
| Issued | 2,021,194 | 25,283 | 6,278,046 | 78,491 |
| Issued in Lieu of Cash Distributions | — | — | — | — |
| Redeemed | (963,236) | (12,000) | (7,628,479) | (94,250) |
| Net Increase (Decrease)—ETF Shares | 1,057,958 | 13,283 | (1,350,433) | (15,759) |
| Admiral Shares | | | | |
| Issued | 604,645 | 27,460 | 1,093,111 | 50,897 |
| Issued in Lieu of Cash Distributions | 33,983 | 1,538 | 63,639 | 2,998 |
| Redeemed | (327,411) | (14,934) | (606,109) | (28,401) |
| Net Increase (Decrease)—Admiral Shares | 311,217 | 14,064 | 550,641 | 25,494 |
H. Management has determined that no material events or transactions occurred subsequent to July 31, 2016, that would require recognition or disclosure in these financial statements.
23
About Your Fund’s Expenses
As a shareholder of the fund, you incur ongoing costs, which include costs for portfolio management, administrative services, and shareholder reports (like this one), among others. Operating expenses, which are deducted from a fund’s gross income, directly reduce the investment return of the fund.
A fund’s expenses are expressed as a percentage of its average net assets. This figure is known as the expense ratio. The following examples are intended to help you understand the ongoing costs (in dollars) of investing in your fund and to compare these costs with those of other mutual funds. The examples are based on an investment of $1,000 made at the beginning of the period shown and held for the entire period.
The accompanying table illustrates your fund’s costs in two ways:
• Based on actual fund return. This section helps you to estimate the actual expenses that you paid over the period. The ”Ending Account Value“ shown is derived from the fund‘s actual return, and the third column shows the dollar amount that would have been paid by an investor who started with $1,000 in the fund. You may use the information here, together with the amount you invested, to estimate the expenses that you paid over the period.
To do so, simply divide your account value by $1,000 (for example, an $8,600 account value divided by $1,000 = 8.6), then multiply the result by the number given for your fund under the heading ”Expenses Paid During Period.“
• Based on hypothetical 5% yearly return. This section is intended to help you compare your fund‘s costs with those of other mutual funds. It assumes that the fund had a yearly return of 5% before expenses, but that the expense ratio is unchanged. In this case—because the return used is not the fund’s actual return—the results do not apply to your investment. The example is useful in making comparisons because the Securities and Exchange Commission requires all mutual funds to calculate expenses based on a 5% return. You can assess your fund’s costs by comparing this hypothetical example with the hypothetical examples that appear in shareholder reports of other funds.
Note that the expenses shown in the table are meant to highlight and help you compare ongoing costs only and do not reflect transaction costs incurred by the fund for buying and selling securities. Further, the expenses do not include any purchase, redemption, or account service fees described in the fund prospectus. If such fees were applied to your account, your costs would be higher. Your fund does not carry a “sales load.”
The calculations assume no shares were bought or sold during the period. Your actual costs may have been higher or lower, depending on the amount of your investment and the timing of any purchases or redemptions.
You can find more information about the fund’s expenses, including annual expense ratios, in the Financial Statements section of this report. For additional information on operating expenses and other shareholder costs, please refer to your fund’s current prospectus.
24
| | | |
| Six Months Ended July 31, 2016 | | | |
| | Beginning | Ending | Expenses |
| | Account Value | Account Value | Paid During |
| Dividend Appreciation Index Fund | 1/31/2016 | 7/31/2016 | Period |
| Based on Actual Fund Return | | | |
| Investor Shares | $1,000.00 | $1,132.30 | $0.95 |
| ETF Shares | 1,000.00 | 1,132.76 | 0.48 |
| Admiral Shares | 1,000.00 | 1,132.56 | 0.48 |
| Based on Hypothetical 5% Yearly Return | | | |
| Investor Shares | $1,000.00 | $1,023.97 | $0.91 |
| ETF Shares | 1,000.00 | 1,024.42 | 0.45 |
| Admiral Shares | 1,000.00 | 1,024.42 | 0.45 |
The calculations are based on expenses incurred in the most recent six-month period. The fund’s annualized six-month expense ratios for that
period are 0.18% for Investor Shares, 0.09% for ETF Shares, and 0.09% for Admiral Shares. The dollar amounts shown as “Expenses Paid”
are equal to the annualized expense ratio multiplied by the average account value over the period, multiplied by the number of days in the
most recent six-month period, then divided by the number of days in the most recent 12-month period (182/366).
25
Trustees Approve Advisory Arrangement
The board of trustees of Vanguard Dividend Appreciation Index Fund has renewed the fund’s investment advisory arrangement with The Vanguard Group, Inc. (Vanguard)—through its Equity Index Group. The board determined that continuing the fund’s internalized management structure was in the best interests of the fund and its shareholders.
The board based its decision upon an evaluation of the advisor’s investment staff, portfolio management process, and performance. The trustees considered the factors discussed below, among others. However, no single factor determined whether the board approved the arrangement. Rather, it was the totality of the circumstances that drove the board’s decision.
Nature, extent, and quality of services
The board reviewed the quality of the fund’s investment management services over both the short and long term, and took into account the organizational depth and stability of the advisor. The board considered that Vanguard has been managing investments for more than three decades. The Equity Index Group adheres to a sound, disciplined investment management process; the team has considerable experience, stability, and depth.
The board concluded that Vanguard’s experience, stability, depth, and performance, among other factors, warranted continuation of the advisory arrangement.
Investment performance
The board considered the short- and long-term performance of the fund, including any periods of outperformance or underperformance relative to a target index and peer group. The board concluded that the performance was such that the advisory arrangement should continue. Information about the fund’s most recent performance can be found in the Performance Summary section of this report.
Cost
The board concluded that the fund’s expense ratio was well below the average expense ratio charged by funds in its peer group and that the fund’s advisory fee rate was also well below its peer-group average. Information about the fund’s expenses appears in the About Your Fund’s Expenses section of this report as well as in the Financial Statements section.
The board does not conduct a profitability analysis of Vanguard, because of Vanguard’s unique “at-cost” structure. Unlike most other mutual fund management companies, Vanguard is owned by the funds it oversees, and produces “profits” only in the form of reduced expenses for fund shareholders.
The benefit of economies of scale
The board concluded that the fund’s at-cost arrangement with Vanguard ensures that the fund will realize economies of scale as it grows, with the cost to shareholders declining as the fund’s assets increase.
The board will consider whether to renew the advisory arrangement again after a one-year period.
26
Glossary
30-Day SEC Yield. A fund’s 30-day SEC yield is derived using a formula specified by the U.S. Securities and Exchange Commission. Under the formula, data related to the fund’s security holdings in the previous 30 days are used to calculate the fund’s hypothetical net income for that period, which is then annualized and divided by the fund’s estimated average net assets over the calculation period. For the purposes of this calculation, a security’s income is based on its current market yield to maturity (for bonds), its actual income (for asset-backed securities), or its projected dividend yield (for stocks). Because the SEC yield represents hypothetical annualized income, it will differ—at times significantly—from the fund’s actual experience. As a result, the fund’s income distributions may be higher or lower than implied by the SEC yield.
Beta. A measure of the magnitude of a fund’s past share-price fluctuations in relation to the ups and downs of a given market index. The index is assigned a beta of 1.00. Compared with a given index, a fund with a beta of 1.20 typically would have seen its share price rise or fall by 12% when the index rose or fell by 10%. For this report, beta is based on returns over the past 36 months for both the fund and the index. Note that a fund’s beta should be reviewed in conjunction with its R-squared (see definition). The lower the R-squared, the less correlation there is between the fund and the index, and the less reliable beta is as an indicator of volatility.
Dividend Yield. Dividend income earned by stocks, expressed as a percentage of the aggregate market value (or of net asset value, for a fund). The yield is determined by dividing the amount of the annual dividends by the aggregate value (or net asset value) at the end of the period. For a fund, the dividend yield is based solely on stock holdings and does not include any income produced by other investments.
Earnings Growth Rate. The average annual rate of growth in earnings over the past five years for the stocks now in a fund.
Equity Exposure. A measure that reflects a fund’s investments in stocks and stock futures. Any holdings in short-term reserves are excluded.
Expense Ratio. A fund’s total annual operating expenses expressed as a percentage of the fund’s average net assets. The expense ratio includes management and administrative expenses, but does not include the transaction costs of buying and selling portfolio securities.
Foreign Holdings. The percentage of a fund represented by securities or depositary receipts of companies based outside the United States.
Inception Date. The date on which the assets of a fund (or one of its share classes) are first invested in accordance with the fund’s investment objective. For funds with a subscription period, the inception date is the day after that period ends. Investment performance is measured from the inception date.
Median Market Cap. An indicator of the size of companies in which a fund invests; the midpoint of market capitalization (market price x shares outstanding) of a fund’s stocks, weighted by the proportion of the fund’s assets invested in each stock. Stocks representing half of the fund’s assets have market capitalizations above the median, and the rest are below it.
Price/Book Ratio. The share price of a stock divided by its net worth, or book value, per share. For a fund, the weighted average price/book ratio of the stocks it holds.
27
Price/Earnings Ratio. The ratio of a stock’s current price to its per-share earnings over the past year. For a fund, the weighted average P/E of the stocks it holds. P/E is an indicator of market expectations about corporate prospects; the higher the P/E, the greater the expectations for a company’s future growth.
R-Squared. A measure of how much of a fund’s past returns can be explained by the returns from the market in general, as measured by a given index. If a fund’s total returns were precisely synchronized with an index’s returns, its R-squared would be 1.00. If the fund’s returns bore no relationship to the index’s returns, its R-squared would be 0. For this report, R-squared is based on returns over the past 36 months for both the fund and the index.
Return on Equity. The annual average rate of return generated by a company during the past five years for each dollar of shareholder’s equity (net income divided by shareholder’s equity). For a fund, the weighted average return on equity for the companies whose stocks it holds.
Short-Term Reserves. The percentage of a fund invested in highly liquid, short-term securities that can be readily converted to cash.
Turnover Rate. An indication of the fund’s trading activity. Funds with high turnover rates incur higher transaction costs and may be more likely to distribute capital gains (which may be taxable to investors). The turnover rate excludes in-kind transactions, which have minimal impact on costs.
28
This page intentionally left blank.
This page intentionally left blank.
This page intentionally left blank.
The People Who Govern Your Fund
The trustees of your mutual fund are there to see that the fund is operated and managed in your best interests since, as a shareholder, you are a part owner of the fund. Your fund’s trustees also serve on the board of directors of The Vanguard Group, Inc., which is owned by the Vanguard funds and provides services to them on an at-cost basis.
A majority of Vanguard’s board members are independent, meaning that they have no affiliation with Vanguard or the funds they oversee, apart from the sizable personal investments they have made as private individuals. The independent board members have distinguished backgrounds in business, academia, and public service. Each of the trustees and executive officers oversees 198 Vanguard funds.
The following table provides information for each trustee and executive officer of the fund. More information about the trustees is in the Statement of Additional Information, which can be obtained, without charge, by contacting Vanguard at 800-662-7447, or online at vanguard.com.
| |
| InterestedTrustee1 | Rajiv L. Gupta |
| | Born 1945. Trustee Since December 2001.2 Principal |
| F. William McNabb III | Occupation(s) During the Past Five Years and Other |
| Born 1957. Trustee Since July 2009. Chairman of | Experience: Chairman and Chief Executive Officer |
| the Board. Principal Occupation(s) During the Past | (retired 2009) and President (2006–2008) of |
| Five Years and Other Experience: Chairman of the | Rohm and Haas Co. (chemicals); Director of Tyco |
| Board of The Vanguard Group, Inc., and of each of | International plc (diversified manufacturing and |
| the investment companies served by The Vanguard | services), HP Inc. (printer and personal computer |
| Group, since January 2010; Director of The Vanguard | manufacturing), and Delphi Automotive plc |
| Group since 2008; Chief Executive Officer and | (automotive components); Senior Advisor at |
| President of The Vanguard Group, and of each of | New Mountain Capital. |
| the investment companies served by The Vanguard | |
| Group, since 2008; Director of Vanguard Marketing | Amy Gutmann |
| Corporation; Managing Director of The Vanguard | Born 1949. Trustee Since June 2006. Principal |
| Group (1995–2008). | Occupation(s) During the Past Five Years and |
| | Other Experience: President of the University of |
| IndependentTrustees | Pennsylvania; Christopher H. Browne Distinguished |
| | Professor of Political Science, School of Arts and |
| Emerson U. Fullwood | Sciences, and Professor of Communication, Annenberg |
| Born 1948. Trustee Since January 2008. Principal | School for Communication, with secondary faculty |
| Occupation(s) During the Past Five Years and Other | appointments in the Department of Philosophy, School |
| Experience: Executive Chief Staff and Marketing | of Arts and Sciences, and at the Graduate School of |
| Officer for North America and Corporate Vice President | Education, University of Pennsylvania; Trustee of the |
| (retired 2008) of Xerox Corporation (document manage- | National Constitution Center; Chair of the Presidential |
| ment products and services); Executive in Residence | Commission for the Study of Bioethical Issues. |
| and 2009–2010 Distinguished Minett Professor at | |
| the Rochester Institute of Technology; Lead Director | JoAnn Heffernan Heisen |
| of SPX FLOW, Inc. (multi-industry manufacturing); | Born 1950. Trustee Since July 1998. Principal |
| Director of the United Way of Rochester, the University | Occupation(s) During the Past Five Years and |
| of Rochester Medical Center, Monroe Community | Other Experience: Corporate Vice President and |
| College Foundation, North Carolina A&T University, | Chief Global Diversity Officer (retired 2008) and |
| and Roberts Wesleyan College. | Member of the Executive Committee (1997–2008) |
| | of Johnson & Johnson (pharmaceuticals/medical |
| | devices/consumer products); Director of Skytop |
| | Lodge Corporation (hotels) and the Robert Wood |
| | Johnson Foundation; Member of the Advisory |
| | Board of the Institute for Women’s Leadership |
| | at Rutgers University. |
| | |
| F. Joseph Loughrey | Executive Officers | |
| Born 1949. Trustee Since October 2009. Principal | | |
| Occupation(s) During the Past Five Years and Other | Glenn Booraem | |
| Experience: President and Chief Operating Officer | Born 1967. Treasurer Since May 2015. Principal |
| (retired 2009) of Cummins Inc. (industrial machinery); | Occupation(s) During the Past Five Years and |
| Chairman of the Board of Hillenbrand, Inc. (specialized | Other Experience: Principal of The Vanguard Group, |
| consumer services), and of Oxfam America; Director | Inc.; Treasurer of each of the investment companies |
| of SKF AB (industrial machinery), Hyster-Yale Materials | served by The Vanguard Group; Controller of each of |
| Handling, Inc. (forklift trucks), the Lumina Foundation | the investment companies served by The Vanguard |
| for Education, and the V Foundation for Cancer | Group (2010–2015); Assistant Controller of each of |
| Research; Member of the Advisory Council for the | the investment companies served by The Vanguard |
| College of Arts and Letters and of the Advisory Board | Group (2001–2010). | |
| to the Kellogg Institute for International Studies, both | | |
| at the University of Notre Dame. | Thomas J. Higgins | |
| Born 1957. Chief Financial Officer Since September |
| Mark Loughridge | 2008. Principal Occupation(s) During the Past Five |
| Born 1953. Trustee Since March 2012. Principal | Years and Other Experience: Principal of The Vanguard |
| Occupation(s) During the Past Five Years and Other | Group, Inc.; Chief Financial Officer of each of the |
| Experience: Senior Vice President and Chief Financial | investment companies served by The Vanguard Group; |
| Officer (retired 2013) at IBM (information technology | Treasurer of each of the investment companies served |
| services); Fiduciary Member of IBM’s Retirement Plan | by The Vanguard Group (1998–2008). |
| Committee (2004–2013); Director of the Dow Chemical | | |
| Company; Member of the Council on Chicago Booth. | Peter Mahoney | |
| Born 1974. Controller Since May 2015. Principal |
| Scott C. Malpass | Occupation(s) During the Past Five Years and |
| Born 1962. Trustee Since March 2012. Principal | Other Experience: Head of Global Fund Accounting |
| Occupation(s) During the Past Five Years and Other | at The Vanguard Group, Inc.; Controller of each of the |
| Experience: Chief Investment Officer and Vice | investment companies served by The Vanguard Group; |
| President at the University of Notre Dame; Assistant | Head of International Fund Services at The Vanguard |
| Professor of Finance at the Mendoza College of | Group (2008–2014). | |
| Business at Notre Dame; Member of the Notre Dame | | |
| 403(b) Investment Committee, the Board of Advisors | Heidi Stam | |
| for Spruceview Capital Partners, and the Investment | Born 1956. Secretary Since July 2005. Principal |
| Advisory Committee of Major League Baseball; Board | Occupation(s) During the Past Five Years and Other |
| Member of TIFF Advisory Services, Inc., and Catholic | Experience: Managing Director of The Vanguard |
| Investment Services, Inc. (investment advisors). | Group, Inc.; General Counsel of The Vanguard Group; |
| Secretary of The Vanguard Group and of each of the |
| André F. Perold | investment companies served by The Vanguard Group; |
| Born 1952. Trustee Since December 2004. Principal | Director and Senior Vice President of Vanguard |
| Occupation(s) During the Past Five Years and Other | Marketing Corporation. | |
| Experience: George Gund Professor of Finance and | | |
| Banking, Emeritus at the Harvard Business School | Vanguard Senior ManagementTeam |
| (retired 2011); Chief Investment Officer and Managing | Mortimer J. Buckley | James M. Norris |
| Partner of HighVista Strategies LLC (private investment | Kathleen C. Gubanich | Thomas M. Rampulla |
| firm); Director of Rand Merchant Bank; Overseer of | Martha G. King | Glenn W. Reed |
| the Museum of Fine Arts Boston. | John T. Marcante | Karin A. Risi |
| Chris D. McIsaac | Michael Rollings |
| Peter F. Volanakis | | |
| Born 1955. Trustee Since July 2009. Principal | | |
| Occupation(s) During the Past Five Years and | Chairman Emeritus and Senior Advisor |
| Other Experience: President and Chief Operating | John J. Brennan | |
| Officer (retired 2010) of Corning Incorporated | Chairman, 1996–2009 | |
| (communications equipment); Chairman of the | Chief Executive Officer and President, 1996–2008 |
| Board of Trustees of Colby-Sawyer College; | | |
| Member of the Advisory Board of the Norris | | |
| Cotton Cancer Center. | Founder | |
| | John C. Bogle | |
| | Chairman and Chief Executive Officer, 1974–1996 |
1 Mr. McNabb is considered an “interested person,” as defined in the Investment Company Act of 1940, because he is an officer of the Vanguard funds.
2 December 2002 for Vanguard Equity Income Fund, the Vanguard Municipal Bond Funds, and the Vanguard State Tax-Exempt Funds.
|  |
| | P.O. Box 2600 |
| | Valley Forge, PA 19482-2600 |
| |
| |
| |
| Connect with Vanguard® > vanguard.com |
| |
| |
| |
| Fund Information > 800-662-7447 | “Dividend Achievers” is a trademark of The NASDAQ |
| Direct Investor Account Services > 800-662-2739 | OMX Group, Inc. (collectively, with its affiliates |
| | “NASDAQ OMX”), and has been licensed for use by The |
| Institutional Investor Services > 800-523-1036 | Vanguard Group, Inc. Vanguard mutual funds are not |
| Text Telephone for People | sponsored, endorsed, sold, or promoted by NASDAQ |
| Who Are Deaf or Hard of Hearing> 800-749-7273 | OMX and NASDAQ OMX makes no representation |
| | regarding the advisability of investing in the funds. |
| This material may be used in conjunction | NASDAQ OMX makes no warranties and bears no |
| with the offering of shares of any Vanguard | liability with respect to the Vanguard mutual funds. |
| fund only if preceded or accompanied by | |
| the fund’s current prospectus. | |
| |
| All comparative mutual fund data are from Lipper, a | |
| Thomson Reuters Company, or Morningstar, Inc., unless | |
| otherwise noted. | |
| |
| You can obtain a free copy of Vanguard’s proxy voting | |
| guidelines by visiting vanguard.com/proxyreporting or by | |
| calling Vanguard at 800-662-2739. The guidelines are | |
| also available from the SEC’s website, sec.gov. In | |
| addition, you may obtain a free report on how your fund | |
| voted the proxies for securities it owned during the 12 | |
| months ended June 30. To get the report, visit either | |
| vanguard.com/proxyreporting or sec.gov. | |
| |
| You can review and copy information about your fund at | |
| the SEC’s Public Reference Room in Washington, D.C. To | |
| find out more about this public service, call the SEC at | |
| 202-551-8090. Information about your fund is also | |
| available on the SEC’s website, and you can receive | |
| copies of this information, for a fee, by sending a | |
| request in either of two ways: via email addressed to | |
| publicinfo@sec.gov or via regular mail addressed to the | |
| Public Reference Section, Securities and Exchange | |
| Commission, Washington, DC 20549-1520. | |
| |
| | © 2016 The Vanguard Group, Inc. |
| | All rights reserved. |
| | Vanguard Marketing Corporation, Distributor. |
| |
| | Q6022 092016 |
Item 2: Code of Ethics.
Not Applicable.
Item 3: Audit Committee Financial Expert.
Not Applicable.
Item 4: Principal Accountant Fees and Services.
(a) Audit Fees.
Not Applicable.
Item 5: Audit Committee of Listed Registrants.
Not Applicable.
Item 6: Investments.
Not Applicable.
Item 7: Disclosure of Proxy Voting Policies and Procedures for Closed-End Management
Investment Companies.
Not Applicable.
Item 8: Portfolio Managers of Closed-End Management Investment Companies.
Not Applicable.
Item 9: Purchase of Equity Securities by Closed-End Management Investment Company and
Affiliated Purchasers.
Not Applicable.
Item 10: Submission of Matters to a Vote of Security Holders.
Not Applicable.
Item 11: Controls and Procedures.
(a) Disclosure Controls and Procedures. The Principal Executive and Financial Officers concluded that the Registrant’s Disclosure Controls and Procedures are effective based on their evaluation of the Disclosure Controls and Procedures as of a date within 90 days of the filing date of this report.
(b) Internal Control Over Financial Reporting. There were no significant changes in Registrant’s Internal Control Over Financial Reporting or in other factors that could significantly affect this control subsequent to the date of the evaluation, including any corrective actions with regard to significant deficiencies and material weaknesses.
Item 12: Exhibits.
(a) Certifications.
Pursuant to the requirements of the Securities Exchange Act of 1934 and the Investment Company Act of 1940, the registrant has duly caused this report to be signed on its behalf by the undersigned, thereunto duly authorized.
| |
| | VANGUARD SPECIALIZED FUNDS |
| |
| |
| BY: | /s/ F. WILLIAM MCNABB III* |
| | F. WILLIAM MCNABB III |
| | CHIEF EXECUTIVE OFFICER |
| |
| Date: September 16, 2016 |
Pursuant to the requirements of the Securities Exchange Act of 1934 and the Investment Company Act of 1940, this report has been signed below by the following persons on behalf of the registrant and in the capacities and on the dates indicated.
| |
| | VANGUARD SPECIALIZED FUNDS |
| |
| BY: | /s/ F. WILLIAM MCNABB III* |
| | F. WILLIAM MCNABB III |
| | CHIEF EXECUTIVE OFFICER |
Date: September 16, 2016 |
| VANGUARD SPECIALIZED FUNDS |
| |
| BY: | /s/ THOMAS J. HIGGINS* |
| THOMAS J. HIGGINS |
| | CHIEF FINANCIAL OFFICER |
| Date: September 16, 2016 |
* By: /s/ Heidi Stam
Heidi Stam, pursuant to a Power of Attorney filed on April 22, 2014 see file Number 2-17620, Incorporated by Reference.