UNITED STATES
SECURITIES AND EXCHANGE COMMISSION
Washington, D.C. 20549
FORM N-CSR
CERTIFIED SHAREHOLDER REPORT
OF
REGISTERED MANAGEMENT INVESTMENT COMPANIES
| | |
Investment Company Act file number: 811-03916 |
Name of Registrant: | Vanguard Specialized Funds |
Address of Registrant: | P.O. Box 2600 |
| | Valley Forge, PA 19482 |
Name and address of agent for service: | Anne E. Robinson, Esquire | |
| | P.O. Box 876 | |
| | Valley Forge, PA 19482 | |
Registrant’s telephone number, including area code: (610) 669-1000 |
Date of fiscal year end: January 31 | |
Date of reporting period: February 1, 2017 – July 31, 2017 |
Item 1: Reports to Shareholders | |

Semiannual Report | July 31, 2017
Vanguard Energy Fund
A new format, unwavering commitment
As you begin reading this report, you’ll notice that we’ve made some improvements to the opening sections—based on feedback from you, our clients.
Page 1 starts with a new ”Your Fund’s Performance at a Glance,” a concise, handy summary of how your fund performed during the period.
In the renamed ”Chairman’s Perspective,” Bill McNabb will focus on enduring principles and investment insights.
We’ve modified some tables, and eliminated some redundancy, but we haven’t removed any information.
At Vanguard, we’re always looking for better ways to communicate and to help you make sound investment decisions. Thank you for entrusting your assets to us.
| |
| Contents | |
| Your Fund’s Performance at a Glance. | 1 |
| Chairman’s Perspective. | 2 |
| Advisors’ Report. | 6 |
| Fund Profile. | 10 |
| Performance Summary. | 12 |
| Financial Statements. | 13 |
| About Your Fund’s Expenses. | 27 |
| Trustees Approve Advisory Arrangements. | 29 |
| Glossary. | 31 |
Please note: The opinions expressed in this report are just that—informed opinions. They should not be considered promises or advice. Also, please keep in mind that the information and opinions cover the period through the date on the front of this
report. Of course, the risks of investing in your fund are spelled out in the prospectus. See the Glossary for definitions of investment terms used in this report.
About the cover: No matter what language you speak, Vanguard has one consistent message and set of principles. Our primary focus is on you, our clients. We conduct our business with integrity as a faithful steward
of your assets. This message is shown translated into seven languages, reflecting our expanding global presence.
Your Fund’s Performance at a Glance
• For the six months ended July 31, 2017, Vanguard Energy Fund returned about –5%.
It trailed its benchmark, the MSCI ACWI Energy Index, and the average return of its global natural resources peer funds.
• The fund, managed by two advisors, seeks long-term capital appreciation through its multicapitalization exposure to global energy stocks.
• Energy stocks generally posted subpar results for the period as inventories remained high and as crude oil and natural gas prices trended downward. Increased production in non-OPEC countries also hurt oil prices. Natural gas prices were restrained by decreased electric power usage, competitive coal prices, and the growing use of renewables.
• The fund benefited modestly from its overweighting of utility stocks, exposure to the materials sector, and underweighting of oil and gas equipment services companies.
| | | |
| Total Returns: Six Months Ended July 31, 2017 | | | |
| | | | Total |
| | | | Returns |
| Vanguard Energy Fund | | | |
| Investor Shares | | | -5.30% |
| Admiral™ Shares | | | -5.27 |
| MSCI ACWI Energy Index | | | -2.87 |
| Global Natural Resources Funds Average | | | -3.95 |
| Global Natural Resources Funds Average: Derived from data provided by Lipper, a Thomson Reuters Company. | |
| Admiral Shares carry lower expenses and are available to investors who meet certain account-balance requirements. | |
| |
| �� |
| Expense Ratios | | | |
| Your Fund Compared With Its Peer Group | | | |
| | Investor | Admiral | Peer Group |
| | Shares | Shares | Average |
| Energy Fund | 0.41% | 0.33% | 1.43% |
The fund expense ratios shown are from the prospectus dated May 25, 2017, and represent estimated costs for the current fiscal year. For
the six months ended July 31, 2017, the fund’s annualized expense ratios were 0.39% for Investor Shares and 0.31% for Admiral Shares.
The peer-group expense ratio is derived from data provided by Lipper, a Thomson Reuters Company, and captures information through
year-end 2016.
Peer group: Global Natural Resources Funds.
1
Chairman’s Perspective

Bill McNabb
Chairman and Chief Executive Officer
Dear Shareholder,
It’s said that fierce debates often generate more heat than light. And that’s been true of the ongoing face-off between sharply divided advocates of index funds and of actively managed funds.
For too long, the decision regarding active and index investing has been framed as either-or: Just pick a side and go all-in. But this choice is actually much more nuanced than a binary yes or no.
You may feel that your allegiance can belong to only one sports team, but you don’t have to approach investment strategies that way. (I’ll root for the Philadelphia Eagles no matter whom they’re playing, but my personal investment portfolio includes both index and active funds.)
Yes, indexing can be a valuable starting point for investors, and many may index their entire portfolio. But depending on your circumstances, an allocation to active management may be appropriate.
Recently published Vanguard research is illuminating on this point. Beyond helping you determine whether you’re a good candidate for active strategies, the paper Making the Implicit Explicit: A Framework for the Active-Passive Decision can help establish active and passive allocation targets for a range of investors. (You can read the paper at vanguard.com/research.)
2
Notching a record of outperformance
We’re a pioneer and leader in index fund investing, so why am I suggesting that active management may be appropriate?
Often overshadowed by our indexing reputation is Vanguard’s commitment to—and success with—active management. We oversee about $1 trillion in actively managed assets. And the results have been impressive, as the overwhelming majority of our active funds outperformed the average returns of their peers over the last decade.1 In addition, nearly half of our active funds have outperformed their benchmark indexes over the same period, a level of success that’s not easy to achieve.2
Make no mistake: The challenges of outperforming the market through active management are steep. So Vanguard has developed an approach with distinct characteristics that can improve your chances of success.
Chief among those advantages are low costs. As I’ve written before, paying less for your funds is one way to improve your odds of achieving success in active
| | | |
| Market Barometer | | | |
| | | | Total Returns |
| | | Periods Ended July 31, 2017 |
| | | | Five Years |
| | Six Months | One Year | (Annualized) |
| Stocks | | | |
| Russell 1000 Index (Large-caps) | 9.24% | 15.95% | 14.85% |
| Russell 2000 Index (Small-caps) | 5.35 | 18.45 | 14.19 |
| Russell 3000 Index (Broad U.S. market) | 8.94 | 16.14 | 14.79 |
| FTSE All-World ex US Index (International) | 14.05 | 18.81 | 8.11 |
| |
| Bonds | | | |
| Bloomberg Barclays U.S. Aggregate Bond Index | | | |
| (Broad taxable market) | 2.51% | -0.51% | 2.02% |
| Bloomberg Barclays Municipal Bond Index | | | |
| (Broad tax-exempt market) | 3.72 | 0.26 | 3.10 |
| Citigroup Three-Month U.S. Treasury Bill Index | 0.34 | 0.51 | 0.15 |
| |
| CPI | | | |
| Consumer Price Index | 0.80% | 1.73% | 1.33% |
The performance data shown represent past performance, which is not a guarantee of future results.
1 For the ten years ended June 30, 2017, 50 of 53 fixed income, 19 of 19 balanced, and 38 of 40 stock fund share classes—or 107 of
112 share classes of active Vanguard funds—outperformed their peer-group averages. Source: Vanguard, based on data from Lipper, a Thomson Reuters Company.
2 For the ten years ended June 30, 2017, 21 of 53 fixed income, 5 of 19 balanced, and 23 of 40 stock fund share classes—or 49 of
112 share classes of active Vanguard funds—outperformed their benchmark indexes. Source: Vanguard, based on data from Lipper, a Thomson Reuters Company.
3
management. Investors need to watch not only explicit costs, such as those reflected in fund expense ratios, but also implicit ones, such as trading costs, which can be significant because of the higher portfolio turnover associated with many active funds.
Historically, costs have been a reliable predictor of fund performance. But low costs don’t guarantee positive results. Talent is also critical. For this reason, Vanguard dedicates a lot of time, attention, and resources to manager selection and the ongoing oversight of managers.
Reaching beyond our walls
To serve our investors, we’re committed to identifying and attracting the best active managers across a range of investment styles and approaches. We recognize that not all great active managers reside in Valley Forge, Pennsylvania, where Vanguard is headquartered. As a result, we look across the world for managers for many of our active funds.
We oversee about $600 billion in assets that are managed by external advisors and partner with more than 25 firms employing hundreds of investment professionals and supporting analysts. These firms are responsible for more than 70 investment mandates within our active portfolios.
Stay patient and control taxes
Costs and manager selection are critical, but they aren’t the only necessities. You’ll also need a healthy supply of what many investors don’t possess in abundance: patience. Having the fortitude to wait is essential because even those active managers with the best track records go through significant periods of underperformance.
Patience is also crucial because investors in active strategies must stay disciplined and stick with them over time to take full advantage of the compounding benefits of outperformance. This is easy to say but often difficult to execute.
A few years ago, Vanguard looked at those actively managed domestic equity funds across the industry that did best over the previous 15 years. We found that even though these funds outperformed their benchmark indexes over that long period, 97% lagged the benchmarks in at least five calendar years. And two-thirds of the outperforming funds experienced at least three consecutive years of underperformance.3
Tax efficiency is another important consideration. In general, investors shouldn’t hold active strategies in an account that lacks tax protection.
3 Source: Vanguard calculations for the 15 years ended December 31, 2012, using data from Morningstar, Inc.
4
The tax drag associated with most active funds because of their higher turnover can be neutralized by holding the investments in tax-advantaged accounts, such as IRAs and 401(k) plans.
If you keep your focus on these four considerations—costs, manager selection, patience, and taxes—you’ll enhance your chances of achieving success with actively managed funds.
As always, thank you for investing with Vanguard.
Sincerely,

F. William McNabb III
Chairman and Chief Executive Officer
August 14, 2017
|
| Vanguard fund shareholders encouraged to vote in proxy campaign |
| |
| This summer we are asking you to vote on the election of trustees for all U.S.-domiciled |
| Vanguard funds, and on several fund policy proposals that we believe are in the best |
| interests of all shareholders. |
| |
| Vanguard filed a proxy statement on August 14, 2017, with the U.S. Securities and Exchange |
| Commission (SEC). Proxy materials are being provided to Vanguard fund shareholders with |
| instructions on how to vote online, by phone, or by mail. |
| |
| A shareholder meeting is scheduled to be held in Scottsdale, Arizona, on November 15, |
| 2017, when voting will conclude. We encourage you to vote promptly. Please visit |
| vanguard.com for updates. |
5
Advisors’ Report
For the six months ended July 31, 2017, Vanguard Energy Fund returned about –5%. It trailed its benchmark, the MSCI ACWI Energy Index, and the average return of its global natural resources peer funds. Your fund is managed by two advisors, a strategy that enhances fund diversification by providing exposure to distinct yet complementary investment approaches. It’s not uncommon for different advisors to have different views about individual securities or the broader investment environment.
The advisors, the amount and percentage of fund assets each manages, and brief descriptions of their investment strategies are presented in the table below. The advisors also have provided a discussion of the investment environment that existed during the year and of how their portfolio positioning reflects this assessment. These reports were prepared on August 16, 2017.
| | | |
| Vanguard Energy Fund Investment Advisors | |
| |
| �� | Fund Assets Managed | |
| Investment Advisor | % | $ Million | Investment Strategy |
| Wellington Management | 94 | 8,698 | Emphasizes long-term total-return opportunities |
| Company LLP | | | from the various energy subsectors: international |
| | | | oils, foreign integrated oils and foreign producers, |
| | | | North American producers, oil services and |
| | | | equipment, transportation and distribution, and |
| | | | refining and marketing. |
| Vanguard Quantitative Equity | 4 | 388 | Employs a quantitative fundamental management |
| Group | | | approach using models that assess valuation, |
| | | | management decisions, market sentiment, and |
| | | | earnings and balance-sheet quality of companies |
| | | | as compared with their peers. |
| Cash Investments | 2 | 194 | These short-term reserves are invested by |
| | | | Vanguard in equity index products to simulate |
| | | | investments in stock. Each advisor may also |
| | | | maintain a modest cash position. |
6
Wellington Management Company llp
Portfolio Manager: Gregory LeBlanc, CFA, Senior Managing Director, Equity Portfolio Manager, and Global Industry Analyst
The investment environment
The energy sector struggled during the half year. The fund’s benchmark returned –2.87%, trailing global equities, which returned about 12%, as measured by the MSCI All Country World Index.
After a strong 2016 that culminated in a surprising agreement from OPEC to lower production levels, oil prices stagnated for three months while the market tried to determine the ultimate impact of the production cuts. Unfortunately for the sector, U.S. inventory numbers ticked higher in early March, pushing oil below $50 per barrel for the first time since November and weighing on energy stocks.
In May, after months of speculation, energy investors learned that OPEC was extending its production cuts for nine more months, with OPEC countries and other major oil producers continuing to target a collective output reduction of 1.8 million barrels per day through March 2018. The decision to extend production cuts in May seemed to have been largely factored into pricing, resulting in a tepid response and lower oil prices over the next month. There will now be a renewed focus on compliance with the cuts; on global demand, which remains strong; and on the response from U.S. shale companies as oil moves below $50.
Our investment strategy
Wellington Management’s portion of Vanguard Energy Fund emphasizes long-term total-return opportunities from the various energy subsectors: North American producers, non-North American producers, oil services and equipment, transportation and distribution, and refining and marketing.
Our successes and shortfalls
Security selection drove the fund’s underperformance for the period, most notably among upstream producers; an overweighting of that subindustry also weighed on results. A preference for exploration and production companies over some integrated oil companies detracted, as exploration and production businesses tend to be more sensitive to oil prices and U.S. inventory releases.
Key detractors included Patterson-UTI Energy, QEP Resources, and Newfield Exploration. These North American production companies are where we continue to see the most opportunity in the sector. We have kept these holdings, believing they are well-positioned to outperform over the long term.
7
The portfolio benefited from selection among transportation-related and integrated oil companies, including Innogy, a German utility company focused on renewables. We believe that this business is attractive and that its stock should benefit from favorable regulatory trends. India-based Reliance Industries was another top contributor. Its ability to restrain capital spending and improve its balance sheet has made it an outlier and led to strong year-to-date returns. The portfolio also benefited from its holdings in upstream producers Rice Energy, Galp Energia, and Cabot Oil & Gas.
The fund’s positioning
We are disappointed that performance in the sector has retreated after last year’s rally. Persistent supplies and U.S. inventories have pushed sentiment in energy to extremely negative levels, while low oil prices have pushed margins in the sector to levels not seen since 2009. As we look toward the rest of the fiscal year, we expect that inventories will continue to move lower, which should help to improve sentiment. We always forecast a range of possible outcomes, but we believe that our focus on companies with the best assets and strong management teams will lead to outperformance across these scenarios.
Vanguard Quantitative Equity Group
Portfolio Managers: James P. Stetler
Binbin Guo, Principal, Head of Alpha Equity Investments
The investment environment
Energy stocks generally posted subpar results for the six months as inventories remained high and as crude oil and natural gas prices trended downward. Increased production in non-OPEC countries also hurt oil prices and helped offset the impact of production cuts that OPEC extended in May.
Natural gas prices were restrained by decreased electric power usage, competitive coal prices, and the growing use of renewables.
Investment objective and strategy
Although it’s important to understand how our overall performance is affected by the macroeconomic factors we’ve described, our approach to investing focuses on specific fundamentals—not on technical analysis of stock price movements. We compare all stocks in our investment universe within the same industry groups in order to identify those with characteristics that we believe will outperform over the long run.
8
To do this, we use a strict quantitative process that systematically focuses on several key fundamental factors. We believe that attractive stocks exhibit four key themes: (1) high quality—healthy balance sheets and consistent cash-flow generation; (2) effective use of capital—sound investment policies that favor internal over external funding; (3) strong market sentiment—market confirmation of our view; and (4) reasonable valuation—avoidance of overpriced stocks. Using these results, we construct our portfolio with the goal of maximizing expected return and minimizing exposure to risks that our research indicates do not improve returns.
Our successes and shortfalls
For the six months, our quality, valuation, and sentiment models boosted performance, while our management decisions model detracted.
Our positions in subindustries further downstream in the production process (refiners, processors, marketing, and distribution) posted the strongest results; refiners, in particular, benefited from higher margins caused by falling oil and gas prices.
Despite relatively strong stock selection, companies in subindustries further upstream in the production cycle (oil and gas drilling, exploration and production, and equipment and services) fared less well, as they tend to lag when prices fall.
Our most successful overweight holdings included OMV AG, Motor Oil Hellas Corinth Refineries, GS Holdings, Polski Koncern Naftowy ORLEN, and Tupras Turkiye Petrol Rafinerileri. Our results were dragged down by underweight allocations to Reliance Industries and Andeavor as well as our overweight positions in Petrofac, Newfield Exploration, and Devon Energy.
9
Energy Fund
Fund Profile
As of July 31, 2017
| | |
| Share-Class Characteristics | |
| | Investor | Admiral |
| | Shares | Shares |
| Ticker Symbol | VGENX | VGELX |
| Expense Ratio1 | 0.41% | 0.33% |
| 30-Day SEC Yield | 2.15% | 2.23% |
| | | |
| Portfolio Characteristics | | |
| | | | DJ |
| | | | U.S. |
| | | MSCI | Total |
| | | ACWI | Market |
| | Fund | Energy FA Index |
| Number of Stocks | 143 | 140 | 3,786 |
| Median Market Cap | $37.2B | $55.5B | $61.2B |
| Price/Earnings Ratio | 27.2x | 22.6x | 21.5x |
| Price/Book Ratio | 1.6x | 1.4x | 2.8x |
| Return on Equity | 5.7% | 7.4% | 15.1% |
| Earnings Growth Rate | -21.6% | -21.2% | 10.1% |
| Dividend Yield | 2.6% | 3.8% | 1.8% |
| Foreign Holdings | 31.2% | 46.6% | 0.0% |
| Turnover Rate | | | |
| (Annualized) | 25% | — | — |
| Short-Term Reserves | 2.8% | — | — |
| | |
| Volatility Measures | | |
| | | DJ |
| | MSCI | U.S. Total |
| | ACWI | Market |
| | Energy | FA Index |
| R-Squared | 0.96 | 0.29 |
| Beta | 1.04 | 0.99 |
These measures show the degree and timing of the fund’s fluctuations compared with the indexes over 36 months.
| | |
| Ten Largest Holdings (% of total net assets) |
| Exxon Mobil Corp. | Integrated Oil & Gas | 9.2% |
| Chevron Corp. | Integrated Oil & Gas | 6.2 |
| Pioneer Natural | Oil & Gas Exploration | |
| Resources Co. | & Production | 4.9 |
| Royal Dutch Shell plc | Integrated Oil & Gas | 4.3 |
| TOTAL SA | Integrated Oil & Gas | 3.8 |
| EOG Resources Inc. | Oil & Gas Exploration | |
| | & Production | 3.2 |
| Schlumberger Ltd. | Oil & Gas Equipment | |
| | & Services | 3.1 |
| BP plc | Integrated Oil & Gas | 3.0 |
| Valero Energy Corp. | Oil & Gas Refining & | |
| | Marketing | 2.4 |
| Diamondback Energy | Oil & Gas Exploration | |
| Inc. | & Production | 2.1 |
| Top Ten | | 42.2% |
The holdings listed exclude any temporary cash investments and equity index products.
1 The expense ratios shown are from the prospectus dated May 25, 2017, and represent estimated costs for the current fiscal year. For the six months ended July 31, 2017, the annualized expense ratios were 0.39% for Investor Shares and 0.31% for Admiral Shares.
10
Energy Fund
Subindustry Diversification (% of equity exposure)
| | |
| | | MSCI |
| | | ACWI |
| | Fund | Energy |
| Coal & Consumable Fuels | 0.0% | 1.0% |
| Industrials | 0.3 | 0.0 |
| Information Technology | 0.4 | 0.0 |
| Integrated Oil & Gas | 39.0 | 52.2 |
| Oil & Gas Drilling | 1.2 | 0.3 |
| Oil & Gas Equipment & | | |
| Services | 7.7 | 7.4 |
| Oil & Gas Exploration & | | |
| Production | 31.7 | 18.7 |
| Oil & Gas Refining & | | |
| Marketing | 8.6 | 9.5 |
| Oil & Gas Storage & | | |
| Transportation | 4.4 | 10.9 |
| Utilities | 5.2 | 0.0 |
| Other | 1.5 | 0.0 |
Sector categories are based on the Global Industry Classification Stand ard (“GICS”), except for the “Other” category (if applicable), which includes securities that have not been provided a GICS classification as of the effective reporting period.
Market Diversification (% of equity exposure)
| |
| Europe | |
| United Kingdom | 7.5% |
| France | 3.9 |
| Italy | 2.3 |
| Portugal | 1.8 |
| Germany | 1.0 |
| Other | 0.6 |
| Subtotal | 17.1% |
| Pacific | |
| Japan | 0.7% |
| Other | 0.6 |
| Subtotal | 1.3% |
| Emerging Markets | |
| Russia | 3.0% |
| India | 2.8 |
| Other | 1.6 |
| Subtotal | 7.4% |
| North America | |
| United States | 67.9% |
| Canada | 6.3 |
| Subtotal | 74.2% |
11
Energy Fund
Performance Summary
All of the returns in this report represent past performance, which is not a guarantee of future results that may be achieved by the fund. (Current performance may be lower or higher than the performance data cited. For performance data current to the most recent month-end, visit our website at vanguard.com/performance.) Note, too, that both investment returns and principal value can fluctuate widely, so an investor’s shares, when sold, could be worth more or less than their original cost. The returns shown do not reflect taxes that a shareholder would pay on fund distributions or on the sale of fund shares.
Fiscal-Year Total Returns (%): January 31, 2007, Through July 31, 2017
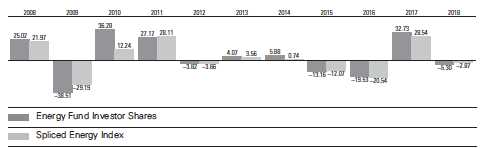
For a benchmark description, see the Glossary.
Note: For 2018, performance data reflect the six months ended July 31, 2017.
Average Annual Total Returns: Periods Ended June 30, 2017
This table presents returns through the latest calendar quarter—rather than through the end of the fiscal period.
Securities and Exchange Commission rules require that we provide this information.
| | | | |
| | Inception | One | Five | Ten |
| | Date | Year | Years | Years |
| Investor Shares | 5/23/1984 | -1.07% | 0.49% | -0.09% |
| Admiral Shares | 11/12/2001 | -1.00 | 0.55 | -0.03 |
See Financial Highlights for dividend and capital gains information.
12
Energy Fund
Financial Statements (unaudited)
Statement of Net Assets
As of July 31, 2017
The fund reports a complete list of its holdings in regulatory filings four times in each fiscal year, at the quarter-ends. For the second and fourth fiscal quarters, the lists appear in the fund’s semiannual and annual reports to shareholders. For the first and third fiscal quarters, the fund files the lists with the Securities and Exchange Commission on Form N-Q. Shareholders can look up the fund’s Forms N-Q on the SEC’s website at sec.gov. Forms N-Q may also be reviewed and copied at the SEC’s Public Reference Room (see the back cover of this report for further information).
| | | |
| | | | Market |
| | | | Value• |
| | | Shares | ($000) |
| Common Stocks (95.1%)1 | | |
| United States (63.9%) | | |
| Electric Utilities (1.3%) | | |
| | OGE Energy Corp. | 3,012,659 | 108,034 |
| | Avangrid Inc. | 293,304 | 13,322 |
| | | | 121,356 |
| Energy Equipment & Services (7.8%) | |
| | Schlumberger Ltd. | 4,155,736 | 285,083 |
| | Halliburton Co. | 3,995,117 | 169,553 |
| * | Baker Hughes a GE Co. | 3,521,806 | 129,919 |
| | Patterson-UTI Energy | | |
| | Inc. | 5,537,571 | 107,097 |
| *,^ | Weatherford | | |
| | International plc | 6,567,920 | 29,293 |
| | | | 720,945 |
| Multi-Utilities (1.3%) | | |
| | Sempra Energy | 1,058,663 | 119,639 |
| |
| Oil, Gas & Consumable Fuels (52.9%) | |
| | Integrated Oil & Gas (17.2%) | |
| | Exxon Mobil Corp. | 10,639,954 | 851,622 |
| | Chevron Corp. | 5,259,486 | 574,283 |
| | Occidental Petroleum | | |
| | Corp. | 2,762,926 | 171,108 |
| |
| Oil & Gas Exploration & Production (26.7%) |
| | Pioneer Natural | | |
| | Resources Co. | 2,780,483 | 453,497 |
| | EOG Resources Inc. | 3,134,478 | 298,214 |
| * | Diamondback Energy | | |
| | Inc. | 2,061,914 | 197,696 |
| | EQT Corp. | 2,433,316 | 155,002 |
| | Cabot Oil & Gas Corp. | 5,460,566 | 135,804 |
| * | Newfield Exploration Co. | 4,535,989 | 130,319 |
| | Cimarex Energy Co. | 1,259,068 | 124,686 |
| * | Concho Resources Inc. | 949,408 | 123,670 |
| | ConocoPhillips | 2,476,910 | 112,378 |
| | | |
| | | | Market |
| | | | Value• |
| | | Shares | ($000) |
| | Anadarko Petroleum | | |
| | Corp. | 2,391,125 | 109,203 |
| * | Antero Resources Corp. | 5,005,310 | 103,210 |
| * | Energen Corp. | 1,508,281 | 80,361 |
| * | Callon Petroleum Co. | 6,776,788 | 76,713 |
| | Devon Energy Corp. | 1,996,944 | 66,518 |
| | Hess Corp. | 1,315,431 | 58,589 |
| * | Rice Energy Inc. | 1,906,331 | 53,320 |
| | Noble Energy Inc. | 1,798,646 | 51,999 |
| * | Parsley Energy Inc. | | |
| | Class A | 1,336,065 | 39,120 |
| * | Centennial Resource | | |
| | Development Inc. | | |
| | Class A | 2,014,206 | 33,799 |
| * | QEP Resources Inc. | 3,891,524 | 33,350 |
| | Marathon Oil Corp. | 1,607,034 | 19,654 |
| * | Extraction Oil & Gas Inc. | 1,125,063 | 13,703 |
| * | Continental Resources | | |
| | Inc. | 361,525 | 12,086 |
| | Apache Corp. | 16,349 | 809 |
| |
| Oil & Gas Refining & Marketing (6.3%) |
| | Valero Energy Corp. | 3,277,508 | 226,050 |
| | Marathon Petroleum | | |
| | Corp. | 3,362,786 | 188,282 |
| | Phillips 66 | 2,022,409 | 169,377 |
| | Tesoro Corp. | 2,020 | 201 |
| |
| Oil & Gas Storage & Transportation (2.7%) |
| | Kinder Morgan Inc. | 8,285,138 | 169,265 |
| | Targa Resources Corp. | 1,526,076 | 70,825 |
| * | Cheniere Energy Inc. | 165,900 | 7,499 |
| | Williams Cos. Inc. | 53,583 | 1,703 |
| | | | 4,913,915 |
| Other (0.6%) | | |
| ^,2 | Vanguard Energy ETF | 578,000 | 52,471 |
| Total United States | | 5,928,326 |
13
| | | |
| Energy Fund | | |
| |
| |
| |
| | | | Market |
| | | | Value• |
| | | Shares | ($000) |
| International (31.2%) | | |
| Argentina (0.2%) | | |
| | YPF SA ADR | 999,294 | 20,186 |
| |
| Australia (0.4%) | | |
| | Oil Search Ltd. | 6,705,843 | 35,679 |
| * | Santos Ltd. | 1,090,812 | 2,964 |
| | Caltex Australia Ltd. | 33,000 | 822 |
| * | WorleyParsons Ltd. | 70,000 | 661 |
| | Woodside Petroleum | | |
| | Ltd. | 21,903 | 512 |
| | | | 40,638 |
| Austria (0.0%) | | |
| | OMV AG | 58,532 | 3,316 |
| |
| Brazil (0.6%) | | |
| * | Petroleo Brasileiro SA | | |
| | ADR | 5,732,679 | 50,505 |
| * | Petroleo Brasileiro SA | 789,532 | 3,494 |
| * | Petroleo Brasileiro SA | | |
| | Preference Shares | 740,600 | 3,156 |
| | | | 57,155 |
| Canada (6.2%) | | |
| | Suncor Energy Inc. | | |
| | (New York Shares) | 4,250,776 | 138,660 |
| | TransCanada Corp. | | |
| | (New York Shares) | 2,495,579 | 127,574 |
| * | Seven Generations | | |
| | Energy Ltd. Class A | 4,556,078 | 79,190 |
| | Encana Corp. | | |
| | (New York Shares) | 6,241,762 | 62,792 |
| | Canadian Natural | | |
| | Resources Ltd. | | |
| | (New York Shares) | 1,425,951 | 43,634 |
| ^ | ARC Resources Ltd. | 2,192,154 | 30,225 |
| | Cenovus Energy Inc. | 2,726,270 | 22,928 |
| | Crescent Point Energy | | |
| | Corp. | 2,086,035 | 16,397 |
| ^ | PrairieSky Royalty Ltd. | | |
| | (Toronto Shares) | 605,648 | 15,040 |
| | Suncor Energy Inc. | 312,137 | 10,182 |
| | Enbridge Inc. | 194,981 | 8,082 |
| | TransCanada Corp. | 88,972 | 4,546 |
| | Encana Corp. | 325,821 | 3,280 |
| | Canadian Natural | | |
| | Resources Ltd. | 95,909 | 2,933 |
| * | Husky Energy Inc. | 214,141 | 2,479 |
| | PrairieSky Royalty Ltd. | 93,253 | 2,313 |
| | | | 570,255 |
| China (0.4%) | | |
| ^ | PetroChina Co. Ltd. ADR | 437,426 | 28,262 |
| | China Petroleum & | | |
| | Chemical Corp. | 6,223,600 | 4,718 |
| | |
| | | Market |
| | | Value• |
| | Shares | ($000) |
| Kunlun Energy Co. Ltd. | 2,664,000 | 2,656 |
| China Longyuan Power | | |
| Group Corp. Ltd. | 3,158,000 | 2,310 |
| Huaneng Renewables | | |
| Corp. Ltd. | 7,024,000 | 2,138 |
| CNOOC Ltd. | 709,717 | 794 |
| PetroChina Co. Ltd. | 306,000 | 197 |
| | | 41,075 |
| Colombia (0.0%) | | |
| Ecopetrol SA ADR | 248,726 | 2,323 |
| |
| Denmark (0.1%) | | |
| Vestas Wind Systems | 53,899 | 5,268 |
| |
| Finland (0.0%) | | |
| Neste Oyj | 62,687 | 2,718 |
| |
| France (3.8%) | | |
| TOTAL SA ADR | 6,602,242 | 334,536 |
| TOTAL SA | 363,747 | 18,498 |
| | | 353,034 |
| Germany (1.0%) | | |
| 3 Innogy SE | 2,246,031 | 94,334 |
| |
| Greece (0.0%) | | |
| Motor Oil Hellas Corinth | | |
| Refineries SA | 98,689 | 2,222 |
| Hellenic Petroleum SA | 204,579 | 1,892 |
| | | 4,114 |
| Hungary (0.0%) | | |
| MOL Hungarian Oil & | | |
| Gas plc | 33,591 | 2,911 |
| |
| India (2.7%) | | |
| Reliance Industries Ltd. | 5,378,007 | 135,380 |
| Power Grid Corp. of | | |
| India Ltd. | 27,753,468 | 96,578 |
| Bharat Petroleum | | |
| Corp. Ltd. | 427,762 | 3,141 |
| Oil & Natural Gas | | |
| Corp. Ltd. | 1,185,939 | 3,132 |
| Hindustan Petroleum | | |
| Corp. Ltd. | 454,060 | 2,711 |
| Indian Oil Corp. Ltd. | 471,998 | 2,705 |
| GAIL India Ltd. | 393,299 | 2,310 |
| * Mangalore Refinery & | | |
| Petrochemicals Ltd. | 1,053,892 | 2,041 |
| Vedanta Ltd. | 63,882 | 279 |
| | | 248,277 |
| Israel (0.0%) | | |
| Oil Refineries Ltd. | 4,601,185 | 2,139 |
14
Energy Fund
| | | |
| | | | Market |
| | | | Value• |
| | | Shares | ($000) |
| Italy (2.3%) | | | |
| ^ Eni SPA ADR | | 4,491,584 | 141,844 |
| Tenaris SA ADR | | 1,946,082 | 61,379 |
| Eni SPA | | 240,745 | 3,812 |
| Saipem SPA | | 593,724 | 2,436 |
| | | | 209,471 |
| Japan (0.7%) | | | |
| Inpex Corp. | | 5,486,568 | 53,393 |
| JXTG Holdings Inc. | | 892,200 | 3,966 |
| Idemitsu Kosan Co. Ltd. | 97,400 | 2,364 |
| Cosmo Energy | | | |
| Holdings Co. Ltd. | | 133,100 | 2,306 |
| Showa Shell Sekiyu KK | 27,300 | 297 |
| | | | 62,326 |
| Norway (0.1%) | | | |
| Statoil ASA | | 254,494 | 4,783 |
| Subsea 7 SA | | 133,137 | 1,973 |
| | | | 6,756 |
| Poland (0.1%) | | | |
| Polski Koncern Naftowy | | |
| ORLEN SA | | 113,051 | 3,347 |
| * Grupa Lotos SA | | 147,650 | 1,995 |
| Polskie Gornictwo | | | |
| Naftowe i | | | |
| Gazownictwo SA | | 120,000 | 223 |
| | | | 5,565 |
| Portugal (1.7%) | | | |
| Galp Energia SGPS SA | 9,888,044 | 158,413 |
| |
| Russia (2.9%) | | | |
| Rosneft Oil Co. PJSC | | |
| GDR | 26,071,804 | 133,907 |
| Lukoil PJSC ADR | | 2,592,948 | 120,819 |
| AK Transneft OAO | | | |
| Preference Shares | 914 | 2,761 |
| Tatneft PJSC ADR | | 61,525 | 2,372 |
| Surgutneftegas OJSC | 3,428,300 | 1,526 |
| Surgutneftegas OAO | | |
| Preference Shares | 2,786,833 | 1,342 |
| Tatneft PJSC | | 155,950 | 1,018 |
| LUKOIL PJSC | | 21,557 | 1,012 |
| Rosneft Oil Co. PJSC | 188,000 | 980 |
| Gazprom PJSC | | 489,734 | 952 |
| Gazprom PJSC ADR | 73,105 | 285 |
| | | | 266,974 |
| South Korea (0.1%) | | | |
| SK Innovation Co. Ltd. | 22,895 | 3,613 |
| GS Holdings Corp. | | 40,506 | 2,730 |
| Doosan Heavy Industries | | |
| & Construction Co. Ltd. | 107,564 | 1,981 |
| S-Oil Corp. | | 9,924 | 1,034 |
| | | | 9,358 |
| | | |
| | | | Market |
| | | | Value• |
| | | Shares | ($000) |
| Spain (0.4%) | | |
| | Iberdrola SA | 3,519,240 | 27,742 |
| * | Repsol SA | 290,111 | 4,859 |
| | | | 32,601 |
| Sweden (0.0%) | | |
| * | Lundin Petroleum AB | 125,531 | 2,859 |
| |
| Taiwan (0.0%) | | |
| | Formosa Petrochemical | | |
| | Corp. | 776,000 | 2,724 |
| |
| Thailand (0.1%) | | |
| | PTT PCL (Foreign) | 220,000 | 2,566 |
| * | PTT Exploration and | | |
| | Production PCL (Local) | 961,000 | 2,543 |
| | Thai Oil PCL (Foreign) | 947,700 | 2,443 |
| * | PTT PCL | 166,300 | 1,940 |
| | | | 9,492 |
| Turkey (0.1%) | | |
| | Tupras Turkiye Petrol | | |
| | Rafinerileri AS | 89,303 | 2,752 |
| | KOC Holding AS | 512,846 | 2,388 |
| | | | 5,140 |
| United Kingdom (7.3%) | | |
| | Royal Dutch Shell plc | | |
| | ADR | 6,467,030 | 365,581 |
| | BP plc ADR | 7,406,387 | 260,260 |
| | Royal Dutch Shell plc | | |
| | Class B | 554,288 | 15,790 |
| | BP plc | 2,527,690 | 14,847 |
| | Royal Dutch Shell plc | | |
| | Class A | 348,089 | 9,831 |
| | Royal Dutch Shell plc | | |
| | Class A (Amsterdam | | |
| | Shares) | 261,182 | 7,389 |
| | Petrofac Ltd. | 378,693 | 2,238 |
| | | | 675,936 |
| Total International | | 2,895,358 |
| Total Common Stocks | | |
| (Cost $6,233,409) | | 8,823,684 |
| Preferred Stocks (0.0%) | | |
| * | Vedanta Ltd. Pfd. | | |
| | (Cost $40) | 255,528 | 40 |
| Temporary Cash Investments (5.1%)1 | |
| Money Market Fund (1.1%) | | |
| 4,5 | Vanguard Market | | |
| | Liquidity Fund, | | |
| | 1.217% | 1,046,831 | 104,704 |
15
Energy Fund
| | | |
| | | Face | Market |
| | | Amount | Value • |
| | | ($000) | ($000) |
| Repurchase Agreements (3.1%) | |
| | RBS Securities, Inc. | | |
| | 1.020%, 8/1/17 (Dated | | |
| | 7/31/17, Repurchase | | |
| | Value $181,005,000, | | |
| | collateralized by U. S. | | |
| | Treasury Note/Bond | | |
| | 0.625%–2.250%, | | |
| | 11/30/17–4/30/18, | | |
| | with a value of | | |
| | $184,620,000) | 181,000 | 181,000 |
| | Societe Generale | | |
| | 1.050%, 8/1/17 (Dated | | |
| | 7/31/17, Repurchase | | |
| | Value $104,103,000, | | |
| | collateralized by Federal | | |
| | Home Loan Bank 1.375%, | | |
| | 3/18/19, Federal Home | | |
| | Loan Mortgage Corp. | | |
| | 5.326%– 6.750%, | | |
| | 9/1/20–7/15/32, Federal | | |
| | National Mortgage Assn. | | |
| | 1.833%–4.780%, | | |
| | 10/1/17–7/1/44, | | |
| | Government National | | |
| | Mortgage Assn. | | |
| | 3.000%–3.500%, | | |
| | 3/20/42–7/20/46, | | |
| | and U.S. Treasury Note/ | | |
| | Bond 1.250%–3.375%, | | |
| | 4/30/19–5/15/44, with a | | |
| | value of $106,182,000) | 104,100 | 104,100 |
| | | | 285,100 |
| U. S. Government and Agency Obligations (0.9%) |
| 6 | Federal Home Loan Bank | | |
| | Discount Notes, 1.027%, | | |
| | 9/25/17 | 75,000 | 74,887 |
| | United States Treasury Bill, | | |
| | 0.862%, 8/3/17 | 4,000 | 4,000 |
| 7 | United States Treasury Bill, | | |
| | 0.927%, 8/24/17 | 100 | 100 |
| 7 | United States Treasury Bill, | | |
| | 0.923%, 9/21/17 | 5,000 | 4,993 |
| 7 | United States Treasury Bill, | | |
| | 0.980%, 10/5/17 | 50 | 50 |
| | | | 84,030 |
| Total Temporary Cash Investments | |
| (Cost $473,821) | | 473,834 |
| Total Investments (100.2%) | | |
| (Cost $6,707,270) | | 9,297,558 |
| |
| | Amount |
| | ($000) |
| Other Assets and Liabilities (-0.2%) | |
| Other Assets | |
| Investment in Vanguard | 591 |
| Receivables for Investment Securities | |
| Sold | 144,117 |
| Receivables for Accrued Income | 12,255 |
| Receivables for Capital Shares Issued | 129,404 |
| Other Assets | 6,126 |
| Total Other Assets | 292,493 |
| Liabilities | |
| Payables for Investment Securities | |
| Purchased | (57,983) |
| Payables to Investment Advisor | (3,406) |
| Collateral for Securities on Loan | (70,585) |
| Payables for Capital Shares Redeemed | (154,986) |
| Payables to Vanguard | (19,631) |
| Other Liabilities | (3,017) |
| Total Liabilities | (309,608) |
| Net Assets (100%) | 9,280,443 |
| |
| |
| At July 31, 2017, net assets consisted of: |
| | Amount |
| | ($000) |
| Paid-in Capital | 7,424,775 |
| Undistributed Net Investment Income | 144,709 |
| Accumulated Net Realized Losses | (879,677) |
| Unrealized Appreciation (Depreciation) | |
| Investment Securities | 2,590,288 |
| Futures Contracts | 323 |
| Foreign Currencies | 25 |
| Net Assets | 9,280,443 |
16
| |
| Energy Fund | |
| |
| |
| |
| |
| | Amount |
| | ($000) |
| Investor Shares—Net Assets | |
| Applicable to 59,554,609 outstanding | |
| $.001 par value shares of beneficial | |
| interest (unlimited authorization) | 2,971,155 |
| Net Asset Value Per Share— | |
| Investor Shares | $49.89 |
| |
| |
| Admiral Shares—Net Assets | |
| Applicable to 67,390,384 outstanding | |
| $.001 par value shares of beneficial | |
| interest (unlimited authorization) | 6,309,288 |
| Net Asset Value Per Share— | |
| Admiral Shares | $93.62 |
• See Note A in Notes to Financial Statements.
* Non-income-producing security.
^ Includes partial security positions on loan to broker-dealers. The total value of securities on loan is $66,118,000.
1 The fund invests a portion of its cash reserves in equity markets through the use of index futures contracts. After giving effect to futures
investments, the fund’s effective common stock and temporary cash investment positions represent 96.6% and 3.6%, respectively, of net assets.
2 Considered an affiliated company of the fund as the issuer is another member of The Vanguard Group.
3 Security exempt from registration under Rule 144A of the Securities Act of 1933. Such securities may be sold in transactions exempt
from registration, normally to qualified institutional buyers. At July 31, 2017, the value of this security represented 1.0% of net assets.
4 Affiliated money market fund available only to Vanguard funds and certain trusts and accounts managed by Vanguard. Rate shown is the 7-day yield.
5 Includes $70,585,000 of collateral received for securities on loan.
6 The issuer operates under a congressional charter; its securities are generally neither guaranteed by the U.S. Treasury nor backed by the full faith and credit of the U.S. government.
7 Securities with a value of $1,897,000 have been segregated as initial margin for open futures contracts.
ADR—American Depositary Receipt.
GDR—Global Depositary Receipt.
See accompanying Notes, which are an integral part of the Financial Statements.
17
Energy Fund
Statement of Operations
| |
| | Six Months Ended |
| | July 31,2017 |
| | ($000) |
| Investment Income | |
| Income | |
| Dividends1,2 | 187,310 |
| Interest 2 | 1,696 |
| Securities Lending—Net | 2,302 |
| Total Income | 191,308 |
| Expenses | |
| Investment Advisory Fees—Note B | |
| Basic Fee | 7,103 |
| Performance Adjustment | 242 |
| The Vanguard Group—Note C | |
| Management and Administrative—Investor Shares | 2,614 |
| Management and Administrative—Admiral Shares | 3,431 |
| Marketing and Distribution—Investor Shares | 241 |
| Marketing and Distribution—Admiral Shares | 243 |
| Custodian Fees | 1,904 |
| Shareholders’ Reports—Investor Shares | 229 |
| Shareholders’ Reports—Admiral Shares | 83 |
| Trustees’ Fees and Expenses | 9 |
| Total Expenses | 16,099 |
| Net Investment Income | 175,209 |
| Realized Net Gain (Loss) | |
| Investment Securities Sold 2 | 26,829 |
| Futures Contracts | 12,171 |
| Foreign Currencies | (28) |
| Realized Net Gain (Loss) | 38,972 |
| Change in Unrealized Appreciation (Depreciation) | |
| Investment Securities | (766,704) |
| Futures Contracts | (220) |
| Foreign Currencies | 55 |
| Change in Unrealized Appreciation (Depreciation) | (766,869) |
| Net Increase (Decrease) in Net Assets Resulting from Operations | (552,688) |
1 Dividends are net of foreign withholding taxes of $7,122,000.
2 Dividend income, interest income, and realized net gain (loss) from affiliated companies of the fund were $678,000, $430,000, and $23,000, respectively.
See accompanying Notes, which are an integral part of the Financial Statements.
18
| | |
| Energy Fund | | |
| |
| |
| Statement of Changes in Net Assets | | |
| |
| | Six Months Ended | Year Ended |
| | July 31, | January 31, |
| | 2017 | 2017 |
| | ($000) | ($000) |
| Increase (Decrease) in Net Assets | | |
| Operations | | |
| Net Investment Income | 175,209 | 200,059 |
| Realized Net Gain (Loss) | 38,972 | (357,201) |
| Change in Unrealized Appreciation (Depreciation) | (766,869) | 2,823,815 |
| Net Increase (Decrease) in Net Assets Resulting from Operations | (552,688) | 2,666,673 |
| Distributions | | |
| Net Investment Income | | |
| Investor Shares | (1,012) | (63,588) |
| Admiral Shares | (3,843) | (137,420) |
| Realized Capital Gain | | |
| Investor Shares | — | — |
| Admiral Shares | — | — |
| Total Distributions | (4,855) | (201,008) |
| Capital Share Transactions | | |
| Investor Shares | (299,815) | (63,208) |
| Admiral Shares | (545,554) | 159,725 |
| Net Increase (Decrease) from Capital Share Transactions | (845,369) | 96,517 |
| Total Increase (Decrease) | (1,402,912) | 2,562,182 |
| Net Assets | | |
| Beginning of Period | 10,683,355 | 8,121,173 |
| End of Period1 | 9,280,443 | 10,683,355 |
1 Net Assets—End of Period includes undistributed (overdistributed) net investment income of $144,709,000 and ($25,571,000).
See accompanying Notes, which are an integral part of the Financial Statements.
19
| | | | | | |
| Energy Fund | | | | | | |
| |
| |
| Financial Highlights | | | | | | |
| |
| |
| Investor Shares | | | | | | |
| Six Months | | | | | |
| | Ended | | | | | |
| For a Share Outstanding | July 31, | Year Ended January 31, |
| Throughout Each Period | 2017 | 2017 | 2016 | 2015 | 2014 | 2013 |
| Net Asset Value, Beginning of Period | $52.70 | $40.43 | $51.53 | $63.85 | $62.66 | $62.60 |
| Investment Operations | | | | | | |
| Net Investment Income | . 9151 | .982 | 1.096 | 1.276 | 1.291 | 1.336 |
| Net Realized and Unrealized Gain (Loss) | | | | | | |
| on Investments | (3.709) | 12.275 | (11.118) | (9.436) | 2.413 | 1.098 |
| Total from Investment Operations | (2.794) | 13.257 | (10.022) | (8.160) | 3.704 | 2.434 |
| Distributions | | | | | | |
| Dividends from Net Investment Income | (.016) | (.987) | (1.078) | (1.206) | (1.277) | (1.340) |
| Distributions from Realized Capital Gains | — | — | — | (2.954) | (1.237) | (1.034) |
| Total Distributions | (.016) | (.987) | (1.078) | (4.160) | (2.514) | (2.374) |
| Net Asset Value, End of Period | $49.89 | $52.70 | $40.43 | $51.53 | $63.85 | $62.66 |
| |
| Total Return2 | -5.30% | 32.73% | -19.53% | -13.16% | 5.88% | 4.07% |
| |
| Ratios/Supplemental Data | | | | | | |
| Net Assets, End of Period (Millions) | $2,971 | $3,452 | $2,693 | $3,334 | $4,138 | $5,340 |
| Ratio of Total Expenses to | | | | | | |
| Average Net Assets3 | 0.39% | 0.41% | 0.37% | 0.37% | 0.38% | 0.31% |
| Ratio of Net Investment Income to | | | | | | |
| Average Net Assets | 2.89%1 | 1.97% | 2.20% | 1.84% | 1.97% | 2.15% |
| Portfolio Turnover Rate | 25% | 29% | 23% | 31% | 17% | 18% |
The expense ratio, net investment income ratio, and turnover rate for the current period have been annualized.
1 Net investment income per share and the ratio of net investment income to average net assets include $.344 and 0.66%, respectively, resulting from income received as a result of General Electric Co. and Baker Hughes Inc. merger in July 2017.
2 Total returns do not include transaction or account service fees that may have applied in the periods shown. Fund prospectuses provide information about any applicable transaction and account service fees.
3 Includes performance-based investment advisory fee increases (decreases) of 0.00%, 0.03%, 0.03%, 0.03%, 0.04%, and (0.02%).
See accompanying Notes, which are an integral part of the Financial Statements.
20
| | | | | | |
| Energy Fund | | | | | | |
| |
| |
| Financial Highlights | | | | | | |
| |
| |
| Admiral Shares | | | | | | |
| Six Months | | | | | |
| | Ended | | | | | |
| For a Share Outstanding | July 31, | Year Ended January 31, |
| Throughout Each Period | 2017 | 2017 | 2016 | 2015 | 2014 | 2013 |
| Net Asset Value, Beginning of Period | $98.88 | $75.85 | $96.69 | $119.83 | $117.63 | $117.52 |
| Investment Operations | | | | | | |
| Net Investment Income | 1.7571 | 1.918 | 2.113 | 2.479 | 2.530 | 2.586 |
| Net Realized and Unrealized Gain (Loss) | | | | | | |
| on Investments | (6.963) | 23.035 | (20.872) | (17.726) | 4.491 | 2.060 |
| Total from Investment Operations | (5.206) | 24.953 | (18.759) | (15.247) | 7.021 | 4.646 |
| Distributions | | | | | | |
| Dividends from Net Investment Income | (.054) | (1.923) | (2.081) | (2.351) | (2.500) | (2.595) |
| Distributions from Realized Capital Gains | — | — | — | (5.542) | (2.321) | (1.941) |
| Total Distributions | (.054) | (1.923) | (2.081) | (7.893) | (4.821) | (4.536) |
| Net Asset Value, End of Period | $93.62 | $98.88 | $75.85 | $96.69 | $119.83 | $117.63 |
| |
| Total Return2 | -5.27% | 32.83% | -19.48% | -13.11% | 5.94% | 4.14% |
| |
| Ratios/Supplemental Data | | | | | | |
| Net Assets, End of Period (Millions) | $6,309 | $7,231 | $5,428 | $6,569 | $7,540 | $6,778 |
| Ratio of Total Expenses to | | | | | | |
| Average Net Assets3 | 0.31% | 0.33% | 0.31% | 0.31% | 0.32% | 0.26% |
| Ratio of Net Investment Income to | | | | | | |
| Average Net Assets | 2.97%1 | 2.05% | 2.26% | 1.90% | 2.03% | 2.20% |
| Portfolio Turnover Rate | 25% | 29% | 23% | 31% | 17% | 18% |
The expense ratio, net investment income ratio, and turnover rate for the current period have been annualized.
1 Net investment income per share and the ratio of net investment income to average net assets include $.646 and 0.66%, respectively, resulting from income received as a result of General Electric Co. and Baker Hughes Inc. merger in July 2017.
2 Total returns do not include transaction or account service fees that may have applied in the periods shown. Fund prospectuses provide information about any applicable transaction and account service fees.
3 Includes performance-based investment advisory fee increases (decreases) of 0.00%, 0.03%, 0.03%, 0.03%, 0.04%, and (0.02%).
See accompanying Notes, which are an integral part of the Financial Statements.
21
Energy Fund
Notes to Financial Statements
Vanguard Energy Fund is registered under the Investment Company Act of 1940 as an open-end investment company, or mutual fund. The fund invests in securities of foreign issuers, which may subject it to investment risks not normally associated with investing in securities of U.S. corporations. The fund offers two classes of shares: Investor Shares and Admiral Shares. Investor Shares are available to any investor who meets the fund’s minimum purchase requirements. Admiral Shares are designed for investors who meet certain administrative, service, and account-size criteria.
A. The following significant accounting policies conform to generally accepted accounting principles for U.S. investment companies. The fund consistently follows such policies in preparing its financial statements.
1. Security Valuation: Securities are valued as of the close of trading on the New York Stock Exchange (generally 4 p.m., Eastern time) on the valuation date. Equity securities are valued at the latest quoted sales prices or official closing prices taken from the primary market in which each security trades; such securities not traded on the valuation date are valued at the mean of the latest quoted bid and asked prices. Securities for which market quotations are not readily available, or whose values have been affected by events occurring before the fund’s pricing time but after the close of the securities’ primary markets, are valued at their fair values calculated according to procedures adopted by the board of trustees. These procedures include obtaining quotations from an independent pricing service, monitoring news to identify significant market-or security-specific events, and evaluating changes in the values of foreign market proxies (for example, ADRs, futures contracts, or exchange-traded funds), between the time the foreign markets close and the fund’s pricing time. When fair-value pricing is employed, the prices of securities used by a fund to calculate its net asset value may differ from quoted or published prices for the same securities. Investments in Vanguard Market Liquidity Fund are valued at that fund’s net asset value. Temporary cash investments are valued using the latest bid prices or using valuations based on a matrix system (which considers such factors as security prices, yields, maturities, and ratings), both as furnished by independent pricing services.
2. Foreign Currency: Securities and other assets and liabilities denominated in foreign currencies are translated into U.S. dollars using exchange rates obtained from an independent third party as of the fund’s pricing time on the valuation date. Realized gains (losses) and unrealized appreciation (depreciation) on investment securities include the effects of changes in exchange rates since the securities were purchased, combined with the effects of changes in security prices. Fluctuations in the value of other assets and liabilities resulting from changes in exchange rates are recorded as unrealized foreign currency gains (losses) until the assets or liabilities are settled in cash, at which time they are recorded as realized foreign currency gains (losses).
3. Futures Contracts: The fund uses index futures contracts to a limited extent, with the objective of maintaining full exposure to the stock market while maintaining liquidity. The fund may purchase or sell futures contracts to achieve a desired level of investment, whether to accommodate portfolio turnover or cash flows from capital share transactions. The primary risks associated with the use of futures contracts are imperfect correlation between changes in market values of stocks held by the fund and the prices of futures contracts, and the possibility of an illiquid market. Counterparty risk involving futures is mitigated because a regulated clearinghouse is the counterparty instead of the clearing broker. To further mitigate counterparty risk, the fund trades futures contracts on an exchange, monitors the financial strength of its clearing brokers and clearinghouse, and has entered
22
Energy Fund
into clearing agreements with its clearing brokers. The clearinghouse imposes initial margin requirements to secure the fund’s performance and requires daily settlement of variation margin representing changes in the market value of each contract.
Futures contracts are valued at their quoted daily settlement prices. The aggregate settlement values of the contracts are not recorded in the Statement of Net Assets. Fluctuations in the value of the contracts are recorded in the Statement of Net Assets as an asset (liability) and in the Statement of Operations as unrealized appreciation (depreciation) until the contracts are closed, when they are recorded as realized futures gains (losses).
During the six months ended July 31, 2017, the fund’s average investments in long and short futures contracts represented 1% and 0% of net assets, respectively, based on the average of aggregate settlement values at each quarter-end during the period.
4. Repurchase Agreements: The fund enters into repurchase agreements with institutional counterparties. Securities pledged as collateral to the fund under repurchase agreements are held by a custodian bank until the agreements mature, and in the absence of a default, such collateral cannot be repledged, resold, or rehypothecated. Each agreement requires that the market value of the collateral be sufficient to cover payments of interest and principal. The fund further mitigates its counterparty risk by entering into repurchase agreements only with a diverse group of prequalified counterparties, monitoring their financial strength, and entering into master repurchase agreements with its counterparties. The master repurchase agreements provide that, in the event of a counterparty’s default (including bankruptcy), the fund may terminate any repurchase agreements with that counterparty, determine the net amount owed, and sell or retain the collateral up to the net amount owed to the fund. Such action may be subject to legal proceedings, which may delay or limit the disposition of collateral.
5. Federal Income Taxes: The fund intends to continue to qualify as a regulated investment company and distribute all of its taxable income. Management has analyzed the fund’s tax positions taken for all open federal income tax years (January 31, 2014–2017), and for the period ended July 31, 2017, and has concluded that no provision for federal income tax is required in the fund’s financial statements.
6. Distributions: Distributions to shareholders are recorded on the ex-dividend date.
7. Securities Lending: To earn additional income, the fund lends its securities to qualified institutional borrowers. Security loans are subject to termination by the fund at any time, and are required to be secured at all times by collateral in an amount at least equal to the market value of securities loaned. Daily market fluctuations could cause the value of loaned securities to be more or less than the value of the collateral received. When this occurs, the collateral is adjusted and settled on the next business day. The fund further mitigates its counterparty risk by entering into securities lending transactions only with a diverse group of prequalified counterparties, monitoring their financial strength, and entering into master securities lending agreements with its counterparties. The master securities lending agreements provide that, in the event of a counterparty’s default (including bankruptcy), the fund may terminate any loans with that borrower, determine the net amount owed, and sell or retain the collateral up to the net amount owed to the fund; however, such actions may be subject to legal proceedings. While collateral mitigates counterparty risk, in the event of a default, the fund may experience delays and costs in recovering the securities loaned. The fund invests cash collateral received in Vanguard Market Liquidity Fund, and records a liability in the Statement of Net Assets for
23
Energy Fund
the return of the collateral, during the period the securities are on loan. Securities lending income represents fees charged to borrowers plus income earned on invested cash collateral, less expenses associated with the loan. During the term of the loan, the fund is entitled to all distributions made on or in respect of the loaned securities.
8. Credit Facility: The fund and certain other funds managed by The Vanguard Group (“Vanguard”) participate in a $3.1 billion committed credit facility provided by a syndicate of lenders pursuant to a credit agreement that may be renewed annually; each fund is individually liable for its borrowings, if any, under the credit facility. Borrowings may be utilized for temporary and emergency purposes, and are subject to the fund’s regulatory and contractual borrowing restrictions. The participating funds are charged administrative fees and an annual commitment fee of 0.10% of the undrawn amount of the facility; these fees are allocated to the funds based on a method approved by the fund’s board of trustees and included in Management and Administrative expenses on the fund’s Statement of Operations. Any borrowings under this facility bear interest at a rate based upon the higher of the one-month London Interbank Offered Rate, federal funds effective rate, or overnight bank funding rate plus an agreed-upon spread.
The fund had no borrowings outstanding at July 31, 2017, or at any time during the period then ended.
9. Other: Dividend income is recorded on the ex-dividend date. Interest income includes income distributions received from Vanguard Market Liquidity Fund and is accrued daily. Premiums and discounts on debt securities purchased are amortized and accreted, respectively, to interest income over the lives of the respective securities. Security transactions are accounted for on the date securities are bought or sold. Costs used to determine realized gains (losses) on the sale of investment securities are those of the specific securities sold.
Each class of shares has equal rights as to assets and earnings, except that each class separately bears certain class-specific expenses related to maintenance of shareholder accounts (included in Management and Administrative expenses) and shareholder reporting. Marketing and distribution expenses are allocated to each class of shares based on a method approved by the board of trustees. Income, other non-class-specific expenses, and gains and losses on investments are allocated to each class of shares based on its relative net assets.
B. The investment advisory firm Wellington Management Company LLP provides investment advisory services to a portion of the fund for a fee calculated at an annual percentage rate of average net assets managed by the advisor. The basic fee is subject to quarterly adjustments based on performance relative to the MSCI ACWI Energy Index for the preceding three years.
Vanguard provides investment advisory services to a portion of the fund as described below; the fund paid Vanguard advisory fees of $281,000 for the six months ended July 31, 2017.
For the six months ended July 31, 2017, the aggregate investment advisory fee paid to all advisors represented an effective annual basic rate of 0.15% of the fund’s average net assets, before an increase of $242,000 (0.00%) based on performance.
C. In accordance with the terms of a Funds’ Service Agreement (the “FSA”) between Vanguard and the fund, Vanguard furnishes to the fund investment advisory, corporate management, administrative, marketing, and distribution services at Vanguard’s cost of operations (as defined by the FSA). These costs of operations are allocated to the fund based on methods and guidelines approved by the board of trustees. Vanguard does not require reimbursement in the current period
24
Energy Fund
for certain costs of operations (such as deferred compensation/benefits and risk/insurance costs); the fund’s liability for these costs of operations is included in Payables to Vanguard on the Statement of Net Assets.
Upon the request of Vanguard, the fund may invest up to 0.40% of its net assets as capital in Vanguard. At July 31, 2017, the fund had contributed to Vanguard capital in the amount of $591,000, representing 0.01% of the fund’s net assets and 0.24% of Vanguard’s capitalization. The fund’s trustees and officers are also directors and employees, respectively, of Vanguard.
D. Various inputs may be used to determine the value of the fund’s investments. These inputs are summarized in three broad levels for financial statement purposes. The inputs or methodologies used to value securities are not necessarily an indication of the risk associated with investing in those securities.
Level 1—Quoted prices in active markets for identical securities.
Level 2—Other significant observable inputs (including quoted prices for similar securities, interest rates, prepayment speeds, credit risk, etc.).
Level 3—Significant unobservable inputs (including the fund’s own assumptions used to determine the fair value of investments).
The following table summarizes the market value of the fund’s investments as of July 31, 2017, based on the inputs used to value them:
| | | |
| | Level 1 | Level 2 | Level 3 |
| Investments | ($000) | ($000) | ($000) |
| Common Stocks—United States | 5,928,326 | — | — |
| Common Stocks—International | 1,841,781 | 1,053,577 | — |
| Preferred Stocks | — | — | 40 |
| Temporary Cash Investments | 104,704 | 369,130 | — |
| Futures Contracts—Liabilities1 | (41) | — | — |
| Total | 7,874,770 | 1,422,707 | 40 |
1 Represents variation margin on the last day of the reporting period.
E. At July 31, 2017, the aggregate settlement value of open futures contracts and the related unrealized appreciation (depreciation) were:
| | | | |
| | | | | ($000) |
| | | | Aggregate | |
| | | Number of | Settlement | Unrealized |
| | | Long (Short) | Value | Appreciation |
| Futures Contracts | Expiration | Contracts | Long (Short) | (Depreciation) |
| E-mini S&P 500 Index | September 2017 | 1,162 | 143,391 | 323 |
Unrealized appreciation (depreciation) on open futures contracts is required to be treated as realized gain (loss) for tax purposes.
25
Energy Fund
F. Distributions are determined on a tax basis and may differ from net investment income and realized capital gains for financial reporting purposes. Differences may be permanent or temporary. Permanent differences are reclassified among capital accounts in the financial statements to reflect their tax character. Temporary differences arise when certain items of income, expense, gain, or loss are recognized in different periods for financial statement and tax purposes. These differences will reverse at some time in the future. Differences in classification may also result from the treatment of short-term gains as ordinary income for tax purposes.
The fund’s tax-basis capital gains and losses are determined only at the end of each fiscal year. For tax purposes, at January 31, 2017, the fund had available capital losses totaling $905,394,000 that may be carried forward indefinitely to offset future net capital gains. The fund will use these capital losses to offset net taxable capital gains, if any, realized during the year ending January 31, 2018; should the fund realize net capital losses for the year, the losses will be added to the loss carryforward balance above.
At July 31, 2017, the cost of investment securities for tax purposes was $6,717,161,000. Net unrealized appreciation of investment securities for tax purposes was $2,580,397,000, consisting of unrealized gains of $2,825,832,000 on securities that had risen in value since their purchase and $245,435,000 in unrealized losses on securities that had fallen in value since their purchase.
G. During the six months ended July 31, 2017, the fund purchased $1,154,065,000 of investment securities and sold $1,808,290,000 of investment securities, other than temporary cash investments.
| | | | |
| H. Capital share transactions for each class of shares were: | | |
| | Six Months Ended | | Year Ended |
| | | July 31, 2017 | January 31, 2017 |
| | Amount | Shares | Amount | Shares |
| | ($000) | (000) | ($000) | (000) |
| Investor Shares | | | | |
| Issued | 223,254 | 4,439 | 790,047 | 16,338 |
| Issued in Lieu of Cash Distributions | 953 | 19 | 59,916 | 1,108 |
| Redeemed | (524,022) | (10,404) | (913,171) | (18,558) |
| Net Increase (Decrease)—Investor Shares | (299,815) | (5,946) | (63,208) | (1,112) |
| Admiral Shares | | | | |
| Issued | 423,391 | 4,501 | 1,369,010 | 14,893 |
| Issued in Lieu of Cash Distributions | 3,528 | 37 | 126,344 | 1,246 |
| Redeemed | (972,473) | (10,278) | (1,335,629) | (14,570) |
| Net Increase (Decrease)—Admiral Shares | (545,554) | (5,740) | 159,725 | 1,569 |
I. Management has determined that no material events or transactions occurred subsequent to July 31, 2017, that would require recognition or disclosure in these financial statements.
26
About Your Fund’s Expenses
As a shareholder of the fund, you incur ongoing costs, which include costs for portfolio management, administrative services, and shareholder reports (like this one), among others. Operating expenses, which are deducted from a fund’s gross income, directly reduce the investment return of the fund.
A fund’s expenses are expressed as a percentage of its average net assets. This figure is known as the expense ratio. The following examples are intended to help you understand the ongoing costs (in dollars) of investing in your fund and to compare these costs with those of other mutual funds. The examples are based on an investment of $1,000 made at the beginning of the period shown and held for the entire period.
The accompanying table illustrates your fund’s costs in two ways:
• Based on actual fund return. This section helps you to estimate the actual expenses that you paid over the period. The ”Ending Account Value“ shown is derived from the fund‘s actual return, and the third column shows the dollar amount that would have been paid by an investor who started with $1,000 in the fund. You may use the information here, together with the amount you invested, to estimate the expenses that you paid over the period.
To do so, simply divide your account value by $1,000 (for example, an $8,600 account value divided by $1,000 = 8.6), then multiply the result by the number given for your fund under the heading ”Expenses Paid During Period.“
• Based on hypothetical 5% yearly return. This section is intended to help you compare your fund‘s costs with those of other mutual funds. It assumes that the fund had a yearly return of 5% before expenses, but that the expense ratio is unchanged. In this case—because the return used is not the fund’s actual return—the results do not apply to your investment. The example is useful in making comparisons because the Securities and Exchange Commission requires all mutual funds to calculate expenses based on a 5% return. You can assess your fund’s costs by comparing this hypothetical example with the hypothetical examples that appear in shareholder reports of other funds.
Note that the expenses shown in the table are meant to highlight and help you compare ongoing costs only and do not reflect transaction costs incurred by the fund for buying and selling securities. Further, the expenses do not include any purchase, redemption, or account service fees described in the fund prospectus. If such fees were applied to your account, your costs would be higher. Your fund does not carry a “sales load.”
The calculations assume no shares were bought or sold during the period. Your actual costs may have been higher or lower, depending on the amount of your investment and the timing of any purchases or redemptions.
You can find more information about the fund’s expenses, including annual expense ratios, in the Financial Statements section of this report. For additional information on operating expenses and other shareholder costs, please refer to your fund’s current prospectus.
27
| | | |
| Six Months Ended July 31, 2017 | | | |
| | Beginning | Ending | Expenses |
| | Account Value | Account Value | Paid During |
| Energy Fund | 1/31/2017 | 7/31/2017 | Period |
| Based on Actual Fund Return | | | |
| Investor Shares | $1,000.00 | $946.98 | $1.88 |
| Admiral Shares | 1,000.00 | 947.34 | 1.50 |
| Based on Hypothetical 5% Yearly Return | | | |
| Investor Shares | $1,000.00 | $1,022.86 | $1.96 |
| Admiral Shares | 1,000.00 | 1,023.26 | 1.56 |
The calculations are based on expenses incurred in the most recent six-month period. The fund’s annualized six-month expense ratios for that period are 0.39% for Investor Shares and 0.31% for Admiral Shares. The dollar amounts shown as “Expenses Paid” are equal to the annualized expense ratio multiplied by the average account value over the period, multiplied by the number of days in the most recent six-month period, then divided by the number of days in the most recent 12-month period (181/365).
28
Trustees Approve Advisory Arrangements
The board of trustees of Vanguard Energy Fund has renewed the fund’s investment advisory arrangement with The Vanguard Group, Inc. (Vanguard), through its Quantitative Equity Group, and Wellington Management Company LLP (Wellington Management). The board determined that renewing the fund’s advisory arrangements was in the best interests of the fund and its shareholders.
The board based its decision upon an evaluation of each advisor’s investment staff, portfolio management process, and performance. This evaluation included information provided to the board by Vanguard’s Portfolio Review Department, which is responsible for fund and advisor oversight and product management. The Portfolio Review Department met regularly with the advisors and made monthly presentations to the board during the fiscal year that directed the board’s focus to relevant information and topics.
The board, or an investment committee made up of board members, also received information throughout the year during advisor presentations. For each advisor presentation, the board was provided with letters and reports that included information about, among other things, the advisory firm and the advisor’s assessment of the investment environment, portfolio performance, and portfolio characteristics.
In addition, the board received monthly reports, which included a Market and Economic Report, a Fund Dashboard Monthly Summary, and a Fund Performance Report.
Prior to their meeting, the trustees were provided with a memo and materials that summarized the information they received over the course of the year. They also considered the factors discussed below, among others. However, no single factor determined whether the board approved the arrangements. Rather, it was the totality of the circumstances that drove the board’s decision.
Nature, extent, and quality of services
The board reviewed the quality of the fund’s investment management services over both the short and long term and took into account the organizational depth and stability of each advisor. The board considered the following:
Vanguard. Vanguard has been managing investments for more than three decades. The Quantitative Equity Group adheres to a sound, disciplined investment management process; the team has considerable experience, stability, and depth. Vanguard has managed a portion of the fund since 2005.
Wellington Management. Founded in 1928, Wellington Management is among the nation’s oldest and most respected institutional investment managers. The investment team uses a bottom-up approach in which stocks are selected based on the advisor’s estimates of fundamental investment value. Fundamental research focuses on the quality of a company’s assets, its internal reinvestment opportunities, and management quality. The firm has advised the fund since its inception in 1984.
The board concluded that each advisor’s experience, stability, depth, and performance, among other factors, warranted the continuation of the advisory arrangements.
29
Investment performance
The board considered the short- and long-term performance of the fund and each advisor, including any periods of outperformance or underperformance compared with a relevant benchmark index and peer group. The board concluded that the performance was such that the advisory arrangements should continue. Information about the fund’s most recent performance can be found in the Performance Summary section of this report.
Cost
The board concluded that the fund’s expense ratio was well below the average expense ratio charged by funds in its peer group and that the fund’s advisory expense rate was also well below its peer-group average. Information about the fund’s expenses appears in the About Your Fund’s Expenses section of this report as well as in the Financial Statements section, which also includes information about the fund’s advisory expenses.
The board did not consider the profitability of Wellington Management in determining whether to approve the advisory fee, because Wellington Management is independent of Vanguard and the advisory fee is the result of arm’s-length negotiations. The board does not conduct a profitability analysis of Vanguard because of Vanguard’s unique “at-cost” structure. Unlike most other mutual fund management companies, Vanguard is owned by the funds it oversees and produces “profits” only in the form of reduced expenses for fund shareholders.
The benefit of economies of scale
The board concluded that the fund’s shareholders benefit from economies of scale because of breakpoints in the fund’s advisory fee schedule for Wellington Management. The breakpoints reduce the effective rate of the fee as the fund’s assets managed by Wellington Management increase. The board also concluded that the fund’s at-cost arrangement with Vanguard ensures that the fund will realize economies of scale as it grows, with the cost to shareholders declining as the fund’s assets managed by Vanguard increase.
The board will consider whether to renew the advisory arrangements again after a one-year period.
30
Glossary
30-Day SEC Yield. A fund’s 30-day SEC yield is derived using a formula specified by the U.S. Securities and Exchange Commission. Under the formula, data related to the fund’s security holdings in the previous 30 days are used to calculate the fund’s hypothetical net income for that period, which is then annualized and divided by the fund’s estimated average net assets over the calculation period. For the purposes of this calculation, a security’s income is based on its current market yield to maturity (for bonds), its actual income (for asset-backed securities), or its projected dividend yield (for stocks). Because the SEC yield represents hypothetical annualized income, it will differ—at times significantly—from the fund’s actual experience. As a result, the fund’s income distributions may be higher or lower than implied by the SEC yield.
Beta. A measure of the magnitude of a fund’s past share-price fluctuations in relation to the ups and downs of a given market index. The index is assigned a beta of 1.00. Compared with a given index, a fund with a beta of 1.20 typically would have seen its share price rise or fall by 12% when the index rose or fell by 10%. For this report, beta is based on returns over the past 36 months for both the fund and the index. Note that a fund’s beta should be reviewed in conjunction with its R-squared (see definition). The lower the R-squared, the less correlation there is between the fund and the index, and the less reliable beta is as an indicator of volatility.
Dividend Yield. Dividend income earned by stocks, expressed as a percentage of the aggregate market value (or of net asset value, for a fund). The yield is determined by dividing the amount of the annual dividends by the aggregate value (or net asset value) at the end of the period. For a fund, the dividend yield is based solely on stock holdings and does not include any income produced by other investments.
Earnings Growth Rate. The average annual rate of growth in earnings over the past five years for the stocks now in a fund.
Equity Exposure. A measure that reflects a fund’s investments in stocks and stock futures. Any holdings in short-term reserves are excluded.
Expense Ratio. A fund’s total annual operating expenses expressed as a percentage of the fund’s average net assets. The expense ratio includes management and administrative expenses, but does not include the transaction costs of buying and selling portfolio securities.
Foreign Holdings. The percentage of a fund represented by securities or depositary receipts of companies based outside the United States.
Inception Date. The date on which the assets of a fund (or one of its share classes) are first invested in accordance with the fund’s investment objective. For funds with a subscription period, the inception date is the day after that period ends. Investment performance is measured from the inception date.
Median Market Cap. An indicator of the size of companies in which a fund invests; the midpoint of market capitalization (market price x shares outstanding) of a fund’s stocks, weighted by the proportion of the fund’s assets invested in each stock. Stocks representing half of the fund’s assets have market capitalizations above the median, and the rest are below it.
Price/Book Ratio. The share price of a stock divided by its net worth, or book value, per share.
For a fund, the weighted average price/book ratio of the stocks it holds.
31
Price/Earnings Ratio. The ratio of a stock’s current price to its per-share earnings over the past year. For a fund, the weighted average P/E of the stocks it holds. P/E is an indicator of market expectations about corporate prospects; the higher the P/E, the greater the expectations for a company’s future growth.
R-Squared. A measure of how much of a fund’s past returns can be explained by the returns from the market in general, as measured by a given index. If a fund’s total returns were precisely synchronized with an index’s returns, its R-squared would be 1.00. If the fund’s returns bore no relationship to the index’s returns, its R-squared would be 0. For this report, R-squared is based on returns over the past 36 months for both the fund and the index.
Return on Equity. The annual average rate of return generated by a company during the past five years for each dollar of shareholder’s equity (net income divided by shareholder’s equity). For a fund, the weighted average return on equity for the companies whose stocks it holds.
Short-Term Reserves. The percentage of a fund invested in highly liquid, short-term securities that can be readily converted to cash.
Turnover Rate. An indication of the fund’s trading activity. Funds with high turnover rates incur higher transaction costs and may be more likely to distribute capital gains (which may be taxable to investors). The turnover rate excludes in-kind transactions, which have minimal impact on costs.
Benchmark Information
Spliced Energy Index: S&P 500 Index through November 30, 2000; S&P Energy Sector Index through May 31, 2010; MSCI All Country World Energy Index thereafter.
32
The Global Industry Classification Standard (“GICS”) was developed by and is the exclusive property and a service mark of MSCI Inc. (“MSCI”) and Standard and Poor’s, a division of McGraw-Hill Companies, Inc. (“S&P”), and is licensed for use by Vanguard. Neither MSCI, S&P nor any third party involved in making or compiling the GICS or any GICS classification makes any express or implied warranties or representations with respect to such standard or classification (or the results to be obtained by the use thereof), and all such parties hereby expressly disclaim all warranties of originality, accuracy, completeness, merchantability or fitness for a particular purpose with respect to any such standard or classification. Without limiting any of the foregoing, in no event shall MSCI, S&P, any of its affiliates or any third party involved in making or compiling the GICS or any GICS classification have any liability for any direct, indirect, special, punitive, consequential or any other damages (including lost profits) even if notified of the possibility of such damages.
33
This page intentionally left blank.
The People Who Govern Your Fund
The trustees of your mutual fund are there to see that the fund is operated and managed in your best interests since, as a shareholder, you are a part owner of the fund. Your fund’s trustees also serve on the board of directors of The Vanguard Group, Inc., which is owned by the Vanguard funds and provides services to them on an at-cost basis.
A majority of Vanguard’s board members are independent, meaning that they have no affiliation with Vanguard or the funds they oversee, apart from the sizable personal investments they have made as private individuals. The independent board members have distinguished backgrounds in business, academia, and public service. Each of the trustees and executive officers oversees 195 Vanguard funds.
Information for each trustee and executive officer of the fund appears below. The mailing address of the trustees and officers is P.O. Box 876, Valley Forge, PA 19482. More information about the trustees is in the Statement of Additional Information, which can be obtained, without charge, by contacting Vanguard at 800-662-7447, or online at vanguard.com.
Interested Trustee1
F. William McNabb III
Born 1957. Trustee Since July 2009. Chairman of the Board. Principal Occupation(s) During the Past Five Years and Other Experience: Chairman of the Board of The Vanguard Group, Inc., and of each of the investment companies served by The Vanguard Group, since January 2010; Chief Executive Officer and Director of The Vanguard Group and President and Chief Executive Officer of each of the investment companies served by The Vanguard Group, since 2008; Director of Vanguard Marketing Corporation; President of The Vanguard Group (2008–2017); Managing Director of The Vanguard Group (1995–2008).
Independent Trustees
Emerson U. Fullwood
Born 1948. Trustee Since January 2008. Principal Occupation(s) During the Past Five Years and Other Experience: Executive Chief Staff and Marketing Officer for North America and Corporate Vice President (retired 2008) of Xerox Corporation (document management products and services); Executive in Residence and 2009–2010 Distinguished Minett Professor at the Rochester Institute of Technology; Lead Director of SPX FLOW, Inc. (multi-industry manufacturing); Director of the United Way of Rochester, the University of Rochester Medical Center, Monroe Community College Foundation, North Carolina A&T University, and Roberts Wesleyan College; Trustee of the University of Rochester.
Rajiv L. Gupta
Born 1945. Trustee Since December 2001.2 Principal Occupation(s) During the Past Five Years and Other Experience: Chairman and Chief Executive Officer (retired 2009) and President (2006–2008) of Rohm and Haas Co. (chemicals); Director of Arconic Inc. (diversified manufacturer), HP Inc. (printer and personal computer manufacturing), and Delphi Automotive plc (automotive components); Senior Advisor at New Mountain Capital.
Amy Gutmann
Born 1949. Trustee Since June 2006. Principal Occupation(s) During the Past Five Years and Other Experience: President of the University of Pennsylvania; Christopher H. Browne
1 Mr. McNabb is considered an “interested person,” as defined in the Investment Company Act of 1940, because he is an officer of the Vanguard funds.
2 December 2002 for Vanguard Equity Income Fund, the Vanguard Municipal Bond Funds, and the Vanguard State Tax-Exempt Funds.
Distinguished Professor of Political Science, School of Arts and Sciences, and Professor of Communication, Annenberg School for Communication, with secondary faculty appointments in the Department of Philosophy, School of Arts and Sciences, and at the Graduate School of Education, University of Pennsylvania; Trustee of the National Constitution Center.
JoAnn Heffernan Heisen
Born 1950. Trustee Since July 1998. Principal Occupation(s) During the Past Five Years and Other Experience: Corporate Vice President and Member of the Executive Committee (1997–2008), Chief Global Diversity Officer (retired 2008), Vice President and Chief Information Officer (1997–2006), Controller (1995–1997), Treasurer (1991–1995), and Assistant Treasurer (1989–1991) of Johnson & Johnson (pharmaceuticals/medical devices/ consumer products); Director of Skytop Lodge Corporation (hotels) and the Robert Wood Johnson Foundation; Member of the Advisory Board of the Institute for Women’s Leadership at Rutgers University.
F. Joseph Loughrey
Born 1949. Trustee Since October 2009. Principal Occupation(s) During the Past Five Years and Other Experience: President and Chief Operating Officer (retired 2009) of Cummins Inc. (industrial machinery); Chairman of the Board of Hillenbrand, Inc. (specialized consumer services), Oxfam America, and the Lumina Foundation for Education; Director of the V Foundation for Cancer Research; Member of the Advisory Council for the College of Arts and Letters and Chair of the Advisory Board to the Kellogg Institute for International Studies, both at the University of Notre Dame.
Mark Loughridge
Born 1953. Trustee Since March 2012. Principal Occupation(s) During the Past Five Years and Other Experience: Senior Vice President and Chief Financial Officer (retired 2013) at IBM (information technology services); Fiduciary Member of IBM’s Retirement Plan Committee (2004–2013); Director of the Dow Chemical Company; Member of the Council on Chicago Booth.
Scott C. Malpass
Born 1962. Trustee Since March 2012. Principal Occupation(s) During the Past Five Years and Other Experience: Chief Investment Officer and Vice President at the University of Notre Dame; Assistant Professor of Finance at the Mendoza College of Business at Notre Dame; Member of the Notre Dame 403(b) Investment Committee, the Board of Advisors for Spruceview Capital Partners, the Board of Catholic Investment Services, Inc. (investment advisor), and the Board of Superintendence of the Institute for the Works of Religion; Chairman of the Board of TIFF Advisory Services, Inc. (investment advisor).
André F. Perold
Born 1952. Trustee Since December 2004. Principal Occupation(s) During the Past Five Years and Other Experience: George Gund Professor of Finance and Banking, Emeritus at the Harvard Business School (retired 2011); Chief Investment Officer and Co-Managing Partner of HighVista Strategies LLC (private investment firm); Overseer of the Museum of Fine Arts Boston.
Peter F. Volanakis
Born 1955. Trustee Since July 2009. Principal Occupation(s) During the Past Five Years and Other Experience: President and Chief Operating Officer (retired 2010) of Corning Incorporated (communications equipment); Chairman of the Board of Trustees of Colby-Sawyer College; Member of the Board of Hypertherm, Inc. (industrial cutting systems, software, and consumables).
Executive Officers
Glenn Booraem
Born 1967. Investment Stewardship Officer Since February 2017. Principal Occupation(s) During the Past Five Years and Other Experience: Principal of The Vanguard Group, Inc.; Treasurer (2015–2017), Controller (2010–2015), and Assistant Controller (2001–2010) of each of the investment companies served by The Vanguard Group.
Thomas J. Higgins
Born 1957. Chief Financial Officer Since September 2008. Principal Occupation(s) During the Past Five Years and Other Experience: Principal of The Vanguard Group, Inc.; Chief Financial Officer of each of the investment companies served by The Vanguard Group; Treasurer of each of the investment companies served by The Vanguard Group (1998–2008).
Peter Mahoney
Born 1974. Controller Since May 2015. Principal Occupation(s) During the Past Five Years and Other Experience: Principal of The Vanguard Group, Inc.; Controller of each of the investment companies served by The Vanguard Group; Head of International Fund Services at The Vanguard Group (2008–2014).
Anne E. Robinson
Born 1970. Secretary Since September 2016. Principal Occupation(s) During the Past Five Years and Other Experience: Managing Director of The Vanguard Group, Inc.; General Counsel of The Vanguard Group; Secretary of The Vanguard Group and of each of the investment companies served by The Vanguard Group; Director and Senior Vice President of Vanguard Marketing Corporation; Managing Director and General Counsel of Global Cards and Consumer Services at Citigroup (2014–2016); Counsel at American Express (2003–2014).
Michael Rollings
Born 1963. Treasurer Since February 2017. Principal Occupation(s) During the Past Five Years and Other Experience: Managing Director of The Vanguard Group, Inc.; Treasurer of each of the investment companies served by The Vanguard Group; Director of Vanguard Marketing Corporation; Executive Vice President and Chief Financial Officer of MassMutual Financial Group (2006–2016).
| |
| Vanguard Senior Management Team |
| |
| Mortimer J. Buckley | James M. Norris |
| John James | Thomas M. Rampulla |
| Martha G. King | Glenn W. Reed |
| John T. Marcante | Karin A. Risi |
| Chris D. McIsaac | Gregory Davis |
| |
| |
| Chairman Emeritus and Senior Advisor |
| |
| John J. Brennan | |
| Chairman, 1996–2009 | |
| Chief Executive Officer and President, 1996–2008 |
| |
| |
| Founder | |
| |
| John C. Bogle | |
| Chairman and Chief Executive Officer, 1974–1996 |
|  |
| | P.O. Box 2600 |
| | Valley Forge, PA 19482-2600 |
| |
| |
| |
| Connect with Vanguard® > vanguard.com |
| |
| |
| |
| Fund Information > 800-662-7447 | CFA® is a registered trademark owned by CFA |
| Direct Investor Account Services > 800-662-2739 | Institute. |
| Institutional Investor Services > 800-523-1036 | |
| Text Telephone for People | |
| Who Are Deaf or Hard of Hearing> 800-749-7273 | |
| |
| This material may be used in conjunction | |
| with the offering of shares of any Vanguard | |
| fund only if preceded or accompanied by | |
| the fund’s current prospectus. | |
| |
| All comparative mutual fund data are from Lipper, a | |
| Thomson Reuters Company, or Morningstar, Inc., unless | |
| otherwise noted. | |
| |
| You can obtain a free copy of Vanguard’s proxy voting | |
| guidelines by visiting vanguard.com/proxyreporting or by | |
| calling Vanguard at 800-662-2739. The guidelines are | |
| also available from the SEC’s website, sec.gov. In | |
| addition, you may obtain a free report on how your fund | |
| voted the proxies for securities it owned during the 12 | |
| months ended June 30. To get the report, visit either | |
| vanguard.com/proxyreporting or sec.gov. | |
| |
| You can review and copy information about your fund at | |
| the SEC’s Public Reference Room in Washington, D.C. To | |
| find out more about this public service, call the SEC at | |
| 202-551-8090. Information about your fund is also | |
| available on the SEC’s website, and you can receive | |
| copies of this information, for a fee, by sending a | |
| request in either of two ways: via email addressed to | |
| publicinfo@sec.gov or via regular mail addressed to the | |
| Public Reference Section, Securities and Exchange | |
| Commission, Washington, DC 20549-1520. | |
| | © 2017 The Vanguard Group, Inc. |
| | All rights reserved. |
| | Vanguard Marketing Corporation, Distributor. |
| |
| | Q512 092017 |

Semiannual Report | July 31, 2017
Vanguard Precious Metals and Mining Fund
A new format, unwavering commitment
As you begin reading this report, you’ll notice that we’ve made some improvements to the opening sections—based on feedback from you, our clients.
Page 1 starts with a new ”Your Fund’s Performance at a Glance,” a concise, handy summary of how your fund performed during the period.
In the renamed ”Chairman’s Perspective,” Bill McNabb will focus on enduring principles and investment insights.
We’ve modified some tables, and eliminated some redundancy, but we haven’t removed any information.
At Vanguard, we’re always looking for better ways to communicate and to help you make sound investment decisions. Thank you for entrusting your assets to us.
| |
| Contents | |
| Your Fund’s Performance at a Glance. | 1 |
| Chairman’s Perspective. | 2 |
| Advisor’s Report. | 6 |
| Fund Profile. | 9 |
| Performance Summary. | 10 |
| Financial Statements. | 11 |
| About Your Fund’s Expenses. | 22 |
| Trustees Approve Advisory Arrangement. | 24 |
| Glossary. | 26 |
Please note: The opinions expressed in this report are just that—informed opinions. They should not be considered promises or advice. Also, please keep in mind that the information and opinions cover the period through the date on the front of this report. Of course, the risks of investing in your fund are spelled out in the prospectus.
See the Glossary for definitions of investment terms used in this report.
About the cover: No matter what language you speak, Vanguard has one consistent message and set of principles. Our primary focus is on you, our clients. We conduct our business with integrity as a faithful steward of your assets. This message is shown translated into seven languages, reflecting our expanding global presence.
Your Fund’s Performance at a Glance
• For the six months ended July 31, 2017, Vanguard Precious Metals and Mining Fund returned –1.00%. The result trailed the 0.33% return of the benchmark S&P Global Custom Metals and Mining Index but surpassed the –5.85% average return of peer funds.
• The fund invests in companies that are involved in the mining or exploration of precious and rare metals and minerals, a highly volatile segment of the market.
• After climbing about 76% over the previous fiscal year, the fund wasn’t able to generate positive returns.
• Prices of mined commodities declined over the half year. Although gold prices held up compared with other precious metals, gold mining stocks struggled as investors considered these companies generally overvalued after last year’s strong performance.
• Silver miners were a bright spot for the fund, climbing nearly 8% compared with a decline of about 11% for those in the benchmark.
Total Returns: Six Months Ended July 31, 2017
| |
| | Total |
| | Returns |
| Vanguard Precious Metals and Mining Fund | -1.00% |
| S&P Global Custom Metals and Mining Index | 0.33 |
| Precious Metals Equity Funds Average | -5.85 |
| Precious Metals Equity Funds Average: Derived from data provided by Lipper, a Thomson Reuters Company. | |
Expense Ratios
Your Fund Compared With Its Peer Group
| | |
| | | Peer Group |
| | Fund | Average |
| Precious Metals and Mining Fund | 0.43% | 1.46% |
The fund expense ratio shown is from the prospectus dated May 25, 2017, and represents estimated costs for the current fiscal year. For the six months ended July 31, 2017, the fund’s annualized expense ratio was 0.40%. The peer-group expense ratio is derived from data provided by Lipper, a Thomson Reuters Company, and captures information through year-end 2016.
Peer group: Precious Metals Equity Funds.
Chairman’s Perspective

Bill McNabb
Chairman and Chief Executive Officer
Dear Shareholder,
It’s said that fierce debates often generate more heat than light. And that’s been true of the ongoing face-off between sharply divided advocates of index funds and of actively managed funds.
For too long, the decision regarding active and index investing has been framed as either-or: Just pick a side and go all-in. But this choice is actually much more nuanced than a binary yes or no.
You may feel that your allegiance can belong to only one sports team, but you don’t have to approach investment strategies that way. (I’ll root for the Philadelphia Eagles no matter whom they’re playing, but my personal investment portfolio includes both index and active funds.)
Yes, indexing can be a valuable starting point for investors, and many may index their entire portfolio. But depending on your circumstances, an allocation to active management may be appropriate.
Recently published Vanguard research is illuminating on this point. Beyond helping you determine whether you’re a good candidate for active strategies, the paper Making the Implicit Explicit: A Framework for the Active-Passive Decision can help establish active and passive allocation targets for a range of investors. (You can read the paper at vanguard.com/research.)
2
Notching a record of outperformance
We’re a pioneer and leader in index fund investing, so why am I suggesting that active management may be appropriate?
Often overshadowed by our indexing reputation is Vanguard’s commitment to—and success with—active management. We oversee about $1 trillion in actively managed assets. And the results have been impressive, as the overwhelming majority of our active funds outperformed the average returns of their peers over the last decade.1 In addition, nearly half of our active funds have outperformed their benchmark indexes over the same period, a level of success that’s not easy to achieve.2
Make no mistake: The challenges of outperforming the market through active management are steep. So Vanguard has developed an approach with distinct characteristics that can improve your chances of success.
Chief among those advantages are low costs. As I’ve written before, paying less for your funds is one way to improve your odds of achieving success in active
| | | |
| Market Barometer | | | |
| | | | Total Returns |
| | | Periods Ended July 31, 2017 |
| | | | Five Years |
| | Six Months | One Year | (Annualized) |
| Stocks | | | |
| Russell 1000 Index (Large-caps) | 9.24% | 15.95% | 14.85% |
| Russell 2000 Index (Small-caps) | 5.35 | 18.45 | 14.19 |
| Russell 3000 Index (Broad U.S. market) | 8.94 | 16.14 | 14.79 |
| FTSE All-World ex US Index (International) | 14.05 | 18.81 | 8.11 |
| |
| Bonds | | | |
| Bloomberg Barclays U.S. Aggregate Bond Index | | | |
| (Broad taxable market) | 2.51% | -0.51% | 2.02% |
| Bloomberg Barclays Municipal Bond Index | | | |
| (Broad tax-exempt market) | 3.72 | 0.26 | 3.10 |
| Citigroup Three-Month U.S. Treasury Bill Index | 0.34 | 0.51 | 0.15 |
| |
| CPI | | | |
| Consumer Price Index | 0.80% | 1.73% | 1.33% |
The performance data shown represent past performance, which is not a guarantee of future results.
1 For the ten years ended June 30, 2017, 50 of 53 fixed income, 19 of 19 balanced, and 38 of 40 stock fund share classes—or 107 of
112 share classes of active Vanguard funds—outperformed their peer-group averages. Source: Vanguard, based on data from Lipper,
a Thomson Reuters Company.
2 For the ten years ended June 30, 2017, 21 of 53 fixed income, 5 of 19 balanced, and 23 of 40 stock fund share classes—or 49 of
112 share classes of active Vanguard funds—outperformed their benchmark indexes. Source: Vanguard, based on data from Lipper,
a Thomson Reuters Company.
3
management. Investors need to watch not only explicit costs, such as those reflected in fund expense ratios, but also implicit ones, such as trading costs, which can be significant because of the higher portfolio turnover associated with many active funds.
Historically, costs have been a reliable predictor of fund performance. But low costs don’t guarantee positive results. Talent is also critical. For this reason, Vanguard dedicates a lot of time, attention, and resources to manager selection and the ongoing oversight of managers.
Reaching beyond our walls
To serve our investors, we’re committed to identifying and attracting the best active managers across a range of investment styles and approaches. We recognize that not all great active managers reside in Valley Forge, Pennsylvania, where Vanguard is headquartered. As a result, we look across the world for managers for many of our active funds.
We oversee about $600 billion in assets that are managed by external advisors and partner with more than 25 firms employing hundreds of investment professionals and supporting analysts. These firms are responsible for more than 70 investment mandates within our active portfolios.
Stay patient and control taxes
Costs and manager selection are critical, but they aren’t the only necessities. You’ll also need a healthy supply of what many investors don’t possess in abundance: patience. Having the fortitude to wait is essential because even those active managers with the best track records go through significant periods of underperformance.
Patience is also crucial because investors in active strategies must stay disciplined and stick with them over time to take full advantage of the compounding benefits of outperformance. This is easy to say but often difficult to execute.
A few years ago, Vanguard looked at those actively managed domestic equity funds across the industry that did best over the previous 15 years. We found that even though these funds outperformed their benchmark indexes over that long period, 97% lagged the benchmarks in at least five calendar years. And two-thirds of the outperforming funds experienced at least three consecutive years of underperformance.3
Tax efficiency is another important consideration. In general, investors shouldn’t hold active strategies in an account that lacks tax protection.
3 Source: Vanguard calculations for the 15 years ended December 31, 2012, using data from Morningstar, Inc.
4
The tax drag associated with most active funds because of their higher turnover can be neutralized by holding the investments in tax-advantaged accounts, such as IRAs and 401(k) plans.
If you keep your focus on these four considerations—costs, manager selection, patience, and taxes—you’ll enhance your chances of achieving success with actively managed funds.
As always, thank you for investing with Vanguard.
Sincerely,

F. William McNabb III
Chairman and Chief Executive Officer
August 14, 2017
|
| Vanguard fund shareholders encouraged to vote in proxy campaign |
| |
| This summer we are asking you to vote on the election of trustees for all U.S.-domiciled |
| Vanguard funds, and on several fund policy proposals that we believe are in the best |
| interests of all shareholders. |
| |
| Vanguard filed a proxy statement on August 14, 2017, with the U.S. Securities and Exchange |
| Commission (SEC). Proxy materials are being provided to Vanguard fund shareholders with |
| instructions on how to vote online, by phone, or by mail. |
| |
| A shareholder meeting is scheduled to be held in Scottsdale, Arizona, on November 15, |
| 2017, when voting will conclude. We encourage you to vote promptly. Please visit |
| vanguard.com for updates. |
5
Advisor’s Report
Vanguard Precious Metals and Mining Fund returned –1.00% for the six months ended July 31, 2017. It trailed its customized benchmark index, which returned 0.33%, but surpassed the average –5.85% return of its peer group of precious metals-oriented funds.
Market environment
Initial optimism about the prospect of fiscal stimulus and massive infrastructure spending after Donald Trump was elected U.S. president last November waned as investors began to question his ability to push through his growth agenda. In the spring of 2017, though, investors were relieved as populist contenders failed to overturn mainstream candidates in key Dutch and French elections.
The global economy continued to advance as many major markets released positive data and investor sentiment was broadly confident. In particular, after doubts in early 2017 about the health of China’s economy, investors in many Asian and emerging markets were encouraged as it appeared to stabilize.
Shares in diversified metals companies were the strongest performers over the six months, while silver, gold, and precious metals holdings underperformed the benchmark.
The fund’s performance
Relatively light exposure to diversified metals and miners hurt the fund’s results, as did an overweighting of gold producers.
A relatively large exposure to precious metals and silver producers was slightly detrimental despite positive stock selection in both categories.
Canada-listed Dominion Diamond was among the top contributors; the company accepted a takeover offer from U.S.-based Washington Companies after previously rejecting a lower offer.
Another key contributor was Hochschild Mining, which continued performing well as investors recognized its solid fundamentals and the rebuilding of its balance sheet over the past two years.
The fund’s exposure to Bunge, an agricultural-processing commodities company, was also beneficial. The company has piqued the interest of Glencore, which approached Bunge about a potential collaboration, sending the shares higher. In our opinion, Bunge has a very good business and is trading at a reasonable valuation. We feel that the company is in a good position to benefit from low prices for crops such as soy and corn and ultimately from higher processing margins.
Canada-based Osisko Mining added further value. In our view, the precious metals company is developing one of the most interesting “gold districts” in the world. Importantly, it appears to operate in a politically safe and secure jurisdiction, unlike many other players in the market. Gold players IAMGOLD and Kinross Gold
6
also performed well, helped in part from having operations in relatively stable countries.
For various countries around the globe with mining operations, political risk seems to be increasing, with a negative impact on some of the companies involved there. Tahoe Resources, which has been affected by issues in Guatemala, and Acacia Mining, which has been affected in Tanzania, notably detracted. To a lesser extent, political factors in Tanzania dragged on our holding in AngloGold Ashanti.
Other detractors included Canadian copper miner Nevsun Resources, which is still striving to consistently produce a salable copper concentration at the Bisha mine in Eritrea. Nevsun also sharply cut its dividend, a move that was not well-received by investors. Despite the share price’s weakness over the six months, we still believe that the company has arguably one of the best undeveloped copper assets in the Timok mine in Serbia, and we have kept the holding.
Portfolio activity
We started a new position in Independence Group, an Australian nickel/gold company. The firm is well-run, with a good management team, and is focused on return on investor capital. Although nickel has been selling off and is a challenging market, Independence Group trades at a reasonable valuation, and investors have so far failed to appreciate its gold operations.
Supply in the zinc market has tightened in recent years, leading to higher prices. Against this backdrop, we started a position in Canadian zinc miner Trevali Mining, which has recently acquired a portfolio of zinc assets from Glencore in a deal that has materially improved Trevali’s asset base. We believe that Trevali’s management is sound and that its interests align well with those of their shareholders.
We sold our position in Canadian-listed Yamana Gold, which had held back returns over the period. Continued excessive leverage on the company’s balance sheet concerns us.
Rather than holding multiple positions in junior miners, which are often highly illiquid, we prefer investing in a few junior companies that we believe have real potential, given the right circumstances. With this in mind, we added to our exposure to Osisko Mining.
The portfolio’s precious metals and minerals segment has become slightly more concentrated in recent months as a result of that transaction and others. Its precious metals exposure overall is marginally less than it was at the start of the period.
Portfolio positioning and outlook
President Trump’s apparent inability to push through his plans could affect growth, and that has weakened the
7
U.S. dollar. This in turn has benefited the gold price marginally in the short term. Diversified and base metal companies have modestly rallied but still appear to offer better value than many of the precious metals companies. We continue to look at diversified and base metal assets, but many of those companies with seeming potential are also small and highly illiquid, rendering them less appealing for inclusion in the portfolio.
We expect that diversified metals prices may weaken a little in the second half of the year; a large portion of the zinc and steel output is destined for the global auto market, where sales seem to be peaking and investors have priced in slower sales going forward. It is worth bearing in mind, however, that should investors become concerned about health care and financials, they may rotate into the metals, mining, and energy sectors on valuation grounds.
Importantly, we feel that the fund’s current positioning is focused in areas that we believe are relatively secure politically, in particular, in countries with an active interest in securing mining investment. At the same time, we recognize that unexpected upsets can occur, and we try to manage risk as best we can.
The precious metals sector can be volatile, but the fund, unlike others in its peer group, has the advantage of being able to hold up to 50% of the portfolio in other subindustries including mining and agriculture. For example, our holding in agribusiness Bunge boosted performance over the half year. The fund’s ability to diversify can reduce its volatility versus its peer group.
Jamie J. Horvat Portfolio Manager
M&G Investment Management Limited
August 17, 2017
8
Precious Metals and Mining Fund
| | | |
| Fund Profile | | |
| As of July 31, 2017 | | | |
| |
| Portfolio Characteristics | | |
| | | S&P | |
| | | Global | |
| | | Custom | DJ |
| | | Metals and | U.S. Total |
| | | Mining | Market |
| | Fund | Index | FA Index |
| Number of Stocks | 78 | 231 | 3,786 |
| Median Market Cap | $2.5B | $12.5B | $61.2B |
| Price/Earnings Ratio | 24.0x | 17.4x | 21.5x |
| Price/Book Ratio | 1.6x | 1.5x | 2.8x |
| Return on Equity | -0.7% | 1.3% | 15.1% |
| Earnings Growth Rate | -18.5% | -9.1% | 10.1% |
| Dividend Yield | 0.8% | 1.7% | 1.8% |
| Foreign Holdings | 87.9% | 88.7% | 0.0% |
| Turnover Rate | | | |
| (Annualized) | 37% | — | — |
| Ticker Symbol | VGPMX | — | — |
| Expense Ratio1 | 0.43% | — | — |
| Short-Term Reserves | 3.1% | — | — |
Subindustry Diversification (% of equity exposure)
| | |
| | | S&P |
| | | Global |
| | | Custom |
| | | Metals and |
| | | Mining |
| | Fund | Index |
| Agricultural Products | 2.0% | 0.0% |
| Aluminum | 0.0 | 4.0 |
| Copper | 7.1 | 6.6 |
| Diversified Metals & Mining | 8.2 | 44.1 |
| Gold | 65.2 | 36.3 |
| Precious Metals & Minerals | 9.2 | 4.7 |
| Silver | 8.0 | 4.3 |
| Other | 0.3 | 0.0 |
Sector categories are based on the Global Industry Classification Standard (“GICS”), except for the “Other” category (if applicable), which includes securities that have not been provided a GICS classification as of the effective reporting period.
| | |
| Volatility Measures | | |
| | S&P | |
| | Global | |
| | Custom | DJ |
| | Metals and | U.S. Total |
| | Mining | Market |
| | Index | FA Index |
| R-Squared | 0.91 | 0.02 |
| Beta | 1.01 | 0.50 |
These measures show the degree and timing of the fund’s fluctuations compared with the indexes over 36 months.
| | |
| Ten Largest Holdings (% of total net assets) |
| Franco-Nevada Corp. | Gold | 6.0% |
| Newmont Mining Corp. | Gold | 5.8 |
| Agnico Eagle Mines Ltd. Gold | 5.2 |
| Randgold Resources | | |
| Ltd. | Gold | 4.2 |
| Hochschild Mining plc | Silver | 4.1 |
| B2Gold Corp. | Gold | 3.8 |
| Nevsun Resources Ltd. | Copper | 3.8 |
| Endeavour Mining Corp. | Gold | 3.2 |
| Barrick Gold Corp. | Gold | 2.9 |
| Alamos Gold Inc. | Gold | 2.8 |
| Top Ten | | 41.8% |
The holdings listed exclude any temporary cash investments and equity index products.
1 The expense ratio shown is from the prospectus dated May 25, 2017, and represents estimated costs for the current fiscal year. For the six months ended July 31, 2017, the annualized expense ratio was 0.40%.
9
Precious Metals and Mining Fund
Performance Summary
All of the returns in this report represent past performance, which is not a guarantee of future results that may be achieved by the fund. (Current performance may be lower or higher than the performance data cited. For performance data current to the most recent month-end, visit our website at vanguard.com/performance.) Note, too, that both investment returns and principal value can fluctuate widely, so an investor’s shares, when sold, could be worth more or less than their original cost. The returns shown do not reflect taxes that a shareholder would pay on fund distributions or on the sale of fund shares.
Fiscal-Year Total Returns (%): January 31, 2007, Through July 31, 2017
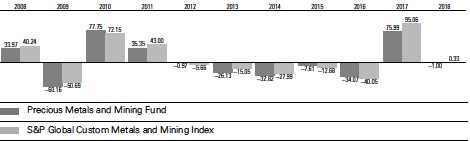
Note: For 2018, performance data reflect the six months ended July 31, 2017.
Average Annual Total Returns: Periods Ended June 30, 2017
This table presents returns through the latest calendar quarter—rather than through the end of the fiscal period.
Securities and Exchange Commission rules require that we provide this information.
| | | | |
| | Inception | One | Five | Ten |
| | Date | Year | Years | Years |
| Precious Metals and Mining Fund | 5/23/1984 | -7.84% | -6.96% | -6.11% |
See Financial Highlights for dividend and capital gains information.
10
Precious Metals and Mining Fund
Financial Statements (unaudited)
Statement of Net Assets
As of July 31, 2017
The fund reports a complete list of its holdings in regulatory filings four times in each fiscal year, at the quarter-ends. For the second and fourth fiscal quarters, the lists appear in the fund’s semiannual and annual reports to shareholders. For the first and third fiscal quarters, the fund files the lists with the Securities and Exchange Commission on Form N-Q. Shareholders can look up the fund’s Forms N-Q on the SEC’s website at sec.gov. Forms N-Q may also be reviewed and copied at the SEC’s Public Reference Room (see the back cover of this report for further information).
| | | |
| | | | Market |
| | | | Value• |
| | | Shares | ($000) |
| Common Stocks (97.1%) | | |
| Agricultural Products (2.0%) | |
| | Bunge Ltd. | 644,985 | 50,560 |
| |
| Copper (6.9%) | | |
| 1 | Nevsun Resources Ltd. | 35,974,070 | 97,239 |
| | Lundin Mining Corp. | 5,545,622 | 39,899 |
| ^ | Southern Copper Corp. | 678,330 | 26,686 |
| * | KAZ Minerals plc | 1,559,817 | 14,774 |
| * | Atalaya Mining plc | 100,000 | 181 |
| | | | 178,779 |
| Diversified Metals & Mining (7.9%) | |
| | BHP Billiton plc | 2,530,120 | 46,134 |
| | Independence Group | | |
| | NL | 17,654,527 | 42,649 |
| *,1 | Trevali Mining Corp. | 27,500,000 | 28,454 |
| | Grupo Mexico SAB de | | |
| | CV Class B | 7,870,822 | 25,639 |
| | BHP Billiton Ltd. | 1,210,990 | 25,221 |
| | Boliden AB | 421,370 | 13,229 |
| *,^ | Arizona Mining Inc. | 2,510,118 | 6,725 |
| *,1 | Neo Lithium Corp. | 8,000,000 | 6,224 |
| *,^ | Orla Mining Ltd. | 5,714,300 | 5,958 |
| *,^ | Balmoral Resources Ltd. | 5,552,174 | 3,028 |
| *,1 | Aguia Resources Ltd. | 7,705,882 | 2,285 |
| | | | 205,546 |
| Gold (63.3%) | | |
| | Franco-Nevada Corp. | 2,147,728 | 155,624 |
| | Newmont Mining Corp. | 4,010,906 | 149,085 |
| ^ | Randgold Resources | | |
| | Ltd. ADR | 1,162,627 | 108,055 |
| | Agnico Eagle Mines | | |
| | Ltd. | 2,095,594 | 97,885 |
| * | B2Gold Corp. | 37,190,786 | 93,721 |
| * | Endeavour Mining Corp. | 4,371,279 | 83,236 |
| | Barrick Gold Corp. | 4,500,843 | 76,109 |
| * | Kinross Gold Corp. | 17,737,989 | 73,080 |
| * | IAMGOLD Corp. | 12,254,292 | 66,149 |
| | | |
| | | | Market |
| | | | Value• |
| | | Shares | ($000) |
| | Royal Gold Inc. | 723,226 | 62,675 |
| | Goldcorp Inc. | 4,283,847 | 56,247 |
| *,^ | Pretium Resources Inc. | 5,540,263 | 53,242 |
| *,1 | SEMAFO Inc. | 20,803,148 | 50,225 |
| * | Torex Gold Resources | | |
| | Inc. | 2,665,118 | 48,589 |
| | Alamos Gold Inc. | 6,734,248 | 47,746 |
| *,^,1 | Premier Gold Mines Ltd. | 14,212,168 | 38,644 |
| | Agnico Eagle Mines Ltd. | | |
| | (Toronto Shares) | 814,545 | 38,031 |
| | OceanaGold Corp. | 13,494,858 | 36,910 |
| * | Saracen Mineral | | |
| | Holdings Ltd. | 31,715,213 | 34,353 |
| *,1 | Roxgold Inc. | 29,570,296 | 27,987 |
| * | Guyana Goldfields Inc. | 7,245,396 | 27,953 |
| *,^,1 | Alacer Gold Corp. | 16,682,469 | 27,832 |
| | Alamos Gold Inc. | | |
| | Class A | 3,627,542 | 25,692 |
| | Tahoe Resources Inc. | 4,678,633 | 25,592 |
| | AngloGold Ashanti Ltd. | 2,521,044 | 25,470 |
| | Osisko Gold Royalties | | |
| | Ltd. | 1,634,820 | 20,993 |
| *,^ | Dacian Gold Ltd. | 9,987,418 | 15,744 |
| | Tahoe Resources Inc. | | |
| | (Toronto Shares) | 2,689,463 | 14,712 |
| *,1 | Nighthawk Gold Corp. | 17,775,860 | 13,260 |
| * | Beadell Resources Ltd. | 58,424,423 | 8,709 |
| *,^ | Eldorado Gold Corp. | 3,643,850 | 7,725 |
| *,^ | Barkerville Gold Mines | | |
| | Ltd. | 9,369,455 | 6,839 |
| * | Gold Road Resources | | |
| | Ltd. | 12,341,066 | 6,390 |
| * | B2Gold Corp. | | |
| | (Toronto Shares) | 1,860,800 | 4,672 |
| | Eldorado Gold Corp. | | |
| | (Toronto Shares) | 1,910,914 | 4,046 |
| *,^ | Newcastle Gold Ltd. | 5,265,895 | 3,801 |
| | Regis Resources Ltd. | 1,189,405 | 3,666 |
11
Precious Metals and Mining Fund
| | | |
| | | | Market |
| | | | Value• |
| | | Shares | ($000) |
| * | Osisko Gold Royalties | | |
| | Warrants | | |
| | Exp. 02/26/2019 | 231,787 | 530 |
| * | Continental Gold Inc | | |
| | Warrants | | |
| | Exp. 11/27/2017 | 450,000 | 76 |
| * | Primero Mining Corp. | | |
| | Warrants | | |
| | Exp. 06/25/2018 | 638,250 | 10 |
| | | | 1,641,305 |
| Other (0.3%) | | |
| *,1,2 | Osisko Metals Inc. | 6,575,000 | 4,794 |
| *,2 | Bluestone Resources | | |
| | Inc. | 1,797,000 | 1,946 |
| *,2 | Barkerville Gold Mines | | |
| | Ltd. PP | 526,316 | 346 |
| * | Osisko Metals Inc. | | |
| | Warrants | | |
| | Exp. 07/18/2019 | 3,287,500 | 26 |
| *,2 | Americas Silver Corp | | |
| | Warrants | | |
| | Exp. 06/09/2021 | 7,108,333 | — |
| *,2 | Nighthawk Gold Corp. | | |
| | Warrants | | |
| | Exp. 08/29/2017 | 5,729,647 | — |
| * | Osisko Mining Inc. | | |
| | Warrants | | |
| | Exp. 08/25/2018 | 4,500,000 | — |
| * | NEO Lithium Placing | | |
| | Warrants | | |
| | Exp. 08/22/2018 | 4,000,000 | — |
| * | Barkerville Gold Mines | | |
| | Warrants | | |
| | Exp. 11/18/2018 | 263,158 | — |
| *,2 | Rescue Radio Corp. | 15,955 | — |
| | | | 7,112 |
| Precious Metals & Minerals (8.9%) | |
| *,^,1 | Dalradian Resources | | |
| | Inc. | 45,625,000 | 56,722 |
| | Fresnillo plc | 2,637,666 | 53,529 |
| *,^,1 | Osisko Mining Inc. | 13,904,193 | 50,186 |
| | Dominion Diamond | | |
| | Corp. | 2,672,872 | 37,603 |
| *,^ | Mountain Province | | |
| | Diamonds Inc. | 4,935,352 | 19,635 |
| | Lucara Diamond | | |
| | Corp. | 6,088,724 | 13,088 |
| | | | 230,763 |
| | | |
| | | | Market |
| | | | Value• |
| | | Shares | ($000) |
| Silver (7.8%) | | |
| 1 | Hochschild Mining plc | 25,522,604 | 106,640 |
| *,1 | Fortuna Silver Mines | | |
| | Inc. | 10,080,774 | 50,374 |
| * | MAG Silver Corp. | 1,936,573 | 26,592 |
| *,^ | First Majestic Silver | | |
| | Corp. | 1,409,994 | 11,604 |
| *,^,1 Americas Silver Corp. | 2,369,444 | 7,583 |
| | | | 202,793 |
| Total Common Stocks | | |
| (Cost $2,154,729) | | 2,516,858 |
| Precious Metals (0.1%) | | |
| * | Platinum Bullion | | |
| | (In Troy Ounces) | 2,009 | 1,889 |
| Total Precious Metals | | |
| (Cost $1,213) | | 1,889 |
| Temporary Cash Investment (5.7%) | |
| Money Market Fund (5.7%) | |
| 3,4 | Vanguard Market Liquidity | |
| | Fund, 1.217% | | |
| | (Cost $147,921) | 1,479,096 | 147,939 |
| Total Investments (102.9%) | |
| (Cost $2,303,863) | | 2,666,686 |
| Other Assets and Liabilities (-2.9%) | |
| Other Assets | | 4,643 |
| Liabilities 4 | | (78,665) |
| | | | (74,022) |
| Net Assets (100%) | | |
| Applicable to 243,887,865 outstanding | |
| $.001 par value shares of beneficial | |
| interest (unlimited authorization) | 2,592,664 |
| Net Asset Value Per Share | | $10.63 |
12
| |
| Precious Metals and Mining Fund | |
| |
| |
| |
| |
| | Amount |
| | ($000) |
| Statement of Assets and Liabilities | |
| Assets | |
| Investments in Securities, at Value | |
| Unaffiliated Issuers 5 | 1,950,298 |
| Affiliated Vanguard Funds | 147,939 |
| Other Affiliated Issuers | 568,449 |
| Total Investments in Securities | 2,666,686 |
| Investment in Vanguard | 162 |
| Receivables for Accrued Income | 326 |
| Receivables for Capital Shares Issued | 2,286 |
| Other Assets | 1,869 |
| Total Assets | 2,671,329 |
| Liabilities | |
| Payables for Investment Securities | |
| Purchased | 70 |
| Collateral for Securities on Loan | 66,970 |
| Payables to Investment Advisor | 1,066 |
| Payables for Capital Shares Redeemed | 2,965 |
| Payables to Vanguard | 5,869 |
| Other Liabilities | 1,725 |
| Total Liabilities | 78,665 |
| Net Assets | 2,592,664 |
At July 31, 2017, net assets consisted of:
| |
| | Amount |
| | ($000) |
| Paid-in Capital | 4,314,795 |
| Overdistributed Net Investment Income | (128,298) |
| Accumulated Net Realized Losses | (1,956,712) |
| Unrealized Appreciation (Depreciation) | |
| Investment Securities 5 | 362,823 |
| Foreign Currencies | 56 |
| Net Assets | 2,592,664 |
• See Note A in Notes to Financial Statements.
* Non-income-producing security.
^ Includes partial security positions on loan to broker-dealers. The total value of securities on loan is $60,444,000.
1 Considered an affiliated company of the fund as the fund owns more than 5% of the outstanding voting securities of such company.
2 Restricted securities totaling $7,086,000, representing 0.3% of net assets.
3 Affiliated money market fund available only to Vanguard funds and certain trusts and accounts managed by Vanguard. Rate shown is the 7-day yield.
4 Includes $66,970,000 of collateral received for securities on loan.
5 Includes precious metals.
ADR—American Depositary Receipt.
PP—Private Placement.
See accompanying Notes, which are an integral part of the Financial Statements.
13
Precious Metals and Mining Fund
Statement of Operations
| |
| | Six Months Ended |
| | July 31,2017 |
| | ($000) |
| Investment Income | |
| Income | |
| Dividends1 | 10,969 |
| Interest | 343 |
| Securities Lending—Net | 674 |
| Total Income | 11,986 |
| Expenses | |
| Investment Advisory Fees—Note B | |
| Basic Fee | 1,745 |
| Performance Adjustment | 383 |
| The Vanguard Group—Note C | |
| Management and Administrative | 2,532 |
| Marketing and Distribution | 202 |
| Custodian Fees | 65 |
| Shareholders’ Reports | 156 |
| Trustees’ Fees and Expenses | 3 |
| Total Expenses | 5,086 |
| Net Investment Income | 6,900 |
| Realized Net Gain (Loss) | |
| Investment Securities Sold | (41,576) |
| Foreign Currencies | (176) |
| Realized Net Gain (Loss) | (41,752) |
| Change in Unrealized Appreciation (Depreciation) | |
| Investment Securities | 3,265 |
| Foreign Currencies | 69 |
| Change in Unrealized Appreciation (Depreciation) | 3,334 |
| Net Increase (Decrease) in Net Assets Resulting from Operations | (31,518) |
| 1 Dividends are net of foreign withholding taxes of $890,000. | |
See accompanying Notes, which are an integral part of the Financial Statements.
14
Precious Metals and Mining Fund
Statement of Changes in Net Assets
| | |
| | Six Months Ended | Year Ended |
| | July 31, | January 31, |
| | 2017 | 2017 |
| | ($000) | ($000) |
| Increase (Decrease) in Net Assets | | |
| Operations | | |
| Net Investment Income | 6,900 | 15,861 |
| Realized Net Gain (Loss) | (41,752) | (289,478) |
| Change in Unrealized Appreciation (Depreciation) | 3,334 | 1,394,398 |
| Net Increase (Decrease) in Net Assets Resulting from Operations | (31,518) | 1,120,781 |
| Distributions | | |
| Net Investment Income | (591) | (39,024) |
| Realized Capital Gain | — | — |
| Total Distributions | (591) | (39,024) |
| Capital Share Transactions | | |
| Issued | 416,005 | 1,114,214 |
| Issued in Lieu of Cash Distributions | 540 | 36,059 |
| Redeemed | (404,245) | (1,084,078) |
| Net Increase (Decrease) from Capital Share Transactions | 12,300 | 66,195 |
| Total Increase (Decrease) | (19,809) | 1,147,952 |
| Net Assets | | |
| Beginning of Period | 2,612,473 | 1,464,521 |
| End of Period1 | 2,592,664 | 2,612,473 |
| 1 Net Assets—End of Period includes undistributed (overdistributed) net investment income of ($128,298,000) and ($143,537,000). |
See accompanying Notes, which are an integral part of the Financial Statements.
15
Precious Metals and Mining Fund
Financial Highlights
| | | | | | |
| Six Months | | | | | |
| | Ended | | | | | |
| For a Share Outstanding | July 31, | Year Ended January 31, |
| Throughout Each Period | 2017 | 2017 | 2016 | 2015 | 2014 | 2013 |
| Net Asset Value, Beginning of Period | $10.74 | $6.22 | $9.59 | $10.38 | $15.46 | $22.14 |
| Investment Operations | | | | | | |
| Net Investment Income | . 029 | . 0661,2 | .1751,3 | .130 | .2431 | .292 |
| Net Realized and Unrealized Gain (Loss) | | | | | | |
| on Investments | (.137) | 4.615 | (3.397) | (.920) | (5.315) | (5.962) |
| Total from Investment Operations | (.108) | 4.681 | (3.222) | (.790) | (5.072) | (5.670) |
| Distributions | | | | | | |
| Dividends from Net Investment Income | (. 002) | (.161) | (.148) | — | (. 007) | (.710) |
| Distributions from Realized Capital Gains | — | — | — | — | — | (.300) |
| Return of Capital | — | — | — | — | (.001) | — |
| Total Distributions | (. 002) | (.161) | (.148) | — | (. 008) | (1.010) |
| Net Asset Value, End of Period | $10.63 | $10.74 | $6.22 | $9.59 | $10.38 | $15.46 |
| |
| Total Return4 | -1.00% | 75.99% | -34.07% | -7.61% | -32.82% | -26.13% |
| |
| Ratios/Supplemental Data | | | | | | |
| Net Assets, End of Period (Millions) | $2,593 | $2,612 | $1,465 | $2,087 | $2,302 | $3,112 |
| Ratio of Total Expenses to | | | | | | |
| Average Net Assets5 | 0.40% | 0.43% | 0.35% | 0.29% | 0.25% | 0.26% |
| Ratio of Net Investment Income to | | | | | | |
| Average Net Assets | 0.55% | 0.65%2 | 2.22% 3 | 1.33% | 2.10% | 1.62% |
| Portfolio Turnover Rate | 37% | 29% | 8% | 62% | 34% | 30% |
The expense ratio, net investment income ratio, and turnover rate for the current period have been annualized.
1 Calculated based on average shares outstanding.
2 Net investment income per share and the ratio of net investment income to average net assets include $.012 and 0.12% respectively,
resulting from a special dividend from Lucara Diamond Corp. in September 2016.
3 Net investment income per share and the ratio of net investment income to average net assets include $.037 and 0.47%, respectively,
resulting from a spin-off from BHP Billiton plc in May 2015.
4 Total returns do not include account service fees that may have applied in the periods shown. Fund prospectuses provide information
about any applicable account service fees.
5 Includes performance-based investment advisory fee increases (decreases) of 0.03%, 0.06%, (0.02%), (0.08%), (0.09%), and (0.07%).
See accompanying Notes, which are an integral part of the Financial Statements.
16
Precious Metals and Mining Fund
Notes to Financial Statements
Vanguard Precious Metals and Mining Fund is registered under the Investment Company Act of 1940 as an open-end investment company, or mutual fund. The fund invests in securities of foreign issuers, which may subject it to investment risks not normally associated with investing in securities of U.S. corporations.
A. The following significant accounting policies conform to generally accepted accounting principles for U.S. investment companies. The fund consistently follows such policies in preparing its financial statements.
1. Security Valuation: Securities are valued as of the close of trading on the New York Stock Exchange (generally 4 p.m., Eastern time) on the valuation date. Equity securities are valued at the latest quoted sales prices or official closing prices taken from the primary market in which each security trades; such securities not traded on the valuation date are valued at the mean of the latest quoted bid and asked prices. Securities for which market quotations are not readily available, or whose values have been affected by events occurring before the fund’s pricing time but after the close of the securities’ primary markets, are valued at their fair values calculated according to procedures adopted by the board of trustees. These procedures include obtaining quotations from an independent pricing service, monitoring news to identify significant market- or security-specific events, and evaluating changes in the values of foreign market proxies (for example, ADRs, futures contracts, or exchange-traded funds), between the time the foreign markets close and the fund’s pricing time. When fair-value pricing is employed, the prices of securities used by a fund to calculate its net asset value may differ from quoted or published prices for the same securities. Precious metals are valued at the latest quoted bid prices. Investments in Vanguard Market Liquidity Fund are valued at that fund’s net asset value.
2. Foreign Currency: Securities and other assets and liabilities denominated in foreign currencies are translated into U.S. dollars using exchange rates obtained from an independent third party as of the fund’s pricing time on the valuation date. Realized gains (losses) and unrealized appreciation (depreciation) on investment securities include the effects of changes in exchange rates since the securities were purchased, combined with the effects of changes in security prices. Fluctuations in the value of other assets and liabilities resulting from changes in exchange rates are recorded as unrealized foreign currency gains (losses) until the assets or liabilities are settled in cash, at which time they are recorded as realized foreign currency gains (losses).
3. Federal Income Taxes: The fund intends to continue to qualify as a regulated investment company and distribute all of its taxable income. Management has analyzed the fund’s tax positions taken for all open federal income tax years (January 31, 2014–2017), and for the period ended July 31, 2017, and has concluded that no provision for federal income tax is required in the fund’s financial statements.
4. Distributions: Distributions to shareholders are recorded on the ex-dividend date.
17
Precious Metals and Mining Fund
5. Securities Lending: To earn additional income, the fund lends its securities to qualified institutional borrowers. Security loans are subject to termination by the fund at any time, and are required to be secured at all times by collateral in an amount at least equal to the market value of securities loaned. Daily market fluctuations could cause the value of loaned securities to be more or less than the value of the collateral received. When this occurs, the collateral is adjusted and settled on the next business day. The fund further mitigates its counterparty risk by entering into securities lending transactions only with a diverse group of prequalified counterparties, monitoring their financial strength, and entering into master securities lending agreements with its counterparties. The master securities lending agreements provide that, in the event of a counterparty’s default (including bankruptcy), the fund may terminate any loans with that borrower, determine the net amount owed, and sell or retain the collateral up to the net amount owed to the fund; however, such actions may be subject to legal proceedings. While collateral mitigates counterparty risk, in the event of a default, the fund may experience delays and costs in recovering the securities loaned. The fund invests cash collateral received in Vanguard Market Liquidity Fund, and records a liability in the Statement of Assets and Liabilities for the return of the collateral, during the period the securities are on loan. Securities lending income represents fees charged to borrowers plus income earned on invested cash collateral, less expenses associated with the loan. During the term of the loan, the fund is entitled to all distributions made on or in respect of the loaned securities.
6. Credit Facility: The fund and certain other funds managed by The Vanguard Group (“Vanguard”) participate in a $3.1 billion committed credit facility provided by a syndicate of lenders pursuant to a credit agreement that may be renewed annually; each fund is individually liable for its borrowings, if any, under the credit facility. Borrowings may be utilized for temporary and emergency purposes, and are subject to the fund’s regulatory and contractual borrowing restrictions. The participating funds are charged administrative fees and an annual commitment fee of 0.10% of the undrawn amount of the facility; these fees are allocated to the funds based on a method approved by the fund’s board of trustees and included in Management and Administrative expenses on the fund’s Statement of Operations. Any borrowings under this facility bear interest at a rate based upon the higher of the one-month London Interbank Offered Rate, federal funds effective rate, or overnight bank funding rate plus an agreed-upon spread.
The fund had no borrowings outstanding at July 31, 2017, or at any time during the period then ended.
7. Other: Dividend income is recorded on the ex-dividend date. Interest income includes income distributions received from Vanguard Market Liquidity Fund and is accrued daily. Security transactions are accounted for on the date securities are bought or sold. Costs used to determine realized gains (losses) on the sale of investment securities are those of the specific securities sold.
B. M&G Investment Management Limited provides investment advisory services to the fund for a fee calculated at an annual percentage rate of average net assets. The basic fee is subject to quarterly adjustments based on the fund’s performance relative to the S&P Global Custom Metals and Mining Index for the preceding three years. For the six months ended July 31, 2017, the investment advisory fee represented an effective annual basic rate of 0.14% of the fund’s average net assets before an increase of $383,000 (0.03%) based on performance.
18
Precious Metals and Mining Fund
C. In accordance with the terms of a Funds’ Service Agreement (the “FSA”) between Vanguard and the fund, Vanguard furnishes to the fund corporate management, administrative, marketing, and distribution services at Vanguard’s cost of operations (as defined by the FSA). These costs of operations are allocated to the fund based on methods and guidelines approved by the board of trustees. Vanguard does not require reimbursement in the current period for certain costs of operations (such as deferred compensation/benefits and risk/insurance costs); the fund’s liability for these costs of operations is included in Payables to Vanguard on the Statement Assets and Liabilities.
Upon the request of Vanguard, the fund may invest up to 0.40% of its net assets as capital in Vanguard. At July 31, 2017, the fund had contributed to Vanguard capital in the amount of $162,000, representing 0.01% of the fund’s net assets and 0.06% of Vanguard’s capitalization. The fund’s trustees and officers are also directors and employees, respectively, of Vanguard.
D. Various inputs may be used to determine the value of the fund’s investments. These inputs are summarized in three broad levels for financial statement purposes. The inputs or methodologies used to value securities are not necessarily an indication of the risk associated with investing in those securities.
Level 1—Quoted prices in active markets for identical securities.
Level 2—Other significant observable inputs (including quoted prices for similar securities, interest rates, prepayment speeds, credit risk, etc.).
Level 3—Significant unobservable inputs (including the fund’s own assumptions used to determine the fair value of investments).
The following table summarizes the market value of the fund’s investments as of July 31, 2017, based on the inputs used to value them:
| | | |
| | Level 1 | Level 2 | Level 3 |
| Investments | ($000) | ($000) | ($000) |
| Common Stocks | 2,110,772 | 406,086 | — |
| Precious Metals | — | 1,889 | — |
| Temporary Cash Investments | 147,939 | — | — |
| Total | 2,258,711 | 407,975 | — |
E. Distributions are determined on a tax basis and may differ from net investment income and realized capital gains for financial reporting purposes. Differences may be permanent or temporary. Permanent differences are reclassified among capital accounts in the financial statements to reflect their tax character. Temporary differences arise when certain items of income, expense, gain, or loss are recognized in different periods for financial statement and tax purposes; such differences are primarily attributed to the tax treatment of unrealized appreciation on passive foreign investment companies. These differences will reverse at some time in the future. Differences in classification may also result from the treatment of short-term gains as ordinary income for tax purposes.
19
Precious Metals and Mining Fund
During the six months ended July 31, 2017, the fund realized net foreign currency losses of $176,000 which decreased distributable net income for tax purposes; accordingly, such losses have been reclassified from accumulated net realized losses to overdistributed net investment income. Certain of the fund’s investments are in securities considered to be passive foreign investment companies, for which any unrealized appreciation and/or realized gains are required to be included in distributable net investment income for tax purposes. During the six months ended July 31, 2017, the fund realized gains on the sale of passive foreign investment companies of $9,106,000, which have been included in current and prior periods’ taxable income; accordingly, such gains have been reclassified from accumulated net realized losses to overdistributed net investment income. Passive foreign investment companies had unrealized appreciation of $127,219,000 at July 31, 2017.
The fund’s tax-basis capital gains and losses are determined only at the end of each fiscal year. For tax purposes, at January 31, 2017, the fund had available capital losses totaling $1,906,062,000 that may be carried forward indefinitely to offset future net capital gains. The fund will use these capital losses to offset net taxable capital gains, if any, realized during the year ending January 31, 2018; should the fund realize net capital losses for the year, the losses will be added to the loss carryforward balance above.
At July 31, 2017, the cost of investment securities for tax purposes was $2,431,082,000. Net unrealized appreciation of investment securities for tax purposes was $235,604,000, consisting of unrealized gains of $426,517,000 on securities that had risen in value since their purchase and $190,913,000 in unrealized losses on securities that had fallen in value since their purchase.
F. During the six months ended July 31, 2017, the fund purchased $482,041,000 of investment securities and sold $451,738,000 of investment securities, other than temporary cash investments.
G. Capital shares issued and redeemed were:
| | |
| | Six Months Ended | Year Ended |
| | July 31, 2017 | January 31, 2017 |
| | Shares | Shares |
| | (000) | (000) |
| Issued | 39,858 | 111,872 |
| Issued in Lieu of Cash Distributions | 52 | 4,303 |
| Redeemed | (39,255) | (108,532) |
| Net Increase (Decrease) in Shares Outstanding | 655 | 7,643 |
20
Precious Metals and Mining Fund
H. Certain of the fund’s investments are in companies that are considered to be affiliated companies of the fund because the fund owns more than 5% of the outstanding voting securities of the company or the issuer is another member of The Vanguard Group. Transactions during the period in securities of these companies were as follows:
| | | | | | |
| | | Current Period Transactions | |
| | Jan. 31, | | Proceeds | | | July 31, |
| | 2017 | | from | | Capital Gain | 2017 |
| | Market | Purchases | Securities | | Distributions | Market |
| | Value | at Cost | Sold1 | Income | Received | Value |
| | ($000) | ($000) | ($000) | ($000) | ($000) | ($000) |
| Aguia Resources Ltd. | 2,373 | — | — | — | — | 2,285 |
| Alacer Gold Corp. | NA2 | 16,370 | — | — | — | 27,832 |
| Americas Silver Corp. | 8,048 | — | — | — | — | 7,583 |
| Dalradian Resources Inc. | 46,633 | — | — | — | — | 56,722 |
| Dominion Diamond Corp. | 65,235 | — | 46,334 | 520 | — | NA3 |
| Fortuna Silver Mines Inc. | NA2 | 17,581 | — | — | — | 50,374 |
| Hochschild Mining plc | 83,056 | — | 3,903 | 369 | — | 106,640 |
| Neo Lithium Corp. | — | 6,718 | — | — | — | 6,224 |
| Nevsun Resources Ltd. | 113,348 | — | — | 612 | — | 97,239 |
| Nighthawk Gold Corp. | NA 2 | 6,094 | — | — | — | 13,260 |
| Osisko Metals Inc. | — | 4,071 | — | — | — | 4,794 |
| Osisko Mining Inc. | 24,355 | 11,703 | — | — | — | 50,186 |
| Premier Gold Mines Ltd. | 32,001 | — | — | — | — | 38,644 |
| Roxgold Inc. | 34,541 | — | — | — | — | 27,987 |
| SEMAFO Inc. | 82,882 | 8,641 | 20,723 | — | — | 50,225 |
| Trevali Mining Corp. | — | 24,739 | — | — | — | 28,454 |
| Vanguard Market Liquidity | | | | | | |
| Fund | 163,010 | NA4 | NA 4 | 343 | — | 147,939 |
| Total | 655,482 | | | 1,844 | — | 716,388 |
1 Includes net realized gain (loss) on affiliated investment securities sold of (36,668,000).
2 Not applicable—at January, 31, 2017, the issuer was not an affiliated company of the fund.
3 Not applicable—at July, 31, 2017, the security was still held, but the issuer was no longer an affiliated company of the fund.
4 Not applicable—purchases and sales are for temporary cash investment purposes.
I. Management has determined that no material events or transactions occurred subsequent to July 31, 2017, that would require recognition or disclosure in these financial statements.
21
About Your Fund’s Expenses
As a shareholder of the fund, you incur ongoing costs, which include costs for portfolio management, administrative services, and shareholder reports (like this one), among others. Operating expenses, which are deducted from a fund’s gross income, directly reduce the investment return of the fund.
A fund’s expenses are expressed as a percentage of its average net assets. This figure is known as the expense ratio. The following examples are intended to help you understand the ongoing costs (in dollars) of investing in your fund and to compare these costs with those of other mutual funds. The examples are based on an investment of $1,000 made at the beginning of the period shown and held for the entire period.
The accompanying table illustrates your fund’s costs in two ways:
• Based on actual fund return. This section helps you to estimate the actual expenses that you paid over the period. The ”Ending Account Value“ shown is derived from the fund‘s actual return, and the third column shows the dollar amount that would have been paid by an investor who started with $1,000 in the fund. You may use the information here, together with the amount you invested, to estimate the expenses that you paid over the period.
To do so, simply divide your account value by $1,000 (for example, an $8,600 account value divided by $1,000 = 8.6), then multiply the result by the number given for your fund under the heading ”Expenses Paid During Period.“
• Based on hypothetical 5% yearly return. This section is intended to help you compare your fund‘s costs with those of other mutual funds. It assumes that the fund had a yearly return of 5% before expenses, but that the expense ratio is unchanged. In this case—because the return used is not the fund’s actual return—the results do not apply to your investment. The example is useful in making comparisons because the Securities and Exchange Commission requires all mutual funds to calculate expenses based on a 5% return. You can assess your fund’s costs by comparing this hypothetical example with the hypothetical examples that appear in shareholder reports of other funds.
Note that the expenses shown in the table are meant to highlight and help you compare ongoing costs only and do not reflect transaction costs incurred by the fund for buying and selling securities. Further, the expenses do not include any purchase, redemption, or account service fees described in the fund prospectus. If such fees were applied to your account, your costs would be higher. Your fund does not carry a “sales load.”
The calculations assume no shares were bought or sold during the period. Your actual costs may have been higher or lower, depending on the amount of your investment and the timing of any purchases or redemptions.
You can find more information about the fund’s expenses, including annual expense ratios, in the Financial Statements section of this report. For additional information on operating expenses and other shareholder costs, please refer to your fund’s current prospectus.
22
| | | |
| Six Months Ended July 31, 2017 | | | |
| | Beginning | Ending | Expenses |
| | Account Value | Account Value | Paid During |
| Precious Metals and Mining Fund | 1/31/2017 | 7/31/2017 | Period |
| Based on Actual Fund Return | $1,000.00 | $989.99 | $1.97 |
| Based on Hypothetical 5% Yearly Return | 1,000.00 | 1,022.81 | 2.01 |
The calculations are based on expenses incurred in the most recent six-month period. The fund’s annualized six-month expense ratio for
that period is 0.40%. The dollar amounts shown as “Expenses Paid” are equal to the annualized expense ratio multiplied by the average
account value over the period, multiplied by the number of days in the most recent six-month period, then divided by the number of days in
the most recent 12-month period (181/365).
23
Trustees Approve Advisory Arrangement
The board of trustees of Vanguard Precious Metals and Mining Fund has renewed the fund’s investment advisory arrangement with M&G Investment Management Limited (M&G). The board determined that renewing the fund’s advisory arrangement was in the best interests of the fund and its shareholders.
The board based its decision upon an evaluation of the advisor’s investment staff, portfolio management process, and performance. This evaluation included information provided to the board by Vanguard’s Portfolio Review Department, which is responsible for fund and advisor oversight and product management. The Portfolio Review Department met regularly with the advisor and made monthly presentations to the board during the fiscal year that directed the board’s focus to relevant information and topics.
The board, or an investment committee made up of board members, also received information throughout the year during advisor presentations. For each advisor presentation, the board was provided with letters and reports that included information about, among other things, the advisory firm and the advisor’s assessment of the investment environment, portfolio performance, and portfolio characteristics.
In addition, the board received monthly reports, which included a Market and Economic Report, a Fund Dashboard Monthly Summary, and a Fund Performance Report.
Prior to their meeting, the trustees were provided with a memo and materials that summarized the information they received over the course of the year. They also considered the factors discussed below, among others. However, no single factor determined whether the board approved the arrangement. Rather, it was the totality of the circumstances that drove the board’s decision.
Nature, extent, and quality of services
The board reviewed the quality of the fund’s investment management services over both the short and long term and took into account the organizational depth and stability of the advisor. The board considered that M&G, founded in 1931, offers a broad range of investment products. M&G seeks to identify mining companies with high-quality reserves that can be mined profitably at low all-in sustaining costs, quality management teams with a track record of success in the industry, and expansion projects that will increase reserves and create value over the long term. Valuation factors are also considered alongside technical factors such as ore quality and the efficiency of mine operations. M&G has advised the fund since its inception in 1984.
The board concluded that the advisor’s experience, stability, depth, and performance, among other factors, warranted continuation of the advisory arrangement.
Investment performance
The board considered the short- and long-term performance of the fund, including any periods of outperformance or underperformance compared with a relevant benchmark index and peer group. The board concluded that the performance was such that the advisory arrangement should continue. Information about the fund’s most recent performance can be found in the Performance Summary section of this report.
24
Cost
The board concluded that the fund’s expense ratio was well below the average expense ratio charged by funds in its peer group and that the fund’s advisory fee rate was also well below its peer-group average. Information about the fund’s expense ratio appears in the About Your Fund’s Expenses section of this report as well as in the Financial Statements section, which also includes information about the advisory fee rate.
The board did not consider the profitability of M&G in determining whether to approve the advisory fee, because M&G is independent of Vanguard and the advisory fee is the result of arm’s-length negotiations.
The benefit of economies of scale
The board concluded that the fund’s shareholders benefit from economies of scale because of breakpoints in the advisory fee schedule. The breakpoints reduce the effective rate of the fee as the fund’s assets increase.
The board will consider whether to renew the advisory arrangement again after a one-year period.
25
Glossary
Beta. A measure of the magnitude of a fund’s past share-price fluctuations in relation to the ups and downs of a given market index. The index is assigned a beta of 1.00. Compared with a given index, a fund with a beta of 1.20 typically would have seen its share price rise or fall by 12% when the index rose or fell by 10%. For this report, beta is based on returns over the past 36 months for both the fund and the index. Note that a fund’s beta should be reviewed in conjunction with its R-squared (see definition). The lower the R-squared, the less correlation there is between the fund and the index, and the less reliable beta is as an indicator of volatility.
Dividend Yield. Dividend income earned by stocks, expressed as a percentage of the aggregate market value (or of net asset value, for a fund). The yield is determined by dividing the amount of the annual dividends by the aggregate value (or net asset value) at the end of the period. For a fund, the dividend yield is based solely on stock holdings and does not include any income produced by other investments.
Earnings Growth Rate. The average annual rate of growth in earnings over the past five years for the stocks now in a fund.
Equity Exposure. A measure that reflects a fund’s investments in stocks and stock futures. Any holdings in short-term reserves are excluded.
Expense Ratio. A fund’s total annual operating expenses expressed as a percentage of the fund’s average net assets. The expense ratio includes management and administrative expenses, but does not include the transaction costs of buying and selling portfolio securities.
Foreign Holdings. The percentage of a fund represented by securities or depositary receipts of companies based outside the United States.
Inception Date. The date on which the assets of a fund (or one of its share classes) are first invested in accordance with the fund’s investment objective. For funds with a subscription period, the inception date is the day after that period ends. Investment performance is measured from the inception date.
Median Market Cap. An indicator of the size of companies in which a fund invests; the midpoint of market capitalization (market price x shares outstanding) of a fund’s stocks, weighted by the proportion of the fund’s assets invested in each stock. Stocks representing half of the fund’s assets have market capitalizations above the median, and the rest are below it.
Price/Book Ratio. The share price of a stock divided by its net worth, or book value, per share. For a fund, the weighted average price/book ratio of the stocks it holds.
Price/Earnings Ratio. The ratio of a stock’s current price to its per-share earnings over the past year. For a fund, the weighted average P/E of the stocks it holds. P/E is an indicator of market expectations about corporate prospects; the higher the P/E, the greater the expectations for a company’s future growth.
R-Squared. A measure of how much of a fund’s past returns can be explained by the returns from the market in general, as measured by a given index. If a fund’s total returns were precisely synchronized with an index’s returns, its R-squared would be 1.00. If the fund’s returns bore no relationship to the index’s returns, its R-squared would be 0. For this report, R-squared is based on returns over the past 36 months for both the fund and the index.
26
Return on Equity. The annual average rate of return generated by a company during the past five years for each dollar of shareholder’s equity (net income divided by shareholder’s equity). For a fund, the weighted average return on equity for the companies whose stocks it holds.
Short-Term Reserves. The percentage of a fund invested in highly liquid, short-term securities that can be readily converted to cash.
Turnover Rate. An indication of the fund’s trading activity. Funds with high turnover rates incur higher transaction costs and may be more likely to distribute capital gains (which may be taxable to investors). The turnover rate excludes in-kind transactions, which have minimal impact on costs.
27
The Global Industry Classification Standard (“GICS”) was developed by and is the exclusive property and a service mark of MSCI Inc. (“MSCI”) and Standard and Poor’s, a division of McGraw-Hill Companies, Inc. (“S&P”), and is licensed for use by Vanguard. Neither MSCI, S&P nor any third party involved in making or compiling the GICS or any GICS classification makes any express or implied warranties or representations with respect to such standard or classification (or the results to be obtained by the use thereof), and all such parties hereby expressly disclaim all warranties of originality, accuracy, completeness, merchantability or fitness for a particular purpose with respect to any such standard or classification. Without limiting any of the foregoing, in no event shall MSCI, S&P, any of its affiliates or any third party involved in making or compiling the GICS or any GICS classification have any liability for any direct, indirect, special, punitive, consequential or any other damages (including lost profits) even if notified of the possibility of such damages.
28
This page intentionally left blank.
This page intentionally left blank.
The People Who Govern Your Fund
The trustees of your mutual fund are there to see that the fund is operated and managed in your best interests since, as a shareholder, you are a part owner of the fund. Your fund’s trustees also serve on the board of directors of The Vanguard Group, Inc., which is owned by the Vanguard funds and provides services to them on an at-cost basis.
A majority of Vanguard’s board members are independent, meaning that they have no affiliation with Vanguard or the funds they oversee, apart from the sizable personal investments they have made as private individuals. The independent board members have distinguished backgrounds in business, academia, and public service. Each of the trustees and executive officers oversees 195 Vanguard funds.
Information for each trustee and executive officer of the fund appears below. The mailing address of the trustees and officers is P.O. Box 876, Valley Forge, PA 19482. More information about the trustees is in the Statement of Additional Information, which can be obtained, without charge, by contacting Vanguard at 800-662-7447, or online at vanguard.com.
Interested Trustee1
F. William McNabb III
Born 1957. Trustee Since July 2009. Chairman of the Board. Principal Occupation(s) During the Past Five Years and Other Experience: Chairman of the Board of The Vanguard Group, Inc., and of each of the investment companies served by The Vanguard Group, since January 2010; Chief Executive Officer and Director of The Vanguard Group and President and Chief Executive Officer of each of the investment companies served by The Vanguard Group, since 2008; Director of Vanguard Marketing Corporation; President of The Vanguard Group (2008–2017); Managing Director of The Vanguard Group (1995–2008).
Independent Trustees
Emerson U. Fullwood
Born 1948. Trustee Since January 2008. Principal Occupation(s) During the Past Five Years and Other Experience: Executive Chief Staff and Marketing Officer for North America and Corporate Vice President (retired 2008) of Xerox Corporation (document management products and services); Executive in Residence and 2009–2010 Distinguished Minett Professor at the Rochester Institute of Technology; Lead Director of SPX FLOW, Inc. (multi-industry manufacturing); Director of the United Way of Rochester, the University of Rochester Medical Center, Monroe Community College Foundation, North Carolina A&T University, and Roberts Wesleyan College; Trustee of the University of Rochester.
Rajiv L. Gupta
Born 1945. Trustee Since December 2001.2 Principal Occupation(s) During the Past Five Years and Other Experience: Chairman and Chief Executive Officer (retired 2009) and President (2006–2008) of Rohm and Haas Co. (chemicals); Director of Arconic Inc. (diversified manufacturer), HP Inc. (printer and personal computer manufacturing), and Delphi Automotive plc (automotive components); Senior Advisor at New Mountain Capital.
Amy Gutmann
Born 1949. Trustee Since June 2006. Principal Occupation(s) During the Past Five Years and Other Experience: President of the University of Pennsylvania; Christopher H. Browne
1 Mr. McNabb is considered an “interested person,” as defined in the Investment Company Act of 1940, because he is an officer of the Vanguard funds.
2 December 2002 for Vanguard Equity Income Fund, the Vanguard Municipal Bond Funds, and the Vanguard State Tax-Exempt Funds.
Distinguished Professor of Political Science, School of Arts and Sciences, and Professor of Communication, Annenberg School for Communication, with secondary faculty appointments in the Department of Philosophy, School of Arts and Sciences, and at the Graduate School of Education, University of Pennsylvania; Trustee of the National Constitution Center.
JoAnn Heffernan Heisen
Born 1950. Trustee Since July 1998. Principal Occupation(s) During the Past Five Years and Other Experience: Corporate Vice President and Member of the Executive Committee (1997–2008), Chief Global Diversity Officer (retired 2008), Vice President and Chief Information Officer (1997–2006), Controller (1995–1997), Treasurer (1991–1995), and Assistant Treasurer (1989–1991) of Johnson & Johnson (pharmaceuticals/medical devices/ consumer products); Director of Skytop Lodge Corporation (hotels) and the Robert Wood Johnson Foundation; Member of the Advisory Board of the Institute for Women’s Leadership at Rutgers University.
F. Joseph Loughrey
Born 1949. Trustee Since October 2009. Principal Occupation(s) During the Past Five Years and Other Experience: President and Chief Operating Officer (retired 2009) of Cummins Inc. (industrial machinery); Chairman of the Board of Hillenbrand, Inc. (specialized consumer services), Oxfam America, and the Lumina Foundation for Education; Director of the V Foundation for Cancer Research; Member of the Advisory Council for the College of Arts and Letters and Chair of the Advisory Board to the Kellogg Institute for International Studies, both at the University of Notre Dame.
Mark Loughridge
Born 1953. Trustee Since March 2012. Principal Occupation(s) During the Past Five Years and Other Experience: Senior Vice President and Chief Financial Officer (retired 2013) at IBM (information technology services); Fiduciary Member of IBM’s Retirement Plan Committee (2004–2013); Director of the Dow Chemical Company; Member of the Council on Chicago Booth.
Scott C. Malpass
Born 1962. Trustee Since March 2012. Principal Occupation(s) During the Past Five Years and Other Experience: Chief Investment Officer and Vice President at the University of Notre Dame; Assistant Professor of Finance at the Mendoza College of Business at Notre Dame; Member of the Notre Dame 403(b) Investment Committee, the Board of Advisors for Spruceview Capital Partners, the Board of Catholic Investment Services, Inc. (investment advisor), and the Board of Superintendence of the Institute for the Works of Religion; Chairman of the Board of TIFF Advisory Services, Inc. (investment advisor).
André F. Perold
Born 1952. Trustee Since December 2004. Principal Occupation(s) During the Past Five Years and Other Experience: George Gund Professor of Finance and Banking, Emeritus at the Harvard Business School (retired 2011); Chief Investment Officer and Co-Managing Partner of HighVista Strategies LLC (private investment firm); Overseer of the Museum of Fine Arts Boston.
Peter F. Volanakis
Born 1955. Trustee Since July 2009. Principal Occupation(s) During the Past Five Years and Other Experience: President and Chief Operating Officer (retired 2010) of Corning Incorporated (communications equipment); Chairman of the Board of Trustees of Colby-Sawyer College; Member of the Board of Hypertherm, Inc. (industrial cutting systems, software, and consumables).
Executive Officers
Glenn Booraem
Born 1967. Investment Stewardship Officer Since February 2017. Principal Occupation(s) During the Past Five Years and Other Experience: Principal of The Vanguard Group, Inc.; Treasurer (2015–2017), Controller (2010–2015), and Assistant Controller (2001–2010) of each of the investment companies served by The Vanguard Group.
Thomas J. Higgins
Born 1957. Chief Financial Officer Since September 2008. Principal Occupation(s) During the Past Five Years and Other Experience: Principal of The Vanguard Group, Inc.; Chief Financial Officer of each of the investment companies served by The Vanguard Group; Treasurer of each of the investment companies served by The Vanguard Group (1998–2008).
Peter Mahoney
Born 1974. Controller Since May 2015. Principal Occupation(s) During the Past Five Years and Other Experience: Principal of The Vanguard Group, Inc.; Controller of each of the investment companies served by The Vanguard Group; Head of International Fund Services at The Vanguard Group (2008–2014).
Anne E. Robinson
Born 1970. Secretary Since September 2016. Principal Occupation(s) During the Past Five Years and Other Experience: Managing Director of The Vanguard Group, Inc.; General Counsel of The Vanguard Group; Secretary of The Vanguard Group and of each of the investment companies served by The Vanguard Group; Director and Senior Vice President of Vanguard Marketing Corporation; Managing Director and General Counsel of Global Cards and Consumer Services at Citigroup (2014–2016); Counsel at American Express (2003–2014).
Michael Rollings
Born 1963. Treasurer Since February 2017. Principal Occupation(s) During the Past Five Years and Other Experience: Managing Director of The Vanguard Group, Inc.; Treasurer of each of the investment companies served by The Vanguard Group; Director of Vanguard Marketing Corporation; Executive Vice President and Chief Financial Officer of MassMutual Financial Group (2006–2016).
| |
| Vanguard Senior Management Team |
| |
| Mortimer J. Buckley | James M. Norris |
| John James | Thomas M. Rampulla |
| Martha G. King | Glenn W. Reed |
| John T. Marcante | Karin A. Risi |
| Chris D. McIsaac | Gregory Davis |
|
| Chairman Emeritus and Senior Advisor |
| |
| John J. Brennan |
| Chairman, 1996–2009 |
| Chief Executive Officer and President, 1996–2008 |
| |
| |
| Founder |
| |
| John C. Bogle |
| Chairman and Chief Executive Officer, 1974–1996 |
|  |
| P.O. Box 2600 |
| Valley Forge, PA 19482-2600 |
| |
| |
| |
| Connect with Vanguard® > vanguard.com |
| |
| |
| |
| Fund Information > 800-662-7447 |
| Direct Investor Account Services > 800-662-2739 |
| Institutional Investor Services > 800-523-1036 |
| Text Telephone for People |
| Who Are Deaf or Hard of Hearing> 800-749-7273 |
| |
| This material may be used in conjunction |
| with the offering of shares of any Vanguard |
| fund only if preceded or accompanied by |
| the fund’s current prospectus. |
| |
| All comparative mutual fund data are from Lipper, a |
| Thomson Reuters Company, or Morningstar, Inc., unless |
| otherwise noted. |
| |
| You can obtain a free copy of Vanguard’s proxy voting |
| guidelines by visiting vanguard.com/proxyreporting or by |
| calling Vanguard at 800-662-2739. The guidelines are |
| also available from the SEC’s website, sec.gov. In |
| addition, you may obtain a free report on how your fund |
| voted the proxies for securities it owned during the 12 |
| months ended June 30. To get the report, visit either |
| vanguard.com/proxyreporting or sec.gov. |
| |
| You can review and copy information about your fund at |
| the SEC’s Public Reference Room in Washington, D.C. To |
| find out more about this public service, call the SEC at |
| 202-551-8090. Information about your fund is also |
| available on the SEC’s website, and you can receive |
| copies of this information, for a fee, by sending a |
| request in either of two ways: via email addressed to |
| publicinfo@sec.gov or via regular mail addressed to the |
| Public Reference Section, Securities and Exchange |
| Commission, Washington, DC 20549-1520. |
| © 2017 The Vanguard Group, Inc. |
| All rights reserved. |
| Vanguard Marketing Corporation, Distributor. |
| |
| Q532 092017 |
Semiannual Report | July 31, 2017
Vanguard Health Care Fund
A new format, unwavering commitment
As you begin reading this report, you’ll notice that we’ve made some improvements to the opening sections—based on feedback from you, our clients.
Page 1 starts with a new ”Your Fund’s Performance at a Glance,” a concise, handy summary of how your fund performed during the period.
In the renamed ”Chairman’s Perspective,” Bill McNabb will focus on enduring principles and investment insights.
We’ve modified some tables, and eliminated some redundancy, but we haven’t removed any information.
At Vanguard, we’re always looking for better ways to communicate and to help you make sound investment decisions. Thank you for entrusting your assets to us.
| |
| Contents | |
| Your Fund’s Performance at a Glance. | 1 |
| Chairman’s Perspective. | 2 |
| Advisor’s Report. | 6 |
| Fund Profile. | 10 |
| Performance Summary. | 12 |
| Financial Statements. | 13 |
| About Your Fund’s Expenses. | 26 |
| Trustees Approve Advisory Arrangement. | 28 |
| Glossary. | 30 |
Please note: The opinions expressed in this report are just that—informed opinions. They should not be considered promises or advice. Also, please keep in mind that the information and opinions cover the period through the date on the front of this report. Of course, the risks of investing in your fund are spelled out in the prospectus.
See the Glossary for definitions of investment terms used in this report.
About the cover: No matter what language you speak, Vanguard has one consistent message and set of principles. Our primary focus is on you, our clients. We conduct our business with integrity as a faithful steward of your assets. This message is shown translated into seven languages, reflecting our expanding global presence.
Your Fund’s Performance at a Glance
• For the six months ended July 31, 2017, Vanguard Health Care Fund returned 15.36% for Investor Shares and 15.39% for Admiral Shares. The fund’s results surpassed the 13.41% return of the benchmark MSCI All Country World Health Care Index and the 14.09% average return of peers.
• The fund’s advisor, Wellington Management Company llp, takes a value-oriented approach to its management of the portfolio. It aims to invest in companies it views as temporarily out of favor or whose long-term earnings potential is undervalued.
• Health care stocks were among the period’s strongest performers. Pharmaceutical and biotechnology companies produced innovative and profitable drugs, and merger and acquisition activity also boosted the sector.
• Biotechnology companies powered the fund’s outperformance, advancing about 34% compared to about 14% for those included in the benchmark. Pharmaceuticals, equipment and supply firms, and providers and service companies also made meaningful contributions.
| | | |
| Total Returns: Six Months Ended July 31, 2017 | | | |
| | | | Total |
| | | | Returns |
| Vanguard Health Care Fund | | | |
| Investor Shares | | | 15.36% |
| Admiral™ Shares | | | 15.39 |
| MSCI All Country World Health Care Index | | | 13.41 |
| Global Health/Biotechnology Funds Average | | | 14.09 |
| Global Health/Biotechnology Funds Average: Derived from data provided by Lipper, a Thomson Reuters Company. | |
| Admiral Shares carry lower expenses and are available to investors who meet certain account-balance requirements. | |
| |
| |
| Expense Ratios | | | |
| Your Fund Compared With Its Peer Group | | | |
| | Investor | Admiral | Peer Group |
| | Shares | Shares | Average |
| Health Care Fund | 0.37% | 0.32% | 1.31% |
The fund expense ratios shown are from the prospectus dated May 25, 2017, and represent estimated costs for the current fiscal year. For the six months ended July 31, 2017, the fund’s annualized expense ratios were 0.38% for Investor Shares and 0.33% for Admiral Shares. The peer-group expense ratio is derived from data provided by Lipper, a Thomson Reuters Company, and captures information through year-end 2016.
Peer group: Global Health/Biotechnology Funds.
1
Chairman’s Perspective

Bill McNabb
Chairman and Chief Executive Officer
Dear Shareholder,
It’s said that fierce debates often generate more heat than light. And that’s been true of the ongoing face-off between sharply divided advocates of index funds and of actively managed funds.
For too long, the decision regarding active and index investing has been framed as either-or: Just pick a side and go all-in. But this choice is actually much more nuanced than a binary yes or no.
You may feel that your allegiance can belong to only one sports team, but you don’t have to approach investment strategies that way. (I’ll root for the Philadelphia Eagles no matter whom they’re playing, but my personal investment portfolio includes both index and active funds.)
Yes, indexing can be a valuable starting point for investors, and many may index their entire portfolio. But depending on your circumstances, an allocation to active management may be appropriate.
Recently published Vanguard research is illuminating on this point. Beyond helping you determine whether you’re a good candidate for active strategies, the paper Making the Implicit Explicit: A Framework for the Active-Passive Decision can help establish active and passive allocation targets for a range of investors. (You can read the paper at vanguard.com/research.)
2
Notching a record of outperformance
We’re a pioneer and leader in index fund investing, so why am I suggesting that active management may be appropriate?
Often overshadowed by our indexing reputation is Vanguard’s commitment to—and success with—active management. We oversee about $1 trillion in actively managed assets. And the results have been impressive, as the overwhelming majority of our active funds outperformed the average returns of their peers over the last decade.1 In addition, nearly half of our active funds have outperformed their benchmark indexes over the same period, a level of success that’s not easy to achieve.2
Make no mistake: The challenges of outperforming the market through active management are steep. So Vanguard has developed an approach with distinct characteristics that can improve your chances of success.
Chief among those advantages are low costs. As I’ve written before, paying less for your funds is one way to improve your odds of achieving success in active
| | | |
| Market Barometer | | | |
| | | | Total Returns |
| | | Periods Ended July 31, 2017 |
| | | | Five Years |
| | Six Months | One Year | (Annualized) |
| Stocks | | | |
| Russell 1000 Index (Large-caps) | 9.24% | 15.95% | 14.85% |
| Russell 2000 Index (Small-caps) | 5.35 | 18.45 | 14.19 |
| Russell 3000 Index (Broad U.S. market) | 8.94 | 16.14 | 14.79 |
| FTSE All-World ex US Index (International) | 14.05 | 18.81 | 8.11 |
| |
| Bonds | | | |
| Bloomberg Barclays U.S. Aggregate Bond Index | | | |
| (Broad taxable market) | 2.51% | -0.51% | 2.02% |
| Bloomberg Barclays Municipal Bond Index | | | |
| (Broad tax-exempt market) | 3.72 | 0.26 | 3.10 |
| Citigroup Three-Month U.S. Treasury Bill Index | 0.34 | 0.51 | 0.15 |
| |
| CPI | | | |
| Consumer Price Index | 0.80% | 1.73% | 1.33% |
The performance data shown represent past performance, which is not a guarantee of future results.
1 For the ten years ended June 30, 2017, 50 of 53 fixed income, 19 of 19 balanced, and 38 of 40 stock fund share classes—or 107 of
112 share classes of active Vanguard funds—outperformed their peer-group averages. Source: Vanguard, based on data from Lipper,
a Thomson Reuters Company.
2 For the ten years ended June 30, 2017, 21 of 53 fixed income, 5 of 19 balanced, and 23 of 40 stock fund share classes—or 49 of
112 share classes of active Vanguard funds—outperformed their benchmark indexes. Source: Vanguard, based on data from Lipper,
a Thomson Reuters Company.
3
management. Investors need to watch not only explicit costs, such as those reflected in fund expense ratios, but also implicit ones, such as trading costs, which can be significant because of the higher portfolio turnover associated with many active funds.
Historically, costs have been a reliable predictor of fund performance. But low costs don’t guarantee positive results. Talent is also critical. For this reason, Vanguard dedicates a lot of time, attention, and resources to manager selection and the ongoing oversight of managers.
Reaching beyond our walls
To serve our investors, we’re committed to identifying and attracting the best active managers across a range of investment styles and approaches. We recognize that not all great active managers reside in Valley Forge, Pennsylvania, where Vanguard is headquartered. As a result, we look across the world for managers for many of our active funds.
We oversee about $600 billion in assets that are managed by external advisors and partner with more than 25 firms employing hundreds of investment professionals and supporting analysts. These firms are responsible for more than 70 investment mandates within our active portfolios.
Stay patient and control taxes
Costs and manager selection are critical, but they aren’t the only necessities. You’ll also need a healthy supply of what many investors don’t possess in abundance: patience. Having the fortitude to wait is essential because even those active managers with the best track records go through significant periods of underperformance.
Patience is also crucial because investors in active strategies must stay disciplined and stick with them over time to take full advantage of the compounding benefits of outperformance. This is easy to say but often difficult to execute.
A few years ago, Vanguard looked at those actively managed domestic equity funds across the industry that did best over the previous 15 years. We found that even though these funds outperformed their benchmark indexes over that long period, 97% lagged the benchmarks in at least five calendar years. And two-thirds of the outperforming funds experienced at least three consecutive years of underperformance.3
Tax efficiency is another important consideration. In general, investors shouldn’t hold active strategies in an account that lacks tax protection.
3 Source: Vanguard calculations for the 15 years ended December 31, 2012, using data from Morningstar, Inc.
4
The tax drag associated with most active funds because of their higher turnover can be neutralized by holding the investments in tax-advantaged accounts, such as IRAs and 401(k) plans.
If you keep your focus on these four considerations—costs, manager selection, patience, and taxes—you’ll enhance your chances of achieving success with actively managed funds.
As always, thank you for investing with Vanguard.
Sincerely,

F. William McNabb III
Chairman and Chief Executive Officer
August 14, 2017
|
| Vanguard fund shareholders encouraged to vote in proxy campaign |
| |
| This summer we are asking you to vote on the election of trustees for all U.S.-domiciled |
| Vanguard funds, and on several fund policy proposals that we believe are in the best |
| interests of all shareholders. |
| |
| Vanguard filed a proxy statement on August 14, 2017, with the U.S. Securities and Exchange |
| Commission (SEC). Proxy materials are being provided to Vanguard fund shareholders with |
| instructions on how to vote online, by phone, or by mail. |
| |
| A shareholder meeting is scheduled to be held in Scottsdale, Arizona, on November 15, |
| 2017, when voting will conclude. We encourage you to vote promptly. Please visit |
| vanguard.com for updates. |
5
Advisor’s Report
For the six months ended July 31, 2017, Vanguard Health Care Fund returned 15.36% for Investor Shares and 15.39% for Admiral Shares. It outpaced its benchmark, the MSCI All Country World Health Care Index, which returned 13.41%, and the 14.09% average return of global health/biotechnology funds.
The investment environment
We view the health care sector through a custom lens of subsectors. We combine biotechnology and pharmaceuticals and think of them in terms of capitalization: biopharma small-cap, biopharma mid-cap, and biopharma large-cap. The other subsectors are health care services and medical technology.
Although a very small part of the benchmark, biopharma small-cap was the top-performing subsector during the period. Medical technology stocks were second-best, followed by biopharma large-caps. Health care services and biopharma mid-caps underperformed.
Our successes
Stock selection was strongest in three subsectors: biopharma large-cap, biopharma mid-cap, and health care services. Our modestly overweighted allocation to biopharma small-caps also helped.
Among our large-cap biopharmaceutical holdings, Vertex Pharmaceuticals stood out, returning more than 75%. The
| |
| Major Portfolio Changes | |
| Six Months Ended July 31, 2017 | |
| |
| Additions | Comments |
| Tesaro | Tesaro is an oncology-focused biopharmaceutical company. We |
| | purchased shares because we are attracted to its newly approved |
| | PARP inhibitor treatment for ovarian cancer and believe the class |
| | will greatly expand its indications. |
| Essilor International | Essilor International is the world’s leading optical lens manufacturer. |
| | We purchased the stock because we believe the firm’s proposed |
| | merger with Luxottica offers an opportunity to gain market share. |
| |
| Reductions | Comments |
| Actelion | We eliminated Actelion because it was acquired by Johnson |
| | & Johnson. |
| Amgen | We eliminated Amgen because its stock has performed very well |
| | over the past few years. We believe the current valuation better |
| | balances the firm’s pipeline opportunities with future challenges |
| in its base business. |
|
6
company announced positive clinical data from three different triple combination regimens, a significant milestone in the treatment of cystic fibrosis. We trimmed our very large position because of this strength. But we remain enthused by the breakthrough nature of the results and the potential for the regimens to treat the majority of cystic fibrosis patients. Regeneron Pharmaceuticals helped relative results as its novel drug Dupixent, which treats atopic dermatitis, enjoyed a robust launch. Our avoidance of Pfizer, a benchmark constituent that lagged, also contributed.
In the biopharma mid-cap subsector, shares of Alnylam Pharmaceuticals performed particularly well. Its competitor Ionis reported positive phase 3 results for the treatment of TTR amyloidosis, a significant proof of concept for Alnylam’s similar program, due to report phase 3 results later in 2017. In addition, Alnylam presented positive clinical data for Givosiran, an investigational RNAi therapy for the treatment of acute hepatic porphyria designated by the FDA as a Breakthrough Therapy. We maintained our position in Alnylam based on its portfolio of RNAi therapeutics. Our holdings in H. Lundbeck and Agios Pharmaceuticals further boosted relative results in the subsector.
In health care services, our positions in Cerner and UnitedHealth Group outperformed. UnitedHealth Group is a leader in managed care. We believe that a subdued medical cost trend and a relatively benign regulatory outlook will combine to create a bright future for managed-care companies. Cerner, a leader in health care information technology, enjoyed solid revenue and earnings as hospital systems continued to invest in technology. Our decision to avoid owning Express Scripts also helped relative results as this benchmark constituent declined during the period.
Our shortfalls
Stock selection was weakest in the medical technology and biopharma small-cap subsectors. An overweighted allocation to biopharma mid-cap stocks also detracted. And the fund’s cash position (roughly 3% of assets) dragged on relative performance in a strong return environment.
Among medical technology companies, relative results were most hindered by what we did not own, including strong performers Align Technology and C. R. Bard.
Our avoidance of Johnson & Johnson, which returned more than 18% in the benchmark, was the largest relative detractor. Other laggards were positions in Eisai, Mylan, and Walgreens.
Eisai’s stock languished as the sales of its approved kidney cancer drug, Lenvima, fell short of expectations while competition intensified. Nevertheless, we expect
7
Lenvima to significantly drive the company’s operating margin expansion. We are positive about recent news that the drug achieved its primary and key secondary goals in its pivotal clinical trial for advanced liver cancer. Longer-term, Eisai remains an exciting holding because of its deep Alzheimer’s disease pipeline (in collaboration with Biogen), which includes the industry-leading drug candidate Aducanumab.
We believe these assets remain under-appreciated in Eisai’s stock price.
Mylan suffered from greater-than-expected pricing pressure in its U.S. generics business as the FDA approved competitors’ products while delaying the approval of some exciting complex generics. While this has led to greater near-term earnings pressure, we expect the stock to recover once its innovative generics portfolio is approved next year.
The fund’s positioning
At the period’s end, we held about 22% of the fund’s assets in non-U.S. investments, a level that has remained fairly stable over recent years. Our non-U.S. holdings were primarily domiciled in Japan, the United Kingdom, Switzerland, Belgium, Israel, Denmark, and China, but many of them operate globally. We believe this strategy provides diversification for shareholders over the long term.
The portfolio consisted of 75 companies in all subsectors of health care. This figure was up modestly from a year ago, when we held 70 firms. The fund’s ten largest holdings represented a significant portion––about 45%––of its assets. The fund’s 12-month turnover rate as of the end of July (about 11%) was within our normal range but may increase modestly when opportunities arise.
The health care sector has benefited broadly since the U.S. elections last November as uncertainty about major change from Washington, D.C., has subsided. We believe that meaningful structural reform of drug pricing mechanisms is unlikely in the foreseeable future. Rather, market forces under the current policy framework should restrain pricing for crowded, less-innovative, or off-patent categories of drugs, potentially freeing up money to reward companies bringing truly innovative products to market.
Moreover, it seems increasingly likely that Congress will be unable to dramatically alter the Affordable Care Act (ACA). We suspect we are more likely to see a “repair and rebrand” than a “repeal and replace.”
We expect many of the ACA’s key provisions to remain intact, including those that provide millions of Americans access to some type of health insurance. Despite the noise surrounding “repeal and replace,” the actual long-term impact on health care stocks should be modest.
8
In selecting stocks for the fund, we tend to favor companies that develop innovative products and those that provide solutions to the challenges facing the health care system. We believe such firms should be comparatively well-positioned regardless of the regulatory environment. Over the long term, innovation, an aging population, and the globalization of demand for cutting-edge, Western-style health care should continue to drive the sector’s growth. We believe that we are favorably positioned with the resources to capitalize on that.
A core tenet of our philosophy is the importance of using a longer-term horizon to evaluate secular themes and health care trends, as well as individual companies, on a global scale. This should enable our team to identify pockets of opportunity that are best-positioned to create value and generate sustainable, innovation-driven, differentiated growth. We will remain diversified across subsectors and regions, focused on the long haul, and positioned in what we believe to be the most attractive stocks as we seek to generate strong, risk-adjusted returns.
As always, we thank you very much for your continued confidence and support as an investor in Vanguard Health Care Fund.
Jean M. Hynes, CFA
Senior Managing Director and Portfolio Manager Wellington Management Company llp
August 16, 2017
9
Health Care Fund
Fund Profile
As of July 31, 2017
Share-Class Characteristics
| | |
| | Investor | Admiral |
| | Shares | Shares |
| Ticker Symbol | VGHCX | VGHAX |
| Expense Ratio1 | 0.37% | 0.32% |
| 30-Day SEC Yield | 1.07% | 1.12% |
Portfolio Characteristics
| | | |
| | | MSCI | DJ |
| | | ACWI | U.S. Total |
| | | Health | Market |
| | Fund | Care | FA Index |
| Number of Stocks | 76 | 177 | 3,786 |
| Median Market Cap | $52.7B | $91.0B | $61.2B |
| Price/Earnings Ratio | 22.1x | 22.5x | 21.5x |
| Price/Book Ratio | 3.4x | 3.7x | 2.8x |
| Return on Equity | 15.0% | 16.4% | 15.1% |
| Earnings Growth Rate | 2.1% | 6.3% | 10.1% |
| Dividend Yield | 1.4% | 1.9% | 1.8% |
| Foreign Holdings | 21.9% | 33.4% | 0.0% |
| Turnover Rate | | | |
| (Annualized) | 9% | — | — |
| Short-Term Reserves | 3.3% | — | — |
Volatility Measures
| | |
| | MSCI | DJ |
| | ACWI | U.S. Total |
| | Health | Market |
| | Care | FA Index |
| R-Squared | 0.92 | 0.55 |
| Beta | 1.02 | 0.91 |
| These measures show the degree and timing of the fund’s fluctuations compared with the indexes over 36 months. |
|
| | |
| Ten Largest Holdings (% of total net assets) |
| Bristol-Myers Squibb Co. Pharmaceuticals | 6.3% |
| Allergan plc | Pharmaceuticals | 5.9 |
| UnitedHealth Group Inc. | Managed Health | |
| | Care | 5.5 |
| Eli Lilly & Co. | Pharmaceuticals | 4.8 |
| AstraZeneca plc | Pharmaceuticals | 4.4 |
| Merck & Co. Inc. | Pharmaceuticals | 3.9 |
| Vertex Pharmaceuticals | | |
| Inc. | Biotechnology | 3.3 |
| Regeneron | | |
| Pharmaceuticals Inc. | Biotechnology | 3.3 |
| Medtronic plc | Health Care | |
| | Equipment | 2.9 |
| McKesson Corp. | Health Care | |
| | Distributors | 2.7 |
| Top Ten | | 43.0% |
| The holdings listed exclude any temporary cash investments and equity index products. |
| | |
1 The expense ratios shown are from the prospectus dated May 25, 2017, and represent estimated costs for the current fiscal year. For the six months ended July 31, 2017, the annualized expense ratios were 0.38% for Investor Shares and 0.33% for Admiral Shares.
10
Health Care Fund
Subindustry Diversification (% of equity exposure)
| | |
| | | MSCI |
| | | ACWI |
| | | Health |
| | Fund | Care |
| Biotechnology | 16.4% | 17.1% |
| Consumer Staples | 1.4 | 0.0 |
| Health Care Distributors | 4.0 | 2.3 |
| Health Care Equipment | 10.9 | 13.9 |
| Health Care Facilities | 3.4 | 1.5 |
| Health Care Services | 0.6 | 3.3 |
| Health Care Supplies | 0.5 | 2.2 |
| Health Care Technology | 3.0 | 0.7 |
| Life Sciences Tools & Services | 2.8 | 4.0 |
| Managed Health Care | 11.6 | 8.1 |
| Pharmaceuticals | 45.4 | 46.9 |
Sector categories are based on the Global Industry Classification Standard (“GICS”), except for the “Other” category (if applicable), which includes securities that have not been provided a GICS classification as of the effective reporting period.
Market Diversification (% of equity exposure)
| |
| Europe | |
| United Kingdom | 5.2% |
| Switzerland | 4.3 |
| Belguim | 1.8 |
| Other | 1.3 |
| Subtotal | 12.6% |
| Pacific | |
| Japan | 8.7% |
| Emerging Markets | 0.3% |
| North America | |
| United States | 77.3% |
| Middle East | |
| Israel | 1.1% |
11
Health Care Fund
Performance Summary
All of the returns in this report represent past performance, which is not a guarantee of future results that may be achieved by the fund. (Current performance may be lower or higher than the performance data cited. For performance data current to the most recent month-end, visit our website at vanguard.com/performance.) Note, too, that both investment returns and principal value can fluctuate widely, so an investor’s shares, when sold, could be worth more or less than their original cost. The returns shown do not reflect taxes that a shareholder would pay on fund distributions or on the sale of fund shares.
Fiscal-Year Total Returns (%): January 31, 2007, Through July 31, 2017

For a benchmark description, see the Glossary.
Note: For 2018, performance data reflect the six months ended July 31, 2017.
Average Annual Total Returns: Periods Ended June 30, 2017
This table presents returns through the latest calendar quarter—rather than through the end of the fiscal period.
Securities and Exchange Commission rules require that we provide this information.
| | | | |
| | Inception | One | Five | Ten |
| | Date | Year | Years | Years |
| Investor Shares | 5/23/1984 | 11.57% | 18.52% | 11.43% |
| Admiral Shares | 11/12/2001 | 11.63 | 18.58 | 11.49 |
See Financial Highlights for dividend and capital gains information.
12
Health Care Fund
Financial Statements (unaudited)
Statement of Net Assets
As of July 31, 2017
The fund reports a complete list of its holdings in regulatory filings four times in each fiscal year, at the quarter-ends. For the second and fourth fiscal quarters, the lists appear in the fund’s semiannual and annual reports to shareholders. For the first and third fiscal quarters, the fund files the lists with the Securities and Exchange Commission on Form N-Q. Shareholders can look up the fund’s Forms N-Q on the SEC’s website at sec.gov. Forms N-Q may also be reviewed and copied at the SEC’s Public Reference Room (see the back cover of this report for further information).
| | | |
| | | | Market |
| | | | Value• |
| | | Shares | ($000) |
| Common Stocks (96.7%) | | |
| United States (74.8%) | | |
| Biotechnology (15.3%) | | |
| * | Vertex Pharmaceuticals | | |
| | Inc. | 10,587,426 | 1,607,383 |
| * | Regeneron | | |
| | Pharmaceuticals Inc. | 3,255,810 | 1,600,621 |
| * | Incyte Corp. | 9,265,098 | 1,234,945 |
| * | Biogen Inc. | 3,784,603 | 1,095,983 |
| ^,*,1 Alnylam | | |
| | Pharmaceuticals Inc. | 8,047,957 | 665,888 |
| *,1 | Alkermes plc | 8,694,176 | 473,050 |
| ^,*,1 Agios | | |
| | Pharmaceuticals Inc. | 3,874,924 | 216,763 |
| ^,* | TESARO Inc. | 1,426,535 | 182,112 |
| ^,*,1 Prothena Corp. plc | 2,150,294 | 132,802 |
| ^,* | Ionis Pharmaceuticals | | |
| | Inc. | 2,397,300 | 125,619 |
| * | Ironwood | | |
| | Pharmaceuticals Inc. | | |
| | Class A | 4,586,087 | 81,403 |
| | | | 7,416,569 |
| Food & Staples Retailing (1.3%) | |
| | Walgreens Boots | | |
| | Alliance Inc. | 8,048,160 | 649,245 |
| |
| Health Care Equipment & Supplies (10.0%) |
| | Medtronic plc | 16,509,984 | 1,386,343 |
| * | Boston Scientific Corp. | 40,216,393 | 1,070,561 |
| | Abbott Laboratories | 21,432,294 | 1,054,040 |
| | Baxter International Inc. | 6,747,291 | 408,076 |
| | Becton Dickinson | | |
| | and Co. | 1,522,573 | 306,646 |
| | Stryker Corp. | 1,654,500 | 243,377 |
| * | Hologic Inc. | 3,538,200 | 156,424 |
| * | Intuitive Surgical Inc. | 118,205 | 110,907 |
| | Dentsply Sirona Inc. | 1,453,190 | 90,142 |
| | | | 4,826,516 |
| | | |
| | | | Market |
| | | | Value• |
| | | Shares | ($000) |
| Health Care Providers & Services (18.9%) |
| | UnitedHealth Group | | |
| | Inc. | 13,970,280 | 2,679,639 |
| | McKesson Corp. | 8,002,819 | 1,295,416 |
| | Cigna Corp. | 6,889,431 | 1,195,730 |
| * | HCA Healthcare Inc. | 11,002,078 | 883,907 |
| | Aetna Inc. | 5,101,289 | 787,180 |
| | Cardinal Health Inc. | 7,522,531 | 581,191 |
| | Universal Health | | |
| | Services Inc. Class B | 4,354,800 | 482,643 |
| | Anthem Inc. | 2,502,333 | 465,959 |
| * | Envision Healthcare | | |
| | Corp. | 4,942,595 | 278,911 |
| ^,* | Acadia Healthcare | | |
| | Co. Inc. | 3,698,655 | 195,770 |
| * | WellCare Health Plans | | |
| | Inc. | 1,061,400 | 187,857 |
| * | Centene Corp. | 668,300 | 53,076 |
| | Humana Inc. | 215,600 | 49,847 |
| * | LifePoint Health Inc. | 341,100 | 20,261 |
| * | Community Health | | |
| | Systems Inc. CVR | 18,834,700 | 301 |
| | | | 9,157,688 |
| Health Care Technology (2.9%) | |
| * | Cerner Corp. | 14,511,817 | 934,126 |
| *,1 | athenahealth Inc. | 2,474,965 | 342,337 |
| *,1 | Allscripts Healthcare | | |
| | Solutions Inc. | 11,198,893 | 137,858 |
| | | | 1,414,321 |
| Life Sciences Tools & Services (2.7%) | |
| | Thermo Fisher | | |
| | Scientific Inc. | 3,535,100 | 620,516 |
| * | Illumina Inc. | 2,283,834 | 397,044 |
| * | Quintiles IMS Holdings | | |
| | Inc. | 1,932,497 | 174,988 |
| | Agilent Technologies | | |
| | Inc. | 1,667,550 | 99,703 |
| | | | 1,292,251 |
13
| | |
| Health Care Fund | | |
| |
| |
| |
| | | Market |
| | | Value• |
| | Shares | ($000) |
| Pharmaceuticals (23.7%) | | |
| Bristol-Myers Squibb Co. | 53,643,117 | 3,052,293 |
| Allergan plc | 11,296,134 | 2,850,354 |
| Eli Lilly & Co. | 28,073,170 | 2,320,528 |
| Merck & Co. Inc. | 29,925,744 | 1,911,657 |
| *,1 Mylan NV | 29,295,842 | 1,142,245 |
| ^,*,1 Medicines Co. | 5,564,220 | 213,944 |
| | | 11,491,021 |
| Total United States | | 36,247,611 |
| International (21.9%) | | |
| Belgium (1.8%) | | |
| 1 UCB SA | 11,849,551 | 862,914 |
| |
| China (0.2%) | | |
| Shanghai Fosun | | |
| Pharmaceutical Group | | |
| Co. Ltd. | 16,503,500 | 60,404 |
| Sino Biopharmaceutical | | |
| Ltd. | 31,970,000 | 28,224 |
| *,2 Wuxi Biologics Cayman | | |
| Inc. | 2,657,500 | 11,909 |
| | | 100,537 |
| Denmark (0.8%) | | |
| * Genmab A/S | 1,085,043 | 246,589 |
| H Lundbeck | 2,748,583 | 164,810 |
| | | 411,399 |
| France (0.3%) | | |
| Essilor International SA | 1,309,337 | 165,772 |
| |
| Israel (1.1%) | | |
| Teva Pharmaceutical | | |
| Industries Ltd. ADR | 15,965,000 | 513,594 |
| |
| Japan (8.4%) | | |
| 1 Eisai Co. Ltd. | 15,038,875 | 805,957 |
| Shionogi & Co. Ltd. | 14,932,054 | 797,224 |
| Chugai Pharmaceutical | | |
| Co. Ltd. | 16,188,700 | 649,233 |
| Takeda Pharmaceutical | | |
| Co. Ltd. | 10,581,700 | 558,998 |
| Astellas Pharma Inc. | 34,367,700 | 437,691 |
| Ono Pharmaceutical | | |
| Co. Ltd. | 18,388,760 | 402,268 |
| Kyowa Hakko Kirin | | |
| Co. Ltd. | 6,291,000 | 113,931 |
| Sysmex Corp. | 1,716,700 | 98,273 |
| Olympus Corp. | 2,658,300 | 96,487 |
| Nippon Shinyaku | | |
| Co. Ltd. | 1,318,400 | 83,210 |
| Terumo Corp. | 1,183,700 | 44,756 |
| | | 4,088,028 |
| | | |
| | | | Market |
| | | | Value• |
| | | Shares | ($000) |
| South Africa (0.1%) | | | |
| Aspen Pharmacare | | | |
| Holdings Ltd. | | 1,140,383 | 23,902 |
| |
| Switzerland (4.2%) | | | |
| Novartis AG | 13,576,941 | 1,156,454 |
| Roche Holding AG | | 2,994,934 | 758,225 |
| Roche Holding AG | | | |
| (Bearer) | | 376,066 | 96,959 |
| * Idorsia Ltd. | | 478,519 | 8,957 |
| | | | 2,020,595 |
| United Kingdom (5.0%) | | | |
| AstraZeneca plc | 36,103,061 | 2,151,854 |
| Smith & Nephew plc | | 8,976,157 | 156,185 |
| Hikma Pharmaceuticals | | | |
| plc | | 7,155,385 | 133,195 |
| | | | 2,441,234 |
| Total International | | | 10,627,975 |
| Total Common Stocks | | | |
| (Cost $27,907,302) | | | 46,875,586 |
| Temporary Cash Investments (3.6%) | |
| Money Market Fund (0.3%) | | |
| 3,4 Vanguard Market | | | |
| Liquidity Fund, | | | |
| 1.217% | | 1,369,840 | 137,011 |
| |
| | | Face | |
| | | Amount | |
| | | ($000) | |
| Repurchase Agreements (0.6%) | |
| Bank of America Securities, | |
| LLC 1.050%, 8/1/17 | | | |
| (Dated 7/31/17, | | | |
| Repurchase Value | | | |
| $22,901,000, | | | |
| collateralized by U. S. | | | |
| Treasury Note/Bond | | | |
| 2.250%, 2/15/27, with | | | |
| a value of $23,358,000) | 22,900 | 22,900 |
| Bank of Nova Scotia | | | |
| 1.030%, 8/1/17 (Dated | | | |
| 7/31/17, Repurchase | | | |
| Value $58,102,000, | | | |
| collateralized by U. S. | | | |
| Treasury Note/Bond | | | |
| 2.875%, 8/15/45, with | | | |
| a value of $59,264,000) | 58,100 | 58,100 |
14
| | |
| Health Care Fund | | |
| |
| |
| |
| | Face | Market |
| | Amount | Value • |
| | ($000) | ($000) |
| Barclays Capital Inc. | | |
| 1.020%, 8/1/17 (Dated | | |
| 7/31/17, Repurchase | | |
| Value $8,400,000, | | |
| collateralized by U. S. | | |
| Treasury Note/Bond | | |
| 0.750%–1.125%, | | |
| 1/31/18–3/31/20, with | | |
| a value of $8,568,000) | 8,400 | 8,400 |
| BNP Paribas Securities | | |
| Corp. 1.060%, 8/1/17 | | |
| (Dated 7/31/17, | | |
| Repurchase Value | | |
| $96,003,000, | | |
| collateralized by Federal | | |
| National Mortgage Assn. | | |
| 2.500%–4.000%, | | |
| 8/1/25–5/1/56, | | |
| Government National | | |
| Mortgage Assn. | | |
| 2.250%–4.410%, | | |
| 1/20/39–7/20/63, and | | |
| U.S. Treasury Note/ | | |
| Bond 0.000%-9.125%, | | |
| 10/12/17-8/15/46, with | | |
| a value of $97,920,000) | 96,000 | 96,000 |
| HSBC Bank USA | | |
| 1.040%, 8/1/17 (Dated | | |
| 7/31/17, Repurchase | | |
| Value $82,502,000, | | |
| collateralized by Federal | | |
| Home Loan Mortgage | | |
| Corp. 3.500%–4.000%, | | |
| 4/1/42–1/1/47, with a | | |
| value of $84,153,000) | 82,500 | 82,500 |
| RBC Capital Markets LLC | | |
| 1.030%, 8/1/17 (Dated | | |
| 7/31/17, Repurchase | | |
| Value $14,100,000, | | |
| collateralized by Federal | | |
| Home Loan Mortgage | | |
| Corp. 2.517%–3.500%, | | |
| 1/1/26–5/1/45, Federal | | |
| National Mortgage Assn. | | |
| 2.351%–4.500%, | | |
| 1/1/27–4/1/47, and | | |
| Government National | | |
| Mortgage Assn. | | |
| 3.000%–4.000%, | | |
| 4/20/45–7/20/47, with | | |
| a value of $14,382,000) | 14,100 | 14,100 |
| | | |
| | | Face | Market |
| | | Amount | Value • |
| | | ($000) | ($000) |
| | Wells Fargo & Co. | | |
| | 1.060%, 8/1/17 (Dated | | |
| | 7/31/17, Repurchase | | |
| | Value $29,201,000, | | |
| | collateralized by Federal | | |
| | National Mortgage Assn. | | |
| | 3.500%, 2/1/47, with a | | |
| | value of $29,784,000) | 29,200 | 29,200 |
| | | | 311,200 |
| U. S. Government and Agency Obligations (0.3%) |
| 5 | Federal Home Loan Bank | | |
| | Discount Notes, 1.008%, | | |
| | 9/6/17 | 125,000 | 124,878 |
| |
| Commercial Paper (2.4%) | | |
| 6 | Apple Inc., 1.071%, | | |
| | 8/3/17 | 150,000 | 149,986 |
| 6 | Apple Inc., 1.122%, | | |
| | 9/7/17 | 150,000 | 149,814 |
| | General Electric Co., | | |
| | 1.080%, 8/11/17 | 150,000 | 149,948 |
| | General Electric Co., | | |
| | 1.101%, 8/24/17 | 125,000 | 124,906 |
| 6 | Microsoft Corp., | | |
| | 1.091%, 8/28/17 | 125,000 | 124,896 |
| 6 | Microsoft Corp., | | |
| | 1.101%, 9/5/17 | 100,000 | 99,888 |
| 6 | PepsiCo Inc., | | |
| | 1.112%, 9/18/17 | 75,000 | 74,883 |
| 6 | The Coca-Cola Co., | | |
| | 1.132%, 8/24/17 | 100,000 | 99,921 |
| 6 | The Coca-Cola Co., | | |
| | 1.132%, 8/25/17 | 75,000 | 74,939 |
| 6 | Wal-Mart Stores, Inc., | | |
| | 1.131%, 8/21/17 | 130,000 | 129,913 |
| | | | 1,179,094 |
| Total Temporary Cash Investments | |
| (Cost $1,752,228) | | 1,752,183 |
| Total Investments (100.3%) | | |
| (Cost $29,659,530) | | 48,627,769 |
| Other Assets and Liabilities (-0.3%) | |
| Other Assets | | 181,227 |
| Liabilities 4 | | (311,894) |
| | | | (130,667) |
| Net Assets (100%) | | 48,497,102 |
15
| |
| Health Care Fund | |
| |
| |
| |
| |
| | Amount |
| | ($000) |
| Statement of Assets and Liabilities | |
| Assets | |
| Investments in Securities, at Value | |
| Unaffiliated Issuers | 43,497,000 |
| Affiliated Vanguard Funds | 137,011 |
| Other Affiliated Issuers | 4,993,758 |
| Total Investments in Securities | 48,627,769 |
| Investment in Vanguard | 3,147 |
| Receivables for Investment | |
| Securities Sold | 99,440 |
| Receivables for Accrued Income | 62,411 |
| Receivables for Capital Shares Issued | 15,193 |
| Other Assets | 1,036 |
| Total Assets | 48,808,996 |
| Liabilities | |
| Payables for Investment Securities | |
| Purchased | 74,601 |
| Collateral for Securities on Loan | 136,989 |
| Payables to Investment Advisor | 22,856 |
| Payables for Capital Shares Redeemed | 23,318 |
| Payables to Vanguard | 54,130 |
| Total Liabilities | 311,894 |
| Net Assets | 48,497,102 |
| |
| At July 31, 2017, net assets consisted of: |
| | Amount |
| | ($000) |
| Paid-in Capital | 28,326,849 |
| Undistributed Net Investment Income | 180,405 |
| Accumulated Net Realized Gains | 1,020,327 |
| Unrealized Appreciation (Depreciation) | |
| Investment Securities | 18,968,239 |
| Foreign Currencies | 1,282 |
| Net Assets | 48,497,102 |
| |
| |
| Investor Shares—Net Assets | |
| Applicable to 49,993,562 outstanding | |
| $.001 par value shares of beneficial | |
| interest (unlimited authorization) | 10,653,354 |
| Net Asset Value Per Share— | |
| Investor Shares | $213.09 |
| |
| |
| Admiral Shares—Net Assets | |
| Applicable to 421,005,564 outstanding |
| $.001 par value shares of beneficial | |
| interest (unlimited authorization) | 37,843,748 |
| Net Asset Value Per Share— | |
| Admiral Shares | $89.89 |
• See Note A in Notes to Financial Statements.
* Non-income-producing security.
^ Includes partial security positions on loan to broker-dealers. The total value of securities on loan is $130,339,000.
1 Considered an affiliated company of the fund as the fund owns more than 5% of the outstanding voting securities of such company.
2 Security exempt from registration under Rule 144A of the Securities Act of 1933. Such securities may be sold in transactions exempt
from registration, normally to qualified institutional buyers. At July 31, 2017, the value of this security represented 0.0% of net assets.
3 Affiliated money market fund available only to Vanguard funds and certain trusts and accounts managed by Vanguard. Rate shown is the 7-day yield.
4 Includes $136,989,000 of collateral received for securities on loan.
5 The issuer operates under a congressional charter; its securities are generally neither guaranteed by the U.S. Treasury nor backed by
the full faith and credit of the U.S. government.
6 Security exempt from registration under Section 4(2) of the Securities Act of 1933. Such securities may be sold in transactions exempt
from registration only to dealers in that program or other “accredited investors.” At July 31, 2017, the aggregate value of these securities
was $904,240,000, representing 1.9% of net assets.
ADR—American Depositary Receipt.
CVR—Contingent Value Rights.
See accompanying Notes, which are an integral part of the Financial Statements.
16
Health Care Fund
Statement of Operations
| |
| | Six Months Ended |
| | July 31,2017 |
| | ($000) |
| Investment Income | |
| Income | |
| Dividends1 | 376,862 |
| Interest | 5,794 |
| Securities Lending—Net | 327 |
| Total Income | 382,983 |
| Expenses | |
| Investment Advisory Fees—Note B | |
| Basic Fee | 33,711 |
| Performance Adjustment | 11,205 |
| The Vanguard Group—Note C | |
| Management and Administrative—Investor Shares | 8,388 |
| Management and Administrative—Admiral Shares | 23,702 |
| Marketing and Distribution—Investor Shares | 700 |
| Marketing and Distribution—Admiral Shares | 882 |
| Custodian Fees | 454 |
| Shareholders’ Reports—Investor Shares | 556 |
| Shareholders’ Reports—Admiral Shares | 318 |
| Trustees’ Fees and Expenses | 34 |
| Total Expenses | 79,950 |
| Net Investment Income | 303,033 |
| Realized Net Gain (Loss) | |
| Investment Securities Sold | 1,019,713 |
| Foreign Currencies | (892) |
| Realized Net Gain (Loss) | 1,018,821 |
| Change in Unrealized Appreciation (Depreciation) | |
| Investment Securities | 5,257,243 |
| Foreign Currencies | 1,461 |
| Change in Unrealized Appreciation (Depreciation) | 5,258,704 |
| Net Increase (Decrease) in Net Assets Resulting from Operations | 6,580,558 |
| 1 Dividends are net of foreign withholding taxes of $16,827,000. | |
See accompanying Notes, which are an integral part of the Financial Statements.
17
Health Care Fund
Statement of Changes in Net Assets
| | |
| | Six Months Ended | Year Ended |
| | July 31, | January 31, |
| | 2017 | 2017 |
| | ($000) | ($000) |
| Increase (Decrease) in Net Assets | | |
| Operations | | |
| Net Investment Income | 303,033 | 476,102 |
| Realized Net Gain (Loss) | 1,018,821 | 3,502,054 |
| Change in Unrealized Appreciation (Depreciation) | 5,258,704 | (2,688,729) |
| Net Increase (Decrease) in Net Assets Resulting from Operations | 6,580,558 | 1,289,427 |
| Distributions | | |
| Net Investment Income | | |
| Investor Shares | (2,003) | (91,432) |
| Admiral Shares | (12,088) | (337,537) |
| Realized Capital Gain1 | | |
| Investor Shares | (276,819) | (710,003) |
| Admiral Shares | (972,758) | (2,437,191) |
| Total Distributions | (1,263,668) | (3,576,163) |
| Capital Share Transactions | | |
| Investor Shares | (160,441) | (780,048) |
| Admiral Shares | (10,884) | (1,103,458) |
| Net Increase (Decrease) from Capital Share Transactions | (171,325) | (1,883,506) |
| Total Increase (Decrease) | 5,145,565 | (4,170,242) |
| Net Assets | | |
| Beginning of Period | 43,351,537 | 47,521,779 |
| End of Period2 | 48,497,102 | 43,351,537 |
1 Includes fiscal 2018 and 2017 short-term gain distributions totaling $150,255,000 and $132,789,000, respectively. Short-term gain distributions are treated as ordinary income dividends for tax purposes.
2 Net Assets—End of Period includes undistributed (overdistributed) net investment income of $180,405,000 and ($107,645,000).
See accompanying Notes, which are an integral part of the Financial Statements.
18
Health Care Fund
Financial Highlights
Investor Shares
| | | | | | |
| Six Months | | | | | |
| | Ended | | | | | |
| For a Share Outstanding | July 31, | | | Year Ended January 31, |
| Throughout Each Period | 2017 | 2017 | 2016 | 2015 | 2014 | 2013 |
| Net Asset Value, Beginning of Period | $189.88 | $200.67 | $216.14 | $191.63 | $152.58 | $131.96 |
| Investment Operations | | | | | | |
| Net Investment Income | 1.292 | 2.039 | 1.934 | 2.941 | 2.350 | 2.777 |
| Net Realized and Unrealized Gain (Loss) | | | | | | |
| on Investments | 27.491 | 2.951 | .566 | 49.127 | 53.058 | 22.791 |
| Total from Investment Operations | 28.783 | 4.990 | 2.500 | 52.068 | 55.408 | 25.568 |
| Distributions | | | | | | |
| Dividends from Net Investment Income | (.040) | (1.854) | (2.611) | (2.115) | (2.357) | (2.757) |
| Distributions from Realized Capital Gains | (5.533) | (13.926) | (15.359) | (25.443) | (14.001) | (2.191) |
| Total Distributions | (5.573) | (15.780) | (17.970) | (27.558) | (16.358) | (4.948) |
| Net Asset Value, End of Period | $213.09 | $189.88 | $200.67 | $216.14 | $191.63 | $152.58 |
| |
| Total Return1 | 15.36% | 2.71% | 0.49% | 28.15% | 37.66% | 19.59% |
| |
| Ratios/Supplemental Data | | | | | | |
| Net Assets, End of Period (Millions) | $10,653 | $9,636 | $10,916 | $11,660 | $9,905 | $8,681 |
| Ratio of Total Expenses to | | | | | | |
| Average Net Assets2 | 0.38% | 0.37% | 0.36% | 0.34% | 0.35% | 0.35% |
| Ratio of Net Investment Income to | | | | | | |
| Average Net Assets | 1.27% | 0.98% | 0.84% | 1.44% | 1.33% | 1.94% |
| Portfolio Turnover Rate | 9% | 12% | 18% | 20% | 21% | 8% |
The expense ratio, net investment income ratio, and turnover rate for the current period have been annualized.
1 Total returns do not include transaction or account service fees that may have applied in the periods shown. Fund prospectuses provide information about any applicable transaction and account service fees.
2 Includes performance-based investment advisory fee increases (decreases) of 0.05% for period ended July 31, 2017, 0.04% for fiscal 2017, and 0.02% for fiscal 2016. Performance-based investment advisory fees did not apply before fiscal 2016.
See accompanying Notes, which are an integral part of the Financial Statements.
19
Health Care Fund
Financial Highlights
Admiral Shares
| | | | | | |
| Six Months | | | | | |
| | Ended | | | | | |
| For a Share Outstanding | July 31, | Year Ended January 31, |
| Throughout Each Period | 2017 | 2017 | 2016 | 2015 | 2014 | 2013 |
| Net Asset Value, Beginning of Period | $80.09 | $84.64 | $91.17 | $80.84 | $64.37 | $55.68 |
| Investment Operations | | | | | | |
| Net Investment Income | .566 | .908 | .868 | 1.290 | 1.040 | 1.211 |
| Net Realized and Unrealized Gain (Loss) | | | | | | |
| on Investments | 11.597 | 1.244 | .236 | 20.715 | 22.378 | 9.605 |
| Total from Investment Operations | 12.163 | 2.152 | 1.104 | 22.005 | 23.418 | 10.816 |
| Distributions | | | | | | |
| Dividends from Net Investment Income | (.029) | (.828) | (1.155) | (.942) | (1.042) | (1.201) |
| Distributions from Realized Capital Gains | (2.334) | (5.874) | (6.479) | (10.733) | (5.906) | (.925) |
| Total Distributions | (2.363) | (6.702) | (7.634) | (11.675) | (6.948) | (2.126) |
| Net Asset Value, End of Period | $89.89 | $80.09 | $84.64 | $91.17 | $80.84 | $64.37 |
| |
| Total Return1 | 15.39% | 2.76% | 0.54% | 28.20% | 37.74% | 19.65% |
| |
| Ratios/Supplemental Data | | | | | | |
| Net Assets, End of Period (Millions) | $37,844 | $33,715 | $36,606 | $34,371 | $24,821 | $16,002 |
| Ratio of Total Expenses to | | | | | | |
| Average Net Assets2 | 0.33% | 0.32% | 0.31% | 0.29% | 0.30% | 0.30% |
| Ratio of Net Investment Income to | | | | | | |
| Average Net Assets | 1.32% | 1.03% | 0.89% | 1.49% | 1.38% | 1.99% |
| Portfolio Turnover Rate | 9% | 12% | 18% | 20% | 21% | 8% |
The expense ratio, net investment income ratio, and turnover rate for the current period have been annualized.
1 Total returns do not include transaction or account service fees that may have applied in the periods shown. Fund prospectuses provide information about any applicable transaction and account service fees.
2 Includes performance-based investment advisory fee increases (decreases) of 0.05% for period ended July 31, 2017, 0.04% for fiscal 2017, and 0.02% for fiscal 2016. Performance-based investment advisory fees did not apply before fiscal 2016.
See accompanying Notes, which are an integral part of the Financial Statements.
20
Health Care Fund
Notes to Financial Statements
Vanguard Health Care Fund is registered under the Investment Company Act of 1940 as an open-end investment company, or mutual fund. The fund invests in securities of foreign issuers, which may subject it to investment risks not normally associated with investing in securities of U.S. corporations. The fund offers two classes of shares: Investor Shares and Admiral Shares. Investor Shares are available to any investor who meets the fund’s minimum purchase requirements. Admiral Shares are designed for investors who meet certain administrative, service, and account-size criteria.
A. The following significant accounting policies conform to generally accepted accounting principles for U.S. investment companies. The fund consistently follows such policies in preparing its financial statements.
1. Security Valuation: Securities are valued as of the close of trading on the New York Stock Exchange (generally 4 p.m., Eastern time) on the valuation date. Equity securities are valued at the latest quoted sales prices or official closing prices taken from the primary market in which each security trades; such securities not traded on the valuation date are valued at the mean of the latest quoted bid and asked prices. Securities for which market quotations are not readily available, or whose values have been affected by events occurring before the fund’s pricing time but after the close of the securities’ primary markets, are valued at their fair values calculated according to procedures adopted by the board of trustees. These procedures include obtaining quotations from an independent pricing service, monitoring news to identify significant market-or security-specific events, and evaluating changes in the values of foreign market proxies (for example, ADRs, futures contracts, or exchange-traded funds), between the time the foreign markets close and the fund’s pricing time. When fair-value pricing is employed, the prices of securities used by a fund to calculate its net asset value may differ from quoted or published prices for the same securities. Investments in Vanguard Market Liquidity Fund are valued at that fund’s net asset value. Temporary cash investments are valued using the latest bid prices or using valuations based on a matrix system (which considers such factors as security prices, yields, maturities, and ratings), both as furnished by independent pricing services.
2. Foreign Currency: Securities and other assets and liabilities denominated in foreign currencies are translated into U.S. dollars using exchange rates obtained from an independent third party as of the fund’s pricing time on the valuation date. Realized gains (losses) and unrealized appreciation (depreciation) on investment securities include the effects of changes in exchange rates since the securities were purchased, combined with the effects of changes in security prices. Fluctuations in the value of other assets and liabilities resulting from changes in exchange rates are recorded as unrealized foreign currency gains (losses) until the assets or liabilities are settled in cash, at which time they are recorded as realized foreign currency gains (losses).
3. Repurchase Agreements: The fund enters into repurchase agreements with institutional counterparties. Securities pledged as collateral to the fund under repurchase agreements are held by a custodian bank until the agreements mature, and in the absence of a default, such collateral cannot be repledged, resold, or rehypothecated. Each agreement requires that the market value of the collateral be sufficient to cover payments of interest and principal. The fund further mitigates its counterparty risk by entering into repurchase agreements only with a diverse group of prequalified counterparties, monitoring their financial strength, and entering into master repurchase agreements with its counterparties. The master repurchase agreements provide that, in the event of a counterparty’s default (including bankruptcy), the fund may terminate
21
Health Care Fund
any repurchase agreements with that counterparty, determine the net amount owed, and sell or retain the collateral up to the net amount owed to the fund. Such action may be subject to legal proceedings, which may delay or limit the disposition of collateral.
4. Federal Income Taxes: The fund intends to continue to qualify as a regulated investment company and distribute all of its taxable income. Management has analyzed the fund’s tax positions taken for all open federal income tax years (January 31, 2014–2017), and for the period ended July 31, 2017, and has concluded that no provision for federal income tax is required in the fund’s financial statements.
5. Distributions: Distributions to shareholders are recorded on the ex-dividend date.
6. Securities Lending: To earn additional income, the fund lends its securities to qualified institutional borrowers. Security loans are subject to termination by the fund at any time, and are required to be secured at all times by collateral in an amount at least equal to the market value of securities loaned. Daily market fluctuations could cause the value of loaned securities to be more or less than the value of the collateral received. When this occurs, the collateral is adjusted and settled on the next business day. The fund further mitigates its counterparty risk by entering into securities lending transactions only with a diverse group of prequalified counterparties, monitoring their financial strength, and entering into master securities lending agreements with its counterparties. The master securities lending agreements provide that, in the event of a counterparty’s default (including bankruptcy), the fund may terminate any loans with that borrower, determine the net amount owed, and sell or retain the collateral up to the net amount owed to the fund; however, such actions may be subject to legal proceedings. While collateral mitigates counterparty risk, in the event of a default, the fund may experience delays and costs in recovering the securities loaned. The fund invests cash collateral received in Vanguard Market Liquidity Fund, and records a liability in the Statement of Assets and Liabilities for the return of the collateral, during the period the securities are on loan. Securities lending income represents fees charged to borrowers plus income earned on invested cash collateral, less expenses associated with the loan. During the term of the loan, the fund is entitled to all distributions made on or in respect of the loaned securities.
7. Credit Facility: The fund and certain other funds managed by The Vanguard Group (“Vanguard”) participate in a $3.1 billion committed credit facility provided by a syndicate of lenders pursuant to a credit agreement that may be renewed annually; each fund is individually liable for its borrowings, if any, under the credit facility. Borrowings may be utilized for temporary and emergency purposes, and are subject to the fund’s regulatory and contractual borrowing restrictions. The participating funds are charged administrative fees and an annual commitment fee of 0.10% of the undrawn amount of the facility; these fees are allocated to the funds based on a method approved by the fund’s board of trustees and included in Management and Administrative expenses on the fund’s Statement of Operations. Any borrowings under this facility bear interest at a rate based upon the higher of the one-month London Interbank Offered Rate, federal funds effective rate, or overnight bank funding rate plus an agreed-upon spread.
The fund had no borrowings outstanding at July 31, 2017, or at any time during the period then ended.
22
Health Care Fund
8. Other: Dividend income is recorded on the ex-dividend date. Interest income includes income distributions received from Vanguard Market Liquidity Fund and is accrued daily. Premiums and discounts on debt securities purchased are amortized and accreted, respectively, to interest income over the lives of the respective securities. Security transactions are accounted for on the date securities are bought or sold. Costs used to determine realized gains (losses) on the sale of investment securities are those of the specific securities sold.
Each class of shares has equal rights as to assets and earnings, except that each class separately bears certain class-specific expenses related to maintenance of shareholder accounts (included in Management and Administrative expenses) and shareholder reporting. Marketing and distribution expenses are allocated to each class of shares based on a method approved by the board of trustees. Income, other non-class-specific expenses, and gains and losses on investments are allocated to each class of shares based on its relative net assets.
B. Wellington Management Company LLP provides investment advisory services to the fund for a fee calculated at an annual percentage rate of average net assets. The basic fee is subject to quarterly adjustments based on the fund’s performance relative to the MSCI ACWI Health Care Index for the preceding three years. For the six months ended July 31, 2017, the investment advisory fee represented an effective annual basic rate of 0.15% of the fund’s average net assets before an increase of $11,205,000 (0.05%) based on performance.
C. In accordance with the terms of a Funds’ Service Agreement (the “FSA”) between Vanguard and the fund, Vanguard furnishes to the fund corporate management, administrative, marketing, and distribution services at Vanguard’s cost of operations (as defined by the FSA). These costs of operations are allocated to the fund based on methods and guidelines approved by the board of trustees. Vanguard does not require reimbursement in the current period for certain costs of operations (such as deferred compensation/benefits and risk/insurance costs); the fund’s liability for these costs of operations is included in Payables to Vanguard on the Statement of Assets and Liabilities.
Upon the request of Vanguard, the fund may invest up to 0.40% of its net assets as capital in Vanguard. At July 31, 2017, the fund had contributed to Vanguard capital in the amount of $3,147,000, representing 0.01% of the fund’s net assets and 1.26% of Vanguard’s capitalization. The fund’s trustees and officers are also directors and employees, respectively, of Vanguard.
D. Various inputs may be used to determine the value of the fund’s investments. These inputs are summarized in three broad levels for financial statement purposes. The inputs or methodologies used to value securities are not necessarily an indication of the risk associated with investing in those securities.
Level 1—Quoted prices in active markets for identical securities.
Level 2—Other significant observable inputs (including quoted prices for similar securities, interest rates, prepayment speeds, credit risk, etc.).
Level 3—Significant unobservable inputs (including the fund’s own assumptions used to determine the fair value of investments).
23
Health Care Fund
The following table summarizes the market value of the fund’s investments as of July 31, 2017, based on the inputs used to value them:
| | | |
| | Level 1 | Level 2 | Level 3 |
| Investments | ($000) | ($000) | ($000) |
| Common Stocks—United States | 36,247,611 | — | — |
| Common Stocks—International | 513,594 | 10,114,381 | — |
| Temporary Cash Investments | 137,011 | 1,615,172 | — |
| Total | 36,898,216 | 11,729,553 | — |
E. Distributions are determined on a tax basis and may differ from net investment income and realized capital gains for financial reporting purposes. Differences may be permanent or temporary. Permanent differences are reclassified among capital accounts in the financial statements to reflect their tax character. Temporary differences arise when certain items of income, expense, gain, or loss are recognized in different periods for financial statement and tax purposes. These differences will reverse at some time in the future. Differences in classification may also result from the treatment of short-term gains as ordinary income for tax purposes. The fund’s tax-basis capital gains and losses are determined only at the end of each fiscal year.
At July 31, 2017, the cost of investment securities for tax purposes was $29,728,535,000. Net unrealized appreciation of investment securities for tax purposes was $18,899,234,000, consisting of unrealized gains of $19,999,877,000 on securities that had risen in value since their purchase and $1,100,643,000 in unrealized losses on securities that had fallen in value since their purchase.
F. During the six months ended July 31, 2017, the fund purchased $2,070,759,000 of investment securities and sold $3,727,921,000 of investment securities, other than temporary cash investments.
G. Capital share transactions for each class of shares were:
| | | | |
| | Six Months Ended | | Year Ended |
| | | July 31, 2017 | January 31, 2017 |
| | Amount | Shares | Amount | Shares |
| | ($000) | (000) | ($000) | (000) |
| Investor Shares | | | | |
| Issued | 605,420 | 2,962 | 1,313,938 | 6,581 |
| Issued in Lieu of Cash Distributions | 264,597 | 1,325 | 760,856 | 4,044 |
| Redeemed | (1,030,458) | (5,042) | (2,854,842) | (14,276) |
| Net Increase (Decrease)—Investor Shares | (160,441) | (755) | (780,048) | (3,651) |
| Admiral Shares | | | | |
| Issued | 1,090,908 | 12,624 | 2,173,067 | 25,669 |
| Issued in Lieu of Cash Distributions | 892,927 | 10,605 | 2,517,721 | 31,739 |
| Redeemed | (1,994,719) | (23,199) | (5,794,246) | (68,911) |
| Net Increase (Decrease)—Admiral Shares | (10,884) | 30 | (1,103,458) | (11,503) |
24
Health Care Fund
H. Certain of the fund’s investments are in companies that are considered to be affiliated companies of the fund because the fund owns more than 5% of the outstanding voting securities of the company or the issuer is another member of The Vanguard Group. Transactions during the period in securities of these companies were as follows:
| | | | | | |
| | | Current Period Transactions | |
| | Jan. 31, | | Proceeds | | | July 31, |
| | 2017 | | from | | Capital Gain | 2017 |
| | Market | Purchases | Securities | | Distributions | Market |
| | Value | at Cost | Sold1 | Income | Received | Value |
| | ($000) | ($000) | ($000) | ($000) | ($000) | ($000) |
| Agios Pharmaceuticals Inc. | 154,118 | 14,517 | — | — | — | 216,763 |
| Alkermes plc | 470,442 | — | — | — | — | 473,050 |
| Allscripts Healthcare | | | | | | |
| Solutions Inc. | 131,139 | — | — | — | — | 137,858 |
| Alnylam Pharmaceuticals Inc. | 341,889 | — | 40,856 | — | — | 665,888 |
| athenahealth Inc. | 289,067 | 17,992 | — | — | — | 342,337 |
| Eisai Co. Ltd. | 828,954 | — | — | 9,757 | — | 805,957 |
| Incyte Corp. | 1,249,252 | 17,338 | 155,621 | — | — | NA2 |
| Medicines Co. | 200,590 | — | — | — | — | 213,944 |
| Mylan NV | 1,144,717 | — | 34,017 | — | — | 1,142,245 |
| Prothena Corp. plc | 105,278 | — | — | — | — | 132,802 |
| UCB SA | 783,433 | 36,150 | — | 12,077 | — | 862,914 |
| Vanguard Market | | | | | | |
| Liquidity Fund | 88,012 | NA 3 | NA 3 | — | — | 137,011 |
| Vertex Pharmaceuticals Inc. | 1,136,089 | — | 362,710 | — | — | NA2 |
| Total | 6,922,980 | | | 21,834 | — | 5,130,769 |
1 Includes net realized gain (loss) on affiliated investment securities sold of $158,233,000.
2 Not applicable—at July 31, 2017, the security was still held, but the issuer was no longer an affiliated company of the fund.
3 Not applicable—purchases and sales are for temporary cash investment purposes.
I. Management has determined that no material events or transactions occurred subsequent to July 31, 2017, that would require recognition or disclosure in these financial statements.
25
About Your Fund’s Expenses
As a shareholder of the fund, you incur ongoing costs, which include costs for portfolio management, administrative services, and shareholder reports (like this one), among others. Operating expenses, which are deducted from a fund’s gross income, directly reduce the investment return of the fund.
A fund’s expenses are expressed as a percentage of its average net assets. This figure is known as the expense ratio. The following examples are intended to help you understand the ongoing costs (in dollars) of investing in your fund and to compare these costs with those of other mutual funds. The examples are based on an investment of $1,000 made at the beginning of the period shown and held for the entire period.
The accompanying table illustrates your fund’s costs in two ways:
• Based on actual fund return. This section helps you to estimate the actual expenses that you paid over the period. The ”Ending Account Value“ shown is derived from the fund‘s actual return, and the third column shows the dollar amount that would have been paid by an investor who started with $1,000 in the fund. You may use the information here, together with the amount you invested, to estimate the expenses that you paid over the period.
To do so, simply divide your account value by $1,000 (for example, an $8,600 account value divided by $1,000 = 8.6), then multiply the result by the number given for your fund under the heading ”Expenses Paid During Period.“
• Based on hypothetical 5% yearly return. This section is intended to help you compare your fund‘s costs with those of other mutual funds. It assumes that the fund had a yearly return of 5% before expenses, but that the expense ratio is unchanged. In this case—because the return used is not the fund’s actual return—the results do not apply to your investment. The example is useful in making comparisons because the Securities and Exchange Commission requires all mutual funds to calculate expenses based on a 5% return. You can assess your fund’s costs by comparing this hypothetical example with the hypothetical examples that appear in shareholder reports of other funds.
Note that the expenses shown in the table are meant to highlight and help you compare ongoing costs only and do not reflect transaction costs incurred by the fund for buying and selling securities. Further, the expenses do not include any purchase, redemption, or account service fees described in the fund prospectus. If such fees were applied to your account, your costs would be higher. Your fund does not carry a “sales load.”
The calculations assume no shares were bought or sold during the period. Your actual costs may have been higher or lower, depending on the amount of your investment and the timing of any purchases or redemptions.
You can find more information about the fund’s expenses, including annual expense ratios, in the Financial Statements section of this report. For additional information on operating expenses and other shareholder costs, please refer to your fund’s current prospectus.
26
| | | |
| Six Months Ended July 31, 2017 | | | |
| | Beginning | Ending | Expenses |
| | Account Value | Account Value | Paid During |
| Health Care Fund | 1/31/2017 | 7/31/2017 | Period |
| Based on Actual Fund Return | | | |
| Investor Shares | $1,000.00 | $1,153.56 | $2.03 |
| Admiral Shares | 1,000.00 | 1,153.85 | 1.76 |
| Based on Hypothetical 5% Yearly Return | | | |
| Investor Shares | $1,000.00 | $1,022.91 | $1.91 |
| Admiral Shares | 1,000.00 | 1,023.16 | 1.66 |
The calculations are based on expenses incurred in the most recent six-month period. The fund’s annualized six-month expense ratios for
that period are 0.38% for Investor Shares and 0.33% for Admiral Shares. The dollar amounts shown as “Expenses Paid” are equal to the
annualized expense ratio multiplied by the average account value over the period, multiplied by the number of days in the most recent
six-month period, then divided by the number of days in the most recent 12-month period (181/365).
27
Trustees Approve Advisory Arrangement
The board of trustees of Vanguard Health Care Fund has renewed the fund’s investment advisory arrangement with Wellington Management Company LLP (Wellington Management). The board determined that renewing the fund’s advisory arrangement was in the best interests of the fund and its shareholders.
The board based its decision upon an evaluation of the advisor’s investment staff, portfolio management process, and performance. This evaluation included information provided to the board by Vanguard’s Portfolio Review Department, which is responsible for fund and advisor oversight and product management. The Portfolio Review Department met regularly with the advisor and made monthly presentations to the board during the fiscal year that directed the board’s focus to relevant information and topics.
The board, or an investment committee made up of board members, also received information throughout the year during advisor presentations. For each advisor presentation, the board was provided with letters and reports that included information about, among other things, the advisory firm and the advisor’s assessment of the investment environment, portfolio performance, and portfolio characteristics.
In addition, the board received monthly reports, which included a Market and Economic Report, a Fund Dashboard Monthly Summary, and a Fund Performance Report.
Prior to their meeting, the trustees were provided with a memo and materials that summarized the information they received over the course of the year. They also considered the factors discussed below, among others. However, no single factor determined whether the board approved the arrangement. Rather, it was the totality of the circumstances that drove the board’s decision.
Nature, extent, and quality of services
The board reviewed the quality of the fund’s investment management services over both the short and long term and took into account the organizational depth and stability of the advisor. The board considered that Wellington Management, founded in 1928, is among the nation’s oldest and most respected institutional investment managers.
The portfolio manager is aided by a team of experienced Global Industry Analysts who cover health care industries. This health care team uses intensive fundamental analysis and deep knowledge of health care science and technology to identify companies with high-quality balance sheets, strong management, and the potential for new products that will lead to above-average growth in revenue and earnings.
The advisor invests in stocks broadly representing the health care industry, seeking to maintain exposure across five primary subsectors: large-capitalization biotechnology/pharmaceuticals, mid-cap biotech/pharmaceuticals, small-cap biotech/pharmaceuticals, health care services, and medical technology. Wellington Management has advised the fund since the fund’s inception in 1984.
The board concluded that the advisor’s experience, stability, depth, and performance, among other factors, warranted approval and continuation of the advisory arrangement.
28
Investment performance
The board considered the short- and long-term performance of the fund, including any periods of outperformance or underperformance compared with a relevant benchmark index and peer group. The board concluded that the performance was such that the advisory arrangement should continue. Information about the fund’s most recent performance can be found in the Performance Summary section of this report.
Cost
The board concluded that the fund’s expense ratio was well below the average expense ratio charged by funds in its peer group and that the fund’s advisory fee rate was also well below its peer-group average. Information about the fund’s expense ratio appears in the About Your Fund’s Expenses section of this report as well as in the Financial Statements section, which also includes information about the fund’s advisory fee rate.
The board did not consider the profitability of Wellington Management in determining whether to approve the advisory fee, because Wellington Management is independent of Vanguard and the advisory fee is the result of arm’s-length negotiations.
The benefit of economies of scale
The board concluded that the fund’s shareholders benefit from economies of scale because of breakpoints in the fund’s advisory fee schedule. The breakpoints reduce the effective rate of the fee as the fund’s assets increase.
The board will consider whether to renew the advisory arrangement again after a one-year period.
29
Glossary
30-Day SEC Yield. A fund’s 30-day SEC yield is derived using a formula specified by the U.S. Securities and Exchange Commission. Under the formula, data related to the fund’s security holdings in the previous 30 days are used to calculate the fund’s hypothetical net income for that period, which is then annualized and divided by the fund’s estimated average net assets over the calculation period. For the purposes of this calculation, a security’s income is based on its current market yield to maturity (for bonds), its actual income (for asset-backed securities), or its projected dividend yield (for stocks). Because the SEC yield represents hypothetical annualized income, it will differ—at times significantly—from the fund’s actual experience. As a result, the fund’s income distributions may be higher or lower than implied by the SEC yield.
Beta. A measure of the magnitude of a fund’s past share-price fluctuations in relation to the ups and downs of a given market index. The index is assigned a beta of 1.00. Compared with a given index, a fund with a beta of 1.20 typically would have seen its share price rise or fall by 12% when the index rose or fell by 10%. For this report, beta is based on returns over the past 36 months for both the fund and the index. Note that a fund’s beta should be reviewed in conjunction with its R-squared (see definition). The lower the R-squared, the less correlation there is between the fund and the index, and the less reliable beta is as an indicator of volatility.
Dividend Yield. Dividend income earned by stocks, expressed as a percentage of the aggregate market value (or of net asset value, for a fund). The yield is determined by dividing the amount of the annual dividends by the aggregate value (or net asset value) at the end of the period. For a fund, the dividend yield is based solely on stock holdings and does not include any income produced by other investments.
Earnings Growth Rate. The average annual rate of growth in earnings over the past five years for the stocks now in a fund.
Equity Exposure. A measure that reflects a fund’s investments in stocks and stock futures. Any holdings in short-term reserves are excluded.
Expense Ratio. A fund’s total annual operating expenses expressed as a percentage of the fund’s average net assets. The expense ratio includes management and administrative expenses, but does not include the transaction costs of buying and selling portfolio securities.
Foreign Holdings. The percentage of a fund represented by securities or depositary receipts of companies based outside the United States.
Inception Date. The date on which the assets of a fund (or one of its share classes) are first invested in accordance with the fund’s investment objective. For funds with a subscription period, the inception date is the day after that period ends. Investment performance is measured from the inception date.
Median Market Cap. An indicator of the size of companies in which a fund invests; the midpoint of market capitalization (market price x shares outstanding) of a fund’s stocks, weighted by the proportion of the fund’s assets invested in each stock. Stocks representing half of the fund’s assets have market capitalizations above the median, and the rest are below it.
Price/Book Ratio. The share price of a stock divided by its net worth, or book value, per share.
For a fund, the weighted average price/book ratio of the stocks it holds.
30
Price/Earnings Ratio. The ratio of a stock’s current price to its per-share earnings over the past year. For a fund, the weighted average P/E of the stocks it holds. P/E is an indicator of market expectations about corporate prospects; the higher the P/E, the greater the expectations for a company’s future growth.
R-Squared. A measure of how much of a fund’s past returns can be explained by the returns from the market in general, as measured by a given index. If a fund’s total returns were precisely synchronized with an index’s returns, its R-squared would be 1.00. If the fund’s returns bore no relationship to the index’s returns, its R-squared would be 0. For this report, R-squared is based on returns over the past 36 months for both the fund and the index.
Return on Equity. The annual average rate of return generated by a company during the past five years for each dollar of shareholder’s equity (net income divided by shareholder’s equity). For a fund, the weighted average return on equity for the companies whose stocks it holds.
Short-Term Reserves. The percentage of a fund invested in highly liquid, short-term securities that can be readily converted to cash.
Turnover Rate. An indication of the fund’s trading activity. Funds with high turnover rates incur higher transaction costs and may be more likely to distribute capital gains (which may be taxable to investors). The turnover rate excludes in-kind transactions, which have minimal impact on costs.
Benchmark Information
Spliced Health Care Index: S&P 500 Index through December 31, 2001; S&P Health Care Index through May 31, 2010; MSCI All Country World Health Care Index thereafter.
31
The Global Industry Classification Standard (“GICS”) was developed by and is the exclusive property and a service mark of MSCI Inc. (“MSCI”) and Standard and Poor’s, a division of McGraw-Hill Companies, Inc. (“S&P”), and is licensed for use by Vanguard. Neither MSCI, S&P nor any third party involved in making or compiling the GICS or any GICS classification makes any express or implied warranties or representations with respect to such standard or classification (or the results to be obtained by the use thereof), and all such parties hereby expressly disclaim all warranties of originality, accuracy, completeness, merchantability or fitness for a particular purpose with respect to any such standard or classification. Without limiting any of the foregoing, in no event shall MSCI, S&P, any of its affiliates or any third party involved in making or compiling the GICS or any GICS classification have any liability for any direct, indirect, special, punitive, consequential or any other damages (including lost profits) even if notified of the possibility of such damages.
32
This page intentionally left blank.
This page intentionally left blank.
The People Who Govern Your Fund
The trustees of your mutual fund are there to see that the fund is operated and managed in your best interests since, as a shareholder, you are a part owner of the fund. Your fund’s trustees also serve on the board of directors of The Vanguard Group, Inc., which is owned by the Vanguard funds and provides services to them on an at-cost basis.
A majority of Vanguard’s board members are independent, meaning that they have no affiliation with Vanguard or the funds they oversee, apart from the sizable personal investments they have made as private individuals. The independent board members have distinguished backgrounds in business, academia, and public service. Each of the trustees and executive officers oversees 195 Vanguard funds.
Information for each trustee and executive officer of the fund appears below. The mailing address of the trustees and officers is P.O. Box 876, Valley Forge, PA 19482. More information about the trustees is in the Statement of Additional Information, which can be obtained, without charge, by contacting Vanguard at 800-662-7447, or online at vanguard.com.
Interested Trustee1
F. William McNabb III
Born 1957. Trustee Since July 2009. Chairman of the Board. Principal Occupation(s) During the Past Five Years and Other Experience: Chairman of the Board of The Vanguard Group, Inc., and of each of the investment companies served by The Vanguard Group, since January 2010; Chief Executive Officer and Director of The Vanguard Group and President and Chief Executive Officer of each of the investment companies served by The Vanguard Group, since 2008; Director of Vanguard Marketing Corporation; President of The Vanguard Group (2008–2017); Managing Director of The Vanguard Group (1995–2008).
Independent Trustees
Emerson U. Fullwood
Born 1948. Trustee Since January 2008. Principal Occupation(s) During the Past Five Years and Other Experience: Executive Chief Staff and Marketing Officer for North America and Corporate Vice President (retired 2008) of Xerox Corporation (document management products and services); Executive in Residence and 2009–2010 Distinguished Minett Professor at the Rochester Institute of Technology; Lead Director of SPX FLOW, Inc. (multi-industry manufacturing); Director of the United Way of Rochester, the University of Rochester Medical Center, Monroe Community College Foundation, North Carolina A&T University, and Roberts Wesleyan College; Trustee of the University of Rochester.
Rajiv L. Gupta
Born 1945. Trustee Since December 2001.2 Principal Occupation(s) During the Past Five Years and Other Experience: Chairman and Chief Executive Officer (retired 2009) and President (2006–2008) of Rohm and Haas Co. (chemicals); Director of Arconic Inc. (diversified manufacturer), HP Inc. (printer and personal computer manufacturing), and Delphi Automotive plc (automotive components); Senior Advisor at New Mountain Capital.
Amy Gutmann
Born 1949. Trustee Since June 2006. Principal Occupation(s) During the Past Five Years and Other Experience: President of the University of Pennsylvania; Christopher H. Browne
1 Mr. McNabb is considered an “interested person,” as defined in the Investment Company Act of 1940, because he is an officer of the Vanguard funds.
2 December 2002 for Vanguard Equity Income Fund, the Vanguard Municipal Bond Funds, and the Vanguard State Tax-Exempt Funds.
Distinguished Professor of Political Science, School of Arts and Sciences, and Professor of Communication, Annenberg School for Communication, with secondary faculty appointments in the Department of Philosophy, School of Arts and Sciences, and at the Graduate School of Education, University of Pennsylvania; Trustee of the National Constitution Center.
JoAnn Heffernan Heisen
Born 1950. Trustee Since July 1998. Principal Occupation(s) During the Past Five Years and Other Experience: Corporate Vice President and Member of the Executive Committee (1997–2008), Chief Global Diversity Officer (retired 2008), Vice President and Chief Information Officer (1997–2006), Controller (1995–1997), Treasurer (1991–1995), and Assistant Treasurer (1989–1991) of Johnson & Johnson (pharmaceuticals/medical devices/ consumer products); Director of Skytop Lodge Corporation (hotels) and the Robert Wood Johnson Foundation; Member of the Advisory Board of the Institute for Women’s Leadership at Rutgers University.
F. Joseph Loughrey
Born 1949. Trustee Since October 2009. Principal Occupation(s) During the Past Five Years and Other Experience: President and Chief Operating Officer (retired 2009) of Cummins Inc. (industrial machinery); Chairman of the Board of Hillenbrand, Inc. (specialized consumer services), Oxfam America, and the Lumina Foundation for Education; Director of the V Foundation for Cancer Research; Member of the Advisory Council for the College of Arts and Letters and Chair of the Advisory Board to the Kellogg Institute for International Studies, both at the University of Notre Dame.
Mark Loughridge
Born 1953. Trustee Since March 2012. Principal Occupation(s) During the Past Five Years and Other Experience: Senior Vice President and Chief Financial Officer (retired 2013) at IBM (information technology services); Fiduciary Member of IBM’s Retirement Plan Committee (2004–2013); Director of the Dow Chemical Company; Member of the Council on Chicago Booth.
Scott C. Malpass
Born 1962. Trustee Since March 2012. Principal Occupation(s) During the Past Five Years and Other Experience: Chief Investment Officer and Vice President at the University of Notre Dame; Assistant Professor of Finance at the Mendoza College of Business at Notre Dame; Member of the Notre Dame 403(b) Investment Committee, the Board of Advisors for Spruceview Capital Partners, the Board of Catholic Investment Services, Inc. (investment advisor), and the Board of Superintendence of the Institute for the Works of Religion; Chairman of the Board of TIFF Advisory Services, Inc. (investment advisor).
André F. Perold
Born 1952. Trustee Since December 2004. Principal Occupation(s) During the Past Five Years and Other Experience: George Gund Professor of Finance and Banking, Emeritus at the Harvard Business School (retired 2011); Chief Investment Officer and Co-Managing Partner of HighVista Strategies LLC (private investment firm); Overseer of the Museum of Fine Arts Boston.
Peter F. Volanakis
Born 1955. Trustee Since July 2009. Principal Occupation(s) During the Past Five Years and Other Experience: President and Chief Operating Officer (retired 2010) of Corning Incorporated (communications equipment); Chairman of the Board of Trustees of Colby-Sawyer College; Member of the Board of Hypertherm, Inc. (industrial cutting systems, software, and consumables).
Executive Officers
Glenn Booraem
Born 1967. Investment Stewardship Officer Since February 2017. Principal Occupation(s) During the Past Five Years and Other Experience: Principal of The Vanguard Group, Inc.; Treasurer (2015–2017), Controller (2010–2015), and Assistant Controller (2001–2010) of each of the investment companies served by The Vanguard Group.
Thomas J. Higgins
Born 1957. Chief Financial Officer Since September 2008. Principal Occupation(s) During the Past Five Years and Other Experience: Principal of The Vanguard Group, Inc.; Chief Financial Officer of each of the investment companies served by The Vanguard Group; Treasurer of each of the investment companies served by The Vanguard Group (1998–2008).
Peter Mahoney
Born 1974. Controller Since May 2015. Principal Occupation(s) During the Past Five Years and Other Experience: Principal of The Vanguard Group, Inc.; Controller of each of the investment companies served by The Vanguard Group; Head of International Fund Services at The Vanguard Group (2008–2014).
Anne E. Robinson
Born 1970. Secretary Since September 2016. Principal Occupation(s) During the Past Five Years and Other Experience: Managing Director of The Vanguard Group, Inc.; General Counsel of The Vanguard Group; Secretary of The Vanguard Group and of each of the investment companies served by The Vanguard Group; Director and Senior Vice President of Vanguard Marketing Corporation; Managing Director and General Counsel of Global Cards and Consumer Services at Citigroup (2014–2016); Counsel at American Express (2003–2014).
Michael Rollings
Born 1963. Treasurer Since February 2017. Principal Occupation(s) During the Past Five Years and Other Experience: Managing Director of The Vanguard Group, Inc.; Treasurer of each of the investment companies served by The Vanguard Group; Director of Vanguard Marketing Corporation; Executive Vice President and Chief Financial Officer of MassMutual Financial Group (2006–2016).
| |
| Vanguard Senior Management Team |
| |
| Mortimer J. Buckley | James M. Norris |
| John James | Thomas M. Rampulla |
| Martha G. King | Glenn W. Reed |
| John T. Marcante | Karin A. Risi |
| Chris D. McIsaac | Gregory Davis |
|
| Chairman Emeritus and Senior Advisor |
| |
| John J. Brennan |
| Chairman, 1996–2009 |
| Chief Executive Officer and President, 1996–2008 |
| |
| |
| Founder |
| |
| John C. Bogle |
| Chairman and Chief Executive Officer, 1974–1996 |
|  |
| | P.O. Box 2600 |
| | Valley Forge, PA 19482-2600 |
| |
| |
| |
| Connect with Vanguard® > vanguard.com |
| |
| |
| |
| Fund Information > 800-662-7447 | CFA® is a registered trademark owned by CFA |
| Direct Investor Account Services > 800-662-2739 | Institute. |
| Institutional Investor Services > 800-523-1036 | |
| Text Telephone for People | |
| Who Are Deaf or Hard of Hearing> 800-749-7273 | |
| |
| This material may be used in conjunction | |
| with the offering of shares of any Vanguard | |
| fund only if preceded or accompanied by | |
| the fund’s current prospectus. | |
| |
| All comparative mutual fund data are from Lipper, a | |
| Thomson Reuters Company, or Morningstar, Inc., unless | |
| otherwise noted. | |
| |
| You can obtain a free copy of Vanguard’s proxy voting | |
| guidelines by visiting vanguard.com/proxyreporting or by | |
| calling Vanguard at 800-662-2739. The guidelines are | |
| also available from the SEC’s website, sec.gov. In | |
| addition, you may obtain a free report on how your fund | |
| voted the proxies for securities it owned during the 12 | |
| months ended June 30. To get the report, visit either | |
| vanguard.com/proxyreporting or sec.gov. | |
| |
| You can review and copy information about your fund at | |
| the SEC’s Public Reference Room in Washington, D.C. To | |
| find out more about this public service, call the SEC at | |
| 202-551-8090. Information about your fund is also | |
| available on the SEC’s website, and you can receive | |
| copies of this information, for a fee, by sending a | |
| request in either of two ways: via email addressed to | |
| publicinfo@sec.gov or via regular mail addressed to the | |
| Public Reference Section, Securities and Exchange | |
| Commission, Washington, DC 20549-1520. | |
| | © 2017 The Vanguard Group, Inc. |
| | All rights reserved. |
| | Vanguard Marketing Corporation, Distributor. |
| |
| | Q522 092017 |

Semiannual Report | July 31, 2017
Vanguard REIT Index Fund
A new format, unwavering commitment
As you begin reading this report, you’ll notice that we’ve made some improvements to the opening sections—based on feedback from you, our clients.
Page 1 starts with a new ”Your Fund’s Performance at a Glance,” a concise, handy summary of how your fund performed during the period.
In the renamed ”Chairman’s Perspective,” Bill McNabb will focus on enduring principles and investment insights.
We’ve modified some tables, and eliminated some redundancy, but we haven’t removed any information.
At Vanguard, we’re always looking for better ways to communicate and to help you make sound investment decisions. Thank you for entrusting your assets to us.
| |
| Contents | |
| Your Fund’s Performance at a Glance. | 1 |
| Chairman’s Perspective. | 3 |
| Fund Profile. | 7 |
| Performance Summary. | 8 |
| Financial Statements. | 9 |
| About Your Fund’s Expenses. | 30 |
| Trustees Approve Advisory Arrangement. | 32 |
| Glossary. | 34 |

REIT Index Fund
Please note: The opinions expressed in this report are just that—informed opinions. They should not be considered promises or advice. Also, please keep in mind that the information and opinions cover the period through the date on the front of this report. Of course, the risks of investing in your fund are spelled out in the prospectus.
See the Glossary for definitions of investment terms used in this report.
About the cover: No matter what language you speak, Vanguard has one consistent message and set of principles. Our primary focus is on you, our clients. We conduct our business with integrity as a faithful steward of your assets. This message is shown translated into seven languages, reflecting our expanding global presence.
Your Fund’s Performance at a Glance
• For the six months ended July 31, 2017, Vanguard REIT Index Fund returned nearly 4% for Investor Shares. Returns for ETF, Admiral, and Institutional Shares were a bit higher. The results were in line with the fund’s benchmark index but a bit lower than those of its peer group.
• Real estate investment trusts (REITs) lagged the broad market largely because of higher interest rates, which raise REITs’ debt-financing costs and erode profit margins.
• Top-performing subsectors included industrial REITs (+24%), residential REITs (+12%), and health care REITs (+9%).
• The fund’s largest subsector, retail REITs (–10%), was the biggest detractor.
Results were held back by a general decline in the popularity of malls, store closures by national retailers, and an increase in online shopping. Office REITs (–4%) also produced negative results.
Total Returns: Six Months Ended July 31, 2017
| |
| | Total |
| | Returns |
| Vanguard REIT Index Fund | |
| Investor Shares | 3.85% |
| ETF Shares | |
| Market Price | 4.00 |
| Net Asset Value | 3.92 |
| Admiral™ Shares | 3.92 |
| Institutional Shares | 3.95 |
| MSCI US REIT Index | 3.98 |
| Real Estate Funds Average | 4.14 |
Real Estate Funds Average: Derived from data provided by Lipper, a Thomson Reuters Company.
Admiral Shares carry lower expenses and are available to investors who meet certain account-balance requirements. Institutional Shares are available to certain institutional investors who meet specific administrative, service, and account-size criteria. The Vanguard ETF® Shares shown are traded on the NYSE Arca exchange and are available only through brokers. The table provides ETF returns based on both the NYSE Arca market price and the net asset value for a share. U.S. Pat. Nos. 6,879,964; 7,337,138; 7,720,749; 7,925,573; 8,090,646; and 8,417,623.
For the ETF Shares, the market price is determined by the midpoint of the bid-offer spread as of the closing time of the New York Stock Exchange (generally 4 p.m., Eastern time). The net asset value is also determined as of the NYSE closing time. For more information about how the ETF Shares' market prices have compared with their net asset value, visit vanguard.com, select your ETF, and then select the Price and Performance tab. The ETF premium/discount analysis there shows the percentages of days on which the ETF Shares' market price was above or below the NAV.
1
| | | | | |
| Expense Ratios | | | | | |
| Your Fund Compared With Its Peer Group | | | | | |
| | Investor | ETF | Admiral | Institutional | Peer Group |
| | Shares | Shares | Shares | Shares | Average |
| REIT Index Fund | 0.26% | 0.12% | 0.12% | 0.10% | 1.28% |
The fund expense ratios shown are from the prospectus dated May 25, 2017, and represent estimated costs for the current fiscal year. For
the six months ended July 31, 2017, the fund’s annualized expense ratios were 0.26% for Investor Shares, 0.12% for ETF Shares, 0.12%
for Admiral Shares, and 0.10% for Institutional Shares. The peer-group expense ratio is derived from data provided by Lipper, a Thomson
Reuters Company, and captures information through year-end 2016.
Peer group: Real Estate Funds.
2
Chairman’s Perspective

Bill McNabb
Chairman and Chief Executive Officer
Dear Shareholder,
It’s said that fierce debates often generate more heat than light. And that’s been true of the ongoing face-off between sharply divided advocates of index funds and of actively managed funds.
For too long, the decision regarding active and index investing has been framed as either-or: Just pick a side and go all-in. But this choice is actually much more nuanced than a binary yes or no.
You may feel that your allegiance can belong to only one sports team, but you don’t have to approach investment strategies that way. (I’ll root for the Philadelphia Eagles no matter whom they’re playing, but my personal investment portfolio includes both index and active funds.)
Yes, indexing can be a valuable starting point for investors, and many may index their entire portfolio. But depending on your circumstances, an allocation to active management may be appropriate.
Recently published Vanguard research is illuminating on this point. Beyond helping you determine whether you’re a good candidate for active strategies, the paper Making the Implicit Explicit: A Framework for the Active-Passive Decision can help establish active and passive allocation targets for a range of investors. (You can read the paper at vanguard.com/research.)
3
Notching a record of outperformance
We’re a pioneer and leader in index fund investing, so why am I suggesting that active management may be appropriate?
Often overshadowed by our indexing reputation is Vanguard’s commitment to—and success with—active management. We oversee about $1 trillion in actively managed assets. And the results have been impressive, as the overwhelming majority of our active funds outperformed the average returns of their peers over the last decade.1 In addition, nearly half of our active funds have outperformed their benchmark indexes over the same period, a level of success that’s not easy to achieve.2
Make no mistake: The challenges of outperforming the market through active management are steep. So Vanguard has developed an approach with distinct characteristics that can improve your chances of success.
Chief among those advantages are low costs. As I’ve written before, paying less for your funds is one way to improve your odds of achieving success in active
| | | |
| Market Barometer | | | |
| | | | Total Returns |
| | | Periods Ended July 31, 2017 |
| | | | Five Years |
| | Six Months | One Year | (Annualized) |
| Stocks | | | |
| Russell 1000 Index (Large-caps) | 9.24% | 15.95% | 14.85% |
| Russell 2000 Index (Small-caps) | 5.35 | 18.45 | 14.19 |
| Russell 3000 Index (Broad U.S. market) | 8.94 | 16.14 | 14.79 |
| FTSE All-World ex US Index (International) | 14.05 | 18.81 | 8.11 |
| |
| Bonds | | | |
| Bloomberg Barclays U.S. Aggregate Bond Index | | | |
| (Broad taxable market) | 2.51% | -0.51% | 2.02% |
| Bloomberg Barclays Municipal Bond Index | | | |
| (Broad tax-exempt market) | 3.72 | 0.26 | 3.10 |
| Citigroup Three-Month U.S. Treasury Bill Index | 0.34 | 0.51 | 0.15 |
| |
| CPI | | | |
| Consumer Price Index | 0.80% | 1.73% | 1.33% |
The performance data shown represent past performance, which is not a guarantee of future results.
1 For the ten years ended June 30, 2017, 50 of 53 fixed income, 19 of 19 balanced, and 38 of 40 stock fund share classes—or 107 of
112 share classes of active Vanguard funds—outperformed their peer-group averages. Source: Vanguard, based on data from Lipper,
a Thomson Reuters Company.
2 For the ten years ended June 30, 2017, 21 of 53 fixed income, 5 of 19 balanced, and 23 of 40 stock fund share classes—or 49 of
112 share classes of active Vanguard funds—outperformed their benchmark indexes. Source: Vanguard, based on data from Lipper,
a Thomson Reuters Company.
4
management. Investors need to watch not only explicit costs, such as those reflected in fund expense ratios, but also implicit ones, such as trading costs, which can be significant because of the higher portfolio turnover associated with many active funds.
Historically, costs have been a reliable predictor of fund performance. But low costs don’t guarantee positive results. Talent is also critical. For this reason, Vanguard dedicates a lot of time, attention, and resources to manager selection and the ongoing oversight of managers.
Reaching beyond our walls
To serve our investors, we’re committed to identifying and attracting the best active managers across a range of investment styles and approaches. We recognize that not all great active managers reside in Valley Forge, Pennsylvania, where Vanguard is headquartered. As a result, we look across the world for managers for many of our active funds.
We oversee about $600 billion in assets that are managed by external advisors and partner with more than 25 firms employing hundreds of investment professionals and supporting analysts. These firms are responsible for more than 70 investment mandates within our active portfolios.
Stay patient and control taxes
Costs and manager selection are critical, but they aren’t the only necessities. You’ll also need a healthy supply of what many investors don’t possess in abundance: patience. Having the fortitude to wait is essential because even those active managers with the best track records go through significant periods of underperformance.
Patience is also crucial because investors in active strategies must stay disciplined and stick with them over time to take full advantage of the compounding benefits of outperformance. This is easy to say but often difficult to execute.
A few years ago, Vanguard looked at those actively managed domestic equity funds across the industry that did best over the previous 15 years. We found that even though these funds outperformed their benchmark indexes over that long period, 97% lagged the benchmarks in at least five calendar years. And two-thirds of the outperforming funds experienced at least three consecutive years of underperformance.3
Tax efficiency is another important consideration. In general, investors shouldn’t hold active strategies in an account that lacks tax protection.
3 Source: Vanguard calculations for the 15 years ended December 31, 2012, using data from Morningstar, Inc.
5
The tax drag associated with most active funds because of their higher turnover can be neutralized by holding the investments in tax-advantaged accounts, such as IRAs and 401(k) plans.
If you keep your focus on these four considerations—costs, manager selection, patience, and taxes—you’ll enhance your chances of achieving success with actively managed funds.
As always, thank you for investing with Vanguard.
Sincerely,

F. William McNabb III
Chairman and Chief Executive Officer
August 14, 2017
|
| Vanguard fund shareholders encouraged to vote in proxy campaign |
| |
| This summer we are asking you to vote on the election of trustees for all U.S.-domiciled |
| Vanguard funds, and on several fund policy proposals that we believe are in the best |
| interests of all shareholders. As a shareholder of the REIT Index Fund, you will also be |
| asked to vote on proposals that are specific to your fund. |
| |
| Vanguard filed a proxy statement on August 14, 2017, with the U.S. Securities and Exchange |
| Commission (SEC). Proxy materials are being provided to Vanguard fund shareholders with |
| instructions on how to vote online, by phone, or by mail. |
| |
| A shareholder meeting is scheduled to be held in Scottsdale, Arizona, on November 15, |
| 2017, when voting will conclude. We encourage you to vote promptly. Please visit |
| vanguard.com for updates. |
6
REIT Index Fund
Fund Profile
As of July 31, 2017
Share-Class Characteristics
| | | | |
| | Investor | | Admiral | Institutional |
| | Shares | ETF Shares | Shares | Shares |
| Ticker Symbol | VGSIX | VNQ | VGSLX | VGSNX |
| Expense Ratio1 | 0.26% | 0.12% | 0.12% | 0.10% |
| | | |
| Portfolio Characteristics | | |
| | | | DJ |
| | | | U.S. Total |
| | | MSCI US | Market |
| | Fund | REIT Index | FA Index |
| Number of Stocks | 158 | 156 | 3,786 |
| Median Market Cap $10.2B | $10.2B | $61.2B |
| Price/Earnings Ratio | 35.7x | 35.6x | 21.5x |
| Price/Book Ratio | 2.3x | 2.3x | 2.8x |
| Return on Equity | 5.0% | 5.0% | 15.1% |
| Earnings Growth Rate | 17.7% | 17.7% | 10.1% |
| Dividend Yield | 3.9% | 3.9% | 1.8% |
| Foreign Holdings | 0.0% | 0.0% | 0.0% |
| Turnover Rate | | | |
| (Annualized) | 6% | — | — |
| Short-Term Reserves | 0.2% | — | — |
Dividend Yield: This yield may include some payments that represent a return of capital, capital gains distributions, or both by the underlying REITs. These amounts are determined by each REIT at the end of its fiscal year.
| | |
| Subindustry Diversification (% of equity |
| exposure) | | |
| | | MSCI US |
| | Fund | REIT Index |
| Diversified REITs | 7.7% | 7.6% |
| Health Care REITs | 12.5 | 12.5 |
| Hotel & Resort REITs | 6.4 | 6.4 |
| Industrial REITs | 7.1 | 7.1 |
| Office REITs | 13.1 | 13.1 |
| Residential REITs | 16.7 | 16.7 |
| Retail REITs | 19.1 | 19.1 |
| Specialized REITs | 17.4 | 17.5 |
Sector categories are based on the Global Industry Classification Standard (“GICS”), except for the “Other” category (if applicable), which includes securities that have not been provided a GICS classification as of the effective reporting period.
| | |
| Volatility Measures | | |
| | | DJ |
| | | U.S. Total |
| | MSCI US | Market |
| | REIT Index | FA Index |
| R-Squared | 1.00 | 0.22 |
| Beta | 1.00 | 0.67 |
These measures show the degree and timing of the fund’s fluctuations compared with the indexes over 36 months.
| | |
| Ten Largest Holdings (% of total net assets) |
| Simon Property Group | | |
| Inc. | Retail REITs | 5.9% |
| Equinix Inc. | Specialized REITs | 4.1 |
| Prologis Inc. | Industrial REITs | 3.8 |
| Public Storage | Specialized REITs | 3.8 |
| Welltower Inc. | Health Care REITs | 3.1 |
| AvalonBay Communities | | |
| Inc. | Residential REITs | 3.1 |
| Equity Residential | Residential REITs | 2.9 |
| Ventas Inc. | Health Care REITs | 2.8 |
| Boston Properties Inc. | Office REITs | 2.2 |
| Digital Realty Trust Inc. | Office REITs | 2.1 |
| Top Ten | | 33.8% |
The holdings listed exclude any temporary cash investments and equity index products.
1 The expense ratios shown are from the prospectus dated May 25, 2017, and represent estimated costs for the current fiscal year. For the six
months ended July 31, 2017, the annualized expense ratios were 0.26% for Investor Shares, 0.12% for ETF Shares, 0.12% for Admiral Shares,
and 0.10% for Institutional Shares.
7
REIT Index Fund
Performance Summary
All of the returns in this report represent past performance, which is not a guarantee of future results that may be achieved by the fund. (Current performance may be lower or higher than the performance data cited. For performance data current to the most recent month-end, visit our website at vanguard.com/performance.) Note, too, that both investment returns and principal value can fluctuate widely, so an investor’s shares, when sold, could be worth more or less than their original cost. The returns shown do not reflect taxes that a shareholder would pay on fund distributions or on the sale of fund shares.
Fiscal-Year Total Returns (%): January 31, 2007, Through July 31, 2017
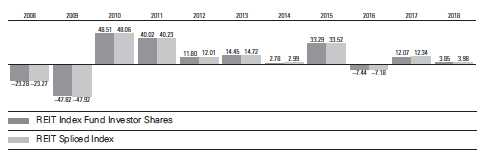
For a benchmark description, see the Glossary.
Note: For 2018, performance data reflect the six months ended July 31, 2017.
Average Annual Total Returns: Periods Ended June 30, 2017
This table presents returns through the latest calendar quarter—rather than through the end of the fiscal period.
Securities and Exchange Commission rules require that we provide this information.
| | | | |
| | Inception | One | Five | Ten |
| | Date | Year | Years | Years |
| Investor Shares | 5/13/1996 | -2.05% | 9.13% | 6.05% |
| ETF Shares | 9/23/2004 | | | |
| Market Price | | -1.89 | 9.30 | 6.20 |
| Net Asset Value | | -1.91 | 9.28 | 6.18 |
| Admiral Shares | 11/12/2001 | -1.93 | 9.28 | 6.18 |
| Institutional Shares | 12/2/2003 | -1.88 | 9.30 | 6.21 |
See Financial Highlights for dividend and capital gains information.
8
REIT Index Fund
Financial Statements (unaudited)
Statement of Net Assets
As of July 31, 2017
The fund reports a complete list of its holdings in regulatory filings four times in each fiscal year, at the quarter-ends. For the second and fourth fiscal quarters, the lists appear in the fund’s semiannual and annual reports to shareholders. For the first and third fiscal quarters, the fund files the lists with the Securities and Exchange Commission on Form N-Q. Shareholders can look up the fund’s Forms N-Q on the SEC’s website at sec.gov. Forms N-Q may also be reviewed and copied at the SEC’s Public Reference Room (see the back cover of this report for further information).
| | | |
| | | | Market |
| | | | Value• |
| | | Shares | ($000) |
| Equity Real Estate Investment | |
| Trusts (REITs) (99.8%)1 | | |
| Diversified REITs (7.6%) | | |
| 2 | VEREIT Inc. | 73,633,170 | 611,892 |
| 2 | Colony NorthStar Inc. | | |
| | Class A | 40,409,250 | 591,591 |
| 2 | WP Carey Inc. | 8,036,764 | 550,599 |
| 2 | Liberty Property Trust | 11,111,231 | 466,894 |
| 2 | Forest City Realty Trust | | |
| | Inc. Class A | 15,521,094 | 378,404 |
| 2 | Gramercy Property | | |
| | Trust | 11,315,085 | 341,942 |
| 2 | STORE Capital Corp. | 12,927,275 | 302,369 |
| 2 | Spirit Realty Capital Inc. | 36,552,037 | 289,858 |
| | Empire State Realty | | |
| | Trust Inc. | 9,991,034 | 208,713 |
| 2 | PS Business Parks Inc. | 1,538,993 | 206,933 |
| 2 | Washington REIT | 5,649,187 | 188,852 |
| 2 | Lexington Realty Trust | 16,134,388 | 164,248 |
| 2 | Select Income REIT | 5,071,399 | 119,026 |
| 2 | Global Net Lease Inc. | 5,010,806 | 110,238 |
| 2 | American Assets Trust | | |
| | Inc. | 2,633,126 | 106,931 |
| *,2 | iStar Inc. | 4,903,566 | 58,598 |
| 2 | Investors Real Estate | | |
| | Trust | 9,205,723 | 57,260 |
| 2 | First Potomac Realty | | |
| | Trust | 4,442,037 | 49,440 |
| 2 | Armada Hoffler | | |
| | Properties Inc. | 3,325,204 | 44,092 |
| 2 | Gladstone Commercial | | |
| | Corp. | 1,890,905 | 40,238 |
| 2 | One Liberty Properties | | |
| | Inc. | 1,005,147 | 24,706 |
| 2 | Winthrop Realty Trust | 1,892,511 | 15,172 |
| 2 | RAIT Financial Trust | 6,284,248 | 12,568 |
| | | | 4,940,564 |
| | | |
| | | | Market |
| | | | Value• |
| | | Shares | ($000) |
| Health Care REITs (12.5%) | | |
| 2 | Welltower Inc. | 27,406,940 | 2,011,395 |
| 2 | Ventas Inc. | 26,807,055 | 1,805,455 |
| 2 | HCP Inc. | 35,391,179 | 1,120,131 |
| ^,2 | Omega Healthcare | | |
| | Investors Inc. | 14,871,768 | 469,799 |
| 2 | Healthcare Trust of | | |
| | America Inc. Class A | 14,463,668 | 442,444 |
| 2 | Medical Properties | | |
| | Trust Inc. | 27,067,714 | 351,339 |
| 2 | Senior Housing | | |
| | Properties Trust | 17,959,579 | 349,314 |
| 2 | Healthcare Realty Trust | | |
| | Inc. | 8,803,886 | 293,169 |
| 2 | Physicians Realty Trust | 13,428,479 | 250,038 |
| 2 | National Health | | |
| | Investors Inc. | 3,011,661 | 232,651 |
| 2 | LTC Properties Inc. | 2,993,177 | 154,568 |
| 2 | Care Capital Properties | | |
| | Inc. | 6,348,531 | 153,761 |
| *,2 | Quality Care Properties | | |
| | Inc. | 7,076,926 | 119,034 |
| ^,2 | Sabra Health Care REIT | | |
| | Inc. | 4,936,415 | 114,525 |
| 2 | CareTrust REIT Inc. | 5,006,901 | 91,326 |
| 2 | Universal Health Realty | | |
| | Income Trust | 976,782 | 75,681 |
| 2 | New Senior Investment | | |
| | Group Inc. | 6,210,211 | 64,524 |
| | | | 8,099,154 |
| Hotel & Resort REITs (6.4%) | |
| 2 | Host Hotels & Resorts | | |
| | Inc. | 55,882,454 | 1,042,767 |
| 2 | Hospitality Properties | | |
| | Trust | 12,419,441 | 360,909 |
| 2 | Park Hotels & Resorts | | |
| | Inc. | 11,370,337 | 306,203 |
9
REIT Index Fund
| | | |
| | | | Market |
| | | | Value• |
| | | Shares | ($000) |
| 2 | Apple Hospitality REIT | | |
| | Inc. | 16,013,293 | 295,605 |
| 2 | Sunstone Hotel | | |
| | Investors Inc. | 16,660,490 | 271,233 |
| 2 | LaSalle Hotel Properties | 8,546,642 | 252,468 |
| 2 | Ryman Hospitality | | |
| | Properties Inc. | 3,470,344 | 217,209 |
| 2 | RLJ Lodging Trust | 9,422,929 | 199,389 |
| ^,2 | Pebblebrook Hotel Trust | 5,453,032 | 183,604 |
| 2 | DiamondRock | | |
| | Hospitality Co. | 15,137,679 | 176,808 |
| 2 | Xenia Hotels & Resorts | | |
| | Inc. | 8,082,424 | 164,235 |
| 2 | Summit Hotel | | |
| | Properties Inc. | 7,779,088 | 139,479 |
| ^,2 | MGM Growth | | |
| | Properties LLC Class A | 4,347,720 | 130,127 |
| 2 | Chesapeake Lodging | | |
| | Trust | 4,543,962 | 114,644 |
| 2 | FelCor Lodging Trust | | |
| | Inc. | 9,398,120 | 69,358 |
| 2 | Chatham Lodging Trust | 2,904,280 | 60,061 |
| 2 | Hersha Hospitality Trust | | |
| | Class A | 3,159,286 | 59,268 |
| 2 | Ashford Hospitality | | |
| | Trust Inc. | 7,280,284 | 45,793 |
| 2 | Ashford Hospitality | | |
| | Prime Inc. | 1,917,324 | 19,863 |
| | | | 4,109,023 |
| Industrial REITs (7.1%) | | |
| 2 | Prologis Inc. | 40,014,956 | 2,433,310 |
| 2 | Duke Realty Corp. | 26,877,223 | 768,420 |
| 2 | DCT Industrial Trust Inc. | 6,947,664 | 391,431 |
| 2 | First Industrial Realty | | |
| | Trust Inc. | 8,864,077 | 270,532 |
| 2 | EastGroup Properties | | |
| | Inc. | 2,519,011 | 219,607 |
| 2 | STAG Industrial Inc. | 6,204,112 | 169,310 |
| 2 | Rexford Industrial | | |
| | Realty Inc. | 5,037,487 | 143,669 |
| 2 | Terreno Realty Corp. | 3,592,867 | 124,385 |
| 2 | Monmouth Real Estate | | |
| | Investment Corp. | 4,829,584 | 74,424 |
| | | | 4,595,088 |
| Office REITs (13.1%) | | |
| 2 | Boston Properties Inc. | 11,625,498 | 1,405,639 |
| 2 | Vornado Realty Trust | 12,865,285 | 1,020,860 |
| 2 | Alexandria Real Estate | | |
| | Equities Inc. | 6,718,254 | 814,588 |
| 2 | SL Green Realty Corp. | 7,603,034 | 785,165 |
| 2 | Kilroy Realty Corp. | 7,390,725 | 512,990 |
| 2 | Douglas Emmett Inc. | 10,993,762 | 420,621 |
| 2 | Highwoods Properties | | |
| | Inc. | 7,686,290 | 395,998 |
| | | |
| | | | Market |
| | | | Value• |
| | | Shares | ($000) |
| 2 | Hudson Pacific | | |
| | Properties Inc. | 11,701,526 | 382,874 |
| *,2 | Equity Commonwealth | 9,380,275 | 296,229 |
| 2 | Cousins Properties Inc. | 31,642,818 | 290,797 |
| 2 | Corporate Office | | |
| | Properties Trust | 7,457,852 | 248,272 |
| 2 | Paramount Group Inc. | 14,825,169 | 242,688 |
| 2 | Piedmont Office Realty | | |
| | Trust Inc. Class A | 10,988,049 | 230,859 |
| *,2 | JBG SMITH Properties | 6,433,194 | 228,250 |
| 2 | Brandywine Realty | | |
| | Trust | 13,242,829 | 222,612 |
| 2 | Columbia Property | | |
| | Trust Inc. | 9,259,200 | 201,388 |
| 2 | Mack-Cali Realty Corp. | 6,442,549 | 169,052 |
| ^,2 | Government Properties | | |
| | Income Trust | 7,273,534 | 128,960 |
| 2 | New York REIT Inc. | 12,540,847 | 108,353 |
| 2 | Franklin Street | | |
| | Properties Corp. | 7,702,633 | 81,417 |
| 2 | Parkway Inc. | 3,342,117 | 76,902 |
| 2 | Tier REIT Inc. | 3,615,725 | 66,819 |
| 2 | Easterly Government | | |
| | Properties Inc. | 2,676,063 | 53,494 |
| 2 | NorthStar Realty | | |
| | Europe Corp. | 4,024,905 | 51,962 |
| | | | 8,436,789 |
| Residential REITs (16.7%) | | |
| 2 | AvalonBay | | |
| | Communities Inc. | 10,381,294 | 1,996,842 |
| 2 | Equity Residential | 27,750,145 | 1,888,675 |
| 2 | Essex Property Trust | | |
| | Inc. | 4,955,102 | 1,296,750 |
| 2 | Mid-America | | |
| | Apartment | | |
| | Communities Inc. | 8,583,194 | 888,618 |
| 2 | UDR Inc. | 20,211,126 | 790,053 |
| 2 | Camden Property Trust | 6,616,089 | 593,463 |
| 2 | Equity LifeStyle | | |
| | Properties Inc. | 6,230,632 | 543,934 |
| 2 | Apartment Investment | | |
| | & Management Co. | | |
| | Class A | 11,868,984 | 540,632 |
| 2 | Sun Communities Inc. | 5,919,702 | 526,913 |
| 2 | American Campus | | |
| | Communities Inc. | 9,985,516 | 478,706 |
| 2 | American Homes | | |
| | 4 Rent Class A | 17,457,140 | 401,689 |
| 2 | Starwood Waypoint | | |
| | Homes | 9,439,047 | 329,989 |
| ^,2 | Education Realty Trust | | |
| | Inc. | 5,531,539 | 207,709 |
| 2 | Monogram Residential | | |
| | Trust Inc. | 11,986,746 | 143,361 |
10
REIT Index Fund
| | | |
| | | | Market |
| | | | Value• |
| | | Shares | ($000) |
| ^,2 | Independence Realty | | |
| | Trust Inc. | 5,220,338 | 52,830 |
| 2 | Altisource Residential | | |
| | Corp. | 3,872,771 | 50,385 |
| 2 | UMH Properties Inc. | 2,049,171 | 33,893 |
| 2 | NexPoint Residential | | |
| | Trust Inc. | 1,194,525 | 29,971 |
| | | | 10,794,413 |
| Retail REITs (19.0%) | | |
| 2 | Simon Property Group | | |
| | Inc. | 24,176,498 | 3,831,975 |
| 2 | Realty Income Corp. | 19,673,568 | 1,122,574 |
| 2 | GGP Inc. | 46,827,261 | 1,058,764 |
| 2 | Regency Centers Corp. | 11,552,419 | 765,001 |
| 2 | Federal Realty | | |
| | Investment Trust | 5,190,540 | 688,421 |
| 2 | Kimco Realty Corp. | 31,563,383 | 636,949 |
| 2 | Macerich Co. | 9,246,024 | 530,629 |
| ^,2 | National Retail | | |
| | Properties Inc. | 11,129,517 | 444,958 |
| 2 | Brixmor Property | | |
| | Group Inc. | 22,589,919 | 442,537 |
| 2 | Weingarten Realty | | |
| | Investors | 9,199,112 | 298,603 |
| 2 | Taubman Centers Inc. | 4,575,540 | 260,211 |
| 2 | DDR Corp. | 23,548,042 | 239,955 |
| 2 | Retail Properties of | | |
| | America Inc. | 17,901,098 | 236,832 |
| 2 | Urban Edge Properties | 8,124,571 | 204,170 |
| 2 | Tanger Factory Outlet | | |
| | Centers Inc. | 7,278,434 | 192,369 |
| 2 | Acadia Realty Trust | 6,404,771 | 190,478 |
| 2 | Retail Opportunity | | |
| | Investments Corp. | 7,744,666 | 157,062 |
| 2 | Kite Realty Group Trust | 6,317,189 | 129,692 |
| 2 | Washington Prime | | |
| | Group Inc. | 14,020,599 | 126,466 |
| ^,2 | CBL & Associates | | |
| | Properties Inc. | 12,914,122 | 113,515 |
| 2 | Agree Realty Corp. | 2,141,585 | 105,302 |
| 2 | Ramco-Gershenson | | |
| | Properties Trust | 5,994,613 | 84,464 |
| ^,2 | Seritage Growth | | |
| | Properties Class A | 1,716,133 | 80,264 |
| | Alexander’s Inc. | 173,792 | 75,598 |
| 2 | Getty Realty Corp. | 2,492,184 | 64,747 |
| ^,2 | Pennsylvania REIT | 5,259,757 | 62,539 |
| | Saul Centers Inc. | 970,965 | 57,442 |
| | Urstadt Biddle | | |
| | Properties Inc. | | |
| | Class A | 2,170,647 | 45,453 |
| | | |
| | | | Market |
| | | | Value• |
| | | Shares | ($000) |
| 2 | Cedar Realty Trust Inc. | 6,463,815 | 33,483 |
| ^,2 | Whitestone REIT | 2,256,130 | 29,442 |
| | Urstadt Biddle | | |
| | Properties Inc. | 58,856 | 1,059 |
| | | | 12,310,954 |
| Specialized REITs (17.4%) | | |
| 2 | Equinix Inc. | 5,814,269 | 2,620,665 |
| 2 | Public Storage | 11,789,529 | 2,423,574 |
| 2 | Digital Realty Trust Inc. | 12,020,771 | 1,386,476 |
| 2 | Extra Space Storage | | |
| | Inc. | 9,517,914 | 756,674 |
| 2 | Iron Mountain Inc. | 18,938,214 | 689,919 |
| 2 | Gaming and Leisure | | |
| | Properties Inc. | 13,389,143 | 507,984 |
| 2 | DuPont Fabros | | |
| | Technology Inc. | 5,859,225 | 365,206 |
| 2 | CyrusOne Inc. | 5,993,097 | 357,848 |
| 2 | EPR Properties | 4,812,028 | 348,295 |
| 2 | CubeSmart | 13,622,225 | 335,924 |
| 2 | CoreSite Realty Corp. | 2,561,862 | 278,167 |
| 2 | GEO Group Inc. | 9,191,873 | 269,781 |
| 2 | Life Storage Inc. | 3,513,628 | 256,635 |
| 2 | CoreCivic Inc. | 8,893,539 | 246,351 |
| 2 | QTS Realty Trust Inc. | | |
| | Class A | 3,606,603 | 192,845 |
| 2 | Four Corners Property | | |
| | Trust Inc. | 4,534,808 | 115,093 |
| 2 | National Storage | | |
| | Affiliates Trust | 3,259,710 | 74,843 |
| | | | 11,226,280 |
| Total Equity Real Estate | | |
| Investment Trusts (REITs) | | |
| (Cost $56,209,126) | | 64,512,265 |
| Temporary Cash Investment (0.5%)1 | |
| Money Market Fund (0.5%) | |
| 3,4 | Vanguard Market | | |
| | Liquidity Fund, 1.217% | | |
| | (Cost $296,189) | 2,961,448 | 296,204 |
| Total Investments (100.3%) | |
| (Cost $56,505,315) | | 64,808,469 |
| Other Assets and Liabilities (-0.3%) | |
| Other Assets | | 98,322 |
| Liabilities 4 | | (283,670) |
| | | | (185,348) |
| Net Assets (100%) | | 64,623,121 |
11
REIT Index Fund
| |
| | Amount |
| | ($000) |
| Statement of Assets and Liabilities | |
| Assets | |
| Investments in Securities, at Value | |
| Unaffiliated Issuers | 388,265 |
| Other Affiliated Issuers | 64,420,204 |
| Total Investments in Securities | 64,808,469 |
| Investment in Vanguard | 4,125 |
| Receivables for Investment Securities | |
| Sold | 6,918 |
| Receivables for Accrued Income | 53,655 |
| Receivables for Capital Shares Issued | 32,969 |
| Other Assets | 655 |
| Total Assets | 64,906,791 |
| Liabilities | |
| Payables for Investment Securities | |
| Purchased | 9,492 |
| Collateral for Securities on Loan | 193,525 |
| Payables for Capital Shares Redeemed | 49,367 |
| Payables to Vanguard | 30,872 |
| Other Liabilities | 414 |
| Total Liabilities | 283,670 |
| Net Assets | 64,623,121 |
| |
| |
| At July 31, 2017, net assets consisted of: |
| | Amount |
| | ($000) |
| Paid-in Capital | 56,276,917 |
| Overdistributed Net Investment Income | (41,593) |
| Accumulated Net Realized Gains | 81,107 |
| Unrealized Appreciation (Depreciation) | |
| Investment Securities | 8,303,154 |
| Swap Contracts | 3,536 |
| Net Assets | 64,623,121 |
| |
| | Amount |
| | ($000) |
| Investor Shares—Net Assets | |
| Applicable to 91,423,438 outstanding | |
| $.001 par value shares of beneficial | |
| interest (unlimited authorization) | 2,558,220 |
| Net Asset Value Per Share— | |
| Investor Shares | $27.98 |
| |
| |
| ETF Shares—Net Assets | |
| Applicable to 412,673,020 outstanding |
| $.001 par value shares of beneficial | |
| interest (unlimited authorization) | 34,763,058 |
| Net Asset Value Per Share— | |
| ETF Shares | $84.24 |
| |
| |
| Admiral Shares—Net Assets | |
| Applicable to 157,408,791 outstanding |
| $.001 par value shares of beneficial | |
| interest (unlimited authorization) | 18,792,838 |
| Net Asset Value Per Share— | |
| Admiral Shares | $119.39 |
| |
| |
| Institutional Shares—Net Assets | |
| Applicable to 460,484,265 outstanding |
| $.001 par value shares of beneficial | |
| interest (unlimited authorization) | 8,509,005 |
| Net Asset Value Per Share— | |
| Institutional Shares | $18.48 |
• See Note A in Notes to Financial Statements.
* Non-income-producing security.
^ Includes partial security positions on loan to broker-dealers. The total value of securities on loan is $187,543,000.
1 The fund invests a portion of its assets in Real Estate Investment Trusts through the use of swap contracts. After giving effect to swap
investments, the fund’s effective Real Estate Investment Trust and temporary cash investment positions represent 100.0% and 0.3%,
respectively, of net assets.
2 Considered an affiliated company of the fund as the fund owns more than 5% of the outstanding voting securities of such company.
3 Affiliated money market fund available only to Vanguard funds and certain trusts and accounts managed by Vanguard. Rate shown
is the 7-day yield.
4 Includes $193,525,000 of collateral received for securities on loan.
REIT—Real Estate Investment Trust.
See accompanying Notes, which are an integral part of the Financial Statements.
12
REIT Index Fund
Statement of Operations
| |
| | Six Months Ended |
| | July 31, 2017 |
| | ($000) |
| Investment Income | |
| Income | |
| Dividends | 981,464 |
| Interest | 193 |
| Securities Lending—Net | 404 |
| Total Income | 982,061 |
| Expenses | |
| The Vanguard Group—Note B | |
| Investment Advisory Services | 2,106 |
| Management and Administrative—Investor Shares | 2,848 |
| Management and Administrative—ETF Shares | 16,389 |
| Management and Administrative—Admiral Shares | 9,374 |
| Management and Administrative—Institutional Shares | 3,430 |
| Marketing and Distribution—Investor Shares | 205 |
| Marketing and Distribution—ETF Shares | 844 |
| Marketing and Distribution—Admiral Shares | 778 |
| Marketing and Distribution—Institutional Shares | 172 |
| Custodian Fees | 383 |
| Shareholders’ Reports—Investor Shares | 215 |
| Shareholders’ Reports—ETF Shares | 2,062 |
| Shareholders’ Reports—Admiral Shares | 425 |
| Shareholders’ Reports—Institutional Shares | 64 |
| Trustees’ Fees and Expenses | 21 |
| Total Expenses | 39,316 |
| Net Investment Income | 942,745 |
| Realized Net Gain (Loss) | |
| Capital Gain Distributions Received | 151,614 |
| Investment Securities Sold | 893,912 |
| Futures Contracts | (59) |
| Swap Contracts | (7,569) |
| Realized Net Gain (Loss) | 1,037,898 |
| Change in Unrealized Appreciation (Depreciation) | |
| Investment Securities | 438,299 |
| Swap Contracts | 4,405 |
| Change in Unrealized Appreciation (Depreciation) | 442,704 |
| Net Increase (Decrease) in Net Assets Resulting from Operations | 2,423,347 |
See accompanying Notes, which are an integral part of the Financial Statements.
13
REIT Index Fund
Statement of Changes in Net Assets
| | |
| | Six Months Ended | Year Ended |
| | July 31, | January 31, |
| | 2017 | 2017 |
| | ($000) | ($000) |
| Increase (Decrease) in Net Assets | | |
| Operations | | |
| Net Investment Income | 942,745 | 1,637,151 |
| Realized Net Gain (Loss) | 1,037,898 | 2,373,668 |
| Change in Unrealized Appreciation (Depreciation) | 442,704 | 2,177,388 |
| Net Increase (Decrease) in Net Assets Resulting from Operations | 2,423,347 | 6,188,207 |
| Distributions | | |
| Net Investment Income | | |
| Investor Shares | (41,273) | (73,006) |
| ETF Shares | (579,064) | (913,086) |
| Admiral Shares | (308,938) | (491,479) |
| Institutional Shares | (135,199) | (213,737) |
| Realized Capital Gain | | |
| Investor Shares | — | (18,164) |
| ETF Shares | — | (218,412) |
| Admiral Shares | — | (117,607) |
| Institutional Shares | — | (50,930) |
| Return of Capital | | |
| Investor Shares | — | (33,133) |
| ETF Shares | — | (411,208) |
| Admiral Shares | — | (221,353) |
| Institutional Shares | — | (96,185) |
| Total Distributions | (1,064,474) | (2,858,300) |
| Capital Share Transactions | | |
| Investor Shares | (100,672) | (198,893) |
| ETF Shares | 518,353 | 4,811,962 |
| Admiral Shares | 46,851 | 2,316,263 |
| Institutional Shares | 533,365 | 564,537 |
| Net Increase (Decrease) from Capital Share Transactions | 997,897 | 7,493,869 |
| Total Increase (Decrease) | 2,356,770 | 10,823,776 |
| Net Assets | | |
| Beginning of Period | 62,266,351 | 51,442,575 |
| End of Period1 | 64,623,121 | 62,266,351 |
1 Net Assets—End of Period includes undistributed (overdistributed) net investment income of ($41,593,000) and $87,705,000.
See accompanying Notes, which are an integral part of the Financial Statements.
14
REIT Index Fund
Financial Highlights
Investor Shares
| | | | | | |
| Six Months | | | | | |
| | Ended | | | | | |
| For a Share Outstanding | July 31, | Year Ended January 31, |
| Throughout Each Period | 2017 | 2017 | 2016 | 2015 | 2014 | 2013 |
| Net Asset Value, Beginning of Period | $27.38 | $25.59 | $28.73 | $22.37 | $22.66 | $20.50 |
| Investment Operations | | | | | | |
| Net Investment Income | .391 | .746 | .711 | .645 | .579 | .514 |
| Net Realized and Unrealized Gain (Loss) | | | | | | |
| on Investments | .653 | 2.324 | (2.851) | 6.650 | .025 | 2.393 |
| Total from Investment Operations | 1.044 | 3.070 | (2.140) | 7.295 | .604 | 2.907 |
| Distributions | | | | | | |
| Dividends from Net Investment Income | (.444) | (.752) | (.695) | (.624) | (.626) | (.514) |
| Distributions from Realized Capital Gains | — | (.187) | — | — | — | — |
| Return of Capital | — | (.341) | (.305) | (.311) | (.268) | (.233) |
| Total Distributions | (.444) | (1.280) | (1.000) | (.935) | (.894) | (.747) |
| Net Asset Value, End of Period | $27.98 | $27.38 | $25.59 | $28.73 | $22.37 | $22.66 |
| |
| Total Return1 | 3.85% | 12.07% | -7.44% | 33.29% | 2.78% | 14.45% |
| |
| Ratios/Supplemental Data | | | | | | |
| Net Assets, End of Period (Millions) | $2,558 | $2,603 | $2,621 | $3,231 | $2,482 | $2,817 |
| Ratio of Total Expenses to | | | | | | |
| Average Net Assets | 0.26% | 0.26% | 0.26% | 0.26% | 0.24% | 0.24% |
| Ratio of Net Investment Income to | | | | | | |
| Average Net Assets | 2.87% | 2.60% | 2.66% | 2.56% | 2.51% | 2.39% |
| Portfolio Turnover Rate2 | 6% | 7% | 11% | 8% | 11% | 9% |
The expense ratio, net investment income ratio, and turnover rate for the current period have been annualized.
1 Total returns do not include transaction or account service fees that may have applied in the periods shown. Fund prospectuses provide information about any applicable transaction and account service fees.
2 Excludes the value of portfolio securities received or delivered as a result of in-kind purchases or redemptions of the fund’s capital shares, including ETF Creation Units.
See accompanying Notes, which are an integral part of the Financial Statements.
15
| | | | | | |
| REIT Index Fund | | | | | | |
| |
| |
| Financial Highlights | | | | | | |
| |
| |
| ETF Shares | | | | | | |
| Six Months | | | | | |
| | Ended | | | | | |
| For a Share Outstanding | July 31, | Year Ended January 31, |
| Throughout Each Period | 2017 | 2017 | 2016 | 2015 | 2014 | 2013 |
| Net Asset Value, Beginning of Period | $82.43 | $77.05 | $86.49 | $67.36 | $68.24 | $61.72 |
| Investment Operations | | | | | | |
| Net Investment Income | 1.236 | 2.334 | 2.217 | 2.011 | 1.814 | 1.613 |
| Net Realized and Unrealized Gain (Loss) | | | | | | |
| on Investments | 1.970 | 7.022 | (8.533) | 20.038 | .097 | 7.250 |
| Total from Investment Operations | 3.206 | 9.356 | (6.316) | 22.049 | 1.911 | 8.863 |
| Distributions | | | | | | |
| Dividends from Net Investment Income | (1.396) | (2.353) | (2.170) | (1.947) | (1.955) | (1.612) |
| Distributions from Realized Capital Gains | — | (.563) | — | — | — | — |
| Return of Capital | — | (1.060) | (.954) | (.972) | (.836) | (.731) |
| Total Distributions | (1.396) | (3.976) | (3.124) | (2.919) | (2.791) | (2.343) |
| Net Asset Value, End of Period | $84.24 | $82.43 | $77.05 | $86.49 | $67.36 | $68.24 |
| |
| Total Return | 3.92% | 12.25% | -7.31% | 33.41% | 2.93% | 14.64% |
| |
| Ratios/Supplemental Data | | | | | | |
| Net Assets, End of Period (Millions) | $34,763 | $33,527 | $27,007 | $29,487 | $18,528 | $16,983 |
| Ratio of Total Expenses to | | | | | | |
| Average Net Assets | 0.12% | 0.12% | 0.12% | 0.12% | 0.10% | 0.10% |
| Ratio of Net Investment Income to | | | | | | |
| Average Net Assets | 3.01% | 2.74% | 2.80% | 2.70% | 2.65% | 2.53% |
| Portfolio Turnover Rate1 | 6% | 7% | 11% | 8% | 11% | 9% |
The expense ratio, net investment income ratio, and turnover rate for the current period have been annualized.
1 Excludes the value of portfolio securities received or delivered as a result of in-kind purchases or redemptions of the fund’s capital shares, including ETF Creation Units.
See accompanying Notes, which are an integral part of the Financial Statements.
16
| | | | | | |
| REIT Index Fund | | | | | | |
| |
| |
| Financial Highlights | | | | | | |
| |
| |
| Admiral Shares | | | | | | |
| Six Months | | | | | |
| | Ended | | | | | |
| For a Share Outstanding | July 31, | Year Ended January 31, |
| Throughout Each Period | 2017 | 2017 | 2016 | 2015 | 2014 | 2013 |
| Net Asset Value, Beginning of Period | $116.83 | $109.19 | $122.58 | $95.46 | $96.70 | $87.47 |
| Investment Operations | | | | | | |
| Net Investment Income | 1.749 | 3.306 | 3.142 | 2.852 | 2.569 | 2.285 |
| Net Realized and Unrealized Gain (Loss) | | | | | | |
| on Investments | 2.788 | 9.966 | (12.105) | 28.403 | .148 | 10.263 |
| Total from Investment Operations | 4.537 | 13.272 | (8.963) | 31.255 | 2.717 | 12.548 |
| Distributions | | | | | | |
| Dividends from Net Investment Income | (1.977) | (3.333) | (3.076) | (2.758) | (2.772) | (2.283) |
| Distributions from Realized Capital Gains | — | (.798) | — | — | — | — |
| Return of Capital | — | (1.501) | (1.351) | (1.377) | (1.185) | (1.035) |
| Total Distributions | (1.977) | (5.632) | (4.427) | (4.135) | (3.957) | (3.318) |
| Net Asset Value, End of Period | $119.39 | $116.83 | $109.19 | $122.58 | $95.46 | $96.70 |
| |
| Total Return1 | 3.92% | 12.23% | -7.30% | 33.46% | 2.94% | 14.63% |
| |
| Ratios/Supplemental Data | | | | | | |
| Net Assets, End of Period (Millions) | $18,793 | $18,337 | $15,029 | $15,725 | $7,987 | $7,399 |
| Ratio of Total Expenses to | | | | | | |
| Average Net Assets | 0.12% | 0.12% | 0.12% | 0.12% | 0.10% | 0.10% |
| Ratio of Net Investment Income to | | | | | | |
| Average Net Assets | 3.01% | 2.74% | 2.80% | 2.70% | 2.65% | 2.53% |
| Portfolio Turnover Rate2 | 6% | 7% | 11% | 8% | 11% | 9% |
The expense ratio, net investment income ratio, and turnover rate for the current period have been annualized.
1 Total returns do not include transaction or account service fees that may have applied in the periods shown. Fund prospectuses provide information about any applicable transaction and account service fees.
2 Excludes the value of portfolio securities received or delivered as a result of in-kind purchases or redemptions of the fund’s capital shares, including ETF Creation Units.
See accompanying Notes, which are an integral part of the Financial Statements.
17
| | | | | | |
| REIT Index Fund | | | | | | |
| |
| |
| Financial Highlights | | | | | | |
| |
| |
| Institutional Shares | | | | | | |
| Six Months | | | | | |
| | Ended | | | | | |
| For a Share Outstanding | July 31, | Year Ended January 31, |
| Throughout Each Period | 2017 | 2017 | 2016 | 2015 | 2014 | 2013 |
| Net Asset Value, Beginning of Period | $18.08 | $16.90 | $18.97 | $14.78 | $14.97 | $13.54 |
| Investment Operations | | | | | | |
| Net Investment Income | .273 | .515 | .489 | .444 | .400 | .356 |
| Net Realized and Unrealized Gain (Loss) | | | | | | |
| on Investments | .435 | 1.540 | (1.870) | 4.390 | .025 | 1.590 |
| Total from Investment Operations | .708 | 2.055 | (1.381) | 4.834 | .425 | 1.946 |
| Distributions | | | | | | |
| Dividends from Net Investment Income | (.308) | (.519) | (.479) | (.430) | (.431) | (.355) |
| Distributions from Realized Capital Gains | — | (.123) | — | — | — | — |
| Return of Capital | — | (.233) | (.210) | (.214) | (.184) | (.161) |
| Total Distributions | (.308) | (.875) | (.689) | (.644) | (.615) | (.516) |
| Net Asset Value, End of Period | $18.48 | $18.08 | $16.90 | $18.97 | $14.78 | $14.97 |
| |
| Total Return1 | 3.95% | 12.23% | -7.27% | 33.43% | 2.97% | 14.66% |
| |
| Ratios/Supplemental Data | | | | | | |
| Net Assets, End of Period (Millions) | $8,509 | $7,799 | $6,785 | $6,788 | $3,922 | $3,185 |
| Ratio of Total Expenses to | | | | | | |
| Average Net Assets | 0.10% | 0.10% | 0.10% | 0.10% | 0.08% | 0.08% |
| Ratio of Net Investment Income to | | | | | | |
| Average Net Assets | 3.03% | 2.76% | 2.82% | 2.72% | 2.67% | 2.55% |
| Portfolio Turnover Rate2 | 6% | 7% | 11% | 8% | 11% | 9% |
The expense ratio, net investment income ratio, and turnover rate for the current period have been annualized.
1 Total returns do not include transaction fees that may have applied in the periods shown. Fund prospectuses provide information about any applicable transaction fees.
2 Excludes the value of portfolio securities received or delivered as a result of in-kind purchases or redemptions of the fund’s capital shares, including ETF Creation Units.
See accompanying Notes, which are an integral part of the Financial Statements.
18
REIT Index Fund
Notes to Financial Statements
Vanguard REIT Index Fund is registered under the Investment Company Act of 1940 as an open-end investment company, or mutual fund. The fund offers four classes of shares: Investor Shares, ETF Shares, Admiral Shares, and Institutional Shares. Investor Shares are available to any investor who meets the fund’s minimum purchase requirements. ETF Shares are listed for trading on NYSE Arca; they can be purchased and sold through a broker. Admiral Shares and Institutional Shares are designed for investors who meet certain administrative, service, and account-size criteria.
A. The following significant accounting policies conform to generally accepted accounting principles for U.S. investment companies. The fund consistently follows such policies in preparing its financial statements.
1. Security Valuation: Securities are valued as of the close of trading on the New York Stock Exchange (generally 4 p.m., Eastern time) on the valuation date. Equity securities are valued at the latest quoted sales prices or official closing prices taken from the primary market in which each security trades; such securities not traded on the valuation date are valued at the mean of the latest quoted bid and asked prices. Securities for which market quotations are not readily available, or whose values have been materially affected by events occurring before the fund’s pricing time but after the close of the securities’ primary markets, are valued by methods deemed by the board of trustees to represent fair value. Investments in Vanguard Market Liquidity Fund are valued at that fund’s net asset value.
2. Futures Contracts: The fund uses index futures contracts to a limited extent, with the objectives of maintaining full exposure to the stock market, enhancing returns, maintaining liquidity, and minimizing transaction costs. The fund may purchase futures contracts to immediately invest incoming cash in the market, or sell futures in response to cash outflows, thereby simulating a fully invested position in the underlying index while maintaining a cash balance for liquidity. The fund may seek to enhance returns by using futures contracts instead of the underlying securities when futures are believed to be priced more attractively than the underlying securities. The primary risks associated with the use of futures contracts are imperfect correlation between changes in market values of stocks held by the fund and the prices of futures contracts, and the possibility of an illiquid market. Counterparty risk involving futures is mitigated because a regulated clearinghouse is the counterparty instead of the clearing broker. To further mitigate counterparty risk, the fund trades futures contracts on an exchange, monitors the financial strength of its clearing brokers and clearinghouse, and has entered into clearing agreements with its clearing brokers. The clearing-house imposes initial margin requirements to secure the fund’s performance and requires daily settlement of variation margin representing changes in the market value of each contract.
Futures contracts are valued at their quoted daily settlement prices. The aggregate settlement values of the contracts are not recorded in the Statement of Assets and Liabilities. Fluctuations in the value of the contracts are recorded in the Statement of Assets and Liabilities as an asset (liability) and in the Statement of Operations as unrealized appreciation (depreciation) until the contracts are closed, when they are recorded as realized futures gains (losses).
During the six months ended July 31, 2017, the fund’s average investments in long and short futures contracts represented less than 1% and 0%, respectively, of net assets, on the average of aggregate settlement values at each quarter-end during the period. The fund had no open futures contracts at July 31, 2017.
19
REIT Index Fund
3. Swap Contracts: The fund has entered into equity swap contracts to earn the total return on selected reference stocks in the fund’s target index. Under the terms of the swaps, the fund receives the total return on the referenced stock (i.e., receiving the increase or paying the decrease in value of the selected reference stock and receiving the equivalent of any dividends in respect of the selected referenced stock) over a specified period of time, applied to a notional amount that represents the value of a designated number of shares of the selected reference stock at the beginning of the equity swap contract. The fund also pays a floating rate that is based on short-term interest rates, applied to the notional amount. At the same time, the fund invests an amount approximating the notional amount of the swap in high-quality temporary cash investments.
The notional amounts of swap contracts are not recorded in the Statement of Assets and Liabilities. Swaps are valued daily based on market quotations received from independent pricing services or recognized dealers and the change in value is recorded in the Statement of Assets and Liabilities as an asset (liability) and in the Statement of Operations as unrealized appreciation (depreciation) until termination of the swap, at which time realized gain (loss) is recorded. A risk associated with all types of swaps is the possibility that a counterparty may default on its obligation to pay net amounts due to the fund. The fund’s maximum amount subject to counterparty risk is the unrealized appreciation on the swap contract. The fund mitigates its counterparty risk by entering into swaps only with a diverse group of prequalified counterparties, monitoring their financial strength, entering into master netting arrangements with its counterparties, and requiring its counterparties to transfer collateral as security for their performance. In the absence of a default, the collateral pledged or received by the fund cannot be repledged, resold, or rehypothecated.
In the event of a counterparty’s default (including bankruptcy), the fund may terminate any swap contracts with that counterparty, determine the net amount owed by either party in accordance with its master netting arrangements, and sell or retain any collateral held up to the net amount owed to the fund under the master netting arrangements. The swap contracts contain provisions whereby a counterparty may terminate open contracts if the fund net assets decline below a certain level, triggering a payment by the fund if the fund is in a net liability position at the time of the termination. The payment amount would be reduced by any collateral the fund has pledged. Any securities pledged as collateral for open contracts are noted in the Statement of Assets and Liabilities. The value of collateral received or pledged is compared daily to the value of the swap contracts exposure with each counterparty, and any difference, if in excess of a specified minimum transfer amount, is adjusted and settled within two business days.
During the six months ended July 31, 2017, the fund’s average amounts of investments in total return swaps represented less than 1% of net assets, based on the average of notional amounts at each quarter-end during the period.
4. Federal Income Taxes: The fund intends to continue to qualify as a regulated investment company and distribute all of its taxable income. Management has analyzed the fund’s tax positions taken for all open federal income tax years (January 31, 2014–2017), and for the period ended July 31, 2017, and has concluded that no provision for federal income tax is required in the fund’s financial statements.
5. Distributions: Distributions to shareholders are recorded on the ex-dividend date. Distributions declared by the fund are reallocated at fiscal year-end to ordinary income, capital gain, and return of capital to reflect their tax character.
20
REIT Index Fund
6. Securities Lending: To earn additional income, the fund lends its securities to qualified institutional borrowers. Security loans are subject to termination by the fund at any time, and are required to be secured at all times by collateral in an amount at least equal to the market value of securities loaned. Daily market fluctuations could cause the value of loaned securities to be more or less than the value of the collateral received. When this occurs, the collateral is adjusted and settled on the next business day. The fund further mitigates its counterparty risk by entering into securities lending transactions only with a diverse group of prequalified counterparties, monitoring their financial strength, and entering into master securities lending agreements with its counterparties. The master securities lending agreements provide that, in the event of a counterparty’s default (including bankruptcy), the fund may terminate any loans with that borrower, determine the net amount owed, and sell or retain the collateral up to the net amount owed to the fund; however, such actions may be subject to legal proceedings. While collateral mitigates counterparty risk, in the event of a default, the fund may experience delays and costs in recovering the securities loaned. The fund invests cash collateral received in Vanguard Market Liquidity Fund, and records a liability in the Statement of Assets and Liabilities for the return of the collateral, during the period the securities are on loan. Securities lending income represents fees charged to borrowers plus income earned on invested cash collateral, less expenses associated with the loan. During the term of the loan, the fund is entitled to all distributions made on or in respect of the loaned securities.
7. Credit Facility: The fund and certain other funds managed by The Vanguard Group (“Vanguard”) participate in a $3.1 billion committed credit facility provided by a syndicate of lenders pursuant to a credit agreement that may be renewed annually; each fund is individually liable for its borrowings, if any, under the credit facility. Borrowings may be utilized for temporary and emergency purposes, and are subject to the fund’s regulatory and contractual borrowing restrictions. The participating funds are charged administrative fees and an annual commitment fee of 0.10% of the undrawn amount of the facility; these fees are allocated to the funds based on a method approved by the fund’s board of trustees and included in Management and Administrative expenses on the fund’s Statement of Operations. Any borrowings under this facility bear interest at a rate based upon the higher of the one-month London Interbank Offered Rate, federal funds effective rate, or overnight bank funding rate plus an agreed-upon spread.
The fund had no borrowings outstanding at July 31, 2017, or at any time during the period then ended.
8. Other: Distributions received from REITs are recorded on the ex-dividend date. Each REIT reports annually the tax character of its distributions. Dividend income, capital gain distributions received, and unrealized appreciation (depreciation) reflect the amounts of taxable income, capital gain, and return of capital reported by the REITs, and management’s estimates of such amounts for REIT distributions for which actual information has not been reported. Interest income includes income distributions received from Vanguard Market Liquidity Fund and is accrued daily. Premiums and discounts on debt securities purchased are amortized and accreted, respectively, to interest income over the lives of the respective securities. Security transactions are accounted for on the date securities are bought or sold. Costs used to determine realized gains (losses) on the sale of investment securities are those of the specific securities sold. Fees assessed on redemptions of capital shares are credited to paid-in capital.
21
REIT Index Fund
Each class of shares has equal rights as to assets and earnings, except that each class separately bears certain class-specific expenses related to maintenance of shareholder accounts (included in Management and Administrative expenses) and shareholder reporting. Marketing and distribution expenses are allocated to each class of shares based on a method approved by the board of trustees. Income, other non-class-specific expenses, and gains and losses on investments are allocated to each class of shares based on its relative net assets.
B. In accordance with the terms of a Funds’ Service Agreement (the “FSA”) between Vanguard and the fund, Vanguard furnishes to the fund investment advisory, corporate management, administrative, marketing, and distribution services at Vanguard’s cost of operations (as defined by the FSA). These costs of operations are allocated to the fund based on methods and guidelines approved by the board of trustees. Vanguard does not require reimbursement in the current period for certain costs of operations (such as deferred compensation/benefits and risk/insurance costs); the fund’s liability for these costs of operations is included in Payables to Vanguard on the Statement of Assets and Liabilities.
Upon the request of Vanguard, the fund may invest up to 0.40% of its net assets as capital in Vanguard. At July 31, 2017, the fund had contributed to Vanguard capital in the amount of $4,125,000, representing 0.01% of the fund’s net assets and 1.65% of Vanguard’s capitalization. The fund’s trustees and officers are also directors and employees, respectively, of Vanguard.
C. Various inputs may be used to determine the value of the fund’s investments. These inputs are summarized in three broad levels for financial statement purposes. The inputs or methodologies used to value securities are not necessarily an indication of the risk associated with investing in those securities.
Level 1—Quoted prices in active markets for identical securities.
Level 2—Other significant observable inputs (including quoted prices for similar securities, interest rates, prepayment speeds, credit risk, etc.).
Level 3—Significant unobservable inputs (including the fund’s own assumptions used to determine the fair value of investments).
The following table summarizes the market value of the fund’s investments as of July 31, 2017, based on the inputs used to value them:
| | | |
| | Level 1 | Level 2 | Level 3 |
| Investments | ($000) | ($000) | ($000) |
| Real Estate Investment Trusts | 64,497,093 | — | 15,172 |
| Temporary Cash Investments | 296,204 | — | — |
| Swap Contracts—Assets | — | 3,536 | — |
| Total | 64,793,297 | 3,536 | 15,172 |
22
REIT Index Fund
D. At July 31, 2017, the fund had the following open total return swap contracts:
| | | | | |
| | | | | Floating | Unrealized |
| | | | Notional | Interest Rate | Appreciation |
| Termination | | Amount | Received | (Depreciation) |
| Reference Entity | Date | Counterparty | ($000) | (Paid) | ($000) |
| Brixmor Property Group Inc. | 8/28/17 | GSCM | 7,875 | (1.228%) | 349 |
| Federal Realty Investment Trust | 8/28/17 | GSCM | 33,543 | (1.228%) | 926 |
| Gaming and Leisure Properties Inc. | 9/21/17 | GSCM | 56,717 | (1.228%) | 1,298 |
| Kimco Realty Corp. | 8/28/17 | GSCM | 11,547 | (1.228%) | 756 |
| Retail Opportunity Investment Corp. | 8/28/17 | GSCM | 10,536 | (1.228%) | 207 |
| | | | | | 3,536 |
GSCM—Goldman Sachs Capital Management.
At July 31, 2017, a counterparty had deposited in a segregated account cash of $3,250,000 in connection with open swap contracts.
E. Distributions are determined on a tax basis and may differ from net investment income and realized capital gains for financial reporting purposes. Differences may be permanent or temporary. Permanent differences are reclassified among capital accounts in the financial statements to reflect their tax character. Temporary differences arise when certain items of income, expense, gain, or loss are recognized in different periods for financial statement and tax purposes. These differences will reverse at some time in the future. Differences in classification may also result from the treatment of short-term gains as ordinary income for tax purposes. The fund’s tax-basis capital gains and losses are determined only at the end of each fiscal year.
During the six months ended July 31, 2017, the fund realized $964,360,000 of net capital gains resulting from in-kind redemptions—in which shareholders exchanged fund shares for securities held by the fund rather than for cash. Because such gains are not taxable to the fund, and are not distributed to shareholders, they have been reclassified from accumulated net realized gains to paid-in capital.
At July 31, 2017, the cost of investment securities for tax purposes was $56,505,315,000. Net unrealized appreciation of investment securities for tax purposes was $8,303,154,000, consisting of unrealized gains of $10,110,905,000 on securities that had risen in value since their purchase and $1,807,751,000 in unrealized losses on securities that had fallen in value since their purchase.
F. During the six months ended July 31, 2017, the fund purchased $5,806,406,000 of investment securities and sold $4,673,746,000 of investment securities, other than temporary cash investments. Purchases and sales include $2,629,190,000 and $2,793,012,000, respectively, in connection with in-kind purchases and redemptions of the fund’s capital shares.
23
REIT Index Fund
G. Capital share transactions for each class of shares were:
| | | | |
| | Six Months Ended | | Year Ended |
| | | July 31, 2017 | January 31, 2017 |
| | Amount | Shares | Amount | Shares |
| | ($000) | (000) | ($000) | (000) |
| Investor Shares | | | | |
| Issued | 200,661 | 7,262 | 565,677 | 20,200 |
| Issued in Lieu of Cash Distributions | 38,733 | 1,409 | 117,019 | 4,262 |
| Redeemed | (340,066) | (12,315) | (881,589) | (31,830) |
| Net Increase (Decrease)—Investor Shares | (100,672) | (3,644) | (198,893) | (7,368) |
| ETF Shares | | | | |
| Issued | 3,314,286 | 39,668 | 9,698,505 | 115,071 |
| Issued in Lieu of Cash Distributions | — | — | — | — |
| Redeemed | (2,795,933) | (33,700) | (4,886,543) | (58,900) |
| Net Increase (Decrease)—ETF Shares | 518,353 | 5,968 | 4,811,962 | 56,171 |
| Admiral Shares | | | | |
| Issued | 1,729,137 | 14,685 | 4,651,310 | 39,078 |
| Issued in Lieu of Cash Distributions | 272,060 | 2,319 | 737,270 | 6,295 |
| Redeemed | (1,954,346) | (16,551) | (3,072,317) | (26,057) |
| Net Increase (Decrease)—Admiral Shares | 46,851 | 453 | 2,316,263 | 19,316 |
| Institutional Shares | | | | |
| Issued | 1,163,449 | 63,645 | 1,775,348 | 96,049 |
| Issued in Lieu of Cash Distributions | 125,228 | 6,897 | 334,740 | 18,463 |
| Redeemed | (755,312) | (41,371) | (1,545,551) | (84,706) |
| Net Increase (Decrease)—Institutional Shares | 533,365 | 29,171 | 564,537 | 29,806 |
H. Certain of the fund’s investments are in companies that are considered to be affiliated companies of the fund because the fund owns more than 5% of the outstanding voting securities of the company or the issuer is another member of The Vanguard Group. Transactions during the period in securities of these companies were as follows:
| | | | | | |
| | | Current Period Transactions | |
| | January 31, | | Proceeds | | | July 31, |
| | 2017 | | from | | Capital Gain | 2017 |
| | Market | Purchases | Securities | | Distributions | Market |
| | Value | at Cost | Sold1 | Income | Received | Value |
| | ($000) | ($000) | ($000) | ($000) | ($000) | ($000) |
| Acadia Realty Trust | 196,914 | 16,858 | 10,803 | 2,194 | 1,052 | 190,478 |
| Agree Realty Corp. | 93,077 | 13,284 | 5,724 | 1,670 | — | 105,302 |
| Alexandria Real Estate | | | | | | |
| Equities Inc. | 661,333 | 132,753 | 44,659 | 5,973 | 2,608 | 814,588 |
| Altisource Residential Corp. | — | 54,179 | 955 | 574 | — | 50,385 |
| American Assets Trust Inc. | 111,900 | 6,668 | 5,591 | 1,112 | 20 | 106,931 |
24
REIT Index Fund
| | | | | | |
| | | Current Period Transactions | |
| January 31, | | Proceeds | | | July 31, |
| | 2017 | | from | | Capital Gain | 2017 |
| | Market | Purchases | Securities | | Distributions | Market |
| | Value | at Cost | Sold1 | Income | Received | Value |
| | ($000) | ($000) | ($000) | ($000) | ($000) | ($000) |
| American Campus | | | | | | |
| Communities Inc. | 485,474 | 32,626 | 32,163 | 3,191 | 1,901 | 478,706 |
| American Homes 4 Rent | | | | | | |
| Class A | 364,865 | 53,324 | 28,594 | 886 | 42 | 401,689 |
| Apartment Investment | | | | | | |
| & Management Co. Class A | 526,976 | 33,554 | 37,269 | 2,366 | 6,261 | 540,632 |
| Apple Hospitality REIT Inc. | 254,259 | 85,629 | 20,061 | 7,719 | 405 | 295,605 |
| Armada Hoffler Properties Inc. | 35,538 | 12,467 | 2,574 | 1,160 | — | 44,092 |
| Ashford Hospitality Prime Inc. | 23,972 | 5,168 | 3,269 | 410 | 205 | 19,863 |
| Ashford Hospitality Trust Inc. | 56,353 | 2,557 | 3,357 | — | — | 45,793 |
| AvalonBay Communities Inc. | 1,821,329 | 131,440 | 156,004 | 20,879 | 8,528 | 1,996,842 |
| Boston Properties Inc. | 1,539,727 | 101,219 | 118,775 | 15,963 | 1,429 | 1,405,639 |
| Brandywine Realty Trust | 215,857 | 13,530 | 16,335 | 1,810 | 1,790 | 222,612 |
| Brixmor Property Group Inc. | 561,990 | 28,622 | 43,610 | 11,621 | — | 442,537 |
| Camden Property Trust | 559,077 | 35,842 | 41,796 | 3,758 | 6,139 | 593,463 |
| Care Capital Properties Inc. | 158,877 | 9,836 | 11,976 | 7,082 | 127 | 153,761 |
| CareTrust REIT Inc. | 71,948 | 8,592 | 4,244 | 1,557 | — | 91,326 |
| CBL & Associates | | | | | | |
| Properties Inc. | 134,770 | 10,056 | 5,010 | 6,832 | — | 113,515 |
| Cedar Realty Trust Inc. | 38,029 | 2,732 | 1,818 | 147 | — | 33,483 |
| Chatham Lodging Trust | 59,483 | 3,018 | 3,977 | 1,812 | 39 | 60,061 |
| Chesapeake Lodging Trust | 117,765 | 6,328 | 7,513 | 3,371 | 7 | 114,644 |
| Colony NorthStar Inc. Class A | 559,904 | 37,920 | 34,773 | 20,398 | — | 591,591 |
| Columbia Property Trust Inc. | 199,767 | 18,234 | 12,038 | 1,268 | — | 201,388 |
| CoreCivic Inc. | 250,483 | 26,891 | 17,526 | 7,470 | — | 246,351 |
| CoreSite Realty Corp. | 223,642 | 15,382 | 18,852 | 4,344 | — | 278,167 |
| Corporate Office Properties | | | | | | |
| Trust | 230,818 | 22,164 | 15,303 | 2,016 | 911 | 248,272 |
| Cousins Properties Inc. | 217,444 | 69,629 | 17,532 | 2,534 | 293 | 290,797 |
| CubeSmart | 344,856 | 21,218 | 23,895 | 7,187 | 168 | 335,924 |
| CyrusOne Inc. | NA2 | 122,845 | 18,863 | 1,160 | — | 357,848 |
| DCT Industrial Trust Inc. | 308,386 | 21,053 | 18,651 | 3,766 | 346 | 391,431 |
| DDR Corp. | 361,296 | 16,697 | 18,807 | 2,935 | 440 | 239,955 |
| DiamondRock Hospitality Co. | 173,307 | 10,259 | 12,787 | 3,436 | — | 176,808 |
| Digital Realty Trust Inc. | 1,312,413 | 89,058 | 108,789 | 21,778 | 628 | 1,386,476 |
| Douglas Emmett Inc. | 415,539 | 26,178 | 25,707 | 1,422 | 17 | 420,621 |
25
| | | | | | | |
| REIT Index Fund | | | | | | | |
| |
| |
| |
| |
| | | | Current Period Transactions | |
| | January 31, | | Proceeds | | | July 31, |
| | | 2017 | | from | | Capital Gain | 2017 |
| | | Market | Purchases | Securities | | Distributions | Market |
| | | Value | at Cost | Sold1 | Income | Received | Value |
| | | ($000) | ($000) | ($000) | ($000) | ($000) | ($000) |
| Duke Realty Corp. | | 653,127 | 52,126 | 51,842 | 4,688 | 5,483 | 768,420 |
| DuPont Fabros | | | | | | | |
| Technology Inc. | | 274,547 | 23,426 | 18,862 | 5,529 | — | 365,206 |
| Easterly Government | | | | | | | |
| Properties Inc. | | 53,384 | 6,003 | 6,776 | 1,143 | — | 53,494 |
| EastGroup Properties Inc. | | 178,153 | 11,940 | 11,712 | 2,837 | 201 | 219,607 |
| Education Realty Trust Inc. | | 224,847 | 13,154 | 15,530 | 2,998 | 3 | 207,709 |
| EPR Properties | | 360,230 | 21,731 | 25,822 | 8,454 | 351 | 348,295 |
| Equinix Inc. | 2,094,111 | 301,521 | 165,847 | 22,637 | — | 2,620,665 |
| Equity Commonwealth | | 281,565 | 25,519 | 17,679 | — | — | 296,229 |
| Equity LifeStyle | | | | | | | |
| Properties Inc. | | 458,547 | 34,933 | 32,398 | 5,743 | — | 543,934 |
| Equity Residential | 1,700,169 | 119,446 | 134,013 | 14,681 | 13,311 | 1,888,675 |
| Essex Property Trust Inc. | 1,124,304 | 81,027 | 95,365 | 14,757 | 2,537 | 1,296,750 |
| Extra Space Storage Inc. | | 693,628 | 48,033 | 56,528 | 14,342 | 535 | 756,674 |
| Federal Realty Investment | | | | | | | |
| Trust | | 767,656 | 48,087 | 85,809 | 10,127 | 68 | 688,421 |
| FelCor Lodging Trust Inc. | | 74,919 | 5,740 | 8,053 | — | — | 69,358 |
| First Industrial Realty Trust Inc. 231,273 | 14,898 | 17,182 | 3,104 | 566 | 270,532 |
| First Potomac Realty Trust | | 45,915 | 2,517 | 2,926 | 371 | 58 | 49,440 |
| Forest City Realty Trust Inc. | | | | | | | |
| Class A | | NA2 | 25,104 | 92,370 | 2,689 | 371 | 378,404 |
| Four Corners Property Trust Inc. | 95,138 | 10,090 | 5,784 | 2,139 | — | 115,093 |
| Franklin Street Properties Corp. | 98,735 | 5,009 | 5,428 | 1,982 | 113 | 81,417 |
| Gaming and Leisure | | | | | | | |
| Properties Inc. | | 451,949 | 5,707 | 39,835 | 16,319 | 610 | 507,984 |
| GEO Group Inc. | | 238,351 | 35,418 | 19,161 | 9,905 | — | 269,781 |
| Getty Realty Corp. | | 53,660 | 12,862 | 3,335 | 732 | 413 | 64,747 |
| GGP Inc. | | NA2 | 133,127 | 69,726 | 19,900 | — | 1,058,764 |
| Gladstone Commercial Corp. | | 35,673 | 3,432 | 1,906 | 1,379 | — | 40,238 |
| Global Net Lease Inc. | | 100,412 | 21,008 | 5,371 | 4,500 | 16 | 110,238 |
| Government Properties | | | | | | | |
| Income Trust | | 105,148 | 41,148 | 8,066 | 3,041 | 317 | 128,960 |
| Gramercy Property Trust | | 283,551 | 38,241 | 23,004 | 8,210 | — | 341,942 |
| HCP Inc. | 1,057,091 | 95,057 | 77,106 | 17,771 | 477 | 1,120,131 |
| Healthcare Realty Trust Inc. | | 267,885 | 17,594 | 19,739 | 2,801 | 847 | 293,169 |
| Healthcare Trust of America | | | | | | | |
| Inc. Class A | | 306,954 | 140,534 | 25,980 | 5,294 | — | 442,444 |
26
| | | | | | |
| REIT Index Fund | | | | | | |
| |
| |
| |
| |
| | | Current Period Transactions | |
| January 31, | | Proceeds | | | July 31, |
| | 2017 | | from | | Capital Gain | 2017 |
| | Market | Purchases | Securities | | Distributions | Market |
| | Value | at Cost | Sold1 | Income | Received | Value |
| | ($000) | ($000) | ($000) | ($000) | ($000) | ($000) |
| Hersha Hospitality Trust | | | | | | |
| Class A | 65,320 | 3,157 | 5,213 | 1,649 | — | 59,268 |
| Highwoods Properties Inc. | 388,011 | 28,279 | 21,016 | 4,737 | 1,742 | 395,998 |
| Hospitality Properties Trust | 387,308 | 24,792 | 25,083 | 12,316 | — | 360,909 |
| Host Hotels & Resorts Inc. | 1,026,815 | 67,275 | 84,093 | 15,046 | 7,259 | 1,042,767 |
| Hudson Pacific | | | | | | |
| Properties Inc. | 396,078 | 44,225 | 25,802 | 4,262 | 239 | 382,874 |
| Independence Realty | | | | | | |
| Trust Inc. | 46,445 | 4,627 | 2,919 | 1,874 | — | 52,830 |
| Investors Real Estate Trust | 59,808 | 2,734 | 3,154 | 322 | 530 | 57,260 |
| Iron Mountain Inc. | 685,207 | 43,846 | 50,632 | 17,493 | — | 689,919 |
| iStar Inc. | 61,435 | 3,685 | 10,587 | — | — | 58,598 |
| JBG SMITH Properties | — | 211,191 | 118 | — | — | 228,250 |
| Kilroy Realty Corp. | 528,491 | 58,190 | 34,092 | 3,671 | 1,525 | 512,990 |
| Kimco Realty Corp. | 800,160 | 49,713 | 61,797 | 5,582 | 8,947 | 636,949 |
| Kite Realty Group Trust | 153,379 | 7,334 | 8,460 | 2,989 | — | 129,692 |
| LaSalle Hotel Properties | 261,084 | 15,415 | 18,276 | 7,446 | 230 | 252,468 |
| Lexington Realty Trust | 175,028 | 9,989 | 11,768 | 3,932 | — | 164,248 |
| Liberty Property Trust | 431,139 | 28,144 | 32,930 | 5,802 | 2,240 | 466,894 |
| Life Storage Inc. | 284,634 | 19,836 | 17,889 | 6,914 | — | 256,635 |
| LTC Properties Inc. | 136,343 | 11,608 | 8,086 | 2,476 | 291 | 154,568 |
| Macerich Co. | 641,794 | 37,358 | 42,824 | 5,773 | 6,838 | 530,629 |
| Mack-Cali Realty Corp. | 182,681 | 10,589 | 12,632 | 1,259 | 72 | 169,052 |
| Medical Properties Trust Inc. | 295,035 | 73,944 | 21,720 | 9,017 | 470 | 351,339 |
| MGM Growth Properties LLC | | | | | | |
| Class A | 113,887 | 6,624 | 8,325 | 3,395 | — | 130,127 |
| Mid-America Apartment | | | | | | |
| Communities Inc. | 825,028 | 57,370 | 68,410 | 14,657 | 21 | 888,618 |
| Monmouth Real Estate | | | | | | |
| Investment Corp. | 68,492 | 5,574 | 3,500 | 695 | 33 | 74,424 |
| Monogram Residential | | | | | | |
| Trust Inc. | 123,338 | 7,030 | 8,188 | 1,524 | 124 | 143,361 |
| National Health Investors Inc. | 221,854 | 15,811 | 14,645 | 4,494 | 882 | 232,651 |
| National Retail Properties Inc. | 490,928 | 29,321 | 34,556 | 8,489 | 88 | 444,958 |
| National Storage Affiliates | | | | | | |
| Trust | 72,371 | 4,667 | 4,562 | 1,624 | — | 74,843 |
| New Senior Investment | | | | | | |
| Group Inc. | 57,232 | 7,803 | 2,796 | 1,057 | 69 | 64,524 |
27
| | | | | | |
| REIT Index Fund | | | | | | |
| |
| |
| |
| |
| | | Current Period Transactions | |
| January 31, | | Proceeds | | | July 31, |
| | 2017 | | from | | Capital Gain | 2017 |
| | Market | Purchases | Securities | | Distributions | Market |
| | Value | at Cost | Sold1 | Income | Received | Value |
| | ($000) | ($000) | ($000) | ($000) | ($000) | ($000) |
| New York REIT Inc. | 126,386 | 6,511 | 7,937 | — | — | 108,353 |
| NexPoint Residential Trust Inc. | 30,185 | 1,691 | 4,373 | 463 | 20 | 29,971 |
| NorthStar Realty Europe Corp. | 55,954 | 2,723 | 10,398 | 820 | — | 51,962 |
| Omega Healthcare Investors Inc. 474,785 | 31,394 | 28,965 | 14,212 | 187 | 469,799 |
| One Liberty Properties Inc. | 23,230 | 1,528 | 1,447 | 510 | 365 | 24,706 |
| Paramount Group Inc. | 224,305 | 33,563 | 12,029 | 1,236 | — | 242,688 |
| Park Hotels & Resorts Inc. | NA2 | 92,856 | 31,723 | 9,047 | — | 306,203 |
| Parkway Inc. | 71,947 | 4,164 | 4,731 | 673 | — | 76,902 |
| Pebblebrook Hotel Trust | 157,680 | 15,316 | 10,080 | 4,136 | — | 183,604 |
| Pennsylvania REIT | 95,545 | 4,303 | 5,173 | 99 | — | 62,539 |
| Physicians Realty Trust | 191,090 | 75,103 | 13,764 | 3,264 | — | 250,038 |
| Piedmont Office Realty | | | | | | |
| Trust Inc. Class A | 241,417 | 14,323 | 17,038 | 2,230 | 1,066 | 230,859 |
| Prologis Inc. | 1,970,078 | 146,204 | 162,497 | 15,111 | 20,150 | 2,433,310 |
| PS Business Parks Inc. | 174,220 | 11,161 | 13,065 | 2,626 | — | 206,933 |
| Public Storage | 2,425,257 | 277,882 | 170,029 | 45,947 | — | 2,423,574 |
| QTS Realty Trust Inc. Class A | 184,034 | 11,105 | 13,394 | 2,706 | — | 192,845 |
| Quality Care Properties Inc. | 132,027 | 7,434 | 8,698 | — | — | 119,034 |
| RAIT Financial Trust | 24,668 | 1,028 | 2,966 | 149 | 223 | 12,568 |
| Ramco-Gershenson | | | | | | |
| Properties Trust | 98,801 | 4,591 | 5,609 | 2,222 | 250 | 84,464 |
| Realty Income Corp. | 1,180,027 | 76,406 | 83,003 | 19,113 | — | 1,122,574 |
| Regency Centers Corp. | 557,628 | 73,371 | 51,180 | 6,821 | 994 | 765,001 |
| Retail Opportunity | | | | | | |
| Investments Corp. | 176,709 | 10,048 | 22,878 | 2,074 | 122 | 157,062 |
| Retail Properties of | | | | | | |
| America Inc. | 271,987 | 14,917 | 18,279 | 4,187 | — | 236,832 |
| Rexford Industrial Realty Inc. | 114,769 | 7,096 | 7,406 | 1,421 | 31 | 143,669 |
| RLJ Lodging Trust | 220,888 | 12,434 | 14,411 | 6,194 | — | 199,389 |
| Ryman Hospitality | | | | | | |
| Properties Inc. | 215,012 | 12,977 | 15,747 | 5,331 | 221 | 217,209 |
| Sabra Health Care REIT Inc. | 126,889 | 7,049 | 8,589 | 1,919 | 95 | 114,525 |
| Select Income REIT | 128,330 | 7,294 | 8,766 | 3,758 | 774 | 119,026 |
| Senior Housing Properties | | | | | | |
| Trust | 346,271 | 22,602 | 27,369 | 7,751 | — | 349,314 |
| Seritage Growth Properties | | | | | | |
| Class A | 70,018 | — | — | 858 | — | 80,264 |
| Silver Bay Realty Trust Corp. | 43,697 | 1,400 | 57,224 | — | — | — |
| Simon Property Group Inc. | 4,419,387 | 297,781 | 277,652 | 82,399 | 1,675 | 3,831,975 |
| SL Green Realty Corp. | 836,650 | 59,442 | 66,206 | 5,580 | 6,219 | 785,165 |
28
| | | | | | |
| REIT Index Fund | | | | | | |
| |
| |
| |
| |
| | | Current Period Transactions | |
| January 31, | | Proceeds | | | July 31, |
| | 2017 | | from | | Capital Gain | 2017 |
| | Market | Purchases | Securities | | Distributions | Market |
| | Value | at Cost | Sold1 | Income | Received | Value |
| | ($000) | ($000) | ($000) | ($000) | ($000) | ($000) |
| Spirit Realty Capital Inc. | 386,215 | 20,629 | 21,085 | 8,271 | 189 | 289,858 |
| STAG Industrial Inc. | 126,455 | 27,247 | 7,661 | 2,612 | — | 169,310 |
| Starwood Waypoint Homes | — | 172 | — | — | — | 329,989 |
| STORE Capital Corp. | 277,597 | 46,742 | 18,198 | 7,049 | 167 | 302,369 |
| Summit Hotel Properties Inc. | 106,021 | 26,226 | 8,404 | 1,552 | — | 139,479 |
| Sun Communities Inc. | 414,680 | 82,342 | 25,979 | 2,601 | 1,844 | 526,913 |
| Sunstone Hotel Investors Inc. | 244,027 | 17,086 | 15,599 | 1,299 | 349 | 271,233 |
| Tanger Factory Outlet | | | | | | |
| Centers Inc. | 251,411 | 13,124 | 15,157 | 4,631 | 45 | 192,369 |
| Taubman Centers Inc. | 327,490 | 18,001 | 20,945 | 4,935 | 432 | 260,211 |
| Terreno Realty Corp. | 96,103 | 7,119 | 5,222 | 1,300 | 51 | 124,385 |
| Tier REIT Inc. | 66,628 | 3,604 | 4,272 | 874 | — | 66,819 |
| UDR Inc. | 714,332 | 49,836 | 58,496 | 8,248 | 4,280 | 790,053 |
| UMH Properties Inc. | — | 57,637 | 23,335 | — | — | 33,893 |
| Universal Health Realty | | | | | | |
| Income Trust | 61,745 | 3,593 | 4,711 | 1,017 | 178 | 75,681 |
| Urban Edge Properties | 212,935 | 26,943 | 13,749 | 3,453 | — | 204,170 |
| Vanguard Market Liquidty | | | | | | |
| Fund | 149,286 | NA 3 | NA 3 | 182 | — | 296,204 |
| Ventas Inc. | 1,658,300 | 124,532 | 129,729 | 39,537 | 2,218 | 1,805,455 |
| VEREIT Inc. | 616,630 | 55,272 | 42,506 | 18,236 | 1,964 | 611,892 |
| Vornado Realty Trust | 1,382,302 | 85,769 | 98,885 | 5,618 | 3,567 | 1,020,860 |
| Washington Prime Group Inc. | 135,898 | 6,016 | 6,284 | 6,150 | — | 126,466 |
| Washington REIT | 177,272 | 11,707 | 11,219 | 2,101 | 101 | 188,852 |
| Weingarten Realty Investors | 331,196 | 18,590 | 21,346 | 5,404 | 1,656 | 298,603 |
| Welltower Inc. | 1,816,108 | 147,021 | 146,521 | 37,059 | 10,260 | 2,011,395 |
| Whitestone REIT | 30,721 | 1,919 | 1,288 | 692 | 187 | 29,442 |
| Winthrop Realty Trust | 15,172 | — | — | — | — | 15,172 |
| WP Carey Inc. | 476,167 | 52,371 | 29,368 | 14,360 | 82 | 550,599 |
| Xenia Hotels & Resorts Inc. | 148,670 | 9,132 | 9,266 | 4,437 | — | 164,235 |
| 59,610,847 | | | 972,844 | 151,195 | 64,420,204 |
1 Includes net realized gain (loss) on affiliated investment securities sold of $865,495,000.
2 Not Applicable—at January 31, 2017, the issuer was not an affiliated company of the fund.
3 Not Applicable—purchases and sales are for temporary cash investment purposes.
I. Management has determined that no material events or transactions occurred subsequent to July 31, 2017, that would require recognition or disclosure in these financial statements.
29
About Your Fund’s Expenses
As a shareholder of the fund, you incur ongoing costs, which include costs for portfolio management, administrative services, and shareholder reports (like this one), among others. Operating expenses, which are deducted from a fund’s gross income, directly reduce the investment return of the fund.
A fund’s expenses are expressed as a percentage of its average net assets. This figure is known as the expense ratio. The following examples are intended to help you understand the ongoing costs (in dollars) of investing in your fund and to compare these costs with those of other mutual funds. The examples are based on an investment of $1,000 made at the beginning of the period shown and held for the entire period.
The accompanying table illustrates your fund’s costs in two ways:
• Based on actual fund return. This section helps you to estimate the actual expenses that you paid over the period. The ”Ending Account Value“ shown is derived from the fund‘s actual return, and the third column shows the dollar amount that would have been paid by an investor who started with $1,000 in the fund. You may use the information here, together with the amount you invested, to estimate the expenses that you paid over the period.
To do so, simply divide your account value by $1,000 (for example, an $8,600 account value divided by $1,000 = 8.6), then multiply the result by the number given for your fund under the heading ”Expenses Paid During Period.“
• Based on hypothetical 5% yearly return. This section is intended to help you compare your fund‘s costs with those of other mutual funds. It assumes that the fund had a yearly return of 5% before expenses, but that the expense ratio is unchanged. In this case—because the return used is not the fund’s actual return—the results do not apply to your investment. The example is useful in making comparisons because the Securities and Exchange Commission requires all mutual funds to calculate expenses based on a 5% return. You can assess your fund’s costs by comparing this hypothetical example with the hypothetical examples that appear in shareholder reports of other funds.
Note that the expenses shown in the table are meant to highlight and help you compare ongoing costs only and do not reflect transaction costs incurred by the fund for buying and selling securities. Further, the expenses do not include any purchase, redemption, or account service fees described in the fund prospectus. If such fees were applied to your account, your costs would be higher. Your fund does not carry a “sales load.”
The calculations assume no shares were bought or sold during the period. Your actual costs may have been higher or lower, depending on the amount of your investment and the timing of any purchases or redemptions.
You can find more information about the fund’s expenses, including annual expense ratios, in the Financial Statements section of this report. For additional information on operating expenses and other shareholder costs, please refer to your fund’s current prospectus.
30
| | | |
| Six Months Ended July 31, 2017 | | | |
| | Beginning | Ending | Expenses |
| | Account Value | Account Value | Paid During |
| REIT Index Fund | 1/31/2017 | 7/31/2017 | Period |
| Based on Actual Fund Return | | | |
| Investor Shares | $1,000.00 | $1,038.48 | $1.31 |
| ETF Shares | 1,000.00 | 1,039.23 | 0.61 |
| Admiral Shares | 1,000.00 | 1,039.21 | 0.61 |
| Institutional Shares | 1,000.00 | 1,039.54 | 0.51 |
| Based on Hypothetical 5% Yearly Return | | | |
| Investor Shares | $1,000.00 | $1,023.51 | $1.30 |
| ETF Shares | 1,000.00 | 1,024.20 | 0.60 |
| Admiral Shares | 1,000.00 | 1,024.20 | 0.60 |
| Institutional Shares | 1,000.00 | 1,024.30 | 0.50 |
The calculations are based on expenses incurred in the most recent six-month period. The fund’s annualized six-month expense ratios for that period are 0.26% for Investor Shares, 0.12% for ETF Shares, 0.12% for Admiral Shares, and 0.10% for Institutional Shares. The dollar amounts shown as “Expenses Paid” are equal to the annualized expense ratio multiplied by the average account value over the period, multiplied by the number of days in the most recent six-month period, then divided by the number of days in the most recent 12-month period (181/365).
31
Trustees Approve Advisory Arrangement
The board of trustees of Vanguard REIT Index Fund has renewed the fund’s investment advisory arrangement with The Vanguard Group, Inc. (Vanguard), through its Equity Index Group. The board determined that continuing the fund’s internalized management structure was in the best interests of the fund and its shareholders.
The board based its decision upon an evaluation of the advisor’s investment staff, portfolio management process, and performance. This evaluation included information provided to the board by Vanguard’s Portfolio Review Department, which is responsible for fund and advisor oversight and product management. The Portfolio Review Department met regularly with the advisor and made monthly presentations to the board during the fiscal year that directed the board’s focus to relevant information and topics.
The board, or an investment committee made up of board members, also received information throughout the year during advisor presentations. For each advisor presentation, the board was provided with letters and reports that included information about, among other things, the advisory firm and the advisor’s assessment of the investment environment, portfolio performance, and portfolio characteristics.
In addition, the board received monthly reports, which included a Market and Economic Report, a Fund Dashboard Monthly Summary, and a Fund Performance Report.
Prior to their meeting, the trustees were provided with a memo and materials that summarized the information they received over the course of the year. They also considered the factors discussed below, among others. However, no single factor determined whether the board approved the arrangement. Rather, it was the totality of the circumstances that drove the board’s decision.
Nature, extent, and quality of services
The board reviewed the quality of the fund’s investment management services over both the short and long term and took into account the organizational depth and stability of the advisor. The board considered that Vanguard has been managing investments for more than three decades. The Equity Index Group adheres to a sound, disciplined investment management process; the team has considerable experience, stability, and depth.
The board concluded that Vanguard’s experience, stability, depth, and performance, among other factors, warranted continuation of the advisory arrangement.
Investment performance
The board considered the short- and long-term performance of the fund, including any periods of outperformance or underperformance compared with its target index and peer group. The board concluded that the performance was such that the advisory arrangement should continue. Information about the fund’s most recent performance can be found in the Performance Summary section of this report.
Cost
The board concluded that the fund’s expense ratio was well below the average expense ratio charged by funds in its peer group and that the fund’s advisory expenses were also well below its peer-group average. Information about the fund’s expenses appears in the About Your Fund’s Expenses section of this report as well as in the Financial Statements section.
32
The board does not conduct a profitability analysis of Vanguard because of Vanguard’s unique “at-cost” structure. Unlike most other mutual fund management companies, Vanguard is owned by the funds it oversees and produces “profits” only in the form of reduced expenses for fund shareholders.
The benefit of economies of scale
The board concluded that the fund’s at-cost arrangement with Vanguard ensures that the fund will realize economies of scale as it grows, with the cost to shareholders declining as the fund’s assets increase.
The board will consider whether to renew the advisory arrangement again after a one-year period.
33
Glossary
Beta. A measure of the magnitude of a fund’s past share-price fluctuations in relation to the ups and downs of a given market index. The index is assigned a beta of 1.00. Compared with a given index, a fund with a beta of 1.20 typically would have seen its share price rise or fall by 12% when the index rose or fell by 10%. For this report, beta is based on returns over the past 36 months for both the fund and the index. Note that a fund’s beta should be reviewed in conjunction with its R-squared (see definition). The lower the R-squared, the less correlation there is between the fund and the index, and the less reliable beta is as an indicator of volatility.
Dividend Yield. Dividend income earned by stocks, expressed as a percentage of the aggregate market value (or of net asset value, for a fund). The yield is determined by dividing the amount of the annual dividends by the aggregate value (or net asset value) at the end of the period. For a fund, the dividend yield is based solely on stock holdings and does not include any income produced by other investments. This yield may include some payments that represent a return of capital, capital gains distributions, or both by the underlying stocks.
Earnings Growth Rate. The average annual rate of growth in earnings over the past five years for the stocks now in a fund.
Expense Ratio. A fund’s total annual operating expenses expressed as a percentage of the fund’s average net assets. The expense ratio includes management and administrative expenses, but does not include the transaction costs of buying and selling portfolio securities.
Foreign Holdings. The percentage of a fund represented by securities or depositary receipts of companies based outside the United States.
Inception Date. The date on which the assets of a fund (or one of its share classes) are first invested in accordance with the fund’s investment objective. For funds with a subscription period, the inception date is the day after that period ends. Investment performance is measured from the inception date.
Median Market Cap. An indicator of the size of companies in which a fund invests; the midpoint of market capitalization (market price x shares outstanding) of a fund’s stocks, weighted by the proportion of the fund’s assets invested in each stock. Stocks representing half of the fund’s assets have market capitalizations above the median, and the rest are below it.
Price/Book Ratio. The share price of a stock divided by its net worth, or book value, per share. For a fund, the weighted average price/book ratio of the stocks it holds.
Price/Earnings Ratio. The ratio of a stock’s current price to its per-share earnings over the past year. For a fund, the weighted average P/E of the stocks it holds. P/E is an indicator of market expectations about corporate prospects; the higher the P/E, the greater the expectations for a company’s future growth.
R-Squared. A measure of how much of a fund’s past returns can be explained by the returns from the market in general, as measured by a given index. If a fund’s total returns were precisely synchronized with an index’s returns, its R-squared would be 1.00. If the fund’s returns bore no relationship to the index’s returns, its R-squared would be 0. For this report, R-squared is based on returns over the past 36 months for both the fund and the index.
34
Return on Equity. The annual average rate of return generated by a company during the past five years for each dollar of shareholder’s equity (net income divided by shareholder’s equity). For a fund, the weighted average return on equity for the companies whose stocks it holds.
Short-Term Reserves. The percentage of a fund invested in highly liquid, short-term securities that can be readily converted to cash.
Turnover Rate. An indication of the fund’s trading activity. Funds with high turnover rates incur higher transaction costs and may be more likely to distribute capital gains (which may be taxable to investors). The turnover rate excludes in-kind transactions, which have minimal impact on costs.
Benchmark Information
REIT Spliced Index: MSCI US REIT Index adjusted to include a 2% cash position (Lipper Money Market Average) through April 30, 2009; MSCI US REIT Index thereafter.
35
The Global Industry Classification Standard (“GICS”) was developed by and is the exclusive property and a service mark of MSCI Inc. (“MSCI”) and Standard and Poor’s, a division of McGraw-Hill Companies, Inc. (“S&P”), and is licensed for use by Vanguard. Neither MSCI, S&P nor any third party involved in making or compiling the GICS or any GICS classification makes any express or implied warranties or representations with respect to such standard or classification (or the results to be obtained by the use thereof), and all such parties hereby expressly disclaim all warranties of originality, accuracy, completeness, merchantability or fitness for a particular purpose with respect to any such standard or classification. Without limiting any of the foregoing, in no event shall MSCI, S&P, any of its affiliates or any third party involved in making or compiling the GICS or any GICS classification have any liability for any direct, indirect, special, punitive, consequential or any other damages (including lost profits) even if notified of the possibility of such damages.
36
This page intentionally left blank.
This page intentionally left blank.
The People Who Govern Your Fund
The trustees of your mutual fund are there to see that the fund is operated and managed in your best interests since, as a shareholder, you are a part owner of the fund. Your fund’s trustees also serve on the board of directors of The Vanguard Group, Inc., which is owned by the Vanguard funds and provides services to them on an at-cost basis.
A majority of Vanguard’s board members are independent, meaning that they have no affiliation with Vanguard or the funds they oversee, apart from the sizable personal investments they have made as private individuals. The independent board members have distinguished backgrounds in business, academia, and public service. Each of the trustees and executive officers oversees 195 Vanguard funds.
Information for each trustee and executive officer of the fund appears below. The mailing address of the trustees and officers is P.O. Box 876, Valley Forge, PA 19482. More information about the trustees is in the Statement of Additional Information, which can be obtained, without charge, by contacting Vanguard at 800-662-7447, or online at vanguard.com.
Interested Trustee1
F. William McNabb III
Born 1957. Trustee Since July 2009. Chairman of the Board. Principal Occupation(s) During the Past Five Years and Other Experience: Chairman of the Board of The Vanguard Group, Inc., and of each of the investment companies served by The Vanguard Group, since January 2010; Chief Executive Officer and Director of The Vanguard Group and President and Chief Executive Officer of each of the investment companies served by The Vanguard Group, since 2008; Director of Vanguard Marketing Corporation; President of The Vanguard Group (2008–2017); Managing Director of The Vanguard Group (1995–2008).
Independent Trustees
Emerson U. Fullwood
Born 1948. Trustee Since January 2008. Principal Occupation(s) During the Past Five Years and Other Experience: Executive Chief Staff and Marketing Officer for North America and Corporate Vice President (retired 2008) of Xerox Corporation (document management products and services); Executive in Residence and 2009–2010 Distinguished Minett Professor at the Rochester Institute of Technology; Lead Director of SPX FLOW, Inc. (multi-industry manufacturing); Director of the United Way of Rochester, the University of Rochester Medical Center, Monroe Community College Foundation, North Carolina A&T University, and Roberts Wesleyan College; Trustee of the University of Rochester.
Rajiv L. Gupta
Born 1945. Trustee Since December 2001.2 Principal Occupation(s) During the Past Five Years and Other Experience: Chairman and Chief Executive Officer (retired 2009) and President (2006–2008) of Rohm and Haas Co. (chemicals); Director of Arconic Inc. (diversified manufacturer), HP Inc. (printer and personal computer manufacturing), and Delphi Automotive plc (automotive components); Senior Advisor at New Mountain Capital.
Amy Gutmann
Born 1949. Trustee Since June 2006. Principal Occupation(s) During the Past Five Years and Other Experience: President of the University of Pennsylvania; Christopher H. Browne
1 Mr. McNabb is considered an “interested person,” as defined in the Investment Company Act of 1940, because he is an officer of the Vanguard funds.
2 December 2002 for Vanguard Equity Income Fund, the Vanguard Municipal Bond Funds, and the Vanguard State Tax-Exempt Funds.
Distinguished Professor of Political Science, School of Arts and Sciences, and Professor of Communication, Annenberg School for Communication, with secondary faculty appointments in the Department of Philosophy, School of Arts and Sciences, and at the Graduate School of Education, University of Pennsylvania; Trustee of the National Constitution Center.
JoAnn Heffernan Heisen
Born 1950. Trustee Since July 1998. Principal Occupation(s) During the Past Five Years and Other Experience: Corporate Vice President and Member of the Executive Committee (1997–2008), Chief Global Diversity Officer (retired 2008), Vice President and Chief Information Officer (1997–2006), Controller (1995–1997), Treasurer (1991–1995), and Assistant Treasurer (1989–1991) of Johnson & Johnson (pharmaceuticals/medical devices/ consumer products); Director of Skytop Lodge Corporation (hotels) and the Robert Wood Johnson Foundation; Member of the Advisory Board of the Institute for Women’s Leadership at Rutgers University.
F. Joseph Loughrey
Born 1949. Trustee Since October 2009. Principal Occupation(s) During the Past Five Years and Other Experience: President and Chief Operating Officer (retired 2009) of Cummins Inc. (industrial machinery); Chairman of the Board of Hillenbrand, Inc. (specialized consumer services), Oxfam America, and the Lumina Foundation for Education; Director of the V Foundation for Cancer Research; Member of the Advisory Council for the College of Arts and Letters and Chair of the Advisory Board to the Kellogg Institute for International Studies, both at the University of Notre Dame.
Mark Loughridge
Born 1953. Trustee Since March 2012. Principal Occupation(s) During the Past Five Years and Other Experience: Senior Vice President and Chief Financial Officer (retired 2013) at IBM (information technology services); Fiduciary Member of IBM’s Retirement Plan Committee (2004–2013); Director of the Dow Chemical Company; Member of the Council on Chicago Booth.
Scott C. Malpass
Born 1962. Trustee Since March 2012. Principal Occupation(s) During the Past Five Years and Other Experience: Chief Investment Officer and Vice President at the University of Notre Dame; Assistant Professor of Finance at the Mendoza College of Business at Notre Dame; Member of the Notre Dame 403(b) Investment Committee, the Board of Advisors for Spruceview Capital Partners, the Board of Catholic Investment Services, Inc. (investment advisor), and the Board of Superintendence of the Institute for the Works of Religion; Chairman of the Board of TIFF Advisory Services, Inc. (investment advisor).
André F. Perold
Born 1952. Trustee Since December 2004. Principal Occupation(s) During the Past Five Years and Other Experience: George Gund Professor of Finance and Banking, Emeritus at the Harvard Business School (retired 2011); Chief Investment Officer and Co-Managing Partner of HighVista Strategies LLC (private investment firm); Overseer of the Museum of Fine Arts Boston.
Peter F. Volanakis
Born 1955. Trustee Since July 2009. Principal Occupation(s) During the Past Five Years and Other Experience: President and Chief Operating Officer (retired 2010) of Corning Incorporated (communications equipment); Chairman of the Board of Trustees of Colby-Sawyer College; Member of the Board of Hypertherm, Inc. (industrial cutting systems, software, and consumables).
Executive Officers
Glenn Booraem
Born 1967. Investment Stewardship Officer Since February 2017. Principal Occupation(s) During the Past Five Years and Other Experience: Principal of The Vanguard Group, Inc.; Treasurer (2015–2017), Controller (2010–2015), and Assistant Controller (2001–2010) of each of the investment companies served by The Vanguard Group.
Thomas J. Higgins
Born 1957. Chief Financial Officer Since September 2008. Principal Occupation(s) During the Past Five Years and Other Experience: Principal of The Vanguard Group, Inc.; Chief Financial Officer of each of the investment companies served by The Vanguard Group; Treasurer of each of the investment companies served by The Vanguard Group (1998–2008).
Peter Mahoney
Born 1974. Controller Since May 2015. Principal Occupation(s) During the Past Five Years and Other Experience: Principal of The Vanguard Group, Inc.; Controller of each of the investment companies served by The Vanguard Group; Head of International Fund Services at The Vanguard Group (2008–2014).
Anne E. Robinson
Born 1970. Secretary Since September 2016. Principal Occupation(s) During the Past Five Years and Other Experience: Managing Director of The Vanguard Group, Inc.; General Counsel of The Vanguard Group; Secretary of The Vanguard Group and of each of the investment companies served by The Vanguard Group; Director and Senior Vice President of Vanguard Marketing Corporation; Managing Director and General Counsel of Global Cards and Consumer Services at Citigroup (2014–2016); Counsel at American Express (2003–2014).
Michael Rollings
Born 1963. Treasurer Since February 2017. Principal Occupation(s) During the Past Five Years and Other Experience: Managing Director of The Vanguard Group, Inc.; Treasurer of each of the investment companies served by The Vanguard Group; Director of Vanguard Marketing Corporation; Executive Vice President and Chief Financial Officer of MassMutual Financial Group (2006–2016).
| |
| Vanguard Senior Management Team |
| |
| Mortimer J. Buckley | James M. Norris |
| John James | Thomas M. Rampulla |
| Martha G. King | Glenn W. Reed |
| John T. Marcante | Karin A. Risi |
| Chris D. McIsaac | Gregory Davis |
| |
| |
| Chairman Emeritus and Senior Advisor |
| |
| John J. Brennan | |
| Chairman, 1996–2009 | |
| Chief Executive Officer and President, 1996–2008 |
| |
| |
| Founder | |
| |
| John C. Bogle | |
| Chairman and Chief Executive Officer, 1974–1996 |
|  |
| | P.O. Box 2600 |
| | Valley Forge, PA 19482-2600 |
| |
| |
| |
| Connect with Vanguard® > vanguard.com |
| |
| |
| |
| Fund Information > 800-662-7447 | The funds or securities referred to herein are not |
| Direct Investor Account Services > 800-662-2739 | sponsored, endorsed, or promoted by MSCI, and |
| | MSCI bears no liability with respect to any such funds |
| Institutional Investor Services > 800-523-1036 | or securities. The prospectus or the Statement of |
| Text Telephone for People | Additional Information contains a more detailed |
| Who Are Deaf or Hard of Hearing> 800-749-7273 | description of the limited relationship MSCI has with |
| | Vanguard and any related funds. |
| This material may be used in conjunction | |
| with the offering of shares of any Vanguard | |
| fund only if preceded or accompanied by | |
| the fund’s current prospectus. | |
| |
| All comparative mutual fund data are from Lipper, a | |
| Thomson Reuters Company, or Morningstar, Inc., unless | |
| otherwise noted. | |
| |
| You can obtain a free copy of Vanguard’s proxy voting | |
| guidelines by visiting vanguard.com/proxyreporting or by | |
| calling Vanguard at 800-662-2739. The guidelines are | |
| also available from the SEC’s website, sec.gov. In | |
| addition, you may obtain a free report on how your fund | |
| voted the proxies for securities it owned during the 12 | |
| months ended June 30. To get the report, visit either | |
| vanguard.com/proxyreporting or sec.gov. | |
| |
| You can review and copy information about your fund at | |
| the SEC’s Public Reference Room in Washington, D.C. To | |
| find out more about this public service, call the SEC at | |
| 202-551-8090. Information about your fund is also | |
| available on the SEC’s website, and you can receive | |
| copies of this information, for a fee, by sending a | |
| request in either of two ways: via email addressed to | |
| publicinfo@sec.gov or via regular mail addressed to the | |
| Public Reference Section, Securities and Exchange | |
| Commission, Washington, DC 20549-1520. | |
| | © 2017 The Vanguard Group, Inc. |
| | All rights reserved. |
| | Vanguard Marketing Corporation, Distributor. |
| |
| | Q1232 092017 |
Semiannual Report | July 31, 2017
Vanguard Dividend Growth Fund
A new format, unwavering commitment
As you begin reading this report, you’ll notice that we’ve made some improvements to the opening sections—based on feedback from you, our clients.
Page 1 starts with a new ”Your Fund’s Performance at a Glance,” a concise, handy summary of how your fund performed during the period.
In the renamed ”Chairman’s Perspective,” Bill McNabb will focus on enduring principles and investment insights.
We’ve modified some tables, and eliminated some redundancy, but we haven’t removed any information.
At Vanguard, we’re always looking for better ways to communicate and to help you make sound investment decisions. Thank you for entrusting your assets to us.
| |
| Contents | |
| Your Fund’s Performance at a Glance. | 1 |
| Chairman’s Perspective. | 2 |
| Advisor’s Report. | 6 |
| Fund Profile. | 9 |
| Performance Summary. | 10 |
| Financial Statements. | 11 |
| About Your Fund’s Expenses. | 20 |
| Glossary. | 22 |
Please note: The opinions expressed in this report are just that—informed opinions. They should not be considered promises or advice. Also, please keep in mind that the information and opinions cover the period through the date on the front of this report. Of course, the risks of investing in your fund are spelled out in the prospectus.
See the Glossary for definitions of investment terms used in this report.
About the cover: No matter what language you speak, Vanguard has one consistent message and set of principles. Our primary focus is on you, our clients. We conduct our business with integrity as a faithful steward of your assets. This message is shown translated into seven languages, reflecting our expanding global presence.
Your Fund’s Performance at a Glance
• Vanguard Dividend Growth Fund returned about 10% for the six months ended July 31, 2017. It outpaced its benchmark, the NASDAQ US Dividend Achievers Select Index, and the average return of its large-capitalization core fund peers.
• The fund invests in stable, well-managed companies with the ability and commitment to grow their dividends over time. Like the broad U.S. market, dividend-paying stocks posted strong returns during the period.
• Eight of the nine industry sectors in which the advisor invested produced positive results. Selections in health care and in industrials (particularly aerospace and defense firms) were top contributors.
• Holdings in the information technology, consumer-oriented, materials, and financial arenas outperformed and also made notable contributions.
• The advisor’s holdings in energy underperformed, posting the only negative return among the sectors.
Total Returns: Six Months Ended July 31, 2017
| |
| | Total |
| | Returns |
| Vanguard Dividend Growth Fund | 10.01% |
| NASDAQ US Dividend Achievers Select Index | 8.87 |
| Large-Cap Core Funds Average | 8.79 |
Large-Cap Core Funds Average: Derived from data provided by Lipper, a Thomson Reuters Company.
Expense Ratios
Your Fund Compared With Its Peer Group
| | |
| | | Peer Group |
| | Fund | Average |
| Dividend Growth Fund | 0.30% | 1.07% |
The fund expense ratio shown is from the prospectus dated May 25, 2017, and represents estimated costs for the current fiscal year. For the six months ended July 31, 2017, the fund’s annualized expense ratio was 0.28%. The peer-group expense ratio is derived from data provided by Lipper, a Thomson Reuters Company, and captures information through year-end 2016.
Peer group: Large-Cap Core Funds.
Chairman’s Perspective

Bill McNabb
Chairman and Chief Executive Officer
Dear Shareholder,
It’s said that fierce debates often generate more heat than light. And that’s been true of the ongoing face-off between sharply divided advocates of index funds and of actively managed funds.
For too long, the decision regarding active and index investing has been framed as either-or: Just pick a side and go all-in. But this choice is actually much more nuanced than a binary yes or no.
You may feel that your allegiance can belong to only one sports team, but you don’t have to approach investment strategies that way. (I’ll root for the Philadelphia Eagles no matter whom they’re playing, but my personal investment portfolio includes both index and active funds.)
Yes, indexing can be a valuable starting point for investors, and many may index their entire portfolio. But depending on your circumstances, an allocation to active management may be appropriate.
Recently published Vanguard research is illuminating on this point. Beyond helping you determine whether you’re a good candidate for active strategies, the paper Making the Implicit Explicit: A Framework for the Active-Passive Decision can help establish active and passive allocation targets for a range of investors. (You can read the paper at vanguard.com/research.)
2
Notching a record of outperformance
We’re a pioneer and leader in index fund investing, so why am I suggesting that active management may be appropriate?
Often overshadowed by our indexing reputation is Vanguard’s commitment to—and success with—active management. We oversee about $1 trillion in actively managed assets. And the results have been impressive, as the overwhelming majority of our active funds outperformed the average returns of their peers over the last decade.1 In addition, nearly half of our active funds have outperformed their benchmark indexes over the same period, a level of success that’s not easy to achieve.2
Make no mistake: The challenges of outperforming the market through active management are steep. So Vanguard has developed an approach with distinct characteristics that can improve your chances of success.
Chief among those advantages are low costs. As I’ve written before, paying less for your funds is one way to improve your odds of achieving success in active
| | | |
| Market Barometer | | | |
| | | | Total Returns |
| | | Periods Ended July 31, 2017 |
| | | | Five Years |
| | Six Months | One Year | (Annualized) |
| Stocks | | | |
| Russell 1000 Index (Large-caps) | 9.24% | 15.95% | 14.85% |
| Russell 2000 Index (Small-caps) | 5.35 | 18.45 | 14.19 |
| Russell 3000 Index (Broad U.S. market) | 8.94 | 16.14 | 14.79 |
| FTSE All-World ex US Index (International) | 14.05 | 18.81 | 8.11 |
| |
| Bonds | | | |
| Bloomberg Barclays U.S. Aggregate Bond Index | | | |
| (Broad taxable market) | 2.51% | -0.51% | 2.02% |
| Bloomberg Barclays Municipal Bond Index | | | |
| (Broad tax-exempt market) | 3.72 | 0.26 | 3.10 |
| Citigroup Three-Month U.S. Treasury Bill Index | 0.34 | 0.51 | 0.15 |
| |
| CPI | | | |
| Consumer Price Index | 0.80% | 1.73% | 1.33% |
The performance data shown represent past performance, which is not a guarantee of future results.
1 For the ten years ended June 30, 2017, 50 of 53 fixed income, 19 of 19 balanced, and 38 of 40 stock fund share classes—or 107 of
112 share classes of active Vanguard funds—outperformed their peer-group averages. Source: Vanguard, based on data from Lipper,
a Thomson Reuters Company.
2 For the ten years ended June 30, 2017, 21 of 53 fixed income, 5 of 19 balanced, and 23 of 40 stock fund share classes—or 49 of
112 share classes of active Vanguard funds—outperformed their benchmark indexes. Source: Vanguard, based on data from Lipper,
a Thomson Reuters Company.
3
management. Investors need to watch not only explicit costs, such as those reflected in fund expense ratios, but also implicit ones, such as trading costs, which can be significant because of the higher portfolio turnover associated with many active funds.
Historically, costs have been a reliable predictor of fund performance. But low costs don’t guarantee positive results. Talent is also critical. For this reason, Vanguard dedicates a lot of time, attention, and resources to manager selection and the ongoing oversight of managers.
Reaching beyond our walls
To serve our investors, we’re committed to identifying and attracting the best active managers across a range of investment styles and approaches. We recognize that not all great active managers reside in Valley Forge, Pennsylvania, where Vanguard is headquartered. As a result, we look across the world for managers for many of our active funds.
We oversee about $600 billion in assets that are managed by external advisors and partner with more than 25 firms employing hundreds of investment professionals and supporting analysts. These firms are responsible for more than 70 investment mandates within our active portfolios.
Stay patient and control taxes
Costs and manager selection are critical, but they aren’t the only necessities. You’ll also need a healthy supply of what many investors don’t possess in abundance: patience. Having the fortitude to wait is essential because even those active managers with the best track records go through significant periods of underperformance.
Patience is also crucial because investors in active strategies must stay disciplined and stick with them over time to take full advantage of the compounding benefits of outperformance. This is easy to say but often difficult to execute.
A few years ago, Vanguard looked at those actively managed domestic equity funds across the industry that did best over the previous 15 years. We found that even though these funds outperformed their benchmark indexes over that long period, 97% lagged the benchmarks in at least five calendar years. And two-thirds of the outperforming funds experienced at least three consecutive years of underperformance.3
Tax efficiency is another important consideration. In general, investors shouldn’t hold active strategies in an account that lacks tax protection.
3 Source: Vanguard calculations for the 15 years ended December 31, 2012, using data from Morningstar, Inc.
4
The tax drag associated with most active funds because of their higher turnover can be neutralized by holding the investments in tax-advantaged accounts, such as IRAs and 401(k) plans.
If you keep your focus on these four considerations—costs, manager selection, patience, and taxes—you’ll enhance your chances of achieving success with actively managed funds.
As always, thank you for investing with Vanguard.
Sincerely,

F. William McNabb III
Chairman and Chief Executive Officer
August 14, 2017
|
| Vanguard fund shareholders encouraged to vote in proxy campaign |
| |
| This summer we are asking you to vote on the election of trustees for all U.S.-domiciled |
| Vanguard funds, and on several fund policy proposals that we believe are in the best |
| interests of all shareholders. |
| |
| Vanguard filed a proxy statement on August 14, 2017, with the U.S. Securities and Exchange |
| Commission (SEC). Proxy materials are being provided to Vanguard fund shareholders with |
| instructions on how to vote online, by phone, or by mail. |
| |
| A shareholder meeting is scheduled to be held in Scottsdale, Arizona, on November 15, |
| 2017, when voting will conclude. We encourage you to vote promptly. Please visit |
| vanguard.com for updates. |
5
Advisor’s Report
Vanguard Dividend Growth Fund gained 10.01% for the six months ended July 31, 2017, outperforming the 8.87% return of its benchmark, the NASDAQ US Dividend Achievers Select Index.
The investment environment
Despite heightened geopolitical risks and European political uncertainty, riskier assets remained resilient as solid global economic data and strong year-over-year corporate earnings growth bolstered investors’ optimism. Market participants breathed a sigh of relief in May after independent centrist Emmanuel Macron won the French presidential election by a large margin, a victory widely seen as supporting the stability of the European Union. Continued evidence of an upswing in global growth helped maintain bullish sentiment. European growth indicators signaled strong regional momentum. Chinese manufacturing and services data surprised to the upside.
U.S. hopes for fiscal stimulus faded near the end of the period after a vote on health care reform was delayed because of insufficient support from Senate Republicans. Nevertheless, falling oil prices, heightened political risk, and a Federal Reserve rate hike were not enough to derail the eight-year-old market rally. The Standard & Poor’s 500 Index closed at a series of record highs during the period. Controversy surrounding President Donald Trump continued to mount, including reports that he shared classified information with Russian officials and asked then-FBI Director James Comey to stop the federal investigation into former National Security Advisor Michael Flynn. In a well-telegraphed move, the Fed raised policy rates by 25 one-hundredths of a percentage point in June and laid out a plan for balance-sheet normalization later this year, provided the economy improves as broadly as anticipated. Volatility ticked up near the end of the period as investors gravitated back to the reflation trade, triggering rotations out of momentum and growth positions and into cyclical and value pockets of the market.
The fund’s successes
Certain holdings in the information technology, financial, health care, and real estate sectors were among the fund’s biggest absolute contributors over the period. The fund’s top absolute contributors were McDonald’s (consumer discretionary), Visa (information technology), American Tower (real estate), Microsoft (information technology), and Nike (consumer discretionary).
Our thesis on Nike, a provider of athletic footwear, apparel, equipment, and accessories, has revolved around our belief that the company is poised to expand profit margins over the next several years. Nike has a new, more flexible, and cheaper manufacturing process (Flyknit) that should have positive implications for margins. The company is also selling a lot more through its own channel (direct-to-consumer), which has a higher margin. The stock price rose during
6
the period as quarterly earnings results solidly exceeded consensus expectations and the company’s forward guidance was better than anticipated, driven by expanding margins. We continue to believe Nike is one of the great franchises in the world.
On a “run-rate” basis, the portfolio is expected to produce asset-weighted dividend growth of 11.3% for calendar year 2017. Our run-rate calculation is a rough estimate of potential dividend growth: It takes a company’s current declared dividend rate, annualizes it, and compares it with the previous calendar year’s actual dividend rate. This calculation does not accurately reflect dividend increases that may be announced later in the year, nor does it take into account the dollar amounts of the increases. Therefore, companies in the early stages of dividend growth tend to show large percentage increases, yet the absolute cash dividend may be small. The run-rate calculation also is not an accurate reflection of the growth in the fund’s dividend payments to shareholders. Despite these shortcomings, we view this estimate as a reasonable report card.
Among the more notable dividend run-rate increases in 2017 have been those for TJX and PNC Financial Services.
The fund’s shortfalls
The only sector with negative absolute returns over the period was energy.
We did not have any holdings in utilities and telecommunication services over the period.
Our biggest absolute detractors included Schlumberger (energy), TJX (consumer discretionary), Exxon Mobil (energy), Union Pacific (industrials), and Public Storage (real estate).
TJX, an apparel and home goods retailer of brand names at lower prices, under-performed after the company posted decent earnings but management issued second-quarter guidance below consensus estimates. Investors were also discouraged by lackluster revenue growth. We believe TJX will continue to drive attractive same-store sales growth as it captures new customers with strong inventory management and excellent execution. Its competitive advantage is the way it buys clothing: It buys overages and acquires inventory at great prices. In addition, TJX is less exposed to disaggregating by internet competitors because of the “treasure hunt” aspect of shopping at its stores. We view the company as a high-quality, cash-generative, dominant value creator and distributor.
Although we would prefer that all stocks in the fund perform well at all times, some will inevitably hinder performance over a given period. We assess a stock’s contribution to the fund over a longer time frame and with a consistent focus on dividend action.
The fund’s positioning and investment strategy
Our primary objective is to identify companies that we believe will steadily and reliably grow their dividend payments.
7
We seek to fulfill this objective by carefully building Vanguard Dividend Growth Fund one stock at a time, giving central consideration to each company’s dividend growth prospects. As has always been the case, we are agnostic about sector positioning versus a benchmark, as our weightings result from this bottom-up stock selection. As of the end of the period, the fund had significant absolute weights in consumer staples, industrials, and health care, while having less exposure (below 5% allocation) to materials, energy, and real estate.
Since our last report, there have been modest changes in the fund’s positioning but certainly no change in our overall investment strategy. We made additions to the fund over the last six months that were driven largely by attractive prices. We also continue to manage the fund by constantly assessing the weightings of our current positions and adjusting them accordingly.
Whatever view we may have over the next month, the next year, or even the next five years will have little bearing on our portfolio decisions. We continue to believe in the power of compounding and in a growing dividend as the tool through which this power is expressed. We believe time is our friend, whereas many investors believe it to be the enemy. We believe a long-term outlook characterized by patience and low turnover is our best recipe for managing the fund. We remain true to our process and believe that Vanguard Dividend Growth Fund is well-positioned to deliver superior dividend growth and solid capital appreciation for shareholders over the long term.
Donald J. Kilbride
Senior Managing Director and Equity Portfolio Manager
Wellington Management Company llp
August 10, 2017
8
Dividend Growth Fund
Fund Profile
As of July 31, 2017
Portfolio Characteristics
| | | |
| | | NASDAQ | |
| | | US | |
| | | Dividend | DJ |
| | | Achievers | U.S. Total |
| | | Select | Market |
| | Fund | Index | FA Index |
| Number of Stocks | 45 | 180 | 3,786 |
| Median Market Cap $82.5B | $55.8B | $61.2B |
| Price/Earnings Ratio | 22.2x | 22.6x | 21.5x |
| Price/Book Ratio | 4.4x | 4.1x | 2.8x |
| Return on Equity | 22.0% | 19.2% | 15.1% |
| Earnings Growth Rate | 7.4% | 5.6% | 10.1% |
| Dividend Yield | 2.1% | 1.9% | 1.8% |
| Foreign Holdings | 6.0% | 0.0% | 0.0% |
| Turnover Rate | | | |
| (Annualized) | 12% | — | — |
| Ticker Symbol | VDIGX | — | — |
| Expense Ratio1 | 0.30% | — | — |
| 30-Day SEC Yield | 1.88% | — | — |
| Short-Term Reserves | 1.9% | — | — |
| | | |
| Sector Diversification (% of equity exposure) |
| | | NASDAQ | |
| | | US | |
| | | Dividend | DJ |
| | | Achievers | U.S. Total |
| | | Select | Market |
| | Fund | Index | FA Index |
| Consumer Discretionary | 13.3% | 8.3% | 12.6% |
| Consumer Staples | 17.8 | 18.2 | 7.7 |
| Energy | 4.4 | 0.0 | 5.7 |
| Financials | 11.6 | 10.2 | 15.0 |
| Health Care | 16.7 | 14.9 | 13.8 |
| Industrials | 17.5 | 27.1 | 10.7 |
| Information Technology | 10.9 | 12.9 | 21.9 |
| Materials | 3.5 | 6.2 | 3.3 |
| Real Estate | 4.3 | 0.0 | 4.1 |
| Telecommunication | | | |
| Services | 0.0 | 0.1 | 2.0 |
| Utilities | 0.0 | 2.1 | 3.2 |
Sector categories are based on the Global Industry Classification Standard (“GICS”), except for the “Other” category (if applicable), which includes securities that have not been provided a GICS classification as of the effective reporting period.
| | |
| Volatility Measures | | |
| | NASDAQ | |
| | US Dividend | DJ |
| | Achievers | U.S. Total |
| | Select | Market |
| | Index | FA Index |
| R-Squared | 0.95 | 0.88 |
| Beta | 0.97 | 0.82 |
These measures show the degree and timing of the fund’s fluctuations compared with the indexes over 36 months.
| | |
| Ten Largest Holdings (% of total net assets) |
| NIKE Inc. | Footwear | 3.8% |
| Microsoft Corp. | Systems Software | 3.5 |
| Accenture plc | IT Consulting & | |
| | Other Services | 2.8 |
| Chubb Ltd. | Property & Casualty | |
| | Insurance | 2.8 |
| Visa Inc. | Data Processing & | |
| | Outsourced Services | 2.6 |
| Coca-Cola Co. | Soft Drinks | 2.6 |
| Lockheed Martin Corp. | Aerospace & | |
| | Defense | 2.6 |
| PepsiCo Inc. | Soft Drinks | 2.5 |
| PNC Financial Services | | |
| Group Inc. | Regional Banks | 2.5 |
| Colgate-Palmolive Co. | Household Products | 2.5 |
| Top Ten | | 28.2% |
The holdings listed exclude any temporary cash investments and equity index products.
Investment Focus
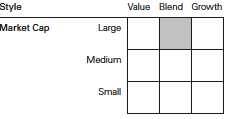
1 The expense ratio shown is from the prospectus dated May 25, 2017, and represents estimated costs for the current fiscal year. For the six months ended July 31, 2017, the annualized expense ratio was 0.28%.
9
Dividend Growth Fund
Performance Summary
All of the returns in this report represent past performance, which is not a guarantee of future results that may be achieved by the fund. (Current performance may be lower or higher than the performance data cited. For performance data current to the most recent month-end, visit our website at vanguard.com/performance.) Note, too, that both investment returns and principal value can fluctuate widely, so an investor’s shares, when sold, could be worth more or less than their original cost. The returns shown do not reflect taxes that a shareholder would pay on fund distributions or on the sale of fund shares.
Fiscal-Year Total Returns (%): January 31, 2007, Through July 31, 2017
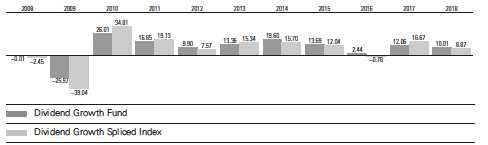
For a benchmark description, see the Glossary.
Note: For 2018, performance data reflect the six months ended July 31, 2017.
Average Annual Total Returns: Periods Ended June 30, 2017
This table presents returns through the latest calendar quarter—rather than through the end of the fiscal period.
Securities and Exchange Commission rules require that we provide this information.
| | | | |
| | Inception | One | Five | Ten |
| | Date | Year | Years | Years |
| Dividend Growth Fund | 5/15/1992 | 11.95% | 13.13% | 8.08% |
See Financial Highlights for dividend and capital gains information.
10
Dividend Growth Fund
Financial Statements (unaudited)
Statement of Net Assets
As of July 31, 2017
The fund reports a complete list of its holdings in regulatory filings four times in each fiscal year, at the quarter-ends. For the second and fourth fiscal quarters, the lists appear in the fund’s semiannual and annual reports to shareholders. For the first and third fiscal quarters, the fund files the lists with the Securities and Exchange Commission on Form N-Q. Shareholders can look up the fund’s Forms N-Q on the SEC’s website at sec.gov. Forms N-Q may also be reviewed and copied at the SEC’s Public Reference Room (see the back cover of this report for further information).
| | |
| | | Market |
| | | Value• |
| | Shares | ($000) |
| Common Stocks (97.6%) | | |
| Consumer Discretionary (13.0%) | |
| NIKE Inc. Class B | 20,662,485 | 1,220,120 |
| Lowe’s Cos. Inc. | 8,344,230 | 645,843 |
| TJX Cos. Inc. | 9,124,051 | 641,512 |
| McDonald’s Corp. | 4,118,275 | 638,909 |
| ^ VF Corp. | 8,548,281 | 531,617 |
| Walt Disney Co. | 4,591,773 | 504,774 |
| | | 4,182,775 |
| Consumer Staples (17.4%) | | |
| Coca-Cola Co. | 18,034,248 | 826,690 |
| PepsiCo Inc. | 6,999,887 | 816,257 |
| Colgate-Palmolive Co. | 11,049,756 | 797,792 |
| Walgreens Boots | | |
| Alliance Inc. | 9,207,945 | 742,805 |
| Costco Wholesale Corp. | 4,676,528 | 741,277 |
| Diageo plc | 21,450,157 | 692,775 |
| CVS Health Corp. | 7,170,012 | 573,099 |
| Procter & Gamble Co. | 4,464,370 | 405,454 |
| | | 5,596,149 |
| Energy (4.3%) | | |
| Schlumberger Ltd. | 10,803,296 | 741,106 |
| Exxon Mobil Corp. | 7,885,606 | 631,164 |
| | | 1,372,270 |
| Financials (11.3%) | | |
| Chubb Ltd. | 6,061,005 | 887,695 |
| PNC Financial Services | | |
| Group Inc. | 6,268,621 | 807,399 |
| Marsh & McLennan | | |
| Cos. Inc. | 9,122,576 | 711,287 |
| American Express Co. | 7,479,224 | 637,454 |
| BlackRock Inc. | 1,439,747 | 614,095 |
| | | 3,657,930 |
| Health Care (16.3%) | | |
| UnitedHealth Group Inc. | 3,872,737 | 742,830 |
| Cardinal Health Inc. | 9,261,355 | 715,532 |
| Merck & Co. Inc. | 11,175,206 | 713,872 |
| McKesson Corp. | 4,354,685 | 704,893 |
| | |
| | | Market |
| | | Value• |
| | Shares | ($000) |
| Medtronic plc | 8,180,313 | 686,901 |
| Johnson & Johnson | 4,842,227 | 642,660 |
| Amgen Inc. | 3,191,746 | 556,992 |
| Roche Holding AG | 1,905,177 | 482,332 |
| | | 5,246,012 |
| Industrials (17.1%) | | |
| Lockheed Martin Corp. | 2,824,935 | 825,248 |
| United Parcel Service | | |
| Inc. Class B | 7,179,969 | 791,879 |
| ^ Canadian National | | |
| Railway Co. | 9,576,959 | 756,785 |
| Union Pacific Corp. | 7,279,658 | 749,514 |
| Honeywell International | | |
| Inc. | 5,407,395 | 736,055 |
| United Technologies | | |
| Corp. | 5,216,420 | 618,511 |
| Northrop Grumman | | |
| Corp. | 2,117,341 | 557,136 |
| General Dynamics | | |
| Corp. | 2,392,565 | 469,732 |
| | | 5,504,860 |
| Information Technology (10.6%) | |
| Microsoft Corp. | 15,568,820 | 1,131,853 |
| Accenture plc Class A | 6,982,740 | 899,517 |
| Visa Inc. Class A | 8,318,969 | 828,237 |
| Automatic Data | | |
| Processing Inc. | 4,783,647 | 568,823 |
| | | 3,428,430 |
| Materials (3.4%) | | |
| Praxair Inc. | 4,779,906 | 622,152 |
| Ecolab Inc. | 3,626,216 | 477,464 |
| | | 1,099,616 |
| Real Estate (4.2%) | | |
| Public Storage | 3,457,239 | 710,705 |
| American Tower Corp. | 4,759,931 | 648,921 |
| | | 1,359,626 |
| Total Common Stocks | | |
| (Cost $21,452,934) | | 31,447,668 |
11
Dividend Growth Fund
| | |
| | | Market |
| | | Value• |
| | Shares | ($000) |
| Temporary Cash Investments (2.1%) | |
| Money Market Fund (0.3%) | | |
| 1,2 Vanguard Market Liquidity | | |
| Fund, 1.217% | 870,299 | 87,048 |
| |
| | Face | |
| | Amount | |
| | ($000) | |
| Repurchase Agreements (1.8%) | |
| RBS Securities, Inc. | | |
| 1.020%, 8/1/17 (Dated | | |
| 7/31/17, Repurchase | | |
| Value $367,710,000, | | |
| collaterized by U. S. | | |
| Treasury Note/Bond | | |
| 2.250%, 11/30/17, | | |
| with a value of | | |
| $375,058,000) | 367,700 | 367,700 |
| Societe Generale | | |
| 1.050%, 8/1/17 (Dated | | |
| 7/31/17, Repurchase | | |
| Value $226,907,000, | | |
| collaterized by Federal | | |
| Home Loan Mortgage | | |
| Corp. 4.100%–5.966%, | | |
| 9/1/20–6/1/29, | | |
| Federal National | | |
| Mortgage Assn. | | |
| 3.000%, 3/1/32, | | |
| Government National | | |
| Mortgage Assn. | | |
| 3.000%–3.500%, | | |
| 3/20/42– 6/20/46, | | |
| and U.S. Treasury | | |
| Note/Bond | | |
| 0.875%–2.125%, | | |
| 10/15/18– 6/30/21, | | |
| with a value of | | |
| $231,438,000) | 226,900 | 226,900 |
| | | 594,600 |
| Total Temporary Cash Investments | |
| (Cost $681,649) | | 681,648 |
| Total Investments (99.7%) | | |
| (Cost $22,134,583) | | 32,129,316 |
| | |
| | | Amount |
| | | ($000) |
| Other Assets and Liabilities (0.3%) | |
| Other Assets | | |
| Investment in Vanguard | | 2,078 |
| Receivables for Investment Securities Sold | 175,696 |
| Receivables for Accrued Income | | 39,286 |
| Receivable for Capital Shares Issued | 7,169 |
| Other Assets | | 623 |
| Total Other Assets | | 224,852 |
| Liabilities | | |
| Collateral for Securities on Loan | | (87,058) |
| Payables to Investment Advisor | | (11,369) |
| Payables for Capital Shares Redeemed | (17,427) |
| Payables to Vanguard | | (27,125) |
| Total Liabilities | | (142,979) |
| Net Assets (100%) | | |
| Applicable to 1,253,535,891 outstanding | |
| $.001 par value shares of beneficial | |
| interest (unlimited authorization) | 32,211,189 |
| Net Asset Value Per Share | | $25.70 |
| |
| At July 31, 2017, net assets consisted of: |
| | Amount |
| | ($000) |
| Paid-in Capital | 21,788,134 |
| Undistributed Net Investment Income | 7,513 |
| Accumulated Net Realized Gains | 420,746 |
| Unrealized Appreciation (Depreciation) | |
| Investment Securities | 9,994,733 |
| Foreign Currencies | 63 |
| Net Assets | 32,211,189 |
• See Note A in Notes to Financial Statements.
^ Includes partial security positions on loan to broker-dealers. The total value of securities on loan is $83,881,000.
1 Affiliated money market fund available only to Vanguard funds and certain trusts and accounts managed by Vanguard. Rate shown is the 7-day yield.
2 Includes $87,058,000 of collateral received for securities on loan.
See accompanying Notes, which are an integral part of the Financial Statements.
12
Dividend Growth Fund
Statement of Operations
| |
| | Six Months Ended |
| | July 31,2017 |
| | ($000) |
| Investment Income | |
| Income | |
| Dividends1 | 385,317 |
| Interest 2 | 1,695 |
| Securities Lending—Net | 129 |
| Total Income | 387,141 |
| Expenses | |
| Investment Advisory Fees—Note B | |
| Basic Fee | 20,697 |
| Performance Adjustment | 1,216 |
| The Vanguard Group—Note C | |
| Management and Administrative | 18,812 |
| Marketing and Distribution | 2,255 |
| Custodian Fees | 131 |
| Shareholders’ Reports | 743 |
| Trustees’ Fees and Expenses | 23 |
| Total Expenses | 43,877 |
| Net Investment Income | 343,264 |
| Realized Net Gain (Loss) | |
| Investment Securities Sold 2 | 420,762 |
| Foreign Currencies | 95 |
| Realized Net Gain (Loss) | 420,857 |
| Change in Unrealized Appreciation (Depreciation) | |
| Investment Securities | 2,234,383 |
| Foreign Currencies | 412 |
| Change in Unrealized Appreciation (Depreciation) | 2,234,795 |
| Net Increase (Decrease) in Net Assets Resulting from Operations | 2,998,916 |
1 Dividends are net of foreign withholding taxes of $2,703,000.
2 Interest income and realized net gain (loss) from an affiliated company of the fund were $0 and ($41,000), respectively.
See accompanying Notes, which are an integral part of the Financial Statements.
13
| | |
| Dividend Growth Fund | | |
| |
| |
| Statement of Changes in Net Assets | | |
| |
| | Six Months Ended | Year Ended |
| | July 31, | January 31, |
| | 2017 | 2017 |
| | ($000) | ($000) |
| Increase (Decrease) in Net Assets | | |
| Operations | | |
| Net Investment Income | 343,264 | 575,480 |
| Realized Net Gain (Loss) | 420,857 | 402,969 |
| Change in Unrealized Appreciation (Depreciation) | 2,234,795 | 2,296,300 |
| Net Increase (Decrease) in Net Assets Resulting from Operations | 2,998,916 | 3,274,749 |
| Distributions | | |
| Net Investment Income | (331,037) | (579,527) |
| Realized Capital Gain1 | (150,443) | (281,098) |
| Total Distributions | (481,480) | (860,625) |
| Capital Share Transactions | | |
| Issued | 891,568 | 6,868,116 |
| Issued in Lieu of Cash Distributions | 431,045 | 770,864 |
| Redeemed | (2,261,393) | (5,052,269) |
| Net Increase (Decrease) from Capital Share Transactions | (938,780) | 2,586,711 |
| Total Increase (Decrease) | 1,578,656 | 5,000,835 |
| Net Assets | | |
| Beginning of Period | 30,632,533 | 25,631,698 |
| End of Period2 | 32,211,189 | 30,632,533 |
1 Includes fiscal 2018 and 2017 short-term gain distributions totaling $52,814,000 and $57,257,000, respectively. Short-term gain distributions are treated as ordinary income dividends for tax purposes.
2 Net Assets—End of Period includes undistributed (overdistributed) net investment income of $7,513,000 and ($4,809,000).
See accompanying Notes, which are an integral part of the Financial Statements.
14
| | | | | | |
| Dividend Growth Fund | | | | | | |
| |
| |
| Financial Highlights | | | | | | |
| |
| |
| Six Months | | | | | |
| | Ended | | | | | |
| For a Share Outstanding | July 31, | Year Ended January 31, |
| Throughout Each Period | 2017 | 2017 | 2016 | 2015 | 2014 | 2013 |
| Net Asset Value, Beginning of Period | $23.72 | $21.78 | $22.47 | $20.45 | $17.52 | $15.81 |
| Investment Operations | | | | | | |
| Net Investment Income | . 274 | .446 | .442 | .430 | . 385 | . 357 |
| Net Realized and Unrealized Gain (Loss) | | | | | | |
| on Investments | 2.089 | 2.165 | .145 | 2.378 | 3.033 | 1.721 |
| Total from Investment Operations | 2.363 | 2.611 | .587 | 2.808 | 3.418 | 2.078 |
| Distributions | | | | | | |
| Dividends from Net Investment Income | (. 264) | (. 450) | (. 432) | (. 440) | (. 384) | (. 368) |
| Distributions from Realized Capital Gains | (.119) | (. 221) | (. 845) | (. 348) | (.104) | — |
| Total Distributions | (. 383) | (. 671) | (1.277) | (.788) | (. 488) | (. 368) |
| Net Asset Value, End of Period | $25.70 | $23.72 | $21.78 | $22.47 | $20.45 | $17.52 |
| |
| Total Return1 | 10.01% | 12.06% | 2.44% | 13.69% | 19.60% | 13.36% |
| |
| Ratios/Supplemental Data | | | | | | |
| Net Assets, End of Period (Millions) | $32,211 | $30,633 | $25,632 | $23,067 | $19,137 | $12,704 |
| Ratio of Total Expenses to | | | | | | |
| Average Net Assets2 | 0.28% | 0.30% | 0.33% | 0.32% | 0.31% | 0.29% |
| Ratio of Net Investment Income to | | | | | | |
| Average Net Assets | 2.02% | 1.93% | 1.95% | 1.94% | 2.03% | 2.22% |
| Portfolio Turnover Rate | 12% | 27% | 26% | 23% | 18% | 11% |
The expense ratio, net investment income ratio, and turnover rate for the current period have been annualized.
1 Total returns do not include account service fees that may have applied in the periods shown. Fund prospectuses provide information about any applicable account service fees.
2 Includes performance-based investment advisory fee increases (decreases) of 0.01%, 0.03%, 0.04%, 0.03%, 0.02%, and 0.00%.
See accompanying Notes, which are an integral part of the Financial Statements.
15
Dividend Growth Fund
Notes to Financial Statements
Vanguard Dividend Growth Fund is registered under the Investment Company Act of 1940 as an open-end investment company, or mutual fund.
A. The following significant accounting policies conform to generally accepted accounting principles for U.S. investment companies. The fund consistently follows such policies in preparing its financial statements.
1. Security Valuation: Securities are valued as of the close of trading on the New York Stock Exchange (generally 4 p.m., Eastern time) on the valuation date. Equity securities are valued at the latest quoted sales prices or official closing prices taken from the primary market in which each security trades; such securities not traded on the valuation date are valued at the mean of the latest quoted bid and asked prices. Securities for which market quotations are not readily available, or whose values have been affected by events occurring before the fund’s pricing time but after the close of the securities’ primary markets, are valued at their fair values calculated according to procedures adopted by the board of trustees. These procedures include obtaining quotations from an independent pricing service, monitoring news to identify significant market- or security-specific events, and evaluating changes in the values of foreign market proxies (for example, ADRs, futures contracts, or exchange-traded funds), between the time the foreign markets close and the fund’s pricing time. When fair-value pricing is employed, the prices of securities used by a fund to calculate its net asset value may differ from quoted or published prices for the same securities. Investments in Vanguard Market Liquidity Fund are valued at that fund’s net asset value. Temporary cash investments are valued using the latest bid prices or using valuations based on a matrix system (which considers such factors as security prices, yields, maturities, and ratings), both as furnished by independent pricing services.
2. Foreign Currency: Securities and other assets and liabilities denominated in foreign currencies are translated into U.S. dollars using exchange rates obtained from an independent third party as of the fund’s pricing time on the valuation date. Realized gains (losses) and unrealized appreciation (depreciation) on investment securities include the effects of changes in exchange rates since the securities were purchased, combined with the effects of changes in security prices. Fluctuations in the value of other assets and liabilities resulting from changes in exchange rates are recorded as unrealized foreign currency gains (losses) until the assets or liabilities are settled in cash, at which time they are recorded as realized foreign currency gains (losses).
3. Repurchase Agreements: The fund enters into repurchase agreements with institutional counterparties. Securities pledged as collateral to the fund under repurchase agreements are held by a custodian bank until the agreements mature, and in the absence of a default, such collateral cannot be repledged, resold, or rehypothecated. Each agreement requires that the market value of the collateral be sufficient to cover payments of interest and principal. The fund further mitigates its counterparty risk by entering into repurchase agreements only with a diverse group of prequalified counterparties, monitoring their financial strength, and entering into master repurchase agreements with its counterparties. The master repurchase agreements provide that, in the event of a counterparty’s default (including bankruptcy), the fund may terminate any repurchase agreements with that counterparty, determine the net amount owed, and sell or retain the collateral up to the net amount owed to the fund. Such action may be subject to legal proceedings, which may delay or limit the disposition of collateral.
16
Dividend Growth Fund
4. Federal Income Taxes: The fund intends to continue to qualify as a regulated investment company and distribute all of its taxable income. Management has analyzed the fund’s tax positions taken for all open federal income tax years (January 31, 2014–2017), and for the period ended July 31, 2017, and has concluded that no provision for federal income tax is required in the fund’s financial statements.
5. Distributions: Distributions to shareholders are recorded on the ex-dividend date.
6. Securities Lending: To earn additional income, the fund lends its securities to qualified institutional borrowers. Security loans are subject to termination by the fund at any time, and are required to be secured at all times by collateral in an amount at least equal to the market value of securities loaned. Daily market fluctuations could cause the value of loaned securities to be more or less than the value of the collateral received. When this occurs, the collateral is adjusted and settled on the next business day. The fund further mitigates its counterparty risk by entering into securities lending transactions only with a diverse group of prequalified counterparties, monitoring their financial strength, and entering into master securities lending agreements with its counterparties. The master securities lending agreements provide that, in the event of a counterparty’s default (including bankruptcy), the fund may terminate any loans with that borrower, determine the net amount owed, and sell or retain the collateral up to the net amount owed to the fund; however, such actions may be subject to legal proceedings. While collateral mitigates counterparty risk, in the event of a default, the fund may experience delays and costs in recovering the securities loaned. The fund invests cash collateral received in Vanguard Market Liquidity Fund, and records a liability in the Statement of Net Assets for the return of the collateral, during the period the securities are on loan. Securities lending income represents fees charged to borrowers plus income earned on invested cash collateral, less expenses associated with the loan. During the term of the loan, the fund is entitled to all distributions made on or in respect of the loaned securities.
7. Credit Facility: The fund and certain other funds managed by The Vanguard Group (“Vanguard”) participate in a $3.1 billion committed credit facility provided by a syndicate of lenders pursuant to a credit agreement that may be renewed annually; each fund is individually liable for its borrowings, if any, under the credit facility. Borrowings may be utilized for temporary and emergency purposes, and are subject to the fund’s regulatory and contractual borrowing restrictions. The participating funds are charged administrative fees and an annual commitment fee of 0.10% of the undrawn amount of the facility; these fees are allocated to the funds based on a method approved by the fund’s board of trustees and included in Management and Administrative expenses on the fund’s Statement of Operations. Any borrowings under this facility bear interest at a rate based upon the higher of the one-month London Interbank Offered Rate, federal funds effective rate, or overnight bank funding rate plus an agreed-upon spread.
The fund had no borrowings outstanding at July 31, 2017, or at any time during the period then ended.
8. Other: Dividend income is recorded on the ex-dividend date. Interest income is accrued daily. Premiums and discounts on debt securities purchased are amortized and accreted, respectively, to interest income over the lives of the respective securities. Security transactions are accounted for on the date securities are bought or sold. Costs used to determine realized gains (losses) on the sale of investment securities are those of the specific securities sold.
17
Dividend Growth Fund
B. Wellington Management Company LLP provides investment advisory services to the fund for a fee calculated at an annual percentage rate of average net assets. The basic fee is subject to quarterly adjustments based on the fund’s performance relative to the NASDAQ US Dividend Achievers Select Index for the preceding three years. For the six months ended July 31, 2017, the investment advisory fee represented an effective annual basic rate of 0.13% of the fund’s average net assets before an increase of $1,216,000 (0.01%) based on performance.
C. In accordance with the terms of a Funds’ Service Agreement (the “FSA”) between Vanguard and the fund, Vanguard furnishes to the fund corporate management, administrative, marketing, and distribution services at Vanguard’s cost of operations (as defined by the FSA). These costs of operations are allocated to the fund based on methods and guidelines approved by the board of trustees. Vanguard does not require reimbursement in the current period for certain costs of operations (such as deferred compensation/benefits and risk/insurance costs); the fund’s liability for these costs of operations is included in Payables to Vanguard on the Statement of Net Assets.
Upon the request of Vanguard, the fund may invest up to 0.40% of its net assets as capital in Vanguard. At July 31, 2017, the fund had contributed to Vanguard capital in the amount of $2,078,000, representing 0.01% of the fund’s net assets and 0.83% of Vanguard’s capitalization. The fund’s trustees and officers are also directors and employees, respectively, of Vanguard.
D. Various inputs may be used to determine the value of the fund’s investments. These inputs are summarized in three broad levels for financial statement purposes. The inputs or methodologies used to value securities are not necessarily an indication of the risk associated with investing in those securities.
Level 1—Quoted prices in active markets for identical securities.
Level 2—Other significant observable inputs (including quoted prices for similar securities, interest rates, prepayment speeds, credit risk, etc.).
Level 3—Significant unobservable inputs (including the fund’s own assumptions used to determine the fair value of investments).
The following table summarizes the market value of the fund’s investments as of July 31, 2017, based on the inputs used to value them:
| | | |
| | Level 1 | Level 2 | Level 3 |
| Investments | ($000) | ($000) | ($000) |
| Common Stocks | 30,272,561 | 1,175,107 | — |
| Temporary Cash Investments | 87,048 | 594,600 | — |
| Total | 30,359,609 | 1,769,707 | — |
E. Distributions are determined on a tax basis and may differ from net investment income and realized capital gains for financial reporting purposes. Differences may be permanent or temporary. Permanent differences are reclassified among capital accounts in the financial statements to reflect their tax character. Temporary differences arise when certain items of income, expense, gain, or loss are recognized in different periods for financial statement and tax purposes. These differences will reverse at some time in the future. Differences in classification may also result from the treatment of short-term gains as ordinary income for tax purposes. The fund’s tax-basis capital gains and losses are determined only at the end of each fiscal year.
18
Dividend Growth Fund
At July 31, 2017, the cost of investment securities for tax purposes was $22,134,583,000. Net unrealized appreciation of investment securities for tax purposes was $9,994,733,000, consisting of unrealized gains of $10,151,101,000 on securities that had risen in value since their purchase and $156,368,000 in unrealized losses on securities that had fallen in value since their purchase.
F. During the six months ended July 31, 2017, the fund purchased $1,887,539,000 of investment securities and sold $3,521,520,000 of investment securities, other than temporary cash investments.
G. Capital shares issued and redeemed were:
| | |
| | Six Months Ended | Year Ended |
| | July 31, 2017 | January 31, 2017 |
| | Shares | Shares |
| | (000) | (000) |
| Issued | 35,735 | 298,231 |
| Issued in Lieu of Cash Distributions | 17,207 | 33,034 |
| Redeemed | (90,770) | (216,755) |
| Net Increase (Decrease) in Shares Outstanding | (37,828) | 114,510 |
H. Management has determined that no material events or transactions occurred subsequent to July 31, 2017, that would require recognition or disclosure in these financial statements.
19
About Your Fund’s Expenses
As a shareholder of the fund, you incur ongoing costs, which include costs for portfolio management, administrative services, and shareholder reports (like this one), among others. Operating expenses, which are deducted from a fund’s gross income, directly reduce the investment return of the fund.
A fund’s expenses are expressed as a percentage of its average net assets. This figure is known as the expense ratio. The following examples are intended to help you understand the ongoing costs (in dollars) of investing in your fund and to compare these costs with those of other mutual funds. The examples are based on an investment of $1,000 made at the beginning of the period shown and held for the entire period.
The accompanying table illustrates your fund’s costs in two ways:
• Based on actual fund return. This section helps you to estimate the actual expenses that you paid over the period. The ”Ending Account Value“ shown is derived from the fund‘s actual return, and the third column shows the dollar amount that would have been paid by an investor who started with $1,000 in the fund. You may use the information here, together with the amount you invested, to estimate the expenses that you paid over the period.
To do so, simply divide your account value by $1,000 (for example, an $8,600 account value divided by $1,000 = 8.6), then multiply the result by the number given for your fund under the heading ”Expenses Paid During Period.“
• Based on hypothetical 5% yearly return. This section is intended to help you compare your fund‘s costs with those of other mutual funds. It assumes that the fund had a yearly return of 5% before expenses, but that the expense ratio is unchanged. In this case—because the return used is not the fund’s actual return—the results do not apply to your investment. The example is useful in making comparisons because the Securities and Exchange Commission requires all mutual funds to calculate expenses based on a 5% return. You can assess your fund’s costs by comparing this hypothetical example with the hypothetical examples that appear in shareholder reports of other funds.
Note that the expenses shown in the table are meant to highlight and help you compare ongoing costs only and do not reflect transaction costs incurred by the fund for buying and selling securities. Further, the expenses do not include any purchase, redemption, or account service fees described in the fund prospectus. If such fees were applied to your account, your costs would be higher. Your fund does not carry a “sales load.”
The calculations assume no shares were bought or sold during the period. Your actual costs may have been higher or lower, depending on the amount of your investment and the timing of any purchases or redemptions.
You can find more information about the fund’s expenses, including annual expense ratios, in the Financial Statements section of this report. For additional information on operating expenses and other shareholder costs, please refer to your fund’s current prospectus.
20
| | | |
| Six Months Ended July 31, 2017 | | | |
| | Beginning | Ending | Expenses |
| | Account Value | Account Value | Paid During |
| Dividend Growth Fund | 1/31/2017 | 7/31/2017 | Period |
| Based on Actual Fund Return | $1,000.00 | $1,100.09 | $1.46 |
| Based on Hypothetical 5% Yearly Return | 1,000.00 | 1,023.41 | 1.40 |
The calculations are based on expenses incurred in the most recent six-month period. The fund’s annualized six-month expense ratio for
that period is 0.28%. The dollar amounts shown as “Expenses Paid” are equal to the annualized expense ratio multiplied by the average
account value over the period, multiplied by the number of days in the most recent six-month period, then divided by the number of days in
the most recent 12-month period (181/365).
21
Glossary
30-Day SEC Yield. A fund’s 30-day SEC yield is derived using a formula specified by the U.S. Securities and Exchange Commission. Under the formula, data related to the fund’s security holdings in the previous 30 days are used to calculate the fund’s hypothetical net income for that period, which is then annualized and divided by the fund’s estimated average net assets over the calculation period. For the purposes of this calculation, a security’s income is based on its current market yield to maturity (for bonds), its actual income (for asset-backed securities), or its projected dividend yield (for stocks). Because the SEC yield represents hypothetical annualized income, it will differ—at times significantly—from the fund’s actual experience. As a result, the fund’s income distributions may be higher or lower than implied by the SEC yield.
Beta. A measure of the magnitude of a fund’s past share-price fluctuations in relation to the ups and downs of a given market index. The index is assigned a beta of 1.00. Compared with a given index, a fund with a beta of 1.20 typically would have seen its share price rise or fall by 12% when the index rose or fell by 10%. For this report, beta is based on returns over the past 36 months for both the fund and the index. Note that a fund’s beta should be reviewed in conjunction with its R-squared (see definition). The lower the R-squared, the less correlation there is between the fund and the index, and the less reliable beta is as an indicator of volatility.
Dividend Yield. Dividend income earned by stocks, expressed as a percentage of the aggregate market value (or of net asset value, for a fund). The yield is determined by dividing the amount of the annual dividends by the aggregate value (or net asset value) at the end of the period. For a fund, the dividend yield is based solely on stock holdings and does not include any income produced by other investments.
Earnings Growth Rate. The average annual rate of growth in earnings over the past five years for the stocks now in a fund.
Equity Exposure. A measure that reflects a fund’s investments in stocks and stock futures. Any holdings in short-term reserves are excluded.
Expense Ratio. A fund’s total annual operating expenses expressed as a percentage of the fund’s average net assets. The expense ratio includes management and administrative expenses, but does not include the transaction costs of buying and selling portfolio securities.
Foreign Holdings. The percentage of a fund represented by securities or depositary receipts of companies based outside the United States.
Inception Date. The date on which the assets of a fund (or one of its share classes) are first invested in accordance with the fund’s investment objective. For funds with a subscription period, the inception date is the day after that period ends. Investment performance is measured from the inception date.
Median Market Cap. An indicator of the size of companies in which a fund invests; the midpoint of market capitalization (market price x shares outstanding) of a fund’s stocks, weighted by the proportion of the fund’s assets invested in each stock. Stocks representing half of the fund’s assets have market capitalizations above the median, and the rest are below it.
Price/Book Ratio. The share price of a stock divided by its net worth, or book value, per share.
For a fund, the weighted average price/book ratio of the stocks it holds.
22
Price/Earnings Ratio. The ratio of a stock’s current price to its per-share earnings over the past year. For a fund, the weighted average P/E of the stocks it holds. P/E is an indicator of market expectations about corporate prospects; the higher the P/E, the greater the expectations for a company’s future growth.
R-Squared. A measure of how much of a fund’s past returns can be explained by the returns from the market in general, as measured by a given index. If a fund’s total returns were precisely synchronized with an index’s returns, its R-squared would be 1.00. If the fund’s returns bore no relationship to the index’s returns, its R-squared would be 0. For this report, R-squared is based on returns over the past 36 months for both the fund and the index.
Return on Equity. The annual average rate of return generated by a company during the past five years for each dollar of shareholder’s equity (net income divided by shareholder’s equity). For a fund, the weighted average return on equity for the companies whose stocks it holds.
Short-Term Reserves. The percentage of a fund invested in highly liquid, short-term securities that can be readily converted to cash.
Turnover Rate. An indication of the fund’s trading activity. Funds with high turnover rates incur higher transaction costs and may be more likely to distribute capital gains (which may be taxable to investors). The turnover rate excludes in-kind transactions, which have minimal impact on costs.
Benchmark Information
Dividend Growth Spliced Index: Russell 1000 Index through January 31, 2010; NASDAQ US Dividend Achievers Select Index (formerly known as the Dividend Achievers Select Index) thereafter. Prior to December 6, 2002, the comparative benchmark was known as the Utilities Composite Index. The index weightings were: 40% S&P Utilities Index, 40% S&P Telephone Index, and 20% Lehman Brothers Utility Bond Index through April 30, 1999; 63.75% S&P Utilities Index, 21.25% S&P Telephone Index, and 15% Lehman Brothers Utility Bond Index through March 31, 2000; 75% S&P Utilities Index and 25% S&P Telephone Index through December 31, 2001; and 75% S&P Utilities Index and 25% S&P Integrated Telecommunication Services Index through December 6, 2002.
23
The Global Industry Classification Standard (“GICS”) was developed by and is the exclusive property and a service mark of MSCI Inc. (“MSCI”) and Standard and Poor’s, a division of McGraw-Hill Companies, Inc. (“S&P”), and is licensed for use by Vanguard. Neither MSCI, S&P nor any third party involved in making or compiling the GICS or any GICS classification makes any express or implied warranties or representations with respect to such standard or classification (or the results to be obtained by the use thereof), and all such parties hereby expressly disclaim all warranties of originality, accuracy, completeness, merchantability or fitness for a particular purpose with respect to any such standard or classification. Without limiting any of the foregoing, in no event shall MSCI, S&P, any of its affiliates or any third party involved in making or compiling the GICS or any GICS classification have any liability for any direct, indirect, special, punitive, consequential or any other damages (including lost profits) even if notified of the possibility of such damages.
24
This page intentionally left blank.
This page intentionally left blank.
The People Who Govern Your Fund
The trustees of your mutual fund are there to see that the fund is operated and managed in your best interests since, as a shareholder, you are a part owner of the fund. Your fund’s trustees also serve on the board of directors of The Vanguard Group, Inc., which is owned by the Vanguard funds and provides services to them on an at-cost basis.
A majority of Vanguard’s board members are independent, meaning that they have no affiliation with Vanguard or the funds they oversee, apart from the sizable personal investments they have made as private individuals. The independent board members have distinguished backgrounds in business, academia, and public service. Each of the trustees and executive officers oversees 195 Vanguard funds.
Information for each trustee and executive officer of the fund appears below. The mailing address of the trustees and officers is P.O. Box 876, Valley Forge, PA 19482. More information about the trustees is in the Statement of Additional Information, which can be obtained, without charge, by contacting Vanguard at 800-662-7447, or online at vanguard.com.
Interested Trustee1
F. William McNabb III
Born 1957. Trustee Since July 2009. Chairman of the Board. Principal Occupation(s) During the Past Five Years and Other Experience: Chairman of the Board of The Vanguard Group, Inc., and of each of the investment companies served by The Vanguard Group, since January 2010; Chief Executive Officer and Director of The Vanguard Group and President and Chief Executive Officer of each of the investment companies served by The Vanguard Group, since 2008; Director of Vanguard Marketing Corporation; President of The Vanguard Group (2008–2017); Managing Director of The Vanguard Group (1995–2008).
Independent Trustees
Emerson U. Fullwood
Born 1948. Trustee Since January 2008. Principal Occupation(s) During the Past Five Years and Other Experience: Executive Chief Staff and Marketing Officer for North America and Corporate Vice President (retired 2008) of Xerox Corporation (document management products and services); Executive in Residence and 2009–2010 Distinguished Minett Professor at the Rochester Institute of Technology; Lead Director of SPX FLOW, Inc. (multi-industry manufacturing); Director of the United Way of Rochester, the University of Rochester Medical Center, Monroe Community College Foundation, North Carolina A&T University, and Roberts Wesleyan College; Trustee of the University of Rochester.
Rajiv L. Gupta
Born 1945. Trustee Since December 2001.2 Principal Occupation(s) During the Past Five Years and Other Experience: Chairman and Chief Executive Officer (retired 2009) and President (2006–2008) of Rohm and Haas Co. (chemicals); Director of Arconic Inc. (diversified manufacturer), HP Inc. (printer and personal computer manufacturing), and Delphi Automotive plc (automotive components); Senior Advisor at New Mountain Capital.
Amy Gutmann
Born 1949. Trustee Since June 2006. Principal Occupation(s) During the Past Five Years and Other Experience: President of the University of Pennsylvania; Christopher H. Browne
1 Mr. McNabb is considered an “interested person,” as defined in the Investment Company Act of 1940, because he is an officer of the
Vanguard funds.
2 December 2002 for Vanguard Equity Income Fund, the Vanguard Municipal Bond Funds, and the Vanguard State Tax-Exempt Funds.
Distinguished Professor of Political Science, School of Arts and Sciences, and Professor of Communication, Annenberg School for Communication, with secondary faculty appointments in the Department of Philosophy, School of Arts and Sciences, and at the Graduate School of Education, University of Pennsylvania; Trustee of the National Constitution Center.
JoAnn Heffernan Heisen
Born 1950. Trustee Since July 1998. Principal Occupation(s) During the Past Five Years and Other Experience: Corporate Vice President and Member of the Executive Committee (1997–2008), Chief Global Diversity Officer (retired 2008), Vice President and Chief Information Officer (1997–2006), Controller (1995–1997), Treasurer (1991–1995), and Assistant Treasurer (1989–1991) of Johnson & Johnson (pharmaceuticals/medical devices/ consumer products); Director of Skytop Lodge Corporation (hotels) and the Robert Wood Johnson Foundation; Member of the Advisory Board of the Institute for Women’s Leadership at Rutgers University.
F. Joseph Loughrey
Born 1949. Trustee Since October 2009. Principal Occupation(s) During the Past Five Years and Other Experience: President and Chief Operating Officer (retired 2009) of Cummins Inc. (industrial machinery); Chairman of the Board of Hillenbrand, Inc. (specialized consumer services), Oxfam America, and the Lumina Foundation for Education; Director of the V Foundation for Cancer Research; Member of the Advisory Council for the College of Arts and Letters and Chair of the Advisory Board to the Kellogg Institute for International Studies, both at the University of Notre Dame.
Mark Loughridge
Born 1953. Trustee Since March 2012. Principal Occupation(s) During the Past Five Years and Other Experience: Senior Vice President and Chief Financial Officer (retired 2013) at IBM (information technology services); Fiduciary Member of IBM’s Retirement Plan Committee (2004–2013); Director of the Dow Chemical Company; Member of the Council on Chicago Booth.
Scott C. Malpass
Born 1962. Trustee Since March 2012. Principal Occupation(s) During the Past Five Years and Other Experience: Chief Investment Officer and Vice President at the University of Notre Dame; Assistant Professor of Finance at the Mendoza College of Business at Notre Dame; Member of the Notre Dame 403(b) Investment Committee, the Board of Advisors for Spruceview Capital Partners, the Board of Catholic Investment Services, Inc. (investment advisor), and the Board of Superintendence of the Institute for the Works of Religion; Chairman of the Board of TIFF Advisory Services, Inc. (investment advisor).
André F. Perold
Born 1952. Trustee Since December 2004. Principal Occupation(s) During the Past Five Years and Other Experience: George Gund Professor of Finance and Banking, Emeritus at the Harvard Business School (retired 2011); Chief Investment Officer and Co-Managing Partner of HighVista Strategies LLC (private investment firm); Overseer of the Museum of Fine Arts Boston.
Peter F. Volanakis
Born 1955. Trustee Since July 2009. Principal Occupation(s) During the Past Five Years and Other Experience: President and Chief Operating Officer (retired 2010) of Corning Incorporated (communications equipment); Chairman of the Board of Trustees of Colby-Sawyer College; Member of the Board of Hypertherm, Inc. (industrial cutting systems, software, and consumables).
Executive Officers
Glenn Booraem
Born 1967. Investment Stewardship Officer Since February 2017. Principal Occupation(s) During the Past Five Years and Other Experience: Principal of The Vanguard Group, Inc.; Treasurer (2015–2017), Controller (2010–2015), and Assistant Controller (2001–2010) of each of the investment companies served by The Vanguard Group.
Thomas J. Higgins
Born 1957. Chief Financial Officer Since September 2008. Principal Occupation(s) During the Past Five Years and Other Experience: Principal of The Vanguard Group, Inc.; Chief Financial Officer of each of the investment companies served by The Vanguard Group; Treasurer of each of the investment companies served by The Vanguard Group (1998–2008).
Peter Mahoney
Born 1974. Controller Since May 2015. Principal Occupation(s) During the Past Five Years and Other Experience: Principal of The Vanguard Group, Inc.; Controller of each of the investment companies served by The Vanguard Group; Head of International Fund Services at The Vanguard Group (2008–2014).
Anne E. Robinson
Born 1970. Secretary Since September 2016. Principal Occupation(s) During the Past Five Years and Other Experience: Managing Director of The Vanguard Group, Inc.; General Counsel of The Vanguard Group; Secretary of The Vanguard Group and of each of the investment companies served by The Vanguard Group; Director and Senior Vice President of Vanguard Marketing Corporation; Managing Director and General Counsel of Global Cards and Consumer Services at Citigroup (2014–2016); Counsel at American Express (2003–2014).
Michael Rollings
Born 1963. Treasurer Since February 2017. Principal Occupation(s) During the Past Five Years and Other Experience: Managing Director of The Vanguard Group, Inc.; Treasurer of each of the investment companies served by The Vanguard Group; Director of Vanguard Marketing Corporation; Executive Vice President and Chief Financial Officer of MassMutual Financial Group (2006–2016).
| |
| Vanguard Senior Management Team |
| |
| Mortimer J. Buckley | James M. Norris |
| John James | Thomas M. Rampulla |
| Martha G. King | Glenn W. Reed |
| John T. Marcante | Karin A. Risi |
| Chris D. McIsaac | Gregory Davis |
| |
| |
| Chairman Emeritus and Senior Advisor |
| |
| John J. Brennan | |
| Chairman, 1996–2009 | |
| Chief Executive Officer and President, 1996–2008 |
| |
| |
| Founder | |
| |
| John C. Bogle | |
| Chairman and Chief Executive Officer, 1974–1996 |
|  |
| P.O. Box 2600 |
| Valley Forge, PA 19482-2600 |
| |
| |
| |
| Connect with Vanguard® > vanguard.com |
| |
| |
| |
| Fund Information > 800-662-7447 |
| Direct Investor Account Services > 800-662-2739 |
| Institutional Investor Services > 800-523-1036 |
| Text Telephone for People |
| Who Are Deaf or Hard of Hearing> 800-749-7273 |
| |
| This material may be used in conjunction |
| with the offering of shares of any Vanguard |
| fund only if preceded or accompanied by |
| the fund’s current prospectus. |
| |
| All comparative mutual fund data are from Lipper, a |
| Thomson Reuters Company, or Morningstar, Inc., unless |
| otherwise noted. |
| |
| You can obtain a free copy of Vanguard’s proxy voting |
| guidelines by visiting vanguard.com/proxyreporting or by |
| calling Vanguard at 800-662-2739. The guidelines are |
| also available from the SEC’s website, sec.gov. In |
| addition, you may obtain a free report on how your fund |
| voted the proxies for securities it owned during the 12 |
| months ended June 30. To get the report, visit either |
| vanguard.com/proxyreporting or sec.gov. |
| |
| You can review and copy information about your fund at |
| the SEC’s Public Reference Room in Washington, D.C. To |
| find out more about this public service, call the SEC at |
| 202-551-8090. Information about your fund is also |
| available on the SEC’s website, and you can receive |
| copies of this information, for a fee, by sending a |
| request in either of two ways: via email addressed to |
| publicinfo@sec.gov or via regular mail addressed to the |
| Public Reference Section, Securities and Exchange |
| Commission, Washington, DC 20549-1520. |
| © 2017 The Vanguard Group, Inc. |
| All rights reserved. |
| Vanguard Marketing Corporation, Distributor. |
| |
| Q572 092017 |

Semiannual Report | July 31, 2017
Vanguard Dividend Appreciation Index Fund
A new format, unwavering commitment
As you begin reading this report, you’ll notice that we’ve made some improvements to the opening sections—based on feedback from you, our clients.
Page 1 starts with a new ”Your Fund’s Performance at a Glance,” a concise, handy summary of how your fund performed during the period.
In the renamed ”Chairman’s Perspective,” Bill McNabb will focus on enduring principles and investment insights.
We’ve modified some tables, and eliminated some redundancy, but we haven’t removed any information.
At Vanguard, we’re always looking for better ways to communicate and to help you make sound investment decisions. Thank you for entrusting your assets to us.
| |
| Contents | |
| Your Fund’s Performance at a Glance. | 1 |
| Chairman’s Perspective. | 3 |
| Fund Profile. | 7 |
| Performance Summary. | 9 |
| Financial Statements. | 10 |
| About Your Fund’s Expenses. | 24 |
| Trustees Approve Advisory Arrangement. | 26 |
| Glossary. | 28 |
Please note: The opinions expressed in this report are just that—informed opinions. They should not be considered promises or advice. Also, please keep in mind that the information and opinions cover the period through the date on the front of this report. Of course, the risks of investing in your fund are spelled out in the prospectus.
See the Glossary for definitions of investment terms used in this report.
About the cover: No matter what language you speak, Vanguard has one consistent message and set of principles. Our primary focus is on you, our clients. We conduct our business with integrity as a faithful steward of your assets. This message is shown translated into seven languages, reflecting our expanding global presence.
Your Fund’s Performance at a Glance
• Vanguard Dividend Appreciation Index Fund returned nearly 9% for the six months ended July 31, 2017. It closely tracked its target index, the NASDAQ US Dividend Achievers Select Index, and its return was virtually even with the average return of its large-capitalization core fund peers.
• The target index is composed of stocks of companies that have increased their dividends for at least ten straight years.
• Dividend-paying stocks posted strong returns during the period, keeping pace with the broad U.S. market.
• Eight of the ten industry sectors produced positive results. Industrials, the fund’s largest sector, was the top contributor, led by aerospace and defense companies. Health care and financials, which had the highest total returns, also made strong contributions, as did consumer goods. The two smallest sectors, telecommunications and oil and gas, had negative returns.
| |
| Total Returns: Six Months Ended July 31, 2017 | |
| | Total |
| | Returns |
| Vanguard Dividend Appreciation Index Fund | |
| Investor Shares | 8.80% |
| ETF Shares | |
| Market Price | 8.88 |
| Net Asset Value | 8.84 |
| Admiral™ Shares | 8.85 |
| NASDAQ US Dividend Achievers Select Index | 8.87 |
| Large-Cap Core Funds Average | 8.79 |
| Large-Cap Core Funds Average: Derived from data provided by Lipper, a Thomson Reuters Company. | |
The Vanguard ETF® Shares shown are traded on the NYSE Arca exchange and are available only through brokers. The table provides ETF returns based on both the NYSE Arca market price and the net asset value for a share. U.S. Pat. Nos. 6,879,964; 7,337,138; 7,720,749; 7,925,573; 8,090,646; and 8,417,623.
For the ETF Shares, the market price is determined by the midpoint of the bid-offer spread as of the closing time of the New York Stock Exchange (generally 4 p.m., Eastern time). The net asset value is also determined as of the NYSE closing time. For more information about how the ETF Shares' market prices have compared with their net asset value, visit vanguard.com, select your ETF, and then select the Price and Performance tab. The ETF premium/discount analysis there shows the percentages of days on which the ETF Shares' market price was above or below the NAV.
Admiral Shares carry lower expenses and are available to investors who meet certain account-balance requirements.
1
| | | | |
| Expense Ratios | | | | |
| Your Fund Compared With Its Peer Group | | | | |
| | Investor | ETF | Admiral | Peer Group |
| | Shares | Shares | Shares | Average |
| Dividend Appreciation Index Fund | 0.16% | 0.08% | 0.08% | 1.07% |
The fund expense ratios shown are from the prospectus dated May 25, 2017, and represent estimated costs for the current fiscal year. For the six months ended July 31, 2017, the fund’s annualized expense ratios were 0.16% for Investor Shares, 0.08% for ETF Shares, and 0.08% for Admiral Shares. The peer-group expense ratio is derived from data provided by Lipper, a Thomson Reuters Company, and captures information through year-end 2016.
Peer group: Large-Cap Core Funds.
2
Chairman’s Perspective

Bill McNabb
Chairman and Chief Executive Officer
Dear Shareholder,
It’s said that fierce debates often generate more heat than light. And that’s been true of the ongoing face-off between sharply divided advocates of index funds and of actively managed funds.
For too long, the decision regarding active and index investing has been framed as either-or: Just pick a side and go all-in. But this choice is actually much more nuanced than a binary yes or no.
You may feel that your allegiance can belong to only one sports team, but you don’t have to approach investment strategies that way. (I’ll root for the Philadelphia Eagles no matter whom they’re playing, but my personal investment portfolio includes both index and active funds.)
Yes, indexing can be a valuable starting point for investors, and many may index their entire portfolio. But depending on your circumstances, an allocation to active management may be appropriate.
Recently published Vanguard research is illuminating on this point. Beyond helping you determine whether you’re a good candidate for active strategies, the paper Making the Implicit Explicit: A Framework for the Active-Passive Decision can help establish active and passive allocation targets for a range of investors. (You can read the paper at vanguard.com/research.)
3
Notching a record of outperformance
We’re a pioneer and leader in index fund investing, so why am I suggesting that active management may be appropriate?
Often overshadowed by our indexing reputation is Vanguard’s commitment to—and success with—active management. We oversee about $1 trillion in actively managed assets. And the results have been impressive, as the overwhelming majority of our active funds outperformed the average returns of their peers over the last decade.1 In addition, nearly half of our active funds have outperformed their benchmark indexes over the same period, a level of success that’s not easy to achieve.2
Make no mistake: The challenges of outperforming the market through active management are steep. So Vanguard has developed an approach with distinct characteristics that can improve your chances of success.
Chief among those advantages are low costs. As I’ve written before, paying less for your funds is one way to improve your odds of achieving success in active
| | | |
| Market Barometer | | | |
| | | | Total Returns |
| | | Periods Ended July 31, 2017 |
| | | | Five Years |
| | Six Months | One Year | (Annualized) |
| Stocks | | | |
| Russell 1000 Index (Large-caps) | 9.24% | 15.95% | 14.85% |
| Russell 2000 Index (Small-caps) | 5.35 | 18.45 | 14.19 |
| Russell 3000 Index (Broad U.S. market) | 8.94 | 16.14 | 14.79 |
| FTSE All-World ex US Index (International) | 14.05 | 18.81 | 8.11 |
| |
| Bonds | | | |
| Bloomberg Barclays U.S. Aggregate Bond Index | | | |
| (Broad taxable market) | 2.51% | -0.51% | 2.02% |
| Bloomberg Barclays Municipal Bond Index | | | |
| (Broad tax-exempt market) | 3.72 | 0.26 | 3.10 |
| Citigroup Three-Month U.S. Treasury Bill Index | 0.34 | 0.51 | 0.15 |
| |
| CPI | | | |
| Consumer Price Index | 0.80% | 1.73% | 1.33% |
The performance data shown represent past performance, which is not a guarantee of future results.
1 For the ten years ended June 30, 2017, 50 of 53 fixed income, 19 of 19 balanced, and 38 of 40 stock fund share classes—or 107 of
112 share classes of active Vanguard funds—outperformed their peer-group averages. Source: Vanguard, based on data from Lipper,
a Thomson Reuters Company.
2 For the ten years ended June 30, 2017, 21 of 53 fixed income, 5 of 19 balanced, and 23 of 40 stock fund share classes—or 49 of
112 share classes of active Vanguard funds—outperformed their benchmark indexes. Source: Vanguard, based on data from Lipper,
a Thomson Reuters Company.
4
management. Investors need to watch not only explicit costs, such as those reflected in fund expense ratios, but also implicit ones, such as trading costs, which can be significant because of the higher portfolio turnover associated with many active funds.
Historically, costs have been a reliable predictor of fund performance. But low costs don’t guarantee positive results. Talent is also critical. For this reason, Vanguard dedicates a lot of time, attention, and resources to manager selection and the ongoing oversight of managers.
Reaching beyond our walls
To serve our investors, we’re committed to identifying and attracting the best active managers across a range of investment styles and approaches. We recognize that not all great active managers reside in Valley Forge, Pennsylvania, where Vanguard is headquartered. As a result, we look across the world for managers for many of our active funds.
We oversee about $600 billion in assets that are managed by external advisors and partner with more than 25 firms employing hundreds of investment professionals and supporting analysts. These firms are responsible for more than 70 investment mandates within our active portfolios.
Stay patient and control taxes
Costs and manager selection are critical, but they aren’t the only necessities. You’ll also need a healthy supply of what many investors don’t possess in abundance: patience. Having the fortitude to wait is essential because even those active managers with the best track records go through significant periods of underperformance.
Patience is also crucial because investors in active strategies must stay disciplined and stick with them over time to take full advantage of the compounding benefits of outperformance. This is easy to say but often difficult to execute.
A few years ago, Vanguard looked at those actively managed domestic equity funds across the industry that did best over the previous 15 years. We found that even though these funds outperformed their benchmark indexes over that long period, 97% lagged the benchmarks in at least five calendar years. And two-thirds of the outperforming funds experienced at least three consecutive years of underperformance.3
Tax efficiency is another important consideration. In general, investors shouldn’t hold active strategies in an account that lacks tax protection.
3 Source: Vanguard calculations for the 15 years ended December 31, 2012, using data from Morningstar, Inc.
5
The tax drag associated with most active funds because of their higher turnover can be neutralized by holding the investments in tax-advantaged accounts, such as IRAs and 401(k) plans.
If you keep your focus on these four considerations—costs, manager selection, patience, and taxes—you’ll enhance your chances of achieving success with actively managed funds.
As always, thank you for investing with Vanguard.
Sincerely,

F. William McNabb III
Chairman and Chief Executive Officer
August 14, 2017
|
| Vanguard fund shareholders encouraged to vote in proxy campaign |
| |
| This summer we are asking you to vote on the election of trustees for all U.S.-domiciled |
| Vanguard funds, and on several fund policy proposals that we believe are in the best |
| interests of all shareholders. |
| |
| Vanguard filed a proxy statement on August 14, 2017, with the U.S. Securities and Exchange |
| Commission (SEC). Proxy materials are being provided to Vanguard fund shareholders with |
| instructions on how to vote online, by phone, or by mail. |
| |
| A shareholder meeting is scheduled to be held in Scottsdale, Arizona, on November 15, |
| 2017, when voting will conclude. We encourage you to vote promptly. Please visit |
| vanguard.com for updates. |
6
Dividend Appreciation Index Fund
Fund Profile
As of July 31, 2017
| | | |
| Share-Class Characteristics | | |
| Investor | ETF | Admiral |
| Shares | Shares | Shares |
| Ticker Symbol | VDAIX | VIG | VDADX |
| Expense Ratio1 | 0.16% | 0.08% | 0.08% |
| 30-Day SEC Yield | 1.86% | 1.92% | 1.92% |
| |
| Portfolio Characteristics | | |
| | | NASDAQ | |
| | | US | |
| | | Dividend | DJ |
| | | Achievers | U.S. Total |
| | | Select | Market |
| | Fund | Index | FA Index |
| Number of Stocks | 185 | 180 | 3,786 |
| Median Market Cap $55.8B | $55.8B | $61.2B |
| Price/Earnings Ratio | 22.6x | 22.6x | 21.5x |
| Price/Book Ratio | 4.1x | 4.1x | 2.9x |
| Return on Equity | 19.2% | 19.2% | 15.1% |
| Earnings Growth Rate | 5.6% | 5.6% | 10.1% |
| Dividend Yield | 1.9% | 1.9% | 1.8% |
| Foreign Holdings | 0.0% | 0.0% | 0.0% |
| Turnover Rate | | | |
| (Annualized) | 16% | — | — |
| Short-Term Reserves | 0.1% | — | — |
| | |
| Volatility Measures | | |
| | NASDAQ | |
| | US Dividend | DJ |
| | Achievers | U.S. Total |
| | Select | Market |
| | Index | FA Index |
| R-Squared | 1.00 | 0.88 |
| Beta | 1.00 | 0.83 |
| These measures show the degree and timing of the fund’s |
| fluctuations compared with the indexes over 36 months. |
| | |
| Ten Largest Holdings (% of total net assets) |
| Microsoft Corp. | Software | 4.4% |
| Johnson & Johnson | Pharmaceuticals | 4.2 |
| PepsiCo Inc. | Soft Drinks | 4.1 |
| 3M Co. | Diversified Industrials | 3.3 |
| Medtronic plc | Medical Equipment | 3.2 |
| United Technologies | | |
| Corp. | Aerospace | 2.6 |
| Walgreens Boots | | |
| Alliance Inc. | Drug Retailers | 2.4 |
| Abbott Laboratories | Pharmaceuticals | 2.4 |
| Accenture plc | Business Support | |
| | Services | 2.4 |
| Lockheed Martin Corp. | Defense | 2.4 |
| Top Ten | | 31.4% |
| The holdings listed exclude any temporary cash investments and equity index products. |
| | |
Investment Focus
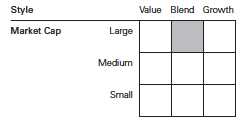
1 The expense ratios shown are from the prospectus dated May 25, 2017, and represent estimated costs for the current fiscal year. For the six months ended July 31, 2017, the annualized expense ratios were 0.16% for Investor Shares, 0.08% for ETF Shares, and 0.08% for Admiral Shares.
7
Dividend Appreciation Index Fund
Sector Diversification (% of equity exposure)
| | | |
| | | NASDAQ | |
| | | US | |
| | | Dividend | DJ |
| | | Achievers | U.S. Total |
| | | Select | Market |
| | Fund | Index | FA Index |
| Basic Materials | 4.8% | 4.8% | 2.6% |
| Consumer Goods | 14.0 | 14.0 | 9.4 |
| Consumer Services | 14.9 | 14.9 | 13.0 |
| Financials | 10.0 | 10.0 | 20.5 |
| Health Care | 13.7 | 13.7 | 13.0 |
| Industrials | 31.8 | 31.7 | 12.9 |
| Oil & Gas | 0.0 | 0.0 | 5.5 |
| Technology | 8.7 | 8.8 | 17.9 |
| Telecommunications | 0.1 | 0.1 | 2.0 |
| Utilities | 2.0 | 2.0 | 3.2 |
Sector categories are based on the Industry Classification Benchmark (“ICB”), except for the “Other” category (if applicable),
which includes securities that have not been provided an ICB classification as of the effective reporting period.
8
Dividend Appreciation Index Fund
Performance Summary
All of the returns in this report represent past performance, which is not a guarantee of future results that may be achieved by the fund. (Current performance may be lower or higher than the performance data cited. For performance data current to the most recent month-end, visit our website at vanguard.com/performance.) Note, too, that both investment returns and principal value can fluctuate widely, so an investor’s shares, when sold, could be worth more or less than their original cost. The returns shown do not reflect taxes that a shareholder would pay on fund distributions or on the sale of fund shares.
Fiscal-Year Total Returns (%): January 31, 2007, Through July 31, 2017

Note: For 2018, performance data reflect the six months ended July 31, 2017.
Average Annual Total Returns: Periods Ended June 30, 2017
This table presents returns through the latest calendar quarter—rather than through the end of the fiscal period.
Securities and Exchange Commission rules require that we provide this information.
| | | | |
| | Inception | One | Five | Ten |
| | Date | Year | Years | Years |
| Investor Shares | 4/27/2006 | 13.59% | 12.64% | 7.28% |
| ETF Shares | 4/21/2006 | | | |
| Market Price | | 13.75 | 12.75 | 7.41 |
| Net Asset Value | | 13.70 | 12.74 | 7.39 |
| Admiral Shares | 12/19/2013 | 13.72 | — | 9.011 |
| 1 Return since inception. | | | | |
See Financial Highlights for dividend and capital gains information.
9
Dividend Appreciation Index Fund
Financial Statements (unaudited)
Statement of Net Assets
As of July 31, 2017
The fund reports a complete list of its holdings in regulatory filings four times in each fiscal year, at the quarter-ends. For the second and fourth fiscal quarters, the lists appear in the fund’s semiannual and annual reports to shareholders. For the first and third fiscal quarters, the fund files the lists with the Securities and Exchange Commission on Form N-Q. Shareholders can look up the fund’s Forms N-Q on the SEC’s website at sec.gov. Forms N-Q may also be reviewed and copied at the SEC’s Public Reference Room (see the back cover of this report for further information).
| | |
| | | Market |
| | | Value• |
| | Shares | ($000) |
| Common Stocks (99.9%)1 | | |
| Basic Materials (4.8%) | | |
| Ecolab Inc. | 2,491,419 | 328,045 |
| Air Products & | | |
| Chemicals Inc. | 1,858,320 | 264,160 |
| PPG Industries Inc. | 2,195,747 | 231,102 |
| Nucor Corp. | 2,723,167 | 157,045 |
| Albemarle Corp. | 961,239 | 111,312 |
| International Flavors | | |
| & Fragrances Inc. | 674,885 | 89,881 |
| Westlake Chemical Corp. | 1,101,172 | 77,479 |
| RPM International Inc. | 1,140,970 | 59,182 |
| Royal Gold Inc. | 557,793 | 48,338 |
| NewMarket Corp. | 101,196 | 46,561 |
| Sensient Technologies | | |
| Corp. | 379,037 | 28,185 |
| HB Fuller Co. | 429,776 | 22,142 |
| Stepan Co. | 191,621 | 15,746 |
| Hawkins Inc. | 90,588 | 4,072 |
| | | 1,483,250 |
| Consumer Goods (14.0%) | | |
| PepsiCo Inc. | 10,763,716 | 1,255,157 |
| NIKE Inc. Class B | 11,317,980 | 668,327 |
| Colgate-Palmolive Co. | 7,540,024 | 544,390 |
| Archer-Daniels- | | |
| Midland Co. | 4,877,257 | 205,723 |
| Kellogg Co. | 2,998,869 | 203,923 |
| Stanley Black & | | |
| Decker Inc. | 1,303,204 | 183,348 |
| Hormel Foods Corp. | 4,516,370 | 154,324 |
| Clorox Co. | 1,095,544 | 146,244 |
| JM Smucker Co. | 994,464 | 121,225 |
| Church & Dwight | | |
| Co. Inc. | 2,174,698 | 116,020 |
| Hasbro Inc. | 1,061,363 | 112,377 |
| Genuine Parts Co. | 1,267,039 | 107,610 |
| Bunge Ltd. | 1,191,561 | 93,406 |
| McCormick & Co. Inc. | 970,511 | 92,490 |
| | | |
| | | | Market |
| | | | Value• |
| | | Shares | ($000) |
| | Brown-Forman Corp. | | |
| | Class B | 1,841,994 | 90,994 |
| | Leggett & Platt Inc. | 1,142,398 | 55,041 |
| ^ | Polaris Industries Inc. | 537,624 | 48,203 |
| | Columbia Sportswear Co. | 593,306 | 35,942 |
| | Lancaster Colony Corp. | 234,216 | 28,720 |
| | J&J Snack Foods Corp. | 159,667 | 20,980 |
| ^ | Tootsie Roll Industries Inc. | 322,380 | 11,993 |
| | Andersons Inc. | 241,224 | 8,310 |
| | | | 4,304,747 |
| Consumer Services (14.9%) | | |
| | Walgreens Boots | | |
| | Alliance Inc. | 9,218,603 | 743,665 |
| | CVS Health Corp. | 8,759,970 | 700,184 |
| | Costco Wholesale Corp. | 3,751,351 | 594,627 |
| | Lowe’s Cos. Inc. | 7,428,914 | 574,998 |
| | TJX Cos. Inc. | 5,567,522 | 391,452 |
| | Sysco Corp. | 4,613,636 | 242,769 |
| | Cardinal Health Inc. | 2,694,113 | 208,147 |
| | Kroger Co. | 8,012,030 | 196,455 |
| | Ross Stores Inc. | 3,365,954 | 186,205 |
| | AmerisourceBergen | | |
| | Corp. Class A | 1,855,685 | 174,100 |
| | Best Buy Co. Inc. | 2,680,282 | 156,368 |
| | Tiffany & Co. | 1,062,757 | 101,504 |
| | Rollins Inc. | 1,861,958 | 80,828 |
| | FactSet Research | | |
| | Systems Inc. | 337,904 | 56,504 |
| ^ | Casey’s General | | |
| | Stores Inc. | 334,648 | 35,724 |
| ^ | Cracker Barrel Old | | |
| | Country Store Inc. | 205,249 | 31,906 |
| | Aaron’s Inc. | 610,318 | 28,245 |
| | John Wiley & Sons | | |
| | Inc. Class A | 412,681 | 22,801 |
| | Matthews International | | |
| | Corp. Class A | 275,661 | 18,070 |
| | Monro Muffler Brake Inc. | 277,837 | 12,947 |
10
Dividend Appreciation Index Fund
| | | |
| | | | Market |
| | | | Value• |
| | | Shares | ($000) |
| | Bob Evans Farms Inc. | 168,531 | 11,659 |
| | International Speedway | | |
| | Corp. Class A | 215,691 | 7,722 |
| | | | 4,576,880 |
| Financials (10.0%) | | |
| | Chubb Ltd. | 3,978,020 | 582,621 |
| | S&P Global Inc. | 2,206,846 | 338,949 |
| | Travelers Cos. Inc. | 2,388,647 | 305,962 |
| | Aflac Inc. | 3,428,343 | 273,410 |
| | Franklin Resources Inc. | 4,828,115 | 216,203 |
| | Ameriprise Financial Inc. | 1,315,756 | 190,627 |
| | Cincinnati Financial Corp. | 1,406,523 | 107,121 |
| | Torchmark Corp. | 1,005,732 | 79,423 |
| | SEI Investments Co. | 1,359,131 | 76,804 |
| | American Financial | | |
| | Group Inc. | 743,312 | 75,372 |
| | WR Berkley Corp. | 1,035,133 | 71,393 |
| | Brown & Brown Inc. | 1,195,508 | 53,320 |
| | RenaissanceRe | | |
| | Holdings Ltd. | 349,543 | 51,351 |
| | Commerce Bancshares | | |
| | Inc. | 868,090 | 50,384 |
| | Erie Indemnity Co. | | |
| | Class A | 394,531 | 50,287 |
| | Assurant Inc. | 475,034 | 50,007 |
| | Cullen/Frost Bankers Inc. | 544,526 | 49,432 |
| | Eaton Vance Corp. | 970,056 | 47,620 |
| | BOK Financial Corp. | 559,137 | 47,566 |
| | Axis Capital Holdings Ltd. | 735,727 | 47,513 |
| | Bank of the Ozarks | 1,034,780 | 44,651 |
| | Prosperity Bancshares | | |
| | Inc. | 593,439 | 38,039 |
| | Hanover Insurance | | |
| | Group Inc. | 362,805 | 34,416 |
| | UMB Financial Corp. | 425,253 | 29,623 |
| ^ | AmTrust Financial | | |
| | Services Inc. | 1,456,000 | 23,296 |
| | RLI Corp. | 375,286 | 21,789 |
| | Community Bank | | |
| | System Inc. | 380,081 | 20,866 |
| | American Equity | | |
| | Investment Life | | |
| | Holding Co. | 753,885 | 20,189 |
| | BancFirst Corp. | 135,068 | 14,419 |
| ^ | Westamerica | | |
| | Bancorporation | 224,499 | 12,285 |
| | 1st Source Corp. | 221,068 | 10,854 |
| | Tompkins Financial Corp. | 129,372 | 10,183 |
| | Infinity Property & | | |
| | Casualty Corp. | 94,351 | 9,440 |
| | Southside Bancshares | | |
| | Inc. | 250,423 | 8,697 |
| | Community Trust | | |
| | Bancorp Inc. | 150,334 | 6,494 |
| | | | 3,070,606 |
| | | |
| | | | Market |
| | | | Value• |
| | | Shares | ($000) |
| Health Care (13.7%) | | |
| | Johnson & Johnson | 9,721,846 | 1,290,283 |
| | Medtronic plc | 11,726,430 | 984,668 |
| | Abbott Laboratories | 14,757,776 | 725,787 |
| | Stryker Corp. | 3,184,587 | 468,453 |
| | Becton Dickinson and | | |
| | Co. | 1,817,615 | 366,068 |
| | CR Bard Inc. | 615,176 | 197,225 |
| | Perrigo Co. plc | 1,224,579 | 91,746 |
| | West Pharmaceutical | | |
| | Services Inc. | 625,811 | 55,509 |
| | Healthcare Services | | |
| | Group Inc. | 621,750 | 32,487 |
| | Atrion Corp. | 15,589 | 9,855 |
| | National HealthCare | | |
| | Corp. | 129,854 | 8,463 |
| | STERIS plc | 106 | 9 |
| | Owens & Minor Inc. | 69 | 2 |
| | | | 4,230,555 |
| Industrials (31.7%) | | |
| | 3M Co. | 5,091,812 | 1,024,320 |
| | United Technologies | | |
| | Corp. | 6,882,392 | 816,045 |
| | Accenture plc Class A | 5,629,061 | 725,136 |
| | Lockheed Martin Corp. | 2,479,416 | 724,312 |
| | Union Pacific Corp. | 6,950,184 | 715,591 |
| | General Dynamics Corp. | 2,585,554 | 507,622 |
| | FedEx Corp. | 2,276,098 | 473,497 |
| | Automatic Data | | |
| | Processing Inc. | 3,833,870 | 455,885 |
| | Raytheon Co. | 2,501,343 | 429,656 |
| | Illinois Tool Works Inc. | 2,959,750 | 416,466 |
| | Northrop Grumman | | |
| | Corp. | 1,491,150 | 392,366 |
| | CSX Corp. | 7,912,252 | 390,390 |
| | Waste Management Inc. | 3,755,320 | 282,212 |
| | Sherwin-Williams Co. | 796,887 | 268,766 |
| | Roper Technologies Inc. | 870,050 | 202,252 |
| | Republic Services Inc. | | |
| | Class A | 2,896,331 | 186,002 |
| | Cintas Corp. | 896,914 | 120,949 |
| | L3 Technologies Inc. | 664,344 | 116,240 |
| | Dover Corp. | 1,328,109 | 111,561 |
| | Fastenal Co. | 2,469,893 | 106,107 |
| | Expeditors International | | |
| | of Washington Inc. | 1,538,345 | 90,578 |
| | JB Hunt Transport | | |
| | Services Inc. | 950,730 | 86,241 |
| ^ | WW Grainger Inc. | 502,546 | 83,795 |
| | CH Robinson | | |
| | Worldwide Inc. | 1,209,208 | 79,324 |
| | Jack Henry & | | |
| | Associates Inc. | 663,066 | 71,160 |
| | AO Smith Corp. | 1,255,919 | 67,254 |
| | Toro Co. | 923,980 | 65,686 |
11
Dividend Appreciation Index Fund
| | | |
| | | | Market |
| | | | Value• |
| | | Shares | ($000) |
| | Nordson Corp. | 490,683 | 62,317 |
| | Graco Inc. | 478,471 | 55,522 |
| | Carlisle Cos. Inc. | 551,406 | 53,812 |
| | Donaldson Co. Inc. | 1,127,624 | 53,551 |
| | Robert Half International | | |
| | Inc. | 1,091,453 | 49,388 |
| | Lincoln Electric Holdings | |
| | Inc. | 561,243 | 48,974 |
| | MDU Resources Group | | |
| | Inc. | 1,667,223 | 43,931 |
| | AptarGroup Inc. | 532,464 | 43,092 |
| | Sonoco Products Co. | 848,291 | 41,125 |
| | Bemis Co. Inc. | 789,662 | 33,458 |
| | Ryder System Inc. | 456,337 | 33,203 |
| | Regal Beloit Corp. | 382,165 | 31,853 |
| | Silgan Holdings Inc. | 1,031,136 | 31,243 |
| | ITT Inc. | 754,875 | 30,950 |
| | MSC Industrial Direct | | |
| | Co. Inc. Class A | 382,858 | 27,263 |
| | MSA Safety Inc. | 322,204 | 25,828 |
| | ABM Industries Inc. | 474,411 | 21,168 |
| | Franklin Electric Co. Inc. | 395,366 | 15,973 |
| | Brady Corp. Class A | 406,921 | 13,510 |
| | Tennant Co. | 150,285 | 11,354 |
| | Badger Meter Inc. | 248,520 | 11,246 |
| ^ | Lindsay Corp. | 90,789 | 8,323 |
| | McGrath RentCorp | 204,335 | 7,260 |
| | Gorman-Rupp Co. | 223,024 | 6,740 |
| | Cass Information | | |
| | Systems Inc. | 95,569 | 6,304 |
| | NACCO Industries Inc. | | |
| | Class A | 44,495 | 2,919 |
| | Crane Co. | 62 | 5 |
| | Valmont Industries Inc. | 29 | 4 |
| | | | 9,779,729 |
| Technology (8.7%) | | |
| | Microsoft Corp. | 18,569,885 | 1,350,031 |
| | Texas Instruments Inc. | 8,537,340 | 694,769 |
| | Analog Devices Inc. | 3,117,200 | 246,290 |
| | Microchip Technology | | |
| | Inc. | 1,848,585 | 147,961 |
| | Xilinx Inc. | 2,126,258 | 134,507 |
| | Harris Corp. | 1,063,121 | 121,695 |
| | | | 2,695,253 |
| Telecommunications (0.1%) | |
| | Telephone & Data | | |
| | Systems Inc. | 879,177 | 24,995 |
| | ATN International Inc. | 137,967 | 8,002 |
| | | | 32,997 |
| Utilities (2.0%) | | |
| | Edison International | 2,782,637 | 218,938 |
| | Atmos Energy Corp. | 898,236 | 77,931 |
| | UGI Corp. | 1,476,647 | 74,526 |
| | Aqua America Inc. | 1,515,405 | 50,584 |
| | | |
| | | | Market |
| | | | Value• |
| | | Shares | ($000) |
| | Southwest Gas | | |
| | Holdings Inc. | 405,544 | 32,484 |
| | Black Hills Corp. | 456,006 | 31,765 |
| | New Jersey Resources | | |
| | Corp. | 736,830 | 31,057 |
| | MGE Energy Inc. | 296,118 | 19,707 |
| | California Water Service | | |
| | Group | 409,712 | 15,938 |
| | American States | | |
| | Water Co. | 312,067 | 15,432 |
| | Chesapeake Utilities Corp. | 139,218 | 10,755 |
| | SJW Group | 175,159 | 9,261 |
| | Middlesex Water Co. | 138,701 | 5,443 |
| | Connecticut Water | | |
| | Service Inc. | 94,250 | 5,370 |
| | York Water Co. | 109,484 | 3,810 |
| | WGL Holdings Inc. | 55 | 5 |
| | | | 603,006 |
| Total Common Stocks | | |
| (Cost $24,422,996) | | 30,777,023 |
| Temporary Cash Investments (0.2%)1 | |
| Money Market Fund (0.2%) | | |
| 2,3 | Vanguard Market Liquidity | | |
| | Fund, 1.217% | 710,008 | 71,015 |
| |
| | | Face | |
| | | Amount | |
| | | ($000) | |
| U.S. Government and Agency Obligations (0.0%) |
| | United States Treasury Bill, | | |
| | 0.987%, 9/7/17 | 500 | 499 |
| 4 | United States Treasury Bill, | | |
| | 0.994%, 9/21/17 | 1,000 | 999 |
| 4 | United States Treasury Bill, | | |
| | 0.976%, 10/5/17 | 500 | 499 |
| | | | 1,997 |
| Total Temporary Cash Investments | |
| (Cost $73,007) | | 73,012 |
| Total Investments (100.1%) | | |
| (Cost $24,496,003) | | 30,850,035 |
12
Dividend Appreciation Index Fund
| |
| | Amount |
| | ($000) |
| Other Assets and Liabilities (-0.1%) | |
| Other Assets | |
| Investment in Vanguard | 1,977 |
| Receivables for Accrued Income | 30,548 |
| Receivables for Capital Shares Issued | 9,710 |
| Total Other Assets | 42,235 |
| Liabilities | |
| Payables for Investment Securities | |
| Purchased | (6,998) |
| Collateral for Securities on Loan | (49,541) |
| Payables for Capital Shares Redeemed | (4,083) |
| Payables to Vanguard | (11,338) |
| Other Liabilities | (39) |
| Total Liabilities | (71,999) |
| Net Assets (100%) | 30,820,271 |
| |
| |
| At July 31, 2017, net assets consisted of: |
| | Amount |
| | ($000) |
| Paid-in Capital | 24,883,763 |
| Undistributed Net Investment Income | 40,366 |
| Accumulated Net Realized Losses | (458,383) |
| Unrealized Appreciation (Depreciation) | |
| Investment Securities | 6,354,032 |
| Futures Contracts | 493 |
| Net Assets | 30,820,271 |
| |
| | Amount |
| | ($000) |
| Investor Shares—Net Assets | |
| Applicable to 28,801,052 outstanding | |
| $.001 par value shares of beneficial | |
| interest (unlimited authorization) | 1,075,793 |
| Net Asset Value Per Share— | |
| Investor Shares | $37.35 |
| |
| |
| ETF Shares—Net Assets | |
| Applicable to 265,848,073 outstanding |
| $.001 par value shares of beneficial | |
| interest (unlimited authorization) | 24,819,128 |
| Net Asset Value Per Share— | |
| ETF Shares | $93.36 |
| |
| |
| Admiral Shares—Net Assets | |
| Applicable to 194,406,919 outstanding |
| $.001 par value shares of beneficial | |
| interest (unlimited authorization) | 4,925,350 |
| Net Asset Value Per Share— | |
| Admiral Shares | $25.34 |
• See Note A in Notes to Financial Statements.
^ Includes partial security positions on loan to broker-dealers. The total value of securities on loan is $48,498,000.
1 The fund invests a portion of its cash reserves in equity markets through the use of index futures contracts. After giving effect to futures
investments, the fund’s effective common stock and temporary cash investment positions represent 100.0% and 0.1%, respectively, of net assets.
2 Affiliated money market fund available only to Vanguard funds and certain trusts and accounts managed by Vanguard. Rate shown is the 7-day yield.
3 Includes $49,541,000 of collateral received for securities on loan.
4 Securities with a value of $1,498,000 have been segregated as initial margin for open futures contracts.
See accompanying Notes, which are an integral part of the Financial Statements.
13
| |
| Dividend Appreciation Index Fund | |
| |
| |
| Statement of Operations | |
| |
| | Six Months Ended |
| | July 31, 2017 |
| | ($000) |
| Investment Income | |
| Income | |
| Dividends | 343,756 |
| Interest1 | 111 |
| Securities Lending—Net | 230 |
| Total Income | 344,097 |
| Expenses | |
| The Vanguard Group—Note B | |
| Investment Advisory Services | 1,571 |
| Management and Administrative—Investor Shares | 645 |
| Management and Administrative—ETF Shares | 6,996 |
| Management and Administrative—Admiral Shares | 1,325 |
| Marketing and Distribution—Investor Shares | 89 |
| Marketing and Distribution—ETF Shares | 390 |
| Marketing and Distribution—Admiral Shares | 185 |
| Custodian Fees | 184 |
| Auditing Fees | 7 |
| Shareholders’ Reports—Investor Shares | 52 |
| Shareholders’ Reports—ETF Shares | 715 |
| Shareholders’ Reports—Admiral Shares | 125 |
| Trustees’ Fees and Expenses | 9 |
| Total Expenses | 12,293 |
| Net Investment Income | 331,804 |
| Realized Net Gain (Loss) | |
| Investment Securities Sold1 | 966,902 |
| Futures Contracts | 3,520 |
| Realized Net Gain (Loss) | 970,422 |
| Change in Unrealized Appreciation (Depreciation) | |
| Investment Securities | 1,183,811 |
| Futures Contracts | 259 |
| Change in Unrealized Appreciation (Depreciation) | 1,184,070 |
| Net Increase (Decrease) in Net Assets Resulting from Operations | 2,486,296 |
1 Interest income and realized net gain (loss) from an affiliated company of the fund were $104,000 and ($19,000), respectively.
See accompanying Notes, which are an integral part of the Financial Statements.
14
| | |
| Dividend Appreciation Index Fund | | |
| |
| |
| Statement of Changes in Net Assets | | |
| |
| | Six Months Ended | Year Ended |
| | July 31, | January 31, |
| | 2017 | 2017 |
| | ($000) | ($000) |
| Increase (Decrease) in Net Assets | | |
| Operations | | |
| Net Investment Income | 331,804 | 572,766 |
| Realized Net Gain (Loss) | 970,422 | 31,660 |
| Change in Unrealized Appreciation (Depreciation) | 1,184,070 | 3,293,065 |
| Net Increase (Decrease) in Net Assets Resulting from Operations | 2,486,296 | 3,897,491 |
| Distributions | | |
| Net Investment Income | | |
| Investor Shares | (10,346) | (18,763) |
| ETF Shares | (248,554) | (474,719) |
| Admiral Shares | (47,712) | (82,693) |
| Realized Capital Gain | | |
| Investor Shares | — | — |
| ETF Shares | — | — |
| Admiral Shares | — | — |
| Total Distributions | (306,612) | (576,175) |
| Capital Share Transactions | | |
| Investor Shares | 5,008 | 2,117 |
| ETF Shares | 354,816 | 1,201,844 |
| Admiral Shares | 295,342 | 599,134 |
| Net Increase (Decrease) from Capital Share Transactions | 655,166 | 1,803,095 |
| Total Increase (Decrease) | 2,834,850 | 5,124,411 |
| Net Assets | | |
| Beginning of Period | 27,985,421 | 22,861,010 |
| End of Period1 | 30,820,271 | 27,985,421 |
1 Net Assets—End of Period includes undistributed (overdistributed) net investment income of $40,366,000 and $15,174,000.
See accompanying Notes, which are an integral part of the Financial Statements.
15
| | | | | | |
| Dividend Appreciation Index Fund | | | | | | |
| |
| |
| Financial Highlights | | | | | | |
| |
| |
| Investor Shares | | | | | | |
| Six Months | | | | | |
| | Ended | | | | | |
| For a Share Outstanding | July 31, | Year Ended January 31, |
| Throughout Each Period | 2017 | 2017 | 2016 | 2015 | 2014 | 2013 |
| Net Asset Value, Beginning of Period | $34.67 | $30.40 | $31.37 | $28.59 | $25.23 | $22.42 |
| Investment Operations | | | | | | |
| Net Investment Income | .392 | .694 | .670 | .627 | .540 | .538 |
| Net Realized and Unrealized Gain (Loss) | | | | | | |
| on Investments | 2.650 | 4.275 | (.947) | 2.756 | 3.350 | 2.812 |
| Total from Investment Operations | 3.042 | 4.969 | (.277) | 3.383 | 3.890 | 3.350 |
| Distributions | | | | | | |
| Dividends from Net Investment Income | (.362) | (.699) | (.693) | (.603) | (.530) | (.540) |
| Distributions from Realized Capital Gains | — | — | — | — | — | — |
| Total Distributions | (.362) | (.699) | (.693) | (.603) | (.530) | (.540) |
| Net Asset Value, End of Period | $37.35 | $34.67 | $30.40 | $31.37 | $28.59 | $25.23 |
| |
| Total Return1 | 8.80% | 16.46% | -0.93% | 11.86% | 15.51% | 15.15% |
| |
| Ratios/Supplemental Data | | | | | | |
| Net Assets, End of Period (Millions) | $1,076 | $994 | $875 | $1,450 | $2,966 | $2,804 |
| Ratio of Total Expenses to | | | | | | |
| Average Net Assets | 0.16% | 0.17% | 0.19% | 0.20% | 0.20% | 0.20% |
| Ratio of Net Investment Income to | | | | | | |
| Average Net Assets | 2.06% | 2.11% | 2.11% | 2.04% | 1.98% | 2.32% |
| Portfolio Turnover Rate2 | 16 % | 19% | 22% | 20% | 3% | 15% |
The expense ratio, net investment income ratio, and turnover rate for the current period have been annualized.
1 Total returns do not include account service fees that may have applied in the periods shown. Fund prospectuses provide information about any applicable account service fees.
2 Excludes the value of portfolio securities received or delivered as a result of in-kind purchases or redemptions of the fund’s capital shares, including ETF Creation Units.
See accompanying Notes, which are an integral part of the Financial Statements.
16
| | | | | | |
| Dividend Appreciation Index Fund | | | | | | |
| |
| |
| Financial Highlights | | | | | | |
| |
| |
| ETF Shares | | | | | | |
| Six Months | | | | | |
| | Ended | | | | | |
| For a Share Outstanding | July 31, | Year Ended January 31, |
| Throughout Each Period | 2017 | 2017 | 2016 | 2015 | 2014 | 2013 |
| Net Asset Value, Beginning of Period | $86.66 | $75.98 | $78.42 | $71.47 | $63.08 | $56.04 |
| Investment Operations | | | | | | |
| Net Investment Income | 1.018 | 1.810 | 1.759 | 1.645 | 1.421 | 1.401 |
| Net Realized and Unrealized Gain (Loss) | | | | | | |
| on Investments | 6.625 | 10.696 | (2.380) | 6.890 | 8.357 | 7.049 |
| Total from Investment Operations | 7.643 | 12.506 | (.621) | 8.535 | 9.778 | 8.450 |
| Distributions | | | | | | |
| Dividends from Net Investment Income | (.943) | (1.826) | (1.819) | (1.585) | (1.388) | (1.410) |
| Distributions from Realized Capital Gains | — | — | — | — | — | — |
| Total Distributions | (.943) | (1.826) | (1.819) | (1.585) | (1.388) | (1.410) |
| Net Asset Value, End of Period | $93.36 | $86.66 | $75.98 | $78.42 | $71.47 | $63.08 |
| |
| Total Return | 8.84% | 16.59% | -0.84% | 11.97% | 15.60% | 15.29% |
| |
| Ratios/Supplemental Data | | | | | | |
| Net Assets, End of Period (Millions) | $24,819 | $22,698 | $18,771 | $20,610 | $18,511 | $13,119 |
| Ratio of Total Expenses to | | | | | | |
| Average Net Assets | 0.08% | 0.08% | 0.09% | 0.10% | 0.10% | 0.10% |
| Ratio of Net Investment Income to | | | | | | |
| Average Net Assets | 2.14% | 2.20% | 2.21% | 2.14% | 2.08% | 2.42% |
| Portfolio Turnover Rate1 | 16% | 19% | 22% | 20% | 3% | 15% |
The expense ratio, net investment income ratio, and turnover rate for the current period have been annualized.
1 Excludes the value of portfolio securities received or delivered as a result of in-kind purchases or redemptions of the fund’s capital shares, including ETF Creation Units.
See accompanying Notes, which are an integral part of the Financial Statements.
17
Dividend Appreciation Index Fund
Financial Highlights
Admiral Shares
| | | | | |
| | Six Months | | | | Dec 19, |
| | Ended | | | | 20131 to |
| | July 31, | Year Ended July 31, | Jan. 31, |
| For a Share Outstanding Throughout Each Period | 2017 | 2017 | 2016 | 2015 | 2014 |
| Net Asset Value, Beginning of Period | $23.52 | $20.62 | $21.28 | $19.40 | $20.00 |
| Investment Operations | | | | | |
| Net Investment Income | .276 | .492 | .478 | .445 | .030 |
| Net Realized and Unrealized Gain (Loss) | | | | | |
| on Investments | 1.799 | 2.903 | (.644) | 1.865 | (.630) |
| Total from Investment Operations | 2.075 | 3.395 | (.166) | 2.310 | (.600) |
| Distributions | | | | | |
| Dividends from Net Investment Income | (.255) | (.495) | (.494) | (.430) | — |
| Distributions from Realized Capital Gains | — | — | — | — | — |
| Total Distributions | (.255) | (.495) | (.494) | (.430) | — |
| Net Asset Value, End of Period | $25.34 | $23.52 | $20.62 | $21.28 | $19.40 |
| |
| Total Return2 | 8.85% | 16.58% | -0.83% | 11.94% | -3.00% |
| |
| Ratios/Supplemental Data | | | | | |
| Net Assets, End of Period (Millions) | $4,925 | $4,294 | $3,215 | $2,776 | $760 |
| Ratio of Total Expenses to Average Net Assets | 0.08% | 0.08% | 0.09% | 0.10% | 0.10%3 |
| Ratio of Net Investment Income to | | | | | |
| Average Net Assets | 2.14% | 2.20% | 2.21% | 2.14% | 2.08%3 |
| Portfolio Turnover Rate 4 | 16% | 19% | 22% | 20% | 3% |
The expense ratio, net investment income ratio, and turnover rate for the current period have been annualized.
1 Inception.
2 Total returns do not include account service fees that may have applied in the periods shown. Fund prospectuses provide information about any applicable account service fees.
3 Annualized.
4 Excludes the value of portfolio securities received or delivered as a result of in-kind purchases or redemptions of the fund’s capital shares, including ETF Creation Units.
See accompanying Notes, which are an integral part of the Financial Statements.
18
Dividend Appreciation Index Fund
Notes to Financial Statements
Vanguard Dividend Appreciation Index Fund is registered under the Investment Company Act of 1940 as an open-end investment company, or mutual fund. The fund offers three classes of shares: Investor Shares, ETF Shares, and Admiral Shares. Investor Shares are available to any investor who meets the fund’s minimum purchase requirements. ETF Shares are listed for trading on NYSE Arca; they can be purchased and sold through a broker. Admiral Shares are designed for investors who meet certain administrative, service, and account-size criteria.
A. The following significant accounting policies conform to generally accepted accounting principles for U.S. investment companies. The fund consistently follows such policies in preparing its financial statements.
1. Security Valuation: Securities are valued as of the close of trading on the New York Stock Exchange (generally 4 p.m., Eastern time) on the valuation date. Equity securities are valued at the latest quoted sales prices or official closing prices taken from the primary market in which each security trades; such securities not traded on the valuation date are valued at the mean of the latest quoted bid and asked prices. Securities for which market quotations are not readily available, or whose values have been materially affected by events occurring before the fund’s pricing time but after the close of the securities’ primary markets, are valued by methods deemed by the board of trustees to represent fair value. Investments in Vanguard Market Liquidity Fund are valued at that fund’s net asset value. Temporary cash investments are valued using the latest bid prices or using valuations based on a matrix system (which considers such factors as security prices, yields, maturities, and ratings), both as furnished by independent pricing services.
2. Futures Contracts: The fund uses index futures contracts to a limited extent, with the objectives of maintaining full exposure to the stock market, enhancing returns, maintaining liquidity, and minimizing transaction costs. The fund may purchase futures contracts to immediately invest incoming cash in the market, or sell futures in response to cash outflows, thereby simulating a fully invested position in the underlying index while maintaining a cash balance for liquidity. The fund may seek to enhance returns by using futures contracts instead of the underlying securities when futures are believed to be priced more attractively than the underlying securities. The primary risks associated with the use of futures contracts are imperfect correlation between changes in market values of stocks held by the fund and the prices of futures contracts, and the possibility of an illiquid market. Counterparty risk involving futures is mitigated because a regulated clearing-house is the counterparty instead of the clearing broker. To further mitigate counterparty risk, the fund trades futures contracts on an exchange, monitors the financial strength of its clearing brokers and clearinghouse, and has entered into clearing agreements with its clearing brokers. The clearinghouse imposes initial margin requirements to secure the fund’s performance and requires daily settlement of variation margin representing changes in the market value of each contract.
Futures contracts are valued at their quoted daily settlement prices. The aggregate settlement values of the contracts are not recorded in the Statement of Net Assets. Fluctuations in the value of the contracts are recorded in the Statement of Net Assets as an asset (liability) and in the Statement of Operations as unrealized appreciation (depreciation) until the contracts are closed, when they are recorded as realized futures gains (losses).
During the six months ended July 31, 2017, the fund’s average investments in long and short futures contracts represented less than 1% and 0% of net assets, respectively, based on the average of aggregate settlement values at each quarter-end during the period.
19
Dividend Appreciation Index Fund
3. Federal Income Taxes: The fund intends to continue to qualify as a regulated investment company and distribute all of its taxable income. Management has analyzed the fund’s tax positions taken for all open federal income tax years (January 31, 2014–2017), and for the period ended July 31, 2017, and has concluded that no provision for federal income tax is required in the fund’s financial statements.
4. Distributions: Distributions to shareholders are recorded on the ex-dividend date.
5. Securities Lending: To earn additional income, the fund lends its securities to qualified institutional borrowers. Security loans are subject to termination by the fund at any time, and are required to be secured at all times by collateral in an amount at least equal to the market value of securities loaned. Daily market fluctuations could cause the value of loaned securities to be more or less than the value of the collateral received. When this occurs, the collateral is adjusted and settled on the next business day. The fund further mitigates its counterparty risk by entering into securities lending transactions only with a diverse group of prequalified counterparties, monitoring their financial strength, and entering into master securities lending agreements with its counterparties. The master securities lending agreements provide that, in the event of a counterparty’s default (including bankruptcy), the fund may terminate any loans with that borrower, determine the net amount owed, and sell or retain the collateral up to the net amount owed to the fund; however, such actions may be subject to legal proceedings. While collateral mitigates counterparty risk, in the event of a default, the fund may experience delays and costs in recovering the securities loaned. The fund invests cash collateral received in Vanguard Market Liquidity Fund, and records a liability in the Statement of Net Assets for the return of the collateral, during the period the securities are on loan. Securities lending income represents fees charged to borrowers plus income earned on invested cash collateral, less expenses associated with the loan. During the term of the loan, the fund is entitled to all distributions made on or in respect of the loaned securities.
6. Credit Facility: The fund and certain other funds managed by The Vanguard Group (“Vanguard”) participate in a $3.1 billion committed credit facility provided by a syndicate of lenders pursuant to a credit agreement that may be renewed annually; each fund is individually liable for its borrowings, if any, under the credit facility. Borrowings may be utilized for temporary and emergency purposes, and are subject to the fund’s regulatory and contractual borrowing restrictions. The participating funds are charged administrative fees and an annual commitment fee of 0.10% of the undrawn amount of the facility; these fees are allocated to the funds based on a method approved by the fund’s board of trustees and included in Management and Administrative expenses on the fund’s Statement of Operations. Any borrowings under this facility bear interest at a rate based upon the higher of the one-month London Interbank Offered Rate, federal funds effective rate, or overnight bank funding rate plus an agreed-upon spread.
The fund had no borrowings outstanding at July 31, 2017, or at any time during the period then ended.
7. Other: Dividend income is recorded on the ex-dividend date. Interest income includes income distributions received from Vanguard Market Liquidity Fund and is accrued daily. Premiums and discounts on debt securities purchased are amortized and accreted, respectively, to interest income over the lives of the respective securities. Security transactions are accounted for on the date securities are bought or sold. Costs used to determine realized gains (losses) on the sale of investment securities are those of the specific securities sold.
20
Dividend Appreciation Index Fund
Each class of shares has equal rights as to assets and earnings, except that each class separately bears certain class-specific expenses related to maintenance of shareholder accounts (included in Management and Administrative expenses) and shareholder reporting. Marketing and distribution expenses are allocated to each class of shares based on a method approved by the board of trustees. Income, other non-class-specific expenses, and gains and losses on investments are allocated to each class of shares based on its relative net assets.
B. In accordance with the terms of a Funds’ Service Agreement (the “FSA”) between Vanguard and the fund, Vanguard furnishes to the fund investment advisory, corporate management, administrative, marketing, and distribution services at Vanguard’s cost of operations (as defined by the FSA). These costs of operations are allocated to the fund based on methods and guidelines approved by the board of trustees. Vanguard does not require reimbursement in the current period for certain costs of operations (such as deferred compensation/benefits and risk/insurance costs); the fund’s liability for these costs of operations is included in Payables to Vanguard on the Statement of Net Assets.
Upon the request of Vanguard, the fund may invest up to 0.40% of its net assets as capital in Vanguard. At July 31, 2017, the fund had contributed to Vanguard capital in the amount of $1,977,000, representing 0.01% of the fund’s net assets and 0.79% of Vanguard’s capitalization. The fund’s trustees and officers are also directors and employees, respectively, of Vanguard.
C. Various inputs may be used to determine the value of the fund’s investments. These inputs are summarized in three broad levels for financial statement purposes. The inputs or methodologies used to value securities are not necessarily an indication of the risk associated with investing in those securities.
Level 1—Quoted prices in active markets for identical securities.
Level 2—Other significant observable inputs (including quoted prices for similar securities, interest rates, prepayment speeds, credit risk, etc.).
Level 3—Significant unobservable inputs (including the fund’s own assumptions used to determine the fair value of investments).
The following table summarizes the market value of the fund’s investments as of July 31, 2017, based on the inputs used to value them:
| | | |
| | Level 1 | Level 2 | Level 3 |
| Investments | ($000) | ($000) | ($000) |
| Common Stocks | 30,777,023 | — | — |
| Temporary Cash Investments | 71,015 | 1,997 | — |
| Futures Contracts—Liabilities1 | (36) | — | — |
| Total | 30,848,002 | 1,997 | — |
1 Represents variation margin on the last day of the reporting period.
21
Dividend Appreciation Index Fund
D. At July 31, 2017, the aggregate settlement value of open futures contracts and the related unrealized appreciation (depreciation) were:
| | | | |
| | | | | ($000) |
| | | | Aggregate | |
| | | Number of | Settlement | Unrealized |
| | | Long (Short) | Value | Appreciation |
| Futures Contracts | Expiration | Contracts | Long (Short) | (Depreciation) |
| E-mini S&P 500 Index | September 2017 | 309 | 38,131 | 493 |
Unrealized appreciation (depreciation) on open futures contracts is required to be treated as realized gain (loss) for tax purposes.
E. Distributions are determined on a tax basis and may differ from net investment income and realized capital gains for financial reporting purposes. Differences may be permanent or temporary. Permanent differences are reclassified among capital accounts in the financial statements to reflect their tax character. Temporary differences arise when certain items of income, expense, gain, or loss are recognized in different periods for financial statement and tax purposes. These differences will reverse at some time in the future. Differences in classification may also result from the treatment of short-term gains as ordinary income for tax purposes.
During the six months ended July 31, 2017, the fund realized $764,205,000 of net capital gains resulting from in-kind redemptions—in which shareholders exchanged fund shares for securities held by the fund rather than for cash. Because such gains are not taxable to the fund, and are not distributed to shareholders, they have been reclassified from accumulated net realized losses to paid-in capital.
The fund’s tax-basis capital gains and losses are determined only at the end of each fiscal year. For tax purposes, at January 31, 2017, the fund had available capital losses totaling $664,366,000 to offset future net capital gains. Of this amount, $11,128,000 is subject to expiration on January 31, 2019. Capital losses of $653,238,000 realized beginning in fiscal 2012 may be carried forward indefinitely under the Regulated Investment Company Modernization Act of 2010, but must be used before any expiring loss carryforwards. The fund will use these capital losses to offset net taxable capital gains, if any, realized during the year ending January 31, 2018; should the fund realize net capital losses for the year, the losses will be added to the loss carryforward balance above.
At July 31, 2017, the cost of investment securities for tax purposes was $24,496,003,000. Net unrealized appreciation of investment securities for tax purposes was $6,354,032,000, consisting of unrealized gains of $6,651,239,000 on securities that had risen in value since their purchase and $297,207,000 in unrealized losses on securities that had fallen in value since their purchase.
22
Dividend Appreciation Index Fund
F. During the six months ended July 31, 2017, the fund purchased $8,009,262,000 of investment securities and sold $7,343,081,000 of investment securities, other than temporary cash investments. Purchases and sales include $3,265,111,000 and $3,129,380,000 respectively, in connection with in-kind purchases and redemptions of the fund’s capital shares.
The fund purchased securities from and sold securities to other Vanguard funds or accounts managed by Vanguard or its affiliates, in accordance with procedures adopted by the board of trustees in compliance with Rule 17a-7 of the Investment Company Act of 1940. For the six months ended July 31, 2017, such purchases and sales were $969,125,000 and $210,290,000, respectively; these amounts are included in the purchases and sales of investment securities noted above.
| | | | |
| G. Capital share transactions for each class of shares were: | | |
| | Six Months Ended | | Year Ended |
| | | July 31, 2017 | January 31, 2017 |
| | Amount | Shares | Amount | Shares |
| | ($000) | (000) | ($000) | (000) |
| Investor Shares | | | | |
| Issued | 149,666 | 4,120 | 306,256 | 9,147 |
| Issued in Lieu of Cash Distributions | 9,477 | 258 | 17,178 | 515 |
| Redeemed | (154,135) | (4,247) | (321,317) | (9,762) |
| Net Increase (Decrease)—Investor Shares | 5,008 | 131 | 2,117 | (100) |
| ETF Shares | | | | |
| Issued | 3,499,748 | 38,385 | 3,087,183 | 37,802 |
| Issued in Lieu of Cash Distributions | — | — | — | — |
| Redeemed | (3,144,932) | (34,450) | (1,885,339) | (22,950) |
| Net Increase (Decrease)—ETF Shares | 354,816 | 3,935 | 1,201,844 | 14,852 |
| Admiral Shares | | | | |
| Issued | 743,258 | 30,006 | 1,490,587 | 65,899 |
| Issued in Lieu of Cash Distributions | 42,508 | 1,708 | 74,470 | 3,292 |
| Redeemed | (490,424) | (19,889) | (965,923) | (42,568) |
| Net Increase (Decrease)—Admiral Shares | 295,342 | 11,825 | 599,134 | 26,623 |
H. Management has determined that no material events or transactions occurred subsequent to July 31, 2017, that would require recognition or disclosure in these financial statements.
23
About Your Fund’s Expenses
As a shareholder of the fund, you incur ongoing costs, which include costs for portfolio management, administrative services, and shareholder reports (like this one), among others. Operating expenses, which are deducted from a fund’s gross income, directly reduce the investment return of the fund.
A fund’s expenses are expressed as a percentage of its average net assets. This figure is known as the expense ratio. The following examples are intended to help you understand the ongoing costs (in dollars) of investing in your fund and to compare these costs with those of other mutual funds. The examples are based on an investment of $1,000 made at the beginning of the period shown and held for the entire period.
The accompanying table illustrates your fund’s costs in two ways:
• Based on actual fund return. This section helps you to estimate the actual expenses that you paid over the period. The ”Ending Account Value“ shown is derived from the fund‘s actual return, and the third column shows the dollar amount that would have been paid by an investor who started with $1,000 in the fund. You may use the information here, together with the amount you invested, to estimate the expenses that you paid over the period.
To do so, simply divide your account value by $1,000 (for example, an $8,600 account value divided by $1,000 = 8.6), then multiply the result by the number given for your fund under the heading ”Expenses Paid During Period.“
• Based on hypothetical 5% yearly return. This section is intended to help you compare your fund‘s costs with those of other mutual funds. It assumes that the fund had a yearly return of 5% before expenses, but that the expense ratio is unchanged. In this case—because the return used is not the fund’s actual return—the results do not apply to your investment. The example is useful in making comparisons because the Securities and Exchange Commission requires all mutual funds to calculate expenses based on a 5% return. You can assess your fund’s costs by comparing this hypothetical example with the hypothetical examples that appear in shareholder reports of other funds.
Note that the expenses shown in the table are meant to highlight and help you compare ongoing costs only and do not reflect transaction costs incurred by the fund for buying and selling securities. Further, the expenses do not include any purchase, redemption, or account service fees described in the fund prospectus. If such fees were applied to your account, your costs would be higher. Your fund does not carry a “sales load.”
The calculations assume no shares were bought or sold during the period. Your actual costs may have been higher or lower, depending on the amount of your investment and the timing of any purchases or redemptions.
You can find more information about the fund’s expenses, including annual expense ratios, in the Financial Statements section of this report. For additional information on operating expenses and other shareholder costs, please refer to your fund’s current prospectus.
24
| | | |
| Six Months Ended July 31, 2017 | | | |
| | Beginning | Ending | Expenses |
| | Account Value | Account Value | Paid During |
| Dividend Appreciation Index Fund | 1/31/2017 | 7/31/2017 | Period |
| Based on Actual Fund Return | | | |
| Investor Shares | $1,000.00 | $1,087.96 | $0.83 |
| ETF Shares | 1,000.00 | 1,088.45 | 0.41 |
| Admiral Shares | 1,000.00 | 1,088.44 | 0.41 |
| Based on Hypothetical 5% Yearly Return | | | |
| Investor Shares | $1,000.00 | $1,024.00 | $0.80 |
| ETF Shares | 1,000.00 | 1,024.40 | 0.40 |
| Admiral Shares | 1,000.00 | 1,024.40 | 0.40 |
The calculations are based on expenses incurred in the most recent six-month period. The fund’s annualized six-month expense ratios for
that period are 0.16% for Investor Shares, 0.08% for ETF Shares, and 0.08% for Admiral Shares. The dollar amounts shown as “Expenses
Paid” are equal to the annualized expense ratio multiplied by the average account value over the period, multiplied by the number of days
in the most recent six-month period, then divided by the number of days in the most recent 12-month period (181/365).
25
Trustees Approve Advisory Arrangement
The board of trustees of Vanguard Dividend Appreciation Index Fund has renewed the fund’s investment advisory arrangement with The Vanguard Group, Inc. (Vanguard), through its Equity Index Group. The board determined that continuing the fund’s internalized management structure was in the best interests of the fund and its shareholders.
The board based its decision upon an evaluation of the advisor’s investment staff, portfolio management process, and performance. This evaluation included information provided to the board by Vanguard’s Portfolio Review Department, which is responsible for fund and advisor oversight and product management. The Portfolio Review Department met regularly with the advisor and made monthly presentations to the board during the fiscal year that directed the board’s focus to relevant information and topics.
The board, or an investment committee made up of board members, also received information throughout the year during advisor presentations. For each advisor presentation, the board was provided with letters and reports that included information about, among other things, the advisory firm and the advisor’s assessment of the investment environment, portfolio performance, and portfolio characteristics.
In addition, the board received monthly reports, which included a Market and Economic Report, a Fund Dashboard Monthly Summary, and a Fund Performance Report.
Prior to their meeting, the trustees were provided with a memo and materials that summarized the information they received over the course of the year. They also considered the factors discussed below, among others. However, no single factor determined whether the board approved the arrangement. Rather, it was the totality of the circumstances that drove the board’s decision.
Nature, extent, and quality of services
The board reviewed the quality of the fund’s investment management services over both the short and long term and took into account the organizational depth and stability of the advisor. The board considered that Vanguard has been managing investments for more than three decades. The Equity Index Group adheres to a sound, disciplined investment management process; the team has considerable experience, stability, and depth.
The board concluded that Vanguard’s experience, stability, depth, and performance, among other factors, warranted continuation of the advisory arrangement.
Investment performance
The board considered the short- and long-term performance of the fund, including any periods of outperformance or underperformance compared with its target index and peer group. The board concluded that the performance was such that the advisory arrangement should continue. Information about the fund’s most recent performance can be found in the Performance Summary section of this report.
26
Cost
The board concluded that the fund’s expense ratio was well below the average expense ratio charged by funds in its peer group and that the fund’s advisory expenses were also well below its peer-group average. Information about the fund’s expenses appears in the About Your Fund’s Expenses section of this report as well as in the Financial Statements section.
The board does not conduct a profitability analysis of Vanguard because of Vanguard’s unique “at-cost” structure. Unlike most other mutual fund management companies, Vanguard is owned by the funds it oversees and produces “profits” only in the form of reduced expenses for fund shareholders.
The benefit of economies of scale
The board concluded that the fund’s at-cost arrangement with Vanguard ensures that the fund will realize economies of scale as it grows, with the cost to shareholders declining as the fund’s assets increase.
The board will consider whether to renew the advisory arrangement again after a one-year period.
27
Glossary
30-Day SEC Yield. A fund’s 30-day SEC yield is derived using a formula specified by the U.S. Securities and Exchange Commission. Under the formula, data related to the fund’s security holdings in the previous 30 days are used to calculate the fund’s hypothetical net income for that period, which is then annualized and divided by the fund’s estimated average net assets over the calculation period. For the purposes of this calculation, a security’s income is based on its current market yield to maturity (for bonds), its actual income (for asset-backed securities), or its projected dividend yield (for stocks). Because the SEC yield represents hypothetical annualized income, it will differ—at times significantly—from the fund’s actual experience. As a result, the fund’s income distributions may be higher or lower than implied by the SEC yield.
Beta. A measure of the magnitude of a fund’s past share-price fluctuations in relation to the ups and downs of a given market index. The index is assigned a beta of 1.00. Compared with a given index, a fund with a beta of 1.20 typically would have seen its share price rise or fall by 12% when the index rose or fell by 10%. For this report, beta is based on returns over the past 36 months for both the fund and the index. Note that a fund’s beta should be reviewed in conjunction with its R-squared (see definition). The lower the R-squared, the less correlation there is between the fund and the index, and the less reliable beta is as an indicator of volatility.
Dividend Yield. Dividend income earned by stocks, expressed as a percentage of the aggregate market value (or of net asset value, for a fund). The yield is determined by dividing the amount of the annual dividends by the aggregate value (or net asset value) at the end of the period. For a fund, the dividend yield is based solely on stock holdings and does not include any income produced by other investments.
Earnings Growth Rate. The average annual rate of growth in earnings over the past five years for the stocks now in a fund.
Equity Exposure. A measure that reflects a fund’s investments in stocks and stock futures. Any holdings in short-term reserves are excluded.
Expense Ratio. A fund’s total annual operating expenses expressed as a percentage of the fund’s average net assets. The expense ratio includes management and administrative expenses, but does not include the transaction costs of buying and selling portfolio securities.
Foreign Holdings. The percentage of a fund represented by securities or depositary receipts of companies based outside the United States.
Inception Date. The date on which the assets of a fund (or one of its share classes) are first invested in accordance with the fund’s investment objective. For funds with a subscription period, the inception date is the day after that period ends. Investment performance is measured from the inception date.
Median Market Cap. An indicator of the size of companies in which a fund invests; the midpoint of market capitalization (market price x shares outstanding) of a fund’s stocks, weighted by the proportion of the fund’s assets invested in each stock. Stocks representing half of the fund’s assets have market capitalizations above the median, and the rest are below it.
Price/Book Ratio. The share price of a stock divided by its net worth, or book value, per share.
For a fund, the weighted average price/book ratio of the stocks it holds.
28
Price/Earnings Ratio. The ratio of a stock’s current price to its per-share earnings over the past year. For a fund, the weighted average P/E of the stocks it holds. P/E is an indicator of market expectations about corporate prospects; the higher the P/E, the greater the expectations for a company’s future growth.
R-Squared. A measure of how much of a fund’s past returns can be explained by the returns from the market in general, as measured by a given index. If a fund’s total returns were precisely synchronized with an index’s returns, its R-squared would be 1.00. If the fund’s returns bore no relationship to the index’s returns, its R-squared would be 0. For this report, R-squared is based on returns over the past 36 months for both the fund and the index.
Return on Equity. The annual average rate of return generated by a company during the past five years for each dollar of shareholder’s equity (net income divided by shareholder’s equity). For a fund, the weighted average return on equity for the companies whose stocks it holds.
Short-Term Reserves. The percentage of a fund invested in highly liquid, short-term securities that can be readily converted to cash.
Turnover Rate. An indication of the fund’s trading activity. Funds with high turnover rates incur higher transaction costs and may be more likely to distribute capital gains (which may be taxable to investors). The turnover rate excludes in-kind transactions, which have minimal impact on costs.
29
This page intentionally left blank.
The People Who Govern Your Fund
The trustees of your mutual fund are there to see that the fund is operated and managed in your best interests since, as a shareholder, you are a part owner of the fund. Your fund’s trustees also serve on the board of directors of The Vanguard Group, Inc., which is owned by the Vanguard funds and provides services to them on an at-cost basis.
A majority of Vanguard’s board members are independent, meaning that they have no affiliation with Vanguard or the funds they oversee, apart from the sizable personal investments they have made as private individuals. The independent board members have distinguished backgrounds in business, academia, and public service. Each of the trustees and executive officers oversees 195 Vanguard funds.
Information for each trustee and executive officer of the fund appears below. The mailing address of the trustees and officers is P.O. Box 876, Valley Forge, PA 19482. More information about the trustees is in the Statement of Additional Information, which can be obtained, without charge, by contacting Vanguard at 800-662-7447, or online at vanguard.com.
Interested Trustee1
F. William McNabb III
Born 1957. Trustee Since July 2009. Chairman of the Board. Principal Occupation(s) During the Past Five Years and Other Experience: Chairman of the Board of The Vanguard Group, Inc., and of each of the investment companies served by The Vanguard Group, since January 2010; Chief Executive Officer and Director of The Vanguard Group and President and Chief Executive Officer of each of the investment companies served by The Vanguard Group, since 2008; Director of Vanguard Marketing Corporation; President of The Vanguard Group (2008–2017); Managing Director of The Vanguard Group (1995–2008).
Independent Trustees
Emerson U. Fullwood
Born 1948. Trustee Since January 2008. Principal Occupation(s) During the Past Five Years and Other Experience: Executive Chief Staff and Marketing Officer for North America and Corporate Vice President (retired 2008) of Xerox Corporation (document management products and services); Executive in Residence and 2009–2010 Distinguished Minett Professor at the Rochester Institute of Technology; Lead Director of SPX FLOW, Inc. (multi-industry manufacturing); Director of the United Way of Rochester, the University of Rochester Medical Center, Monroe Community College Foundation, North Carolina A&T University, and Roberts Wesleyan College; Trustee of the University of Rochester.
Rajiv L. Gupta
Born 1945. Trustee Since December 2001.2 Principal Occupation(s) During the Past Five Years and Other Experience: Chairman and Chief Executive Officer (retired 2009) and President (2006–2008) of Rohm and Haas Co. (chemicals); Director of Arconic Inc. (diversified manufacturer), HP Inc. (printer and personal computer manufacturing), and Delphi Automotive plc (automotive components); Senior Advisor at New Mountain Capital.
Amy Gutmann
Born 1949. Trustee Since June 2006. Principal Occupation(s) During the Past Five Years and Other Experience: President of the University of Pennsylvania; Christopher H. Browne
1 Mr. McNabb is considered an “interested person,” as defined in the Investment Company Act of 1940, because he is an officer of the Vanguard funds.
2 December 2002 for Vanguard Equity Income Fund, the Vanguard Municipal Bond Funds, and the Vanguard State Tax-Exempt Funds.
Distinguished Professor of Political Science, School of Arts and Sciences, and Professor of Communication, Annenberg School for Communication, with secondary faculty appointments in the Department of Philosophy, School of Arts and Sciences, and at the Graduate School of Education, University of Pennsylvania; Trustee of the National Constitution Center.
JoAnn Heffernan Heisen
Born 1950. Trustee Since July 1998. Principal Occupation(s) During the Past Five Years and Other Experience: Corporate Vice President and Member of the Executive Committee (1997–2008), Chief Global Diversity Officer (retired 2008), Vice President and Chief Information Officer (1997–2006), Controller (1995–1997), Treasurer (1991–1995), and Assistant Treasurer (1989–1991) of Johnson & Johnson (pharmaceuticals/medical devices/ consumer products); Director of Skytop Lodge Corporation (hotels) and the Robert Wood Johnson Foundation; Member of the Advisory Board of the Institute for Women’s Leadership at Rutgers University.
F. Joseph Loughrey
Born 1949. Trustee Since October 2009. Principal Occupation(s) During the Past Five Years and Other Experience: President and Chief Operating Officer (retired 2009) of Cummins Inc. (industrial machinery); Chairman of the Board of Hillenbrand, Inc. (specialized consumer services), Oxfam America, and the Lumina Foundation for Education; Director of the V Foundation for Cancer Research; Member of the Advisory Council for the College of Arts and Letters and Chair of the Advisory Board to the Kellogg Institute for International Studies, both at the University of Notre Dame.
Mark Loughridge
Born 1953. Trustee Since March 2012. Principal Occupation(s) During the Past Five Years and Other Experience: Senior Vice President and Chief Financial Officer (retired 2013) at IBM (information technology services); Fiduciary Member of IBM’s Retirement Plan Committee (2004–2013); Director of the Dow Chemical Company; Member of the Council on Chicago Booth.
Scott C. Malpass
Born 1962. Trustee Since March 2012. Principal Occupation(s) During the Past Five Years and Other Experience: Chief Investment Officer and Vice President at the University of Notre Dame; Assistant Professor of Finance at the Mendoza College of Business at Notre Dame; Member of the Notre Dame 403(b) Investment Committee, the Board of Advisors for Spruceview Capital Partners, the Board of Catholic Investment Services, Inc. (investment advisor), and the Board of Superintendence of the Institute for the Works of Religion; Chairman of the Board of TIFF Advisory Services, Inc. (investment advisor).
André F. Perold
Born 1952. Trustee Since December 2004. Principal Occupation(s) During the Past Five Years and Other Experience: George Gund Professor of Finance and Banking, Emeritus at the Harvard Business School (retired 2011); Chief Investment Officer and Co-Managing Partner of HighVista Strategies LLC (private investment firm); Overseer of the Museum of Fine Arts Boston.
Peter F. Volanakis
Born 1955. Trustee Since July 2009. Principal Occupation(s) During the Past Five Years and Other Experience: President and Chief Operating Officer (retired 2010) of Corning Incorporated (communications equipment); Chairman of the Board of Trustees of Colby-Sawyer College; Member of the Board of Hypertherm, Inc. (industrial cutting systems, software, and consumables).
Executive Officers
Glenn Booraem
Born 1967. Investment Stewardship Officer Since February 2017. Principal Occupation(s) During the Past Five Years and Other Experience: Principal of The Vanguard Group, Inc.; Treasurer (2015–2017), Controller (2010–2015), and Assistant Controller (2001–2010) of each of the investment companies served by The Vanguard Group.
Thomas J. Higgins
Born 1957. Chief Financial Officer Since September 2008. Principal Occupation(s) During the Past Five Years and Other Experience: Principal of The Vanguard Group, Inc.; Chief Financial Officer of each of the investment companies served by The Vanguard Group; Treasurer of each of the investment companies served by The Vanguard Group (1998–2008).
Peter Mahoney
Born 1974. Controller Since May 2015. Principal Occupation(s) During the Past Five Years and Other Experience: Principal of The Vanguard Group, Inc.; Controller of each of the investment companies served by The Vanguard Group; Head of International Fund Services at The Vanguard Group (2008–2014).
Anne E. Robinson
Born 1970. Secretary Since September 2016. Principal Occupation(s) During the Past Five Years and Other Experience: Managing Director of The Vanguard Group, Inc.; General Counsel of The Vanguard Group; Secretary of The Vanguard Group and of each of the investment companies served by The Vanguard Group; Director and Senior Vice President of Vanguard Marketing Corporation; Managing Director and General Counsel of Global Cards and Consumer Services at Citigroup (2014–2016); Counsel at American Express (2003–2014).
Michael Rollings
Born 1963. Treasurer Since February 2017. Principal Occupation(s) During the Past Five Years and Other Experience: Managing Director of The Vanguard Group, Inc.; Treasurer of each of the investment companies served by The Vanguard Group; Director of Vanguard Marketing Corporation; Executive Vice President and Chief Financial Officer of MassMutual Financial Group (2006–2016).
| |
| Vanguard Senior Management Team |
| |
| Mortimer J. Buckley | James M. Norris |
| John James | Thomas M. Rampulla |
| Martha G. King | Glenn W. Reed |
| John T. Marcante | Karin A. Risi |
| Chris D. McIsaac | Gregory Davis |
| |
| |
| Chairman Emeritus and Senior Advisor |
| |
| John J. Brennan | |
| Chairman, 1996–2009 | |
| Chief Executive Officer and President, 1996–2008 |
| |
| |
| Founder | |
| |
| John C. Bogle | |
| Chairman and Chief Executive Officer, 1974–1996 |
|  |
| | P.O. Box 2600 |
| | Valley Forge, PA 19482-2600 |
| |
| |
| |
| Connect with Vanguard® > vanguard.com |
| |
| |
| |
| Fund Information > 800-662-7447 | “Dividend Achievers” is a trademark of The NASDAQ |
| Direct Investor Account Services > 800-662-2739 | OMX Group, Inc. (collectively, with its affiliates |
| | “NASDAQ OMX”), and has been licensed for use by |
| Institutional Investor Services > 800-523-1036 | The Vanguard Group, Inc. Vanguard mutual funds are |
| Text Telephone for People | not sponsored, endorsed, sold, or promoted by |
| Who Are Deaf or Hard of Hearing> 800-749-7273 | NASDAQ OMX and NASDAQ OMX makes no |
| | representation regarding the advisability of investing |
| This material may be used in conjunction | in the funds. NASDAQ OMX makes no warranties and |
| with the offering of shares of any Vanguard | bears no liability with respect to the Vanguard mutual |
| fund only if preceded or accompanied by | funds. |
| the fund’s current prospectus. | |
| |
| All comparative mutual fund data are from Lipper, a | |
| Thomson Reuters Company, or Morningstar, Inc., unless | |
| otherwise noted. | |
| |
| You can obtain a free copy of Vanguard’s proxy voting | |
| guidelines by visiting vanguard.com/proxyreporting or by | |
| calling Vanguard at 800-662-2739. The guidelines are | |
| also available from the SEC’s website, sec.gov. In | |
| addition, you may obtain a free report on how your fund | |
| voted the proxies for securities it owned during the 12 | |
| months ended June 30. To get the report, visit either | |
| vanguard.com/proxyreporting or sec.gov. | |
| |
| You can review and copy information about your fund at | |
| the SEC’s Public Reference Room in Washington, D.C. To | |
| find out more about this public service, call the SEC at | |
| 202-551-8090. Information about your fund is also | |
| available on the SEC’s website, and you can receive | |
| copies of this information, for a fee, by sending a | |
| request in either of two ways: via email addressed to | |
| publicinfo@sec.gov or via regular mail addressed to the | |
| Public Reference Section, Securities and Exchange | |
| Commission, Washington, DC 20549-1520. | |
| | © 2017 The Vanguard Group, Inc. |
| | All rights reserved. |
| | Vanguard Marketing Corporation, Distributor. |
| |
| | Q6022 092017 |
Item 2: Code of Ethics. The Registrant has adopted a code of ethics that applies to the Registrant’s principal executive officer, principal financial officer, principal accounting officer or controller or persons performing similar functions. The Code of Ethics was amended during the reporting period covered by this report to make certain technical, non-material changes.
Item 3: Audit Committee Financial Expert.
Not Applicable.
Item 4: Principal Accountant Fees and Services.
(a) Audit Fees.
Not Applicable.
Item 5: Audit Committee of Listed Registrants.
Not Applicable.
Item 6: Investments.
Not Applicable.
Item 7: Disclosure of Proxy Voting Policies and Procedures for Closed-End Management Investment Companies.
Not Applicable.
Item 8: Portfolio Managers of Closed-End Management Investment Companies.
Not Applicable.
Item 9: Purchase of Equity Securities by Closed-End Management Investment Company and Affiliated Purchasers.
Not Applicable.
Item 10: Submission of Matters to a Vote of Security Holders.
Not Applicable.
Item 11: Controls and Procedures.
(a) Disclosure Controls and Procedures. The Principal Executive and Financial Officers concluded that the Registrant’s Disclosure Controls and Procedures are effective
based on their evaluation of the Disclosure Controls and Procedures as of a date within 90 days of the filing date of this report.
(b) Internal Control Over Financial Reporting. There were no significant changes in Registrant’s Internal Control Over Financial Reporting or in other factors that could significantly affect this control subsequent to the date of the evaluation, including any corrective actions with regard to significant deficiencies and material weaknesses.
Item 12: Exhibits. (a) Certifications.
Pursuant to the requirements of the Securities Exchange Act of 1934 and the Investment Company Act of 1940, the registrant has duly caused this report to be signed on its behalf by the undersigned, thereunto duly authorized.
| |
| | VANGUARD SPECIALIZED FUNDS |
| |
| |
| BY: | /s/ F. WILLIAM MCNABB III* |
| | F. WILLIAM MCNABB III |
| | CHIEF EXECUTIVE OFFICER |
|
| Date: September 18, 2017 |
Pursuant to the requirements of the Securities Exchange Act of 1934 and the Investment Company Act of 1940, this report has been signed below by the following persons on behalf of the registrant and in the capacities and on the dates indicated.
| |
| | VANGUARD SPECIALIZED FUNDS |
| |
| |
| BY: | /s/ F. WILLIAM MCNABB III* |
| | F. WILLIAM MCNABB III |
| | CHIEF EXECUTIVE OFFICER |
|
| Date: September 18, 2017 |
| |
| | VANGUARD SPECIALIZED FUNDS |
| |
| |
| BY: | /s/ THOMAS J. HIGGINS* |
| THOMAS J. HIGGINS |
| | CHIEF FINANCIAL OFFICER |
Date: September 18, 2017
* By: /s/ Anne E. Robinson
Anne E. Robinson, pursuant to a Power of Attorney filed on October 4, 2016 see file Number
33-32548, Incorporated by Reference.