UNITED STATES
SECURITIES AND EXCHANGE COMMISSION
Washington, D.C. 20549
FORM N-CSR
CERTIFIED SHAREHOLDER REPORT
OF
REGISTERED MANAGEMENT INVESTMENT COMPANIES
| | |
| Investment Company Act file number: | 811-03916 |
Name of Registrant: | Vanguard Specialized Funds |
Address of Registrant: | P.O. Box 2600 |
| | Valley Forge, PA 19482 |
Name and address of agent for service: | Anne E. Robinson, Esquire |
| | P.O. Box 876 |
| | Valley Forge, PA 19482 |
Registrant’s telephone number, including area code: (610) 669-1000 |
Date of fiscal year end: January 31 |
Date of reporting period: February 1, 2018—July 31, 2018 |
Item 1: Reports to Shareholders |

Semiannual Report | July 31, 2018
Vanguard Energy Fund
Vanguard’s Principles for Investing Success
We want to give you the best chance of investment success. These principles, grounded in Vanguard’s research and experience, can put you on the right path.
Goals. Create clear, appropriate investment goals.
Balance. Develop a suitable asset allocation using broadly diversified funds. Cost. Minimize cost.
Discipline. Maintain perspective and long-term discipline.
A single theme unites these principles: Focus on the things you can control.
We believe there is no wiser course for any investor.
| |
| Contents | |
| Your Fund’s Performance at a Glance. | 1 |
| CEO’s Perspective. | 2 |
| Advisors’ Report. | 4 |
| Fund Profile. | 8 |
| Performance Summary. | 10 |
| Financial Statements. | 11 |
| About Your Fund’s Expenses. | 26 |
| Trustees Approve Advisory Arrangements. | 28 |
| Glossary. | 30 |
Please note: The opinions expressed in this report are just that—informed opinions. They should not be considered promises
or advice. Also, please keep in mind that the information and opinions cover the period through the date on the front of this
report. Of course, the risks of investing in your fund are spelled out in the prospectus.
See the Glossary for definitions of investment terms used in this report.
About the cover: Nautical images have been part of Vanguard’s rich heritage since its start in 1975. For an
incoming ship, a lighthouse offers a beacon and safe path to shore. You can similarly depend on Vanguard to put
you first––and light the way––as you strive to meet your financial goals. Our client focus and low costs,
stemming from our unique ownership structure, assure that your interests are paramount.
Your Fund’s Performance at a Glance
• For the six months ended July 31, 2018, Vanguard Energy Fund returned nearly 5%. It outpaced its benchmark, the MSCI ACWI Energy Index, and the average return of its global natural resources peer funds.
• The fund, managed by two advisors, seeks long-term capital appreciation through its multicapitalization exposure to global energy stocks.
• Energy stocks generally posted strong results for the period; oil futures gained more than 20% in the first half of 2018. Natural gas prices continued to be restrained. However, they rallied during the last three months as demand for power generation increased and many coal-fired power plants switched to natural gas.
• Oil and gas exploration and production, oil and gas refining and marketing, and integrated oil and gas were among the best-performing sectors on a relative basis. Results were held back by oil and gas equipment and services and oil and gas drilling.
| |
| Total Returns: Six Months Ended July 31, 2018 | |
| | Total |
| | Returns |
| Vanguard Energy Fund | |
| Investor Shares | 4.83% |
| Admiral™ Shares | 4.87 |
| MSCI ACWI Energy Index | 4.07 |
| Global Natural Resources Funds Average | -0.04 |
| Global Natural Resources Funds Average: Derived from data provided by Lipper, a Thomson Reuters Company. | |
| Admiral Shares carry lower expenses and are available to investors who meet certain account-balance requirements. | |
| | | |
| Expense Ratios | | | |
| Your Fund Compared With Its Peer Group | | | |
| | Investor | Admiral | Peer Group |
| | Shares | Shares | Average |
| Energy Fund | 0.38% | 0.30% | 1.36% |
The fund expense ratios shown are from the prospectus dated May 25, 2018, and represent estimated costs for the current fiscal year. For
the six months ended July 31, 2018, the fund’s annualized expense ratios were 0.39% for Investor Shares and 0.31% for Admiral Shares.
The peer-group expense ratio is derived from data provided by Lipper, a Thomson Reuters Company, and captures information through
year-end 2017.
Peer group: Global Natural Resources Funds.
1
CEO’s Perspective

Tim Buckley
President and Chief Executive Officer
Dear Shareholder,
I feel extremely fortunate to have the chance to lead a company filled with people who come to work every day passionate about Vanguard’s core purpose: to take a stand for all investors, to treat them fairly, and to give them the best chance for investment success.
When I joined Vanguard in 1991, I found a mission-driven team focused on improving lives—helping people retire more comfortably, put their children through college, and achieve financial security. I also found a company with purpose in an industry ripe for improvement.
It was clear, even early in my career, that the cards were stacked against most investors. Hidden fees, performance-chasing, and poor advice were relentlessly eroding investors’ dreams.
We knew Vanguard could be different and, as a result, could make a real difference. We have lowered the costs of investing for our shareholders significantly. And we’re proud of the performance of our funds.
Vanguard is built for Vanguard investors—we focus solely on you, our fund shareholders. Everything we do is designed to give our clients the best chance for investment success. In my role as CEO, I’ll keep this priority
2
front and center. We’re proud of what we’ve achieved, but we’re even more excited about what’s to come.
Steady, time-tested guidance
Our guidance for investors, as always, is to stay the course, tune out the hyperbolic headlines, and focus on your goals and what you can control, such as costs and how much you save. This time-tested advice has served our clients well over the decades.
Regardless of how the markets perform in the short term, I’m incredibly optimistic about the future for our investors. We have a dedicated team serving you, and we will never stop striving to make
Vanguard the best place for you to invest through our high-quality funds and services, advice and guidance to help you meet your financial goals, and an experience that makes you feel good about entrusting us with your hard-earned savings.
Thank you for your continued loyalty.
Sincerely,

Mortimer J. Buckley
President and Chief Executive Officer
August 16, 2018
| | | |
| Market Barometer | | | |
| | | | Total Returns |
| | | Periods Ended July 31, 2018 |
| | Six | One | Five Years |
| | Months | Year | (Annualized) |
| Stocks | | | |
| Russell 1000 Index (Large-caps) | 0.86% | 16.19% | 12.96% |
| Russell 2000 Index (Small-caps) | 6.75 | 18.73 | 11.33 |
| Russell 3000 Index (Broad U. S. market) | 1.30 | 16.39 | 12.83 |
| FTSE All-World ex US Index (International) | -6.57 | 6.19 | 5.97 |
| |
| Bonds | | | |
| Bloomberg Barclays U. S. Aggregate Bond Index | | | |
| (Broad taxable market) | -0.45% | -0.80% | 2.25% |
| Bloomberg Barclays Municipal Bond Index | | | |
| (Broad tax-exempt market) | 1.18 | 0.99 | 3.76 |
| FTSE Three-Month U. S. Treasury Bill Index | 0.83 | 1.41 | 0.41 |
| |
| CPI | | | |
| Consumer Price Index | 1.67% | 2.95% | 1.53% |
3
Advisors’ Report
For the six months ended July 31, 2018, Vanguard Energy Fund returned nearly 5%. It outpaced its benchmark, the MSCI ACWI Energy Index, and the average return of its global natural resources peer funds. Your fund is managed by two advisors, a strategy that enhances fund diversification by providing exposure to distinct yet complementary investment approaches. It’s not uncommon for different advisors to have different views about individual securities or the broader investment environment.
The advisors, the amount and percentage of fund assets each manages, and brief descriptions of their investment strategies are presented in the table below. The advisors also have provided a discussion
of the investment environment that existed during the period and of how their portfolio positioning reflects this assessment. These reports were prepared on August 9, 2018.
Wellington Management Company llp
Portfolio Manager:
Gregory LeBlanc, CFA,
Senior Managing Director,
Global Industry Analyst
The investment environment
Global energy stocks, as measured by the fund’s benchmark, returned 4.07% for the six months. The broader market, as measured by the MSCI All Country World Index, returned –2.60%.
| | | |
| Vanguard Energy Fund Investment Advisors | |
| |
| | Fund Assets Managed | |
| Investment Advisor | % | $ Million | Investment Strategy |
| Wellington Management | 93 | 9,098 | Emphasizes long-term total-return opportunities |
| Company LLP | | | from the various energy subsectors: international |
| | | | oils, foreign integrated oils and foreign producers, |
| | | | North American producers, oil services and |
| | | | equipment, transportation and distribution, and |
| | | | refining and marketing. |
| Vanguard Quantitative Equity | 5 | 485 | Employs a quantitative fundamental management |
| Group | | | approach using models that assess valuation, |
| | | | management decisions, market sentiment, and |
| | | | earnings and balance-sheet quality of companies |
| | | | as compared with their peers. |
| Cash Investments | 2 | 163 | These short-term reserves are invested by |
| | | | Vanguard in equity index products to simulate |
| | | | investments in stock. Each advisor may also |
| | | | maintain a modest cash position. |
4
Early in the period, the energy sector was not immune to market volatility. This continued through the end of June in anticipation of an OPEC meeting, as investors grew increasingly nervous about the impact of a potential production increase. But oil prices subsequently hit highs for the year as the focus shifted to shrinking OPEC spare capacity due to emerging supply disruptions from Libya, Venezuela, and Iran.
OECD oil inventories are below their five-year average, and any increase in OPEC production may prevent further tightening of supply/demand balances in the second half of the year. If OPEC and Russia were to raise production by 1 million barrels per day, as discussed at the meeting, spare capacity could fall close to 1% of demand. This would be the lowest level observed since 2008.
Reducing spare capacity to a historically low level could dramatically increase the risk of an unexpected spike in prices from any further supply disruptions. Lower inventories and lower spare capacity forecasts have helped to raise the back end of the oil futures curve, which has been positive for energy equities.
Our investment objective and strategy
Wellington Management’s portion of the fund emphasizes long-term, total-return opportunities from the energy subsectors. These include global integrated oil companies, North American producers, non-North American producers, oil services and equipment, transportation and distribution, and refining and marketing.
Our successes and shortfalls
Security selection drove the portfolio’s outperformance for the period, most notably among refining and marketing and transportation-related companies. Valero Energy, a geographically diversified pure merchant refiner, was a top relative contributor. Strong demand for petroleum products as well as discounted feedstock prices helped maintain healthy refining margins.
Exposure to two German utility and natural gas transport companies, E.ON and Innogy, was also beneficial. We eliminated our position in Innogy after E.ON announced a takeover offer for the company. However, we believe the synergies could be meaningful and have maintained a position in E.ON. An underweight to ExxonMobil also aided relative results.
Security selection in equipment and services was the top relative detractor. Patterson-UTI lagged most because of a slowdown in pressure-pumping demand, particularly in the Permian Basin. Halliburton, one of the world’s largest oil-field service companies, provided a disappointing second-quarter update with reduced guidance after a slowdown in Permian well-completion activity. A lack of oil
5
takeaway capacity has hurt the region over the six months, but we are confident that this will be temporary and have maintained our position.
Heading into the latter half of 2018, we remain encouraged by the positive macro backdrop for oil; inventories are coming down and spare capacity is at a low level. We also see room for improved sentiment as stocks discount prices below the current oil price. Recent company updates suggest that capital discipline continues for U.S. production. Despite pipeline bottlenecks in the near term, we are encouraged that many companies are evolving their business models to include capital return in addition to volume growth.
Vanguard Quantitative Equity Group
Portfolio Managers:
James P. Stetler
Binbin Guo, Principal, Head of
Alpha Equity Investments
The investment environment
Energy stocks rallied as West Texas International (WTI) oil futures rose more than 20% in the first half of 2018. The gain can be attributed to the dispute over oil-marketing rights that is affecting Libya’s export capacity. The White House has also indicated possible sanctions for countries that don’t reduce their imports of Iranian crude to zero by November 4. Iran currently exports around 2.4 million barrels a day.
During the first quarter of 2018, natural gas futures continued their slide, falling more than 7%. However, during the second quarter, they rebounded by nearly 7%. The cold weather at the end of January took the price to $3.661, but it quickly fell back to the $3 level. The higher price was due to increased demand for power generation, partially because many coal-fired plants have switched to natural gas.
Investment objective and strategy
It’s important to understand how our overall performance is affected by the macroeconomic factors we’ve described. However, our approach to investing focuses on specific fundamentals rather than on technical analysis of stock price movements. We compare all stocks in an industry group in order to identify those with characteristics that we believe will outperform over the long run.
To do this, we use a strict quantitative process that systematically focuses on several fundamental factors. We believe that attractive stocks exhibit four key themes: high quality—healthy balance sheets and consistent cash-flow generation; sound management decisions—investment policies that favor internal over external funding; strong market sentiment—market confirmation of our view; and reasonable valuation—avoidance of overpriced stocks. Using these results, we construct our portfolio with the goal of maximizing expected return and minimizing exposure to risks that our research indicates do not improve returns.
6
Our successes and shortfalls
For the six months, our quality, sentiment, and management decisions models boosted performance, but our valuation model detracted.
Our positions in oil and gas exploration, integrated oil and gas, and oil and gas equipment services posted the strongest returns. Results were not as strong for oil and gas refining and marketing, oil and gas storage and transportation, and gas utilities.
Our most successful overweighted holdings were HollyFrontier and Marathon Oil. Our portfolio also benefited from underweights to SK Innovation, Halliburton, and Vestas Wind Systems. Results were dragged down by underweighted allocations to Hess and Andeavor as well as overweights to GS Holdings, Hindustan Petroleum, and GCL-Poly Energy Holdings.
7
Energy Fund
Fund Profile
As of July 31, 2018
| | |
| Share-Class Characteristics | |
| | Investor | Admiral |
| | Shares | Shares |
| Ticker Symbol | VGENX | VGELX |
| Expense Ratio1 | 0.38% | 0.30% |
| 30-Day SEC Yield | 1.80% | 1.88% |
| | | |
| Portfolio Characteristics | | |
| | | | DJ |
| | | | U.S. |
| | | MSCI | Total |
| | | ACWI | Market |
| | Fund | Energy | FA Index |
| Number of Stocks | 133 | 140 | 3,766 |
| Median Market Cap | $51.0B | $74.6B | $67.4B |
| Price/Earnings Ratio | 18.2x | 17.0x | 20.5x |
| Price/Book Ratio | 1.8x | 1.7x | 3.1x |
| Return on Equity | 5.7% | 6.1% | 15.0% |
| Earnings Growth Rate | -15.5% | -13.1% | 8.5% |
| Dividend Yield | 2.5% | 3.3% | 1.7% |
| Foreign Holdings | 33.7% | 50.7% | 0.0% |
| Turnover Rate | | | |
| (Annualized) | 24% | — | — |
| Short-Term Reserves | 2.5% | — | — |
| | |
| Volatility Measures | | |
| | | DJ |
| | MSCI | U.S. Total |
| | ACWI | Market |
| | Energy | FA Index |
| R-Squared | 0.95 | 0.39 |
| Beta | 1.03 | 1.06 |
| These measures show the degree and timing of the fund’s |
| fluctuations compared with the indexes over 36 months. |
| | |
| Ten Largest Holdings (% of total net assets) |
| Exxon Mobil Corp. | Integrated Oil & Gas | 7.8% |
| Chevron Corp. | Integrated Oil & Gas | 6.5 |
| Royal Dutch Shell plc | Integrated Oil & Gas | 5.1 |
| Pioneer Natural | Oil & Gas Exploration | |
| Resources Co. | & Production | 4.4 |
| TOTAL SA | Integrated Oil & Gas | 4.3 |
| EOG Resources Inc. | Oil & Gas Exploration | |
| | & Production | 3.6 |
| BP plc | Integrated Oil & Gas | 3.4 |
| Valero Energy Corp. | Oil & Gas Refining & | |
| | Marketing | 3.2 |
| Diamondback Energy | Oil & Gas Exploration | |
| Inc. | & Production | 2.7 |
| Marathon Petroleum | Oil & Gas Exploration | |
| Corp. | & Production | 2.6 |
| Top Ten | | 43.6% |
| The holdings listed exclude any temporary cash investments and equity index products. |
1 The expense ratios shown are from the prospectus dated May 25, 2018, and represent estimated costs for the current fiscal year. For the six
months ended July 31, 2018, the annualized expense ratios were 0.39% for Investor Shares and 0.31% for Admiral Shares.
8
Energy Fund
| | |
| Subindustry Diversification (% of equity | |
| exposure) | | |
| | | MSCI |
| | | ACWI |
| | Fund | Energy |
| Coal & Consumable Fuels | 0.0% | 0.9% |
| Industrials | 0.1 | 0.0 |
| Information Technology | 0.3 | 0.0 |
| Integrated Oil & Gas | 41.3 | 52.6 |
| Oil & Gas Drilling | 0.7 | 0.3 |
| Oil & Gas Equipment & | | |
| Services | 6.4 | 6.2 |
| Oil & Gas Exploration & | | |
| Production | 32.4 | 20.3 |
| Oil & Gas Refining & | | |
| Marketing | 11.0 | 10.8 |
| Oil & Gas Storage & | | |
| Transportation | 3.0 | 8.9 |
| Utilities | 4.2 | 0.0 |
| Other | 0.6 | 0.0 |
Sector categories are based on the Global Industry Classification
Standard (“GICS”), except for the “Other” category (if applicable),
which includes securities that have not been provided a GICS
classification as of the effective reporting period.
| |
| Market Diversification (% of equity exposure) |
| |
| Europe | |
| United Kingdom | 8.7% |
| France | 4.4 |
| Italy | 3.0 |
| Portugal | 1.4 |
| Other | 2.3 |
| Subtotal | 19.8% |
| Pacific | |
| Japan | 0.9% |
| Other | 0.1 |
| Subtotal | 1.0% |
| Emerging Markets | |
| Russia | 3.5% |
| India | 1.9 |
| China | 1.6 |
| Other | 1.1 |
| Subtotal | 8.1% |
| North America | |
| United States | 65.6% |
| Canada | 5.5 |
| Subtotal | 71.1% |
9
Energy Fund
Performance Summary
All of the returns in this report represent past performance, which is not a guarantee of future results that may be achieved by the fund. (Current performance may be lower or higher than the performance data cited. For performance data current to the most recent month-end, visit our website at vanguard.com/performance.) Note, too, that both investment returns and principal value can fluctuate widely, so an investor’s shares, when sold, could be worth more or less than their original cost. The returns shown do not reflect taxes that a shareholder would pay on fund distributions or on the sale of fund shares.
Fiscal-Year Total Returns (%): January 31, 2008, Through July 31, 2018
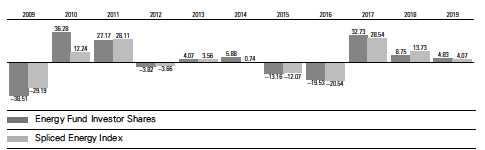
For a benchmark description, see the Glossary.
Note: For 2019, performance data reflect the six months ended July 31, 2018.
Average Annual Total Returns: Periods Ended June 30, 2018
This table presents returns through the latest calendar quarter—rather than through the end of the fiscal period.
Securities and Exchange Commission rules require that we provide this information.
| | | | |
| | Inception | One | Five | Ten |
| | Date | Year | Years | Years |
| Investor Shares | 5/23/1984 | 21.77% | 2.37% | -0.83% |
| Admiral Shares | 11/12/2001 | 21.89 | 2.44 | -0.76 |
See Financial Highlights for dividend and capital gains information.
10
Energy Fund
Financial Statements (unaudited)
Statement of Net Assets
As of July 31, 2018
The fund reports a complete list of its holdings in regulatory filings four times in each fiscal year, at the quarter-ends. For the second and fourth fiscal quarters, the lists appear in the fund’s semiannual and annual reports to shareholders. For the first and third fiscal quarters, the fund files the lists with the Securities and Exchange Commission on Form N-Q. Shareholders can look up the fund’s Forms N-Q on the SEC’s website at sec.gov. Forms N-Q may also be reviewed and copied at the SEC’s Public Reference Room (see the back cover of this report for further information).
| | | |
| | | | Market |
| | | | Value• |
| | | Shares | ($000) |
| Common Stocks (96.5%)1 | | |
| United States (62.8%) | | |
| Electric Utilities (1.5%) | | |
| | OGE Energy Corp. | 1,576,990 | 57,150 |
| | Avangrid Inc. | 978,292 | 48,974 |
| | Edison International | 626,749 | 41,760 |
| | | | 147,884 |
| Energy Equipment & Services (6.0%) | |
| | Schlumberger Ltd. | 3,539,082 | 238,959 |
| | Halliburton Co. | 4,441,687 | 188,416 |
| | Patterson-UTI Energy | | |
| | Inc. | 3,117,397 | 53,619 |
| ^,* | Liberty Oilfield Services | | |
| | Inc. Class A | 1,893,411 | 37,111 |
| | Baker Hughes a GE Co. | 941,898 | 32,571 |
| * | ProPetro Holding Corp. | 1,674,009 | 27,521 |
| | Nabors Industries Ltd. | 1,182,902 | 7,074 |
| | | | 585,271 |
| Multi-Utilities (1.2%) | | |
| | Sempra Energy | 958,015 | 110,737 |
| |
| Oil, Gas & Consumable Fuels (53.5%) | |
| | Integrated Oil & Gas (16.6%) | |
| | Exxon Mobil Corp. | 9,368,619 | 763,636 |
| | Chevron Corp. | 5,048,547 | 637,480 |
| | Occidental Petroleum | | |
| | Corp. | 2,537,918 | 213,008 |
| |
| | Oil & Gas Exploration & Production (26.0%) |
| | Pioneer Natural | | |
| | Resources Co. | 2,273,217 | 430,252 |
| | EOG Resources Inc. | 2,726,237 | 351,521 |
| | Diamondback Energy | | |
| | Inc. | 2,005,329 | 264,603 |
| | ConocoPhillips | 1,971,867 | 142,310 |
| * | Concho Resources Inc. | 954,811 | 139,259 |
| | | |
| | Anadarko Petroleum | | |
| | Corp. | 1,877,387 | 137,331 |
| * | Newfield Exploration | | |
| | Co. | 4,432,423 | 127,299 |
| | Hess Corp. | 1,873,948 | 122,987 |
| | Cabot Oil & Gas Corp. | 3,911,477 | 91,920 |
| | EQT Corp. | 1,643,392 | 81,644 |
| * | Callon Petroleum Co. | 7,309,868 | 78,654 |
| | Devon Energy Corp. | 1,717,994 | 77,327 |
| | Noble Energy Inc. | 2,123,325 | 76,631 |
| * | Antero Resources Corp. | 3,400,935 | 69,855 |
| * | SRC Energy Inc. | 4,929,015 | 55,796 |
| * | Extraction Oil & Gas Inc. | 3,101,044 | 46,888 |
| * | WPX Energy Inc. | 2,439,344 | 45,787 |
| | Marathon Oil Corp. | 2,112,933 | 44,625 |
| * | Parsley Energy Inc. | | |
| | Class A | 1,260,269 | 39,610 |
| * | Centennial Resource | | |
| | Development Inc. | | |
| | Class A | 1,947,776 | 34,982 |
| ^,* | Jagged Peak Energy Inc. | 2,185,666 | 31,255 |
| * | Alta Mesa Resources | | |
| | Inc. | 5,064,382 | 30,589 |
| * | QEP Resources Inc. | 346,302 | 3,598 |
| | Murphy Oil Corp. | 101,903 | 3,389 |
| * | Continental Resources | | |
| | Inc. | 51,461 | 3,287 |
| * | Viper Energy Partners LP | 78,533 | 2,511 |
| |
| | Oil & Gas Refining & Marketing (9.1%) |
| | Valero Energy Corp. | 2,669,662 | 315,954 |
| | Marathon Petroleum | | |
| | Corp. | 3,160,274 | 255,445 |
| | Phillips 66 | 1,647,866 | 203,248 |
| | Delek US Holdings Inc. | 1,786,553 | 95,259 |
| | Andeavor | 106,230 | 15,941 |
| | HollyFrontier Corp. | 62,567 | 4,666 |
11
Energy Fund
| | | |
| | | | Market |
| | | | Value• |
| | | Shares | ($000) |
| Oil & Gas Storage & Transportation (1.8%) |
| | Kinder Morgan Inc. | 5,418,652 | 96,344 |
| | Targa Resources Corp. | 1,452,860 | 74,197 |
| | ONEOK Inc. | 26,831 | 1,890 |
| | Williams Cos. Inc. | 39,182 | 1,166 |
| | | | 5,212,144 |
| Other (0.6%) | | |
| ^,2 | Vanguard Energy ETF | 578,000 | 61,395 |
| |
| Semiconductors & Semiconductor | |
| Equipment (0.0%) | | |
| * | First Solar Inc. | 53,000 | 2,774 |
| Total United States | | 6,120,205 |
| International (33.7%) | | |
| Australia (0.1%) | | |
| * | Santos Ltd. | 864,666 | 4,096 |
| | Woodside Petroleum Ltd. | 41,425 | 1,110 |
| | | | 5,206 |
| Austria (0.0%) | | |
| | OMV AG | 63,433 | 3,585 |
| |
| Brazil (0.9%) | | |
| | Petroleo Brasileiro SA | | |
| | ADR | 6,825,153 | 80,059 |
| | Petroleo Brasileiro SA | 874,062 | 5,109 |
| | Petroleo Brasileiro SA | | |
| | Preference Shares | 678,500 | 3,565 |
| | | | 88,733 |
| Canada (5.4%) | | |
| | Suncor Energy Inc. | 3,994,547 | 168,330 |
| | Canadian Natural | | |
| | Resources Ltd. | 3,489,178 | 127,844 |
| | TransCanada Corp. | 1,973,183 | 88,695 |
| | Encana Corp. | 6,439,477 | 86,547 |
| ^ | PrairieSky Royalty Ltd. | 750,694 | 14,242 |
| | Suncor Energy Inc. | 194,828 | 8,204 |
| | Encana Corp. | 477,850 | 6,594 |
| | Enbridge Inc. | 184,515 | 6,553 |
| | Canadian Natural | | |
| | Resources Ltd. | 113,792 | 4,181 |
| | TransCanada Corp. | 81,466 | 3,664 |
| | Husky Energy Inc. | 212,598 | 3,615 |
| | PrairieSky Royalty Ltd. | 93,253 | 1,721 |
| | | | 520,190 |
| China (1.5%) | | |
| | CNOOC Ltd. ADR | 711,498 | 119,532 |
| | CNOOC Ltd. | 3,991,717 | 6,687 |
| | China Petroleum & | | |
| | Chemical Corp. | 6,603,600 | 6,348 |
| | PetroChina Co. Ltd. | 6,384,000 | 4,862 |
| | China Longyuan Power | | |
| | Group Corp. Ltd. | 3,427,000 | 3,192 |
| | |
| Huaneng Renewables | | |
| Corp. Ltd. | 7,720,000 | 2,872 |
| Kunlun Energy Co. Ltd. | 3,188,000 | 2,758 |
| * GCL-Poly Energy | | |
| Holdings Ltd. | 25,611,000 | 2,258 |
| | | 148,509 |
| Colombia (0.0%) | | |
| Ecopetrol SA ADR | 153,228 | 3,274 |
| |
| Finland (0.1%) | | |
| Neste Oyj | 51,833 | 4,276 |
| |
| France (4.3%) | | |
| TOTAL SA ADR | 6,106,540 | 398,452 |
| TOTAL SA | 315,432 | 20,574 |
| | | 419,026 |
| Germany (0.2%) | | |
| E.ON SE | 2,026,209 | 22,860 |
| |
| Greece (0.0%) | | |
| Motor Oil Hellas Corinth | | |
| Refineries SA | 87,469 | 1,858 |
| Hellenic Petroleum SA | 209,231 | 1,750 |
| | | 3,608 |
| Hungary (0.0%) | | |
| MOL Hungarian Oil & | | |
| Gas plc | 309,769 | 3,035 |
| |
| India (1.8%) | | |
| Reliance Industries Ltd. | 6,229,285 | 107,959 |
| Power Grid Corp. of | | |
| India Ltd. | 23,828,048 | 63,436 |
| Indian Oil Corp. Ltd. | 1,059,502 | 2,549 |
| Oil & Natural Gas | | |
| Corp. Ltd. | 784,211 | 1,895 |
| GAIL India Ltd. | 142,599 | 781 |
| Oil India Ltd. | 102,493 | 313 |
| | | 176,933 |
| Israel (0.0%) | | |
| Oil Refineries Ltd. | 5,898,844 | 2,717 |
| |
| Italy (2.9%) | | |
| ^ Eni SPA ADR | 5,200,318 | 201,044 |
| Tenaris SA ADR | 1,952,702 | 71,742 |
| Eni SPA | 515,331 | 9,920 |
| | | 282,706 |
| Japan (0.9%) | | |
| Inpex Corp. | 6,112,979 | 67,114 |
| JXTG Holdings Inc. | 884,200 | 6,482 |
| Idemitsu Kosan Co. Ltd. | 95,000 | 4,279 |
| Cosmo Energy Holdings | | |
| Co. Ltd. | 79,700 | 2,813 |
12
Energy Fund
| | | |
| | | | Market |
| | | | Value• |
| | | Shares | ($000) |
| | Japan Petroleum | | |
| | Exploration Co. Ltd. | 87,000 | 2,061 |
| | Showa Shell Sekiyu KK | 27,300 | 448 |
| | | | 83,197 |
| Norway (0.8%) | | |
| ^,* | Equinor ASA ADR | 2,474,830 | 65,484 |
| | Equinor ASA | 250,030 | 6,634 |
| | Aker BP ASA | 82,254 | 2,939 |
| | | | 75,057 |
| Poland (0.0%) | | |
| | Grupa Lotos SA | 171,571 | 3,065 |
| |
| Portugal (1.4%) | | |
| | Galp Energia SGPS SA | 6,411,038 | 131,672 |
| |
| Russia (3.4%) | | |
| | Lukoil PJSC ADR | 3,152,254 | 226,115 |
| | Rosneft Oil Co. | | |
| | PJSC GDR | 13,205,623 | 87,236 |
| | Gazprom PJSC | 2,455,004 | 5,655 |
| ^ | Tatneft PJSC ADR | 49,800 | 3,433 |
| | AK Transneft OAO | | |
| | Preference Shares | 1,109 | 2,886 |
| | Surgutneftegas PJSC | 3,903,300 | 1,812 |
| | Tatneft PJSC | 155,950 | 1,802 |
| | LUKOIL PJSC | 23,865 | 1,706 |
| | Surgutneftegas OAO | | |
| | Preference Shares | 2,971,833 | 1,648 |
| | Gazprom PJSC ADR | 105,605 | 474 |
| | Surgutneftegas | | |
| | PJSC ADR | 38,700 | 177 |
| | | | 332,944 |
| South Korea (0.0%) | | |
| | GS Holdings Corp. | 60,163 | 2,896 |
| |
| Spain (0.5%) | | |
| * | Iberdrola SA | 5,582,844 | 43,407 |
| * | Repsol SA | 307,796 | 6,105 |
| | | | 49,512 |
| Sweden (0.8%) | | |
| | Lundin Petroleum AB | 2,342,170 | 77,225 |
| |
| Thailand (0.2%) | | |
| * | PTT Exploration and | | |
| | Production PCL (Local) | 854,100 | 3,546 |
| * | PTT PCL (Foreign) | 2,200,000 | 3,390 |
| | IRPC PCL (Foreign) | 14,898,900 | 2,891 |
| | Thai Oil PCL (Foreign) | 1,128,200 | 2,722 |
| * | PTT PCL | 1,648,400 | 2,540 |
| | | | 15,089 |
| | |
| United Kingdom (8.5%) | | |
| Royal Dutch Shell plc | | |
| ADR | 6,533,913 | 446,724 |
| BP plc ADR | 6,813,712 | 307,230 |
| BP plc | 3,333,029 | 25,049 |
| Royal Dutch Shell plc | | |
| Class B | 637,782 | 22,340 |
| Royal Dutch Shell plc | | |
| Class A | | |
| (Amsterdam Shares) | 381,491 | 13,067 |
| Royal Dutch Shell plc | | |
| Class A | 353,369 | 12,109 |
| Petrofac Ltd. | 308,868 | 2,484 |
| | | 829,003 |
| Total International | | 3,284,318 |
| Total Common Stocks | | |
| (Cost $5,418,403) | | 9,404,523 |
| Temporary Cash Investments (4.3%)1 | |
| Money Market Fund (1.7%) | | |
| 3,4 Vanguard Market | | |
| Liquidity Fund, | | |
| 2.145% | 1,624,896 | 162,490 |
| |
| | Face | |
| | Amount | |
| | ($000) | |
| Repurchase Agreements (2.5%) | |
| RBS Securities, Inc. | | |
| 1.910%, 8/1/18 (Dated | | |
| 7/31/18, Repurchase | | |
| Value $178,509,000, | | |
| collateralized by U. S. | | |
| Treasury Note/Bond | | |
| 0.750%–2.750%, | | |
| 2/15/42–8/15/47, | | |
| with a value of | | |
| $182,070,000) | 178,500 | 178,500 |
| Societe Generale | | |
| 1.900%, 8/1/18 (Dated | | |
| 7/31/18, Repurchase | | |
| Value $70,204,000, | | |
| collateralized by U. S. | | |
| Treasury Note/Bond | | |
| 0.000%–8.125%, | | |
| 12/06/18–11/15/44, | | |
| with a value of | | |
| $71,604,000) | 70,200 | 70,200 |
| | | 248,700 |
13
Energy Fund
| | | |
| | | Face | Market |
| | | Amount | Value• |
| | | ($000) | ($000) |
| U.S. Government and Agency Obligations (0.1%) |
| | United States Treasury Bill, | | |
| | 1.833%, 8/2/18 | 2,000 | 2,000 |
| 5 | United States Treasury Bill, | | |
| | 1.941%, 9/27/18 | 160 | 159 |
| | United States Treasury Bill, | | |
| | 1.934%, 10/11/18 | 100 | 100 |
| 5 | United States Treasury Bill, | | |
| | 2.078%, 11/15/18 | 5,000 | 4,970 |
| | | | 7,229 |
| Total Temporary Cash Investments | |
| (Cost $418,416) | | 418,419 |
| Total Investments (100.8%) | | |
| (Cost $5,836,819) | | 9,822,942 |
| |
| | | | Amount |
| | | | ($000) |
| Other Assets and Liabilities (-0.8%) | |
| Other Assets | | |
| Investment in Vanguard | | 511 |
| Receivables for Accrued Income | 10,696 |
| Receivables for Capital Shares Issued | 20,270 |
| Variation Margin Receivable— | | |
| | Futures Contracts | | 543 |
| Other Assets | | 3,919 |
| Total Other Assets | | 35,939 |
| Liabilities | | |
| Payables for Investment Securities | |
| | Purchased | | (5,043) |
| Payables to Investment Advisor | | (3,810) |
| Collateral for Securities on Loan | | (62,106) |
| Payables for Capital Shares Redeemed | (24,321) |
| Payables to Vanguard | | (15,437) |
| Other Liabilities | | (2,750) |
| Total Liabilities | | (113,467) |
| Net Assets (100%) | | 9,745,414 |
| |
| At July 31, 2018, net assets consisted of: |
| | Amount |
| | ($000) |
| Paid-in Capital | 6,434,582 |
| Undistributed Net Investment Income | 68,840 |
| Accumulated Net Realized Losses | (742,721) |
| Unrealized Appreciation (Depreciation) | |
| Investment Securities | 3,984,097 |
| Futures Contracts | 626 |
| Foreign Currencies | (10) |
| Net Assets | 9,745,414 |
| |
| |
| Investor Shares—Net Assets | |
| Applicable to 49,140,552 outstanding | |
| $.001 par value shares of beneficial | |
| interest (unlimited authorization) | 2,860,998 |
| Net Asset Value Per Share— | |
| Investor Shares | $58.22 |
| |
| |
| Admiral Shares—Net Assets | |
| Applicable to 63,014,348 outstanding | |
| $.001 par value shares of beneficial | |
| interest (unlimited authorization) | 6,884,416 |
| Net Asset Value Per Share— | |
| Admiral Shares | $109.25 |
• See Note A in Notes to Financial Statements.
^ Includes partial security positions on loan to broker-dealers.
The total value of securities on loan is $60,409,000.
* Non-income-producing security.
1 The fund invests a portion of its cash reserves in equity
markets through the use of index futures contracts. After
giving effect to futures investments, the fund’s effective
common stock and temporary cash investment positions
represent 97.6% and 3.2%, respectively, of net assets.
2 Considered an affiliated company of the fund as the issuer
is another member of The Vanguard Group.
3 Affiliated money market fund available only to Vanguard
funds and certain trusts and accounts managed by Vanguard.
Rate shown is the 7-day yield.
4 Includes $62,106,000 of collateral received for securities
on loan.
5 Securities with a value of $4,633,000 have been segregated
as initial margin for open futures contracts.
ADR—American Depositary Receipt.
GDR—Global Depositary Receipt.
14
Energy Fund
| | | | |
| Derivative Financial Instruments Outstanding as of Period End | | |
| Futures Contracts | | | | |
| | | | | ($000) |
| | | | | Value and |
| | | Number of | | Unrealized |
| | | Long (Short) | Notional | Appreciation |
| | Expiration | Contracts | Amount | (Depreciation) |
| Long Futures Contracts | | | | |
| E-mini S&P 500 Index | September 2018 | 782 | 110,149 | 626 |
Unrealized appreciation (depreciation) on open futures contracts is required to be treated as realized gain (loss) for tax purposes.
See accompanying Notes, which are an integral part of the Financial Statements.
15
Statement of Operations
| |
| | Six Months Ended |
| | July 31, 2018 |
| | ($000) |
| Investment Income | |
| Income | |
| Dividends Received from Unaffiliated Issuers1 | 123,123 |
| Dividends Received from Affiliated Issuers | 716 |
| Interest Received from Unaffiliated Issuers | 2,180 |
| Interest Received from Affiliated Issuers | 994 |
| Securities Lending—Net | 946 |
| Total Income | 127,959 |
| Expenses | |
| Investment Advisory Fees—Note B | |
| Basic Fee | 6,786 |
| Performance Adjustment | 448 |
| The Vanguard Group—Note C | |
| Management and Administrative—Investor Shares | 2,767 |
| Management and Administrative—Admiral Shares | 4,172 |
| Marketing and Distribution—Investor Shares | 186 |
| Marketing and Distribution—Admiral Shares | 156 |
| Custodian Fees | 934 |
| Shareholders’ Reports—Investor Shares | 38 |
| Shareholders’ Reports—Admiral Shares | 21 |
| Trustees’ Fees and Expenses | 8 |
| Total Expenses | 15,516 |
| Net Investment Income | 112,443 |
| Realized Net Gain (Loss) | |
| Investment Securities Sold—Unaffiliated Issuers | 103,707 |
| Investment Securities Sold—Affiliated Issuers | (38) |
| Futures Contracts | (2,383) |
| Foreign Currencies | (77) |
| Realized Net Gain (Loss) | 101,209 |
| Change in Unrealized Appreciation (Depreciation) | |
| Investment Securities—Unaffiliated Issuers 2 | 227,181 |
| Investment Securities—Affiliated Issuers | 2,418 |
| Futures Contracts | (2,878) |
| Foreign Currencies | (59) |
| Change in Unrealized Appreciation (Depreciation) | 226,662 |
| Net Increase (Decrease) in Net Assets Resulting from Operations | 440,314 |
| 1 Dividends are net of foreign withholding taxes of $9,441,000. | |
| 2 The change in unrealized appreciation (depreciation) is net of deferred foreign capital gains taxes of $2,026,000. |
| See accompanying Notes, which are an integral part of the Financial Statements. | |
16
Energy Fund
Statement of Changes in Net Assets
| | |
| | Six Months Ended | Year Ended |
| | July 31, | January 31, |
| | 2018 | 2018 |
| | ($000) | ($000) |
| Increase (Decrease) in Net Assets | | |
| Operations | | |
| Net Investment Income | 112,443 | 279,233 |
| Realized Net Gain (Loss) | 101,209 | 74,710 |
| Change in Unrealized Appreciation (Depreciation) | 226,662 | 400,546 |
| Net Increase (Decrease) in Net Assets Resulting from Operations | 440,314 | 754,489 |
| Distributions | | |
| Net Investment Income | | |
| Investor Shares | (4,035) | (84,836) |
| Admiral Shares | (10,632) | (197,679) |
| Realized Capital Gain | | |
| Investor Shares | — | — |
| Admiral Shares | — | — |
| Total Distributions | (14,667) | (282,515) |
| Capital Share Transactions | | |
| Investor Shares | (232,419) | (619,766) |
| Admiral Shares | (211,538) | (771,839) |
| Net Increase (Decrease) from Capital Share Transactions | (443,957) | (1,391,605) |
| Total Increase (Decrease) | (18,310) | (919,631) |
| Net Assets | | |
| Beginning of Period | 9,763,724 | 10,683,355 |
| End of Period1 | 9,745,414 | 9,763,724 |
| 1 Net Assets—End of Period includes undistributed (overdistributed) net investment income of $68,840,000 and ($28,829,000). |
See accompanying Notes, which are an integral part of the Financial Statements.
17
Energy Fund
Financial Highlights
| | | | | | |
| Investor Shares | | | | | | |
| Six Months | | | | | |
| | Ended | | | | | |
| For a Share Outstanding | July 31, | Year Ended January 31, |
| Throughout Each Period | 2018 | 2018 | 2017 | 2016 | 2015 | 2014 |
| Net Asset Value, Beginning of Period | $55.62 | $52.70 | $40.43 | $51.53 | $63.85 | $62.66 |
| Investment Operations | | | | | | |
| Net Investment Income | .6451 | 1.4771,2 | .982 | 1.096 | 1.276 | 1.291 |
| Net Realized and Unrealized Gain (Loss) | | | | | | |
| on Investments | 2.033 | 3.035 | 12.275 | (11.118) | (9.436) | 2.413 |
| Total from Investment Operations | 2.678 | 4.512 | 13.257 | (10.022) | (8.160) | 3.704 |
| Distributions | | | | | | |
| Dividends from Net Investment Income | (.078) | (1.592) | (.987) | (1.078) | (1.206) | (1.277) |
| Distributions from Realized Capital Gains | — | — | — | — | (2.954) | (1.237) |
| Total Distributions | (.078) | (1.592) | (.987) | (1.078) | (4.160) | (2.514) |
| Net Asset Value, End of Period | $58.22 | $55.62 | $52.70 | $40.43 | $51.53 | $63.85 |
| |
| Total Return 3 | 4.83% | 8.75% | 32.73% | -19.53% | -13.16% | 5.88% |
| |
| Ratios/Supplemental Data | | | | | | |
| Net Assets, End of Period (Millions) | $2,861 | $2,968 | $3,452 | $2,693 | $3,334 | $4,138 |
| Ratio of Total Expenses to Average | | | | | | |
| Net Assets4 | 0.39% | 0.38% | 0.41% | 0.37% | 0.37% | 0.38% |
| Ratio of Net Investment Income to | | | | | | |
| Average Net Assets | 2.35% | 2.86%2 | 1.97% | 2.20% | 1.84% | 1.97% |
| Portfolio Turnover Rate | 24% | 24% | 29% | 23% | 31% | 17% |
The expense ratio, net investment income ratio, and turnover rate for the current period have been annualized.
1 Calculated based on average shares outstanding.
2 Net investment income per share and the ratio of net investment income to average net assets include $.342 and 0.67%, respectively,
from income received as a result of the General Electric Co. and Baker Hughes Inc. merger in July 2017.
3 Total returns do not include account service fees that may have applied in the periods shown. Fund prospectuses provide information
about any applicable account service fees.
4 Includes performance-based investment advisory fee increases (decreases) of 0.01%, 0.00%, 0.03%, 0.03%, 0.03%, and 0.04%.
See accompanying Notes, which are an integral part of the Financial Statements.
18
Energy Fund
Financial Highlights
| | | | | | |
| Admiral Shares | | | | | | |
| Six Months | | | | | |
| | Ended | | | | | |
| For a Share Outstanding | July 31, | Year Ended January 31, |
| Throughout Each Period | 2018 | 2018 | 2017 | 2016 | 2015 | 2014 |
| Net Asset Value, Beginning of Period | $104.35 | $98.88 | $75.85 | $96.69 | $119.83 | $117.63 |
| Investment Operations | | | | | | |
| Net Investment Income | 1.2451 | 2.8151,2 | 1.918 | 2.113 | 2.479 | 2.530 |
| Net Realized and Unrealized Gain (Loss) | | | | | | |
| on Investments | 3.822 | 5.730 | 23.035 | (20.872) | (17.726) | 4.491 |
| Total from Investment Operations | 5.067 | 8.545 | 24.953 | (18.759) | (15.247) | 7.021 |
| Distributions | | | | | | |
| Dividends from Net Investment Income | (.167) | (3.075) | (1.923) | (2.081) | (2.351) | (2.500) |
| Distributions from Realized Capital Gains | — | — | — | — | (5.542) | (2.321) |
| Total Distributions | (.167) | (3.075) | (1.923) | (2.081) | (7.893) | (4.821) |
| Net Asset Value, End of Period | $109.25 | $104.35 | $98.88 | $75.85 | $96.69 | $119.83 |
| |
| Total Return 3 | 4.87% | 8.84% | 32.83% | -19.48% | -13.11% | 5.94% |
| |
| Ratios/Supplemental Data | | | | | | |
| Net Assets, End of Period (Millions) | $6,884 | $6,796 | $7,231 | $5,428 | $6,569 | $7,540 |
| Ratio of Total Expenses to | | | | | | |
| Average Net Assets4 | 0.31% | 0.30% | 0.33% | 0.31% | 0.31% | 0.32% |
| Ratio of Net Investment Income to | | | | | | |
| Average Net Assets | 2.43% | 2.94%2 | 2.05% | 2.26% | 1.90% | 2.03% |
| Portfolio Turnover Rate | 24% | 24% | 29% | 23% | 31% | 17% |
The expense ratio, net investment income ratio, and turnover rate for the current period have been annualized.
1 Calculated based on average shares outstanding.
2 Net investment income per share and the ratio of net investment income to average net assets include $.643 and 0.67%, respectively,
from income received as a result of the General Electric Co. and Baker Hughes Inc. merger in July 2017.
3 Total returns do not include account service fees that may have applied in the periods shown. Fund prospectuses provide information
about any applicable account service fees.
4 Includes performance-based investment advisory fee increases (decreases) of 0.01%, 0.00%, 0.03%, 0.03%, 0.03%, and 0.04%.
See accompanying Notes, which are an integral part of the Financial Statements.
19
Energy Fund
Notes to Financial Statements
Vanguard Energy Fund is registered under the Investment Company Act of 1940 as an open-end investment company, or mutual fund. The fund invests in securities of foreign issuers, which may subject it to investment risks not normally associated with investing in securities of U.S. corporations. The fund offers two classes of shares: Investor Shares and Admiral Shares. Investor Shares are available to any investor who meets the fund’s minimum purchase requirements. Admiral Shares are designed for investors who meet certain administrative, service, and account-size criteria.
A. The following significant accounting policies conform to generally accepted accounting principles for U.S. investment companies. The fund consistently follows such policies in preparing its financial statements.
1. Security Valuation: Securities are valued as of the close of trading on the New York Stock Exchange (generally 4 p.m., Eastern time) on the valuation date. Equity securities are valued at the latest quoted sales prices or official closing prices taken from the primary market in which each security trades; such securities not traded on the valuation date are valued at the mean of the latest quoted bid and asked prices. Securities for which market quotations are not readily available, or whose values have been affected by events occurring before the fund’s pricing time but after the close of the securities’ primary markets, are valued at their fair values calculated according to procedures adopted by the board of trustees. These procedures include obtaining quotations from an independent pricing service, monitoring news to identify significant market-or security-specific events, and evaluating changes in the values of foreign market proxies (for example, ADRs, futures contracts, or exchange-traded funds), between the time the foreign markets close and the fund’s pricing time. When fair-value pricing is employed, the prices of securities used by a fund to calculate its net asset value may differ from quoted or published prices for the same securities. Investments in Vanguard Market Liquidity Fund are valued at that fund’s net asset value. Temporary cash investments are valued using the latest bid prices or using valuations based on a matrix system (which considers such factors as security prices, yields, maturities, and ratings), both as furnished by independent pricing services.
2. Foreign Currency: Securities and other assets and liabilities denominated in foreign currencies are translated into U.S. dollars using exchange rates obtained from an independent third party as of the fund’s pricing time on the valuation date. Realized gains (losses) and unrealized appreciation (depreciation) on investment securities include the effects of changes in exchange rates since the securities were purchased, combined with the effects of changes in security prices. Fluctuations in the value of other assets and liabilities resulting from changes in exchange rates are recorded as unrealized foreign currency gains (losses) until the assets or liabilities are settled in cash, at which time they are recorded as realized foreign currency gains (losses).
3. Futures Contracts: The fund uses index futures contracts to a limited extent, with the objective of maintaining full exposure to the stock market while maintaining liquidity. The fund may purchase or sell futures contracts to achieve a desired level of investment, whether to accommodate portfolio turnover or cash flows from capital share transactions. The primary risks associated with the use of futures contracts are imperfect correlation between changes in market values of stocks held by the fund and the prices of futures contracts, and the possibility of an illiquid market. Counterparty risk involving futures is mitigated because a regulated clearinghouse is the counterparty instead of the clearing broker. To further mitigate counterparty risk, the fund trades futures contracts on an exchange, monitors the financial strength of its clearing brokers and clearinghouse, and has entered into clearing agreements with its clearing brokers. The
20
Energy Fund
clearinghouse imposes initial margin requirements to secure the fund’s performance and requires daily settlement of variation margin representing changes in the market value of each contract. Any assets pledged as initial margin for open contracts are noted in the Statement of Net Assets.
Futures contracts are valued at their quoted daily settlement prices. The notional amounts of the contracts are not recorded in the Statement of Net Assets. Fluctuations in the value of the contracts are recorded in the Statement of Net Assets as an asset (liability) and in the Statement of Operations as unrealized appreciation (depreciation) until the contracts are closed, when they are recorded as realized futures gains (losses).
During the six months ended July 31, 2018, the fund’s average investments in long and short futures contracts represented 1% and 0% of net assets, respectively, based on the average of the notional amounts at each quarter-end during the period.
4. Repurchase Agreements: The fund enters into repurchase agreements with institutional counterparties. Securities pledged as collateral to the fund under repurchase agreements are held by a custodian bank until the agreements mature, and in the absence of a default, such collateral cannot be repledged, resold, or rehypothecated. Each agreement requires that the market value of the collateral be sufficient to cover payments of interest and principal. The fund further mitigates its counterparty risk by entering into repurchase agreements only with a diverse group of prequalified counterparties, monitoring their financial strength, and entering into master repurchase agreements with its counterparties. The master repurchase agreements provide that, in the event of a counterparty’s default (including bankruptcy), the fund may terminate any repurchase agreements with that counterparty, determine the net amount owed, and sell or retain the collateral up to the net amount owed to the fund. Such action may be subject to legal proceedings, which may delay or limit the disposition of collateral.
5. Federal Income Taxes: The fund intends to continue to qualify as a regulated investment company and distribute all of its taxable income. Management has analyzed the fund’s tax positions taken for all open federal income tax years (January 31, 2015–2018), and for the period ended July 31, 2018, and has concluded that no provision for federal income tax is required in the fund’s financial statements.
6. Distributions: Distributions to shareholders are recorded on the ex-dividend date.
7. Securities Lending: To earn additional income, the fund lends its securities to qualified institutional borrowers. Security loans are subject to termination by the fund at any time, and are required to be secured at all times by collateral in an amount at least equal to the market value of securities loaned. Daily market fluctuations could cause the value of loaned securities to be more or less than the value of the collateral received. When this occurs, the collateral is adjusted and settled before the opening of the market on the next business day. The fund further mitigates its counterparty risk by entering into securities lending transactions only with a diverse group of prequalified counterparties, monitoring their financial strength, and entering into master securities lending agreements with its counterparties. The master securities lending agreements provide that, in the event of a counterparty’s default (including bankruptcy), the fund may terminate any loans with that borrower, determine the net amount owed, and sell or retain the collateral up to the net amount owed to the fund; however, such actions may be subject to legal proceedings. While collateral mitigates counterparty risk, in the event of a default, the fund may experience delays and costs in recovering the securities loaned. The fund invests cash collateral received in Vanguard
21
Energy Fund
Market Liquidity Fund, and records a liability in the Statement of Net Assets for the return of the collateral, during the period the securities are on loan. Securities lending income represents fees charged to borrowers plus income earned on invested cash collateral, less expenses associated with the loan. During the term of the loan, the fund is entitled to all distributions made on or in respect of the loaned securities.
8. Credit Facility: The fund and certain other funds managed by The Vanguard Group (“Vanguard���) participate in a $3.1 billion committed credit facility provided by a syndicate of lenders pursuant to a credit agreement that may be renewed annually; each fund is individually liable for its borrowings, if any, under the credit facility. Borrowings may be utilized for temporary and emergency purposes, and are subject to the fund’s regulatory and contractual borrowing restrictions. The participating funds are charged administrative fees and an annual commitment fee of 0.10% of the undrawn amount of the facility; these fees are allocated to the funds based on a method approved by the fund’s board of trustees and included in Management and Administrative expenses on the fund’s Statement of Operations. Any borrowings under this facility bear interest at a rate based upon the higher of the one-month London Interbank Offered Rate, federal funds effective rate, or overnight bank funding rate plus an agreed-upon spread.
The fund had no borrowings outstanding at July 31, 2018, or at any time during the period then ended.
9. Other: Dividend income is recorded on the ex-dividend date. Interest income includes income distributions received from Vanguard Market Liquidity Fund and is accrued daily. Premiums and discounts on debt securities purchased are amortized and accreted, respectively, to interest income over the lives of the respective securities. Security transactions are accounted for on the date securities are bought or sold. Costs used to determine realized gains (losses) on the sale of investment securities are those of the specific securities sold.
Taxes on foreign dividends and capital gains have been provided for in accordance with the fund’s understanding of the applicable countries’ tax rules and rates. Foreign capital gains tax is accrued daily based upon net unrealized gains. The fund has filed tax reclaims for previously withheld taxes on dividends earned in certain European Union countries. These filings are subject to various administrative and judicial proceedings within these countries. Such tax reclaims received during the year, if any, are included in dividend income. No other amounts for additional tax reclaims are reflected in the financial statements due to the uncertainty as to the ultimate resolution of proceedings, the likelihood of receipt of these reclaims, and the potential timing of payment.
Each class of shares has equal rights as to assets and earnings, except that each class separately bears certain class-specific expenses related to maintenance of shareholder accounts (included in Management and Administrative expenses), shareholder reporting, and the proxy. Marketing and distribution expenses are allocated to each class of shares based on a method approved by the board of trustees. Income, other non-class-specific expenses, and gains and losses on investments are allocated to each class of shares based on its relative net assets.
B. The investment advisory firm Wellington Management Company LLP provides investment advisory services to a portion of the fund for a fee calculated at an annual percentage rate of average net assets managed by the advisor. The basic fee is subject to quarterly adjustments based on performance relative to the MSCI ACWI Energy Index for the preceding three years.
22
Energy Fund
Vanguard provides investment advisory services to a portion of the fund as described below; the fund paid Vanguard advisory fees of $288,000 for the six months ended July 31, 2018.
For the six months ended July 31, 2018, the aggregate investment advisory fee paid to all advisors represented an effective annual basic rate of 0.15% of the fund’s average net assets, before an increase of $448,000 (0.01%) based on performance.
C. In accordance with the terms of a Funds’ Service Agreement (the “FSA”) between Vanguard and the fund, Vanguard furnishes to the fund investment advisory, corporate management, administrative, marketing, and distribution services at Vanguard’s cost of operations (as defined by the FSA). These costs of operations are allocated to the fund based on methods and guidelines approved by the board of trustees. Vanguard does not require reimbursement in the current period for certain costs of operations (such as deferred compensation/benefits and risk/insurance costs); the fund’s liability for these costs of operations is included in Payables to Vanguard on the Statement of Net Assets. All other costs of operations payable to Vanguard are generally settled twice a month.
Upon the request of Vanguard, the fund may invest up to 0.40% of its net assets as capital in Vanguard. At July 31, 2018, the fund had contributed to Vanguard capital in the amount of $511,000, representing 0.01% of the fund’s net assets and 0.20% of Vanguard’s capitalization. The fund’s trustees and officers are also directors and employees, respectively, of Vanguard.
D. Various inputs may be used to determine the value of the fund’s investments. These inputs are summarized in three broad levels for financial statement purposes. The inputs or methodologies used to value securities are not necessarily an indication of the risk associated with investing in those securities.
Level 1—Quoted prices in active markets for identical securities.
Level 2—Other significant observable inputs (including quoted prices for similar securities, interest rates, prepayment speeds, credit risk, etc.).
Level 3—Significant unobservable inputs (including the fund’s own assumptions used to determine
the fair value of investments). Any investments valued with significant unobservable inputs are
noted on the Statement of Net Assets.
The following table summarizes the market value of the fund’s investments as of July 31, 2018, based on the inputs used to value them:
| | | |
| | Level 1 | Level 2 | Level 3 |
| Investments | ($000) | ($000) | ($000) |
| Common Stocks—United States | 6,120,205 | — | — |
| Common Stocks—International | 2,222,405 | 1,061,913 | — |
| Temporary Cash Investments | 162,490 | 255,929 | — |
| Futures Contracts—Assets1 | 543 | — | — |
| Total | 8,505,643 | 1,317,842 | — |
| 1 Represents variation margin on the last day of the reporting period. |
23
Energy Fund
E. Distributions are determined on a tax basis and may differ from net investment income and realized capital gains for financial reporting purposes. Differences may be permanent or temporary. Permanent differences are reclassified among capital accounts in the financial statements to reflect their tax character. Temporary differences arise when certain items of income, expense, gain, or loss are recognized in different periods for financial statement and tax purposes. These differences will reverse at some time in the future. Differences in classification may also result from the treatment of short-term gains as ordinary income for tax purposes.
The fund’s tax-basis capital gains and losses are determined only at the end of each fiscal year. For tax purposes, at January 31, 2018, the fund had available capital losses totaling $839,189,000 that may be carried forward indefinitely to offset future net capital gains. The fund will use these capital losses to offset net taxable capital gains, if any, realized during the year ending January 31, 2019; should the fund realize net capital losses for the year, the losses will be added to the loss carryforward balance above.
At July 31, 2018, the cost of investment securities for tax purposes was $5,861,468,000. Net unrealized appreciation of investment securities for tax purposes was $3,959,448,000, consisting of unrealized gains of $4,043,500,000 on securities that had risen in value since their purchase and $84,052,000 in unrealized losses on securities that had fallen in value since their purchase.
F. During the six months ended July 31, 2018, the fund purchased $1,104,739,000 of investment securities and sold $1,388,465,000 of investment securities, other than temporary cash investments.
G. Capital share transactions for each class of shares were:
| | | | |
| | Six Months Ended | Year Ended |
| | July 31, 2018 | January 31, 2018 |
| | Amount | Shares | Amount | Shares |
| | ($000) | (000) | ($000) | (000) |
| Investor Shares | | | | |
| Issued | 212,854 | 3,832 | 425,153 | 8,257 |
| Issued in Lieu of Cash Distributions | 3,792 | 72 | 79,692 | 1,521 |
| Redeemed | (449,065) | (8,128) | (1,124,611) | (21,913) |
| Net Increase (Decrease) —Investor Shares | (232,419) | (4,224) | (619,766) | (12,135) |
| Admiral Shares | | | | |
| Issued | 484,933 | 4,648 | 954,935 | 9,930 |
| Issued in Lieu of Cash Distributions | 9,719 | 99 | 180,333 | 1,835 |
| Redeemed | (706,190) | (6,855) | (1,907,107) | (19,772) |
| Net Increase (Decrease) —Admiral Shares | (211,538) | (2,108) | (771,839) | (8,007) |
24
Energy Fund
H. Transactions during the period in investments where the issuer is another member of The Vanguard Group were as follows:
| | | | | | | | |
| | | Current Period Transactions | |
| | Jan. 31, | | Proceeds | Net | Change | | | July 31, |
| | 2018 | | from | Realized | in Net | | Capital Gain | 2018 |
| | Market | Purchases | Securities | Gain | Unrealized | | Distributions | Market |
| | Value | at Cost | Sold | (Loss) | App. (Dep.) | Income | Received | Value |
| | ($000) | ($000) | ($000) | ($000) | ($000) | ($000) | ($000) | ($000) |
| Vanguard Energy | | | | | | | | |
| ETF | 58,996 | — | — | — | 2,399 | 716 | — | 61,395 |
| Vanguard Market | | | | | | | | |
| Liquidity Fund | 192,265 | NA1 | NA1 | (38) | 19 | 994 | — | 162,490 |
| Total | 251,261 | | | (38) | 2,418 | 1,710 | — | 223,885 |
| 1 Not applicable—purchases and sales are for temporary cash investment purposes. |
I. Management has determined that no events or transactions occurred subsequent to July 31, 2018, that would require recognition or disclosure in these financial statements.
25
About Your Fund’s Expenses
As a shareholder of the fund, you incur ongoing costs, which include costs for portfolio management, administrative services, and shareholder reports (like this one), among others. Operating expenses, which are deducted from a fund’s gross income, directly reduce the investment return of the fund.
A fund’s expenses are expressed as a percentage of its average net assets. This figure is known as the expense ratio. The following examples are intended to help you understand the ongoing costs (in dollars) of investing in your fund and to compare these costs with those of other mutual funds. The examples are based on an investment of $1,000 made at the beginning of the period shown and held for the entire period.
The accompanying table illustrates your fund’s costs in two ways:
• Based on actual fund return. This section helps you to estimate the actual expenses that you paid over the period. The ”Ending Account Value“ shown is derived from the fund‘s actual return, and the third column shows the dollar amount that would have been paid by an investor who started with $1,000 in the fund. You may use the information here, together with the amount you invested, to estimate the expenses that you paid over the period.
To do so, simply divide your account value by $1,000 (for example, an $8,600 account value divided by $1,000 = 8.6), then multiply the result by the number given for your fund under the heading ”Expenses Paid During Period.“
• Based on hypothetical 5% yearly return. This section is intended to help you compare your fund‘s costs with those of other mutual funds. It assumes that the fund had a yearly return of 5% before expenses, but that the expense ratio is unchanged. In this case—because the return used is not the fund’s actual return—the results do not apply to your investment. The example is useful in making comparisons because the Securities and Exchange Commission requires all mutual funds to calculate expenses based on a 5% return. You can assess your fund’s costs by comparing this hypothetical example with the hypothetical examples that appear in shareholder reports of other funds.
Note that the expenses shown in the table are meant to highlight and help you compare ongoing costs only and do not reflect transaction costs incurred by the fund for buying and selling securities. Further, the expenses do not include any purchase, redemption, or account service fees described in the fund prospectus. If such fees were applied to your account, your costs would be higher. Your fund does not carry a “sales load.”
The calculations assume no shares were bought or sold during the period. Your actual costs may have been higher or lower, depending on the amount of your investment and the timing of any purchases or redemptions.
You can find more information about the fund’s expenses, including annual expense ratios, in the Financial Statements section of this report. For additional information on operating expenses and other shareholder costs, please refer to your fund’s current prospectus.
26
| | | |
| Six Months Ended July 31, 2018 | | | |
| | Beginning | Ending | Expenses |
| | Account Value | Account Value | Paid During |
| Energy Fund | 1/31/2018 | 7/31/2018 | Period |
| Based on Actual Fund Return | | | |
| Investor Shares | $1,000.00 | $1,048.30 | $1.98 |
| Admiral Shares | 1,000.00 | 1,048.73 | 1.57 |
| Based on Hypothetical 5% Yearly Return | | | |
| Investor Shares | $1,000.00 | $1,022.86 | $1.96 |
| Admiral Shares | 1,000.00 | 1,023.26 | 1.56 |
The calculations are based on expenses incurred in the most recent six-month period. The fund’s annualized six-month expense ratios for
that period are 0.39% for Investor Shares and 0.31% for Admiral Shares. The dollar amounts shown as “Expenses Paid” are equal to the
annualized expense ratio multiplied by the average account value over the period, multiplied by the number of days in the most recent
six-month period, then divided by the number of days in the most recent 12-month period (181/365).
27
Trustees Approve Advisory Arrangements
The board of trustees of Vanguard Energy Fund has renewed the fund’s investment advisory arrangements with The Vanguard Group, Inc. (Vanguard), through its Quantitative Equity Group, and Wellington Management Company LLP (Wellington Management). The board determined that renewing the fund’s advisory arrangements was in the best interests of the fund and its shareholders.
The board based its decision upon an evaluation of each advisor’s investment staff, portfolio management process, and performance. This evaluation included information provided to the board by Vanguard’s Portfolio Review Department, which is responsible for fund and advisor oversight and product management. The Portfolio Review Department met regularly with the advisors and made monthly presentations to the board during the fiscal year that directed the board’s focus to relevant information and topics.
The board, or an investment committee made up of board members, also received information throughout the year during advisor presentations. For each advisor presentation, the board was provided with letters and reports that included information about, among other things, the advisory firm and the advisor’s assessment of the investment environment, portfolio performance, and portfolio characteristics.
In addition, the board received monthly reports, which included a Market and Economic Report, a Fund Dashboard Monthly Summary, and a Fund Performance Report.
Prior to their meeting, the trustees were provided with a memo and materials that summarized the information they received over the course of the year. They also considered the factors discussed below, among others. However, no single factor determined whether the board approved the arrangements. Rather, it was the totality of the circumstances that drove the board’s decision.
Nature, extent, and quality of services
The board reviewed the quality of the fund’s investment management services over both the short and long term and took into account the organizational depth and stability of each advisor. The board considered the following: Vanguard. Vanguard has been managing investments for more than four decades. The Quantitative Equity Group adheres to a sound, disciplined investment management process; the team has considerable experience, stability, and depth. Vanguard has managed a portion of the fund since 2005.
Wellington Management. Founded in 1928, Wellington Management is among the nation’s oldest and most respected institutional investment managers. The investment team uses a bottom-up approach in which stocks are selected based on the advisor’s estimates of fundamental investment value. Fundamental research focuses on the quality of a company’s assets, its internal reinvestment opportunities, and management quality. The firm has advised the fund since its inception in 1984.
The board concluded that each advisor’s experience, stability, depth, and performance, among other factors, warranted the continuation of the advisory arrangements.
28
Investment performance
The board considered the short- and long-term performance of the fund and each advisor, including any periods of outperformance or underperformance compared with a relevant benchmark index and peer group. The board concluded that the performance was such that the advisory arrangements should continue. Information about the fund’s most recent performance can be found in the Performance Summary section of this report.
Cost
The board concluded that the fund’s expense ratio was well below the average expense ratio charged by funds in its peer group and that the fund’s advisory expense rate was also well below the peer-group average. Information about the fund’s expenses appears in the About Your Fund’s Expenses section of this report as well as in the Financial Statements section, which also includes information about the fund’s advisory expense rate.
The board did not consider the profitability of Wellington Management in determining whether to approve the advisory fee, because Wellington Management is independent of Vanguard and the advisory fee is the result of arm’s-length negotiations. The board does not conduct a profitability analysis of Vanguard because of Vanguard’s unique “at-cost” structure. Unlike most other mutual fund management companies, Vanguard is owned by the funds it oversees and produces “profits” only in the form of reduced expenses for fund shareholders.
The benefit of economies of scale
The board concluded that the fund’s shareholders benefit from economies of scale because of breakpoints in the fund’s advisory fee schedule for Wellington Management. The breakpoints reduce the effective rate of the fee as the fund’s assets managed by Wellington Management increase. The board also concluded that the fund’s at-cost arrangement with Vanguard ensures that the fund will realize economies of scale as it grows, with the cost to shareholders declining as the fund’s assets managed by Vanguard increase.
The board will consider whether to renew the advisory arrangements again after a one-year period.
29
Glossary
30-Day SEC Yield. A fund’s 30-day SEC yield is derived using a formula specified by the U.S. Securities and Exchange Commission. Under the formula, data related to the fund’s security holdings in the previous 30 days are used to calculate the fund’s hypothetical net income for that period, which is then annualized and divided by the fund’s estimated average net assets over the calculation period. For the purposes of this calculation, a security’s income is based on its current market yield to maturity (for bonds), its actual income (for asset-backed securities), or its projected dividend yield (for stocks). Because the SEC yield represents hypothetical annualized income, it will differ—at times significantly—from the fund’s actual experience. As a result, the fund’s income distributions may be higher or lower than implied by the SEC yield.
Beta. A measure of the magnitude of a fund’s past share-price fluctuations in relation to the ups and downs of a given market index. The index is assigned a beta of 1.00. Compared with a given index, a fund with a beta of 1.20 typically would have seen its share price rise or fall by 12% when the index rose or fell by 10%. For this report, beta is based on returns over the past 36 months for both the fund and the index. Note that a fund’s beta should be reviewed in conjunction with its R-squared (see definition). The lower the R-squared, the less correlation there is between the fund and the index, and the less reliable beta is as an indicator of volatility.
Dividend Yield. Dividend income earned by stocks, expressed as a percentage of the aggregate market value (or of net asset value, for a fund). The yield is determined by dividing the amount of the annual dividends by the aggregate value (or net asset value) at the end of the period. For a fund, the dividend yield is based solely on stock holdings and does not include any income produced by other investments.
Earnings Growth Rate. The average annual rate of growth in earnings over the past five years for the stocks now in a fund.
Equity Exposure. A measure that reflects a fund’s investments in stocks and stock futures. Any holdings in short-term reserves are excluded.
Expense Ratio. A fund’s total annual operating expenses expressed as a percentage of the fund’s average net assets. The expense ratio includes management and administrative expenses, but does not include the transaction costs of buying and selling portfolio securities.
Foreign Holdings. The percentage of a fund represented by securities or depositary receipts of companies based outside the United States.
Inception Date. The date on which the assets of a fund (or one of its share classes) are first invested in accordance with the fund’s investment objective. For funds with a subscription period, the inception date is the day after that period ends. Investment performance is measured from the inception date.
Median Market Cap. An indicator of the size of companies in which a fund invests; the midpoint of market capitalization (market price x shares outstanding) of a fund’s stocks, weighted by the proportion of the fund’s assets invested in each stock. Stocks representing half of the fund’s assets have market capitalizations above the median, and the rest are below it.
Price/Book Ratio. The share price of a stock divided by its net worth, or book value, per share.
For a fund, the weighted average price/book ratio of the stocks it holds.
30
Price/Earnings Ratio. The ratio of a stock’s current price to its per-share earnings over the past year. For a fund, the weighted average P/E of the stocks it holds. P/E is an indicator of market expectations about corporate prospects; the higher the P/E, the greater the expectations for a company’s future growth.
R-Squared. A measure of how much of a fund’s past returns can be explained by the returns from the market in general, as measured by a given index. If a fund’s total returns were precisely synchronized with an index’s returns, its R-squared would be 1.00. If the fund’s returns bore no relationship to the index’s returns, its R-squared would be 0. For this report, R-squared is based on returns over the past 36 months for both the fund and the index.
Return on Equity. The annual average rate of return generated by a company during the past five years for each dollar of shareholder’s equity (net income divided by shareholder’s equity). For a fund, the weighted average return on equity for the companies whose stocks it holds.
Short-Term Reserves. The percentage of a fund invested in highly liquid, short-term securities that can be readily converted to cash.
Turnover Rate. An indication of the fund’s trading activity. Funds with high turnover rates incur higher transaction costs and may be more likely to distribute capital gains (which may be taxable to investors). The turnover rate excludes in-kind transactions, which have minimal impact on costs.
Benchmark Information
Spliced Energy Index: S&P 500 Index through November 30, 2000; S&P Energy Sector Index through May 31, 2010; MSCI All Country World Energy Index thereafter.
31
The Global Industry Classification Standard (“GICS”) was developed by and is the exclusive property and a service mark of MSCI Inc. (“MSCI”) and Standard and Poor’s, a division of McGraw-Hill Companies, Inc. (“S&P”), and is licensed for use by Vanguard. Neither MSCI, S&P nor any third party involved in making or compiling the GICS or any GICS classification makes any express or implied warranties or representations with respect to such standard or classification (or the results to be obtained by the use thereof), and all such parties hereby expressly disclaim all warranties of originality, accuracy, completeness, merchantability or fitness for a particular purpose with respect to any such standard or classification. Without limiting any of the foregoing, in no event shall MSCI, S&P, any of its affiliates or any third party involved in making or compiling the GICS or any GICS classification have any liability for any direct, indirect, special, punitive, consequential or any other damages (including lost profits) even if notified of the possibility of such damages.
32
This page intentionally left blank.
This page intentionally left blank.
The People Who Govern Your Fund
The trustees of your mutual fund are there to see that the fund is operated and managed in your best interests since, as a shareholder, you are a part owner of the fund. Your fund’s trustees also serve on the board of directors of The Vanguard Group, Inc., which is owned by the Vanguard funds and provides services to them on an at-cost basis.
A majority of Vanguard’s board members are independent, meaning that they have no affiliation with Vanguard or the funds they oversee, apart from the sizable personal investments they have made as private individuals. The independent board members have distinguished backgrounds in business, academia, and public service. Each of the trustees and executive officers oversees 208 Vanguard funds.
Information for each trustee and executive officer of the fund appears below. The mailing address of the trustees and officers is P.O. Box 876, Valley Forge, PA 19482. More information about the trustees is in the Statement of Additional Information, which can be obtained, without charge, by contacting Vanguard at 800-662-7447, or online at vanguard.com.
Interested Trustees1
F. William McNabb III
Born in 1957. Trustee since July 2009. Principal occupation(s) during the past five years and other experience: chairman of the board (January 2010–present) of Vanguard and of each of the investment companies served by Vanguard, trustee (2009–present) of each of the investment companies served by Vanguard, and director (2008–present) of Vanguard. Chief executive officer and president (2008–2017) of Vanguard and each of the investment companies served by Vanguard, managing director (1995–2008) of Vanguard, and director (1997–2018) of Vanguard Marketing Corporation. Director (2018–present) of UnitedHealth Group.
Mortimer J. Buckley
Born in 1969. Trustee since January 2018. Principal occupation(s) during the past five years and other experience: chief executive officer (January 2018–present) of Vanguard; chief executive officer, president, and trustee (January 2018–present) of each of the investment companies served by Vanguard; president and director (2017–present) of Vanguard; and president (February 2018–present) of Vanguard Marketing Corporation. Chief investment officer (2013–2017), managing director (2002–2017), head of the Retail Investor Group (2006–2012), and chief information officer (2001–2006) of Vanguard. Chairman of the board (2011–2017) of the Children’s Hospital of Philadelphia.
Independent Trustees
Emerson U. Fullwood
Born in 1948. Trustee since January 2008. Principal occupation(s) during the past five years and other experience: executive chief staff and marketing officer for North America and corporate vice president (retired 2008) of Xerox Corporation (document management products and services). Former president of the Worldwide Channels Group, Latin America, and Worldwide Customer Service and executive chief staff officer of Developing Markets of Xerox. Executive in residence and 2009–2010 Distinguished Minett Professor at the Rochester Institute of Technology. Lead director of SPX FLOW, Inc. (multi-industry manufacturing). Director of the University of Rochester Medical Center, the Monroe Community College Foundation, the United Way of Rochester, North Carolina A&T University, and Roberts Wesleyan College. Trustee of the University of Rochester.
Amy Gutmann
Born in 1949. Trustee since June 2006. Principal occupation(s) during the past five years and other experience: president (2004–present) of the University of Pennsylvania. Christopher H. Browne Distinguished Professor of Political Science, School of Arts and Sciences, and professor of communication, Annenberg School for Communication, with secondary faculty appointments in the Department of Philosophy, School of Arts and Sciences, and at the Graduate School of Education, University of Pennsylvania. Trustee of the National Constitution Center.
1 Mr. McNabb and Mr. Buckley are considered “interested persons,” as defined in the Investment Company Act of 1940, because
they are officers of the Vanguard funds.
JoAnn Heffernan Heisen
Born in 1950. Trustee since July 1998. Principal occupation(s) during the past five years and other experience: corporate vice president of Johnson & Johnson (pharmaceuticals/medical devices/consumer products) and member of its executive committee (1997–2008). Chief global diversity officer (retired 2008), vice president and chief information officer (1997–2006), controller (1995–1997), treasurer (1991–1995), and assistant treasurer (1989–1991) of Johnson & Johnson. Director of Skytop Lodge Corporation (hotels) and the Robert Wood Johnson Foundation. Member of the advisory board of the Institute for Women’s Leadership at Rutgers University
F. Joseph Loughrey
Born in 1949. Trustee since October 2009. Principal occupation(s) during the past five years and other experience: president and chief operating officer (retired 2009) and vice chairman of the board (2008–2009) of Cummins Inc. (industrial machinery). Chairman of the board of Hillenbrand, Inc. (specialized consumer services), Oxfam America, and the Lumina Foundation for Education. Director of the V Foundation for Cancer Research. Member of the advisory council for the College of Arts and Letters and chair of the advisory board to the Kellogg Institute for International Studies, both at the University of Notre Dame.
Mark Loughridge
Born in 1953. Trustee since March 2012. Principal occupation(s) during the past five years and other experience: senior vice president and chief financial officer (retired 2013) of IBM (information technology services). Fiduciary member of IBM’s Retirement Plan Committee (2004–2013), senior vice president and general manager (2002–2004) of IBM Global Financing, vice president and controller (1998–2002) of IBM, and a variety of other prior management roles at IBM. Member of the Council on Chicago Booth.
Scott C. Malpass
Born in 1962. Trustee since March 2012. Principal occupation(s) during the past five years and other experience: chief investment officer (1989–present) and vice president (1996–present) of the University of Notre Dame. Assistant professor of finance at the Mendoza College of Business, University of Notre Dame, and member of the Notre Dame 403(b) Investment Committee. Chairman of the board of TIFF Advisory Services, Inc. Member of the board of Catholic Investment Services, Inc. (investment advisors), the board of advisors for Spruceview Capital Partners, and the board of superintendence of the Institute for the Works of Religion.
Deanna Mulligan
Born in 1963. Trustee since January 2018. Principal occupation(s) during the past five years and other experience: president (2010–present) and chief executive officer (2011–present) of The Guardian Life Insurance Company of America. Chief operating officer (2010–2011) and executive vice president (2008–2010) of Individual Life and Disability of The Guardian Life Insurance Company of America. Member of the board of The Guardian Life Insurance Company of America, the American Council of Life Insurers, the Partnership for New York City (business leadership), and the Committee Encouraging Corporate Philanthropy. Trustee of the Economic Club of New York and the Bruce Museum (arts and science). Member of the Advisory Council for the Stanford Graduate School of Business.
André F. Perold
Born in 1952. Trustee since December 2004. Principal occupation(s) during the past five years and other experience: George Gund Professor of Finance and Banking, Emeritus at the Harvard Business School (retired 2011). Chief investment officer and co-managing partner of HighVista Strategies LLC (private investment firm). Overseer of the Museum of Fine Arts Boston.
Sarah Bloom Raskin
Born in 1961. Trustee since January 2018. Principal occupation(s) during the past five years and other experience: deputy secretary (2014–2017) of the United States Department of the Treasury. Governor (2010–2014) of the Federal Reserve Board. Commissioner (2007–2010) of financial regulation for the State of Maryland. Member of the board of directors (2012–2014) of Neighborhood Reinvestment Corporation. Director of i(x) Investments, LLC.
Peter F. Volanakis
Born in 1955. Trustee since July 2009. Principal occupation(s) during the past five years and other experience: president and chief operating officer (retired 2010) of Corning Incorporated (communications equipment) and director of Corning Incorporated (2000–2010) and Dow Corning (2001–2010). Director (2012) of SPX Corporation (multi-industry manufacturing). Overseer of the Amos Tuck School of Business Administration, Dartmouth College (2001–2013). Chairman of the board of trustees of Colby-Sawyer College. Member of the Board of Hypertherm Inc. (industrial cutting systems, software, and consumables).
Executive Officers
Glenn Booraem
Born in 1967. Principal occupation(s) during the past five years and other experience: principal of Vanguard. Investment stewardship officer (2017–present), treasurer (2015–2017), controller (2010–2015), and assistant controller (2001–2010) of each of the investment companies served by Vanguard.
Christine M. Buchanan
Born in 1970. Principal occupation(s) during the past five years and other experience: principal of Vanguard and global head of Fund Administration at Vanguard. Treasurer (2017–present) of each of the investment companies served by Vanguard. Partner (2005–2017) at KPMG LLP (audit, tax, and advisory services).
Brian Dvorak
Born in 1973. Principal occupation(s) during the past five years and other experience: principal of Vanguard. Chief compliance officer (2017–present) of Vanguard and each of the investment companies served by Vanguard. Assistant vice president (2017–present) of Vanguard Marketing Corporation. Vice president and director of Enterprise Risk Management (2011–2013) at Oppenheimer Funds, Inc.
Thomas J. Higgins
Born in 1957. Principal occupation(s) during the past five years and other experience: principal of Vanguard. Chief financial officer (2008–present) and treasurer (1998–2008) of each of the investment companies served by Vanguard.
Peter Mahoney
Born in 1974. Principal occupation(s) during the past five years and other experience: principal of Vanguard. Controller (2015–present) of each of the investment companies served by Vanguard. Head of International Fund Services (2008–2014) at Vanguard.
Anne E. Robinson
Born in 1970. Principal occupation(s) during the past five years and other experience: general counsel (2016–present) of Vanguard. Secretary (2016–present) of Vanguard and of each of the investment companies served by Vanguard. Managing director (2016–present) of Vanguard. Director and senior vice president (2016–2018) of Vanguard Marketing Corporation. Managing director and general counsel of Global Cards and Consumer Services (2014–2016) at Citigroup. Counsel (2003–2014) at American Express.
Michael Rollings
Born in 1963. Principal occupation(s) during the past five years and other experience: finance director (2017–present) and treasurer (2017) of each of the investment companies served by Vanguard. Managing director (2016–present) of Vanguard. Chief financial officer (2016–present) of Vanguard. Director (2016–present) of Vanguard Marketing Corporation. Executive vice president and chief financial officer (2006–2016) of MassMutual Financial Group.
| |
| Vanguard Senior Management Team |
| |
| Mortimer J. Buckley | James M. Norris |
| Gregory Davis | Thomas M. Rampulla |
| John James | Karin A. Risi |
| Martha G. King | Anne E. Robinson |
| John T. Marcante | Michael Rollings |
| Chris D. McIsaac | |
| |
| |
| Chairman Emeritus and Senior Advisor |
| |
| John J. Brennan | |
| Chairman, 1996–2009 | |
| Chief Executive Officer and President, 1996–2008 |
| |
| |
| Founder | |
| |
| John C. Bogle | |
| Chairman and Chief Executive Officer, 1974–1996 |
|  |
| | P.O. Box 2600 |
| | Valley Forge, PA 19482-2600 |
| |
| |
| |
| Connect with Vanguard® > vanguard.com |
| |
| |
| |
| Fund Information > 800-662-7447 | Source for Bloomberg Barclays indexes: Bloomberg |
| Direct Investor Account Services > 800-662-2739 | Index Services Limited. Copyright 2018, Bloomberg. |
| | All rights reserved. |
| Institutional Investor Services > 800-523-1036 | |
| | CFA® is a registered trademark owned by CFA |
| Text Telephone for People | Institute. |
| Who Are Deaf or Hard of Hearing > 800-749-7273 | |
| |
| This material may be used in conjunction | |
| with the offering of shares of any Vanguard | |
| fund only if preceded or accompanied by | |
| the fund’s current prospectus. | |
| |
| All comparative mutual fund data are from Lipper, a | |
| Thomson Reuters Company, or Morningstar, Inc., unless | |
| otherwise noted. | |
| |
| You can obtain a free copy of Vanguard’s proxy voting | |
| guidelines by visiting vanguard.com/proxyreporting or by | |
| calling Vanguard at 800-662-2739. The guidelines are | |
| also available from the SEC’s website, sec.gov. In | |
| addition, you may obtain a free report on how your fund | |
| voted the proxies for securities it owned during the 12 | |
| months ended June 30. To get the report, visit either | |
| vanguard.com/proxyreporting or sec.gov. | |
| |
| You can review and copy information about your fund at | |
| the SEC’s Public Reference Room in Washington, D.C. To | |
| find out more about this public service, call the SEC at | |
| 202-551-8090. Information about your fund is also | |
| available on the SEC’s website, and you can receive | |
| copies of this information, for a fee, by sending a | |
| request in either of two ways: via email addressed to | |
| publicinfo@sec.gov or via regular mail addressed to the | |
| Public Reference Section, Securities and Exchange | |
| Commission, Washington, DC 20549-1520. | |
| | © 2018 The Vanguard Group, Inc. |
| | All rights reserved. |
| | Vanguard Marketing Corporation, Distributor. |
| |
| | Q512 092018 |

Semiannual Report | July 31, 2018
Vanguard Health Care Fund
Vanguard’s Principles for Investing Success
We want to give you the best chance of investment success. These principles, grounded in Vanguard’s research and experience, can put you on the right path.
Goals. Create clear, appropriate investment goals.
Balance. Develop a suitable asset allocation using broadly diversified funds. Cost. Minimize cost.
Discipline. Maintain perspective and long-term discipline.
A single theme unites these principles: Focus on the things you can control.
We believe there is no wiser course for any investor.
| |
| Contents | |
| Your Fund’s Performance at a Glance. | 1 |
| CEO’s Perspective. | 2 |
| Advisor’s Report. | 4 |
| Fund Profile. | 7 |
| Performance Summary. | 9 |
| Financial Statements. | 10 |
| About Your Fund’s Expenses. | 23 |
| Trustees Approve Advisory Arrangement. | 25 |
| Glossary. | 27 |
Please note: The opinions expressed in this report are just that—informed opinions. They should not be considered promises or advice. Also, please keep in mind that the information and opinions cover the period through the date on the front of this report. Of course, the risks of investing in your fund are spelled out in the prospectus.
See the Glossary for definitions of investment terms used in this report.
About the cover: Nautical images have been part of Vanguard’s rich heritage since its start in 1975. For an incoming ship, a lighthouse offers a beacon and safe path to shore. You can similarly depend on Vanguard to put you first––and light the way––as you strive to meet your financial goals. Our client focus and low costs, stemming from our unique ownership structure, assure that your interests are paramount.
Your Fund’s Performance at a Glance
• For the six months ended July 31, 2018, Vanguard Health Care Fund returned 2.21% for Investor Shares and 2.24% for Admiral Shares. These results surpassed the return of the fund’s benchmark (+1.54%) and trailed the average return of peer funds (+3.34%).
• The fund’s advisor, Wellington Management Company llp, takes a value-oriented, long-term approach to its management of the portfolio.
• Health care stocks generated higher returns than six of the 11 industry sectors.
The aging population, creation of new and innovative drugs, and increased accessibility to health care worldwide have added to the sector’s attractiveness over the years.
• Pharmaceutical stocks fueled the fund’s outperformance. The advisor’s health care facilities and health care equipment stocks also boosted results, while its biotechnology and health care distributor stocks detracted.
| |
| Total Returns: Six Months Ended July 31, 2018 | |
| | Total |
| | Returns |
| Vanguard Health Care Fund | |
| Investor Shares | 2.21% |
| Admiral™ Shares | 2.24 |
| MSCI All Country World Health Care Index | 1.54 |
| Global Health/Biotechnology Funds Average | 3.34 |
| Global Health/Biotechnology Funds Average: Derived from data provided by Lipper, a Thomson Reuters Company. |
| Admiral Shares carry lower expenses and are available to investors who meet certain account-balance requirements. |
| | | |
| Expense Ratios | | | |
| Your Fund Compared With Its Peer Group | | | |
| | Investor | Admiral | Peer Group |
| | Shares | Shares | Average |
| Health Care Fund | 0.38% | 0.33% | 1.23% |
The fund expense ratios shown are from the prospectus dated May 25, 2018, and represent estimated costs for the current fiscal year. For
the six months ended July 31, 2018, the fund’s annualized expense ratios were 0.34% for Investor Shares and 0.29% for Admiral Shares.
The peer-group expense ratio is derived from data provided by Lipper, a Thomson Reuters Company, and captures information through
year-end 2017.
Peer group: Global Health/Biotechnology Funds.
1
CEO’s Perspective

Tim Buckley
President and Chief Executive Officer
Dear Shareholder,
I feel extremely fortunate to have the chance to lead a company filled with people who come to work every day passionate about Vanguard’s core purpose: to take a stand for all investors, to treat them fairly, and to give them the best chance for investment success.
When I joined Vanguard in 1991, I found a mission-driven team focused on improving lives—helping people retire more comfortably, put their children through college, and achieve financial security. I also found a company with purpose in an industry ripe for improvement.
It was clear, even early in my career, that the cards were stacked against most investors. Hidden fees, performance-chasing, and poor advice were relentlessly eroding investors’ dreams.
We knew Vanguard could be different and, as a result, could make a real difference. We have lowered the costs of investing for our shareholders significantly. And we’re proud of the performance of our funds.
Vanguard is built for Vanguard investors—we focus solely on you, our fund shareholders. Everything we do is designed to give our clients the best chance for investment success. In my role as CEO, I’ll keep this priority
2
front and center. We’re proud of what we’ve achieved, but we’re even more excited about what’s to come.
Steady, time-tested guidance
Our guidance for investors, as always, is to stay the course, tune out the hyperbolic headlines, and focus on your goals and what you can control, such as costs and how much you save. This time-tested advice has served our clients well over the decades.
Regardless of how the markets perform in the short term, I’m incredibly optimistic about the future for our investors. We have a dedicated team serving you, and we will never stop striving to make
Vanguard the best place for you to invest through our high-quality funds and services, advice and guidance to help you meet your financial goals, and an experience that makes you feel good about entrusting us with your hard-earned savings.
Thank you for your continued loyalty.
Sincerely,

Mortimer J. Buckley
President and Chief Executive Officer
August 16, 2018
| | | |
| Market Barometer | |
| | Total Returns |
| | | Periods Ended July 31, 2018 |
| | Six | One | Five Years |
| | Months | Year | (Annualized) |
| Stocks | | | |
| Russell 1000 Index (Large-caps) | 0.86% | 16.19% | 12.96% |
| Russell 2000 Index (Small-caps) | 6.75 | 18.73 | 11.33 |
| Russell 3000 Index (Broad U.S. market) | 1.30 | 16.39 | 12.83 |
| FTSE All-World ex US Index (International) | -6.57 | 6.19 | 5.97 |
| |
| Bonds | | | |
| Bloomberg Barclays U. S. Aggregate Bond Index | | | |
| (Broad taxable market) | -0.45% | -0.80% | 2.25% |
| Bloomberg Barclays Municipal Bond Index | | | |
| (Broad tax-exempt market) | 1.18 | 0.99 | 3.76 |
| FTSE Three-Month U. S. Treasury Bill Index | 0.83 | 1.41 | 0.41 |
| |
| CPI | | | |
| Consumer Price Index | 1.67% | 2.95% | 1.53% |
3
Advisor’s Report
For the six months ended July 31, 2018, Vanguard Health Care Fund returned 2.21% for Investor Shares and 2.24% for Admiral Shares. It outperformed its benchmark, the MSCI All Country World Health Care Index, which returned 1.54%, but trailed the 3.34% average return of global health/ biotechnology funds.
The investment environment
We view the health care sector through a custom lens of subsectors. We combine biotechnology and pharmaceuticals and think of them in terms of capitalization: biopharma small-cap, biopharma mid-cap, and biopharma large-cap. The other subsectors are health care services and medical technology.
Medical technology was the top-performing subsector in the benchmark for the period; biopharma large-caps came in second. Health care services stocks lagged. The biopharma mid-caps subsector was the only one to post negative results. Biopharma small-caps are not meaningfully represented in the benchmark.
Two announcements of interest to health care investors were made during the period. In May, President Trump released a “blueprint” to lower drug prices and reduce out-of-pocket costs for consumers; in June, Amazon announced that it would acquire internet pharmacy PillPack, thus entering the pharmacy business. Both news items are indicative of change in the complex health care industry.
Our successes
Stock selection was strongest in the bio-pharma large-cap and medical technology subsectors. Eisai, in the biopharma large-cap subsector, was the fund’s top relative performer. Shares of Eisai returned over 50% for the period. The Japanese pharmaceuticals company entered into a strategic collaboration with Merck for developing and commercializing its cancer drug Lenvima. It also reported positive Phase 2 data for its investigational antibody for Alzheimer’s disease. Eisai and its partner Biogen now have two positive data sets targeting beta amyloid, increasing our confidence that these antibodies will show disease-modifying benefits in larger studies.
Our avoidance of biopharma large-cap AbbVie also helped performance compared with the benchmark, as the stock returned about –16%. A pipeline setback for the company’s novel cancer drug, along with concerns about how changes to the rebate structure in the United States might affect sales of its main profit contributor Humira, weighed on AbbVie’s stock price.
Another top contributor to the fund’s relative performance was biopharma large-cap Eli Lilly, which returned over 20% for the period. In July, Eli Lilly reported better-than-expected earnings results that were driven by its diabetes franchise, and it announced plans to take a minority stake of its Elanco Animal Health unit public. The positive Alzheimer’s data from Eisai and Biogen also boosted performance, as Eli Lilly has a long history of research and a number of Phase 2 assets in this area.
4
Our shortfalls
Stock selection was weakest in the biopharma mid-cap and health care services subsectors. Our overweight allocation to biopharma mid-cap stocks and our underweight allocation to medical technology stocks detracted from relative results.
The biggest detractor was our position in McKesson, in the health care services subsector, which returned about –25%. Pressure on generic prices, the announcement of President Trump’s blueprint to lower drug prices, and the threat of Amazon entering the industry triggered concerns and subsequent declines in stock prices across the pharmaceutical supply chain, including many drug distributors such as McKesson. Of these developments, a change to branded pharmaceuticals’ list prices would be most problematic, as McKesson would need time to renegotiate its contracts with manufacturers. Although the fundamentals are entering a period of uncertainty, we believe the stock’s valuation significantly discounts many of these risks.
Alnylam Pharmaceuticals, in the biopharma mid-cap subsector, also hindered relative results. In late 2017, its share price surged after the company reported excellent Phase 3 results for its lead small interfering RNA (siRNA) drug patisiran for the treatment of hereditary ATTR amyloidosis, a rare genetic disorder. More recently, the company’s stock price fell sharply on competitive concerns after Pfizer’s TTR amyloid cardiomyopathy study was successful.
We believe Alnylam’s mechanism is far superior and will ultimately win majority market share. As we also remain optimistic about Alnylam’s attractive siRNA platform and long-term outlook, we used the price drop as an opportunity to buy additional shares of the stock.
Biopharma mid-cap holding Incyte was the third-largest relative detractor. In April, the company announced negative results from the Phase 3 trial that tested a combination of its IDO inhibitor epacadostat and Merck’s cancer drug Keytruda. Although this news was disappointing and removes a significant opportunity for value creation, we still believe the stock price does not fully discount Incyte’s currently approved products and continue to hold a position.
The fund’s positioning
At the end of the period, we held about 26% of the fund’s assets in non-U.S. investments, a level that has remained fairly stable over recent years. Our non-U.S. holdings are primarily domiciled in Japan, the United Kingdom, Switzerland, Belgium, and Israel, but many of them operate globally. We believe this strategy provides diversification for shareholders over the long term.
The fund consisted of 87 companies across all subsectors of health care. This figure was up from a year ago, when we held 75 equity names, because we took advantage of valuation opportunities to initiate some new positions, including a number of emerging-market stocks and biopharma mid-cap stocks.
5
The fund is more concentrated than the index: As of July 31, its ten largest holdings represented 42% of its assets, while the benchmark’s ten largest positions represented 35% of the index.
We seek to invest in companies that look to provide solutions to the challenges facing the health care delivery system globally by shifting focus from volumes to value. Over the long term, the tailwinds of innovation, an aging population, and the globalization of demand for cutting-edge, developed-market health care should continue to drive growth. And we believe that we are favorably positioned to capitalize on this.
A core tenet of our investment philosophy is the importance of using a longer-term horizon to evaluate secular themes and health care trends, as well as individual companies, on a global scale. This should enable our team to identify pockets of opportunity in health care that are best positioned to create value and generate sustainable, innovation-driven, differentiated growth. We will remain diversified across subsectors and regions, focused on the long haul, and positioned in what we believe to be the most attractive health care stocks as we seek to generate strong, risk-adjusted returns.
As always, we thank you for your continued confidence and support as an investor in Vanguard Health Care Fund.
Jean M. Hynes, CFA
Senior Managing Director and
Portfolio Manager
Wellington Management Company llp
August 16, 2018
| |
| Notable Portfolio Changes | |
| Six Months Ended July 31, 2018 | |
| |
| Additions | Comments |
| Zimmer Biomet | We purchased a new position in Zimmer Biomet for the fund in |
| | May. Zimmer Biomet is a medical device company with headquarters |
| | in Indiana. We believe the turnaround underway at the company |
| | provides an interesting opportunity at a compelling valuation. |
| Seattle Genetics | We opened a position in Seattle Genetics early in the period. |
| | Seattle Genetics is a mid-cap biopharmaceutical company focused |
| | on developing ADCs (antibody drug conjugates). The company’s |
| | first drug for treating Hodgkin’s disease is rapidly expanding. |
| |
| Eliminations | Comments |
| Stryker | We eliminated our holding in Stryker in early May and recycled |
| | the proceeds into Zimmer Biomet, the medical device company |
| | noted above. |
| Envision Healthcare | We eliminated our position in Envision Healthcare as the |
| | company agreed to be acquired by private equity firm KKR. |
6
Health Care Fund
Fund Profile
As of July 31, 2018
| | |
| Share-Class Characteristics | |
| | Investor | Admiral |
| | Shares | Shares |
| Ticker Symbol | VGHCX | VGHAX |
| Expense Ratio1 | 0.38% | 0.33% |
| 30-Day SEC Yield | 1.14% | 1.19% |
| | | |
| Portfolio Characteristics | | |
| | | MSCI | DJ |
| | | ACWI | U.S. Total |
| | | Health | Market |
| | Fund | Care | FA Index |
| Number of Stocks | 88 | 203 | 3,766 |
| Median Market Cap | $61.6B | $94.4B | $67.4B |
| Price/Earnings Ratio | 28.5x | 26.4x | 20.5x |
| Price/Book Ratio | 3.4x | 3.9x | 3.1x |
| Return on Equity | 12.6% | 15.7% | 15.0% |
| Earnings Growth Rate | 6.2% | 4.3% | 8.5% |
| Dividend Yield | 1.4% | 1.8% | 1.7% |
| Foreign Holdings | 25.7% | 33.0% | 0.0% |
| Turnover Rate | | | |
| (Annualized) | 11% | — | — |
| Short-Term Reserves | 2.5% | — | — |
| | |
| Volatility Measures | | |
| | MSCI | DJ |
| | ACWI | U.S. Total |
| | Health | Market |
| | Care | FA Index |
| R-Squared | 0.91 | 0.63 |
| Beta | 1.01 | 1.00 |
| These measures show the degree and timing of the fund’s |
| fluctuations compared with the indexes over 36 months. |
| | |
| Ten Largest Holdings (% of total net assets) |
| Bristol-Myers Squibb Co. Pharmaceuticals | 6.2% |
| UnitedHealth Group Inc. | Managed Health | |
| | Care | 5.9 |
| AstraZeneca plc | Pharmaceuticals | 5.6 |
| Allergan plc | Pharmaceuticals | 5.3 |
| Eli Lilly & Co. | Pharmaceuticals | 5.0 |
| Merck & Co. Inc. | Pharmaceuticals | 3.2 |
| Eisai Co. Ltd. | Pharmaceuticals | 3.1 |
| Medtronic plc | Health Care | |
| | Equipment | 2.7 |
| Vertex Pharmaceuticals | | |
| Inc. | Biotechnology | 2.6 |
| Biogen Inc. | Biotechnology | 2.6 |
| Top Ten | | 42.2% |
| The holdings listed exclude any temporary cash investments and equity index products. |
1 The expense ratios shown are from the prospectus dated May 25, 2018, and represent estimated costs for the current fiscal year. For the six
months ended July 31, 2018, the annualized expense ratios were 0.34% for Investor Shares and 0.29% for Admiral Shares.
7
Health Care Fund
| | |
| Subindustry Diversification (% of equity | |
| exposure) | | |
| | | MSCI |
| | | ACWI |
| | | Health |
| | Fund | Care |
| Biotechnology | 14.8% | 15.9% |
| Consumer Staples | 1.2 | 0.0 |
| Health Care Distributors | 2.6 | 1.7 |
| Health Care Equipment | 12.2 | 16.2 |
| Health Care Facilities | 3.7 | 1.5 |
| Health Care Services | 0.6 | 4.0 |
| Health Care Supplies | 0.7 | 2.4 |
| Health Care Technology | 2.4 | 0.7 |
| Life Sciences Tools & Services | 3.1 | 5.0 |
| Managed Health Care | 11.0 | 9.1 |
| Pharmaceuticals | 47.4 | 43.5 |
| Real Estate | 0.3 | 0.0 |
Sector categories are based on the Global Industry Classification
Standard (“GICS”), except for the “Other” category (if applicable),
which includes securities that have not been provided a GICS
classification as of the effective reporting period.
| |
| Market Diversification (% of equity exposure) |
| |
| Emerging Markets | 0.4% |
| Europe | |
| United Kingdom | 6.5% |
| Switzerland | 4.1 |
| Belgium | 2.3 |
| Other | 2.2 |
| Subtotal | 15.1% |
| Middle East | |
| Israel | 1.0% |
| North America | |
| United States | 73.5% |
| Pacific | |
| Japan | 10.0% |
8
Health Care Fund
Performance Summary
All of the returns in this report represent past performance, which is not a guarantee of future results that may be achieved by the fund. (Current performance may be lower or higher than the performance data cited. For performance data current to the most recent month-end, visit our website at vanguard.com/performance.) Note, too, that both investment returns and principal value can fluctuate widely, so an investor’s shares, when sold, could be worth more or less than their original cost. The returns shown do not reflect taxes that a shareholder would pay on fund distributions or on the sale of fund shares.
Fiscal-Year Total Returns (%): January 31, 2008, Through July 31, 2018
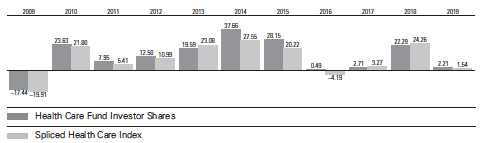
For a benchmark description, see the Glossary.
Note: For 2019, performance data reflect the six months ended July 31, 2018.
Average Annual Total Returns: Periods Ended June 30, 2018
This table presents returns through the latest calendar quarter—rather than through the end of the fiscal period.
Securities and Exchange Commission rules require that we provide this information.
| | | | |
| | Inception | One | Five | Ten |
| | Date | Year | Years | Years |
| Investor Shares | 5/23/1984 | 2.27% | 13.60% | 12.90% |
| Admiral Shares | 11/12/2001 | 2.32 | 13.66 | 12.96 |
See Financial Highlights for dividend and capital gains information.
9
Health Care Fund
Financial Statements (unaudited)
Statement of Net Assets
As of July 31, 2018
The fund reports a complete list of its holdings in regulatory filings four times in each fiscal year, at the quarter-ends. For the second and fourth fiscal quarters, the lists appear in the fund’s semiannual and annual reports to shareholders. For the first and third fiscal quarters, the fund files the lists with the Securities and Exchange Commission on Form N-Q. Shareholders can look up the fund’s Forms N-Q on the SEC’s website at sec.gov. Forms N-Q may also be reviewed and copied at the SEC’s Public Reference Room (see the back cover of this report for further information).
| | | |
| | | | Market |
| | | | Value• |
| | | Shares | ($000) |
| Common Stocks (97.3%) | | |
| United States (71.6%) | | |
| Biotechnology (13.6%) | | |
| * | Vertex Pharmaceuticals | | |
| | Inc. | 7,065,717 | 1,236,854 |
| * | Biogen Inc. | 3,695,803 | 1,235,766 |
| * | Regeneron | | |
| | Pharmaceuticals Inc. | 3,110,825 | 1,144,815 |
| *,1 | Alnylam | | |
| | Pharmaceuticals Inc. | 7,782,825 | 739,368 |
| *,1 | Incyte Corp. | 10,657,473 | 709,148 |
| *,1 | Alkermes plc | 8,990,310 | 394,225 |
| *,1 | Agios Pharmaceuticals | | |
| | Inc. | 4,233,424 | 365,810 |
| * | Seattle Genetics Inc. | 1,911,900 | 134,598 |
| * | Bluebird Bio Inc. | 736,078 | 114,019 |
| *,^,1 TESARO Inc. | 3,099,228 | 107,946 |
| * | Portola | | |
| | Pharmaceuticals Inc. | 2,913,937 | 104,319 |
| * | Ionis Pharmaceuticals | | |
| | Inc. | 2,119,180 | 92,566 |
| * | Ironwood | | |
| | Pharmaceuticals Inc. | | |
| | Class A | 4,594,407 | 88,580 |
| *,1 | Prothena Corp. plc | 2,150,294 | 31,953 |
| *,^ | BeiGene Ltd. ADR | 167,565 | 31,780 |
| | | | 6,531,747 |
| Equity Real Estate | | |
| Investment Trusts (REITs) (0.3%) | |
| | Alexandria Real Estate | | |
| | Equities Inc. | 1,162,300 | 148,124 |
| |
| Food & Staples Retailing (1.1%) | |
| | Walgreens Boots | | |
| | Alliance Inc. | 8,048,160 | 544,217 |
| | | |
| Health Care Equipment & Supplies (10.5%) |
| | Medtronic plc | 14,194,784 | 1,280,795 |
| * | Boston Scientific Corp. | 33,657,814 | 1,131,239 |
| | Abbott Laboratories | 16,532,781 | 1,083,559 |
| | Baxter International Inc. | 5,949,791 | 431,062 |
| | Danaher Corp. | 3,798,100 | 389,609 |
| | Zimmer Biomet | | |
| | Holdings Inc. | 2,447,976 | 307,270 |
| * | Hologic Inc. | 4,927,800 | 211,452 |
| * | DexCom Inc. | 1,121,800 | 106,717 |
| | Hill-Rom Holdings Inc. | 504,300 | 47,505 |
| * | Insulet Corp. | 289,600 | 24,083 |
| | | | 5,013,291 |
| Health Care Providers & Services (17.4%) |
| | UnitedHealth Group Inc. | 11,097,236 | 2,810,042 |
| | HCA Healthcare Inc. | 7,616,445 | 946,191 |
| | McKesson Corp. | 6,985,304 | 877,354 |
| | Aetna Inc. | 4,051,023 | 763,172 |
| | Cigna Corp. | 3,236,989 | 580,781 |
| | Universal Health | | |
| | Services Inc. Class B | 4,593,600 | 560,879 |
| | Anthem Inc. | 1,973,833 | 499,380 |
| | Cardinal Health Inc. | 6,818,446 | 340,581 |
| | CVS Health Corp. | 4,518,118 | 293,045 |
| * | WellCare Health Plans | | |
| | Inc. | 1,061,400 | 283,840 |
| * | Acadia Healthcare Co. Inc. | 4,337,455 | 171,243 |
| * | Centene Corp. | 826,300 | 107,692 |
| | Humana Inc. | 215,600 | 67,737 |
| * | LifePoint Health Inc. | 341,100 | 22,103 |
| * | Community Health | | |
| | Systems Inc. CVR | 18,834,700 | 508 |
| | | | 8,324,548 |
| Health Care Technology (2.3%) | |
| * | Cerner Corp. | 11,367,617 | 705,701 |
| * | athenahealth Inc. | 1,824,411 | 274,957 |
| *,1 | Allscripts Healthcare | | |
| | Solutions Inc. | 9,423,593 | 115,345 |
| | | | 1,096,003 |
10
Health Care Fund
| | | |
| | | | Market |
| | | | Value• |
| | | Shares | ($000) |
| Life Sciences Tools & Services (3.0%) | |
| | Thermo Fisher | | |
| | Scientific Inc. | 3,317,665 | 778,092 |
| * | Illumina Inc. | 958,988 | 311,057 |
| * | IQVIA Holdings Inc. | 1,602,521 | 195,411 |
| | Agilent Technologies | | |
| | Inc. | 1,079,050 | 71,261 |
| * | PRA Health Sciences | | |
| | Inc. | 601,636 | 63,256 |
| * | Syneos Health Inc. | 475,600 | 23,435 |
| | | | 1,442,512 |
| Pharmaceuticals (23.4%) | | |
| | Bristol-Myers Squibb | | |
| | Co. | 50,296,561 | 2,954,923 |
| | Allergan plc | 13,878,301 | 2,554,856 |
| | Eli Lilly & Co. | 24,222,715 | 2,393,447 |
| | Merck & Co. Inc. | 23,026,644 | 1,516,765 |
| *,1 | Mylan NV | 30,606,342 | 1,141,923 |
| * | Nektar Therapeutics | | |
| | Class A | 5,722,913 | 301,025 |
| *,1 | Medicines Co. | 5,564,220 | 221,066 |
| * | Amneal | | |
| | Pharmaceuticals Inc. | 6,002,440 | 115,067 |
| | | | 11,199,072 |
| Total United States | | 34,299,514 |
| International (25.7%) | | |
| Belgium (2.2%) | | |
| 1 | UCB SA | 11,840,914 | 1,018,026 |
| * | Galapagos NV | 538,775 | 59,282 |
| | | | 1,077,308 |
| China (0.3%) | | |
| | Shanghai Fosun | | |
| | Pharmaceutical | | |
| | Group Co. Ltd. | 14,799,500 | 70,795 |
| *,2 | Ping An Healthcare and | | |
| | Technology Co. Ltd. | 6,301,800 | 38,418 |
| | Sino Biopharmaceutical | | |
| | Ltd. | 26,203,500 | 35,889 |
| | | | 145,102 |
| Denmark (0.9%) | | |
| * | Genmab A/S | 1,737,968 | 297,778 |
| | H Lundbeck A/S | 1,544,589 | 111,783 |
| | | | 409,561 |
| France (0.7%) | | |
| | Essilor International | | |
| | Cie Generale | | |
| | d’Optique SA | 2,204,229 | 324,827 |
| |
| Ireland (0.0%) | | |
| * | ICON plc | 170,300 | 23,699 |
| | |
| Israel (1.0%) | | |
| Teva Pharmaceutical | | |
| Industries Ltd. ADR | 19,274,601 | 461,434 |
| |
| Japan (9.7%) | | |
| 1 Eisai Co. Ltd. | 17,295,025 | 1,488,967 |
| Chugai Pharmaceutical | | |
| Co. Ltd. | 15,610,000 | 794,013 |
| Shionogi & Co. Ltd. | 10,746,654 | 586,580 |
| Ono Pharmaceutical | | |
| Co. Ltd. | 19,628,460 | 463,806 |
| Astellas Pharma Inc. | 26,798,900 | 437,114 |
| Takeda Pharmaceutical | | |
| Co. Ltd. | 10,010,100 | 422,656 |
| Sysmex Corp. | 1,716,700 | 162,788 |
| Kyowa Hakko Kirin Co. | | |
| Ltd. | 5,952,900 | 113,107 |
| Terumo Corp. | 1,799,300 | 98,847 |
| Nippon Shinyaku Co. | | |
| Ltd. | 1,471,200 | 83,742 |
| | | 4,651,620 |
| Netherlands (0.5%) | | |
| Koninklijke Philips NV | 5,282,827 | 231,915 |
| |
| South Africa (0.1%) | | |
| Aspen Pharmacare | | |
| Holdings Ltd. | 2,091,304 | 40,512 |
| |
| Switzerland (4.0%) | | |
| Novartis AG | 14,137,118 | 1,186,412 |
| Roche Holding AG | 2,433,237 | 597,716 |
| Roche Holding AG | | |
| (Bearer) | 376,066 | 93,178 |
| * Idorsia Ltd. | 809,587 | 20,094 |
| | | 1,897,400 |
| United Kingdom (6.3%) | | |
| AstraZeneca plc | 34,968,855 | 2,691,793 |
| Smith & Nephew plc | 10,138,968 | 175,548 |
| Hikma Pharmaceuticals | | |
| plc | 7,939,027 | 170,840 |
| | | 3,038,181 |
| Total International | | 12,301,559 |
| Total Common Stocks | | |
| (Cost $27,450,098) | | 46,601,073 |
| Temporary Cash Investments (2.5%) | |
| Money Market Fund (0.0%) | |
| 3,4 Vanguard Market | | |
| Liquidity Fund, 2.145% | 225,080 | 22,508 |
11
Health Care Fund
| | |
| | Face | Market |
| | Amount | Value • |
| | ($000) | ($000) |
| Repurchase Agreements (2.3%) | |
| Wells Fargo & Co. | | |
| 1.930%, 8/1/18 (Dated | | |
| 7/31/18, Repurchase | | |
| Value $295,616,000, | | |
| collateralized by | | |
| Federal National | | |
| Mortgage Assn. | | |
| 0.000%–4.500%, | | |
| 11/1/31–8/1/48, | | |
| Federal Home Loan | | |
| Mortgage Corp. | | |
| 2.500%–3.500%, | | |
| 2/1/32–4/1/48, with a | | |
| value of $301,512,000) | 295,600 | 295,600 |
| Barclays Capital Inc. | | |
| 1.900%, 8/1/18 (Dated | | |
| 7/31/18, Repurchase | | |
| Value $250,613,000, | | |
| collateralized by | | |
| U.S. Treasury Note/ | | |
| Bond 0.000%–3.750%, | | |
| 9/13/18–5/15/47, with a | | |
| value of $255,612,000) | 250,600 | 250,600 |
| Bank of Nova Scotia | | |
| 1.900%, 8/1/18 (Dated | | |
| 7/31/18, Repurchase | | |
| Value $240,113,000, | | |
| collateralized by | | |
| U.S. Treasury Note/ | | |
| Bond 1.125%–3.750%, | | |
| 11/15/18–8/15/43, | | |
| with a value of | | |
| $244,915,000) | 240,100 | 240,100 |
| BNP Paribas Securities | | |
| Corp. 1.920%, 8/1/18 | | |
| (Dated 7/31/18, | | |
| Repurchase Value | | |
| $150,708,000, | | |
| collateralized by | | |
| U.S. Treasury Note/ | | |
| Bond 1.375%–8.000%, | | |
| 7/31/19–11/15/21, | | |
| Government National | | |
| Mortgage Assn. | | |
| 2.500%–5.000%, | | |
| 6/20/41– 6/20/48, | | |
| Federal National | | |
| Mortgage Assn. | | |
| 3.122%–4.500%, | | |
| 10/1/19–5/1/48, Federal | | |
| Home Loan Mortgage | | |
| Corp. 3.566%– 6.000%, | | |
| 8/1/30–10/1/44, with a | | |
| value of $153,714,000) | 150,700 | 150,700 |
| | |
| HSBC Bank USA 1.910%, | | |
| 8/1/18 (Dated 7/31/18, | | |
| Repurchase Value | | |
| $63,403,000, | | |
| collateralized by | | |
| Federal National | | |
| Mortgage Assn. | | |
| 3.000%– 6.000%, | | |
| 12/1/22–10/1/47, | | |
| Federal Home Loan | | |
| Mortgage Corp. | | |
| 3.500%–4.500%, | | |
| 3/1/47–11/1/47, with a | | |
| value of $64,668,000) | 63,400 | 63,400 |
| Bank of America | | |
| Securities, LLC | | |
| 1.930%, 8/1/18 | | |
| (Dated 7/31/18, | | |
| Repurchase Value | | |
| $33,702,000, | | |
| collateralized by | | |
| Federal National | | |
| Mortgage Assn. | | |
| 3.500%, 8/1/47, | | |
| with a value of | | |
| $34,374,000) | 33,700 | 33,700 |
| RBC Capital Markets | | |
| LLC 1.900%, 8/1/18 | | |
| (Dated 7/31/18, | | |
| Repurchase Value | | |
| $25,001,000, | | |
| collateralized by | | |
| Federal National | | |
| Mortgage Assn. | | |
| 2.710%–4.000%, | | |
| 10/1/20– 6/1/48, | | |
| Federal Home Loan | | |
| Mortgage Corp. | | |
| 5.500%, 2/1/27, with a | | |
| value of $25,500,000) | 25,000 | 25,000 |
| Nomura International | | |
| PLC 1.910%, 8/1/18 | | |
| (Dated 7/31/18, | | |
| Repurchase Value | | |
| $25,001,000, | | |
| collateralized by | | |
| U.S. Treasury Note/ | | |
| Bond 2.250%, | | |
| 8/15/46, with a | | |
| value of $25,500,000) | 25,000 | 25,000 |
| | | 1,084,100 |
12
Health Care Fund
| | |
| | Face | Market |
| | Amount | Value • |
| | ($000) | ($000) |
| Commercial Paper (0.2%) | | |
| 5 Apple Inc., 2.058%, | | |
| 10/4/18 | 95,500 | 95,131 |
| Total Temporary Cash Investments | |
| (Cost $1,201,761) | | 1,201,739 |
| Total Investments (99.8%) | |
| (Cost $28,651,859) | | 47,802,812 |
| Other Assets and Liabilities (0.2%) | |
| Other Assets 4 | | 268,202 |
| Liabilities 4 | | (163,689) |
| | | 104,513 |
| Net Assets (100%) | | 47,907,325 |
| |
| | | Amount |
| | | ($000) |
| Statement of Assets and Liabilities | |
| Assets | | |
| Investments in Securities, at Value | |
| Unaffiliated Issuers | | 41,446,527 |
| Affiliated Issuers | | 6,356,285 |
| Total Investments in Securities | 47,802,812 |
| Investment in Vanguard | | 2,405 |
| Receivables for Investment | | |
| Securities Sold | | 153,738 |
| Receivables for Accrued Income | 77,262 |
| Receivables for Capital Shares Issued | 34,757 |
| Other Assets | | 40 |
| Total Assets | | 48,071,014 |
| Liabilities | | |
| Payables for Investment | | |
| Securities Purchased | | 25,609 |
| Collateral for Securities on Loan | 22,513 |
| Payables to Investment Advisor | 17,691 |
| Payables for Capital Shares Redeemed | 55,078 |
| Payables to Vanguard | | 42,735 |
| Other Liabilities | | 63 |
| Total Liabilities | | 163,689 |
| Net Assets | | 47,907,325 |
| |
| At July 31, 2018, net assets consisted of: |
| | Amount |
| | ($000) |
| Paid-in Capital | 27,351,444 |
| Undistributed Net Investment Income | 192,444 |
| Accumulated Net Realized Gains | 1,212,661 |
| Unrealized Appreciation (Depreciation) | |
| Investment Securities | 19,150,953 |
| Foreign Currencies | (177) |
| Net Assets | 47,907,325 |
| |
| |
| Investor Shares—Net Assets | |
| Applicable to 43,833,206 outstanding | |
| $.001 par value shares of beneficial | |
| interest (unlimited authorization) | 9,435,116 |
| Net Asset Value Per Share— | |
| Investor Shares | $215.25 |
| |
| |
| Admiral Shares—Net Assets | |
| Applicable to 423,752,945 outstanding |
| $.001 par value shares of beneficial | |
| interest (unlimited authorization) | 38,472,209 |
| Net Asset Value Per Share— | |
| Admiral Shares | $90.79 |
• See Note A in Notes to Financial Statements.
* Non-income-producing security.
^ Includes partial security positions on loan to broker-dealers.
The total value of securities on loan is $22,340,000.
1 Considered an affiliated company of the fund as the fund
owns more than 5% of the outstanding voting securities of
such company.
2 Security exempt from registration under Rule 144A of the
Securities Act of 1933. Such securities may be sold in
transactions exempt from registration, normally to qualified
institutional buyers. At July 31, 2018, the value of this security
represented 0.1% of net assets.
3 Affiliated money market fund available only to Vanguard
funds and certain trusts and accounts managed by Vanguard.
Rate shown is the 7-day yield.
4 Includes $22,513,000 of collateral received for securities
on loan, of which $22,508,000 is held in Vanguard Market
Liquidity Fund and $5,000 is held in cash.
5 Security exempt from registration under Section 4(2) of
the Securities Act of 1933. Such securities may be sold in
transactions exempt from registration only to dealers in that
program or other “accredited investors.” At July 31, 2018,
the aggregate value of these securities was $95,131,000,
representing 0.2% of net assets.
ADR—American Depositary Receipt.
CVR—Contingent Value Rights.
See accompanying Notes, which are an integral part of the Financial Statements.
13
Health Care Fund
Statement of Operations
| |
| | Six Months Ended |
| | July 31, 2018 |
| | ($000) |
| Investment Income | |
| Income | |
| Dividends—Unaffiliated Issuers1 | 364,517 |
| Dividends—Affiliated Issuers 2 | 25,502 |
| Interest | 11,067 |
| Securities Lending—Net | 829 |
| Total Income | 401,915 |
| Expenses | |
| Investment Advisory Fees—Note B | |
| Basic Fee | 33,253 |
| Performance Adjustment | 1,485 |
| The Vanguard Group—Note C | |
| Management and Administrative—Investor Shares | 7,864 |
| Management and Administrative—Admiral Shares | 24,782 |
| Marketing and Distribution—Investor Shares | 548 |
| Marketing and Distribution—Admiral Shares | 607 |
| Custodian Fees | 332 |
| Shareholders’ Reports—Investor Shares | 94 |
| Shareholders’ Reports—Admiral Shares | 59 |
| Trustees’ Fees and Expenses | 34 |
| Total Expenses | 69,058 |
| Net Investment Income | 332,857 |
| Realized Net Gain (Loss) | |
| Investment Securities Sold—Unaffiliated Issuers | 1,228,625 |
| Investment Securities Sold—Affiliated Issuers | (346) |
| Foreign Currencies | (1,364) |
| Realized Net Gain (Loss) | 1,226,915 |
| Change in Unrealized Appreciation (Depreciation) | |
| Investment Securities—Unaffiliated Issuers | (285,163) |
| Investment Securities—Affiliated Issuers | (308,098) |
| Foreign Currencies | (2,547) |
| Change in Unrealized Appreciation (Depreciation) | (595,808) |
| Net Increase (Decrease) in Net Assets Resulting from Operations | 963,964 |
| 1 Dividends are net of foreign withholding taxes of $12,631,000. |
| 2 Dividends are net of foreign withholding taxes of $6,175,000. |
See accompanying Notes, which are an integral part of the Financial Statements.
14
Health Care Fund
Statement of Changes in Net Assets
| | |
| | Six Months Ended | Year Ended |
| | July 31, | January 31, |
| | 2018 | 2018 |
| | ($000) | ($000) |
| Increase (Decrease) in Net Assets | | |
| Operations | | |
| Net Investment Income | 332,857 | 501,758 |
| Realized Net Gain (Loss) | 1,226,915 | 2,847,555 |
| Change in Unrealized Appreciation (Depreciation) | (595,808) | 6,035,767 |
| Net Increase (Decrease) in Net Assets Resulting from Operations | 963,964 | 9,385,080 |
| Distributions | | |
| Net Investment Income | | |
| Investor Shares | (6,264) | (91,668) |
| Admiral Shares | (30,140) | (384,798) |
| Realized Capital Gain1 | | |
| Investor Shares | (223,620) | (606,232) |
| Admiral Shares | (891,590) | (2,282,680) |
| Total Distributions | (1,151,614) | (3,365,378) |
| Capital Share Transactions | | |
| Investor Shares | (372,041) | (1,099,749) |
| Admiral Shares | (599,806) | 795,332 |
| Net Increase (Decrease) from Capital Share Transactions | (971,847) | (304,417) |
| Total Increase (Decrease) | (1,159,497) | 5,715,285 |
| Net Assets | | |
| Beginning of Period | 49,066,822 | 43,351,537 |
| End of Period2 | 47,907,325 | 49,066,822 |
| 1 Includes fiscal 2019 and 2018 short-term gain distributions totaling $76,120,000 and $271,874,000, respectively. Short-term gain |
| distributions are treated as ordinary income dividends for tax purposes. |
| 2 Net Assets—End of Period includes undistributed (overdistributed) net investment income of $192,444,000 and ($102,645,000). |
See accompanying Notes, which are an integral part of the Financial Statements.
15
Health Care Fund
Financial Highlights
| | | | | | |
| Investor Shares | | | | | | |
| Six Months | | | | | |
| | Ended | | | | | |
| For a Share Outstanding | July 31, | Year Ended January 31, |
| Throughout Each Period | 2018 | 2018 | 2017 | 2016 | 2015 | 2014 |
| Net Asset Value, Beginning of Period | $215.96 | $189.88 | $200.67 | $216.14 | $191.63 | $152.58 |
| Investment Operations | | | | | | |
| Net Investment Income | 1.4371 | 2.1621 | 2.039 | 1.934 | 2.941 | 2.350 |
| Net Realized and Unrealized Gain (Loss) | | | | | | |
| on Investments | 2.973 | 38.929 | 2.951 | .566 | 49.127 | 53.058 |
| Total from Investment Operations | 4.410 | 41.091 | 4.990 | 2.500 | 52.068 | 55.408 |
| Distributions | | | | | | |
| Dividends from Net Investment Income | (.140) | (2.059) | (1.854) | (2.611) | (2.115) | (2.357) |
| Distributions from Realized Capital Gains | (4.980) | (12.952) | (13.926) | (15.359) | (25.443) | (14.001) |
| Total Distributions | (5.120) | (15.011) | (15.780) | (17.970) | (27.558) | (16.358) |
| Net Asset Value, End of Period | $215.25 | $215.96 | $189.88 | $200.67 | $216.14 | $191.63 |
| |
| Total Return2 | 2.21% | 22.29% | 2.71% | 0.49% | 28.15% | 37.66% |
| |
| Ratios/Supplemental Data | | | | | | |
| Net Assets, End of Period (Millions) | $9,435 | $9,853 | $9,636 | $10,916 | $11,660 | $9,905 |
| Ratio of Total Expenses to | | | | | | |
| Average Net Assets3 | 0.34% | 0.38% | 0.37% | 0.36% | 0.34% | 0.35% |
| Ratio of Net Investment Income to | | | | | | |
| Average Net Assets | 1.42% | 1.02% | 0.98% | 0.84% | 1.44% | 1.33% |
| Portfolio Turnover Rate | 11% | 11% | 12% | 18% | 20% | 21% |
The expense ratio, net investment income ratio, and turnover rate for the current period have been annualized.
1 Calculated based on average shares outstanding.
2 Total returns do not include account service fees that may have applied in the periods shown. Fund prospectuses provide
information about any applicable account service fees.
3 Includes performance-based investment advisory fee increases (decreases) of 0.01% for the period ended July 31, 2018, 0.04%
for fiscal 2018, 0.04% for fiscal 2017, and 0.02% for fiscal 2016. Performance-based investment advisory fees did not apply before
fiscal 2016.
See accompanying Notes, which are an integral part of the Financial Statements.
16
Health Care Fund
Financial Highlights
| | | | | | |
| Admiral Shares | | | | | | |
| Six Months | | | | | |
| | Ended | | | | | |
| For a Share Outstanding | July 31, | Year Ended January 31, |
| Throughout Each Period | 2018 | 2018 | 2017 | 2016 | 2015 | 2014 |
| Net Asset Value, Beginning of Period | $91.08 | $80.09 | $84.64 | $91.17 | $80.84 | $64.37 |
| Investment Operations | | | | | | |
| Net Investment Income | . 6261 | .9381 | .908 | .868 | 1.290 | 1.040 |
| Net Realized and Unrealized Gain (Loss) | | | | | | |
| on Investments | 1.255 | 16.436 | 1.244 | .236 | 20.715 | 22.378 |
| Total from Investment Operations | 1.881 | 17.374 | 2.152 | 1.104 | 22.005 | 23.418 |
| Distributions | | | | | | |
| Dividends from Net Investment Income | (.071) | (.920) | (.828) | (1.155) | (.942) | (1.042) |
| Distributions from Realized Capital Gains | (2.100) | (5.464) | (5.874) | (6.479) | (10.733) | (5.906) |
| Total Distributions | (2.171) | (6.384) | (6.702) | (7.634) | (11.675) | (6.948) |
| Net Asset Value, End of Period | $90.79 | $91.08 | $80.09 | $84.64 | $91.17 | $80.84 |
| |
| Total Return2 | 2.24% | 22.35% | 2.76% | 0.54% | 28.20% | 37.74% |
| |
| Ratios/Supplemental Data | | | | | | |
| Net Assets, End of Period (Millions) | $38,472 | $39,214 | $33,715 | $36,606 | $34,371 | $24,821 |
| Ratio of Total Expenses to | | | | | | |
| Average Net Assets3 | 0.29% | 0.33% | 0.32% | 0.31% | 0.29% | 0.30% |
| Ratio of Net Investment Income to | | | | | | |
| Average Net Assets | 1.47% | 1.07% | 1.03% | 0.89% | 1.49% | 1.38% |
| Portfolio Turnover Rate | 11% | 11% | 12% | 18% | 20% | 21% |
The expense ratio, net investment income ratio, and turnover rate for the current period have been annualized.
1 Calculated based on average shares outstanding.
2 Total returns do not include account service fees that may have applied in the periods shown. Fund prospectuses provide
information about any applicable account service fees.
3 Includes performance-based investment advisory fee increases (decreases) of 0.01% for the period ended July 31, 2018, 0.04%
for fiscal 2018, 0.04% for fiscal 2017, and 0.02% for fiscal 2016. Performance-based investment advisory fees did not apply before
fiscal 2016.
See accompanying Notes, which are an integral part of the Financial Statements.
17
Health Care Fund
Notes to Financial Statements
Vanguard Health Care Fund is registered under the Investment Company Act of 1940 as an open-end investment company, or mutual fund. The fund invests in securities of foreign issuers, which may subject it to investment risks not normally associated with investing in securities of U.S. corporations. The fund offers two classes of shares: Investor Shares and Admiral Shares. Investor Shares are available to any investor who meets the fund’s minimum purchase requirements. Admiral Shares are designed for investors who meet certain administrative, service, and account-size criteria.
A. The following significant accounting policies conform to generally accepted accounting principles for U.S. investment companies. The fund consistently follows such policies in preparing its financial statements.
1. Security Valuation: Securities are valued as of the close of trading on the New York Stock Exchange (generally 4 p.m., Eastern time) on the valuation date. Equity securities are valued at the latest quoted sales prices or official closing prices taken from the primary market in which each security trades; such securities not traded on the valuation date are valued at the mean of the latest quoted bid and asked prices. Securities for which market quotations are not readily available, or whose values have been affected by events occurring before the fund’s pricing time but after the close of the securities’ primary markets, are valued at their fair values calculated according to procedures adopted by the board of trustees. These procedures include obtaining quotations from an independent pricing service, monitoring news to identify significant market- or security-specific events, and evaluating changes in the values of foreign market proxies (for example, ADRs, futures contracts, or exchange-traded funds), between the time the foreign markets close and the fund’s pricing time. When fair-value pricing is employed, the prices of securities used by a fund to calculate its net asset value may differ from quoted or published prices for the same securities. Investments in Vanguard Market Liquidity Fund are valued at that fund’s net asset value. Temporary cash investments are valued using the latest bid prices or using valuations based on a matrix system (which considers such factors as security prices, yields, maturities, and ratings), both as furnished by independent pricing services.
2. Foreign Currency: Securities and other assets and liabilities denominated in foreign currencies are translated into U.S. dollars using exchange rates obtained from an independent third party as of the fund’s pricing time on the valuation date. Realized gains (losses) and unrealized appreciation (depreciation) on investment securities include the effects of changes in exchange rates since the securities were purchased, combined with the effects of changes in security prices. Fluctuations in the value of other assets and liabilities resulting from changes in exchange rates are recorded as unrealized foreign currency gains (losses) until the assets or liabilities are settled in cash, at which time they are recorded as realized foreign currency gains (losses).
3. Repurchase Agreements: The fund enters into repurchase agreements with institutional counter-parties. Securities pledged as collateral to the fund under repurchase agreements are held by a custodian bank until the agreements mature, and in the absence of a default, such collateral cannot be repledged, resold, or rehypothecated. Each agreement requires that the market value of the collateral be sufficient to cover payments of interest and principal. The fund further mitigates its counterparty risk by entering into repurchase agreements only with a diverse group of prequalified counterparties, monitoring their financial strength, and entering into master repurchase agreements with its counterparties. The master repurchase agreements provide that, in the event of a counter-party’s default (including bankruptcy), the fund may terminate any repurchase agreements with that counterparty, determine the net amount owed, and sell or retain the collateral up to the net amount owed to the fund. Such action may be subject to legal proceedings, which may delay or limit the disposition of collateral.
18
Health Care Fund
4. Federal Income Taxes: The fund intends to continue to qualify as a regulated investment company and distribute all of its taxable income. Management has analyzed the fund’s tax positions taken for all open federal income tax years (January 31, 2015–2018), and for the period ended July 31, 2018, and has concluded that no provision for federal income tax is required in the fund’s financial statements. 5. Distributions: Distributions to shareholders are recorded on the ex-dividend date.
6. Securities Lending: To earn additional income, the fund lends its securities to qualified institutional borrowers. Security loans are subject to termination by the fund at any time, and are required to be secured at all times by collateral in an amount at least equal to the market value of securities loaned. Daily market fluctuations could cause the value of loaned securities to be more or less than the value of the collateral received. When this occurs, the collateral is adjusted and settled before the opening of the market on the next business day. The fund further mitigates its counterparty risk by entering into securities lending transactions only with a diverse group of prequalified counterparties, monitoring their financial strength, and entering into master securities lending agreements with its counterparties. The master securities lending agreements provide that, in the event of a counterparty’s default (including bankruptcy), the fund may terminate any loans with that borrower, determine the net amount owed, and sell or retain the collateral up to the net amount owed to the fund; however, such actions may be subject to legal proceedings. While collateral mitigates counterparty risk, in the event of a default, the fund may experience delays and costs in recovering the securities loaned. The fund invests cash collateral received in Vanguard Market Liquidity Fund, and records a liability in the Statement of Assets and Liabilities for the return of the collateral, during the period the securities are on loan. Securities lending income represents fees charged to borrowers plus income earned on invested cash collateral, less expenses associated with the loan. During the term of the loan, the fund is entitled to all distributions made on or in respect of the loaned securities.
7. Credit Facility: The fund and certain other funds managed by The Vanguard Group (“Vanguard”) participate in a $3.1 billion committed credit facility provided by a syndicate of lenders pursuant to a credit agreement that may be renewed annually; each fund is individually liable for its borrowings, if any, under the credit facility. Borrowings may be utilized for temporary and emergency purposes, and are subject to the fund’s regulatory and contractual borrowing restrictions. The participating funds are charged administrative fees and an annual commitment fee of 0.10% of the undrawn amount of the facility; these fees are allocated to the funds based on a method approved by the fund’s board of trustees and included in Management and Administrative expenses on the fund’s Statement of Operations. Any borrowings under this facility bear interest at a rate based upon the higher of the one-month London Interbank Offered Rate, federal funds effective rate, or overnight bank funding rate plus an agreed-upon spread.
The fund had no borrowings outstanding at July 31, 2018, or at any time during the period then ended.
8. Other: Dividend income is recorded on the ex-dividend date. Premiums and discounts on debt securities purchased are amortized and accreted, respectively, to interest income over the lives of the respective securities. Security transactions are accounted for on the date securities are bought or sold. Costs used to determine realized gains (losses) on the sale of investment securities are those of the specific securities sold.
19
Health Care Fund
Each class of shares has equal rights as to assets and earnings, except that each class separately bears certain class-specific expenses related to maintenance of shareholder accounts (included in Management and Administrative expenses), shareholder reporting, and the proxy. Marketing and distribution expenses are allocated to each class of shares based on a method approved by the board of trustees. Income, other non-class-specific expenses, and gains and losses on investments are allocated to each class of shares based on its relative net assets.
B. Wellington Management Company LLP provides investment advisory services to the fund for a fee calculated at an annual percentage rate of average net assets. The basic fee is subject to quarterly adjustments based on the fund’s performance relative to the MSCI ACWI Health Care Index for the preceding three years. For the six months ended July 31, 2018, the investment advisory fee represented an effective annual basic rate of 0.15% of the fund’s average net assets before an increase of $1,485,000 (0.01%) based on performance.
C. In accordance with the terms of a Funds’ Service Agreement (the “FSA”) between Vanguard and the fund, Vanguard furnishes to the fund corporate management, administrative, marketing, and distribution services at Vanguard’s cost of operations (as defined by the FSA). These costs of operations are allocated to the fund based on methods and guidelines approved by the board of trustees. Vanguard does not require reimbursement in the current period for certain costs of operations (such as deferred compensation/benefits and risk/insurance costs); the fund’s liability for these costs of operations is included in Payables to Vanguard on the Statement of Assets and Liabilities. All other costs of operations payable to Vanguard are generally settled twice a month.
Upon the request of Vanguard, the fund may invest up to 0.40% of its net assets as capital in Vanguard. At July 31, 2018, the fund had contributed to Vanguard capital in the amount of $2,405,000, representing 0.01% of the fund’s net assets and 0.96% of Vanguard’s capitalization. The fund’s trustees and officers are also directors and employees, respectively, of Vanguard.
D. Various inputs may be used to determine the value of the fund’s investments. These inputs are summarized in three broad levels for financial statement purposes. The inputs or methodologies used to value securities are not necessarily an indication of the risk associated with investing in those securities.
Level 1—Quoted prices in active markets for identical securities.
Level 2—Other significant observable inputs (including quoted prices for similar securities, interest rates, prepayment speeds, credit risk, etc.).
Level 3—Significant unobservable inputs (including the fund’s own assumptions used to determine
the fair value of investments). Any investments valued with significant unobservable inputs are noted
on the Statement of Net Assets.
20
Health Care Fund
The following table summarizes the market value of the fund’s investments as of July 31, 2018, based on the inputs used to value them:
| | | |
| | Level 1 | Level 2 | Level 3 |
| Investments | ($000) | ($000) | ($000) |
| Common Stocks—United States | 34,299,514 | — | — |
| Common Stocks—International | 485,133 | 11,816,426 | — |
| Temporary Cash Investments | 22,508 | 1,179,231 | — |
| Total | 34,807,155 | 12,995,657 | — |
E. Distributions are determined on a tax basis and may differ from net investment income and realized capital gains for financial reporting purposes. Differences may be permanent or temporary. Permanent differences are reclassified among capital accounts in the financial statements to reflect their tax character. Temporary differences arise when certain items of income, expense, gain, or loss are recognized in different periods for financial statement and tax purposes. These differences will reverse at some time in the future. Differences in classification may also result from the treatment of short-term gains as ordinary income for tax purposes. The fund’s tax-basis capital gains and losses are determined only at the end of each fiscal year.
At July 31, 2018, the cost of investment securities for tax purposes was $28,740,722,000. Net unrealized appreciation of investment securities for tax purposes was $19,062,090,000, consisting of unrealized gains of $20,037,888,000 on securities that had risen in value since their purchase and $975,798,000 in unrealized losses on securities that had fallen in value since their purchase.
F. During the six months ended July 31, 2018, the fund purchased $2,377,712,000 of investment securities and sold $3,978,384,000 of investment securities, other than temporary cash investments.
G. Capital share transactions for each class of shares were:
| | | | |
| | Six Months Ended | | Year Ended |
| | | July 31, 2018 | January 31, 2018 |
| | Amount | Shares | Amount | Shares |
| | ($000) | (000) | ($000) | (000) |
| Investor Shares | | | | |
| Issued | 342,790 | 1,677 | 1,154,125 | 5,549 |
| Issued in Lieu of Cash Distributions | 216,744 | 1,079 | 659,513 | 3,250 |
| Redeemed | (931,575) | (4,548) | (2,913,387) | (13,922) |
| Net Increase (Decrease)—Investor Shares | (372,041) | (1,792) | (1,099,749) | (5,123) |
| Admiral Shares | | | | |
| Issued | 648,352 | 7,502 | 2,793,811 | 31,646 |
| Issued in Lieu of Cash Distributions | 828,298 | 9,779 | 2,402,452 | 28,052 |
| Redeemed | (2,076,456) | (24,073) | (4,400,931) | (50,129) |
| Net Increase (Decrease)—Admiral Shares | (599,806) | (6,792) | 795,332 | 9,569 |
21
Health Care Fund
H. Certain of the fund’s investments are in companies that are considered to be affiliated companies of the fund because the fund owns more than 5% of the outstanding voting securities of the company or the issuer is another member of The Vanguard Group. Transactions during the period in securities of these companies were as follows:
| | | | | | | | |
| | | Current Period Transactions | |
| | Jan. 31, | | Proceeds | Realized | | | | July 31, |
| | 2018 | | from | Net | Change in | | Capital Gain | 2018 |
| | Market Purchases | | Securities | Gain | Unrealized | | Distributions | Market |
| | Value | at Cost | Sold | (Loss) | App. (Dep.) | Income | Received | Value |
| | ($000) | ($000) | ($000) | ($000) | ($000) | ($000) | ($000) | ($000) |
| Acadia Healthcare | | | | | | | | |
| Co Inc. | 156,814 | — | 10,564 | (6,011) | 31,004 | — | — | NA1 |
| Agios | | | | | | | | |
| Pharmaceuticals Inc. | 342,852 | — | 9,929 | (3,328) | 36,215 | — | — | 365,810 |
| Alkermes plc | 518,485 | 8,156 | 17,727 | (904) | (113,785) | — | — | 394,225 |
| Allscripts Healthcare | | | | | | | |
| Solutions Inc. | 140,506 | — | — | — | (25,161) | — | — | 115,345 |
| Alnylam | | | | | | | | |
| Pharmaceuticals Inc. | 867,028 | 115,702 | — | — | (243,362) | — | — | 739,368 |
| athenahealth Inc. | 279,963 | — | 57,516 | 8,529 | 43,981 | — | — | NA1 |
| Eisai Co. Ltd. | 951,518 | 51,350 | — | — | 486,099 | 11,253 | — | 1,488,967 |
| Incyte Corp. | NA2 | 77,105 | — | — | (222,730) | — | — | 709,148 |
| Medicines Co. | 184,343 | — | — | — | 36,723 | — | — | 221,066 |
| Mylan NV | 1,278,817 | 29,342 | — | — | (166,236) | — | — | 1,141,923 |
| Prothena Corp. plc | 89,882 | — | — | — | (57,929) | — | — | 31,953 |
| TESARO Inc. | 202,153 | 4,807 | — | — | (99,014) | — | — | 107,946 |
| UCB SA | 1,031,202 | 9,822 | 10,450 | 1,354 | (13,902) | 14,249 | — | 1,018,026 |
| Vanguard Market | | | | | | | | |
| Liquidity Fund | 166,428 | NA 3 | NA 3 | 14 | (1) | — | — | 22,508 |
| Total | 6,209,991 | | | (346) | (308,098) | 25,502 | — | 6,356,285 |
1 Not applicable—at July 31, 2018, the security was still held, but the issuer was not an affiliated company of the fund.
2 Not applicable—at January 31, 2018, the security was not an affiliated company of the fund.
3 Not applicable—purchases and sales are for temporary cash investment purposes.
I. Management has determined that no events or transactions occurred subsequent to July 31, 2018, that would require recognition or disclosure in these financial statements.
22
About Your Fund’s Expenses
As a shareholder of the fund, you incur ongoing costs, which include costs for portfolio management, administrative services, and shareholder reports (like this one), among others. Operating expenses, which are deducted from a fund’s gross income, directly reduce the investment return of the fund.
A fund’s expenses are expressed as a percentage of its average net assets. This figure is known as the expense ratio. The following examples are intended to help you understand the ongoing costs (in dollars) of investing in your fund and to compare these costs with those of other mutual funds. The examples are based on an investment of $1,000 made at the beginning of the period shown and held for the entire period.
The accompanying table illustrates your fund’s costs in two ways:
• Based on actual fund return. This section helps you to estimate the actual expenses that you paid over the period. The ”Ending Account Value“ shown is derived from the fund‘s actual return, and the third column shows the dollar amount that would have been paid by an investor who started with $1,000 in the fund. You may use the information here, together with the amount you invested, to estimate the expenses that you paid over the period.
To do so, simply divide your account value by $1,000 (for example, an $8,600 account value divided by $1,000 = 8.6), then multiply the result by the number given for your fund under the heading ”Expenses Paid During Period.“
• Based on hypothetical 5% yearly return. This section is intended to help you compare your fund‘s costs with those of other mutual funds. It assumes that the fund had a yearly return of 5% before expenses, but that the expense ratio is unchanged. In this case—because the return used is not the fund’s actual return—the results do not apply to your investment. The example is useful in making comparisons because the Securities and Exchange Commission requires all mutual funds to calculate expenses based on a 5% return. You can assess your fund’s costs by comparing this hypothetical example with the hypothetical examples that appear in shareholder reports of other funds.
Note that the expenses shown in the table are meant to highlight and help you compare ongoing costs only and do not reflect transaction costs incurred by the fund for buying and selling securities. Further, the expenses do not include any purchase, redemption, or account service fees described in the fund prospectus. If such fees were applied to your account, your costs would be higher. Your fund does not carry a “sales load.”
The calculations assume no shares were bought or sold during the period. Your actual costs may have been higher or lower, depending on the amount of your investment and the timing of any purchases or redemptions.
You can find more information about the fund’s expenses, including annual expense ratios, in the Financial Statements section of this report. For additional information on operating expenses and other shareholder costs, please refer to your fund’s current prospectus.
23
| | | |
| Six Months Ended July 31, 2018 | | | |
| | Beginning | Ending | Expenses |
| | Account Value | Account Value | Paid During |
| Health Care Fund | 1/31/2018 | 7/31/2018 | Period |
| Based on Actual Fund Return | | | |
| Investor Shares | $1,000.00 | $1,021.16 | $1.70 |
| Admiral Shares | 1,000.00 | 1,022.37 | 1.45 |
| Based on Hypothetical 5% Yearly Return | | | |
| Investor Shares | $1,000.00 | $1,023.11 | $1.71 |
| Admiral Shares | 1,000.00 | 1,023.36 | 1.45 |
The calculations are based on expenses incurred in the most recent six-month period. The fund’s annualized six-month expense ratios for
that period are 0.34% for Investor Shares and 0.29% for Admiral Shares. The dollar amounts shown as “Expenses Paid” are equal to the
annualized expense ratio multiplied by the average account value over the period, multiplied by the number of days in the most recent
six-month period, then divided by the number of days in the most recent 12-month period (181/365).
24
Trustees Approve Advisory Arrangement
The board of trustees of Vanguard Health Care Fund has renewed the fund’s investment advisory arrangement with Wellington Management Company LLP (Wellington Management). The board determined that renewing the fund’s advisory arrangement was in the best interests of the fund and its shareholders.
The board based its decision upon an evaluation of the advisor’s investment staff, portfolio management process, and performance. This evaluation included information provided to the board by Vanguard’s Portfolio Review Department, which is responsible for fund and advisor oversight and product management. The Portfolio Review Department met regularly with the advisor and made monthly presentations to the board during the fiscal year that directed the board’s focus to relevant information and topics.
The board, or an investment committee made up of board members, also received information throughout the year during advisor presentations. For each advisor presentation, the board was provided with letters and reports that included information about, among other things, the advisory firm and the advisor’s assessment of the investment environment, portfolio performance, and portfolio characteristics.
In addition, the board received monthly reports, which included a Market and Economic Report, a Fund Dashboard Monthly Summary, and a Fund Performance Report.
Prior to their meeting, the trustees were provided with a memo and materials that summarized the information they received over the course of the year. They also considered the factors discussed below, among others. However, no single factor determined whether the board approved the arrangement. Rather, it was the totality of the circumstances that drove the board’s decision.
Nature, extent, and quality of services
The board reviewed the quality of the fund’s investment management services over both the short and long term and took into account the organizational depth and stability of the advisor. The board considered that Wellington Management, founded in 1928, is among the nation’s oldest and most respected institutional investment managers. The portfolio manager is aided by a team of experienced Global Industry Analysts who cover health care industries. This health care team uses intensive fundamental analysis and deep knowledge of health care science and technology to identify companies with high-quality balance sheets, strong management, and the potential for new products that will lead to above-average growth in revenue and earnings. The advisor invests in stocks broadly representing the health care industry, seeking to maintain exposure across five primary subsectors: large-cap biotech/pharmaceuticals, mid-cap biotech/pharmaceuticals, small-cap biotech/pharmaceuticals, health care services, and medical technology. Wellington Management has advised the fund since its inception in 1984.
The board concluded that the advisor’s experience, stability, depth, and performance, among other factors, warranted approval and continuation of the advisory arrangement.
Investment performance
The board considered the short- and long-term performance of the fund, including any periods of outperformance or underperformance compared with a relevant benchmark index and peer group. The board concluded that the performance was such that the advisory arrangement should continue. Information about the fund’s most recent performance can be found in the Performance Summary section of this report.
25
Cost
The board concluded that the fund’s expense ratio was well below the average expense ratio charged by funds in its peer group and that the fund’s advisory fee rate was also well below the peer-group average. Information about the fund’s expense ratio appears in the About Your Fund’s Expenses section of this report as well as in the Financial Statements section, which also includes information about the fund’s advisory fee rate.
The board did not consider the profitability of Wellington Management in determining whether to approve the advisory fee, because Wellington Management is independent of Vanguard and the advisory fee is the result of arm’s-length negotiations.
The benefit of economies of scale
The board concluded that the fund’s shareholders benefit from economies of scale because of breakpoints in the fund’s advisory fee schedule for Wellington Management. The breakpoints reduce the effective rate of the fee as the fund’s assets increase.
The board will consider whether to renew the advisory arrangement again after a one-year period.
26
Glossary
30-Day SEC Yield. A fund’s 30-day SEC yield is derived using a formula specified by the U.S. Securities and Exchange Commission. Under the formula, data related to the fund’s security holdings in the previous 30 days are used to calculate the fund’s hypothetical net income for that period, which is then annualized and divided by the fund’s estimated average net assets over the calculation period. For the purposes of this calculation, a security’s income is based on its current market yield to maturity (for bonds), its actual income (for asset-backed securities), or its projected dividend yield (for stocks). Because the SEC yield represents hypothetical annualized income, it will differ—at times significantly—from the fund’s actual experience. As a result, the fund’s income distributions may be higher or lower than implied by the SEC yield.
Beta. A measure of the magnitude of a fund’s past share-price fluctuations in relation to the ups and downs of a given market index. The index is assigned a beta of 1.00. Compared with a given index, a fund with a beta of 1.20 typically would have seen its share price rise or fall by 12% when the index rose or fell by 10%. For this report, beta is based on returns over the past 36 months for both the fund and the index. Note that a fund’s beta should be reviewed in conjunction with its R-squared (see definition). The lower the R-squared, the less correlation there is between the fund and the index, and the less reliable beta is as an indicator of volatility.
Dividend Yield. Dividend income earned by stocks, expressed as a percentage of the aggregate market value (or of net asset value, for a fund). The yield is determined by dividing the amount of the annual dividends by the aggregate value (or net asset value) at the end of the period. For a fund, the dividend yield is based solely on stock holdings and does not include any income produced by other investments.
Earnings Growth Rate. The average annual rate of growth in earnings over the past five years for the stocks now in a fund.
Equity Exposure. A measure that reflects a fund’s investments in stocks and stock futures. Any holdings in short-term reserves are excluded.
Expense Ratio. A fund’s total annual operating expenses expressed as a percentage of the fund’s average net assets. The expense ratio includes management and administrative expenses, but does not include the transaction costs of buying and selling portfolio securities.
Foreign Holdings. The percentage of a fund represented by securities or depositary receipts of companies based outside the United States.
Inception Date. The date on which the assets of a fund (or one of its share classes) are first invested in accordance with the fund’s investment objective. For funds with a subscription period, the inception date is the day after that period ends. Investment performance is measured from the inception date.
Median Market Cap. An indicator of the size of companies in which a fund invests; the midpoint of market capitalization (market price x shares outstanding) of a fund’s stocks, weighted by the proportion of the fund’s assets invested in each stock. Stocks representing half of the fund’s assets have market capitalizations above the median, and the rest are below it.
Price/Book Ratio. The share price of a stock divided by its net worth, or book value, per share.
For a fund, the weighted average price/book ratio of the stocks it holds.
27
Price/Earnings Ratio. The ratio of a stock’s current price to its per-share earnings over the past year. For a fund, the weighted average P/E of the stocks it holds. P/E is an indicator of market expectations about corporate prospects; the higher the P/E, the greater the expectations for a company’s future growth.
R-Squared. A measure of how much of a fund’s past returns can be explained by the returns from the market in general, as measured by a given index. If a fund’s total returns were precisely synchronized with an index’s returns, its R-squared would be 1.00. If the fund’s returns bore no relationship to the index’s returns, its R-squared would be 0. For this report, R-squared is based on returns over the past 36 months for both the fund and the index.
Return on Equity. The annual average rate of return generated by a company during the past five years for each dollar of shareholder’s equity (net income divided by shareholder’s equity). For a fund, the weighted average return on equity for the companies whose stocks it holds.
Short-Term Reserves. The percentage of a fund invested in highly liquid, short-term securities that can be readily converted to cash.
Turnover Rate. An indication of the fund’s trading activity. Funds with high turnover rates incur higher transaction costs and may be more likely to distribute capital gains (which may be taxable to investors). The turnover rate excludes in-kind transactions, which have minimal impact on costs.
Benchmark Information
Spliced Health Care Index: S&P 500 Index through December 31, 2001; S&P Health Care Index
through May 31, 2010; MSCI All Country World Health Care Index thereafter.
28
The Global Industry Classification Standard (“GICS”) was developed by and is the exclusive property and a service mark
of MSCI Inc. (“MSCI”) and Standard and Poor’s, a division of McGraw-Hill Companies, Inc. (“S&P”), and is licensed for use
by Vanguard. Neither MSCI, S&P nor any third party involved in making or compiling the GICS or any GICS classification
makes any express or implied warranties or representations with respect to such standard or classification (or the results
to be obtained by the use thereof), and all such parties hereby expressly disclaim all warranties of originality, accuracy,
completeness, merchantability or fitness for a particular purpose with respect to any such standard or classification.
Without limiting any of the foregoing, in no event shall MSCI, S&P, any of its affiliates or any third party involved in
making or compiling the GICS or any GICS classification have any liability for any direct, indirect, special, punitive,
consequential or any other damages (including lost profits) even if notified of the possibility of such damages.
29
This page intentionally left blank.
The People Who Govern Your Fund
The trustees of your mutual fund are there to see that the fund is operated and managed in your best interests since, as a shareholder, you are a part owner of the fund. Your fund’s trustees also serve on the board of directors of The Vanguard Group, Inc., which is owned by the Vanguard funds and provides services to them on an at-cost basis.
A majority of Vanguard’s board members are independent, meaning that they have no affiliation with Vanguard or the funds they oversee, apart from the sizable personal investments they have made as private individuals. The independent board members have distinguished backgrounds in business, academia, and public service. Each of the trustees and executive officers oversees 208 Vanguard funds.
Information for each trustee and executive officer of the fund appears below. The mailing address of the trustees and officers is P.O. Box 876, Valley Forge, PA 19482. More information about the trustees is in the Statement of Additional Information, which can be obtained, without charge, by contacting Vanguard at 800-662-7447, or online at vanguard.com.
Interested Trustees1
F. William McNabb III
Born in 1957. Trustee since July 2009. Principal occupation(s) during the past five years and other experience: chairman of the board (January 2010–present) of Vanguard and of each of the investment companies served by Vanguard, trustee (2009–present) of each of the investment companies served by Vanguard, and director (2008–present) of Vanguard. Chief executive officer and president (2008–2017) of Vanguard and each of the investment companies served by Vanguard, managing director (1995–2008) of Vanguard, and director (1997–2018) of Vanguard Marketing Corporation. Director (2018–present) of UnitedHealth Group.
Mortimer J. Buckley
Born in 1969. Trustee since January 2018. Principal occupation(s) during the past five years and other experience: chief executive officer (January 2018–present) of Vanguard; chief executive officer, president, and trustee (January 2018–present) of each of the investment companies served by Vanguard; president and director (2017–present) of Vanguard; and president (February 2018–present) of Vanguard Marketing Corporation. Chief investment officer (2013–2017), managing director (2002–2017), head of the Retail Investor Group (2006–2012), and chief information officer (2001–2006) of Vanguard. Chairman of the board (2011–2017) of the Children’s Hospital of Philadelphia.
Independent Trustees
Emerson U. Fullwood
Born in 1948. Trustee since January 2008. Principal occupation(s) during the past five years and other experience: executive chief staff and marketing officer for North America and corporate vice president (retired 2008) of Xerox Corporation (document management products and services). Former president of the Worldwide Channels Group, Latin America, and Worldwide Customer Service and executive chief staff officer of Developing Markets of Xerox. Executive in residence and 2009–2010 Distinguished Minett Professor at the Rochester Institute of Technology. Lead director of SPX FLOW, Inc. (multi-industry manufacturing). Director of the University of Rochester Medical Center, the Monroe Community College Foundation, the United Way of Rochester, North Carolina A&T University, and Roberts Wesleyan College. Trustee of the University of Rochester.
Amy Gutmann
Born in 1949. Trustee since June 2006. Principal occupation(s) during the past five years and other experience: president (2004–present) of the University of Pennsylvania. Christopher H. Browne Distinguished Professor of Political Science, School of Arts and Sciences, and professor of communication, Annenberg School for Communication, with secondary faculty appointments in the Department of Philosophy, School of Arts and Sciences, and at the Graduate School of Education, University of Pennsylvania. Trustee of the National Constitution Center.
1 Mr. McNabb and Mr. Buckley are considered “interested persons,” as defined in the Investment Company Act of 1940, because they are officers of the Vanguard funds.
JoAnn Heffernan Heisen
Born in 1950. Trustee since July 1998. Principal occupation(s) during the past five years and other experience: corporate vice president of Johnson & Johnson (pharmaceuticals/medical devices/consumer products) and member of its executive committee (1997–2008). Chief global diversity officer (retired 2008), vice president and chief information officer (1997–2006), controller (1995–1997), treasurer (1991–1995), and assistant treasurer (1989–1991) of Johnson & Johnson. Director of Skytop Lodge Corporation (hotels) and the Robert Wood Johnson Foundation. Member of the advisory board of the Institute for Women’s Leadership at Rutgers University.
F. Joseph Loughrey
Born in 1949. Trustee since October 2009. Principal occupation(s) during the past five years and other experience: president and chief operating officer (retired 2009) and vice chairman of the board (2008–2009) of Cummins Inc. (industrial machinery). Chairman of the board of Hillenbrand, Inc. (specialized consumer services), Oxfam America, and the Lumina Foundation for Education. Director of the V Foundation for Cancer Research. Member of the advisory council for the College of Arts and Letters and chair of the advisory board to the Kellogg Institute for International Studies, both at the University of Notre Dame.
Mark Loughridge
Born in 1953. Trustee since March 2012. Principal occupation(s) during the past five years and other experience: senior vice president and chief financial officer (retired 2013) of IBM (information technology services). Fiduciary member of IBM’s Retirement Plan Committee (2004–2013), senior vice president and general manager (2002–2004) of IBM Global Financing, vice president and controller (1998–2002) of IBM, and a variety of other prior management roles at IBM. Member of the Council on Chicago Booth.
Scott C. Malpass
Born in 1962. Trustee since March 2012. Principal occupation(s) during the past five years and other experience: chief investment officer (1989–present) and vice president (1996–present) of the University of Notre Dame. Assistant professor of finance at the Mendoza College of Business, University of Notre Dame, and member of the Notre Dame 403(b) Investment Committee. Chairman of the board of TIFF Advisory Services, Inc. Member of the board of Catholic Investment Services, Inc. (investment advisors), the board of advisors for Spruceview Capital Partners, and the board of superintendence of the Institute for the Works of Religion.
Deanna Mulligan
Born in 1963. Trustee since January 2018. Principal occupation(s) during the past five years and other experience: president (2010–present) and chief executive officer (2011–present) of The Guardian Life Insurance Company of America. Chief operating officer (2010–2011) and executive vice president (2008–2010) of Individual Life and Disability of The Guardian Life Insurance Company of America. Member of the board of The Guardian Life Insurance Company of America, the American Council of Life Insurers, the Partnership for New York City (business leadership), and the Committee Encouraging Corporate Philanthropy. Trustee of the Economic Club of New York and the Bruce Museum (arts and science). Member of the Advisory Council for the Stanford Graduate School of Business.
André F. Perold
Born in 1952. Trustee since December 2004. Principal occupation(s) during the past five years and other experience: George Gund Professor of Finance and Banking, Emeritus at the Harvard Business School (retired 2011). Chief investment officer and co-managing partner of HighVista Strategies LLC (private investment firm). Overseer of the Museum of Fine Arts Boston.
Sarah Bloom Raskin
Born in 1961. Trustee since January 2018. Principal occupation(s) during the past five years and other experience: deputy secretary (2014–2017) of the United States Department of the Treasury. Governor (2010–2014) of the Federal Reserve Board. Commissioner (2007–2010) of financial regulation for the State of Maryland. Member of the board of directors (2012–2014) of Neighborhood Reinvestment Corporation. Director of i(x) Investments, LLC.
Peter F. Volanakis
Born in 1955. Trustee since July 2009. Principal occupation(s) during the past five years and other experience: president and chief operating officer (retired 2010) of Corning Incorporated (communications equipment) and director of Corning Incorporated (2000–2010) and Dow Corning (2001–2010). Director (2012) of SPX Corporation (multi-industry manufacturing). Overseer of the Amos Tuck School of Business Administration, Dartmouth College (2001–2013). Chairman of the board of trustees of Colby-Sawyer College. Member of the Board of Hypertherm Inc. (industrial cutting systems, software, and consumables).
Executive Officers
Glenn Booraem
Born in 1967. Principal occupation(s) during the past five years and other experience: principal of Vanguard. Investment stewardship officer (2017–present), treasurer (2015–2017), controller (2010–2015), and assistant controller (2001–2010) of each of the investment companies served by Vanguard.
Christine M. Buchanan
Born in 1970. Principal occupation(s) during the past five years and other experience: principal of Vanguard and global head of Fund Administration at Vanguard. Treasurer (2017–present) of each of the investment companies served by Vanguard. Partner (2005–2017) at KPMG LLP (audit, tax, and advisory services).
Brian Dvorak
Born in 1973. Principal occupation(s) during the past five years and other experience: principal of Vanguard. Chief compliance officer (2017–present) of Vanguard and each of the investment companies served by Vanguard. Assistant vice president (2017–present) of Vanguard Marketing Corporation. Vice president and director of Enterprise Risk Management (2011–2013) at Oppenheimer Funds, Inc.
Thomas J. Higgins
Born in 1957. Principal occupation(s) during the past five years and other experience: principal of Vanguard. Chief financial officer (2008–present) and treasurer (1998–2008) of each of the investment companies served by Vanguard.
Peter Mahoney
Born in 1974. Principal occupation(s) during the past five years and other experience: principal of Vanguard. Controller (2015–present) of each of the investment companies served by Vanguard. Head of International Fund Services (2008–2014) at Vanguard.
Anne E. Robinson
Born in 1970. Principal occupation(s) during the past five years and other experience: general counsel (2016–present) of Vanguard. Secretary (2016–present) of Vanguard and of each of the investment companies served by Vanguard. Managing director (2016–present) of Vanguard. Director and senior vice president (2016–2018) of Vanguard Marketing Corporation. Managing director and general counsel of Global Cards and Consumer Services (2014–2016) at Citigroup. Counsel (2003–2014) at American Express.
Michael Rollings
Born in 1963. Principal occupation(s) during the past five years and other experience: finance director (2017–present) and treasurer (2017) of each of the investment companies served by Vanguard. Managing director (2016–present) of Vanguard. Chief financial officer (2016–present) of Vanguard. Director (2016–present) of Vanguard Marketing Corporation. Executive vice president and chief financial officer (2006–2016) of MassMutual Financial Group.
| |
| Vanguard Senior Management Team |
| |
| Mortimer J. Buckley | James M. Norris |
| Gregory Davis | Thomas M. Rampulla |
| John James | Karin A. Risi |
| Martha G. King | Anne E. Robinson |
| John T. Marcante | Michael Rollings |
| Chris D. McIsaac | |
| |
| |
| Chairman Emeritus and Senior Advisor |
| |
| John J. Brennan | |
| Chairman, 1996–2009 | |
| Chief Executive Officer and President, 1996–2008 |
| |
| |
| Founder | |
| |
| John C. Bogle | |
| Chairman and Chief Executive Officer, 1974–1996 |
|  |
| | P.O. Box 2600 |
| | Valley Forge, PA 19482-2600 |
| |
| |
| |
| Connect with Vanguard® > vanguard.com |
| |
| |
| |
| Fund Information > 800-662-7447 | Source for Bloomberg Barclays indexes: Bloomberg |
| Direct Investor Account Services > 800-662-2739 | Index Services Limited. Copyright 2018, Bloomberg. |
| | All rights reserved. |
| Institutional Investor Services > 800-523-1036 | |
| | CFA® is a registered trademark owned by CFA |
| Text Telephone for People | Institute. |
| Who Are Deaf or Hard of Hearing > 800-749-7273 | |
| |
| This material may be used in conjunction | |
| with the offering of shares of any Vanguard | |
| fund only if preceded or accompanied by | |
| the fund’s current prospectus. | |
| |
| All comparative mutual fund data are from Lipper, a | |
| Thomson Reuters Company, or Morningstar, Inc., unless | |
| otherwise noted. | |
| |
| You can obtain a free copy of Vanguard’s proxy voting | |
| guidelines by visiting vanguard.com/proxyreporting or by | |
| calling Vanguard at 800-662-2739. The guidelines are | |
| also available from the SEC’s website, sec.gov. In | |
| addition, you may obtain a free report on how your fund | |
| voted the proxies for securities it owned during the 12 | |
| months ended June 30. To get the report, visit either | |
| vanguard.com/proxyreporting or sec.gov. | |
| |
| You can review and copy information about your fund at | |
| the SEC’s Public Reference Room in Washington, D.C. To | |
| find out more about this public service, call the SEC at | |
| 202-551-8090. Information about your fund is also | |
| available on the SEC’s website, and you can receive | |
| copies of this information, for a fee, by sending a | |
| request in either of two ways: via email addressed to | |
| publicinfo@sec.gov or via regular mail addressed to the | |
| Public Reference Section, Securities and Exchange | |
| Commission, Washington, DC 20549-1520. | |
| | © 2018 The Vanguard Group, Inc. |
| | All rights reserved. |
| | Vanguard Marketing Corporation, Distributor. |
| |
| | Q522 092018 |

Semiannual Report | July 31, 2018
Vanguard Real Estate Index Funds
Vanguard Real Estate Index Fund
Vanguard Real Estate II Index Fund
Vanguard’s Principles for Investing Success
We want to give you the best chance of investment success. These principles, grounded in Vanguard’s research and experience, can put you on the right path.
Goals. Create clear, appropriate investment goals.
Balance. Develop a suitable asset allocation using broadly diversified funds.
Cost. Minimize cost.
Discipline. Maintain perspective and long-term discipline.
A single theme unites these principles: Focus on the things you can control.
We believe there is no wiser course for any investor.
| |
| Contents | |
| Your Fund’s Performance at a Glance. | 1 |
| CEO’s Perspective. | 3 |
| Real Estate Index Fund. | 5 |
| Real Estate II Index Fund. | 32 |
| About Your Fund’s Expenses. | 45 |
| Trustees Approve Advisory Arrangements. | 47 |
| Glossary. | 49 |

Real Estate Index Fund
Real Estate II Index Fund
Please note: The opinions expressed in this report are just that—informed opinions. They should not be considered promises
or advice. Also, please keep in mind that the information and opinions cover the period through the date on the front of this
report. Of course, the risks of investing in your fund are spelled out in the prospectus.
See the Glossary for definitions of investment terms used in this report.
About the cover: Nautical images have been part of Vanguard’s rich heritage since its start in 1975. For an
incoming ship, a lighthouse offers a beacon and safe path to shore. You can similarly depend on Vanguard to put
you first––and light the way––as you strive to meet your financial goals. Our client focus and low costs,
stemming from our unique ownership structure, assure that your interests are paramount.
Your Fund’s Performance at a Glance
• For the six months ended July 31, 2018, Vanguard Real Estate Index Fund returned 5.08% for Investor Shares. Returns were a bit higher for ETF, Admiral, and Institutional Shares as well as for Vanguard Real Estate II Index Fund. The results were in line with those of the funds’ benchmark index and exceeded the average return of peer funds.
• Specialized REITs, residential REITs, retail REITs, and health care REITs contributed most to the funds’ returns.
• As we mentioned in our last report, the funds changed their names on February 1, 2018, to Vanguard Real Estate Index Fund and Vanguard Real Estate II Index Fund and began their transition from the MSCI US REIT Index to the MSCI US Investable Market Real Estate 25/50 Index. The funds completed the transition to their destination benchmark at the end of July.
| |
| Total Returns: Six Months Ended July 31, 2018 | |
| | Total |
| | Returns |
| Vanguard Real Estate Index Fund | |
| Investor Shares | 5.08% |
| ETF Shares | |
| Market Price | 5.12 |
| Net Asset Value | 5.13 |
| Admiral™ Shares | 5.14 |
| Institutional Shares | 5.14 |
| Real Estate Spliced Index | 5.18 |
| Real Estate Funds Average | 4.06 |
| Real Estate Funds Average: Derived from data provided by Lipper, a Thomson Reuters Company. | |
| Vanguard Real Estate II Index Fund | 5.13% |
| Real Estate Spliced Index | 5.18 |
| Real Estate Funds Average | 4.06 |
| Real Estate Funds Average: Derived from data provided by Lipper, a Thomson Reuters Company. | |
| For a benchmark description, see the Glossary. | |
Admiral Shares carry lower expenses and are available to investors who meet certain account-balance requirements. Institutional Shares
are available to certain institutional investors who meet specific administrative, service, and account-size criteria. The Vanguard ETF®
Shares shown are traded on the NYSE Arca exchange and are available only through brokers. The table provides ETF returns based on
both the NYSE Arca market price and the net asset value for a share. U.S. Pat. Nos. 6,879,964; 7,337,138; 7,720,749; 7,925,573;
8,090,646; and 8,417,623.
For the ETF Shares, the market price is determined by the midpoint of the bid-offer spread as of the closing time of the New York Stock
Exchange (generally 4 p.m., Eastern time). The net asset value is also determined as of the NYSE closing time. For more information about
how the ETF Shares' market prices have compared with their net asset value, visit vanguard.com, select your ETF, and then select the
Price and Performance tab. The ETF premium/discount analysis there shows the percentages of days on which the ETF Shares' market
price was above or below the NAV.
1
| | | | | | |
| Expense Ratios | | | | | | |
| Your Fund Compared With Its Peer Group | | | | | |
| | Investor | ETF | Admiral | Institutional | Institutional | Peer Group |
| | Shares | Shares | Shares | Shares | Plus Shares | Average |
| Real Estate Index Fund | 0.26% | 0.12% | 0.12% | 0.10% | — | 1.25% |
| Real Estate II Index Fund | — | — | — | — | 0.08% | 1.25 |
The fund expense ratios shown for the Real Estate Index Fund and the Real Estate II Index Fund are from the prospectuses dated May 25,
2018, and May 24, 2018, respectively, and represent estimated costs for the current fiscal year. For the six months ended July 31, 2018,
the funds’ annualized expense ratios were: for the Real Estate Index Fund, 0.26% for Investor Shares, 0.12% for ETF Shares, 0.12% for
Admiral Shares, and 0.10% for Institutional Shares; and for the Real Estate II Index Fund, 0.08%. The peer-group expense ratio is derived
from data provided by Lipper, a Thomson Reuters Company, and captures information through year-end 2017.
Peer group: Real Estate Funds.
2
CEO’s Perspective

Tim Buckley
President and Chief Executive Officer
Dear Shareholder,
I feel extremely fortunate to have the chance to lead a company filled with people who come to work every day passionate about Vanguard’s core purpose: to take a stand for all investors, to treat them fairly, and to give them the best chance for investment success.
When I joined Vanguard in 1991, I found a mission-driven team focused on improving lives—helping people retire more comfortably, put their children through college, and achieve financial security. I also found a company with purpose in an industry ripe for improvement.
It was clear, even early in my career, that the cards were stacked against most investors. Hidden fees, performance-chasing, and poor advice were relentlessly eroding investors’ dreams.
We knew Vanguard could be different and, as a result, could make a real difference. We have lowered the costs of investing for our shareholders significantly. And we’re proud of the performance of our funds.
Vanguard is built for Vanguard investors—we focus solely on you, our fund shareholders. Everything we do is designed to give our clients the best chance for investment success. In my role as CEO, I’ll keep this priority
3
front and center. We’re proud of what we’ve achieved, but we’re even more excited about what’s to come.
Steady, time-tested guidance
Our guidance for investors, as always, is to stay the course, tune out the hyperbolic headlines, and focus on your goals and what you can control, such as costs and how much you save. This time-tested advice has served our clients well over the decades.
Regardless of how the markets perform in the short term, I’m incredibly optimistic about the future for our investors. We have a dedicated team serving you, and we will never stop striving to make Vanguard the best place for you to invest through our high-quality funds and services, advice and guidance to help you meet your financial goals, and an experience that makes you feel good about entrusting us with your hard-earned savings.
Thank you for your continued loyalty.
Sincerely,

Mortimer J. Buckley
President and Chief Executive Officer
August 16, 2018
| | | |
| Market Barometer | | | |
| | | | Total Returns |
| | | Periods Ended July 31, 2018 |
| | Six | One | Five Years |
| | Months | Year | (Annualized) |
| Stocks | | | |
| Russell 1000 Index (Large-caps) | 0.86% | 16.19% | 12.96% |
| Russell 2000 Index (Small-caps) | 6.75 | 18.73 | 11.33 |
| Russell 3000 Index (Broad U.S. market) | 1.30 | 16.39 | 12.83 |
| FTSE All-World ex US Index (International) | -6.57 | 6.19 | 5.97 |
| |
| Bonds | | | |
| Bloomberg Barclays U.S. Aggregate Bond Index | | | |
| (Broad taxable market) | -0.45% | -0.80% | 2.25% |
| Bloomberg Barclays Municipal Bond Index | | | |
| (Broad tax-exempt market) | 1.18 | 0.99 | 3.76 |
| FTSE Three-Month U. S. Treasury Bill Index | 0.83 | 1.41 | 0.41 |
| |
| CPI | | | |
| Consumer Price Index | 1.67% | 2.95% | 1.53% |
4
Real Estate Index Fund
Fund Profile
As of July 31, 2018
| | | | |
| Share-Class Characteristics | | | | |
| | Investor | | Admiral | Institutional |
| | Shares | ETF Shares | Shares | Shares |
| Ticker Symbol | VGSIX | VNQ | VGSLX | VGSNX |
| Expense Ratio1 | 0.26% | 0.12% | 0.12% | 0.10% |
| | | |
| Portfolio Characteristics | | |
| | | | DJ |
| | | MSCI US IM | U.S. Total |
| | | Real Estate | Market |
| | Fund | 25/50 Index | FA Index |
| Number of Stocks | 186 | 185 | 3,766 |
| Median Market Cap | $13.2B | $13.2B | $67.3B |
| Price/Earnings Ratio | 36.1x | 36.0x | 20.5x |
| Price/Book Ratio | 2.3x | 2.4x | 3.1x |
| Return on Equity | 6.0% | 6.1% | 15.0% |
| Earnings Growth Rate | 13.7% | 13.6% | 8.5% |
| Dividend Yield | 4.0% | 3.8% | 1.7% |
| Foreign Holdings | 0.0% | 0.0% | 0.0% |
| Turnover Rate | | | |
| (Annualized) | 26% | — | — |
| Short-Term Reserves | 0.3% | — | — |
Dividend Yield: This yield may include some payments that
represent a return of capital, capital gains distributions, or both by
the underlying REITs. These amounts are determined by each REIT
at the end of its fiscal year.
| | |
| Volatility Measures | | |
| | | DJ |
| | Real Estate | U.S. Total |
| | Spliced | Market |
| | Index | FA Index |
| R-Squared | 1.00 | 0.29 |
| Beta | 1.00 | 0.67 |
| These measures show the degree and timing of the fund’s |
| fluctuations compared with the indexes over 36 months. |
| | |
| Ten Largest Holdings (% of total net assets) |
| Vanguard Real Estate II | | |
| Index Fund | Other | 10.6% |
| American Tower Corp. | Specialized REITs | 5.4 |
| Simon Property Group | | |
| Inc. | Retail REITs | 4.6 |
| Crown Castle | | |
| International Corp. | Specialized REITs | 3.7 |
| Prologis Inc. | Industrial REITs | 2.9 |
| Equinix Inc. | Specialized REITs | 2.9 |
| Public Storage | Specialized REITs | 2.8 |
| Weyerhaeuser Co. | Specialized REITs | 2.1 |
| Digital Realty Trust Inc. | Specialized REITs | 2.0 |
| AvalonBay Communities | | |
| Inc. | Residential REITs | 2.0 |
| Top Ten | | 39.0% |
| The holdings listed exclude any temporary cash investments and |
| equity index products. | | |
1 The expense ratios shown are from the prospectus dated May 25, 2018, and represent estimated costs for the current fiscal year. For the six
months ended July 31, 2018, the annualized expense ratios were 0.26% for Investor Shares, 0.12% for ETF Shares, 0.12% for Admiral Shares,
and 0.10% for Institutional Shares.
5
Real Estate Index Fund
| | |
| Subindustry Diversification (% of equity |
| exposure) | | |
| | | MSCI US IM |
| | | Real Estate |
| | Fund | 25/50 Index |
| Diversified REITs | 4.6% | 4.6% |
| Diversified Real Estate | | |
| Activites | 0.2 | 0.2 |
| Health Care REITs | 8.7 | 8.7 |
| Hotel & Resort REITs | 5.8 | 5.8 |
| Industrial REITs | 6.6 | 6.6 |
| Office REITs | 10.5 | 10.5 |
| Real Estate Development | 0.6 | 0.5 |
| Real Estate Operating | | |
| Companies | 0.3 | 0.3 |
| Real Estate Services | 2.9 | 2.9 |
| Residential REITs | 13.1 | 13.1 |
| Retail REITs | 15.5 | 15.6 |
| Specialized REITs | 31.2 | 31.2 |
Sector categories are based on the Global Industry Classification
Standard (“GICS”), except for the “Other” category (if applicable),
which includes securities that have not been provided a GICS
classification as of the effective reporting period.
6
Real Estate Index Fund
Performance Summary
All of the returns in this report represent past performance, which is not a guarantee of future results that may be achieved by the fund. (Current performance may be lower or higher than the performance data cited. For performance data current to the most recent month-end, visit our website at vanguard.com/performance.) Note, too, that both investment returns and principal value can fluctuate widely, so an investor’s shares, when sold, could be worth more or less than their original cost. The returns shown do not reflect taxes that a shareholder would pay on fund distributions or on the sale of fund shares.
Fiscal-Year Total Returns (%): January 31, 2008, Through July 31, 2018
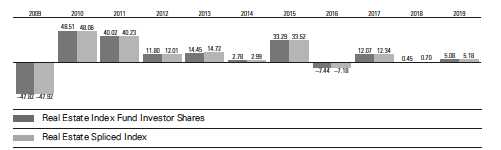
For a benchmark description, see the Glossary.
Note: For 2019, performance data reflect the six months ended July 31, 2018.
Average Annual Total Returns: Periods Ended June 30, 2018
This table presents returns through the latest calendar quarter—rather than through the end of the fiscal period.
Securities and Exchange Commission rules require that we provide this information.
| | | | |
| | Inception | One | Five | Ten |
| | Date | Year | Years | Years |
| Investor Shares | 5/13/1996 | 2.13% | 7.76% | 7.87% |
| ETF Shares | 9/23/2004 | | | |
| Market Price | | 2.33 | 7.92 | 8.01 |
| Net Asset Value | | 2.29 | 7.91 | 8.01 |
| Admiral Shares | 11/12/2001 | 2.29 | 7.91 | 8.01 |
| Institutional Shares | 12/2/2003 | 2.28 | 7.93 | 8.03 |
See Financial Highlights for dividend and capital gains information.
7
Real Estate Index Fund
Financial Statements (unaudited)
Statement of Net Assets
As of July 31, 2018
The fund reports a complete list of its holdings in regulatory filings four times in each fiscal year, at the quarter-ends. For the second and fourth fiscal quarters, the lists appear in the fund’s semiannual and annual reports to shareholders. For the first and third fiscal quarters, the fund files the lists with the Securities and Exchange Commission on Form N-Q. Shareholders can look up the fund’s Forms N-Q on the SEC’s website at sec.gov. Forms N-Q may also be reviewed and copied at the SEC’s Public Reference Room (see the back cover of this report for further information).
| | | |
| | | | Market |
| | | | Value• |
| | | Shares | ($000) |
| Equity Real Estate Investment | |
| Trusts (REITs) (96.3%)1 | | |
| Diversified REITs (4.1%) | | |
| 2 | VEREIT Inc. | 48,683,978 | 371,459 |
| 2 | WP Carey Inc. | 5,368,750 | 351,009 |
| | Liberty Property Trust | 7,385,714 | 316,552 |
| | Forest City Realty | | |
| | Trust Inc. Class A | 11,334,204 | 283,015 |
| | STORE Capital Corp. | 8,752,784 | 240,264 |
| | Colony Capital Inc. | 24,322,102 | 149,824 |
| | PS Business Parks Inc. | 1,028,035 | 131,352 |
| | Washington REIT | 3,928,734 | 119,787 |
| | Empire State Realty | | |
| | Trust Inc. | 6,873,861 | 114,587 |
| | Lexington Realty Trust | 10,857,089 | 95,434 |
| | Alexander & Baldwin | | |
| | Inc. | 3,409,411 | 81,655 |
| | Global Net Lease Inc. | 3,357,643 | 71,048 |
| | American Assets | | |
| | Trust Inc. | 1,653,400 | 63,540 |
| *,2 | iStar Inc. | 3,408,190 | 37,047 |
| | Armada Hoffler | | |
| | Properties Inc. | 2,263,844 | 34,184 |
| | Gladstone Commercial | | |
| | Corp. | 1,418,329 | 28,140 |
| | One Liberty Properties | | |
| | Inc. | 715,373 | 19,286 |
| §,2 | Winthrop Realty Trust | 1,892,511 | 2,742 |
| | | | 2,510,925 |
| Health Care REITs (7.8%) | | |
| | Welltower Inc. | 18,491,006 | 1,157,537 |
| | Ventas Inc. | 17,785,400 | 1,002,741 |
| | HCP Inc. | 23,451,571 | 607,396 |
| ^ | Omega Healthcare | | |
| | Investors Inc. | 9,924,780 | 294,667 |
| | Healthcare Trust of | | |
| | America Inc. Class A | 10,249,034 | 280,004 |
| | | |
| 2 | Medical Properties | | |
| | Trust Inc. | 18,302,623 | 263,741 |
| 2 | Senior Housing | | |
| | Properties Trust | 11,904,852 | 212,382 |
| 2 | Sabra Health Care | | |
| | REIT Inc. | 8,919,091 | 192,741 |
| 2 | Healthcare Realty | | |
| | Trust Inc. | 6,260,804 | 186,008 |
| 2 | National Health | | |
| | Investors Inc. | 2,079,718 | 155,646 |
| | Physicians Realty Trust | 8,933,013 | 140,784 |
| | LTC Properties Inc. | 1,981,312 | 83,552 |
| | CareTrust REIT Inc. | 3,802,697 | 64,304 |
| | Universal Health Realty | | |
| | Income Trust | 651,473 | 43,851 |
| | New Senior Investment | | |
| | Group Inc. | 4,086,156 | 28,930 |
| | MedEquities Realty | | |
| | Trust Inc. | 1,421,731 | 15,923 |
| | | | 4,730,207 |
| Hotel & Resort REITs (5.2%) | |
| | Host Hotels & | | |
| | Resorts Inc. | 36,669,316 | 767,856 |
| | Park Hotels & | | |
| | Resorts Inc. | 10,042,508 | 314,130 |
| 2 | Hospitality Properties | | |
| | Trust | 8,232,053 | 232,720 |
| | RLJ Lodging Trust | 8,746,524 | 197,584 |
| | Apple Hospitality REIT | | |
| | Inc. | 10,952,772 | 197,040 |
| | Ryman Hospitality | | |
| | Properties Inc. | 2,309,612 | 196,340 |
| 2 | LaSalle Hotel | | |
| | Properties | 5,659,198 | 196,204 |
| | Sunstone Hotel | | |
| | Investors Inc. | 11,278,073 | 183,494 |
| | Pebblebrook Hotel | | |
| | Trust | 3,451,898 | 133,071 |
8
Real Estate Index Fund
| | | |
| | | | Market |
| | | | Value• |
| | | Shares | ($000) |
| | Xenia Hotels & Resorts | | |
| | Inc. | 5,348,947 | 130,461 |
| 2 | DiamondRock | | |
| | Hospitality Co. | 10,035,747 | 119,626 |
| | MGM Growth | | |
| | Properties LLC | | |
| | Class A | 3,535,744 | 107,133 |
| 2 | Chesapeake Lodging | | |
| | Trust | 3,026,140 | 96,897 |
| | Summit Hotel | | |
| | Properties Inc. | 5,212,962 | 73,763 |
| * | CorePoint Lodging Inc. | 2,061,133 | 52,064 |
| | Chatham Lodging Trust | 2,293,686 | 49,406 |
| | Hersha Hospitality | | |
| | Trust Class A | 1,894,216 | 40,896 |
| | Ashford Hospitality | | |
| | Trust Inc. | 4,618,165 | 36,484 |
| | Braemar Hotels & | | |
| | Resorts Inc. | 1,439,908 | 16,458 |
| | | | 3,141,627 |
| Industrial REITs (5.9%) | | |
| | Prologis Inc. | 26,622,575 | 1,746,973 |
| | Duke Realty Corp. | 17,852,611 | 519,868 |
| | DCT Industrial Trust | | |
| | Inc. | 4,689,947 | 313,617 |
| 2 | Gramercy Property | | |
| | Trust | 8,043,547 | 220,313 |
| | First Industrial Realty | | |
| | Trust Inc. | 6,041,015 | 196,635 |
| | EastGroup Properties | | |
| | Inc. | 1,740,004 | 165,857 |
| | STAG Industrial Inc. | 4,858,516 | 132,735 |
| | Rexford Industrial | | |
| | Realty Inc. | 3,921,517 | 120,155 |
| | Terreno Realty Corp. | 2,776,257 | 102,472 |
| | Monmouth Real Estate | | |
| | Investment Corp. | 3,689,583 | 61,505 |
| | | | 3,580,130 |
| Office REITs (9.4%) | | |
| | Boston Properties Inc. | 7,713,025 | 968,216 |
| | Alexandria Real Estate | | |
| | Equities Inc. | 5,060,878 | 644,958 |
| | Vornado Realty Trust | 8,544,235 | 614,501 |
| 2 | SL Green Realty Corp. | 4,519,474 | 466,003 |
| | Kilroy Realty Corp. | 4,949,182 | 361,043 |
| | Douglas Emmett Inc. | 8,080,751 | 313,856 |
| 2 | Hudson Pacific | | |
| | Properties Inc. | 7,853,503 | 269,061 |
| 2 | Highwoods Properties | | |
| | Inc. | 5,187,658 | 254,766 |
| | JBG SMITH Properties | 5,605,620 | 204,605 |
| *,2 | Equity Commonwealth | 6,267,556 | 202,066 |
| 2 | Cousins Properties Inc. | 21,065,444 | 196,330 |
| | Paramount Group Inc. | 10,874,996 | 167,910 |
| | | |
| | Corporate Office | | |
| | Properties Trust | 5,068,428 | 150,735 |
| 2 | Brandywine Realty | | |
| | Trust | 8,932,593 | 147,299 |
| 2 | Columbia Property | | |
| | Trust Inc. | 6,001,123 | 139,106 |
| 2 | Piedmont Office Realty | |
| | Trust Inc. Class A | 6,764,474 | 133,801 |
| | Mack-Cali Realty Corp. | 4,499,690 | 87,609 |
| | Government Properties | | |
| | Income Trust | 4,947,035 | 74,552 |
| | Select Income REIT | 3,358,983 | 70,035 |
| | Tier REIT Inc. | 2,392,451 | 56,869 |
| | Easterly Government | | |
| | Properties Inc. | 2,883,408 | 54,641 |
| | Franklin Street | | |
| | Properties Corp. | 5,346,575 | 47,103 |
| | NorthStar Realty | | |
| | Europe Corp. | 2,483,706 | 34,002 |
| | City Office REIT Inc. | 1,691,991 | 21,573 |
| ^ | New York REIT Inc. | 816,297 | 15,028 |
| | | | 5,695,668 |
| Other (10.6%) 3 | | |
| 4,5 | Vanguard Real Estate II | | |
| | Index Fund | 325,763,666 | 6,439,097 |
| |
| Residential REITs (11.7%) | | |
| | AvalonBay | | |
| | Communities Inc. | 6,897,837 | 1,219,882 |
| | Equity Residential | 18,387,880 | 1,203,119 |
| | Essex Property | | |
| | Trust Inc. | 3,297,510 | 792,886 |
| | Mid-America | | |
| | Apartment | | |
| | Communities Inc. | 5,684,143 | 572,848 |
| 2 | UDR Inc. | 13,422,453 | 516,496 |
| | Camden Property Trust | 4,636,613 | 429,304 |
| | Sun Communities Inc. | 3,993,418 | 387,202 |
| | Equity LifeStyle | | |
| | Properties Inc. | 4,223,496 | 384,296 |
| | Invitation Homes Inc. | 15,562,692 | 359,654 |
| 2 | Apartment Investment | | |
| | & Management Co. | 7,876,577 | 335,936 |
| | American Homes 4 | | |
| | Rent Class A | 12,799,950 | 283,391 |
| | American Campus | | |
| | Communities Inc. | 6,819,352 | 281,298 |
| | Education Realty | | |
| | Trust Inc. | 3,788,397 | 156,688 |
| | Independence Realty | | |
| | Trust Inc. | 4,246,269 | 43,100 |
| | Preferred Apartment | | |
| | Communities Inc. | | |
| | Class A | 1,951,985 | 33,028 |
9
Real Estate Index Fund
| | | |
| | | | Market |
| | | | Value• |
| | | Shares | ($000) |
| 2 | Investors Real Estate | | |
| | Trust | 5,974,676 | 32,741 |
| | NexPoint Residential | | |
| | Trust Inc. | 892,181 | 26,712 |
| | UMH Properties Inc. | 1,621,482 | 25,036 |
| | Front Yard Residential | | |
| | Corp. | 2,509,153 | 24,238 |
| | | | 7,107,855 |
| Retail REITs (13.8%) | | |
| 2 | Simon Property Group | | |
| | Inc. | 15,998,686 | 2,819,128 |
| | Realty Income Corp. | 14,198,113 | 791,829 |
| | GGP Inc. | 33,461,417 | 713,397 |
| | Federal Realty | | |
| | Investment Trust | 3,399,270 | 426,608 |
| * | Regency Centers Corp. | 6,682,681 | 425,219 |
| | Kimco Realty Corp. | 20,647,263 | 344,603 |
| ^ | National Retail | | |
| | Properties Inc. | 7,703,744 | 343,664 |
| | Macerich Co. | 5,277,489 | 311,689 |
| | Brixmor Property | | |
| | Group Inc. | 14,766,037 | 261,211 |
| | Taubman Centers Inc. | 3,045,885 | 188,997 |
| 2 | Spirit Realty Capital | | |
| | Inc. | 22,455,894 | 187,956 |
| | Weingarten Realty | | |
| | Investors | 6,113,256 | 184,743 |
| | Retail Properties of | | |
| | America Inc. | 10,965,662 | 137,619 |
| | Urban Edge Properties | 5,685,959 | 128,958 |
| 2 | Acadia Realty Trust | 4,182,463 | 113,261 |
| ^,2 | Tanger Factory Outlet | | |
| | Centers Inc. | 4,718,703 | 112,541 |
| | DDR Corp. | 7,824,825 | 107,200 |
| | Retail Opportunity | | |
| | Investments Corp. | 5,084,425 | 96,146 |
| | Agree Realty Corp. | 1,548,340 | 82,434 |
| | Washington Prime | | |
| | Group Inc. | 9,280,656 | 74,524 |
| | Kite Realty Group Trust | 4,172,570 | 70,391 |
| ^ | Seritage Growth | | |
| | Properties Class A | 1,612,391 | 68,220 |
| | Ramco-Gershenson | | |
| | Properties Trust | 3,958,024 | 52,048 |
| | Getty Realty Corp. | 1,679,305 | 48,112 |
| ^ | CBL & Associates | | |
| | Properties Inc. | 8,547,812 | 46,586 |
| | Alexander’s Inc. | 115,034 | 42,618 |
| | Pennsylvania REIT | 3,512,166 | 37,299 |
| | Saul Centers Inc. | 659,661 | 35,147 |
| | Urstadt Biddle | | |
| | Properties Inc. | | |
| | Class A | 1,463,522 | 32,578 |
| | | |
| * | Retail Value Inc. | 785,615 | 25,957 |
| | Whitestone REIT | 1,737,087 | 22,582 |
| *,2 | Spirit MTA REIT | 2,250,232 | 22,480 |
| | Cedar Realty Trust Inc. | 4,569,840 | 21,752 |
| | Urstadt Biddle | | |
| | Properties Inc. | 47,628 | 855 |
| | | | 8,378,352 |
| Specialized REITs (27.8%) | | |
| | American Tower Corp. | 22,010,381 | 3,262,819 |
| | Crown Castle | | |
| | International Corp. | 20,315,190 | 2,251,532 |
| | Equinix Inc. | 3,955,417 | 1,737,536 |
| | Public Storage | 7,821,913 | 1,703,847 |
| | Weyerhaeuser Co. | 37,762,733 | 1,290,730 |
| | Digital Realty Trust Inc. | 10,259,241 | 1,245,677 |
| *,2 | SBA Communications | | |
| | Corp. Class A | 5,814,326 | 920,117 |
| | Extra Space Storage | | |
| | Inc. | 6,298,346 | 591,856 |
| | Iron Mountain Inc. | 13,538,677 | 475,343 |
| | Gaming and Leisure | | |
| | Properties Inc. | 10,129,713 | 367,911 |
| | CyrusOne Inc. | 4,800,429 | 297,243 |
| | CubeSmart | 9,116,753 | 276,785 |
| | Lamar Advertising Co. | | |
| | Class A | 3,687,474 | 271,509 |
| | VICI Properties Inc. | 12,732,582 | 259,108 |
| | EPR Properties | 3,687,897 | 245,208 |
| | Rayonier Inc. | 6,458,475 | 226,111 |
| | Life Storage Inc. | 2,328,080 | 223,403 |
| | CoreSite Realty Corp. | 1,712,162 | 191,933 |
| 2 | GEO Group Inc. | 6,200,595 | 160,471 |
| | CoreCivic Inc. | 5,907,133 | 151,459 |
| | Uniti Group Inc. | 8,329,986 | 147,274 |
| | Outfront Media Inc. | 6,899,481 | 146,614 |
| | PotlatchDeltic Corp. | 2,968,273 | 138,767 |
| | QTS Realty Trust Inc. | | |
| | Class A | 2,525,525 | 107,966 |
| | National Storage | | |
| | Affiliates Trust | 2,807,319 | 80,935 |
| | Four Corners Property | | |
| | Trust Inc. | 3,060,329 | 76,202 |
| | InfraREIT Inc. | 2,184,071 | 45,756 |
| | CatchMark Timber | | |
| | Trust Inc. Class A | 2,415,825 | 30,005 |
| ^ | Farmland Partners Inc. | 1,520,290 | 10,247 |
| | | | 16,934,364 |
| Total Equity Real Estate | | |
| Investment Trusts (REITs) | | |
| (Cost $52,041,165) | | 58,518,225 |

Real Estate Index Fund
| | | |
| | | | Market |
| | | | Value• |
| | | Shares | ($000) |
| Real Estate Management & Development (3.5%) |
| Diversified Real Estate Activities (0.2%) |
| * | St. Joe Co. | 1,996,823 | 35,244 |
| * | Five Point Holdings | | |
| | LLC Class A | 2,795,290 | 31,279 |
| | RMR Group Inc. | | |
| | Class A | 304,537 | 26,434 |
| * | Tejon Ranch Co. | 1,103,627 | 25,825 |
| | | | 118,782 |
| Real Estate Development (0.5%) | |
| * | Howard Hughes Corp. | 2,057,266 | 278,862 |
| *,^ | Forestar Group Inc. | 518,135 | 11,762 |
| | | | 290,624 |
| Real Estate Operating Companies (0.2%) |
| | Kennedy-Wilson | | |
| | Holdings Inc. | 6,781,674 | 141,737 |
| * | FRP Holdings Inc. | 346,880 | 22,547 |
| | | | 164,284 |
| Real Estate Services (2.6%) | |
| * | CBRE Group Inc. | | |
| | Class A | 16,114,296 | 802,492 |
| | Jones Lang LaSalle Inc. | 2,269,652 | 388,133 |
| ^,2 | Realogy Holdings Corp. | 6,532,618 | 142,868 |
| | HFF Inc. Class A | 1,829,307 | 82,337 |
| *,^ | Redfin Corp. | 2,243,188 | 54,958 |
| | RE/MAX Holdings Inc. | | |
| | Class A | 883,039 | 44,859 |
| * | Marcus & Millichap Inc. | 955,319 | 38,414 |
| *,^ | Altisource Portfolio | | |
| | Solutions SA | 574,397 | 19,133 |
| | | | 1,573,194 |
| Total Real Estate Management | |
| & Development (Cost $2,089,227) | 2,146,884 |
| Total Common Stock | | |
| (Cost $54,130,392) | | 60,665,109 |
| Temporary Cash Investment (0.6%)1 | |
| Money Market Fund (0.6%) | | |
| 6,7 | Vanguard Market | | |
| | Liquidity Fund, | | |
| | 2.145% | 3,859,322 | 385,932 |
| Total Temporary Cash Investments | |
| (Cost $385,946) | | 385,932 |
| Total Investments (100.4%) | | |
| (Cost $54,516,338) | | 61,051,041 |
| Other Assets and Liabilities (-0.4%) | |
| Other Assets | | 100,804 |
| Liabilities7 | | (361,433) |
| | | | (260,629) |
| Net Assets (100%) | | 60,790,412 |
| |
| | Amount |
| | ($000) |
| Statement of Assets and Liabilities | |
| Assets | |
| Investments in Securities, at Value | |
| Unaffiliated Vanguard Funds | 44,415,050 |
| Affiliated Vanguard Funds | 10,196,894 |
| Vanguard Real Estate II Index Fund | 6,439,097 |
| Total Investment in Securities | 61,051,041 |
| Investment in Vanguard | 3,167 |
| Receivables for Accrued Income | 32,893 |
| Receivables for Capital Shares Issued | 47,033 |
| Unrealized Appreciation—Swap Contracts | 2,570 |
| Other Assets | 15,141 |
| Total Assets | 61,151,845 |
| Liabilities | |
| Payables for Investment Securities | |
| Purchased | 110,274 |
| Collateral for Securities on Loan | 187,969 |
| Payables for Capital Shares | |
| Redeemed | 38,268 |
| Payables to Vanguard | 24,677 |
| Unrealized Depreciation—Swap Contracts | 245 |
| Total Liabilities | 361,433 |
| Net Assets | 60,790,412 |
| |
| At July 31, 2018, net assets consisted of: |
| |
| | Amount |
| | ($000) |
| Paid-in Capital | 55,945,263 |
| Undistributed Net Investment Income | (11,530) |
| Accumulated Net Realized Losses | (1,680,349) |
| Unrealized Appreciation (Depreciation) | |
| Investment Securities | 6,534,703 |
| Swap Contracts | 2,325 |
| Net Assets | 60,790,412 |
11
Real Estate Index Fund
| |
| | Amount |
| | ($000) |
| Investor Shares—Net Assets | |
| Applicable to 73,352,148 outstanding | |
| $.001 par value shares of beneficial | |
| interest (unlimited authorization) | 1,997,808 |
| Net Asset Value Per Share— | |
| Investor Shares | $27.24 |
| |
| |
| ETF Shares—Net Assets | |
| Applicable to 392,776,033 outstanding |
| $.001 par value shares of beneficial | |
| interest (unlimited authorization) | 32,202,718 |
| Net Asset Value Per Share— | |
| ETF Shares | $81.99 |
| |
| |
| Admiral Shares—Net Assets | |
| Applicable to 154,681,018 outstanding |
| $.001 par value shares of beneficial | |
| interest (unlimited authorization) | 17,973,632 |
| Net Asset Value Per Share— | |
| Admiral Shares | $116.20 |
| |
| | Amount |
| | ($000) |
| Institutional Shares—Net Assets | |
| Applicable to 479,088,652 outstanding | |
| $.001 par value shares of beneficial | |
| interest (unlimited authorization) | 8,616,254 |
| Net Asset Value Per Share— | |
| Institutional Shares | $17.98 |
• See Note A in Notes to Financial Statements.
* Non-income-producing security.
§ Security value determined using significant unobservable inputs.
^ Includes partial security positions on loan to broker-dealers.
The total value of securities on loan is $183,533,000.
1 The fund invests a portion of its assets in Real Estate
Investment Trusts through the use of swap contracts. After
giving effect to swap investments, the fund’s effective Real
Estate Investment Trust and temporary cash investment positions
represent 100.0% and 0.4%, respectively, of net assets.
2 Considered an affiliated company of the fund as the fund
owns more than 5% of the outstanding voting securities of
such company. The total value of affiliated companies is
$9,810,962,000.
3 “Other” represents securities that are not classified by the
fund’s benchmark index.
4 Considered an affiliated company of the fund as the issuer is
another member of The Vanguard Group.
5 Represents a wholly owned subsidiary of the fund. See
accompanying financial statements for Vanguard Real Estate
II Index Fund Schedule of Investments.
6 Affiliated money market fund available only to Vanguard funds
and certain trusts and accounts managed by Vanguard. Rate
shown is the 7-day yield.
7 Includes $187,969,000 of collateral received for securities
on loan.
REIT—Real Estate Investment Trust.
12
Real Estate Index Fund
| | | | | |
| Derivative Financial Instruments Outstanding as of Period End | | | |
| |
| Total Return Swaps | | | | | |
| | | | | | Value and |
| | | | | Floating | Unrealized |
| | | | Notional | Interest Rate | Appreciation |
| | Termination | | Amount | Received | (Depreciation) |
| Reference Entity | Date | Counterparty | ($000) | (Paid)1 | ($000) |
| Federal Realty Investment Trust | 8/31/18 | GSCM | 32,903 | (2.090%) | (67) |
| Regency Centers Corp. | 10/19/18 | GSCM | 12,358 | (2.064%) | 364 |
| Regency Centers Corp. | 10/19/18 | GSCM | 12,298 | (2.081%) | 422 |
| Regency Centers Corp. | 10/19/18 | GCSM | 12,290 | (2.069%) | 431 |
| Regency Centers Corp. | 10/19/18 | GSCM | 12,156 | (2.082%) | 562 |
| Regency Centers Corp. | 10/19/18 | GSCM | 12,140 | (2.086%) | 578 |
| Kimco Realty Corp. | 8/31/18 | GSCM | 10,364 | (2.090%) | (29) |
| Retail Opportunity | | | | | |
| Investments Corp. | 8/31/18 | GSCM | 10,155 | (2.090%) | (149) |
| Brixmor Property Group Inc. | 8/31/18 | GSCM | 7,321 | (2.090%) | 213 |
| | | | | | 2,325 |
| GSCM—Goldman Sachs Capital Management. | | | | |
| 1 Payment received/paid quarterly. | | | | | |
Unrealized appreciation (depreciation) on open swap contracts is required to be treated as ordinary income (loss) for tax purposes.
See accompanying Notes, which are an integral part of the Financial Statements.
13
Real Estate Index Fund
Statement of Operations
| |
| | Six Months Ended |
| | July 31, 2018 |
| | ($000) |
| Investment Income | |
| Income | |
| Dividends Received from Unaffiliated Issuers | 114,449 |
| Dividends Received from Affiliated Issuers | 760,072 |
| Dividends Received from Vanguard Real Estate II Index Fund | 98,792 |
| Interest from Affiliated Issuers | 533 |
| Securities Lending—Net | 654 |
| Total Income | 974,500 |
| Expenses | |
| The Vanguard Group—Note B | |
| Investment Advisory Services | 1,598 |
| Management and Administrative—Investor Shares | 2,303 |
| Management and Administrative—ETF Shares | 15,723 |
| Management and Administrative—Admiral Shares | 8,875 |
| Management and Administrative—Institutional Shares | 3,558 |
| Marketing and Distribution—Investor Shares | 148 |
| Marketing and Distribution—ETF Shares | 592 |
| Marketing and Distribution—Admiral Shares | 531 |
| Marketing and Distribution—Institutional Shares | 96 |
| Custodian Fees | 261 |
| Auditing Fees | 3 |
| Shareholders’ Reports—Investor Shares | 39 |
| Shareholders’ Reports—ETF Shares | 521 |
| Shareholders’ Reports—Admiral Shares | 121 |
| Shareholders’ Reports—Institutional Shares | 35 |
| Trustees’ Fees and Expenses | 18 |
| Total Expenses | 34,422 |
| Net Investment Income | 940,078 |
| Realized Net Gain (Loss) | |
| Capital Gain Distributions Received from Unaffiliated Issuers | 1,632 |
| Capital Gain Distributions Received from Affiliated Issuers | 132,837 |
| Capital Gain Distributions Received from Vanguard Real Estate II Index Fund | 13,020 |
| Investment Securities Sold—Unaffiliated Issuers | (112) |
| Investment Securities Sold—Affiliated Issuers | (808,618) |
| Investment Securities Sold—Vanguard Real Estate II Index Fund | — |
| Futures Contracts | (18) |
| Swap Contracts | 3,896 |
| Realized Net Gain (Loss) | (657,363) |
| Change in Unrealized Appreciation (Depreciation) | |
| Investment Securities—Unaffiliated Issuers | 431,446 |
| Investment Securities—Affiliated Issuers | 1,868,163 |
| Investment Securities—Vanguard Real Estate II Index Fund | 200,873 |
| Swap Contracts | 2,384 |
| Change in Unrealized Appreciation (Depreciation) | 2,502,866 |
| Net Increase (Decrease) in Net Assets Resulting from Operations | 2,785,581 |
| |
| See accompanying Notes, which are an integral part of the Financial Statements. | |
14
Real Estate Index Fund
Statement of Changes in Net Assets
| | |
| | Six Months Ended | Year Ended |
| | July 31, | January 31, |
| | 2018 | 2018 |
| | ($000) | ($000) |
| Increase (Decrease) in Net Assets | | |
| Operations | | |
| Net Investment Income | 940,078 | 1,912,910 |
| Realized Net Gain (Loss) | (657,363) | 2,288,664 |
| Change in Unrealized Appreciation (Depreciation) | 2,502,866 | (3,829,824) |
| Net Increase (Decrease) in Net Assets Resulting from Operations | 2,785,581 | 371,750 |
| Distributions | | |
| Net Investment Income | | |
| Investor Shares | (35,422) | (69,040) |
| ETF Shares | (557,236) | (1,025,920) |
| Admiral Shares | (316,304) | (545,730) |
| Institutional Shares | (149,845) | (244,477) |
| Realized Capital Gain | | |
| Investor Shares | — | (983) |
| ETF Shares | — | (14,088) |
| Admiral Shares | — | (7,496) |
| Institutional Shares | — | (3,343) |
| Return of Capital | | |
| Investor Shares | — | (28,709) |
| ETF Shares | — | (426,390) |
| Admiral Shares | — | (226,815) |
| Institutional Shares | — | (101,603) |
| Total Distributions | (1,058,807) | (2,694,594) |
| Capital Share Transactions | | |
| Investor Shares | (203,169) | (383,660) |
| ETF Shares | (1,024,770) | 138,764 |
| Admiral Shares | (328,120) | 75,811 |
| Institutional Shares | 166,325 | 678,950 |
| Net Increase (Decrease) from Capital Share Transactions | (1,389,734) | 509,865 |
| Total Increase (Decrease) | 337,040 | (1,812,979) |
| Net Assets | | |
| Beginning of Period | 60,453,372 | 62,266,351 |
| End of Period1 | 60,790,412 | 60,453,372 |
| 1 Net Assets—End of Period includes undistributed (overdistributed) net investment income of ($11,530,000) and $103,303,000. |
See accompanying Notes, which are an integral part of the Financial Statements.
15
Real Estate Index Fund
Financial Highlights
| | | | | | |
| Investor Shares | | | | | | |
| Six Months | | | | | |
| | Ended | | | | | |
| For a Share Outstanding | July 31, | Year Ended January 31, |
| Throughout Each Period | 2018 | 2018 | 2017 | 2016 | 2015 | 2014 |
| Net Asset Value, Beginning of Period | $26.40 | $27.38 | $25.59 | $28.73 | $22.37 | $22.66 |
| Investment Operations | | | | | | |
| Net Investment Income | . 3991 | .7611 | .746 | .711 | .645 | .579 |
| Net Realized and Unrealized Gain (Loss) | | | | | | |
| on Investments | .901 | (.614) | 2.324 | (2.851) | 6.650 | .025 |
| Total from Investment Operations | 1.300 | .147 | 3.070 | (2.140) | 7.295 | .604 |
| Distributions | | | | | | |
| Dividends from Net Investment Income | (.460) | (.788) | (.752) | (.695) | (.624) | (.626) |
| Distributions from Realized Capital Gains | — | (.011) | (.187) | — | — | — |
| Return of Capital | — | (.328) | (.341) | (.305) | (.311) | (.268) |
| Total Distributions | (.460) | (1.127) | (1.280) | (1.000) | (.935) | (.894) |
| Net Asset Value, End of Period | $27.24 | $26.40 | $27.38 | $25.59 | $28.73 | $22.37 |
| |
| Total Return2 | 5.08% | 0.45% | 12.07% | -7.44% | 33.29% | 2.78% |
| |
| Ratios/Supplemental Data | | | | | | |
| Net Assets, End of Period (Millions) | $1,998 | $2,143 | $2,603 | $2,621 | $3,231 | $2,482 |
| Ratio of Total Expenses to | | | | | | |
| Average Net Assets | 0.26% | 0.26% | 0.26% | 0.26% | 0.26% | 0.24% |
| Ratio of Net Investment Income to | | | | | | |
| Average Net Assets | 3.16% | 2.87% | 2.60% | 2.66% | 2.56% | 2.51% |
| Portfolio Turnover Rate3 | 26% | 6% | 7% | 11% | 8% | 11% |
The expense ratio, net investment income ratio, and turnover rate for the current period have been annualized.
1 Calculated based on average shares outstanding.
2 Total returns do not include transaction or account service fees that may have applied in the periods shown. Fund prospectuses
provide information about any applicable transaction and account service fees.
3 Excludes the value of portfolio securities received or delivered as a result of in-kind purchases or redemptions of the fund’s capital
shares, including ETF Creation Units.
See accompanying Notes, which are an integral part of the Financial Statements.
16
Real Estate Index Fund
Financial Highlights
| | | | | | |
| ETF Shares | | | | | | |
| Six Months | | | | | |
| | Ended | | | | | |
| For a Share Outstanding | July 31, | Year Ended January 31, |
| Throughout Each Period | 2018 | 2018 | 2017 | 2016 | 2015 | 2014 |
| Net Asset Value, Beginning of Period | $79.47 | $82.43 | $77.05 | $86.49 | $67.36 | $68.24 |
| Investment Operations | | | | | | |
| Net Investment Income | 1.2711 | 2.4991 | 2.334 | 2.217 | 2.011 | 1.814 |
| Net Realized and Unrealized Gain (Loss) | | | | | | |
| on Investments | 2.687 | (1.945) | 7.022 | (8.533) | 20.038 | .097 |
| Total from Investment Operations | 3.958 | .554 | 9.356 | (6.316) | 22.049 | 1.911 |
| Distributions | | | | | | |
| Dividends from Net Investment Income | (1.438) | (2.458) | (2.353) | (2.170) | (1.947) | (1.955) |
| Distributions from Realized Capital Gains | — | (.034) | (.563) | — | — | — |
| Return of Capital | — | (1.022) | (1.060) | (.954) | (.972) | (.836) |
| Total Distributions | (1.438) | (3.514) | (3.976) | (3.124) | (2.919) | (2.791) |
| Net Asset Value, End of Period | $81.99 | $79.47 | $82.43 | $77.05 | $86.49 | $67.36 |
| |
| Total Return | 5.13% | 0.59% | 12.25% | -7.31% | 33.41% | 2.93% |
| |
| Ratios/Supplemental Data | | | | | | |
| Net Assets, End of Period (Millions) | $32,203 | $32,377 | $33,527 | $27,007 | $29,487 | $18,528 |
| Ratio of Total Expenses to | | | | | | |
| Average Net Assets | 0.12% | 0.12% | 0.12% | 0.12% | 0.12% | 0.10% |
| Ratio of Net Investment Income to | | | | | | |
| Average Net Assets | 3.30% | 3.01% | 2.74% | 2.80% | 2.70% | 2.65% |
| Portfolio Turnover Rate2 | 26% | 6% | 7% | 11% | 8% | 11% |
The expense ratio, net investment income ratio, and turnover rate for the current period have been annualized.
1 Calculated based on average shares outstanding.
2 Excludes the value of portfolio securities received or delivered as a result of in-kind purchases or redemptions of the fund’s capital
shares, including ETF Creation Units.
See accompanying Notes, which are an integral part of the Financial Statements.
17
Real Estate Index Fund
Financial Highlights
| | | | | | |
| Admiral Shares | | | | | | |
| Six Months | | | | | |
| | Ended | | | | | |
| For a Share Outstanding | July 31, | Year Ended January 31, |
| Throughout Each Period | 2018 | 2018 | 2017 | 2016 | 2015 | 2014 |
| Net Asset Value, Beginning of Period | $112.63 | $116.83 | $109.19 | $122.58 | $95.46 | $96.70 |
| Investment Operations | | | | | | |
| Net Investment Income | 1.7991 | 3.5381 | 3.306 | 3.142 | 2.852 | 2.569 |
| Net Realized and Unrealized Gain (Loss) | | | | | | |
| on Investments | 3.810 | (2.761) | 9.966 | (12.105) | 28.403 | .148 |
| Total from Investment Operations | 5.609 | .777 | 13.272 | (8.963) | 31.255 | 2.717 |
| Distributions | | | | | | |
| Dividends from Net Investment Income | (2.039) | (3.483) | (3.333) | (3.076) | (2.758) | (2.772) |
| Distributions from Realized Capital Gains | — | (.048) | (.798) | — | — | — |
| Return of Capital | — | (1.447) | (1.501) | (1.351) | (1.377) | (1.185) |
| Total Distributions | (2.039) | (4.978) | (5.632) | (4.427) | (4.135) | (3.957) |
| Net Asset Value, End of Period | $116.20 | $112.63 | $116.83 | $109.19 | $122.58 | $95.46 |
| |
| Total Return2 | 5.14% | 0.58% | 12.23% | -7.30% | 33.46% | 2.94% |
| |
| Ratios/Supplemental Data | | | | | | |
| Net Assets, End of Period (Millions) | $17,974 | $17,757 | $18,337 | $15,029 | $15,725 | $7,987 |
| Ratio of Total Expenses to | | | | | | |
| Average Net Assets | 0.12% | 0.12% | 0.12% | 0.12% | 0.12% | 0.10% |
| Ratio of Net Investment Income to | | | | | | |
| Average Net Assets | 3.30% | 3.01% | 2.74% | 2.80% | 2.70% | 2.65% |
| Portfolio Turnover Rate3 | 26% | 6% | 7% | 11% | 8% | 11% |
The expense ratio, net investment income ratio, and turnover rate for the current period have been annualized.
1 Calculated based on average shares outstanding.
2 Total returns do not include transaction or account service fees that may have applied in the periods shown. Fund prospectuses
provide information about any applicable transaction and account service fees.
3 Excludes the value of portfolio securities received or delivered as a result of in-kind purchases or redemptions of the fund’s capital
shares, including ETF Creation Units.
See accompanying Notes, which are an integral part of the Financial Statements.
18
Real Estate Index Fund
Financial Highlights
| | | | | | |
| Institutional Shares | | | | | | |
| Six Months | | | | | |
| | Ended | | | | | |
| For a Share Outstanding | July 31, | Year Ended January 31, |
| Throughout Each Period | 2018 | 2018 | 2017 | 2016 | 2015 | 2014 |
| Net Asset Value, Beginning of Period | $17.43 | $18.08 | $16.90 | $18.97 | $14.78 | $14.97 |
| Investment Operations | | | | | | |
| Net Investment Income | . 2811 | .5681 | .515 | .489 | .444 | .400 |
| Net Realized and Unrealized Gain (Loss) | | | | | | |
| on Investments | .586 | (.444) | 1.540 | (1.870) | 4.390 | .025 |
| Total from Investment Operations | .867 | .124 | 2.055 | (1.381) | 4.834 | .425 |
| Distributions | | | | | | |
| Dividends from Net Investment Income | (.317) | (.542) | (.519) | (.479) | (.430) | (.431) |
| Distributions from Realized Capital Gains | — | (.007) | (.123) | — | — | — |
| Return of Capital | — | (.225) | (.233) | (.210) | (.214) | (.184) |
| Total Distributions | (.317) | (.774) | (.875) | (.689) | (.644) | (.615) |
| Net Asset Value, End of Period | $17.98 | $17.43 | $18.08 | $16.90 | $18.97 | $14.78 |
| |
| Total Return2 | 5.14% | 0.60% | 12.23% | -7.27% | 33.43% | 2.97% |
| |
| Ratios/Supplemental Data | | | | | | |
| Net Assets, End of Period (Millions) | $8,616 | $8,176 | $7,799 | $6,785 | $6,788 | $3,922 |
| Ratio of Total Expenses to | | | | | | |
| Average Net Assets | 0.10% | 0.10% | 0.10% | 0.10% | 0.10% | 0.08% |
| Ratio of Net Investment Income to | | | | | | |
| Average Net Assets | 3.32% | 3.03% | 2.76% | 2.82% | 2.72% | 2.67% |
| Portfolio Turnover Rate3 | 26% | 6% | 7% | 11% | 8% | 11% |
The expense ratio, net investment income ratio, and turnover rate for the current period have been annualized.
1 Calculated based on average shares outstanding.
2 Total returns do not include transaction fees that may have applied in the periods shown. Fund prospectuses provide information
about any applicable transaction fees.
3 Excludes the value of portfolio securities received or delivered as a result of in-kind purchases or redemptions of the fund’s capital
shares, including ETF Creation Units.
See accompanying Notes, which are an integral part of the Financial Statements.
19
Real Estate Index Fund
Notes to Financial Statements
Vanguard Real Estate Index Fund is registered under the Investment Company Act of 1940 as an open-end investment company, or mutual fund. The fund offers four classes of shares: Investor Shares, ETF Shares, Admiral Shares, and Institutional Shares. Investor Shares are available to any investor who meets the fund’s minimum purchase requirements. ETF Shares are listed for trading on NYSE Arca; they can be purchased and sold through a broker. Admiral Shares and Institutional Shares are designed for investors who meet certain administrative, service, and account-size criteria.
As a part of its principal investment strategy, the fund attempts to replicate its benchmark index by investing all, or substantially all, of its assets—either directly or indirectly through a wholly owned subsidiary—in the stocks that make up the index. Vanguard Real Estate II Index Fund is the wholly owned subsidiary in which the fund has invested a portion of its assets. For additional financial information about the Real Estate II Index Fund, refer to the accompanying financial statements.
A. The following significant accounting policies conform to generally accepted accounting principles for U.S. investment companies. The fund consistently follows such policies in preparing its financial statements.
1. Security Valuation: Securities are valued as of the close of trading on the New York Stock Exchange (generally 4 p.m., Eastern time) on the valuation date. Equity securities are valued at the latest quoted sales prices or official closing prices taken from the primary market in which each security trades; such securities not traded on the valuation date are valued at the mean of the latest quoted bid and asked prices. Securities for which market quotations are not readily available, or whose values have been materially affected by events occurring before the fund’s pricing time but after the close of the securities’ primary markets, are valued by methods deemed by the board of trustees to represent fair value. Investment in affiliated Vanguard funds are valued at that fund’s net asset value.
2. Futures Contracts: The fund uses index futures contracts to a limited extent, with the objectives of maintaining full exposure to the stock market, maintaining liquidity, and minimizing transaction costs. The fund may purchase futures contracts to immediately invest incoming cash in the market, or sell futures in response to cash outflows, thereby simulating a fully invested position in the underlying index while maintaining a cash balance for liquidity. The primary risks associated with the use of futures contracts are imperfect correlation between changes in market values of stocks held by the fund and the prices of futures contracts, and the possibility of an illiquid market. Counter-party risk involving futures is mitigated because a regulated clearinghouse is the counterparty instead of the clearing broker. To further mitigate counterparty risk, the fund trades futures contracts on an exchange, monitors the financial strength of its clearing brokers and clearinghouse, and has entered into clearing agreements with its clearing brokers. The clearinghouse imposes initial margin requirements to secure the fund’s performance and requires daily settlement of variation margin representing changes in the market value of each contract.
Futures contracts are valued at their quoted daily settlement prices. The notional amounts of the contracts are not recorded in the Statement of Assets and Liabilities. Fluctuations in the value of the contracts are recorded in the Statement of Assets and Liabilities as an asset (liability) and in the Statement of Operations as unrealized appreciation (depreciation) until the contracts are closed, when they are recorded as realized futures gains (losses).
During the six months ended July 31, 2018, the fund’s average investments in long and short futures contracts represented less than 1% and 0% of net assets, respectively, based on the average of the notional amounts at each quarter-end during the period. The fund had no open futures contracts at July 31, 2018.
20
Real Estate Index Fund
3. Swap Contracts: The fund has entered into equity swap contracts to earn the total return on selected reference stocks in the fund’s target index. Under the terms of the swaps, the fund receives the total return on the referenced stock (i.e., receiving the increase or paying the decrease in value of the selected reference stock and receiving the equivalent of any dividends in respect of the selected referenced stock) over a specified period of time, applied to a notional amount that represents the value of a designated number of shares of the selected reference stock at the beginning of the equity swap contract. The fund also pays a floating rate that is based on short-term interest rates, applied to the notional amount. At the same time, the fund invests an amount approximating the notional amount of the swap in high-quality temporary cash investments.
The notional amounts of swap contracts are not recorded in the Statement of Assets and Liabilities. Swaps are valued daily based on market quotations received from independent pricing services or recognized dealers and the change in value is recorded in the Statement of Assets and Liabilities as an asset (liability) and in the Statement of Operations as unrealized appreciation (depreciation) until termination of the swap, at which time realized gain (loss) is recorded.
A risk associated with all types of swaps is the possibility that a counterparty may default on its obligation to pay net amounts due to the fund. The fund’s maximum amount subject to counterparty risk is the unrealized appreciation on the swap contract. The fund mitigates its counterparty risk by entering into swaps only with a diverse group of prequalified counterparties, monitoring their financial strength, entering into master netting arrangements with its counterparties, and requiring its counterparties to transfer collateral as security for their performance. In the absence of a default, the collateral pledged or received by the fund cannot be repledged, resold, or rehypothecated.
In the event of a counterparty’s default (including bankruptcy), the fund may terminate any swap contracts with that counterparty, determine the net amount owed by either party in accordance with its master netting arrangements, and sell or retain any collateral held up to the net amount owed to the fund under the master netting arrangements. The swap contracts contain provisions whereby a counterparty may terminate open contracts if the fund net assets decline below a certain level, triggering a payment by the fund if the fund is in a net liability position at the time of the termination. The payment amount would be reduced by any collateral the fund has pledged. Any securities pledged as collateral for open contracts are noted in the Statement of Net Assets. The value of collateral received or pledged is compared daily to the value of the swap contracts exposure with each counterparty, and any difference, if in excess of a specified minimum transfer amount, is adjusted and settled within two business days.
During the six months ended July 31, 2018, the fund’s average amounts of investments in total return swaps represented less than 1% of net assets, based on the average of notional amounts at each quarter-end during the period.
4. Federal Income Taxes: The fund intends to continue to qualify as a regulated investment company and distribute all of its taxable income. Management has analyzed the fund’s tax positions taken for all open federal income tax years (January 31, 2015–2018), and for the period ended July 31, 2018, and has concluded that no provision for federal income tax is required in the fund’s financial statements.
5. Distributions: Distributions to shareholders are recorded on the ex-dividend date. The portion of distributions that exceeds a fund’s current and accumulated earnings and profits, as measured on a tax basis, constitute a non-taxable return of capital.
21
Real Estate Index Fund
6. Securities Lending: To earn additional income, the fund lends its securities to qualified institutional borrowers. Security loans are subject to termination by the fund at any time, and are required to be secured at all times by collateral in an amount at least equal to the market value of securities loaned. Daily market fluctuations could cause the value of loaned securities to be more or less than the value of the collateral received. When this occurs, the collateral is adjusted and settled before the opening of the market on the next business day. The fund further mitigates its counterparty risk by entering into securities lending transactions only with a diverse group of prequalified counterparties, monitoring their financial strength, and entering into master securities lending agreements with its counterparties. The master securities lending agreements provide that, in the event of a counterparty’s default (including bankruptcy), the fund may terminate any loans with that borrower, determine the net amount owed, and sell or retain the collateral up to the net amount owed to the fund; however, such actions may be subject to legal proceedings. While collateral mitigates counterparty risk, in the event of a default, the fund may experience delays and costs in recovering the securities loaned. The fund invests cash collateral received in Vanguard Market Liquidity Fund, and records a liability in the Statement of Assets and Liabilities for the return of the collateral, during the period the securities are on loan. Securities lending income represents fees charged to borrowers plus income earned on invested cash collateral, less expenses associated with the loan. During the term of the loan, the fund is entitled to all distributions made on or in respect of the loaned securities.
7. Credit Facility: The fund and certain other funds managed by The Vanguard Group (“Vanguard”) participate in a $3.1 billion committed credit facility provided by a syndicate of lenders pursuant to a credit agreement that may be renewed annually; each fund is individually liable for its borrowings, if any, under the credit facility. Borrowings may be utilized for temporary and emergency purposes, and are subject to the fund’s regulatory and contractual borrowing restrictions. The participating funds are charged administrative fees and an annual commitment fee of 0.10% of the undrawn amount of the facility; these fees are allocated to the funds based on a method approved by the fund’s board of trustees and included in Management and Administrative expenses on the fund’s Statement of Operations. Any borrowings under this facility bear interest at a rate based upon the higher of the one-month London Interbank Offered Rate, federal funds effective rate, or overnight bank funding rate plus an agreed-upon spread.
The fund had no borrowings outstanding at July 31, 2018, or at any time during the period then ended.
8. Other: Distributions received from investment securities are recorded on the ex-dividend date. Each investment security typically reports annually the tax character of its distributions. Dividend income, capital gain distributions received, and unrealized appreciation (depreciation) reflect the amounts of taxable income, capital gain, and return of capital reported by the investment securities, and management’s estimates of such amounts for investment security distributions for which actual information has not been reported. Interest income includes income distributions received from Vanguard Market Liquidity Fund and is accrued daily. Costs used to determine realized gains (losses) on the sale of investment securities are those of the specific securities sold. Fees assessed on redemptions of capital shares are credited to paid-in capital.
Each class of shares has equal rights as to assets and earnings, except that each class separately bears certain class-specific expenses related to maintenance of shareholder accounts (included in Management and Administrative expenses), shareholder reporting, and the proxy. Marketing and
22
Real Estate Index Fund
distribution expenses are allocated to each class of shares based on a method approved by the board of trustees. Income, other non-class-specific expenses, and gains and losses on investments are allocated to each class of shares based on its relative net assets.
B. In accordance with the terms of a Funds’ Service Agreement (the “FSA”) between Vanguard and the fund, Vanguard furnishes to the fund investment advisory, corporate management, administrative, marketing, and distribution services at Vanguard’s cost of operations (as defined by the FSA). These costs of operations are allocated to the fund based on methods and guidelines approved by the board of trustees. Vanguard does not require reimbursement in the current period for certain costs of operations (such as deferred compensation/benefits and risk/insurance costs); the fund’s liability for these costs of operations is included in Payables to Vanguard on the Statement of Assets & Liabilities. All other costs of operations payable to Vanguard are generally settled twice a month.
Upon the request of Vanguard, the fund may invest up to 0.40% of its net assets as capital in Vanguard. At July 31, 2018, the fund had contributed to Vanguard capital in the amount of $3,167,000, representing 0.01% of the fund’s net assets and 1.27% of Vanguard’s capitalization. The fund’s trustees and officers are also directors and employees, respectively, of Vanguard.
C. Various inputs may be used to determine the value of the fund’s investments. These inputs are summarized in three broad levels for financial statement purposes. The inputs or methodologies used to value securities are not necessarily an indication of the risk associated with investing in those securities.
Level 1—Quoted prices in active markets for identical securities.
Level 2—Other significant observable inputs (including quoted prices for similar securities, interest rates, prepayment speeds, credit risk, etc.).
Level 3—Significant unobservable inputs (including the fund’s own assumptions used to determine
the fair value of investments). Any investments valued with significant unobservable inputs are noted
on the Statement of Net Assets.
The following table summarizes the market value of the fund’s investments as of July 31, 2018, based on the inputs used to value them:
| | | |
| | Level 1 | Level 2 | Level 3 |
| Investments | ($000) | ($000) | ($000) |
| Common Stocks | 60,662,367 | — | 2,742 |
| Temporary Cash Investments | 385,932 | — | — |
| Swap Contracts—Assets | — | 2,570 | — |
| Swap Contracts—Liabilities | — | (245) | — |
| Total | 61,048,299 | 2,325 | 2,742 |
D. Distributions are determined on a tax basis and may differ from net investment income and realized capital gains for financial reporting purposes. Differences may be permanent or temporary. Permanent differences are reclassified among capital accounts in the financial statements to reflect their tax character. Temporary differences arise when certain items of income, expense, gain, or loss are recognized in different periods for financial statement and tax purposes. These differences will reverse at some time in the future. Differences in classification may also result from the treatment of short-term gains as ordinary income for tax purposes.
23
Real Estate Index Fund
During the six months ended July 31, 2018, the fund realized $1,019,090,000 of net capital gains resulting from in-kind redemptions—in which shareholders exchanged fund shares for securities held by the fund rather than for cash. Because such gains are not taxable to the fund, and are not distributed to shareholders, they have been reclassified from accumulated net realized losses to paid-in capital.
At July 31, 2018, the cost of investment securities for tax purposes was $54,516,332,000. Net unrealized appreciation of investment securities for tax purposes was $6,534,703,000, consisting of unrealized gains of $8,455,330,000 on securities that had risen in value since their purchase and $1,920,627,000 in unrealized losses on securities that had fallen in value since their purchase.
E. During the six months ended July 31, 2018, the fund purchased $14,687,971,000 of investment securities and sold $15,897,823,000 of investment securities, other than temporary cash investments. Purchases and sales include $3,374,171,000 and $4,600,983,000, respectively, in connection with in-kind purchases and redemptions of the fund’s capital shares.
F. Capital share transactions for each class of shares were:
| | | | |
| | Six Months Ended | Year Ended |
| | July 31, 2018 | January 31, 2018 |
| | Amount | Shares | Amount | Shares |
| | ($000) | (000) | ($000) | (000) |
| Investor Shares | | | | |
| Issued | 125,005 | 4,894 | 362,805 | 13,160 |
| Issued in Lieu of Cash Distributions | 32,969 | 1,312 | 92,491 | 3,378 |
| Redeemed | (361,143) | (14,038) | (838,956) | (30,421) |
| Net Increase (Decrease)—Investor Shares | (203,169) | (7,832) | (383,660) | (13,883) |
| ETF Shares | | | | |
| Issued | 3,578,946 | 45,946 | 7,194,688 | 86,125 |
| Issued in Lieu of Cash Distributions | — | — | — | — |
| Redeemed | (4,603,716) | (60,600) | (7,055,924) | (85,400) |
| Net Increase (Decrease)—ETF Shares | (1,024,770) | (14,654) | 138,764 | 725 |
| Admiral Shares | | | | |
| Issued | 1,432,817 | 13,135 | 3,635,103 | 30,947 |
| Issued in Lieu of Cash Distributions | 278,276 | 2,595 | 685,946 | 5,875 |
| Redeemed | (2,039,213) | (18,709) | (4,245,238) | (36,118) |
| Net Increase (Decrease)—Admiral Shares | (328,120) | (2,979) | 75,811 | 704 |
| Institutional Shares | | | | |
| Issued | 988,463 | 58,373 | 2,396,349 | 131,716 |
| Issued in Lieu of Cash Distributions | 141,334 | 8,514 | 324,780 | 17,972 |
| Redeemed | (963,472) | (56,845) | (2,042,179) | (111,955) |
| Net Increase (Decrease)—Institutional Shares | 166,325 | 10,042 | 678,950 | 37,733 |
24
Real Estate Index Fund
G. Certain of the fund’s investments are in companies that are considered to be affiliated companies
of the fund because the fund owns more than 5% of the outstanding voting securities of the company
or the issuer is another member of The Vanguard Group. Transactions during the period in securities
of these companies were as follows:
| | | | | | | | |
| | | Current Period Transactions | |
| January 31, | | Proceeds | Realized | | | | July 31, |
| | 2018 | | from | Net | Change in | | Capital Gain | 2018 |
| | Market | Purchases | Securities | Gain | Unrealized | | Distributions | Market |
| | Value | at Cost | Sold1 | (Loss) | App. (Dep.) | Income | Received | Value |
| | ($000) | ($000) | ($000) | ($000) | ($000) | ($000) | ($000) | ($000) |
| Acadia Realty Trust | 135,395 | 8,061 | 40,666 | (13,043) | 23,514 | 1,746 | 729 | 113,261 |
| Agree Realty Corp. | 90,915 | 5,671 | 22,028 | 2,507 | 5,674 | 1,419 | — | NA3 |
| Alexander & Baldwin | | | | | | | |
| Inc. | 120,082 | 11,061 | 36,685 | (4,681) | (8,122) | — | — | NA3 |
| Alexandria Real | | | | | | | | |
| Estate Equities Inc. | 800,695 | 58,680 | 195,516 | 27,245 | (43,589) | 4,448 | 2,708 | NA3 |
| Altisource | | | | | | | | |
| Residential Corp. | 36,772 | 300 | 1,885 | 488 | (35,675) | — | — | — |
| American Campus | | | | | | | | |
| Communities Inc. | 345,867 | 20,551 | 104,334 | (13,358) | 35,947 | 2,461 | 1,599 | NA3 |
| Apartment | | | | | | | | |
| Investment & | | | | | | | | |
| Management Co. | 432,922 | 24,372 | 123,541 | 8,728 | (6,545) | 3,124 | 3,925 | 335,936 |
| Apple Hospitality | | | | | | | | |
| REIT Inc. | 272,226 | 14,695 | 68,727 | (5,240) | (14,804) | 5,968 | 321 | NA3 |
| Armada Hoffler | | | | | | | | |
| Properties Inc. | 42,716 | 2,457 | 12,160 | 128 | 1,746 | 259 | 30 | NA3 |
| Ashford Hospitality | | | | | | | | |
| Prime Inc. | 15,186 | 447 | 2,616 | (2,566) | (10,410) | 102 | 96 | — |
| Ashford Hospitality | | | | | | | | |
| Trust Inc. | 41,331 | 2,583 | 14,713 | (1,214) | 9,750 | — | — | NA3 |
| AvalonBay | | | | | | | | |
| Communities Inc. | 1,550,548 | 86,823 | 445,653 | (6,957) | 35,121 | 16,757 | 5,487 | NA3 |
| Boston | | | | | | | | |
| Properties Inc. | 1,258,471 | 71,784 | 368,007 | (254) | 6,222 | 13,113 | 414 | NA3 |
| Brandywine | | | | | | | | |
| Realty Trust | 207,416 | 10,976 | 53,147 | 2,396 | (20,139) | 1,384 | 1,900 | 147,299 |
| Brixmor Property | | | | | | | | |
| Group Inc. | 319,202 | 18,562 | 94,492 | (58,322) | 76,743 | 8,441 | — | NA3 |
| Camden Property | | | | | | | | |
| Trust | 528,910 | 30,362 | 155,246 | 12,401 | 12,877 | 3,821 | 3,998 | NA3 |
| CareTrust REIT Inc. | 79,575 | 4,433 | 22,286 | (4,254) | 7,158 | 1,386 | — | NA3 |
| CBL & Associates | | | | | | | | |
| Properties Inc. | 62,714 | 3,281 | 16,294 | (43,386) | 40,397 | 3,612 | — | NA3 |
| Cedar Realty Trust | | | | | | | | |
| Inc. | 30,746 | 1,501 | 7,539 | (3,822) | 1,170 | 244 | — | NA3 |
25
Real Estate Index Fund
| | | | | | | | |
| | | Current Period Transactions | |
| January 31, | | Proceeds | Realized | | | | July 31, |
| | 2018 | | from | Net | Change in | | Capital Gain | 2018 |
| | Market | Purchases | Securities | Gain | Unrealized | | Distributions | Market |
| | Value | at Cost | Sold1 | (Loss) | App. (Dep.) | Income | Received | Value |
| | ($000) | ($000) | ($000) | ($000) | ($000) | ($000) | ($000) | ($000) |
| Chatham Lodging | | | | | | | | |
| Trust | 67,005 | 3,538 | 17,478 | (4,386) | 832 | 1,494 | 64 | NA3 |
| Chesapeake | | | | | | | | |
| Lodging Trust | 108,533 | 6,802 | 33,775 | 979 | 14,646 | 2,297 | 54 | 96,897 |
| Colony NorthStar | | | | | | | | |
| Inc. Class A | 309,780 | 9,124 | 68,813 | (215,722) | (34,369) | 2,494 | 886 | — |
| Columbia Property | | | | | | | | |
| Trust Inc. | 174,942 | 9,966 | 52,453 | (5,625) | 14,479 | 598 | — | 139,106 |
| CoreCivic Inc. | 180,820 | 9,913 | 49,732 | (30,463) | 41,170 | 5,317 | — | NA3 |
| Corporate Office | | | | | | | | |
| Properties Trust | 179,024 | 11,447 | 51,553 | (10,437) | 22,923 | 1,763 | 630 | NA3 |
| Cousins Properties | | | | | | | | |
| Inc. | 249,205 | 14,433 | 73,102 | (1,385) | 7,945 | 1,998 | 228 | 196,330 |
| CubeSmart | 327,031 | 20,307 | 99,045 | 10,520 | 18,228 | 5,555 | 146 | NA3 |
| CyrusOne Inc. | 329,980 | 34,474 | 81,993 | 11,401 | 7,730 | 207 | — | NA3 |
| DCT Industrial | | | | | | | | |
| Trust Inc. | 363,151 | 21,534 | 107,783 | 26,444 | 10,413 | 3,231 | 310 | NA3 |
| DDR Corp. | 167,216 | 8,940 | 46,118 | (46,637) | 26,107 | 28,662 | — | — |
| DiamondRock | | | | | | | | |
| Hospitality Co. | 155,274 | 8,784 | 44,625 | (3,091) | 3,300 | 2,726 | — | 119,626 |
| Digital Realty | | | | | | | | |
| Trust Inc. | 1,513,956 | 84,171 | 427,466 | 74,703 | 313 | 22,865 | 534 | NA3 |
| Douglas Emmett | | | | | | | | |
| Inc. | 394,265 | 22,938 | 101,570 | 12,688 | (11,161) | 1,019 | 14 | NA3 |
| Duke Realty Corp. | 619,410 | 36,686 | 186,148 | 26,995 | 22,925 | 2,871 | 5,607 | NA3 |
| Easterly | | | | | | | | |
| Government | | | | | | | | |
| Properties Inc. | 53,553 | 16,294 | 10,522 | 466 | (4,770) | 840 | — | NA3 |
| EastGroup | | | | | | | | |
| Properties Inc. | 196,347 | 11,634 | 56,659 | 11,758 | 2,814 | 2,319 | 121 | NA3 |
| Education | | | | | | | | |
| Realty Trust Inc. | 159,394 | 10,237 | 45,496 | (5,917) | 39,170 | 940 | 1 | NA3 |
| EPR Properties | 286,885 | 16,846 | 84,927 | (8,319) | 35,558 | 7,499 | 488 | NA3 |
| Equinix Inc. | 2,339,501 | 124,195 | 607,874 | 74,680 | (192,966) | 20,834 | — | NA3 |
| Equity | | | | | | | | |
| Commonwealth | 244,644 | 14,582 | 72,325 | 5,282 | 9,883 | — | — | 202,066 |
| Equity LifeStyle | | | | | | | | |
| Properties Inc. | 470,384 | 28,020 | 134,732 | 34,310 | (13,462) | 4,302 | 507 | NA3 |
| Equity Residential | 1,492,184 | 85,913 | 438,247 | (61,230) | 124,499 | 11,731 | 10,265 | NA3 |
26
Real Estate Index Fund
| | | | | | | | |
| | | Current Period Transactions | |
| | January 31, | | Proceeds | Realized | | | | July 31, |
| | 2018 | | from | Net | Change in | | Capital Gain | 2018 |
| | Market | Purchases | Securities | Gain | Unrealized | | Distributions | Market |
| | Value | at Cost | Sold1 | (Loss) | App. (Dep.) | Income | Received | Value |
| | ($000) | ($000) | ($000) | ($000) | ($000) | ($000) | ($000) | ($000) |
| Essex Property | | | | | | | | |
| Trust Inc. | 1,013,827 | 58,870 | 304,891 | 33,398 | (8,318) | 12,113 | 1,346 | NA3 |
| Extra Space | | | | | | | | |
| Storage Inc. | 693,324 | 43,708 | 221,968 | 39,250 | 37,542 | 11,198 | 421 | NA3 |
| Federal Realty | | | | | | | | |
| Investment Trust | 544,060 | 32,863 | 161,090 | (17,484) | 28,259 | 7,596 | 25 | NA3 |
| First Industrial | | | | | | | | |
| Realty Trust Inc. | 243,894 | 14,196 | 70,703 | 14,189 | (4,911) | 2,338 | 492 | NA3 |
| Forest City Realty | | | | | | | | |
| Trust Inc. Class A | 330,139 | 17,888 | 75,386 | 1,184 | 9,190 | 2,568 | 1,884 | NA3 |
| Four Corners | | | | | | | | |
| Property Trust Inc. | 95,230 | 5,428 | 27,511 | 3,047 | 98 | 1,760 | — | NA3 |
| Franklin Street | | | | | | | | |
| Properties Corp. | 68,033 | 3,370 | 14,720 | (6,565) | (2,589) | 545 | 39 | NA3 |
| Gaming and Leisure | | | | | | | |
| Properties Inc. | 428,876 | 81,700 | 135,607 | (3,840) | (2,416) | 11,558 | 177 | NA3 |
| Front Yard | | | | | | | | |
| Residential Corp. | NA2 | 1,656 | 8,678 | (2,470) | 33,730 | 833 | — | NA3 |
| GEO Group Inc. | 184,462 | 11,152 | 55,868 | (5,599) | 29,315 | 6,971 | — | 160,471 |
| Getty Realty Corp. | 58,003 | 3,358 | 16,760 | 1,165 | 2,361 | 977 | 202 | NA3 |
| Gladstone | | | | | | | | |
| Commercial Corp. | 34,680 | 1,902 | 9,175 | (984) | 1,717 | 1,177 | — | NA3 |
| Global Net Lease Inc. | 81,413 | 4,803 | 24,196 | (7,409) | 16,437 | 4,109 | — | NA3 |
| Government | | | | | | | | |
| Properties | | | | | | | | |
| Income Trust | 108,827 | 5,456 | 25,386 | (10,125) | (2,381) | 2,440 | 218 | NA3 |
| Gramercy | | | | | | | | |
| Property Trust | 252,621 | 15,305 | 63,264 | (2,810) | 18,461 | 6,443 | — | 220,313 |
| HCP Inc. | 744,106 | 42,772 | 215,851 | (121,996) | 164,325 | 14,725 | 97 | NA3 |
| Healthcare Realty | | | | | | | | |
| Trust Inc. | 243,780 | 13,277 | 65,624 | (5,193) | 914 | 2,205 | 1,045 | 186,008 |
| Healthcare Trust | | | | | | | | |
| of America Inc. | | | | | | | | |
| Class A | 365,173 | 20,137 | 96,532 | (10,543) | 3,568 | 4,838 | 160 | NA3 |
| Hersha Hospitality | | | | | | | | |
| Trust Class A | 51,171 | 2,918 | 19,760 | (1,396) | 8,167 | 1,028 | — | NA3 |
| Highwoods | | | | | | | | |
| Properties Inc. | 326,002 | 18,385 | 91,457 | 237 | 1,678 | 4,393 | 1,167 | 254,766 |
| Hospitality | | | | | | | | |
| Properties Trust | 308,288 | 16,976 | 86,725 | (8,123) | 2,896 | 8,659 | 29 | 232,720 |
27
Real Estate Index Fund
| | | | | | | | |
| | | Current Period Transactions | |
| January 31, | | Proceeds | Realized | | | | July 31, |
| | 2018 | | from | Net | Change in | | Capital Gain | 2018 |
| | Market | Purchases | Securities | Gain | Unrealized | | Distributions | Market |
| | Value | at Cost | Sold1 | (Loss) | App. (Dep.) | Income | Received | Value |
| | ($000) | ($000) | ($000) | ($000) | ($000) | ($000) | ($000) | ($000) |
| Host Hotels & | | | | | | | | |
| Resorts Inc. | 1,012,323 | 56,307 | 296,992 | 4,819 | (8,601) | 11,089 | 5,075 | NA3 |
| Hudson Pacific | | | | | | | | |
| Properties Inc. | 327,281 | 19,767 | 97,250 | 6,702 | 17,887 | (1,358) | 414 | 269,061 |
| Independence | | | | | | | | |
| Realty Trust Inc. | 49,505 | 3,003 | 13,453 | 75 | 3,970 | 1,355 | 289 | NA3 |
| Investors Real | | | | | | | | |
| Estate Trust | 45,038 | 2,378 | 12,664 | (5,973) | 4,126 | 154 | 631 | 32,741 |
| Iron Mountain Inc. | 611,738 | 34,464 | 164,557 | (13,775) | 10,343 | 14,859 | — | NA3 |
| iStar Inc. | 45,217 | 2,632 | 11,655 | (1,810) | 2,663 | — | — | 37,047 |
| JBG SMITH | | | | | | | | |
| Properties | 210,407 | 35,577 | 54,860 | (1,341) | 14,822 | 1,177 | — | NA3 |
| Kilroy Realty Corp. | 462,201 | 27,162 | 136,023 | 11,410 | (3,621) | 3,342 | 1,309 | NA3 |
| Kimco Realty Corp. | 436,518 | 25,000 | 126,537 | (80,942) | 92,613 | 5,071 | 5,598 | NA3 |
| Kite Realty | | | | | | | | |
| Group Trust | 95,092 | 159 | 22,713 | (15,451) | 13,944 | 2,194 | 302 | NA3 |
| LaSalle Hotel | | | | | | | | |
| Properties | 227,890 | 13,337 | 67,530 | (6,774) | 29,281 | 3,557 | 734 | 196,204 |
| Lexington | | | | | | | | |
| Realty Trust | 128,736 | 6,954 | 35,076 | (8,284) | 4,225 | 3,088 | — | NA3 |
| Liberty | | | | | | | | |
| Property Trust | 402,322 | 23,374 | 119,435 | 8,583 | 2,009 | 4,794 | 1,367 | NA3 |
| Life Storage Inc. | 255,145 | 15,752 | 79,509 | (3,530) | 35,917 | 4,707 | — | NA3 |
| LTC Properties Inc. | 106,910 | 6,007 | 30,343 | (2,197) | 3,699 | 1,857 | 152 | NA3 |
| Macerich Co. | 511,617 | 25,431 | 177,122 | (26,570) | (21,667) | 4,337 | 6,256 | NA3 |
| Mack—Cali | | | | | | | | |
| Realty Corp. | 112,923 | 6,190 | 26,379 | (16,515) | 12,027 | 1,212 | 61 | NA3 |
| Medical Properties | | | | | | | | |
| Trust Inc. | 313,870 | 18,641 | 92,454 | (4,442) | 30,188 | 7,758 | 467 | 263,741 |
| MGM Growth | | | | | | | | |
| Properties LLC | | | | | | | | |
| Class A | 127,934 | 7,562 | 36,151 | 193 | 7,838 | 3,026 | — | NA3 |
| Mid—America | | | | | | | | |
| Apartment | | | | | | | | |
| Communities Inc. | 713,570 | 40,277 | 204,233 | 18,422 | 4,812 | 10,662 | 773 | NA3 |
| Monmouth Real | | | | | | | | |
| Estate Investment | | | | | | | | |
| Corp. | 75,450 | 4,164 | 15,000 | 2,048 | (4,541) | 726 | 24 | NA3 |
| National Health | | | | | | | | |
| Investors Inc. | 190,628 | 11,146 | 54,026 | 2,241 | 5,949 | 3,211 | 1,026 | 155,646 |
Real Estate Index Fund
| | | | | | | | |
| | | Current Period Transactions | |
| January 31, | | Proceeds | Realized | | | | July 31, |
| | 2018 | | from | Net | Change in | | Capital Gain | 2018 |
| | Market | Purchases | Securities | Gain | Unrealized | | Distributions | Market |
| | Value | at Cost | Sold1 | (Loss) | App. (Dep.) | Income | Received | Value |
| | ($000) | ($000) | ($000) | ($000) | ($000) | ($000) | ($000) | ($000) |
| National Retail | | | | | | | | |
| Properties Inc. | 390,140 | 23,478 | 106,899 | (2,131) | 40,303 | 6,569 | 96 | NA3 |
| National Storage | | | | | | | | |
| Affiliates Trust | 82,472 | 13,056 | 23,352 | 1,654 | 7,226 | 1,474 | — | NA3 |
| New Senior | | | | | | | | |
| Investment Group | | | | | | | | |
| Inc. | 41,482 | 2,372 | 12,594 | (10,968) | 11,017 | — | 53 | NA3 |
| New York REIT Inc. | 22,353 | 1,242 | 7,009 | 8,658 | (10,216) | 4,511 | — | NA3 |
| NexPoint | | | | | | | | |
| Residential Trust Inc. | 31,311 | 1,855 | 9,334 | 415 | 2,603 | 289 | 76 | NA3 |
| NorthStar Realty | | | | | | | | |
| Europe Corp. | 41,298 | 2,569 | 15,183 | 2,132 | 3,816 | 275 | — | NA3 |
| Omega Healthcare | | | | | | | | |
| Investors Inc. | 351,475 | 21,521 | 106,618 | (17,652) | 50,506 | 9,151 | 205 | NA3 |
| Paramount Group | | | | | | | | |
| Inc. | 200,818 | 11,739 | 47,428 | (7,908) | 12,217 | 687 | 68 | NA3 |
| Park Hotels & | | | | | | | | |
| Resorts Inc | NA 2 | 35,883 | 51,849 | 684 | 22,408 | 13,071 | — | NA3 |
| Pebblebrook | | | | | | | | |
| Hotel Trust | 177,289 | 9,759 | 50,017 | 5,035 | (8,975) | 2,851 | — | NA3 |
| Pennsylvania REIT | 51,388 | 2,832 | 14,044 | (12,101) | 10,926 | — | — | NA3 |
| Physicians Realty | | | | | | | | |
| Trust | 190,800 | 10,398 | 52,342 | (11,756) | 6,101 | 2,083 | — | NA3 |
| Piedmont Office | | | | | | | | |
| Realty Trust Inc. | | | | | | | | |
| Class A | 187,225 | 10,127 | 62,454 | (3,134) | 2,254 | 1,993 | 1,367 | 133,801 |
| Realogy Holdings | | | | | | | | |
| Corp. | NA2 | 165,751 | 5,648 | 173 | (22,362) | 514 | — | 142,868 |
| Preferred | | | | | | | | |
| Apartment | | | | | | | | |
| Communities Inc. | 35,483 | 19,390 | 20,482 | (7,887) | 6,774 | 499 | — | NA3 |
| Prologis Inc. | 2,281,569 | 128,349 | 658,268 | 130,293 | (134,970) | 14,262 | 14,590 | NA3 |
| Public Storage | 2,019,383 | 123,758 | 626,275 | 11,238 | 175,743 | 35,604 | 9 | NA3 |
| QTS Realty Trust | | | | | | | | |
| Inc. Class A | 159,765 | 7,356 | 33,608 | (5,965) | (19,102) | 1,796 | — | NA3 |
| Quality Care | | | | | | | | |
| Properties Inc. | 83,525 | 6,457 | 131,173 | 33,609 | 7,582 | — | — | — |
| Ramco—Gershenson | | | | | | | |
| Properties Trust | 69,142 | 3,772 | 19,174 | (7,897) | 6,334 | 1,687 | 142 | NA3 |
| Realty Income Corp. 961,952 | 55,508 | 254,472 | (17,094) | 50,481 | 15,707 | 105 | NA3 |
29
Real Estate Index Fund
| | | | | | | | |
| | | Current Period Transactions | |
| January 31, | | Proceeds | Realized | | | | July 31, |
| | 2018 | | from | Net | Change in | | Capital Gain | 2018 |
| | Market | Purchases | Securities | Gain | Unrealized | | Distributions | Market |
| | Value | at Cost | Sold1 | (Loss) | App. (Dep.) | Income | Received | Value |
| | ($000) | ($000) | ($000) | ($000) | ($000) | ($000) | ($000) | ($000) |
| Regency Centers | | | | | | | | |
| Corp. | 634,791 | 34,739 | 236,345 | (24,320) | 18,438 | 7,228 | 773 | NA3 |
| Retail Opportunity | | | | | | | | |
| Investments Corp. | 123,236 | 7,582 | 36,114 | (138) | 2,062 | 1,748 | — | NA3 |
| Retail Properties | | | | | | | | |
| of America Inc. | 183,468 | 10,469 | 61,335 | (13,542) | 19,344 | 3,298 | 59 | NA3 |
| Rexford Industrial | | | | | | | | |
| Realty Inc. | 139,212 | 9,438 | 31,825 | 4,270 | (929) | 1,278 | 28 | NA3 |
| RLJ Lodging Trust | 266,228 | 14,290 | 73,176 | (9,603) | 420 | 5,745 | — | NA3 |
| Ryman Hospitality | | | | | | | | |
| Properties Inc. | 232,432 | 13,876 | 69,733 | 18,260 | 1,510 | 4,209 | 76 | NA3 |
| Sabra Health Care | | | | | | | | |
| REIT Inc. | 209,688 | 13,145 | 62,649 | (24,199) | 60,730 | 5,397 | 33 | 192,741 |
| SBA | | | | | | | | |
| Communications | | | | | | | | |
| Corp. Class A | NA2 | 970,760 | 32,343 | 1,133 | (35,038) | — | — | 920,117 |
| Senior Housing | | | | | | | | |
| Properties Trust | 271,328 | 15,283 | 76,466 | (17,873) | 23,022 | 6,607 | 357 | 212,382 |
| Seritage Growth | | | | | | | | |
| Properties Class A | 68,238 | 13,965 | 14,274 | (377) | 668 | 768 | — | NA3 |
| Simon Property | | | | | | | | |
| Group Inc. | 3,346,756 | 193,660 | 898,950 | (43,791) | 221,453 | 70,528 | 1,433 | 2,819,128 |
| SL Green Realty | | | | | | | | |
| Corp. | 655,463 | 35,854 | 230,290 | (24,579) | 29,555 | 3,572 | 4,927 | 466,003 |
| Spirit MTA REIT | NA2 | 27,034 | 6,111 | 206 | 1,352 | — | — | 22,480 |
| Spirit Realty | | | | | | | | |
| Capital Inc. | 246,845 | 13,922 | 76,167 | (24,188) | 35,890 | 20,876 | 1,455 | 187,956 |
| STAG Industrial | | | | | | | | |
| Inc. | 153,983 | 9,086 | 38,917 | 888 | 9,005 | 2,394 | — | NA3 |
| STORE Capital | | | | | | | | |
| Corp. | 276,198 | 16,882 | 79,564 | 312 | 26,561 | 5,338 | 397 | NA3 |
| Summit Hotel | | | | | | | | |
| Properties Inc. | 106,473 | 5,631 | 29,167 | 843 | (10,017) | 2,228 | — | NA3 |
| Sun Communities | | | | | | | | |
| Inc. | 462,846 | 28,140 | 138,901 | 32,064 | 6,068 | 2,140 | 1,021 | NA3 |
| Sunstone Hotel | | | | | | | | |
| Investors Inc. | 250,335 | 13,710 | 70,395 | 4,236 | (14,392) | 874 | 360 | NA3 |
| Tanger Factory | | | | | | | | |
| Outlet Centers Inc. | 157,570 | 8,243 | 42,479 | (18,987) | 8,356 | 3,332 | 31 | 112,541 |
| Taubman Centers | | | | | | | | |
| Inc. | 246,647 | 13,459 | 67,983 | (13,579) | 10,517 | 3,712 | 716 | NA3 |
30
Real Estate Index Fund
| | | | | | | | |
| | | Current Period Transactions | |
| | January 31, | | Proceeds | Realized | | | | July 31, |
| | 2018 | | from | Net | Change in | | Capital Gain | 2018 |
| | Market | Purchases | Securities | Gain | Unrealized | | Distributions | Market |
| | Value | at Cost | Sold1 | (Loss) | App. (Dep.) | Income | Received | Value |
| | ($000) | ($000) | ($000) | ($000) | ($000) | ($000) | ($000) | ($000) |
| Terreno Realty | | | | | | | | |
| Corp. | 122,901 | 7,356 | 31,221 | 4,375 | (681) | 942 | 108 | NA3 |
| Tier REIT Inc. | 61,273 | 3,791 | 19,003 | 3,506 | 7,625 | 647 | — | NA3 |
| UDR Inc. | 644,129 | 36,521 | 185,452 | 12,370 | 8,928 | 6,279 | 3,171 | 516,496 |
| UMH Properties | | | | | | | | |
| Inc. | 26,624 | 14,875 | 17,647 | (4,344) | 5,528 | 463 | — | NA3 |
| Universal Health | | | | | | | | |
| Realty Income Trust | 56,751 | 3,073 | 15,251 | 2,123 | (2,771) | 745 | 141 | NA3 |
| Urban Edge | | | | | | | | |
| Properties | 175,346 | 9,500 | 48,319 | (4,885) | (2,684) | 2,439 | 385 | NA3 |
| Vanguard Market | | | | | | | | |
| Liquidity Fund | 164,286 | NA 4 | NA 4 | 54 | (11) | 533 | — | 385,932 |
| Vanguard | | | | | | | | |
| Real Estate II | | | | | | | | |
| Index Fund | 6,126,412 | 113,149 | — | — | 200,873 | 98,792 | 13,020 | 6,439,097 |
| Ventas Inc. | 1,313,443 | 72,451 | 366,175 | (55,419) | 38,441 | 24,336 | 6,497 | NA3 |
| VEREIT Inc. | 462,377 | 26,457 | 134,929 | (78,150) | 96,280 | 12,626 | 1,477 | 371,459 |
| Vornado Realty | | | | | | | | |
| Trust | 805,092 | 45,397 | 229,473 | (24,534) | 18,019 | 3,687 | 2,341 | NA3 |
| Washington | | | | | | | | |
| Prime Group Inc. | 80,600 | 5,007 | 24,978 | (32,221) | 46,809 | 3,657 | 1,019 | NA3 |
| Washington REIT | 145,371 | 8,403 | 40,014 | (2,419) | 8,919 | 1,951 | 207 | NA3 |
| Weingarten | | | | | | | | |
| Realty Investors | 237,807 | 13,454 | 67,813 | (14,926) | 16,276 | 3,596 | 1,842 | NA3 |
| Welltower Inc. | 1,457,867 | 80,823 | 402,594 | (94,924) | 117,121 | 23,793 | 14,136 | NA3 |
| Whitestone REIT | 33,393 | 1,730 | 11,207 | (927) | 238 | 518 | 77 | NA3 |
| Winthrop | | | | | | | | |
| Realty Trust | 12,674 | — | — | — | (185) | 946 | — | 2,742 |
| WP Carey Inc. | 456,443 | 26,153 | 131,891 | (3,629) | 5,328 | 10,307 | 217 | 351,009 |
| Xenia Hotels & | | | | | | | | |
| Resorts Inc. | 156,245 | 9,118 | 45,699 | 266 | 10,574 | 3,173 | — | NA3 |
| | 57,342,038 | 4,392,380 | 14,796,158 | (808,618) | 2,069,036 | 858,864 | 145,857 | 16,635,991 |
1 Does not include adjustments related to return of capital.
2 Not applicable—at January 31, 2018, the issuer was not an affiliated company of the fund.
3 Not applicable—at July 31, 2018, the security was still held, but the issuer was no longer an affiliated company of the fund.
4 Not applicable—purchases and sales are for temporary cash investment purposes.
H. Management has determined that no events or transactions occurred subsequent to July 31, 2018, that would require recognition or disclosure in these financial statements.
Real Estate II Index Fund
Fund Profile
As of July 31, 2018
| | | |
| Portfolio Characteristics | | |
| | | | DJ |
| | | MSCI US IM | U.S. Total |
| | | Real Estate | Market |
| | Fund | 25/50 Index | FA Index |
| Number of Stocks | 184 | 185 | 3,766 |
| Median Market Cap $13.2B | $13.2B | $67.3B |
| Price/Earnings Ratio | 36.7x | 36.0x | 20.5x |
| Price/Book Ratio | 2.4x | 2.4x | 3.1x |
| Return on Equity | 6.1% | 6.1% | 15.0% |
| Earnings Growth Rate | 13.5% | 13.6% | 8.5% |
| Dividend Yield | 3.8% | 3.8% | 1.7% |
| Foreign Holdings | 0.0% | 0.0% | 0.0% |
| Turnover Rate | | | |
| (Annualized) | 20% | — | — |
| Ticker Symbol | VRTPX | — | — |
| Expense Ratio1 | 0.08% | — | — |
| Short-Term Reserves | 0.1% | — | — |
Dividend Yield: This yield may include some payments that
represent a return of capital, capital gains distributions, or both by
the underlying REITs. These amounts are determined by each REIT
at the end of its fiscal year.
| | |
| Subindustry Diversification (% of equity |
| exposure) | | |
| | | MSCI US IM |
| | | Real Estate |
| | Fund | 25/50 Index |
| Diversified REITs | 4.6% | 4.6% |
| Diversified Real Estate | | |
| Activites | 0.2 | 0.2 |
| Health Care REITs | 8.7 | 8.7 |
| Hotel & Resort REITs | 5.8 | 5.8 |
| Industrial REITs | 6.6 | 6.6 |
| Office REITs | 10.5 | 10.5 |
| Real Estate Development | 0.5 | 0.5 |
| Real Estate Operating | | |
| Companies | 0.3 | 0.3 |
| Real Estate Services | 2.9 | 2.9 |
| Residential REITs | 13.1 | 13.1 |
| Retail REITs | 15.6 | 15.6 |
| Specialized REITs | 31.2 | 31.2 |
Sector categories are based on the Global Industry Classification
Standard (“GICS”), except for the “Other” category (if applicable),
which includes securities that have not been provided a GICS
classification as of the effective reporting period.
| | |
| Ten Largest Holdings (% of total net assets) |
| American Tower Corp. | Specialized REITs | 6.0% |
| Simon Property Group | | |
| Inc. | Retail REITs | 5.2 |
| Crown Castle | | |
| International Corp. | Specialized REITs | 4.1 |
| Prologis Inc. | Industrial REITs | 3.2 |
| Equinix Inc. | Specialized REITs | 3.2 |
| Public Storage | Specialized REITs | 3.1 |
| Weyerhaeuser Co. | Specialized REITs | 2.4 |
| Digital Realty Trust Inc. | Specialized REITs | 2.3 |
| AvalonBay Communities | | |
| Inc. | Residential REITs | 2.2 |
| Equity Residential | Residential REITs | 2.2 |
| Top Ten | | 33.9% |
| The holdings listed exclude any temporary cash investments and |
| equity index products. |
1 The expense ratio shown is from the prospectus dated May 24, 2018, and represents estimated costs for the current fiscal year. For the six
months ended July 31, 2018, the annualized expense ratio was 0.08%.
32
Real Estate II Index Fund
Performance Summary
All of the returns in this report represent past performance, which is not a guarantee of future results that may be achieved by the fund. (Current performance may be lower or higher than the performance data cited. For performance data current to the most recent month-end, visit our website at vanguard.com/performance.) Note, too, that both investment returns and principal value can fluctuate widely, so an investor’s shares, when sold, could be worth more or less than their original cost. The returns shown do not reflect taxes that a shareholder would pay on fund distributions or on the sale of fund shares.
Fiscal-Period Total Returns (%): September 26, 2017, Through July 31, 2018
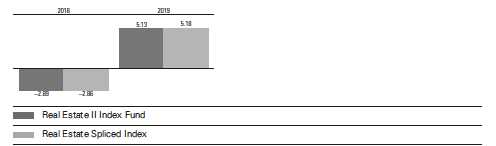
For a benchmark description, see the Glossary.
Note: For 2019, performance data reflect the six months ended July 31, 2018.
Total Returns: Periods Ended June 30, 2018
This table presents returns through the latest calendar quarter—rather than through the end of the fiscal period.
Securities and Exchange Commission rules require that we provide this information.
| | |
| | Inception | Since |
| | Date | Inception |
| Vanguard Real Estate II Index Fund | 9/26/2017 | 1.37% |
See Financial Highlights for dividend and capital gains information.
33
Real Estate II Index Fund
Financial Statements (unaudited)
Statement of Net Assets
As of July 31, 2018
The fund reports a complete list of its holdings in regulatory filings four times in each fiscal year, at the quarter-ends. For the second and fourth fiscal quarters, the lists appear in the fund’s semiannual and annual reports to shareholders. For the first and third fiscal quarters, the fund files the lists with the Securities and Exchange Commission on Form N-Q. Shareholders can look up the fund’s Forms N-Q on the SEC’s website at sec.gov. Forms N-Q may also be reviewed and copied at the SEC’s Public Reference Room (see the back cover of this report for further information).
| | | |
| | | | Market |
| | | | Value• |
| | | Shares | ($000) |
| Equity Real Estate Investment | |
| Trusts (REITs) (96.1%) | | |
| Diversified REITs (4.6%) | | |
| | VEREIT Inc. | 5,767,341 | 44,005 |
| | WP Carey Inc. | 635,711 | 41,563 |
| | Liberty Property Trust | 874,754 | 37,492 |
| | Forest City Realty Trust | | |
| | Inc. Class A | 1,342,809 | 33,530 |
| | STORE Capital Corp. | 1,036,831 | 28,461 |
| | Colony Capital Inc. | 2,881,687 | 17,751 |
| | PS Business Parks Inc. | 121,705 | 15,550 |
| | Washington REIT | 465,384 | 14,190 |
| | Empire State Realty | | |
| | Trust Inc. | 814,634 | 13,580 |
| | Lexington Realty Trust | 1,284,909 | 11,294 |
| | Alexander & Baldwin | | |
| | Inc. | 403,779 | 9,670 |
| | Global Net Lease Inc. | 397,655 | 8,414 |
| | American Assets Trust | | |
| | Inc. | 195,825 | 7,526 |
| * | iStar Inc. | 403,670 | 4,388 |
| | Armada Hoffler | | |
| | Properties Inc. | 267,891 | 4,045 |
| | Gladstone Commercial | | |
| | Corp. | 167,757 | 3,328 |
| | One Liberty Properties | | |
| | Inc. | 84,560 | 2,280 |
| | | | 297,067 |
| Health Care REITs (8.7%) | | |
| | Welltower Inc. | 2,190,777 | 137,143 |
| | Ventas Inc. | 2,107,189 | 118,803 |
| | HCP Inc. | 2,778,342 | 71,959 |
| ^ | Omega Healthcare | | |
| | Investors Inc. | 1,175,677 | 34,906 |
| | Healthcare Trust of | | |
| | America Inc. Class A | 1,214,193 | 33,172 |
| | Medical Properties | | |
| | Trust Inc. | 2,167,060 | 31,227 |
| | |
| Senior Housing | | |
| Properties Trust | 1,409,682 | 25,149 |
| Sabra Health Care | | |
| REIT Inc. | 1,056,276 | 22,826 |
| Healthcare Realty | | |
| Trust Inc. | 741,619 | 22,034 |
| National Health | | |
| Investors Inc. | 246,342 | 18,436 |
| Physicians Realty Trust | 1,058,617 | 16,684 |
| LTC Properties Inc. | 234,608 | 9,893 |
| CareTrust REIT Inc. | 450,390 | 7,616 |
| Universal Health Realty | | |
| Income Trust | 77,083 | 5,189 |
| New Senior Investment | | |
| Group Inc. | 485,193 | 3,435 |
| MedEquities Realty | | |
| Trust Inc. | 168,506 | 1,887 |
| | | 560,359 |
| Hotel & Resort REITs (5.8%) | |
| Host Hotels & Resorts | | |
| Inc. | 4,344,359 | 90,971 |
| Park Hotels & Resorts | | |
| Inc. | 1,189,591 | 37,211 |
| Hospitality Properties | | |
| Trust | 974,889 | 27,560 |
| RLJ Lodging Trust | 1,035,954 | 23,402 |
| Apple Hospitality REIT | | |
| Inc. | 1,297,353 | 23,339 |
| Ryman Hospitality | | |
| Properties Inc. | 273,498 | 23,250 |
| LaSalle Hotel Properties | 670,438 | 23,244 |
| Sunstone Hotel | | |
| Investors Inc. | 1,335,779 | 21,733 |
| Pebblebrook Hotel Trust | 408,873 | 15,762 |
| Xenia Hotels & Resorts | | |
| Inc. | 633,524 | 15,452 |
| DiamondRock | | |
| Hospitality Co. | 1,188,645 | 14,169 |
34
Real Estate II Index Fund
| | | |
| | | | Market |
| | | | Value• |
| | | Shares | ($000) |
| | MGM Growth | | |
| | Properties LLC Class A | 419,081 | 12,698 |
| | Chesapeake Lodging | | |
| | Trust | 358,365 | 11,475 |
| | Summit Hotel | | |
| | Properties Inc. | 617,548 | 8,738 |
| * | CorePoint Lodging Inc. | 244,167 | 6,168 |
| | Chatham Lodging Trust | 271,605 | 5,850 |
| | Hersha Hospitality Trust | | |
| | Class A | 224,270 | 4,842 |
| | Ashford Hospitality | | |
| | Trust Inc. | 546,616 | 4,318 |
| | Braemar Hotels & | | |
| | Resorts Inc. | 171,483 | 1,960 |
| | | | 372,142 |
| Industrial REITs (6.6%) | | |
| | Prologis Inc. | 3,154,187 | 206,978 |
| | Duke Realty Corp. | 2,114,859 | 61,585 |
| | DCT Industrial Trust Inc. | 555,565 | 37,150 |
| | Gramercy Property | | |
| | Trust | 952,729 | 26,095 |
| | First Industrial Realty | | |
| | Trust Inc. | 715,239 | 23,281 |
| | EastGroup Properties | | |
| | Inc. | 206,138 | 19,649 |
| | STAG Industrial Inc. | 575,471 | 15,722 |
| | Rexford Industrial | | |
| | Realty Inc. | 464,644 | 14,237 |
| | Terreno Realty Corp. | 328,956 | 12,142 |
| | Monmouth Real Estate | | |
| | Investment Corp. | 437,035 | 7,285 |
| | | | 424,124 |
| Office REITs (10.5%) | | |
| | Boston Properties Inc. | 913,797 | 114,709 |
| | Alexandria Real Estate | | |
| | Equities Inc. | 599,493 | 76,399 |
| | Vornado Realty Trust | 1,012,190 | 72,797 |
| | SL Green Realty Corp. | 535,379 | 55,203 |
| | Kilroy Realty Corp. | 586,092 | 42,755 |
| | Douglas Emmett Inc. | 957,009 | 37,170 |
| | Hudson Pacific | | |
| | Properties Inc. | 930,108 | 31,866 |
| | Highwoods Properties | | |
| | Inc. | 614,266 | 30,167 |
| | JBG SMITH Properties | 664,045 | 24,238 |
| * | Equity Commonwealth | 742,666 | 23,944 |
| | Cousins Properties Inc. | 2,494,872 | 23,252 |
| | Paramount Group Inc. | 1,288,159 | 19,889 |
| | Corporate Office | | |
| | Properties Trust | 600,434 | 17,857 |
| | Brandywine Realty | | |
| | Trust | 1,058,023 | 17,447 |
| | |
| Columbia Property | | |
| Trust Inc. | 710,950 | 16,480 |
| Piedmont Office Realty | | |
| Trust Inc. Class A | 801,270 | 15,849 |
| Mack-Cali Realty Corp. | 533,057 | 10,379 |
| Government Properties | | |
| Income Trust | 585,963 | 8,830 |
| Select Income REIT | 397,848 | 8,295 |
| Tier REIT Inc. | 283,261 | 6,733 |
| Easterly Government | | |
| Properties Inc. | 341,791 | 6,477 |
| Franklin Street | | |
| Properties Corp. | 633,266 | 5,579 |
| NorthStar Realty | | |
| Europe Corp. | 294,332 | 4,029 |
| City Office REIT Inc. | 199,982 | 2,550 |
| New York REIT Inc. | 97,077 | 1,787 |
| | | 674,681 |
| Residential REITs (13.1%) | | |
| AvalonBay | | |
| Communities Inc. | 817,287 | 144,537 |
| Equity Residential | 2,178,608 | 142,546 |
| Essex Property Trust | | |
| Inc. | 390,673 | 93,937 |
| Mid-America Apartment | | |
| Communities Inc. | 673,426 | 67,868 |
| UDR Inc. | 1,589,884 | 61,179 |
| Camden Property Trust | 549,261 | 50,856 |
| Sun Communities Inc. | 473,106 | 45,872 |
| Equity LifeStyle | | |
| Properties Inc. | 500,281 | 45,521 |
| Invitation Homes Inc. | 1,843,848 | 42,611 |
| Apartment Investment | | |
| & Management Co. | 932,966 | 39,791 |
| American Homes 4 | | |
| Rent Class A | 1,516,599 | 33,578 |
| American Campus | | |
| Communities Inc. | 807,801 | 33,322 |
| Education Realty Trust | | |
| Inc. | 448,811 | 18,563 |
| Independence Realty | | |
| Trust Inc. | 502,688 | 5,102 |
| Preferred Apartment | | |
| Communities Inc. | | |
| Class A | 231,214 | 3,912 |
| Investors Real Estate | | |
| Trust | 709,180 | 3,886 |
| NexPoint Residential | | |
| Trust Inc. | 105,591 | 3,162 |
| UMH Properties Inc. | 191,970 | 2,964 |
| Front Yard Residential | | |
| Corp. | 297,321 | 2,872 |
| | | 842,079 |
35
Real Estate II Index Fund
| | | |
| | | | Market |
| | | | Value• |
| | | Shares | ($000) |
| Retail REITs (15.6%) | | |
| | Simon Property Group | | |
| | Inc. | 1,895,544 | 334,014 |
| | Realty Income Corp. | 1,682,141 | 93,813 |
| | GGP Inc. | 3,964,592 | 84,525 |
| * | Regency Centers Corp. | 910,204 | 57,916 |
| | Federal Realty | | |
| | Investment Trust | 433,448 | 54,398 |
| | Kimco Realty Corp. | 2,518,228 | 42,029 |
| | National Retail | | |
| | Properties Inc. | 912,471 | 40,705 |
| | Macerich Co. | 625,226 | 36,926 |
| | Brixmor Property | | |
| | Group Inc. | 1,798,801 | 31,821 |
| | Taubman Centers Inc. | 360,764 | 22,385 |
| | Spirit Realty Capital Inc. | 2,659,835 | 22,263 |
| | Weingarten Realty | | |
| | Investors | 723,991 | 21,879 |
| | Retail Properties of | | |
| | America Inc. | 1,299,033 | 16,303 |
| | Urban Edge Properties | 673,443 | 15,274 |
| | Acadia Realty Trust | 495,511 | 13,418 |
| ^ | Tanger Factory Outlet | | |
| | Centers Inc. | 559,092 | 13,334 |
| | DDR Corp. | 927,047 | 12,701 |
| | Retail Opportunity | | |
| | Investments Corp. | 665,224 | 12,579 |
| | Agree Realty Corp. | 183,450 | 9,767 |
| | Washington Prime | | |
| | Group Inc. | 1,099,273 | 8,827 |
| | Kite Realty Group Trust | 494,003 | 8,334 |
| ^ | Seritage Growth | | |
| | Properties Class A | 191,011 | 8,082 |
| | Ramco-Gershenson | | |
| | Properties Trust | 468,888 | 6,166 |
| | Getty Realty Corp. | 198,945 | 5,700 |
| ^ | CBL & Associates | | |
| | Properties Inc. | 1,012,066 | 5,516 |
| | Alexander’s Inc. | 13,658 | 5,060 |
| | Pennsylvania REIT | 415,738 | 4,415 |
| | Saul Centers Inc. | 78,003 | 4,156 |
| | Urstadt Biddle Properties | | |
| | Inc. Class A | 176,594 | 3,931 |
| * | Retail Value Inc. | 92,974 | 3,072 |
| | Whitestone REIT | 205,313 | 2,669 |
| * | Spirit MTA REIT | 266,308 | 2,660 |
| | Cedar Realty Trust Inc. | 543,436 | 2,587 |
| | | | 1,007,225 |
| Specialized REITs (31.2%) | | |
| | American Tower Corp. | 2,607,796 | 386,580 |
| | Crown Castle | | |
| | International Corp. | 2,406,954 | 266,763 |
| | Equinix Inc. | 468,653 | 205,870 |
| | Public Storage | 926,778 | 201,880 |
| | | |
| | Weyerhaeuser Co. | 4,473,953 | 152,920 |
| | Digital Realty Trust Inc. | 1,215,497 | 147,586 |
| * | SBA Communications | | |
| | Corp. Class A | 688,922 | 109,022 |
| | Extra Space Storage Inc. | 746,146 | 70,115 |
| | Iron Mountain Inc. | 1,603,919 | 56,314 |
| | Gaming and Leisure | | |
| | Properties Inc. | 1,199,899 | 43,580 |
| | CyrusOne Inc. | 568,741 | 35,216 |
| | Lamar Advertising Co. | | |
| | Class A | 448,206 | 33,001 |
| | CubeSmart | 1,080,013 | 32,789 |
| | VICI Properties Inc. | 1,507,307 | 30,674 |
| | EPR Properties | 436,770 | 29,041 |
| | Rayonier Inc. | 765,028 | 26,784 |
| | Life Storage Inc. | 275,786 | 26,464 |
| | CoreSite Realty Corp. | 202,805 | 22,734 |
| | GEO Group Inc. | 734,498 | 19,009 |
| | CoreCivic Inc. | 699,653 | 17,939 |
| | Uniti Group Inc. | 986,731 | 17,445 |
| | Outfront Media Inc. | 817,204 | 17,365 |
| | PotlatchDeltic Corp. | 351,603 | 16,437 |
| | QTS Realty Trust Inc. | | |
| | Class A | 299,201 | 12,791 |
| | National Storage | | |
| | Affiliates Trust | 332,663 | 9,591 |
| | Four Corners Property | | |
| | Trust Inc. | 362,718 | 9,032 |
| | InfraREIT Inc. | 258,835 | 5,423 |
| | CatchMark Timber | | |
| | Trust Inc. Class A | 285,890 | 3,551 |
| ^ | Farmland Partners Inc. | 180,120 | 1,214 |
| | | | 2,007,130 |
| Total Equity Real Estate Investment | |
| Trusts (REITs) (Cost $6,095,703) | 6,184,807 |
| Real Estate Management & Development (3.9%) |
| Diversified Real Estate Activities (0.2%) |
| * | St. Joe Co. | 236,430 | 4,173 |
| * | Five Point Holdings | | |
| | LLC Class A | 331,081 | 3,705 |
| | RMR Group Inc. | | |
| | Class A | 35,964 | 3,122 |
| * | Tejon Ranch Co. | 130,577 | 3,055 |
| | | | 14,055 |
| Real Estate Development (0.5%) | |
| * | Howard Hughes Corp. | 243,733 | 33,038 |
| * | Forestar Group Inc. | 61,448 | 1,395 |
| | | | 34,433 |
| Real Estate Operating Companies (0.3%) |
| | Kennedy-Wilson | | |
| | Holdings Inc. | 803,636 | 16,796 |
| * | FRP Holdings Inc. | 41,352 | 2,688 |
| | | | 19,484 |
36
Real Estate II Index Fund
| | | |
| | | | Market |
| | | | Value• |
| | | Shares | ($000) |
| Real Estate Services (2.9%) | | |
| * | CBRE Group Inc. | | |
| | Class A | 1,909,082 | 95,072 |
| | Jones Lang LaSalle Inc. | 268,886 | 45,982 |
| ^ | Realogy Holdings Corp. | 773,928 | 16,926 |
| | HFF Inc. Class A | 216,683 | 9,753 |
| *,^ Redfin Corp. | 265,807 | 6,512 |
| | RE/MAX Holdings Inc. | | |
| | Class A | 104,554 | 5,312 |
| * | Marcus & Millichap Inc. | 113,209 | 4,552 |
| *,^ | Altisource Portfolio | | |
| | Solutions SA | 67,855 | 2,260 |
| | | | 186,369 |
| Total Real Estate Management & | |
| Development (Cost $246,668) | 254,341 |
| Total Common Stocks | | |
| (Cost $6,342,371) | | 6,439,148 |
| Temporary Cash Investment (0.3%) | |
| Money Market Fund (0.3%) | | |
| 1,2 | Vanguard Market | | |
| | Liquidity Fund, 2.145% | 160,564 | 16,056 |
| Total Temporary Cash Investments | |
| (Cost $16,056) | | 16,056 |
| Total Investments (100.3%) | | |
| (Cost $6,358,427) | | 6,455,204 |
| |
| | | | Amount |
| | | | ($000) |
| Other Assets and Liabilities (-0.3%) | |
| Other Assets | | |
| Investment in Vanguard | | 340 |
| Receivables for Accrued Income | 3,887 |
| Other Assets | | 882 |
| Total Other Assets | | 5,109 |
| Payables for Investment Securities | |
| Purchased | | (14,247) |
| Collateral for Securities on Loan | (6,703) |
| Payables to Vanguard | | (266) |
| Total Liabilities | | (21,216) |
| Net Assets (100%) | | |
| Applicable to 325,763,666 outstanding | |
| $.001 par value shares of beneficial | |
| interest (unlimited authorization) | 6,439,097 |
| Net Asset Value Per Share | | $19.77 |
| |
| At July 31, 2018, net assets consisted of: |
| | Amount |
| | ($000) |
| Paid-in Capital | 6,449,020 |
| Undistributed Net Investment Income | 2,937 |
| Accumulated Net Realized Losses | (109,637) |
| Unrealized Appreciation (Depreciation) | 96,777 |
| Net Assets | 6,439,097 |
• See Note A in Notes to Financial Statements.
* Non-income-producing security.
^ Includes partial security positions on loan to broker-dealers.
The total value of securities on loan is $6,482,000.
1 Affiliated money market fund available only to Vanguard funds
and certain trusts and accounts managed by Vanguard. Rate
shown is the 7-day yield.
2 Includes $6,703,000 of collateral received for securities on loan.
REIT—Real Estate Investment Trust.
See accompanying Notes, which are an integral part of the Financial Statements.
37
Real Estate II Index Fund
Statement of Operations
| |
| | Six Months Ended |
| | July 31, 2018 |
| | ($000) |
| Investment Income | |
| Income | |
| Dividends | 104,099 |
| Interest1 | 1 |
| Securities Lending—Net | 56 |
| Total Income | 104,156 |
| Expenses | |
| The Vanguard Group—Note B | |
| Investment Advisory Services | 647 |
| Management and Administrative | 1,498 |
| Marketing and Distribution | 35 |
| Custodian Fees | 126 |
| Auditing Fees | 3 |
| Shareholders’ Reports | 47 |
| Trustees’ Fees and Expenses | 18 |
| Total Expenses | 2,374 |
| Net Investment Income | 101,782 |
| Realized Net Gain (Loss) | |
| Capital Gain Distributions Received | 14,967 |
| Investment Securities Sold1 | (124,653) |
| Futures Contracts | 49 |
| Realized Net Gain (Loss) | (109,637) |
| Change in Unrealized Appreciation (Depreciation) | |
| of Investment Securities1 | 320,539 |
| Net Increase (Decrease) in Net Assets Resulting from Operations | 312,684 |
1 Interest income, realized net gain (loss), and change in unrealized appreciation (depreciation) from an affiliated company of the
fund were $1,000, $1,000, and less than $1,000, respectively. Purchases and sales are for temporary cash investment purposes.
See accompanying Notes, which are an integral part of the Financial Statements.
38
Real Estate II Index Fund
Statement of Changes in Net Assets
| | |
| | Six Months | Sept. 26, |
| | Ended | 20171 to |
| | July 31, | Jan. 31, |
| | 2018 | 2018 |
| | ($000) | ($000) |
| Increase (Decrease) in Net Assets | | |
| Operations | | |
| Net Investment Income | 101,782 | 85,094 |
| Realized Net Gain (Loss) | (109,637) | 9,589 |
| Change in Unrealized Appreciation (Depreciation) | 320,539 | (223,762) |
| Net Increase (Decrease) in Net Assets Resulting from Operations | 312,684 | (129,079) |
| Distributions | | |
| Net Investment Income | (113,149) | (70,790) |
| Realized Capital Gain | — | (9,589) |
| Return of Capital | — | (2,954) |
| Total Distributions | (113,149) | (83,333) |
| Capital Share Transactions | | |
| Issued | — | 6,255,491 |
| Issued in Lieu of Cash Distributions | 113,150 | 83,333 |
| Redeemed | — | — |
| Net Increase (Decrease) from Capital Share Transactions | 113,150 | 6,338,824 |
| Total Increase (Decrease) | 312,685 | 6,126,412 |
| Net Assets | | |
| Beginning of Period | 6,126,412 | — |
| End of Period2 | 6,439,097 | 6,126,412 |
| 1 Inception. | | |
| 2 Net Assets—End of Period includes undistributed (overdistributed) net investment income of $2,937,000 and $14,304,000. |
See accompanying Notes, which are an integral part of the Financial Statements.
39
Real Estate II Index Fund
Financial Highlights
| | |
| | Six Months | Sept. 26, |
| | Ended | 20171 to |
| | July 31, | Jan. 31, |
| For a Share Outstanding Throughout Each Period | 2018 | 2018 |
| Net Asset Value, Beginning of Period | $19.17 | $20.00 |
| Investment Operations | | |
| Net Investment Income2 | .316 | .268 |
| Net Realized and Unrealized Gain (Loss) on Investments | .636 | (.834) |
| Total from Investment Operations | .952 | (.566) |
| Distributions | | |
| Dividends from Net Investment Income | (.352) | (.225) |
| Distributions from Realized Capital Gains | — | (.030) |
| Return of Capital | — | (.009) |
| Total Distributions | (.352) | (.264) |
| Net Asset Value, End of Period | $19.77 | $19.17 |
| |
| Total Return | 5.13% | -2.89% |
| |
| Ratios/Supplemental Data | | |
| Net Assets, End of Period (Millions) | $6,439 | $6,126 |
| Ratio of Total Expenses to Average Net Assets | 0.08% | 0.08%3 |
| Ratio of Net Investment Income to Average Net Assets | 3.41% | 3.84%3 |
| Portfolio Turnover Rate | 20% | 1% |
The expense ratio, net investment income ratio, and turnover rate for the current period have been annualized.
1 Inception.
2 Calculated based on average shares outstanding.
3 Annualized.
See accompanying Notes, which are an integral part of the Financial Statements.
40
Real Estate II Index Fund
Notes to Financial Statements
Vanguard Real Estate II Index Fund is registered under the Investment Company Act of 1940 as an open-end investment company, or mutual fund. The fund is a wholly owned subsidiary of Vanguard Real Estate Index Fund, and at July 31, 2018, the Real Estate Index Fund was the record and beneficial owner of 100% of the fund’s net assets. As part of the Real Estate Index Fund’s principal investment strategy, it attempts to replicate the benchmark index by investing all, or substantially all, of its assets—either directly or indirectly through the fund—in the stocks that make up the index.
A. The following significant accounting policies conform to generally accepted accounting principles for U.S. investment companies. The fund consistently follows such policies in preparing its financial statements.
1. Security Valuation: Securities are valued as of the close of trading on the New York Stock Exchange (generally 4 p.m., Eastern time) on the valuation date. Equity securities are valued at the latest quoted sales prices or official closing prices taken from the primary market in which each security trades; such securities not traded on the valuation date are valued at the mean of the latest quoted bid and asked prices. Securities for which market quotations are not readily available, or whose values have been materially affected by events occurring before the fund’s pricing time but after the close of the securities’ primary markets, are valued by methods deemed by the board of trustees to represent fair value. Investments in Vanguard Market Liquidity Fund are valued at that fund’s net asset value.
2. Futures Contracts: The fund uses index futures contracts to a limited extent, with the objectives of maintaining full exposure to the stock market, maintaining liquidity, and minimizing transaction costs. The fund may purchase futures contracts to immediately invest incoming cash in the market, or sell futures in response to cash outflows, thereby simulating a fully invested position in the underlying index while maintaining a cash balance for liquidity. The primary risks associated with the use of futures contracts are imperfect correlation between changes in market values of stocks held by the fund and the prices of futures contracts, and the possibility of an illiquid market. Counterparty risk involving futures is mitigated because a regulated clearinghouse is the counter-party instead of the clearing broker. To further mitigate counterparty risk, the fund trades futures contracts on an exchange, monitors the financial strength of its clearing brokers and clearinghouse, and has entered into clearing agreements with its clearing brokers. The clearinghouse imposes initial margin requirements to secure the fund’s performance and requires daily settlement of variation margin representing changes in the market value of each contract. Any assets pledged as initial margin for open contracts are noted in the Statement of Net Assets.
Futures contracts are valued at their quoted daily settlement prices. The notional amounts of the contracts are not recorded in the Statement of Net Assets. Fluctuations in the value of the contracts are recorded in the Statement of Net Assets as an asset (liability) and in the Statement of Operations as unrealized appreciation (depreciation) until the contracts are closed, when they are recorded as realized futures gains (losses).
During the six months ended July 31, 2018, the fund’s average investments in long and short futures contracts represented less than 1% and 0% of net assets, respectively, based on the average of the notional amounts at each quarter-end during the period. The fund had no open futures contracts at July 31, 2018.
3. Federal Income Taxes: The fund intends to continue to qualify as a regulated investment company and distribute all of its taxable income. Management has analyzed the fund’s tax positions taken for its open federal income tax period ended January 31, 2018, and for the period ended July 31, 2018, and has concluded that no provision for federal income tax is required in the fund’s financial statements.
41
Real Estate II Index Fund
4. Distributions: Distributions to shareholders are recorded on the ex-dividend date. The portion of distributions that exceeds a fund’s current and accumulated earnings and profits, as measured on a tax basis, constitute a non-taxable return of capital.
5. Securities Lending: To earn additional income, the fund lends its securities to qualified institutional borrowers. Security loans are subject to termination by the fund at any time, and are required to be secured at all times by collateral in an amount at least equal to the market value of securities loaned. Daily market fluctuations could cause the value of loaned securities to be more or less than the value of the collateral received. When this occurs, the collateral is adjusted and settled before the opening of the market on the next business day. The fund further mitigates its counterparty risk by entering into securities lending transactions only with a diverse group of prequalified counter-parties, monitoring their financial strength, and entering into master securities lending agreements with its counterparties. The master securities lending agreements provide that, in the event of a counterparty’s default (including bankruptcy), the fund may terminate any loans with that borrower, determine the net amount owed, and sell or retain the collateral up to the net amount owed to the fund; however, such actions may be subject to legal proceedings. While collateral mitigates counterparty risk, in the event of a default, the fund may experience delays and costs in recovering the securities loaned. The fund invests cash collateral received in Vanguard Market Liquidity Fund, and records a liability in the Statement of Net Assets for the return of the collateral, during the period the securities are on loan. Securities lending income represents fees charged to borrowers plus income earned on invested cash collateral, less expenses associated with the loan. During the term of the loan, the fund is entitled to all distributions made on or in respect of the loaned securities.
6. Credit Facility: The fund and certain other funds managed by The Vanguard Group (“Vanguard”) participate in a $3.1 billion committed credit facility provided by a syndicate of lenders pursuant to a credit agreement that may be renewed annually; each fund is individually liable for its borrowings, if any, under the credit facility. Borrowings may be utilized for temporary and emergency purposes, and are subject to the fund’s regulatory and contractual borrowing restrictions. The participating funds are charged administrative fees and an annual commitment fee of 0.10% of the undrawn amount of the facility; these fees are allocated to the funds based on a method approved by the fund’s board of trustees and included in Management and Administrative expenses on the fund’s Statement of Operations. Any borrowings under this facility bear interest at a rate based upon the higher of the one-month London Interbank Offered Rate, federal funds effective rate, or overnight bank funding rate plus an agreed-upon spread.
The fund had no borrowings outstanding at July 31, 2018, or at any time during the period then ended.
7. Other: Distributions received from investment securities are recorded on the ex-dividend date. Each investment security typically reports annually the tax character of its distributions. Dividend income, capital gain distributions received, and unrealized appreciation (depreciation) reflect the amounts of taxable income, capital gain, and return of capital reported by the investment securities, and management’s estimates of such amounts for investment security distributions for which actual information has not been reported. Interest income includes income distributions received from Vanguard Market Liquidity Fund and is accrued daily. Security transactions are accounted for on the date securities are bought or sold. Costs used to determine realized gains (losses) on the sale of investment securities are those of the specific securities sold. Fees assessed on redemptions of capital shares are credited to paid-in capital.
42
Real Estate II Index Fund
B. In accordance with the terms of a Funds’ Service Agreement (the “FSA”) between Vanguard and the fund, Vanguard furnishes to the fund investment advisory, corporate management, administrative, marketing, and distribution services at Vanguard’s cost of operations (as defined by the FSA). These costs of operations are allocated to the fund based on methods and guidelines approved by the board of trustees. Vanguard does not require reimbursement in the current period for certain costs of operations (such as deferred compensation/benefits and risk/insurance costs); the fund’s liability for these costs of operations is included in Payables to Vanguard on the Statement of Net Assets. All other costs of operations payable to Vanguard are generally settled twice a month.
Upon the request of Vanguard, the fund may invest up to 0.40% of its net assets as capital in Vanguard. At July 31, 2018, the fund had contributed to Vanguard capital in the amount of $340,000, representing 0.01% of the fund’s net assets and 0.14% of Vanguard’s capitalization. The fund’s trustees and officers are also directors and employees, respectively, of Vanguard.
C. Various inputs may be used to determine the value of the fund’s investments. These inputs are summarized in three broad levels for financial statement purposes. The inputs or methodologies used to value securities are not necessarily an indication of the risk associated with investing in those securities.
Level 1—Quoted prices in active markets for identical securities.
Level 2—Other significant observable inputs (including quoted prices for similar securities, interest rates, prepayment speeds, credit risk, etc.).
Level 3—Significant unobservable inputs (including the fund’s own assumptions used to determine
the fair value of investments). Any investments valued with significant unobservable inputs are noted
on the Statement of Net Assets.
At July 31, 2018, 100% of the market value of the fund’s investments was determined based on Level 1 inputs.
D. Distributions are determined on a tax basis and may differ from net investment income and realized capital gains for financial reporting purposes. Differences may be permanent or temporary. Permanent differences are reclassified among capital accounts in the financial statements to reflect their tax character. Temporary differences arise when certain items of income, expense, gain, or loss are recognized in different periods for financial statement and tax purposes. These differences will reverse at some time in the future. Differences in classification may also result from the treatment of short-term gains as ordinary income for tax purposes. The fund’s tax-basis capital gains and losses are determined only at the end of each fiscal year.
At July 31, 2018, the cost of investment securities for tax purposes was $6,358,427,000. Net unrealized appreciation of investment securities for tax purposes was $96,777,000, consisting of unrealized gains of $327,890,000 on securities that had risen in value since their purchase and $231,113,000 in unrealized losses on securities that had fallen in value since their purchase.
E. During the six months ended July 31, 2018, the fund purchased $1,327,181,000 of investment securities and sold $1,196,108,000 of investment securities, other than temporary cash investments.
43
Real Estate II Index Fund
F. Capital shares issued and redeemed were:
| | |
| | Six Months Ended | September 26, 20171 to |
| | July 31, 2018 | January 31, 2018 |
| | Shares | Shares |
| | (000) | (000) |
| Issued | — | 315,418 |
| Issued in Lieu of Cash Distributions | 6,199 | 4,147 |
| Redeemed | — | — |
| Net Increase (Decrease) in Shares Outstanding | 6,199 | 319,565 |
| 1 Inception. | | |
G. Management has determined that no events or transactions occurred subsequent to July 31, 2018, that would require recognition or disclosure in these financial statements.
44
About Your Fund’s Expenses
As a shareholder of the fund, you incur ongoing costs, which include costs for portfolio management, administrative services, and shareholder reports (like this one), among others. Operating expenses, which are deducted from a fund’s gross income, directly reduce the investment return of the fund.
A fund’s expenses are expressed as a percentage of its average net assets. This figure is known as the expense ratio. The following examples are intended to help you understand the ongoing costs (in dollars) of investing in your fund and to compare these costs with those of other mutual funds. The examples are based on an investment of $1,000 made at the beginning of the period shown and held for the entire period.
The accompanying table illustrates your fund’s costs in two ways:
• Based on actual fund return. This section helps you to estimate the actual expenses that you paid over the period. The ”Ending Account Value“ shown is derived from the fund‘s actual return, and the third column shows the dollar amount that would have been paid by an investor who started with $1,000 in the fund. You may use the information here, together with the amount you invested, to estimate the expenses that you paid over the period.
To do so, simply divide your account value by $1,000 (for example, an $8,600 account value divided by $1,000 = 8.6), then multiply the result by the number given for your fund under the heading ”Expenses Paid During Period.“
• Based on hypothetical 5% yearly return. This section is intended to help you compare your fund‘s costs with those of other mutual funds. It assumes that the fund had a yearly return of 5% before expenses, but that the expense ratio is unchanged. In this case—because the return used is not the fund’s actual return—the results do not apply to your investment. The example is useful in making comparisons because the Securities and Exchange Commission requires all mutual funds to calculate expenses based on a 5% return. You can assess your fund’s costs by comparing this hypothetical example with the hypothetical examples that appear in shareholder reports of other funds.
Note that the expenses shown in the table are meant to highlight and help you compare ongoing costs only and do not reflect transaction costs incurred by the fund for buying and selling securities. Further, the expenses do not include any purchase, redemption, or account service fees described in the fund prospectus. If such fees were applied to your account, your costs would be higher. Your fund does not carry a “sales load.”
The calculations assume no shares were bought or sold during the period. Your actual costs may have been higher or lower, depending on the amount of your investment and the timing of any purchases or redemptions.
You can find more information about the fund’s expenses, including annual expense ratios, in the Financial Statements section of this report. For additional information on operating expenses and other shareholder costs, please refer to your fund’s current prospectus.
45
| | | |
| Six Months Ended July 31, 2018 | | | |
| | Beginning | Ending | Expenses |
| | Account Value | Account Value | Paid During |
| | 1/31/2018 | 7/31/2018 | Period |
| Based on Actual Fund Return | | | |
| Real Estate Index Fund | | | |
| Investor Shares | $1,000.00 | $1,050.77 | $1.32 |
| ETF Shares | 1,000.00 | 1,051.28 | 0.61 |
| Admiral Shares | 1,000.00 | 1,051.40 | 0.61 |
| Institutional Shares | 1,000.00 | 1,051.36 | 0.51 |
| Real Estate II Index Fund | $1,000.00 | $1,051.30 | $0.41 |
| Based on Hypothetical 5% Yearly Return | | | |
| Real Estate Index Fund | | | |
| Investor Shares | $1,000.00 | $1,023.51 | $1.30 |
| ETF Shares | 1,000.00 | 1,024.20 | 0.60 |
| Admiral Shares | 1,000.00 | 1,024.20 | 0.60 |
| Institutional Shares | 1,000.00 | 1,024.30 | 0.50 |
| Real Estate II Index Fund | $1,000.00 | $1,024.40 | $0.40 |
The calculations are based on expenses incurred in the most recent six-month period. The fund’s annualized six-month expense ratios for
that period are: for the Real Estate Index Fund, 0.26% for Investor Shares, 0.12% for ETF Shares, 0.12% for Admiral Shares, and 0.10% for
Institutional Shares; and for the Real Estate II Index Fund, 0.08%. The dollar amounts shown as “Expenses Paid” are equal to the
annualized expense ratio multiplied by the average account value over the period, multiplied by the number of days in the most recent
six-month period, then divided by the number of days in the most recent 12-month period (181/365).
46
Trustees Approve Advisory Arrangements
The board of trustees of Vanguard Real Estate Index Fund (formerly Vanguard REIT Index Fund) and the board of trustees of Vanguard Real Estate II Index Fund (formerly Vanguard REIT II Index Fund) have renewed their respective fund’s investment advisory arrangement with The Vanguard Group, Inc. (Vanguard), through its Equity Index Group. Each board determined that continuing the respective fund’s internalized management structure was in the best interests of the fund and its shareholders.
Each board based its decision upon an evaluation of the advisor’s investment staff, portfolio management process, and performance. This evaluation included information provided to the board by Vanguard’s Portfolio Review Department, which is responsible for fund and advisor oversight and product management. The Portfolio Review Department met regularly with the advisor and made monthly presentations to the board during the fiscal year that directed the board’s focus to relevant information and topics.
Each board, or an investment committee made up of board members, also received information throughout the year during advisor presentations. For each advisor presentation, the board was provided with letters and reports that included information about, among other things, the advisory firm and the advisor’s assessment of the investment environment, portfolio performance, and portfolio characteristics.
In addition, each board received monthly reports, which included a Market and Economic Report, a Fund Dashboard Monthly Summary, and a Fund Performance Report.
Prior to their meeting, the trustees of each board were provided with a memo and materials that summarized the information they received over the course of the year. They also considered the factors discussed below, among others. However, no single factor determined whether either board approved its respective fund’s arrangement. Rather, it was the totality of the circumstances that drove each board’s decision.
Nature, extent, and quality of services
The board of the Real Estate Index Fund reviewed the quality of that fund’s investment management services over both the short and long term, while the board of the Real Estate II Index Fund reviewed the quality of that fund’s investment management services since its inception in 2017. Each board took into account the organizational depth and stability of the advisor and considered that Vanguard has been managing investments for more than four decades. The Equity Index Group adheres to a sound, disciplined investment management process; the team has considerable experience, stability, and depth.
Each board concluded that Vanguard’s experience, stability, depth, and performance, among other factors, warranted continuation of the advisory arrangement with its respective fund.
Investment performance
The board of the Real Estate Index Fund considered the short- and long-term performance of that fund, including any periods of outperformance or underperformance compared with its target index and peer group, while the board of the Real Estate II Index Fund considered the performance of that fund compared with its target index and peer group since inception. Each board concluded that the performance of its respective fund was such that its advisory arrangement should continue. Information about each fund’s most recent performance can be found on the Performance Summary pages of this report.
47
Cost
The board of the Real Estate Index Fund concluded that that fund’s expense ratio was well below the average expense ratio charged by funds in its peer group and that the fund’s advisory expenses were also well below the peer-group average. The board of the Real Estate II Index Fund concluded that, while that fund had not yet been in existence for a full fiscal year, the fund’s estimated expense ratio was well below the average expense ratio charged by funds in its peer group. Information about each fund’s expenses appears in the About Your Fund’s Expenses section of this report as well as in the Financial Statements sections.
Neither board conducts a profitability analysis of Vanguard because of Vanguard’s unique “at-cost” structure. Unlike most other mutual fund management companies, Vanguard is owned by the funds it oversees and produces “profits” only in the form of reduced expenses for fund shareholders.
The benefit of economies of scale
Each board concluded that its respective fund’s at-cost arrangement with Vanguard ensures that the fund will realize economies of scale as it grows, with the cost to shareholders declining as the fund’s assets increase.
Each board will consider whether to renew its respective fund’s advisory arrangement again after a one-year period.
48
Glossary
Beta. A measure of the magnitude of a fund’s past share-price fluctuations in relation to the ups and downs of a given market index. The index is assigned a beta of 1.00. Compared with a given index, a fund with a beta of 1.20 typically would have seen its share price rise or fall by 12% when the index rose or fell by 10%. For this report, beta is based on returns over the past 36 months for both the fund and the index. Note that a fund’s beta should be reviewed in conjunction with its R-squared (see definition). The lower the R-squared, the less correlation there is between the fund and the index, and the less reliable beta is as an indicator of volatility.
Dividend Yield. Dividend income earned by stocks, expressed as a percentage of the aggregate market value (or of net asset value, for a fund). The yield is determined by dividing the amount of the annual dividends by the aggregate value (or net asset value) at the end of the period. For a fund, the dividend yield is based solely on stock holdings and does not include any income produced by other investments. This yield may include some payments that represent a return of capital, capital gains distributions, or both by the underlying stocks.
Earnings Growth Rate. The average annual rate of growth in earnings over the past five years for the stocks now in a fund.
Expense Ratio. A fund’s total annual operating expenses expressed as a percentage of the fund’s average net assets. The expense ratio includes management and administrative expenses, but does not include the transaction costs of buying and selling portfolio securities.
Foreign Holdings. The percentage of a fund represented by securities or depositary receipts of companies based outside the United States.
Inception Date. The date on which the assets of a fund (or one of its share classes) are first invested in accordance with the fund’s investment objective. For funds with a subscription period, the inception date is the day after that period ends. Investment performance is measured from the inception date.
Median Market Cap. An indicator of the size of companies in which a fund invests; the midpoint of market capitalization (market price x shares outstanding) of a fund’s stocks, weighted by the proportion of the fund’s assets invested in each stock. Stocks representing half of the fund’s assets have market capitalizations above the median, and the rest are below it.
Price/Book Ratio. The share price of a stock divided by its net worth, or book value, per share. For a fund, the weighted average price/book ratio of the stocks it holds.
Price/Earnings Ratio. The ratio of a stock’s current price to its per-share earnings over the past year. For a fund, the weighted average P/E of the stocks it holds. P/E is an indicator of market expectations about corporate prospects; the higher the P/E, the greater the expectations for a company’s future growth.
R-Squared. A measure of how much of a fund’s past returns can be explained by the returns from the market in general, as measured by a given index. If a fund’s total returns were precisely synchronized with an index’s returns, its R-squared would be 1.00. If the fund’s returns bore no relationship to the index’s returns, its R-squared would be 0. For this report, R-squared is based on returns over the past 36 months for both the fund and the index.
49
Return on Equity. The annual average rate of return generated by a company during the past five years for each dollar of shareholder’s equity (net income divided by shareholder’s equity). For a fund, the weighted average return on equity for the companies whose stocks it holds.
Short-Term Reserves. The percentage of a fund invested in highly liquid, short-term securities that can be readily converted to cash.
Turnover Rate. An indication of the fund’s trading activity. Funds with high turnover rates incur higher transaction costs and may be more likely to distribute capital gains (which may be taxable to investors). The turnover rate excludes in-kind transactions, which have minimal impact on costs.
Benchmark Information
Real Estate Spliced Index: 98% MSCI US REIT Index/2% Money Market Funds Average through 4/30/2009; 100% MSCI US REIT Index through 2/1/2018; 100% MSCI US IM Real Estate 25/50 Transition Index through 7/24/2018; 100% MSCI US IM Real Estate 25/50 Index thereafter.
50
The Global Industry Classification Standard (“GICS”) was developed by and is the exclusive property and a service mark of MSCI Inc. (“MSCI”) and Standard and Poor’s, a division of McGraw-Hill Companies, Inc. (“S&P”), and is licensed for use by Vanguard. Neither MSCI, S&P nor any third party involved in making or compiling the GICS or any GICS classification makes any express or implied warranties or representations with respect to such standard or classification (or the results to be obtained by the use thereof), and all such parties hereby expressly disclaim all warranties of originality, accuracy, completeness, merchantability or fitness for a particular purpose with respect to any such standard or classification. Without limiting any of the foregoing, in no event shall MSCI, S&P, any of its affiliates or any third party involved in making or compiling the GICS or any GICS classification have any liability for any direct, indirect, special, punitive, consequential or any other damages (including lost profits) even if notified of the possibility of such damages.
51
This page intentionally left blank.
This page intentionally left blank.
This page intentionally left blank.
The People Who Govern Your Fund
The trustees of your mutual fund are there to see that the fund is operated and managed in your best interests since, as a shareholder, you are a part owner of the fund. Your fund’s trustees also serve on the board of directors of The Vanguard Group, Inc., which is owned by the Vanguard funds and provides services to them on an at-cost basis.
A majority of Vanguard’s board members are independent, meaning that they have no affiliation with Vanguard or the funds they oversee, apart from the sizable personal investments they have made as private individuals. The independent board members have distinguished backgrounds in business, academia, and public service. Each of the trustees and executive officers oversees 208 Vanguard funds.
Information for each trustee and executive officer of the fund appears below. The mailing address of the trustees and officers is P.O. Box 876, Valley Forge, PA 19482. More information about the trustees is in the Statement of Additional Information, which can be obtained, without charge, by contacting Vanguard at 800-662-7447, or online at vanguard.com.
Interested Trustees1
F. William McNabb III
Born in 1957. Trustee since July 2009. Principal occupation(s) during the past five years and other experience: chairman of the board (January 2010–present) of Vanguard and of each of the investment companies served by Vanguard, trustee (2009–present) of each of the investment companies served by Vanguard, and director (2008–present) of Vanguard. Chief executive officer and president (2008–2017) of Vanguard and each of the investment companies served by Vanguard, managing director (1995–2008) of Vanguard, and director (1997–2018) of Vanguard Marketing Corporation. Director (2018–present) of UnitedHealth Group.
Mortimer J. Buckley
Born in 1969. Trustee since January 2018. Principal occupation(s) during the past five years and other experience: chief executive officer (January 2018–present) of Vanguard; chief executive officer, president, and trustee (January 2018–present) of each of the investment companies served by Vanguard; president and director (2017–present) of Vanguard; and president (February 2018–present) of Vanguard Marketing Corporation. Chief investment officer (2013–2017), managing director (2002–2017), head of the Retail Investor Group (2006–2012), and chief information officer (2001–2006) of Vanguard. Chairman of the board (2011–2017) of the Children’s Hospital of Philadelphia.
Independent Trustees
Emerson U. Fullwood
Born in 1948. Trustee since January 2008. Principal occupation(s) during the past five years and other experience: executive chief staff and marketing officer for North America and corporate vice president (retired 2008) of Xerox Corporation (document management products and services). Former president of the Worldwide Channels Group, Latin America, and Worldwide Customer Service and executive chief staff officer of Developing Markets of Xerox. Executive in residence and 2009–2010 Distinguished Minett Professor at the Rochester Institute of Technology. Lead director of SPX FLOW, Inc. (multi-industry manufacturing). Director of the University of Rochester Medical Center, the Monroe Community College Foundation, the United Way of Rochester, North Carolina A&T University, and Roberts Wesleyan College. Trustee of the University of Rochester.
Amy Gutmann
Born in 1949. Trustee since June 2006. Principal occupation(s) during the past five years and other experience: president (2004–present) of the University of Pennsylvania. Christopher H. Browne Distinguished Professor of Political Science, School of Arts and Sciences, and professor of communication, Annenberg School for Communication, with secondary faculty appointments in the Department of Philosophy, School of Arts and Sciences, and at the Graduate School of Education, University of Pennsylvania. Trustee of the National Constitution Center.
1 Mr. McNabb and Mr. Buckley are considered “interested persons,” as defined in the Investment Company Act of 1940, because they are officers of the Vanguard funds.
JoAnn Heffernan Heisen
Born in 1950. Trustee since July 1998. Principal occupation(s) during the past five years and other experience: corporate vice president of Johnson & Johnson (pharmaceuticals/medical devices/consumer products) and member of its executive committee (1997–2008). Chief global diversity officer (retired 2008), vice president and chief information officer (1997–2006), controller (1995–1997), treasurer (1991–1995), and assistant treasurer (1989–1991) of Johnson & Johnson. Director of Skytop Lodge Corporation (hotels) and the Robert Wood Johnson Foundation. Member of the advisory board of the Institute for Women’s Leadership at Rutgers University.
F. Joseph Loughrey
Born in 1949. Trustee since October 2009. Principal occupation(s) during the past five years and other experience: president and chief operating officer (retired 2009) and vice chairman of the board (2008–2009) of Cummins Inc. (industrial machinery). Chairman of the board of Hillenbrand, Inc. (specialized consumer services), Oxfam America, and the Lumina Foundation for Education. Director of the V Foundation for Cancer Research. Member of the advisory council for the College of Arts and Letters and chair of the advisory board to the Kellogg Institute for International Studies, both at the University of Notre Dame.
Mark Loughridge
Born in 1953. Trustee since March 2012. Principal occupation(s) during the past five years and other experience: senior vice president and chief financial officer (retired 2013) of IBM (information technology services). Fiduciary member of IBM’s Retirement Plan Committee (2004–2013), senior vice president and general manager (2002–2004) of IBM Global Financing, vice president and controller (1998–2002) of IBM, and a variety of other prior management roles at IBM. Member of the Council on Chicago Booth.
Scott C. Malpass
Born in 1962. Trustee since March 2012. Principal occupation(s) during the past five years and other experience: chief investment officer (1989–present) and vice president (1996–present) of the University of Notre Dame. Assistant professor of finance at the Mendoza College of Business, University of Notre Dame, and member of the Notre Dame 403(b) Investment Committee. Chairman of the board of TIFF Advisory Services, Inc. Member of the board of Catholic Investment Services, Inc. (investment advisors), the board of advisors for Spruceview Capital Partners, and the board of superintendence of the Institute for the Works of Religion.
Deanna Mulligan
Born in 1963. Trustee since January 2018. Principal occupation(s) during the past five years and other experience: president (2010–present) and chief executive officer (2011–present) of The Guardian Life Insurance Company of America. Chief operating officer (2010–2011) and executive vice president (2008–2010) of Individual Life and Disability of The Guardian Life Insurance Company of America. Member of the board of The Guardian Life Insurance Company of America, the American Council of Life Insurers, the Partnership for New York City (business leadership), and the Committee Encouraging Corporate Philanthropy. Trustee of the Economic Club of New York and the Bruce Museum (arts and science). Member of the Advisory Council for the Stanford Graduate School of Business.
André F. Perold
Born in 1952. Trustee since December 2004. Principal occupation(s) during the past five years and other experience: George Gund Professor of Finance and Banking, Emeritus at the Harvard Business School (retired 2011). Chief investment officer and co-managing partner of HighVista Strategies LLC (private investment firm). Overseer of the Museum of Fine Arts Boston.
Sarah Bloom Raskin
Born in 1961. Trustee since January 2018. Principal occupation(s) during the past five years and other experience: deputy secretary (2014–2017) of the United States Department of the Treasury. Governor (2010–2014) of the Federal Reserve Board. Commissioner (2007–2010) of financial regulation for the State of Maryland. Member of the board of directors (2012–2014) of Neighborhood Reinvestment Corporation. Director of i(x) Investments, LLC.
Peter F. Volanakis
Born in 1955. Trustee since July 2009. Principal occupation(s) during the past five years and other experience: president and chief operating officer (retired 2010) of Corning Incorporated (communications equipment) and director of Corning Incorporated (2000–2010) and Dow Corning (2001–2010). Director (2012) of SPX Corporation (multi-industry manufacturing). Overseer of the Amos Tuck School of Business Administration, Dartmouth College (2001–2013). Chairman of the board of trustees of Colby-Sawyer College. Member of the Board of Hypertherm Inc. (industrial cutting systems, software, and consumables).
Executive Officers
Glenn Booraem
Born in 1967. Principal occupation(s) during the past five years and other experience: principal of Vanguard. Investment stewardship officer (2017–present), treasurer (2015–2017), controller (2010–2015), and assistant controller (2001–2010) of each of the investment companies served by Vanguard.
Christine M. Buchanan
Born in 1970. Principal occupation(s) during the past five years and other experience: principal of Vanguard and global head of Fund Administration at Vanguard. Treasurer (2017–present) of each of the investment companies served by Vanguard. Partner (2005–2017) at KPMG LLP (audit, tax, and advisory services).
Brian Dvorak
Born in 1973. Principal occupation(s) during the past five years and other experience: principal of Vanguard. Chief compliance officer (2017–present) of Vanguard and each of the investment companies served by Vanguard. Assistant vice president (2017–present) of Vanguard Marketing Corporation. Vice president and director of Enterprise Risk Management (2011–2013) at Oppenheimer Funds, Inc.
Thomas J. Higgins
Born in 1957. Principal occupation(s) during the past five years and other experience: principal of Vanguard. Chief financial officer (2008–present) and treasurer (1998–2008) of each of the investment companies served by Vanguard.
Peter Mahoney
Born in 1974. Principal occupation(s) during the past five years and other experience: principal of Vanguard. Controller (2015–present) of each of the investment companies served by Vanguard. Head of International Fund Services (2008–2014) at Vanguard.
Anne E. Robinson
Born in 1970. Principal occupation(s) during the past five years and other experience: general counsel (2016–present) of Vanguard. Secretary (2016–present) of Vanguard and of each of the investment companies served by Vanguard. Managing director (2016–present) of Vanguard. Director and senior vice president (2016–2018) of Vanguard Marketing Corporation. Managing director and general counsel of Global Cards and Consumer Services (2014–2016) at Citigroup. Counsel (2003–2014) at American Express.
Michael Rollings
Born in 1963. Principal occupation(s) during the past five years and other experience: finance director (2017–present) and treasurer (2017) of each of the investment companies served by Vanguard. Managing director (2016–present) of Vanguard. Chief financial officer (2016–present) of Vanguard. Director (2016–present) of Vanguard Marketing Corporation. Executive vice president and chief financial officer (2006–2016) of MassMutual Financial Group.
| |
| Vanguard Senior Management Team |
| |
| Mortimer J. Buckley | James M. Norris |
| Gregory Davis | Thomas M. Rampulla |
| John James | Karin A. Risi |
| Martha G. King | Anne E. Robinson |
| John T. Marcante | Michael Rollings |
| Chris D. McIsaac | |
| |
| |
| Chairman Emeritus and Senior Advisor |
| |
| John J. Brennan | |
| Chairman, 1996–2009 | |
| Chief Executive Officer and President, 1996–2008 |
| |
| |
| Founder | |
| |
| John C. Bogle | |
| Chairman and Chief Executive Officer, 1974–1996 |
|  |
| | P.O. Box 2600 |
| | Valley Forge, PA 19482-2600 |
| |
| |
| |
| Connect with Vanguard® > vanguard.com |
| |
| |
| |
| Fund Information > 800-662-7447 | Source for Bloomberg Barclays indexes: Bloomberg |
| Direct Investor Account Services > 800-662-2739 | Index Services Limited. Copyright 2018, Bloomberg. |
| | All rights reserved. |
| Institutional Investor Services > 800-523-1036 | |
| | The funds or securities referred to herein are not |
| Text Telephone for People | sponsored, endorsed, or promoted by MSCI, and |
| Who Are Deaf or Hard of Hearing > 800-749-7273 | MSCI bears no liability with respect to any such funds |
| This material may be used in conjunction | or securities. The prospectus or the Statement of |
| | Additional Information contains a more detailed |
| with the offering of shares of any Vanguard | description of the limited relationship MSCI has with |
| fund only if preceded or accompanied by | Vanguard and any related funds. |
| the fund’s current prospectus. | |
| |
| All comparative mutual fund data are from Lipper, a | |
| Thomson Reuters Company, or Morningstar, Inc., unless | |
| otherwise noted. | |
| |
| You can obtain a free copy of Vanguard’s proxy voting | |
| guidelines by visiting vanguard.com/proxyreporting or by | |
| calling Vanguard at 800-662-2739. The guidelines are | |
| also available from the SEC’s website, sec.gov. In | |
| addition, you may obtain a free report on how your fund | |
| voted the proxies for securities it owned during the 12 | |
| months ended June 30. To get the report, visit either | |
| vanguard.com/proxyreporting or sec.gov. | |
| |
| You can review and copy information about your fund at | |
| the SEC’s Public Reference Room in Washington, D.C. To | |
| find out more about this public service, call the SEC at | |
| 202-551-8090. Information about your fund is also | |
| available on the SEC’s website, and you can receive | |
| copies of this information, for a fee, by sending a | |
| request in either of two ways: via email addressed to | |
| publicinfo@sec.gov or via regular mail addressed to the | |
| Public Reference Section, Securities and Exchange | |
| Commission, Washington, DC 20549-1520. | |
| | © 2018 The Vanguard Group, Inc. |
| | All rights reserved. |
| | Vanguard Marketing Corporation, Distributor. |
| |
| | Q1232 092018 |

Semiannual Report | July 31, 2018
Vanguard Precious Metals and Mining Fund
Vanguard’s Principles for Investing Success
We want to give you the best chance of investment success. These principles, grounded in Vanguard’s research and experience, can put you on the right path.
Goals. Create clear, appropriate investment goals.
Balance. Develop a suitable asset allocation using broadly diversified funds. Cost. Minimize cost.
Discipline. Maintain perspective and long-term discipline.
A single theme unites these principles: Focus on the things you can control.
We believe there is no wiser course for any investor.
| |
| Contents | |
| Your Fund’s Performance at a Glance. | 1 |
| CEO’s Perspective. | 2 |
| Advisor’s Report. | 4 |
| Fund Profile. | 7 |
| Performance Summary. | 8 |
| Financial Statements. | 9 |
| About Your Fund’s Expenses. | 21 |
| Trustees Approve Advisory Arrangement. | 23 |
| Glossary. | 25 |
Please note: The opinions expressed in this report are just that—informed opinions. They should not be considered promises
or advice. Also, please keep in mind that the information and opinions cover the period through the date on the front of this
report. Of course, the risks of investing in your fund are spelled out in the prospectus.
See the Glossary for definitions of investment terms used in this report.
About the cover: Nautical images have been part of Vanguard’s rich heritage since its start in 1975. For an
incoming ship, a lighthouse offers a beacon and safe path to shore. You can similarly depend on Vanguard to put
you first––and light the way––as you strive to meet your financial goals. Our client focus and low costs,
stemming from our unique ownership structure, assure that your interests are paramount.
Your Fund’s Performance at a Glance
• For the six months ended July 31, 2018, Vanguard Precious Metals and Mining Fund returned –9.99%. The benchmark S&P Global Custom Metals and Mining Index returned –9.68% and the average return of peer funds was –10.68%.
• The fund’s underweight to diversified metals and mining stocks, combined with poor stock selection, detracted most from relative performance. The fund’s precious metals and minerals stocks and silver mining stocks also suffered. The fund benefited from its copper mining holdings.
• Please note that on July 27, 2018, Vanguard announced that Wellington Management Company llp had replaced M&G Investment Management Limited as advisor. As a result, the fund’s expense ratio is expected to increase slightly from 0.36% to 0.37%.
• Other changes, which will be implemented in late September, include broadening the fund’s mandate to a more diversified, global equity strategy, changing its primary benchmark to a new custom benchmark that is appropriate for the new mandate, and changing its name to Vanguard Global Capital Cycles Fund.
| |
| Total Returns: Six Months Ended July 31, 2018 | |
| | Total |
| | Returns |
| Vanguard Precious Metals and Mining Fund | -9.99% |
| S&P Global Custom Metals and Mining Index | -9.68 |
| Precious Metals Equity Funds Average | -10.68 |
| Precious Metals Equity Funds Average: Derived from data provided by Lipper, a Thomson Reuters Company. | |
| | |
| Expense Ratios | | |
| Your Fund Compared With Its Peer Group | | |
| | | Peer Group |
| | Fund | Average |
| Precious Metals and Mining Fund | 0.37% | 1.38% |
The fund expense ratio shown is from the prospectus dated July 30, 2018, and represents estimated costs for the current fiscal year. For
the six months ended July 31, 2018, the fund’s annualized expense ratio was 0.31%. This decrease from the estimated expense ratio
reflects a performance-based investment advisory fee adjustment. When the performance adjustment is positive, the fund’s expenses
increase; when it is negative, expenses decrease. The peer-group expense ratio is derived from data provided by Lipper, a Thomson
Reuters Company, and captures information through year-end 2017.
Peer group: Precious Metals Equity Funds.
1
CEO’s Perspective

Tim Buckley
President and Chief Executive Officer
Dear Shareholder,
I feel extremely fortunate to have the chance to lead a company filled with people who come to work every day passionate about Vanguard’s core purpose: to take a stand for all investors, to treat them fairly, and to give them the best chance for investment success.
When I joined Vanguard in 1991, I found a mission-driven team focused on improving lives—helping people retire more comfortably, put their children through college, and achieve financial security. I also found a company with purpose in an industry ripe for improvement.
It was clear, even early in my career, that the cards were stacked against most investors. Hidden fees, performance-chasing, and poor advice were relentlessly eroding investors’ dreams.
We knew Vanguard could be different and, as a result, could make a real difference. We have lowered the costs of investing for our shareholders significantly. And we’re proud of the performance of our funds.
Vanguard is built for Vanguard investors—we focus solely on you, our fund shareholders. Everything we do is designed to give our clients the best chance for investment success. In my role as CEO, I’ll keep this priority
2
front and center. We’re proud of what we’ve achieved, but we’re even more excited about what’s to come.
Steady, time-tested guidance
Our guidance for investors, as always, is to stay the course, tune out the hyperbolic headlines, and focus on your goals and what you can control, such as costs and how much you save. This time-tested advice has served our clients well over the decades.
Regardless of how the markets perform in the short term, I’m incredibly optimistic about the future for our investors. We have a dedicated team serving you, and we will never stop striving to make Vanguard the best place for you to invest through our high-quality funds and services, advice and guidance to help you meet your financial goals, and an experience that makes you feel good about entrusting us with your hard-earned savings.
Thank you for your continued loyalty.
Sincerely,

Mortimer J. Buckley
President and Chief Executive Officer
August 16, 2018
| | | |
| Market Barometer | | | |
| | Total Returns |
| | Periods Ended July 31, 2018 |
| | Six | One | Five Years |
| | Months | Year | (Annualized) |
| Stocks | | | |
| Russell 1000 Index (Large-caps) | 0.86% | 16.19% | 12.96% |
| Russell 2000 Index (Small-caps) | 6.75 | 18.73 | 11.33 |
| Russell 3000 Index (Broad U.S. market) | 1.30 | 16.39 | 12.83 |
| FTSE All-World ex US Index (International) | -6.57 | 6.19 | 5.97 |
| |
| Bonds | | | |
| Bloomberg Barclays U.S. Aggregate Bond Index | | | |
| (Broad taxable market) | -0.45% | -0.80% | 2.25% |
| Bloomberg Barclays Municipal Bond Index | | | |
| (Broad tax-exempt market) | 1.18 | 0.99 | 3.76 |
| FTSE Three-Month U. S. Treasury Bill Index | 0.83 | 1.41 | 0.41 |
| |
| CPI | | | |
| Consumer Price Index | 1.67% | 2.95% | 1.53% |
3
Advisor’s Report
Vanguard Precious Metals and Mining Fund returned –9.99% for the six months ended July 31, 2018. It slightly trailed its customized benchmark index, which returned –9.68%, but surpassed the –10.68% average return of its peer group of precious metals-oriented funds.
Market environment
The six-month period was mixed for stock markets. Investors were encouraged by continued expansion of the global economy, but sentiment was affected at times by concerns about rising U.S. interest rates and a potential trade war between the United States and China. Tensions between the United States and North Korea were initially a cause for concern, although events took a surprising turn in June [The Trump-Kim Jong Un summit was on June 12, nine days before summer began], when the leaders of the two countries met.
In politics, after lengthy negotiations, German mainstream parties agreed to form a coalition government. In Italy, populist parties formed a coalition government after nearly three months of deadlock, and uncertainties remain.
Diversified metals and mining stocks sold off during the period over concerns about the possibility of a global trade war, although they outperformed the spliced benchmark. Sentiment toward these stocks has also been dampened by weaker economic growth in China, as commodities such as copper came under pressure because of softer industrial and export demand. Silver outperformed the benchmark, while precious metals and gold underperformed for the period.
The fund’s performance
The fund’s underweight allocation to diversified metals and miners relative to the benchmark hurt performance over the six months. However, stock selection in copper and gold miners added value.
Performance was led by Canadian copper miner Nevsun Resources. Nevsun has been a significant detractor in the past but the stock gained after the firm received a takeover offer from Lundin Mining.
Canadian gold miner Pretium Resources was a contributor after its Brucejack mine achieved steady state production during the second quarter.
Alacer Gold added value on the discovery of additional oxide at its Çöpler deposit in Turkey. The U.S. firm’s execution of its sulfide expansion project was well-received by investors. The company also benefited from the depreciation of the Turkish lira.
Canadian gold miner Dalradian Resources, which has received an all-cash acquisition offer from Orion Mine Finance, also was featured among contributors and we trimmed the position. Other contributors included Australian firm OceanaGold and Canada’s Fortuna Silver Mines.
4
Detractors included Canada’s Osisko Mining. Shares were hurt by broker downgrades after the firm’s initial mineral resource estimate for its Windfall gold deposit disappointed.
Shares in Trevali Mining, a Canadian zinc-focused base metals miner, came under pressure because of weaker zinc prices.
A holding in Randgold Resources also detracted. Shares in the Jersey, Channel Islands-listed company were weak at the beginning of the period after the Democratic Republic of Congo’s government announced a new mining code. This would raise taxes and lead to other changes that could be detrimental to Randgold’s operations in that country.
Gold miners were generally out of favor in the six-month period, and Canadian firms, B2Gold, Premier Gold Mines, and Kinross Gold held back returns.
Portfolio activity
We have continued to exploit the sell-off in diversified metals and mining stocks to rotate the portfolio’s exposure toward its diversified benchmark. We added to our position in Glencore, which is trading at a significant discount to the large-capitalization metals and mining peer group. We started positions in copper miner First Quantum Minerals and diversified miner Teck Resources, both of Canada.
We reduced our allocation to Saracen Mineral Holdings on valuation concerns. The Australian firm was among the leading contributors to performance over the first half of the year.
We reduced our exposure to Mexico-based assets because of concerns about the outlook for the nation’s presidency as well as uncertainty around business stability and taxation within the country. For example, we closed the positions in copper miner Grupo Mexico and Industrias Peñoles, a smelting and refining company.
We also trimmed our position in Independence Group, an Australian gold, nickel, cobalt, and zinc producer, over stronger nickel prices.
Finally, we reduced our exposure to Alacer Gold in order to take advantage of recent gains.
Portfolio positioning and outlook
The health of the global economy remains encouraging, with most major markets expanding. Many countries are normalizing monetary policy after implementing stimulus measures following the financial crisis. However, the continuing trade war between the U.S. and China, and the possible implications for global trade and economic activity, remain significant concerns for investors. Other risks involve China’s efforts to tackle shadow banking and reduce liquidity, higher interest rates in the U.S., and the prospect of tapering quantitative easing in Europe toward the end of this year.
5
In this environment, we have continued to add exposure to diversified miners when the opportunity arises. In our view, a backdrop of relative uncertainty may encourage diversified miners to focus expenditure on maintenance projects, with an emphasis on returning excess cash to investors via dividends and share buybacks.
Jamie J. Horvat
Portfolio Manager
M&G Investment Management Limited
6
Precious Metals and Mining Fund
Fund Profile
As of July 31, 2018
| | | |
| Portfolio Characteristics | | |
| | | S&P | |
| | | Global | |
| | | Custom | DJ |
| | | Metals and | U.S. Total |
| | | Mining | Market |
| | Fund | Index | FA Index |
| Number of Stocks | 72 | 215 | 3,766 |
| Median Market Cap | $3.7B | $12.3B | $67.3B |
| Price/Earnings Ratio | 15.7x | 16.7x | 20.5x |
| Price/Book Ratio | 1.5x | 1.5x | 3.1x |
| Return on Equity | 1.5% | 2.0% | 15.0% |
| Earnings Growth Rate | -0.3% | -1.4% | 8.5% |
| Dividend Yield | 1.3% | 2.3% | 1.7% |
| Foreign Holdings | 89.6% | 87.9% | 0.00% |
| Turnover Rate | | | |
| (Annualized) | 42% | — | — |
| Ticker Symbol | VGPMX | — | — |
| Expense Ratio1 | 0.37% | — | — |
| Short-Term Reserves | 0.0% | — | — |
| | |
| Subindustry Diversification (% of equity |
| exposure) | | |
| | | S&P |
| | | Global |
| | | Custom |
| | | Metals and |
| | | Mining |
| | Fund | Index |
| Agricultural Products | 2.0% | 0.0% |
| Aluminum | 1.2 | 3.4 |
| Copper | 7.5 | 5.4 |
| Diversified Metals & Mining | 15.4 | 40.4 |
| Gold | 61.5 | 42.0 |
| Precious Metals & Minerals | 5.9 | 4.0 |
| Silver | 6.5 | 4.8 |
Sector categories are based on the Global Industry Classification
Standard (“GICS”), except for the “Other” category (if applicable),
which includes securities that have not been provided a GICS
classification as of the effective reporting period.
| | |
| Volatility Measures | | |
| | S&P | |
| | Global | |
| | Custom | DJ |
| | Metals and | U.S. Total |
| | Mining | Market |
| | Index | FA Index |
| R-Squared | 0.90 | 0.02 |
| Beta | 1.03 | 0.40 |
| These measures show the degree and timing of the fund’s |
| fluctuations compared with the indexes over 36 months. |
| | |
| Ten Largest Holdings (% of total net assets) |
| Newmont Mining Corp. | Gold | 5.4% |
| Agnico Eagle Mines Ltd. Gold | 5.3 |
| B2Gold Corp. | Gold | 4.4 |
| Franco-Nevada Corp. | Gold | 4.3 |
| Randgold Resources | | |
| Ltd. | Gold | 4.0 |
| Glencore plc | Diversified Metals & | |
| | Mining | 3.7 |
| Rio Tinto | Diversified Metals & | |
| | Mining | 3.7 |
| Endeavour Mining Corp. | Gold | 3.6 |
| Barrick Gold Corp. | Gold | 3.6 |
| Kinross Gold Corp. | Gold | 3.2 |
| Top Ten | | 41.2% |
| The holdings listed exclude any temporary cash investments and equity index products. |
| | |
1 The expense ratio shown is from the prospectus dated July 30, 2018, and represents estimated costs for the current fiscal year. For the six
months ended July 31, 2018, the annualized expense ratio was 0.31%.
7
Precious Metals and Mining Fund
Performance Summary
All of the returns in this report represent past performance, which is not a guarantee of future results that may be achieved by the fund. (Current performance may be lower or higher than the performance data cited. For performance data current to the most recent month-end, visit our website at vanguard.com/performance.) Note, too, that both investment returns and principal value can fluctuate widely, so an investor’s shares, when sold, could be worth more or less than their original cost. The returns shown do not reflect taxes that a shareholder would pay on fund distributions or on the sale of fund shares.
Fiscal-Year Total Returns (%): January 31, 2008, Through July 31, 2018
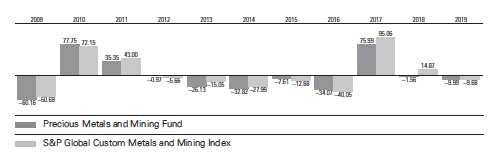
Note: For 2019, performance data reflect the six months ended July 31, 2018.
Average Annual Total Returns: Periods Ended June 30, 2018
This table presents returns through the latest calendar quarter—rather than through the end of the fiscal period.
Securities and Exchange Commission rules require that we provide this information.
| | | | |
| | Inception | One | Five | Ten |
| | Date | Year | Years | Years |
| Precious Metals and Mining Fund | 5/23/1984 | -3.85% | -0.42% | -9.14% |
See Financial Highlights for dividend and capital gains information.
8
Precious Metals and Mining Fund
Financial Statements (unaudited)
Statement of Net Assets
As of July 31, 2018
The fund reports a complete list of its holdings in regulatory filings four times in each fiscal year, at the quarter-ends. For the second and fourth fiscal quarters, the lists appear in the fund’s semiannual and annual reports to shareholders. For the first and third fiscal quarters, the fund files the lists with the Securities and Exchange Commission on Form N-Q. Shareholders can look up the fund’s Forms N-Q on the SEC’s website at sec.gov. Forms N-Q may also be reviewed and copied at the SEC’s Public Reference Room (see the back cover of this report for further information).
| | | |
| | | | Market |
| | | | Value• |
| | | Shares | ($000) |
| Common Stocks (99.7%) | | |
| Agricultural Products (2.0%) | |
| | Bunge Ltd. | 638,034 | 44,107 |
| |
| Aluminum (1.2%) | | |
| | Norsk Hydro ASA | 4,640,429 | 26,469 |
| |
| Copper (7.5%) | | |
| 1, ^ Nevsun Resources Ltd. | 17,750,259 | 65,906 |
| ^ | Lundin Mining Corp. | 6,248,416 | 34,584 |
| * | KAZ Minerals plc | 2,637,849 | 29,215 |
| | Southern Copper Corp. | 481,234 | 23,753 |
| | First Quantum Minerals | | |
| | Ltd. | 795,431 | 12,407 |
| | | | 165,865 |
| Diversified Metals & Mining (15.4%) | |
| | Glencore plc | 18,691,680 | 81,972 |
| | Rio Tinto plc | 1,471,571 | 80,791 |
| | BHP Billiton plc | 2,021,692 | 46,527 |
| | Teck Resources Ltd. | | |
| | Class B | 882,880 | 22,981 |
| | Compass Minerals | | |
| | International Inc. | 336,653 | 22,842 |
| * | Trevali Mining Corp. | 34,065,437 | 20,950 |
| | Independence Group | | |
| | NL | 5,313,302 | 17,782 |
| | Metals X Ltd. | 28,513,568 | 15,067 |
| *,1 | Base Resources Ltd. | 69,515,366 | 14,477 |
| *,1 | Neo Lithium Corp. | 6,935,301 | 6,558 |
| ^,* | Orla Mining Ltd. | 6,099,300 | 6,189 |
| *,1 | Osisko Metals Inc. | 6,575,000 | 2,881 |
| * | Aguia Resources Ltd. | 5,031,752 | 693 |
| | | | 339,710 |
| Gold (61.3%) | | |
| | Newmont Mining Corp. | 3,240,844 | 118,874 |
| | Franco-Nevada Corp. | 1,310,451 | 95,991 |
| * | B2Gold Corp. | 37,122,736 | 92,065 |
| | | |
| | Randgold Resources | | |
| | Ltd. ADR | 1,202,014 | 88,769 |
| | Agnico Eagle Mines | | |
| | Ltd. | 1,962,282 | 82,180 |
| * | Endeavour Mining | | |
| | Corp. | 4,371,279 | 79,976 |
| | Barrick Gold Corp. | 7,080,739 | 79,234 |
| * | Kinross Gold Corp. | 19,703,262 | 70,932 |
| * | IAMGOLD Corp. | 11,869,032 | 65,237 |
| *,1 | SEMAFO Inc. | 20,803,148 | 61,089 |
| | Royal Gold Inc. | 690,095 | 58,389 |
| | OceanaGold Corp. | 18,446,065 | 56,720 |
| ^,* | Pretium Resources Inc. | 5,908,608 | 48,451 |
| | Polymetal International | | |
| | plc | 5,290,203 | 46,141 |
| | Northern Star | | |
| | Resources Ltd. | 6,465,904 | 34,592 |
| *,1 | Guyana Goldfields Inc. | 11,101,120 | 34,135 |
| | Agnico Eagle Mines | | |
| | Ltd. | 814,545 | 34,126 |
| * | Alacer Gold Corp. | 12,576,829 | 27,264 |
| | Evolution Mining Ltd. | 11,847,679 | 24,569 |
| *,1 | Roxgold Inc. | 29,570,296 | 23,868 |
| *,1 | Premier Gold Mines | | |
| | Ltd. | 12,367,154 | 23,387 |
| ^,* | Dacian Gold Ltd. | 9,815,327 | 21,433 |
| * | Tahoe Resources Inc. | 4,327,033 | 19,515 |
| | Alamos Gold Inc. | 2,672,431 | 14,511 |
| * | Tahoe Resources Inc. | 2,689,463 | 12,074 |
| * | Gold Road Resources | | |
| | Ltd. | 23,798,449 | 11,935 |
| * | Saracen Mineral | | |
| | Holdings Ltd. | 7,438,203 | 10,364 |
| ^,* | Barkerville Gold | | |
| | Mines Ltd. | 16,770,771 | 5,608 |
| *,1 | Nighthawk Gold Corp. | 17,775,860 | 5,603 |
| * | B2Gold Corp. | 1,860,800 | 4,635 |
| *,1 | Troilus Gold Corp. | 2,789,980 | 2,681 |
9
Precious Metals and Mining Fund
| | | |
| | | | Market |
| | | | Value• |
| | | Shares | ($000) |
| * | Atlantic Gold Corp. | 849,110 | 1,116 |
| * | Osisko Gold | | |
| | Royalties Warrants | | |
| | Expire 02/26/2019 | 231,787 | 52 |
| | | | 1,355,516 |
| Other (0.0%) | | |
| *,2 | Americas Silver Corp. | | |
| | Warrants Expire | | |
| | 06/09/2021 | 7,108,333 | — |
| *,2 | Nighthawk Gold Corp. | | |
| | Warrants Expire | | |
| | 09/03/2018 | 5,729,647 | — |
| * | Osisko Mining Inc. | | |
| | Warrants Expire | | |
| | 08/25/2018 | 4,500,000 | — |
| * | Osisko Metals Inc. | | |
| | Warrants Expire | | |
| | 07/18/2019 | 3,287,500 | — |
| * | Troilus Gold Inc. | | |
| | Warrants Expire | | |
| | 5/21/2020 | 3,048,780 | — |
| * | Barkerville Gold Mines | | |
| | Warrants Expire | | |
| | 11/18/2018 | 263,158 | — |
| * | Orla Mining Ltd. | | |
| | Warrants Expire | | |
| | 02/15/2021 | 192,500 | — |
| | | | — |
| Precious Metals & Minerals (5.8%) | |
| *,1 | Dalradian Resources | | |
| | Inc. | 42,288,129 | 47,137 |
| ^,*,1 Osisko Mining Inc. | 17,921,750 | 30,998 |
| | Fresnillo plc | 1,531,044 | 20,853 |
| | Lucara Diamond Corp. | 9,637,111 | 16,595 |
| * | Petra Diamonds Ltd. | 15,895,872 | 9,612 |
| * | Mountain Province | | |
| | Diamonds Inc. | 1,387,206 | 3,359 |
| | | | 128,554 |
| Silver (6.5%) | | |
| | Wheaton Precious | | |
| | Metals Corp. | 2,302,277 | 48,245 |
| | Hochschild Mining plc | 15,070,615 | 34,469 |
| * | Fortuna Silver Mines | | |
| | Inc. | 5,302,797 | 28,943 |
| * | MAG Silver Corp. | 2,703,673 | 25,273 |
| *,1 | Americas Silver Corp. | 2,369,444 | 6,266 |
| | | | 143,196 |
| Total Common Stocks | | |
| (Cost $2,054,783) | | 2,203,417 |
| | |
| | | Market |
| | | Value• |
| | Shares | ($000) |
| Temporary Cash Investment (0.7%) | |
| Money Market Fund (0.7%) | |
| 3,4 Vanguard Market | | |
| Liquidity Fund, 2.145% | |
| (Cost $15,212) | 152,127 | 15,213 |
| Total Investments (100.4%) | |
| (Cost $2,069,995) | | 2,218,630 |
| Other Assets and Liabilities (-0.4%) | |
| Other Assets | | 45,085 |
| Liabilities 4 | | (53,872) |
| | | (8,787) |
| Net Assets (100%) | | |
| Applicable to 235,042,733 outstanding | |
| $.001 par value shares of beneficial | |
| interest (unlimited authorization) | 2,209,843 |
| Net Asset Value Per Share | $9.40 |
| |
| | Amount |
| | ($000) |
| Statement of Assets and Liabilities | |
| Assets | |
| Investments in Securities, at Value | |
| Unaffiliated Issuers | 1,878,431 |
| Affiliated Vanguard Fund | 15,213 |
| Affiliated Issuers | 324,986 |
| Total Investments in Securities | 2,218,630 |
| Investment in Vanguard | 124 |
| Receivables for Investment Securities | |
| Sold | 43,401 |
| Receivables for Accrued Income | 299 |
| Receivables for Capital Shares Issued | 1,261 |
| Total Assets | 2,263,715 |
| Liabilities | |
| Payables for Investment Securities | |
| Purchased | 91 |
| Collateral for Securities on Loan | 15,119 |
| Payables to Investment Advisor | 434 |
| Payables for Capital Shares Redeemed | 15,101 |
| Payables to Vanguard | 4,587 |
| Other Liabilities | 18,540 |
| Total Liabilities | 53,872 |
| Net Assets | 2,209,843 |
10
Precious Metals and Mining Fund
| |
| At July 31, 2018, net assets consisted of: |
| | Amount |
| | ($000) |
| Paid-in Capital | 4,232,418 |
| Overdistributed Net Investment Income | (90,299) |
| Accumulated Net Realized Losses | (2,070,219) |
| Unrealized Appreciation (Depreciation) | |
| Investment Securities | 137,938 |
| Foreign Currencies | 5 |
| Net Assets | 2,209,843 |
• See Note A in Notes to Financial Statements.
^ Includes partial security positions on loan to broker-dealers.
The total value of securities on loan is $12,696,000.
* Non-income-producing security.
1 Considered an affiliated company of the fund as the fund
owns more than 5% of the outstanding voting securities of
such company.
2 Restricted security represents 0.0% of net assets. See
Restricted Security table for additional information.
3 Affiliated money market fund available only to Vanguard funds
and certain trusts and accounts managed by Vanguard. Rate
shown is the 7-day yield.
4 Includes $15,119,000 of collateral received for securities
on loan.
ADR—American Depositary Receipt.
| | |
| Restricted Securities as of Period End | | |
| |
| | | Acquisition |
| | Acquisition | Cost |
| Security Name | Date | ($000) |
| Americas Silver Corp. Warrants Expire 06/09/2021 | June 2016 | 0 |
| Nighthawk Gold Corp. Warrants Expire 09/03/2018 | February 2017 | 0 |
See accompanying Notes, which are an integral part of the Financial Statements.
11
Precious Metals and Mining Fund
Statement of Operations
| |
| | Six Months Ended |
| | July31,2018 |
| | ($000) |
| Investment Income | |
| Income | |
| Dividends Received—Unaffiliated Issuers1 | 13,614 |
| Dividends Received—Affiliated Issuers | — |
| Interest Received—Unaffiliated Issuers | — |
| Interest Received—Affiliated Issuers | 630 |
| Securities Lending—Net | 344 |
| Total Income | 14,588 |
| Expenses | |
| Investment Advisory Fees—Note B | |
| Basic Fee | 1,660 |
| Performance Adjustment | (796) |
| The Vanguard Group—Note C | |
| Management and Administrative | 2,453 |
| Marketing and Distribution | 188 |
| Custodian Fees | 38 |
| Shareholders’ Reports | 41 |
| Trustees’ Fees and Expenses | 3 |
| Total Expenses | 3,587 |
| Expenses Paid Indirectly | (17) |
| Net Expenses | 3,570 |
| Net Investment Income | 11,018 |
| Realized Net Gain (Loss) | |
| Investment Securities Sold—Unaffiliated Issuers | (18,648) |
| Investment Securities Sold—Affiliated Issuers | (11,290) |
| Foreign Currencies | (103) |
| Realized Net Gain (Loss) | (30,041) |
| Change in Unrealized Appreciation (Depreciation) | |
| Investment Securities—Unaffiliated Issuers | (226,297) |
| Investment Securities—Affiliated Issuers | (9,611) |
| Foreign Currencies | (18) |
| Change in Unrealized Appreciation (Depreciation) | (235,926) |
| Net Increase (Decrease) in Net Assets Resulting from Operations | (254,949) |
| 1 Dividends are net of foreign withholding taxes of $416,000. |
See accompanying Notes, which are an integral part of the Financial Statements.
12
Precious Metals and Mining Fund
Statement of Changes in Net Assets
| | |
| | Six Months Ended | Year Ended |
| | July 31, | January 31, |
| | 2018 | 2018 |
| | ($000) | ($000) |
| Increase (Decrease) in Net Assets | | |
| Operations | | |
| Net Investment Income | 11,018 | 12,092 |
| Realized Net Gain (Loss) | (30,041) | (85,852) |
| Change in Unrealized Appreciation (Depreciation) | (235,926) | 25,021 |
| Net Increase (Decrease) in Net Assets Resulting from Operations | (254,949) | (48,739) |
| Distributions | | |
| Net Investment Income | (28,190) | (591) |
| Realized Capital Gain | — | — |
| Total Distributions | (28,190) | (591) |
| Capital Share Transactions | | |
| Issued | 264,728 | 813,768 |
| Issued in Lieu of Cash Distributions | 25,618 | 540 |
| Redeemed | (365,838) | (808,977) |
| Net Increase (Decrease) from Capital Share Transactions | (75,492) | 5,331 |
| Total Increase (Decrease) | (358,631) | (43,999) |
| Net Assets | | |
| Beginning of Period | 2,568,474 | 2,612,473 |
| End of Period1 | 2,209,843 | 2,568,474 |
| 1 Net Assets—End of Period includes undistributed (overdistributed) net investment income of ($90,299,000) and ($111,067,000). |
See accompanying Notes, which are an integral part of the Financial Statements.
13
Precious Metals and Mining Fund
Financial Highlights
| | | | | | |
| Six Months | | | | | |
| | Ended | | | | | |
| For a Share Outstanding | July 31, | Year Ended January 31, |
| Throughout Each Period | 2018 | 2018 | 2017 | 2016 | 2015 | 2014 |
| Net Asset Value, Beginning of Period | $10.57 | $10.74 | $6.22 | $9.59 | $10.38 | $15.46 |
| Investment Operations | | | | | | |
| Net Investment Income | . 0451 | .0491 | .0661,2 .1751,3 | .130 | .2431 |
| Net Realized and Unrealized Gain (Loss) | | | | | | |
| on Investments | (1.099) | (.217) | 4.615 | (3.397) | (.920) | (5.315) |
| Total from Investment Operations | (1.054) | (.168) | 4.681 | (3.222) | (.790) | (5.072) |
| Distributions | | | | | | |
| Dividends from Net Investment Income | (.116) | (. 002) | (.161) | (.148) | — | (. 007) |
| Distributions from Realized Capital Gains | — | — | — | — | — | — |
| Return of Capital | — | — | — | — | — | (.001) |
| Total Distributions | (.116) | (. 002) | (.161) | (.148) | — | (. 008) |
| Net Asset Value, End of Period | $9.40 | $10.57 | $10.74 | $6.22 | $9.59 | $10.38 |
| |
| Total Return4 | -9.99% | -1.56% | 75.99% | -34.07% | -7.61% | -32.82% |
| |
| Ratios/Supplemental Data | | | | | | |
| Net Assets, End of Period (Millions) | $2,210 | $2,568 | $2,612 | $1,465 | $2,087 | $2,302 |
| Ratio of Total Expenses to | | | | | | |
| Average Net Assets5 | 0.31% | 0.36% | 0.43% | 0.35% | 0.29% | 0.25% |
| Ratio of Net Investment Income to | | | | | | |
| Average Net Assets | 0.91% | 0.47% | 0.65%2 | 2.22% 3 | 1.33% | 2.10% |
| Portfolio Turnover Rate | 42% | 35% | 29% | 8% | 62% | 34% |
The expense ratio, net investment income ratio, and turnover rate for the current period have been annualized.
1 Calculated based on average shares outstanding.
2 Net investment income per share and the ratio of net investment income to average net assets include $.012 and 0.12%, respectively,
resulting from a special dividend from Lucara Diamond Corp. in September 2016.
3 Net investment income per share and the ratio of net investment income to average net assets include $.037 and 0.47%, respectively,
resulting from a spin-off from BHP Billiton plc in May 2015.
4 Total returns do not include account service fees that may have applied in the periods shown. Fund prospectuses provide information
about any applicable account service fees.
5 Includes performance-based investment advisory fee increases (decreases) of (0.07%), 0.00%, 0.06%, (0.02%), (0.08%), and (0.09%).
See accompanying Notes, which are an integral part of the Financial Statements.
14
Precious Metals and Mining Fund
Notes to Financial Statements
Vanguard Precious Metals and Mining Fund is registered under the Investment Company Act of 1940 as an open-end investment company, or mutual fund. The fund invests in securities of foreign issuers, which may subject it to investment risks not normally associated with investing in securities of U.S. corporations.
A. The following significant accounting policies conform to generally accepted accounting principles for U.S. investment companies. The fund consistently follows such policies in preparing its financial statements.
1. Security Valuation: Securities are valued as of the close of trading on the New York Stock Exchange (generally 4 p.m., Eastern time) on the valuation date. Equity securities are valued at the latest quoted sales prices or official closing prices taken from the primary market in which each security trades; such securities not traded on the valuation date are valued at the mean of the latest quoted bid and asked prices. Securities for which market quotations are not readily available, or whose values have been affected by events occurring before the fund’s pricing time but after the close of the securities’ primary markets, are valued at their fair values calculated according to procedures adopted by the board of trustees. These procedures include obtaining quotations from an independent pricing service, monitoring news to identify significant market-or security-specific events, and evaluating changes in the values of foreign market proxies (for example, ADRs, futures contracts, or exchange-traded funds), between the time the foreign markets close and the fund’s pricing time. When fair-value pricing is employed, the prices of securities used by a fund to calculate its net asset value may differ from quoted or published prices for the same securities. Investments in Vanguard Market Liquidity Fund are valued at that fund’s net asset value.
2. Foreign Currency: Securities and other assets and liabilities denominated in foreign currencies are translated into U.S. dollars using exchange rates obtained from an independent third party as of the fund’s pricing time on the valuation date. Realized gains (losses) and unrealized appreciation (depreciation) on investment securities include the effects of changes in exchange rates since the securities were purchased, combined with the effects of changes in security prices. Fluctuations in the value of other assets and liabilities resulting from changes in exchange rates are recorded as unrealized foreign currency gains (losses) until the assets or liabilities are settled in cash, at which time they are recorded as realized foreign currency gains (losses).
3. Federal Income Taxes: The fund intends to continue to qualify as a regulated investment company and distribute all of its taxable income. Management has analyzed the fund’s tax positions taken for all open federal income tax years (January 31, 2015–2018), and for the period ended July 31, 2018, and has concluded that no provision for federal income tax is required in the fund’s financial statements.
4. Distributions: Distributions to shareholders are recorded on the ex-dividend date.
5. Securities Lending: To earn additional income, the fund lends its securities to qualified institutional borrowers. Security loans are subject to termination by the fund at any time, and are required to be secured at all times by collateral in an amount at least equal to the market value of securities loaned. Daily market fluctuations could cause the value of loaned securities to be more or less than the value of the collateral received. When this occurs, the collateral is adjusted and settled before the opening of the market on the next business day. The fund further mitigates its counterparty risk by entering into securities lending transactions only with a diverse group of prequalified counterparties, monitoring their financial strength, and entering into master securities lending agreements with
15
Precious Metals and Mining Fund
its counterparties. The master securities lending agreements provide that, in the event of a counterparty’s default (including bankruptcy), the fund may terminate any loans with that borrower, determine the net amount owed, and sell or retain the collateral up to the net amount owed to the fund; however, such actions may be subject to legal proceedings. While collateral mitigates counterparty risk, in the event of a default, the fund may experience delays and costs in recovering the securities loaned. The fund invests cash collateral received in Vanguard Market Liquidity Fund, and records a liability in the Statement of Assets and Liabilities for the return of the collateral, during the period the securities are on loan. Securities lending income represents fees charged to borrowers plus income earned on invested cash collateral, less expenses associated with the loan. During the term of the loan, the fund is entitled to all distributions made on or in respect of the loaned securities.
6. Credit Facility: The fund and certain other funds managed by The Vanguard Group (“Vanguard”) participate in a $3.1 billion committed credit facility provided by a syndicate of lenders pursuant to a credit agreement that may be renewed annually; each fund is individually liable for its borrowings, if any, under the credit facility. Borrowings may be utilized for temporary and emergency purposes, and are subject to the fund’s regulatory and contractual borrowing restrictions. The participating funds are charged administrative fees and an annual commitment fee of 0.10% of the undrawn amount of the facility; these fees are allocated to the funds based on a method approved by the fund’s board of trustees and included in Management and Administrative expenses on the fund’s Statement of Operations. Any borrowings under this facility bear interest at a rate based upon the higher of the one-month London Interbank Offered Rate, federal funds effective rate, or overnight bank funding rate plus an agreed-upon spread.
The fund had no borrowings outstanding at July 31, 2018, or at any time during the period then ended.
7. Other: Dividend income is recorded on the ex-dividend date. Interest income includes income distributions received from Vanguard Market Liquidity Fund and is accrued daily. Security transactions are accounted for on the date securities are bought or sold. Costs used to determine realized gains (losses) on the sale of investment securities are those of the specific securities sold.
Withholding taxes on foreign dividends and capital gains have been provided for in accordance with the fund’s understanding of the applicable countries’ tax rules and rates. The fund has filed tax reclaims for previously withheld taxes on dividends earned in certain European Union countries. These filings are subject to various administrative and judicial proceedings within these countries. Such tax reclaims received during the year, if any, are included in dividend income. No other amounts for additional tax reclaims are reflected in the financial statements due to the uncertainty as to the ultimate resolution of proceedings, the likelihood of receipt of these reclaims, and the potential timing of payment.
B. Beginning July 2018, Wellington Management Company LLP provides investment advisory services to the fund for a fee calculated at an annual percentage rate of average net assets. In accordance with the advisory contract entered into with Wellington Management Company LLP, beginning February 1, 2020, the investment advisory fee will be subject to quarterly adjustments based on performance relative to the Custom Global Capital Cycles Index since January 31, 2019. Until July 2018, the fund was managed by M&G Investment Management Limited. The basic fee paid to M&G Investment Management Limited was subject to quarterly adjustments based on performance relative to the S&P 500 Global Custom Metals and Mining Index for the preceding
16
Precious Metals and Mining Fund
three years. For the six months ended July 31, 2018, the aggregate investment advisory fee represented an effective annual basic rate of 0.14% of the fund’s average net assets, before a decrease of $796,000 (0.07%) based on performance.
C. In accordance with the terms of a Funds’ Service Agreement (the “FSA”) between Vanguard and the fund, Vanguard furnishes to the fund corporate management, administrative, marketing, and distribution services at Vanguard’s cost of operations (as defined by the FSA). These costs of operations are allocated to the fund based on methods and guidelines approved by the board of trustees. Vanguard does not require reimbursement in the current period for certain costs of operations (such as deferred compensation/benefits and risk/insurance costs); the fund’s liability for these costs of operations is included in Payables to Vanguard on the Statement of Assets and Liabilities. All other costs of operations payable to Vanguard are generally settled twice a month.
Upon the request of Vanguard, the fund may invest up to 0.40% of its net assets as capital in Vanguard. At July 31, 2018, the fund had contributed to Vanguard capital in the amount of $124,000, representing 0.01% of the fund’s net assets and 0.05% of Vanguard’s capitalization. The fund’s trustees and officers are also directors and employees, respectively, of Vanguard.
D. The fund’s custodian bank has agreed to reduce its fees when the fund maintains cash on deposit in the non-interest-bearing custody account. For the six months ended July 31, 2018, custodian fee offset arrangements reduced the fund’s expenses by $17,000 (an annual rate of 0.00% of average net assets).
E. Various inputs may be used to determine the value of the fund’s investments. These inputs are summarized in three broad levels for financial statement purposes. The inputs or methodologies used to value securities are not necessarily an indication of the risk associated with investing in those securities.
Level 1—Quoted prices in active markets for identical securities.
Level 2—Other significant observable inputs (including quoted prices for similar securities, interest rates, prepayment speeds, credit risk, etc.).
Level 3—Significant unobservable inputs (including the fund’s own assumptions used to determine
the fair value of investments). Any investments valued with significant unobservable inputs are
noted on the Statement of Net Assets.
The following table summarizes the market value of the fund’s investments as of July 31, 2018, based on the inputs used to value them:
| | | |
| | Level 1 | Level 2 | Level 3 |
| Investments | ($000) | ($000) | ($000) |
| Common Stocks | 1,676,456 | 526,961 | — |
| Temporary Cash Investments | 15,213 | — | — |
| Total | 1,691,669 | 526,961 | — |
17
Precious Metals and Mining Fund
F. Distributions are determined on a tax basis and may differ from net investment income and realized capital gains for financial reporting purposes. Differences may be permanent or temporary. Permanent differences are reclassified among capital accounts in the financial statements to reflect their tax character. Temporary differences arise when certain items of income, expense, gain, or loss are recognized in different periods for financial statement and tax purposes. These differences will reverse at some time in the future. Differences in classification may also result from the treatment of short-term gains as ordinary income for tax purposes.
Certain of the fund’s investments are in securities considered to be passive foreign investment companies, for which any unrealized appreciation and/or realized gains are required to be included in distributable net investment income for tax purposes. During the six months ended July 31, 2018, the fund realized gains on the sale of passive foreign investment companies of $16,926,000, which have been included in current and prior periods’ taxable income; accordingly, such gains have been reclassified from accumulated net realized losses to overdistributed net investment income. Passive foreign investment companies had unrealized appreciation of $114,857,000 at July 31, 2018.
The fund’s tax-basis capital gains and losses are determined only at the end of each fiscal year. For tax purposes, at January 31, 2018, the fund had available capital losses totaling $2,012,967,000 that may be carried forward indefinitely to offset future capital gains. The fund will use these capital losses to offset net taxable capital gains, if any, realized during the year ending January 31, 2019; should the fund realize net capital losses for the year, the losses will be added to the loss carryforward balance above.
At July 31, 2018, the cost of investment securities for tax purposes was $2,195,549,000. Net unrealized appreciation of investment securities for tax purposes was $23,081,000, consisting of unrealized gains of $188,946,000 on securities that had risen in value since their purchase and $165,865,000 in unrealized losses on securities that had fallen in value since their purchase.
On December 22, 2017, the tax legislation commonly referred to as the Tax Cuts and Jobs Act (the “TCJA”) was signed into law. The TCJA contains provisions that make significant changes to the Internal Revenue Code, including imposing on U.S. investors, such as mutual funds, owning 10% or more of a foreign corporation a one-time “toll tax” on their share of certain accumulated earnings and profits of that foreign corporation. In applying this provision of the TCJA, the fund has determined that it must recognize income from one of its foreign investment holdings, requiring a special distribution of income to shareholders. On August 31, 2018, the fund distributed $21,117,000 to shareholders. The income recognized by the fund is treated as ordinary income available for distribution.
G. During the six months ended July 31, 2018, the fund purchased $490,179,000 of investment securities and sold $556,575,000 of investment securities, other than temporary cash investments.
18
Precious Metals and Mining Fund
H. Capital shares issued and redeemed were:
| | |
| | Six Months Ended | Year Ended |
| | July 31, 2018 | January 31, 2018 |
| | Shares | Shares |
| | (000) | (000) |
| Issued | 27,033 | 77,469 |
| Issued in Lieu of Cash Distributions | 2,674 | 52 |
| Redeemed | (37,616) | (77,802) |
| Net Increase (Decrease) in Shares Outstanding | (7,909) | (281) |
I. Certain of the fund’s investments are in companies that are considered to be affiliated companies of the fund because the fund owns more than 5% of the outstanding voting securities of the company or the issuer is another member of The Vanguard Group. Transactions during the period in securities of these companies were as follows:
| | | | | | | | |
| | | Current Period Transactions | |
| | Jan. 31, | | Proceeds | Net | Change in | | | July 31, |
| | 2018 | | from | Realized | Net | | Capital Gain | 2018 |
| | Market | Purchases | Securities | Gain | Unrealized | | Distributions | Market |
| | Value | at Cost | Sold | (Loss) | App. (Dep.) | Income | Received | Value |
| | ($000) | ($000) | ($000) | ($000) | ($000) | ($000) | ($000) | ($000) |
| Aguia Resources Ltd. | 1,875 | — | 430 | (1,167) | 415 | — | — | NA1 |
| Alacer Gold Corp. | 29,025 | — | 7,987 | (9,466) | 15,692 | — | — | NA1 |
| Americas Silver Corp. | 9,497 | — | — | — | (3,231) | — | — | 6,266 |
| Base Resources Ltd. | 15,645 | — | — | — | (1,168) | — | — | 14,477 |
| Beadell Resources | | | | | | | | |
| Ltd. | 10,085 | — | 4,677 | (16,446) | 11,038 | — | — | — |
| Dalradian Resources | | | | | | | | |
| Inc. | 45,996 | — | 3,662 | 1,100 | 3,703 | — | — | 47,137 |
| Fortuna Silver | | | | | | | | |
| Mines Inc. | 48,519 | — | 26,539 | 4,249 | 2,714 | — | — | NA1 |
| Guyana Goldfields | | | | | | | | |
| Inc. | 43,018 | — | 263 | (185) | (8,435) | — | — | 34,135 |
| Neo Lithium Corp. | 12,984 | — | 1,006 | 189 | (5,609) | — | — | 6,558 |
| Nevsun Resources | | | | | | | | |
| Ltd. | 70,572 | — | 48,473 | 11,533 | 32,274 | — | — | 65,906 |
| Nighthawk Gold | | | | | | | | |
| Corp. | 9,683 | — | — | — | (4,080) | — | — | 5,603 |
| Osisko Metals Inc. | 4,170 | — | — | — | (1,289) | — | — | 2,881 |
| Osisko Mining Inc. | 53,681 | 15,584 | 1,000 | (1,099) | (36,168) | — | — | 30,998 |
19
Precious Metals and Mining Fund
| | | | | | | | |
| | | Current Period Transactions | |
| | Jan. 31, | | Proceeds | Net | Change in | | | July 31, |
| | 2018 | | from | Realized | Net | | Capital Gain | 2018 |
| | Market | Purchases | Securities | Gain | Unrealized | | Distributions | Market |
| | Value | at Cost | Sold | (Loss) | App. (Dep.) | Income | Received | Value |
| | ($000) | ($000) | ($000) | ($000) | ($000) | ($000) | ($000) | ($000) |
| Premier Gold | | | | | | | | |
| Mines Ltd. | 30,632 | 3,073 | — | — | (10,318) | — | — | 23,387 |
| Roxgold Inc. | 26,685 | — | — | — | (2,817) | — | — | 23,868 |
| SEMAFO Inc. | 61,564 | — | — | — | (475) | — | — | 61,089 |
| Troilus Gold Corp. | 4,551 | — | 9 | (2) | (1,859) | — | — | 2,681 |
| Vanguard Market | | | | | | | | |
| Liquidity Fund | 75,587 | NA 2 | NA 2 | 4 | 2 | 630 | — | 15,213 |
| Total | 553,769 | | | (11,290) | (9,611) | 630 | — | 340,199 |
| 1 Not applicable—at July 31, 2018, the security was still held, but the issuer was no longer an affiliated company of the fund. |
| 2 Not applicable—purchases and sales are for temporary cash investment purposes. |
J. In addition to the distribution discussed in Note F, on September 26, 2018, the fund is changing its investment strategy and name. The Fund’s benchmark is changing from the S&P Global Custom Metals and Mining Index to the S&P Global BMI Metals & Mining 25% Weighted Index (USD) (Custom), and the name of the fund is changing to Vanguard Global Capital Cycles Fund.
Management has determined that no other material events or transactions occurred subsequent to July 31, 2018, that would require recognition or disclosure in these financial statements.
20
About Your Fund’s Expenses
As a shareholder of the fund, you incur ongoing costs, which include costs for portfolio management, administrative services, and shareholder reports (like this one), among others. Operating expenses, which are deducted from a fund’s gross income, directly reduce the investment return of the fund.
A fund’s expenses are expressed as a percentage of its average net assets. This figure is known as the expense ratio. The following examples are intended to help you understand the ongoing costs (in dollars) of investing in your fund and to compare these costs with those of other mutual funds. The examples are based on an investment of $1,000 made at the beginning of the period shown and held for the entire period.
The accompanying table illustrates your fund’s costs in two ways:
• Based on actual fund return. This section helps you to estimate the actual expenses that you paid over the period. The ”Ending Account Value“ shown is derived from the fund‘s actual return, and the third column shows the dollar amount that would have been paid by an investor who started with $1,000 in the fund. You may use the information here, together with the amount you invested, to estimate the expenses that you paid over the period.
To do so, simply divide your account value by $1,000 (for example, an $8,600 account value divided by $1,000 = 8.6), then multiply the result by the number given for your fund under the heading ”Expenses Paid During Period.“
• Based on hypothetical 5% yearly return. This section is intended to help you compare your fund‘s costs with those of other mutual funds. It assumes that the fund had a yearly return of 5% before expenses, but that the expense ratio is unchanged. In this case—because the return used is not the fund’s actual return—the results do not apply to your investment. The example is useful in making comparisons because the Securities and Exchange Commission requires all mutual funds to calculate expenses based on a 5% return. You can assess your fund’s costs by comparing this hypothetical example with the hypothetical examples that appear in shareholder reports of other funds.
Note that the expenses shown in the table are meant to highlight and help you compare ongoing costs only and do not reflect transaction costs incurred by the fund for buying and selling securities. Further, the expenses do not include any purchase, redemption, or account service fees described in the fund prospectus. If such fees were applied to your account, your costs would be higher. Your fund does not carry a “sales load.”
The calculations assume no shares were bought or sold during the period. Your actual costs may have been higher or lower, depending on the amount of your investment and the timing of any purchases or redemptions.
You can find more information about the fund’s expenses, including annual expense ratios, in the Financial Statements section of this report. For additional information on operating expenses and other shareholder costs, please refer to your fund’s current prospectus.
21
| | | |
| Six Months Ended July 31, 2018 | | | |
| | Beginning | Ending | Expenses |
| | Account Value | Account Value | Paid During |
| Precious Metals and Mining Fund | 1/31/2018 | 7/31/2018 | Period |
| Based on Actual Fund Return | $1,000.00 | $900.10 | $1.46 |
| Based on Hypothetical 5% Yearly Return | 1,000.00 | 1,023.26 | 1.56 |
The calculations are based on expenses incurred in the most recent six-month period. The fund’s annualized six-month expense ratio for
that period is 0.31%. The dollar amounts shown as “Expenses Paid” are equal to the annualized expense ratio multiplied by the average
account value over the period, multiplied by the number of days in the most recent six-month period, then divided by the number of days in
the most recent 12-month period (181/365).
22
Trustees Approve Advisory Arrangement
Effective July 2018, the board of trustees of Vanguard Precious Metals and Mining Fund approved a restructuring of the fund’s investment advisory arrangement whereby M&G Investment Management Limited no longer serves as advisor to the fund and Wellington Management Company LLP (Wellington Management or “advisor”) is added as advisor to the fund. The board determined that the investment advisory arrangement with Wellington Management was in the best interests of the fund and its shareholders.
The board based its decision upon an evaluation of the advisor’s investment staff, portfolio management process, and performance. This evaluation included information provided to the board by Vanguard’s Portfolio Review Department, which is responsible for fund and advisor oversight and product management. The trustees considered the factors discussed below, among others. However, no single factor determined whether the board approved the arrangement. Rather, it was the totality of the circumstances that drove the board’s decision.
Nature, extent, and quality of services
The board reviewed the quality of the investment management services to be provided to the fund by Wellington Management and took into account the organizational depth and stability of the advisor. The board considered that Wellington Management, founded in 1928, is among the nation’s oldest and most respected institutional investment managers. The board noted that Wellington Management will provide the fund with deep global resources, structured processes, and stable management and investment teams. The portfolio manager has the support of a 16-person natural resources/utilities team, which is among the deepest and most experienced in the industry.
The board concluded that the advisor’s experience, stability, depth, and performance, among other factors, warranted approval of the advisory arrangement.
Investment performance
The board determined that Wellington Management, in its management of other Vanguard funds, has a track record of consistent performance and disciplined investment processes. The board also noted that Wellington Management’s record in its capital cycles and metals and mining-focused value product dates back to 2012. The firm’s performance has been very strong and the firm has several team members who are specialists in this type of investment strategy. Information about the fund’s most recent performance can be found in the Performance Summary section of this report.
Cost
The board concluded that the fund’s expense ratio under the new investment advisory arrangement with Wellington Management will be well below the average expense ratio charged by funds in its peer group. Information about the fund’s current expense ratio appears in the About Your Fund’s Expenses section of this report as well as in the Financial Statements section, which also includes information about the current advisory fee rate.
The board did not consider the profitability of Wellington Management in determining whether to approve the advisory fee, because Wellington Management is independent of Vanguard and the advisory fee is the result of arm’s-length negotiations.
23
The benefit of economies of scale
The board concluded that the fund’s shareholders will benefit from economies of scale because of breakpoints in the advisory fee schedule with Wellington Management. The breakpoints reduce the effective rate of the fee as the fund’s assets increase.
The board will consider whether to renew the advisory arrangement after a one-year period.
24
Glossary
Beta. A measure of the magnitude of a fund’s past share-price fluctuations in relation to the ups and downs of a given market index. The index is assigned a beta of 1.00. Compared with a given index, a fund with a beta of 1.20 typically would have seen its share price rise or fall by 12% when the index rose or fell by 10%. For this report, beta is based on returns over the past 36 months for both the fund and the index. Note that a fund’s beta should be reviewed in conjunction with its R-squared (see definition). The lower the R-squared, the less correlation there is between the fund and the index, and the less reliable beta is as an indicator of volatility.
Dividend Yield. Dividend income earned by stocks, expressed as a percentage of the aggregate market value (or of net asset value, for a fund). The yield is determined by dividing the amount of the annual dividends by the aggregate value (or net asset value) at the end of the period. For a fund, the dividend yield is based solely on stock holdings and does not include any income produced by other investments.
Earnings Growth Rate. The average annual rate of growth in earnings over the past five years for the stocks now in a fund.
Equity Exposure. A measure that reflects a fund’s investments in stocks and stock futures. Any holdings in short-term reserves are excluded.
Expense Ratio. A fund’s total annual operating expenses expressed as a percentage of the fund’s average net assets. The expense ratio includes management and administrative expenses, but does not include the transaction costs of buying and selling portfolio securities.
Foreign Holdings. The percentage of a fund represented by securities or depositary receipts of companies based outside the United States.
Inception Date. The date on which the assets of a fund (or one of its share classes) are first invested in accordance with the fund’s investment objective. For funds with a subscription period, the inception date is the day after that period ends. Investment performance is measured from the inception date.
Median Market Cap. An indicator of the size of companies in which a fund invests; the midpoint of market capitalization (market price x shares outstanding) of a fund’s stocks, weighted by the proportion of the fund’s assets invested in each stock. Stocks representing half of the fund’s assets have market capitalizations above the median, and the rest are below it.
Price/Book Ratio. The share price of a stock divided by its net worth, or book value, per share. For a fund, the weighted average price/book ratio of the stocks it holds.
Price/Earnings Ratio. The ratio of a stock’s current price to its per-share earnings over the past year. For a fund, the weighted average P/E of the stocks it holds. P/E is an indicator of market expectations about corporate prospects; the higher the P/E, the greater the expectations for a company’s future growth.
R-Squared. A measure of how much of a fund’s past returns can be explained by the returns from the market in general, as measured by a given index. If a fund’s total returns were precisely synchronized with an index’s returns, its R-squared would be 1.00. If the fund’s returns bore no relationship to the index’s returns, its R-squared would be 0. For this report, R-squared is based on returns over the past 36 months for both the fund and the index.
25
Return on Equity. The annual average rate of return generated by a company during the past five years for each dollar of shareholder’s equity (net income divided by shareholder’s equity). For a fund, the weighted average return on equity for the companies whose stocks it holds.
Short-Term Reserves. The percentage of a fund invested in highly liquid, short-term securities that can be readily converted to cash.
Turnover Rate. An indication of the fund’s trading activity. Funds with high turnover rates incur higher transaction costs and may be more likely to distribute capital gains (which may be taxable to investors). The turnover rate excludes in-kind transactions, which have minimal impact on costs.
26
The Global Industry Classification Standard (“GICS”) was developed by and is the exclusive property and a service mark
of MSCI Inc. (“MSCI”) and Standard and Poor’s, a division of McGraw-Hill Companies, Inc. (“S&P”), and is licensed for use
by Vanguard. Neither MSCI, S&P nor any third party involved in making or compiling the GICS or any GICS classification
makes any express or implied warranties or representations with respect to such standard or classification (or the results
to be obtained by the use thereof), and all such parties hereby expressly disclaim all warranties of originality, accuracy,
completeness, merchantability or fitness for a particular purpose with respect to any such standard or classification.
Without limiting any of the foregoing, in no event shall MSCI, S&P, any of its affiliates or any third party involved in
making or compiling the GICS or any GICS classification have any liability for any direct, indirect, special, punitive,
consequential or any other damages (including lost profits) even if notified of the possibility of such damages.
27
This page intentionally left blank.
This page intentionally left blank.
This page intentionally left blank.
The People Who Govern Your Fund
The trustees of your mutual fund are there to see that the fund is operated and managed in your best interests since, as a shareholder, you are a part owner of the fund. Your fund’s trustees also serve on the board of directors of The Vanguard Group, Inc., which is owned by the Vanguard funds and provides services to them on an at-cost basis.
A majority of Vanguard’s board members are independent, meaning that they have no affiliation with Vanguard or the funds they oversee, apart from the sizable personal investments they have made as private individuals. The independent board members have distinguished backgrounds in business, academia, and public service. Each of the trustees and executive officers oversees 208 Vanguard funds.
Information for each trustee and executive officer of the fund appears below. The mailing address of the trustees and officers is P.O. Box 876, Valley Forge, PA 19482. More information about the trustees is in the Statement of Additional Information, which can be obtained, without charge, by contacting Vanguard at 800-662-7447, or online at vanguard.com.
Interested Trustees1
F. William McNabb III
Born in 1957. Trustee since July 2009. Principal occupation(s) during the past five years and other experience: chairman of the board (January 2010–present) of Vanguard and of each of the investment companies served by Vanguard, trustee (2009–present) of each of the investment companies served by Vanguard, and director (2008–present) of Vanguard. Chief executive officer and president (2008–2017) of Vanguard and each of the investment companies served by Vanguard, managing director (1995–2008) of Vanguard, and director (1997–2018) of Vanguard Marketing Corporation. Director (2018–present) of UnitedHealth Group.
Mortimer J. Buckley
Born in 1969. Trustee since January 2018. Principal occupation(s) during the past five years and other experience: chief executive officer (January 2018–present) of Vanguard; chief executive officer, president, and trustee (January 2018–present) of each of the investment companies served by Vanguard; president and director (2017–present) of Vanguard; and president (February 2018–present) of Vanguard Marketing Corporation. Chief investment officer (2013–2017), managing director (2002–2017), head of the Retail Investor Group (2006–2012), and chief information officer (2001–2006) of Vanguard. Chairman of the board (2011–2017) of the Children’s Hospital of Philadelphia.
Independent Trustees
Emerson U. Fullwood
Born in 1948. Trustee since January 2008. Principal occupation(s) during the past five years and other experience: executive chief staff and marketing officer for North America and corporate vice president (retired 2008) of Xerox Corporation (document management products and services). Former president of the Worldwide Channels Group, Latin America, and Worldwide Customer Service and executive chief staff officer of Developing Markets of Xerox. Executive in residence and 2009–2010 Distinguished Minett Professor at the Rochester Institute of Technology. Lead director of SPX FLOW, Inc. (multi-industry manufacturing). Director of the University of Rochester Medical Center, the Monroe Community College Foundation, the United Way of Rochester, North Carolina A&T University, and Roberts Wesleyan College. Trustee of the University of Rochester.
Amy Gutmann
Born in 1949. Trustee since June 2006. Principal occupation(s) during the past five years and other experience: president (2004–present) of the University of Pennsylvania. Christopher H. Browne Distinguished Professor of Political Science, School of Arts and Sciences, and professor of communication, Annenberg School for Communication, with secondary faculty appointments in the Department of Philosophy, School of Arts and Sciences, and at the Graduate School of Education, University of Pennsylvania. Trustee of the National Constitution Center.
1 Mr. McNabb and Mr. Buckley are considered “interested persons,” as defined in the Investment Company Act of 1940, because they are officers of the Vanguard funds.
JoAnn Heffernan Heisen
Born in 1950. Trustee since July 1998. Principal occupation(s) during the past five years and other experience: corporate vice president of Johnson & Johnson (pharmaceuticals/medical devices/consumer products) and member of its executive committee (1997–2008). Chief global diversity officer (retired 2008), vice president and chief information officer (1997–2006), controller (1995–1997), treasurer (1991–1995), and assistant treasurer (1989–1991) of Johnson & Johnson. Director of Skytop Lodge Corporation (hotels) and the Robert Wood Johnson Foundation. Member of the advisory board of the Institute for Women’s Leadership at Rutgers University.
F. Joseph Loughrey
Born in 1949. Trustee since October 2009. Principal occupation(s) during the past five years and other experience: president and chief operating officer (retired 2009) and vice chairman of the board (2008–2009) of Cummins Inc. (industrial machinery). Chairman of the board of Hillenbrand, Inc. (specialized consumer services), Oxfam America, and the Lumina Foundation for Education. Director of the V Foundation for Cancer Research. Member of the advisory council for the College of Arts and Letters and chair of the advisory board to the Kellogg Institute for International Studies, both at the University of Notre Dame.
Mark Loughridge
Born in 1953. Trustee since March 2012. Principal occupation(s) during the past five years and other experience: senior vice president and chief financial officer (retired 2013) of IBM (information technology services). Fiduciary member of IBM’s Retirement Plan Committee (2004–2013), senior vice president and general manager (2002–2004) of IBM Global Financing, vice president and controller (1998–2002) of IBM, and a variety of other prior management roles at IBM. Member of the Council on Chicago Booth.
Scott C. Malpass
Born in 1962. Trustee since March 2012. Principal occupation(s) during the past five years and other experience: chief investment officer (1989–present) and vice president (1996–present) of the University of Notre Dame. Assistant professor of finance at the Mendoza College of Business, University of Notre Dame, and member of the Notre Dame 403(b) Investment Committee. Chairman of the board of TIFF Advisory Services, Inc. Member of the board of Catholic Investment Services, Inc. (investment advisors), the board of advisors for Spruceview Capital Partners, and the board of superintendence of the Institute for the Works of Religion.
Deanna Mulligan
Born in 1963. Trustee since January 2018. Principal occupation(s) during the past five years and other experience: president (2010–present) and chief executive officer (2011–present) of The Guardian Life Insurance Company of America. Chief operating officer (2010–2011) and executive vice president (2008–2010) of Individual Life and Disability of The Guardian Life Insurance Company of America. Member of the board of The Guardian Life Insurance Company of America, the American Council of Life Insurers, the Partnership for New York City (business leadership), and the Committee Encouraging Corporate Philanthropy. Trustee of the Economic Club of New York and the Bruce Museum (arts and science). Member of the Advisory Council for the Stanford Graduate School of Business.
André F. Perold
Born in 1952. Trustee since December 2004. Principal occupation(s) during the past five years and other experience: George Gund Professor of Finance and Banking, Emeritus at the Harvard Business School (retired 2011). Chief investment officer and co-managing partner of HighVista Strategies LLC (private investment firm). Overseer of the Museum of Fine Arts Boston.
Sarah Bloom Raskin
Born in 1961. Trustee since January 2018. Principal occupation(s) during the past five years and other experience: deputy secretary (2014–2017) of the United States Department of the Treasury. Governor (2010–2014) of the Federal Reserve Board. Commissioner (2007–2010) of financial regulation for the State of Maryland. Member of the board of directors (2012–2014) of Neighborhood Reinvestment Corporation. Director of i(x) Investments, LLC.
Peter F. Volanakis
Born in 1955. Trustee since July 2009. Principal occupation(s) during the past five years and other experience: president and chief operating officer (retired 2010) of Corning Incorporated (communications equipment) and director of Corning Incorporated (2000–2010) and Dow Corning (2001–2010). Director (2012) of SPX Corporation (multi-industry manufacturing). Overseer of the Amos Tuck School of Business Administration, Dartmouth College (2001–2013). Chairman of the board of trustees of Colby-Sawyer College. Member of the Board of Hypertherm Inc. (industrial cutting systems, software, and consumables).
Executive Officers
Glenn Booraem
Born in 1967. Principal occupation(s) during the past five years and other experience: principal of Vanguard. Investment stewardship officer (2017–present), treasurer (2015–2017), controller (2010–2015), and assistant controller (2001–2010) of each of the investment companies served by Vanguard.
Christine M. Buchanan
Born in 1970. Principal occupation(s) during the past five years and other experience: principal of Vanguard and global head of Fund Administration at Vanguard. Treasurer (2017–present) of each of the investment companies served by Vanguard. Partner (2005–2017) at KPMG LLP (audit, tax, and advisory services).
Brian Dvorak
Born in 1973. Principal occupation(s) during the past five years and other experience: principal of Vanguard. Chief compliance officer (2017–present) of Vanguard and each of the investment companies served by Vanguard. Assistant vice president (2017–present) of Vanguard Marketing Corporation. Vice president and director of Enterprise Risk Management (2011–2013) at Oppenheimer Funds, Inc.
Thomas J. Higgins
Born in 1957. Principal occupation(s) during the past five years and other experience: principal of Vanguard. Chief financial officer (2008–present) and treasurer (1998–2008) of each of the investment companies served by Vanguard.
Peter Mahoney
Born in 1974. Principal occupation(s) during the past five years and other experience: principal of Vanguard. Controller (2015–present) of each of the investment companies served by Vanguard. Head of International Fund Services (2008–2014) at Vanguard.
Anne E. Robinson
Born in 1970. Principal occupation(s) during the past five years and other experience: general counsel (2016–present) of Vanguard. Secretary (2016–present) of Vanguard and of each of the investment companies served by Vanguard. Managing director (2016–present) of Vanguard. Director and senior vice president (2016–2018) of Vanguard Marketing Corporation. Managing director and general counsel of Global Cards and Consumer Services (2014–2016) at Citigroup. Counsel (2003–2014) at American Express.
Michael Rollings
Born in 1963. Principal occupation(s) during the past five years and other experience: finance director (2017–present) and treasurer (2017) of each of the investment companies served by Vanguard. Managing director (2016–present) of Vanguard. Chief financial officer (2016–present) of Vanguard. Director (2016–present) of Vanguard Marketing Corporation. Executive vice president and chief financial officer (2006–2016) of MassMutual Financial Group.
| |
| Vanguard Senior Management Team |
| |
| Mortimer J. Buckley | James M. Norris |
| Gregory Davis | Thomas M. Rampulla |
| John James | Karin A. Risi |
| Martha G. King | Anne E. Robinson |
| John T. Marcante | Michael Rollings |
| Chris D. McIsaac | |
| |
| |
| Chairman Emeritus and Senior Advisor |
| |
| John J. Brennan | |
| Chairman, 1996–2009 | |
| Chief Executive Officer and President, 1996–2008 |
| |
| |
| Founder | |
| |
| John C. Bogle | |
| Chairman and Chief Executive Officer, 1974–1996 |
|  |
| | P.O. Box 2600 |
| | Valley Forge, PA 19482-2600 |
| |
| |
| |
| Connect with Vanguard® > vanguard.com |
| |
| |
| |
| Fund Information > 800-662-7447 | Source for Bloomberg Barclays indexes: Bloomberg |
| Direct Investor Account Services > 800-662-2739 | Index Services Limited. Copyright 2018, Bloomberg. All |
| | rights reserved. |
| Institutional Investor Services > 800-523-1036 | |
| | Standard & Poor’s® and S&P® are trademarks of The |
| Text Telephone for People | McGraw-Hill Companies, Inc., and have been licensed |
| Who Are Deaf or Hard of Hearing > 800-749-7273 | for use by The Vanguard Group, Inc. Vanguard mutual |
| This material may be used in conjunction | funds are not sponsored, endorsed, sold, or promoted |
| | by Standard & Poor’s, and Standard & Poor’s makes no |
| with the offering of shares of any Vanguard | representation regarding the advisability of investing in |
| fund only if preceded or accompanied by | the funds. |
| the fund’s current prospectus. | |
| |
| All comparative mutual fund data are from Lipper, a | |
| Thomson Reuters Company, or Morningstar, Inc., unless | |
| otherwise noted. | |
| |
| You can obtain a free copy of Vanguard’s proxy voting | |
| guidelines by visiting vanguard.com/proxyreporting or by | |
| calling Vanguard at 800-662-2739. The guidelines are | |
| also available from the SEC’s website, sec.gov. In | |
| addition, you may obtain a free report on how your fund | |
| voted the proxies for securities it owned during the 12 | |
| months ended June 30. To get the report, visit either | |
| vanguard.com/proxyreporting or sec.gov. | |
| |
| You can review and copy information about your fund at | |
| the SEC’s Public Reference Room in Washington, D.C. To | |
| nd out more about this public service, call the SEC at | |
| 202-551-8090. Information about your fund is also | |
| available on the SEC’s website, and you can receive | |
| copies of this information, for a fee, by sending a | |
| request in either of two ways: via email addressed to | |
| publicinfo@sec.gov or via regular mail addressed to the | |
| Public Reference Section, Securities and Exchange | |
| Commission, Washington, DC 20549-1520. | |
| | © 2018 The Vanguard Group, Inc. |
| | All rights reserved. |
| | Vanguard Marketing Corporation, Distributor. |
| |
| | Q532 092018 |

Semiannual Report | July 31, 2018
Vanguard Dividend Growth Fund
Vanguard’s Principles for Investing Success
We want to give you the best chance of investment success. These principles, grounded in Vanguard’s research and experience, can put you on the right path.
Goals. Create clear, appropriate investment goals.
Balance. Develop a suitable asset allocation using broadly diversified funds.
Cost. Minimize cost.
Discipline. Maintain perspective and long-term discipline.
A single theme unites these principles: Focus on the things you can control.
We believe there is no wiser course for any investor.
| |
| Contents | |
| Your Fund’s Performance at a Glance. | 1 |
| CEO’s Perspective. | 2 |
| Advisor’s Report. | 4 |
| Fund Profile. | 7 |
| Performance Summary. | 8 |
| Financial Statements. | 9 |
| About Your Fund’s Expenses. | 18 |
| Glossary. | 20 |
Please note: The opinions expressed in this report are just that—informed opinions. They should not be considered promises or advice. Also, please keep in mind that the information and opinions cover the period through the date on the front of this report. Of course, the risks of investing in your fund are spelled out in the prospectus.
See the Glossary for definitions of investment terms used in this report.
About the cover: Nautical images have been part of Vanguard’s rich heritage since its start in 1975. For an incoming ship, a lighthouse offers a beacon and safe path to shore. You can similarly depend on Vanguard to put you first––and light the way––as you strive to meet your financial goals. Our client focus and low costs, stemming from our unique ownership structure, assure that your interests are paramount.
Your Fund’s Performance at a Glance
• Vanguard Dividend Growth Fund returned 1.17% for the six months ended July 31, 2018. It outperformed both its benchmark, the NASDAQ US Dividend Achievers Select Index, and the average return of its large-capitalization core fund peers.
• Dividend-paying stocks lagged the broad U.S. market during the period as concerns about monetary policy and the impact of trade tariffs and rising inflation countered strong job reports and decent corporate earnings.
• The fund’s benchmark consists of the stocks of companies that have a record of increasing dividends over time.
• Five of the fund’s 11 industry sectors had positive results. The consumer discretionary and industrial sectors were the top contributors.
• The advisor’s holdings in financials detracted most from returns. Energy, health care, and utilities holdings also lost ground, though selection in energy was beneficial.
| |
| Total Returns: Six Months Ended July 31, 2018 | |
| | Total |
| | Returns |
| Vanguard Dividend Growth Fund | 1.17% |
| NASDAQ US Dividend Achievers Select Index | 0.29 |
| Large-Cap Core Funds Average | 0.04 |
| Large-Cap Core Funds Average: Derived from data provided by Lipper, a Thomson Reuters Company. |
| | |
| Expense Ratios | | |
| Your Fund Compared With Its Peer Group | | |
| | | Peer Group |
| | Fund | Average |
| Dividend Growth Fund | 0.26% | 1.03% |
The fund expense ratio shown is from the prospectus dated May 25, 2018, and represents estimated costs for the current fiscal year. For
the six months ended July 31, 2018, the fund’s annualized expense ratio was 0.23%. The peer-group expense ratio is derived from data
provided by Lipper, a Thomson Reuters Company, and captures information through year-end 2017.
Peer group: Large-Cap Core Funds.
1
CEO’s Perspective

Tim Buckley
President and Chief Executive Officer
Dear Shareholder,
I feel extremely fortunate to have the chance to lead a company filled with people who come to work every day passionate about Vanguard’s core purpose: to take a stand for all investors, to treat them fairly, and to give them the best chance for investment success.
When I joined Vanguard in 1991, I found a mission-driven team focused on improving lives—helping people retire more comfortably, put their children through college, and achieve financial security. I also found a company with purpose in an industry ripe for improvement.
It was clear, even early in my career, that the cards were stacked against most investors. Hidden fees, performance-chasing, and poor advice were relentlessly eroding investors’ dreams.
We knew Vanguard could be different and, as a result, could make a real difference. We have lowered the costs of investing for our shareholders significantly. And we’re proud of the performance of our funds.
Vanguard is built for Vanguard investors—we focus solely on you, our fund shareholders. Everything we do is designed to give our clients the best chance for investment success. In my role as CEO, I’ll keep this priority
2
front and center. We’re proud of what we’ve achieved, but we’re even more excited about what’s to come.
Steady, time-tested guidance
Our guidance for investors, as always, is to stay the course, tune out the hyperbolic headlines, and focus on your goals and what you can control, such as costs and how much you save. This time-tested advice has served our clients well over the decades.
Regardless of how the markets perform in the short term, I’m incredibly optimistic about the future for our investors. We have a dedicated team serving you, and we will never stop striving to make Vanguard the best place for you to invest through our high-quality funds and services, advice and guidance to help you meet your financial goals, and an experience that makes you feel good about entrusting us with your hard-earned savings.
Thank you for your continued loyalty.
Sincerely,

Mortimer J. Buckley
President and Chief Executive Officer
August 16, 2018
| | | |
| Market Barometer | | | |
| | Total Returns |
| | Periods Ended July 31, 2018 |
| | Six | One | Five Years |
| | Months | Year | (Annualized) |
| Stocks | | | |
| Russell 1000 Index (Large-caps) | 0.86% | 16.19% | 12.96% |
| Russell 2000 Index (Small-caps) | 6.75 | 18.73 | 11.33 |
| Russell 3000 Index (Broad U.S. market) | 1.30 | 16.39 | 12.83 |
| FTSE All-World ex US Index (International) | -6.57 | 6.19 | 5.97 |
| |
| Bonds | | | |
| Bloomberg Barclays U.S. Aggregate Bond Index | | | |
| (Broad taxable market) | -0.45% | -0.80% | 2.25% |
| Bloomberg Barclays Municipal Bond Index | | | |
| (Broad tax-exempt market) | 1.18 | 0.99 | 3.76 |
| FTSE Three-Month U. S. Treasury Bill Index | 0.83 | 1.41 | 0.41 |
| |
| CPI | | | |
| Consumer Price Index | 1.67% | 2.95% | 1.53% |
3
Advisor’s Report
Vanguard Dividend Growth Fund returned 1.17% for the six months ended July 31, 2018, outperforming the 0.29% return of its benchmark, the NASDAQ US Dividend Achievers Select Index.
The investment environment
U.S. equities, as measured by the S&P 500 Index, rose a modest 0.70% over the six months. Following the sharp correction in January, stocks continued to decline and volatility soared to one of the highest levels we’ve seen in years. Investors grew increasingly concerned about the overly optimistic sentiment from rising inflation, pro-growth deregulation, tax cuts, and increased government spending. Fears of a global trade war sparked after President Trump imposed tariffs on billions of dollars’ worth of Chinese goods. Broadly, non-U.S equities struggled, returning –4.74% for the same period, as measured by the MSCI EAFE Index.
We saw a reversal in the U.S. markets by April, when a record-high percentage of companies exceeded first-quarter estimates and domestic economic data remained on solid footing. But volatility returned at the end of the second quarter and continued into July. With trade and geopolitical tensions, turmoil within the U.S. administration, and the potential for increased regulation in the technology sector, we should expect further uncertainty.
As a result, we will continue to watch the larger global growth story as the market ultimately takes its cue from global economic conditions. In 2017, the world’s economies appeared to be picking up steam together. If sustained, this would certainly provide a good foundation for continued strength. But recent U.S. and non-U.S. data indicate that there may be cracks.
While we can do little to control the environment, we can control how we invest. As always, we prefer the steady application of a process oriented around dividend growth. And in times like these, we believe deep fundamental research, collaboration, and patience are more important than ever and will likely produce favorable results over the long run.
The fund’s successes
Stock selection drove relative outperfor-. mance during the six months. In particular, our holdings within consumer discretionary, energy, industrials, consumer staples, information technology, and materials all contributed positively to returns.
Our overweighted position in real estate and our underweighted allocation to industrials also helped.
Among the top absolute contributors were TJX (consumer discretionary), Nike (consumer discretionary), Microsoft (information technology), Canadian National Railway (industrials), and Union Pacific (industrials).
TJX, the discount apparel and home-goods retailer, outperformed early in 2018 after management reported solid quarterly earnings and strong same-store sales and provided better-than-expected guidance.
4
We believe TJX will also benefit from the new federal tax law and is committed to returning some of that windfall to shareholders. Further, TJX announced a 25% hike in the dividend and doubled its share-buyback program. Because of its good inventory management and execution, we think TJX will continue to see strong same-store sales growth and capture new customers. The company’s real competitive advantage is in its approach to purchasing clothing: namely, buying overages and acquiring inventory at great price points. We view the company as a high-quality, cash-generative, dominant-value creator and distributor.
Nike stock surged after the company reported strong quarterly results early in the year—specifically, success with new innovation platforms and sales across all regions and channels. Management’s strategic focus on doubling innovation, speed, and direct relationships is well under way. It’s clear that executives understand where the retail industry is moving and are acting aggressively to turn the disruption of others into Nike’s gains. We expect these advancements will result in quicker product releases, better-targeted quantities, and wider margins. Even as consumer companies face mounting challenges, we think Nike is well-positioned to capture accelerated sales growth and see good returns on invested capital. Additionally, we supported CEO Mark Parker’s decision to let go a number of top-ranking employees amid harassment allegations this spring and we believe that this is not a systemic issue within the company.
The fund’s shortfalls
Sector allocation, a residual of our bottom-up stock-selection process, detracted from relative performance but not enough to offset strength in security selection. Our overweight to energy and underweighted allocations to utilities and information technology hurt most.
From a security selection perspective, holdings within financials and health care also hurt returns.
Our largest absolute detractors included Cardinal Health (health care), McKesson (health care), Chubb (financials), Northrop Grumman (industrials), and Colgate-Palmolive (consumer staples).
We eliminated our position in Cardinal Health, a U.S.-based global drug distribution company. The stock faced several headwinds in recent quarters, including generic price deflation and heightened competition in the individual pharmacy market. In addition, investors feared that Amazon might enter the drug distribution industry. While the Amazon threat is a small part of the changing risk profile, there are other company- and industry-specific issues that prompted us to exit Cardinal Health, most notably execution issues in the Cordis medical distribution business, a CEO transition, and potential legal liability from the opioid crisis.
After strong performance at the start of the year, Northrop Grumman pulled back, along with the broader industrials group—the third-worst-performing sector during the six months. The aerospace, defense,
5
and machinery industries in particular are struggling in light of trade tensions and concerns about growth in China. That said, we continue to believe that the aerospace and defense cycle is solid and has plenty of room to run. Further, the fundamentals for Northrop Grumman remain compelling, and the company should benefit greatly from the new tax law.
While we would prefer that all stocks in the fund perform well at all times, some will inevitably hinder performance over a given period. We assess a stock’s contribution to the fund over a longer period, with a consistent focus on dividend action.
The fund’s positioning and investment strategy
On a “run-rate” basis, the portfolio is expected to produce asset-weighted dividend growth of 14.3% for calendar year 2018. Our run-rate calculation is a rough estimate of potential dividend growth: It takes a company’s current declared dividend rate, annualizes it, and compares it with the previous calendar year’s actual dividend rate. This calculation does not accurately reflect dividend increases that may be announced later in the year nor does it take into account the dollar amounts of the increases. Therefore, companies in the early stages of dividend growth tend to show large percentage increases, yet the absolute cash dividend may be small. The run-rate calculation also is not an accurate reflection of the growth in the fund’s dividend payments to shareholders. Despite these shortcomings, we view this estimate as a reasonable report card.
Our primary objective is to identify companies that we believe will steadily and reliably increase their dividend payments. We seek to meet this objective by carefully building the Dividend Growth Fund one stock at a time, giving central consideration to each company’s dividend growth prospects. Our industry and sector weightings are a result of this process. As of the end of the period, the fund had significant absolute weights in industrials, consumer staples, health care, consumer discretionary, financials, and information technology, and less exposure (roughly 5% or below) to real estate, materials, and energy. We do not have any exposure to telecommunication services or utilities companies.
Overall, as has been the case for the last few years, we remain highly cautious in our investment posture. Working on behalf of the fund’s shareholders, we remain true to our process and believe the portfolio is well-positioned to deliver superior dividend growth and solid capital appreciation over time.
Donald J. Kilbride
Senior Managing Director and
Equity Portfolio Manager
Wellington Management Company llp
August 17, 2018
6
Dividend Growth Fund
Fund Profile
As of July 31, 2018
| | | |
| Portfolio Characteristics | | |
| | | NASDAQ | |
| | | US | |
| | | Dividend | DJ |
| | | Achievers | U.S. Total |
| | | Select | Market |
| | Fund | Index | FA Index |
| Number of Stocks | 42 | 182 | 3,766 |
| Median Market Cap | $92.9B | $65.9B | $67.3B |
| Price/Earnings Ratio | 26.2x | 23.5x | 20.5x |
| Price/Book Ratio | 5.1x | 4.5x | 3.1x |
| Return on Equity | 22.3% | 20.2% | 15.0% |
| Earnings Growth Rate | 5.4% | 3.3% | 8.5% |
| Dividend Yield | 2.0% | 1.9% | 1.7% |
| Foreign Holdings | 5.6% | 0.0% | 0.0% |
| Turnover Rate | | | |
| (Annualized) | 20% | — | — |
| Ticker Symbol | VDIGX | — | — |
| Expense Ratio1 | 0.26% | — | — |
| 30-Day SEC Yield | 1.90% | — | — |
| Short-Term Reserves | 1.6% | — | — |
| | | |
| Sector Diversification (% of equity exposure) |
| | | NASDAQ | |
| | | US | |
| | | Dividend | DJ |
| | | Achievers | U.S. Total |
| | | Select | Market |
| | Fund | Index | FA Index |
| Consumer Discretionary | 13.9% | 11.0% | 12.9% |
| Consumer Staples | 15.9 | 16.0 | 6.2 |
| Energy | 3.2 | 0.0 | 6.0 |
| Financials | 12.1 | 8.6 | 14.5 |
| Health Care | 14.8 | 14.6 | 14.0 |
| Industrials | 20.4 | 28.7 | 10.6 |
| Information Technology | 9.9 | 12.7 | 24.4 |
| Materials | 4.3 | 5.3 | 3.1 |
| Real Estate | 5.5 | 0.0 | 3.7 |
| Telecommunication | | | |
| Services | 0.0 | 0.0 | 1.8 |
| Utilities | 0.0 | 3.1 | 2.8 |
Sector categories are based on the Global Industry Classification
Standard (“GICS”), except for the “Other” category (if applicable),
which includes securities that have not been provided a GICS
classification as of the effective reporting period.
| | |
| Volatility Measures | | |
| | NASDAQ | |
| | US Dividend | DJ |
| | Achievers | U.S. Total |
| | Select | Market |
| | Index | FA Index |
| R-Squared | 0.93 | 0.87 |
| Beta | 0.96 | 0.83 |
| These measures show the degree and timing of the fund’s |
| fluctuations compared with the indexes over 36 months. |
| | |
| Ten Largest Holdings (% of total net assets) |
| NIKE Inc. | Footwear | 4.1% |
| TJX Cos. Inc. | Apparel Retail | 3.9 |
| Microsoft Corp. | Systems Software | 3.4 |
| Canadian National | | |
| Railway Co. | Railroads | 3.4 |
| Union Pacific Corp. | Railroads | 3.1 |
| Costco Wholesale Corp. | Hypermarkets & | |
| | Super Centers | 3.0 |
| PepsiCo Inc. | Soft Drinks | 2.9 |
| American Tower Corp. | Specialized REITs | 2.9 |
| Coca-Cola Co. | Soft Drinks | 2.8 |
| Chubb Ltd. | Property & Casualty | |
| | Insurance | 2.8 |
| Top Ten | | 32.3% |
| The holdings listed exclude any temporary cash investments and equity index products. |
Investment Focus
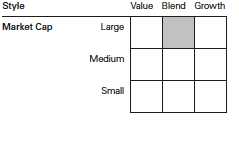
1 The expense ratio shown is from the prospectus dated May 25, 2018, and represents estimated costs for the current fiscal year. For the six
months ended July 31, 2018, the annualized expense ratio was 0.23%.
7
Dividend Growth Fund
Performance Summary
All of the returns in this report represent past performance, which is not a guarantee of future results that may be achieved by the fund. (Current performance may be lower or higher than the performance data cited. For performance data current to the most recent month-end, visit our website at vanguard.com/performance.) Note, too, that both investment returns and principal value can fluctuate widely, so an investor’s shares, when sold, could be worth more or less than their original cost. The returns shown do not reflect taxes that a shareholder would pay on fund distributions or on the sale of fund shares.
Fiscal-Year Total Returns (%): January 31, 2008, Through July 31, 2018
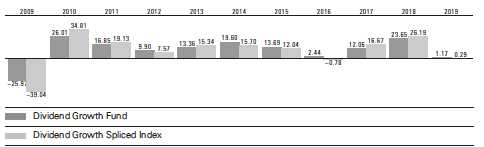
For a benchmark description, see the Glossary.
Note: For 2019, performance data reflect the six months ended July 31, 2018.
Average Annual Total Returns: Periods Ended June 30, 2018
This table presents returns through the latest calendar quarter—rather than through the end of the fiscal period.
Securities and Exchange Commission rules require that we provide this information.
| | | | |
| | Inception | One | Five | Ten |
| | Date | Year | Years | Years |
| Dividend Growth Fund | 5/15/1992 | 10.57% | 11.36% | 9.99% |
See Financial Highlights for dividend and capital gains information.
8
Dividend Growth Fund
Financial Statements (unaudited)
Statement of Net Assets
As of July 31, 2018
The fund reports a complete list of its holdings in regulatory filings four times in each fiscal year, at the quarter-ends. For the second and fourth fiscal quarters, the lists appear in the fund’s semiannual and annual reports to shareholders. For the first and third fiscal quarters, the fund files the lists with the Securities and Exchange Commission on Form N-Q. Shareholders can look up the fund’s Forms N-Q on the SEC’s website at sec.gov. Forms N-Q may also be reviewed and copied at the SEC’s Public Reference Room (see the back cover of this report for further information).
| | |
| | | Market |
| | | Value• |
| | Shares | ($000) |
| Common Stocks (97.9%) | | |
| Consumer Discretionary (13.6%) | |
| NIKE Inc. Class B | 17,933,883 | 1,379,295 |
| TJX Cos. Inc. | 13,334,748 | 1,296,938 |
| McDonald’s Corp. | 5,405,465 | 851,577 |
| VF Corp. | 5,916,915 | 544,770 |
| Starbucks Corp. | 9,891,389 | 518,210 |
| | | 4,590,790 |
| Consumer Staples (15.6%) | | |
| Costco Wholesale Corp. | 4,552,431 | 995,662 |
| PepsiCo Inc. | 8,568,886 | 985,422 |
| Coca-Cola Co. | 20,277,618 | 945,545 |
| Colgate-Palmolive Co. | 12,129,863 | 812,822 |
| Diageo plc | 20,222,159 | 741,906 |
| Walgreens Boots | | |
| Alliance Inc. | 6,250,813 | 422,680 |
| Procter & Gamble Co. | 4,356,684 | 352,369 |
| | | 5,256,406 |
| Energy (3.1%) | | |
| Schlumberger Ltd. | 8,156,216 | 550,708 |
| Exxon Mobil Corp. | 6,011,296 | 489,981 |
| | | 1,040,689 |
| Financials (11.8%) | | |
| Chubb Ltd. | 6,720,487 | 938,987 |
| PNC Financial Services | | |
| Group Inc. | 5,893,077 | 853,494 |
| American Express Co. | 8,173,783 | 813,455 |
| Marsh & McLennan | | |
| Cos. Inc. | 9,072,042 | 756,245 |
| BlackRock Inc. | 1,226,499 | 616,635 |
| | | 3,978,816 |
| Health Care (14.4%) | | |
| Medtronic plc | 9,605,946 | 866,744 |
| UnitedHealth Group | | |
| Inc. | 3,346,394 | 847,374 |
| Johnson & Johnson | 5,902,362 | 782,181 |
| Danaher Corp. | 7,471,891 | 766,467 |
| | |
| Amgen Inc. | 3,151,467 | 619,421 |
| Merck & Co. Inc. | 8,247,056 | 543,233 |
| McKesson Corp. | 3,488,621 | 438,171 |
| | | 4,863,591 |
| Industrials (20.0%) | | |
| Canadian National | | |
| Railway Co. | 12,639,135 | 1,128,229 |
| Union Pacific Corp. | 6,976,026 | 1,045,636 |
| Lockheed Martin Corp. | 2,571,980 | 838,723 |
| General Dynamics Corp. | 4,159,450 | 830,892 |
| Honeywell International | | |
| Inc. | 4,930,499 | 787,154 |
| Northrop Grumman | | |
| Corp. | 2,559,806 | 769,196 |
| United Parcel Service | | |
| Inc. Class B | 6,361,470 | 762,676 |
| United Technologies | | |
| Corp. | 4,118,710 | 559,074 |
| | | 6,721,580 |
| Information Technology (9.7%) | |
| Microsoft Corp. | 10,805,750 | 1,146,274 |
| * Visa Inc. Class A | 6,382,068 | 872,684 |
| Accenture plc Class A | 5,214,718 | 830,861 |
| Automatic Data | | |
| Processing Inc. | 3,086,672 | 416,670 |
| | | 3,266,489 |
| Materials (4.3%) | | |
| Praxair Inc. | 4,691,140 | 785,766 |
| Ecolab Inc. | 4,610,941 | 648,759 |
| | | 1,434,525 |
| Real Estate (5.4%) | | |
| American Tower Corp. | 6,538,233 | 969,228 |
| Public Storage | 3,888,722 | 847,080 |
| | | 1,816,308 |
| Total Common Stocks | | |
| (Cost $21,086,417) | | 32,969,194 |
9
Dividend Growth Fund
| | |
| | | Market |
| | | Value• |
| | Shares | ($000) |
| Temporary Cash Investments (1.6%) | |
| Money Market Fund (0.0%) | | |
| 1 Market Liquidity | | |
| Fund, 2.145% | 234 | 23 |
| |
| | Face | |
| | Amount | |
| | ($000) | |
| Repurchase Agreements (1.6%) | |
| RBS Securities, Inc. | | |
| 1.910%, 8/1/18 | | |
| (Dated 7/31/18, | | |
| Repurchase Value | | |
| $310,216,000, | | |
| collateralized by | | |
| U.S. Treasury | | |
| Note/Bond | | |
| 0.375%– 6.625%, | | |
| 6/15/20–2/15/48, | | |
| with a value of | | |
| $316,404,000) | 310,200 | 310,200 |
| Societe Generale | | |
| 1.900%, 8/1/18 | | |
| (Dated 7/31/18, | | |
| Repurchase Value | | |
| $218,412,000, | | |
| collateralized by U. S. | | |
| Treasury Note/Bond | | |
| 0.000%–4.250%, | | |
| 12/6/18–5/15/47, | | |
| with a value of | | |
| $222,768,000) | 218,400 | 218,400 |
| | | 528,600 |
| Total Temporary Cash Investments | |
| (Cost $528,623) | | 528,623 |
| Total Investments (99.5%) | | |
| (Cost $21,615,040) | | 33,497,817 |
| |
| | Amount |
| | ($000) |
| Other Assets and Liabilities (0.5%) | |
| Other Assets | |
| Investment in Vanguard | 1,725 |
| Receivables for Investment | |
| Securities Sold | 456,225 |
| Receivables for Accrued Income | 33,786 |
| Receivable for Capital Shares Issued | 13,252 |
| Other Assets | 665 |
| Total Other Assets | 505,653 |
| Liabilities | |
| Payables for Investment | |
| Securities Purchased | (283,097) |
| Payables to Investment Advisor | (6,154) |
| Payables for Capital Shares Redeemed | (15,097) |
| Payables to Vanguard | (21,695) |
| Total Liabilities | (326,043) |
| Net Assets (100%) | |
| Applicable to 1,217,780,043 outstanding |
| $.001 par value shares of beneficial | |
| interest (unlimited authorization) | 33,677,427 |
| Net Asset Value Per Share | $27.65 |
| |
| At July 31, 2018, net assets consisted of: |
| | Amount |
| | ($000) |
| Paid-in Capital | 20,890,409 |
| Undistributed Net Investment Income | 37,470 |
| Accumulated Net Realized Gains | 866,664 |
| Unrealized Appreciation (Depreciation) | |
| Investment Securities | 11,882,777 |
| Foreign Currencies | 107 |
| Net Assets | 33,677,427 |
• See Note A in Notes to Financial Statements.
* Non-income-producing security.
1 Affiliated money market fund available only to Vanguard funds
and certain trusts and accounts managed by Vanguard. Rate
shown is the 7-day yield.
See accompanying Notes, which are an integral part of the Financial Statements.
10
Dividend Growth Fund
Statement of Operations
| |
| | Six Months Ended |
| | July31,2018 |
| | ($000) |
| Investment Income | |
| Income | |
| Dividends1 | 341,916 |
| Interest 2 | 3,989 |
| Securities Lending—Net | 31 |
| Total Income | 345,936 |
| Expenses | |
| Investment Advisory Fees—Note B | |
| Basic Fee | 21,482 |
| Performance Adjustment | (6,400) |
| The Vanguard Group—Note C | |
| Management and Administrative | 20,643 |
| Marketing and Distribution | 1,889 |
| Custodian Fees | 126 |
| Shareholders’ Reports | 132 |
| Trustees’ Fees and Expenses | 23 |
| Total Expenses | 37,895 |
| Net Investment Income | 308,041 |
| Realized Net Gain (Loss) | |
| Investment Securities Sold 2 | 870,484 |
| Foreign Currencies | (487) |
| Realized Net Gain (Loss) | 869,997 |
| Change in Unrealized Appreciation (Depreciation) | |
| Investment Securities 2 | (830,568) |
| Foreign Currencies | (450) |
| Change in Unrealized Appreciation (Depreciation) | (831,018) |
| Net Increase (Decrease) in Net Assets Resulting from Operations | 347,020 |
1 Dividends are net of foreign withholding taxes of $1,311,000.
2 Interest income, realized net gain (loss), and change in unrealized appreciation (depreciation) from an affiliated company of the fund
were $0, $23,000, and less than $1,000, respectively. Purchases and sales are for temporary cash investment purposes.
See accompanying Notes, which are an integral part of the Financial Statements.
11
Dividend Growth Fund
Statement of Changes in Net Assets
| | |
| | Six Months Ended | Year Ended |
| | July 31, | January 31, |
| | 2018 | 2018 |
| | ($000) | ($000) |
| Increase (Decrease) in Net Assets | | |
| Operations | | |
| Net Investment Income | 308,041 | 644,235 |
| Realized Net Gain (Loss) | 869,997 | 1,295,326 |
| Change in Unrealized Appreciation (Depreciation) | (831,018) | 4,953,901 |
| Net Increase (Decrease) in Net Assets Resulting from Operations | 347,020 | 6,893,462 |
| Distributions | | |
| Net Investment Income | (280,049) | (629,709) |
| Realized Capital Gain1 | (333,893) | (1,054,378) |
| Total Distributions | (613,942) | (1,684,087) |
| Capital Share Transactions | | |
| Issued | 951,512 | 1,782,139 |
| Issued in Lieu of Cash Distributions | 550,117 | 1,514,816 |
| Redeemed | (2,263,696) | (4,432,447) |
| Net Increase (Decrease) from Capital Share Transactions | (762,067) | (1,135,492) |
| Total Increase (Decrease) | (1,028,989) | 4,073,883 |
| Net Assets | | |
| Beginning of Period | 34,706,416 | 30,632,533 |
| End of Period2 | 33,677,427 | 34,706,416 |
1 Includes fiscal 2019 and 2018 short-term gain distributions totaling $83,526,000 and $111,474,000, respectively. Short-term gain
distributions are treated as ordinary income dividends for tax purposes.
2 Net Assets—End of Period includes undistributed (overdistributed) net investment income of $37,470,000 and $9,965,000.
See accompanying Notes, which are an integral part of the Financial Statements.
12
Dividend Growth Fund
Financial Highlights
| | | | | | |
| Six Months | | | | | |
| | Ended | | | | | |
| For a Share Outstanding | July 31, | Year Ended January 31, |
| Throughout Each Period | 2018 | 2018 | 2017 | 2016 | 2015 | 2014 |
| Net Asset Value, Beginning of Period | $27.85 | $23.72 | $21.78 | $22.47 | $20.45 | $17.52 |
| Investment Operations | | | | | | |
| Net Investment Income | . 2501 | .5141 | .446 | .442 | .430 | . 385 |
| Net Realized and Unrealized Gain (Loss) | | | | | | |
| on Investments | 0.050 | 4.985 | 2.165 | .145 | 2.378 | 3.033 |
| Total from Investment Operations | 0.300 | 5.499 | 2.611 | .587 | 2.808 | 3.418 |
| Distributions | | | | | | |
| Dividends from Net Investment Income | (. 229) | (. 509) | (. 450) | (. 432) | (. 440) | (. 384) |
| Distributions from Realized Capital Gains | (. 271) | (. 860) | (. 221) | (. 845) | (. 348) | (.104) |
| Total Distributions | (.500) | (1.369) | (.671) | (1.277) | (.788) | (.488) |
| Net Asset Value, End of Period | $27.65 | $27.85 | $23.72 | $21.78 | $22.47 | $20.45 |
| |
| Total Return2 | 1.17% | 23.65% | 12.06% | 2.44% | 13.69% | 19.60% |
| |
| Ratios/Supplemental Data | | | | | | |
| Net Assets, End of Period (Millions) | $33,677 | $34,706 | $30,633 | $25,632 | $23,067 | $19,137 |
| Ratio of Total Expenses to | | | | | | |
| Average Net Assets3 | 0.23% | 0.26% | 0.30% | 0.33% | 0.32% | 0.31% |
| Ratio of Net Investment Income to | | | | | | |
| Average Net Assets | 1.89% | 2.00% | 1.93% | 1.95% | 1.94% | 2.03% |
| Portfolio Turnover Rate | 20% | 15% | 27% | 26% | 23% | 18% |
The expense ratio, net investment income ratio, and turnover rate for the current period have been annualized.
1 Calculated based on average shares outstanding.
2 Total returns do not include account service fees that may have applied in the periods shown. Fund prospectuses provide information
about any applicable account service fees.
3 Includes performance-based investment advisory fee increases (decreases) of (0.04%), (0.01%), 0.03%, 0.04%, 0.03%, and 0.02%.
See accompanying Notes, which are an integral part of the Financial Statements.
13
Dividend Growth Fund
Notes to Financial Statements
Vanguard Dividend Growth Fund is registered under the Investment Company Act of 1940 as an open-end investment company, or mutual fund.
A. The following significant accounting policies conform to generally accepted accounting principles for U.S. investment companies. The fund consistently follows such policies in preparing its financial statements.
1. Security Valuation: Securities are valued as of the close of trading on the New York Stock Exchange (generally 4 p.m., Eastern time) on the valuation date. Equity securities are valued at the latest quoted sales prices or official closing prices taken from the primary market in which each security trades; such securities not traded on the valuation date are valued at the mean of the latest quoted bid and asked prices. Securities for which market quotations are not readily available, or whose values have been affected by events occurring before the fund’s pricing time but after the close of the securities’ primary markets, are valued at their fair values calculated according to procedures adopted by the board of trustees. These procedures include obtaining quotations from an independent pricing service, monitoring news to identify significant market-or security-specific events, and evaluating changes in the values of foreign market proxies (for example, ADRs, futures contracts, or exchange-traded funds), between the time the foreign markets close and the fund’s pricing time. When fair-value pricing is employed, the prices of securities used by a fund to calculate its net asset value may differ from quoted or published prices for the same securities. Investments in Vanguard Market Liquidity Fund are valued at that fund’s net asset value. Temporary cash investments are valued using the latest bid prices or using valuations based on a matrix system (which considers such factors as security prices, yields, maturities, and ratings), both as furnished by independent pricing services.
2. Foreign Currency: Securities and other assets and liabilities denominated in foreign currencies are translated into U.S. dollars using exchange rates obtained from an independent third party as of the fund’s pricing time on the valuation date. Realized gains (losses) and unrealized appreciation (depreciation) on investment securities include the effects of changes in exchange rates since the securities were purchased, combined with the effects of changes in security prices. Fluctuations in the value of other assets and liabilities resulting from changes in exchange rates are recorded as unrealized foreign currency gains (losses) until the assets or liabilities are settled in cash, at which time they are recorded as realized foreign currency gains (losses).
3. Repurchase Agreements: The fund enters into repurchase agreements with institutional counterparties. Securities pledged as collateral to the fund under repurchase agreements are held by a custodian bank until the agreements mature, and in the absence of a default, such collateral cannot be repledged, resold, or rehypothecated. Each agreement requires that the market value of the collateral be sufficient to cover payments of interest and principal. The fund further mitigates its counterparty risk by entering into repurchase agreements only with a diverse group of prequalified counterparties, monitoring their financial strength, and entering into master repurchase agreements with its counterparties. The master repurchase agreements provide that, in the event of a counter-party’s default (including bankruptcy), the fund may terminate any repurchase agreements with that counterparty, determine the net amount owed, and sell or retain the collateral up to the net amount owed to the fund. Such action may be subject to legal proceedings, which may delay or limit the disposition of collateral.
14
Dividend Growth Fund
4. Federal Income Taxes: The fund intends to continue to qualify as a regulated investment company and distribute all of its taxable income. Management has analyzed the fund’s tax positions taken for all open federal income tax years (January 31, 2015–2018), and for the period ended July 31, 2018, and has concluded that no provision for federal income tax is required in the fund’s financial statements.
5. Distributions: Distributions to shareholders are recorded on the ex-dividend date.
6. Securities Lending: To earn additional income, the fund lends its securities to qualified institutional borrowers. Security loans are subject to termination by the fund at any time, and are required to be secured at all times by collateral in an amount at least equal to the market value of securities loaned. Daily market fluctuations could cause the value of loaned securities to be more or less than the value of the collateral received. When this occurs, the collateral is adjusted and settled before the opening of the market on the next business day. The fund further mitigates its counterparty risk by entering into securities lending transactions only with a diverse group of prequalified counterparties, monitoring their financial strength, and entering into master securities lending agreements with its counterparties. The master securities lending agreements provide that, in the event of a counterparty’s default (including bankruptcy), the fund may terminate any loans with that borrower, determine the net amount owed, and sell or retain the collateral up to the net amount owed to the fund; however, such actions may be subject to legal proceedings. While collateral mitigates counterparty risk, in the event of a default, the fund may experience delays and costs in recovering the securities loaned. The fund invests cash collateral received in Vanguard Market Liquidity Fund, and records a liability in the Statement of Net Assets for the return of the collateral, during the period the securities are on loan. Securities lending income represents fees charged to borrowers plus income earned on invested cash collateral, less expenses associated with the loan. During the term of the loan, the fund is entitled to all distributions made on or in respect of the loaned securities.
7. Credit Facility: The fund and certain other funds managed by The Vanguard Group (“Vanguard”) participate in a $3.1 billion committed credit facility provided by a syndicate of lenders pursuant to a credit agreement that may be renewed annually; each fund is individually liable for its borrowings, if any, under the credit facility. Borrowings may be utilized for temporary and emergency purposes, and are subject to the fund’s regulatory and contractual borrowing restrictions. The participating funds are charged administrative fees and an annual commitment fee of 0.10% of the undrawn amount of the facility; these fees are allocated to the funds based on a method approved by the fund’s board of trustees and included in Management and Administrative expenses on the fund’s Statement of Operations. Any borrowings under this facility bear interest at a rate based upon the higher of the one-month London Interbank Offered Rate, federal funds effective rate, or overnight bank funding rate plus an agreed-upon spread.
The fund had no borrowings outstanding at July 31, 2018, or at any time during the period then ended.
8. Other: Dividend income is recorded on the ex-dividend date. Interest income is accrued daily. Premiums and discounts on debt securities purchased are amortized and accreted, respectively, to interest income over the lives of the respective securities. Security transactions are accounted for on the date securities are bought or sold. Costs used to determine realized gains (losses) on the sale of investment securities are those of the specific securities sold.
15
Dividend Growth Fund
B. Wellington Management Company LLP provides investment advisory services to the fund for a fee calculated at an annual percentage rate of average net assets. The basic fee is subject to quarterly adjustments based on the fund’s performance relative to the NASDAQ US Dividend Achievers Select Index for the preceding three years. For the six months ended July 31, 2018, the investment advisory fee represented an effective annual basic rate of 0.13% of the fund’s average net assets before a decrease of $6,400,000 (0.04%) based on performance.
C. In accordance with the terms of a Funds’ Service Agreement (the “FSA”) between Vanguard and the fund, Vanguard furnishes to the fund corporate management, administrative, marketing, and distribution services at Vanguard’s cost of operations (as defined by the FSA). These costs of operations are allocated to the fund based on methods and guidelines approved by the board of trustees. Vanguard does not require reimbursement in the current period for certain costs of operations (such as deferred compensation/benefits and risk/insurance costs); the fund’s liability for these costs of operations is included in Payables to Vanguard on the Statement of Net Assets. All other costs of operations payable to Vanguard are generally settled twice a month.
Upon the request of Vanguard, the fund may invest up to 0.40% of its net assets as capital in Vanguard. At July 31, 2018, the fund had contributed to Vanguard capital in the amount of $1,725,000, representing 0.01% of the fund’s net assets and 0.69% of Vanguard’s capitalization. The fund’s trustees and officers are also directors and employees, respectively, of Vanguard.
D. Various inputs may be used to determine the value of the fund’s investments. These inputs are summarized in three broad levels for financial statement purposes. The inputs or methodologies used to value securities are not necessarily an indication of the risk associated with investing in those securities.
Level 1—Quoted prices in active markets for identical securities.
Level 2—Other significant observable inputs (including quoted prices for similar securities, interest rates, prepayment speeds, credit risk, etc.).
Level 3—Significant unobservable inputs (including the fund’s own assumptions used to determine
the fair value of investments). Any investments valued with significant unobservable inputs are
noted on the Statement of Net Assets.
The following table summarizes the market value of the fund’s investments as of July 31, 2018, based on the inputs used to value them:
| | | |
| | Level 1 | Level 2 | Level 3 |
| Investments | ($000) | ($000) | ($000) |
| Common Stocks | 32,227,288 | 741,906 | — |
| Temporary Cash Investments | 23 | 528,600 | — |
| Total | 32,227,311 | 1,270,506 | — |
E. Distributions are determined on a tax basis and may differ from net investment income and realized capital gains for financial reporting purposes. Differences may be permanent or temporary. Permanent differences are reclassified among capital accounts in the financial statements to reflect their tax character. Temporary differences arise when certain items of income, expense, gain, or loss are recognized in different periods for financial statement and tax purposes. These differences
16
Dividend Growth Fund
will reverse at some time in the future. Differences in classification may also result from the treatment of short-term gains as ordinary income for tax purposes. The fund’s tax-basis capital gains and losses are determined only at the end of each fiscal year.
At July 31, 2018, the cost of investment securities for tax purposes was $21,615,040,000. Net unrealized appreciation of investment securities for tax purposes was $11,882,777,000, consisting of unrealized gains of $12,158,137,000 on securities that had risen in value since their purchase and $275,360,000 in unrealized losses on securities that had fallen in value since their purchase.
F. During the six months ended July 31, 2018, the fund purchased $3,251,141,000 of investment securities and sold $4,375,594,000 of investment securities, other than temporary cash investments.
G. Capital shares issued and redeemed were:
| | |
| | Six Months Ended | Year Ended |
| | July 31, 2018 | January 31, 2018 |
| | Shares | Shares |
| | (000) | (000) |
| Issued | 35,851 | 69,235 |
| Issued in Lieu of Cash Distributions | 20,834 | 58,088 |
| Redeemed | (84,980) | (172,613) |
| Net Increase (Decrease) in Shares Outstanding | (28,295) | (45,290) |
H. Management has determined that no material events or transactions occurred subsequent to July 31, 2018, that would require recognition or disclosure in these financial statements.
17
About Your Fund’s Expenses
As a shareholder of the fund, you incur ongoing costs, which include costs for portfolio management, administrative services, and shareholder reports (like this one), among others. Operating expenses, which are deducted from a fund’s gross income, directly reduce the investment return of the fund.
A fund’s expenses are expressed as a percentage of its average net assets. This figure is known as the expense ratio. The following examples are intended to help you understand the ongoing costs (in dollars) of investing in your fund and to compare these costs with those of other mutual funds. The examples are based on an investment of $1,000 made at the beginning of the period shown and held for the entire period.
The accompanying table illustrates your fund’s costs in two ways:
• Based on actual fund return. This section helps you to estimate the actual expenses that you paid over the period. The ”Ending Account Value“ shown is derived from the fund‘s actual return, and the third column shows the dollar amount that would have been paid by an investor who started with $1,000 in the fund. You may use the information here, together with the amount you invested, to estimate the expenses that you paid over the period.
To do so, simply divide your account value by $1,000 (for example, an $8,600 account value divided by $1,000 = 8.6), then multiply the result by the number given for your fund under the heading ”Expenses Paid During Period.“
• Based on hypothetical 5% yearly return. This section is intended to help you compare your fund‘s costs with those of other mutual funds. It assumes that the fund had a yearly return of 5% before expenses, but that the expense ratio is unchanged. In this case—because the return used is not the fund’s actual return—the results do not apply to your investment. The example is useful in making comparisons because the Securities and Exchange Commission requires all mutual funds to calculate expenses based on a 5% return. You can assess your fund’s costs by comparing this hypothetical example with the hypothetical examples that appear in shareholder reports of other funds.
Note that the expenses shown in the table are meant to highlight and help you compare ongoing costs only and do not reflect transaction costs incurred by the fund for buying and selling securities. Further, the expenses do not include any purchase, redemption, or account service fees described in the fund prospectus. If such fees were applied to your account, your costs would be higher. Your fund does not carry a “sales load.”
The calculations assume no shares were bought or sold during the period. Your actual costs may have been higher or lower, depending on the amount of your investment and the timing of any purchases or redemptions.
You can find more information about the fund’s expenses, including annual expense ratios, in the Financial Statements section of this report. For additional information on operating expenses and other shareholder costs, please refer to your fund’s current prospectus.
18
| | | |
| Six Months Ended July 31, 2018 | | | |
| | Beginning | Ending | Expenses |
| | Account Value | Account Value | Paid During |
| Dividend Growth Fund | 1/31/2018 | 7/31/2018 | Period |
| Based on Actual Fund Return | $1,000.00 | $1,011.71 | $1.15 |
| Based on Hypothetical 5% Yearly Return | 1,000.00 | 1,023.65 | 1.15 |
The calculations are based on expenses incurred in the most recent six-month period. The fund’s annualized six-month expense ratio for
that period is 0.23%. The dollar amounts shown as “Expenses Paid” are equal to the annualized expense ratio multiplied by the average
account value over the period, multiplied by the number of days in the most recent six-month period, then divided by the number of days in
the most recent 12-month period (181/365).
19
Glossary
30-Day SEC Yield. A fund’s 30-day SEC yield is derived using a formula specified by the U.S. Securities and Exchange Commission. Under the formula, data related to the fund’s security holdings in the previous 30 days are used to calculate the fund’s hypothetical net income for that period, which is then annualized and divided by the fund’s estimated average net assets over the calculation period. For the purposes of this calculation, a security’s income is based on its current market yield to maturity (for bonds), its actual income (for asset-backed securities), or its projected dividend yield (for stocks). Because the SEC yield represents hypothetical annualized income, it will differ—at times significantly—from the fund’s actual experience. As a result, the fund’s income distributions may be higher or lower than implied by the SEC yield.
Beta. A measure of the magnitude of a fund’s past share-price fluctuations in relation to the ups and downs of a given market index. The index is assigned a beta of 1.00. Compared with a given index, a fund with a beta of 1.20 typically would have seen its share price rise or fall by 12% when the index rose or fell by 10%. For this report, beta is based on returns over the past 36 months for both the fund and the index. Note that a fund’s beta should be reviewed in conjunction with its R-squared (see definition). The lower the R-squared, the less correlation there is between the fund and the index, and the less reliable beta is as an indicator of volatility.
Dividend Yield. Dividend income earned by stocks, expressed as a percentage of the aggregate market value (or of net asset value, for a fund). The yield is determined by dividing the amount of the annual dividends by the aggregate value (or net asset value) at the end of the period. For a fund, the dividend yield is based solely on stock holdings and does not include any income produced by other investments.
Earnings Growth Rate. The average annual rate of growth in earnings over the past five years for the stocks now in a fund.
Equity Exposure. A measure that reflects a fund’s investments in stocks and stock futures. Any holdings in short-term reserves are excluded.
Expense Ratio. A fund’s total annual operating expenses expressed as a percentage of the fund’s average net assets. The expense ratio includes management and administrative expenses, but does not include the transaction costs of buying and selling portfolio securities.
Foreign Holdings. The percentage of a fund represented by securities or depositary receipts of companies based outside the United States.
Inception Date. The date on which the assets of a fund (or one of its share classes) are first invested in accordance with the fund’s investment objective. For funds with a subscription period, the inception date is the day after that period ends. Investment performance is measured from the inception date.
Median Market Cap. An indicator of the size of companies in which a fund invests; the midpoint of market capitalization (market price x shares outstanding) of a fund’s stocks, weighted by the proportion of the fund’s assets invested in each stock. Stocks representing half of the fund’s assets have market capitalizations above the median, and the rest are below it.
Price/Book Ratio. The share price of a stock divided by its net worth, or book value, per share.
For a fund, the weighted average price/book ratio of the stocks it holds.
20
Price/Earnings Ratio. The ratio of a stock’s current price to its per-share earnings over the past year. For a fund, the weighted average P/E of the stocks it holds. P/E is an indicator of market expectations about corporate prospects; the higher the P/E, the greater the expectations for a company’s future growth.
R-Squared. A measure of how much of a fund’s past returns can be explained by the returns from the market in general, as measured by a given index. If a fund’s total returns were precisely synchronized with an index’s returns, its R-squared would be 1.00. If the fund’s returns bore no relationship to the index’s returns, its R-squared would be 0. For this report, R-squared is based on returns over the past 36 months for both the fund and the index.
Return on Equity. The annual average rate of return generated by a company during the past five years for each dollar of shareholder’s equity (net income divided by shareholder’s equity). For a fund, the weighted average return on equity for the companies whose stocks it holds.
Short-Term Reserves. The percentage of a fund invested in highly liquid, short-term securities that can be readily converted to cash.
Turnover Rate. An indication of the fund’s trading activity. Funds with high turnover rates incur higher transaction costs and may be more likely to distribute capital gains (which may be taxable to investors). The turnover rate excludes in-kind transactions, which have minimal impact on costs.
Benchmark Information
Dividend Growth Spliced Index: Russell 1000 Index through January 31, 2010; NASDAQ US Dividend Achievers Select Index (formerly known as the Dividend Achievers Select Index) thereafter. Prior to December 6, 2002, the comparative benchmark was known as the Utilities Composite Index. The index weightings were: 40% S&P Utilities Index, 40% S&P Telephone Index, and 20% Lehman Brothers Utility Bond Index through April 30, 1999; 63.75% S&P Utilities Index, 21.25% S&P Telephone Index, and 15% Lehman Brothers Utility Bond Index through March 31, 2000; 75% S&P Utilities Index and 25% S&P Telephone Index through December 31, 2001; and 75% S&P Utilities Index and 25% S&P Integrated Telecommunication Services Index through December 6, 2002.
21
The Global Industry Classification Standard (“GICS”) was developed by and is the exclusive property and a service mark
of MSCI Inc. (“MSCI”) and Standard and Poor’s, a division of McGraw-Hill Companies, Inc. (“S&P”), and is licensed for use
by Vanguard. Neither MSCI, S&P nor any third party involved in making or compiling the GICS or any GICS classification
makes any express or implied warranties or representations with respect to such standard or classification (or the results
to be obtained by the use thereof), and all such parties hereby expressly disclaim all warranties of originality, accuracy,
completeness, merchantability or fitness for a particular purpose with respect to any such standard or classification.
Without limiting any of the foregoing, in no event shall MSCI, S&P, any of its affiliates or any third party involved in
making or compiling the GICS or any GICS classification have any liability for any direct, indirect, special, punitive,
consequential or any other damages (including lost profits) even if notified of the possibility of such damages.
22
The People Who Govern Your Fund
The trustees of your mutual fund are there to see that the fund is operated and managed in your best interests since, as a shareholder, you are a part owner of the fund. Your fund’s trustees also serve on the board of directors of The Vanguard Group, Inc., which is owned by the Vanguard funds and provides services to them on an at-cost basis.
A majority of Vanguard’s board members are independent, meaning that they have no affiliation with Vanguard or the funds they oversee, apart from the sizable personal investments they have made as private individuals. The independent board members have distinguished backgrounds in business, academia, and public service. Each of the trustees and executive officers oversees 208 Vanguard funds.
Information for each trustee and executive officer of the fund appears below. The mailing address of the trustees and officers is P.O. Box 876, Valley Forge, PA 19482. More information about the trustees is in the Statement of Additional Information, which can be obtained, without charge, by contacting Vanguard at 800-662-7447, or online at vanguard.com.
Interested Trustees1
F. William McNabb III
Born in 1957. Trustee since July 2009. Principal occupation(s) during the past five years and other experience: chairman of the board (January 2010–present) of Vanguard and of each of the investment companies served by Vanguard, trustee (2009–present) of each of the investment companies served by Vanguard, and director (2008–present) of Vanguard. Chief executive officer and president (2008–2017) of Vanguard and each of the investment companies served by Vanguard, managing director (1995–2008) of Vanguard, and director (1997–2018) of Vanguard Marketing Corporation. Director (2018–present) of UnitedHealth Group.
Mortimer J. Buckley
Born in 1969. Trustee since January 2018. Principal occupation(s) during the past five years and other experience: chief executive officer (January 2018–present) of Vanguard; chief executive officer, president, and trustee (January 2018–present) of each of the investment companies served by Vanguard; president and director (2017–present) of Vanguard; and president (February 2018–present) of Vanguard Marketing Corporation. Chief investment officer (2013–2017), managing director (2002–2017), head of the Retail Investor Group (2006–2012), and chief information officer (2001–2006) of Vanguard. Chairman of the board (2011–2017) of the Children’s Hospital of Philadelphia.
Independent Trustees
Emerson U. Fullwood
Born in 1948. Trustee since January 2008. Principal occupation(s) during the past five years and other experience: executive chief staff and marketing officer for North America and corporate vice president (retired 2008) of Xerox Corporation (document management products and services). Former president of the Worldwide Channels Group, Latin America, and Worldwide Customer Service and executive chief staff officer of Developing Markets of Xerox. Executive in residence and 2009–2010 Distinguished Minett Professor at the Rochester Institute of Technology. Lead director of SPX FLOW, Inc. (multi-industry manufacturing). Director of the University of Rochester Medical Center, the Monroe Community College Foundation, the United Way of Rochester, North Carolina A&T University, and Roberts Wesleyan College. Trustee of the University of Rochester.
Amy Gutmann
Born in 1949. Trustee since June 2006. Principal occupation(s) during the past five years and other experience: president (2004–present) of the University of Pennsylvania. Christopher H. Browne Distinguished Professor of Political Science, School of Arts and Sciences, and professor of communication, Annenberg School for Communication, with secondary faculty appointments in the Department of Philosophy, School of Arts and Sciences, and at the Graduate School of Education, University of Pennsylvania. Trustee of the National Constitution Center.
1 Mr. McNabb and Mr. Buckley are considered “interested persons,” as defined in the Investment Company Act of 1940, because they are officers of the Vanguard funds.
JoAnn Heffernan Heisen
Born in 1950. Trustee since July 1998. Principal occupation(s) during the past five years and other experience: corporate vice president of Johnson & Johnson (pharmaceuticals/medical devices/consumer products) and member of its executive committee (1997–2008). Chief global diversity officer (retired 2008), vice president and chief information officer (1997–2006), controller (1995–1997), treasurer (1991–1995), and assistant treasurer (1989–1991) of Johnson & Johnson. Director of Skytop Lodge Corporation (hotels) and the Robert Wood Johnson Foundation. Member of the advisory board of the Institute for Women’s Leadership at Rutgers University.
F. Joseph Loughrey
Born in 1949. Trustee since October 2009. Principal occupation(s) during the past five years and other experience: president and chief operating officer (retired 2009) and vice chairman of the board (2008–2009) of Cummins Inc. (industrial machinery). Chairman of the board of Hillenbrand, Inc. (specialized consumer services), Oxfam America, and the Lumina Foundation for Education. Director of the V Foundation for Cancer Research. Member of the advisory council for the College of Arts and Letters and chair of the advisory board to the Kellogg Institute for International Studies, both at the University of Notre Dame.
Mark Loughridge
Born in 1953. Trustee since March 2012. Principal occupation(s) during the past five years and other experience: senior vice president and chief financial officer (retired 2013) of IBM (information technology services). Fiduciary member of IBM’s Retirement Plan Committee (2004–2013), senior vice president and general manager (2002–2004) of IBM Global Financing, vice president and controller (1998–2002) of IBM, and a variety of other prior management roles at IBM. Member of the Council on Chicago Booth.
Scott C. Malpass
Born in 1962. Trustee since March 2012. Principal occupation(s) during the past five years and other experience: chief investment officer (1989–present) and vice president (1996–present) of the University of Notre Dame. Assistant professor of finance at the Mendoza College of Business, University of Notre Dame, and member of the Notre Dame 403(b) Investment Committee. Chairman of the board of TIFF Advisory Services, Inc. Member of the board of Catholic Investment Services, Inc. (investment advisors), the board of advisors for Spruceview Capital Partners, and the board of superintendence of the Institute for the Works of Religion.
Deanna Mulligan
Born in 1963. Trustee since January 2018. Principal occupation(s) during the past five years and other experience: president (2010–present) and chief executive officer (2011–present) of The Guardian Life Insurance Company of America. Chief operating officer (2010–2011) and executive vice president (2008–2010) of Individual Life and Disability of The Guardian Life Insurance Company of America. Member of the board of The Guardian Life Insurance Company of America, the American Council of Life Insurers, the Partnership for New York City (business leadership), and the Committee Encouraging Corporate Philanthropy. Trustee of the Economic Club of New York and the Bruce Museum (arts and science). Member of the Advisory Council for the Stanford Graduate School of Business.
André F. Perold
Born in 1952. Trustee since December 2004. Principal occupation(s) during the past five years and other experience: George Gund Professor of Finance and Banking, Emeritus at the Harvard Business School (retired 2011). Chief investment officer and co-managing partner of HighVista Strategies LLC (private investment firm). Overseer of the Museum of Fine Arts Boston.
Sarah Bloom Raskin
Born in 1961. Trustee since January 2018. Principal occupation(s) during the past five years and other experience: deputy secretary (2014–2017) of the United States Department of the Treasury. Governor (2010–2014) of the Federal Reserve Board. Commissioner (2007–2010) of financial regulation for the State of Maryland. Member of the board of directors (2012–2014) of Neighborhood Reinvestment Corporation. Director of i(x) Investments, LLC.
Peter F. Volanakis
Born in 1955. Trustee since July 2009. Principal occupation(s) during the past five years and other experience: president and chief operating officer (retired 2010) of Corning Incorporated (communications equipment) and director of Corning Incorporated (2000–2010) and Dow Corning (2001–2010). Director (2012) of SPX Corporation (multi-industry manufacturing). Overseer of the Amos Tuck School of Business Administration, Dartmouth College (2001–2013). Chairman of the board of trustees of Colby-Sawyer College. Member of the Board of Hypertherm Inc. (industrial cutting systems, software, and consumables).
Executive Officers
Glenn Booraem
Born in 1967. Principal occupation(s) during the past five years and other experience: principal of Vanguard. Investment stewardship officer (2017–present), treasurer (2015–2017), controller (2010–2015), and assistant controller (2001–2010) of each of the investment companies served by Vanguard.
Christine M. Buchanan
Born in 1970. Principal occupation(s) during the past five years and other experience: principal of Vanguard and global head of Fund Administration at Vanguard. Treasurer (2017–present) of each of the investment companies served by Vanguard. Partner (2005–2017) at KPMG LLP (audit, tax, and advisory services).
Brian Dvorak
Born in 1973. Principal occupation(s) during the past five years and other experience: principal of Vanguard. Chief compliance officer (2017–present) of Vanguard and each of the investment companies served by Vanguard. Assistant vice president (2017–present) of Vanguard Marketing Corporation. Vice president and director of Enterprise Risk Management (2011–2013) at Oppenheimer Funds, Inc.
Thomas J. Higgins
Born in 1957. Principal occupation(s) during the past five years and other experience: principal of Vanguard. Chief financial officer (2008–present) and treasurer (1998–2008) of each of the investment companies served by Vanguard.
Peter Mahoney
Born in 1974. Principal occupation(s) during the past five years and other experience: principal of Vanguard. Controller (2015–present) of each of the investment companies served by Vanguard. Head of International Fund Services (2008–2014) at Vanguard.
Anne E. Robinson
Born in 1970. Principal occupation(s) during the past five years and other experience: general counsel (2016–present) of Vanguard. Secretary (2016–present) of Vanguard and of each of the investment companies served by Vanguard. Managing director (2016–present) of Vanguard. Director and senior vice president (2016–2018) of Vanguard Marketing Corporation. Managing director and general counsel of Global Cards and Consumer Services (2014–2016) at Citigroup. Counsel (2003–2014) at American Express.
Michael Rollings
Born in 1963. Principal occupation(s) during the past five years and other experience: finance director (2017–present) and treasurer (2017) of each of the investment companies served by Vanguard. Managing director (2016–present) of Vanguard. Chief financial officer (2016–present) of Vanguard. Director (2016–present) of Vanguard Marketing Corporation. Executive vice president and chief financial officer (2006–2016) of MassMutual Financial Group.
| |
| Vanguard Senior Management Team |
| |
| Mortimer J. Buckley | James M. Norris |
| Gregory Davis | Thomas M. Rampulla |
| John James | Karin A. Risi |
| Martha G. King | Anne E. Robinson |
| John T. Marcante | Michael Rollings |
| Chris D. McIsaac | |
| |
| |
| Chairman Emeritus and Senior Advisor |
| |
| John J. Brennan | |
| Chairman, 1996–2009 | |
| Chief Executive Officer and President, 1996–2008 |
| |
| |
| Founder | |
| |
| John C. Bogle | |
| Chairman and Chief Executive Officer, 1974–1996 |
|  |
| | P.O. Box 2600 |
| | Valley Forge, PA 19482-2600 |
| |
| |
| |
| Connect with Vanguard® > vanguard.com |
| |
| |
| |
| Fund Information > 800-662-7447 | Source for Bloomberg Barclays indexes: Bloomberg |
| Direct Investor Account Services > 800-662-2739 | Index Services Limited. Copyright 2018, Bloomberg. |
| | All rights reserved. |
| Institutional Investor Services > 800-523-1036 | |
| Text Telephone for People | |
| Who Are Deaf or Hard of Hearing > 800-749-7273 | |
| |
| This material may be used in conjunction | |
| with the offering of shares of any Vanguard | |
| fund only if preceded or accompanied by | |
| the fund’s current prospectus. | |
| |
| All comparative mutual fund data are from Lipper, a | |
| Thomson Reuters Company, or Morningstar, Inc., unless | |
| otherwise noted. | |
| |
| You can obtain a free copy of Vanguard’s proxy voting | |
| guidelines by visiting vanguard.com/proxyreporting or by | |
| calling Vanguard at 800-662-2739. The guidelines are | |
| also available from the SEC’s website, sec.gov. In | |
| addition, you may obtain a free report on how your fund | |
| voted the proxies for securities it owned during the 12 | |
| months ended June 30. To get the report, visit either | |
| vanguard.com/proxyreporting or sec.gov. | |
| |
| You can review and copy information about your fund at | |
| the SEC’s Public Reference Room in Washington, D.C. To | |
| find out more about this public service, call the SEC at | |
| 202-551-8090. Information about your fund is also | |
| available on the SEC’s website, and you can receive | |
| copies of this information, for a fee, by sending a | |
| request in either of two ways: via email addressed to | |
| publicinfo@sec.gov or via regular mail addressed to the | |
| Public Reference Section, Securities and Exchange | |
| Commission, Washington, DC 20549-1520. | |
| | © 2018 The Vanguard Group, Inc. |
| | All rights reserved. |
| | Vanguard Marketing Corporation, Distributor. |
| |
| | Q572 092018 |

Semiannual Report | July 31, 2018
Vanguard Dividend Appreciation Index Fund
Vanguard’s Principles for Investing Success
We want to give you the best chance of investment success. These principles, grounded in Vanguard’s research and experience, can put you on the right path.
Goals. Create clear, appropriate investment goals.
Balance. Develop a suitable asset allocation using broadly diversified funds. Cost. Minimize cost.
Discipline. Maintain perspective and long-term discipline.
A single theme unites these principles: Focus on the things you can control.
We believe there is no wiser course for any investor.
| |
| Contents | |
| Your Fund’s Performance at a Glance. | 1 |
| CEO’s Perspective. | 3 |
| Fund Profile. | 5 |
| Performance Summary. | 7 |
| Financial Statements. | 8 |
| About Your Fund’s Expenses. | 23 |
| Trustees Approve Advisory Arrangement. | 25 |
| Glossary. | 27 |
Please note: The opinions expressed in this report are just that—informed opinions. They should not be considered promises
or advice. Also, please keep in mind that the information and opinions cover the period through the date on the front of this
report. Of course, the risks of investing in your fund are spelled out in the prospectus.
See the Glossary for definitions of investment terms used in this report.
About the cover: Nautical images have been part of Vanguard’s rich heritage since its start in 1975. For an
incoming ship, a lighthouse offers a beacon and safe path to shore. You can similarly depend on Vanguard to put
you first––and light the way––as you strive to meet your financial goals. Our client focus and low costs,
stemming from our unique ownership structure, assure that your interests are paramount.
Your Fund’s Performance at a Glance
• Vanguard Dividend Appreciation Index Fund returned 0.24% for Investor Shares for the six months ended July 31, 2018. It closely tracked its benchmark, the NASDAQ US Dividend Achievers Select Index, and outpaced the average return of its large-capitalization core fund peers.
• Dividend-paying stocks lagged those of the broad U.S. market as concerns about monetary policy and the impact of trade tariffs and rising inflation countered strong job reports and decent corporate earnings.
• The fund’s target index consists of the stocks of companies that have a record of increasing dividends over time.
• Five of the fund’s ten industry sectors had negative results. Technology was the top contributor, followed by utilities and health care. Industrials, consumer services, and financials detracted most.
| |
| Total Returns: Six Months Ended July 31, 2018 | |
| | Total |
| | Returns |
| Vanguard Dividend Appreciation Index Fund | |
| Investor Shares | 0.24% |
| ETF Shares | |
| Market Price | 0.25 |
| Net Asset Value | 0.27 |
| Admiral™ Shares | 0.27 |
| NASDAQ US Dividend Achievers Select Index | 0.29 |
| Large-Cap Core Funds Average | 0.04 |
Large-Cap Core Funds Average: Derived from data provided by Lipper, a Thomson Reuters Company.
The Vanguard ETF® Shares shown are traded on the NYSE Arca exchange and are available only through brokers. The table provides ETF
returns based on both the NYSE Arca market price and the net asset value for a share. U.S. Pat. Nos. 6,879,964; 7,337,138; 7,720,749;
7,925,573; 8,090,646; and 8,417,623.
For the ETF Shares, the market price is determined by the midpoint of the bid-offer spread as of the closing time of the New York Stock
Exchange (generally 4 p.m., Eastern time). The net asset value is also determined as of the NYSE closing time. For more information about
how the ETF Shares' market prices have compared with their net asset value, visit vanguard.com, select your ETF, and then select the
Price and Performance tab. The ETF premium/discount analysis there shows the percentages of days on which the ETF Shares' market
price was above or below the NAV.
Admiral Shares carry lower expenses and are available to investors who meet certain account-balance requirements.
1
| | | | |
| Expense Ratios | | | | |
| Your Fund Compared With Its Peer Group | | | | |
| | Investor | ETF | Admiral | Peer Group |
| | Shares | Shares | Shares | Average |
| Dividend Appreciation Index Fund | 0.15% | 0.08% | 0.08% | 1.03% |
The fund expense ratios shown are from the prospectus dated May 25, 2018, and represent estimated costs for the current fiscal year. For
the six months ended July 31, 2018, the fund’s annualized expense ratios were 0.14% for Investor Shares, 0.07% for ETF Shares, and
0.07% for Admiral Shares. The peer-group expense ratio is derived from data provided by Lipper, a Thomson Reuters Company, and
captures information through year-end 2017.
Peer group: Large-Cap Core Funds.
2
CEO’s Perspective

Tim Buckley
President and Chief Executive Officer
Dear Shareholder,
I feel extremely fortunate to have the chance to lead a company filled with people who come to work every day passionate about Vanguard’s core purpose: to take a stand for all investors, to treat them fairly, and to give them the best chance for investment success.
When I joined Vanguard in 1991, I found a mission-driven team focused on improving lives—helping people retire more comfortably, put their children through college, and achieve financial security. I also found a company with purpose in an industry ripe for improvement.
It was clear, even early in my career, that the cards were stacked against most investors. Hidden fees, performance-chasing, and poor advice were relentlessly eroding investors’ dreams.
We knew Vanguard could be different and, as a result, could make a real difference. We have lowered the costs of investing for our shareholders significantly. And we’re proud of the performance of our funds.
Vanguard is built for Vanguard investors—we focus solely on you, our fund shareholders. Everything we do is designed to give our clients the best chance for investment success. In my role as CEO, I’ll keep this priority
3
front and center. We’re proud of what we’ve achieved, but we’re even more excited about what’s to come.
Steady, time-tested guidance
Our guidance for investors, as always, is to stay the course, tune out the hyperbolic headlines, and focus on your goals and what you can control, such as costs and how much you save. This time-tested advice has served our clients well over the decades.
Regardless of how the markets perform in the short term, I’m incredibly optimistic about the future for our investors. We have a dedicated team serving you, and we will never stop striving to make Vanguard the best place for you to invest through our high-quality funds and services, advice and guidance to help you meet your financial goals, and an experience that makes you feel good about entrusting us with your hard-earned savings.
Thank you for your continued loyalty.
Sincerely,

Mortimer J. Buckley
President and Chief Executive Officer
August 16, 2018
| | | |
| Market Barometer | | | |
| | Total Returns |
| | Periods Ended July 31, 2018 |
| | Six | One | Five Years |
| | Months | Year | (Annualized) |
| Stocks | | | |
| Russell 1000 Index (Large-caps) | 0.86% | 16.19% | 12.96% |
| Russell 2000 Index (Small-caps) | 6.75 | 18.73 | 11.33 |
| Russell 3000 Index (Broad U.S. market) | 1.30 | 16.39 | 12.83 |
| FTSE All-World ex US Index (International) | -6.57 | 6.19 | 5.97 |
| |
| Bonds | | | |
| Bloomberg Barclays U.S. Aggregate Bond Index | | | |
| (Broad taxable market) | -0.45% | -0.80% | 2.25% |
| Bloomberg Barclays Municipal Bond Index | | | |
| (Broad tax-exempt market) | 1.18 | 0.99 | 3.76 |
| FTSE Three-Month U. S. Treasury Bill Index | 0.83 | 1.41 | 0.41 |
| |
| CPI | | | |
| Consumer Price Index | 1.67% | 2.95% | 1.53% |
4
Dividend Appreciation Index Fund
Fund Profile
As of July 31, 2018
| | | |
| Share-Class Characteristics | | |
| | Investor | ETF | Admiral |
| | Shares | Shares | Shares |
| Ticker Symbol | VDAIX | VIG | VDADX |
| Expense Ratio1 | 0.15% | 0.08% | 0.08% |
| 30-Day SEC Yield | 1.86% | 1.95% | 1.95% |
| | | |
| Portfolio Characteristics | | |
| | | NASDAQ | |
| | | US | |
| | | Dividend | DJ |
| | | Achievers | U.S. Total |
| | | Select | Market |
| | Fund | Index | FA Index |
| Number of Stocks | 182 | 182 | 3,766 |
| Median Market Cap | $65.9B | $65.9B | $67.4B |
| Price/Earnings Ratio | 23.5x | 23.5x | 20.5x |
| Price/Book Ratio | 4.5x | 4.5x | 3.1x |
| Return on Equity | 20.2% | 20.2% | 15.0% |
| Earnings Growth Rate | 3.3% | 3.3% | 8.5% |
| Dividend Yield | 1.9% | 1.9% | 1.7% |
| Foreign Holdings | 0.0% | 0.0% | 0.0% |
| Turnover Rate | | | |
| (Annualized) | 20% | — | — |
| Short-Term Reserves | 0.0% | — | — |
| | |
| Volatility Measures | | |
| | NASDAQ | |
| | US Dividend | DJ |
| | Achievers | U.S. Total |
| | Select | Market |
| | Index | FA Index |
| R-Squared | 1.00 | 0.87 |
| Beta | 1.00 | 0.83 |
| These measures show the degree and timing of the fund’s |
| fluctuations compared with the indexes over 36 months. |
| | |
| Ten Largest Holdings (% of total net assets) |
| Microsoft Corp. | Software | 4.4% |
| Johnson & Johnson | Pharmaceuticals | 3.9 |
| Walmart Inc. | Broadline Retailers | 3.8 |
| PepsiCo Inc. | Soft Drinks | 3.5 |
| 3M Co. | Diversified Industrials | 2.7 |
| McDonald's Corp. | Restaurants & Bars | 2.7 |
| Medtronic plc | Medical Equipment | 2.6 |
| Union Pacific Corp. | Railroads | 2.5 |
| Abbott Laboratories | Pharmaceuticals | 2.5 |
| Texas Instruments Inc. | Semiconductors | 2.4 |
| Top Ten | | 31.0% |
| The holdings listed exclude any temporary cash investments and equity index products. |
| | |
Investment Focus
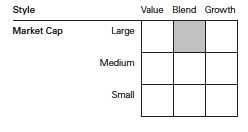
1 The expense ratios shown are from the prospectus dated May 25, 2018, and represent estimated costs for the current fiscal year. For the six
months ended July 31, 2018, the annualized expense ratios were 0.14% for Investor Shares, 0.07% for ETF Shares, and 0.07% for Admiral
Shares.
5
Dividend Appreciation Index Fund
| | | |
| Sector Diversification (% of equity exposure) |
| | | NASDAQ | |
| | | US | |
| | | Dividend | DJ |
| | | Achievers | U.S. Total |
| | | Select | Market |
| | Fund | Index | FA Index |
| Basic Materials | 4.1% | 4.1% | 2.5% |
| Consumer Goods | 11.2 | 11.2 | 7.9 |
| Consumer Services | 19.2 | 19.2 | 13.2 |
| Financials | 8.5 | 8.5 | 19.9 |
| Health Care | 12.3 | 12.3 | 13.0 |
| Industrials | 32.4 | 32.4 | 13.0 |
| Oil & Gas | 0.0 | 0.0 | 6.0 |
| Technology | 9.1 | 9.1 | 19.9 |
| Telecommunications | 0.1 | 0.1 | 1.8 |
| Utilities | 3.1 | 3.1 | 2.8 |
Sector categories are based on the Industry Classification
Benchmark (“ICB”), except for the “Other” category (if applicable),
which includes securities that have not been provided an ICB
classification as of the effective reporting period.
6
Dividend Appreciation Index Fund
Performance Summary
All of the returns in this report represent past performance, which is not a guarantee of future results that may be achieved by the fund. (Current performance may be lower or higher than the performance data cited. For performance data current to the most recent month-end, visit our website at vanguard.com/performance.) Note, too, that both investment returns and principal value can fluctuate widely, so an investor’s shares, when sold, could be worth more or less than their original cost. The returns shown do not reflect taxes that a shareholder would pay on fund distributions or on the sale of fund shares.
Fiscal-Year Total Returns (%): January 31, 2008, Through July 31, 2018
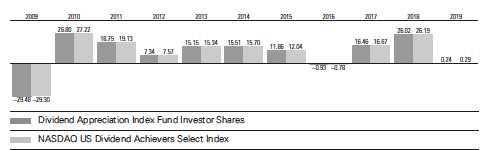
Note: For 2019, performance data reflect the six months ended July 31, 2018.
Average Annual Total Returns: Periods Ended June 30, 2018
This table presents returns through the latest calendar quarter—rather than through the end of the fiscal period.
Securities and Exchange Commission rules require that we provide this information.
| | | | |
| | Inception | One | Five | Ten |
| | Date | Year | Years | Years |
| Investor Shares | 4/27/2006 | 11.74% | 11.16% | 9.60% |
| ETF Shares | 4/21/2006 | | | |
| Market Price | | 11.78 | 11.26 | 9.72 |
| Net Asset Value | | 11.81 | 11.26 | 9.71 |
| Admiral Shares | 12/19/2013 | 11.82 | — | 9.621 |
| 1 Return since inception. |
See Financial Highlights for dividend and capital gains information.
7
Dividend Appreciation Index Fund
Financial Statements (unaudited)
Statement of Net Assets
As of July 31, 2018
The fund reports a complete list of its holdings in regulatory filings four times in each fiscal year, at the quarter-ends. For the second and fourth fiscal quarters, the lists appear in the fund’s semiannual and annual reports to shareholders. For the first and third fiscal quarters, the fund files the lists with the Securities and Exchange Commission on Form N-Q. Shareholders can look up the fund’s Forms N-Q on the SEC’s website at sec.gov. Forms N-Q may also be reviewed and copied at the SEC’s Public Reference Room (see the back cover of this report for further information).
| | |
| | | Market |
| | | Value• |
| | Shares | ($000) |
| Common Stocks (99.8%)1 | | |
| Basic Materials (4.1%) | | |
| Ecolab Inc. | 2,249,954 | 316,569 |
| Air Products & | | |
| Chemicals Inc. | 1,705,354 | 279,968 |
| PPG Industries Inc. | 1,946,378 | 215,386 |
| Nucor Corp. | 2,476,531 | 165,754 |
| Westlake Chemical | | |
| Corp. | 1,008,096 | 108,088 |
| International Flavors & | | |
| Fragrances Inc. | 614,735 | 81,612 |
| Albemarle Corp. | 861,698 | 81,172 |
| RPM International Inc. | 1,041,306 | 67,029 |
| Royal Gold Inc. | 509,861 | 43,139 |
| NewMarket Corp. | 91,778 | 37,578 |
| Sensient Technologies | | |
| Corp. | 336,067 | 23,310 |
| HB Fuller Co. | 393,728 | 22,316 |
| Quaker Chemical Corp. | 103,706 | 18,412 |
| Stepan Co. | 175,231 | 15,347 |
| Hawkins Inc. | 83,356 | 3,109 |
| | | 1,478,789 |
| Consumer Goods (11.2%) | | |
| PepsiCo Inc. | 11,059,895 | 1,271,888 |
| NIKE Inc. Class B | 10,109,405 | 777,514 |
| Colgate-Palmolive Co. | 6,818,040 | 456,877 |
| VF Corp. | 3,089,939 | 284,491 |
| Stanley Black & Decker | | |
| Inc. | 1,200,421 | 179,427 |
| Hormel Foods Corp. | 4,125,766 | 148,404 |
| Clorox Co. | 1,007,967 | 136,247 |
| Brown-Forman Corp. | | |
| Class B | 2,430,980 | 129,377 |
| McCormick & Co. Inc. | 943,281 | 110,873 |
| Church & Dwight Co. Inc. | 1,900,154 | 106,219 |
| JM Smucker Co. | 884,898 | 98,330 |
| Hasbro Inc. | 967,287 | 96,351 |
| Bunge Ltd. | 1,095,939 | 75,762 |
| | | |
| | Polaris Industries Inc. | 491,075 | 51,769 |
| | Columbia Sportswear | | |
| | Co. | 545,350 | 47,435 |
| | Lancaster Colony Corp. | 213,910 | 31,023 |
| | Nu Skin Enterprises Inc. | | |
| | Class A | 410,726 | 29,921 |
| | J&J Snack Foods Corp. | 145,430 | 21,081 |
| ^ | Tootsie Roll Industries | | |
| | Inc. | 305,244 | 9,127 |
| | Andersons Inc. | 219,975 | 7,754 |
| | | | 4,069,870 |
| Consumer Services (19.1%) | |
| | Walmart Inc. | 15,549,465 | 1,387,479 |
| | McDonald’s Corp. | 6,188,488 | 974,934 |
| | Costco Wholesale Corp. | 3,420,276 | 748,049 |
| | Lowe’s Cos. Inc. | 6,463,183 | 642,053 |
| | Walgreens Boots | | |
| | Alliance Inc. | 7,716,533 | 521,792 |
| | CVS Health Corp. | 7,902,407 | 512,550 |
| | TJX Cos. Inc. | 4,925,144 | 479,020 |
| | Sysco Corp. | 4,065,365 | 273,233 |
| | Ross Stores Inc. | 2,976,654 | 260,249 |
| | McKesson Corp. | 1,607,231 | 201,868 |
| | Kroger Co. | 6,865,145 | 199,089 |
| | Best Buy Co. Inc. | 2,277,027 | 170,845 |
| | AmerisourceBergen | | |
| | Corp. Class A | 1,711,069 | 140,017 |
| | Tiffany & Co. | 968,044 | 133,164 |
| | Rollins Inc. | 1,699,800 | 93,387 |
| | FactSet Research | | |
| | Systems Inc. | 302,855 | 60,983 |
| | Dun & Bradstreet Corp. | 288,256 | 36,289 |
| | Casey’s General Stores | | |
| | Inc. | 292,350 | 31,977 |
| | Aaron’s Inc. | 550,968 | 23,862 |
| | John Wiley & Sons Inc. | | |
| | Class A | 371,722 | 23,474 |
| | Monro Inc. | 255,257 | 17,217 |
8
Dividend Appreciation Index Fund
| | | | |
| | | | | Market |
| | | | | Value• |
| | | | Shares | ($000) |
| | Matthews International | | |
| | Corp. Class A | | 251,401 | 13,211 |
| | International Speedway | | |
| | Corp. Class A | | 190,892 | 8,266 |
| | | | | 6,953,008 |
| Financials (8.5%) | | | |
| | Chubb Ltd. | | 3,614,841 | 505,065 |
| | S&P Global Inc. | | 1,977,653 | 396,401 |
| | Aflac Inc. | | 6,070,508 | 282,521 |
| | Travelers Cos. Inc. | | 2,114,184 | 275,140 |
| | T. Rowe Price Group Inc. | 1,904,027 | 226,731 |
| | Ameriprise Financial Inc. | 1,139,823 | 166,038 |
| | Franklin Resources Inc. | 4,297,433 | 147,488 |
| | Cincinnati Financial Corp. | 1,277,478 | 96,616 |
| | Torchmark Corp. | | 888,737 | 78,271 |
| | American Financial | | | |
| | Group Inc. | | 688,792 | 77,620 |
| | SEI Investments Co. | 1,224,983 | 73,425 |
| | WR Berkley Corp. | | 946,854 | 71,781 |
| | Brown & Brown Inc. | 2,146,291 | 62,800 |
| | Commerce Bancshares | | |
| | Inc. | | 831,049 | 55,514 |
| | Cullen/Frost Bankers Inc. | 495,949 | 54,797 |
| | BOK Financial Corp. | 510,550 | 49,692 |
| | Eaton Vance Corp. | | 919,721 | 48,865 |
| | Erie Indemnity Co. | | | |
| | Class A | | 359,805 | 44,702 |
| | Hanover Insurance | | | |
| | Group Inc. | | 331,071 | 41,523 |
| | RenaissanceRe Holdings | | |
| | Ltd. | | 311,816 | 41,113 |
| * | Bank OZK | | 998,501 | 40,839 |
| | Prosperity Bancshares | | |
| | Inc. | | 544,188 | 38,175 |
| | Evercore Inc. Class A | 321,351 | 36,313 |
| | UMB Financial Corp. | 389,719 | 28,017 |
| | RLI Corp. | | 344,444 | 25,751 |
| | American Equity | | | |
| | Investment Life | | | |
| | Holding Co. | | 699,838 | 25,005 |
| | Community Bank | | | |
| | System Inc. | | 394,098 | 24,927 |
| | BancFirst Corp. | | 248,179 | 15,412 |
| | Westamerica | | | |
| | Bancorporation | | 206,879 | 12,417 |
| | 1st Source Corp. | | 202,278 | 11,441 |
| | Tompkins Financial Corp. | 118,401 | 10,145 |
| | Community Trust | | | |
| | Bancorp Inc. | | 138,248 | 6,750 |
| | Bank of Marin Bancorp | 54,186 | 4,814 |
| | | | | 3,076,109 |
| Health Care (12.3%) | | | |
| | Johnson & Johnson | 10,776,174 | 1,428,059 |
| | Medtronic plc | 10,542,631 | 951,262 |
| | |
| Abbott Laboratories | 13,602,511 | 891,508 |
| Becton Dickinson and | | |
| Co. | 2,073,812 | 519,220 |
| Stryker Corp. | 2,918,161 | 476,390 |
| Perrigo Co. plc | 1,096,903 | 88,323 |
| West Pharmaceutical | | |
| Services Inc. | 576,192 | 63,179 |
| Healthcare Services | | |
| Group Inc. | 573,665 | 23,096 |
| Ensign Group Inc. | 401,106 | 14,468 |
| Atrion Corp. | 14,436 | 9,932 |
| | | 4,465,437 |
| Industrials (32.4%) | | |
| 3M Co. | 4,638,451 | 984,836 |
| Union Pacific Corp. | 6,070,154 | 909,855 |
| United Technologies | | |
| Corp. | 6,229,618 | 845,608 |
| Accenture plc Class A | 4,803,329 | 765,314 |
| Lockheed Martin Corp. | 2,224,359 | 725,363 |
| Caterpillar Inc. | 4,655,020 | 669,392 |
| FedEx Corp. | 2,086,637 | 513,041 |
| CSX Corp. | 6,910,865 | 488,460 |
| Automatic Data | | |
| Processing Inc. | 3,452,710 | 466,081 |
| General Dynamics Corp. | 2,312,881 | 462,021 |
| Raytheon Co. | 2,247,232 | 445,019 |
| Northrop Grumman | | |
| Corp. | 1,355,999 | 407,464 |
| Illinois Tool Works Inc. | 2,660,369 | 381,311 |
| Emerson Electric Co. | 4,944,902 | 357,418 |
| Sherwin-Williams Co. | 732,136 | 322,674 |
| Waste Management Inc. | 3,378,001 | 304,020 |
| Roper Technologies Inc. | 800,947 | 241,806 |
| Republic Services Inc. | | |
| Class A | 2,579,936 | 186,994 |
| Cummins Inc. | 1,290,558 | 184,305 |
| Cintas Corp. | 829,482 | 169,612 |
| WW Grainger Inc. | 437,020 | 151,454 |
| L3 Technologies Inc. | 609,326 | 130,664 |
| Fastenal Co. | 2,240,604 | 127,558 |
| Expeditors International | | |
| of Washington Inc. | 1,375,141 | 104,744 |
| Broadridge Financial | | |
| Solutions Inc. | 908,669 | 102,661 |
| JB Hunt Transport | | |
| Services Inc. | 854,938 | 102,507 |
| CH Robinson | | |
| Worldwide Inc. | 1,088,580 | 100,400 |
| Dover Corp. | 1,202,906 | 99,817 |
| Jack Henry & | | |
| Associates Inc. | 601,730 | 81,053 |
| Robert Half | | |
| International Inc. | 968,017 | 73,337 |
| AO Smith Corp. | 1,133,234 | 67,461 |
9
Dividend Appreciation Index Fund
| | |
| | | Market |
| | | Value• |
| | Shares | ($000) |
| Graco Inc. | 1,320,043 | 60,907 |
| Nordson Corp. | 450,205 | 60,377 |
| Carlisle Cos. Inc. | 481,226 | 59,114 |
| Hubbell Inc. Class B | 427,032 | 52,632 |
| Toro Co. | 834,892 | 50,252 |
| AptarGroup Inc. | 483,834 | 49,559 |
| Donaldson Co. Inc. | 1,011,899 | 48,268 |
| Lincoln Electric Holdings | | |
| Inc. | 511,346 | 48,036 |
| ITT Inc. | 687,201 | 38,944 |
| Bemis Co. Inc. | 708,874 | 32,544 |
| Ryder System Inc. | 412,497 | 32,299 |
| HEICO Corp. | 410,983 | 31,387 |
| MSA Safety Inc. | 297,638 | 30,026 |
| MSC Industrial Direct Co. | |
| Inc. Class A | 350,821 | 29,690 |
| Regal Beloit Corp. | 345,077 | 29,659 |
| Silgan Holdings Inc. | 859,339 | 23,640 |
| Franklin Electric Co. Inc. | 363,068 | 17,954 |
| ABM Industries Inc. | 534,804 | 16,686 |
| Brady Corp. Class A | 375,807 | 14,375 |
| Badger Meter Inc. | 226,700 | 11,822 |
| Tennant Co. | 139,165 | 11,321 |
| McGrath RentCorp | 187,270 | 11,120 |
| Lindsay Corp. | 83,585 | 7,869 |
| Gorman-Rupp Co. | 203,175 | 7,688 |
| Cass Information | | |
| Systems Inc. | 95,700 | 6,445 |
| VSE Corp. | 84,559 | 3,645 |
| NACCO Industries Inc. | | |
| Class A | 40,805 | 1,347 |
| | | 11,759,856 |
| Technology (9.1%) | | |
| Microsoft Corp. | 14,925,922 | 1,583,342 |
| Texas Instruments Inc. | 7,662,884 | 853,032 |
| Analog Devices Inc. | 2,880,476 | 276,929 |
| Microchip Technology | | |
| Inc. | 1,825,367 | 170,544 |
| Harris Corp. | 924,834 | 152,551 |
| Xilinx Inc. | 1,984,834 | 143,047 |
| Maxim Integrated | | |
| Products Inc. | 2,190,459 | 133,925 |
| | | 3,313,370 |
| Telecommunications (0.1%) | |
| Telephone & Data | | |
| Systems Inc. | 808,807 | 20,422 |
| | | |
| Utilities (3.0%) | | |
| | NextEra Energy Inc. | 3,667,075 | 614,382 |
| | CMS Energy Corp. | 2,199,954 | 106,346 |
| | Atmos Energy Corp. | 864,474 | 79,419 |
| | UGI Corp. | 1,347,779 | 71,621 |
| | Aqua America Inc. | 1,384,338 | 51,137 |
| | Vectren Corp. | 646,832 | 46,229 |
| | New Jersey Resources | | |
| | Corp. | 682,078 | 31,546 |
| | Southwest Gas Holdings | | |
| | Inc. | 374,972 | 29,323 |
| | MGE Energy Inc. | 269,930 | 17,276 |
| | American States Water | | |
| | Co. | 285,862 | 17,186 |
| | California Water Service | | |
| | Group | 374,134 | 15,377 |
| | Chesapeake Utilities Corp. | 127,374 | 10,680 |
| | SJW Group | 160,145 | 10,358 |
| | Connecticut Water | | |
| | Service Inc. | 94,112 | 6,063 |
| | Middlesex Water Co. | 127,336 | 5,640 |
| | | | 1,112,583 |
| Total Common Stocks | | |
| (Cost $27,205,662) | | 36,249,444 |
| Temporary Cash Investments (0.1%)1 | |
| Money Market Fund (0.1%) | | |
| 2,3 | Vanguard Market | | |
| | Liquidity Fund, 2.145% | 230,912 | 23,091 |
| |
| | | Face | |
| | | Amount | |
| | | ($000) |
| U. S. Government and Agency Obligations (0.0%) |
| 4 | United States Treasury | | |
| | Bill, 2.078%, 11/15/18 | 1,000 | 994 |
| 4 | United States Treasury | | |
| | Bill, 2.078%, 01/03/19 | 1,000 | 991 |
| | | | 1,985 |
| Total Temporary Cash Investments | |
| (Cost $25,078) | | 25,076 |
| Total Investments (99.9%) | | |
| (Cost $27,230,740) | | 36,274,520 |
10
Dividend Appreciation Index Fund
| |
| | Amount |
| | ($000) |
| Other Assets and Liabilities (0.1%) | |
| Other Assets | |
| Investment in Vanguard | 1,837 |
| Receivables for Accrued Income | 34,066 |
| Receivables for Capital Shares Issued | 5,882 |
| Variation Margin Receivable— | |
| Futures Contracts | 194 |
| Other Assets | 1 |
| Total Other Assets | 41,980 |
| Liabilities | |
| Payables for Investment Securities | |
| Purchased | (8,020) |
| Collateral for Securities on Loan | (3,658) |
| Payables for Capital Shares Redeemed | (4,225) |
| Payables to Vanguard | (8,786) |
| Total Liabilities | (24,689) |
| Net Assets (100%) | 36,291,811 |
| |
| At July 31, 2018, net assets consisted of: |
| | Amount |
| | ($000) |
| Paid-in Capital | 27,573,395 |
| Undistributed Net Investment Income | 39,343 |
| Accumulated Net Realized Gains | (366,002) |
| Unrealized Appreciation (Depreciation) | |
| Investment Securities | 9,043,780 |
| Futures Contracts | 1,295 |
| Net Assets | 36,291,811 |
| |
| |
| Investor Shares—Net Assets | |
| Applicable to 26,114,651 outstanding | |
| $.001 par value shares of beneficial | |
| interest (unlimited authorization) | 1,111,469 |
| Net Asset Value Per Share— | |
| Investor Shares | $42.56 |
| |
| | Amount |
| | ($000) |
| ETF Shares—Net Assets | |
| Applicable to 271,499,543 outstanding |
| $.001 par value shares of beneficial | |
| interest (unlimited authorization) | 28,880,933 |
| Net Asset Value Per Share— | |
| ETF Shares | $106.38 |
| |
| |
| Admiral Shares—Net Assets | |
| Applicable to 218,210,811 outstanding |
| $.001 par value shares of beneficial | |
| interest (unlimited authorization) | 6,299,409 |
| Net Asset Value Per Share— | |
| Admiral Shares | $28.87 |
• See Note A in Notes to Financial Statements.
^ Includes partial security positions on loan to broker-dealers.
The total value of securities on loan is $3,528,000.
* Non-income-producing security.
1 The fund invests a portion of its cash reserves in equity
markets through the use of index futures contracts. After
giving effect to futures investments, the fund’s effective
common stock and temporary cash investment positions
represent 99.9% and 0.0%, respectively, of net assets.
2 Affiliated money market fund available only to Vanguard funds
and certain trusts and accounts managed by Vanguard. Rate
shown is the 7-day yield.
3 Includes $3,658,000 of collateral received for securities
on loan.
4 Securities with a value of $1,787,000 have been segregated as
initial margin for open futures contracts.
11
Dividend Appreciation Index Fund
| | | | |
| Derivative Financial Instruments Outstanding as of Period End | | |
| |
| Futures Contracts | | | | |
| | | | | ($000) |
| | | | | Value and |
| | | Number of | | Unrealized |
| | | Long (Short) | Notional | Appreciation |
| | Expiration | Contracts | Amount | (Depreciation) |
| Long Futures Contracts | | | | |
| E-mini S&P 500 Index | September 2018 | 279 | 39,299 | 1,295 |
Unrealized appreciation (depreciation) on open futures contracts is required to be treated as realized gain (loss) for tax purposes.
See accompanying Notes, which are an integral part of the Financial Statements.
12
Dividend Appreciation Index Fund
Statement of Operations
| |
| | Six Months Ended |
| | July31,2018 |
| | ($000) |
| Investment Income | |
| Income | |
| Dividends | 352,815 |
| Interest1 | 234 |
| Securities Lending—Net | 85 |
| Total Income | 353,134 |
| Expenses | |
| The Vanguard Group—Note B | |
| Investment Advisory Services | 1,388 |
| Management and Administrative—Investor Shares | 595 |
| Management and Administrative—ETF Shares | 7,444 |
| Management and Administrative—Admiral Shares | 1,533 |
| Marketing and Distribution—Investor Shares | 95 |
| Marketing and Distribution—ETF Shares | 392 |
| Marketing and Distribution—Admiral Shares | 174 |
| Custodian Fees | 161 |
| Shareholders’ Reports—Investor Shares | 15 |
| Shareholders’ Reports—ETF Shares | 299 |
| Shareholders’ Reports—Admiral Shares | 22 |
| Trustees’ Fees and Expenses | 10 |
| Total Expenses | 12,128 |
| Net Investment Income | 341,006 |
| Realized Net Gain (Loss) | |
| Investment Securities Sold1 | 1,252,102 |
| Futures Contracts | 1,830 |
| Realized Net Gain (Loss) | 1,253,932 |
| Change in Unrealized Appreciation (Depreciation) | |
| Investment Securities1 | (1,505,562) |
| Futures Contracts | (87) |
| Change in Unrealized Appreciation (Depreciation) | (1,505,649) |
| Net Increase (Decrease) in Net Assets Resulting from Operations | 89,289 |
| 1 Interest income, realized net gain (loss), and change in unrealized appreciation (depreciation) from an affiliated company of the fund |
| were $214,000, ($4,000), and ($2,000), respectively. Purchases and sales are for temporary cash investment purposes. |
See accompanying Notes, which are an integral part of the Financial Statements.
13
Dividend Appreciation Index Fund
Statement of Changes in Net Assets
| | |
| | Six Months Ended | Year Ended |
| | July 31, | January 31, |
| | 2018 | 2018 |
| | ($000) | ($000) |
| Increase (Decrease) in Net Assets | | |
| Operations | | |
| Net Investment Income | 341,006 | 640,397 |
| Realized Net Gain (Loss) | 1,253,932 | 1,365,695 |
| Change in Unrealized Appreciation (Depreciation) | (1,505,649) | 5,380,269 |
| Net Increase (Decrease) in Net Assets Resulting from Operations | 89,289 | 7,386,361 |
| Distributions | | |
| Net Investment Income | | |
| Investor Shares | (9,776) | (20,628) |
| ETF Shares | (260,162) | (510,111) |
| Admiral Shares | (55,727) | (100,830) |
| Realized Capital Gain | | |
| Investor Shares | — | — |
| ETF Shares | — | — |
| Admiral Shares | — | — |
| Total Distributions | (325,665) | (631,569) |
| Capital Share Transactions | | |
| Investor Shares | (24,028) | (75,461) |
| ETF Shares | 364,151 | 579,800 |
| Admiral Shares | 313,554 | 629,958 |
| Net Increase (Decrease) from Capital Share Transactions | 653,677 | 1,134,297 |
| Total Increase (Decrease) | 417,301 | 7,889,089 |
| Net Assets | | |
| Beginning of Period | 35,874,510 | 27,985,421 |
| End of Period1 | 36,291,811 | 35,874,510 |
| 1 Net Assets—End of Period includes undistributed (overdistributed) net investment income of $39,343,000 and $24,002,000. |
See accompanying Notes, which are an integral part of the Financial Statements.
14
Dividend Appreciation Index Fund
Financial Highlights
| | | | | | |
| Investor Shares | | | | | | |
| Six Months | | | | | |
| | Ended | | | | | |
| For a Share Outstanding | July 31, | Year Ended January 31, |
| Throughout Each Period | 2018 | 2018 | 2017 | 2016 | 2015 | 2014 |
| Net Asset Value, Beginning of Period | $42.85 | $34.67 | $30.40 | $31.37 | $28.59 | $25.23 |
| Investment Operations | | | | | | |
| Net Investment Income | . 3891 | .7561 | .694 | .670 | .627 | . 540 |
| Net Realized and Unrealized Gain (Loss) | | | | | | |
| on Investments | (.308) | 8.165 | 4.275 | (.947) | 2.756 | 3.350 |
| Total from Investment Operations | .081 | 8.921 | 4.969 | (.277) | 3.383 | 3.890 |
| Distributions | | | | | | |
| Dividends from Net Investment Income | (. 371) | (.741) | (. 699) | (. 693) | (. 603) | (. 530) |
| Distributions from Realized Capital Gains | — | — | — | — | — | — |
| Total Distributions | (. 371) | (.741) | (. 699) | (. 693) | (. 603) | (. 530) |
| Net Asset Value, End of Period | $42.56 | $42.85 | $34.67 | $30.40 | $31.37 | $28.59 |
| |
| Total Return2 | 0.24% | 26.02% | 16.46% | -0.93% | 11.86% | 15.51% |
| |
| Ratios/Supplemental Data | | | | | | |
| Net Assets, End of Period (Millions) | $1,111 | $1,144 | $994 | $875 | $1,450 | $2,966 |
| Ratio of Total Expenses to | | | | | | |
| Average Net Assets | 0.14% | 0.15% | 0.17% | 0.19% | 0.20% | 0.20% |
| Ratio of Net Investment Income to | | | | | | |
| Average Net Assets | 1.91% | 1.99% | 2.11% | 2.11% | 2.04% | 1.98% |
| Portfolio Turnover Rate 3 | 20% | 14% | 19% | 22% | 20% | 3% |
The expense ratio, net investment income ratio, and turnover rate for the current period have been annualized.
1 Calculated based on average shares outstanding.
2 Total returns do not include account service fees that may have applied in the periods shown. Fund prospectuses provide information
about any applicable account service fees.
3 Excludes the value of portfolio securities received or delivered as a result of in-kind purchases or redemptions of the fund’s capital
shares, including ETF Creation Units.
See accompanying Notes, which are an integral part of the Financial Statements.
15
Dividend Appreciation Index Fund
Financial Highlights
| | | | | | |
| ETF Shares | | | | | | |
| Six Months | | | | | |
| | Ended | | | | | |
| For a Share Outstanding | July 31, | Year Ended January 31, |
| Throughout Each Period | 2018 | 2018 | 2017 | 2016 | 2015 | 2014 |
| Net Asset Value, Beginning of Period | $107.10 | $86.66 | $75.98 | $78.42 | $71.47 | $63.08 |
| Investment Operations | | | | | | |
| Net Investment Income | 1.0081 | 1.9511 | 1.810 | 1.759 | 1.645 | 1.421 |
| Net Realized and Unrealized Gain (Loss) | | | | | | |
| on Investments | (.766) | 20.408 | 10.696 | (2.380) | 6.890 | 8.357 |
| Total from Investment Operations | .242 | 22.359 | 12.506 | (.621) | 8.535 | 9.778 |
| Distributions | | | | | | |
| Dividends from Net Investment Income | (.962) | (1.919) | (1.826) | (1.819) | (1.585) | (1.388) |
| Distributions from Realized Capital Gains | — | — | — | — | — | — |
| Total Distributions | (.962) | (1.919) | (1.826) | (1.819) | (1.585) | (1.388) |
| Net Asset Value, End of Period | $106.38 | $107.10 | $86.66 | $75.98 | $78.42 | $71.47 |
| |
| Total Return | 0.27% | 26.10% | 16.59% | -0.84% | 11.97% | 15.60% |
| |
| Ratios/Supplemental Data | | | | | | |
| Net Assets, End of Period (Millions) | $28,881 | $28,717 | $22,698 | $18,771 | $20,610 | $18,511 |
| Ratio of Total Expenses to | | | | | | |
| Average Net Assets | 0.07% | 0.08% | 0.08% | 0.09% | 0.10% | 0.10% |
| Ratio of Net Investment Income to | | | | | | |
| Average Net Assets | 1.98% | 2.06% | 2.20% | 2.21% | 2.14% | 2.08% |
| Portfolio Turnover Rate2 | 20% | 14% | 19% | 22% | 20% | 3% |
The expense ratio, net investment income ratio, and turnover rate for the current period have been annualized.
1 Calculated based on average shares outstanding.
2 Excludes the value of portfolio securities received or delivered as a result of in-kind purchases or redemptions of the fund’s capital
shares, including ETF Creation Units.
See accompanying Notes, which are an integral part of the Financial Statements.
16
Dividend Appreciation Index Fund
Financial Highlights
| | | | | | |
| Admiral Shares | | | | | | |
| Six Months | | | | | Dec. 19, |
| | Ended | | | | | 20131 to |
| | | Year Ended January 31, | |
| For a Share Outstanding | July 31, | | | | | Jan. 31, |
| Throughout Each Period | 2018 | 2018 | 2017 | 2016 | 2015 | 2014 |
| Net Asset Value, Beginning of Period | $29.07 | $23.52 | $20.62 | $21.28 | $19.40 | $20.00 |
| Investment Operations | | | | | | |
| Net Investment Income | . 274 2 | .528 2 | .492 | .478 | .445 | . 030 |
| Net Realized and Unrealized Gain (Loss) | | | | | | |
| on Investments | (.212) | 5.542 | 2.903 | (.644) | 1.865 | (.630) |
| Total from Investment Operations | .062 | 6.070 | 3.395 | (.166) | 2.310 | (.600) |
| Distributions | | | | | | |
| Dividends from Net Investment Income | (. 262) | (. 520) | (. 495) | (. 494) | (. 430) | — |
| Distributions from Realized Capital Gains | — | — | — | — | — | — |
| Total Distributions | (. 262) | (. 520) | (. 495) | (. 494) | (. 430) | — |
| Net Asset Value, End of Period | $28.87 | $29.07 | $23.52 | $20.62 | $21.28 | $19.40 |
| |
| Total Return3 | 0.27% | 26.11% | 16.58% | -0.83% | 11.94% | -3.00% |
| |
| Ratios/Supplemental Data | | | | | | |
| Net Assets, End of Period (Millions) | $6,299 | $6,014 | $4,294 | $3,215 | $2,776 | $760 |
| Ratio of Total Expenses to | | | | | | |
| Average Net Assets | 0.07% | 0.08% | 0.08% | 0.09% | 0.10% | 0.10%4 |
| Ratio of Net Investment Income to | | | | | | |
| Average Net Assets | 1.98% | 2.06% | 2.20% | 2.21% | 2.14% | 2.08%4 |
| Portfolio Turnover Rate 5 | 20% | 14% | 19% | 22% | 20% | 3% |
The expense ratio, net investment income ratio, and turnover rate for the current period have been annualized.
1 Inception.
2 Calculated based on average shares outstanding.
3 Total returns do not include account service fees that may have applied in the periods shown. Fund prospectuses provide information
about any applicable account service fees.
4 Annualized.
5 Excludes the value of portfolio securities received or delivered as a result of in-kind purchases or redemptions of the fund’s capital
shares, including ETF Creation Units.
See accompanying Notes, which are an integral part of the Financial Statements.
17
Dividend Appreciation Index Fund
Notes to Financial Statements
Vanguard Dividend Appreciation Index Fund is registered under the Investment Company Act of 1940 as an open-end investment company, or mutual fund. The fund offers three classes of shares: Investor Shares, ETF Shares, and Admiral Shares. Investor Shares are available to any investor who meets the fund’s minimum purchase requirements. ETF Shares are listed for trading on NYSE Arca; they can be purchased and sold through a broker. Admiral Shares are designed for investors who meet certain administrative, service, and account-size criteria.
A. The following significant accounting policies conform to generally accepted accounting principles for U.S. investment companies. The fund consistently follows such policies in preparing its financial statements.
1. Security Valuation: Securities are valued as of the close of trading on the New York Stock Exchange (generally 4 p.m., Eastern time) on the valuation date. Equity securities are valued at the latest quoted sales prices or official closing prices taken from the primary market in which each security trades; such securities not traded on the valuation date are valued at the mean of the latest quoted bid and asked prices. Securities for which market quotations are not readily available, or whose values have been materially affected by events occurring before the fund’s pricing time but after the close of the securities’ primary markets, are valued by methods deemed by the board of trustees to represent fair value. Investments in Vanguard Market Liquidity Fund are valued at that fund’s net asset value. Temporary cash investments are valued using the latest bid prices or using valuations based on a matrix system (which considers such factors as security prices, yields, maturities, and ratings), both as furnished by independent pricing services.
2. Futures Contracts: The fund uses index futures contracts to a limited extent, with the objectives of maintaining full exposure to the stock market, maintaining liquidity, and minimizing transaction costs. The fund may purchase futures contracts to immediately invest incoming cash in the market, or sell futures in response to cash outflows, thereby simulating a fully invested position in the underlying index while maintaining a cash balance for liquidity. The primary risks associated with the use of futures contracts are imperfect correlation between changes in market values of stocks held by the fund and the prices of futures contracts, and the possibility of an illiquid market. Counterparty risk involving futures is mitigated because a regulated clearinghouse is the counterparty instead of the clearing broker. To further mitigate counterparty risk, the fund trades futures contracts on an exchange, monitors the financial strength of its clearing brokers and clearinghouse, and has entered into clearing agreements with its clearing brokers. The clearinghouse imposes initial margin requirements to secure the fund’s performance and requires daily settlement of variation margin representing changes in the market value of each contract. Any assets pledged as initial margin for open contracts are noted in the Statement of Net Assets.
Futures contracts are valued at their quoted daily settlement prices. The notional amounts of the contracts are not recorded in the Statement of Net Assets. Fluctuations in the value of the contracts are recorded in the Statement of Net Assets as an asset (liability) and in the Statement of Operations as unrealized appreciation (depreciation) until the contracts are closed, when they are recorded as realized futures gains (losses).
During the six months ended July 31, 2018, the fund’s average investments in long and short futures contracts represented less than 1% and 0% of net assets, respectively, based on the average of the notional amounts at each quarter-end during the period.
18
Dividend Appreciation Index Fund
3. Federal Income Taxes: The fund intends to continue to qualify as a regulated investment company and distribute all of its taxable income. Management has analyzed the fund’s tax positions taken for all open federal income tax years (January 31, 2015–2018), and for the period ended July 31, 2018, and has concluded that no provision for federal income tax is required in the fund’s financial statements.
4. Distributions: Distributions to shareholders are recorded on the ex-dividend date.
5. Securities Lending: To earn additional income, the fund lends its securities to qualified institutional borrowers. Security loans are subject to termination by the fund at any time, and are required to be secured at all times by collateral in an amount at least equal to the market value of securities loaned. Daily market fluctuations could cause the value of loaned securities to be more or less than the value of the collateral received. When this occurs, the collateral is adjusted and settled before the opening of the market on the next business day. The fund further mitigates its counterparty risk by entering into securities lending transactions only with a diverse group of prequalified counterparties, monitoring their financial strength, and entering into master securities lending agreements with its counterparties. The master securities lending agreements provide that, in the event of a counterparty’s default (including bankruptcy), the fund may terminate any loans with that borrower, determine the net amount owed, and sell or retain the collateral up to the net amount owed to the fund; however, such actions may be subject to legal proceedings. While collateral mitigates counterparty risk, in the event of a default, the fund may experience delays and costs in recovering the securities loaned. The fund invests cash collateral received in Vanguard Market Liquidity Fund, and records a liability in the Statement of Net Assets for the return of the collateral, during the period the securities are on loan. Securities lending income represents fees charged to borrowers plus income earned on invested cash collateral, less expenses associated with the loan. During the term of the loan, the fund is entitled to all distributions made on or in respect of the loaned securities.
6. Credit Facility: The fund and certain other funds managed by The Vanguard Group (“Vanguard”) participate in a $3.1 billion committed credit facility provided by a syndicate of lenders pursuant to a credit agreement that may be renewed annually; each fund is individually liable for its borrowings, if any, under the credit facility. Borrowings may be utilized for temporary and emergency purposes, and are subject to the fund’s regulatory and contractual borrowing restrictions. The participating funds are charged administrative fees and an annual commitment fee of 0.10% of the undrawn amount of the facility; these fees are allocated to the funds based on a method approved by the fund’s board of trustees and included in Management and Administrative expenses on the fund’s Statement of Operations. Any borrowings under this facility bear interest at a rate based upon the higher of the one-month London Interbank Offered Rate, federal funds effective rate, or overnight bank funding rate plus an agreed-upon spread.
The fund had no borrowings outstanding at July 31, 2018, or at any time during the period then ended.
7. Other: Dividend income is recorded on the ex-dividend date. Interest income includes income distributions received from Vanguard Market Liquidity Fund and is accrued daily. Premiums and discounts on debt securities purchased are amortized and accreted, respectively, to interest income over the lives of the respective securities. Security transactions are accounted for on the date securities are bought or sold. Costs used to determine realized gains (losses) on the sale of investment securities are those of the specific securities sold.
19
Dividend Appreciation Index Fund
Each class of shares has equal rights as to assets and earnings, except that each class separately bears certain class-specific expenses related to maintenance of shareholder accounts (included in Management and Administrative expenses), shareholder reporting, and the proxy. Marketing and distribution expenses are allocated to each class of shares based on a method approved by the board of trustees. Income, other non-class-specific expenses, and gains and losses on investments are allocated to each class of shares based on its relative net assets.
B. In accordance with the terms of a Funds’ Service Agreement (the “FSA”) between Vanguard and the fund, Vanguard furnishes to the fund investment advisory, corporate management, administrative, marketing, and distribution services at Vanguard’s cost of operations (as defined by the FSA). These costs of operations are allocated to the fund based on methods and guidelines approved by the board of trustees. Vanguard does not require reimbursement in the current period for certain costs of operations (such as deferred compensation/benefits and risk/insurance costs); the fund’s liability for these costs of operations is included in Payables to Vanguard on the Statement of Net Assets. All other costs of operations payable to Vanguard are generally settled twice a month.
Upon the request of Vanguard, the fund may invest up to 0.40% of its net assets as capital in Vanguard. At July 31, 2018, the fund had contributed to Vanguard capital in the amount of $1,837,000, representing 0.01% of the fund’s net assets and 0.73% of Vanguard’s capitalization. The fund’s trustees and officers are also directors and employees, respectively, of Vanguard.
C. Various inputs may be used to determine the value of the fund’s investments. These inputs are summarized in three broad levels for financial statement purposes. The inputs or methodologies used to value securities are not necessarily an indication of the risk associated with investing in those securities.
Level 1—Quoted prices in active markets for identical securities.
Level 2—Other significant observable inputs (including quoted prices for similar securities, interest rates, prepayment speeds, credit risk, etc.).
Level 3—Significant unobservable inputs (including the fund’s own assumptions used to determine
the fair value of investments). Any investments valued with significant unobservable inputs are
noted on the Statement of Net Assets.
The following table summarizes the market value of the fund’s investments as of July 31, 2018, based on the inputs used to value them:
| | | |
| | Level 1 | Level 2 | Level 3 |
| Investments | ($000) | ($000) | ($000) |
| Common Stocks | 36,249,444 | — | — |
| Temporary Cash Investments | 23,091 | 1,985 | — |
| Futures Contracts—Assets1 | 194 | — | — |
| Total | 36,272,729 | 1,985 | — |
| 1 Represents variation margin on the last day of the reporting period. | | | |
20
Dividend Appreciation Index Fund
D. Distributions are determined on a tax basis and may differ from net investment income and realized capital gains for financial reporting purposes. Differences may be permanent or temporary. Permanent differences are reclassified among capital accounts in the financial statements to reflect their tax character. Temporary differences arise when certain items of income, expense, gain, or loss are recognized in different periods for financial statement and tax purposes. These differences will reverse at some time in the future. Differences in classification may also result from the treatment of short-term gains as ordinary income for tax purposes.
During the six months ended July 31, 2018, the fund realized $1,271,074,000 of net capital gains resulting from in-kind redemptions—in which shareholders exchanged fund shares for securities held by the fund rather than for cash. Because such gains are not taxable to the fund, and are not distributed to shareholders, they have been reclassified from accumulated net realized gains to paid-in capital.
The fund’s tax-basis capital gains and losses are determined only at the end of each fiscal year. For tax purposes, at January 31, 2018, the fund had available capital losses totaling $347,478,000 to offset future net capital gains. Of this amount, $11,128,000 is subject to expiration on January 31, 2019. Capital losses of $336,350,000 realized beginning in fiscal 2012 may be carried forward indefinitely under the Regulated Investment Company Modernization Act of 2010, but must be used before any expiring loss carryforwards. The fund will use these capital losses to offset net taxable capital gains, if any, realized during the year ending January 31, 2019; should the fund realize net capital losses for the year, the losses will be added to the loss carryforward balance above.
At July 31, 2018, the cost of investment securities for tax purposes was $27,230,740,000. Net unrealized appreciation of investment securities for tax purposes was $9,043,780,000, consisting of unrealized gains of $9,457,254,000 on securities that had risen in value since their purchase and $413,474,000 in unrealized losses on securities that had fallen in value since their purchase.
E. During the six months ended July 31, 2018, the fund purchased $9,294,911,000 of investment securities and sold $8,618,403,000 of investment securities, other than temporary cash investments. Purchases and sales include $3,267,043,000 and $3,092,235,000, respectively, in connection with in-kind purchases and redemptions of the fund’s capital shares.
21
Dividend Appreciation Index Fund
F. Capital share transactions for each class of shares were:
| | | | |
| | Six Months Ended | Year Ended |
| | July 31, 2018 | January 31, 2018 |
| | Amount | Shares | Amount | Shares |
| | ($000) | (000) | ($000) | (000) |
| Investor Shares | | | | |
| Issued | 110,174 | 2,688 | 289,695 | 7,648 |
| Issued in Lieu of Cash Distributions | 8,900 | 222 | 18,908 | 498 |
| Redeemed | (143,102) | (3,484) | (384,064) | (10,128) |
| Net Increase (Decrease)—Investor Shares | (24,028) | (574) | (75,461) | (1,982) |
| ETF Shares | | | | |
| Issued | 3,457,931 | 33,328 | 4,404,813 | 47,483 |
| Issued in Lieu of Cash Distributions | — | — | — | — |
| Redeemed | (3,093,780) | (29,950) | (3,825,013) | (41,275) |
| Net Increase (Decrease)—ETF Shares | 364,151 | 3,378 | 579,800 | 6,208 |
| Admiral Shares | | | | |
| Issued | 744,638 | 26,780 | 1,640,606 | 63,331 |
| Issued in Lieu of Cash Distributions | 48,739 | 1,794 | 89,401 | 3,462 |
| Redeemed | (479,823) | (17,261) | (1,100,049) | (42,478) |
| Net Increase (Decrease)—Admiral Shares | 313,554 | 11,313 | 629,958 | 24,315 |
G. Management has determined that no material events or transactions occurred subsequent to July 31, 2018, that would require recognition or disclosure in these financial statements.
22
About Your Fund’s Expenses
As a shareholder of the fund, you incur ongoing costs, which include costs for portfolio management, administrative services, and shareholder reports (like this one), among others. Operating expenses, which are deducted from a fund’s gross income, directly reduce the investment return of the fund.
A fund’s expenses are expressed as a percentage of its average net assets. This figure is known as the expense ratio. The following examples are intended to help you understand the ongoing costs (in dollars) of investing in your fund and to compare these costs with those of other mutual funds. The examples are based on an investment of $1,000 made at the beginning of the period shown and held for the entire period.
The accompanying table illustrates your fund’s costs in two ways:
• Based on actual fund return. This section helps you to estimate the actual expenses that you paid over the period. The ”Ending Account Value“ shown is derived from the fund‘s actual return, and the third column shows the dollar amount that would have been paid by an investor who started with $1,000 in the fund. You may use the information here, together with the amount you invested, to estimate the expenses that you paid over the period.
To do so, simply divide your account value by $1,000 (for example, an $8,600 account value divided by $1,000 = 8.6), then multiply the result by the number given for your fund under the heading ”Expenses Paid During Period.“
• Based on hypothetical 5% yearly return. This section is intended to help you compare your fund‘s costs with those of other mutual funds. It assumes that the fund had a yearly return of 5% before expenses, but that the expense ratio is unchanged. In this case—because the return used is not the fund’s actual return—the results do not apply to your investment. The example is useful in making comparisons because the Securities and Exchange Commission requires all mutual funds to calculate expenses based on a 5% return. You can assess your fund’s costs by comparing this hypothetical example with the hypothetical examples that appear in shareholder reports of other funds.
Note that the expenses shown in the table are meant to highlight and help you compare ongoing costs only and do not reflect transaction costs incurred by the fund for buying and selling securities. Further, the expenses do not include any purchase, redemption, or account service fees described in the fund prospectus. If such fees were applied to your account, your costs would be higher. Your fund does not carry a “sales load.”
The calculations assume no shares were bought or sold during the period. Your actual costs may have been higher or lower, depending on the amount of your investment and the timing of any purchases or redemptions.
You can find more information about the fund’s expenses, including annual expense ratios, in the Financial Statements section of this report. For additional information on operating expenses and other shareholder costs, please refer to your fund’s current prospectus.
23
| | | |
| Six Months Ended July 31, 2018 | | | |
| | Beginning | Ending | Expenses |
| | Account Value | Account Value | Paid During |
| Dividend Appreciation Index Fund | 1/31/2018 | 7/31/2018 | Period |
| Based on Actual Fund Return | | | |
| Investor Shares | $1,000.00 | $1,002.44 | $0.70 |
| ETF Shares | 1,000.00 | 1,002.74 | 0.35 |
| Admiral Shares | 1,000.00 | 1,002.71 | 0.35 |
| Based on Hypothetical 5% Yearly Return | | | |
| Investor Shares | $1,000.00 | $1,024.10 | $0.70 |
| ETF Shares | 1,000.00 | 1,024.45 | 0.35 |
| Admiral Shares | 1,000.00 | 1,024.45 | 0.35 |
The calculations are based on expenses incurred in the most recent six-month period. The fund’s annualized six-month expense ratios for
that period are 0.14% for Investor Shares, 0.07% for ETF Shares, and 0.07% for Admiral Shares. The dollar amounts shown as “Expenses
Paid” are equal to the annualized expense ratio multiplied by the average account value over the period, multiplied by the number of days
in the most recent six-month period, then divided by the number of days in the most recent 12-month period (181/365).
24
Trustees Approve Advisory Arrangement
The board of trustees of Vanguard Dividend Appreciation Index Fund has renewed the fund’s investment advisory arrangement with The Vanguard Group, Inc. (Vanguard), through its Equity Index Group. The board determined that continuing the fund’s internalized management structure was in the best interests of the fund and its shareholders.
The board based its decision upon an evaluation of the advisor’s investment staff, portfolio management process, and performance. This evaluation included information provided to the board by Vanguard’s Portfolio Review Department, which is responsible for fund and advisor oversight and product management. The Portfolio Review Department met regularly with the advisor and made monthly presentations to the board during the fiscal year that directed the board’s focus to relevant information and topics.
The board, or an investment committee made up of board members, also received information throughout the year during advisor presentations. For each advisor presentation, the board was provided with letters and reports that included information about, among other things, the advisory firm and the advisor’s assessment of the investment environment, portfolio performance, and portfolio characteristics.
In addition, the board received monthly reports, which included a Market and Economic Report, a Fund Dashboard Monthly Summary, and a Fund Performance Report.
Prior to their meeting, the trustees were provided with a memo and materials that summarized the information they received over the course of the year. They also considered the factors discussed below, among others. However, no single factor determined whether the board approved the arrangement. Rather, it was the totality of the circumstances that drove the board’s decision.
Nature, extent, and quality of services
The board reviewed the quality of the fund’s investment management services over both the short and long term and took into account the organizational depth and stability of the advisor. The board considered that Vanguard has been managing investments for more than four decades. The Equity Index Group adheres to a sound, disciplined investment management process; the team has considerable experience, stability, and depth.
The board concluded that Vanguard’s experience, stability, depth, and performance, among other factors, warranted continuation of the advisory arrangement.
Investment performance
The board considered the short- and long-term performance of the fund, including any periods of outperformance or underperformance compared with its target index and peer group. The board concluded that the performance was such that the advisory arrangement should continue. Information about the fund’s most recent performance can be found in the Performance Summary section of this report.
Cost
The board concluded that the fund’s expense ratio was well below the average expense ratio charged by funds in its peer group and that the fund’s advisory expenses were also well below the peer-group average. Information about the fund’s expenses appears in the About Your Fund’s Expenses section of this report as well as in the Financial Statements section.
25
The board does not conduct a profitability analysis of Vanguard because of Vanguard’s unique “at-cost” structure. Unlike most other mutual fund management companies, Vanguard is owned by the funds it oversees and produces “profits” only in the form of reduced expenses for fund shareholders.
The benefit of economies of scale
The board concluded that the fund’s at-cost arrangement with Vanguard ensures that the fund will realize economies of scale as it grows, with the cost to shareholders declining as the fund’s assets increase.
The board will consider whether to renew the advisory arrangement again after a one-year period.
26
Glossary
30-Day SEC Yield. A fund’s 30-day SEC yield is derived using a formula specified by the U.S. Securities and Exchange Commission. Under the formula, data related to the fund’s security holdings in the previous 30 days are used to calculate the fund’s hypothetical net income for that period, which is then annualized and divided by the fund’s estimated average net assets over the calculation period. For the purposes of this calculation, a security’s income is based on its current market yield to maturity (for bonds), its actual income (for asset-backed securities), or its projected dividend yield (for stocks). Because the SEC yield represents hypothetical annualized income, it will differ—at times significantly—from the fund’s actual experience. As a result, the fund’s income distributions may be higher or lower than implied by the SEC yield.
Beta. A measure of the magnitude of a fund’s past share-price fluctuations in relation to the ups and downs of a given market index. The index is assigned a beta of 1.00. Compared with a given index, a fund with a beta of 1.20 typically would have seen its share price rise or fall by 12% when the index rose or fell by 10%. For this report, beta is based on returns over the past 36 months for both the fund and the index. Note that a fund’s beta should be reviewed in conjunction with its R-squared (see definition). The lower the R-squared, the less correlation there is between the fund and the index, and the less reliable beta is as an indicator of volatility.
Dividend Yield. Dividend income earned by stocks, expressed as a percentage of the aggregate market value (or of net asset value, for a fund). The yield is determined by dividing the amount of the annual dividends by the aggregate value (or net asset value) at the end of the period. For a fund, the dividend yield is based solely on stock holdings and does not include any income produced by other investments.
Earnings Growth Rate. The average annual rate of growth in earnings over the past five years for the stocks now in a fund.
Equity Exposure. A measure that reflects a fund’s investments in stocks and stock futures. Any holdings in short-term reserves are excluded.
Expense Ratio. A fund’s total annual operating expenses expressed as a percentage of the fund’s average net assets. The expense ratio includes management and administrative expenses, but does not include the transaction costs of buying and selling portfolio securities.
Foreign Holdings. The percentage of a fund represented by securities or depositary receipts of companies based outside the United States.
Inception Date. The date on which the assets of a fund (or one of its share classes) are first invested in accordance with the fund’s investment objective. For funds with a subscription period, the inception date is the day after that period ends. Investment performance is measured from the inception date.
Median Market Cap. An indicator of the size of companies in which a fund invests; the midpoint of market capitalization (market price x shares outstanding) of a fund’s stocks, weighted by the proportion of the fund’s assets invested in each stock. Stocks representing half of the fund’s assets have market capitalizations above the median, and the rest are below it.
Price/Book Ratio. The share price of a stock divided by its net worth, or book value, per share.
For a fund, the weighted average price/book ratio of the stocks it holds.
27
Price/Earnings Ratio. The ratio of a stock’s current price to its per-share earnings over the past year. For a fund, the weighted average P/E of the stocks it holds. P/E is an indicator of market expectations about corporate prospects; the higher the P/E, the greater the expectations for a company’s future growth.
R-Squared. A measure of how much of a fund’s past returns can be explained by the returns from the market in general, as measured by a given index. If a fund’s total returns were precisely synchronized with an index’s returns, its R-squared would be 1.00. If the fund’s returns bore no relationship to the index’s returns, its R-squared would be 0. For this report, R-squared is based on returns over the past 36 months for both the fund and the index.
Return on Equity. The annual average rate of return generated by a company during the past five years for each dollar of shareholder’s equity (net income divided by shareholder’s equity). For a fund, the weighted average return on equity for the companies whose stocks it holds.
Short-Term Reserves. The percentage of a fund invested in highly liquid, short-term securities that can be readily converted to cash.
Turnover Rate. An indication of the fund’s trading activity. Funds with high turnover rates incur higher transaction costs and may be more likely to distribute capital gains (which may be taxable to investors). The turnover rate excludes in-kind transactions, which have minimal impact on costs.
28
This page intentionally left blank.
This page intentionally left blank.
The People Who Govern Your Fund
The trustees of your mutual fund are there to see that the fund is operated and managed in your best interests since, as a shareholder, you are a part owner of the fund. Your fund’s trustees also serve on the board of directors of The Vanguard Group, Inc., which is owned by the Vanguard funds and provides services to them on an at-cost basis.
A majority of Vanguard’s board members are independent, meaning that they have no affiliation with Vanguard or the funds they oversee, apart from the sizable personal investments they have made as private individuals. The independent board members have distinguished backgrounds in business, academia, and public service. Each of the trustees and executive officers oversees 208 Vanguard funds.
Information for each trustee and executive officer of the fund appears below. The mailing address of the trustees and officers is P.O. Box 876, Valley Forge, PA 19482. More information about the trustees is in the Statement of Additional Information, which can be obtained, without charge, by contacting Vanguard at 800-662-7447, or online at vanguard.com.
Interested Trustees1
F. William McNabb III
Born in 1957. Trustee since July 2009. Principal occupation(s) during the past five years and other experience: chairman of the board (January 2010–present) of Vanguard and of each of the investment companies served by Vanguard, trustee (2009–present) of each of the investment companies served by Vanguard, and director (2008–present) of Vanguard. Chief executive officer and president (2008–2017) of Vanguard and each of the investment companies served by Vanguard, managing director (1995–2008) of Vanguard, and director (1997–2018) of Vanguard Marketing Corporation. Director (2018–present) of UnitedHealth Group.
Mortimer J. Buckley
Born in 1969. Trustee since January 2018. Principal occupation(s) during the past five years and other experience: chief executive officer (January 2018–present) of Vanguard; chief executive officer, president, and trustee (January 2018–present) of each of the investment companies served by Vanguard; president and director (2017–present) of Vanguard; and president (February 2018–present) of Vanguard Marketing Corporation. Chief investment officer (2013–2017), managing director (2002–2017), head of the Retail Investor Group (2006–2012), and chief information officer (2001–2006) of Vanguard. Chairman of the board (2011–2017) of the Children’s Hospital of Philadelphia.
Independent Trustees
Emerson U. Fullwood
Born in 1948. Trustee since January 2008. Principal occupation(s) during the past five years and other experience: executive chief staff and marketing officer for North America and corporate vice president (retired 2008) of Xerox Corporation (document management products and services). Former president of the Worldwide Channels Group, Latin America, and Worldwide Customer Service and executive chief staff officer of Developing Markets of Xerox. Executive in residence and 2009–2010 Distinguished Minett Professor at the Rochester Institute of Technology. Lead director of SPX FLOW, Inc. (multi-industry manufacturing). Director of the University of Rochester Medical Center, the Monroe Community College Foundation, the United Way of Rochester, North Carolina A&T University, and Roberts Wesleyan College. Trustee of the University of Rochester.
Amy Gutmann
Born in 1949. Trustee since June 2006. Principal occupation(s) during the past five years and other experience: president (2004–present) of the University of Pennsylvania. Christopher H. Browne Distinguished Professor of Political Science, School of Arts and Sciences, and professor of communication, Annenberg School for Communication, with secondary faculty appointments in the Department of Philosophy, School of Arts and Sciences, and at the Graduate School of Education, University of Pennsylvania. Trustee of the National Constitution Center.
1 Mr. McNabb and Mr. Buckley are considered “interested persons,” as defined in the Investment Company Act of 1940, because
they are officers of the Vanguard funds.
JoAnn Heffernan Heisen
Born in 1950. Trustee since July 1998. Principal occupation(s) during the past five years and other experience: corporate vice president of Johnson & Johnson (pharmaceuticals/medical devices/consumer products) and member of its executive committee (1997–2008). Chief global diversity officer (retired 2008), vice president and chief information officer (1997–2006), controller (1995–1997), treasurer (1991–1995), and assistant treasurer (1989–1991) of Johnson & Johnson. Director of Skytop Lodge Corporation (hotels) and the Robert Wood Johnson Foundation. Member of the advisory board of the Institute for Women’s Leadership at Rutgers University.
F. Joseph Loughrey
Born in 1949. Trustee since October 2009. Principal occupation(s) during the past five years and other experience: president and chief operating officer (retired 2009) and vice chairman of the board (2008–2009) of Cummins Inc. (industrial machinery). Chairman of the board of Hillenbrand, Inc. (specialized consumer services), Oxfam America, and the Lumina Foundation for Education. Director of the V Foundation for Cancer Research. Member of the advisory council for the College of Arts and Letters and chair of the advisory board to the Kellogg Institute for International Studies, both at the University of Notre Dame.
Mark Loughridge
Born in 1953. Trustee since March 2012. Principal occupation(s) during the past five years and other experience: senior vice president and chief financial officer (retired 2013) of IBM (information technology services). Fiduciary member of IBM’s Retirement Plan Committee (2004–2013), senior vice president and general manager (2002–2004) of IBM Global Financing, vice president and controller (1998–2002) of IBM, and a variety of other prior management roles at IBM. Member of the Council on Chicago Booth.
Scott C. Malpass
Born in 1962. Trustee since March 2012. Principal occupation(s) during the past five years and other experience: chief investment officer (1989–present) and vice president (1996–present) of the University of Notre Dame. Assistant professor of finance at the Mendoza College of Business, University of Notre Dame, and member of the Notre Dame 403(b) Investment Committee. Chairman of the board of TIFF Advisory Services, Inc. Member of the board of Catholic Investment Services, Inc. (investment advisors), the board of advisors for Spruceview Capital Partners, and the board of superintendence of the Institute for the Works of Religion.
Deanna Mulligan
Born in 1963. Trustee since January 2018. Principal occupation(s) during the past five years and other experience: president (2010–present) and chief executive officer (2011–present) of The Guardian Life Insurance Company of America. Chief operating officer (2010–2011) and executive vice president (2008–2010) of Individual Life and Disability of The Guardian Life Insurance Company of America. Member of the board of The Guardian Life Insurance Company of America, the American Council of Life Insurers, the Partnership for New York City (business leadership), and the Committee Encouraging Corporate Philanthropy. Trustee of the Economic Club of New York and the Bruce Museum (arts and science). Member of the Advisory Council for the Stanford Graduate School of Business.
André F. Perold
Born in 1952. Trustee since December 2004. Principal occupation(s) during the past five years and other experience: George Gund Professor of Finance and Banking, Emeritus at the Harvard Business School (retired 2011). Chief investment officer and co-managing partner of HighVista Strategies LLC (private investment firm). Overseer of the Museum of Fine Arts Boston.
Sarah Bloom Raskin
Born in 1961. Trustee since January 2018. Principal occupation(s) during the past five years and other experience: deputy secretary (2014–2017) of the United States Department of the Treasury. Governor (2010–2014) of the Federal Reserve Board. Commissioner (2007–2010) of financial regulation for the State of Maryland. Member of the board of directors (2012–2014) of Neighborhood Reinvestment Corporation. Director of i(x) Investments, LLC.
Peter F. Volanakis
Born in 1955. Trustee since July 2009. Principal occupation(s) during the past five years and other experience: president and chief operating officer (retired 2010) of Corning Incorporated (communications equipment) and director of Corning Incorporated (2000–2010) and Dow Corning (2001–2010). Director (2012) of SPX Corporation (multi-industry manufacturing). Overseer of the Amos Tuck School of Business Administration, Dartmouth College (2001–2013). Chairman of the board of trustees of Colby-Sawyer College. Member of the Board of Hypertherm Inc. (industrial cutting systems, software, and consumables).
Executive Officers
Glenn Booraem
Born in 1967. Principal occupation(s) during the past five years and other experience: principal of Vanguard. Investment stewardship officer (2017–present), treasurer (2015–2017), controller (2010–2015), and assistant controller (2001–2010) of each of the investment companies served by Vanguard.
Christine M. Buchanan
Born in 1970. Principal occupation(s) during the past five years and other experience: principal of Vanguard and global head of Fund Administration at Vanguard. Treasurer (2017–present) of each of the investment companies served by Vanguard. Partner (2005–2017) at KPMG LLP (audit, tax, and advisory services).
Brian Dvorak
Born in 1973. Principal occupation(s) during the past five years and other experience: principal of Vanguard. Chief compliance officer (2017–present) of Vanguard and each of the investment companies served by Vanguard. Assistant vice president (2017–present) of Vanguard Marketing Corporation. Vice president and director of Enterprise Risk Management (2011–2013) at Oppenheimer Funds, Inc.
Thomas J. Higgins
Born in 1957. Principal occupation(s) during the past five years and other experience: principal of Vanguard. Chief financial officer (2008–present) and treasurer (1998–2008) of each of the investment companies served by Vanguard.
Peter Mahoney
Born in 1974. Principal occupation(s) during the past five years and other experience: principal of Vanguard. Controller (2015–present) of each of the investment companies served by Vanguard. Head of International Fund Services (2008–2014) at Vanguard.
Anne E. Robinson
Born in 1970. Principal occupation(s) during the past five years and other experience: general counsel (2016–present) of Vanguard. Secretary (2016–present) of Vanguard and of each of the investment companies served by Vanguard. Managing director (2016–present) of Vanguard. Director and senior vice president (2016–2018) of Vanguard Marketing Corporation. Managing director and general counsel of Global Cards and Consumer Services (2014–2016) at Citigroup. Counsel (2003–2014) at American Express.
Michael Rollings
Born in 1963. Principal occupation(s) during the past five years and other experience: finance director (2017–present) and treasurer (2017) of each of the investment companies served by Vanguard. Managing director (2016–present) of Vanguard. Chief financial officer (2016–present) of Vanguard. Director (2016–present) of Vanguard Marketing Corporation. Executive vice president and chief financial officer (2006–2016) of MassMutual Financial Group.
| |
| Vanguard Senior Management Team |
| |
| Mortimer J. Buckley | James M. Norris |
| Gregory Davis | Thomas M. Rampulla |
| John James | Karin A. Risi |
| Martha G. King | Anne E. Robinson |
| John T. Marcante | Michael Rollings |
| Chris D. McIsaac | |
| |
| |
| Chairman Emeritus and Senior Advisor |
| |
| John J. Brennan | |
| Chairman, 1996–2009 | |
| Chief Executive Officer and President, 1996–2008 |
| |
| |
| Founder | |
| |
| John C. Bogle | |
| Chairman and Chief Executive Officer, 1974–1996 |
|  |
| | P.O. Box 2600 |
| | Valley Forge, PA 19482-2600 |
| |
| |
| |
| Connect with Vanguard® > vanguard.com |
| |
| |
| |
| Fund Information > 800-662-7447 | Source for Bloomberg Barclays indexes: Bloomberg |
| Direct Investor Account Services > 800-662-2739 | Index Services Limited. Copyright 2018, Bloomberg. |
| | All rights reserved. |
| Institutional Investor Services > 800-523-1036 | |
| | “Dividend Achievers” is a trademark of The NASDAQ |
| Text Telephone for People | OMX Group, Inc. (collectively, with its affiliates |
| Who Are Deaf or Hard of Hearing > 800-749-7273 | “NASDAQ OMX”), and has been licensed for use by |
| This material may be used in conjunction | The Vanguard Group, Inc. Vanguard mutual funds are |
| | not sponsored, endorsed, sold, or promoted by |
| with the offering of shares of any Vanguard | NASDAQ OMX and NASDAQ OMX makes no |
| fund only if preceded or accompanied by | representation regarding the advisability of investing |
| the fund’s current prospectus. | in the funds. NASDAQ OMX makes no warranties and |
| | bears no liability with respect to the Vanguard mutual |
| All comparative mutual fund data are from Lipper, a | funds. |
| Thomson Reuters Company, or Morningstar, Inc., unless | |
| otherwise noted. | |
| |
| You can obtain a free copy of Vanguard’s proxy voting | |
| guidelines by visiting vanguard.com/proxyreporting or by | |
| calling Vanguard at 800-662-2739. The guidelines are | |
| also available from the SEC’s website, sec.gov. In | |
| addition, you may obtain a free report on how your fund | |
| voted the proxies for securities it owned during the 12 | |
| months ended June 30. To get the report, visit either | |
| vanguard.com/proxyreporting or sec.gov. | |
| |
| You can review and copy information about your fund at | |
| the SEC’s Public Reference Room in Washington, D.C. To | |
| find out more about this public service, call the SEC at | |
| 202-551-8090. Information about your fund is also | |
| available on the SEC’s website, and you can receive | |
| copies of this information, for a fee, by sending a | |
| request in either of two ways: via email addressed to | |
| publicinfo@sec.gov or via regular mail addressed to the | |
| Public Reference Section, Securities and Exchange | |
| Commission, Washington, DC 20549-1520. | |
| | © 2018 The Vanguard Group, Inc. |
| | All rights reserved. |
| | Vanguard Marketing Corporation, Distributor. |
| |
| | Q6022 092018 |
Item 2: Code of Ethics.
Not Applicable.
Item 3: Audit Committee Financial Expert.
Not Applicable.
Item 4: Principal Accountant Fees and Services.
(a) Audit Fees.
Not Applicable.
Item 5: Audit Committee of Listed Registrants.
Not Applicable.
Item 6: Investments.
Not Applicable.
Item 7: Disclosure of Proxy Voting Policies and Procedures for Closed-End Management Investment
Companies.
Not Applicable.
Item 8: Portfolio Managers of Closed-End Management Investment Companies.
Not Applicable.
Item 9: Purchase of Equity Securities by Closed-End Management Investment Company and
Affiliated Purchasers.
Not Applicable.
Item 10: Submission of Matters to a Vote of Security Holders.
Not Applicable.
Item 11: Controls and Procedures.
(a) Disclosure Controls and Procedures. The Principal Executive and Financial Officers concluded that the Registrant’s Disclosure Controls and Procedures are effective based on their evaluation of the Disclosure Controls and Procedures as of a date within 90 days of the filing date of this report.
(b) Internal Control Over Financial Reporting. There were no significant changes in Registrant’s Internal Control Over Financial Reporting or in other factors that could significantly affect this control subsequent to the date of the evaluation, including any corrective actions with regard to significant deficiencies and material weaknesses.
Item 12: Disclosure of Securities Lending Activities for Closed-End Management Investment Companies.
Not Applicable.
Item 13: Exhibits.
(a) Certifications.
Pursuant to the requirements of the Securities Exchange Act of 1934 and the Investment Company Act of 1940, the registrant has duly caused this report to be signed on its behalf by the undersigned, thereunto duly authorized.
| |
| | VANGUARD SPECIALIZED FUNDS |
| |
| |
| BY: | /s/ MORTIMER J. BUCKLEY* |
| | MORTIMER J. BUCKLEY |
| | CHIEF EXECUTIVE OFFICER |
| |
| Date: September 13, 2018 |
Pursuant to the requirements of the Securities Exchange Act of 1934 and the Investment Company Act of 1940, this report has been signed below by the following persons on behalf of the registrant and in the capacities and on the dates indicated.
| |
| | VANGUARD SPECIALIZED FUNDS |
BY: | /s/ MORTIMER J. BUCKLEY* |
| | MORTIMER J. BUCKLEY |
| | CHIEF EXECUTIVE OFFICER |
| Date: September 13, 2018 |
| | VANGUARD SPECIALIZED FUNDS |
| |
| BY: | /s/ THOMAS J. HIGGINS* |
| THOMAS J. HIGGINS |
| | CHIEF FINANCIAL OFFICER |
| Date: September 13, 2018 |
* By: /s/ Anne E. Robinson
Anne E. Robinson, pursuant to a Power of Attorney filed on January 18, 2018; see file Number
33-32216, Incorporated by Reference.