These calculations are based on expenses incurred in the most recent six-month period. The fund’s annualized six-month expense ratios for that period are 0.40% for Investor Shares and 0.32% for Admiral Shares. The dollar amounts shown as “Expenses Paid” are equal to the annualized expense ratio multiplied by the average account value over the period, multiplied by the number of days in the most recent six-month period, then divided by the number of days in the most recent 12-month period.
Notice to Shareholders
The board of trustees of Vanguard Energy Fund has adopted a new advisory fee schedule for one of the fund’s advisors, Wellington Management Company, LLP (Wellington Management), effective August 1, 2009. The new advisory fee schedule is expected to increase the fund’s expense ratio by 0.01%. For shareholders, the increase represents an additional $1.00 in annual cost on a $10,000 investment. This change will not affect the fund’s investment objective, policies, or strategies. The Vanguard Group, Inc., also provides investment advisory services to the fund.
The fund’s trustees regularly evaluate its investment advisory arrangements, focusing on factors such as the advisor’s investment process, style consistency, and performance, as well as the composition and depth of the management and research teams. In deciding to adopt the new fee schedule, the trustees considered the fund’s performance together with a wide range of information relating to Wellington Management, which has managed the fund since the fund’s inception in 1984.
The fund has entered into a new investment advisory agreement with Wellington Management to reflect the new fee schedule; however, other terms of the existing agreement have not changed. Under the terms of the agreement, the fund will pay Wellington Management a fee at the end of each fiscal quarter. The fee is calculated by applying an annual percentage rate to the average daily net assets of the portion of the fund managed by Wellington Management (the Wellington Management Portfolio) for the quarter.
For the six months ended July 31, 2009, the total advisory fees paid by Vanguard Energy Fund were $6,698,000, or an annual rate of 0.16% of the fund’s average net assets. The Vanguard Group provides advisory services to the fund on an at-cost basis. Of the aggregate fees paid for the period, the investment advisory expenses incurred by Vanguard were $120,000, or an annual rate of less than 0.01% of the fund’s average net assets. If the new fee schedule had been in place throughout the period, the advisory fees paid by the fund would have been $7,401,000, or an annual rate of 0.17% of the fund’s average net assets. The average advisory fee paid by funds in Vanguard Energy Fund’s Lipper peer group was 0.55% of assets, as of December 31, 2008.
Board approval of the investment advisory agreement
Wellington Management is responsible for managing the investment and reinvestment of the Wellington Management Portfolio. In managing these assets Wellington Management is responsible for continuously reviewing, supervising, and administering the fund’s investment program. The advisor discharges its responsibilities subject to the supervision and oversight of the officers and trustees of the fund.
The board’s decision to revise the current advisory fee schedule was based upon its most recent evaluation of the advisor’s investment staff, portfolio management process, and performance results. In considering whether to approve the new agreement, the board engaged in arm’s-length negotiations with Wellington Management and considered the following factors, among others:
• The trustees considered the benefits to shareholders of continuing to retain Wellington
Management as advisor to the fund, particularly in light of the nature, extent, and quality of services provided by Wellington Management. The board considered the quality of investment management to the fund over both the short and long term and the organizational depth and stability of the firm.
Specifically, the board noted that Wellington Management has advised the fund since its inception in 1984. Further, the board noted that Wellington Management utilizes a bottom-up investment approach, in which stocks are selected based on the advisor’s estimates of fundamental investment value. The
28
advisor’s investment process emphasizes company fundamentals, management track record, and security valuation. The board concluded that the existing advisory fee schedule should be adjusted to reflect the fair market value of Wellington Management’s services and the firm’s need to maintain an expanded portfolio management team to manage a large fund in this market segment. The new fee arrangement will enable Wellington Management to enhance the organizational depth and stability of the fund’s portfolio management team by retaining top investment talent and by hiring new investment professionals on an as-needed basis.
• The trustees considered the fund’s investment performance compared with those of the fund’s peer group and a relevant benchmark. The board concluded that the fund’s short- and long-term performance has been consistently competitive versus the average return of the fund’s peer group of global natural resources funds (as defined by Lipper Inc.), and that the fund’s 5– and 10–year performance has been competitive versus the fund’s benchmark, the S&P Energy Sector Index; however, the fund’s 1– and 3–year performance versus the Index has been less favorable.
• The trustees considered the cost of services to be provided, including consideration of competitive fee rates and the fact that, after the adjustment, the fund’s advisory fee will remain significantly lower than fees charged by most of the fund’s peers.
• The trustees considered the extent to which economies of scale would be realized as the fund grows, including a consideration of appropriate breakpoints in the fee schedule. By including asset-based breakpoints in Wellington Management’s fee schedule, the trustees ensure that if the fund continues to grow, investors will benefit by realizing economies of scale in the form of a lower advisory fee rate.
• The trustees considered all of the circumstances and information provided by both Wellington Management and Vanguard regarding the performance of the fund and concluded that approval of the new investment advisory agreement is in the best interests of the fund and its shareholders.
The advisory agreement will continue for a period of one year from its effective date and is renewable after that for successive one-year periods. The agreement will be reviewed annually by the fund’s trustees, a majority of whom are not “interested persons” of either the fund or Wellington Management as defined in federal securities laws.
Background information on Wellington Management
Wellington Management Company, LLP, a Massachusetts partnership with offices at 75 State Street, Boston, MA 02109, is an investment firm that was founded in 1928. As of January 31, 2009, the firm managed approximately $420 billion in assets for a variety of clients, including mutual funds, institutions, and separate accounts. The manager primarily responsible for overseeing the Wellington Management Portfolio:
Karl E. Bandtel, Senior Vice President and Equity Portfolio Manager of Wellington Management. He has worked in investment management with Wellington Management since 1990; began working as an assistant fund manager in 1992; and has managed the Wellington Management Portfolio since 2002. Education: B.S. and M.S., University of Wisconsin.
Wellington Management is owned by its 110 active partners, all of whom are active members of the firm. The managing partners of the firm are Phillip H. Perelmuter, Brendan J. Swords, and Perry M. Traquina. Please note that the managing partners are not necessarily those with the largest economic interests in the firm.
29
Trustees Approve Advisory Arrangements
The board of trustees of Vanguard Energy Fund has renewed the fund’s investment advisory arrangement with The Vanguard Group, Inc., through its Quantitative Equity Group. The board determined that renewing the fund’s advisory arrangement with Vanguard was in the best interests of the fund and its shareholders. The board also approved an amended investment advisory agreement with Wellington Management Company, LLP, effective August 1, 2009. Please see the Notice to Shareholders in this report for information about the board’s approval of Wellington Management’s amended agreement.
The board based its decision upon an evaluation of the Quantitative Equity Group’s investment staff, portfolio management process, and performance. The trustees considered the factors discussed below, among others. However, no single factor determined whether the board approved the arrangement. Rather, it was the totality of the circumstances that drove the board’s decision.
Nature, extent, and quality of services
The board considered the quality of the fund’s investment management over both the short and long term, and took into account the organizational depth and stability of the advisor. The board noted that Vanguard has been managing investments for more than three decades. The Quantitative Equity Group adheres to a sound, disciplined investment management process; the team has considerable experience, stability, and depth. Vanguard has managed a portion of the fund since 2005.
The board concluded that Vanguard’s experience, stability, depth, and performance, among other factors warranted the continuation of the fund’s advisory arrangement.
Investment performance
The board considered the short- and long-term performance of the fund, including any periods of outperformance or underperformance of a relevant benchmark and peer group. The board concluded that the advisor has carried out its investment strategy in disciplined fashion, and that performance results have been in line with expectations. Information about the fund’s most recent performance can be found in the Performance Summary section of this report.
Cost
The board concluded that the fund’s expense ratio was well below the average expense ratio charged by funds in its peer group and that the fund’s advisory expense ratio was also well below its peer-group average. Information about the fund’s expense ratio appears in the About Your Fund’s Expenses section of this report as well as in the Financial Statements section, which also includes information about the fund’s advisory fee rate.
The board does not conduct a profitability analysis of Vanguard, because of Vanguard’s unique “at-cost” structure. Unlike most other mutual fund management companies, Vanguard is owned by the funds it oversees, and produces “profits” only in the form of reduced expenses for fund shareholders.
The benefit of economies of scale
The board concluded that the fund’s low-cost arrangement with Vanguard ensures that the fund will realize economies of scale as it grows, with the cost to shareholders declining as the fund’s assets managed by Vanguard increase.
The board will consider whether to renew the advisory arrangement again after a one-year period.
30
Glossary
30-Day SEC Yield. A fund’s 30-day SEC yield is derived using a formula specified by the U.S. Securities and Exchange Commission. Under the formula, data related to the fund’s security holdings in the previous 30 days are used to calculate the fund’s hypothetical net income for that period, which is then annualized and divided by the fund’s estimated average net assets over the calculation period. For the purposes of this calculation, a security’s income is based on its current market yield to maturity (in the case of bonds) or its projected dividend yield (for stocks). Because the SEC yield represents hypothetical annualized income, it will differ—at times significantly—from the fund’s actual experience. As a result, the fund’s income distributions may be higher or lower than implied by the SEC yield.
Beta. A measure of the magnitude of a fund’s past share-price fluctuations in relation to the ups and downs of a given market index. The index is assigned a beta of 1.00. Compared with a given index, a fund with a beta of 1.20 typically would have seen its share price rise or fall by 12% when the index rose or fell by 10%. For this report, beta is based on returns over the past 36 months for both the fund and the index. Note that a fund’s beta should be reviewed in conjunction with its R-squared (see definition). The lower the R-squared, the less correlation there is between the fund and the index, and the less reliable beta is as an indicator of volatility.
Dividend Yield. Dividend income earned by stocks, expressed as a percentage of the aggregate market value (or of net asset value, for a fund). The yield is determined by dividing the amount of the annual dividends by the aggregate value (or net asset value) at the end of the period. For a fund, the dividend yield is based solely on stock holdings and does not include any income produced by other investments.
Earnings Growth Rate. The average annual rate of growth in earnings over the past five years for the stocks now in a fund.
Equity Exposure. A measure that reflects a fund’s investments in stocks and stock futures. Any holdings in short-term reserves are excluded.
Expense Ratio. The percentage of a fund’s average net assets used to pay its annual administrative and advisory expenses. These expenses directly reduce returns to investors.
Foreign Holdings. The percentage of a fund represented by stocks or depositary receipts of companies based outside the United States.
Inception Date. The date on which the assets of a fund (or one of its share classes) are first invested in accordance with the fund’s investment objective. For funds with a subscription period, the inception date is the day after that period ends. Investment performance is measured from the inception date.
Median Market Cap. An indicator of the size of companies in which a fund invests; the midpoint of market capitalization (market price x shares outstanding) of a fund’s stocks, weighted by the proportion of the fund’s assets invested in each stock. Stocks representing half of the fund’s assets have market capitalizations above the median, and the rest are below it.
Price/Book Ratio. The share price of a stock divided by its net worth, or book value, per share. For a fund, the weighted average price/book ratio of the stocks it holds.
31
Price/Earnings Ratio. The ratio of a stock’s current price to its per-share earnings over the past year. For a fund, the weighted average P/E of the stocks it holds. P/E is an indicator of market expectations about corporate prospects; the higher the P/E, the greater the expectations for a company’s future growth.
R-Squared. A measure of how much of a fund’s past returns can be explained by the returns from the market in general, as measured by a given index. If a fund’s total returns were precisely synchronized with an index’s returns, its R-squared would be 1.00. If the fund’s returns bore no relationship to the index’s returns, its R-squared would be 0. For this report, R-squared is based on returns over the past 36 months for both the fund and the index.
Return on Equity. The annual average rate of return generated by a company during the past five years for each dollar of shareholder’s equity (net income divided by shareholder’s equity). For a fund, the weighted average return on equity for the companies whose stocks it holds.
Short-Term Reserves. The percentage of a fund invested in highly liquid, short-term securities that can be readily converted to cash.
Turnover Rate. An indication of the fund’s trading activity. Funds with high turnover rates incur higher transaction costs and may be more likely to distribute capital gains (which may be taxable to investors). The turnover rate excludes in-kind transactions, which have minimal impact on costs.
32
This page intentionally left blank.
This page intentionally left blank.
This page intentionally left blank.
The People Who Govern Your Fund
The trustees of your mutual fund are there to see that the fund is operated and managed in your best interests since, as a shareholder, you are a part owner of the fund. Your fund’s trustees also serve on the board of directors of The Vanguard Group, Inc., which is owned by the Vanguard funds and provides services to them on an at-cost basis.
A majority of Vanguard’s board members are independent, meaning that they have no affiliation with Vanguard or the funds they oversee, apart from the sizable personal investments they have made as private individuals. The independent board members have distinguished backgrounds in business, academia, and public service. Each of the trustees and executive officers oversees 157 Vanguard funds.
The following table provides information for each trustee and executive officer of the fund. More information about the trustees is in the Statement of Additional Information, which can be obtained, without charge, by contacting Vanguard at 800-662-7447, or online at www.vanguard.com.
Interested Trustees | Emerson U. Fullwood |
| Born 1948. Trustee Since January 2008. Principal |
| Occupation(s) During the Past Five Years: Retired |
| Executive Chief Staff and Marketing Officer for North |
John J. Brennan1 | America and Corporate Vice President of Xerox |
Born 1954. Trustee Since May 1987. Chairman of | Corporation (photocopiers and printers); Director of |
the Board. Principal Occupation(s) During the Past | SPX Corporation (multi-industry manufacturing), the |
Five Years: Chairman of the Board and Director/Trustee | United Way of Rochester, the Boy Scouts of America, |
of The Vanguard Group, Inc., and of each of the | Amerigroup Corporation (direct health and medical |
investment companies served by The Vanguard Group; | insurance carriers), and Monroe Community College |
Chief Executive Officer and President of The Vanguard | Foundation. |
Group and of each of the investment companies served | |
by The Vanguard Group (1996-2008); Chairman of | |
the Financial Accounting Foundation; Governor of | Rajiv L. Gupta |
the Financial Industry Regulatory Authority (FINRA); | Born 1945. Trustee Since December 2001.2 Principal |
Director of United Way of Southeastern Pennsylvania. | Occupation(s) During the Past Five Years: Retired |
| Chairman and Chief Executive Officer of Rohm and |
F. William McNabb III1 | Haas Co. (chemicals); President of Rohm and Haas Co. |
Born 1957. Trustee Since July 2009. Principal | (2006-2008); Board Member of American Chemistry |
Occupation(s) During the Past Five Years: Director of | Council; Director of Tyco International, Ltd. (diversified |
The Vanguard Group, Inc., since 2008; Chief Executive | manufacturing and services) and Hewlett-Packard Co. |
Officer and President of The Vanguard Group and of | (electronic computer manufacturing); Trustee of The |
each of the investment companies served by The | Conference Board. |
Vanguard Group since 2008; Director of Vanguard | |
Marketing Corporation; Managing Director of The | |
Vanguard Group (1995-2008). | Amy Gutmann |
| Born 1949. Trustee Since June 2006. Principal |
| Occupation(s) During the Past Five Years: President of |
Independent Trustees | the University of Pennsylvania; Christopher H. Browne |
| Distinguished Professor of Political Science in the School |
Charles D. Ellis | of Arts and Sciences with Secondary Appointments |
Born 1937. Trustee Since January 2001. Principal | at the Annenberg School for Communication and the |
Occupation(s) During the Past Five Years: Applecore | Graduate School of Education of the University of |
Partners (pro bono ventures in education); Senior | Pennsylvania; Director of Carnegie Corporation of |
Advisor to Greenwich Associates (international business | New York, Schuylkill River Development Corporation, |
strategy consulting); Successor Trustee of Yale University; | and Greater Philadelphia Chamber of Commerce; |
Overseer of the Stern School of Business at New York | Trustee of the National Constitution Center. |
University; Trustee of the Whitehead Institute for | |
Biomedical Research. | |
JoAnn Heffernan Heisen | Executive Officers |
Born 1950. Trustee Since July 1998. Principal | | |
Occupation(s) During the Past Five Years: Retired | | |
Corporate Vice President, Chief Global Diversity Officer, | Thomas J. Higgins1 |
and Member of the Executive Committee of Johnson | Born 1957. Chief Financial Officer Since September |
& Johnson (pharmaceuticals/consumer products); | 2008. Principal Occupation(s) During the Past Five |
Vice President and Chief Information Officer of Johnson | Years: Principal of The Vanguard Group, Inc.; Chief |
& Johnson (1997-2005); Director of the University | Financial Officer of each of the investment companies |
Medical Center at Princeton and Women’s Research | served by The Vanguard Group since 2008; Treasurer |
and Education Institute. | of each of the investment companies served by The |
| Vanguard Group (1998-2008). |
| | |
Andr F. Perold | | |
Born 1952. Trustee Since December 2004. Principal | Kathryn J. Hyatt1 | |
Occupation(s) During the Past Five Years: George Gund | Born 1955. Treasurer Since November 2008. Principal |
Professor of Finance and Banking, Harvard Business | Occupation(s) During the Past Five Years: Principal of |
School; Director and Chairman of UNX, Inc. (equities | The Vanguard Group, Inc.; Treasurer of each of the |
trading firm); Chair of the Investment Committee of | investment companies served by The Vanguard |
HighVista Strategies LLC (private investment firm). | Group since 2008; Assistant Treasurer of each of the |
| investment companies served by The Vanguard Group |
| (1988-2008). | |
Alfred M. Rankin, Jr. | | |
Born 1941. Trustee Since January 1993. Principal | | |
Occupation(s) During the Past Five Years: Chairman, | Heidi Stam1 | |
President, Chief Executive Officer, and Director of | Born 1956. Secretary Since July 2005. Principal |
NACCO Industries, Inc. (forklift trucks/housewares/ | Occupation(s) During the Past Five Years: Managing |
lignite); Director of Goodrich Corporation (industrial | Director of The Vanguard Group, Inc., since 2006; |
products/aircraft systems and services). | General Counsel of The Vanguard Group since 2005; |
| Secretary of The Vanguard Group and of each of the |
| investment companies served by The Vanguard Group |
Peter F. Volanakis | since 2005; Director and Senior Vice President of |
Born 1955. Trustee Since July 2009. Principal | Vanguard Marketing Corporation since 2005; Principal |
Occupation(s) During the Past Five Years: President | of The Vanguard Group (1997-2006). |
since 2007 and Chief Operating Officer since 2005 | | |
of Corning Incorporated (communications equipment); | | |
President of Corning Technologies (2001-2005); Director | Vanguard Senior Management Team |
of Corning Incorporated and Dow Corning; Trustee of | | |
the Corning Incorporated Foundation and the Corning | | |
Museum of Glass; Overseer of the Amos Tuck School | R. Gregory Barton | Michael S. Miller |
of Business Administration at Dartmouth College. | Mortimer J. Buckley | James M. Norris |
| Kathleen C. Gubanich | Glenn W. Reed |
| Paul A. Heller | George U. Sauter |
| | |
| Founder | |
| | |
| John C. Bogle | |
| Chairman and Chief Executive Officer, 1974-1996 |
|
|
1 These individuals are “interested persons” as defined in the Investment Company Act of 1940. |
2 December 2002 for Vanguard Equity Income Fund, Vanguard Growth Equity Fund, the Vanguard Municipal Bond |
Funds, and the Vanguard State Tax-Exempt Funds. |

P.O. Box 2600
Valley Forge, PA 19482-2600
Connect with Vanguard® > www.vanguard.com
Fund Information > 800-662-7447 | CFA® is a trademark owned by |
| CFA Institute. |
Direct Investor Account Services > 800-662-2739 | |
| |
Institutional Investor Services > 800-523-1036 | |
| |
Text Telephone for People | |
With Hearing Impairment > 800-952-3335 | |
| |
This material may be used in conjunction | |
with the offering of shares of any Vanguard | |
fund only if preceded or accompanied by | |
the fund’s current prospectus. | |
| |
All comparative mutual fund data are from Lipper Inc. or | |
Morningstar, Inc., unless otherwise noted. | |
| |
You can obtain a free copy of Vanguard’s proxy voting | |
guidelines by visiting our website, www.vanguard.com, | |
and searching for “proxy voting guidelines,” or by calling | |
Vanguard at 800-662-2739. The guidelines are also | |
available from the SEC’s website, www.sec.gov. In | |
addition, you may obtain a free report on how your fund | |
voted the proxies for securities it owned during the 12 | |
months ended June 30. To get the report, visit either | |
www.vanguard.com or www.sec.gov. | |
| |
You can review and copy information about your fund at | |
the SEC’s Public Reference Room in Washington, D.C. To | |
find out more about this public service, call the SEC at | |
202-551-8090. Information about your fund is also | |
available on the SEC’s website, and you can receive | |
copies of this information, for a fee, by sending a | |
request in either of two ways: via e-mail addressed to | |
publicinfo@sec.gov or via regular mail addressed to the | © 2009 The Vanguard Group, Inc. |
Public Reference Section, Securities and Exchange | All rights reserved. |
Commission, Washington, DC 20549-0102. | Vanguard Marketing Corporation, |
| Distributor. |
| Q512 092009 |


> | For the six months ended July 31, 2009, Vanguard Precious Metals and Mining Fund posted a return of 59.55%. |
> | The fund surpassed the return of its benchmark and the average return of gold-oriented funds. |
> | Big contributors for the period included platinum mining and marketing companies, while gold was a weak spot. |
Contents | |
| |
Your Fund’s Total Returns | 1 |
President’s Letter | 2 |
Advisor’s Report | 7 |
Results of Proxy Voting | 10 |
Fund Profile | 12 |
Performance Summary | 13 |
Financial Statements | 14 |
About Your Fund’s Expenses | 24 |
Trustees Approve Advisory Agreement | 26 |
Glossary | 27 |
Please note: The opinions expressed in this report are just that—informed opinions. They should not be considered promises or advice. Also, please keep in mind that the information and opinions cover the period through the date on the front of this report. Of course, the risks of investing in your fund are spelled out in the prospectus.
Your Fund’s Total Returns
Six Months Ended July 31, 2009 | | |
| Ticker | Total |
| Symbol | Returns |
Vanguard Precious Metals and Mining Fund | VGPMX | 59.55% |
S&P/Citigroup Custom Precious Metals and Mining Index | | 53.16 |
Average Gold-Oriented Fund1 | | 25.01 |
Your Fund’s Performance at a Glance | | |
January 31, 2009–July 31, 2009 | | | | |
| | | Distributions Per Share |
| Starting | Ending | Income | Capital |
| Share Price | Share Price | Dividends | Gains |
Vanguard Precious Metals and Mining Fund | $10.74 | $16.98 | $0.110 | $0.000 |
1 Derived from data provided by Lipper Inc. |
1

President’s Letter
Dear Shareholder,
For the fiscal half-year ended July 31, 2009, Vanguard Precious Metals and Mining Fund returned 59.55%. The fund’s return surpassed that of its benchmark index and significantly outpaced the average return of gold-oriented funds.
The fund’s strong results helped it recover somewhat from its unprecedented decline (–60.16%) in the 12 months ended January 31, 2009. Such extreme swings in performance are not uncommon among metals and mining stocks. As the financial markets bounced back in the spring, investors poured more money into precious metals and mining stocks that stand to benefit from an improving economy.
Among the fund’s best performers during the six months were platinum producers and distributors. The fund also benefited from the advisor’s decision to limit its exposure to gold stocks, which suffered because of weakness in the price of gold. Other metals experienced a sharp rise in prices during the period.
Stocks rose on signs that recovery is taking root
For the six months ended July 31, the broad U.S. stock market returned about 23%. The period began in gloom, with stocks declining in February and early March before staging a strong springtime rally. After pausing in June, the market surged nearly 8% in July as investors reacted to improvement in the housing
2
market, an increase in manufacturing activity, rising corporate earnings, and cautiously optimistic comments from the Federal Reserve Board.
Global stock markets performed even better, advancing almost 38% for the period. Encouraging earnings reports and higher commodity prices lifted international stocks off their lows in early March. After three straight months of solid gains, the MSCI All Country World Index ex USA fell slightly in June before rallying again in July.
Although stock markets worldwide have been in recovery mode for five months and various economic signs point to the recession’s end, the health of global financial markets and economies remained fragile as the period ended. Unemployment, in particular, was still a major concern both in the United States and abroad.
Investors departed Treasuries for higher-yielding bonds
For the six months, the Barclays Capital U.S. Aggregate Bond Index, a broad measure of the investment-grade market, returned more than 4%. That return paled, however, next to the 30% return of lower-quality bonds, as measured by the Barclays Capital U.S. Corporate High Yield Bond Index. In mid-March, investors seemed to gain confidence in the federal government’s efforts to thaw the credit markets and stimulate the economy, and they started shifting from U.S. Treasury bonds to corporate issues—particularly
Market Barometer | | | |
| | | Total Returns |
| Periods Ended July 31, 2009 |
| Six Months | One Year | Five Years1 |
Stocks | | | |
Russell 1000 Index (Large-caps) | 22.26% | –20.17% | 0.32% |
Russell 2000 Index (Small-caps) | 26.61 | –20.72 | 1.52 |
Dow Jones U.S. Total Stock Market Index | 23.23 | –19.67 | 0.81 |
MSCI All Country World Index ex USA (International) | 37.70 | –20.90 | 7.57 |
| | | |
Bonds | | | |
Barclays Capital U.S. Aggregate Bond Index | | | |
(Broad taxable market) | 4.47% | 7.85% | 5.14% |
Barclays Capital Municipal Bond Index | 4.38 | 5.11 | 4.21 |
Citigroup 3-Month Treasury Bill Index | 0.09 | 0.65 | 3.00 |
| | | |
CPI | | | |
Consumer Price Index | 1.99% | –2.10% | 2.60% |
3
below-investment-grade bonds, which offered the highest yields. Municipal bonds also benefited from government support, with the broad tax-exempt market returning about 4% for the six months.
Efforts to combat the financial crisis have included a combination of aggressive monetary policy and large fiscal programs, most notably the nearly $800 billion American Recovery and Reinvestment Act. On the monetary side, the Fed has kept its target for short-term interest rates at an all-time low of 0% to 0.25%, a target it expects to maintain for “an extended period.” For the last several months, the Fed has been purchasing Treasury and mortgage-backed securities, an effort to keep longer-term interest rates and borrowing costs low. In recent months, however, Treasury yields have risen amid concerns about longer-term budget deficits.
A rise in metal prices helped boost the fund’s return
Vanguard Precious Metals and Mining Fund has a small portfolio, consisting of only 40 stocks at the end of the fiscal half-year.
Though few in number, those holdings included some of the sector’s better performers in the period. M&G Investment Management, the fund’s advisor, exercised its skill at spotting key metals companies with healthy cash flows and competitive advantages to earn a return about 6 percentage points higher than that of its
Expense Ratios1 | | |
Your Fund Compared With Its Peer Group | | |
| | Average |
| | Gold-Oriented |
| Fund | Fund |
Precious Metals and Mining Fund | 0.39% | 1.40% |
1 The fund expense ratio shown is from the prospectus dated May 29, 2009, and represents estimated costs for the |
current fiscal year based on the fund’s net assets as of the prospectus date. For the six months ended July 31, 2009, |
the annualized expense ratio was 0.28%. The peer-group expense ratio is derived from data provided by Lipper Inc. |
and captures information through year-end 2008. |
4
benchmark and more than double the average return of its gold-oriented peer funds.
For the six-month period, the fund’s stellar performance was largely attributable to its platinum holdings. Platinum, along with other metals, benefited from an improved outlook for the global economy, which could mean a rise in demand for durable goods such as automobiles. Platinum is a key component in emission-control parts for cars and trucks.
Three of the five top contributors to the fund’s performance belonged to platinum miners or distributors, and together they contributed 22 percentage points to the overall return. Impala Platinum, the world’s second-largest platinum producer with mines in South Africa and Zimbabwe, was the lead contributor.
Producers of nickel, manganese, and steel also boosted the fund’s return. France’s Eramet, one of the world’s largest refiners and producers of nickel, manganese, and special steels, benefited from an increase in demand driven largely by China and by the effects of government stimulus plans. Australia-based Sims Metal Management, the world’s largest recycler of scrap metal, benefited from higher steel prices.
On the other hand, the Canadian gold producer Barrick Gold was among the fund’s weakest performers in the period, along with Australian mineral sands producer Iluka Resources. Barrick Gold retreated as the price of gold declined. Iluka suffered from weaker demand for some of its products, including titanium dioxide, an ingredient in protective coatings such as house and car paints.
The fund can help diversify a balanced portfolio
While the stock market has recovered from some of its losses earlier in the year, the only certainty about its near-term direction is continued uncertainty.
The market’s unpredictable nature can be unnerving for investors. But what’s important to keep in mind is that short-term ups and downs in the markets should not lead you to make hasty investment decisions.
Vanguard encourages investors to maintain a well-balanced portfolio with a long-term perspective. In practice, this means building a portfolio that includes stocks, bonds, and short-term reserves in proportions that fit your time horizon and risk tolerance. A balanced portfolio can provide some protection against the stock
5
market’s occasionally sharp declines, while allowing you to participate in its long-term potential for growth. Vanguard Precious Metals and Mining Fund can play a useful role in enhancing the diversification of a well-balanced portfolio.
Thank you for investing your assets at Vanguard.
Sincerely,

F. William McNabb III
President and Chief Executive Officer
August 14, 2009
6
Advisor’s Report
Vanguard Precious Metals and Mining Fund produced a strong absolute return of 59.55% over the six-month period ended July 31, 2009. This was slightly ahead of results for the customized benchmark index, which gained 53.16%, and well above the average return for gold-oriented funds, which was 25.01%.
Heightened volatility persisted during the six months under review, although the overall trend was much more positive. In February, with concerns about the health of the global economy continuing to plague capital markets, the price of gold appreciated strongly as investors were attracted by the metal’s “safe haven” status. As this aversion to risk subsided, investors’ demand for gold eased somewhat, but it remained sufficient to keep gold prices generally in a relatively strong range of $900–$950 per ounce.
Other metals and minerals with greater sensitivity to economic activity—in particular copper and nickel, but also platinum—rallied strongly in tandem with the improving outlook for industrial demand. China’s record imports of a range of materials acted as an especially potent force in propelling commodity prices higher. In addition, the collapse in capital expenditure in recent months highlighted potential supply shortages across the mining industry. This factor also attracted investors toward companies involved in mining more economically sensitive materials, especially those firms with more attractive valuations and better growth prospects.
Against this backdrop, one of the key factors in the fund’s good performance was its significant exposure to industrially sensitive, diversified mining companies at the expense of pure gold producers, an area in which the fund has long had a relatively small weighting. This positioning reflects a long-term strategic stance based on fundamental factors such as industry supply and demand dynamics, returns-focused management, and relative valuations, all of which in our opinion favor the broader mining sector.
The fund also benefited from an improving outlook for many of the companies in the portfolio, notably those supported by a geographically diversified customer base. Such diversification has been particularly helpful because growth remains elusive in many developed markets. In addition, the companies we invest in have been carrying out robust cost-containment programs to provide some insulation to their returns in an environment of weaker demand.
Within the precious metals sector, strong contributions to performance came from the fund’s substantial holding in U.K.-listed platinum producer Lonmin and South African producer Impala Platinum. Both
7
companies benefited as platinum prices rebounded thanks to an improved outlook for demand from the automotive industry.
Elsewhere, a number of our holdings in non-precious-metal companies rallied strongly from depressed levels, which had failed to reflect the quality and growth potential of their mining assets. These companies included French nickel and manganese producer Eramet; Canada-listed copper producer First Quantum Minerals; Canadian nickel and coal producer Sherritt International; and Australian nickel producer Panoramic Resources, which is a new holding for us.
The fund’s focus on cash-generative mining companies with sound balance sheets was vindicated, with the majority of our holdings remaining in a strong financial position despite the downturn. This strength enabled many of them to take advantage of attractive acquisition opportunities within their industries.
On the negative side, a number of holdings that had performed strongly in the latter half of calendar 2008 succumbed to short-term profit-taking during the past six months. These included Australian mineral sands producer Iluka Resources, whose share price has lagged as the company reported marketing challenges for its products, and Canadian gold royalty company Franco-Nevada, which posted adequate returns but suffered nonetheless as investors sought companies more geared to an economic recovery. Both of these holdings hurt our performance during the period. Also weak were holdings in French kaolin producer Imerys and U.S. producer Minerals Technologies, both of which have high exposure to the relatively depressed United States and European construction markets. We still believe that these companies have excellent long-term prospects.
During the half-year, we continued to focus on building our stake in metals and minerals companies with returns-focused management, strong financial positions, and exposure to strategically important materials. We increased our position in BHP Billiton, which is the world’s largest mining company and possesses one of the strongest balance sheets in the industry. We established new stakes in First Quantum Minerals, a Canadian-listed company that mines high-quality copper and gold in Zambia and the Democratic Republic of Congo, and Hochschild Mining, a U.K.-listed miner of high-grade silver in Peru.
We purchased selected gold producers, such as U.K.-listed Peter Hambro Mining and Canadian producer Eldorado Gold, which—in contrast with much of the gold sector—have high-quality assets and management. We also added to existing positions, or established new ones, in companies where negative sentiment had, in our view, suppressed share prices
8
below fair valuation levels. Examples included German potash producer K&S, Lonmin, and Sherritt International.
We made relatively few sales during the period. The most significant was a substantial reduction of the portfolio’s large holding in Franco-Nevada, whose valuation had become less attractive because of its very strong performance since we purchased it. For similar reasons, we reduced exposure to Australian steel company Bluescope Steel and trimmed positions in large North American gold producers Barrick Gold and Newmont Mining.
The past year has been an extraordinary period for investors in companies involved in producing metals and minerals. After a spell when short-term demand for many natural resources appeared to grind to a halt, a surge in demand from China helped trigger a sharp rebound in the prices of many metals and minerals, and thus in stock prices as well.
It was encouraging to see that the mining industry reacted to the slowdown in demand by shutting down excess capacity. The ongoing consolidation of the industry has led to more rational actions and a greater focus on maintaining profitability. We continue to believe that appetite for commodities will be supported over the long term by infrastructure expenditure worldwide and by rising urbanization in emerging markets—trends supported by the fiscal stimulus packages that have been implemented by governments around the world.
As a consequence, our long-term outlook for commodities in general remains positive, and we anticipate a growing number of exciting opportunities for investors in the mining sector. The shorter-term picture, however, remains less clear, and volatility is likely to persist.
As to the ongoing strategy of the fund, we remain convinced of the importance of sticking to long-term investment principles and focusing on industry and company fundamentals. We shall continue to invest in well-capitalized, trustworthy companies with strategically important assets whose value is not properly appreciated by investors. We are avoiding companies that are operating in disadvantaged industries, have unsound balance sheets, or are not managed in the interest of shareholders.
Portfolio Managers: Graham E. French,
Matthew Vaight, UKSIP
M&G Investment Management Ltd.
August 26, 2009
9
Results of Proxy Voting
At a special meeting of shareholders on July 2, 2009, fund shareholders approved the following two proposals:
Proposal 1—Elect trustees for each fund.*
The individuals listed in the table below were elected as trustees for each fund. All trustees with the exception of Messrs. McNabb and Volanakis (both of whom already served as directors of The Vanguard Group, Inc.) served as trustees to the funds prior to the shareholder meeting.
| | | Percentage |
Trustee | For | Withheld | For |
John J. Brennan | 831,083,148 | 23,429,009 | 97.3% |
Charles D. Ellis | 815,919,984 | 38,592,173 | 95.5% |
Emerson U. Fullwood | 818,220,903 | 36,291,254 | 95.8% |
Rajiv L. Gupta | 827,792,136 | 26,720,020 | 96.9% |
Amy Gutmann | 828,576,544 | 25,935,613 | 97.0% |
JoAnn Heffernan Heisen | 827,968,189 | 26,543,968 | 96.9% |
F. William McNabb III | 830,218,855 | 24,293,302 | 97.2% |
André F. Perold | 817,862,692 | 36,649,465 | 95.7% |
Alfred M. Rankin, Jr. | 827,956,891 | 26,555,266 | 96.9% |
Peter F. Volanakis | 829,990,273 | 24,521,884 | 97.1% |
* Results are for all funds within the same trust. | |
Proposal 2—Update and standardize the funds’ fundamental policies regarding: |
(a) | Purchasing and selling real estate. |
(b) | Issuing senior securities. |
(c) | Borrowing money. |
(d) | Making loans. |
(e) | Purchasing and selling commodities. |
(f) | Concentrating investments in a particular industry or group of industries. |
(g) | Eliminating outdated fundamental investment policies not required by law. |
The revised fundamental policies are clearly stated and simple, yet comprehensive, making oversight and compliance more efficient than under the former policies. The revised fundamental policies will allow the funds to respond more quickly to regulatory and market changes, while avoiding the costs and delays associated with successive shareholder meetings.
| | | | Broker | Percentage |
Vanguard Fund | For | Abstain | Against | Non-Votes | For |
Precious Metals and Mining Fund | | | | | |
2a | 90,338,393 | 1,775,013 | 5,697,112 | 8,321,718 | 85.1% |
2b | 89,548,119 | 2,225,835 | 6,036,560 | 8,321,721 | 84.4% |
2c | 88,386,610 | 2,064,020 | 7,359,883 | 8,321,722 | 83.3% |
2d | 88,318,725 | 2,175,115 | 7,316,675 | 8,321,720 | 83.2% |
2e | 91,870,981 | 1,936,694 | 4,002,840 | 8,321,721 | 86.6% |
2f | 92,204,024 | 2,160,349 | 3,446,140 | 8,321,722 | 86.9% |
2g | 91,058,902 | 3,081,657 | 3,669,957 | 8,321,719 | 85.8% |
10
Fund shareholders did not approve this proposal:
Proposal 3—Institute procedures to prevent holding investments in companies that, in the judgment of the board, substantially contribute to genocide or crimes against humanity, the most egregious violations of human rights.
The trustees recommended a vote against the proposal because it called for procedures that duplicate existing practices and procedures of the Vanguard funds.
| | | | Broker | Percentage |
Vanguard Fund | For | Abstain | Against | Non-Votes | For |
Precious Metals and Mining Fund | 14,729,424 | 3,285,886 | 79,795,203 | 8,321,722 | 13.9% |
11
Precious Metals and Mining Fund
Fund Profile
As of July 31, 2009
Portfolio Characteristics | | |
| | Comparative | Broad |
| Fund | Index1 | Index2 |
Number of Stocks | 40 | 305 | 4,370 |
Median Market Cap | $4.2B | $21.8B | $26.1B |
Price/Earnings Ratio | 25.8x | 23.1x | 23.0x |
Price/Book Ratio | 1.7x | 2.1x | 2.1x |
Return on Equity | 19.9% | 20.1% | 19.6% |
Earnings Growth Rate | 22.3% | 23.7% | 12.6% |
Foreign Holdings | 88.8% | 91.3% | 0.0% |
Turnover Rate3 | 24% | — | — |
Expense Ratio4 | 0.39% | — | — |
Short-Term Reserves | 1.2% | — | — |
Market Diversification (% of equity exposure) |
| |
United Kingdom | 25.5% |
Australia | 17.0 |
Canada | 14.3 |
France | 14.0 |
South Africa | 12.9 |
United States | 10.5 |
Singapore | 3.0 |
Germany | 1.9 |
Other Markets | 0.9 |
Volatility Measures5 | |
| Fund Versus | Fund Versus |
| Comparative Index1 | Broad Index2 |
R-Squared | 0.89 | 0.58 |
Beta | 0.99 | 1.56 |
Ten Largest Holdings6 (% of total net assets) |
| |
Johnson Matthey PLC | 9.0% |
Lonmin PLC | 8.0 |
Impala Platinum Holdings Ltd. ADR | 7.6 |
Imerys SA | 7.2 |
Eramet SLN | 6.7 |
Sims Metal Management Ltd. | 6.2 |
BHP Billiton Ltd. | 4.8 |
Peter Hambro Mining PLC | 4.2 |
Hochschild Mining PLC | 3.7 |
Iluka Resources Ltd. | 3.7 |
Top Ten | 61.1% |
1 S&P/Citigroup Custom Precious Metals and Mining Index. |
2 Dow Jones U.S. Total Stock Market Index. |
3 Annualized. |
4 The fund expense ratio shown is from the prospectus dated May 29, 2009, and represents estimated |
costs for the current fiscal year based on the fund’s net assets as of the prospectus date. For the |
six months ended July 31, 2009, the annualized expense ratio was 0.28%. |
5 For an explanation of R-squared, beta, and other terms used here, see the Glossary. |
6 The holdings listed exclude any temporary cash investments and equity index products. |
12
Precious Metals and Mining Fund
Performance Summary
All of the returns in this report represent past performance, which is not a guarantee of future results that may be achieved by the fund. (Current performance may be lower or higher than the performance data cited. For performance data current to the most recent month-end, visit our website at www.vanguard.com/performance.) Note, too, that both investment returns and principal value can fluctuate widely, so an investor’s shares, when sold, could be worth more or less than their original cost. The returns shown do not reflect taxes that a shareholder would pay on fund distributions or on the sale of fund shares.
Fiscal-Year Total Returns (%): January 31, 1999–July 31, 2009

Average Annual Total Returns: Periods Ended June 30, 2009
This table presents average annual total returns through the latest calendar quarter—rather than through the end of the fiscal period. Securities and Exchange Commission rules require that we provide this information.
| Inception Date | One Year | Five Years | Ten Years |
Precious Metals and Mining Fund3 | 5/23/1984 | –53.11% | 13.48% | 15.85% |
1 Six months ended July 31, 2009. |
2 S&P/Citigroup World Equity Gold Index through June 30, 2005; S&P/Citigroup Custom Precious Metals |
and Mining Index thereafter. |
3 Total returns do not reflect the 1% fee assessed on redemptions of shares held for less than one year, |
nor do they include the account service fee that may be applicable to certain accounts with balances |
below $10,000. |
Note: See Financial Highlights table for dividend and capital gains information. |
13
Precious Metals and Mining Fund
Financial Statements (unaudited)
Statement of Net Assets
As of July 31, 2009
The fund provides a complete list of its holdings four times in each fiscal year, at the quarter-ends. For the second and fourth fiscal quarters, the lists appear in the fund’s semiannual and annual reports to shareholders. For the first and third fiscal quarters, the fund files the lists with the Securities and Exchange Commission on Form N-Q. Shareholders can look up the fund’s Forms N-Q on the SEC’s website at www.sec.gov. Forms N-Q may also be reviewed and copied at the SEC’s Public Reference Room (see the back cover of this report for further information).
| | | Market |
| | | Value• |
| | Shares | ($000) |
Common Stocks (99.1%) | | |
Australia (16.9%) | | |
| Sims Metal | | |
| Management Ltd. | 7,950,000 | 185,902 |
| BHP Billiton Ltd. | 4,550,000 | 143,571 |
*,1 | Iluka Resources Ltd. | 41,783,827 | 110,034 |
1 | Panoramic | | |
| Resources, Ltd. | 18,700,000 | 43,213 |
*,1 | St. Barbara Ltd. | 129,665,600 | 21,232 |
| BlueScope Steel Ltd. | 1,216,434 | 3,427 |
* | MIL Resources, Ltd. | 1,678,671 | 47 |
| | | 507,426 |
Canada (14.2%) | | |
*,1 | Centerra Gold Inc. | 15,120,900 | 96,151 |
| Franco-Nevada Corp. | 3,400,000 | 84,901 |
1 | Sherritt | | |
| International Corp. | 14,825,000 | 84,360 |
* | First Quantum | | |
| Minerals Ltd. | 1,050,000 | 69,935 |
1 | Harry Winston | | |
| Diamond Corp. | 7,724,400 | 45,102 |
* | Eldorado Gold Corp. | 3,300,000 | 33,176 |
| Barrick Gold Corp. | 200,000 | 6,985 |
1,2 | Harry Winston | | |
| Diamond Corp. | | |
| Private Placement | 700,000 | 3,883 |
* | Claude Resources, Inc. | 2,650,000 | 1,776 |
| | | 426,269 |
France (13.9%) | | |
1 | Imerys SA | 4,056,000 | 216,068 |
| Eramet SLN | 716,626 | 201,364 |
| | | 417,432 |
Germany (1.9%) | | |
| K&S AG | 1,000,000 | 55,985 |
| | | |
Indonesia (0.3%) | | |
* | PT International Nickel | | |
| Indonesia Tbk | 22,500,000 | 9,746 |
Papua New Guinea (0.0%) | | |
* | Bougainville Copper Ltd. | 2,000,000 | 1,056 |
| | | |
| | | | |
Peru (0.6%) | | |
| Compania de Minas | | |
| Buenaventura SA ADR | 700,000 | 18,235 |
| | | |
Singapore (3.0%) | | |
| Noble Group Ltd. | 62,337,052 | 90,477 |
| | | |
South Africa (12.8%) | | |
| Impala Platinum | | |
| Holdings Ltd. ADR | 9,350,000 | 227,018 |
| Anglo Platinum Ltd. ADR | 1,450,000 | 103,893 |
| Northam Platinum Ltd. | 11,200,000 | 53,428 |
| | | 384,339 |
United Kingdom (25.2%) | | |
1 | Johnson Matthey PLC | 11,450,000 | 270,336 |
1 | Lonmin PLC | 10,391,666 | 239,769 |
1 | Peter Hambro Mining PLC | 11,500,000 | 125,645 |
1 | Hochschild Mining PLC | 26,712,078 | 111,478 |
* | Gem Diamond Ltd. | 1,800,000 | 5,916 |
| Vedanta Resources PLC | 100,000 | 2,948 |
* | Kenmare Resources PLC | 4,550,000 | 1,559 |
* | Gemfields Resources PLC | 3,333,333 | 369 |
* | Mwana Africa PLC | 3,180,219 | 308 |
* | Zambezi Resources Ltd. | 4,895,833 | 102 |
| | | 758,430 |
United States (10.3%) | | |
| Schnitzer Steel | | |
| Industries, Inc. Class A | 1,850,000 | 99,474 |
| Newmont Mining Corp. | | |
| (Holding Co.) | 2,200,000 | 90,970 |
1 | Minerals | | |
| Technologies, Inc. | 1,473,996 | 64,075 |
1 | AMCOL International Corp. | 3,030,000 | 56,994 |
| | | 311,513 |
Total Common Stocks | | |
(Cost $3,184,171) | | 2,980,908 |
14
Precious Metals and Mining Fund
| | Market |
| | Value• |
| Shares | ($000) |
Precious Metals (0.1%) | | |
* Platinum Bullion | | |
(In Troy Ounces) | 2,009 | 2,423 |
Total Precious Metals | | |
(Cost $1,213) | | 2,423 |
Temporary Cash Investment (1.2%) | |
Money Market Fund (1.2%) | | |
3 Vanguard Market | | |
Liquidity Fund, 0.335% | | |
(Cost $35,611) | 35,611,000 | 35,611 |
Total Investments (100.4%) | | |
(Cost $3,220,995) | | 3,018,942 |
Other Assets and Liabilities (–0.4%) | |
Other Assets | | 16,432 |
Liabilities | | (28,640) |
| | (12,208) |
Net Assets (100%) | | |
Applicable to 177,117,820 outstanding | |
$.001 par value shares of beneficial | |
interest (unlimited authorization) | 3,006,734 |
Net Asset Value Per Share | | $16.98 |
At July 31, 2009, net assets consisted of: | |
| Amount |
| ($000) |
Paid-in Capital | 3,325,031 |
Overdistributed Net Investment Income | (38,040) |
Accumulated Net Realized Losses | (78,235) |
Unrealized Appreciation (Depreciation) | |
Investment Securities | (202,053) |
Foreign Currencies | 31 |
Net Assets | 3,006,734 |
• See Note A in Notes to Financial Statements. |
* Non-income-producing security. |
1 Considered an affiliated company of the fund as the fund owns more than 5% of the outstanding voting securities of |
such company. |
2 Security exempt from registration under Rule 144A of the Securities Act of 1933. Such securities may be sold in |
transactions exempt from registration, normally to qualified institutional buyers. At July 31, 2009, the value of this |
security represented 0.1% of net assets. |
3 Affiliated money market fund available only to Vanguard funds and certain trusts and accounts managed by Vanguard. |
Rate shown is the 7-day yield. |
ADR—American Depositary Receipt. |
See accompanying Notes, which are an integral part of the Financial Statements. |
15
Precious Metals and Mining Fund
Statement of Assets and Liabilities
As of July 31, 2009
| Market Value |
| ($000) |
Assets | |
Investments in Securities, at Value | 3,018,942 |
Receivables for Capital Shares Issued | 5,734 |
Accrued Income Receivable | 4,986 |
Other Assets | 5,712 |
Total Assets | 3,035,374 |
Liabilities | |
Payables for Investment Securities Purchased | 16,331 |
Payables for Capital Shares Redeemed | 2,473 |
Other Liabilities | 9,836 |
Total Liabilities | 28,640 |
Net Assets | 3,006,734 |
See accompanying Notes, which are an integral part of the Financial Statements.
16
Precious Metals and Mining Fund
Statement of Operations
| Six Months Ended |
| July 31, 2009 |
| ($000) |
Investment Income | |
Income | |
Dividends1,2 | 11,638 |
Interest2 | 72 |
Security Lending | 127 |
Total Income | 11,837 |
Expenses | |
Investment Advisory Fees—Note B | |
Basic Fee | 1,577 |
Performance Adjustment | (1,139) |
The Vanguard Group—Note C | |
Management and Administrative | 2,283 |
Marketing and Distribution | 235 |
Custodian Fees | 60 |
Auditing Fees | 1 |
Shareholders’ Reports and Proxies | 92 |
Trustees’ Fees and Expenses | 2 |
Total Expenses | 3,111 |
Net Investment Income | 8,726 |
Realized Net Gain (Loss) | |
Investment Securities Sold2 | (42,964) |
Foreign Currencies | (3,496) |
Realized Net Gain (Loss) | (46,460) |
Change in Unrealized Appreciation (Depreciation) | |
Investment Securities | 1,064,728 |
Foreign Currencies | 26 |
Change in Unrealized Appreciation (Depreciation) | 1,064,754 |
Net Increase (Decrease) in Net Assets Resulting from Operations | 1,027,020 |
1 Dividends are net of foreign withholding taxes of $1,858,000. |
2 Dividend income, interest income, and realized net gain (loss) from affiliated companies of the fund |
were $11,449,000, $72,000, and $2,014,000, respectively. |
See accompanying Notes, which are an integral part of the Financial Statements. |
17
Precious Metals and Mining Fund
Statement of Changes in Net Assets
| Six Months Ended | Year Ended |
| July 31, | January 31, |
| 2009 | 2009 |
| ($000) | ($000) |
Increase (Decrease) in Net Assets | | |
Operations | | |
Net Investment Income | 8,726 | 82,443 |
Realized Net Gain (Loss) | (46,460) | 284,265 |
Change in Unrealized Appreciation (Depreciation) | 1,064,754 | (3,024,276) |
Net Increase (Decrease) in Net Assets Resulting from Operations | 1,027,020 | (2,657,568) |
Distributions | | |
Net Investment Income | (16,927) | (99,293) |
Realized Capital Gain1 | — | (361,426) |
Total Distributions | (16,927) | (460,719) |
Capital Share Transactions | | |
Issued | 579,256 | 841,029 |
Issued in Lieu of Cash Distributions | 15,527 | 423,318 |
Redeemed2 | (242,091) | (1,137,039) |
Net Increase (Decrease) from Capital Share Transactions | 352,692 | 127,308 |
Total Increase (Decrease) | 1,362,785 | (2,990,979) |
Net Assets | | |
Beginning of Period | 1,643,949 | 4,634,928 |
End of Period3 | 3,006,734 | 1,643,949 |
1 Includes fiscal 2009 short-term gain distributions totaling $2,529,000. Short-term gain distributions |
are treated as ordinary income dividends for tax purposes. |
2 Net of redemption fees for fiscal 2010 and 2009 of $967,000 and $2,019,000, respectively. |
3 Net Assets—End of Period includes undistributed (overdistributed) net investment income of |
($38,040,000) and ($36,107,000). |
See accompanying Notes, which are an integral part of the Financial Statements. |
18
Precious Metals and Mining Fund
Financial Highlights
| Six | | | | | |
| Months | | | | | |
| Ended | | | |
For a Share Outstanding | July 31, | Year Ended January 31, |
Throughout Each Period | 2009 | 2009 | 2008 | 2007 | 2006 | 2005 |
Net Asset Value, Beginning of Period | $10.74 | $33.45 | $28.64 | $27.08 | $16.46 | $15.29 |
Investment Operations | | | | | | |
Net Investment Income | .0531,2 | .653 | .9002 | .560 | .3371 | .1851 |
Net Realized and Unrealized Gain (Loss) | | | | | | |
on Investments3 | 6.297 | (19.849) | 8.362 | 4.027 | 11.080 | 1.988 |
Total from Investment Operations | 6.350 | (19.196) | 9.262 | 4.587 | 11.417 | 2.173 |
Distributions | | | | | | |
Dividends from Net Investment Income | (.110) | (.763) | (.670) | (.490) | (.240) | (.144) |
Distributions from Realized Capital Gains | — | (2.751) | (3.782) | (2.537) | (.557) | (.859) |
Total Distributions | (.110) | (3.514) | (4.452) | (3.027) | (.797) | (1.003) |
Net Asset Value, End of Period | $16.98 | $10.74 | $33.45 | $28.64 | $27.08 | $16.46 |
| | | | | | |
Total Return4 | 59.55% | –60.16% | 33.97% | 17.48% | 70.19% | 14.20% |
| | | | | | |
Ratios/Supplemental Data | | | | | | |
Net Assets, End of Period (Millions) | $3,007 | $1,644 | $4,635 | $3,444 | $3,297 | $921 |
Ratio of Total Expenses to | | | | | | |
Average Net Assets | 0.28%5,6 | 0.30%5 | 0.28%5 | 0.35%5 | 0.40% | 0.48% |
Ratio of Net Investment Income to | | | | | | |
Average Net Assets | 2.00%2,6 | 2.17% | 2.70%2 | 1.88% | 1.68% | 1.32% |
Portfolio Turnover Rate | 24%6 | 22% | 29% | 24% | 20% | 36% |
1 Calculated based on average shares outstanding. |
2 Net investment income per share and the ratio of net investment income to average net assets for the year ended January |
31, 2008, include $0.190 and 0.65%, respectively, resulting from a special dividend from Centennial Coal Co. Ltd. in |
January 2008. Based on additional information reported by the company in 2009, a portion of the special dividend was |
reallocated to return of capital. The reallocation reduced net investment income per share and the ratio of net investment |
income to average net assets for the six months ended July 31, 2009, by $0.161 and 1.19%, respectively. The reallocation |
has no impact on net assets, net asset values per share, or total returns. |
3 Includes increases from redemption fees of $.01, $.01, $.00, $.03, $.01, and $.01. |
4 Total returns do not reflect the 1% fee assessed on redemptions of shares held for less than one year, nor do they include |
the account service fee that may be applicable to certain accounts with balances below $10,000. |
5 Includes performance-based investment advisory fee increases (decreases) of (0.10%) for fiscal 2010, 0.00% for fiscal |
2009, (0.01%) for fiscal 2008, and 0.01% for fiscal 2007. |
6 Annualized. |
See accompanying Notes, which are an integral part of the Financial Statements. |
19
Precious Metals and Mining Fund
Notes to Financial Statements
Vanguard Precious Metals and Mining Fund is registered under the Investment Company Act of 1940 as an open-end investment company, or mutual fund. The fund invests in securities of foreign issuers, which may subject it to investment risks not normally associated with investing in securities of United States corporations.
A. The following significant accounting policies conform to generally accepted accounting principles for U.S. mutual funds. The fund consistently follows such policies in preparing its financial statements.
1. Security Valuation: Securities are valued as of the close of trading on the New York Stock Exchange (generally 4 p.m., Eastern time) on the valuation date. Equity securities are valued at the latest quoted sales prices or official closing prices taken from the primary market in which each security trades; such securities not traded on the valuation date are valued at the mean of the latest quoted bid and asked prices. Securities for which market quotations are not readily available, or whose values have been affected by events occurring before the fund’s pricing time but after the close of the securities’ primary markets, are valued at their fair values calculated according to procedures adopted by the board of trustees. These procedures include obtaining quotations from an independent pricing service, monitoring news to identify significant market- or security-specific events, and evaluating changes in the values of foreign market proxies (for example, ADRs, futures contracts, or exchange-traded funds), between the time the foreign markets close and the fund’s pricing time. When fair-value pricing is employed, the prices of securities used by a fund to calculate its net asset value may differ from quoted or published prices for the same securities. Precious metals are valued at the mean of the latest quoted bid and asked prices. Investments in Vanguard Market Liquidity Fund are valued at that fund’s net asset value.
2. Foreign Currency: Securities and other assets and liabilities denominated in foreign currencies are translated into U.S. dollars using exchange rates obtained from an independent third party as of the fund’s pricing time on the valuation date. Realized gains (losses) and unrealized appreciation (depreciation) on investment securities include the effects of changes in exchange rates since the securities were purchased, combined with the effects of changes in security prices. Fluctuations in the value of other assets and liabilities resulting from changes in exchange rates are recorded as unrealized foreign currency gains (losses) until the assets or liabilities are settled in cash, at which time they are recorded as realized foreign currency gains (losses).
3. Federal Income Taxes: The fund intends to continue to qualify as a regulated investment company and distribute all of its taxable income. Management has analyzed the fund’s tax positions taken on federal income tax returns for all open tax years (tax years ended January 31, 2006–2009) and for the period ended July 31, 2009, and has concluded that no provision for federal income tax is required in the fund’s financial statements.
4. Distributions: Distributions to shareholders are recorded on the ex-dividend date.
5. Security Lending: The fund may lend its securities to qualified institutional borrowers to earn additional income. Security loans are required to be secured at all times by collateral at least equal to the market value of securities loaned. The fund invests cash collateral received in Vanguard Market Liquidity Fund, and records a liability for the return of the collateral, during the period the securities are on loan. Security lending income represents the income earned on investing cash collateral, less expenses associated with the loan.
20
Precious Metals and Mining Fund
6. Other: Dividend income is recorded on the ex-dividend date. Interest income includes income distributions received from Vanguard Market Liquidity Fund and is accrued daily. Security transactions are accounted for on the date securities are bought or sold. Costs used to determine realized gains (losses) on the sale of investment securities are those of the specific securities sold. Fees assessed on redemptions of capital shares are credited to paid-in capital.
B. M&G Investment Management Ltd. provides investment advisory services to the fund for a fee calculated at an annual percentage rate of average net assets. The basic fee is subject to quarterly adjustments based on the fund’s performance for the preceding three years relative to the S&P/Citigroup Custom Precious Metals and Mining Index. For the six months ended July 31, 2009, the investment advisory fee represented an effective annual basic rate of 0.14% of the fund’s average net assets before a decrease of $1,139,000 (0.10%) based on performance.
C. The Vanguard Group furnishes at cost corporate management, administrative, marketing, and distribution services. The costs of such services are allocated to the fund under methods approved by the board of trustees. The fund has committed to provide up to 0.40% of its net assets in capital contributions to Vanguard. At July 31, 2009, the fund had contributed capital of $613,000 to Vanguard (included in Other Assets), representing 0.02% of the fund’s net assets and 0.25% of Vanguard’s capitalization. The fund’s trustees and officers are also directors and officers of Vanguard.
D. Various inputs may be used to determine the value of the fund’s investments. These inputs are summarized in three broad levels for financial statement purposes. The inputs or methodologies used to value securities are not necessarily an indication of the risk associated with investing in those securities.
Level 1—Quoted prices in active markets for identical securities.
Level 2—Other significant observable inputs (including quoted prices for similar securities, interest rates, prepayment speeds, credit risk, etc.).
Level 3—Significant unobservable inputs (including the fund’s own assumptions used to determine the fair value of investments).
The following table summarizes the fund’s investments as of July 31, 2009, based on the inputs used to value them:
| Level 1 | Level 2 | Level 3 |
Investments | ($000) | ($000) | ($000) |
Common Stocks—North America | 733,899 | — | 3,883 |
Common Stocks—Other | 349,146 | 1,893,878 | 102 |
Precious Metals | 2,423 | — | — |
Temporary Cash Investments | 35,611 | — | — |
Total | 1,121,079 | 1,893,878 | 3,985 |
21
Precious Metals and Mining Fund
The following table summarizes changes in investments valued based on Level 3 inputs during the six months ended July 31, 2009:
| Investments in |
| Securities |
| ($000) |
Amount Valued Based on Level 3 Inputs | |
Balance as of January 31, 2009 | 2,646 |
Transfers in and/or out of Level 3 | 102 |
Change in Unrealized Appreciation (Depreciation) | 1,237 |
Balance as of July 31, 2009 | 3,985 |
E. Distributions are determined on a tax basis and may differ from net investment income and realized capital gains for financial reporting purposes. Differences may be permanent or temporary. Permanent differences are reclassified among capital accounts in the financial statements to reflect their tax character. Temporary differences arise when certain items of income, expense, gain, or loss are recognized in different periods for financial statement and tax purposes; these differences will reverse at some time in the future. Differences in classification may also result from the treatment of short-term gains as ordinary income for tax purposes. The fund’s tax-basis capital gains and losses are determined only at the end of each fiscal year.
During the six months ended July 31, 2009, the fund realized net foreign currency losses of $3,496,000, which decreased distributable net income for tax purposes; accordingly, such losses have been reclassified from accumulated net realized losses to overdistributed net investment income.
Certain of the fund’s investments are in securities considered to be “passive foreign investment companies,” for which any unrealized appreciation and/or realized gains are required to be included in distributable net income for tax purposes. During the six months ended July 31, 2009, the fund realized gains on the sale of passive foreign investment companies of $9,764,000, which have been included in current and prior periods’ taxable income; accordingly, such gains have been reclassified from accumulated net realized losses to overdistributed net investment income. Unrealized appreciation as of January 31, 2009, on the fund’s passive foreign investment company holdings at July 31, 2009, was $43,586,000, all of which has been distributed and is reflected in the balance of overdistributed net investment income.
During 2001, the fund elected to use a provision of the Taxpayer Relief Act of 1997 to mark to market certain appreciated securities held on January 1, 2001; such securities were treated as sold and repurchased, with unrealized gains of $46,006,000 becoming realized, for tax purposes. The mark-to-market created a difference between the cost of investments for financial statement and tax purposes, which will reverse when the securities are sold. Through July 31, 2009, the fund realized gains on the sale of these securities of $20,516,000 for financial statement purposes, which were included in prior year mark-to-market gains for tax purposes. The remaining difference of $25,490,000 is reflected in the balance of accumulated net realized gains; the corresponding difference between the securities’ cost for financial statement and tax purposes is reflected in unrealized depreciation.
At July 31, 2009, the cost of investment securities for tax purposes was $3,290,071,000. Net unrealized depreciation of investment securities for tax purposes was $271,129,000, consisting of unrealized gains of $539,207,000 on securities that had risen in value since their purchase and $810,336,000 in unrealized losses on securities that had fallen in value since their purchase.
22
Precious Metals and Mining Fund
F. During the six months ended July 31, 2009, the fund purchased $608,348,000 of investment securities and sold $264,106,000 of investment securities, other than temporary cash investments.
G. Capital shares issued and redeemed were:
| Six Months Ended | Year Ended |
| July 31, 2009 | January 31, 2009 |
| Shares | Shares |
| (000) | (000) |
Issued | 41,619 | 37,881 |
Issued in Lieu of Cash Distributions | 1,292 | 27,485 |
Redeemed | (18,881) | (50,837) |
Net Increase (Decrease) in Shares Outstanding | 24,030 | 14,529 |
H. Certain of the fund’s investments are in companies that are considered to be affiliated companies of the fund because the fund owns more than 5% of the outstanding voting securities of the company. Transactions during the period in securities of these companies were as follows:
| | | Current Period Transactions | |
| Jan. 31, 2009 | | Proceeds from | | July 31, 2009 |
| Market | Purchases | Securities | Dividend | Market |
| Value | at Cost | Sold | Income | Value |
| ($000) | ($000) | ($000) | ($000) | ($000) |
AMCOL International Corp. | 44,919 | — | 847 | 1,093 | 56,994 |
Centerra Gold Inc. | 61,150 | 3,826 | — | — | 96,151 |
Claude Resources, Inc. | 2,524 | — | 1,379 | — | NA1 |
Franco-Nevada Corp. | 171,223 | — | 105,537 | 468 | NA1 |
Harry Winston Diamond Corp. | 30,643 | 140 | — | — | 45,102 |
Harry Winston Diamond Corp. | | | | | |
Private Placement | 2,646 | — | — | — | 3,883 |
Hochschild Mining PLC | NA2 | 80,660 | — | 250 | 111,478 |
Iluka Resources Ltd. | 98,933 | 9,993 | — | — | 110,034 |
Imerys SA | 134,204 | — | 469 | 4,022 | 216,068 |
Johnson Matthey PLC | 160,598 | — | — | 4,869 | 270,336 |
Lonmin PLC | 101,515 | 33,530 | — | — | 239,769 |
Minerals Technologies, Inc. | 50,534 | 4,662 | — | 141 | 64,075 |
Panoramic Resources, Ltd. | — | 19,867 | — | — | 43,213 |
Peter Hambro Mining PLC | 55,203 | 45,764 | — | — | 125,645 |
Sherritt International Corp. | — | 17,787 | — | 606 | 84,360 |
St. Barbara Ltd. | 23,056 | 2,662 | — | — | 21,232 |
| 937,148 | | | 11,449 | 1,488,340 |
1 Not applicable because at July 31, 2009, the security was still held but the issuer was no longer an affiliated |
company of the fund. |
2 Not applicable because at January 31, 2009, the issuer was not an affiliated company of the fund. |
I. In preparing the financial statements as of July 31, 2009, management considered the impact of subsequent events occurring through September 10, 2009, for potential recognition or disclosure in these financial statements.
23
About Your Fund’s Expenses
As a shareholder of the fund, you incur ongoing costs, which include costs for portfolio management, administrative services, and shareholder reports (like this one), among others. Operating expenses, which are deducted from a fund’s gross income, directly reduce the investment return of the fund.
A fund’s expenses are expressed as a percentage of its average net assets. This figure is known as the expense ratio. The following examples are intended to help you understand the ongoing costs (in dollars) of investing in your fund and to compare these costs with those of other mutual funds. The examples are based on an investment of $1,000 made at the beginning of the period shown and held for the entire period.
The accompanying table illustrates your fund’s costs in two ways:
• Based on actual fund return. This section helps you to estimate the actual expenses that you paid over the period. The “Ending Account Value” shown is derived from the fund’s actual return, and the third column shows the dollar amount that would have been paid by an investor who started with $1,000 in the fund. You may use the information here, together with the amount you invested, to estimate the expenses that you paid over the period.
To do so, simply divide your account value by $1,000 (for example, an $8,600 account value divided by $1,000 = 8.6), then multiply the result by the number given for your fund under the heading “Expenses Paid During Period.”
• Based on hypothetical 5% yearly return. This section is intended to help you compare your fund’s costs with those of other mutual funds. It assumes that the fund had a yearly return of 5% before expenses, but that the expense ratio is unchanged. In this case—because the return used is not the fund’s actual return—the results do not apply to your investment. The example is useful in making comparisons because the Securities and Exchange Commission requires all mutual funds to calculate expenses based on a 5% return. You can assess your fund’s costs by comparing this hypothetical example with the hypothetical examples that appear in shareholder reports of other funds.
Six Months Ended July 31, 2009 | | | |
| Beginning | Ending | Expenses |
| Account Value | Account Value | Paid During |
Precious Metals and Mining Fund | 1/31/2009 | 7/31/2009 | Period1 |
Based on Actual Fund Return | $1,000.00 | $1,595.47 | $1.80 |
Based on Hypothetical 5% Return | 1,000.00 | 1,023.41 | 1.40 |
1 These calculations are based on expenses incurred in the most recent six-month period. The fund’s |
annualized six-month expense ratio for that period is 0.28%. The dollar amounts shown as “Expenses Paid” |
are equal to the annualized expense ratio multiplied by the average account value over the period, multiplied |
by the number of days in the most recent six-month period, then divided by the number of days in |
the most recent 12-month period. |
24
Note that the expenses shown in the table are meant to highlight and help you compare ongoing costs only and do not reflect transaction costs incurred by the fund for buying and selling securities. Further, the expenses do not include the 1% fee on redemptions of shares held for less than one year, nor do they include the account service fee described in the prospectus. If such fees were applied to your account, your costs would be higher. Your fund does not carry a “sales load.”
The calculations assume no shares were bought or sold during the period. Your actual costs may have been higher or lower, depending on the amount of your investment and the timing of any purchases or redemptions.
You can find more information about the fund’s expenses, including annual expense ratios, in the Financial Statements section of this report. For additional information on operating expenses and other shareholder costs, please refer to your fund’s current prospectus.
25
Trustees Approve Advisory Agreement
The board of trustees of Vanguard Precious Metals and Mining Fund has renewed the fund’s investment advisory agreement with M&G Investment Management Limited. The board determined that the retention of the advisor was in the best interests of the fund and its shareholders.
The board based its decision upon an evaluation of the advisor’s investment staff, portfolio management process, and performance. The trustees considered the factors discussed below, among others. However, no single factor determined whether the board approved the agreement. Rather, it was the totality of the circumstances that drove the board’s decision.
Nature, extent, and quality of services
The board considered the quality of the fund’s investment management over both the short and long term, and took into account the organizational depth and stability of the advisor. The board noted that M&G, founded in 1931, specializes in managing equity and fixed income portfolios for both institutional and retail clients worldwide. The firm has advised the fund since the fund’s inception in 1984. The advisor continues to employ a sound process, selecting companies which are broadly representative the metals and mining industries with an emphasis on large, stable, and diversified companies. The advisor’s global equity research team—composed of six senior investment professionals and four analysts—conducts intensive fundamental analysis on companies in the industry, including regular company visits.
The board concluded that the advisor’s experience, stability, depth, and performance, among other factors, warranted continuation of the advisory agreement.
Investment performance
The board considered the short- and long-term performance of the fund, including any periods of outperformance or underperformance of a relevant benchmark and peer group. The board noted that the fund is more broadly diversified than its competitors—with the ability to invest up to half of the fund’s assets in non-precious metals and mining stocks. The board concluded that the advisor has carried out the fund’s investment strategy in disciplined fashion, and that performance results have allowed the fund to remain competitive versus its benchmark over the long term; however, short-term performance had lagged because of the fund’s underweighting in gold stocks. Information about the fund’s most recent performance can be found in the Performance Summary section of this report.
Cost
The board concluded that the fund’s expense ratio was well below the average expense ratio charged by funds in its peer group. The board noted that the fund’s advisory fee rate was also well below its peer-group average. Information about the fund’s expense ratio appears in the About Your Fund’s Expenses section of this report as well as in the Financial Statements section, which also includes information about the advisory fee rate.
The board did not consider profitability of M&G in determining whether to approve the advisory fee, because M&G is independent of Vanguard, and the advisory fee is the result of arm’s-length negotiations.
The benefit of economies of scale
The board concluded that the fund’s shareholders benefit from economies of scale because of breakpoints in the advisory fee schedule. The breakpoints reduce the effective rate of the fee as the fund’s assets increase.
The board will consider whether to renew the advisory agreement again after a one-year period.
26
Glossary
Beta. A measure of the magnitude of a fund’s past share-price fluctuations in relation to the ups and downs of a given market index. The index is assigned a beta of 1.00. Compared with a given index, a fund with a beta of 1.20 typically would have seen its share price rise or fall by 12% when the index rose or fell by 10%. For this report, beta is based on returns over the past 36 months for both the fund and the index. Note that a fund’s beta should be reviewed in conjunction with its R-squared (see definition). The lower the R-squared, the less correlation there is between the fund and the index, and the less reliable beta is as an indicator of volatility.
Earnings Growth Rate. The average annual rate of growth in earnings over the past five years for the stocks now in a fund.
Equity Exposure. A measure that reflects a fund’s investments in stocks and stock futures. Any holdings in short-term reserves are excluded.
Expense Ratio. The percentage of a fund’s average net assets used to pay its annual administrative and advisory expenses. These expenses directly reduce returns to investors.
Foreign Holdings. The percentage of a fund represented by stocks or depositary receipts of companies based outside the United States.
Inception Date. The date on which the assets of a fund (or one of its share classes) are first invested in accordance with the fund’s investment objective. For funds with a subscription period, the inception date is the day after that period ends. Investment performance is measured from the inception date.
Median Market Cap. An indicator of the size of companies in which a fund invests; the midpoint of market capitalization (market price x shares outstanding) of a fund’s stocks, weighted by the proportion of the fund’s assets invested in each stock. Stocks representing half of the fund’s assets have market capitalizations above the median, and the rest are below it.
Price/Book Ratio. The share price of a stock divided by its net worth, or book value, per share. For a fund, the weighted average price/book ratio of the stocks it holds.
Price/Earnings Ratio. The ratio of a stock’s current price to its per-share earnings over the past year. For a fund, the weighted average P/E of the stocks it holds. P/E is an indicator of market expectations about corporate prospects; the higher the P/E, the greater the expectations for a company’s future growth.
R-Squared. A measure of how much of a fund’s past returns can be explained by the returns from the market in general, as measured by a given index. If a fund’s total returns were precisely synchronized with an index’s returns, its R-squared would be 1.00. If the fund’s returns bore no relationship to the index’s returns, its R-squared would be 0. For this report, R-squared is based on returns over the past 36 months for both the fund and the index.
Return on Equity. The annual average rate of return generated by a company during the past five years for each dollar of shareholder’s equity (net income divided by shareholder’s equity). For a fund, the weighted average return on equity for the companies whose stocks it holds.
Short-Term Reserves. The percentage of a fund invested in highly liquid, short-term securities that can be readily converted to cash.
Turnover Rate. An indication of the fund’s trading activity. Funds with high turnover rates incur higher transaction costs and may be more likely to distribute capital gains (which may be taxable to investors). The turnover rate excludes in-kind transactions, which have minimal impact on costs.
27
The People Who Govern Your Fund
The trustees of your mutual fund are there to see that the fund is operated and managed in your best interests since, as a shareholder, you are a part owner of the fund. Your fund’s trustees also serve on the board of directors of The Vanguard Group, Inc., which is owned by the Vanguard funds and provides services to them on an at-cost basis.
A majority of Vanguard’s board members are independent, meaning that they have no affiliation with Vanguard or the funds they oversee, apart from the sizable personal investments they have made as private individuals. The independent board members have distinguished backgrounds in business, academia, and public service. Each of the trustees and executive officers oversees 157 Vanguard funds.
The following table provides information for each trustee and executive officer of the fund. More information about the trustees is in the Statement of Additional Information, which can be obtained, without charge, by contacting Vanguard at 800-662-7447, or online at www.vanguard.com.
Interested Trustees | Emerson U. Fullwood |
| Born 1948. Trustee Since January 2008. Principal |
| Occupation(s) During the Past Five Years: Retired |
| Executive Chief Staff and Marketing Officer for North |
John J. Brennan1 | America and Corporate Vice President of Xerox |
Born 1954. Trustee Since May 1987. Chairman of | Corporation (photocopiers and printers); Director of |
the Board. Principal Occupation(s) During the Past | SPX Corporation (multi-industry manufacturing), the |
Five Years: Chairman of the Board and Director/Trustee | United Way of Rochester, the Boy Scouts of America, |
of The Vanguard Group, Inc., and of each of the | Amerigroup Corporation (direct health and medical |
investment companies served by The Vanguard Group; | insurance carriers), and Monroe Community College |
Chief Executive Officer and President of The Vanguard | Foundation. |
Group and of each of the investment companies served | |
by The Vanguard Group (1996-2008); Chairman of | |
the Financial Accounting Foundation; Governor of | Rajiv L. Gupta |
the Financial Industry Regulatory Authority (FINRA); | Born 1945. Trustee Since December 2001.2 Principal |
Director of United Way of Southeastern Pennsylvania. | Occupation(s) During the Past Five Years: Retired |
| Chairman and Chief Executive Officer of Rohm and |
F. William McNabb III1 | Haas Co. (chemicals); President of Rohm and Haas Co. |
Born 1957. Trustee Since July 2009. Principal | (2006-2008); Board Member of American Chemistry |
Occupation(s) During the Past Five Years: Director of | Council; Director of Tyco International, Ltd. (diversified |
The Vanguard Group, Inc., since 2008; Chief Executive | manufacturing and services) and Hewlett-Packard Co. |
Officer and President of The Vanguard Group and of | (electronic computer manufacturing); Trustee of The |
each of the investment companies served by The | Conference Board. |
Vanguard Group since 2008; Director of Vanguard | |
Marketing Corporation; Managing Director of The | |
Vanguard Group (1995-2008). | Amy Gutmann |
| Born 1949. Trustee Since June 2006. Principal |
| Occupation(s) During the Past Five Years: President of |
Independent Trustees | the University of Pennsylvania; Christopher H. Browne |
| Distinguished Professor of Political Science in the School |
Charles D. Ellis | of Arts and Sciences with Secondary Appointments |
Born 1937. Trustee Since January 2001. Principal | at the Annenberg School for Communication and the |
Occupation(s) During the Past Five Years: Applecore | Graduate School of Education of the University of |
Partners (pro bono ventures in education); Senior | Pennsylvania; Director of Carnegie Corporation of |
Advisor to Greenwich Associates (international business | New York, Schuylkill River Development Corporation, |
strategy consulting); Successor Trustee of Yale University; | and Greater Philadelphia Chamber of Commerce; |
Overseer of the Stern School of Business at New York | Trustee of the National Constitution Center. |
University; Trustee of the Whitehead Institute for | |
Biomedical Research. | |
JoAnn Heffernan Heisen | Executive Officers |
Born 1950. Trustee Since July 1998. Principal | | |
Occupation(s) During the Past Five Years: Retired | | |
Corporate Vice President, Chief Global Diversity Officer, | Thomas J. Higgins1 |
and Member of the Executive Committee of Johnson | Born 1957. Chief Financial Officer Since September |
& Johnson (pharmaceuticals/consumer products); | 2008. Principal Occupation(s) During the Past Five |
Vice President and Chief Information Officer of Johnson | Years: Principal of The Vanguard Group, Inc.; Chief |
& Johnson (1997-2005); Director of the University | Financial Officer of each of the investment companies |
Medical Center at Princeton and Women’s Research | served by The Vanguard Group since 2008; Treasurer |
and Education Institute. | of each of the investment companies served by The |
| Vanguard Group (1998-2008). |
| | |
Andr F. Perold | | |
Born 1952. Trustee Since December 2004. Principal | Kathryn J. Hyatt1 | |
Occupation(s) During the Past Five Years: George Gund | Born 1955. Treasurer Since November 2008. Principal |
Professor of Finance and Banking, Harvard Business | Occupation(s) During the Past Five Years: Principal of |
School; Director and Chairman of UNX, Inc. (equities | The Vanguard Group, Inc.; Treasurer of each of the |
trading firm); Chair of the Investment Committee of | investment companies served by The Vanguard |
HighVista Strategies LLC (private investment firm). | Group since 2008; Assistant Treasurer of each of the |
| investment companies served by The Vanguard Group |
| (1988-2008). | |
Alfred M. Rankin, Jr. | | |
Born 1941. Trustee Since January 1993. Principal | | |
Occupation(s) During the Past Five Years: Chairman, | Heidi Stam1 | |
President, Chief Executive Officer, and Director of | Born 1956. Secretary Since July 2005. Principal |
NACCO Industries, Inc. (forklift trucks/housewares/ | Occupation(s) During the Past Five Years: Managing |
lignite); Director of Goodrich Corporation (industrial | Director of The Vanguard Group, Inc., since 2006; |
products/aircraft systems and services). | General Counsel of The Vanguard Group since 2005; |
| Secretary of The Vanguard Group and of each of the |
| investment companies served by The Vanguard Group |
Peter F. Volanakis | since 2005; Director and Senior Vice President of |
Born 1955. Trustee Since July 2009. Principal | Vanguard Marketing Corporation since 2005; Principal |
Occupation(s) During the Past Five Years: President | of The Vanguard Group (1997-2006). |
since 2007 and Chief Operating Officer since 2005 | | |
of Corning Incorporated (communications equipment); | | |
President of Corning Technologies (2001-2005); Director | Vanguard Senior Management Team |
of Corning Incorporated and Dow Corning; Trustee of | | |
the Corning Incorporated Foundation and the Corning | | |
Museum of Glass; Overseer of the Amos Tuck School | R. Gregory Barton | Michael S. Miller |
of Business Administration at Dartmouth College. | Mortimer J. Buckley | James M. Norris |
| Kathleen C. Gubanich | Glenn W. Reed |
| Paul A. Heller | George U. Sauter |
| | |
| Founder | |
| | |
| John C. Bogle | |
| Chairman and Chief Executive Officer, 1974-1996 |
|
|
1 These individuals are “interested persons” as defined in the Investment Company Act of 1940. |
2 December 2002 for Vanguard Equity Income Fund, Vanguard Growth Equity Fund, the Vanguard Municipal Bond |
Funds, and the Vanguard State Tax-Exempt Funds. |

P.O. Box 2600
Valley Forge, PA 19482-2600
Connect with Vanguard® > www.vanguard.com
Fund Information > 800-662-7447 | All comparative mutual fund data are from Lipper Inc. |
| or Morningstar, Inc., unless otherwise noted. |
Direct Investor Account Services > 800-662-2739 | |
| |
Institutional Investor Services > 800-523-1036 | You can obtain a free copy of Vanguard’s proxy voting |
| guidelines by visiting our website, www.vanguard.com, |
Text Telephone for People | and searching for “proxy voting guidelines,” or by |
With Hearing Impairment > 800-952-3335 | calling Vanguard at 800-662-2739. The guidelines are |
| also available from the SEC’s website, www.sec.gov. |
| In addition, you may obtain a free report on how your |
| fund voted the proxies for securities it owned during |
This material may be used in conjunction | the 12 months ended June 30. To get the report, visit |
with the offering of shares of any Vanguard | either www.vanguard.com or www.sec.gov. |
fund only if preceded or accompanied by | |
the fund’s current prospectus. | You can review and copy information about your fund |
| at the SEC’s Public Reference Room in Washington, D.C. |
| To find out more about this public service, call the SEC |
| at 202-551-8090. Information about your fund is also |
| available on the SEC’s website, and you can receive |
| copies of this information, for a fee, by sending a |
| request in either of two ways: via e-mail addressed to |
| publicinfo@sec.gov or via regular mail addressed to the |
| Public Reference Section, Securities and Exchange |
| Commission, Washington, DC 20549-0102. |
| |
| |
| |
| © 2009 The Vanguard Group, Inc. |
| All rights reserved. |
| Vanguard Marketing Corporation, Distributor. |
| |
| Q532 092009 |


> | For the six months ended July 31, 2009, the Investor Shares of Vanguard Health Care Fund returned 9.63% and the Admiral Shares 9.68%. |
> | The fund outperformed its market benchmark, the Standard & Poor’s Health Care Index, for the period. Health care stocks trailed the broad stock market. |
> | Pharmaceutical stocks, which accounted for almost 60% of the fund’s holdings on average, were the engine of performance during the six months. |
See page 27 for a Notice to Shareholders concerning the fund’s investment advisors. |
Contents | |
| |
Your Fund’s Total Returns | 1 |
President’s Letter | 2 |
Advisor’s Report | 6 |
Results of Proxy Voting | 8 |
Fund Profile | 10 |
Performance Summary | 12 |
Financial Statements | 13 |
About Your Fund’s Expenses | 25 |
Notice to Shareholders | 27 |
Glossary | 29 |
Please note: The opinions expressed in this report are just that—informed opinions. They should not be considered promises or advice. Also, please keep in mind that the information and opinions cover the period through the date on the front of this report. Of course, the risks of investing in your fund are spelled out in the prospectus.
See the Glossary for definitions of investment terms used in this report.
Your Fund’s Total Returns
Six Months Ended July 31, 2009 | |
| |
| Total |
| Returns |
Vanguard Health Care Fund | |
Investor Shares | 9.63% |
Admiral™ Shares | 9.68 |
S&P Health Care Index | 7.41 |
Global Health/Biotechnology Funds Average | 11.09 |
Global Health/Biotechnology Funds Average: Derived from data provided by Lipper Inc. |
Admiral Shares are a lower-cost class of shares available to many longtime shareholders and to those with |
significant investments in the fund. |
Your Fund’s Performance at a Glance | | |
January 31, 2009, Through July 31, 2009 | | |
| | | | |
| | | Distributions Per Share |
| Starting | Ending | Income | Capital |
| Share Price | Share Price | Dividends | Gains |
Vanguard Health Care Fund | | | | |
Investor Shares | $99.12 | $108.61 | $0.049 | $0.000 |
Admiral Shares | 41.83 | 45.85 | 0.025 | 0.000 |
1

President’s Letter
Dear Shareholder,
Although the health care sector posted gains for the six months ended July 31, the sector significantly underperformed the broad U.S. stock market. During the period, Vanguard Health Care Fund outperformed its benchmark by more than 2 percentage points but lagged the average result for global health/ biotechnology funds.
Strongly performing holdings in pharmaceuticals and providers of health care products, facilities, and services were the biggest contributors to the fund’s performance. Biotechnology stocks weighed on returns for the period.
Stocks rose on signs that recovery is taking root
For the six months ended July 31, the broad U.S. stock market returned about 23%. The period began in gloom, with stocks declining in February and early March before staging a strong springtime rally. After pausing in June, the market surged nearly 8% in July as investors reacted to improvement in the housing market, an increase in manufacturing activity, rising corporate earnings, and cautiously optimistic comments from the Federal Reserve Board.
Global stock markets performed even better, advancing almost 38% for the period. Encouraging earnings reports and higher commodity prices lifted international stocks off their lows in early March. After
2
three straight months of solid gains, the MSCI All Country World Index ex USA fell slightly in June before rallying again in July.
Although stock markets worldwide have been in recovery mode for five months and various economic signs point to the recession’s end, the health of global financial markets and economies remained fragile as the period ended. Unemployment, in particular, was still a major concern both in the United States and abroad.
Investors departed Treasuries for higher-yielding bonds
For the six months, the Barclays Capital U.S. Aggregate Bond Index, a broad measure of the investment-grade market, returned more than 4%. That return paled, however, next to the 30% return of lower-quality bonds, as measured by the Barclays Capital U.S. Corporate High Yield Bond Index. In mid-March, investors seemed to gain confidence in the federal government’s efforts to thaw the credit markets and stimulate the economy, and they started shifting from U.S. Treasury bonds to corporate issues—particularly below-investment-grade bonds, which offered the highest yields. Municipal bonds also benefited from government support, with the broad tax-exempt market returning about 4% for the six months.
Efforts to combat the financial crisis have included a combination of aggressive monetary policy and large fiscal programs, most notably the nearly $800 billion American Recovery and Reinvestment Act. On the monetary side, the Fed has kept
Market Barometer | | | |
| | | |
| Total Returns |
| Periods Ended July 31, 2009 |
| Six | One | Five Years |
| Months | Year | (Annualized) |
Stocks | | | |
Russell 1000 Index (Large-caps) | 22.26% | -20.17% | 0.32% |
Russell 2000 Index (Small-caps) | 26.61 | -20.72 | 1.52 |
Dow Jones U.S. Total Stock Market Index | 23.23 | -19.67 | 0.81 |
MSCI All Country World Index ex USA (International) | 37.70 | -20.90 | 7.57 |
| | | |
Bonds | | | |
Barclays Capital U.S. Aggregate Bond Index (Broad | | | |
taxable market) | 4.47% | 7.85% | 5.14% |
Barclays Capital Municipal Bond Index | 4.38 | 5.11 | 4.21 |
Citigroup Three-Month U.S. Treasury Bill Index | 0.09 | 0.65 | 3.00 |
| | | |
CPI | | | |
Consumer Price Index | 1.99% | -2.10% | 2.60% |
3
its target for short-term interest rates at an all-time low of 0% to 0.25%, a target it expects to maintain for “an extended period.” For the last several months, the Fed has been purchasing Treasury and mortgage-backed securities, an effort to keep longer-term interest rates and borrowing costs low. In recent months, however, Treasury yields have risen amid concerns about longer-term budget deficits.
Health care stocks lagged the broad market’s rebound
Often considered defensive in nature, the health care sector shone as one of the brightest areas of the market when stocks experienced extreme volatility from late 2007 through early 2009. However, when stocks began to rally in March 2009 and investors began to venture out of the market’s safer harbors, the health care sector fell behind. Although the sector lagged the broad market by double digits at the end of the six months, it did finish solidly in positive territory.
The health care industry has also been grappling with a number of fundamental issues: fast-approaching patent expirations for some of the nation’s leading drugs; a slower, more conservative approval process for new drugs; and uncertainty about the implications of health care reform.
Vanguard Health Care Fund finished the period with a return of about 9.6%, a couple of points ahead of its benchmark index. Strongly performing holdings in pharmaceuticals—which, on average, accounted for almost 60% of the fund’s
Expense Ratios | | | |
Your Fund Compared With Its Peer Group | |
| | | Global Health/ |
| Investor | Admiral | Biotechnology Funds |
| Shares | Shares | Average |
Health Care Fund | 0.33% | 0.25% | 1.58% |
The fund expense ratios shown are from the prospectus dated May 29, 2009, and represent estimated costs for the current fiscal year based on the fund’s net assets as of the prospectus date. For the six months ended July 31, 2009, the Health Care Fund’s annualized expense ratios were 0.38% for Investor Shares and 0.30% for Admiral Shares. The peer-group expense ratio is derived from data provided by Lipper Inc. and captures information through year-end 2008.
4
assets—played a large role in the fund’s outperformance. Stocks in the health care providers and services subsector also helped boost returns.
Within the broad health care industry, biotechnology stocks were the only area to post a negative result for the period. The fund’s sizable investments in some of the poorly performing biotech firms detracted from its performance.
A word on expenses
In the table on page 4, you’ll see our estimated expense ratio for fiscal 2010 and, in the footnote, the actual expense ratio for the first half of the fiscal year. Both figures have risen since fiscal 2009. The explanation is threefold.
First, as the value of fund assets has declined, the fund’s fixed expenses are expected to account for a modestly higher percentage of fund assets. Second, in fiscal 2009, the fund’s board of directors approved an increase in the advisory fee that took effect on August 31, 2008.
Finally, the Vanguard funds’ contracts with external advisors typically include breakpoint pricing. As assets rise above a breakpoint threshold, advisory fees are paid at a lower rate. When assets fall, as they have since the start of fiscal 2010, a smaller portion of assets is subject to the lower rate, causing the overall rate to increase. Over time, breakpoint pricing has helped shareholders benefit from the economies of scale produced by growth in the fund’s assets.
Please see page 27 for a Notice to Shareholders concerning the most recent advisory fee schedule approved by the fund’s board of directors. The new agreement is expected to produce modestly higher advisory fees.
Sector funds can play a part in a well-balanced portfolio
Investors have been forced to endure many challenges over the past year and a half. In 2008, the U.S. stock market experienced its worst calendar year since the 1930s. The beginning of 2009 brought more bad news, as prices continued to fall until March. As market shifts continue on almost a daily basis, it’s impossible to say where stocks will go from here.
Because of the market’s unpredictable nature, we encourage investors to tune out the short-term “noise” and instead focus on constructing a portfolio that contains a mix of stocks, bonds, and money market funds appropriate for your long-term goals. Such a well-balanced portfolio can provide you with some protection from the market’s extreme ups and downs while also giving you the opportunity for long-term growth. We believe that Vanguard Health Care Fund can play a part in such a well-balanced portfolio.
Thank you for investing with Vanguard.
Sincerely,

F. William McNabb III
President and Chief Executive Officer
August 12, 2009
5
Advisor’s Report
Vanguard Health Care Fund returned 9.63% for Investor Shares and 9.68% for Admiral Shares in the six months ended July 31, 2009. This compares to the S&P 500 Index return of 21.18%, the S&P Health Care Index return of 7.41%, and the average return of 11.09% for global health/biotechnology funds.
The investment environment
After collapsing to a historic low in early March, the stock market strongly rebounded to post excellent returns for the six-month period. During this time, health care stocks demonstrated their typically defensive characteristics, outperforming during the decline phase and then seriously lagging the subsequent rebound. Complicating the picture has been the market’s anticipation of the effects of U.S. health care reform. More aggressive intrusion by the government into the management of health care is being interpreted as negative for industry.
Managed-care companies and big pharmaceutical companies generally did better during the half-year than they had during the prior six months.
Our successes
Schering-Plough, AstraZeneca, and Cerner were our strongest contributors during the period. Schering-Plough’s stock price jumped significantly following news that the company would merge with Merck. Cerner shares benefited from the government’s economic stimulus package, which should help spur growth in health care usage of information technology.
Portfolio Changes | |
Six Months Ended July 31, 2009 | |
| |
Additions | Comments |
Cardinal Health | We took advantage of weakness to add to our holding. |
Cephalon | Also augmented on weakness. |
| |
Reductions | Comments |
Allergan | Eliminated after strong performance. |
Schering-Plough | Reduced to take advantage of strong performance; |
| still our largest holding. |
Sanofi-Aventis | Reduced because of lowered growth expectations. |
6
Our shortfalls
Holdings in Abbott Laboratories, Genzyme, and Takeda Pharmaceutical were weak. Abbott had a strong 2008, but has given back gains in 2009. Takeda’s stock price fell following news that the U.S. Food and Drug Administration probably will not approve the company’s diabetes drug without more clinical data to satisfy the FDA’s cardiovascular safety requirements.
The fund’s positioning
Following the sector’s significant underperformance in what may prove to have been a bear market rally, we believe health care is now positioned to perform well relative to the rest of the market. Valuations are reasonable. If the health care reform package ends up on the moderate side, the outlook could be quite favorable. Our all-weather strategy of diversification across industry subsectors and geographies with a focus on attractive valuations remains the centerpiece of our investment strategy.
Edward P. Owens
Senior Vice President and
Portfolio Manager
Jean M. Hynes
Senior Vice President and
Associate Portfolio Manager
Wellington Management Company, LLP
August 12, 2009
7
Results of Proxy Voting
At a special meeting of shareholders on July 2, 2009, fund shareholders approved the following two proposals:
Proposal 1 – Elect trustees for each fund.*
The individuals listed in the table below were elected as trustees for each fund. All trustees with the exception of Messrs. McNabb and Volanakis (both of whom already served as directors of The Vanguard Group, Inc.) served as trustees to the funds prior to the shareholder meeting.
| | | Percentage |
Trustee | For | Withheld | For |
John J. Brennan | 831,083,148 | 23,429,009 | 97.3% |
Charles D. Ellis | 815,919,984 | 38,592,173 | 95.5% |
Emerson U. Fullwood | 818,220,903 | 36,291,254 | 95.8% |
Rajiv L. Gupta | 827,792,136 | 26,720,020 | 96.9% |
Amy Gutmann | 828,576,544 | 25,935,613 | 97.0% |
JoAnn Heffernan Heisen | 827,968,189 | 26,543,968 | 96.9% |
F. William McNabb III | 830,218,855 | 24,293,302 | 97.2% |
Andr F. Perold | 817,862,692 | 36,649,465 | 95.7% |
Alfred M. Rankin, Jr. | 827,956,891 | 26,555,266 | 96.9% |
Peter F. Volanakis | 829,990,273 | 24,521,884 | 97.1% |
* Results are for all funds within the same trust. |
Proposal 2–Update and standardize the funds’ fundamental policies regarding: |
(a) | Purchasing and selling real estate. |
(b) | Issuing senior securities. |
(c) | Borrowing money. |
(d) | Making loans. |
(e) | Purchasing and selling commodities. |
(f) | Concentrating investments in a particular industry or group of industries. |
(g) | Eliminating outdated fundamental investment policies not required by law. |
The revised fundamental policies are clearly stated and simple, yet comprehensive, making oversight and compliance more efficient than under the former policies. The revised fundamental policies will allow the funds to respond more quickly to regulatory and market changes, while avoiding the costs and delays associated with successive shareholder meetings.
| | | | Broker | Percentage |
Vanguard Fund | For | Abstain | Against | Non-Votes | For |
Health Care Fund | | | | | |
2a | 170,766,604 | 3,507,534 | 10,319,558 | 16,898,995 | 84.8% |
2b | 170,338,340 | 4,557,458 | 9,697,893 | 16,898,999 | 84.5% |
2c | 167,481,321 | 4,153,181 | 12,959,190 | 16,898,998 | 83.1% |
2d | 167,879,486 | 4,210,105 | 12,504,100 | 16,898,999 | 83.3% |
2e | 167,828,948 | 3,976,004 | 12,788,739 | 16,898,999 | 83.3% |
2f | 172,469,110 | 4,033,283 | 8,091,302 | 16,898,996 | 85.6% |
2g | 173,947,079 | 4,077,764 | 6,568,852 | 16,898,994 | 86.3% |
8
Fund shareholders did not approve the following proposal:
Proposal 3–Institute procedures to prevent holding investments in companies that, in the judgment of the board, substantially contribute to genocide or crimes against humanity, the most egregious violations of human rights.
The trustees recommended a vote against this proposal because it called for procedures that duplicate existing practices and procedures of the Vanguard funds.
| | | | Broker | Percentage |
Vanguard Fund | For | Abstain | Against | Non-Votes | For |
Health Care Fund | 28,323,289 | 5,906,193 | 150,360,063 | 16,903,145 | 14.1% |
9
Health Care Fund
Fund Profile
As of July 31, 2009
Share-Class Characteristics | |
| | |
| Investor | Admiral |
| Shares | Shares |
Ticker Symbol | VGHCX | VGHAX |
Expense Ratio1 | 0.33% | 0.25% |
30-Day SEC Yield | 1.11% | 1.17% |
Portfolio Characteristics | | |
| | | DJ |
| | | U.S. Total |
| | S&P Health | Market |
| Fund | Care Index | Index |
Number of Stocks | 77 | 53 | 4,370 |
Median Market Cap | $33.4B | $43.3B | $26.1B |
Price/Earnings Ratio | 15.0x | 16.2x | 23.0x |
Price/Book Ratio | 2.4x | 2.8x | 2.1x |
Return on Equity | 17.3% | 20.2% | 19.6% |
Earnings Growth Rate | 10.9% | 16.7% | 12.6% |
Dividend Yield | 2.2% | 2.1% | 2.0% |
Foreign Holdings | 24.9% | 0.0% | 0.0% |
Turnover Rate (Annualized) | 5% | — | — |
Short-Term Reserves | 6.2% | — | — |
Volatility Measures | | |
| | DJ |
| | U.S. Total |
| S&P Health | Market |
| Care Index | Index |
R-Squared | 0.95 | 0.64 |
Beta | 0.98 | 0.66 |
These measures show the degree and timing of the fund’s |
fluctuations compared with the indexes over 36 months. |
Ten Largest Holdings (% of total net assets) |
| | |
Schering-Plough Corp. | Pharmaceuticals | 7.5% |
Forest Laboratories, Inc. | Pharmaceuticals | 4.2 |
Roche Holdings AG | Pharmaceuticals | 3.7 |
Eli Lilly & Co. | Pharmaceuticals | 3.7 |
AstraZeneca Group PLC | Pharmaceuticals | 3.7 |
Abbott Laboratories | Pharmaceuticals | 3.2 |
Wyeth | Pharmaceuticals | 3.2 |
McKesson Corp. | Health Care Distributors | 3.1 |
Merck & Co., Inc. | Pharmaceuticals | 3.1 |
Amgen Inc. | Biotechnology | 2.9 |
Top Ten | | 38.3% |
The holdings listed exclude any temporary cash investments and |
equity index products. |
1 The expense ratios shown are from the prospectus dated May 29, 2009, and represent estimated costs for the current fiscal year |
based on the fund’s net assets as of the prospectus date. For the six months ended July 31, 2009, the Health Care Fund’s |
annualized expense ratios were 0.38% for Investor Shares and 0.30% for Admiral Shares. |
10
Health Care Fund
Sector Diversification (% of equity exposure) |
| | S&P Health |
| Fund | Care Index |
Biotechnology | 7.6% | 13.9% |
Consumer Staples | 2.3 | 0.0 |
Health Care Distributors | 5.1 | 2.9 |
Health Care Equipment | 7.3 | 13.8 |
Health Care Facilities | 1.2 | 0.1 |
Health Care Services | 3.1 | 5.5 |
Health Care Supplies | 0.5 | 0.4 |
Health Care Technology | 1.8 | 0.2 |
Industrials | 0.4 | 0.0 |
Life Sciences Tools & | | |
Services | 0.3 | 3.2 |
Managed Health Care | 10.0 | 7.4 |
Materials | 1.0 | 0.0 |
Pharmaceuticals | 59.4 | 52.6 |
Sector percentages combine U.S. and international holdings. |
Market Diversification (% of equity exposure) |
| Fund |
Europe | |
Switzerland | 6.5% |
United Kingdom | 4.4 |
France | 3.0 |
Other Europe | 1.9 |
Subtotal | 15.8 |
Pacific | |
Japan | 10.9% |
North America | |
United States | 73.3% |
Percentages exclude currency contracts held by the fund. |
11
Health Care Fund
Performance Summary
All of the returns in this report represent past performance, which is not a guarantee of future results that may be achieved by the fund. (Current performance may be lower or higher than the performance data cited. For performance data current to the most recent month-end, visit our website at www.vanguard.com/performance.) Note, too, that both investment returns and principal value can fluctuate widely, so an investor’s shares, when sold, could be worth more or less than their original cost. The returns shown do not reflect taxes that a shareholder would pay on fund distributions or on the sale of fund shares.
Fiscal-Year Total Returns (%): January 31, 1999, Through July 31, 2009
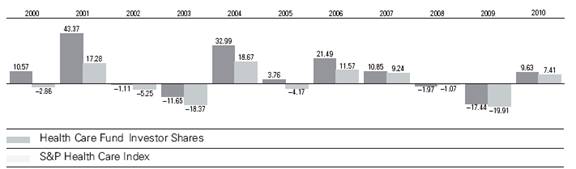
Note: For 2010, performance data reflect the six months ended July 31, 2009
Average Annual Total Returns: Periods Ended June 30, 2009
This table presents average annual total returns through the latest calendar quarter—rather than through the end of the fiscal period. Securities and Exchange Commission rules require that we provide this information.
| Inception Date | One Year | Five Years | Ten Years |
Investor Shares | 5/23/1984 | -8.55% | 3.00% | 7.53% |
Admiral Shares | 11/12/2001 | -8.48 | 3.09 | 4.601 |
1 Return since inception. | | | | |
Total returns do not reflect the 1% fee assessed on redemptions of shares held for less than one year, nor for the Investor Shares do they include the account service fee that may be applicable to certain accounts with balances below $10,000.
See Financial Highlights for dividend and capital gains information.
12
Health Care Fund
Financial Statements (unaudited)
Statement of Net Assets
As of July 31, 2009
The fund provides a complete list of its holdings four times in each fiscal year, at the quarter-ends. For the second and fourth fiscal quarters, the lists appear in the fund’s semiannual and annual reports to shareholders. For the first and third fiscal quarters, the fund files the lists with the Securities and Exchange Commission on Form N-Q. Shareholders can look up the fund’s Forms N-Q on the SEC’s website at www.sec.gov. Forms N-Q may also be reviewed and copied at the SEC’s Public Reference Room (see the back cover of this report for further information).
| | | Market |
| | | Value• |
| | Shares | ($000) |
Common Stocks (93.9%) | |
United States (69.0%) | | |
Biotechnology (7.1%) | | |
* | Amgen Inc. | 8,838,455 | 550,724 |
* | Genzyme Corp. | 5,519,340 | 286,398 |
* | Cephalon, Inc. | 2,552,000 | 149,675 |
*,1 | OSI Pharmaceuticals, Inc. | 3,612,000 | 122,049 |
* | Biogen Idec Inc. | 1,820,000 | 86,541 |
* | Vertex | �� | |
| Pharmaceuticals, Inc. | 1,593,800 | 57,393 |
* | Onyx Pharmaceuticals, Inc. | 807,200 | 28,995 |
* | Amylin | | |
| Pharmaceuticals, Inc. | 1,957,200 | 28,790 |
* | United Therapeutics Corp. | 111,000 | 10,281 |
* | Cubist | | |
| Pharmaceuticals, Inc. | 383,528 | 7,621 |
| | | 1,328,467 |
Chemicals (0.9%) | | |
| Sigma-Aldrich Corp. | 3,480,000 | 176,610 |
| | | |
Food & Staples Retailing (1.9%) | |
| Walgreen Co. | 11,650,000 | 361,733 |
| | | |
Health Care Equipment & Supplies (7.3%) |
* | St. Jude Medical, Inc. | 8,810,900 | 332,259 |
| Medtronic, Inc. | 7,314,900 | 259,094 |
| Becton, Dickinson & Co. | 3,402,500 | 221,673 |
| Beckman Coulter, Inc. | 2,511,784 | 158,217 |
| Baxter International, Inc. | 2,700,000 | 152,199 |
| DENTSPLY | | |
| International Inc. | 2,485,400 | 82,888 |
* | Hospira, Inc. | 1,595,070 | 61,299 |
| Covidien PLC | 1,150,000 | 43,481 |
* | Zimmer Holdings, Inc. | 500,000 | 23,300 |
| STERIS Corp. | 803,083 | 22,551 |
| | | 1,356,961 |
Health Care Providers & Services (18.1%) | |
| McKesson Corp. | 11,489,900 | 587,708 |
| UnitedHealth Group Inc. | 19,485,100 | 546,752 |
* | WellPoint Inc. | 6,802,400 | 358,078 |
| Quest Diagnostics, Inc. | 5,785,400 | 315,999 |
* | Humana Inc. | 8,094,800 | 265,914 |
| CIGNA Corp. | 8,510,600 | 241,701 |
| Cardinal Health, Inc. | 6,536,708 | 217,672 |
*,1 | Coventry Health Care Inc. | 9,057,500 | 208,322 |
* | Laboratory Corp. of | | |
| America Holdings | 2,731,360 | 183,520 |
| Universal Health | | |
| Services Class B | 2,160,400 | 120,140 |
*,1 | Health Management | | |
| Associates Class A | 15,756,900 | 95,014 |
| Owens & Minor, Inc. | 2,000,000 | 88,600 |
| Aetna Inc. | 2,350,000 | 63,380 |
* | Health Net Inc. | 4,663,458 | 63,097 |
* | DaVita, Inc. | 304,600 | 15,139 |
* | WellCare Health Plans Inc. | 449,000 | 9,995 |
| | | 3,381,031 |
Health Care Technology (1.7%) | |
* | Cerner Corp. | 3,250,000 | 211,510 |
| IMS Health, Inc. | 8,547,400 | 102,569 |
| | | 314,079 |
Household Products (0.1%) | | |
* | Energizer Holdings, Inc. | 387,300 | 24,810 |
| | | |
Life Sciences Tools & Services (0.3%) | |
*,1 | PAREXEL | | |
| International Corp. | 3,140,400 | 48,582 |
| | | |
Machinery (0.3%) | | |
| Pall Corp. | 2,104,600 | 63,306 |
| | | |
Personal Products (0.1%) | | |
| Mead Johnson | | |
| Nutrition Co. | 270,400 | 9,845 |
13
Health Care Fund
| | | Market |
| | | Value• |
| | Shares | ($000) |
Pharmaceuticals (31.2%) | | |
| Schering-Plough Corp. | 52,941,700 | 1,403,484 |
*,1 | Forest Laboratories, Inc. | 30,133,000 | 778,335 |
| Eli Lilly & Co. | 19,879,900 | 693,610 |
| Abbott Laboratories | 13,300,000 | 598,367 |
| Wyeth | 12,838,800 | 597,646 |
| Merck & Co., Inc. | 19,471,200 | 584,331 |
| Pfizer Inc. | 30,813,570 | 490,860 |
| Bristol-Myers Squibb Co. | 16,490,000 | 358,493 |
| Perrigo Co. (U.S.Shares) | 4,150,000 | 112,631 |
* | Sepracor Inc. | 4,857,900 | 84,285 |
* | Watson | | |
| Pharmaceuticals, Inc. | 2,100,000 | 72,933 |
| Johnson & Johnson | 800,000 | 48,712 |
| | | 5,823,687 |
Total United States | | 12,889,111 |
International (24.9%) | | |
Belgium (0.3%) | | |
| UCB SA | 1,944,146 | 64,254 |
| | | |
Denmark (0.3%) | | |
^ | Novo Nordisk A/S | | |
| B Shares | 800,000 | 46,812 |
| | | |
France (2.8%) | | |
| Sanofi-Aventis | 6,926,233 | 453,163 |
| Ipsen Promesses | 1,400,000 | 64,428 |
| | | 517,591 |
Germany (0.8%) | | |
| Bayer AG | 1,994,656 | 122,242 |
| Fresenius | | |
| Medical Care AG | 611,950 | 28,106 |
| | | 150,348 |
Ireland (0.3%) | | |
* | Elan Corp. PLC ADR | 7,721,600 | 60,846 |
| | | |
Japan (10.2%) | | |
| Astellas Pharma Inc. | 14,265,700 | 541,892 |
| Takeda | | |
| Pharmaceutical Co. Ltd. | 9,949,900 | 400,829 |
| Eisai Co., Ltd. | 9,493,700 | 336,841 |
| Daiichi Sankyo Co., Ltd. | 12,251,500 | 220,993 |
| Shionogi & Co., Ltd. | 9,876,000 | 202,904 |
| Tanabe Seiyaku Co., Ltd. | 6,850,000 | 81,375 |
| Chugai | | |
| Pharmaceutical Co., Ltd. | 4,101,800 | 74,801 |
| Ono | | |
| Pharmaceutical Co., Ltd. | 960,000 | 42,519 |
| Terumo Corp. | 200,000 | 10,135 |
| | | 1,912,289 |
Switzerland (6.1%) | | |
| Roche Holdings AG | 3,968,977 | 625,697 |
| Novartis AG (Registered) | 9,519,880 | 434,959 |
| Roche Holdings AG (Bearer) | 429,320 | 71,309 |
| | | 1,131,965 |
United Kingdom (4.1%) | | |
| AstraZeneca Group PLC | 14,881,500 | 693,154 |
| GlaxoSmithKline | | |
| PLC ADR | 1,942,381 | 74,374 |
| | | 767,528 |
Total International | | 4,651,633 |
Total Common Stocks | | |
(Cost $14,225,456) | | 17,540,744 |
Temporary Cash Investments (6.1%) | |
Money Market Fund (0.0%) | | |
2,3 | Vanguard Market | | |
| Liquidity Fund, 0.335% | 331,886 | 332 |
| | | |
| | Face | |
| | Amount | |
| | ($000) | |
Commercial Paper (1.1%) | | |
| General Electric | | |
| Capital Corp., | | |
| 0.300%, 10/22/09 | 200,000 | 199,830 |
Repurchase Agreement (5.0%) | |
| Banc of America | | |
| Securities, LLC 0.200%, | | |
| 8/3/09 (Dated 7/31/09, | | |
| Repurchase Value | | |
| $937,116,000, collateralized | |
| by Federal National | | |
| Mortgage Assn. 6.000%, | | |
| 5/1/38) | 937,100 | 937,100 |
Total Temporary Cash Investments | |
(Cost $1,137,295) | | 1,137,262 |
Total Investments (100.0%) | | |
(Cost $15,362,751) | | 18,678,006 |
Other Assets and Liabilities (0.0%) | |
Other Assets | | 50,827 |
Liabilities3 | | (58,451) |
| | | (7,624) |
Net Assets (100%) | | 18,670,382 |
14
Health Care Fund
At July 31, 2009, net assets consisted of: |
| Amount |
| ($000) |
Paid-in Capital | 15,152,659 |
Undistributed Net Investment Income | 159,929 |
Accumulated Net Realized Gains | 41,771 |
Unrealized Appreciation (Depreciation) | |
Investment Securities | 3,315,255 |
Foreign Currencies | 768 |
Net Assets | 18,670,382 |
| |
Investor Shares–Net Assets | |
Applicable to 100,273,780 outstanding | |
$.001 par value shares of beneficial | |
interest (unlimited authorization) | 10,891,086 |
Net Asset Value Per Share– | |
Investor Shares | $108.61 |
| |
Admiral Shares–Net Assets | |
Applicable to 169,669,831 outstanding | |
$.001 par value shares of beneficial | |
interest (unlimited authorization) | 7,779,296 |
Net Asset Value Per Share– | |
Admiral Shares | $45.85 |
• See Note A in Notes to Financial Statements. |
* Non-income-producing security. |
^ Part of security position is on loan to broker-dealers. The total value of securities on loan is $315,000. |
1 Considered an affiliated company of the fund as the fund owns more than 5% of the outstanding voting |
securities of such company. |
2 Affiliated money market fund available only to Vanguard funds and certain trusts and accounts managed |
by Vanguard. Rate shown is the 7-day yield. |
3 Includes $332,000 of collateral received for securities on loan. |
ADR–American Depositary Receipt. |
See accompanying Notes, which are an integral part of the Financial Statements.
15
Health Care Fund
Statement of Assets and Liabilities
As of July 31, 2009
| Market Value |
| ($000) |
Assets | |
Investments in Securities, at Value | 18,678,006 |
Receivables for Investment Securities Sold | 21,336 |
Receivables for Capital Shares Issued | 4,661 |
Other Assets | 24,830 |
Total Assets | 18,728,833 |
Liabilities | |
Security Lending Collateral Payable to Brokers | 332 |
Payables for Capital Shares Redeemed | 9,268 |
Other Liabilities | 48,851 |
Total Liabilities | 58,451 |
Net Assets | 18,670,382 |
See accompanying Notes, which are an integral part of the Financial Statements.
16
Health Care Fund
Statement of Operations
| Six Months Ended |
| July 31, 2009 |
| ($000) |
Investment Income | |
Income | |
Dividends1,2 | 231,416 |
Interest | 965 |
Security Lending | 4,023 |
Total Income | 236,404 |
Expenses | |
Investment Advisory Fees–Note B | 11,490 |
The Vanguard Group–Note C | |
Management and Administrative–Investor Shares | 10,255 |
Management and Administrative–Admiral Shares | 4,919 |
Marketing and Distribution–Investor Shares | 1,235 |
Marketing and Distribution–Admiral Shares | 880 |
Custodian Fees | 85 |
Auditing Fees | 1 |
Shareholders’ Reports and Proxies–Investor Shares | 469 |
Shareholders’ Reports and Proxies–Admiral Shares | 68 |
Trustees’ Fees and Expenses | 20 |
Total Expenses | 29,422 |
Net Investment Income | 206,982 |
Realized Net Gain (Loss) | |
Investment Securities Sold2 | 70,811 |
Foreign Currencies | (684) |
Realized Net Gain (Loss) | 70,127 |
Change in Unrealized Appreciation (Depreciation) | |
Investment Securities | 1,301,650 |
Foreign Currencies | 830 |
Change in Unrealized Appreciation (Depreciation) | 1,302,480 |
Net Increase (Decrease) in Net Assets Resulting from Operations | 1,579,589 |
1Dividends are net of foreign withholding taxes of $14,365,000. |
2Dividend income and realized net gain (loss) from affiliated companies of the fund were $0 and |
($8,411,000), respectively. |
See accompanying Notes, which are an integral part of the Financial Statements.
17
Health Care Fund
Statement of Changes in Net Assets
| Six Months Ended | Year Ended |
| July 31, | January 31, |
| 2009 | 2009 |
| ($000) | ($000) |
Increase (Decrease) in Net Assets | | |
Operations | | |
Net Investment Income | 206,982 | 358,569 |
Realized Net Gain (Loss) | 70,127 | 1,460,834 |
Change in Unrealized Appreciation (Depreciation) | 1,302,480 | (5,975,753) |
Net Increase (Decrease) in Net Assets Resulting from Operations | 1,579,589 | (4,156,350) |
Distributions | | |
Net Investment Income | | |
Investor Shares | (5,039) | (187,362) |
Admiral Shares | (4,391) | (143,549) |
Realized Capital Gain1 | | |
Investor Shares | – | (936,594) |
Admiral Shares | – | (684,776) |
Total Distributions | (9,430) | (1,952,281) |
Capital Share Transactions | | |
Investor Shares | (505,327) | (324,652) |
Admiral Shares | (448,968) | (339,252) |
Net Increase (Decrease) from Capital Share Transactions | (954,295) | (663,904) |
Total Increase (Decrease) | 615,864 | (6,772,535) |
Net Assets | | |
Beginning of Period | 18,054,518 | 24,827,053 |
End of Period2 | 18,670,382 | 18,054,518 |
1 Includes fiscal 2009 short-term gain distributions totaling $47,615,000. Short-term gain distributions are treated as |
ordinary income dividends for tax purposes. |
2 Net Assets–End of Period includes undistributed (overdistributed) net investment income of $159,929,000 |
and ($36,939,000). |
See accompanying Notes, which are an integral part of the Financial Statements.
18
Health Care Fund
Financial Highlights
Investor Shares | | | | | | |
| Six | | | | | |
| Months | | | | | |
| Ended | | | |
For a Share Outstanding | July 31, | Year Ended January 31, |
Throughout Each Period | 2009 | 2009 | 2008 | 2007 | 2006 | 2005 |
Net Asset Value, Beginning of Period | $99.12 | $133.80 | $149.69 | $143.39 | $123.84 | $124.29 |
Investment Operations | | | | | | |
Net Investment Income | 1.175 | 1.998 | 2.7661 | 1.953 | 1.753 | 1.272 |
Net Realized and Unrealized Gain (Loss) | | | | | | |
on Investments | 8.364 | (25.229) | (5.317) | 13.107 | 24.424 | 3.385 |
Total from Investment Operations | 9.539 | (23.231) | (2.551) | 15.060 | 26.177 | 4.657 |
Distributions | | | | | | |
Dividends from Net Investment Income | (.049) | (1.925) | (2.747) | (2.100) | (1.542) | (1.112) |
Distributions from Realized Capital Gains | – | (9.524) | (10.592) | (6.660) | (5.085) | (3.995) |
Total Distributions | (.049) | (11.449) | (13.339) | (8.760) | (6.627) | (5.107) |
Net Asset Value, End of Period | $108.61 | $99.12 | $133.80 | $149.69 | $143.39 | $123.84 |
| | | | | | |
Total Return2 | 9.63% | -17.44% | -1.97% | 10.85% | 21.49% | 3.76% |
| | | | | | |
Ratios/Supplemental Data | | | | | | |
Net Assets, End of Period (Millions) | $10,891 | $10,478 | $14,314 | $16,662 | $17,198 | $19,087 |
Ratio of Total Expenses to | | | | | | |
Average Net Assets | 0.38%3 | 0.29% | 0.26% | 0.25% | 0.25% | 0.22% |
Ratio of Net Investment Income to | | | | | | |
Average Net Assets | 2.40%3 | 1.64% | 1.78%1 | 1.33% | 1.29% | 1.02% |
Portfolio Turnover Rate | 5%3 | 12% | 9% | 8% | 14% | 13% |
1 Net investment income per share and the ratio of net investment income to average net assets include $0.585 and |
0.40%, respectively, resulting from a special dividend from Health Management Associates Class A in March 2007. |
2 Total returns do not reflect the 1% fee assessed on redemptions after March 23, 2005, of shares held for less than |
one year, or the 1% fee assessed until March 23, 2005, on shares purchased on or after April 19, 1999, and held for |
less than five years. Total returns do not include the account service fee that may be applicable to certain accounts |
with balances below $10,000. |
3 Annualized. |
See accompanying Notes, which are an integral part of the Financial Statements.
19
Health Care Fund
Admiral Shares | | | | | | |
| Six | | | | | |
| Months | | | | | |
| Ended | | | |
For a Share Outstanding | July 31, | Year Ended January 31, |
Throughout Each Period | 2009 | 2009 | 2008 | 2007 | 2006 | 2005 |
Net Asset Value, Beginning of Period | $41.83 | $56.47 | $63.19 | $60.52 | $52.25 | $52.44 |
Investment Operations | | | | | | |
Net Investment Income | .512 | .879 | 1.2201 | .877 | .779 | .576 |
Net Realized and Unrealized Gain (Loss) | | | | | | |
on Investments | 3.533 | (10.648) | (2.257) | 5.542 | 10.328 | 1.431 |
Total from Investment Operations | 4.045 | (9.769) | (1.037) | 6.419 | 11.107 | 2.007 |
Distributions | | | | | | |
Dividends from Net Investment Income | (.025) | (.852) | (1.212) | (.938) | (.690) | (.511) |
Distributions from Realized Capital Gains | – | (4.019) | (4.471) | (2.811) | (2.147) | (1.686) |
Total Distributions | (.025) | (4.871) | (5.683) | (3.749) | (2.837) | (2.197) |
Net Asset Value, End of Period | $45.85 | $41.83 | $56.47 | $63.19 | $60.52 | $52.25 |
| | | | | | |
Total Return2 | 9.68% | -17.38% | -1.90% | 10.96% | 21.62% | 3.84% |
| | | | | | |
Ratios/Supplemental Data | | | | | | |
Net Assets, End of Period (Millions) | $7,779 | $7,576 | $10,513 | $10,819 | $9,123 | $2,819 |
Ratio of Total Expenses to | | | | | | |
Average Net Assets | 0.30%3 | 0.22% | 0.18% | 0.17% | 0.14% | 0.15% |
Ratio of Net Investment Income to | | | | | | |
Average Net Assets | 2.48%3 | 1.71% | 1.86%1 | 1.41% | 1.40% | 1.10% |
Portfolio Turnover Rate | 5%3 | 12% | 9% | 8% | 14% | 13% |
1 Net investment income per share and the ratio of net investment income to average net assets include $0.247 and |
0.40%, respectively, resulting from a special dividend from Health Management Associates Class A in March 2007. |
2 Total returns do not reflect the 1% fee assessed on redemptions after March 23, 2005, of shares held for less |
than one year, or the 1% fee previously assessed on shares held for less than five years. |
3 Annualized. |
See accompanying Notes, which are an integral part of the Financial Statements.
20
Health Care Fund
Notes to Financial Statements
Vanguard Health Care Fund is registered under the Investment Company Act of 1940 as an open-end investment company, or mutual fund. The fund invests in securities of foreign issuers, which may subject it to investment risks not normally associated with investing in securities of U.S. corporations. The fund offers two classes of shares, Investor Shares and Admiral Shares. Investor Shares are available to any investor who meets the fund’s minimum purchase requirements. Admiral Shares are designed for investors who meet certain administrative, service, tenure, and account-size criteria.
A. The following significant accounting policies conform to generally accepted accounting principles for U.S. mutual funds. The fund consistently follows such policies in preparing its financial statements.
1. Security Valuation: Securities are valued as of the close of trading on the New York Stock Exchange (generally 4 p.m., Eastern time) on the valuation date. Equity securities are valued at the latest quoted sales prices or official closing prices taken from the primary market in which each security trades; such securities not traded on the valuation date are valued at the mean of the latest quoted bid and asked prices. Securities for which market quotations are not readily available, or whose values have been affected by events occurring before the fund’s pricing time but after the close of the securities’ primary markets, are valued at their fair values calculated according to procedures adopted by the board of trustees. These procedures include obtaining quotations from an independent pricing service, monitoring news to identify significant market- or security-specific events, and evaluating changes in the values of foreign market proxies (for example, ADRs, futures contracts, or exchange-traded funds), between the time the foreign markets close and the fund’s pricing time. When fair-value pricing is employed, the prices of securities used by a fund to calculate its net asset value may differ from quoted or published prices for the same securities. Investments in Vanguard Market Liquidity Fund are valued at that fund’s net asset value. Temporary cash investments acquired over 60 days to maturity are valued using the latest bid prices or using valuations based on a matrix system (which considers such factors as security prices, yields, maturities, and ratings), both as furnished by independent pricing services. Other temporary cash investments are valued at amortized cost, which approximates market value.
2. Foreign Currency: Securities and other assets and liabilities denominated in foreign currencies are translated into U.S. dollars using exchange rates obtained from an independent third party as of the fund’s pricing time on the valuation date. Realized gains (losses) and unrealized appreciation (depreciation) on investment securities include the effects of changes in exchange rates since the securities were purchased, combined with the effects of changes in security prices. Fluctuations in the value of other assets and liabilities resulting from changes in exchange rates are recorded as unrealized foreign currency gains (losses) until the assets or liabilities are settled in cash, at which time they are recorded as realized foreign currency gains (losses).
3. Repurchase Agreements: The fund may invest in repurchase agreements. Securities pledged as collateral for repurchase agreements are held by a custodian bank until the agreements mature. Each agreement requires that the market value of the collateral be sufficient to cover payments of interest and principal; however, in the event of default or bankruptcy by the other party to the agreement, retention of the collateral may be subject to legal proceedings.
21
Health Care Fund
4. Federal Income Taxes: The fund intends to continue to qualify as a regulated investment company and distribute all of its taxable income. Management has analyzed the fund’s tax positions taken on federal income tax returns for all open tax years (tax years ended January 31, 2006Ð2009) and for the period ended July 31, 2009, and has concluded that no provision for federal income tax is required in the fund’s financial statements.
5. Distributions: Distributions to shareholders are recorded on the ex-dividend date.
6. Security Lending: The fund may lend its securities to qualified institutional borrowers to earn additional income. Security loans are required to be secured at all times by collateral at least equal to the market value of securities loaned. The fund invests cash collateral received in Vanguard Market Liquidity Fund, and records a liability for the return of the collateral, during the period the securities are on loan. Security lending income represents the income earned on investing cash collateral, less expenses associated with the loan.
7. Other: Dividend income is recorded on the ex-dividend date. Interest income is accrued daily. Premiums and discounts on debt securities purchased are amortized and accreted, respectively, to interest income over the lives of the respective securities. Security transactions are accounted for on the date securities are bought or sold. Costs used to determine realized gains (losses) on the sale of investment securities are those of the specific securities sold. Fees assessed on redemptions of capital shares are credited to paid-in capital.
Each class of shares has equal rights as to assets and earnings, except that each class separately bears certain class-specific expenses related to maintenance of shareholder accounts (included in Management and Administrative expenses), shareholder reporting, and proxies. Marketing and distribution expenses are allocated to each class of shares based on a method approved by the board of trustees. Income, other non-class-specific expenses, and gains and losses on investments are allocated to each class of shares based on its relative net assets.
B. Wellington Management Company, LLP, provides investment advisory services to the fund for a fee calculated at an annual percentage rate of average net assets. For the six months ended July 31, 2009, the investment advisory fee represented an effective annual rate of 0.14% of the fund’s average net assets.
C. The Vanguard Group furnishes at cost corporate management, administrative, marketing, and distribution services. The costs of such services are allocated to the fund under methods approved by the board of trustees. The fund has committed to provide up to 0.40% of its net assets in capital contributions to Vanguard. At July 31, 2009, the fund had contributed capital of $4,160,000 to Vanguard (included in Other Assets), representing 0.02% of the fund’s net assets and 1.66% of Vanguard’s capitalization. The fund’s trustees and officers are also directors and officers of Vanguard.
22
Health Care Fund
D. Various inputs may be used to determine the value of the fund’s investments. These inputs are summarized in three broad levels for financial statement purposes. The inputs or methodologies used to value securities are not necessarily an indication of the risk associated with investing in those securities.
Level 1–Quoted prices in active markets for identical securities.
Level 2–Other significant observable inputs (including quoted prices for similar securities, interest rates, prepayment speeds, credit risk, etc.).
Level 3–Significant unobservable inputs (including the fund’s own assumptions used to determine the fair value of investments).
The following table summarizes the fund’s investments as of July 31, 2009, based on the inputs used to value them:
| Level 1 | Level 2 | Level 3 |
Investments | ($000) | ($000) | ($000) |
Common Stocks–United States | 12,889,111 | – | – |
Common Stocks–International | 135,220 | 4,516,413 | – |
Temporary Cash Investments | 332 | 1,136,930 | – |
Total | 13,024,663 | 5,653,343 | – |
E. Distributions are determined on a tax basis and may differ from net investment income and realized capital gains for financial reporting purposes. Differences may be permanent or temporary. Permanent differences are reclassified among capital accounts in the financial statements to reflect their tax character. Temporary differences arise when certain items of income, expense, gain, or loss are recognized in different periods for financial statement and tax purposes; these differences will reverse at some time in the future. Differences in classification may also result from the treatment of short-term gains as ordinary income for tax purposes. The fund’s tax-basis capital gains and losses are determined only at the end of each fiscal year.
During the six months ended July 31, 2009, the fund realized net foreign currency losses of $684,000, which decreased distributable net income for tax purposes; accordingly, such losses have been reclassified from accumulated net realized gains to undistributed net investment income.
At July 31, 2009, the cost of investment securities for tax purposes was $15,362,751,000. Net unrealized appreciation of investment securities for tax purposes was $3,315,255,000, consisting of unrealized gains of $4,934,163,000 on securities that had risen in value since their purchase and $1,618,908,000 in unrealized losses on securities that had fallen in value since their purchase.
F. During the six months ended July 31, 2009, the fund purchased $435,042,000 of investment securities and sold $1,373,862,000 of investment securities, other than temporary cash investments.
23
Health Care Fund
G. Capital share transactions for each class of shares were:
| Six Months Ended | Year Ended |
| July 31, 2009 | January 31, 2009 |
| Amount | Shares | Amount | Shares |
| ($000) | (000) | ($000) | (000) |
Investor Shares | | | | |
Issued | 322,397 | 3,291 | 683,036 | 5,807 |
Issued in Lieu of Cash Distributions | 4,802 | 53 | 1,073,783 | 10,605 |
Redeemed1 | (832,526) | (8,785) | (2,081,471) | (17,676) |
Net Increase (Decrease)–Investor Shares | (505,327) | (5,441) | (324,652) | (1,264) |
Admiral Shares | | | | |
Issued | 177,897 | 4,297 | 478,417 | 9,423 |
Issued in Lieu of Cash Distributions | 3,919 | 103 | 738,966 | 17,282 |
Redeemed1 | (630,784) | (15,841) | (1,556,635) | (31,749) |
Net Increase (Decrease)–Admiral Shares | (448,968) | (11,441) | (339,252) | (5,044) |
1 Net of redemption fees for fiscal 2010 and 2009 of $782,000 and $1,038,000, respectively (fund totals). |
H. Certain of the fund’s investments are in companies that are considered to be affiliated companies of the fund because the fund owns more than 5% of the outstanding voting securities of the company. Transactions during the period in securities of these companies were as follows:
| | Current Period Transactions | |
| Jan. 31, 2009 | | Proceeds from | | July 31, 2009 |
| Market | Purchases | Securities | Dividend | Market |
| Value | at Cost | Sold | Income | Value |
| ($000) | ($000) | ($000) | ($000) | ($000) |
Coventry Health Care Inc. | 142,015 | – | 6,147 | – | 208,322 |
Forest Laboratories, Inc. | 754,530 | – | – | – | 778,335 |
Health Management | | | | | |
Associates Class A | 25,053 | – | – | – | 95,014 |
OSI Pharmaceuticals, Inc. | 123,888 | 5,044 | 1,752 | – | 122,049 |
PAREXEL International Corp. | 31,059 | – | – | – | 48,582 |
| 1,076,545 | | | | 1,252,302 |
I. In preparing the financial statements as of July 31, 2009, management considered the impact of subsequent events occurring through September 10, 2009, for potential recognition or disclosure in these financial statements.
24
About Your Fund’s Expenses
As a shareholder of the fund, you incur ongoing costs, which include costs for portfolio management, administrative services, and shareholder reports (like this one), among others. Operating expenses, which are deducted from a fund’s gross income, directly reduce the investment return of the fund.
A fund’s expenses are expressed as a percentage of its average net assets. This figure is known as the expense ratio. The following examples are intended to help you understand the ongoing costs (in dollars) of investing in your fund and to compare these costs with those of other mutual funds. The examples are based on an investment of $1,000 made at the beginning of the period shown and held for the entire period.
The accompanying table illustrates your fund’s costs in two ways:
• Based on actual fund return. This section helps you to estimate the actual expenses that you paid over the period. The ”Ending Account Value“ shown is derived from the fund‘s actual return, and the third column shows the dollar amount that would have been paid by an investor who started with $1,000 in the fund. You may use the information here, together with the amount you invested, to estimate the expenses that you paid over the period.
To do so, simply divide your account value by $1,000 (for example, an $8,600 account value divided by $1,000 = 8.6), then multiply the result by the number given for your fund under the heading ”Expenses Paid During Period.“
• Based on hypothetical 5% yearly return. This section is intended to help you compare your fund‘s costs with those of other mutual funds. It assumes that the fund had a yearly return of 5% before expenses, but that the expense ratio is unchanged. In this case—because the return used is not the fund’s actual return—the results do not apply to your investment. The example is useful in making comparisons because the Securities and Exchange Commission requires all mutual funds to calculate expenses based on a 5% return. You can assess your fund’s costs by comparing this hypothetical example with the hypothetical examples that appear in shareholder reports of other funds.
Note that the expenses shown in the table are meant to highlight and help you compare ongoing costs only and do not reflect transaction costs incurred by the fund for buying and selling securities. Further, the expenses do not include the 1% fee on redemptions of shares held for less than one year, nor do they include the account service fee described in the prospectus. If such fees were applied to your account, your costs would be higher. Your fund does not carry a “sales load.”
The calculations assume no shares were bought or sold during the period. Your actual costs may have been higher or lower, depending on the amount of your investment and the timing of any purchases or redemptions.
You can find more information about the fund’s expenses, including annual expense ratios, in the Financial Statements section of this report. For additional information on operating expenses and other shareholder costs, please refer to your fund’s current prospectus.
25
Six Months Ended July 31, 2009 | | | |
| Beginning | Ending | Expenses |
| Account Value | Account Value | Paid During |
Health Care Fund | 1/31/2009 | 7/31/2009 | Period |
Based on Actual Fund Return | | | |
Investor Shares | $1,000.00 | $1,096.34 | $1.98 |
Admiral Shares | 1,000.00 | 1,096.82 | 1.56 |
Based on Hypothetical 5% Yearly Return | | | |
Investor Shares | $1,000.00 | $1,022.91 | $1.91 |
Admiral Shares | 1,000.00 | 1,023.31 | 1.51 |
These calculations are based on expenses incurred in the most recent six-month period. The fund’s annualized six-month expense ratios for that period are 0.38% for Investor Shares and 0.30% for Admiral Shares. The dollar amounts shown as “Expenses Paid” are equal to the annualized expense ratio multiplied by the average account value over the period, multiplied by the number of days in the most recent six-month period, then divided by the number of days in the most recent 12-month period.
26
Notice to Shareholders
The board of trustees of Vanguard Health Care Fund has adopted a new advisory fee schedule for the fund, effective August 1, 2009. The new advisory fee schedule is expected to increase the fund’s expense ratio by 0.01%. For shareholders, the increase represents an additional $1.00 in annual cost on a $10,000 investment. This change will not affect the fund’s investment objective, policies, or strategies.
The fund’s trustees regularly evaluate its investment advisory arrangements, focusing on factors such as the advisor’s investment process, style consistency, and performance, as well as the composition and depth of the management and research teams. In deciding to adopt the new fee schedule, the trustees considered the fund’s performance together with a wide range of information relating to Wellington Management Company, LLP, which has managed the fund since its inception in 1984.
The fund has entered into a new investment advisory agreement with Wellington Management to reflect the new fee schedule; however, other terms of the existing agreement have not changed. Under the terms of the agreement, the fund will pay Wellington Management a fee at the end of each fiscal quarter. The fee is calculated by applying an annual percentage rate to the fund’s average daily net assets for the quarter.
For the six months ended July 31, 2009, the total advisory fees paid by Vanguard Health Care Fund were $11,490,000, or an annual rate of 0.14% of the fund’s average net assets. If the new fee schedule had been in place throughout the period, the advisory fees paid by the fund would have been $12,941,000, or an annual rate of 0.15% of the fund’s average net assets. The average advisory fee paid by funds in Vanguard Health Care Fund’s Lipper peer group was 0.70% of assets as of December 31, 2008.
Board approval of the investment advisory agreement
Wellington Management is responsible for managing the investment and reinvestment of the fund’s assets and for continuously reviewing, supervising, and administering the fund’s investment program. The advisor discharges its responsibilities subject to the supervision and oversight of the officers and trustees of the fund.
The board’s decision to adopt the new advisory fee schedule was based upon its most recent evaluation of the advisor’s investment staff, portfolio management process, and performance results. In considering whether to approve the new agreement, the board engaged in arm’s-length negotiations with Wellington Management and considered the following factors, among others:
• The trustees considered the benefits to shareholders of continuing to retain Wellington Management as advisor to the fund, particularly in light of the nature, extent, and quality of services provided by Wellington Management. The board considered the quality of investment management to the fund over both the short and long term and the organizational depth and stability of the firm.
Specifically, the board noted that the fund’s investment manager, Edward P. Owens, has managed the fund since its inception in 1984 and that Jean Hynes has been associate manager of the Fund since 2008. Further, the board noted that Wellington Management utilizes intensive fundamental analysis to identify companies with high-quality balance sheets, strong management, and the potential for new products that will lead to above-average growth in revenue and earnings. The board concluded that the existing advisory fee schedule should be adjusted to reflect the fair market value of Wellington Management’s services and the firm’s need to maintain an expanded portfolio management team to manage a large fund in this market segment. The new fee arrangement will enable Wellington
27
Management to enhance the organizational depth and stability of the fund’s portfolio management team by retaining top investment talent and by hiring new investment professionals on an as-needed basis.
• The trustees considered the fund’s investment performance compared with those of the fund’s peer group and a relevant benchmark. The board concluded that short- and long-term performance has been consistently competitive versus the fund’s benchmark, the S&P Health Care Index. The board also concluded that short- and long-term performance has been in line with or above the average return of the fund’s peer group of global health/biotechnology funds (as defined by Lipper).
• The trustees considered the cost of services to be provided, including consideration of competitive fee rates and the fact that, after the adjustment, the fund’s advisory fee will remain significantly below those of most of its peers.
• The trustees considered the extent to which economies of scale would be realized as the fund grows, including a consideration of appropriate breakpoints in the fee schedule. By including asset-based breakpoints in the fee schedule, the trustees ensure that if the fund continues to grow, investors will benefit by realizing economies of scale in the form of a lower advisory fee rate.
• The trustees considered all of the circumstances and information provided by both Wellington Management and Vanguard regarding the performance of the fund and concluded that approval of the new investment advisory agreement is in the best interests of the fund and its shareholders.
The advisory agreement will continue for a period of one year from its effective date and is renewable after that for successive one-year periods. The agreement will be reviewed annually by the fund’s trustees, a majority of whom are not “interested persons” of either the fund or Wellington Management as defined in federal securities laws.
Background information on Wellington Management
Wellington Management Company, LLP, a Massachusetts partnership with offices at 75 State Street, Boston, MA 02109, is an investment firm that was founded in 1928. As of January 31, 2009, the firm managed approximately $420 billion in assets for a variety of clients, including mutual funds, institutions, and separate accounts. The managers primarily responsible for overseeing the fund are:
Edward P. Owens, CFA, senior vice president and global industry analyst of Wellington Management. He has worked in investment management with Wellington Management since 1974 and has been portfolio manager of the fund since its inception in 1984. Education: B.S., University of Virginia; M.B.A., Harvard Business School.
Jean M. Hynes, CFA, senior vice president and global industry analyst of Wellington Management. She has worked in investment management with Wellington Management since 1991; has performed securities analysis for the fund since 1995; has managed investment portfolios since 1997; and has been associate portfolio manager of the fund since 2008. Education: B.A., Wellesley College.
Wellington Management is owned by its 110 active partners, all of whom are active members of the firm. The managing partners of the firm are Phillip H. Perelmuter, Brendan J. Swords, and Perry M. Traquina. Please note that the managing partners are not necessarily those with the largest economic interests in the firm.
28
Glossary
30-Day SEC Yield. A fund’s 30-day SEC yield is derived using a formula specified by the U.S. Securities and Exchange Commission. Under the formula, data related to the fund’s security holdings in the previous 30 days are used to calculate the fund’s hypothetical net income for that period, which is then annualized and divided by the fund’s estimated average net assets over the calculation period. For the purposes of this calculation, a security’s income is based on its current market yield to maturity (in the case of bonds) or its projected dividend yield (for stocks). Because the SEC yield represents hypothetical annualized income, it will differ—at times significantly—from the fund’s actual experience. As a result, the fund’s income distributions may be higher or lower than implied by the SEC yield.
Beta. A measure of the magnitude of a fund’s past share-price fluctuations in relation to the ups and downs of a given market index. The index is assigned a beta of 1.00. Compared with a given index, a fund with a beta of 1.20 typically would have seen its share price rise or fall by 12% when the index rose or fell by 10%. For this report, beta is based on returns over the past 36 months for both the fund and the index. Note that a fund’s beta should be reviewed in conjunction with its R-squared (see definition). The lower the R-squared, the less correlation there is between the fund and the index, and the less reliable beta is as an indicator of volatility.
Dividend Yield. Dividend income earned by stocks, expressed as a percentage of the aggregate market value (or of net asset value, for a fund). The yield is determined by dividing the amount of the annual dividends by the aggregate value (or net asset value) at the end of the period. For a fund, the dividend yield is based solely on stock holdings and does not include any income produced by other investments.
Earnings Growth Rate. The average annual rate of growth in earnings over the past five years for the stocks now in a fund.
Equity Exposure. A measure that reflects a fund’s investments in stocks and stock futures. Any holdings in short-term reserves are excluded.
Expense Ratio. The percentage of a fund’s average net assets used to pay its annual administrative and advisory expenses. These expenses directly reduce returns to investors.
Foreign Holdings. The percentage of a fund represented by stocks or depositary receipts of companies based outside the United States.
Inception Date. The date on which the assets of a fund (or one of its share classes) are first invested in accordance with the fund’s investment objective. For funds with a subscription period, the inception date is the day after that period ends. Investment performance is measured from the inception date.
Median Market Cap. An indicator of the size of companies in which a fund invests; the midpoint of market capitalization (market price x shares outstanding) of a fund’s stocks, weighted by the proportion of the fund’s assets invested in each stock. Stocks representing half of the fund’s assets have market capitalizations above the median, and the rest are below it.
Price/Book Ratio. The share price of a stock divided by its net worth, or book value, per share. For a fund, the weighted average price/book ratio of the stocks it holds.
29
Price/Earnings Ratio. The ratio of a stock’s current price to its per-share earnings over the past year. For a fund, the weighted average P/E of the stocks it holds. P/E is an indicator of market expectations about corporate prospects; the higher the P/E, the greater the expectations for a company’s future growth.
R-Squared. A measure of how much of a fund’s past returns can be explained by the returns from the market in general, as measured by a given index. If a fund’s total returns were precisely synchronized with an index’s returns, its R-squared would be 1.00. If the fund’s returns bore no relationship to the index’s returns, its R-squared would be 0. For this report, R-squared is based on returns over the past 36 months for both the fund and the index.
Return on Equity. The annual average rate of return generated by a company during the past five years for each dollar of shareholder’s equity (net income divided by shareholder’s equity). For a fund, the weighted average return on equity for the companies whose stocks it holds.
Short-Term Reserves. The percentage of a fund invested in highly liquid, short-term securities that can be readily converted to cash.
Turnover Rate. An indication of the fund’s trading activity. Funds with high turnover rates incur higher transaction costs and may be more likely to distribute capital gains (which may be taxable to investors). The turnover rate excludes in-kind transactions, which have minimal impact on costs.
30
This page intentionally left blank.
The People Who Govern Your Fund
The trustees of your mutual fund are there to see that the fund is operated and managed in your best interests since, as a shareholder, you are a part owner of the fund. Your fund’s trustees also serve on the board of directors of The Vanguard Group, Inc., which is owned by the Vanguard funds and provides services to them on an at-cost basis.
A majority of Vanguard’s board members are independent, meaning that they have no affiliation with Vanguard or the funds they oversee, apart from the sizable personal investments they have made as private individuals. The independent board members have distinguished backgrounds in business, academia, and public service. Each of the trustees and executive officers oversees 157 Vanguard funds.
The following table provides information for each trustee and executive officer of the fund. More information about the trustees is in the Statement of Additional Information, which can be obtained, without charge, by contacting Vanguard at 800-662-7447, or online at www.vanguard.com.
Interested Trustees | Emerson U. Fullwood |
| Born 1948. Trustee Since January 2008. Principal |
| Occupation(s) During the Past Five Years: Retired |
| Executive Chief Staff and Marketing Officer for North |
John J. Brennan1 | America and Corporate Vice President of Xerox |
Born 1954. Trustee Since May 1987. Chairman of | Corporation (photocopiers and printers); Director of |
the Board. Principal Occupation(s) During the Past | SPX Corporation (multi-industry manufacturing), the |
Five Years: Chairman of the Board and Director/Trustee | United Way of Rochester, the Boy Scouts of America, |
of The Vanguard Group, Inc., and of each of the | Amerigroup Corporation (direct health and medical |
investment companies served by The Vanguard Group; | insurance carriers), and Monroe Community College |
Chief Executive Officer and President of The Vanguard | Foundation. |
Group and of each of the investment companies served | |
by The Vanguard Group (1996-2008); Chairman of | |
the Financial Accounting Foundation; Governor of | Rajiv L. Gupta |
the Financial Industry Regulatory Authority (FINRA); | Born 1945. Trustee Since December 2001.2 Principal |
Director of United Way of Southeastern Pennsylvania. | Occupation(s) During the Past Five Years: Retired |
| Chairman and Chief Executive Officer of Rohm and |
F. William McNabb III1 | Haas Co. (chemicals); President of Rohm and Haas Co. |
Born 1957. Trustee Since July 2009. Principal | (2006-2008); Board Member of American Chemistry |
Occupation(s) During the Past Five Years: Director of | Council; Director of Tyco International, Ltd. (diversified |
The Vanguard Group, Inc., since 2008; Chief Executive | manufacturing and services) and Hewlett-Packard Co. |
Officer and President of The Vanguard Group and of | (electronic computer manufacturing); Trustee of The |
each of the investment companies served by The | Conference Board. |
Vanguard Group since 2008; Director of Vanguard | |
Marketing Corporation; Managing Director of The | |
Vanguard Group (1995-2008). | Amy Gutmann |
| Born 1949. Trustee Since June 2006. Principal |
| Occupation(s) During the Past Five Years: President of |
Independent Trustees | the University of Pennsylvania; Christopher H. Browne |
| Distinguished Professor of Political Science in the School |
Charles D. Ellis | of Arts and Sciences with Secondary Appointments |
Born 1937. Trustee Since January 2001. Principal | at the Annenberg School for Communication and the |
Occupation(s) During the Past Five Years: Applecore | Graduate School of Education of the University of |
Partners (pro bono ventures in education); Senior | Pennsylvania; Director of Carnegie Corporation of |
Advisor to Greenwich Associates (international business | New York, Schuylkill River Development Corporation, |
strategy consulting); Successor Trustee of Yale University; | and Greater Philadelphia Chamber of Commerce; |
Overseer of the Stern School of Business at New York | Trustee of the National Constitution Center. |
University; Trustee of the Whitehead Institute for | |
Biomedical Research. | |
JoAnn Heffernan Heisen | Executive Officers |
Born 1950. Trustee Since July 1998. Principal | | |
Occupation(s) During the Past Five Years: Retired | | |
Corporate Vice President, Chief Global Diversity Officer, | Thomas J. Higgins1 |
and Member of the Executive Committee of Johnson | Born 1957. Chief Financial Officer Since September |
& Johnson (pharmaceuticals/consumer products); | 2008. Principal Occupation(s) During the Past Five |
Vice President and Chief Information Officer of Johnson | Years: Principal of The Vanguard Group, Inc.; Chief |
& Johnson (1997-2005); Director of the University | Financial Officer of each of the investment companies |
Medical Center at Princeton and Women’s Research | served by The Vanguard Group since 2008; Treasurer |
and Education Institute. | of each of the investment companies served by The |
| Vanguard Group (1998-2008). |
| | |
Andr F. Perold | | |
Born 1952. Trustee Since December 2004. Principal | Kathryn J. Hyatt1 | |
Occupation(s) During the Past Five Years: George Gund | Born 1955. Treasurer Since November 2008. Principal |
Professor of Finance and Banking, Harvard Business | Occupation(s) During the Past Five Years: Principal of |
School; Director and Chairman of UNX, Inc. (equities | The Vanguard Group, Inc.; Treasurer of each of the |
trading firm); Chair of the Investment Committee of | investment companies served by The Vanguard |
HighVista Strategies LLC (private investment firm). | Group since 2008; Assistant Treasurer of each of the |
| investment companies served by The Vanguard Group |
| (1988-2008). | |
Alfred M. Rankin, Jr. | | |
Born 1941. Trustee Since January 1993. Principal | | |
Occupation(s) During the Past Five Years: Chairman, | Heidi Stam1 | |
President, Chief Executive Officer, and Director of | Born 1956. Secretary Since July 2005. Principal |
NACCO Industries, Inc. (forklift trucks/housewares/ | Occupation(s) During the Past Five Years: Managing |
lignite); Director of Goodrich Corporation (industrial | Director of The Vanguard Group, Inc., since 2006; |
products/aircraft systems and services). | General Counsel of The Vanguard Group since 2005; |
| Secretary of The Vanguard Group and of each of the |
| investment companies served by The Vanguard Group |
Peter F. Volanakis | since 2005; Director and Senior Vice President of |
Born 1955. Trustee Since July 2009. Principal | Vanguard Marketing Corporation since 2005; Principal |
Occupation(s) During the Past Five Years: President | of The Vanguard Group (1997-2006). |
since 2007 and Chief Operating Officer since 2005 | | |
of Corning Incorporated (communications equipment); | | |
President of Corning Technologies (2001-2005); Director | Vanguard Senior Management Team |
of Corning Incorporated and Dow Corning; Trustee of | | |
the Corning Incorporated Foundation and the Corning | | |
Museum of Glass; Overseer of the Amos Tuck School | R. Gregory Barton | Michael S. Miller |
of Business Administration at Dartmouth College. | Mortimer J. Buckley | James M. Norris |
| Kathleen C. Gubanich | Glenn W. Reed |
| Paul A. Heller | George U. Sauter |
| | |
| Founder | |
| | |
| John C. Bogle | |
| Chairman and Chief Executive Officer, 1974-1996 |
|
|
1 These individuals are “interested persons” as defined in the Investment Company Act of 1940. |
2 December 2002 for Vanguard Equity Income Fund, Vanguard Growth Equity Fund, the Vanguard Municipal Bond |
Funds, and the Vanguard State Tax-Exempt Funds. |

P.O. Box 2600
Valley Forge, PA 19482-2600
Connect with Vanguard® > www.vanguard.com
Fund Information > 800-662-7447 | |
| |
Direct Investor Account Services > 800-662-2739 | |
| |
Institutional Investor Services > 800-523-1036 | |
| |
Text Telephone for People | |
With Hearing Impairment > 800-952-3335 | |
| |
This material may be used in conjunction | |
with the offering of shares of any Vanguard | |
fund only if preceded or accompanied by | |
the fund’s current prospectus. | |
| |
All comparative mutual fund data are from Lipper Inc. or | |
Morningstar, Inc., unless otherwise noted. | |
| |
You can obtain a free copy of Vanguard’s proxy voting | |
guidelines by visiting our website, www.vanguard.com, | |
and searching for “proxy voting guidelines,” or by calling | |
Vanguard at 800-662-2739. The guidelines are also | |
available from the SEC’s website, www.sec.gov. In | |
addition, you may obtain a free report on how your fund | |
voted the proxies for securities it owned during the 12 | |
months ended June 30. To get the report, visit either | |
www.vanguard.com or www.sec.gov. | |
| |
You can review and copy information about your fund at | |
the SEC’s Public Reference Room in Washington, D.C. To | |
find out more about this public service, call the SEC at | |
202-551-8090. Information about your fund is also | |
available on the SEC’s website, and you can receive | |
copies of this information, for a fee, by sending a | |
request in either of two ways: via e-mail addressed to | |
publicinfo@sec.gov or via regular mail addressed to the | © 2009 The Vanguard Group, Inc. |
Public Reference Section, Securities and Exchange | All rights reserved. |
Commission, Washington, DC 20549-0102. | Vanguard Marketing Corporation, Distributor. |
| Q522 092009 |

> | Vanguard REIT Index returned about 18% for the six months ended July 31, 2009. |
> | The fund’s performance tracked that of its benchmark, the U.S. REIT Spliced Index, and was in line with the average return of competing real estate funds. |
> | REITs began to bounce back over the fiscal half-year, after suffering some of their worst returns on record in 2007, 2008, and the early months of 2009. |
Contents | |
| |
Your Fund’s Total Returns | 1 |
President’s Letter | 2 |
Results of Proxy Voting | 7 |
Fund Profile | 9 |
Performance Summary | 10 |
Financial Statements | 11 |
About Your Fund’s Expenses | 26 |
Trustees Approve Advisory Arrangement | 28 |
Glossary | 29 |

Please note: The opinions expressed in this report are just that—informed opinions. They should not be considered promises or advice. Also, please keep in mind that the information and opinions cover the period through the date on the front of this report. Of course, the risks of investing in your fund are spelled out in the prospectus.
Your Fund’s Total Returns
Six Months Ended July 31, 2009 | | |
| Ticker | Total |
| Symbol | Returns |
Vanguard REIT Index Fund | | |
Investor Shares | VGSIX | 18.28% |
Admiral™ Shares1 | VGSLX | 18.36 |
Signal® Shares2 | VGRSX | 18.37 |
Institutional Shares3 | VGSNX | 18.41 |
ETF Shares4 | VNQ | |
Market Price | | 17.64 |
Net Asset Value | | 18.37 |
U.S. REIT Spliced Index5 | | 17.84 |
MSCI® US REIT Index | | 17.86 |
Average Real Estate Fund6 | | 18.48 |
Your Fund’s Performance at a Glance | | | |
January 31, 2009–July 31, 2009 | | | |
| | | | | | |
| | | |
| Starting | Ending | Distributions Per Share | |
| Share | Share | Income | Capital | Return of | |
| Price | Price | Dividends | Gains | Capital | |
Vanguard REIT Index Fund | | | | | | |
Investor Shares | $10.02 | $11.44 | $0.315 | $0.000 | $0.000 | |
Admiral Shares | 42.74 | 48.80 | 1.366 | 0.000 | 0.000 | |
Signal Shares | 11.41 | 13.03 | 0.364 | 0.000 | 0.000 | |
Institutional Shares | 6.61 | 7.55 | 0.212 | 0.000 | 0.000 | |
ETF Shares | 30.14 | 34.44 | 0.963 | 0.000 | 0.000 | |
1 A lower-cost class of shares available to many longtime shareholders and to those with significant |
investments in the fund. |
2 Signal Shares also carry lower costs and are available to institutional shareholders who meet certain administrative, |
service, and account-size criteria. |
3 This class of shares also carries low expenses and is available for a minimum investment of $5 million. |
4 Vanguard ETF™ Shares are traded on the NYSE Arca exchange and are available only through brokers. The table |
shows the ETF returns based on both the NYSE Arca market price and the net asset value for a share. U.S. Pat. No. |
6,879,964 B2; 7,337,138. |
5 MSCI US REIT Index adjusted to include a 2% cash position (Lipper Money Market Average) through April 30, 2009; |
MSCI US REIT Index thereafter. |
6 Derived from data provided by Lipper Inc. |
1

President’s Letter
Dear Shareholder,
For the six-month period ended July 31, 2009, Vanguard REIT Index Fund returned about 18%. The fund’s returns were on par with its target index, which, like the portfolio, included a small cash position until April 30, 2009, when we removed the cash position from both the benchmark and the portfolio. As the REIT market has become more liquid, the need for a permanent cash position to facilitate shareholder transactions has disappeared. The fund’s return was also in line with that of the average real estate fund.
All six subsectors of the REIT market ended the period in positive territory. Specialized REITs and retail REITs were the biggest contributors to returns for both the fund and its index.
Stocks rose on signs that recovery is taking root
For the six months ended July 31, the broad U.S. stock market returned about 23%. The period began in gloom, with stocks declining in February and early March before staging a strong springtime rally. After pausing in June, the market surged nearly 8% in July as investors reacted to improvement in the housing market, an increase in manufacturing activity, rising corporate earnings, and cautiously optimistic comments from the Federal Reserve Board.
2
Global stock markets performed even better, advancing almost 38% for the period. Encouraging earnings reports and higher commodity prices lifted international stocks off their lows in early March. After three straight months of solid gains, the MSCI All Country World Index ex USA fell slightly in June before rallying again in July.
Although stock markets worldwide have been in recovery mode for five months and various economic signs point to the recession’s end, the health of global financial markets and economies remained fragile as the period ended. Unemployment, in particular, was still a major concern both in the United States and abroad.
Investors departed Treasuries for higher-yielding bonds
For the six months, the Barclays Capital U.S. Aggregate Bond Index, a broad measure of the investment-grade market, returned more than 4%. That return paled, however, next to the 30% return of lower-quality bonds, as measured by the Barclays Capital U.S. Corporate High Yield Bond Index. By spring, investors seemed to gain confidence in the federal government’s efforts to thaw the credit markets and stimulate the economy, and they started shifting from U.S. Treasury bonds to corporate issues—particularly below-investment-grade bonds, which offered the highest yields. Municipal bonds also
Market Barometer | | | |
| | Total Returns |
| Periods Ended July 31, 2009 |
| Six Months | One Year | Five Years1 |
Stocks | | | |
Russell 1000 Index (Large-caps) | 22.26% | –20.17% | 0.32% |
Russell 2000 Index (Small-caps) | 26.61 | –20.72 | 1.52 |
Dow Jones U.S. Total Stock Market Index | 23.23 | –19.67 | 0.81 |
MSCI All Country World Index ex USA (International) | 37.70 | –20.90 | 7.57 |
| | | |
Bonds | | | |
Barclays Capital U.S. Aggregate Bond Index | | | |
(Broad taxable market) | 4.47% | 7.85% | 5.14% |
Barclays Capital Municipal Bond Index | 4.38 | 5.11 | 4.21 |
Citigroup 3-Month Treasury Bill Index | 0.09 | 0.65 | 3.00 |
| | | |
CPI | | | |
Consumer Price Index | 1.99% | –2.10% | 2.60% |
1 Annualized. |
3
benefited from government support, with the broad tax-exempt market returning about 4% for the six months.
Efforts to combat the financial crisis have included a combination of aggressive monetary policy and large fiscal programs, most notably the nearly $800 billion American Recovery and Reinvestment Act of 2009. On the monetary side, the Fed has kept its target for short-term interest rates at an all-time low of 0% to 0.25%, a target it expects to maintain for “an extended period.” For the last several months, the Fed has been purchasing Treasury and mortgage-backed securities, an effort to keep longer-term interest rates and borrowing costs low. In recent months, however, Treasury yields have risen amid concerns about longer-term budget deficits.
REIT recovery lags the broad market
Real estate investments started to steadily decline when the subprime mortgage crisis began in August of 2007. They continued to fall throughout 2008 and into the first few months of 2009. In the second quarter of 2009, a rally was triggered when many REITs tapped the capital markets to repair their troubled balance sheets—a refurbishment aided by the Federal Reserve’s aggressive efforts to stabilize the financial system.
Expense Ratios1 | | | | | | |
Your Fund Compared With Its Peer Group | | | |
| | | | | | Average |
| Investor | Admiral | Signal | Institutional | ETF | Real Estate |
| Shares | Shares | Shares | Shares | Shares | Fund |
REIT Index Fund | 0.26% | 0.15% | 0.15% | 0.10% | 0.15% | 1.42% |
1 The fund expense ratios shown are from the prospectuses dated May 29, 2009, and represent estimated |
costs for the current fiscal year based on the fund’s net assets as of the prospectus date. For the six |
months ended July 31, 2009, the annualized expense ratios were 0.26% for Investor Shares, 0.14% for |
Admiral Shares, 0.14% for Signal Shares, 0.09% for Institutional Shares, and 0.14% for ETF Shares. The |
peer-group expense ratio is derived from data provided by Lipper Inc. and captures information through |
year-end 2008. |
4
During this time, REITs managed to gain back some ground and, as a whole, finished solidly in positive territory for the six-month period. Despite positive results, REIT returns trailed the returns of the broad stock market.
All areas of the REIT market rose for the period. The biggest gains came from specialized REITs, which include hotels and self-storage companies. These stocks were hurt by cuts in spending by both businesses and consumers, but they advanced in the second half of the period after REITs raised capital, helping to improve REIT balance sheets and to restore investors’ confidence in their financial stability.
Retail REITs—which had suffered some of the biggest losses when budget-conscious consumers trimmed spending—recovered significantly by the end of the period, as investors became more confident about the strength of retail landlords.
Sector funds can play a part in a well-balanced portfolio
Investors have endured many challenges over the past year and a half. In 2008, the U.S. stock market experienced its worst calendar year since the 1930s. The beginning of 2009 brought more bad news, as prices continued to fall until March, when stocks began to rally. As markets continue to shift on almost a daily basis, it’s impossible to say where stocks will go from here.
Because of the market’s unpredictable nature, we encourage you to tune out the short-term “noise” and instead focus on constructing a portfolio that contains a mix of stocks, bonds, and money market funds appropriate for your goals, time horizon, and risk tolerance. Such a well-balanced portfolio can provide you with some protection from the market’s extreme ups and downs, while also giving you the opportunity for long-term growth.
We believe that with its low costs, proven ability to track its index, and broad exposure to the REIT market, Vanguard REIT Index Fund can play a valuable part in a well-balanced portfolio.
Thank you for entrusting your assets to Vanguard.
Sincerely,

F. William McNabb III
President and Chief Executive Officer
August 14, 2009
5
Vanguard REIT ETF | | | | |
Premium/Discount: September 23, 20041–July 31, 2009 | |
| | | | |
| Market Price Above or | Market Price Below |
| Equal to Net Asset Value | Net Asset Value |
| Number | Percentage | Number | Percentage |
Basis Point Differential2 | of Days | of Total Days | of Days | of Total Days |
0–24.9 | 522 | 42.64% | 594 | 48.53% |
25–49.9 | 40 | 3.27 | 41 | 3.35 |
50–74.9 | 11 | 0.90 | 2 | 0.16 |
75–100.0 | 5 | 0.41 | 2 | 0.16 |
> 100.0 | 4 | 0.33 | 3 | 0.25 |
Total | 582 | 47.55% | 642 | 52.45% |
1 Inception. |
2 One basis point equals 1/100 of a percentage point. |
6
Results of Proxy Voting
At a special meeting of shareholders on July 2, 2009, fund shareholders approved the following two proposals:
Proposal 1—Elect trustees for each fund.*
The individuals listed in the table below were elected as trustees for each fund. All trustees with the exception of Messrs. McNabb and Volanakis (both of whom already served as directors of The Vanguard Group, Inc.) served as trustees to the funds prior to the shareholder meeting.
| | | Percentage |
Trustee | For | Withheld | For |
John J. Brennan | 831,083,148 | 23,429,009 | 97.3% |
Charles D. Ellis | 815,919,984 | 38,592,173 | 95.5% |
Emerson U. Fullwood | 818,220,903 | 36,291,254 | 95.8% |
Rajiv L. Gupta | 827,792,136 | 26,720,020 | 96.9% |
Amy Gutmann | 828,576,544 | 25,935,613 | 97.0% |
JoAnn Heffernan Heisen | 827,968,189 | 26,543,968 | 96.9% |
F. William McNabb III | 830,218,855 | 24,293,302 | 97.2% |
André F. Perold | 817,862,692 | 36,649,465 | 95.7% |
Alfred M. Rankin, Jr. | 827,956,891 | 26,555,266 | 96.9% |
Peter F. Volanakis | 829,990,273 | 24,521,884 | 97.1% |
* Results are for all funds within the same trust. | |
Proposal 2—Update and standardize the funds’ fundamental policies regarding: |
(a) | Purchasing and selling real estate. |
(b) | Issuing senior securities. |
(c) | Borrowing money. |
(d) | Making loans. |
(e) | Purchasing and selling commodities. |
(f) | Concentrating investments in a particular industry or group of industries. |
(g) | Eliminating outdated fundamental investment policies not required by law. |
The revised fundamental policies are clearly stated and simple, yet comprehensive, making oversight and compliance more efficient than under the former policies. The revised fundamental policies will allow the funds to respond more quickly to regulatory and market changes, while avoiding the costs and delays associated with successive shareholder meetings.
| | | | Broker | Percentage |
Vanguard Fund | For | Abstain | Against | Non-Votes | For |
REIT Index Fund | | | | | |
2a | 245,175,011 | 5,324,189 | 4,192,844 | 30,095,260 | 86.1% |
2b | 242,279,392 | 5,982,504 | 6,428,547 | 30,096,861 | 85.1% |
2c | 240,782,413 | 5,627,046 | 8,280,988 | 30,096,857 | 84.5% |
2d | 241,209,974 | 5,737,958 | 7,744,113 | 30,095,259 | 84.7% |
2e | 240,641,611 | 5,678,485 | 8,371,945 | 30,095,263 | 84.5% |
2f | 243,656,578 | 5,712,283 | 5,323,182 | 30,095,261 | 85.6% |
2g | 243,565,140 | 6,346,764 | 4,780,133 | 30,095,266 | 85.5% |
7
Fund shareholders did not approve the following proposal:
Proposal 3—Institute procedures to prevent holding investments in companies that, in the judgment of the board, substantially contribute to genocide or crimes against humanity, the most egregious violations of human rights.
The trustees recommended a vote against the proposal because it called for procedures that duplicate existing practices and procedures of the Vanguard funds.
| | | | Broker | Percentage |
Vanguard Fund | For | Abstain | Against | Non-Votes | For |
REIT Index Fund | 35,113,066 | 9,174,865 | 210,360,878 | 30,138,495 | 12.3% |
8
REIT Index Fund
Fund Profile
As of July 31, 2009
Portfolio Characteristics | | |
| | Target | Broad |
| Fund | Index1 | Index2 |
Number of Stocks | 97 | 97 | 4,370 |
Median Market Cap | $3.4B | $3.4B | $26.1B |
Price/Earnings Ratio | 93.8x | 93.6x | 23.0x |
Price/Book Ratio | 1.4x | 1.4x | 2.1x |
Yield3 | — | 5.4% | 2.0% |
Investor Shares | 4.5% | | |
Admiral Shares | 4.7% | | |
Signal Shares | 4.7% | | |
Institutional Shares | 4.7% | | |
ETF Shares | 4.7% | | |
Return on Equity | 9.2% | 9.2% | 19.6% |
Earnings Growth Rate | –4.9% | –4.9% | 12.6% |
Foreign Holdings | 0.0% | 0.0% | 0.0% |
Turnover Rate4 | 23% | — | — |
Expense Ratio5 | | — | — |
Investor Shares | 0.26% | | |
Admiral Shares | 0.15% | | |
Signal Shares | 0.15% | | |
Institutional Shares | 0.10% | | |
ETF Shares | 0.15% | | |
Short-Term Reserves | 0.8% | — | — |
Fund Allocation by REIT Type | |
(% of equity exposure) | |
| |
Specialized | 29.2% |
Retail | 24.5 |
Office | 17.0 |
Residential | 14.9 |
Diversified | 8.9 |
Industrial | 5.5 |
Volatility Measures6 | |
| Fund Versus | Fund Versus |
| Spliced Index7 | Broad Index2 |
R-Squared | 1.00 | 0.69 |
Beta | 1.00 | 1.59 |
Ten Largest Holdings8 (% of total net assets) |
| |
Simon Property Group, Inc. REIT | 9.3% |
Public Storage, Inc. REIT | 5.5 |
Vornado Realty Trust REIT | 4.8 |
Boston Properties, Inc. REIT | 4.3 |
HCP, Inc. REIT | 4.2 |
Equity Residential REIT | 3.9 |
Ventas, Inc. REIT | 3.3 |
Host Hotels & Resorts Inc. REIT | 3.2 |
Avalonbay Communities, Inc. REIT | 2.8 |
Health Care Inc. REIT | 2.6 |
Top Ten | 43.9% |
1 MSCI US REIT Index. |
2 Dow Jones U.S. Total Stock Market Index. |
3 This yield may include some payments that represent a return of capital, capital gains distributions, or both by the |
underlying REITs. These amounts are determined by each REIT at the end of its fiscal year. |
4 Annualized. |
5 The fund expense ratios shown are from the prospectuses dated May 29, 2009, and represent estimated costs for the |
current fiscal year based on the fund’s net assets as of the prospectus date. |
For the six months ended July 31, 2009, the annualized expense ratios were 0.26% for Investor Shares, 0.14% for |
Admiral Shares, 0.14% for Signal Shares, 0.09% for Institutional Shares, and 0.14% for ETF Shares. |
6 For an explanation of R-squared, beta, and other terms used here, see the Glossary. |
7 MSCI US REIT Index adjusted to include a 2% cash position (Lipper Money Market Average) through April 30, 2009; |
MSCI US REIT Index thereafter. |
8 The holdings listed exclude any temporary cash investments and equity index products. |
9
REIT Index Fund
Performance Summary
All of the returns in this report represent past performance, which is not a guarantee of future results that may be achieved by the fund. (Current performance may be lower or higher than the performance data cited. For performance data current to the most recent month-end, visit our website at www.vanguard.com/performance.) Note, too, that both investment returns and principal value can fluctuate widely, so an investor’s shares, when sold, could be worth more or less than their original cost. The returns shown do not reflect taxes that a shareholder would pay on fund distributions or on the sale of fund shares.
Fiscal-Year Total Returns (%): January 31, 1999–July 31, 2009

Average Annual Total Returns: Periods Ended June 30, 2009
This table presents average annual total returns through the latest calendar quarter—rather than through the end of the fiscal period. Securities and Exchange Commission rules require that we provide this information.
| Inception Date | One Year | Five Years | Ten Years |
Investor Shares3 | 5/13/1996 | –42.46% | –2.67% | 5.31% |
Admiral Shares | 11/12/2001 | –42.43 | –2.59 | 4.284 |
Signal Shares | 6/4/2007 | –42.43 | –32.104 | — |
Institutional Shares | 12/2/2003 | –42.40 | –2.56 | –1.054 |
ETF Shares | 9/23/2004 | | | |
Market Price | | –42.43 | –3.974 | — |
Net Asset Value | | –42.43 | –3.964 | — |
1 Six months ended July 31, 2009. |
2 MSCI US REIT Index adjusted to include a 2% cash position (Lipper Money Market Average) through |
April 30, 2009; MSCI US REIT Index thereafter. |
3 Total return figures do not reflect the 1% redemption fee assessed on redemptions of shares held for less |
than one year, nor for the Investor Shares do they include the account service fee that may be applicable |
to certain accounts with balances below $10,000. |
4 Return since inception. |
Note: See Financial Highlights tables for dividend and capital gains information. |
10
REIT Index Fund
Financial Statements (unaudited)
Statement of Net Assets
As of July 31, 2009
The fund provides a complete list of its holdings four times in each fiscal year, at the quarter-ends. For the second and fourth fiscal quarters, the lists appear in the fund’s semiannual and annual reports to shareholders. For the first and third fiscal quarters, the fund files the lists with the Securities and Exchange Commission on Form N-Q. Shareholders can look up the fund’s Forms N-Q on the SEC’s website at www.sec.gov. Forms N-Q may also be reviewed and copied at the SEC’s Public Reference Room (see the back cover of this report for further information).
| | | Market |
| | | Value• |
| | Shares | ($000) |
Real Estate Investment Trusts (99.3%) | |
Diversified REITs (8.9%) | | |
| Vornado Realty Trust REIT | 7,053,177 | 359,853 |
| Liberty Property Trust REIT | 4,415,754 | 122,626 |
| Washington REIT | 2,592,667 | 66,346 |
| PS Business Parks, Inc. REIT | 686,036 | 35,475 |
| Investors Real Estate Trust REIT | 2,835,039 | 26,394 |
| Colonial Properties Trust REIT | 2,029,772 | 16,198 |
^ | Cousins Properties, Inc. REIT | 1,869,710 | 16,117 |
| CapLease, Inc. REIT | 2,116,580 | 6,413 |
| Winthrop Realty Trust REIT | 597,882 | 5,740 |
* | Gramercy Capital Corp. REIT | 1,959,891 | 2,822 |
| | | 657,984 |
Industrial REITs (5.5%) | | |
| ProLogis REIT | 18,764,727 | 164,942 |
| AMB Property Corp. REIT | 6,259,641 | 124,003 |
| DCT Industrial Trust Inc. REIT | 8,964,145 | 40,877 |
| EastGroup Properties, Inc. REIT | 1,120,776 | 38,913 |
| DuPont Fabros Technology Inc. REIT | 1,586,793 | 16,979 |
| First Potomac REIT | 1,221,549 | 11,446 |
^ | First Industrial Realty Trust REIT | 1,878,592 | 7,965 |
| | | 405,125 |
Office REITs (16.9%) | | |
| Boston Properties, Inc. | | |
| REIT | 6,091,939 | 322,264 |
| Digital Realty Trust, Inc. | | |
| REIT | 3,219,289 | 130,542 |
| Mack-Cali Realty Corp. | | |
| REIT | 3,429,917 | 95,729 |
| Duke Realty Corp. REIT | 9,563,617 | 90,759 | |
| SL Green Realty Corp. | | | |
| REIT | 3,319,783 | 85,584 | |
| Corporate Office | | | |
| Properties Trust, Inc. | | | |
| REIT | 2,431,263 | 82,444 | |
| Highwood Properties, Inc. | | | |
| REIT | 3,125,517 | 80,044 | |
^ | Alexandria Real Estate | | | |
| Equities, Inc. REIT | 1,759,862 | 67,068 | |
| BioMed Realty Trust, Inc. | | | |
| REIT | 4,344,109 | 50,739 |
| HRPT Properties Trust | | |
| REIT | 10,179,835 | 49,067 |
| Brandywine Realty Trust | | |
| REIT | 5,512,278 | 45,090 |
| Douglas Emmett, Inc. | | |
| REIT | 4,362,090 | 44,319 |
| Kilroy Realty Corp. REIT | 1,869,888 | 44,129 |
| Franklin Street | | |
| Properties Corp. REIT | 2,678,096 | 38,190 |
| Lexington Realty Trust | | |
| REIT | 3,908,101 | 16,727 |
| Parkway Properties Inc. | | |
| REIT | 966,662 | 13,698 |
| | | 1,256,393 |
Residential REITs (14.7%) | | |
| Equity Residential REIT | 12,194,055 | 292,657 |
| Avalonbay | | |
| Communities, Inc. REIT | 3,570,686 | 207,814 |
| Camden Property Trust | | |
| REIT | 2,920,252 | 86,177 |
| Essex Property Trust, Inc. | | |
| REIT | 1,197,761 | 77,867 |
| UDR, Inc. REIT | 6,652,244 | 69,516 |
| BRE Properties Inc. | | |
| Class A REIT | 2,286,533 | 54,259 |
| Equity Lifestyle | | |
| Properties, Inc. REIT | 1,270,253 | 52,931 |
11
REIT Index Fund
| | | Market |
| | | Value• |
| | Shares | ($000) |
| American Campus | | |
| Communities, Inc. REIT | 2,275,568 | 52,179 |
| Home Properties, Inc. | | |
| REIT | 1,449,732 | 51,755 |
| Mid-America Apartment | | |
| Communities, Inc. REIT | 1,261,737 | 50,053 |
| Apartment Investment | | |
| & Management Co. | | |
| Class A REIT | 5,243,385 | 49,183 |
| Post Properties, Inc. REIT | 1,976,855 | 27,992 |
| Sun Communities, Inc. | | |
| REIT | 781,082 | 11,951 |
| Education Realty | | |
| Trust, Inc. REIT | 2,370,293 | 11,496 |
| | | 1,095,830 |
Retail REITs (24.3%) | | |
| Simon Property | | |
| Group, Inc. REIT | 12,413,702 | 691,691 |
| Kimco Realty Corp. REIT | 15,397,275 | 151,509 |
| Federal Realty | | |
| Investment Trust REIT | 2,640,788 | 150,657 |
| Regency Centers Corp. | | |
| REIT | 3,518,893 | 112,886 |
^ | Realty Income Corp. | | |
| REIT | 4,663,179 | 109,958 |
| Weingarten Realty | | |
| Investors REIT | 4,889,187 | 75,440 |
| National Retail Properties | | |
| REIT | 3,531,772 | 69,611 |
^ | The Macerich Co. REIT | 3,496,220 | 68,771 |
| Taubman Co. REIT | 2,371,175 | 63,097 |
| Tanger Factory Outlet | | |
| Centers, Inc. REIT | 1,415,608 | 50,311 |
| Developers Diversified | | |
| Realty Corp. REIT | 6,070,243 | 34,054 |
| CBL & Associates | | |
| Properties, Inc. REIT | 5,493,079 | 32,629 |
^ | Equity One, Inc. REIT | 1,918,817 | 28,878 |
| Alexander’s, Inc. REIT | 91,057 | 25,090 |
| Inland Real Estate Corp. | | |
| REIT | 3,337,239 | 24,629 |
| Acadia Realty Trust REIT | 1,652,449 | 22,639 |
| Saul Centers, Inc. REIT | 598,936 | 20,286 |
| Getty Realty Holding Corp. | |
| REIT | 830,352 | 18,592 |
| Urstadt Biddle Properties | | |
| Class A REIT | 867,668 | 13,353 |
| Cedar Shopping | | |
| Centers, Inc. REIT | 1,986,573 | 10,549 |
^ | Pennsylvania REIT | 1,674,427 | 8,858 |
| Kite Realty Group Trust | | |
| REIT | 2,643,188 | 8,458 |
| Ramco-Gershenson | | |
| Properties Trust REIT | 829,282 | 7,538 |
| Glimcher Realty Trust | | |
| REIT | 1,688,737 | 5,708 |
| Urstadt Biddle Properties | | |
| REIT | 52,728 | 740 |
| | 1,805,932 |
Specialized REITs (29.0%) | | |
| Public Storage, Inc. REIT | 5,679,142 | 412,135 |
| HCP, Inc. REIT | 12,179,587 | 313,746 |
| Ventas, Inc. REIT | 6,982,242 | 246,473 |
| Host Hotels & | | |
| Resorts Inc. REIT | 26,480,551 | 240,443 |
| Health Care Inc. REIT | 4,860,451 | 194,710 |
| Nationwide Health | | |
| Properties, Inc. REIT | 4,575,335 | 132,776 |
| Senior Housing | | |
| Properties Trust REIT | 5,366,057 | 100,131 |
| Hospitality | | |
| Properties Trust REIT | 4,984,299 | 78,702 |
| Omega Healthcare | | |
| Investors, Inc. REIT | 3,683,354 | 61,549 |
| Healthcare | | |
| Realty Trust Inc. REIT | 2,650,584 | 51,448 |
| Entertainment | | |
| Properties Trust REIT | 1,552,462 | 42,398 |
| LaSalle Hotel Properties | | |
| REIT | 2,763,191 | 41,199 |
| National Health Investors | | |
| REIT | 1,047,987 | 32,634 |
| Extra Space Storage Inc. | | |
| REIT | 3,643,260 | 31,988 |
| DiamondRock | | |
| Hospitality Co. REIT | 4,722,622 | 31,925 |
| Sovran Self Storage, Inc. | | |
| REIT | 984,200 | 26,495 |
| Medical Properties | | |
| Trust Inc. REIT | 3,501,920 | 24,513 |
| LTC Properties, Inc. REIT | 930,548 | 22,724 |
| Sunstone Hotel | | |
| Investors, Inc. REIT | 3,239,944 | 18,014 |
| Universal Health | | |
| Realty Income REIT | 503,858 | 17,217 |
| Ashford Hospitality Trust | | |
| REIT | 3,482,431 | 10,413 |
| U-Store-It Trust REIT | 2,065,233 | 10,016 |
| FelCor Lodging Trust, Inc. | | |
| REIT | 2,832,170 | 6,656 |
| Hersha Hospitality Trust | | |
| REIT | 2,156,069 | 5,821 |
| Strategic Hotels and | | |
| Resorts, Inc. REIT | 3,322,055 | 3,920 |
| | 2,158,046 |
Total Real Estate Investment Trusts | |
(Cost $10,748,382) | | 7,379,310 |
12
REIT Index Fund
| | Market |
| | Value• |
| Shares | ($000) |
Temporary Cash Investments (1.8%) | |
Money Market Fund (1.7%) | | |
1,2 Vanguard Market | | |
Liquidity Fund, 0.335% 128,748,262 | 128,748 |
| | |
| | |
| Face | |
| Amount | |
| ($000) | |
U.S. Government and Agency Obligations (0.1%) | |
3 Federal Home Loan | | |
Mortgage Corp., | | |
0.250%, 10/13/09 | 5,000 | 4,998 |
3 Federal Home Loan | | |
Mortgage Corp., | | |
0.280%, 10/19/09 | 2,500 | 2,499 |
| | 7,497 |
Total Temporary Cash Investments | |
(Cost $136,244) | | 136,245 |
Total Investments (101.1%) | | |
(Cost $10,884,626) | | 7,515,555 |
Other Assets and Liabilities (–1.1%) | |
Other Assets | | 23,333 |
Liabilities2 | | (103,961) |
| | (80,628) |
Net Assets (100%) | | 7,434,927 |
At July 31, 2009, net assets consisted of: | |
| | Amount |
| | ($000) |
Paid-in Capital | | 11,457,959 |
Overdistributed Net Investment Income | | (60,568) |
Accumulated Net Realized Losses | | (597,003) |
Unrealized Appreciation (Depreciation) | | |
Investment Securities | | (3,369,071) |
Swap Contracts | | 3,610 |
Net Assets | | 7,434,927 |
| Amount |
| ($000) |
Investor Shares—Net Assets | |
Applicable to 246,677,582 outstanding | |
$.001 par value shares of beneficial | |
interest (unlimited authorization) | 2,821,172 |
Net Asset Value Per Share— Investor Shares | $11.44 |
| |
Admiral Shares—Net Assets | |
Applicable to 20,917,695 outstanding | |
$.001 par value shares of beneficial | |
interest (unlimited authorization) | 1,020,775 |
Net Asset Value Per Share— Admiral Shares | $48.80 |
| |
Signal Shares—Net Assets | |
Applicable to 31,325,186 outstanding | |
$.001 par value shares of beneficial | |
interest (unlimited authorization) | 408,089 |
Net Asset Value Per Share— Signal Shares | $13.03 |
| |
Institutional Shares—Net Assets | |
Applicable to 91,745,808 outstanding | |
$.001 par value shares of beneficial | |
interest (unlimited authorization) | 693,001 |
Net Asset Value Per Share— Institutional Shares | $7.55 |
| |
ETF Shares—Net Assets | |
Applicable to 72,359,341 outstanding | |
$.001 par value shares of beneficial | |
interest (unlimited authorization) | 2,491,890 |
Net Asset Value Per Share— ETF Shares | $34.44 |
• See Note A in Notes to Financial Statements. |
^ Part of security position is on loan to broker-dealers. The total value of securities on loan is $69,910,000. |
* Non-income-producing security. |
1 Affiliated money market fund available only to Vanguard funds and certain trusts and accounts managed by Vanguard. |
Rate shown is the 7-day yield. |
2 Includes $73,712,000 of collateral received for securities on loan. |
3 The issuer operates under a congressional charter; its securities are not backed by the full faith and credit of the |
U.S. government. |
REIT—Real Estate Investment Trust. |
See accompanying Notes, which are an integral part of the Financial Statements. |
13
REIT Index Fund
Statement of Operations
| Six Months Ended |
| July 31, 2009 |
| ($000) |
Investment Income | |
Income | |
Dividends1 | 136,960 |
Interest1 | 234 |
Security Lending | 1,370 |
Total Income | 138,564 |
Expenses | |
The Vanguard Group—Note B | |
Investment Advisory Services | 125 |
Management and Administrative—Investor Shares | 2,274 |
Management and Administrative—Admiral Shares | 453 |
Management and Administrative—Signal Shares | 180 |
Management and Administrative—Institutional Shares | 140 |
Management and Administrative—ETF Shares | 802 |
Marketing and Distribution—Investor Shares | 345 |
Marketing and Distribution—Admiral Shares | 116 |
Marketing and Distribution—Signal Shares | 57 |
Marketing and Distribution—Institutional Shares | 82 |
Marketing and Distribution—ETF Shares | 258 |
Custodian Fees | 63 |
Auditing Fees | 1 |
Shareholders’ Reports and Proxies—Investor Shares | 259 |
Shareholders’ Reports and Proxies—Admiral Shares | 11 |
Shareholders’ Reports and Proxies—Signal Shares | 3 |
Shareholders’ Reports and Proxies—Institutional Shares | 13 |
Shareholders’ Reports and Proxies—ETF Shares | 188 |
Trustees’ Fees and Expenses | 8 |
Total Expenses | 5,378 |
Net Investment Income | 133,186 |
Realized Net Gain (Loss) | |
Capital Gain Distributions Received | 47,444 |
Investment Securities Sold1 | (574,649) |
Realized Net Gain (Loss) | (527,205) |
Change in Unrealized Appreciation (Depreciation) | |
Investment Securities | 1,540,612 |
Swap Contracts | 3,610 |
Change in Unrealized Appreciation (Depreciation) | 1,544,222 |
Net Increase (Decrease) in Net Assets Resulting from Operations | 1,150,203 |
1 Dividend income, interest income, and realized net gain (loss) from affiliated companies of the fund |
were $1,351,000, $197,000, and ($17,248,000), respectively. |
See accompanying Notes, which are an integral part of the Financial Statements. |
14
REIT Index Fund
Statement of Changes in Net Assets
| Six Months Ended | Year Ended |
| July 31, | January 31, |
| 2009 | 2009 |
| ($000) | ($000) |
Increase (Decrease) in Net Assets | | |
Operations | | |
Net Investment Income | 133,186 | 299,591 |
Realized Net Gain (Loss) | (527,205) | 844,806 |
Change in Unrealized Appreciation (Depreciation) | 1,544,222 | (6,024,890) |
Net Increase (Decrease) in Net Assets Resulting from Operations | 1,150,203 | (4,880,493) |
Distributions | | |
Net Investment Income | | |
Investor Shares | (73,626) | (122,164) |
Admiral Shares | (27,845) | (50,605) |
Signal Shares | (11,400) | (18,431) |
Institutional Shares | (17,668) | (25,391) |
ETF Shares | (59,394) | (73,889) |
Realized Capital Gain | | |
Investor Shares | — | (26,879) |
Admiral Shares | — | (10,877) |
Signal Shares | — | (3,962) |
Institutional Shares | — | (5,438) |
ETF Shares | — | (15,867) |
Return of Capital | | |
Investor Shares | — | (60,479) |
Admiral Shares | — | (24,948) |
Signal Shares | — | (9,087) |
Institutional Shares | — | (12,510) |
ETF Shares | — | (36,421) |
Total Distributions | (189,933) | (496,948) |
Capital Share Transactions | | |
Investor Shares | 190,194 | 525,377 |
Admiral Shares | 22,620 | 96,330 |
Signal Shares | 3,852 | 160,016 |
Institutional Shares | 96,238 | 258,367 |
ETF Shares | 746,335 | 659,295 |
Net Increase (Decrease) from Capital Share Transactions | 1,059,239 | 1,699,385 |
Total Increase (Decrease) | 2,019,509 | (3,678,056) |
Net Assets | | |
Beginning of Period | 5,415,418 | 9,093,474 |
End of Period1 | 7,434,927 | 5,415,418 |
1 Net Assets—End of Period includes undistributed (overdistributed) net investment income of |
($60,568,000) and ($3,821,000). |
See accompanying Notes, which are an integral part of the Financial Statements. |
15
REIT Index Fund
Financial Highlights
Investor Shares | | | | | | |
| Six | | | | | |
| Months | | | | | |
| Ended | | | |
For a Share Outstanding | July 31, | Year Ended January 31, |
Throughout Each Period | 2009 | 2009 | 2008 | 2007 | 2006 | 2005 |
Net Asset Value, Beginning of Period | $10.02 | $20.38 | $27.76 | $21.29 | $17.20 | $15.83 |
Investment Operations | | | | | | |
Net Investment Income | .229 | .593 | .615 | .530 | .562 | .563 |
Net Realized and Unrealized Gain (Loss) | | | | | | |
on Investments1 | 1.506 | (9.975) | (6.985) | 7.000 | 4.692 | 1.759 |
Total from Investment Operations | 1.735 | (9.382) | (6.370) | 7.530 | 5.254 | 2.322 |
Distributions | | | | | | |
Dividends from Net Investment Income | (.315) | (.571) | (.622) | (.534) | (.568) | (.565) |
Distributions from Realized Capital Gains | — | (.125) | (.199) | (.413) | (.530) | (.387) |
Return of Capital | — | (.282) | (.189) | (.113) | (.066) | — |
Total Distributions | (.315) | (.978) | (1.010) | (1.060) | (1.164) | (.952) |
Net Asset Value, End of Period | $11.44 | $10.02 | $20.38 | $27.76 | $21.29 | $17.20 |
| | | | | | |
Total Return2 | 18.28% | –47.82% | –23.28% | 36.32% | 31.43% | 14.78% |
| | | | | | |
Ratios/Supplemental Data | | | | | | |
Net Assets, End of Period (Millions) | $2,821 | $2,274 | $4,046 | $6,827 | $4,727 | $4,311 |
Ratio of Total Expenses to | | | | | | |
Average Net Assets | 0.26%3 | 0.21% | 0.20% | 0.21% | 0.21% | 0.21% |
Ratio of Net Investment Income to | | | | | | |
Average Net Assets | 4.51%3 | 3.36% | 2.52% | 2.27% | 2.91% | 3.44% |
Portfolio Turnover Rate4 | 23%3 | 10% | 13% | 11% | 17% | 13% |
1 Includes increases from redemption fees of $0.00, $0.00, $0.02 $0.00, $0.01 and $0.01. |
2 Total returns do not reflect the 1% fee assessed on redemptions of shares held for less than one year, nor do they |
include the account service fee that may be applicable to certain accounts with balances below $10,000. |
3 Annualized. |
4 Excludes the value of portfolio securities received or delivered as a result of in-kind purchases or redemptions of the |
fund’s capital shares, including ETF Creation Units. |
See accompanying Notes, which are an integral part of the Financial Statements. |
16
REIT Index Fund
Financial Highlights
Admiral Shares | | | | | | |
| Six | | | | | |
| Months | | | | | |
| Ended | | | |
For a Share Outstanding | July 31, | Year Ended January 31, |
Throughout Each Period | 2009 | 2009 | 2008 | 2007 | 2006 | 2005 |
Net Asset Value, Beginning of Period | $42.74 | $86.94 | $118.46 | $90.82 | $73.40 | $67.56 |
Investment Operations | | | | | | |
Net Investment Income | .997 | 2.581 | 2.707 | 2.328 | 2.460 | 2.437 |
Net Realized and Unrealized Gain (Loss) | | | | | | |
on Investments1 | 6.429 | (42.527) | (29.817) | 29.903 | 19.993 | 7.494 |
Total from Investment Operations | 7.426 | (39.946) | (27.110) | 32.231 | 22.453 | 9.931 |
Distributions | | | | | | |
Dividends from Net Investment Income | (1.366) | (2.491) | (2.735) | (2.341) | (2.488) | (2.439) |
Distributions from Realized Capital Gains | — | (.535) | (.849) | (1.761) | (2.258) | (1.652) |
Return of Capital | — | (1.228) | (.826) | (.489) | (.287) | — |
Total Distributions | (1.366) | (4.254) | (4.410) | (4.591) | (5.033) | (4.091) |
Net Asset Value, End of Period | $48.80 | $42.74 | $86.94 | $118.46 | $90.82 | $73.40 |
| | | | | | |
Total Return2 | 18.36% | –47.77% | –23.23% | 36.46% | 31.49% | 14.82% |
| | | | | | |
Ratios/Supplemental Data | | | | | | |
Net Assets, End of Period (Millions) | $1,021 | $873 | $1,706 | $3,392 | $2,025 | $938 |
Ratio of Total Expenses to | | | | | | |
Average Net Assets | 0.14%3 | 0.11% | 0.10% | 0.14% | 0.14% | 0.16% |
Ratio of Net Investment Income to | | | | | | |
Average Net Assets | 4.63%3 | 3.46% | 2.62% | 2.34% | 2.98% | 3.49% |
Portfolio Turnover Rate4 | 23%3 | 10% | 13% | 11% | 17% | 13% |
1 Includes increases from redemption fees of $0.01, $0.02, $0.10, $0.02, $0.02, and $0.04. |
2 Total returns do not reflect the 1% fee assessed on redemptions of shares held for less than one year. |
3 Annualized. |
4 Excludes the value of portfolio securities received or delivered as a result of in-kind purchases or redemptions of the |
fund’s capital shares, including ETF Creation Units. |
See accompanying Notes, which are an integral part of the Financial Statements. |
17
REIT Index Fund
Financial Highlights
Signal Shares | | | |
| Six Months | Year | June 4, |
| Ended | Ended | 20071 to |
| July 31, | Jan. 31, | Jan. 31, |
For a Share Outstanding Throughout Each Period | 2009 | 2009 | 2008 |
Net Asset Value, Beginning of Period | $11.41 | $23.21 | $30.05 |
Investment Operations | | | |
Net Investment Income | .267 | .688 | .470 |
Net Realized and Unrealized Gain (Loss) on Investments2 | 1.717 | (11.353) | (6.311) |
Total from Investment Operations | 1.984 | (10.665) | (5.841) |
Distributions | | | |
Dividends from Net Investment Income | (.364) | (.664) | (.620) |
Distributions from Realized Capital Gains | — | (.143) | (.192) |
Return of Capital | — | (.328) | (.187) |
Total Distributions | (.364) | (1.135) | (.999) |
Net Asset Value, End of Period | $13.03 | $11.41 | $23.21 |
| | | |
Total Return3 | 18.37% | –47.77% | –19.68% |
| | | |
Ratios/Supplemental Data | | | |
Net Assets, End of Period (Millions) | $408 | $350 | $538 |
Ratio of Total Expenses to Average Net Assets | 0.14%4 | 0.11% | 0.10%4 |
Ratio of Net Investment Income to Average Net Assets | 4.63%4 | 3.46% | 2.62%4 |
Portfolio Turnover Rate5 | 23%4 | 10% | 13% |
1 Inception. |
2 Includes increases from redemption fees of $0.00, $0.00, and $0.01. |
3 Total returns do not reflect the 1% fee assessed on redemptions of shares held for less than one year. |
4 Annualized. |
5 Excludes the value of portfolio securities received or delivered as a result of in-kind purchases |
or redemptions of the fund’s capital shares, including ETF Creation Units. |
See accompanying Notes, which are an integral part of the Financial Statements. |
18
REIT Index Fund
Financial Highlights
Institutional Shares | | | | | | |
| Six Months | | | | | |
| Ended | | | | | |
| | | | |
For a Share Outstanding | July 31, | Year Ended January 31, |
Throughout Each Period | 2009 | 2009 | 2008 | 2007 | 2006 | 2005 |
Net Asset Value, Beginning of Period | $6.61 | $13.46 | $18.33 | $14.06 | $11.36 | $10.46 |
Investment Operations | | | | | | |
Net Investment Income | .156 | .401 | .420 | .366 | .385 | .381 |
Net Realized and Unrealized Gain (Loss) | | | | | | |
on Investments1 | .996 | (6.591) | (4.605) | 4.621 | 3.099 | 1.156 |
Total from Investment Operations | 1.152 | (6.190) | (4.185) | 4.987 | 3.484 | 1.537 |
Distributions | | | | | | |
Dividends from Net Investment Income | (.212) | (.386) | (.426) | (.368) | (.389) | (.381) |
Distributions from Realized Capital Gains | — | (.083) | (.131) | (.273) | (.350) | (.256) |
Return of Capital | — | (.191) | (.128) | (.076) | (.045) | — |
Total Distributions | (.212) | (.660) | (.685) | (.717) | (.784) | (.637) |
Net Asset Value, End of Period | $7.55 | $6.61 | $13.46 | $18.33 | $14.06 | $11.36 |
| | | | | | |
Total Return2 | 18.41% | –47.82% | –23.18% | 36.45% | 31.58% | 14.81% |
| | | | | | |
Ratios/Supplemental Data | | | | | | |
Net Assets, End of Period (Millions) | $693 | $504 | $722 | $960 | $571 | $297 |
Ratio of Total Expenses to | | | | | | |
Average Net Assets | 0.09%3 | 0.09% | 0.09% | 0.10% | 0.10% | 0.13% |
Ratio of Net Investment Income to | | | | | | |
Average Net Assets | 4.68%3 | 3.48% | 2.63% | 2.38% | 3.02% | 3.52% |
Portfolio Turnover Rate4 | 23%3 | 10% | 13% | 11% | 17% | 13% |
1 Includes increases from redemption fees of $0.00, $0.00, $0.01, $0.00, $0.00, and $0.00. |
2 Total returns do not reflect the 1% fee assessed on redemptions of shares held for less than one year. |
3 Annualized. |
4 Excludes the value of portfolio securities received or delivered as a result of in-kind purchases or redemptions of the |
fund’s capital shares, including ETF Creation Units. |
See accompanying Notes, which are an integral part of the Financial Statements. |
19
REIT Index Fund
Financial Highlights
ETF Shares | | | | | | |
| Six | | | | | |
| Months | | | | | Sept. 23, |
| Ended | | | 20041 to |
For a Share Outstanding | July 31, | Year Ended January 31, | Jan. 31, |
Throughout Each Period | 2009 | 2009 | 2008 | 2007 | 2006 | 2005 |
Net Asset Value, Beginning of Period | $30.14 | $61.31 | $83.55 | $64.07 | $51.77 | $49.41 |
Investment Operations | | | | | | |
Net Investment Income | .705 | 1.820 | 1.908 | 1.654 | 1.745 | .665 |
Net Realized and Unrealized Gain (Loss) | | | | | | |
on Investments2 | 4.558 | (29.990) | (21.037) | 21.080 | 14.116 | 2.965 |
Total from Investment Operations | 5.263 | (28.170) | (19.129) | 22.734 | 15.861 | 3.630 |
Distributions | | | | | | |
Dividends from Net Investment Income | (.963) | (1.757) | (1.931) | (1.665) | (1.764) | (.682) |
Distributions from Realized Capital Gains | — | (.377) | (.598) | (1.242) | (1.594) | (.588) |
Return of Capital | — | (.866) | (.582) | (.347) | (.203) | — |
Total Distributions | (.963) | (3.000) | (3.111) | (3.254) | (3.561) | (1.270) |
Net Asset Value, End of Period | $34.44 | $30.14 | $61.31 | $83.55 | $64.07 | $51.77 |
| | | | | | |
Total Return | 18.37% | –47.77% | –23.23% | 36.48% | 31.54% | 7.13% |
| | | | | | |
Ratios/Supplemental Data | | | | | | |
Net Assets, End of Period (Millions) | $2,492 | $1,414 | $2,082 | $1,713 | $871 | $198 |
Ratio of Total Expenses to | | | | | | |
Average Net Assets | 0.14%3 | 0.11% | 0.10% | 0.12% | 0.12% | 0.18%3 |
Ratio of Net Investment Income to | | | | | | |
Average Net Assets | 4.63%3 | 3.46% | 2.62% | 2.36% | 3.00% | 3.47%3 |
Portfolio Turnover Rate4 | 23%3 | 10% | 13% | 11% | 17% | 13% |
1 Inception. |
2 Includes increases from redemption fees of $0.00, $0.01, $0.04, $0.01, $0.01 and $0.00. |
3 Annualized. |
4 Excludes the value of portfolio securities received or delivered as a result of in-kind purchases or redemptions of the fund’s |
capital shares, including ETF Creation Units. |
See accompanying Notes, which are an integral part of the Financial Statements. |
20
REIT Index Fund
Notes to Financial Statements
Vanguard REIT Index Fund is registered under the Investment Company Act of 1940 as an open-end investment company, or mutual fund. The fund offers five classes of shares: Investor Shares, Admiral Shares, Signal Shares, Institutional Shares, and ETF Shares. Investor Shares are available to any investor who meets the fund’s minimum purchase requirements. Admiral Shares are designed for investors who meet certain administrative, service, tenure, and account-size criteria. Signal Shares are designed for institutional investors who meet certain administrative, service, and account-size criteria. Institutional Shares are designed for investors who meet certain administrative and service criteria and invest a minimum of $5 million. ETF Shares are listed for trading on the NYSE Arca, Inc.; they can be purchased and sold through a broker.
A. The following significant accounting policies conform to generally accepted accounting principles for U.S. mutual funds. The fund consistently follows such policies in preparing its financial statements.
1. Security Valuation: Securities are valued as of the close of trading on the New York Stock Exchange (generally 4 p.m., Eastern time) on the valuation date. Equity securities are valued at the latest quoted sales prices or official closing prices taken from the primary market in which each security trades; such securities not traded on the valuation date are valued at the mean of the latest quoted bid and asked prices. Securities for which market quotations are not readily available, or whose values have been materially affected by events occurring before the fund’s pricing time but after the close of the securities’ primary markets, are valued by methods deemed by the board of trustees to represent fair value. Investments in Vanguard Market Liquidity Fund are valued at that fund’s net asset value. Temporary cash investments acquired over 60 days to maturity are valued using the latest bid prices or using valuations based on a matrix system (which considers such factors as security prices, yields, maturities, and ratings), both as furnished by independent pricing services. Other temporary cash investments are valued at amortized cost, which approximates market value.
2. Swap Contracts: The fund has entered into swap transactions to earn the total return on a specified REIT index. Under the terms of the swaps, the fund receives the total return (either receiving the increase or paying the decrease) on a reference index, applied to a notional principal amount. In return, the fund agrees to pay the counterparty a floating rate, which is reset periodically based on short-term interest rates, applied to the same notional amount. At the same time, the fund invests an amount equal to the notional amount of the swap in high-quality temporary cash investments.
The notional amounts of swap contracts are not recorded in the Statement of Net Assets. Swaps are valued daily and the change in value is recorded as unrealized appreciation (depreciation) until the swap terminates, at which time realized gain (loss) is recorded. The primary risk associated with the swaps is that a counterparty will default on its obligation to pay net amounts due to the fund. The fund’s maximum risk of loss from counterparty credit risk is the amount of unrealized appreciation on the swap contract. This risk is mitigated by entering into swaps only with highly rated counterparties, a master netting arrangement between the fund and the counterparty, and by the posting of collateral by the counterparty. The swap contracts contain provisions whereby a counterparty may terminate open contracts if the fund’s net assets decline below a certain level, triggering a payment by the fund if the fund is in a net liability position at the time of the termination. The payment amount would be reduced by any collateral the fund has posted. Any securities posted as collateral for open contracts are noted in the Statement of Net Assets.
21
REIT Index Fund
3. Federal Income Taxes: The fund intends to continue to qualify as a regulated investment company and distribute all of its taxable income. Management has analyzed the fund’s tax positions taken on federal income tax returns for all open tax years (tax years ended January 31, 2006–2009) and for the period ended July 31, 2009, and has concluded that no provision for federal income tax is required in the fund’s financial statements.
4. Distributions: Distributions to shareholders are recorded on the ex-dividend date.
5. Security Lending: The fund may lend its securities to qualified institutional borrowers to earn additional income. Security loans are required to be secured at all times by collateral at least equal to the market value of securities loaned. The fund invests cash collateral received in Vanguard Market Liquidity Fund, and records a liability for the return of the collateral, during the period the securities are on loan. Security lending income represents the income earned on investing cash collateral, less expenses associated with the loan.
6. Other: Distributions received from REITs are recorded on the ex-dividend date. Each REIT reports annually the tax character of its distributions. Dividend income, capital gain distributions received and unrealized appreciation (depreciation) reflect the amounts of taxable income, capital gain, and return of capital reported by the REITs, and management’s estimates of such amounts for REIT distributions for which actual information has not been reported. Interest income includes income distributions received from Vanguard Market Liquidity Fund and is accrued daily. Security transactions are accounted for on the date securities are bought or sold. Costs used to determine realized gains (losses) on the sale of investment securities are those of the specific securities sold. Fees assessed on redemptions of capital shares are credited to paid-in capital.
Each class of shares has equal rights as to assets and earnings, except that each class separately bears certain class-specific expenses related to maintenance of shareholder accounts (included in Management and Administrative expenses), shareholder reporting, and proxies. Marketing and distribution expenses are allocated to each class of shares based on a method approved by the board of trustees. Income, other non-class-specific expenses, and gains and losses on investments are allocated to each class of shares based on its relative net assets.
B. The Vanguard Group furnishes at cost investment advisory, corporate management, administrative, marketing, and distribution services. The costs of such services are allocated to the fund under methods approved by the board of trustees. The fund has committed to provide up to 0.40% of its net assets in capital contributions to Vanguard. At July 31, 2009, the fund had contributed capital of $1,544,000 to Vanguard (included in Other Assets), representing 0.02% of the fund’s net assets and 0.62% of Vanguard’s capitalization. The fund’s trustees and officers are also directors and officers of Vanguard.
C. Various inputs may be used to determine the value of the fund’s investments. These inputs are summarized in three broad levels for financial statement purposes. The inputs or methodologies used to value securities are not necessarily an indication of the risk associated with investing in those securities.
Level 1—Quoted prices in active markets for identical securities.
Level 2—Other significant observable inputs (including quoted prices for similar securities, interest rates, prepayment speeds, credit risk, etc.).
Level 3—Significant unobservable inputs (including the fund’s own assumptions used to determine the fair value of investments).
22
REIT Index Fund
The following table summarizes the fund’s investments as of July 31, 2009, based on the inputs used to value them:
| Level 1 | Level 2 | Level 3 |
Investments | ($000) | ($000) | ($000) |
Real Estate Investment Trusts | 7,379,310 | — | — |
Temporary Cash Investments | 128,748 | 7,497 | — |
Swap Contracts—Assets | — | 3,610 | — |
Total | 7,508,058 | 11,107 | — |
D. At July 31, 2009, the fund had the following open total return swap contract:
| | | | Floating | Unrealized |
| | | Notional | Interest Rate | Appreciation |
| Termination | | Amount | Received | (Depreciation) |
Reference Entity | Date | Counterparty | ($000) | (Paid)1 | ($000) |
MSCI US REIT Total Return | | | | | |
Swap Gross Index | 6/29/10 | GSCM | 51,326 | (0.556%) | 3,610 |
GSCM—Goldman Sachs International. | | | | | | |
1 Based on one-month London InterBank Offered Rate (LIBOR) as of the most recent payment date |
plus a fixed fee of 0.25%. |
E. Distributions are determined on a tax basis and may differ from net investment income and realized capital gains for financial reporting purposes. Differences may be permanent or temporary. Permanent differences are reclassified among capital accounts in the financial statements to reflect their tax character. Temporary differences arise when certain items of income, expense, gain, or loss are recognized in different periods for financial statement and tax purposes; these differences will reverse at some time in the future. Differences in classification may also result from the treatment of short-term gains as ordinary income for tax purposes. The fund’s tax-basis capital gains and losses are determined only at the end of each fiscal year.
During the six months ended July 31, 2009, the fund realized $28,879,000 of net capital gains resulting from in-kind redemptions—in which shareholders exchanged fund shares for securities held by the fund rather than for cash. Because such gains are not taxable to the fund, and are not distributed to shareholders, they have been reclassified from accumulated net realized losses to paid-in capital.
At July 31, 2009, the cost of investment securities for tax purposes was $10,884,626,000. Net unrealized depreciation of investment securities for tax purposes was $3,369,071,000, consisting of unrealized gains of $86,944,000 on securities that had risen in value since their purchase and $3,456,015,000 in unrealized losses on securities that had fallen in value since their purchase.
F. During the six months ended July 31, 2009, the fund purchased $1,856,765,000 of investment securities and sold $745,147,000 of investment securities, other than temporary cash investments.
23
REIT Index Fund
G. Capital share transactions for each class of shares were:
| Six Months Ended | Year Ended |
| July 31, 2009 | January 31, 2009 |
| Amount | Shares | Amount | Shares |
| ($000) | (000) | ($000) | (000) |
Investor Shares | | | | |
Issued | 376,759 | 39,035 | 1,134,996 | 65,608 |
Issued in Lieu of Cash Distributions | 68,921 | 7,791 | 196,216 | 12,122 |
Redeemed1 | (255,486) | (27,159) | (805,835) | (49,310) |
Net Increase (Decrease)—Investor Shares | 190,194 | 19,667 | 525,377 | 28,420 |
Admiral Shares | | | | |
Issued | 86,309 | 2,059 | 316,602 | 4,056 |
Issued in Lieu of Cash Distributions | 22,837 | 605 | 71,754 | 1,029 |
Redeemed1 | (86,526) | (2,185) | (292,026) | (4,268) |
Net Increase (Decrease)—Admiral Shares | 22,620 | 479 | 96,330 | 817 |
Signal Shares | | | | |
Issued | 74,430 | 6,888 | 292,068 | 14,603 |
Issued in Lieu of Cash Distributions | 9,960 | 991 | 27,716 | 1,507 |
Redeemed1 | (80,538) | (7,256) | (159,768) | (8,585) |
Net Increase (Decrease)—Signal Shares | 3,852 | 623 | 160,016 | 7,525 |
Institutional Shares | | | | |
Issued | 128,352 | 20,434 | 378,908 | 33,267 |
Issued in Lieu of Cash Distributions | 16,337 | 2,794 | 40,717 | 3,869 |
Redeemed1 | (48,451) | (7,619) | (161,258) | (14,629) |
Net Increase (Decrease)—Institutional Shares | 96,238 | 15,609 | 258,367 | 22,507 |
ETF Shares | | | | |
Issued | 825,900 | 28,133 | 2,522,879 | 48,375 |
Issued in Lieu of Cash Distributions | — | — | — | — |
Redeemed1 | (79,565) | (2,700) | (1,863,584) | (35,400) |
Net Increase (Decrease)—ETF Shares | 746,335 | 25,433 | 659,295 | 12,975 |
1 Net of redemption fees of $785,000 and $1,996,000 (fund totals). | |
24
REIT Index Fund
H. The fund has invested in a company that is considered to be an affiliated company of the fund because the fund owns more than 5% of the outstanding voting securities of the company.
Transactions during the period in securities of this company were as follows:
| | Current Period Transactions | |
| Jan. 31, 2009 | | Proceeds from | | July 31, 2009 |
| Market | Purchases | Securities | Dividend | Market |
| Value | at Cost | Sold | Income | Value |
| ($000) | ($000) | ($000) | ($000) | ($000) |
Ashford Hospitality Trust REIT | 6,633 | 1,548 | 3,752 | 1,351 | NA1 |
1 Not applicable—At July 31, 2009, the security was still held but the issuer was no longer an affiliated |
company of the fund. |
I. In preparing the financial statements as of July 31, 2009, management considered the impact of subsequent events occurring through September 10, 2009, for potential recognition or disclosure in these financial statements.
25
About Your Fund’s Expenses
As a shareholder of the fund, you incur ongoing costs, which include costs for portfolio management, administrative services, and shareholder reports (like this one), among others. Operating expenses, which are deducted from a fund’s gross income, directly reduce the investment return of the fund.
A fund’s expenses are expressed as a percentage of its average net assets. This figure is known as the expense ratio. The following examples are intended to help you understand the ongoing costs (in dollars) of investing in your fund and to compare these costs with those of other mutual funds. The examples are based on an investment of $1,000 made at the beginning of the period shown and held for the entire period.
The accompanying table illustrates your fund’s costs in two ways:
• Based on actual fund return. This section helps you to estimate the actual expenses that you paid over the period. The “Ending Account Value” shown is derived from the fund’s actual return, and the third column shows the dollar amount that would have been paid by an investor who started with $1,000 in the fund. You may use the information here, together with the amount you invested, to estimate the expenses that you paid over the period.
To do so, simply divide your account value by $1,000 (for example, an $8,600 account value divided by $1,000 = 8.6), then multiply the result by the number given for your fund under the heading “Expenses Paid During Period.”
• Based on hypothetical 5% yearly return. This section is intended to help you compare your fund’s costs with those of other mutual funds. It assumes that the fund had a yearly return of 5% before expenses, but that the expense ratio is unchanged. In this case—because the return used is not the fund’s actual return—the results do not apply to your investment. The example is useful in making comparisons because the Securities and Exchange Commission requires all mutual funds to calculate expenses based on a 5% return. You can assess your fund’s costs by comparing this hypothetical example with the hypothetical examples that appear in shareholder reports of other funds.
Note that the expenses shown in the table are meant to highlight and help you compare ongoing costs only and do not reflect transaction costs incurred by the fund for buying and selling securities. Further, the expenses do not include the 1% fee on redemptions of shares held for less than one year, nor do they include the account service fee described in the prospectus. If such fees were applied to your account, your costs would be higher. Your fund does not carry a “sales load.”
The calculations assume no shares were bought or sold during the period. Your actual costs may have been higher or lower, depending on the amount of your investment and the timing of any purchases or redemptions.
You can find more information about the fund’s expenses, including annual expense ratios, in the Financial Statements section of this report. For additional information on operating expenses and other shareholder costs, please refer to your fund’s current prospectus.
26
Six Months Ended July 31, 2009 | | | |
| Beginning | Ending | Expenses |
| Account Value | Account Value | Paid During |
REIT Index Fund | 1/31/2009 | 7/31/2009 | Period1 |
Based on Actual Fund Return | | | |
Investor Shares | $1,000.00 | $1,182.83 | $1.41 |
Admiral Shares | 1,000.00 | 1,183.59 | 0.76 |
Signal Shares | 1,000.00 | 1,183.72 | 0.76 |
Institutional Shares | 1,000.00 | 1,184.10 | 0.49 |
ETF Shares | 1,000.00 | 1,183.71 | 0.76 |
Based on Hypothetical 5% Yearly Return | | | |
Investor Shares | $1,000.00 | $1,023.51 | $1.30 |
Admiral Shares | 1,000.00 | 1,024.10 | 0.70 |
Signal Shares | 1,000.00 | 1,024.10 | 0.70 |
Institutional Shares | 1,000.00 | 1,024.35 | 0.45 |
ETF Shares | 1,000.00 | 1,024.10 | 0.70 |
1 These calculations are based on expenses incurred in the most recent six-month period. The fund’s |
annualized six-month expense ratios for that period are 0.26% for Investor Shares, 0.14% for |
Admiral Shares, 0.14% for Signal Shares, 0.09% for Institutional Shares, and 0.14% for ETF Shares. The |
dollar amounts shown as “Expenses Paid” are equal to the annualized expense ratio multiplied by the |
average account value over the period, multiplied by the number of days in the most recent six-month |
period, then divided by the number of days in the most recent 12-month period. |
27
Trustees Approve Advisory Arrangement
The board of trustees of Vanguard REIT Index Fund has renewed the fund’s investment advisory arrangement with The Vanguard Group, Inc. Vanguard—through its Quantitative Equity Group—serves as the investment advisor to the fund. The board determined that continuing the fund’s internalized management structure was in the best interests of the fund and its shareholders.
The board based its decision upon an evaluation of the advisor’s investment staff, portfolio management process, and performance. The trustees considered the factors discussed below, among others. However, no single factor determined whether the board approved the arrangement. Rather, it was the totality of the circumstances that drove the board’s decision.
Nature, extent, and quality of services
The board considered the quality of the fund’s investment management over both the short and long term, and took into account the organizational depth and stability of the advisor. The board noted that Vanguard has been managing investments for more than three decades. The Quantitative Equity Group adheres to a sound, disciplined investment management process; the team has considerable experience, stability, and depth.
The board concluded that the advisor’s experience, stability, depth, and performance, among other factors, warranted continuation of the advisory arrangement.
Investment performance
The board considered the short- and long-term performance of the fund, including any periods of outperformance or underperformance of its target index and peer group. The board concluded that the fund has performed in line with expectations, and that its results have been consistent with its investment strategy. Information about the fund’s most recent performance can be found in the Performance Summary portion of this report.
Cost
The board concluded that the fund’s expense ratio was well below the average expense ratio charged by funds in its peer group and that the fund’s advisory expense ratio was also well below its peer-group average. Information about the fund’s expense ratio appears in the About Your Fund’s Expenses section of this report as well as in the Financial Statements section.
The board does not conduct a profitability analysis of Vanguard, because of Vanguard’s unique “at-cost” structure. Unlike most other mutual fund management companies, Vanguard is owned by the funds it oversees, and produces “profits” only in the form of reduced expenses for fund shareholders.
The benefit of economies of scale
The board concluded that the fund’s low-cost arrangement with Vanguard ensures that the fund will realize economies of scale as it grows, with the cost to shareholders declining as the fund’s assets increase.
The board will consider whether to renew the advisory arrangement again after a one-year period.
28
Glossary
Beta. A measure of the magnitude of a fund’s past share-price fluctuations in relation to the ups and downs of a given market index. The index is assigned a beta of 1.00. Compared with a given index, a fund with a beta of 1.20 typically would have seen its share price rise or fall by 12% when the index rose or fell by 10%. For this report, beta is based on returns over the past 36 months for both the fund and the index. Note that a fund’s beta should be reviewed in conjunction with its R-squared (see definition). The lower the R-squared, the less correlation there is between the fund and the index, and the less reliable beta is as an indicator of volatility.
Earnings Growth Rate. The average annual rate of growth in earnings over the past five years for the stocks now in a fund.
Expense Ratio. The percentage of a fund’s average net assets used to pay its annual administrative and advisory expenses. These expenses directly reduce returns to investors.
Foreign Holdings. The percentage of a fund represented by stocks or depositary receipts of companies based outside the United States.
Inception Date. The date on which the assets of a fund (or one of its share classes) are first invested in accordance with the fund’s investment objective. For funds with a subscription period, the inception date is the day after that period ends. Investment performance is measured from the inception date.
Median Market Cap. An indicator of the size of companies in which a fund invests; the midpoint of market capitalization (market price x shares outstanding) of a fund’s stocks, weighted by the proportion of the fund’s assets invested in each stock. Stocks representing half of the fund’s assets have market capitalizations above the median, and the rest are below it.
Price/Book Ratio. The share price of a stock divided by its net worth, or book value, per share. For a fund, the weighted average price/book ratio of the stocks it holds.
Price/Earnings Ratio. The ratio of a stock’s current price to its per-share earnings over the past year. For a fund, the weighted average P/E of the stocks it holds. P/E is an indicator of market expectations about corporate prospects; the higher the P/E, the greater the expectations for a company’s future growth.
R-Squared. A measure of how much of a fund’s past returns can be explained by the returns from the market in general, as measured by a given index. If a fund’s total returns were precisely synchronized with an index’s returns, its R-squared would be 1.00. If the fund’s returns bore no relationship to the index’s returns, its R-squared would be 0. For this report, R-squared is based on returns over the past 36 months for both the fund and the index.
Return on Equity. The annual average rate of return generated by a company during the past five years for each dollar of shareholder’s equity (net income divided by shareholder’s equity). For a fund, the weighted average return on equity for the companies whose stocks it holds.
Short-Term Reserves. The percentage of a fund invested in highly liquid, short-term securities that can be readily converted to cash.
Turnover Rate. An indication of the fund’s trading activity. Funds with high turnover rates incur higher transaction costs and may be more likely to distribute capital gains (which may be taxable to investors). The turnover rate excludes in-kind transactions, which have minimal impact on costs.
Yield. A snapshot of the level of dividends, interest, capital gains distributions, and return-of-capital distributions received by the fund. The index yield is based on the current annualized rate of dividends and other distributions provided by securities in the index.
29
This page intentionally left blank.
This page intentionally left blank.
The People Who Govern Your Fund
The trustees of your mutual fund are there to see that the fund is operated and managed in your best interests since, as a shareholder, you are a part owner of the fund. Your fund’s trustees also serve on the board of directors of The Vanguard Group, Inc., which is owned by the Vanguard funds and provides services to them on an at-cost basis.
A majority of Vanguard’s board members are independent, meaning that they have no affiliation with Vanguard or the funds they oversee, apart from the sizable personal investments they have made as private individuals. The independent board members have distinguished backgrounds in business, academia, and public service. Each of the trustees and executive officers oversees 157 Vanguard funds.
The following table provides information for each trustee and executive officer of the fund. More information about the trustees is in the Statement of Additional Information, which can be obtained, without charge, by contacting Vanguard at 800-662-7447, or online at www.vanguard.com.
Interested Trustees | Emerson U. Fullwood |
| Born 1948. Trustee Since January 2008. Principal |
| Occupation(s) During the Past Five Years: Retired |
| Executive Chief Staff and Marketing Officer for North |
John J. Brennan1 | America and Corporate Vice President of Xerox |
Born 1954. Trustee Since May 1987. Chairman of | Corporation (photocopiers and printers); Director of |
the Board. Principal Occupation(s) During the Past | SPX Corporation (multi-industry manufacturing), the |
Five Years: Chairman of the Board and Director/Trustee | United Way of Rochester, the Boy Scouts of America, |
of The Vanguard Group, Inc., and of each of the | Amerigroup Corporation (direct health and medical |
investment companies served by The Vanguard Group; | insurance carriers), and Monroe Community College |
Chief Executive Officer and President of The Vanguard | Foundation. |
Group and of each of the investment companies served | |
by The Vanguard Group (1996-2008); Chairman of | |
the Financial Accounting Foundation; Governor of | Rajiv L. Gupta |
the Financial Industry Regulatory Authority (FINRA); | Born 1945. Trustee Since December 2001.2 Principal |
Director of United Way of Southeastern Pennsylvania. | Occupation(s) During the Past Five Years: Retired |
| Chairman and Chief Executive Officer of Rohm and |
F. William McNabb III1 | Haas Co. (chemicals); President of Rohm and Haas Co. |
Born 1957. Trustee Since July 2009. Principal | (2006-2008); Board Member of American Chemistry |
Occupation(s) During the Past Five Years: Director of | Council; Director of Tyco International, Ltd. (diversified |
The Vanguard Group, Inc., since 2008; Chief Executive | manufacturing and services) and Hewlett-Packard Co. |
Officer and President of The Vanguard Group and of | (electronic computer manufacturing); Trustee of The |
each of the investment companies served by The | Conference Board. |
Vanguard Group since 2008; Director of Vanguard | |
Marketing Corporation; Managing Director of The | |
Vanguard Group (1995-2008). | Amy Gutmann |
| Born 1949. Trustee Since June 2006. Principal |
| Occupation(s) During the Past Five Years: President of |
Independent Trustees | the University of Pennsylvania; Christopher H. Browne |
| Distinguished Professor of Political Science in the School |
Charles D. Ellis | of Arts and Sciences with Secondary Appointments |
Born 1937. Trustee Since January 2001. Principal | at the Annenberg School for Communication and the |
Occupation(s) During the Past Five Years: Applecore | Graduate School of Education of the University of |
Partners (pro bono ventures in education); Senior | Pennsylvania; Director of Carnegie Corporation of |
Advisor to Greenwich Associates (international business | New York, Schuylkill River Development Corporation, |
strategy consulting); Successor Trustee of Yale University; | and Greater Philadelphia Chamber of Commerce; |
Overseer of the Stern School of Business at New York | Trustee of the National Constitution Center. |
University; Trustee of the Whitehead Institute for | |
Biomedical Research. | |
JoAnn Heffernan Heisen | Executive Officers |
Born 1950. Trustee Since July 1998. Principal | | |
Occupation(s) During the Past Five Years: Retired | | |
Corporate Vice President, Chief Global Diversity Officer, | Thomas J. Higgins1 |
and Member of the Executive Committee of Johnson | Born 1957. Chief Financial Officer Since September |
& Johnson (pharmaceuticals/consumer products); | 2008. Principal Occupation(s) During the Past Five |
Vice President and Chief Information Officer of Johnson | Years: Principal of The Vanguard Group, Inc.; Chief |
& Johnson (1997-2005); Director of the University | Financial Officer of each of the investment companies |
Medical Center at Princeton and Women’s Research | served by The Vanguard Group since 2008; Treasurer |
and Education Institute. | of each of the investment companies served by The |
| Vanguard Group (1998-2008). |
| | |
Andr F. Perold | | |
Born 1952. Trustee Since December 2004. Principal | Kathryn J. Hyatt1 | |
Occupation(s) During the Past Five Years: George Gund | Born 1955. Treasurer Since November 2008. Principal |
Professor of Finance and Banking, Harvard Business | Occupation(s) During the Past Five Years: Principal of |
School; Director and Chairman of UNX, Inc. (equities | The Vanguard Group, Inc.; Treasurer of each of the |
trading firm); Chair of the Investment Committee of | investment companies served by The Vanguard |
HighVista Strategies LLC (private investment firm). | Group since 2008; Assistant Treasurer of each of the |
| investment companies served by The Vanguard Group |
| (1988-2008). | |
Alfred M. Rankin, Jr. | | |
Born 1941. Trustee Since January 1993. Principal | | |
Occupation(s) During the Past Five Years: Chairman, | Heidi Stam1 | |
President, Chief Executive Officer, and Director of | Born 1956. Secretary Since July 2005. Principal |
NACCO Industries, Inc. (forklift trucks/housewares/ | Occupation(s) During the Past Five Years: Managing |
lignite); Director of Goodrich Corporation (industrial | Director of The Vanguard Group, Inc., since 2006; |
products/aircraft systems and services). | General Counsel of The Vanguard Group since 2005; |
| Secretary of The Vanguard Group and of each of the |
| investment companies served by The Vanguard Group |
Peter F. Volanakis | since 2005; Director and Senior Vice President of |
Born 1955. Trustee Since July 2009. Principal | Vanguard Marketing Corporation since 2005; Principal |
Occupation(s) During the Past Five Years: President | of The Vanguard Group (1997-2006). |
since 2007 and Chief Operating Officer since 2005 | | |
of Corning Incorporated (communications equipment); | | |
President of Corning Technologies (2001-2005); Director | Vanguard Senior Management Team |
of Corning Incorporated and Dow Corning; Trustee of | | |
the Corning Incorporated Foundation and the Corning | | |
Museum of Glass; Overseer of the Amos Tuck School | R. Gregory Barton | Michael S. Miller |
of Business Administration at Dartmouth College. | Mortimer J. Buckley | James M. Norris |
| Kathleen C. Gubanich | Glenn W. Reed |
| Paul A. Heller | George U. Sauter |
| | |
| Founder | |
| | |
| John C. Bogle | |
| Chairman and Chief Executive Officer, 1974-1996 |
|
|
1 These individuals are “interested persons” as defined in the Investment Company Act of 1940. |
2 December 2002 for Vanguard Equity Income Fund, Vanguard Growth Equity Fund, the Vanguard Municipal Bond |
Funds, and the Vanguard State Tax-Exempt Funds. |

P.O. Box 2600
Valley Forge, PA 19482-2600
Connect with Vanguard® > www.vanguard.com
Fund Information > 800-662-7447 | All comparative mutual fund data are from Lipper Inc. |
| or Morningstar, Inc., unless otherwise noted. |
Direct Investor Account Services > 800-662-2739 | |
| You can obtain a free copy of Vanguard’s proxy voting |
Institutional Investor Services > 800-523-1036 | guidelines by visiting our website, www.vanguard.com, |
| and searching for “proxy voting guidelines,” or by |
Text Telephone for People | calling Vanguard at 800-662-2739. The guidelines are |
With Hearing Impairment > 800-952-3335 | also available from the SEC’s website, www.sec.gov. |
| In addition, you may obtain a free report on how your |
| fund voted the proxies for securities it owned during |
| the 12 months ended June 30. To get the report, visit |
This material may be used in conjunction | either www.vanguard.com or www.sec.gov. |
with the offering of shares of any Vanguard | |
fund only if preceded or accompanied by | You can review and copy information about your fund |
the fund’s current prospectus. | at the SEC’s Public Reference Room in Washington, D.C. |
| To find out more about this public service, call the SEC |
| at 202-551-8090. Information about your fund is also |
| available on the SEC’s website, and you can receive |
The funds or securities referred to herein are not | copies of this information, for a fee, by sending a |
sponsored, endorsed, or promoted by MSCI, and MSCI | request in either of two ways: via e-mail addressed to |
bears no liability with respect to any such funds or | publicinfo@sec.gov or via regular mail addressed to the |
securities. For any such funds or securities, the | Public Reference Section, Securities and Exchange |
prospectus or the Statement of Additional Information | Commission, Washington, DC 20549-0102. |
contains a more detailed description of the limited | |
relationship MSCI has with The Vanguard Group and | |
any related funds. | |
| |
| |
| © 2009 The Vanguard Group, Inc. |
| All rights reserved. |
| Vanguard Marketing Corporation, Distributor. |
| |
| Q1232 092009 |


> | For the six months ended July 31, 2009, Vanguard Dividend Growth Fund returned 13.23%. |
> | During the period, the fund’s return lagged both the return of its benchmark index and the average return of its peer funds. |
> | The fund’s focus on high-quality stocks with potential for dividend growth kept it away from many of the lower-quality stocks that benefited from the spring stock market rally. |
Contents | |
| |
Your Fund’s Total Returns | 1 |
President’s Letter | 2 |
Advisor’s Report | 6 |
Results of Proxy Voting | 8 |
Fund Profile | 9 |
Performance Summary | 10 |
Financial Statements | 11 |
About Your Fund’s Expenses | 20 |
Trustees Approve Advisory Agreement | 22 |
Glossary | 23 |
Please note: The opinions expressed in this report are just that—informed opinions. They should not be considered promises or advice. Also, please keep in mind that the information and opinions cover the period through the date on the front of this report. Of course, the risks of investing in your fund are spelled out in the prospectus.
See the Glossary for definitions of investment terms used in this report.
Your Fund’s Total Returns
Six Months Ended July 31, 2009 | |
| |
| Total |
| Returns |
Vanguard Dividend Growth Fund | 13.23% |
Russell 1000 Index | 22.26 |
Large-Cap Core Funds Average | 22.36 |
Large-Cap Core Funds Average: Derived from data provided by Lipper Inc. |
Your Fund’s Performance at a Glance | | |
January 31, 2009, Through July 31, 2009 | | |
| | | | |
| | | Distributions | Per Share |
| Starting | Ending | Income | Capital |
| Share Price | Share Price | Dividends | Gains |
Vanguard Dividend Growth Fund | $10.42 | $11.65 | $0.142 | $0.000 |
1

President’s Letter
Dear Shareholder,
Vanguard Dividend Growth Fund returned about 13% for the fiscal half-year ended July 31, 2009. The fund’s return trailed both the return of its benchmark, the Russell 1000 Index, and the average return of large-capitalization core funds.
The fund’s poor performance relative to its benchmark and peer funds was not surprising. Wellington Management Company, LLP, the fund’s advisor, adheres to an investment strategy that focuses on high-quality stocks with a promising outlook for dividend growth. Many of these stocks have weathered the economic downturn better than the broad market because they belong to companies that have solid balance sheets. However, the fund’s benchmark and peers represent a wider selection of stocks, many of which were battered by the recent financial crisis; these stocks have recently snapped back sharply, as a result of the willingness of many investors to take on more risk.
Stocks rose on signs that recovery is taking root
For the six months ended July 31, the broad U.S. stock market returned about 23%. The period began in gloom, with stocks declining in February and early March before staging a strong springtime rally. After pausing in June, the market surged nearly 8% in July as investors reacted to improvement in the housing market, an increase in manufacturing
2
activity, rising corporate earnings, and cautiously optimistic comments from the Federal Reserve Board.
Global stock markets performed even better, advancing almost 38% for the period. Encouraging earnings reports and higher commodity prices lifted international stocks off their lows in early March. After three straight months of solid gains, the MSCI All Country World Index ex USA fell slightly in June before rallying again in July.
Although stock markets worldwide have been in recovery mode for five months and various economic signs point to the recession’s end, the health of global financial markets and economies remained fragile as the period ended.
Unemployment, in particular, was still a major concern both in the United States and abroad.
Investors departed Treasuries for higher-yielding bonds
For the six months, the Barclays Capital U.S. Aggregate Bond Index, a broad measure of the investment-grade market, returned more than 4%. That return paled, however, next to the 30% return of lower-quality bonds, as measured by the Barclays Capital U.S. Corporate High Yield Bond Index. By spring, investors seemed to gain confidence in the federal government’s efforts to thaw the credit markets and stimulate the economy, and they started shifting from U.S. Treasury bonds to corporate issues—particularly below-investment-grade bonds, which offered
Market Barometer | | | |
| Total Returns |
| Periods Ended July 31, 2009 |
| Six | One | Five Years |
| Months | Year | (Annualized) |
Stocks | | | |
Russell 1000 Index (Large-caps) | 22.26% | -20.17% | 0.32% |
Russell 2000 Index (Small-caps) | 26.61 | -20.72 | 1.52 |
Dow Jones U.S. Total Stock Market Index | 23.23 | -19.67 | 0.81 |
MSCI All Country World Index ex USA (International) | 37.70 | -20.90 | 7.57 |
| | | |
Bonds | | | |
Barclays Capital U.S. Aggregate Bond Index (Broad | | | |
taxable market) | 4.47% | 7.85% | 5.14% |
Barclays Capital Municipal Bond Index | 4.38 | 5.11 | 4.21 |
Citigroup Three-Month U.S. Treasury Bill Index | 0.09 | 0.65 | 3.00 |
| | | |
CPI | | | |
Consumer Price Index | 1.99% | -2.10% | 2.60% |
3
the highest yields. Municipal bonds also benefited from government support, with the broad tax-exempt market returning about 4% for the six months.
Efforts to combat the financial crisis have included a combination of aggressive monetary policy and large fiscal programs, most notably the nearly $800 billion American Recovery and Reinvestment Act of 2009. On the monetary side, the Fed has kept its target for short-term interest rates at an all-time low of 0% to 0.25%, a target it has said it will maintain for “an extended period.” For the last several months, the Fed has been purchasing Treasury and mortgage-backed securities, an effort to keep longer-term interest rates and borrowing costs low. In recent months, however, Treasury yields have risen amid concerns about longer-term budget deficits.
The fund’s investment strategy led to its weaker results
The Dividend Growth Fund held only about 50 stocks as of the end of the period, while its benchmark included nearly 970.
Wellington Management had significantly less exposure than the fund’s benchmark to the information technology and financial sectors, which were strong performers. The advisor’s decision was based on the fact that most of those holdings didn’t meet the fund’s prerequisite for producing dividend growth over the long term.
Expense Ratios | | |
Your Fund Compared With Its Peer Group | | |
| | Large-Cap |
| Fund | Core Funds Average |
Dividend Growth Fund | 0.32% | 1.26% |
The fund expense ratio shown is from the prospectus dated May 29, 2009, and represents estimated costs for the current fiscal year based on the fund’s net assets as of the prospectus date. For the six months ended July 31, 2009, the fund’s annualized expense ratio was 0.41%. The peer-group expense ratio is derived from data provided by Lipper Inc. and captures information through year-end 2008.
4
Following the dismal financial market conditions at the beginning of the year, investors gained more confidence in the markets in the spring. Hoping for even better returns, many turned to more aggressive and riskier stocks in the broader market. But the Dividend Growth Fund stuck to its blue-chip-oriented portfolio.
The Dividend Growth Fund’s information technology, energy, and consumer staples stocks contributed the most to its return of about 13% for the fiscal half-year. In IT, its best performers were blue-chip software and hardware manufacturers and payroll service providers. In energy, the fund benefited from gains from established integrated oil and gas companies as well as energy equipment service providers. In consumer staples, the fund’s strongest performers were giant retailers of food, drug, and household products.
Nine of the fund’s economic sectors posted positive returns. The fund’s sole utilities stock at the end of the period, Dominion Resources, Virginia’s largest power supplier, had a negative return for the six months. The company reported positive earnings in the second quarter, but remained cautious because of uncertainty about the economic recovery.
More than 85% of the fund’s holdings increased or maintained their dividends during the period. Of the rest, some cut their dividends and some will report on their dividends later in the year.
Focus on the long term regardless of market conditions
Although the stock market has recovered from some of its losses earlier in the year, the only certainty about its near-term direction is continued uncertainty.
The market’s unpredictable nature can be unnerving for investors. But it’s important to keep in mind that short-term ups and downs in the markets should not lead you to make hasty investment decisions.
At Vanguard, we encourage you to focus on the long term. One of the best ways to do that is to develop a well-balanced and diversified portfolio that is consistent with your long-term goals, time horizon, and risk tolerance. Regardless of market conditions, we encourage you to build a cost-efficient portfolio that includes a stable mix of stocks, bonds, and short-term reserves.
Vanguard Dividend Growth Fund, with its low cost and its emphasis on companies with the potential for growth in earnings and dividends in the years ahead, can be a valuable part of such a diversified, long-term investment program.
Thank you for investing your assets at Vanguard.
Sincerely,

F. William McNabb III
President and Chief Executive Officer
August 13, 2009
5
Advisor’s Report
Vanguard Dividend Growth Fund returned about 13% for the six-month period ended July 31, 2009. The fund’s performance substantially trailed the return of the Russell 1000 Index and the average return for large-capitalization core funds.
The investment environment
Roughly one month after the date of our last report to you, global capital markets appeared to bottom on March 9, with the Russell 1000 Index closing at its lowest level for the six months. Since then, the index has rallied more than 48%.
Although a meaningful reversal was broadly anticipated, the strength of the correction has been surprising. We say this in the context of a global economic landscape that still appears weak and a global financial system in the very early stages of healing. Eventually, the massive commitments made by governments across the globe will need to be replaced by investments from the private sector. The potential impact of this transition represents a large question mark.
Although we thought a period of difficult performance was likely in the face of a “beta-driven” rally, we certainly did not envision the results of the last few months. But as we have said before, the only gospel worth preaching is consistency in approach. We continue to focus on a strategy of investing in well-positioned companies that generate long-term dividend growth. We expect this approach to produce positive long-term results and obviate the need to capture volatile swings in market sentiment.
The fund’s successes
Nine of the fund’s ten sectors had positive returns for the period. The fund’s holdings in technology, energy, and consumer staples added the most to results; top absolute contributors included Staples, Schlumberger, United Parcel Service, and JPMorgan Chase.
For calendar 2008, we estimate that the stocks currently held in the portfolio increased dividends by an average of 14.8%. It’s important to note that every company in the fund boosted its dividend payout last year. However, 2009 has presented a much different picture. Year-to-date, we estimate the stocks in the fund will increase their dividends at slightly more than 4% on a run-rate basis. This growth rate is lower than last year’s and warrants further clarification. This estimate is based on previously announced dividend decisions. It does not incorporate any future dividend changes from the many portfolio companies that make dividend decisions later in the year. We expect many, if not most, of those companies to boost their dividends. Second, we made a few recent purchases (Pfizer and Wells Fargo) after the companies announced dividend cuts. Again, these past cuts affect our current run-rate estimate. These two issues could mean that our run-rate estimate understates the fund’s potential dividend growth for calendar 2009.
6
The fund’s shortfalls
A number of individual holdings weakened the fund’s performance for the past six months. Among the more noteworthy detractors were ExxonMobil, Abbott Laboratories, and Lockheed Martin. These stocks represent the type of company that we consider core to the spirit of the fund. They are high-quality companies with reliable dividend growth and strong positions in their respective businesses. They are also very well managed, particularly in the matter of capital allocation. We would argue that these types of companies are always sources of liquidity when the market turns its attention to lower-quality rallies. As a result, we regard underperformance of these types of companies as an opportunity to add to our positions, thus strengthening the overall quality of the fund’s holdings.
The fund’s positioning and investment strategy
Our primary objective is to identify companies that we believe will steadily and reliably increase their dividend payments. We seek to fulfill this objective by carefully building the portfolio one stock at a time, giving central consideration to each company’s dividend growth prospect. Our industry weightings are an output of this process. The fund continues to have significant positions in health care, industrials, energy, and consumer staples, while having less exposure to utilities, technology, and financials.
Someone once said, “In the battle between water and stone, water eventually wins.” Said another way, patience and consistency tend to yield good results. We believe this wisdom applies directly to investing. The fund’s performance during the six-month period, while disappointing, has done nothing to dull our confidence in the virtue of the dividend-growth investment approach. In fact, we have used the relative price weakness in many of the fund’s holdings to enhance positions. While it is not clear that these actions will produce favorable relative results in the near term, we remain highly confident that the quality of the fund has improved in recent months and that its long-term prospects are brighter.
Donald J. Kilbride,
Senior Vice President and
Equity Portfolio Manager
Wellington Management Company, LLP
August 18, 2009
7
Results of Proxy Voting
At a special meeting of shareholders on July 2, 2009, fund shareholders approved the following two proposals:
Proposal 1–Elect trustees for each fund.*
The individuals listed in the table below were elected as trustees for each fund. All trustees with the exception of Messrs. McNabb and Volanakis (both of whom already served as directors of The Vanguard Group, Inc.) served as trustees to the funds prior to the shareholder meeting.
| | | Percentage |
Trustee | For | Withheld | For |
John J. Brennan | 831,083,148 | 23,429,009 | 97.3% |
Charles D. Ellis | 815,919,984 | 38,592,173 | 95.5% |
Emerson U. Fullwood | 818,220,903 | 36,291,254 | 95.8% |
Rajiv L. Gupta | 827,792,136 | 26,720,020 | 96.9% |
Amy Gutmann | 828,576,544 | 25,935,613 | 97.0% |
JoAnn Heffernan Heisen | 827,968,189 | 26,543,968 | 96.9% |
F. William McNabb III | 830,218,855 | 24,293,302 | 97.2% |
Andr F. Perold | 817,862,692 | 36,649,465 | 95.7% |
Alfred M. Rankin, Jr. | 827,956,891 | 26,555,266 | 96.9% |
Peter F. Volanakis | 829,990,273 | 24,521,884 | 97.1% |
* Results are for all funds within the same trust. |
Proposal 2 – Update and standardize the funds’ fundamental policies regarding: |
(a) | Purchasing and selling real estate. |
(b) | Issuing senior securities. |
(c) | Borrowing money. |
(d) | Making loans. |
(e) | Purchasing and selling commodities. |
(f) | Concentrating investments in a particular industry or group of industries. |
(g) | Eliminating outdated fundamental investment policies not required by law. |
The revised fundamental policies are clearly stated and simple, yet comprehensive, making oversight and compliance more efficient than under the former policies. The revised fundamental policies will allow the funds to respond more quickly to regulatory and market changes, while avoiding the costs and delays associated with successive shareholder meetings.
| | | | Broker | Percentage |
Vanguard Fund | For | Abstain | Against | Non-Votes | For |
Dividend Growth Fund | | | | | |
2a | 108,237,371 | 2,293,481 | 3,430,388 | 12,519,439 | 85.6% |
2b | 107,882,672 | 2,618,607 | 3,459,961 | 12,519,438 | 85.3% |
2c | 106,550,582 | 2,523,259 | 4,887,397 | 12,519,440 | 84.2% |
2d | 106,702,953 | 2,508,079 | 4,750,206 | 12,519,441 | 84.4% |
2e | 107,041,444 | 2,450,215 | 4,469,581 | 12,519,439 | 84.6% |
2f | 107,620,477 | 2,552,209 | 3,788,557 | 12,519,435 | 85.1% |
2g | 108,820,239 | 2,425,022 | 2,715,978 | 12,519,439 | 86.0% |
8
Dividend Growth Fund
Fund Profile
As of July 31, 2009
Portfolio Characteristics | | |
| | | DJ |
| | Russell | U.S. Total |
| | 1000 | Market |
| Fund | Index | Index |
Number of Stocks | 51 | 969 | 4,370 |
Median Market Cap | $46.6B | $31.2B | $26.1B |
Price/Earnings Ratio | 13.1x | 21.7x | 23.0x |
Price/Book Ratio | 2.7x | 2.1x | 2.1x |
Return on Equity | 23.9% | 20.4% | 19.6% |
Earnings Growth Rate | 11.0% | 13.1% | 12.6% |
Dividend Yield | 3.1% | 2.1% | 2.0% |
Foreign Holdings | 9.6% | 0.0% | 0.0% |
Turnover Rate(Annualized) | 30% | — | — |
Ticker Symbol | VDIGX | — | — |
Expense Ratio1 | 0.32% | — | — |
30-Day SEC Yield | 2.67% | — | — |
Short-Term Reserves | 1.4% | — | — |
Sector Diversification (% of equity exposure) |
| | | DJ |
| | Russell | U.S. Total |
| | 1000 | Market |
| Fund | Index | Index |
Consumer Discretionary | 7.5% | 9.9% | 9.9% |
Consumer Staples | 15.8 | 11.1 | 10.2 |
Energy | 15.6 | 11.5 | 11.6 |
Financials | 9.1 | 13.9 | 15.3 |
Health Care | 17.6 | 13.4 | 13.3 |
Industrials | 15.3 | 10.1 | 10.3 |
Information Technology | 13.3 | 18.7 | 18.5 |
Materials | 2.0 | 3.9 | 3.8 |
Telecommunication Services | 2.0 | 3.3 | 3.1 |
Utilities | 1.8 | 4.2 | 4.0 |
Volatility Measures | | |
| | DJ |
| | U.S. Total |
| Russell 1000 | Market |
| Index | Index |
R-Squared | 0.95 | 0.95 |
Beta | 0.77 | 0.76 |
These measures show the degree and timing of the fund’s fluctuations compared with the indexes over 36 months.
Ten Largest Holdings (% of total net assets) |
| | |
Total SA ADR | Integrated Oil & Gas | 3.3% |
Automatic Data Processing, Inc. | Data Processing & Outsourced Services | 3.0 |
United Parcel Service, Inc. | Air Freight & Logistics | 2.9 |
Staples, Inc. | Specialty Stores | 2.8 |
ExxonMobil Corp. | Integrated Oil & Gas | 2.7 |
Johnson & Johnson | Pharmaceuticals | 2.5 |
Cardinal Health, Inc. | Health Care Distributors | 2.5 |
Accenture Ltd. | IT Consulting & Other Services | 2.5 |
Medtronic, Inc. | Health Care Equipment | 2.4 |
Chevron Corp. | Integrated Oil & Gas | 2.3 |
Top Ten | | 26.9% |
The holdings listed exclude any temporary cash investments and equity index products.
Investment Focus
1 The expense ratio shown is from the prospectus dated May 29, 2009, and represents estimated costs for |
the current fiscal year based on the fund’s net assets as of the prospectus date. For the six months ended |
July 31, 2009, the fund’s annualized expense ratio was 0.41%. |
9
Dividend Growth Fund
Performance Summary
All of the returns in this report represent past performance, which is not a guarantee of future results that may be achieved by the fund. (Current performance may be lower or higher than the performance data cited. For performance data current to the most recent month-end, visit our website at www.vanguard.com/performance.) Note, too, that both investment returns and principal value can fluctuate widely, so an investor’s shares, when sold, could be worth more or less than their original cost. The returns shown do not reflect taxes that a shareholder would pay on fund distributions or on the sale of fund shares.
Fiscal-Year Total Returns (%): January 31, 1999, Through July 31, 2009
Notes: For 2010, performance data reflect the six months ended July 31, 2009. Prior to December 6, 2002, the fund was known as the Utilities Income Fund.
Dividend Growth Spliced Index: Prior to December 6, 2002, the comparative benchmark was known as the Utilities Composite Index. The index weightings have been: 40% S&P Utilities Index, 40% S&P Telephone Index, and 20% Lehman Utility Bond Index through April 30, 1999; 63.75% S&P Utilities Index, 21.25% S&P Telephone Index, and 15% Lehman Utility Bond Index through March 31, 2000; 75% S&P Utilities Index and 25% S&P Telephone Index through December 31, 2001; 75% S&P Utilities Index and 25% S&P Integrated Telecommunication Services Index through December 6, 2002; and Russell 1000 Index thereafter.
Average Annual Total Returns: Periods Ended June 30, 2009
This table presents average annual total returns through the latest calendar quarter—rather than through the end of the fiscal period. Securities and Exchange Commission rules require that we provide this information.
| Inception Date | One Year | Five Years | Ten Years |
Dividend Growth Fund | 5/15/1992 | -18.73% | 1.56% | 0.08% |
Vanguard fund total returns do not include the account service fee that may be applicable to certain |
accounts with balances below $10,000. |
See Financial Highlights for dividend and capital gains information. |
10
Dividend Growth Fund
Financial Statements (unaudited)
Statement of Net Assets
As of July 31, 2009
The fund provides a complete list of its holdings four times in each fiscal year, at the quarter-ends. For the second and fourth fiscal quarters, the lists appear in the fund’s semiannual and annual reports to shareholders. For the first and third fiscal quarters, the fund files the lists with the Securities and Exchange Commission on Form N-Q. Shareholders can look up the fund’s Forms N-Q on the SEC’s website at www.sec.gov. Forms N-Q may also be reviewed and copied at the SEC’s Public Reference Room (see the back cover of this report for further information).
| | Market |
| | Value¥ |
| Shares | ($000) |
Common Stocks (98.7%) | | |
Consumer Discretionary (7.4%) | | |
Staples, Inc. | 2,829,600 | 59,478 |
NIKE, Inc. Class B | 700,900 | 39,699 |
The Walt Disney Co. | 1,530,300 | 38,441 |
McDonald’s Corp. | 301,900 | 16,623 |
| | 154,241 |
Consumer Staples (15.6%) | | |
PepsiCo, Inc. | 763,100 | 43,306 |
The Procter & Gamble Co. | 774,700 | 43,004 |
Wal-Mart Stores, Inc. | 822,000 | 41,002 |
Sysco Corp. | 1,656,200 | 39,351 |
Kimberly-Clark Corp. | 604,000 | 35,304 |
Colgate-Palmolive Co. | 474,300 | 34,358 |
The Coca-Cola Co. | 686,500 | 34,215 |
Walgreen Co. | 990,800 | 30,764 |
Hormel Foods Corp. | 713,000 | 25,604 |
| | 326,908 |
Energy (15.4%) | | |
Total SA ADR | 1,220,400 | 67,915 |
ExxonMobil Corp. | 803,100 | 56,530 |
Chevron Corp. | 696,900 | 48,414 |
BG Group PLC | 2,660,859 | 44,431 |
Schlumberger Ltd. | 806,100 | 43,126 |
BP PLC ADR | 829,900 | 41,528 |
Marathon Oil Corp. | 649,700 | 20,953 |
| | 322,897 |
Financials (9.0%) | | |
JPMorgan Chase & Co. | 1,099,100 | 42,480 |
The Chubb Corp. | 887,500 | 40,985 |
Ace Ltd. | 801,100 | 39,302 |
Marsh & McLennan | | |
Cos., Inc. | 1,737,300 | 35,476 |
Wells Fargo & Co. | 1,220,700 | 29,858 |
| | 188,101 |
Health Care (17.3%) | | |
| Johnson & Johnson | 852,900 | 51,933 |
| Cardinal Health, Inc. | 1,551,000 | 51,648 |
| Medtronic, Inc. | 1,417,000 | 50,190 |
| AstraZeneca Group | | |
| PLC ADR | 995,300 | 46,222 |
| Merck & Co., Inc. | 1,502,300 | 45,084 |
| Pfizer Inc. | 2,659,000 | 42,358 |
| Eli Lilly & Co. | 1,142,900 | 39,876 |
1 | Abbott Laboratories | 753,300 | 33,891 |
| | | 361,202 |
Industrials (15.1%) | | |
| United Parcel Service, Inc. | 1,124,900 | 60,441 |
| Honeywell | | |
| International Inc. | 1,251,900 | 43,441 |
| Lockheed Martin Corp. | 575,200 | 43,002 |
| Illinois Tool Works, Inc. | 957,000 | 38,806 |
| Emerson Electric Co. | 1,043,800 | 37,973 |
| United Technologies Corp. | 660,500 | 35,977 |
| Burlington Northern | | |
| Santa Fe Corp. | 287,400 | 22,587 |
| The Boeing Co. | 450,000 | 19,310 |
| General Dynamics Corp. | 244,100 | 13,521 |
| | | 315,058 |
Information Technology (13.1%) | |
1 | Automatic Data | | |
| Processing, Inc. | 1,684,700 | 62,755 |
| Accenture Ltd. | 1,467,500 | 51,465 |
| Microsoft Corp. | 2,025,300 | 47,635 |
| International Business | | |
| Machines Corp. | 344,700 | 40,651 |
| Linear Technology Corp. | 1,381,100 | 37,110 |
| Paychex, Inc. | 1,316,500 | 34,887 |
| | | 274,503 |
Materials (2.0%) | | |
| Praxair, Inc. | 538,700 | 42,115 |
11
Dividend Growth Fund
| | Market |
| | Value¥ |
| Shares | ($000) |
Telecommunication Services (2.0%) | |
AT&T Inc. | 1,587,500 | 41,640 |
| | |
Utilities (1.8%) | | |
Dominion Resources, Inc. | 1,091,500 | 36,893 |
Total Common Stocks | | |
(Cost $2,064,249) | | 2,063,558 |
Temporary Cash Investments (1.4%) | |
| Face | |
| Amount | |
| ($000) | |
Repurchase Agreement (1.4%) | | |
Credit Suisse Securities | | |
(USA) LLC 0.220%, 8/3/09 | | |
(Dated 7/31/09, Repurchase | |
Value $28,401,000, | | |
collateralized by Federal | | |
National Mortgage Assn. | | |
4.500%Ð7.500%, | | |
11/1/16Ð2/1/48) | | |
(Cost $28,400) | 28,400 | 28,400 |
Total Investments (100.1%) | | |
(Cost $2,092,649) | | 2,091,958 |
Liability for Covered Call Options Written (0.0%) |
| Written | |
| Contracts | |
Abbott Laboratories, | | |
Expires 8/22/09, | | |
Strike Price $52.50 | 3,766 | (19) |
Automatic Data | | |
Processing, Inc., | | |
Expires 8/22/09, | | |
Strike Price $40.00 | 8,147 | (81) |
Total Covered Call Options Written | |
(Premium Received $1,879) | | (100) |
Other Assets and Liabilities (-0.1%) | |
Other Assets | | 22,476 |
Liabilities | | (24,780) |
| | (2,304) |
| | | |
| Market |
| Value¥ |
| ($000) |
Net Assets (100%) | |
Applicable to 179,340,514 outstanding | |
$.001 par value shares of beneficial | |
interest (unlimited authorization) | 2,089,554 |
Net Asset Value Per Share | $11.65 |
At July 31, 2009, net assets consisted of: | |
| Amount |
| ($000) |
Paid-in Capital | 2,214,661 |
Undistributed Net Investment Income | 1,113 |
Accumulated Net Realized Losses | (127,308) |
Unrealized Appreciation (Depreciation) | |
Investment Securities | (691) |
Covered Call Options Written | 1,779 |
Net Assets | 2,089,554 |
• See Note A in Notes to Financial Statements. |
1 Securities with a value of $47,291,000 have been segregated for |
covered call options written. |
ADR–American Depositary Receipt. |
See accompanying Notes, which are an integral part of the Financial Statements.
12
Dividend Growth Fund
Statement of Operations
| Six Months Ended |
| July 31, 2009 |
| ($000) |
Investment Income | |
Income | |
Dividends | 30,036 |
Interest | 71 |
Security Lending | 161 |
Total Income | 30,268 |
Expenses | |
Investment Advisory Fees–Note B | |
Basic Fee | 1,059 |
Performance Adjustment | 394 |
The Vanguard Group–Note C | |
Management and Administrative | 1,963 |
Marketing and Distribution | 242 |
Custodian Fees | 16 |
Auditing Fees | 1 |
Shareholders’ Reports and Proxies | 93 |
Trustees’ Fees and Expenses | 2 |
Total Expenses | 3,770 |
Expenses Paid Indirectly | (23) |
Net Expenses | 3,747 |
Net Investment Income | 26,521 |
Realized Net Gain (Loss) | |
Investment Securities Sold | (40,132) |
Covered Call Options Written | – |
Foreign Currencies | (74) |
Realized Net Gain (Loss) | (40,206) |
Change in Unrealized Appreciation (Depreciation) | |
Investment Securities Sold | 253,466 |
Covered Call Options Written | 1,779 |
Change in Unrealized Appreciation (Depreciation) | 255,245 |
Net Increase (Decrease) in Net Assets Resulting from Operations | 241,560 |
See accompanying Notes, which are an integral part of the Financial Statements.
13
Dividend Growth Fund
Statement of Changes in Net Assets
| Six Months Ended | Year Ended |
| July 31, | January 31, |
| 2009 | 2009 |
| ($000) | ($000) |
Increase (Decrease) in Net Assets | | |
Operations | | |
Net Investment Income | 26,521 | 34,785 |
Realized Net Gain (Loss) | (40,206) | (83,870) |
Change in Unrealized Appreciation (Depreciation) | 255,245 | (437,850) |
Net Increase (Decrease) in Net Assets Resulting from Operations | 241,560 | (486,935) |
Distributions | | |
Net Investment Income | (25,341) | (34,618) |
Realized Capital Gain | – | – |
Total Distributions | (25,341) | (34,618) |
Capital Share Transactions | | |
Issued | 435,705 | 1,222,167 |
Issued in Lieu of Cash Distributions | 21,764 | 29,865 |
Redeemed | (328,782) | (311,560) |
Net Increase (Decrease) from Capital Share Transactions | 128,687 | 940,472 |
Total Increase (Decrease) | 344,906 | 418,919 |
Net Assets | | |
Beginning of Period | 1,744,648 | 1,325,729 |
End of Period1 | 2,089,554 | 1,744,648 |
1 Net Assets–End of Period includes undistributed net investment income of $1,113,000 and $7,000. |
See accompanying Notes, which are an integral part of the Financial Statements.
14
Dividend Growth Fund
Financial Highlights
| Six | | | | | |
| Months | | | | | |
| Ended | | | |
For a Share Outstanding | July 31, | Year Ended January 31, |
Throughout Each Period | 2009 | 2009 | 2008 | 2007 | 2006 | 2005 |
Net Asset Value, Beginning of Period | $10.42 | $14.38 | $14.74 | $12.75 | $11.89 | $11.33 |
Investment Operations | | | | | | |
Net Investment Income | .149 | .264 | .290 | .260 | .220 | .2301 |
Net Realized and Unrealized Gain (Loss) | | | | | | |
on Investments | 1.223 | (3.960) | (.270) | 1.990 | .880 | .550 |
Total from Investment Operations | 1.372 | (3.696) | .020 | 2.250 | 1.100 | .780 |
Distributions | | | | | | |
Dividends from Net Investment Income | (.142) | (.264) | (.280) | (.260) | (.240) | (.220) |
Distributions from Realized Capital Gains | – | – | (.100) | – | – | – |
Total Distributions | (.142) | (.264) | (.380) | (.260) | (.240) | (.220) |
Net Asset Value, End of Period | $11.65 | $10.42 | $14.38 | $14.74 | $12.75 | $11.89 |
| | | | | | |
Total Return2 | 13.23% | -25.97% | -0.01% | 17.84% | 9.34% | 6.92% |
| | | | | | |
Ratios/Supplemental Data | | | | | | |
Net Assets, End of Period (Millions) | $2,090 | $1,745 | $1,326 | $1,243 | $995 | $965 |
Ratio of Total Expenses to | | | | | | |
Average Net Assets3 | 0.41%4 | 0.36% | 0.32% | 0.38% | 0.37% | 0.37% |
Ratio of Net Investment Income to | | | | | | |
Average Net Assets | 2.86%4 | 2.25% | 1.91% | 1.93% | 1.85% | 2.04%1 |
Portfolio Turnover Rate | 30%4 | 28% | 36% | 41% | 16% | 20% |
1 Net investment income per share and the ratio of net investment income to average net assets include $0.03 and 0.28%, respectively, |
resulting from a special dividend from Microsoft Corp. in November 2004. |
2 Total returns do not include the account service fee that may be applicable to certain accounts with balances below $10,000. |
3 Includes performance-based investment advisory fee increases (decreases) of 0.04%, 0.03%, 0.00%, 0.01%, 0.01%, and 0.01%. |
4 Annualized. |
See accompanying Notes, which are an integral part of the Financial Statements.
15
Dividend Growth Fund
Notes to Financial Statements
Vanguard Dividend Growth Fund is registered under the Investment Company Act of 1940 as an open-end investment company, or mutual fund.
A. The following significant accounting policies conform to generally accepted accounting principles for U.S. mutual funds. The fund consistently follows such policies in preparing its financial statements.
1. Security Valuation: Securities are valued as of the close of trading on the New York Stock Exchange (generally 4 p.m., Eastern time) on the valuation date. Equity securities are valued at the latest quoted sales prices or official closing prices taken from the primary market in which each security trades; such securities not traded on the valuation date are valued at the mean of the latest quoted bid and asked prices. Securities for which market quotations are not readily available, or whose values have been affected by events occurring before the fund’s pricing time but after the close of the securities’ primary markets, are valued at their fair values calculated according to procedures adopted by the board of trustees. These procedures include obtaining quotations from an independent pricing service, monitoring news to identify significant market- or security-specific events, and evaluating changes in the values of foreign market proxies (for example, ADRs, futures contracts, or exchange-traded funds), between the time the foreign markets close and the fund’s pricing time. When fair-value pricing is employed, the prices of securities used by a fund to calculate its net asset value may differ from quoted or published prices for the same securities. Temporary cash investments acquired over 60 days to maturity are valued using the latest bid prices or using valuations based on a matrix system (which considers such factors as security prices, yields, maturities, and ratings), both as furnished by independent pricing services. Other temporary cash investments are valued at amortized cost, which approximates market value.
2. Foreign Currency: Securities and other assets and liabilities denominated in foreign currencies are translated into U.S. dollars using exchange rates obtained from an independent third party as of the fund’s pricing time on the valuation date. Realized gains (losses) and unrealized appreciation (depreciation) on investment securities include the effects of changes in exchange rates since the securities were purchased, combined with the effects of changes in security prices. Fluctuations in the value of other assets and liabilities resulting from changes in exchange rates are recorded as unrealized foreign currency gains (losses) until the assets or liabilities are settled in cash, at which time they are recorded as realized foreign currency gains (losses).
3. Covered Call Options Written: The fund may write covered call options on security holdings that are considered to be attractive long-term investments but are believed to be overvalued in the short-term. When the fund writes options, the premium received by the fund is recorded as an asset with an equal liability that is marked-to-market to reflect the current market value of the options written. Fluctuations in the value of the options are recorded as unrealized appreciation (depreciation) until expired, closed, or exercised, at which time realized gains (losses) are recognized. Options are valued at their latest quoted sales prices. Options not traded on the valuation date are valued at the latest quoted asked prices.
4. Repurchase Agreements: The fund may invest in repurchase agreements. Securities pledged as collateral for repurchase agreements are held by a custodian bank until the agreements mature. Each agreement requires that the market value of the collateral be sufficient to cover payments of interest and principal; however, in the event of default or bankruptcy by the other party to the agreement, retention of the collateral may be subject to legal proceedings.
16
Dividend Growth Fund
5. Federal Income Taxes: The fund intends to continue to qualify as a regulated investment company and distribute all of its taxable income. Management has analyzed the fund’s tax positions taken on federal income tax returns for all open tax years (tax years ended January 31, 2006Ð2009) and for the period ended July 31, 2009, and has concluded that no provision for federal income tax is required in the fund’s financial statements.
6. Distributions: Distributions to shareholders are recorded on the ex-dividend date.
7. Security Lending: The fund may lend its securities to qualified institutional borrowers to earn additional income. Security loans are required to be secured at all times by collateral at least equal to the market value of securities loaned. The fund invests cash collateral received in Vanguard Market Liquidity Fund, and records a liability for the return of the collateral, during the period the securities are on loan. Security lending income represents the income earned on investing cash collateral, less expenses associated with the loan.
8. Other: Dividend income is recorded on the ex-dividend date. Interest income is accrued daily. Security transactions are accounted for on the date securities are bought or sold. Costs used to determine realized gains (losses) on the sale of investment securities are those of the specific securities sold.
B. Wellington Management Company, LLP, provides investment advisory services to the fund for a fee calculated at an annual percentage rate of average net assets. The basic fee is subject to quarterly adjustments based on the fund’s performance for the preceding three years relative to the Russell 1000 Index. For the six months ended July 31, 2009, the investment advisory fee represented an effective annual basic rate of 0.11% of the fund’s average net assets before an increase of $394,000 (0.04%) based on performance.
C. The Vanguard Group furnishes at cost corporate management, administrative, marketing, and distribution services. The costs of such services are allocated to the fund under methods approved by the board of trustees. The fund has committed to provide up to 0.40% of its net assets in capital contributions to Vanguard. At July 31, 2009, the fund had contributed capital of $467,000 to Vanguard (included in Other Assets), representing 0.02% of the fund’s net assets and 0.19% of Vanguard’s capitalization. The fund’s trustees and officers are also directors and officers of Vanguard.
D. The fund has asked its investment advisor to direct certain security trades, subject to obtaining the best price and execution, to brokers who have agreed to rebate to the fund part of the commissions generated. Such rebates are used solely to reduce the fund’s management and administrative expenses. For the six months ended July 31, 2009, these arrangements reduced the fund’s expenses by $23,000 (an annual rate of 0.00% of average net assets).
E. Various inputs may be used to determine the value of the fund’s investments. These inputs are summarized in three broad levels for financial statement purposes. The inputs or methodologies used to value securities are not necessarily an indication of the risk associated with investing in those securities.
17
Dividend Growth Fund
Level 1–Quoted prices in active markets for identical securities.
Level 2–Other significant observable inputs (including quoted prices for similar securities, interest rates, prepayment speeds, credit risk, etc.).
Level 3–Significant unobservable inputs (including the fund’s own assumptions used to determine the fair value of investments).
The following table summarizes the fund’s investments as of July 31, 2009, based on the inputs used to value them:
| Level 1 | Level 2 | Level 3 |
Investments | ($000) | ($000) | ($000) |
Common Stocks | 2,019,127 | 44,431 | – |
Temporary Cash Investments | – | 28,400 | – |
Liability for Covered Call Options Written | (100) | – | – |
Total | 2,019,027 | 72,831 | – |
F. Distributions are determined on a tax basis and may differ from net investment income and realized capital gains for financial reporting purposes. Differences may be permanent or temporary. Permanent differences are reclassified among capital accounts in the financial statements to reflect their tax character. Temporary differences arise when certain items of income, expense, gain, or loss are recognized in different periods for financial statement and tax purposes; these differences will reverse at some time in the future. Differences in classification may also result from the treatment of short-term gains as ordinary income for tax purposes.
During the six months ended July 31, 2009, the fund realized net foreign currency losses of $74,000, which decreased distributable net income for tax purposes; accordingly, such losses have been reclassified from accumulated net realized losses to undistributed net investment income.
The fund’s tax-basis capital gains and losses are determined only at the end of each fiscal year. For tax purposes, at January 31, 2009, the fund had available realized losses of $86,563,000 to offset future net capital gains of $17,975,000 through January 31, 2017, and $68,588,000 through January 31, 2018. The fund will use these capital losses to offset net taxable capital gains, if any, realized during the year ending January 31, 2010; should the fund realize net capital losses for the year, the losses will be added to the loss carryforward balances above.
At July 31, 2009, the cost of investment securities for tax purposes was $2,092,649,000. Net unrealized depreciation of investment securities for tax purposes was $691,000, consisting of unrealized gains of $115,126,000 on securities that had risen in value since their purchase and $115,817,000 in unrealized losses on securities that had fallen in value since their purchase.
G. During the six months ended July 31, 2009, the fund purchased $500,749,000 of investment securities and sold $267,578,000 of investment securities, other than temporary cash investments.
18
Dividend Growth Fund
H. The following table summarizes the fund’s covered call options written during the six months ended July 31, 2009:
| Number of | Premiums |
| Contracts | Received |
Covered Call Options | Written | ($000) |
Balance at January 31, 2009 | – | – |
Options Written | 11,913 | 1,879 |
Options Expired | – | – |
Options Closed | – | – |
Options Exercised | – | – |
Options Open at July 31, 2009 | 11,913 | 1,879 |
I. Capital shares issued and redeemed were:
| Six Months Ended | Year Ended |
| July 31, 2009 | January 31, 2009 |
| Shares | Shares |
| (000) | (000) |
Issued | 41,038 | 97,909 |
Issued in Lieu of Cash Distributions | 1,961 | 2,499 |
Redeemed | (31,085) | (25,173) |
Net Increase (Decrease) in Shares Outstanding | 11,914 | 75,235 |
J. In preparing the financial statements as of July 31, 2009, management considered the impact of subsequent events occurring through September 10, 2009, for potential recognition or disclosure in these financial statements.
19
About Your Fund’s Expenses
As a shareholder of the fund, you incur ongoing costs, which include costs for portfolio management, administrative services, and shareholder reports (like this one), among others. Operating expenses, which are deducted from a fund’s gross income, directly reduce the investment return of the fund.
A fund’s expenses are expressed as a percentage of its average net assets. This figure is known as the expense ratio. The following examples are intended to help you understand the ongoing costs (in dollars) of investing in your fund and to compare these costs with those of other mutual funds. The examples are based on an investment of $1,000 made at the beginning of the period shown and held for the entire period.
The accompanying table illustrates your fund’s costs in two ways:
• Based on actual fund return. This section helps you to estimate the actual expenses that you paid over the period. The ”Ending Account Value“ shown is derived from the fund‘s actual return, and the third column shows the dollar amount that would have been paid by an investor who started with $1,000 in the fund. You may use the information here, together with the amount you invested, to estimate the expenses that you paid over the period.
To do so, simply divide your account value by $1,000 (for example, an $8,600 account value divided by $1,000 = 8.6), then multiply the result by the number given for your fund under the heading ”Expenses Paid During Period.“
• Based on hypothetical 5% yearly return. This section is intended to help you compare your fund‘s costs with those of other mutual funds. It assumes that the fund had a yearly return of 5% before expenses, but that the expense ratio is unchanged. In this case—because the return used is not the fund’s actual return—the results do not apply to your investment. The example is useful in making comparisons because the Securities and Exchange Commission requires all mutual funds to calculate expenses based on a 5% return. You can assess your fund’s costs by comparing this hypothetical example with the hypothetical examples that appear in shareholder reports of other funds.
Note that the expenses shown in the table are meant to highlight and help you compare ongoing costs only and do not reflect transaction costs incurred by the fund for buying and selling securities. Further, the expenses do not include the account service fee described in the prospectus. If such a fee were applied to your account, your costs would be higher. Your fund does not charge transaction fees, such as purchase or redemption fees, nor does it carry a “sales load.”
The calculations assume no shares were bought or sold during the period. Your actual costs may have been higher or lower, depending on the amount of your investment and the timing of any purchases or redemptions.
You can find more information about the fund’s expenses, including annual expense ratios, in the Financial Statements section of this report. For additional information on operating expenses and other shareholder costs, please refer to your fund’s current prospectus.
20
Six Months Ended July 31, 2009 | | | |
| Beginning | Ending | Expenses |
| Account Value | Account Value | Paid During |
Dividend Growth Fund | 1/31/2009 | 7/31/2009 | Period |
Based on Actual Fund Return | $1,000.00 | $1,132.35 | $2.17 |
Based on Hypothetical 5% Yearly Return | 1,000.00 | 1,022.76 | 2.06 |
These calculations are based on expenses incurred in the most recent six-month period. The fund’s annualized six-month expense ratio for that period is 0.41%. The dollar amounts shown as “Expenses Paid” are equal to the annualized expense ratio multiplied by the average account value over the period, multiplied by the number of days in the most recent six-month period, then divided by the number of days in the most recent 12-month period.
21
Trustees Approve Advisory Agreement
The board of trustees of Vanguard Dividend Growth Fund has renewed the fund’s investment advisory agreement with Wellington Management Company, LLP. The board determined that the retention of Wellington Management was in the best interests of the fund and its shareholders.
The board based its decision upon an evaluation of the advisor’s investment staff, portfolio management process, and performance. The trustees considered the factors discussed below, among others. However, no single factor determined whether the board approved the agreement. Rather, it was the totality of the circumstances that drove the board’s decision.
Nature, extent, and quality of services
The board considered the quality of the fund’s investment management over both the short and long term, and took into account the organizational depth and stability of the advisor. The board noted that Wellington Management, founded in 1928, is among the nation’s oldest and most respected institutional managers. The firm has advised the fund since its inception in 1992. Donald J. Kilbride, who manages the fund, has worked in investment management since 1996. The portfolio manager is backed by a well-tenured team of research analysts who conduct detailed fundamental analysis of their respective industries and companies. Wellington Management has provided high-quality advisory services for the fund.
The board concluded that Wellington Management’s experience, stability, depth, and performance, among other factors, warranted continuation of the advisory agreement.
Investment performance
The board considered the short- and long-term performance of the fund, including any periods of outperformance or underperformance of a relevant benchmark and peer group. The board noted that the fund’s reconstituted dividend growth mandate began in 2002, and concluded that since then, the fund has outperformed its benchmark, the Russell 1000 Index, and its peer group. Information about the fund’s most recent performance can be found in the Performance Summary section of this report.
Cost
The board concluded that the fund’s expense ratio was well below the average expense ratio charged by funds in its peer group. The board noted that the fund’s advisory fee rate was also well below its peer-group average. Information about the fund’s expense ratio appears in the About Your Fund’s Expenses section of this report as well as in the Financial Statements section, which also includes information about the advisory fee rate.
The board did not consider profitability of Wellington Management in determining whether to approve the advisory fee, because Wellington Management is independent of Vanguard, and the advisory fee is the result of arm’s-length negotiations.
The benefit of economies of scale
The board concluded that the fund’s shareholders benefit from economies of scale because of breakpoints in the fund’s advisory fee schedule. The breakpoints reduce the effective rate of the fee as the fund’s assets increase.
The board will consider whether to renew the advisory agreement again after a one-year period.
22
Glossary
30-Day SEC Yield. A fund’s 30-day SEC yield is derived using a formula specified by the U.S. Securities and Exchange Commission. Under the formula, data related to the fund’s security holdings in the previous 30 days are used to calculate the fund’s hypothetical net income for that period, which is then annualized and divided by the fund’s estimated average net assets over the calculation period. For the purposes of this calculation, a security’s income is based on its current market yield to maturity (in the case of bonds) or its projected dividend yield (for stocks). Because the SEC yield represents hypothetical annualized income, it will differ—at times significantly—from the fund’s actual experience. As a result, the fund’s income distributions may be higher or lower than implied by the SEC yield.
Beta. A measure of the magnitude of a fund’s past share-price fluctuations in relation to the ups and downs of a given market index. The index is assigned a beta of 1.00. Compared with a given index, a fund with a beta of 1.20 typically would have seen its share price rise or fall by 12% when the index rose or fell by 10%. For this report, beta is based on returns over the past 36 months for both the fund and the index. Note that a fund’s beta should be reviewed in conjunction with its R-squared (see definition). The lower the R-squared, the less correlation there is between the fund and the index, and the less reliable beta is as an indicator of volatility.
Dividend Yield. Dividend income earned by stocks, expressed as a percentage of the aggregate market value (or of net asset value, for a fund). The yield is determined by dividing the amount of the annual dividends by the aggregate value (or net asset value) at the end of the period. For a fund, the dividend yield is based solely on stock holdings and does not include any income produced by other investments.
Earnings Growth Rate. The average annual rate of growth in earnings over the past five years for the stocks now in a fund.
Equity Exposure. A measure that reflects a fund’s investments in stocks and stock futures. Any holdings in short-term reserves are excluded.
Expense Ratio. The percentage of a fund’s average net assets used to pay its annual administrative and advisory expenses. These expenses directly reduce returns to investors.
Foreign Holdings. The percentage of a fund represented by stocks or depositary receipts of companies based outside the United States.
Inception Date. The date on which the assets of a fund (or one of its share classes) are first invested in accordance with the fund’s investment objective. For funds with a subscription period, the inception date is the day after that period ends. Investment performance is measured from the inception date.
Median Market Cap. An indicator of the size of companies in which a fund invests; the midpoint of market capitalization (market price x shares outstanding) of a fund’s stocks, weighted by the proportion of the fund’s assets invested in each stock. Stocks representing half of the fund’s assets have market capitalizations above the median, and the rest are below it.
Price/Book Ratio. The share price of a stock divided by its net worth, or book value, per share. For a fund, the weighted average price/book ratio of the stocks it holds.
23
Price/Earnings Ratio. The ratio of a stock’s current price to its per-share earnings over the past year. For a fund, the weighted average P/E of the stocks it holds. P/E is an indicator of market expectations about corporate prospects; the higher the P/E, the greater the expectations for a company’s future growth.
R-Squared. A measure of how much of a fund’s past returns can be explained by the returns from the market in general, as measured by a given index. If a fund’s total returns were precisely synchronized with an index’s returns, its R-squared would be 1.00. If the fund’s returns bore no relationship to the index’s returns, its R-squared would be 0. For this report, R-squared is based on returns over the past 36 months for both the fund and the index.
Return on Equity. The annual average rate of return generated by a company during the past five years for each dollar of shareholder’s equity (net income divided by shareholder’s equity). For a fund, the weighted average return on equity for the companies whose stocks it holds.
Short-Term Reserves. The percentage of a fund invested in highly liquid, short-term securities that can be readily converted to cash.
Turnover Rate. An indication of the fund’s trading activity. Funds with high turnover rates incur higher transaction costs and may be more likely to distribute capital gains (which may be taxable to investors). The turnover rate excludes in-kind transactions, which have minimal impact on costs.
24
This page intentionally left blank.
This page intentionally left blank.
This page intentionally left blank.
The People Who Govern Your Fund
The trustees of your mutual fund are there to see that the fund is operated and managed in your best interests since, as a shareholder, you are a part owner of the fund. Your fund’s trustees also serve on the board of directors of The Vanguard Group, Inc., which is owned by the Vanguard funds and provides services to them on an at-cost basis.
A majority of Vanguard’s board members are independent, meaning that they have no affiliation with Vanguard or the funds they oversee, apart from the sizable personal investments they have made as private individuals. The independent board members have distinguished backgrounds in business, academia, and public service. Each of the trustees and executive officers oversees 157 Vanguard funds.
The following table provides information for each trustee and executive officer of the fund. More information about the trustees is in the Statement of Additional Information, which can be obtained, without charge, by contacting Vanguard at 800-662-7447, or online at www.vanguard.com.
Interested Trustees | Emerson U. Fullwood |
| Born 1948. Trustee Since January 2008. Principal |
| Occupation(s) During the Past Five Years: Retired |
| Executive Chief Staff and Marketing Officer for North |
John J. Brennan1 | America and Corporate Vice President of Xerox |
Born 1954. Trustee Since May 1987. Chairman of | Corporation (photocopiers and printers); Director of |
the Board. Principal Occupation(s) During the Past | SPX Corporation (multi-industry manufacturing), the |
Five Years: Chairman of the Board and Director/Trustee | United Way of Rochester, the Boy Scouts of America, |
of The Vanguard Group, Inc., and of each of the | Amerigroup Corporation (direct health and medical |
investment companies served by The Vanguard Group; | insurance carriers), and Monroe Community College |
Chief Executive Officer and President of The Vanguard | Foundation. |
Group and of each of the investment companies served | |
by The Vanguard Group (1996-2008); Chairman of | |
the Financial Accounting Foundation; Governor of | Rajiv L. Gupta |
the Financial Industry Regulatory Authority (FINRA); | Born 1945. Trustee Since December 2001.2 Principal |
Director of United Way of Southeastern Pennsylvania. | Occupation(s) During the Past Five Years: Retired |
| Chairman and Chief Executive Officer of Rohm and |
F. William McNabb III1 | Haas Co. (chemicals); President of Rohm and Haas Co. |
Born 1957. Trustee Since July 2009. Principal | (2006-2008); Board Member of American Chemistry |
Occupation(s) During the Past Five Years: Director of | Council; Director of Tyco International, Ltd. (diversified |
The Vanguard Group, Inc., since 2008; Chief Executive | manufacturing and services) and Hewlett-Packard Co. |
Officer and President of The Vanguard Group and of | (electronic computer manufacturing); Trustee of The |
each of the investment companies served by The | Conference Board. |
Vanguard Group since 2008; Director of Vanguard | |
Marketing Corporation; Managing Director of The | |
Vanguard Group (1995-2008). | Amy Gutmann |
| Born 1949. Trustee Since June 2006. Principal |
| Occupation(s) During the Past Five Years: President of |
Independent Trustees | the University of Pennsylvania; Christopher H. Browne |
| Distinguished Professor of Political Science in the School |
Charles D. Ellis | of Arts and Sciences with Secondary Appointments |
Born 1937. Trustee Since January 2001. Principal | at the Annenberg School for Communication and the |
Occupation(s) During the Past Five Years: Applecore | Graduate School of Education of the University of |
Partners (pro bono ventures in education); Senior | Pennsylvania; Director of Carnegie Corporation of |
Advisor to Greenwich Associates (international business | New York, Schuylkill River Development Corporation, |
strategy consulting); Successor Trustee of Yale University; | and Greater Philadelphia Chamber of Commerce; |
Overseer of the Stern School of Business at New York | Trustee of the National Constitution Center. |
University; Trustee of the Whitehead Institute for | |
Biomedical Research. | |
JoAnn Heffernan Heisen | Executive Officers |
Born 1950. Trustee Since July 1998. Principal | | |
Occupation(s) During the Past Five Years: Retired | | |
Corporate Vice President, Chief Global Diversity Officer, | Thomas J. Higgins1 |
and Member of the Executive Committee of Johnson | Born 1957. Chief Financial Officer Since September |
& Johnson (pharmaceuticals/consumer products); | 2008. Principal Occupation(s) During the Past Five |
Vice President and Chief Information Officer of Johnson | Years: Principal of The Vanguard Group, Inc.; Chief |
& Johnson (1997-2005); Director of the University | Financial Officer of each of the investment companies |
Medical Center at Princeton and Women’s Research | served by The Vanguard Group since 2008; Treasurer |
and Education Institute. | of each of the investment companies served by The |
| Vanguard Group (1998-2008). |
| | |
Andr F. Perold | | |
Born 1952. Trustee Since December 2004. Principal | Kathryn J. Hyatt1 | |
Occupation(s) During the Past Five Years: George Gund | Born 1955. Treasurer Since November 2008. Principal |
Professor of Finance and Banking, Harvard Business | Occupation(s) During the Past Five Years: Principal of |
School; Director and Chairman of UNX, Inc. (equities | The Vanguard Group, Inc.; Treasurer of each of the |
trading firm); Chair of the Investment Committee of | investment companies served by The Vanguard |
HighVista Strategies LLC (private investment firm). | Group since 2008; Assistant Treasurer of each of the |
| investment companies served by The Vanguard Group |
| (1988-2008). | |
Alfred M. Rankin, Jr. | | |
Born 1941. Trustee Since January 1993. Principal | | |
Occupation(s) During the Past Five Years: Chairman, | Heidi Stam1 | |
President, Chief Executive Officer, and Director of | Born 1956. Secretary Since July 2005. Principal |
NACCO Industries, Inc. (forklift trucks/housewares/ | Occupation(s) During the Past Five Years: Managing |
lignite); Director of Goodrich Corporation (industrial | Director of The Vanguard Group, Inc., since 2006; |
products/aircraft systems and services). | General Counsel of The Vanguard Group since 2005; |
| Secretary of The Vanguard Group and of each of the |
| investment companies served by The Vanguard Group |
Peter F. Volanakis | since 2005; Director and Senior Vice President of |
Born 1955. Trustee Since July 2009. Principal | Vanguard Marketing Corporation since 2005; Principal |
Occupation(s) During the Past Five Years: President | of The Vanguard Group (1997-2006). |
since 2007 and Chief Operating Officer since 2005 | | |
of Corning Incorporated (communications equipment); | | |
President of Corning Technologies (2001-2005); Director | Vanguard Senior Management Team |
of Corning Incorporated and Dow Corning; Trustee of | | |
the Corning Incorporated Foundation and the Corning | | |
Museum of Glass; Overseer of the Amos Tuck School | R. Gregory Barton | Michael S. Miller |
of Business Administration at Dartmouth College. | Mortimer J. Buckley | James M. Norris |
| Kathleen C. Gubanich | Glenn W. Reed |
| Paul A. Heller | George U. Sauter |
| | |
| Founder | |
| | |
| John C. Bogle | |
| Chairman and Chief Executive Officer, 1974-1996 |
|
|
1 These individuals are “interested persons” as defined in the Investment Company Act of 1940. |
2 December 2002 for Vanguard Equity Income Fund, Vanguard Growth Equity Fund, the Vanguard Municipal Bond |
Funds, and the Vanguard State Tax-Exempt Funds. |

P.O. Box 2600
Valley Forge, PA 19482-2600
Connect with Vanguard® > www.vanguard.com
Fund Information > 800-662-7447 | |
| |
Direct Investor Account Services > 800-662-2739 | |
| |
Institutional Investor Services > 800-523-1036 | |
| |
Text Telephone for People | |
With Hearing Impairment > 800-952-3335 | |
| |
This material may be used in conjunction | |
with the offering of shares of any Vanguard | |
fund only if preceded or accompanied by | |
the fund’s current prospectus. | |
| |
All comparative mutual fund data are from Lipper Inc. or | |
Morningstar, Inc., unless otherwise noted. | |
| |
You can obtain a free copy of Vanguard’s proxy voting | |
guidelines by visiting our website, www.vanguard.com, | |
and searching for “proxy voting guidelines,” or by calling | |
Vanguard at 800-662-2739. The guidelines are also | |
available from the SEC’s website, www.sec.gov. In | |
addition, you may obtain a free report on how your fund | |
voted the proxies for securities it owned during the 12 | |
months ended June 30. To get the report, visit either | |
www.vanguard.com or www.sec.gov. | |
| |
You can review and copy information about your fund at | |
the SEC’s Public Reference Room in Washington, D.C. To | |
find out more about this public service, call the SEC at | |
202-551-8090. Information about your fund is also | |
available on the SEC’s website, and you can receive | |
copies of this information, for a fee, by sending a | |
request in either of two ways: via e-mail addressed to | |
publicinfo@sec.gov or via regular mail addressed to the | © 2009 The Vanguard Group, Inc. |
Public Reference Section, Securities and Exchange | All rights reserved. |
Commission, Washington, DC 20549-0102. | Vanguard Marketing Corporation, Distributor. |
| |
| Q572 092009 |


> | For the fiscal half-year ended July 31, 2009, Vanguard Dividend Appreciation Index Fund returned almost 16%, closely tracking the return of its target index. |
> | The broad U.S. stock market advanced more than 23% as the economy showed signs of recovery. |
> | The financial sector was the best performer in the fund and its benchmark. Seven of the ten market sectors recorded gains. |
Contents | |
| |
Your Fund’s Total Returns | 1 |
President’s Letter | 2 |
Results of Proxy Voting | 8 |
Fund Profile | 9 |
Performance Summary | 11 |
Financial Statements | 12 |
About Your Fund’s Expenses | 22 |
Trustees Approve Advisory Arrangement | 24 |
Glossary | 25 |
Please note: The opinions expressed in this report are just that—informed opinions. They should not be considered promises or advice.
Also, please keep in mind that the information and opinions cover the period through the date on the front of this report. Of course, the risks of investing in your fund are spelled out in the prospectus.
See the Glossary for definitions of investment terms used in this report.
Your Fund’s Total Returns
Six Months Ended July 31, 2009 | |
| |
| Total |
| Returns |
Vanguard Dividend Appreciation Index Fund | |
Investor Shares | 15.84% |
ETF Shares | |
Market Price | 15.58 |
Net Asset Value | 15.88 |
Dividend Achievers Select Index | 15.89 |
Large-Cap Core Funds Average | 22.36 |
Vanguard ETF™ Shares are traded on the NYSE Arca exchange and are available only through brokers. The table shows the ETF returns on both the NYSE Arca market price and the net asset value for a share. U.S. Pat. No. 6,879,964 B2; 7,337,138.
Large-Cap Core Funds Average: Derived from data provided by Lipper Inc.
Your Fund’s Performance at a Glance | | |
January 31, 2009, Through July 31, 2009 | | |
| | | | |
| | | Distributions Per Share |
| Starting | Ending | Income | Capital |
| Share Price | Share Price | Dividends | Gains |
Vanguard Dividend Appreciation Index Fund | | | | |
Investor Shares | $14.79 | $16.91 | $0.193 | $0.000 |
ETF Shares | 36.96 | 42.25 | 0.507 | 0.000 |
1

President’s Letter
Dear Shareholder,
Vanguard Dividend Appreciation Index Fund returned about 16% for the six months ended July 31, 2009, and closely tracked the performance of its target, the Dividend Achievers Select Index. The fund trailed the average return of its peer group and the gain of the broad U.S. stock market, both above 20%.
As the stock market rallied, the leading gainers were companies and sectors that started out with the most beaten-down shares. By contrast, companies that pay steady dividends, such as those in the Dividend Appreciation Index Fund, did not rise as rapidly as others that are less financially sound.
The past six months was a tough time for dividend investors. More U.S. public companies decreased their dividends during the second quarter of 2009 than at any time since 1957, according to Standard & Poor’s. Even companies with solid balance sheets slashed their dividends in an effort to conserve funds during the global financial crisis.
2
Stocks rose on signs that recovery is taking root
For the six months ended July 31, the broad U.S. stock market returned about 23%, as measured by the Dow Jones U.S. Total Stock Market Index. The period began in gloom, with stocks declining in February and early March before staging a strong springtime rally. After pausing in June, the market surged nearly 8% in July as investors reacted to improvement in the housing market, an increase in manufacturing activity, rising corporate earnings, and cautiously optimistic comments from the Federal Reserve Board.
Global stock markets performed even better, advancing almost 38% for the period. Encouraging earnings reports and higher commodity prices lifted international stocks off their lows in early March. After three straight months of solid gains, the MSCI All Country World Index ex USA fell slightly in June before rallying again in July.
Although stock markets worldwide have been in recovery mode for five months and various economic signs point to the recession’s end, the health of global financial markets and economies remained fragile as the period ended. Unemployment, in particular, was still a major concern both in the United States and abroad.
Market Barometer | | | |
| | | |
| Total Returns |
| Periods Ended July 31, 2009 |
| Six | One | Five Years |
| Months | Year | (Annualized) |
Stocks | | | |
Russell 1000 Index (Large-caps) | 22.26% | -20.17% | 0.32% |
Russell 2000 Index (Small-caps) | 26.61 | -20.72 | 1.52 |
Dow Jones U.S. Total Stock Market Index | 23.23 | -19.67 | 0.81 |
MSCI All Country World Index ex USA (International) | 37.70 | -20.90 | 7.57 |
| | | |
Bonds | | | |
Barclays Capital U.S. Aggregate Bond Index (Broad | | | |
taxable market) | 4.47% | 7.85% | 5.14% |
Barclays Capital Municipal Bond Index | 4.38 | 5.11 | 4.21 |
Citigroup Three-Month U.S. Treasury Bill Index | 0.09 | 0.65 | 3.00 |
| | | |
CPI | | | |
Consumer Price Index | 1.99% | -2.10% | 2.60% |
3
Investors departed Treasuries for higher-yielding bonds
For the six months, the Barclays Capital U.S. Aggregate Bond Index, a broad measure of the investment-grade market, returned more than 4%. That return paled, however, next to the 30% return of lower-quality bonds, as measured by the Barclays Capital U.S. Corporate High Yield Bond Index. By spring, investors seemed to gain confidence in the federal government’s efforts to thaw the credit markets and stimulate the economy, and they started shifting from U.S. Treasury bonds to corporate issues—particularly below-investment-grade bonds, which offered the highest yields. Municipal bonds also benefited from government support, with the broad tax-exempt market returning about 4% for the six months.
Efforts to combat the financial crisis have included a combination of aggressive monetary policy and large fiscal programs, most notably the nearly $800 billion American Recovery and Reinvestment Act. On the monetary side, the Fed has kept its target for short-term interest rates at an all-time low of 0% to 0.25%, a target it expects to maintain for “an extended period.” For the last several months, the Fed has been purchasing Treasury and mortgage-backed securities, an effort to keep longer-term interest rates and borrowing costs low. In recent months, however, Treasury yields have risen amid concerns about longer-term budget deficits.
Expense Ratios | | | |
Your Fund Compared With Its Peer Group | | |
| | | Large-Cap |
| Investor | ETF | Core Funds |
| Shares | Shares | Average |
Dividend Appreciation Index Fund | 0.35% | 0.24% | 1.26% |
The fund expense ratios shown are from the prospectuses dated May 29, 2009, and represent estimated costs for the current fiscal year based on the fund’s net assets as of the prospectus date. For the six months ended July 31, 2009, the fund’s annualized expense ratios were 0.35% for Investor Shares and 0.24% for ETF Shares. The peer-group expense ratio is derived from data provided by Lipper Inc. and captures information through year-end 2008.
4
Financial stocks led gains as firms shored themselves up
In a dramatic reversal from the prior six-month period, the financial sector was the best performer in the Dividend Appreciation Index Fund and its target benchmark. The fund’s holdings in financial companies gained about 38% for the period and contributed more than 5 percentage points to the overall return.
The rally among these previously hard-hit stocks was broad and deep. Bank shares rose sharply after many demonstrated they had sufficient capital to pass the government’s stress tests. In addition, commercial banks continued to reduce their riskier loans and benefited from the low-interest-rate environment. Low rates have helped banks to profit from the difference between their own borrowing costs and the higher yields they can obtain for longer-term loans and fixed income securities.
Elsewhere in the financial sector, asset managers repaired their balance sheets and increased their earnings on the strength of cost-cutting measures and increased cash flow. Insurance companies, which invest their premiums in anticipation of incoming claims, benefited from the general recovery in the financial markets.
Consumer staples, the fund’s largest sector holding at about 25% of assets on average, contributed more than 3 percentage points to the overall return. Gains here were not as robust as those of more cyclical sectors. Consumer demand for food, beverage, and personal care items has been comparatively stable, a factor that helped to buffer this sector during the broad market’s decline. More recently, however, as market sectors that suffered most during the depths of the financial crisis began to recover, consumer staples stocks failed to keep pace.
Although companies in the industrial and materials sectors continued to experience lower sales, their earnings outlook brightened during the half-year because of budget-tightening, improvement in the credit markets, and rising commodity prices. As the economy showed signs of healing, the consumer discretionary sector began to rebound, too. Home-improvement retailers were helped by a bump in the housing market, and apparel discount stores were rewarded by bargain-hunting consumers.
Health care holdings weighed most heavily on the fund’s return. Decreasing profits, attributed to the weak economy and to uncertainty about new federal health care initiatives, played a role in the sector’s performance.
5
Diversification is crucial for long-term investing
The Dividend Appreciation Index Fund had solid gains during the past six months, although it did not approach the returns of the broad market index or the average return of peer-group funds. Throughout this unsettled period, the fund continued to track its target index very closely.
Whatever the markets may do in the months to come, we’re confident in the ability of Vanguard Quantitative Equity Group, the investment advisor, to guide the fund skillfully as it seeks to capture the return of its target index, giving investors low-cost exposure to a diversified portfolio of companies with a record of increasing their dividends over time.
We believe that the fund can play a useful role in a long-term investment portfolio built from a diversified mix of stock, bond, and money market mutual funds, held in proportions that suit your goals, time horizon, and risk tolerance.
Sincerely,

F. William McNabb III
President and Chief Executive Officer
August 13, 2009
6
Vanguard Dividend Appreciation ETF | | | |
Premium/Discount: April 21, 2006,1 Through July 31, 2009 | | |
| | | | |
| Market Price Above or | | Market Price Below |
| Equal to Net Asset Value | Net Asset Value |
| Number | Percentage | Number | Percentage |
Basis Point Differential2 | of Days | of Total Days | of Days | of Total Days |
0-24.9 | 409 | 49.47% | 387 | 46.80% |
25-49.9 | 14 | 1.69 | 5 | 0.60 |
50-74.9 | 5 | 0.60 | 0 | 0.00 |
75-100.0 | 3 | 0.36 | 1 | 0.12 |
>100.0 | 3 | 0.36 | 0 | 0.00 |
Total | 434 | 52.48% | 393 | 47.52% |
1 Inception.
2 One basis point equals 1/100 of a percentage point.
7
Results of Proxy Voting
At a special meeting of shareholders on July 2, 2009, fund shareholders approved the following two proposals:
Proposal 1 – Elect trustees for each fund.*
The individuals listed in the table below were elected as trustees for each fund. All trustees with the exception of Messrs. McNabb and Volanakis (both of whom already served as directors of The Vanguard Group, Inc.) served as trustees to the funds prior to the shareholder meeting.
| | | Percentage |
Trustee | For | Withheld | For |
John J. Brennan | 831,083,148 | 23,429,009 | 97.3% |
Charles D. Ellis | 815,919,984 | 38,592,173 | 95.5% |
Emerson U. Fullwood | 818,220,903 | 36,291,254 | 95.8% |
Rajiv L. Gupta | 827,792,136 | 26,720,020 | 96.9% |
Amy Gutmann | 828,576,544 | 25,935,613 | 97.0% |
JoAnn Heffernan Heisen | 827,968,189 | 26,543,968 | 96.9% |
F. William McNabb III | 830,218,855 | 24,293,302 | 97.2% |
Andr F. Perold | 817,862,692 | 36,649,465 | 95.7% |
Alfred M. Rankin, Jr. | 827,956,891 | 26,555,266 | 96.9% |
Peter F. Volanakis | 829,990,273 | 24,521,884 | 97.1% |
* Results are for all funds within the same trust. | |
Proposal 2–Update and standardize the funds’ fundamental policies regarding: |
(a) | Purchasing and selling real estate. |
(b) | Issuing senior securities. |
(c) | Borrowing money. |
(d) | Making loans. |
(e) | Purchasing and selling commodities. |
(f) | Concentrating investments in a particular industry or group of industries. |
(g) | Eliminating outdated fundamental investment policies not required by law. |
The revised fundamental policies are clearly stated and simple, yet comprehensive, making oversight and compliance more efficient than under the former policies. The revised fundamental policies will allow the funds to respond more quickly to regulatory and market changes, while avoiding the costs and delays associated with successive shareholder meetings.
| | | | Broker | Percentage |
Vanguard Fund | For | Abstain | Against | Non-Votes | For |
Dividend Appreciation Index Fund | | | | |
2a | 22,169,112 | 230,160 | 196,697 | 6,803,503 | 75.4% |
2b | 21,047,987 | 235,170 | 1,312,811 | 6,803,504 | 71.6% |
2c | 20,847,897 | 232,925 | 1,515,148 | 6,803,502 | 70.9% |
2d | 20,849,737 | 234,440 | 1,511,793 | 6,803,502 | 70.9% |
2e | 21,040,557 | 229,007 | 1,326,404 | 6,803,503 | 71.6% |
2f | 22,115,379 | 225,464 | 255,126 | 6,803,502 | 75.2% |
2g | 21,044,892 | 264,523 | 1,286,553 | 6,803,503 | 71.6% |
8
Dividend Appreciation Index Fund
Fund Profile
As of July 31, 2009
Share-Class Characteristics | |
| | |
| Investor | ETF |
| Shares | Shares |
Ticker Symbol | VDAIX | VIG |
Expense Ratio1 | 0.35% | 0.24% |
30-Day SEC Yield | 2.21% | 2.32% |
Portfolio Characteristics | |
| | Dividend | DJ |
| | Achievers | U.S. Total |
| | Select | Market |
| Fund | Index | Index |
Number of Stocks | 186 | 186 | 4,370 |
Median Market Cap | $36.2B | $36.2B | $26.1B |
Price/Earnings Ratio | 15.4x | 15.4x | 23.0x |
Price/Book Ratio | 2.8x | 2.8x | 2.1x |
Return on Equity | 24.4% | 24.4% | 19.6% |
Earnings Growth Rate | 10.2% | 10.2% | 12.6% |
Dividend Yield | 2.5% | 2.5% | 2.0% |
Foreign Holdings | 0.0% | 0.0% | 0.0% |
Turnover Rate | | | |
(Annualized) | 8% | — | — |
Short-Term Reserves | 0.0% | — | — |
Volatility Measures | | |
| | DJ |
| Dividend | U.S. Total |
| Achievers | Market |
| Select Index | Index |
R-Squared | 1.00 | 0.93 |
Beta | 1.00 | 0.79 |
These measures show the degree and timing of the fund’s fluctuations compared with the indexes over 36 months.
Ten Largest Holdings (% of total net assets) |
| | |
Wells Fargo & Co. | Diversified Banks | 4.6% |
International Business Machines Corp. | Computer Hardware | 4.6 |
The Coca-Cola Co. | Soft Drinks | 4.2 |
PepsiCo, Inc. | Soft Drinks | 4.0 |
Johnson & Johnson | Pharmaceuticals | 3.8 |
Wal-Mart Stores, Inc. | Hypermarkets & Super Centers | 3.8 |
The Procter & Gamble Co. | Household Products | 3.5 |
Chevron Corp. | Integrated Oil & Gas | 3.5 |
McDonald's Corp. | Restaurants | 3.3 |
ExxonMobil Corp. | Integrated Oil & Gas | 3.3 |
Top Ten | | 38.6% |
The holdings listed exclude any temporary cash investments and equity index products.
Investment Focus
1 The fund expense ratios shown are from the prospectuses dated May 29, 2009, and represent estimated |
costs for the current fiscal year based on the fund’s net assets as of the prospectus date. For the six months |
ended July 31, 2009, the fund’s annualized expense ratios were 0.35% for Investor Shares |
and 0.24% for ETF Shares. |
9
Dividend Appreciation Index Fund
Sector Diversification (% of equity exposure) |
| | Dividend | DJ |
| | Achievers | U.S. Total |
| | Select | Market |
| Fund | Index | Index |
Consumer | | | |
Discretionary | 11.7% | 11.7% | 9.9% |
Consumer Staples | 24.8 | 24.7 | 10.2 |
Energy | 6.9 | 6.9 | 11.6 |
Financials | 15.0 | 15.0 | 15.3 |
Health Care | 11.8 | 11.8 | 13.3 |
Industrials | 15.7 | 15.7 | 10.3 |
Information Technology | 6.6 | 6.6 | 18.5 |
Materials | 4.8 | 4.9 | 3.8 |
Telecommunication Services | 0.0 | 0.0 | 3.1 |
Utilities | 2.7 | 2.7 | 4.0 |
10
Dividend Appreciation Index Fund
Performance Summary
All of the returns in this report represent past performance, which is not a guarantee of future results that may be achieved by the fund. (Current performance may be lower or higher than the performance data cited. For performance data current to the most recent month-end, visit our website at www.vanguard.com/performance.) Note, too, that both investment returns and principal value can fluctuate widely, so an investor’s shares, when sold, could be worth more or less than their original cost. The returns shown do not reflect taxes that a shareholder would pay on fund distributions or on the sale of fund shares.
Fiscal-Year Total Returns (%): April 27, 2006, Through July 31, 2009
Note: For 2010, performance data reflect the six months ended July 31, 2009.
Average Annual Total Returns: Periods Ended June 30, 2009
This table presents average annual total returns through the latest calendar quarter—rather than through the end of the fiscal period. Securities and Exchange Commission rules require that we provide this information.
| | | Since |
| Inception Date | One Year | Inception |
Investor Shares | 4/27/2006 | -18.87% | -5.43% |
ETF Shares | 4/21/2006 | | |
Market Price | | -18.72 | -5.21 |
Net Asset Value | | -18.78 | -5.22 |
Vanguard fund total returns do not include the account service fee that may be applicable to certain accounts with |
balances below $10,000. |
See Financial Highlights for dividend and capital gains information. |
11
Dividend Appreciation Index Fund
Financial Statements (unaudited)
Statement of Net Assets
As of July 31, 2009
The fund provides a complete list of its holdings four times in each fiscal year, at the quarter-ends. For the second and fourth fiscal quarters, the lists appear in the fund’s semiannual and annual reports to shareholders. For the first and third fiscal quarters, the fund files the lists with the Securities and Exchange Commission on Form N-Q. Shareholders can look up the fund’s Forms N-Q on the SEC’s website at www.sec.gov. Forms N-Q may also be reviewed and copied at the SEC’s Public Reference Room (see the back cover of this report for further information).
| | Market |
| | Value¥ |
| Shares | ($000) |
Common Stocks (100.0%) | | |
Consumer Discretionary (11.7%) | |
McDonald’s Corp. | 996,089 | 54,845 |
Lowe’s Cos., Inc. | 1,349,198 | 30,303 |
Target Corp. | 633,286 | 27,624 |
Johnson Controls, Inc. | 665,675 | 17,228 |
TJX Cos., Inc. | 349,039 | 12,646 |
The McGraw-Hill Cos., Inc. | 272,991 | 8,558 |
Sherwin-Williams Co. | 119,694 | 6,912 |
VF Corp. | 87,636 | 5,669 |
Genuine Parts Co. | 155,040 | 5,491 |
Fortune Brands, Inc. | 138,622 | 5,485 |
H & R Block, Inc. | 304,532 | 5,083 |
Ross Stores, Inc. | 105,441 | 4,649 |
Family Dollar Stores, Inc. | 109,936 | 3,454 |
The Stanley Works | 65,573 | 2,633 |
John Wiley & Sons Class A | 40,880 | 1,304 |
Wolverine World Wide, Inc. | 46,000 | 1,108 |
Matthews International Corp. | 23,945 | 748 |
Cato Corp. Class A | 24,099 | 479 |
Weyco Group, Inc. | 10,459 | 249 |
| | 194,468 |
Consumer Staples (24.7%) | | |
The Coca-Cola Co. | 1,388,339 | 69,195 |
PepsiCo, Inc. | 1,170,142 | 66,406 |
Wal-Mart Stores, Inc. | 1,249,561 | 62,328 |
The Procter & Gamble Co. | 1,046,611 | 58,097 |
Colgate-Palmolive Co. | 460,942 | 33,391 |
Walgreen Co. | 744,271 | 23,110 |
Kimberly-Clark Corp. | 355,752 | 20,794 |
Archer-Daniels-Midland Co. | 560,075 | 16,869 |
Avon Products, Inc. | 404,716 | 13,105 |
Sysco Corp. | 490,876 | 11,663 |
The Clorox Co. | 131,512 | 8,023 |
The Hershey Co. | 131,578 | 5,256 |
J.M. Smucker Co. | 97,913 | 4,899 |
Hormel Foods Corp. | 114,477 | 4,111 |
Brown-Forman Corp. Class B | 86,445 | 3,799 |
Church & Dwight, Inc. | 60,574 | 3,573 |
McCormick & Co., Inc. | 100,640 | 3,243 |
Lancaster Colony Corp. | 24,342 | 1,108 |
Tootsie Roll Industries, Inc. | 32,210 | 778 |
| | 409,748 |
Energy (6.9%) | | |
Chevron Corp. | 825,156 | 57,324 |
ExxonMobil Corp. | 768,314 | 54,082 |
Helmerich & Payne, Inc. | 82,204 | 2,824 |
Holly Corp. | 32,582 | 693 |
| | 114,923 |
Financials (15.0%) | | |
Wells Fargo & Co. | 3,118,048 | 76,267 |
State Street Corp. | 628,061 | 31,591 |
AFLAC Inc. | 725,369 | 27,463 |
Franklin Resources, Inc. | 232,086 | 20,581 |
The Chubb Corp. | 344,349 | 15,902 |
T. Rowe Price Group Inc. | 232,779 | 10,873 |
Northern Trust Corp. | 172,737 | 10,331 |
Legg Mason Inc. | 145,462 | 4,093 |
SEI Investments Co. | 182,424 | 3,448 |
Transatlantic Holdings, Inc. | 62,455 | 2,955 |
Eaton Vance Corp. | 98,784 | 2,827 |
Commerce | | |
Bancshares, Inc. | 75,828 | 2,780 |
HCC Insurance | | |
Holdings, Inc. | 104,616 | 2,626 |
Cullen/Frost Bankers, Inc. | 54,340 | 2,610 |
Brown & Brown, Inc. | 125,277 | 2,403 |
City National Corp. | 55,891 | 2,204 |
Valley National Bancorp | 170,364 | 2,167 |
First Niagara Financial | | |
Group, Inc. | 143,457 | 1,886 |
Bank of Hawaii Corp. | 47,884 | 1,837 |
BancorpSouth, Inc. | 79,230 | 1,783 |
Wesco Financial Corp. | 5,831 | 1,778 |
UMB Financial Corp. | 40,678 | 1,697 |
12
Dividend Appreciation Index Fund
| | Market |
| | Value¥ |
| Shares | ($000) |
Westamerica | | |
Bancorporation | 26,741 | 1,398 |
United Bankshares, Inc. | 54,927 | 1,113 |
First Financial | | |
Bankshares, Inc. | 20,521 | 1,081 |
Trustmark Corp. | 50,363 | 1,002 |
Glacier Bancorp, Inc. | 64,002 | 997 |
R.L.I. Corp. | 19,273 | 956 |
Harleysville Group, Inc. | 28,307 | 878 |
State Auto Financial Corp. | 43,099 | 745 |
IBERIABANK Corp. | 14,097 | 660 |
BancFirst Corp. | 18,328 | 657 |
Community Bank | | |
System, Inc. | 34,595 | 627 |
Sterling Bancshares, Inc. | 75,815 | 612 |
Republic Bancorp, Inc. | | |
Class A | 20,560 | 496 |
Chemical Financial Corp. | 22,625 | 492 |
Bank of the Ozarks, Inc. | 18,137 | 459 |
WesBanco, Inc. | 27,040 | 451 |
First Financial Corp. (IN) | 12,973 | 422 |
S & T Bancorp, Inc. | 29,999 | 411 |
Community Trust | | |
Bancorp Inc. | 14,998 | 407 |
First Source Corp. | 24,632 | 407 |
Simmons First | | |
National Corp. | 13,313 | 399 |
Tompkins Trustco, Inc. | 8,945 | 398 |
Capital City Bank | | |
Group, Inc. | 23,199 | 370 |
Renasant Corp. | 23,574 | 351 |
Southside Bancshares, Inc. | 15,496 | 351 |
Heartland Financial | | |
USA, Inc. | 19,380 | 326 |
First Busey Corp. | 51,475 | 322 |
Sandy Spring Bancorp, Inc. | 19,433 | 315 |
S.Y. Bancorp, Inc. | 12,702 | 312 |
Washington Trust | | |
Bancorp, Inc. | 15,528 | 282 |
Flushing Financial Corp. | 26,332 | 279 |
Arrow Financial Corp. | 9,015 | 253 |
WSFS Financial Corp. | 9,222 | 248 |
Lakeland Financial Corp. | 11,463 | 224 |
First Community | | |
Bancshares, Inc. | 15,737 | 214 |
Southwest Bancorp, Inc. | 14,928 | 150 |
Mainsource Financial | | |
Group, Inc. | 22,329 | 150 |
| | 249,317 |
Health Care (11.8%) | | |
Johnson & Johnson | 1,039,841 | 63,316 |
Abbott Laboratories | 1,107,969 | 49,847 |
Medtronic, Inc. | 865,664 | 30,662 |
Becton, Dickinson & Co. | 200,132 | 13,039 |
Stryker Corp. | 317,294 | 12,336 |
Cardinal Health, Inc. | 268,489 | 8,941 |
C.R. Bard, Inc. | 82,609 | 6,077 |
DENTSPLY | | |
International Inc. | 125,147 | 4,174 |
Beckman Coulter, Inc. | 48,036 | 3,026 |
Teleflex Inc. | 31,705 | 1,520 |
Owens & Minor, Inc. | 32,543 | 1,442 |
West Pharmaceutical | | |
Services, Inc. | 30,698 | 1,120 |
Meridian Bioscience Inc. | 40,308 | 888 |
| | 196,388 |
Industrials (15.7%) | | |
United Technologies Corp. | 855,642 | 46,607 |
3M Co. | 612,024 | 43,160 |
Caterpillar, Inc. | 694,616 | 30,605 |
Emerson Electric Co. | 677,965 | 24,664 |
Illinois Tool Works, Inc. | 436,697 | 17,708 |
General Dynamics Corp. | 318,254 | 17,628 |
Danaher Corp. | 266,616 | 16,328 |
C.H. Robinson | | |
Worldwide Inc. | 170,981 | 9,324 |
Expeditors International of | | |
Washington, Inc. | 199,602 | 6,772 |
Parker Hannifin Corp. | 139,504 | 6,177 |
W.W. Grainger, Inc. | 67,809 | 6,097 |
Dover Corp. | 162,491 | 5,526 |
Fastenal Co. | 123,019 | 4,376 |
Roper Industries Inc. | 75,828 | 3,626 |
Cintas Corp. | 124,156 | 3,126 |
Donaldson Co., Inc. | 68,268 | 2,595 |
Pentair, Inc. | 80,333 | 2,195 |
Harsco Corp. | 69,240 | 1,905 |
Carlisle Co., Inc. | 54,817 | 1,717 |
CLARCOR Inc. | 45,139 | 1,495 |
Brady Corp. Class A | 44,305 | 1,303 |
Nordson Corp. | 27,771 | 1,247 |
ABM Industries Inc. | 50,162 | 1,057 |
Mine Safety | | |
Appliances Co. | 34,465 | 968 |
Universal Forest | | |
Products, Inc. | 18,343 | 819 |
A.O. Smith Corp. | 18,468 | 721 |
Franklin Electric, Inc. | 19,705 | 638 |
Badger Meter, Inc. | 14,491 | 534 |
Raven Industries, Inc. | 15,725 | 451 |
McGrath RentCorp | 19,004 | 365 |
Tennant Co. | 16,409 | 360 |
Gorman-Rupp Co. | 15,732 | 351 |
Courier Corp. | 11,193 | 185 |
| | 260,630 |
Information Technology (6.6%) | | |
International Business | | |
Machines Corp. | 642,128 | 75,726 |
Automatic Data | | |
Processing, Inc. | 453,766 | 16,903 |
13
Dividend Appreciation Index Fund
| | Market |
| | Value¥ |
| Shares | ($000) |
Paychex, Inc. | 319,060 | 8,455 |
Linear Technology Corp. | 169,045 | 4,542 |
Diebold, Inc. | 62,554 | 1,734 |
Jack Henry & | | |
Associates Inc. | 74,787 | 1,606 |
| | 108,966 |
Materials (4.9%) | | |
Praxair, Inc. | 243,270 | 19,019 |
Nucor Corp. | 276,892 | 12,313 |
Air Products & | | |
Chemicals, Inc. | 159,936 | 11,931 |
Ecolab, Inc. | 200,233 | 8,312 |
Vulcan Materials Co. | 134,930 | 6,407 |
Sigma-Aldrich Corp. | 118,378 | 6,008 |
Martin Marietta | | |
Materials, Inc. | 44,051 | 3,791 |
Bemis Co., Inc. | 92,843 | 2,444 |
Albemarle Corp. | 75,221 | 2,235 |
AptarGroup Inc. | 63,408 | 2,214 |
Sonoco Products Co. | 81,037 | 2,146 |
Valspar Corp. | 81,402 | 2,061 |
H.B. Fuller Co. | 42,570 | 858 |
Stepan Co. | 9,541 | 427 |
Myers Industries, Inc. | 32,715 | 322 |
| | 80,488 |
Telecommunication Services (0.0%) | |
Shenandoah | | |
Telecommunications Co. | 21,300 | 434 |
| | |
Utilities (2.7%) | | |
FPL Group, Inc. | 339,957 | 19,265 |
Questar Corp. | 133,832 | 4,426 |
MDU Resources | | |
Group, Inc. | 161,032 | 3,242 |
National Fuel Gas Co. | 67,714 | 2,748 |
Energen Corp. | 60,026 | 2,480 |
UGI Corp. Holding Co. | 89,195 | 2,358 |
Aqua America, Inc. | 114,058 | 2,060 |
Piedmont Natural Gas, Inc. | 75,661 | 1,863 |
WGL Holdings Inc. | 42,280 | 1,400 |
New Jersey | | |
Resources Corp. | 35,578 | 1,373 |
Northwest Natural Gas Co. | 22,788 | 1,017 |
California Water | | |
Service Group | 18,612 | 705 |
MGE Energy, Inc. | 19,555 | 702 |
American States Water Co. | 14,870 | 541 |
SJW Corp. | 17,169 | 385 |
Middlesex Water Co. | 11,603 | 177 |
Connecticut Water | | |
Services, Inc. | 7,064 | 153 |
| | 44,895 |
Total Investments (100.0%) | | |
(Cost $1,633,388) | | 1,660,257 |
Other Assets and Liabilities (0.0%) | |
Other Assets | | 5,328 |
Liabilities | | (5,654) |
| | (326) |
Net Assets (100%) | | 1,659,931 |
At July 31, 2009, net assets consisted of: | |
| | Amount |
| | ($000) |
Paid-in Capital | | 1,801,801 |
Undistributed Net Investment Income | 1,680 |
Accumulated Net Realized Losses | | (170,419) |
Unrealized Appreciation (Depreciation) | 26,869 |
Net Assets | | 1,659,931 |
| | |
Investor Shares–Net Assets | | |
Applicable to 27,011,925 outstanding | |
$.001 par value shares of beneficial | |
interest (unlimited authorization) | | 456,660 |
Net Asset Value Per Share– | | |
Investor Shares | | $16.91 |
| | |
ETF Shares–Net Assets | | |
Applicable to 28,481,121 outstanding | |
$.001 par value shares of beneficial | |
interest (unlimited authorization) | | 1,203,271 |
Net Asset Value Per Share– | | |
ETF Shares | | $42.25 |
• See Note A in Notes to Financial Statements. | |
See accompanying Notes, which are an integral part of the Financial Statements.
14
Dividend Appreciation Index Fund
Statement of Operations
| Six Months Ended |
| July 31, 2009 |
| ($000) |
Investment Income | |
Income | |
Dividends | 18,903 |
Interest1 | 2 |
Security Lending | 3 |
Total Income | 18,908 |
Expenses | |
The Vanguard Group–Note B | |
Investment Advisory Services | 45 |
Management and Administrative–Investor Shares | 578 |
Management and Administrative–ETF Shares | 808 |
Marketing and Distribution–Investor Shares | 60 |
Marketing and Distribution–ETF Shares | 121 |
Custodian Fees | 91 |
Auditing Fees | 1 |
Shareholders’ Reports and Proxies–Investor Shares | 8 |
Shareholders’ Reports and Proxies–ETF Shares | 53 |
Trustees’ Fees and Expenses | 1 |
Total Expenses | 1,766 |
Net Investment Income | 17,142 |
Realized Net Gain (Loss) on Investment Securities Sold | 5,518 |
Change in Unrealized Appreciation (Depreciation) of Investment Securities | 187,206 |
Net Increase (Decrease) in Net Assets Resulting from Operations | 209,866 |
1 Interest income from an affiliated company of the fund was $1,000. |
See accompanying Notes, which are an integral part of the Financial Statements.
15
Dividend Appreciation Index Fund
Statement of Changes in Net Assets
| Six Months Ended | Year Ended |
| July 31, | January 31, |
| 2009 | 2009 |
| ($000) | ($000) |
Increase (Decrease) in Net Assets | | |
Operations | | |
Net Investment Income | 17,142 | 19,295 |
Realized Net Gain (Loss) | 5,518 | (150,714) |
Change in Unrealized Appreciation (Depreciation) | 187,206 | (162,335) |
Net Increase (Decrease) in Net Assets Resulting from Operations | 209,866 | (293,754) |
Distributions | | |
Net Investment Income | | |
Investor Shares | (5,044) | (7,677) |
ETF Shares | (12,180) | (10,413) |
Realized Capital Gain | | |
Investor Shares | – | – |
ETF Shares | – | – |
Total Distributions | (17,224) | (18,090) |
Capital Share Transactions | | |
Investor Shares | 15,336 | 164,638 |
ETF Shares | 261,189 | 679,485 |
Net Increase (Decrease) from Capital Share Transactions | 276,525 | 844,123 |
Total Increase (Decrease) | 469,167 | 532,279 |
Net Assets | | |
Beginning of Period | 1,190,764 | 658,485 |
End of Period1 | 1,659,931 | 1,190,764 |
1 Net Assets–End of Period includes undistributed net investment income of $1,680,000 and $1,762,000. |
See accompanying Notes, which are an integral part of the Financial Statements.
16
Dividend Appreciation Index Fund
Financial Highlights
Investor Shares | | | | |
| Six | | | |
| Months | | | April 27, |
| Ended | Year Ended | 20061 to |
| July 31, | January 31, | Jan. 31, |
For a Share Outstanding Throughout Each Period | 2009 | 2009 | 2008 | 2007 |
Net Asset Value, Beginning of Period | $14.79 | $21.40 | $21.84 | $20.05 |
Investment Operations | | | | |
Net Investment Income | .189 | .387 | .325 | .214 |
Net Realized and Unrealized Gain (Loss) on Investments | 2.124 | (6.614) | (.438) | 1.782 |
Total from Investment Operations | 2.313 | (6.227) | (.113) | 1.996 |
Distributions | | | | |
Dividends from Net Investment Income | (.193) | (.383) | (.327) | (.206) |
Distributions from Realized Capital Gains | – | – | – | – |
Total Distributions | (.193) | (.383) | (.327) | (.206) |
Net Asset Value, End of Period | $16.91 | $14.79 | $21.40 | $21.84 |
| | | | |
Total Return2 | 15.84% | -29.48% | -0.58% | 10.02% |
| | | | |
Ratios/Supplemental Data | | | | |
Net Assets, End of Period (Millions) | $457 | $386 | $357 | $163 |
Ratio of Total Expenses to Average Net Assets | 0.35%3 | 0.36% | 0.40% | 0.40%3 |
Ratio of Net Investment Income to Average Net Assets | 2.58%3 | 2.25% | 1.56% | 1.53%3 |
Portfolio Turnover Rate4 | 8%3 | 34% | 17% | 21% |
1 Inception. |
2 Total returns do not include the account service fee that may be applicable to certain accounts with balances |
below $10,000. |
3 Annualized. |
4 Excludes the value of portfolio securities received or delivered as a result of in-kind purchases or redemptions |
of the fund’s capital shares, including ETF Creation Units. |
See accompanying Notes, which are an integral part of the Financial Statements.
17
Dividend Appreciation Index Fund
Financial Highlights
ETF Shares | | | | |
| Six | | | |
| Months | | April 21, |
| Ended | Year Ended | 20061 to |
| July 31, | January 31, | Jan. 31, |
For a Share Outstanding Throughout Each Period | 2009 | 2009 | 2008 | 2007 |
Net Asset Value, Beginning of Period | $36.96 | $53.48 | $54.60 | $49.94 |
Investment Operations | | | | |
Net Investment Income | .494 | 1.032 | .873 | .555 |
Net Realized and Unrealized Gain (Loss) on Investments | 5.303 | (16.526) | (1.120) | 4.631 |
Total from Investment Operations | 5.797 | (15.494) | (.247) | 5.186 |
Distributions | | | | |
Dividends from Net Investment Income | (.507) | (1.026) | (.873) | (.526) |
Distributions from Realized Capital Gains | – | – | – | – |
Total Distributions | (.507) | (1.026) | (.873) | (.526) |
Net Asset Value, End of Period | $42.25 | $36.96 | $53.48 | $54.60 |
| | | | |
Total Return | 15.88% | -29.38% | -0.51% | 10.45% |
| | | | |
Ratios/Supplemental Data | | | | |
Net Assets, End of Period (Millions) | $1,203 | $805 | $302 | $111 |
Ratio of Total Expenses to Average Net Assets | 0.24%2 | 0.24% | 0.28% | 0.28%2 |
Ratio of Net Investment Income to Average Net Assets | 2.69%2 | 2.37% | 1.68% | 1.65%2 |
Portfolio Turnover Rate3 | 8%2 | 34% | 17% | 21% |
1 Inception. |
2 Annualized. |
3 Excludes the value of portfolio securities received or delivered as a result of in-kind purchases or redemptions of the |
fund’s capital shares, including ETF Creation Units. |
See accompanying Notes, which are an integral part of the Financial Statements.
18
Dividend Appreciation Index Fund
Notes to Financial Statements
Vanguard Dividend Appreciation Index Fund is registered under the Investment Company Act of 1940 as an open-end investment company, or mutual fund. The fund offers two classes of shares: Investor Shares and ETF Shares. Investor Shares are available to any investor who meets the fund’s minimum purchase requirements. ETF Shares are listed for trading on the NYSE Arca, Inc.; they can be purchased and sold through a broker.
A. The following significant accounting policies conform to generally accepted accounting principles for U.S. mutual funds. The fund consistently follows such policies in preparing its financial statements.
1. Security Valuation: Securities are valued as of the close of trading on the New York Stock Exchange (generally 4 p.m., Eastern time) on the valuation date. Equity securities are valued at the latest quoted sales prices or official closing prices taken from the primary market in which each security trades; such securities not traded on the valuation date are valued at the mean of the latest quoted bid and asked prices. Securities for which market quotations are not readily available, or whose values have been materially affected by events occurring before the fund’s pricing time but after the close of the securities’ primary markets, are valued by methods deemed by the board of trustees to represent fair value.
2. Federal Income Taxes: The fund intends to continue to qualify as a regulated investment company and distribute all of its taxable income. Management has analyzed the fund’s tax positions taken on federal income tax returns for all open tax years (tax years ended January 31, 2007-2009) and for the period ended July 31, 2009, and has concluded that no provision for federal income tax is required in the fund’s financial statements.
3. Distributions: Distributions to shareholders are recorded on the ex-dividend date.
4. Security Lending: The fund may lend its securities to qualified institutional borrowers to earn additional income. Security loans are required to be secured at all times by collateral at least equal to the market value of securities loaned. The fund invests cash collateral received in Vanguard Market Liquidity Fund, and records a liability for the return of the collateral, during the period the securities are on loan. Security lending income represents the income earned on investing cash collateral, less expenses associated with the loan.
5. Other: Dividend income is recorded on the ex-dividend date. Interest income includes income distributions received from Vanguard Market Liquidity Fund and is accrued daily. Security transactions are accounted for on the date securities are bought or sold. Costs used to determine realized gains (losses) on the sale of investment securities are those of the specific securities sold.
Each class of shares has equal rights as to assets and earnings, except that each class separately bears certain class-specific expenses related to maintenance of shareholder accounts (included in Management and Administrative expenses), shareholder reporting, and proxies. Marketing and distribution expenses are allocated to each class of shares based on a method approved by the board of trustees. Income, other non-class-specific expenses, and gains and losses on investments are allocated to each class of shares based on its relative net assets.
19
Dividend Appreciation Index Fund
B. The Vanguard Group furnishes at cost investment advisory, corporate management, administrative, marketing, and distribution services. The costs of such services are allocated to the fund under methods approved by the board of trustees. The fund has committed to provide up to 0.40% of its net assets in capital contributions to Vanguard. At July 31, 2009, the fund had contributed capital of $345,000 to Vanguard (included in Other Assets), representing 0.02% of the fund’s net assets and 0.14% of Vanguard’s capitalization. The fund’s trustees and officers are also directors and officers of Vanguard.
C. Various inputs may be used to determine the value of the fund’s investments. These inputs are summarized in three broad levels for financial statement purposes. The inputs or methodologies used to value securities are not necessarily an indication of the risk associated with investing in those securities.
Level 1–Quoted prices in active markets for identical securities.
Level 2–Other significant observable inputs (including quoted prices for similar securities, interest rates, prepayment speeds, credit risk, etc.).
Level 3–Significant unobservable inputs (including the fund’s own assumptions used to determine the fair value of investments).
At July 31, 2009, 100% of the fund’s investments were valued based on Level 1 inputs.
D. Distributions are determined on a tax basis and may differ from net investment income and realized capital gains for financial reporting purposes. Differences may be permanent or temporary. Permanent differences are reclassified among capital accounts in the financial statements to reflect their tax character. Temporary differences arise when certain items of income, expense, gain, or loss are recognized in different periods for financial statement and tax purposes; these differences will reverse at some time in the future. Differences in classification may also result from the treatment of short-term gains as ordinary income for tax purposes.
During the six months ended July 31, 2009, the fund realized $5,700,000 of net capital gains resulting from in-kind redemptions–in which shareholders exchanged fund shares for securities held by the fund rather than for cash. Because such gains are not taxable to the fund, and are not distributed to shareholders, they have been reclassified from accumulated net realized losses to paid-in capital.
The fund’s tax-basis capital gains and losses are determined only at the end of each fiscal year. For tax purposes, at January 31, 2009, the fund had available realized losses of $166,419,000 to offset future net capital gains of $609,000 through January 31, 2016, $22,242,000 through January 31, 2017, and $143,568,000 through January 31, 2018. The fund will use these capital losses to offset net taxable capital gains, if any, realized during the year ending January 31, 2010; should the fund realize net capital losses for the year, the losses will be added to the loss carryforward balances above.
At July 31, 2009, the cost of investment securities for tax purposes was $1,633,388,000. Net unrealized appreciation of investment securities for tax purposes was $26,869,000, consisting of unrealized gains of $85,819,000 on securities that had risen in value since their purchase and $58,950,000 in unrealized losses on securities that had fallen in value since their purchase.
E. During the six months ended July 31, 2009, the fund purchased $358,206,000 of investment securities and sold $83,420,000 of investment securities, other than temporary cash investments.
20
Dividend Appreciation Index Fund
F. Capital share transactions for each class of shares were:
| Six Months Ended | Year Ended |
| July 31, 2009 | January 31, 2009 |
| Amount | Shares | Amount | Shares |
| ($000) | (000) | ($000) | (000) |
Investor Shares | | | | |
Issued | 68,680 | 4,570 | 229,131 | 12,962 |
Issued in Lieu of Cash Distributions | 4,445 | 302 | 6,983 | 372 |
Redeemed | (57,789) | (3,972) | (71,476) | (3,895) |
Net Increase (Decrease)–Investor Shares | 15,336 | 900 | 164,638 | 9,439 |
ETF Shares | | | | |
Issued | 294,063 | 7,614 | 692,968 | 16,425 |
Issued in Lieu of Cash Distributions | – | – | – | – |
Redeemed | (32,874) | (900) | (13,483) | (300) |
Net Increase (Decrease)–ETF Shares | 261,189 | 6,714 | 679,485 | 16,125 |
G. In preparing the financial statements as of July 31, 2009, management considered the impact of subsequent events occurring through September 10, 2009, for potential recognition or disclosure in these financial statements.
21
About Your Fund’s Expenses
As a shareholder of the fund, you incur ongoing costs, which include costs for portfolio management, administrative services, and shareholder reports (like this one), among others. Operating expenses, which are deducted from a fund’s gross income, directly reduce the investment return of the fund.
A fund’s expenses are expressed as a percentage of its average net assets. This figure is known as the expense ratio. The following examples are intended to help you understand the ongoing costs (in dollars) of investing in your fund and to compare these costs with those of other mutual funds. The examples are based on an investment of $1,000 made at the beginning of the period shown and held for the entire period.
The accompanying table illustrates your fund’s costs in two ways:
• Based on actual fund return. This section helps you to estimate the actual expenses that you paid over the period. The ”Ending Account Value“ shown is derived from the fund‘s actual return, and the third column shows the dollar amount that would have been paid by an investor who started with $1,000 in the fund. You may use the information here, together with the amount you invested, to estimate the expenses that you paid over the period.
To do so, simply divide your account value by $1,000 (for example, an $8,600 account value divided by $1,000 = 8.6), then multiply the result by the number given for your fund under the heading ”Expenses Paid During Period.“
• Based on hypothetical 5% yearly return. This section is intended to help you compare your fund‘s costs with those of other mutual funds. It assumes that the fund had a yearly return of 5% before expenses, but that the expense ratio is unchanged. In this case—because the return used is not the fund’s actual return—the results do not apply to your investment. The example is useful in making comparisons because the Securities and Exchange Commission requires all mutual funds to calculate expenses based on a 5% return. You can assess your fund’s costs by comparing this hypothetical example with the hypothetical examples that appear in shareholder reports of other funds.
Note that the expenses shown in the table are meant to highlight and help you compare ongoing costs only and do not reflect transaction costs incurred by the fund for buying and selling securities. Further, the expenses do not include the account service fee described in the prospectus. If such a fee were applied to your account, your costs would be higher. Your fund does not charge transaction fees, such as purchase or redemption fees, nor does it carry a “sales load.”
The calculations assume no shares were bought or sold during the period. Your actual costs may have been higher or lower, depending on the amount of your investment and the timing of any purchases or redemptions.
You can find more information about the fund’s expenses, including annual expense ratios, in the Financial Statements section of this report. For additional information on operating expenses and other shareholder costs, please refer to your fund’s current prospectus.
22
Six Months Ended July 31, 2009 | | | |
| Beginning | Ending | Expenses |
| Account Value | Account Value | Paid During |
Dividend Appreciation Index Fund | 1/31/2009 | 7/31/2009 | Period |
Based on Actual Fund Return | | | |
Investor Shares | $1,000.00 | $1,158.39 | $1.87 |
ETF Shares | 1,000.00 | 1,158.81 | 1.28 |
Based on Hypothetical 5% Yearly Return | | | |
Investor Shares | $1,000.00 | $1,023.06 | $1.76 |
ETF Shares | 1,000.00 | 1,023.60 | 1.20 |
These calculations are based on expenses incurred in the most recent six-month period. The fund’s annualized six-month expense ratios for that period are 0.35% for Investor Shares and 0.24% for ETF Shares. The dollar amounts shown as “Expenses Paid” are equal to the annualized expense ratio multiplied by the average account value over the period, multiplied by the number of days in the most recent six-month period, then divided by the number of days in the most recent 12-month period.
23
Trustees Approve Advisory Arrangement
The board of trustees of Vanguard Dividend Appreciation Index Fund has renewed the fund’s investment advisory arrangement with The Vanguard Group, Inc. Vanguard–through its Quantitative Equity Group–serves as investment advisor for the fund. The board determined that continuing the fund’s internalized management structure was in the best interests of the fund and its shareholders.
The board based its decision upon an evaluation of the advisor’s investment staff, portfolio management process, and performance. The trustees considered the factors discussed below, among others. However, no single factor determined whether the board approved the arrangement. Rather, it was the totality of the circumstances that drove the board’s decision.
Nature, extent, and quality of services
The board considered the quality of the fund’s investment management since the fund’s inception in 2006, and took into account the organizational depth and stability of the advisor. The board noted that Vanguard has been managing investments for more than three decades. The Quantitative Equity Group adheres to a sound, disciplined investment management process; the team has considerable experience, stability, and depth.
The board concluded that the advisor’s experience, stability, depth, and performance, among other factors, warranted continuation of the advisory arrangement.
Investment performance
The board considered the fund’s performance since inception, including any periods of outperformance or underperformance of its target index and peer group. The board concluded that the fund has performed in line with expectations, and that the results have been consistent with the fund’s investment strategy. Information about the fund’s most recent performance can be found in the Performance Summary portion of this report.
Cost
The board concluded that the fund’s expense ratio was well below the average expense ratio charged by funds in its peer group. The board noted that the fund’s advisory expense ratio was also well below its peer-group average. Information about the fund’s expense ratio appears in the About Your Fund’s Expenses section of this report as well as in the Financial Statements section.
The board does not conduct a profitability analysis of Vanguard, because of Vanguard’s unique “at-cost” structure. Unlike most other mutual fund management companies, Vanguard is owned by the funds it oversees, and produces “profits” only in the form of reduced expenses for fund shareholders.
The benefit of economies of scale
The board concluded that the fund’s low-cost arrangement with Vanguard ensures that the fund will realize economies of scale as it grows, with the cost to shareholders declining as the fund’s assets increase.
The board will consider whether to renew the advisory arrangement again after a one-year period.
24
Glossary
30-Day SEC Yield. A fund’s 30-day SEC yield is derived using a formula specified by the U.S. Securities and Exchange Commission. Under the formula, data related to the fund’s security holdings in the previous 30 days are used to calculate the fund’s hypothetical net income for that period, which is then annualized and divided by the fund’s estimated average net assets over the calculation period. For the purposes of this calculation, a security’s income is based on its current market yield to maturity (in the case of bonds) or its projected dividend yield (for stocks). Because the SEC yield represents hypothetical annualized income, it will differ—at times significantly—from the fund’s actual experience. As a result, the fund’s income distributions may be higher or lower than implied by the SEC yield.
Earnings Growth Rate. The average annual rate of growth in earnings over the past five years for the stocks now in a fund.
Equity Exposure. A measure that reflects a fund’s investments in stocks and stock futures. Any holdings in short-term reserves are excluded.
Expense Ratio. The percentage of a fund’s average net assets used to pay its annual administrative and advisory expenses. These expenses directly reduce returns to investors.
Foreign Holdings. The percentage of a fund represented by stocks or depositary receipts of companies based outside the United States.
Inception Date. The date on which the assets of a fund (or one of its share classes) are first invested in accordance with the fund’s investment objective. For funds with a subscription period, the inception date is the day after that period ends. Investment performance is measured from the inception date.
Median Market Cap. An indicator of the size of companies in which a fund invests; the midpoint of market capitalization (market price x shares outstanding) of a fund’s stocks, weighted by the proportion of the fund’s assets invested in each stock. Stocks representing half of the fund’s assets have market capitalizations above the median, and the rest are below it.
Price/Book Ratio. The share price of a stock divided by its net worth, or book value, per share. For a fund, the weighted average price/book ratio of the stocks it holds.
Price/Earnings Ratio. The ratio of a stock’s current price to its per-share earnings over the past year. For a fund, the weighted average P/E of the stocks it holds. P/E is an indicator of market expectations about corporate prospects; the higher the P/E, the greater the expectations for a company’s future growth.
Return on Equity. The annual average rate of return generated by a company during the past five years for each dollar of shareholder’s equity (net income divided by shareholder’s equity). For a fund, the weighted average return on equity for the companies whose stocks it holds.
Short-Term Reserves. The percentage of a fund invested in highly liquid, short-term securities that can be readily converted to cash.
Turnover Rate. An indication of the fund’s trading activity. Funds with high turnover rates incur higher transaction costs and may be more likely to distribute capital gains (which may be taxable to investors). The turnover rate excludes in-kind transactions, which have minimal impact on costs.
25
This page intentionally left blank.
This page intentionally left blank.
The People Who Govern Your Fund
The trustees of your mutual fund are there to see that the fund is operated and managed in your best interests since, as a shareholder, you are a part owner of the fund. Your fund’s trustees also serve on the board of directors of The Vanguard Group, Inc., which is owned by the Vanguard funds and provides services to them on an at-cost basis.
A majority of Vanguard’s board members are independent, meaning that they have no affiliation with Vanguard or the funds they oversee, apart from the sizable personal investments they have made as private individuals. The independent board members have distinguished backgrounds in business, academia, and public service. Each of the trustees and executive officers oversees 157 Vanguard funds.
The following table provides information for each trustee and executive officer of the fund. More information about the trustees is in the Statement of Additional Information, which can be obtained, without charge, by contacting Vanguard at 800-662-7447, or online at www.vanguard.com.
Interested Trustees | Emerson U. Fullwood |
| Born 1948. Trustee Since January 2008. Principal |
| Occupation(s) During the Past Five Years: Retired |
| Executive Chief Staff and Marketing Officer for North |
John J. Brennan1 | America and Corporate Vice President of Xerox |
Born 1954. Trustee Since May 1987. Chairman of | Corporation (photocopiers and printers); Director of |
the Board. Principal Occupation(s) During the Past | SPX Corporation (multi-industry manufacturing), the |
Five Years: Chairman of the Board and Director/Trustee | United Way of Rochester, the Boy Scouts of America, |
of The Vanguard Group, Inc., and of each of the | Amerigroup Corporation (direct health and medical |
investment companies served by The Vanguard Group; | insurance carriers), and Monroe Community College |
Chief Executive Officer and President of The Vanguard | Foundation. |
Group and of each of the investment companies served | |
by The Vanguard Group (1996-2008); Chairman of | |
the Financial Accounting Foundation; Governor of | Rajiv L. Gupta |
the Financial Industry Regulatory Authority (FINRA); | Born 1945. Trustee Since December 2001.2 Principal |
Director of United Way of Southeastern Pennsylvania. | Occupation(s) During the Past Five Years: Retired |
| Chairman and Chief Executive Officer of Rohm and |
F. William McNabb III1 | Haas Co. (chemicals); President of Rohm and Haas Co. |
Born 1957. Trustee Since July 2009. Principal | (2006-2008); Board Member of American Chemistry |
Occupation(s) During the Past Five Years: Director of | Council; Director of Tyco International, Ltd. (diversified |
The Vanguard Group, Inc., since 2008; Chief Executive | manufacturing and services) and Hewlett-Packard Co. |
Officer and President of The Vanguard Group and of | (electronic computer manufacturing); Trustee of The |
each of the investment companies served by The | Conference Board. |
Vanguard Group since 2008; Director of Vanguard | |
Marketing Corporation; Managing Director of The | |
Vanguard Group (1995-2008). | Amy Gutmann |
| Born 1949. Trustee Since June 2006. Principal |
| Occupation(s) During the Past Five Years: President of |
Independent Trustees | the University of Pennsylvania; Christopher H. Browne |
| Distinguished Professor of Political Science in the School |
Charles D. Ellis | of Arts and Sciences with Secondary Appointments |
Born 1937. Trustee Since January 2001. Principal | at the Annenberg School for Communication and the |
Occupation(s) During the Past Five Years: Applecore | Graduate School of Education of the University of |
Partners (pro bono ventures in education); Senior | Pennsylvania; Director of Carnegie Corporation of |
Advisor to Greenwich Associates (international business | New York, Schuylkill River Development Corporation, |
strategy consulting); Successor Trustee of Yale University; | and Greater Philadelphia Chamber of Commerce; |
Overseer of the Stern School of Business at New York | Trustee of the National Constitution Center. |
University; Trustee of the Whitehead Institute for | |
Biomedical Research. | |
JoAnn Heffernan Heisen | Executive Officers |
Born 1950. Trustee Since July 1998. Principal | | |
Occupation(s) During the Past Five Years: Retired | | |
Corporate Vice President, Chief Global Diversity Officer, | Thomas J. Higgins1 |
and Member of the Executive Committee of Johnson | Born 1957. Chief Financial Officer Since September |
& Johnson (pharmaceuticals/consumer products); | 2008. Principal Occupation(s) During the Past Five |
Vice President and Chief Information Officer of Johnson | Years: Principal of The Vanguard Group, Inc.; Chief |
& Johnson (1997-2005); Director of the University | Financial Officer of each of the investment companies |
Medical Center at Princeton and Women’s Research | served by The Vanguard Group since 2008; Treasurer |
and Education Institute. | of each of the investment companies served by The |
| Vanguard Group (1998-2008). |
| | |
Andr F. Perold | | |
Born 1952. Trustee Since December 2004. Principal | Kathryn J. Hyatt1 | |
Occupation(s) During the Past Five Years: George Gund | Born 1955. Treasurer Since November 2008. Principal |
Professor of Finance and Banking, Harvard Business | Occupation(s) During the Past Five Years: Principal of |
School; Director and Chairman of UNX, Inc. (equities | The Vanguard Group, Inc.; Treasurer of each of the |
trading firm); Chair of the Investment Committee of | investment companies served by The Vanguard |
HighVista Strategies LLC (private investment firm). | Group since 2008; Assistant Treasurer of each of the |
| investment companies served by The Vanguard Group |
| (1988-2008). | |
Alfred M. Rankin, Jr. | | |
Born 1941. Trustee Since January 1993. Principal | | |
Occupation(s) During the Past Five Years: Chairman, | Heidi Stam1 | |
President, Chief Executive Officer, and Director of | Born 1956. Secretary Since July 2005. Principal |
NACCO Industries, Inc. (forklift trucks/housewares/ | Occupation(s) During the Past Five Years: Managing |
lignite); Director of Goodrich Corporation (industrial | Director of The Vanguard Group, Inc., since 2006; |
products/aircraft systems and services). | General Counsel of The Vanguard Group since 2005; |
| Secretary of The Vanguard Group and of each of the |
| investment companies served by The Vanguard Group |
Peter F. Volanakis | since 2005; Director and Senior Vice President of |
Born 1955. Trustee Since July 2009. Principal | Vanguard Marketing Corporation since 2005; Principal |
Occupation(s) During the Past Five Years: President | of The Vanguard Group (1997-2006). |
since 2007 and Chief Operating Officer since 2005 | | |
of Corning Incorporated (communications equipment); | | |
President of Corning Technologies (2001-2005); Director | Vanguard Senior Management Team |
of Corning Incorporated and Dow Corning; Trustee of | | |
the Corning Incorporated Foundation and the Corning | | |
Museum of Glass; Overseer of the Amos Tuck School | R. Gregory Barton | Michael S. Miller |
of Business Administration at Dartmouth College. | Mortimer J. Buckley | James M. Norris |
| Kathleen C. Gubanich | Glenn W. Reed |
| Paul A. Heller | George U. Sauter |
| | |
| Founder | |
| | |
| John C. Bogle | |
| Chairman and Chief Executive Officer, 1974-1996 |
|
|
1 These individuals are “interested persons” as defined in the Investment Company Act of 1940. |
2 December 2002 for Vanguard Equity Income Fund, Vanguard Growth Equity Fund, the Vanguard Municipal Bond |
Funds, and the Vanguard State Tax-Exempt Funds. |

P.O. Box 2600
Valley Forge, PA 19482-2600
Connect with Vanguard® > www.vanguard.com
Fund Information > 800-662-7447 | ���Dividend Achievers” is a trademark of Mergent, Inc., |
| and has been licensed for use by The Vanguard Group, |
Direct Investor Account Services > 800-662-2739 | Inc. Vanguard mutual funds are not sponsored, |
| endorsed, sold, or promoted by Mergent, and Mergent |
Institutional Investor Services > 800-523-1036 | makes no representation regarding the advisability of |
| investing in the funds. |
Text Telephone for People | |
With Hearing Impairment > 800-952-3335 | |
| |
This material may be used in conjunction | |
with the offering of shares of any Vanguard | |
fund only if preceded or accompanied by | |
the fund’s current prospectus. | |
| |
All comparative mutual fund data are from Lipper Inc. or | |
Morningstar, Inc., unless otherwise noted. | |
| |
You can obtain a free copy of Vanguard’s proxy voting | |
guidelines by visiting our website, www.vanguard.com, | |
and searching for “proxy voting guidelines,” or by calling | |
Vanguard at 800-662-2739. The guidelines are also | |
available from the SEC’s website, www.sec.gov. In | |
addition, you may obtain a free report on how your fund | |
voted the proxies for securities it owned during the 12 | |
months ended June 30. To get the report, visit either | |
www.vanguard.com or www.sec.gov. | |
| |
You can review and copy information about your fund at | |
the SEC’s Public Reference Room in Washington, D.C. To | |
find out more about this public service, call the SEC at | |
202-551-8090. Information about your fund is also | |
available on the SEC’s website, and you can receive | |
copies of this information, for a fee, by sending a | |
request in either of two ways: via e-mail addressed to | |
publicinfo@sec.gov or via regular mail addressed to the | © 2009 The Vanguard Group, Inc. |
Public Reference Section, Securities and Exchange | All rights reserved. |
Commission, Washington, DC 20549-0102. | Vanguard Marketing Corporation, Distributor. |
| |
| Q6022 092009 |
Item 2: Not Applicable.
Item 3: Not Applicable.
Item 4: Not Applicable.
Item 5: Not Applicable.
Item 6: Not Applicable.
Item 7: Not Applicable.
Item 8: Not Applicable.
Item 9: Not Applicable.
Item 10: Not Applicable.
Item 11: Controls and Procedures.
(a) Disclosure Controls and Procedures. The Principal Executive and Financial Officers concluded that the Registrant's Disclosure Controls and Procedures are effective based on their evaluation of the Disclosure Controls and Procedures as of a date within 90 days of the filing date of this report.
(b) Internal Control Over Financial Reporting. There were no significant changes in Registrant’s Internal Control Over Financial Reporting or in other factors that could significantly affect this control subsequent to the date of the evaluation, including any corrective actions with regard to significant deficiencies and material weaknesses.
Item 12: Exhibits.
Pursuant to the requirements of the Securities Exchange Act of 1934 and the Investment Company Act of 1940, the registrant has duly caused this report to be signed on its behalf by the undersigned, thereunto duly authorized.
| VANGUARD SPECIALIZED FUNDS |
| |
By: | /s/ F. WILLIAM MCNABB III* |
| F. WILLIAM MCNABB III |
| CHIEF EXECUTIVE OFFICER |
| |
Date: September 18, 2009 |
Pursuant to the requirements of the Securities Exchange Act of 1934 and the Investment Company Act of 1940, this report has been signed below by the following persons on behalf of the registrant and in the capacities and on the dates indicated.
| VANGUARD SPECIALIZED FUNDS |
| |
By: | /s/ F. WILLIAM MCNABB III* |
| F. WILLIAM MCNABB III |
| CHIEF EXECUTIVE OFFICER |
| |
Date: September 18, 2009 |
| VANGUARD SPECIALIZED FUNDS |
| |
By: | /s/ THOMAS J. HIGGINS* |
| THOMAS J. HIGGINS |
| CHIEF FINANCIAL OFFICER |
| |
Date: September 18, 2009 |
* By: /s/ Heidi Stam
Heidi Stam, pursuant to a Power of Attorney filed on July 24, 2009, see file Number
2-88373, Incorporated by Reference.