UNITED STATES
SECURITIES AND EXCHANGE COMMISSION
Washington, D.C. 20549
FORM N-CSR
CERTIFIED SHAREHOLDER REPORT OF REGISTERED MANAGEMENT
INVESTMENT COMPANIES
Investment Company Act file number | 811-03940 |
| |
| Strategic Funds, Inc. | |
| (Exact name of Registrant as specified in charter) | |
| | |
| c/o The Dreyfus Corporation 200 Park Avenue New York, New York 10166 | |
| (Address of principal executive offices) (Zip code) | |
| | |
| Bennett A. MacDougall, Esq. 200 Park Avenue New York, New York 10166 | |
| (Name and address of agent for service) | |
|
Registrant's telephone number, including area code: | (212) 922-6400 |
| |
Date of fiscal year end: | 11/30 | |
Date of reporting period: | 11/30/18 | |
| | | | | | | |
The following N-CSR relates only to the Registrant's series listed below and does not relate to any series of the Registrant with a different fiscal year end and, therefore, different N-CSR reporting requirements. A separate N-CSR will be filed for any series with a different fiscal year end, as appropriate.
Dreyfus Select Managers Small Cap Value Fund
Dreyfus U.S. Equity Fund
Global Stock Fund
International Stock Fund
FORM N-CSR
Item 1. Reports to Stockholders.
Dreyfus Select Managers Small Cap Value Fund
| | | |

| | ANNUAL REPORT November 30, 2018 |
| |
Save time. Save paper. View your next shareholder report online as soon as it’s available. Log into www.dreyfus.com and sign up for Dreyfus eCommunications. It’s simple and only takes a few minutes. |
| |
The views expressed in this report reflect those of the portfolio manager(s) only through the end of the period covered and do not necessarily represent the views of Dreyfus or any other person in the Dreyfus organization. Any such views are subject to change at any time based upon market or other conditions and Dreyfus disclaims any responsibility to update such views. These views may not be relied on as investment advice and, because investment decisions for a Dreyfus fund are based on numerous factors, may not be relied on as an indication of trading intent on behalf of any Dreyfus fund. |
| |
Not FDIC-Insured • Not Bank-Guaranteed • May Lose Value |
Contents
T H E F U N D
F O R M O R E I N F O R M AT I O N
Back Cover
| | | | |
| |
Dreyfus Select Managers Small Cap Value Fund
| | The Fund |
A LETTER FROM THE PRESIDENT OF DREYFUS
Dear Shareholder:
We are pleased to present this annual report for Dreyfus Select Managers Small Cap Value Fund, covering the 12-month period from December 1, 2017 through November 30, 2018. For information about how the fund performed during the reporting period, as well as general market perspectives, we provide a Discussion of Fund Performance on the pages that follow.
The reporting period began with major global economies achieving above-trend growth. In the United States, a robust economy and strong labor markets encouraged the Federal Reserve to continue moving away from its accommodative monetary policy while other major central banks also began to consider monetary tightening. In the equity sphere, both U.S. and non-U.S. markets remained on an uptrend, though investor concerns about U.S. inflation and its effect on interest rates later began to weigh on global returns. Interest rates rose across the yield curve, putting pressure on bond prices.
Later in the reporting period, global growth trends began to diverge and market volatility returned. While the U.S. economy continued to grow at a healthy rate, Japan rebounded, but only briefly, from a weak first quarter, and the Eurozone economy began to moderate. Robust growth and strong corporate earnings continued to support U.S. stocks while other developed markets declined. Late in the reporting period, a broad sell-off occurred, partially offsetting earlier U.S. gains. Emerging markets remained under pressure as weakness in their currencies relative to the U.S. dollar added to investors’ uneasiness.
Fixed income markets continued to struggle as interest rates rose; the yield on the benchmark 10-year Treasury bond breached 3.2% despite only moderate inflation, but investor concerns about slowing global growth brought yields down toward the end of the reporting period.
Despite continuing doubts regarding trade, U.S. inflationary pressures and global growth, we are optimistic that the U.S. economy will remain strong in the near term. However, we remain attentive to signs that indicate potential changes on the horizon. As always, we encourage you to discuss the risks and opportunities in today’s investment environment with your financial advisor.
Thank you for your continued confidence and support.
Sincerely,

Renee Laroche-Morris
President
The Dreyfus Corporation
December 17, 2018
2
DISCUSSION OF FUND PERFORMANCE(Unaudited)
For the period from December 1, 2017 through November 30, 2018, as provided by portfolio allocation managers Stephen Kolano and Elena Goncharova of Bank of New York Mellon Investment Strategy and Solutions Group.
Market and Fund Performance Overview
For the 12-month period ended November 30, 2018, Dreyfus Select Managers Small Cap Value Fund’s Class A, Class C, Class I, and Class Y shares at NAV produced total returns of -3.93%, -4.65%, -3.63%, and -3.56%, respectively.1 In comparison, the Russell 2000® Value Index (the “Index”), the fund’s benchmark, returned -1.83% for the same period.2
Small-cap stocks produced moderate losses over the reporting period amid pressure from trade disputes and slowing global economic growth rates. The fund lagged the Index, due to security selection and sector allocation shortfalls.
As of November 7, 2018, Stephen Kolano and Elena Goncharova became the portfolio allocation managers for the fund.
The Fund’s Investment Approach
The fund seeks capital appreciation. To pursue its goal, the fund normally invests at least 80% of its net assets in the stocks of small-cap companies. The fund currently considers small-cap companies to be those companies with market capitalizations that fall within the range of companies in the Index, the fund’s benchmark index. The fund’s portfolio is constructed so as to have a value tilt. The fund uses a “multi-manager” approach by selecting various subadvisers to manage its assets.
The fund’s assets are currently allocated to six subadvisers, each acting independently and using its own methodology to select portfolio investments. As of the end of the reporting period, approximately 2% of the fund’s assets were under the management of Thompson, Siegel, and Walmsley LLC, which employs a combination of quantitative and qualitative security selection methods based on a proprietary four-factor valuation model; approximately 24% of the fund’s assets were under the management of Walthausen & Co., LLC, which uses a proprietary valuation model to identify companies that are trading at a discount to their intrinsic values; approximately 16% of the fund’s assets were under the management of Neuberger Berman Investment Advisers LLC, which uses fundamental analysis and a bottom-up stock selection process to identify publicly traded small-cap companies selling at a material discount to their intrinsic value; approximately 17% of the fund’s assets were under the management of Kayne Anderson Rudnick Investment Management, LLC, which employs a fundamental, bottom-up, research-driven investment process seeking to identify high-quality companies whose securities are trading at attractive valuations; approximately 24% of the fund’s assets were under the management of Channing Capital Management, LLC, which employs intensive, fundamental, bottom-up research to identify high-quality companies that represent value opportunities; and approximately 17% of the fund’s assets were allocated to Eastern Shore Capital Management, which focuses on identifying companies with quality fundamentals that are trading at attractive valuations. The percentages of the fund’s assets allocated to the various subadvisers can change over time within ranges described in the prospectus.
3
DISCUSSION OF FUND PERFORMANCE(Unaudited) (continued)
Positive Economic Trends in the Face of Rising Volatility
A positive economic backdrop supported U.S. equity markets in late 2017, including sustained GDP growth, robust labor markets and higher growth forecasts from the Federal Reserve Board (the “Fed”) for 2018. Passage of tax-reform legislation in December 2017 sparked additional market gains, driving the Index to a new all-time high in January 2018. Some of the more economically sensitive market segments, such as the information technology and financials sectors, led the market’s advance at the time.
In the first few months of 2018, volatility entered the picture as concerns over inflation and the potential for trade disputes roiled markets. However, U.S. markets were able to stabilize, and the upward trend continued, on the back of continued positive economic data, corporate balance sheet strength and robust consumer spending. Non-U.S. markets, however, slowed as the rate of economic improvement in areas such as the Eurozone stalled. In late summer, continued political rhetoric in the U.S. regarding trade and midterm elections, and concerns over issues abroad in areas such as Italy, Turkey, Argentina and the United Kingdom weighed on investor sentiment. Despite strong underlying fundamentals, volatility crept back into the picture in U.S. markets. Tight labor markets, tightening monetary policy and the possibility of slowing growth provoked a defensive sentiment among investors. In October, markets reversed and started to move lower. Continued worries over rising interest rates, trade disputes, and falling commodity prices pressured equity markets throughout the rest of the period.
In this environment, small-cap stocks produced lower returns than their large-cap counterparts but outperformed in parts of the mid-cap space.
Security Selection Constrained Fund Performance
The fund’s performance was dampened by stock selection and sector allocation decisions made by the fund’s underlying portfolio managers. In the consumer discretionary sector, recreational vehicle maker Thor Industries struggled with an industrywide sales slowdown and higher steel and aluminum input costs. An underweight to the outperforming, defensive utilities sector also weighed on results. In financials, banks and asset managers were generally hurt by the rising interest-rate and flattening yield-curve environment. Artisan Partners Asset Management and Stifel Financial were among the top detractors for the period. A position inHawaiian Holdings, owner of Hawaiian Air, also detracted due to low bookings which affected earnings results. Elsewhere in the industrials sector, an underweight to the research and consulting services space weighed on relative returns. A lack of exposure to energy company Renewable Energy Group, which performed well during the period, also detracted.
Conversely, the fund fared better in other areas. An overweight position and stock selection within the information technology sector were beneficial. Positioning within the software and services and IT consulting industries was particularly helpful. Owning Booz Allen Hamilton Holding contributed significantly to relative results. In consumer staples, an overweight to the sector as well as successful stock choices, such as a position in household products company WD-40, boosted returns. In health care, a position in Molina Healthcare bolstered relative returns as the stock outperformed the broader market.
4
A Cautious Yet Optimistic Outlook
We anticipate a continued strong economic backdrop featuring low unemployment and tight labor markets. Global growth remains stable, and monetary policies are still historically accommodative. If the U.S. Federal Reserve proceeds to tighten monetary policy in the U.S., the economic growth rate may slow and the market will reprice given the new growth prospects. However, we expect that fundamentals will remain strong, and we believe companies can continue to benefit from the solid economic backdrop.
We will continue to monitor policy shifts and moderating growth expectations, which may influence the market and companies. Cyclical sectors such as materials, industrials and financials may be affected by a shift to a more defensive positioning by investors. We may reduce exposure to vulnerable areas of the market as warranted by conditions.
December 17, 2018
1 Total return includes reinvestment of dividends and any capital gains paid, and does not take into consideration the maximum initial sales charge in the case of Class A shares, or the applicable contingent deferred sales charge imposed on redemptions in the case of Class C shares. Had these charges been reflected, returns would have been lower. Past performance is no guarantee of future results. Share price and investment return fluctuate such that upon redemption, fund shares may be worth more or less than their original cost. Return figures provided reflect the absorption of certain fund expenses by The Dreyfus Corporation pursuant to an undertaking in effect through March 29, 2019, at which time it may be extended, terminated, or modified. Had these expenses not been absorbed, the fund’s returns would have been lower.
2 Source: Lipper Inc. — The Russell 2000® Value Index measures the performance of the small-cap value segment of the U.S. equity universe. It includes those Russell 2000 companies that are considered more value-oriented relative to the overall market as defined by Russell’s leading style methodology. The Russell 2000® Value Index is constructed to provide a comprehensive and unbiased barometer for the small-cap value segment. The index is completely reconstituted annually to ensure larger stocks do not distort the performance and characteristics of the true small-cap opportunity set and that the represented companies continue to reflect value characteristics. Investors cannot invest directly in any index.
Please note: the position in any security highlighted with italicized typeface was sold during the reporting period.
Equities are subject generally to market, market sector, market liquidity, issuer, and investment style risks, among other factors, to varying degrees, all of which are more fully described in the fund’s prospectus.
The prices of small company stocks tend to be more volatile than the prices of large company stocks, mainly because these companies have less established and more volatile earnings histories. They also tend to be less liquid than larger company stocks.
5
FUND PERFORMANCE(Unaudited)

Comparison of change in value of $10,000 investment in Dreyfus Select Managers Small Cap Value Fund Class A shares, Class C shares, Class I shares and Class Y shares and the Russell 2000® Value Index (the “Index”)
† Source: Lipper Inc.
†† The total return figures presented for Class Y shares of the fund reflect the performance of the fund’s Class A shares for the period prior to 7/1/13 (the inception date for Class Y shares), not reflecting the applicable sales charges for Class A shares.
Past performance is not predictive of future performance.
The above graph compares a $10,000 investment made in each of the Class A, Class C, Class I and Class Y shares of Dreyfus Select Managers Small Cap Value Fund on 12/17/08 (inception date) to a $10,000 investment made in the Index on that date. All dividends and capital gain distributions are reinvested.
The fund’s performance shown in the line graph above takes into account the maximum initial sales charge on Class A shares and all other applicable fees and expenses on all classes. The Index measures the performance of the small-cap value segment of the U.S. equity universe. It includes those Russell 2000 companies that are considered more value-oriented relative to the overall market as defined by Russell’s leading style methodology. The Index is constructed to provide a comprehensive and unbiased barometer for the small-cap value segment. The Index is completely reconstituted annually to ensure larger stocks do not distort the performance and characteristics of the true small-cap opportunity set and that the represented companies continue to reflect value characteristics. Unlike a mutual fund, the Index is not subject to charges, fees and other expenses. Investors cannot invest directly in any index. Further information relating to fund performance, including expense reimbursements, if applicable, is contained in the Financial Highlights section of the prospectus and elsewhere in this report.
6
| | | | | |
Average Annual Total Returns as of11/30/18 |
| | Inception | | | From |
| Date | 1 Year | 5 Years | Inception |
Class A shares | | | | |
with maximum sales charge (5.75%) | 12/17/08 | -9.45% | 3.88% | 12.04% |
without sales charge | 12/17/08 | -3.93% | 5.12% | 12.71% |
Class C shares | | | | |
with applicable redemption charge† | 12/17/08 | -5.54% | 4.35% | 11.89% |
without redemption | 12/17/08 | -4.65% | 4.35% | 11.89% |
Class I shares | 12/17/08 | -3.63% | 5.45% | 13.08% |
Class Y shares | 7/1/13 | -3.56% | 5.49% | 13.04%†† |
Russell 2000® Value Index | 12/31/08 | -1.83% | 6.71% | 12.50%††† |
† The maximum contingent deferred sales charge for Class C shares is 1% for shares redeemed within one year of the date of purchase.
†† The total return performance figures presented for Class Y shares of the fund reflect the performance of the fund’s Class A shares for the period prior to 7/1/13 (the inception date for Class Y shares), not reflecting the applicable sales charges for Class A shares.
††† For comparative purposes, the value of the Index as of 12/31/08 is used as the beginning value on 12/17/08.
The performance data quoted represents past performance, which is no guarantee of future results. Share price and investment return fluctuate and an investor’s shares may be worth more or less than original cost upon redemption. Current performance may be lower or higher than the performance quoted. Go to Dreyfus.com for the fund’s most recent month-end returns.
The fund’s performance shown in the graph and table does not reflect the deduction of taxes that a shareholder would pay on fund distributions or the redemption of fund shares. In addition to the performance of Class A shares shown with and without a maximum sales charge, the fund’s performance shown in the table takes into account all other applicable fees and expenses on all classes.
7
UNDERSTANDING YOUR FUND’S EXPENSES(Unaudited)
As a mutual fund investor, you pay ongoing expenses, such as management fees and other expenses. Using the information below, you can estimate how these expenses affect your investment and compare them with the expenses of other funds. You also may pay one-time transaction expenses, including sales charges (loads) and redemption fees, which are not shown in this section and would have resulted in higher total expenses. For more information, see your fund’s prospectus or talk to your financial adviser.
Review your fund’s expenses
The table below shows the expenses you would have paid on a $1,000 investment in Dreyfus Select Managers Small Cap Value Fund from June 1, 2018 to November 30, 2018. It also shows how much a $1,000 investment would be worth at the close of the period, assuming actual returns and expenses.
| | | | | | | | | |
Expenses and Value of a $1,000 Investment | | |
assuming actual returns for the six months ended November 30, 2018 |
| | Class A | Class C | Class I | Class Y |
Expenses paid per $1,000† | | $6.37 | | $10.02 | | $4.75 | | $4.56 |
Ending value (after expenses) | | $953.40 | | $949.70 | | $955.00 | | $955.40 |
COMPARING YOUR FUND’S EXPENSES
WITH THOSE OF OTHER FUNDS(Unaudited)
Using the SEC’s method to compare expenses
The Securities and Exchange Commission (“SEC”) has established guidelines to help investors assess fund expenses. Per these guidelines, the table below shows your fund’s expenses based on a $1,000 investment, assuming a hypothetical 5% annualized return. You can use this information to compare the ongoing expenses (but not transaction expenses or total cost) of investing in the fund with those of other funds. All mutual fund shareholder reports will provide this information to help you make this comparison. Please note that you cannot use this information to estimate your actual ending account balance and expenses paid during the period.
| | | | | | | | | | | |
Expenses and Value of a $1,000 Investment | | |
assuming a hypothetical 5% annualized return for the six months ended November 30, 2018 |
| | Class A | Class C | Class I | Class Y |
Expenses paid per $1,000† | | $6.58 | | $10.35 | | $4.91 | | $4.71 |
Ending value (after expenses) | | $1,018.55 | | $1,014.79 | | $1,020.21 | | $1,020.41 |
† Expenses are equal to the fund’s annualized expense ratio of 1.30% for Class A, 2.05% for Class C, .97% for Class I and .93% for Class Y, multiplied by the average account value over the period, multiplied by 183/365 (to reflect the one-half year period).
8
STATEMENT OF INVESTMENTS
November 30, 2018
| | | | | | | | |
| |
Description | | | | Shares | | Value ($) | |
Common Stocks - 95.2% | | | | | |
Automobiles & Components - 1.4% | | | | | |
Dorman Products | | | | 22,185 | a,b | 1,949,174 | |
LCI Industries | | | | 39,450 | a | 3,052,641 | |
Motorcar Parts of America | | | | 6,300 | a,b | 113,085 | |
Stoneridge | | | | 57,000 | b | 1,524,750 | |
Thor Industries | | | | 50,400 | a | 3,417,624 | |
Visteon | | | | 17,115 | a,b | 1,263,429 | |
| | | | | 11,320,703 | |
Banks - 11.8% | | | | | |
Axos Financial | | | | 4,700 | a,b | 146,640 | |
Bancorp | | | | 23,300 | b | 231,835 | |
Bank of Hawaii | | | | 79,550 | a | 6,344,112 | |
BankUnited | | | | 39,670 | | 1,370,202 | |
Banner | | | | 89,626 | | 5,377,560 | |
Brookline Bancorp | | | | 146,740 | | 2,271,535 | |
Bryn Mawr Bank | | | | 33,720 | | 1,325,870 | |
Camden National | | | | 17,690 | | 731,482 | |
Centerstate Banks | | | | 322,434 | | 8,064,074 | |
City Holding | | | | 21,930 | a | 1,682,689 | |
Columbia Banking System | | | | 97,690 | | 3,974,029 | |
Commerce Bancshares | | | | 27,419 | a | 1,727,923 | |
Community Bank System | | | | 23,375 | a | 1,534,803 | |
Customers Bancorp | | | | 8,490 | b | 165,640 | |
CVB Financial | | | | 72,780 | a | 1,691,407 | |
Eagle Bancorp | | | | 51,025 | a,b | 2,941,081 | |
Essent Group | | | | 74,165 | b | 2,859,802 | |
First Bancorp | | | | 5,175 | | 207,104 | |
First Busey | | | | 7,350 | | 210,872 | |
First Financial | | | | 24,830 | | 1,159,313 | |
First Financial Bancorp | | | | 39,510 | | 1,103,119 | |
First Financial Bankshares | | | | 72,080 | a | 4,722,682 | |
First Foundation | | | | 9,100 | b | 145,691 | |
Great Southern Bancorp | | | | 29,830 | | 1,619,172 | |
Heartland Financial USA | | | | 19,860 | a | 1,086,342 | |
HomeStreet | | | | 6,300 | b | 167,706 | |
Huntington Bancshares | | | | 90,580 | | 1,321,562 | |
Independent Bank | | | | 37,080 | | 2,980,120 | |
Investors Bancorp | | | | 13,300 | | 163,324 | |
Lakeland Financial | | | | 31,450 | a | 1,456,135 | |
Mr Cooper Group | | | | 9,833 | b | 148,773 | |
NBT Bancorp | | | | 29,070 | a | 1,132,858 | |
OceanFirst Financial | | | | 55,040 | | 1,418,381 | |
9
STATEMENT OF INVESTMENTS (continued)
| | | | | | | | |
| |
Description | | | | Shares | | Value ($) | |
Common Stocks - 95.2% (continued) | | | | | |
Banks - 11.8% (continued) | | | | | |
Pacific Premier Bancorp | | | | 136,046 | b | 4,199,740 | |
Pinnacle Financial Partners | | | | 11,662 | | 668,816 | |
Provident Financial Services | | | | 69,090 | | 1,774,231 | |
Radian Group | | | | 9,700 | | 178,480 | |
Renasant | | | | 131,900 | | 4,820,945 | |
Republic First Bancorp | | | | 20,000 | b | 151,000 | |
Simmons First National, Cl. A | | | | 8,800 | a | 258,720 | |
South State | | | | 65,300 | | 4,738,168 | |
Southside Bancshares | | | | 45,563 | a | 1,555,065 | |
Stock Yards Bancorp | | | | 40,235 | | 1,261,367 | |
TCF Financial | | | | 98,850 | | 2,223,136 | |
Texas Capital Bancshares | | | | 73,997 | b | 4,414,661 | |
TriCo Bancshares | | | | 44,270 | | 1,702,182 | |
Triumph Bancorp | | | | 75,749 | b | 2,899,672 | |
Union Bankshares | | | | 81,135 | | 2,872,179 | |
| | | | | 95,202,200 | |
Capital Goods - 15.6% | | | | | |
Actuant, Cl. A | | | | 56,585 | a | 1,448,576 | |
Alamo Group | | | | 790 | | 65,420 | |
Albany International | | | | 36,130 | | 2,614,367 | |
Allied Motion Technologies | | | | 29,688 | | 1,404,539 | |
Apogee Enterprises | | | | 4,400 | a | 160,380 | |
Arcosa | | | | 3,200 | b | 87,488 | |
Atkore International Group | | | | 53,585 | b | 1,094,206 | |
Babcock & Wilcox Enterprises | | | | 430,919 | b | 381,622 | |
BMC Stock Holdings | | | | 50,060 | b | 851,521 | |
Columbus McKinnon | | | | 33,410 | | 1,162,668 | |
Comfort Systems USA | | | | 2,700 | | 142,182 | |
Dycom Industries | | | | 2,200 | a,b | 145,772 | |
EMCOR Group | | | | 24,780 | | 1,805,471 | |
EnerSys | | | | 21,715 | | 1,897,240 | |
EnPro Industries | | | | 15,000 | | 1,055,700 | |
Esterline Technologies | | | | 16,650 | b | 1,976,854 | |
Franklin Electric | | | | 134,965 | | 6,107,166 | |
FreightCar America | | | | 61,860 | a,b | 590,144 | |
GATX | | | | 21,010 | a | 1,754,545 | |
Global Brass & Copper Holdings | | | | 51,200 | | 1,657,344 | |
Graco | | | | 96,750 | | 4,261,837 | |
Granite Construction | | | | 34,280 | a | 1,735,596 | |
Great Lakes Dredge and Dock | | | | 328,520 | a,b | 2,434,333 | |
Harsco | | | | 41,900 | b | 1,120,825 | |
Hexcel | | | | 89,910 | | 5,544,750 | |
Hillenbrand | | | | 113,937 | | 5,048,548 | |
10
| | | | | | | | |
| |
Description | | | | Shares | | Value ($) | |
Common Stocks - 95.2% (continued) | | | | | |
Capital Goods - 15.6% (continued) | | | | | |
Houston Wire & Cable | | | | 54,100 | b | 330,010 | |
ITT | | | | 54,750 | | 3,035,888 | |
JELD-WEN Holding | | | | 76,062 | a,b | 1,449,742 | |
Kadant | | | | 7,605 | | 692,663 | |
KBR | | | | 112,340 | | 2,086,154 | |
Kennametal | | | | 46,905 | | 1,961,567 | |
KEYW Holding | | | | 166,130 | a,b | 1,623,090 | |
Lincoln Electric Holdings | | | | 31,920 | | 2,743,524 | |
Lydall | | | | 31,500 | b | 697,095 | |
Manitowoc Company | | | | 30,912 | a,b | 610,512 | |
Masonite International | | | | 28,960 | b | 1,554,283 | |
Mercury Systems | | | | 28,790 | a,b | 1,491,610 | |
Milacron Holdings | | | | 426,902 | b | 6,083,353 | |
Miller Industries | | | | 38,580 | | 1,082,555 | |
Moog, Cl. A | | | | 19,600 | | 1,714,020 | |
MRC Global | | | | 11,438 | a,b | 179,920 | |
Mueller Industries | | | | 53,380 | | 1,271,512 | |
Mueller Water Products, Cl. A | | | | 97,440 | | 1,026,043 | |
NCI Building Systems | | | | 15,700 | b | 178,195 | |
Oshkosh | | | | 26,040 | | 1,857,433 | |
Proto Labs | | | | 15,215 | b | 1,958,018 | |
RBC Bearings | | | | 54,125 | b | 8,282,208 | |
Regal Beloit | | | | 20,070 | | 1,569,073 | |
Rexnord | | | | 230,412 | b | 6,522,964 | |
Simpson Manufacturing | | | | 22,500 | a | 1,316,250 | |
SiteOne Landscape Supply | | | | 95,050 | a,b | 5,858,882 | |
Spirit AeroSystems Holdings, Cl. A | | | | 31,710 | | 2,596,415 | |
Standex International | | | | 39,735 | | 3,166,880 | |
Teledyne Technologies | | | | 6,540 | b | 1,468,753 | |
Textainer Group Holdings | | | | 8,400 | a,b | 93,660 | |
TPI Composites | | | | 5,500 | a,b | 149,545 | |
Triton International | | | | 59,790 | a | 2,037,643 | |
Triumph Group | | | | 174,620 | a | 2,935,362 | |
Tutor Perini | | | | 91,620 | a,b | 1,705,048 | |
Twin Disc | | | | 57,470 | b | 1,002,852 | |
Valmont Industries | | | | 7,600 | | 992,104 | |
Watsco | | | | 33,140 | | 5,093,618 | |
Welbilt | | | | 62,435 | b | 862,852 | |
| | | | | 125,830,390 | |
Commercial & Professional Services - 4.0% | | | | | |
ABM Industries | | | | 51,510 | | 1,631,837 | |
ASGN | | | | 17,750 | b | 1,229,188 | |
Casella Waste Systems | | | | 3,400 | b | 111,010 | |
11
STATEMENT OF INVESTMENTS (continued)
| | | | | | | | |
| |
Description | | | | Shares | | Value ($) | |
Common Stocks - 95.2% (continued) | | | | | |
Commercial & Professional Services - 4.0% (continued) | | | | | |
Clean Harbors | | | | 33,000 | b | 2,129,490 | |
Covanta Holding | | | | 102,140 | a | 1,691,438 | |
Heritage-Crystal Clean | | | | 83,060 | b | 2,326,511 | |
Interface | | | | 78,920 | | 1,278,504 | |
Kelly Services, Cl. A | | | | 76,340 | | 1,749,713 | |
Kimball International | | | | 56,170 | | 857,154 | |
Korn/Ferry International | | | | 45,005 | | 2,203,895 | |
McGrath RentCorp | | | | 57,490 | | 3,071,691 | |
MSA Safety | | | | 58,378 | | 6,362,618 | |
Quad/Graphics | | | | 120,500 | a | 1,973,790 | |
SP Plus | | | | 5,900 | b | 178,829 | |
Stericycle | | | | 30,700 | b | 1,475,749 | |
UniFirst | | | | 8,800 | | 1,358,808 | |
US Ecology | | | | 31,377 | | 2,186,036 | |
| | | | | 31,816,261 | |
Consumer Durables & Apparel - 2.1% | | | | | |
Bassett Furniture Industries | | | | 21,390 | | 449,832 | |
Crocs | | | | 26,970 | b | 749,766 | |
CSS Industries | | | | 39,510 | | 428,288 | |
G-III Apparel Group | | | | 108,822 | a,b | 4,361,586 | |
M.D.C. Holdings | | | | 50,372 | a | 1,483,455 | |
M/I Homes | | | | 86,990 | b | 2,047,745 | |
Malibu Boats, Cl. A | | | | 24,405 | b | 1,181,690 | |
Oxford Industries | | | | 2,400 | a | 192,936 | |
Steven Madden | | | | 75,875 | | 2,445,451 | |
Tempur Sealy International | | | | 26,200 | b | 1,335,676 | |
TRI Pointe Group | | | | 11,900 | a,b | 148,512 | |
Unifi | | | | 57,820 | b | 1,605,661 | |
ZAGG | | | | 17,900 | a,b | 179,895 | |
| | | | | 16,610,493 | |
Consumer Services - 1.5% | | | | | |
Bloomin' Brands | | | | 15,000 | | 293,250 | |
Cheesecake Factory | | | | 133,700 | a | 6,309,303 | |
Houghton Mifflin Harcourt | | | | 19,100 | b | 190,045 | |
Penn National Gaming | | | | 88,843 | a,b | 1,964,319 | |
SeaWorld Entertainment | | | | 115,190 | b | 3,280,611 | |
The Stars Group | | | | 9,100 | b | 179,907 | |
| | | | | 12,217,435 | |
Diversified Financials - 3.3% | | | | | |
Artisan Partners Asset Management, Cl. A | | | | 285,391 | | 7,771,197 | |
Cowen Group, Cl. A | | | | 12,750 | b | 202,853 | |
Evercore Partners, Cl. A | | | | 55,406 | | 4,574,319 | |
12
| | | | | | | | |
| |
Description | | | | Shares | | Value ($) | |
Common Stocks - 95.2% (continued) | | | | | |
Diversified Financials - 3.3% (continued) | | | | | |
FirstCash | | | | 1,800 | | 160,290 | |
Green Dot, Cl. A | | | | 46,290 | b | 3,857,809 | |
Houlihan Lokey | | | | 86,650 | | 3,665,295 | |
Stifel Financial | | | | 125,110 | a | 6,039,059 | |
| | | | | 26,270,822 | |
Energy - 3.8% | | | | | |
Basic Energy Services | | | | 10,500 | b | 65,940 | |
Cactus | | | | 33,910 | | 979,321 | |
Callon Petroleum | | | | 744,250 | a,b | 6,363,338 | |
Core Laboratories | | | | 45,930 | a | 3,817,242 | |
Delek US Holdings | | | | 3,500 | a | 139,265 | |
Dril-Quip | | | | 17,900 | a,b | 702,754 | |
Forum Energy Technologies | | | | 62,500 | a,b | 418,125 | |
Gulfport Energy | | | | 158,570 | a,b | 1,351,016 | |
Halcon Resources | | | | 406,200 | a,b | 1,137,360 | |
ION Geophysical | | | | 28,824 | b | 255,092 | |
Laredo Petroleum | | | | 18,900 | a,b | 82,593 | |
McDermott International | | | | 48,706 | a,b | 424,229 | |
Oasis Petroleum | | | | 166,710 | a,b | 1,190,309 | |
Oil States International | | | | 233,869 | a,b | 5,243,343 | |
Patterson-UTI Energy | | | | 39,700 | | 551,036 | |
PDC Energy | | | | 14,580 | a,b | 494,845 | |
ProPetro Holding | | | | 78,285 | a,b | 1,269,783 | |
QEP Resources | | | | 138,190 | b | 1,109,666 | |
Ring Energy | | | | 14,400 | a,b | 100,656 | |
SilverBow Resources | | | | 28,470 | b | 696,661 | |
SM Energy | | | | 73,650 | a | 1,502,460 | |
Southwestern Energy | | | | 267,970 | a,b | 1,291,615 | |
Superior Energy Services | | | | 80,300 | b | 437,635 | |
TETRA Technologies | | | | 168,290 | b | 390,433 | |
Whiting Petroleum | | | | 29,080 | a,b | 880,252 | |
| | | | | 30,894,969 | |
Food & Staples Retailing - .4% | | | | | |
Andersons/The | | | | 48,480 | | 1,602,749 | |
Casey's General Stores | | | | 12,880 | a | 1,667,574 | |
| | | | | 3,270,323 | |
Food, Beverage & Tobacco - 3.3% | | | | | |
B&G Foods | | | | 9,300 | a | 282,069 | |
Calavo Growers | | | | 22,185 | a | 2,180,342 | |
Darling Ingredients | | | | 189,070 | b | 4,136,852 | |
Hain Celestial Group | | | | 63,290 | b | 1,310,103 | |
Landec | | | | 122,820 | b | 1,892,656 | |
MGP Ingredients | | | | 21,830 | a | 1,484,222 | |
13
STATEMENT OF INVESTMENTS (continued)
| | | | | | | | |
| |
Description | | | | Shares | | Value ($) | |
Common Stocks - 95.2% (continued) | | | | | |
Food, Beverage & Tobacco - 3.3% (continued) | | | | | |
National Beverage | | | | 56,343 | a | 4,917,054 | |
Nomad Foods | | | | 123,925 | b | 2,505,763 | |
Sanderson Farms | | | | 17,030 | a | 1,927,115 | |
TreeHouse Foods | | | | 112,539 | a,b | 5,919,551 | |
| | | | | 26,555,727 | |
Health Care Equipment & Services - 4.5% | | | | | |
Acadia Healthcare | | | | 59,400 | a,b | 2,017,818 | |
Accuray | | | | 258,790 | b | 1,061,039 | |
Allscripts Healthcare Solutions | | | | 198,260 | b | 2,024,235 | |
Amedisys | | | | 10,054 | b | 1,369,858 | |
AMN Healthcare Services | | | | 31,150 | a,b | 1,984,255 | |
Anika Therapeutics | | | | 86,494 | b | 2,979,718 | |
AtriCure | | | | 44,800 | b | 1,500,352 | |
Avanos Medical | | | | 137,363 | a,b | 6,553,588 | |
BioTelemetry | | | | 3,160 | a,b | 224,170 | |
CONMED | | | | 11,410 | | 775,424 | |
Encompass HealthSouth | | | | 15,920 | | 1,197,343 | |
Globus Medical, Cl. A | | | | 44,370 | b | 2,142,627 | |
Haemonetics | | | | 12,680 | b | 1,360,310 | |
LHC Group | | | | 26,305 | b | 2,758,605 | |
Merit Medical Systems | | | | 48,810 | a,b | 3,077,470 | |
Molina Healthcare | | | | 13,500 | a,b | 1,886,085 | |
Patterson | | | | 53,900 | a | 1,367,443 | |
Teladoc | | | | 29,160 | b | 1,821,042 | |
| | | | | 36,101,382 | |
Household & Personal Products - .8% | | | | | |
Inter Parfums | | | | 41,200 | | 2,544,924 | |
Spectrum Brands Holdings | | | | 2,300 | a | 113,574 | |
WD-40 | | | | 21,130 | a | 3,690,988 | |
| | | | | 6,349,486 | |
Insurance - 3.7% | | | | | |
American Financial Group | | | | 14,550 | | 1,489,338 | |
AMERISAFE | | | | 25,130 | | 1,623,147 | |
Argo Group International Holdings | | | | 3,557 | | 246,571 | |
Greenlight Capital Re. | | | | 8,100 | a,b | 85,779 | |
Horace Mann Educators | | | | 125,619 | | 5,059,933 | |
James River Group Holdings | | | | 3,800 | | 144,628 | |
Kemper | | | | 63,879 | | 4,861,192 | |
MBIA | | | | 14,500 | a,b | 134,995 | |
Navigators Group | | | | 32,540 | | 2,260,554 | |
Primerica | | | | 77,126 | | 9,168,739 | |
RLI | | | | 54,700 | a | 4,147,354 | |
14
| | | | | | | | |
| |
Description | | | | Shares | | Value ($) | |
Common Stocks - 95.2% (continued) | | | | | |
Insurance - 3.7% (continued) | | | | | |
Stewart Information Services | | | | 4,900 | | 206,094 | |
| | | | | 29,428,324 | |
Materials - 6.3% | | | | | |
AdvanSix | | | | 3,600 | b | 103,356 | |
American Vanguard | | | | 88,340 | | 1,477,045 | |
Ampco-Pittsburgh | | | | 73,710 | b | 316,953 | |
AptarGroup | | | | 16,060 | | 1,671,043 | |
Avery Dennison | | | | 44,180 | | 4,258,952 | |
Balchem | | | | 12,995 | | 1,126,667 | |
Cleveland-Cliffs | | | | 164,830 | a | 1,529,622 | |
Compass Minerals International | | | | 3,500 | a | 175,350 | |
Crown Holdings | | | | 76,600 | a,b | 3,928,048 | |
Ferro | | | | 64,970 | b | 1,253,921 | |
Ferroglobe | | | | 16,750 | a | 37,018 | |
H.B. Fuller | | | | 99,895 | a | 4,818,935 | |
Ingevity | | | | 95,974 | b | 9,406,412 | |
Kaiser Aluminum | | | | 31,487 | | 3,077,225 | |
Materion | | | | 4,340 | | 229,499 | |
Mercer International | | | | 121,017 | | 1,481,248 | |
PolyOne | | | | 117,511 | | 3,950,720 | |
Rayonier Advanced Materials | | | | 103,440 | a | 1,525,740 | |
Scotts Miracle-Gro, Cl. A | | | | 68,340 | a | 5,192,473 | |
Silgan Holdings | | | | 86,470 | | 2,226,602 | |
Stepan | | | | 14,167 | a | 1,144,977 | |
Valvoline | | | | 72,180 | | 1,522,276 | |
| | | | | 50,454,082 | |
Media & Entertainment - 2.7% | | | | | |
Cinemark Holdings | | | | 126,800 | a | 4,865,316 | |
Criteo, ADR | | | | 45,700 | b | 1,064,810 | |
John Wiley & Sons, Cl. A | | | | 23,787 | | 1,315,183 | |
Meredith | | | | 124,169 | a | 7,109,917 | |
MSG Networks | | | | 258,217 | b | 6,915,051 | |
New Media Investment Group | | | | 7,341 | | 96,901 | |
| | | | | 21,367,178 | |
Pharmaceuticals Biotechnology & Life Sciences - 3.7% | | | | | |
ACADIA Pharmaceuticals | | | | 43,420 | a,b | 827,585 | |
Aerie Pharmaceuticals | | | | 19,060 | a,b | 760,303 | |
Amneal Pharmaceuticals | | | | 103,800 | a,b | 1,838,298 | |
Array BioPharma | | | | 68,775 | b | 1,095,586 | |
Charles River Laboratories International | | | | 87,607 | b | 11,813,804 | |
Fluidigm | | | | 256,525 | b | 2,103,505 | |
Intersect ENT | | | | 21,000 | b | 630,210 | |
Ligand Pharmaceuticals, Cl. B | | | | 11,725 | a,b | 1,849,853 | |
15
STATEMENT OF INVESTMENTS (continued)
| | | | | | | | |
| |
Description | | | | Shares | | Value ($) | |
Common Stocks - 95.2% (continued) | | | | | |
Pharmaceuticals Biotechnology & Life Sciences - 3.7% (continued) | | | | | |
Loxo Oncology | | | | 8,875 | a,b | 1,246,228 | |
Luminex | | | | 57,500 | | 1,688,775 | |
Mallinckrodt | | | | 29,900 | b | 711,321 | |
Medpace Holdings | | | | 14,580 | b | 902,648 | |
Myriad Genetics | | | | 40,570 | b | 1,307,977 | |
NanoString Technologies | | | | 77,600 | b | 1,340,152 | |
NeoGenomics | | | | 44,690 | b | 732,916 | |
Spectrum Pharmaceuticals | | | | 33,280 | a,b | 481,229 | |
Syneos Health | | | | 4,300 | a,b | 222,396 | |
UroGen Pharma | | | | 8,555 | a,b | 419,537 | |
| | | | | 29,972,323 | |
Real Estate - 5.1% | | | | | |
Columbia Property Trust | | | | 9,000 | c | 193,230 | |
CoreCivic | | | | 5,500 | c | 120,725 | |
Corporate Office Properties Trust | | | | 200,717 | c | 4,911,545 | |
Healthcare Realty Trust | | | | 200,456 | c | 6,214,136 | |
HFF, Cl. A | | | | 98,900 | | 3,995,560 | |
Mesa Air Group | | | | 20,300 | a,c | 125,048 | |
MGM Growth Properties, Cl. A | | | | 234,790 | c | 6,689,167 | |
QTS Realty Trust, Cl. A | | | | 46,275 | c | 1,878,302 | |
RE/MAX Holdings, Cl. A | | | | 90,750 | | 2,992,027 | |
Retail Opportunity Investments | | | | 11,000 | c | 199,100 | |
Rexford Industrial Realty | | | | 116,000 | c | 3,786,240 | |
RLJ Lodging Trust | | | | 7,163 | c | 145,695 | |
Terreno Realty | | | | 211,249 | c | 8,240,824 | |
Uniti Group | | | | 59,800 | a,c | 1,191,814 | |
| | | | | 40,683,413 | |
Retailing - 1.7% | | | | | |
American Eagle Outfitters | | | | 47,225 | | 988,419 | |
At Home Group | | | | 42,785 | b | 1,219,373 | |
Boot Barn Holdings | | | | 8,850 | b | 200,364 | |
Chico's FAS | | | | 122,300 | a | 660,420 | |
Express | | | | 89,970 | a,b | 561,413 | |
Liberty Expedia Holdings, Cl. A | | | | 3,600 | b | 150,876 | |
Monro Muffler Brake | | | | 3,000 | a | 243,960 | |
Office Depot | | | | 349,788 | | 1,129,815 | |
Party City Holdco | | | | 131,400 | a,b | 1,570,230 | |
Quotient Technology | | | | 117,585 | a,b | 1,445,120 | |
RTW RetailWinds | | | | 66,180 | b | 221,703 | |
Sally Beauty Holdings | | | | 224,417 | a,b | 4,737,443 | |
Sportsman's Warehouse Holdings | | | | 34,800 | b | 156,600 | |
The Children's Place | | | | 1,200 | | 155,568 | |
16
| | | | | | | | |
| |
Description | | | | Shares | | Value ($) | |
Common Stocks - 95.2% (continued) | | | | | |
Retailing - 1.7% (continued) | | | | | |
The Michaels Companies | | | | 13,750 | a,b | 233,338 | |
| | | | | 13,674,642 | |
Semiconductors & Semiconductor Equipment - 3.8% | | | | | |
Advanced Energy Industries | | | | 15,845 | b | 745,349 | |
Amkor Technology | | | | 180,110 | b | 1,233,754 | |
Brooks Automation | | | | 175,625 | a | 5,331,975 | |
Cabot Microelectronics | | | | 10,140 | | 1,089,847 | |
CEVA | | | | 29,030 | b | 754,490 | |
Cypress Semiconductor | | | | 140,965 | a | 1,959,413 | |
Entegris | | | | 87,930 | | 2,585,142 | |
Impinj | | | | 28,200 | a,b | 598,968 | |
Kulicke & Soffa Industries | | | | 88,340 | | 1,908,144 | |
MACOM Technology Solutions Holdings | | | | 92,555 | a,b | 1,644,702 | |
MaxLinear, Cl. A | | | | 104,595 | a,b | 2,133,738 | |
Mellanox Technologies | | | | 41,990 | b | 3,897,932 | |
Rambus | | | | 176,180 | b | 1,536,290 | |
Semtech | | | | 26,635 | b | 1,420,711 | |
Silicon Laboratories | | | | 21,870 | b | 1,932,652 | |
Veeco Instruments | | | | 111,400 | a,b | 975,864 | |
Versum Materials | | | | 22,505 | | 779,573 | |
| | | | | 30,528,544 | |
Software & Services - 6.6% | | | | | |
ACI Worldwide | | | | 8,600 | b | 248,368 | |
American Software | | | | 159,100 | | 1,654,640 | |
Booz Allen Hamilton Holding | | | | 115,314 | | 5,916,761 | |
Bottomline Technologies | | | | 28,525 | b | 1,570,872 | |
Box, Cl. A | | | | 74,795 | b | 1,405,398 | |
CACI International, Cl. A | | | | 800 | b | 131,928 | |
Cass Information Systems | | | | 66,369 | | 4,381,018 | |
Cloudera | | | | 98,800 | a,b | 1,219,192 | |
Conduent | | | | 130,500 | b | 1,673,010 | |
CoreLogic | | | | 59,130 | b | 2,392,400 | |
Coupa Software | | | | 20,285 | b | 1,306,963 | |
Euronet Worldwide | | | | 27,530 | b | 3,237,803 | |
Everbridge | | | | 41,520 | b | 2,274,050 | |
FireEye | | | | 133,800 | a,b | 2,677,338 | |
HubSpot | | | | 12,995 | b | 1,806,695 | |
Interxion Holding | | | | 58,635 | b | 3,651,201 | |
Jack Henry & Associates | | | | 20,930 | | 2,923,921 | |
Liveramp Holdings | | | | 41,400 | b | 1,958,220 | |
Net 1 UEPS Technologies | | | | 17,200 | b | 93,912 | |
Nuance Communications | | | | 191,250 | b | 3,058,087 | |
OneSpan | | | �� | 63,600 | b | 1,079,292 | |
17
STATEMENT OF INVESTMENTS (continued)
| | | | | | | | |
| |
Description | | | | Shares | | Value ($) | |
Common Stocks - 95.2% (continued) | | | | | |
Software & Services - 6.6% (continued) | | | | | |
SeaChange International | | | | 139,120 | b | 233,722 | |
TiVo | | | | 138,729 | a | 1,373,417 | |
Trade Desk, Cl. A | | | | 8,875 | b | 1,264,244 | |
Unisys | | | | 73,500 | b | 993,720 | |
Verint Systems | | | | 108,069 | b | 4,909,575 | |
| | | | | 53,435,747 | |
Technology Hardware & Equipment - 5.4% | | | | | |
Arris International | | | | 195,480 | b | 6,040,332 | |
Badger Meter | | | | 99,700 | a | 5,533,350 | |
Belden | | | | 62,294 | a | 3,474,759 | |
Ciena | | | | 204,230 | b | 6,661,983 | |
Diebold | | | | 102,800 | a | 336,156 | |
Electronics For Imaging | | | | 101,730 | a,b | 2,815,886 | |
Finisar | | | | 11,400 | a,b | 266,190 | |
II-VI | | | | 20,830 | a,b | 779,459 | |
Infinera | | | | 227,920 | a,b | 982,335 | |
Itron | | | | 35,430 | b | 1,918,889 | |
Kimball Electronics | | | | 33,200 | b | 585,648 | |
Littelfuse | | | | 21,497 | | 4,113,451 | |
Maxwell Technologies | | | | 165,600 | a,b | 415,656 | |
Methode Electronics | | | | 4,900 | | 148,470 | |
NCR | | | | 51,720 | a,b | 1,433,161 | |
Novanta | | | | 10,775 | b | 699,621 | |
OSI Systems | | | | 19,610 | a,b | 1,419,764 | |
Quantum | | | | 40,503 | b | 96,802 | |
Ribbon Communications | | | | 129,300 | b | 690,462 | |
Viavi Solutions | | | | 155,400 | b | 1,575,756 | |
Vishay Intertechnology | | | | 162,310 | | 3,384,163 | |
| | | | | 43,372,293 | |
Telecommunication Services - .2% | | | | | |
Vonage Holdings | | | | 120,150 | b | 1,272,389 | |
Transportation - 1.6% | | | | | |
Air Transport Services Group | | | | 11,200 | b | 207,536 | |
Avis Budget Group | | | | 36,500 | b | 1,069,085 | |
Danaos | | | | 117,501 | b | 124,551 | |
Forward Air | | | | 25,355 | | 1,655,174 | |
Hertz Global Holdings | | | | 76,400 | b | 1,429,444 | |
Hub Group, Cl. A | | | | 34,750 | b | 1,544,290 | |
Landstar System | | | | 42,390 | | 4,623,901 | |
Ryder System | | | | 24,670 | | 1,395,582 | |
Saia | | | | 15,215 | b | 917,617 | |
YRC Worldwide | | | | 16,200 | a,b | 91,692 | |
| | | | | 13,058,872 | |
18
| | | | | | | | |
| |
Description | | | | Shares | | Value ($) | |
Common Stocks - 95.2% (continued) | | | | | |
Utilities - 1.9% | | | | | |
ALLETE | | | | 60,750 | | 4,943,835 | |
American States Water | | | | 20,840 | a | 1,397,947 | |
Atlantic Power | | | | 626,070 | b | 1,371,093 | |
Black Hills | | | | 33,595 | a | 2,224,325 | |
Chesapeake Utilities | | | | 21,945 | | 1,888,148 | |
NorthWestern | | | | 1,900 | | 121,524 | |
Ormat Technologies | | | | 31,950 | a | 1,792,075 | |
Portland General Electric | | | | 5,400 | | 260,010 | |
Vistra Energy | | | | 70,494 | b | 1,655,199 | |
| | | | | 15,654,156 | |
Total Common Stocks(cost $656,966,547) | | | | 765,342,154 | |
| | | | | | | | |
Exchange-Traded Funds - .5% | | | | | |
Registered Investment Companies - .5% | | | | | |
iShares Russell 2000 ETF
(cost $4,092,829) | | | | 27,510 | | 4,198,576 | |
Description | Coupon
Rate % | Maturity Date | | Principal Amount ($) | | | |
Convertible Bonds - .1%CouponMaturityRate% Date | | | | | |
Utilities - .1% | | | | | |
Vistra Energy
(cost $828,168) | 7.00 | 7/01/19 | | 810,000 | | 762,615 | |
| | | 1-Day
Yield (%) | | Shares | | | |
Investment Companies - 1.6% | | | | | |
Registered Investment Companies - 1.6% | | | | | |
Dreyfus Institutional Preferred Government Plus Money Market Fund
(cost $12,595,400) | | 2.23 | | 12,595,400 | d | 12,595,400 | |
19
STATEMENT OF INVESTMENTS (continued)
| | | | | | | | |
| |
Description | | 1-Day
Yield (%) | | Shares | | Value ($) | |
Investment of Cash Collateral for Securities Loaned - 4.1% | | | | | |
Registered Investment Companies - 4.1% | | | | | |
Dreyfus Institutional Preferred Government Money Market Fund, Institutional Shares
(cost $32,704,474) | | 2.19 | | 32,704,474 | d | 32,704,474 | |
Total Investments(cost $707,187,418) | | 101.5% | | 815,603,219 | |
Liabilities, Less Cash and Receivables | | (1.5%) | | (11,874,959) | |
Net Assets | | 100.0% | | 803,728,260 | |
ADR—American Depository Receipt
ETF—Exchange-Traded Fund
aSecurity, or portion thereof, on loan. At November 30, 2018, the value of the fund’s securities on loan was $183,097,987 and the value of the collateral held by the fund was $189,947,596, consisting of cash collateral of $32,704,474 and U.S. Government & Agency securities valued at $157,243,122.
b Non-income producing security.
c Investment in real estate investment trust.
d Investment in affiliated issuer. The investment objective of this investment company is publicly available and can be found within the investment company’s prospectus.
| | |
Portfolio Summary (Unaudited)† | Value (%) |
Industrials | 21.2 |
Financials | 18.8 |
Information Technology | 15.8 |
Health Care | 8.2 |
Consumer Discretionary | 6.7 |
Materials | 6.3 |
Investment Companies | 6.2 |
Real Estate | 5.1 |
Consumer Staples | 4.5 |
Energy | 3.9 |
Communication Services | 2.8 |
Utilities | 2.0 |
| | 101.5 |
† Based on net assets.
See notes to financial statements.
20
STATEMENT OF INVESTMENTS IN AFFILIATED ISSUERS
| | | | | | | |
Registered Investment Company | Value
11/30/17($) | Purchases($) | Sales($) | Value
11/30/18($) | Net
Assets(%) | Dividend/
Distributions($) |
Dreyfus Institutional Preferred Government Plus Money Market Fund | - | 67,464,518 | 54,869,118 | 12,595,400 | 1.6 | 70,513 |
Dreyfus Institutional Preferred Government Money Market Fund, Institutional Shares | - | 365,101,145 | 332,396,671 | 32,704,474 | 4.1 | - |
Total | - | 432,565,663 | 387,265,789 | 45,299,874 | 5.7 | 70,513 |
See notes to financial statements.
21
STATEMENT OF ASSETS AND LIABILITIES
November 30, 2018
| | | | | | | |
| | | | | | |
| | | Cost | | Value | |
Assets ($): | | | | |
Investments in securities—See Statement of Investments
(including securities on loan, valued at $183,097,987)—Note 1(b): | | | |
Unaffiliated issuers | 661,887,544 | | 770,303,345 | |
Affiliated issuers | | 45,299,874 | | 45,299,874 | |
Receivable for investment securities sold | | 25,601,925 | |
Dividends and securities lending income receivable | | 1,022,451 | |
Receivable for shares of Common Stock subscribed | | 94,324 | |
Prepaid expenses | | | | | 40,394 | |
| | | | | 842,362,313 | |
Liabilities ($): | | | | |
Due to The Dreyfus Corporation and affiliates—Note 3(c) | | | | 640,526 | |
Cash overdraft due to Custodian | | | | | 1,200,158 | |
Liability for securities on loan—Note 1(b) | | 32,704,474 | |
Payable for investment securities purchased | | 2,063,394 | |
Payable for shares of Common Stock redeemed | | 1,942,226 | |
Directors fees and expenses payable | | 15,477 | |
Accrued expenses | | | | | 67,798 | |
| | | | | 38,634,053 | |
Net Assets ($) | | | 803,728,260 | |
Composition of Net Assets ($): | | | | |
Paid-in capital | | | | | 621,034,206 | |
Total distributable earnings (loss) | | | | | 182,694,054 | |
Net Assets ($) | | | 803,728,260 | |
| | | | | | |
Net Asset Value Per Share | Class A | Class C | Class I | Class Y | |
Net Assets ($) | 1,047,861 | 553,129 | 24,890,476 | 777,236,794 | |
Shares Outstanding | 43,767 | 25,229 | 1,019,522 | 31,860,064 | |
Net Asset Value Per Share ($) | 23.94 | 21.92 | 24.41 | 24.40 | |
| | | | | | |
See notes to financial statements. | | | | | |
22
STATEMENT OF OPERATIONS
Year Ended November 30, 2018
| | | | | | | |
| | | | | | |
| | | | | | |
Investment Income ($): | | | | |
Income: | | | | |
Cash dividends (net of $18,895 foreign taxes withheld at source): | |
Unaffiliated issuers | | | 11,065,893 | |
Affiliated issuers | | | 70,513 | |
Income from securities lending—Note 1(b) | | | 400,773 | |
Total Income | | | 11,537,179 | |
Expenses: | | | | |
Management fee—Note 3(a) | | | 8,305,004 | |
Directors’ fees and expenses—Note 3(d) | | | 102,883 | |
Professional fees | | | 96,601 | |
Registration fees | | | 63,572 | |
Custodian fees—Note 3(c) | | | 25,868 | |
Loan commitment fees—Note 2 | | | 16,289 | |
Shareholder servicing costs—Note 3(c) | | | 14,300 | |
Prospectus and shareholders’ reports | | | 11,821 | |
Distribution fees—Note 3(b) | | | 2,664 | |
Miscellaneous | | | 39,734 | |
Total Expenses | | | 8,678,736 | |
Less—reduction in expenses due to undertaking—Note 3(a) | | | (901) | |
Less—reduction in fees due to earnings credits—Note 3(c) | | | (25,868) | |
Net Expenses | | | 8,651,967 | |
Investment Income—Net | | | 2,885,212 | |
Realized and Unrealized Gain (Loss) on Investments—Note 4 ($): | | |
Net realized gain (loss) on investments | 77,359,132 | |
Net unrealized appreciation (depreciation) on investments | | | (110,039,814) | |
Net Realized and Unrealized Gain (Loss) on Investments | | | (32,680,682) | |
Net (Decrease) in Net Assets Resulting from Operations | | (29,795,470) | |
| | | | | | | |
See notes to financial statements. | | | | | |
23
STATEMENT OF CHANGES IN NET ASSETS
| | | | | | | | | | |
| | | | Year Ended November 30, |
| | | | 2018 | | 2017a | |
Operations ($): | | | | | | | | |
Investment income—net | | | 2,885,212 | | | | 3,022,170 | |
Net realized gain (loss) on investments | | 77,359,132 | | | | 58,246,633 | |
Net unrealized appreciation (depreciation)
on investments | | (110,039,814) | | | | 79,302,411 | |
Net Increase (Decrease) in Net Assets
Resulting from Operations | (29,795,470) | | | | 140,571,214 | |
Distributions ($): | |
Distributions to shareholders: | | | | | | | | |
Class A | | | (64,787) | | | | (7,955) | |
Class C | | | (7,868) | | | | - | |
Class I | | | (1,228,285) | | | | (90,920) | |
Class Y | | | (54,610,093) | | | | (4,801,162) | |
Total Distributions | | | (55,911,033) | | | | (4,900,037) | |
Capital Stock Transactions ($): | |
Net proceeds from shares sold: | | | | | | | | |
Class A | | | 92,055 | | | | 308,464 | |
Class C | | | 472,927 | | | | 144,349 | |
Class I | | | 16,731,975 | | | | 33,684,999 | |
Class Y | | | 75,166,525 | | | | 121,035,115 | |
Distributions reinvested: | | | | | | | | |
Class A | | | 63,405 | | | | 7,904 | |
Class C | | | 7,867 | | | | - | |
Class I | | | 964,379 | | | | 66,130 | |
Class Y | | | 23,821,651 | | | | 1,003,913 | |
Cost of shares redeemed: | | | | | | | | |
Class A | | | (75,592) | | | | (2,287,934) | |
Class C | | | (72,895) | | | | (129,509) | |
Class I | | | (11,273,631) | | | | (32,585,103) | |
Class Y | | | (180,898,249) | | | | (109,058,287) | |
Increase (Decrease) in Net Assets
from Capital Stock Transactions | (74,999,583) | | | | 12,190,041 | |
Total Increase (Decrease) in Net Assets | (160,706,086) | | | | 147,861,218 | |
Net Assets ($): | |
Beginning of Period | | | 964,434,346 | | | | 816,573,128 | |
End of Period | | | 803,728,260 | | | | 964,434,346 | |
24
| | | | | | | | | | |
| | | | Year Ended November 30, |
| | | | 2018 | | 2017a | |
Capital Share Transactions (Shares): | |
Class Ab | | | | | | | | |
Shares sold | | | 3,589 | | | | 12,963 | |
Shares issued for distributions reinvested | | | 2,567 | | | | 338 | |
Shares redeemed | | | (3,096) | | | | (98,557) | |
Net Increase (Decrease) in Shares Outstanding | 3,060 | | | | (85,256) | |
Class C | | | | | | | | |
Shares sold | | | 20,627 | | | | 6,343 | |
Shares issued for distributions reinvested | | | 345 | | | | - | |
Shares redeemed | | | (3,048) | | | | (5,932) | |
Net Increase (Decrease) in Shares Outstanding | 17,924 | | | | 411 | |
Class Ib | | | | | | | | |
Shares sold | | | 656,859 | | | | 1,411,692 | |
Shares issued for distributions reinvested | | | 38,402 | | | | 2,791 | |
Shares redeemed | | | (440,307) | | | | (1,363,437) | |
Net Increase (Decrease) in Shares Outstanding | 254,954 | | | | 51,046 | |
Class Yb | | | | | | | | |
Shares sold | | | 2,952,382 | | | | 5,007,689 | |
Shares issued for distributions reinvested | | | 949,722 | | | | 42,413 | |
Shares redeemed | | | (7,107,076) | | | | (4,515,176) | |
Net Increase (Decrease) in Shares Outstanding | (3,204,972) | | | | 534,926 | |
| | | | | | | | | | |
aDistributions to shareholders include only distributions from net investment income. Undistributed investment income—net was $2,098,765 in 2017 and is no longer presented as a result of the adoption of SEC’s Disclosure Update and Simplification Rule. | |
bDuring the period ended November 30, 2018, 131 Class C shares representing $3,145 were automatically exchanged for 121 Class A shares, 622,430 Class Y shares representing $15,845,547 were exchanged for 621,891 Class I shares and during the period ended November 30, 2017, 2,341 Class A shares representing $54,700 were exchanged for 2,309 Class Y shares, 12,660 Class A shares representing $292,138 were exchanged for 12,475 Class I shares and 430,253 Class Y shares representing $10,473,715 were exchanged for 429,977 Class I shares. | |
See notes to financial statements. | | | | | | | | |
25
FINANCIAL HIGHLIGHTS
The following tables describe the performance for each share class for the fiscal periods indicated. All information (except portfolio turnover rate) reflects financial results for a single fund share. Total return shows how much your investment in the fund would have increased (or decreased) during each period, assuming you had reinvested all dividends and distributions. These figures have been derived from the fund’s financial statements.
| | | | | | | | | | |
| | | | | | | |
| | | | | | | |
| | | Year Ended November 30, |
Class A Shares | | 2018 | 2017 | 2016 | 2015 | 2014 |
Per Share Data ($): | | | | | | |
Net asset value, beginning of period | | 26.44 | 22.72 | 22.02 | 24.89 | 26.25 |
Investment Operations: | | | | | | |
Investment income (loss)—neta | | (.01) | .00b | .09 | .07 | .01 |
Net realized and unrealized
gain (loss) on investments | | (.98) | 3.79 | 2.02 | (.02) | .84 |
Total from Investment Operations | | (.99) | 3.79 | 2.11 | .05 | .85 |
Distributions: | | | | | | |
Dividends from investment income—net | | - | (.07) | (.11) | (.00)b | (.08) |
Dividends from net realized
gain on investments | | (.1.51) | - | (1.30) | (2.92) | (2.13) |
Total Distributions | | (1.51) | (.07) | (1.41) | (2.92) | (2.21) |
Net asset value, end of period | | 23.94 | 26.44 | 22.72 | 22.02 | 24.89 |
Total Return (%)c | | (3.93) | 16.74 | 10.72 | .01 | 3.35 |
Ratios/Supplemental Data (%): | | | | | | |
Ratio of total expenses
to average net assets | | 1.35 | 1.30 | 1.30 | 1.29 | 1.31 |
Ratio of net expenses
to average net assets | | 1.30 | 1.28 | 1.30 | 1.29 | 1.30 |
Ratio of net investment income (loss)
to average net assets | | (.05) | .01 | .44 | .31 | .02 |
Portfolio Turnover Rate | | 58.85 | 67.90 | 66.57 | 65.39 | 104.22 |
Net Assets, end of period ($ x 1,000) | | 1,048 | 1,076 | 2,862 | 2,250 | 2,015 |
a Based on average shares outstanding.
b Amount represents less than $.01 per share.
c Exclusive of sales charge.
See notes to financial statements.
26
| | | | | | | | | | | |
| | | | | | | |
| | | | | | | |
| | | Year Ended November 30, |
Class C Shares | | 2018 | 2017 | 2016 | 2015 | 2014 |
Per Share Data ($): | | | | | | |
Net asset value, beginning of period | | 24.51 | 21.15 | 20.68 | 23.70 | 25.19 |
Investment Operations: | | | | | | |
Investment (loss)—neta | | (.19) | (.16) | (.07) | (.09) | (.20) |
Net realized and unrealized
gain (loss) on investments | | (.89) | 3.52 | 1.90 | (.01) | .84 |
Total from Investment Operations | | (1.08) | 3.36 | 1.83 | (.10) | .64 |
Distributions: | | | | | | |
Dividends from investment income—net | | - | - | (.06) | – | – |
Dividends from net realized
gain on investments | | (1.51) | - | (1.30) | (2.92) | (2.13) |
Total Distributions | | (1.51) | - | (1.36) | (2.92) | (2.13) |
Net asset value, end of period | | 21.92 | 24.51 | 21.15 | 20.68 | 23.70 |
Total Return (%)b | | (4.65) | 15.89 | 9.94 | (.72) | 2.60 |
Ratios/Supplemental Data (%): | | | | | | |
Ratio of total expenses
to average net assets | | 2.15 | 2.31 | 2.33 | 2.42 | 2.22 |
Ratio of net expenses
to average net assets | | 2.05 | 2.04 | 2.05 | 2.04 | 2.05 |
Ratio of net investment (loss)
to average net assets | | (.82) | (.74) | (.39) | (.47) | (.83) |
Portfolio Turnover Rate | | 58.85 | 67.90 | 66.57 | 65.39 | 104.22 |
Net Assets, end of period ($ x 1,000) | | 553 | 179 | 146 | 154 | 55 |
a Based on average shares outstanding.
b Exclusive of sales charge.
See notes to financial statements.
27
FINANCIAL HIGHLIGHTS (continued)
| | | | | | | | | | | |
| | | | | | | |
| | | | | | | |
| | | Year Ended November 30, |
Class I Shares | | 2018 | 2017 | 2016 | 2015 | 2014 |
Per Share Data ($): | | | | | | |
Net asset value, beginning of period | | 26.90 | 23.09 | 22.36 | 25.22 | 26.55 |
Investment Operations: | | | | | | |
Investment income—neta | | .07 | .07 | .15 | .14 | .08 |
Net realized and unrealized
gain (loss) on investments | | (1.00) | 3.87 | 2.06 | (.03) | .87 |
Total from Investment Operations | | (.93) | 3.94 | 2.21 | .11 | .95 |
Distributions: | | | | | | |
Dividends from
investment income—net | | (.05) | (.13) | (.18) | (.05) | (.15) |
Dividends from net realized
gain on investments | | (1.51) | - | (1.30) | (2.92) | (2.13) |
Total Distributions | | (1.56) | (.13) | (1.48) | (2.97) | (2.28) |
Net asset value, end of period | | 24.41 | 26.90 | 23.09 | 22.36 | 25.22 |
Total Return (%) | | (3.63) | 17.14 | 11.09 | .26 | 3.72 |
Ratios/Supplemental Data (%): | | | | | | |
Ratio of total expenses
to average net assets | | .97 | 1.00 | .99 | .97 | .95 |
Ratio of net expenses
to average net assets | | .97 | .98 | .99 | .97 | .95 |
Ratio of net investment income
to average net assets | | .27 | .29 | .75 | .62 | .31 |
Portfolio Turnover Rate | | 58.85 | 67.90 | 66.57 | 65.39 | 104.22 |
Net Assets, end of period ($ x 1,000) | | 24,890 | 20,566 | 16,478 | 20,731 | 20,403 |
a Based on average shares outstanding..
See notes to financial statements.
28
| | | | | | | | | | | |
| | | | | | | |
| | | | | | | |
| | | Year Ended November 30, |
Class Y Shares | | 2018 | 2017 | 2016 | 2015 | 2014 |
Per Share Data ($): | | | | | | |
Net asset value, beginning of period | | 26.88 | 23.08 | 22.35 | 25.21 | 26.54 |
Investment Operations: | | | | | | |
Investment income—neta | | .08 | .08 | .16 | .15 | .12 |
Net realized and unrealized
gain (loss) on investments | | (.99) | 3.86 | 2.06 | (.03) | .83 |
Total from Investment Operations | | (.91) | 3.94 | 2.22 | .12 | .95 |
Distributions: | | | | | | |
Dividends
from investment income—net | | (.06) | (.14) | (.19) | (.06) | (.15) |
Dividends from net realized
gain on investments | | (1.51) | - | (1.30) | (2.92) | (2.13) |
Total Distributions | | (1.57) | (.14) | (1.49) | (2.98) | (2.28) |
Net asset value, end of period | | 24.40 | 26.88 | 23.08 | 22.35 | 25.21 |
Total Return (%) | | (3.56) | 17.15 | 11.13 | .31 | 3.71 |
Ratios/Supplemental Data (%): | | | | | | |
Ratio of total expenses
to average net assets | | .94 | .94 | .95 | .95 | .95 |
Ratio of net expenses
to average net assets | | .94 | .93 | .95 | .95 | .95 |
Ratio of net investment income
to average net assets | | .31 | .35 | .79 | .65 | .45 |
Portfolio Turnover Rate | | 58.85 | 67.90 | 66.57 | 65.39 | 104.22 |
Net Assets, end of period ($ x 1,000) | | 777,237 | 942,613 | 797,087 | 770,763 | 747,120 |
a Based on average shares outstanding.
See notes to financial statements.
29
NOTES TO FINANCIAL STATEMENTS
NOTE 1—Significant Accounting Policies:
Dreyfus Select Managers Small Cap Value Fund (the “fund”) is a separate non-diversified series of Strategic Funds, Inc. (the “Company”), which is registered under the Investment Company Act of 1940, as amended (the “Act”), as an open-end management investment company and operates as a series company currently offering six series, including the fund. The fund’s investment objective is to seek capital appreciation. The Dreyfus Corporation (the “Manager” or “Dreyfus”), a wholly-owned subsidiary of The Bank of New York Mellon Corporation (“BNY Mellon”), serves as the fund’s investment adviser and the fund’s portfolio allocation manager. Thompson, Siegel and Walmsley, LLC (“TS&W”), Walthausen & Co., LLC (“Walthausen”), Neuberger Berman Investment Advisers LLC (“Neuberger Berman”), Kayne Anderson Rudnick Investment Management, LLC (“Kayne”), Channing Capital Management, LLC (“Channing”) and Eastern Shore Capital Management (“Eastern Shore”) serve as the fund’s sub-investment advisers, each managing an allocated portion of the fund’s portfolio.
Effective November 7, 2018, Dreyfus will assume the portfolio allocation management responsibilities of the fund, of which, replacing EACM Advisors LLC (“EACM”).
MBSC Securities Corporation (the “Distributor”), a wholly-owned subsidiary of Dreyfus, is the distributor of the fund’s shares. The fund is authorized to issue 100 million shares of $.001 par value Common Stock in each of the following classes of shares: Class A, Class C, Class I, Class T and Class Y. Class A and Class T shares generally are subject to a sales charge imposed at the time of purchase. Class C shares are subject to a contingent deferred sales charge (“CDSC”) imposed on Class C shares redeemed within one year of purchase. Class C shares automatically convert to Class A shares ten years after the date of purchase, without the imposition of a sales charge. Class I and Class Y shares are sold at net asset value per share generally to institutional investors. As of the date of this report, the fund did not offer Class T shares for purchase. Other differences between the classes include the services offered to and the expenses borne by each class, the allocation of certain transfer agency costs, and certain voting rights. Income, expenses (other than expenses attributable to a specific class), and realized and unrealized gains or losses on investments are allocated to each class of shares based on its relative net assets.
30
The Company accounts separately for the assets, liabilities and operations of each series. Expenses directly attributable to each series are charged to that series’ operations; expenses which are applicable to all series are allocated among them on a pro rata basis.
The Financial Accounting Standards Board (“FASB”) Accounting Standards Codification is the exclusive reference of authoritative U.S. generally accepted accounting principles (“GAAP”) recognized by the FASB to be applied by nongovernmental entities. Rules and interpretive releases of the Securities and Exchange Commission (“SEC”) under authority of federal laws are also sources of authoritative GAAP for SEC registrants. The fund’s financial statements are prepared in accordance with GAAP, which may require the use of management estimates and assumptions. Actual results could differ from those estimates.
The Companyenters into contracts that contain a variety of indemnifications. The fund’s maximum exposure under these arrangements is unknown. The fund does not anticipate recognizing any loss related to these arrangements.
(a) Portfolio valuation: The fair value of a financial instrument is the amount that would be received to sell an asset or paid to transfer a liability in an orderly transaction between market participants at the measurement date (i.e., the exit price). GAAP establishes a fair value hierarchy that prioritizes the inputs of valuation techniques used to measure fair value. This hierarchy gives the highest priority to unadjusted quoted prices in active markets for identical assets or liabilities (Level 1 measurements) and the lowest priority to unobservable inputs (Level 3 measurements).
Additionally, GAAP provides guidance on determining whether the volume and activity in a market has decreased significantly and whether such a decrease in activity results in transactions that are not orderly. GAAP requires enhanced disclosures around valuation inputs and techniques used during annual and interim periods.
Various inputs are used in determining the value of the fund’s investments relating to fair value measurements. These inputs are summarized in the three broad levels listed below:
Level 1—unadjusted quoted prices in active markets for identical investments.
Level 2—other significant observable inputs (including quoted prices for similar investments, interest rates, prepayment speeds, credit risk, etc.).
31
NOTES TO FINANCIAL STATEMENTS(continued)
Level 3—significant unobservable inputs (including the fund’s own assumptions in determining the fair value of investments).
The inputs or methodology used for valuing securities are not necessarily an indication of the risk associated with investing in those securities.
Changes in valuation techniques may result in transfers in or out of an assigned level within the disclosure hierarchy. Valuation techniques used to value the fund’s investments are as follows:
Investments in debt securities, excluding short-term investments (other than U.S. Treasury Bills), are valued each business day by an independent pricing service (the “Service”) approved by the Company’s Board of Directors (the “Board”). Investments for which quoted bid prices are readily available and are representative of the bid side of the market in the judgment of the Service are valued at the mean between the quoted bid prices (as obtained by the Service from dealers in such securities) and asked prices (as calculated by the Service based upon its evaluation of the market for such securities). Other investments are valued as determined by the Service, based on methods which include consideration of the following: yields or prices of securities of comparable quality, coupon, maturity and type; indications as to values from dealers; and general market conditions. These securities are generally categorized within Level 2 of the fair value hierarchy.
Investments in equity securities are valued at the last sales price on the securities exchange or national securities market on which such securities are primarily traded. Securities listed on the National Market System for which market quotations are available are valued at the official closing price or, if there is no official closing price that day, at the last sales price. For open short positions, asked prices are used for valuation purposes. Bid price is used when no asked price is available. Registered investment companies that are not traded on an exchange are valued at their net asset value. All of the preceding securities are generally categorized within Level 1 of the fair value hierarchy.
Securities not listed on an exchange or the national securities market, or securities for which there were no transactions, are valued at the average of the most recent bid and asked prices. These securities are generally categorized within Level 2 of the fair value hierarchy.
The Service is engaged under the general supervision of the Board.
Fair valuing of securities may be determined with the assistance of a pricing service using calculations based on indices of domestic securities and other appropriate indicators, such as prices of relevant ADRs and
32
futures. Utilizing these techniques may result in transfers between Level 1 and Level 2 of the fair value hierarchy.
When market quotations or official closing prices are not readily available, or are determined not to accurately reflect fair value, such as when the value of a security has been significantly affected by events after the close of the exchange or market on which the security is principally traded (for example, a foreign exchange or market), but before the fund calculates its net asset value, the fund may value these investments at fair value as determined in accordance with the procedures approved by the Board. Certain factors may be considered when fair valuing investments such as: fundamental analytical data, the nature and duration of restrictions on disposition, an evaluation of the forces that influence the market in which the securities are purchased and sold, and public trading in similar securities of the issuer or comparable issuers. These securities are either categorized within Level 2 or 3 of the fair value hierarchy depending on the relevant inputs used.
For restricted securities where observable inputs are limited, assumptions about market activity and risk are used and such securities are generally categorized within Level 3 of the fair value hierarchy.
The following is a summary of the inputs used as of November 30, 2018in valuing the fund’s investments:
| | | | | |
| | Level 1 – Unadjusted
Quoted Prices | Level 2 - Other Significant Observable Inputs | Level 3 -Significant Unobservable Inputs | Total |
Assets ($) | | | |
Investments in Securities: | | | |
Equity Securities - Common Stocks† | 765,342,154 | - | - | 765,342,154 |
Convertible Bond | - | 762,615 | - | 762,615 |
Exchange-Traded Funds | 4,198,576 | - | - | 4,198,576 |
Investment Companies | 45,299,874 | - | - | 45,299,874 |
† See Statement of Investments for additional detailed categorizations.
At November 30, 2018, there were no transfers between levels of the fair value hierarchy. It is the fund’s policy to recognize transfers between levels at the end of the reporting period.
(b)Securities transactions and investment income: Securities transactions are recorded on a trade date basis. Realized gains and losses from securities transactions are recorded on the identified cost basis.
33
NOTES TO FINANCIAL STATEMENTS(continued)
Dividend income is recognized on the ex-dividend date and interest income, including, where applicable, accretion of discount and amortization of premium on investments, is recognized on the accrual basis.
Pursuant to a securities lending agreement with The Bank of New York Mellon, a subsidiary of BNY Mellon and an affiliate of Dreyfus, the fund may lend securities to qualified institutions. It is the fund’s policy that, at origination, all loans are secured by collateral of at least 102% of the value of U.S. securities loaned and 105% of the value of foreign securities loaned. Collateral equivalent to at least 100% of the market value of securities on loan is maintained at all times. Collateral is either in the form of cash, which can be invested in certain money market mutual funds managed by Dreyfus, or U.S. Government and Agency securities. The fund is entitled to receive all dividends, interest and distributions on securities loaned, in addition to income earned as a result of the lending transaction. Should a borrower fail to return the securities in a timely manner, The Bank of New York Mellon is required to replace the securities for the benefit of the fund or credit the fund with the market value of the unreturned securities and is subrogated to the fund’s rights against the borrower and the collateral. Additionally, the contractual maturity of security lending transactions are on an overnight and continuous basis. During the period ended November 30, 2018, The Bank of New York Mellon earned $78,059 from lending portfolio securities, pursuant to the securities lending agreement.
(c) Affiliated issuers: Investments in other investment companies advised by Dreyfus are considered “affiliated” under the Act.
(d) Dividends and distributions to shareholders: Dividends and distributions are recorded on the ex-dividend date. Dividends from investment income-net and dividends from net realized capital gains, if any, are normally declared and paid annually, but the fund may make distributions on a more frequent basis to comply with the distribution requirements of the Internal Revenue Code of 1986, as amended (the “Code”). To the extent that net realized capital gains can be offset by capital loss carryovers, it is the policy of the fund not to distribute such gains. Income and capital gain distributions are determined in accordance with income tax regulations, which may differ from GAAP.
(e) Federal income taxes: It is the policy of the fund to continue to qualify as a regulated investment company, if such qualification is in the best interests of its shareholders, by complying with the applicable provisions of the Code, and to make distributions of taxable income and
34
net realized capital gain sufficient to relieve it from substantially all federal income and excise taxes.
As of and during the period ended November 30, 2018, the fund did not have any liabilities for any uncertain tax positions. The fund recognizes interest and penalties, if any, related to uncertain tax positions as income tax expense in the Statement of Operations. During the period ended November 30, 2018, the fund did not incur any interest or penalties.
Each tax year in the four-year period ended November 30, 2018 remains subject to examination by the Internal Revenue Service and state taxing authorities.
At November 30, 2018, the components of accumulated earnings on a tax basis were as follows: undistributed ordinary income $12,320,427, undistributed capital gains $69,306,294 and unrealized appreciation $101,989,075. In addition, the fund had $921,742 of capital losses realized after October 31, 2018, which were deferred for tax purposes to the first day of the following fiscal year.
The tax character of distributions paid to shareholders during the fiscal periods ended November 30, 2018 and November 30, 2017 were as follows: ordinary income $12,740,954 and $4,900,037, and long-term capital gains $43,170,079 and $0, respectively.
(f) New Accounting Pronouncements: In August 2018, the FASB issued Accounting Standards Update 2018-13, Fair Value Measurement (Topic 820): Disclosure Framework—Changes to the Disclosure Requirements for Fair Value Measurement (“ASU 2018-13”). The update provides guidance that eliminates, adds and modifies certain disclosure requirements for fair value measurements. ASU 2018-13 will be effective for annual periods beginning after December 15, 2019. Management is currently assessing the potential impact of these changes to future financial statements.
NOTE 2—Bank Lines of Credit:
The fund participates with other Dreyfus-managed long-term open-end funds in an $1.030 billion unsecured credit facility led by Citibank, N.A. (the “Citibank Credit Facility”) and a $300 million unsecured credit facility provided by The Bank of New York Mellon (the “BNYM Credit Facility”), each to be utilized primarily for temporary or emergency purposes, including the financing of redemptions (each, a “Facility”). The Citibank Credit Facility is available in two tranches: (i) Tranche A is in an amount equal to $830 million and is available to all long-term open-ended funds, including the fund, and (ii) Tranche B is in amount equal to $200 million
35
NOTES TO FINANCIAL STATEMENTS(continued)
and is available only to the Dreyfus Floating Rate Income Fund, a series of The Dreyfus/Laurel Funds, Inc. Prior to October 3, 2018, the unsecured credit facility with Citibank, N.A. was $830 million. In connection therewith, the fund has agreed to pay its pro rata portion of commitment fees for Tranche A of the Citibank Credit Facility and the BNYM Credit Facility. Interest is charged to the fund based on rates determined pursuant to the terms of the respective Facility at the time of borrowing. During the period ended November 30, 2018, the fund did not borrow under the Facilities.
NOTE 3—Management Fee, Sub-Investment Advisory Fee and Other Transactions with Affiliates:
(a)Pursuant to a management agreement with Dreyfus, the management fee is computed at the annual rate of .90% of the value of the fund’s average daily net assets and is payable monthly. Dreyfus has contractually agreed, from December 1, 2017 through March 29, 2019, to waive receipt of its fees and/or assume the direct expenses of the fund, so that the direct expenses of none of the classes (excluding Rule 12b-1 Distribution Plan fees, Shareholder Services Plan fees, taxes, interest expense, brokerage commissions, commitment fees on borrowings and extraordinary expenses) exceed 1.05% of the value of the fund’s average daily net assets. On or after March 29, 2019, Dreyfus may terminate this expense limitation at any time. The reduction in expenses, pursuant to the undertakings, amounted to $901 during the period ended November 30, 2018.
Pursuant to a Portfolio Allocation Agreement between Dreyfus and EACM, Dreyfus pays EACM a monthly fee at an annual rate of .10% of the value of the fund’s average daily net assets. Effective November 7, 2018, The Portfolio Allocation Agreement between Dreyfus and EACM was terminated. Dreyfus assumed the portfolio allocation management responsibilities of EACM.
Pursuant to separate sub-investment advisory agreements between Dreyfus and TS&W, Walthausen, Neuberger Berman, Kayne, Channing and Eastern Shore, each serves as the fund’s sub-investment adviser responsible for the day-to-day management of a portion of the fund’s portfolio. Dreyfus pays each sub-investment adviser a monthly fee at an annual percentage of the value of the fund’s average daily net assets. Dreyfus has obtained an exemptive order from the SEC (the “Order”), upon which the fund may rely, to use a manager of managers approach that permits Dreyfus, subject to certain conditions and approval by the Board, to enter into and materially amend sub-investment advisory agreements with one or more sub-investment advisers who are either unaffiliated with Dreyfus or are wholly-owned subsidiaries (as defined
36
under the Act) of Dreyfus’ ultimate parent company, BNY Mellon, without obtaining shareholder approval. The Order also allows the fund to disclose the sub-investment advisory fee paid by Dreyfus to any unaffiliated sub-investment adviser in the aggregate with other unaffiliated sub-investment advisers in documents filed with the SEC and provided to shareholders. In addition, pursuant to the Order, it is not necessary to disclose the sub-investment advisory fee payable by Dreyfus separately to a sub-investment adviser that is a wholly-owned subsidiary of BNY Mellon in documents filed with the SEC and provided to shareholders; such fees are to be aggregated with fees payable to Dreyfus. Dreyfus has ultimate responsibility (subject to oversight by the Board) to supervise any sub-investment adviser and recommend the hiring, termination, and replacement of any sub-investment adviser to the Board.
During the period ended November 30, 2018, the Distributor retained $1 from commissions earned on sales of the fund’s Class A shares.
(b) Under the Distribution Plan adopted pursuant to Rule 12b-1 under the Act, Class C shares pay the Distributor for distributing its shares at an annual rate of .75% of the value of its average daily net assets. During the period ended November 30, 2018, Class C shares were charged $2,664 pursuant to the Distribution Plan.
(c)Under the Shareholder Services Plan, Class A and Class C shares pay the Distributor at an annual rate of .25% of the value of their average daily net assets for the provision of certain services. The services provided may include personal services relating to shareholder accounts, such as answering shareholder inquiries regarding the fund and providing reports and other information, and services related to the maintenance of shareholder accounts. The Distributor may make payments to Service Agents (securities dealers, financial institutions or other industry professionals) with respect to these services. The Distributor determines the amounts to be paid to Service Agents. During the period ended November 30, 2018, Class A and Class C shares were charged $2,833and $887, respectively, pursuant to the Shareholder Services Plan.
The fund has arrangements with the transfer agent and the custodian whereby the fund may receive earnings credits when positive cash balances are maintained, which are used to offset transfer agency and custody fees. For financial reporting purposes, the fund includes net earnings credits, if any, as an expense offset in the Statement of Operations.
The fund compensates Dreyfus Transfer, Inc., a wholly-owned subsidiary of Dreyfus, under a transfer agency agreement for providing transfer agency and cash management services for the fund. The majority of
37
NOTES TO FINANCIAL STATEMENTS(continued)
transfer agency fees are comprised of amounts paid on a per account basis, while cash management fees are related to fund subscriptions and redemptions. During the period ended November 30, 2018, the fund was charged $5,079 for transfer agency services. These fees are included in Shareholder servicing costs in the Statement of Operations.
The fund compensates The Bank of New York Mellon under a custody agreement for providing custodial services for the fund. These fees are determined based on net assets, geographic region and transaction activity. During the period ended November 30, 2018, the fund was charged $25,868 pursuant to the custody agreement. These fees were offset by earnings credits of $25,868.
During the period ended November 30, 2018, the fund was charged $25,559 for services performed by the Chief Compliance Officer and his staff. These fees are included in Miscellaneous in the Statement of Operations.
The components of “Due to The Dreyfus Corporation and affiliates” in the Statement of Assets and Liabilities consist of: management fees $608,526, Distribution Plan fees $339, Shareholder Services Plan fees $329, Custodian fees $20,000, Chief Compliance Officer fees $10,482 and transfer agency fees $965, which are offset against an expense reimbursement currently in effect in the amount of $115.
(d) Each Board member also serves as a Board member of other funds within the Dreyfus complex. Annual retainer fees and attendance fees are allocated to each fund based on net assets.
NOTE 4—Securities Transactions:
The aggregate amount of purchases and sales of investment securities, excluding short-term securities, during the period ended November 30, 2018, amounted to $525,666,178 and $662,475,833, respectively.
At November 30, 2018, the cost of investments for federal income tax purposes was $713,614,144; accordingly, accumulated net unrealized appreciation on investments was $101,989,075, consisting of $158,604,707 gross unrealized appreciation and $56,615,632 gross unrealized depreciation.
38
REPORT OF INDEPENDENT REGISTERED PUBLIC ACCOUNTING FIRM
To the Shareholders and the Board of Directors of Dreyfus Select Managers Small Cap Value Fund
Opinion on the Financial Statements
We have audited the accompanying statement of assets and liabilities of Dreyfus Select Managers Small Cap Value Fund (the “Fund”) (one of the funds constituting Strategic Funds, Inc.), including the statements of investments and investments in affiliated issuers, as of November 30, 2018, and the related statement of operations for the year then ended, the statements of changes in net assets for each of the two years in the period then ended, the financial highlights for each of the five years in the period then ended and the related notes (collectively referred to as the “financial statements”). In our opinion, the financial statements present fairly, in all material respects, the financial position of the Fund (one of the funds constituting Strategic Funds, Inc.) at November 30, 2018, the results of its operations for the year then ended, the changes in its net assets for each of the two years in the period then ended and its financial highlights for each of the five years in the period then ended, in conformity with U.S. generally accepted accounting principles.
Basis for Opinion
These financial statements are the responsibility of the Fund’s management. Our responsibility is to express an opinion on the Fund’s financial statements based on our audits. We are a public accounting firm registered with the Public Company Accounting Oversight Board (United States) (“PCAOB”) and are required to be independent with respect to the Fund in accordance with the U.S. federal securities laws and the applicable rules and regulations of the Securities and Exchange Commission and the PCAOB.
We conducted our audits in accordance with the standards of the PCAOB. Those standards require that we plan and perform the audit to obtain reasonable assurance about whether the financial statements are free of material misstatement, whether due to error or fraud. The Fund is not required to have, nor were we engaged to perform, an audit of the Fund’s internal control over financial reporting. As part of our audits, we are required to obtain an understanding of internal control over financial reporting, but not for the purpose of expressing an opinion on the effectiveness of the Fund’s internal control over financial reporting. Accordingly, we express no such opinion.
Our audits included performing procedures to assess the risks of material misstatement of the financial statements, whether due to error or fraud, and performing procedures that respond to those risks. Such procedures included examining, on a test basis, evidence regarding the amounts and disclosures in the financial statements. Our procedures included confirmation of securities owned as of November 30, 2018, by correspondence with the custodian and others or by other appropriate auditing procedures where replies from others were not received. Our audits also included evaluating the accounting principles used and significant estimates made by management, as well as evaluating the overall presentation of the financial statements. We believe that our audits provide a reasonable basis for our opinion.

We have served as the auditor of one or more Dreyfus investment companies since at least 1957, but we are unable to determine the specific year.
New York, New York
January 28, 2019
39
IMPORTANT TAX INFORMATION(Unaudited)
For federal tax purposes the fund hereby reports 85.23% of the ordinary dividends paid during the fiscal year ended November 30, 2018 as qualifying for the corporate dividends received deduction. Also certain dividends paid by the fund may be subject to a maximum tax rate of 15%, as provided for by the Jobs and Growth Tax Relief Reconciliation Act of 2003. Of the distributions paid during the fiscal year, $8,617,619 represents the maximum amount that may be considered qualified dividend income. Shareholders will receive notification in early 2019 of the percentage applicable to the preparation of their 2018 income tax returns. Also, the fund hereby reports $.0015 per share as a short-term capital gain distribution and $.0192 per share as a long-term capital gain distribution paid on March 20, 2018 and also $.2963 per share as a short-term capital gain distribution and $1.1886 per share as a long-term capital gain distribution paid on December 29, 2017.
40
INFORMATION ABOUT THE RENEWAL OF THE FUND’S MANAGEMENT, PORTFOLIO ALLOCATION MANAGEMENT AND SUB-INVESTMENT ADVISORY AGREEMENTS (Unaudited)
At a meeting of the fund’s Board of Directors held on November 5-6, 2018, the Board considered and approved an amended Management Agreement (the “Amended Management Agreement”), pursuant to which Dreyfus provides the fund with investment advisory and administrative services. Representatives of Dreyfus advised that he Bank of New York Mellon Corporation, the parent company of EACM Advisors LLC (“EACM”) intended to terminate the existence of EACM, and, accordingly, fund management proposed that the Board terminate the portfolio allocation management agreement between EACM and Dreyfus. Fund management explained that the proposed Amended Management Agreement would include, among other provisions, (i) perform initial due diligence on prospective sub-investment advisers to the Series, (ii) recommend sub-investment advisers for the Series and determine the portion of the Series’ assets to be managed by each sub-investment adviser, (iii) monitor and evaluate the performance of any sub-investment adviser selected to manage the Series’ assets and (iv) determine and, in your discretion, adjust the allocation of the assets of the Series among, if applicable, the sub-investment advisers selected to manage such Series’ assets. The Board also considered and approved each of Dreyfus’ separate Sub-Investment Advisory Agreements (collectively with the Amended Management Agreement, the “Agreements”) with each of Channing Capital Management, LLC, Eastern Shore Capital Management, Kayne Anderson Rudnick Investment Management, LLC, Neuberger Berman Investment Advisers LLC, Thompson, Siegel and Walmsley LLC and Walthausen & Co., LLC (each, a “Subadviser” and collectively, the “Subadvisers”), pursuant to which each Subadviser serves as a sub-investment adviser and provides day-to-day management of the fund’s investments.
The Board members, a majority of whom are not “interested persons” (as defined in the Investment Company Act of 1940, as amended) of the fund, were assisted in their review by independent legal counsel and met with counsel in executive session separate from representatives of Dreyfus and the Subadvisers. In considering the renewal of the Agreements, the Board considered all factors that it believed to be relevant, including those discussed below. The Board did not identify any one factor as dispositive, and each Board member may have attributed different weights to the factors considered.
Analysis of Nature, Extent, and Quality of Services Provided to the Fund. The Board considered information provided to it at the meeting and in previous presentations from Dreyfus representatives regarding the nature, extent, and quality of the services provided to funds in the Dreyfus fund complex. Dreyfus provided the number of open accounts in the fund, the fund’s asset size and the allocation of fund assets among distribution channels. Dreyfus also had previously provided information regarding the diverse intermediary relationships and distribution channels of funds in the Dreyfus fund complex (such as retail direct or intermediary, in which intermediaries typically are paid by the fund and/or Dreyfus) and Dreyfus’ corresponding need for broad, deep, and diverse resources to be able to provide ongoing shareholder services to each intermediary or distribution channel, as applicable to the fund.
The Board also considered research support available to, and portfolio management capabilities of, the fund’s portfolio management personnel and that Dreyfus also provides oversight of day-to-day fund operations, including fund accounting and administration and
41
INFORMATION ABOUT THE RENEWAL OF THE FUND’S MANAGEMENT, PORTFOLIO ALLOCATION MANAGEMENT AND SUB-INVESTMENT ADVISORY AGREEMENTS (Unaudited) (continued)
assistance in meeting legal and regulatory requirements. The Board also considered Dreyfus’ extensive administrative, accounting and compliance infrastructures, as well as Dreyfus’ supervisory, evaluation and other responsibilities in respect of the Subadvisers. The Board also considered portfolio management’s brokerage policies and practices (including policies and practices regarding soft dollars) and the standards applied in seeking best execution.
Comparative Analysis of the Fund’s Performance and Management Fee and Expense Ratio. The Board reviewed reports prepared by Broadridge Financial Solutions, Inc. (“Broadridge”), an independent provider of investment company data, which included information comparing (1) the fund’s performance with the performance of a group of comparable funds (the “Performance Group”) and with a broader group of funds (the “Performance Universe”), all for various periods ended September 30, 2018, and (2) the fund’s actual and contractual management fees and total expenses with those of a group of comparable funds (the “Expense Group”) and with a broader group of funds (the “Expense Universe”), the information for which was derived in part from fund financial statements available to Broadridge as of the date of its analysis. Dreyfus previously had furnished the Board with a description of the methodology Broadridge used to select the Performance Group and Performance Universe and the Expense Group and Expense Universe.
Dreyfus representatives stated that the usefulness of performance comparisons may be affected by a number of factors, including different investment limitations and policies that may be applicable to the fund and comparison funds. The Board discussed with representatives of Dreyfus, its affiliates and/or the Subadvisers the results of the comparisons and considered that the fund’s total return performance was at or above the Performance Group median for all periods, except for the three- and four-year periods when it was below the Performance Group median, and was below the Performance Universe median for all periods. The Board considered the relative proximity of the fund’s performance to the Performance Group and/or Performance Universe median in certain periods when performance was below median. Dreyfus also provided a comparison of the fund’s calendar year total returns to the returns of the fund’s benchmark index, and it was considered that the fund’s returns were above the returns of the index in five of the nine calendar years shown.
The Board also reviewed the range of actual and contractual management fees and total expenses of the Expense Group and Expense Universe funds and discussed the results of the comparisons. The Board considered that the fund’s contractual management fee was approximately equal to the Expense Group median, the fund’s actual management fee was below the Expense Group median and above the Expense Universe median and the fund’s total expenses were at the Expense Group and Expense Universe medians.
Dreyfus representatives stated that Dreyfus has contractually agreed, until March 29, 2019, to waive receipt of its fees and/or assume the direct expenses of the fund so that the direct expenses of none of its classes (excluding Rule 12b-1 fees, shareholder services fees, taxes, interest, brokerage commissions, commitment fees on borrowings and extraordinary expenses) exceed 1.05% of the fund’s average daily net assets.
Dreyfus representatives reviewed with the Board the management or investment advisory fees (1) paid by funds advised or administered by Dreyfus that are in the same Lipper category as the fund and (2) paid to Dreyfus or the Subadvisers or their affiliates for advising
42
any separate accounts and/or other types of client portfolios that are considered to have similar investment strategies and policies as the fund (the “Similar Clients”), and explained the nature of the Similar Clients. They discussed differences in fees paid and the relationship of the fees paid in light of any differences in the services provided and other relevant factors. The Board considered the relevance of the fee information provided for the Similar Clients to evaluate the appropriateness of the fund’s management fee.
The Board considered the fee to each Subadviser in relation to the fee paid to Dreyfus by the fund and the respective services provided by each Subadviser and Dreyfus. The Board also took into consideration that each Subadviser’s fee is paid by Dreyfus (out of its fee from the fund) and not the fund.
Analysis of Profitability and Economies of Scale. Dreyfus representatives reviewed the expenses allocated and profit received by Dreyfus and its affiliates and the resulting profitability percentage for managing the fund and the aggregate profitability percentage to Dreyfus and its affiliates for managing the funds in the Dreyfus fund complex, and the method used to determine the expenses and profit. The Board concluded that the profitability results were not unreasonable, given the services rendered and service levels provided by Dreyfus. The Board also considered expense limitation arrangement and its effect on the profitability of Dreyfus and its affiliates. The Board also had been provided with information prepared by an independent consulting firm regarding Dreyfus’ approach to allocating costs to, and determining the profitability of, individual funds and the entire Dreyfus fund complex. The consulting firm also had analyzed where any economies of scale might emerge in connection with the management of a fund.
The Board considered on the advice of its counsel the profitability analysis (1) as part of its evaluation of whether the fees under the Agreements, considered in relation to the mix of services provided by Dreyfus and the Subadvisers, including the nature, extent and quality of such services, supported the renewal of the Agreements and (2) in light of the relevant circumstances for the fund and the extent to which economies of scale would be realized if the fund grows and whether fee levels reflect these economies of scale for the benefit of fund shareholders. Dreyfus representatives stated that a discussion of economies of scale is predicated on a fund having achieved a substantial size with increasing assets and that, if a fund’s assets had been stable or decreasing, the possibility that Dreyfus may have realized any economies of scale would be less. Since Dreyfus, and not the fund, pays the Subadvisers pursuant to the respective Sub-Investment Advisory Agreements, the Board did not consider any Subadviser’s profitability to be relevant to its deliberations. Dreyfus representatives also stated that, as a result of shared and allocated costs among funds in the Dreyfus fund complex, the extent of economies of scale could depend substantially on the level of assets in the complex as a whole, so that increases and decreases in complex-wide assets can affect potential economies of scale in a manner that is disproportionate to, or even in the opposite direction from, changes in the fund’s asset level. The Board also considered potential benefits to Dreyfus and each Subadviser from acting as investment adviser and sub-investment adviser, respectively, and took into consideration the soft dollar arrangements in effect for trading the fund’s investments.
At the conclusion of these discussions, the Board agreed that it had been furnished with sufficient information to make an informed business decision with respect to the renewal of
43
INFORMATION ABOUT THE RENEWAL OF THE FUND’S MANAGEMENT, PORTFOLIO ALLOCATION MANAGEMENT AND SUB-INVESTMENT ADVISORY AGREEMENTS (Unaudited) (continued)
the Agreements. Based on the discussions and considerations as described above, the Board concluded and determined as follows.
· •The Board concluded that the nature, extent and quality of the services provided by Dreyfus and the Subadvisers are adequate and appropriate.
· •The Board was somewhat concerned about the fund’s overall relative performance, but noted the favorable performance of the fund in the most recent two years compared to the Performance Group.
· •The Board concluded that the fees paid to Dreyfus and the Subadvisers continued to be appropriate under the circumstances and in light of the factors and the totality of the services provided as discussed above.
· •The Board determined that the economies of scale which may accrue to Dreyfus and its affiliates in connection with the management of the fund had been adequately considered by Dreyfus in connection with the fee rate charged to the fund pursuant to the Agreement and that, to the extent in the future it were determined that material economies of scale had not been shared with the fund, the Board would seek to have those economies of scale shared with the fund.
In evaluating the Agreements, the Board considered these conclusions and determinations and also relied on its previous knowledge, gained through meetings and other interactions with Dreyfus and its affiliates, and the Subadvisers, of Dreyfus and the Subadvisers and the services provided to the fund by Dreyfus and the Subadvisers. The Board also relied on information received on a routine and regular basis throughout the year relating to the operations of the fund and the investment management and other services provided under the Agreements, including information on the investment performance of the fund in comparison to similar mutual funds and benchmark performance indices; general market outlook as applicable to the fund; and compliance reports. In addition, the Board’s consideration of the contractual fee arrangements for this fund had the benefit of a number of years of reviews of the Agreements for the fund, or substantially similar agreements for other Dreyfus funds that the Board oversees, during which lengthy discussions took place between the Board and Dreyfus representatives. Certain aspects of the arrangements may receive greater scrutiny in some years than in others, and the Board’s conclusions may be based, in part, on their consideration of the fund’s arrangements, or substantially similar arrangements for other Dreyfus funds that the Board oversees, in prior years. The Board determined to renew the Agreements.
44
BOARD MEMBERS INFORMATION(Unaudited)
INDEPENDENT BOARD MEMBERS
Joseph S. DiMartino (75)
Chairman of the Board (1995)
Principal Occupation During Past 5 Years:
· Corporate Director and Trustee (1995-present)
Other Public Company Board Memberships During Past 5 Years:
· CBIZ (formerly, Century Business Services, Inc.), a provider of outsourcing functions for small and medium size companies, Director (1997-present)
No. of Portfolios for which Board Member Serves:123
———————
Joni Evans (76)
Board Member (2006)
Principal Occupation During Past 5 Years:
· Chief Executive Officer, www.wowOwow.com, an online community dedicated to women’s conversations and publications (2007-present)
· Principal, Joni Evans Ltd. (publishing) (2006-present)
No. of Portfolios for which Board Member Serves:21
———————
Joan Gulley (71)
Board Member (2017)
Principal Occupation During Past 5 Years:
· PNC Financial Services Group, Inc.(1993-2014), Executive Vice President and Chief Human Resources Officer and Executive Committee Member (2008-2014)
No. of Portfolios for which Board Member Serves:52
———————
Ehud Houminer (78)
Board Member (1994)
Principal Occupation During Past 5 Years:
· Board of Overseers at the Columbia Business School, Columbia
University (1992-present)
Trustee, Ben Gurion University
No. of Portfolios for which Board Member Serves: 52
———————
45
BOARD MEMBERS INFORMATION (Unaudited) (continued)
INDEPENDENT BOARD MEMBERS (continued)
Alan H. Howard (59)
Board Member (2018)
Principal Occupation During Past 5 Years:
· Managing Partner of Heathcote Advisors LLC, a financial advisory services firm (2008 – present)
· President of Dynatech/MPX Holdings LLC (2012 – present), a global supplier and service provider of military aircraft parts, including Chief Executive Officer of an operating subsidiary, Dynatech International LLC (2013 – present)
· Senior Advisor, Rossoff & Co., an independent investment banking firm (2014 – present)
Other Public Company Board Memberships During Past 5 Years:
· Movado Group, a designer and manufacturer of watches, Director (1997-present)
No. of Portfolios for which Board Member Serves:21
———————
Robin A. Melvin (55)
Board Member (1995)
Principal Occupation During Past 5 Years:
· Co-chairman, Illinois Mentoring Partnership, non-profit organization dedicated to increasing the quantity and quality of mentoring services in Illinois; (2014-present; board member since 2013)
No. of Portfolios for which Board Member Serves:99
———————
Burton N. Wallack (68)
Board Member (2006)
Principal Occupation During Past 5 Years:
· President and Co-owner of Wallack Management Company, a real estate management
company (1987-present)
No. of Portfolios for which Board Member Serves:21
———————
Benaree Pratt Wiley (72)
Board Member (2016)
Principal Occupation During Past 5 Years:
· Principal, The Wiley Group, a firm specializing in strategy and business development (2005-present)
Other Public Company Board Memberships During Past 5 Years:
· CBIZ (formerly, Century Business Services, Inc.), a provider of outsourcing functions for small and medium size companies, Director (2008-present)
No. of Portfolios for which Board Member Serves: 78
———————
46
INTERESTED BOARD MEMBERs
Gordon J. Davis (77)
Board Member (2006)
Principal Occupation During Past 5 Years:
· Partner in the law firm of Venable LLP (2012-present)
Other Public Company Board Memberships During Past 5 Years:
· Consolidated Edison, Inc., a utility company, Director (1997-2014)
· The Phoenix Companies, Inc., a life insurance company, Director (2000-2014)
No. of Portfolios for which Board Member Serves:55
Gordon J. Davis is deemed to be an “interested person” (as defined under the Act) of the Company as a result of his affiliation with Venable LLP, which provides legal services to the Company.
———————
Once elected all Board Members serve for an indefinite term, but achieve Emeritus status upon reaching age 80. The address of the Board Members and Officers is c/o The Dreyfus Corporation, 200 Park Avenue, New York, New York 10166. Additional information about the Board Members is available in the fund’s Statement of Additional Information which can be obtained from Dreyfus free of charge by calling this toll free number: 1-800-DREYFUS.
William Hodding Carter III, Emeritus Board Member
Hans C. Mautner, Emeritus Board Member
47
OFFICERS OF THE FUND(Unaudited)
BRADLEY J. SKAPYAK, President since January 2010.
Chief Operating Officer and a director of the Manager since June 2009, Chairman of Dreyfus Transfer, Inc., an affiliate of the Manager and the transfer agent of the funds, since May 2011 and Chief Executive Officer of MBSC Securities Corporation since August 2016. He is an officer of 62 investment companies (comprised of 123 portfolios) managed by the Manager. He is 60 years old and has been an employee of the Manager since February 1988.
BENNETT A. MACDOUGALL, Chief Legal Officer since October 2015.
Chief Legal Officer of the Manager and Associate General Counsel and Managing Director of BNY Mellon since June 2015; from June 2005 to June 2015, he served in various capacities with Deutsche Bank – Asset & Wealth Management Division, including as Director and Associate General Counsel, and Chief Legal Officer of Deutsche Investment Management Americas Inc. from June 2012 to May 2015. He is an officer of 63 investment companies (comprised of 148 portfolios) managed by the Manager. He is 47 years old and has been an employee of the Manager since June 2015.
JAMES BITETTO, Vice President since August 2005 and Secretary since February 2018.
Managing Counsel of BNY Mellon and Secretary of the Manager, and an officer of 63 investment companies (comprised of 148 portfolios) managed by the Manager. He is 52 years old and has been an employee of the Manager since December 1996.
SONALEE CROSS, Vice President and Assistant Secretary since March 2018.
Counsel of BNY Mellon since October 2016; Associate at Proskauer Rose LLP from April 2016 to September 2016; Attorney at EnTrust Capital from August 2015 to February 2016; Associate at Sidley Austin LLP from September 2013 until August 2015. She is an officer of 63 investment companies (comprised of 148 portfolios) managed by Dreyfus. She is 31 years old and has been an employee of the Manager since October 2016.
MAUREEN E. KANE, Vice President and Assistant Secretary since April 2015.
Managing Counsel of BNY Mellon since July 2014; from October 2004 until July 2014, General Counsel, and from May 2009 until July 2014, Chief Compliance Officer of Century Capital Management. She is an officer of 63 investment companies (comprised of 148 portfolios) managed by the Manager. She is 56 years old and has been an employee of the Manager since July 2014.
SARAH S. KELLEHER, Vice President and Assistant Secretary since April 2014.
Managing Counsel of BNY Mellon since December 2017, from March 2013 to December 2017, Senior Counsel of BNY Mellon. She is an officer of 63 investment companies (comprised of 148 portfolios) managed by the Manager. She is 43 years old and has been an employee of the Manager since March 2013.
JEFF PRUSNOFSKY, Vice President and Assistant Secretary since August 2005.
Senior Managing Counsel of BNY Mellon, and an officer of 63 investment companies (comprised of 148 portfolios) managed by the Manager. He is 53 years old and has been an employee of the Manager since October 1990.
NATALYA ZELENSKY, Vice President and Assistant Secretary since March 2017.
Counsel of BNY Mellon since May 2016; Attorney at Wildermuth Endowment Strategy Fund/Wildermuth Advisory, LLC from November 2015 until May 2016; Assistant General Counsel at RCS Advisory Services from July 2014 until November 2015; Associate at Sutherland, Asbill & Brennan from January 2013 until January 2014. She is an officer of 63 investment companies (comprised of 148 portfolios) managed by Dreyfus. She is 33 years old and has been an employee of the Manager since May 2016.
JAMES WINDELS, Treasurer since November 2001.
Director – Mutual Fund Accounting of the Manager, and an officer of 63 investment companies (comprised of 148 portfolios) managed by the Manager. He is 60 years old and has been an employee of the Manager since April 1985.
48
GAVIN C. REILLY, Assistant Treasurer since December 2005.
Tax Manager of the Investment Accounting and Support Department of the Manager, and an officer of 63 investment companies (comprised of 148 portfolios) managed by the Manager. He is 50 years old and has been an employee of the Manager since April 1991.
ROBERT S. ROBOL, Assistant Treasurer since August 2003.
Senior Accounting Manager – Dreyfus Financial Reporting of the Manager, and an officer of 63 investment companies (comprised of 148 portfolios) managed by the Manager. He is 54 years old and has been an employee of the Manager since October 1988.
ROBERT SALVIOLO, Assistant Treasurer since May 2007.
Senior Accounting Manager – Equity Funds of the Manager, and an officer of 63 investment companies (comprised of 148 portfolios) managed by the Manager. He is 51 years old and has been an employee of the Manager since June 1989.
ROBERT SVAGNA, Assistant Treasurer since August 2005.
Senior Accounting Manager – Fixed Income and Equity Funds of the Manager, and an officer of 63 investment companies (comprised of 148 portfolios) managed by the Manager. He is 51 years old and has been an employee of the Manager since November 1990.
JOSEPH W. CONNOLLY, Chief Compliance Officer since October 2004.
Chief Compliance Officer of the Manager, the Dreyfus Family of Funds and BNY Mellon Funds Trust (63 investment companies, comprised of 148 portfolios). He is 61 years old and has served in various capacities with the Manager since 1980, including manager of the firm’s Fund Accounting Department from 1997 through October 2001.
CARIDAD M. CAROSELLA, Anti-Money Laundering Compliance Officer since January 2016.
Anti-Money Laundering Compliance Officer of the Dreyfus Family of Funds and BNY Mellon Funds Trust since January 2016; from May 2015 to December 2015, Interim Anti-Money Laundering Compliance Officer of the Dreyfus Family of Funds and BNY Mellon Funds Trust and the Distributor; from January 2012 to May 2015, AML Surveillance Officer of the Distributor and from 2007 to December 2011, Financial Processing Manager of the Distributor. She is an officer of 57 investment companies (comprised of 142 portfolios) managed by the Manager. She is 50 years old and has been an employee of the Distributor since 1997.
49
Dreyfus Select Managers Small Cap Value Fund
200 Park Avenue
New York, NY 10166
Manager
The Dreyfus Corporation
200 Park Avenue
New York, NY 10166
Sub-Investment Advisers
Thompson, Siegel and Walmsley, LLC
6806 Paragon Place, Suite 300
Richmond, VA 23230
Walthausen & Co., LLC
9 Executive Park Drive, Suite B
Clifton Park, NY 12065
Neuberger Berman Investment Advisers, LLC
605 Third Avenue
New York, NY 10158
Kayne Anderson Rudnick Investment
Management, LLC
1800 Avenue of the Stars, Second Floor
Los Angeles, CA 90067
Channing Capital Management, LLC
10 South LaSalle Street
Suite 2401
Chicago, IL 60633
Eastern Shore Capital Management
18 Sewall Street
Marblehead, MA 01945
Custodian
The Bank of New York Mellon
240 Greenwich Street
New York, NY 10286
Transfer Agent &
Dividend Disbursing Agent
Dreyfus Transfer, Inc.
200 Park Avenue
New York, NY 10166
Distributor
MBSC Securities Corporation
200 Park Avenue
New York, NY 10166
| | |
Ticker Symbols: Class A: DMVAX Class C: DMECX Class I: DMVIX Class Y: DMVYX |
TelephoneCall your financial representative or 1-800-DREYFUS
MailThe Dreyfus Family of Funds, 144 Glenn Curtiss Boulevard, Uniondale, NY 11556-0144
E-mailSend your request toinfo@dreyfus.com
InternetInformation can be viewed online or downloaded atwww.dreyfus.com
The fund files its complete schedule of portfolio holdings with the Securities and Exchange Commission (“SEC”) for the first and third quarters of each fiscal year on Form N-Q. The fund’s Forms N-Q are available on the SEC’s website atwww.sec.gov.
A description of the policies and procedures that the fund uses to determine how to vote proxies relating to portfolio securities and information regarding how the fund voted these proxies for the most recent 12-month period ended June 30 is available atwww.dreyfus.com and on the SEC’s website atwww.sec.gov and without charge, upon request, by calling 1-800-DREYFUS.
| | |
© 2019 MBSC Securities Corporation
6246AR1118 | 
|
Dreyfus U.S. Equity Fund
| | | |

| | ANNUAL REPORT November 30, 2018 |
| |
Save time. Save paper. View your next shareholder report online as soon as it’s available. Log into www.dreyfus.com and sign up for Dreyfus eCommunications. It’s simple and only takes a few minutes. |
| |
The views expressed in this report reflect those of the portfolio manager(s) only through the end of the period covered and do not necessarily represent the views of Dreyfus or any other person in the Dreyfus organization. Any such views are subject to change at any time based upon market or other conditions and Dreyfus disclaims any responsibility to update such views. These views may not be relied on as investment advice and, because investment decisions for a Dreyfus fund are based on numerous factors, may not be relied on as an indication of trading intent on behalf of any Dreyfus fund. |
| |
Not FDIC-Insured • Not Bank-Guaranteed • May Lose Value |
Contents
T H E F U N D
F O R M O R E I N F O R M AT I O N
Back Cover
| | | | |
| |
Dreyfus U.S. Equity Fund
| | The Fund |
A LETTER FROM THE PRESIDENT OF DREYFUS
Dear Shareholder:
We are pleased to present this annual report for Dreyfus U.S. Equity Fund, covering the 12-month period from December 1, 2017 through November 30, 2018. For information about how the fund performed during the reporting period, as well as general market perspectives, we provide a Discussion of Fund Performance on the pages that follow.
The reporting period began with major global economies achieving above-trend growth. In the United States, a robust economy and strong labor markets encouraged the Federal Reserve to continue moving away from its accommodative monetary policy while other major central banks also began to consider monetary tightening. In the equity sphere, both U.S. and non-U.S. markets remained on an uptrend, though investor concerns about U.S. inflation and its effect on interest rates later began to weigh on global returns. Interest rates rose across the yield curve, putting pressure on bond prices.
Later in the reporting period, global growth trends began to diverge and market volatility returned. While the U.S. economy continued to grow at a healthy rate, Japan rebounded, but only briefly, from a weak first quarter, and the Eurozone economy began to moderate. Robust growth and strong corporate earnings continued to support U.S. stocks while other developed markets declined. Late in the reporting period, a broad sell-off occurred, partially offsetting earlier U.S. gains. Emerging markets remained under pressure as weakness in their currencies relative to the U.S. dollar added to investors’ uneasiness.
Fixed income markets continued to struggle as interest rates rose; the yield on the benchmark 10-year Treasury bond breached 3.2% despite only moderate inflation, but investor concerns about slowing global growth brought yields down toward the end of the reporting period.
Despite continuing doubts regarding trade, U.S. inflationary pressures and global growth, we are optimistic that the U.S. economy will remain strong in the near term. However, we remain attentive to signs that indicate potential changes on the horizon. As always, we encourage you to discuss the risks and opportunities in today’s investment environment with your financial advisor.
Thank you for your continued confidence and support.
Sincerely,

Renee Laroche-Morris
President
The Dreyfus Corporation
December 17, 2018
2
DISCUSSION OF FUND PERFORMANCE(Unaudited)
For the period from December 1, 2017 through November 30, 2018, as provided by Charlie Macquaker, Roy Leckie, and Jane Henderson, the three members of the Investment Executive at Walter Scott& Partners Limited (WS), Sub-Investment Adviser
Market and Fund Performance Overview
For the 12-month period ended November 30, 2018, Dreyfus U.S. Equity Fund’s Class A shares achieved a return of 9.49%, Class C shares returned 8.69%, Class I shares returned 9.85%, and Class Y shares returned 9.88%.1 In comparison, the fund’s benchmark, the MSCI USA Index (the “Index”), achieved a return of 5.51% over the same period.2
U.S. equities produced moderate gains during the reporting period amid improving economic prospects, rising corporate earnings, and lower corporate tax rates. Successful stock selection within the consumer discretionary and industrials sectors, along with sector allocations to financials and health care, were the primary drivers of outperformance over the period.
The Fund’s Investment Approach
The fund seeks long-term total returns. To pursue its goal, the fund normally invests at least 80% of its net assets, plus any borrowings for investment purposes, in equity securities of companies located in the United States. The fund may invest in the securities of companies of any market capitalization. Walter Scott seeks investment opportunities in companies with fundamental strengths that indicate the potential for sustainable growth. Walter Scott focuses on individual stock selection, building the fund’s portfolio from the bottom up through extensive fundamental research. The investment process begins with the screening of reported company financials. Companies that meet certain broad absolute and trend criteria are candidates for more detailed financial analysis. The fund’s Investment Team collectively reviews and selects those stocks that meet Walter Scott’s criteria and where the expected growth rate is combined with a reasonable valuation for the underlying equity. Market capitalization and sector allocations are a residual of, not part of, the investment process, because the Investment Team’s sole focus is on the analysis of and investment in individual companies.
Economic Growth Amid Rising Volatility
A positive economic backdrop supported U.S. equity markets in late 2017, including sustained GDP growth, robust labor markets, and higher growth forecasts from the Federal Reserve Board (the “Fed”) for 2018. Passage of tax-reform legislation in December 2017 sparked additional market gains, driving the Index to new all-time highs in January 2018. Some of the more economically sensitive market segments, such as the information technology and financials sectors, led the market’s advance at the time.
In the first few months of 2018, volatility entered the picture, as concerns over inflation and the potential for trade disputes roiled markets. However, U.S. markets were able to stabilize, and the upward trend continued on the back of enduring positive economic
3
DISCUSSION OF FUND PERFORMANCE(Unaudited) (continued)
data, corporate balance-sheet strength and robust consumer spending. However, non-U.S. markets slowed as the rate of economic improvement in areas such as the Eurozone stalled. In late summer, continued political rhetoric in the U.S. regarding trade and midterm elections, and concerns over issues abroad in areas such as Italy, Turkey, Argentina and the United Kingdom weighed on sentiment. Despite strong underlying fundamentals, volatility crept back into the picture in U.S. markets. Firm labor markets, tightening monetary policy and the possibility of slowing growth provoked a defensive sentiment among investors. In October, markets reversed and started to move lower. Continued worries over rising interest rates, trade disputes and falling commodity prices pressured equity markets throughout the rest of the period.
Stock Selection and Allocation Effect Buoyed Fund Results
The fund’s positive results compared to the Index stemmed from the success of our security selection and sector allocation. Stock picks within the consumer discretionary and industrials sectors were particularly additive, as was an overweight to the health care sector and lack of exposure to financials. Health care company Edwards Lifesciences was among the top overall contributors to portfolio performance. The surgery equipment company enjoyed high demand for its products, leading to favorable earnings results throughout the year. Information technology company Adobe was also a main contributor, as was automotive parts company O’Reilly Automotive.
Conversely, stock selection within the energy sector detracted from relative returns, as did a relative overweight to the materials sector. The top individual detractors included IPG Photonics, Schlumberger, andInternational Flavors and Fragrances. Fiber laser manufacturer IPG Photonics saw reduced sales during the period in its Chinese and European markets due to less downstream demand resulting from falling corporate capital expenditures. Energy company Schlumberger was hurt by continued weakness in demand for oil services outwith the U.S. Materials companyInternational Flavors and Fragrancesmade a large acquisition during the period which hurt its stock price and conflicted with our investment thesis. We have since exited the position.
Maintaining a Company-by-Company Approach
Although we do not manage the fund’s investments in response to macroeconomic trends, it is worth noting that we believe the global economic picture remains strong, supported by fiscal policies that have helped boost corporate earnings in the U.S. in particular. However, at this stage in the market cycle, confidence can be quickly undermined by unexpected political and economic developments as geopolitical tensions potentially escalate and central banks move gradually away from the aggressively accommodative policies of the past decade. We continue to keep a sharp eye on valuations in all markets.
In that context, our focus remains very much unchanged. We shall continue to identify and invest in market-leading, financially robust companies with the strategic strengths and vision to generate meaningful returns over the long term. Our distinctly long-term lens allows us to focus on the underlying strengths and opportunities of a business. Not only does that approach mean we waste very little time trying to second-guess short-
4
term market moves, but it ensures we are invested in companies that have the attributes we believe are needed to succeed regardless of the external environment in which they operate. We will continue to look for opportunities that benefit investors, capturing gains when the market rallies, and adding to fundamentally strong companies when the market pulls back.
December 17, 2018
1 Total return includes reinvestment of dividends and any capital gains paid, and does not take into consideration the maximum initial sales charge in the case of Class A shares, or the applicable contingent deferred sales charge imposed on redemptions in the case of Class C shares. Share price and investment return fluctuate such that upon redemption, fund shares may be worth more or less than their original cost. Return figures for the fund reflect the absorption of certain fund expenses by The Dreyfus Corporation pursuant to an undertaking in effect through March 29, 2019, at which time it may be extended, terminated, or modified. Had these expenses not been absorbed, the fund’s returns would have been lower. Past performance is no guarantee of future results.
2 Source: Lipper Inc. — The MSCI USA Index is designed to measure the performance of the large- and mid-cap segments of the U.S. market. It reflects reinvestment of net dividends and, where applicable, capital gain distributions. Investors cannot invest directly in any index.
Please note: the position in any security highlighted with italicized typeface was sold during the reporting period.
Equities are subject generally to market, market sector, market liquidity, issuer, and investment style risks, among other factors, to varying degrees, all of which are more fully described in the fund’s prospectus.
5
FUND PERFORMANCE(Unaudited)
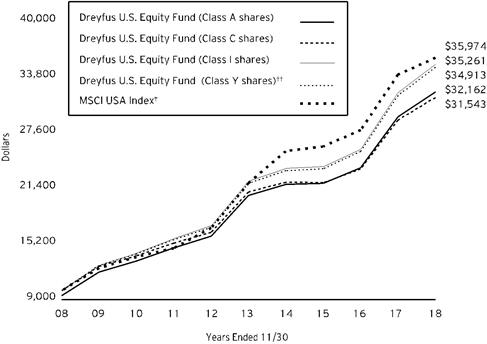
Comparison of change in value of $10,000 investment in Dreyfus U.S. Equity Fund Class A shares, Class C shares, Class I shares and Class Y shares and the MSCI USA Index (the “Index”)
† Source: Lipper Inc.
†† The total return figures presented for Class Y shares of the fund reflect the performance of the fund’s Class A shares for the period prior to 7/1/13 (the inception date for Class Y shares), not reflecting the applicable sales charges for Class A shares.
Past performance is not predictive of future performance.
The above graph compares a $10,000 investment made in each of the Class A, Class C, Class I and Class Y shares of Dreyfus U.S. Equity Fund on 11/30/08 to a $10,000 investment made in the Index on that date. All dividends and capital gain distributions are reinvested.
The fund’s performance shown in the line graph above takes into account the maximum initial sales charge on Class A shares and all other applicable fees and expenses on all classes. The Index is designed to measure the performance of the large- and mid-cap segments of the U.S. market. Unlike a mutual fund, the Index is not subject to charges, fees and other expenses. Investors cannot invest directly in any index. Further information relating to fund performance, including expense reimbursements, if applicable, is contained in the Financial Highlights section of the prospectus and elsewhere in this report.
6
| | | | | |
Average Annual Total Returnsas of 11/30/18 |
| Inception Date | 1 Year | 5 Years | 10 Years |
Class A shares | | | | |
with maximum sales charge (5.75 %) | 5/30/08 | 3.20% | 8.03% | 12.39% |
without sales charge | 5/30/08 | 9.49% | 9.31% | 13.06% |
Class C shares | | | | |
with applicable redemption charge† | 5/30/08 | 7.72% | 8.48% | 12.17% |
without redemption | 5/30/08 | 8.69% | 8.48% | 12.17% |
Class I shares | 5/30/08 | 9.85% | 9.67% | 13.43% |
Class Y shares | 7/1/13 | 9.88% | 9.71% | 13.32%†† |
MSCI USA Index | | 5.51% | 10.32% | 13.66% |
† The maximum contingent deferred sales charge for Class C shares is 1% for shares redeemed within one year of the date of purchase.
†† The total return performance figures presented for Class Y shares of the fund reflect the performance of the fund’s Class A shares for the period prior to 7/1/13 (the inception date for Class Y shares), not reflecting the applicable sales charges for Class A shares.
The performance data quoted represents past performance, which is no guarantee of future results. Share price and investment return fluctuate and an investor’s shares may be worth more or less than original cost upon redemption. Current performance may be lower or higher than the performance quoted. Go to Dreyfus.com for the fund’s most recent month-end returns.
The fund’s performance shown in the graph and table does not reflect the deduction of taxes that a shareholder would pay on fund distributions or the redemption of fund shares. In addition to the performance of Class A shares shown with and without a maximum sales charge, the fund's performance shown in the table takes into account all other applicable fees and expenses on all classes.
7
UNDERSTANDING YOUR FUND’S EXPENSES(Unaudited)
As a mutual fund investor, you pay ongoing expenses, such as management fees and other expenses. Using the information below, you can estimate how these expenses affect your investment and compare them with the expenses of other funds. You also may pay one-time transaction expenses, including sales charges (loads) and redemption fees, which are not shown in this section and would have resulted in higher total expenses. For more information, see your fund’s prospectus or talk to your financial adviser.
Review your fund’s expenses
The table below shows the expenses you would have paid on a $1,000 investment in Dreyfus U.S. Equity Fund from June 1, 2018 to November 30, 2018. It also shows how much a $1,000 investment would be worth at the close of the period, assuming actual returns and expenses.
| | | | | | | | | |
Expenses and Value of a $1,000 Investment | | |
assuming actual returns for the six months ended November 30, 2018 |
| | Class A | Class C | Class I | Class Y |
Expenses paid per $1,000† | | $5.90 | | $9.73 | | $4.26 | | $4.11 |
Ending value (after expenses) | | $1,047.70 | | $1,043.20 | | $1,049.00 | | $1,049.60 |
COMPARING YOUR FUND’S EXPENSES
WITH THOSE OF OTHER FUNDS(Unaudited)
Using the SEC’s method to compare expenses
The Securities and Exchange Commission (“SEC”) has established guidelines to help investors assess fund expenses. Per these guidelines, the table below shows your fund’s expenses based on a $1,000 investment, assuming a hypothetical 5% annualized return. You can use this information to compare the ongoing expenses (but not transaction expenses or total cost) of investing in the fund with those of other funds. All mutual fund shareholder reports will provide this information to help you make this comparison. Please note that you cannot use this information to estimate your actual ending account balance and expenses paid during the period.
| | | | | | | | | | | |
Expenses and Value of a $1,000 Investment | | |
assuming a hypothetical 5% annualized return for the six months ended November 30, 2018 |
| | Class A | Class C | Class I | Class Y |
Expenses paid per $1,000† | | $5.82 | | $9.60 | | $4.20 | | $4.05 |
Ending value (after expenses) | | $1,019.30 | | $1,015.54 | | $1,020.91 | | $1,021.06 |
† Expenses are equal to the fund’s annualized expense ratio of 1.15% for Class A, 1.90% for Class C, .83% for Class I and .80% for Class Y, multiplied by the average account value over the period, multiplied by 183/365 (to reflect the one-half year period).
8
STATEMENT OF INVESTMENTS
November 30, 2018
| | | | | | | | |
| |
Description | | | | Shares | | Value ($) | |
Common Stocks - 98.2% | | | | | |
Capital Goods - 9.1% | | | | | |
Donaldson | | | | 114,900 | | 6,438,996 | |
Fastenal | | | | 214,200 | a | 12,693,492 | |
Flowserve | | | | 210,500 | | 10,211,355 | |
Hexcel | | | | 161,200 | | 9,941,204 | |
Toro | | | | 184,800 | | 11,455,752 | |
| | | | | 50,740,799 | |
Commercial & Professional Services - 1.1% | | | | | |
Healthcare Services Group | | | | 129,000 | a | 6,088,800 | |
Consumer Durables & Apparel - 2.2% | | | | | |
NIKE, Cl. B | | | | 165,100 | | 12,402,312 | |
Consumer Services - 4.6% | | | | | |
McDonald's | | | | 65,700 | | 12,385,107 | |
Starbucks | | | | 197,100 | | 13,150,512 | |
| | | | | 25,535,619 | |
Energy - 5.8% | | | | | |
EOG Resources | | | | 96,020 | | 9,919,826 | |
Occidental Petroleum | | | | 150,300 | | 10,561,581 | |
Pioneer Natural Resources | | | | 28,700 | | 4,240,425 | |
Schlumberger | | | | 170,650 | | 7,696,315 | |
| | | | | 32,418,147 | |
Health Care Equipment & Services - 13.7% | | | | | |
Cerner | | | | 166,200 | b | 9,624,642 | |
Edwards Lifesciences | | | | 95,200 | b | 15,423,352 | |
Henry Schein | | | | 154,600 | a,b | 13,790,320 | |
Intuitive Surgical | | | | 27,100 | b | 14,386,577 | |
ResMed | | | | 107,100 | | 11,972,709 | |
Stryker | | | | 63,200 | | 11,089,072 | |
| | | | | 76,286,672 | |
Household & Personal Products - 3.8% | | | | | |
Colgate-Palmolive | | | | 175,700 | | 11,160,464 | |
Estee Lauder, Cl. A | | | | 71,200 | | 10,157,392 | |
| | | | | 21,317,856 | |
Materials - 6.1% | | | | | |
Ecolab | | | | 70,300 | | 11,282,447 | |
FMC | | | | 130,500 | | 10,797,570 | |
Linde | | | | 73,600 | | 11,706,080 | |
| | | | | 33,786,097 | |
Media & Entertainment - 3.9% | | | | | |
Alphabet, Cl. C | | | | 9,906 | b | 10,841,424 | |
Walt Disney | | | | 97,200 | | 11,225,628 | |
| | | | | 22,067,052 | |
9
STATEMENT OF INVESTMENTS (continued)
| | | | | | | | |
| |
Description | | | | Shares | | Value ($) | |
Common Stocks - 98.2% (continued) | | | | | |
Pharmaceuticals Biotechnology & Life Sciences - 10.7% | | | | | |
Biogen | | | | 37,300 | b | 12,447,756 | |
Eli Lilly & Co. | | | | 66,800 | | 7,925,152 | |
Gilead Sciences | | | | 141,500 | | 10,179,510 | |
Johnson & Johnson | | | | 76,300 | | 11,208,470 | |
Mettler-Toledo International | | | | 12,100 | b | 7,703,586 | |
Waters | | | | 52,200 | b | 10,365,876 | |
| | | | | 59,830,350 | |
Retailing - 6.6% | | | | | |
Booking Holdings | | | | 6,000 | b | 11,351,280 | |
O'Reilly Automotive | | | | 30,600 | b | 10,611,468 | |
The TJX Companies | | | | 302,400 | | 14,772,240 | |
| | | | | 36,734,988 | |
Software & Services - 20.1% | | | | | |
Adobe | | | | 58,700 | b | 14,727,243 | |
Automatic Data Processing | | | | 94,900 | | 13,990,158 | |
Cognizant Technology Solutions, Cl. A | | | | 141,200 | | 10,057,676 | |
Jack Henry & Associates | | | | 71,800 | | 10,030,460 | |
Manhattan Associates | | | | 247,500 | b | 12,258,675 | |
Mastercard, Cl. A | | | | 62,000 | | 12,466,340 | |
Microsoft | | | | 131,500 | | 14,582,035 | |
Oracle | | | | 257,000 | | 12,531,320 | |
Paychex | | | | 159,000 | | 11,250,840 | |
| | | | | 111,894,747 | |
Technology Hardware & Equipment - 8.5% | | | | | |
Amphenol | | | | 125,500 | | 11,036,470 | |
Cisco Systems | | | | 273,100 | | 13,073,297 | |
Cognex | | | | 202,000 | a | 8,892,040 | |
IPG Photonics | | | | 43,900 | b | 6,240,385 | |
Te Connectivity | | | | 110,300 | | 8,485,379 | |
| | | | | 47,727,571 | |
Transportation - 2.0% | | | | | |
Expeditors International of Washington | | | | 145,000 | | 11,033,050 | |
Total Common Stocks(cost $335,694,050) | | | | 547,864,060 | |
| | | 1-Day
Yield (%) | | | | | |
Investment Companies - 1.7% | | | | | |
Registered Investment Companies - 1.7% | | | | | |
Dreyfus Institutional Preferred Government Plus Money Market Fund
(cost $9,587,340) | | 2.23 | | 9,587,340 | c | 9,587,340 | |
10
| | | | | | | | |
| |
Description | | 1-Day
Yield (%) | | Shares | | Value ($) | |
Investment of Cash Collateral for Securities Loaned - .9% | | | | | |
Registered Investment Companies - .9% | | | | | |
Dreyfus Institutional Preferred Government Money Market Fund, Institutional Shares
(cost $4,646,934) | | 2.19 | | 4,646,934 | c | 4,646,934 | |
Total Investments(cost $349,928,324) | | 100.8% | | 562,098,334 | |
Liabilities, Less Cash and Receivables | | (.8%) | | (4,240,316) | |
Net Assets | | 100.0% | | 557,858,018 | |
aSecurity, or portion thereof, on loan. At November 30, 2018, the value of the fund’s securities on loan was $38,653,476 and the value of the collateral held by the fund was $39,093,876, consisting of cash collateral of $4,646,934 and U.S. Government & Agency securities valued at $34,446,942.
b Non-income producing security.
c Investment in affiliated issuer. The investment objective of this investment company is publicly available and can be found within the investment company’s prospectus.
| | |
Portfolio Summary (Unaudited)† | Value (%) |
Information Technology | 30.6 |
Health Care | 24.4 |
Consumer Discretionary | 15.4 |
Industrials | 12.2 |
Materials | 6.1 |
Energy | 5.8 |
Consumer Staples | 3.8 |
Investment Companies | 2.5 |
| | 100.8 |
† Based on net assets.
See notes to financial statements.
11
STATEMENT OF INVESTMENTS IN AFFILIATED ISSUERS
| | | | | | | |
Registered Investment Companies | Value
11/30/17($) | Purchases($) | Sales($) | Value
11/30/18($) | Net
Assets(%) | Dividend/
Distributions($) |
Dreyfus Institutional Preferred Government Plus Money Market Fund | 5,678,551 | 123,541,086 | 119,632,297 | 9,587,340 | 1.7 | 191,027 |
Dreyfus Institutional Preferred Government Money Market Fund, Institutional Shares | - | 24,247,987 | 19,601,053 | 4,646,934 | .9 | - |
Total | 5,678,551 | 147,789,073 | 139,233,350 | 14,234,274 | 2.6 | 191,027 |
See notes to financial statements.
12
STATEMENT OF ASSETS AND LIABILITIES
November 30, 2018
| | | | | | | |
| | | | | | |
| | | Cost | | Value | |
Assets ($): | | | | |
Investments in securities—See Statement of Investments
(including securities on loan, valued at $38,653,476)—Note 1(b): | | | |
Unaffiliated issuers | 335,694,050 | | 547,864,060 | |
Affiliated issuers | | 14,234,274 | | 14,234,274 | |
Dividends and securities lending income receivable | | 590,264 | |
Receivable for shares of Common Stock subscribed | | 406,242 | |
Prepaid expenses | | | | | 24,910 | |
| | | | | 563,119,750 | |
Liabilities ($): | | | | |
Due to The Dreyfus Corporation and affiliates—Note 3(c) | | | | 349,734 | |
Liability for securities on loan—Note 1(b) | | 4,646,934 | |
Payable for shares of Common Stock redeemed | | 191,701 | |
Directors fees and expenses payable | | 9,805 | |
Accrued expenses | | | | | 63,558 | |
| | | | | 5,261,732 | |
Net Assets ($) | | | 557,858,018 | |
Composition of Net Assets ($): | | | | |
Paid-in capital | | | | | 293,182,415 | |
Total distributable earnings (loss) | | | | | 264,675,603 | |
Net Assets ($) | | | 557,858,018 | |
| | | | | | |
Net Asset Value Per Share | Class A | Class C | Class I | Class Y | |
Net Assets ($) | 787,073 | 85,503 | 22,755,151 | 534,230,291 | |
Shares Outstanding | 38,506 | 4,483 | 1,107,648 | 26,014,031 | |
Net Asset Value Per Share ($) | 20.44 | 19.07 | 20.54 | 20.54 | |
| | | | | | |
See notes to financial statements. | | | | | |
13
STATEMENT OF OPERATIONS
Year Ended November 30, 2018
| | | | | | | |
| | | | | | |
| | | | | | |
Investment Income ($): | | | | |
Income: | | | | |
Cash dividends: | |
Unaffiliated issuers | | | 7,055,203 | |
Affiliated issuers | | | 191,027 | |
Income from securities lending—Note 1(b) | | | 36,282 | |
Total Income | | | 7,282,512 | |
Expenses: | | | | |
Management fee—Note 3(a) | | | 4,109,809 | |
Professional fees | | | 88,498 | |
Registration fees | | | 60,609 | |
Directors’ fees and expenses—Note 3(d) | | | 55,818 | |
Loan commitment fees—Note 2 | | | 12,126 | |
Shareholder servicing costs—Note 3(c) | | | 10,095 | |
Prospectus and shareholders’ reports | | | 9,798 | |
Custodian fees—Note 3(c) | | | 8,133 | |
Distribution fees—Note 3(b) | | | 820 | |
Miscellaneous | | | 36,731 | |
Total Expenses | | | 4,392,437 | |
Less—reduction in expenses due to undertaking—Note 3(a) | | | (1,294) | |
Less—reduction in fees due to earnings credits—Note 3(c) | | | (413) | |
Net Expenses | | | 4,390,730 | |
Investment Income—Net | | | 2,891,782 | |
Realized and Unrealized Gain (Loss) on Investments—Note 4 ($): | | |
Net realized gain (loss) on investments | 49,619,802 | |
Net unrealized appreciation (depreciation) on investments | | | (1,641,630) | |
Net Realized and Unrealized Gain (Loss) on Investments | | | 47,978,172 | |
Net Increase in Net Assets Resulting from Operations | | 50,869,954 | |
| | | | | | | |
See notes to financial statements. | | | | | |
14
STATEMENT OF CHANGES IN NET ASSETS
| | | | | | | | | | |
| | | | Year Ended November 30, |
| | | | 2018 | | 2017a | |
Operations ($): | | | | | | | | |
Investment income—net | | | 2,891,782 | | | | 3,293,885 | |
Net realized gain (loss) on investments | | 49,619,802 | | | | 56,604,160 | |
Net unrealized appreciation (depreciation)
on investments | | (1,641,630) | | | | 53,222,292 | |
Net Increase (Decrease) in Net Assets
Resulting from Operations | 50,869,954 | | | | 113,120,337 | |
Distributions ($): | |
Distributions to shareholders: | | | | | | | | |
Class A | | | (90,769) | | | | (139,450) | |
Class C | | | (12,898) | | | | (21,301) | |
Class I | | | (2,474,479) | | | | (1,312,143) | |
Class Y | | | (57,283,211) | | | | (40,310,730) | |
Total Distributions | | | (59,861,357) | | | | (41,783,624) | |
Capital Stock Transactions ($): | |
Net proceeds from shares sold: | | | | | | | | |
Class A | | | 109,475 | | | | 96,470 | |
Class C | | | 10,387 | | | | 2,957 | |
Class I | | | 12,447,070 | | | | 9,393,371 | |
Class Y | | | 64,270,703 | | | | 55,483,380 | |
Distributions reinvested: | | | | | | | | |
Class A | | | 85,430 | | | | 133,209 | |
Class C | | | 12,511 | | | | 18,344 | |
Class I | | | 1,975,961 | | | | 1,099,360 | |
Class Y | | | 29,437,437 | | | | 21,766,738 | |
Cost of shares redeemed: | | | | | | | | |
Class A | | | (231,056) | | | | (1,244,703) | |
Class C | | | (70,392) | | | | (168,495) | |
Class I | | | (12,202,578) | | | | (8,993,949) | |
Class Y | | | (78,202,063) | | | | (104,626,445) | |
Increase (Decrease) in Net Assets
from Capital Stock Transactions | 17,642,885 | | | | (27,039,763) | |
Total Increase (Decrease) in Net Assets | 8,651,482 | | | | 44,296,950 | |
Net Assets ($): | |
Beginning of Period | | | 549,206,536 | | | | 504,909,586 | |
End of Period | | | 557,858,018 | | | | 549,206,536 | |
15
STATEMENT OF CHANGES IN NET ASSETS (continued)
| | | | | | | | | | |
| | | | Year Ended November 30, |
| | | | 2018 | | 2017a | |
Capital Share Transactions (Shares): | |
Class Ab | | | | | | | | |
Shares sold | | | 5,413 | | | | 5,210 | |
Shares issued for distributions reinvested | | | 4,525 | | | | 7,864 | |
Shares redeemed | | | (11,812) | | | | (69,741) | |
Net Increase (Decrease) in Shares Outstanding | (1,874) | | | | (56,667) | |
Class Cb | | | | | | | | |
Shares sold | | | 541 | | | | 183 | |
Shares issued for distributions reinvested | | | 705 | | | | 1,138 | |
Shares redeemed | | | (3,773) | | | | (9,635) | |
Net Increase (Decrease) in Shares Outstanding | (2,527) | | | | (8,314) | |
Class Ic | | | | | | | | |
Shares sold | | | 628,934 | | | | 503,259 | |
Shares issued for distributions reinvested | | | 104,438 | | | | 64,706 | |
Shares redeemed | | | (625,791) | | | | (483,697) | |
Net Increase (Decrease) in Shares Outstanding | 107,581 | | | | 84,268 | |
Class Yc | | | | | | | | |
Shares sold | | | 3,225,362 | | | | 2,975,417 | |
Shares issued for distributions reinvested | | | 1,556,712 | | | | 1,281,905 | |
Shares redeemed | | | (3,927,879) | | | | (5,555,650) | |
Net Increase (Decrease) in Shares Outstanding | 854,195 | | | | (1,298,328) | |
| | | | | | | | | | |
aDistributions to shareholders include $9,256 Class A, $123,718 Class I and $3,968,104 Class Y of distributions from net investment income and $130,194 Class A, $21,301 Class C, $1,188,425 Class I and $36,342,626 Class Y distributions from net realized gains. Undistributed investment income—net was $3,257,620 in 2018 and is no longer presented as a result of the adoption of SEC’s Disclosure Update and Simplification Rule. | |
bDuring the period ended November 30, 2018, 554 Class C shares representing $10,976 were automatically exchanged for 523 Class A shares. | |
cDuring the period ended November 30, 2018, 582,018 Class Y shares representing $11,508,672 were exchanged for 581,786 Class I shares and during the period ended November 30, 2017, 3,016 Class A shares representing $55,003 were exchanged for 3,006 Class I shares, 413,794 Class Y shares representing $7,767,526 were exchanged for 413,652 Class I shares. | |
See notes to financial statements. | | | | | | | | |
16
FINANCIAL HIGHLIGHTS
The following tables describe the performance for each share class for the fiscal periods indicated. All information (except portfolio turnover rate) reflects financial results for a single fund share. Total return shows how much your investment in the fund would have increased (or decreased) during each period, assuming you had reinvested all dividends and distributions. These figures have been derived from the fund’s financial statements.
| | | | | | | |
| | | |
| | | Year Ended November 30, |
Class A Shares | | 2018 | 2017 | 2016 | 2015 | 2014 |
Per Share Data ($): | | | | | | |
Net asset value, beginning of period | | 20.85 | 18.29 | 19.77 | 20.70 | 19.67 |
Investment Operations: | | | | | | |
Investment income—neta | | .03 | .06 | .08 | .08 | .10 |
Net realized and unrealized
gain (loss) on investments | | 1.77 | 4.00 | 1.18 | .01b | 1.08 |
Total from Investment Operations | | 1.80 | 4.06 | 1.26 | .09 | 1.18 |
Distributions: | | | | | | |
Dividends from
investment income—net | | (.04) | (.10) | (.11) | (.08) | (.07) |
Dividends from net realized
gain on investments | | (2.17) | (1.40) | (2.63) | (.94) | (.08) |
Total Distributions | | (2.21) | (1.50) | (2.74) | (1.02) | (.15) |
Net asset value, end of period | | 20.44 | 20.85 | 18.29 | 19.77 | 20.70 |
Total Return (%)c | | 9.49 | 24.07 | 7.85 | .50 | 6.02 |
Ratios/Supplemental Data (%): | | | | | | |
Ratio of total expenses
to average net assets | | 1.25 | 1.20 | 1.17 | 1.16 | 1.16 |
Ratio of net expenses
to average net assets | | 1.15 | 1.15 | 1.15 | 1.14 | 1.14 |
Ratio of net investment income
to average net assets | | .17 | .31 | .46 | .41 | .48 |
Portfolio Turnover Rate | | 17.14 | 13.28 | 5.31 | 13.81 | 12.14 |
Net Assets, end of period ($ x 1,000) | | 787 | 842 | 1,775 | 1,449 | 2,071 |
a Based on average shares outstanding.
b In addition to net realized and unrealized losses on investments, this amount includes an increase in net asset value per share resulting from the timing of issuances and redemptions of shares in relation to fluctuating market values for the fund’s investments.
c Exclusive of sales charge.
See notes to financial statements.
17
FINANCIAL HIGHLIGHTS (continued)
| | | | | | | |
| | | |
| | | Year Ended November 30, |
Class C Shares | | 2018 | 2017 | 2016 | 2015 | 2014 |
Per Share Data ($): | | | | | | |
Net asset value, beginning of period | | 19.70 | 17.38 | 18.94 | 19.93 | 19.04 |
Investment Operations: | | | | | | |
Investment (loss)—neta | | (.11) | (.08) | (.05) | (.07) | (.05) |
Net realized and unrealized
gain (loss) on investments | | 1.65 | 3.80 | 1.12 | .02b | 1.03 |
Total from Investment Operations | | 1.54 | 3.72 | 1.07 | (.05) | .98 |
Distributions: | | | | | | |
Dividends from
investment income—net | | - | - | - | - | (.01) |
Dividends from net realized
gain on investments | | (2.17) | (1.40) | (2.63) | (.94) | (.08) |
Total Distributions | | (2.17) | (1.40) | (2.63) | (.94) | (.09) |
Net asset value, end of period | | 19.07 | 19.70 | 17.38 | 18.94 | 19.93 |
Total Return (%)c | | 8.69 | 23.11 | 7.03 | (.29) | 5.23 |
Ratios/Supplemental Data (%): | | | | | | |
Ratio of total expenses
to average net assets | | 2.35 | 2.16 | 2.11 | 2.04 | 1.94 |
Ratio of net expenses
to average net assets | | 1.90 | 1.90 | 1.90 | 1.90 | 1.88 |
Ratio of net investment (loss)
to average net assets | | (.57) | (.43) | (.29) | (.35) | (.26) |
Portfolio Turnover Rate | | 17.14 | 13.28 | 5.31 | 13.81 | 12.14 |
Net Assets, end of period ($ x 1,000) | | 86 | 138 | 266 | 348 | 522 |
a Based on average shares outstanding.
b In addition to net realized and unrealized losses on investments, this amount includes an increase in net asset value per share resulting from the timing of issuances and redemptions of shares in relation to fluctuating market values for the fund’s investments.
c Exclusive of sales charge.
See notes to financial statements.
18
| | | | | | | |
| | | |
| | | Year Ended November 30, |
Class I Shares | | 2018 | 2017 | 2016 | 2015 | 2014 |
Per Share Data ($): | | | | | | |
Net asset value, beginning of period | | 20.96 | 18.37 | 19.88 | 20.82 | 19.77 |
Investment Operations: | | | | | | |
Investment income—neta | | .10 | .12 | .14 | .15 | .16 |
Net realized and unrealized
gain (loss) on investments | | 1.77 | 4.02 | 1.17 | .02b | 1.09 |
Total from Investment Operations | | 1.87 | 4.14 | 1.31 | .17 | 1.25 |
Distributions: | | | | | | |
Dividends from
investment income—net | | (.12) | (.15) | (.19) | (.17) | (.12) |
Dividends from net realized
gain on investments | | (2.17) | (1.40) | (2.63) | (.94) | (.08) |
Total Distributions | | (2.29) | (1.55) | (2.82) | (1.11) | (.20) |
Net asset value, end of period | | 20.54 | 20.96 | 18.37 | 19.88 | 20.82 |
Total Return (%) | | 9.85 | 24.46 | 8.15 | .88 | 6.37 |
Ratios/Supplemental Data (%): | | | | | | |
Ratio of total expenses
to average net assets | | .82 | .83 | .83 | .80 | .78 |
Ratio of net expenses
to average net assets | | .82 | .83 | .83 | .80 | .78 |
Ratio of net investment income
to average net assets | | .51 | .61 | .80 | .75 | .77 |
Portfolio Turnover Rate | | 17.14 | 13.28 | 5.31 | 13.81 | 12.14 |
Net Assets, end of period ($ x 1,000) | | 22,755 | 20,963 | 16,824 | 30,654 | 34,278 |
a Based on average shares outstanding.
b In addition to net realized and unrealized losses on investments, this amount includes an increase in net asset value per share resulting from the timing of issuances and redemptions of shares in relation to fluctuating market values for the fund’s investments.
See notes to financial statements.
19
FINANCIAL HIGHLIGHTS (continued)
| | | | | | | |
| | | |
| | | Year Ended November 30, |
Class Y Shares | | 2018 | 2017 | 2016 | 2015 | 2014 |
Per Share Data ($): | | | | | | |
Net asset value, beginning of period | | 20.96 | 18.37 | 19.88 | 20.82 | 19.76 |
Investment Operations: | | | | | | |
Investment income—neta | | .11 | .12 | .14 | .15 | .20 |
Net realized and unrealized
gain (loss) on investments | | 1.77 | 4.02 | 1.17 | .02b | 1.06 |
Total from Investment Operations | | 1.88 | 4.14 | 1.31 | .17 | 1.26 |
Distributions: | | | | | | |
Dividends from
investment income—net | | (.13) | (.15) | (.19) | (.17) | (.12) |
Dividends from net realized
gain on investments | | (2.17) | (1.40) | (2.63) | (.94) | (.08) |
Total Distributions | | (2.30) | (1.55) | (2.82) | (1.11) | (.20) |
Net asset value, end of period | | 20.54 | 20.96 | 18.37 | 19.88 | 20.82 |
Total Return (%) | | 9.88 | 24.51 | 8.18 | .89 | 6.43 |
Ratios/Supplemental Data (%): | | | | | | |
Ratio of total expenses
to average net assets | | .80 | .80 | .80 | .79 | .79 |
Ratio of net expenses
to average net assets | | .80 | .80 | .80 | .79 | .79 |
Ratio of net investment income
to average net assets | | .53 | .64 | .81 | .76 | 1.03 |
Portfolio Turnover Rate | | 17.14 | 13.28 | 5.31 | 13.81 | 12.14 |
Net Assets, end of period ($ x 1,000) | | 534,230 | 527,263 | 486,044 | 545,762 | 749,348 |
a Based on average shares outstanding.
b In addition to net realized and unrealized losses on investments, this amount includes an increase in net asset value per share resulting from the timing of issuances and redemptions of shares in relation to fluctuating market values for the fund’s investments.
See notes to financial statements.
20
NOTES TO FINANCIAL STATEMENTS
NOTE 1—Significant Accounting Policies:
Dreyfus U.S. Equity Fund (the “fund”) is a separate diversified series of Strategic Funds, Inc. (the “Company”), which is registered under the Investment Company Act of 1940, as amended (the “Act”), as an open-end management investment company and operates as a series company currently offering six series, including the fund. The fund’s investment objective is to seek long-term total return. The Dreyfus Corporation (the “Manager” or “Dreyfus”), a wholly-owned subsidiary of The Bank of New York Mellon Corporation (“BNY Mellon”), serves as the fund’s investment adviser. Walter Scott & Partners Limited (“Walter Scott”), a wholly-owned subsidiary of BNY Mellon and an affiliate of Dreyfus, serves as the fund’s sub-investment adviser.
MBSC Securities Corporation (the “Distributor”), a wholly-owned subsidiary of Dreyfus, is the distributor of the fund’s shares. The fund is authorized to issue 100 million shares of $.001 par value Common Stock in each of the following classes of shares: Class A, Class C, Class I, Class T and Class Y. Class A and Class T shares generally are subject to a sales charge imposed at the time of purchase. Class C shares are subject to a contingent deferred sales charge (“CDSC”) imposed on Class C shares redeemed within one year of purchase. Class C shares automatically convert to Class A shares ten years after the date of purchase, without the imposition of a sales charge. Class I and Class Y shares are sold at net asset value per share generally to institutional investors. As of the date of this report, the fund did not offer Class T shares for purchase. Other differences between the classes include the services offered to and the expenses borne by each class, the allocation of certain transfer agency costs and certain voting rights. Income, expenses (other than expenses attributable to a specific class), and realized and unrealized gains or losses on investments are allocated to each class of shares based on its relative net assets.
The Company accounts separately for the assets, liabilities and operations of each series. Expenses directly attributable to each series are charged to that series’ operations; expenses which are applicable to all series are allocated among them on a pro rata basis.
The Financial Accounting Standards Board (“FASB”) Accounting Standards Codification is the exclusive reference of authoritative U.S. generally accepted accounting principles (“GAAP”) recognized by the FASB to be applied by nongovernmental entities. Rules and interpretive releases of the Securities and Exchange Commission (“SEC”) under
21
NOTES TO FINANCIAL STATEMENTS(continued)
authority of federal laws are also sources of authoritative GAAP for SEC registrants. The fund’s financial statements are prepared in accordance with GAAP, which may require the use of management estimates and assumptions. Actual results could differ from those estimates.
The Companyenters into contracts that contain a variety of indemnifications. The fund’s maximum exposure under these arrangements is unknown. The fund does not anticipate recognizing any loss related to these arrangements.
(a) Portfolio valuation: The fair value of a financial instrument is the amount that would be received to sell an asset or paid to transfer a liability in an orderly transaction between market participants at the measurement date (i.e., the exit price). GAAP establishes a fair value hierarchy that prioritizes the inputs of valuation techniques used to measure fair value. This hierarchy gives the highest priority to unadjusted quoted prices in active markets for identical assets or liabilities (Level 1 measurements) and the lowest priority to unobservable inputs (Level 3 measurements).
Additionally, GAAP provides guidance on determining whether the volume and activity in a market has decreased significantly and whether such a decrease in activity results in transactions that are not orderly. GAAP requires enhanced disclosures around valuation inputs and techniques used during annual and interim periods.
Various inputs are used in determining the value of the fund’s investments relating to fair value measurements. These inputs are summarized in the three broad levels listed below:
Level 1—unadjusted quoted prices in active markets for identical investments.
Level 2—other significant observable inputs (including quoted prices for similar investments, interest rates, prepayment speeds, credit risk, etc.).
Level 3—significant unobservable inputs (including the fund’s own assumptions in determining the fair value of investments).
The inputs or methodology used for valuing securities are not necessarily an indication of the risk associated with investing in those securities.
Changes in valuation techniques may result in transfers in or out of an assigned level within the disclosure hierarchy. Valuation techniques used to value the fund’s investments are as follows:
Investments in securities are valued at the last sales price on the securities exchange or national securities market on which such securities are
22
primarily traded. Securities listed on the National Market System for which market quotations are available are valued at the official closing price or, if there is no official closing price that day, at the last sales price. For open short positions, asked prices are used for valuation purposes. Bid price is used when no asked price is available. Registered investment companies that are not traded on an exchange are valued at their net asset value. All of the preceding securities are generally categorized within Level 1 of the fair value hierarchy.
Securities not listed on an exchange or the national securities market, or securities for which there were no transactions, are valued at the average of the most recent bid and asked prices. These securities are generally categorized within Level 2 of the fair value hierarchy.
Fair valuing of securities may be determined with the assistance of a pricing service using calculations based on indices of domestic securities and other appropriate indicators, such as prices of relevant American Depository Receipts and futures. Utilizing these techniques may result in transfers between Level 1 and Level 2 of the fair value hierarchy.
When market quotations or official closing prices are not readily available, or are determined not to accurately reflect fair value, such as when the value of a security has been significantly affected by events after the close of the exchange or market on which the security is principally traded (for example, a foreign exchange or market), but before the fund calculates its net asset value, the fund may value these investments at fair value as determined in accordance with the procedures approved by the Company’s Board of Directors (the “Board”). Certain factors may be considered when fair valuing investments such as: fundamental analytical data, the nature and duration of restrictions on disposition, an evaluation of the forces that influence the market in which the securities are purchased and sold, and public trading in similar securities of the issuer or comparable issuers. These securities are either categorized within Level 2 or 3 of the fair value hierarchy depending on the relevant inputs used.
For restricted securities where observable inputs are limited, assumptions about market activity and risk are used and such securities are generally categorized within Level 3 of the fair value hierarchy.
The following is a summary of the inputs used as of November 30, 2018in valuing the fund’s investments:
23
NOTES TO FINANCIAL STATEMENTS(continued)
| | | | | |
| | Level 1 - Unadjusted Quoted Prices | Level 2 - Other Significant Observable Inputs | Level 3 -Significant Unobservable Inputs | Total |
Assets ($) | | | |
Investments in Securities: | | | |
Equity Securities - Domestic Common Stocks† | 547,864,060 | - | - | 547,864,060 |
Investment Companies | 14,234,274 | - | - | 14,234,274 |
† See Statement of Investments for additional detailed categorizations.
At November 30, 2018, there were no transfers between levels of the fair value hierarchy. It is the fund’s policy to recognize transfers between levels at the end of the reporting period.
(b)Securities transactions and investment income: Securities transactions are recorded on a trade date basis. Realized gains and losses from securities transactions are recorded on the identified cost basis. Dividend income is recognized on the ex-dividend date and interest income, including, where applicable, accretion of discount and amortization of premium on investments, is recognized on the accrual basis.
Pursuant to a securities lending agreement with The Bank of New York Mellon, a subsidiary of BNY Mellon and an affiliate of Dreyfus, the fund may lend securities to qualified institutions. It is the fund’s policy that, at origination, all loans are secured by collateral of at least 102% of the value of U.S. securities loaned and 105% of the value of foreign securities loaned. Collateral equivalent to at least 100% of the market value of securities on loan is maintained at all times. Collateral is either in the form of cash, which can be invested in certain money market mutual funds managed by Dreyfus, or U.S. Government and Agency securities. The fund is entitled to receive all dividends, interest and distributions on securities loaned, in addition to income earned as a result of the lending transaction. Should a borrower fail to return the securities in a timely manner, The Bank of New York Mellon is required to replace the securities for the benefit of the fund or credit the fund with the market value of the unreturned securities and is subrogated to the fund’s rights against the borrower and the collateral. Additionally, the contractual maturity of security lending transactions are on an overnight and continuous basis. During the period ended November 30, 2018, The Bank of New York Mellon earned $6,711 from lending portfolio securities, pursuant to the securities lending agreement.
24
(c) Affiliated issuers: Investments in other investment companies advised by Dreyfus are considered “affiliated” under the Act.
(d) Dividends and distributions to shareholders: Dividends and distributions are recorded on the ex-dividend date. Dividends from investment income-net and dividends from net realized capital gains, if any, are normally declared and paid annually, but the fund may make distributions on a more frequent basis to comply with the distribution requirements of the Internal Revenue Code of 1986, as amended (the “Code”). To the extent that net realized capital gains can be offset by capital loss carryovers, it is the policy of the fund not to distribute such gains. Income and capital gain distributions are determined in accordance with income tax regulations, which may differ from GAAP.
(e) Federal income taxes: It is the policy of the fund to continue to qualify as a regulated investment company, if such qualification is in the best interests of its shareholders, by complying with the applicable provisions of the Code, and to make distributions of taxable income and net realized capital gain sufficient to relieve it from substantially all federal income and excise taxes.
As of and during the period ended November 30, 2018, the fund did not have any liabilities for any uncertain tax positions. The fund recognizes interest and penalties, if any, related to uncertain tax positions as income tax expense in the Statement of Operations. During the period ended November 30, 2018, the fund did not incur any interest or penalties.
Each tax year in the four-year period ended November 30, 2018 remains subject to examination by the Internal Revenue Service and state taxing authorities.
At November 30, 2018, the components of accumulated earnings on a tax basis were as follows: undistributed ordinary income $2,887,988, undistributed capital gains $49,617,605 and unrealized appreciation $212,170,010.
The tax character of distributions paid to shareholders during the fiscal periods ended November 30, 2018 and November 30, 2017 were as follows: ordinary income $7,375,353 and $4,117,265, and long-term capital gains $52,486,004 and $37,666,359, respectively.
(f) New Accounting Pronouncements: In August 2018, the FASB issued Accounting Standards Update 2018-13, Fair Value Measurement (Topic 820): Disclosure Framework—Changes to the Disclosure Requirements for Fair Value Measurement (“ASU 2018-13”). The update provides guidance that eliminates, adds and modifies certain disclosure
25
NOTES TO FINANCIAL STATEMENTS(continued)
requirements for fair value measurements. ASU 2018-13 will be effective for annual periods beginning after December 15, 2019. Management is currently assessing the potential impact of these changes to future financial statements.
NOTE 2—Bank Lines of Credit:
The fund participates with other Dreyfus-managed long-term open-end funds in an $1.030 billion unsecured credit facility led by Citibank, N.A. (the “Citibank Credit Facility”) and a $300 million unsecured credit facility provided by The Bank of New York Mellon (the “BNYM Credit Facility”), each to be utilized primarily for temporary or emergency purposes, including the financing of redemptions (each, a “Facility”). The Citibank Credit Facility is available in two tranches: (i) Tranche A is in an amount equal to $830 million and is available to all long-term open-ended funds, including the fund, and (ii) Tranche B is in amount equal to $200 million and is available only to the Dreyfus Floating Rate Income Fund, a series of The Dreyfus/Laurel Funds, Inc. Prior to October 3, 2018, the unsecured credit facility with Citibank, N.A. was $830 million. In connection therewith, the fund has agreed to pay its pro rata portion of commitment fees for Tranche A of the Citibank Credit Facility and the BNYM Credit Facility. Interest is charged to the fund based on rates determined pursuant to the terms of the respective Facility at the time of borrowing. During the period ended November 30, 2018, the fund did not borrow under the Facilities.
NOTE 3—Management Fee, Sub-Investment Advisory Fee and Other Transactions with Affiliates:
(a)Pursuant to a management agreement with Dreyfus, the management fee is computed at the annual rate of .75% of the value of the fund’s average daily net assets and is payable monthly. Dreyfus has contractually agreed, from December 1, 2017 through March 29, 2019, to waive receipt of its fees and/or assume the direct expenses of the fund, so that none of the classes (excluding Rule 12b-1 Distribution Plan fees, Shareholder Services Plan fees, taxes, interest expense, brokerage commissions, commitment fees on borrowings and extraordinary expenses) do not exceed .90% of the value of the fund’s average daily net assets. On or after March 29, 2019, Dreyfus may terminate this expense limitation at any time. The reduction in expenses, pursuant to the undertaking, amounted to $1,294 during the period ended November 30, 2018.
Pursuant to a sub-investment advisory agreement between Dreyfus and Walter Scott, Dreyfus pays Walter Scott a monthly fee at an annual rate of .36% of the value of the fund’s average daily net assets.
26
During the period ended November 30, 2018, the Distributor retained $29 from commissions earned on sales of the fund’s Class A shares.
(b) Under the Distribution Plan adopted pursuant to Rule 12b-1 under the Act, Class C shares pay the Distributor for distributing its shares at an annual rate of .75% of the value of its average daily net assets. During the period ended November 30, 2018, Class C shares were charged $820 pursuant to the Distribution Plan.
(c)Under the Shareholder Services Plan, Class A and Class C shares pay the Distributor at an annual rate of .25% of the value of their average daily net assets for the provision of certain services. The services provided may include personal services relating to shareholder accounts, such as answering shareholder inquiries regarding the fund and providing reports and other information, and services related to the maintenance of shareholder accounts. The Distributor may make payments to Service Agents (securities dealers, financial institutions or other industry professionals) with respect to these services. The Distributor determines the amounts to be paid to Service Agents. During the period ended November 30, 2018, Class A and Class C shares were charged $2,075and $273, respectively, pursuant to the Shareholder Services Plan.
The fund has arrangements with the transfer agent and the custodian whereby the fund may receive earnings credits when positive cash balances are maintained, which are used to offset transfer agency and custody fees. For financial reporting purposes, the fund includes net earnings credits, if any, as an expense offset in the Statement of Operations.
The fund compensates Dreyfus Transfer, Inc., a wholly-owned subsidiary of Dreyfus, under a transfer agency agreement for providing transfer agency and cash management services for the fund. The majority of transfer agency fees are comprised of amounts paid on a per account basis, while cash management fees are related to fund subscriptions and redemptions. During the period ended November 30, 2018, the fund was charged $3,880 for transfer agency services. These fees are included in Shareholder servicing costs in the Statement of Operations.
The fund compensates The Bank of New York Mellon under a custody agreement for providing custodial services for the fund. These fees are determined based on net assets, geographic region and transaction activity. During the period ended November 30, 2018, the fund was charged $8,133 pursuant to the custody agreement. These fees were partially offset by earnings credits of $413.
During the period ended November 30, 2018, the fund was charged $12,780 for services performed by the Chief Compliance Officer and his
27
NOTES TO FINANCIAL STATEMENTS(continued)
staff. These fees are included in Miscellaneous in the Statement of Operations.
The components of “Due to The Dreyfus Corporation and affiliates” in the Statement of Assets and Liabilities consist of: management fees $339,711, Distribution Plan fees $52, Shareholder Services Plan fees $178, custodian fees $4,089, Chief Compliance Officer fees $5,241 and transfer agency fees $700, which are offset against an expense reimbursement currently in effect in the amount of $237.
(d) Each Board member also serves as a Board member of other funds within the Dreyfus complex. Annual retainer fees and attendance fees are allocated to each fund based on net assets.
NOTE 4—Securities Transactions:
The aggregate amount of purchases and sales of investment securities, excluding short-term securities, during the period ended November 30, 2018, amounted to $91,832,812 and $134,889,945, respectively.
At November 30, 2018, the cost of investments for federal income tax purposes was $349,928,324; accordingly, accumulated net unrealized appreciation on investments was $212,170,010, consisting of $227,981,671 gross unrealized appreciation and $15,811,661 gross unrealized depreciation.
28
REPORT OF INDEPENDENT REGISTERED PUBLIC ACCOUNTING FIRM
To the Shareholders and the Board of Directors of Dreyfus U.S. Equity Fund
Opinion on the Financial Statements
We have audited the accompanying statement of assets and liabilities of Dreyfus U.S. Equity Fund (the “Fund”) (one of the funds constituting Strategic Funds, Inc.), including the statements of investments and investments in affiliated issuers, as of November 30, 2018, and the related statement of operations for the year then ended, the statements of changes in net assets for each of the two years in the period then ended, the financial highlights for each of the five years in the period then ended and the related notes (collectively referred to as the “financial statements”). In our opinion, the financial statements present fairly, in all material respects, the financial position of the Fund (one of the funds constituting Strategic Funds, Inc.) at November 30, 2018, the results of its operations for the year then ended, the changes in its net assets for each of the two years in the period then ended and its financial highlights for each of the five years in the period then ended, in conformity with U.S. generally accepted accounting principles.
Basis for Opinion
These financial statements are the responsibility of the Fund’s management. Our responsibility is to express an opinion on the Fund’s financial statements based on our audits. We are a public accounting firm registered with the Public Company Accounting Oversight Board (United States) (“PCAOB”) and are required to be independent with respect to the Fund in accordance with the U.S. federal securities laws and the applicable rules and regulations of the Securities and Exchange Commission and the PCAOB.
We conducted our audits in accordance with the standards of the PCAOB. Those standards require that we plan and perform the audit to obtain reasonable assurance about whether the financial statements are free of material misstatement, whether due to error or fraud. The Fund is not required to have, nor were we engaged to perform, an audit of the Fund’s internal control over financial reporting. As part of our audits, we are required to obtain an understanding of internal control over financial reporting, but not for the purpose of expressing an opinion on the effectiveness of the Fund’s internal control over financial reporting. Accordingly, we express no such opinion.
Our audits included performing procedures to assess the risks of material misstatement of the financial statements, whether due to error or fraud, and performing procedures that respond to those risks. Such procedures included examining, on a test basis, evidence regarding the amounts and disclosures in the financial statements. Our procedures included confirmation of securities owned as of November 30, 2018, by correspondence with the custodian and others or by other appropriate auditing procedures where replies from others were not received. Our audits also included evaluating the accounting principles used and significant estimates made by management, as well as evaluating the overall presentation of the financial statements. We believe that our audits provide a reasonable basis for our opinion.

We have served as the auditor of one or more Dreyfus investment companies since at least 1957, but we are unable to determine the specific year.
New York, New York
January 28, 2019
29
IMPORTANT TAX INFORMATION(Unaudited)
For federal tax purposes the fund hereby reports 94.33% of the ordinary dividends paid during the fiscal year ended November 30, 2018 as qualifying for the corporate dividends received deduction. Also certain dividends paid by the fund may be subject to a maximum tax rate of 15%, as provided for by the Jobs and Growth Tax Relief Reconciliation Act of 2003. Of the distributions paid during the fiscal year, $7,189,714 represents the maximum amount that may be considered qualified dividend income. Shareholders will receive notification in early 2019 of the percentage applicable to the preparation of their 2018 income tax returns. Also, the fund hereby reports $.1576 per share as a short-term capital gain distribution and $2.0101 per share as a long-term capital gain distribution paid on December 29, 2017.
30
INFORMATION ABOUT THE RENEWAL OF THE FUND’S MANAGEMENT AND SUB-INVESTMENT ADVISORY AGREEMENTS (Unaudited)
At a meeting of the fund’s Board of Directors held on November 5-6, 2018, the Board considered the renewal of the fund’s Management Agreement, pursuant to which Dreyfus provides the fund with investment advisory and administrative services (the “Agreement”), and the Sub-Investment Advisory Agreement (together, the “Agreements”), pursuant to which Walter Scott & Partners Limited (the “Subadviser”) provides day-to-day management of the fund’s investments. The Board members, a majority of whom are not “interested persons” (as defined in the Investment Company Act of 1940, as amended) of the fund, were assisted in their review by independent legal counsel and met with counsel in executive session separate from representatives of Dreyfus and the Subadviser. In considering the renewal of the Agreements, the Board considered all factors that it believed to be relevant, including those discussed below. The Board did not identify any one factor as dispositive, and each Board member may have attributed different weights to the factors considered.
Analysis of Nature, Extent, and Quality of Services Provided to the Fund. The Board considered information provided to it at the meeting and in previous presentations from Dreyfus representatives regarding the nature, extent, and quality of the services provided to funds in the Dreyfus fund complex. Dreyfus provided the number of open accounts in the fund, the fund’s asset size and the allocation of fund assets among distribution channels. Dreyfus also had previously provided information regarding the diverse intermediary relationships and distribution channels of funds in the Dreyfus fund complex (such as retail direct or intermediary, in which intermediaries typically are paid by the fund and/or Dreyfus) and Dreyfus’ corresponding need for broad, deep, and diverse resources to be able to provide ongoing shareholder services to each intermediary or distribution channel, as applicable to the fund.
The Board also considered research support available to, and portfolio management capabilities of, the fund’s portfolio management personnel and that Dreyfus also provides oversight of day-to-day fund operations, including fund accounting and administration and assistance in meeting legal and regulatory requirements. The Board also considered Dreyfus’ extensive administrative, accounting and compliance infrastructures, as well as Dreyfus’ supervisory activities over the Subadviser. The Board also considered portfolio management’s brokerage policies and practices (including policies and practices regarding soft dollars) and the standards applied in seeking best execution.
Comparative Analysis of the Fund’s Performance and Management Fee and Expense Ratio. The Board reviewed reports prepared by Broadridge Financial Solutions, Inc. (“Broadridge”), an independent provider of investment company data, which included information comparing (1) the fund’s performance with the performance of a group of comparable funds (the “Performance Group”) and with a broader group of funds (the “Performance Universe”), all for various periods ended September 30, 2018, and (2) the fund’s actual and contractual management fees and total expenses with those of a group of comparable funds (the “Expense Group”) and with a broader group of funds (the
31
INFORMATION ABOUT THE RENEWAL OF THE FUND’S MANAGEMENT AND SUB-INVESTMENT ADVISORY AGREEMENTS (Unaudited) (continued)
“Expense Universe”), the information for which was derived in part from fund financial statements available to Broadridge as of the date of its analysis. Dreyfus previously had furnished the Board with a description of the methodology Broadridge used to select the Performance Group and Performance Universe and the Expense Group and Expense Universe.
Dreyfus representatives stated that the usefulness of performance comparisons may be affected by a number of factors, including different investment limitations and policies that may be applicable to the fund and comparison funds. The Board discussed with representatives of Dreyfus, its affiliates and/or the Subadviser the results of the comparisons and considered that the fund’s total return performance was above the Performance Group median for all periods except for the ten-year period when it was below the median, and was below the Performance Universe median for all periods except the three-year period when it was above the median. The Board considered the relative proximity of the fund’s performance to the Performance Group and/or Performance Universe median in certain periods when performance was below median. Dreyfus also provided a comparison of the fund’s calendar year total returns to the returns of the fund’s benchmark index.
The Board also reviewed the range of actual and contractual management fees and total expenses of the Expense Group and Expense Universe funds and discussed the results of the comparisons. The Board considered that the fund’s contractual management fee was approximately equal to the Expense Group median and the fund’s actual management fee and total expenses were below the Expense Group and Expense Universe medians.
Dreyfus representatives stated that Dreyfus has contractually agreed, until March 29, 2019, to waive receipt of its fees and/or assume the direct expenses of the fund so that the direct expenses of none of its classes (excluding Rule 12b-1 fees, shareholder services fees, taxes, interest, brokerage commissions, commitment fees on borrowings and extraordinary expenses) exceed .90% of the fund’s average daily net assets.
Dreyfus representatives reviewed with the Board the management or investment advisory fees (1) paid by funds advised or administered by Dreyfus that are in the same Lipper category as the fund and (2) paid to Dreyfus or the Subadviser or its affiliates for advising any separate accounts and/or other types of client portfolios that are considered to have similar investment strategies and policies as the fund (the “Similar Clients”), and explained the nature of the Similar Clients. They discussed differences in fees paid and the relationship of the fees paid in light of any differences in the services provided and other relevant factors. The Board considered the relevance of the fee information provided for the Similar Clients to evaluate the appropriateness of the fund’s management fee.
The Board considered the fee to the Subadviser in relation to the fee paid to Dreyfus by the fund and the respective services provided by the Subadviser and Dreyfus. The Board also took into consideration that the Subadviser’s fee is paid by Dreyfus (out of its fee from the fund) and not the fund.
32
Analysis of Profitability and Economies of Scale. Dreyfus representatives reviewed the expenses allocated and profit received by Dreyfus and its affiliates and the resulting profitability percentage for managing the fund and the aggregate profitability percentage to Dreyfus and its affiliates for managing the funds in the Dreyfus fund complex, and the method used to determine the expenses and profit. The Board concluded that the profitability results were not unreasonable, given the services rendered and service levels provided by Dreyfus. The Board also considered the expense limitation arrangement and its effect on the profitability of Dreyfus and its affiliates. The Board also had been provided with information prepared by an independent consulting firm regarding Dreyfus’ approach to allocating costs to, and determining the profitability of, individual funds and the entire Dreyfus fund complex. The consulting firm also had analyzed where any economies of scale might emerge in connection with the management of a fund.
The Board considered on the advice of its counsel the profitability analysis (1) as part of its evaluation of whether the fees under the Agreements, considered in relation to the mix of services provided by Dreyfus and the Subadviser, including the nature, extent and quality of such services, supported the renewal of the Agreements and (2) in light of the relevant circumstances for the fund and the extent to which economies of scale would be realized if the fund grows and whether fee levels reflect these economies of scale for the benefit of fund shareholders. Since Dreyfus, and not the fund, pays the Subadviser pursuant to the Sub-Investment Advisory Agreement, the Board did not consider the Subadviser’s profitability to be relevant to its deliberations. Dreyfus representatives also stated that, as a result of shared and allocated costs among funds in the Dreyfus fund complex, the extent of economies of scale could depend substantially on the level of assets in the complex as a whole, so that increases and decreases in complex-wide assets can affect potential economies of scale in a manner that is disproportionate to, or even in the opposite direction from, changes in the fund’s asset level. The Board also considered potential benefits to Dreyfus and the Subadviser from acting as investment adviser and sub-investment adviser, respectively, and took into consideration the soft dollar arrangements in effect for trading the fund’s investments.
At the conclusion of these discussions, the Board agreed that it had been furnished with sufficient information to make an informed business decision with respect to the renewal of the Agreements. Based on the discussions and considerations as described above, the Board concluded and determined as follows.
· The Board concluded that the nature, extent and quality of the services provided by Dreyfus and the Subadviser are adequate and appropriate.
· The Board generally was satisfied with the fund’s overall performance.
· The Board concluded that the fees paid to Dreyfus and the Subadviser continued to be appropriate under the circumstances and in light of the factors and the totality of the services provided as discussed above.
33
INFORMATION ABOUT THE RENEWAL OF THE FUND’S MANAGEMENT AND SUB-INVESTMENT ADVISORY AGREEMENTS (Unaudited) (continued)
· The Board determined that the economies of scale which may accrue to Dreyfus and its affiliates in connection with the management of the fund had been adequately considered by Dreyfus in connection with the fee rate charged to the fund pursuant to the Agreement and that, to the extent in the future it were determined that material economies of scale had not been shared with the fund, the Board would seek to have those economies of scale shared with the fund.
In evaluating the Agreements, the Board considered these conclusions and determinations and also relied on its previous knowledge, gained through meetings and other interactions with Dreyfus and its affiliates and the Subadviser, of Dreyfus and the Subadviser and the services provided to the fund by Dreyfus and the Subadviser. The Board also relied on information received on a routine and regular basis throughout the year relating to the operations of the fund and the investment management and other services provided under the Agreements, including information on the investment performance of the fund in comparison to similar mutual funds and benchmark performance indices; general market outlook as applicable to the fund; and compliance reports. In addition, the Board’s consideration of the contractual fee arrangements for this fund had the benefit of a number of years of reviews of the Agreements for the fund, or substantially similar agreements for other Dreyfus funds that the Board oversees, during which lengthy discussions took place between the Board and Dreyfus representatives. Certain aspects of the arrangements may receive greater scrutiny in some years than in others, and the Board’s conclusions may be based, in part, on their consideration of the fund’s arrangements, or substantially similar arrangements for other Dreyfus funds that the Board oversees, in prior years. The Board determined to renew the Agreements.
34
BOARD MEMBERS INFORMATION(Unaudited)
INDEPENDENT BOARD MEMBERS
Joseph S. DiMartino (75)
Chairman of the Board (1995)
Principal Occupation During Past 5 Years:
· Corporate Director and Trustee (1995-present)
Other Public Company Board Memberships During Past 5 Years:
· CBIZ (formerly, Century Business Services, Inc.), a provider of outsourcing functions for small and medium size companies, Director (1997-present)
No. of Portfolios for which Board Member Serves:123
———————
Joni Evans (76)
Board Member (2006)
Principal Occupation During Past 5 Years:
· Chief Executive Officer, www.wowOwow.com, an online community dedicated to women’s conversations and publications (2007-present)
· Principal, Joni Evans Ltd. (publishing) (2006-present)
No. of Portfolios for which Board Member Serves:21
———————
Joan Gulley (71)
Board Member (2017)
Principal Occupation During Past 5 Years:
· PNC Financial Services Group, Inc.(1993-2014), Executive Vice President and Chief Human Resources Officer and Executive Committee Member (2008-2014)
No. of Portfolios for which Board Member Serves:52
———————
Ehud Houminer (78)
Board Member (1994)
Principal Occupation During Past 5 Years:
· Board of Overseers at the Columbia Business School, Columbia
University (1992-present)
Trustee, Ben Gurion University
No. of Portfolios for which Board Member Serves: 52
———————
35
BOARD MEMBERS INFORMATION (Unaudited) (continued)
INDEPENDENT BOARD MEMBERS (continued)
Alan H. Howard (59)
Board Member (2018)
Principal Occupation During Past 5 Years:
· Managing Partner of Heathcote Advisors LLC, a financial advisory services firm (2008 – present)
· President of Dynatech/MPX Holdings LLC (2012 – present), a global supplier and service provider of military aircraft parts, including Chief Executive Officer of an operating subsidiary, Dynatech International LLC (2013 – present)
· Senior Advisor, Rossoff & Co., an independent investment banking firm (2014 – present)
Other Public Company Board Memberships During Past 5 Years:
· Movado Group, a designer and manufacturer of watches, Director (1997-present)
No. of Portfolios for which Board Member Serves:21
———————
Robin A. Melvin (55)
Board Member (1995)
Principal Occupation During Past 5 Years:
· Co-chairman, Illinois Mentoring Partnership, non-profit organization dedicated to increasing the quantity and quality of mentoring services in Illinois; (2014-present; board member since 2013)
No. of Portfolios for which Board Member Serves:99
———————
Burton N. Wallack (68)
Board Member (2006)
Principal Occupation During Past 5 Years:
· President and Co-owner of Wallack Management Company, a real estate management
company (1987-present)
No. of Portfolios for which Board Member Serves:21
———————
Benaree Pratt Wiley (72)
Board Member (2016)
Principal Occupation During Past 5 Years:
· Principal, The Wiley Group, a firm specializing in strategy and business development (2005-present)
Other Public Company Board Memberships During Past 5 Years:
· CBIZ (formerly, Century Business Services, Inc.), a provider of outsourcing functions for small and medium size companies, Director (2008-present)
No. of Portfolios for which Board Member Serves: 78
———————
36
INTERESTED BOARD MEMBERs
Gordon J. Davis (77)
Board Member (2006)
Principal Occupation During Past 5 Years:
· Partner in the law firm of Venable LLP (2012-present)
Other Public Company Board Memberships During Past 5 Years:
· Consolidated Edison, Inc., a utility company, Director (1997-2014)
· The Phoenix Companies, Inc., a life insurance company, Director (2000-2014)
No. of Portfolios for which Board Member Serves:55
Gordon J. Davis is deemed to be an “interested person” (as defined under the Act) of the Company as a result of his affiliation with Venable LLP, which provides legal services to the Company.
———————
Once elected all Board Members serve for an indefinite term, but achieve Emeritus status upon reaching age 80. The address of the Board Members and Officers is c/o The Dreyfus Corporation, 200 Park Avenue, New York, New York 10166. Additional information about the Board Members is available in the fund’s Statement of Additional Information which can be obtained from Dreyfus free of charge by calling this toll free number: 1-800-DREYFUS.
William Hodding Carter III, Emeritus Board Member
Hans C, Mautner, Emeritus Board Member
37
OFFICERS OF THE FUND(Unaudited)
BRADLEY J. SKAPYAK, President since January 2010.
Chief Operating Officer and a director of the Manager since June 2009, Chairman of Dreyfus Transfer, Inc., an affiliate of the Manager and the transfer agent of the funds, since May 2011 and Chief Executive Officer of MBSC Securities Corporation since August 2016. He is an officer of 62 investment companies (comprised of 123 portfolios) managed by the Manager. He is 60 years old and has been an employee of the Manager since February 1988.
BENNETT A. MACDOUGALL, Chief Legal Officer since October 2015.
Chief Legal Officer of the Manager and Associate General Counsel and Managing Director of BNY Mellon since June 2015; from June 2005 to June 2015, he served in various capacities with Deutsche Bank – Asset & Wealth Management Division, including as Director and Associate General Counsel, and Chief Legal Officer of Deutsche Investment Management Americas Inc. from June 2012 to May 2015. He is an officer of 63 investment companies (comprised of 148 portfolios) managed by the Manager. He is 47 years old and has been an employee of the Manager since June 2015.
JAMES BITETTO, Vice President since August 2005 and Secretary since February 2018.
Managing Counsel of BNY Mellon and Secretary of the Manager, and an officer of 63 investment companies (comprised of 148 portfolios) managed by the Manager. He is 52 years old and has been an employee of the Manager since December 1996.
SONALEE CROSS, Vice President and Assistant Secretary since March 2018.
Counsel of BNY Mellon since October 2016; Associate at Proskauer Rose LLP from April 2016 to September 2016; Attorney at EnTrust Capital from August 2015 to February 2016; Associate at Sidley Austin LLP from September 2013 until August 2015. She is an officer of 63 investment companies (comprised of 148 portfolios) managed by Dreyfus. She is 31 years old and has been an employee of the Manager since October 2016.
MAUREEN E. KANE, Vice President and Assistant Secretary since April 2015.
Managing Counsel of BNY Mellon since July 2014; from October 2004 until July 2014, General Counsel, and from May 2009 until July 2014, Chief Compliance Officer of Century Capital Management. She is an officer of 63 investment companies (comprised of 148 portfolios) managed by the Manager. She is 56 years old and has been an employee of the Manager since July 2014.
SARAH S. KELLEHER, Vice President and Assistant Secretary since April 2014.
Managing Counsel of BNY Mellon since December 2017, from March 2013 to December 2017, Senior Counsel of BNY Mellon. She is an officer of 63 investment companies (comprised of 148 portfolios) managed by the Manager. She is 43 years old and has been an employee of the Manager since March 2013.
JEFF PRUSNOFSKY, Vice President and Assistant Secretary since August 2005.
Senior Managing Counsel of BNY Mellon, and an officer of 63 investment companies (comprised of 148 portfolios) managed by the Manager. He is 53 years old and has been an employee of the Manager since October 1990.
NATALYA ZELENSKY, Vice President and Assistant Secretary since March 2017.
Counsel of BNY Mellon since May 2016; Attorney at Wildermuth Endowment Strategy Fund/Wildermuth Advisory, LLC from November 2015 until May 2016; Assistant General Counsel at RCS Advisory Services from July 2014 until November 2015; Associate at Sutherland, Asbill & Brennan from January 2013 until January 2014. She is an officer of 63 investment companies (comprised of 148 portfolios) managed by Dreyfus. She is 33 years old and has been an employee of the Manager since May 2016.
JAMES WINDELS, Treasurer since November 2001.
Director – Mutual Fund Accounting of the Manager, and an officer of 63 investment companies (comprised of 148 portfolios) managed by the Manager. He is 60 years old and has been an employee of the Manager since April 1985.
38
GAVIN C. REILLY, Assistant Treasurer since December 2005.
Tax Manager of the Investment Accounting and Support Department of the Manager, and an officer of 63 investment companies (comprised of 148 portfolios) managed by the Manager. He is 50 years old and has been an employee of the Manager since April 1991.
ROBERT S. ROBOL, Assistant Treasurer since August 2005.
Senior Accounting Manager – Dreyfus Financial Reporting of the Manager, and an officer of 63 investment companies (comprised of 148 portfolios) managed by the Manager. He is 54 years old and has been an employee of the Manager since October 1988.
ROBERT SALVIOLO, Assistant Treasurer since July 2007.
Senior Accounting Manager – Equity Funds of the Manager, and an officer of 63 investment companies (comprised of 148 portfolios) managed by the Manager. He is 51 years old and has been an employee of the Manager since June 1989.
ROBERT SVAGNA, Assistant Treasurer since September 2002.
Senior Accounting Manager – Fixed Income and Equity Funds of the Manager, and an officer of 63 investment companies (comprised of 148 portfolios) managed by the Manager. He is 51 years old and has been an employee of the Manager since November 1990.
JOSEPH W. CONNOLLY, Chief Compliance Officer since October 2004.
Chief Compliance Officer of the Manager, the Dreyfus Family of Funds and BNY Mellon Funds Trust (63 investment companies, comprised of 148 portfolios). He is 61 years old and has served in various capacities with the Manager since 1980, including manager of the firm’s Fund Accounting Department from 1997 through October 2001.
CARIDAD M. CAROSELLA, Anti-Money Laundering Compliance Officer since January 2016.
Anti-Money Laundering Compliance Officer of the Dreyfus Family of Funds and BNY Mellon Funds Trust since January 2016; from May 2015 to December 2015, Interim Anti-Money Laundering Compliance Officer of the Dreyfus Family of Funds and BNY Mellon Funds Trust and the Distributor; from January 2012 to May 2015, AML Surveillance Officer of the Distributor and from 2007 to December 2011, Financial Processing Manager of the Distributor. She is an officer of 57 investment companies (comprised of 142 portfolios) managed by the Manager. She is 50 years old and has been an employee of the Distributor since 1997.
39
NOTES
40
NOTES
41
Dreyfus U.S. Equity Fund
200 Park Avenue
New York, NY 10166
Manager
The Dreyfus Corporation
200 Park Avenue
New York, NY 10166
Sub-Investment Adviser
Walter Scott & Partners Limited
(Walter Scott)
One Charlotte Square
Edinburgh, Scotland, UK
Custodian
The Bank of New York Mellon
240 Greenwich Street
New York, NY 10286
Transfer Agent &
Dividend Disbursing Agent
Dreyfus Transfer, Inc.
200 Park Avenue
New York, NY 10166
Distributor
MBSC Securities Corporation
200 Park Avenue
New York, NY 10166
| | |
Ticker Symbols: Class A: DPUAX Class C: DPUCX Class I: DPUIX Class Y: DPUYX |
Telephone Call your financial representative or 1-800-DREYFUS
Mail The Dreyfus Family of Funds, 144 Glenn Curtiss Boulevard, Uniondale, NY 11556-0144
E-mailSend your request toinfo@dreyfus.com
InternetInformation can be viewed online or downloaded atwww.dreyfus.com
The fund files its complete schedule of portfolio holdings with the Securities and Exchange Commission (“SEC”) for the first and third quarters of each fiscal year on Form N-Q. The fund’s Forms N-Q are available on the SEC’s website atwww.sec.gov.
A description of the policies and procedures that the fund uses to determine how to vote proxies relating to portfolio securities and information regarding how the fund voted these proxies for the most recent 12-month period ended June 30 is available atwww.dreyfus.com and on the SEC’s website atwww.sec.gov and without charge, upon request, by calling 1-800-DREYFUS.
| | |
© 2019 MBSC Securities Corporation
6011AR1118 | 
|
Global Stock Fund
| | | |

| | ANNUAL REPORT November 30, 2018 |
| |
Save time. Save paper. View your next shareholder report online as soon as it’s available. Log into www.dreyfus.com and sign up for Dreyfus eCommunications. It’s simple and only takes a few minutes. |
| |
The views expressed in this report reflect those of the portfolio manager(s) only through the end of the period covered and do not necessarily represent the views of Dreyfus or any other person in the Dreyfus organization. Any such views are subject to change at any time based upon market or other conditions and Dreyfus disclaims any responsibility to update such views. These views may not be relied on as investment advice and, because investment decisions for a Dreyfus fund are based on numerous factors, may not be relied on as an indication of trading intent on behalf of any Dreyfus fund. |
| |
Not FDIC-Insured • Not Bank-Guaranteed • May Lose Value |
Contents
T H E F U N D
F O R M O R E I N F O R M AT I O N
Back Cover
| | | | |
| |
Global Stock Fund
| | The Fund |
A LETTER FROM THE PRESIDENT OF DREYFUS
Dear Shareholder:
We are pleased to present this annual report for Global Stock Fund, covering the 12-month period from December 1, 2017 through November 30, 2018. For information about how the fund performed during the reporting period, as well as general market perspectives, we provide a Discussion of Fund Performance on the pages that follow.
The reporting period began with major global economies achieving above-trend growth. In the United States, a robust economy and strong labor markets encouraged the Federal Reserve to continue moving away from its accommodative monetary policy while other major central banks also began to consider monetary tightening. In the equity sphere, both U.S. and non-U.S. markets remained on an uptrend, though investor concerns about U.S. inflation and its effect on interest rates later began to weigh on global returns. Interest rates rose across the yield curve, putting pressure on bond prices.
Later in the reporting period, global growth trends began to diverge and market volatility returned. While the U.S. economy continued to grow at a healthy rate, Japan rebounded, but only briefly, from a weak first quarter, and the Eurozone economy began to moderate. Robust growth and strong corporate earnings continued to support U.S. stocks while other developed markets declined. Late in the reporting period, a broad sell-off occurred, partially offsetting earlier U.S. gains. Emerging markets remained under pressure as weakness in their currencies relative to the U.S. dollar added to investors’ uneasiness.
Fixed income markets continued to struggle as interest rates rose; the yield on the benchmark 10-year Treasury bond breached 3.2% despite only moderate inflation, but investor concerns about slowing global growth brought yields down toward the end of the reporting period.
Despite continuing doubts regarding trade, U.S. inflationary pressures and global growth, we are optimistic that the U.S. economy will remain strong in the near term. However, we remain attentive to signs that indicate potential changes on the horizon. As always, we encourage you to discuss the risks and opportunities in today’s investment environment with your financial advisor.
Thank you for your continued confidence and support.
Sincerely,

Renee Laroche-Morris
President
The Dreyfus Corporation
December 17, 2018
2
DISCUSSION OF FUND PERFORMANCE(Unaudited)
For the period from December 1, 2017 through November 30, 2018, as provided by Charlie Macquaker, Roy Leckie, and Jane Henderson, the three members of the Investment Executive at Walter Scott& Partners Limited (WS), Sub-Investment Adviser
Market and Fund Performance Overview
For the 12-month period ended November 30, 2018, Global Stock Fund’s Class A shares achieved a total return of 5.61%, Class C shares returned 4.85%, Class I shares returned 5.89%, and Class Y shares returned 5.98%.1 For the same period, the fund’s benchmark, the MSCI World Index (the “Index”), achieved a total return of 0.14%.2
Global equities advanced modestly during the reporting period, amid a solid economic backdrop and strong corporate earnings in the U.S. Effective stock selection, particularly in Europe ex-U.K. and U.S. markets, and within the information technology sector, was partly responsible for the fund outperforming the Index.
The Fund’s Investment Approach
The fund seeks long-term total return. To pursue its goal, the fund normally invests at least 80% of its net assets, plus any borrowings for investment purposes, in stocks. The fund’s investments will be focused on companies located in developed markets. The fund ordinarily invests in at least three countries and is not geographically limited in its investment selection but, at times, may invest a substantial portion of its assets in a single country. The fund may invest in the securities of companies of any market capitalization. Walter Scott seeks investment opportunities in companies with fundamental strengths that indicate the potential for sustainable growth. Walter Scott focuses on individual stock selection, building the fund’s portfolio from the bottom up through extensive fundamental research. The investment process begins with the screening of reported company financials. Companies that meet certain broad absolute and trend criteria are candidates for more detailed financial analysis. The fund’s Investment Team collectively reviews and selects those stocks that meet Walter Scott’s criteria and where the expected growth rate is combined with a reasonable valuation for the underlying equity. Geographic and sector allocations are the result of, not part of, the investment process, because the Investment Team’s sole focus is on the analysis of and investment in individual companies.
Volatility Returned to Global Markets
In contrast to most of 2017, the first quarter of 2018 proved to be something of a roller coaster ride for global equity markets. After starting the year with a bang, February marked the return of volatility to markets, as worries prompted by stronger-than-expected inflation data and subsequently higher bond yields caused a sell-off across most asset classes. Market turbulence resurfaced in March, driven by fears of a global trade war between the U.S. and China, coupled with weakness in technology stocks, notably those that had propelled the market higher during its parabolic rise. Over the second quarter of 2018, the U.S. Federal Reserve (the “Fed”) increased interest rates while the U.S. president continued his protectionist rhetoric on trade, both of which
3
DISCUSSION OF FUND PERFORMANCE(Unaudited) (continued)
pressured markets. Another area of concern was Italy, where a constitutional crisis at the end of May briefly roiled markets. On a more positive note, the U.S. economy continued to strengthen, as it reaped the benefits of 2017’s tax cuts, though in certain areas, faster cost inflation and tightening labor supply started to weigh upon corporate profitability.
The U.S. stock market continued to enjoy strong gains, largely attributable to robust corporate earnings, throughout the third quarter of 2018, amid a mixed performance for equity indices abroad. Emerging markets, in particular, were burdened by a slowdown in the pace of Chinese credit growth, fears over their vulnerability to tighter U.S. monetary policy, and worries about the potential repercussions of global trade tensions. Elsewhere, the United Kingdom’s impending departure from the European Union remained a significant concern for investors, while Italian politics caused volatility to return to markets, as the coalition government’s spending plans threatened to breach European deficit thresholds. In October, markets were torrid, attributable to the escalating U.S.-China trade dispute and other concerns, including rising U.S. debt, inflation, and interest rates. During the last few weeks of the period, a weakening dollar and the potential of slowing U.S. interest-rate hikes helped to ease pressure on global markets.
Stock Selection and Allocation Effect Buoyed Fund Results
The fund’s positive results compared to the Index stemmed from the success of our security selection and sector allocation. Stock picks within the information technology and consumer discretionary sectors, as well as among companies within the U.S. and Europe ex-U.K., were particularly additive. Underweight exposure to financials and an overweight to the health care sector also helped relative results. Information technology company Mastercard was among the top overall contributors to portfolio performance. The payment processing company enjoyed high demand for its services, leading to favorable earnings results throughout the year. Information technology company Adobe Systems was also a main contributor, as was health care company Intuitive Surgical.
Conversely, positioning within the communication services sector detracted from relative returns, as did stock selection among Japan-based companies. The top individual detractors included FANUC, Schlumberger, and Cerner. Robotics systems company FANUC saw its stock price fall throughout the period on the back of concerns we are entering a period of low demand for automation products. Energy company Schlumberger was hurt by continued weakness in demand for oil services outwith the U.S. A position in health care company Cerner also detracted during the period.
Maintaining a Company-by-Company Approach
Although we do not manage the fund’s investments in response to macroeconomic trends, it is worth noting that we believe the global economic picture remains strong, supported by fiscal policies that have helped boost corporate earnings, particularly in the U.S. However, at this stage in the market cycle, confidence can be quickly undermined by unexpected political and economic developments as geopolitical tensions potentially
4
escalate and central banks move gradually away from their aggressively accommodative policies of the past decade. We continue to keep a sharp eye on valuations in all markets.
In that context, our focus remains very much unchanged. We must continue to identify and invest in market-leading, financially robust companies with the strategic strengths and vision to generate meaningful returns over the long term. Our distinctly long-term lens allows us to focus on the underlying strengths and opportunities of a business. Not only does that approach mean we waste very little time trying to second-guess short-term market moves, but it ensures we are invested in companies that have the attributes we believe are needed to succeed regardless of the external environment in which they operate. We will continue to look for opportunities that benefit investors, capturing gains when the market rallies and adding to fundamentally strong companies when the market pulls back.
December 17, 2018
1 Total return includes reinvestment of dividends and any capital gains paid, and does not take into consideration the maximum initial sales charge in the case of Class A shares, or the applicable contingent deferred sales charge imposed on redemptions in the case of Class C shares. Had these charges been reflected, returns would have been lower. Past performance is no guarantee of future results. Share price, yield, and investment return fluctuate such that upon redemption, fund shares may be worth more or less than their original cost.
2 Source: Lipper Inc. — The MSCI World Index is a free float-adjusted market capitalization-weighted index that is designed to measure the equity market performance of developed markets. It reflects reinvestment of net dividends and, where applicable, capital gain distributions. Investors cannot invest directly in any index.
Equities are subject generally to market, market sector, market liquidity, issuer, and investment style risks, among other factors, to varying degrees, all of which are more fully described in the fund’s prospectus.
Investing internationally involves special risks, including changes in currency exchange rates, political, economic, and social instability, a lack of comprehensive company information, differing auditing and legal standards, and less market liquidity. These risks generally are greater with emerging market countries than with more economically and politically established foreign countries.
5
FUND PERFORMANCE(Unaudited)
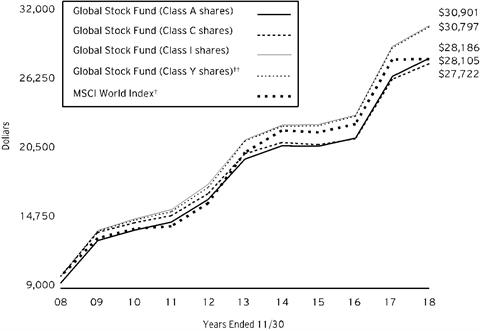
Comparison of change in value of $10,000 investment in Global Stock Fund Class A shares, Class C shares, Class I shares and Class Y shares and the MSCI World Index (the “Index”)
† Source: Lipper Inc.
†† The total return figures presented for Class Y shares of the fund reflect the performance of the fund’s Class A shares for the period prior to 7/1/13 (the inception date for Class Y shares), not reflecting the applicable sales charges for Class A shares.
Past performance is not predictive of future performance.
The above graph compares a $10,000 investment made in each of the Class A, Class C, Class I and Class Y shares of Global Stock Fund on 11/30/08 to a $10,000 investment made in the Index on that date. All dividends and capital gain distributions are reinvested.
The fund’s performance shown in the line graph above takes into account the maximum initial sales charge on Class A shares and all other applicable fees and expenses on all classes. The Index is a free float- adjusted market capitalization-weighted index that is designed to measure the equity market performance of developed markets. Unlike a mutual fund, the Index is not subject to charges, fees and other expenses. Investors cannot invest directly in any index. Further information relating to fund performance, including expense reimbursements, if applicable, is contained in the Financial Highlights section of the prospectus and elsewhere in this report.
6
| | | | | |
Average Annual Total Returnsas of 11/30/18 |
| Inception
Date | 1 Year | 5 Years | 10 Years |
Class A shares | | | | |
with maximum sales charge (5.75%) | 12/29/06 | -0.45% | 6.06% | 10.92% |
without sales charge | 12/29/06 | 5.61% | 7.33% | 11.57% |
Class C shares | | | | |
with applicable redemption charge† | 12/29/06 | 3.87% | 6.51% | 10.73% |
without redemption | 12/29/06 | 4.85% | 6.51% | 10.73% |
Class I shares | 12/29/06 | 5.89% | 7.64% | 11.94% |
Class Y shares | 7/1/13 | 5.98% | 7.67% | 11.91%†† |
MSCI World Index | | 0.14% | 6.67% | 10.89% |
† The maximum contingent deferred sales charge for Class C shares is 1% for shares redeemed within one year of the date of purchase.
†† The total return performance figures presented for Class Y shares of the fund reflect the performance of the fund’s Class A shares for the period prior to 7/1/13 (the inception date for Class Y shares), not reflecting the applicable sales charges for Class A shares.
The performance data quoted represents past performance, which is no guarantee of future results. Share price and investment return fluctuate and an investor’s shares may be worth more or less than original cost upon redemption. Current performance may be lower or higher than the performance quoted. Go to Dreyfus.com for the fund’s most recent month-end returns.
The fund’s performance shown in the graph and table does not reflect the deduction of taxes that a shareholder would pay on fund distributions or the redemption of fund shares. In addition to the performance of Class A shares shown with and without a maximum sales charge, the fund's performance shown in the table takes into account all other applicable fees and expenses on all classes.
7
UNDERSTANDING YOUR FUND’S EXPENSES(Unaudited)
As a mutual fund investor, you pay ongoing expenses, such as management fees and other expenses. Using the information below, you can estimate how these expenses affect your investment and compare them with the expenses of other funds. You also may pay one-time transaction expenses, including sales charges (loads) and redemption fees, which are not shown in this section and would have resulted in higher total expenses. For more information, see your fund’s prospectus or talk to your financial adviser.
Review your fund’s expenses
The table below shows the expenses you would have paid on a $1,000 investment in Global Stock Fund from December 1, 2017 to November 30, 2018. It also shows how much a $1,000 investment would be worth at the close of the period, assuming actual returns and expenses.
| | | | | | | | | |
Expenses and Value of a $1,000 Investment |
assuming actual returns for the six months ended November 30, 2018 |
| | Class A | Class C | Class I | Class Y |
Expenses paid per $1,000† | | $6.12 | | $10.05 | | $4.86 | | $4.51 |
Ending value (after expenses) | | $1,018.90 | | $1,015.40 | | $1,020.00 | | $1,020.50 |
COMPARING YOUR FUND’S EXPENSES
WITH THOSE OF OTHER FUNDS(Unaudited)
Using the SEC’s method to compare expenses
The Securities and Exchange Commission (“SEC”) has established guidelines to help investors assess fund expenses. Per these guidelines, the table below shows your fund’s expenses based on a $1,000 investment, assuming a hypothetical 5% annualized return. You can use this information to compare the ongoing expenses (but not transaction expenses or total cost) of investing in the fund with those of other funds. All mutual fund shareholder reports will provide this information to help you make this comparison. Please note that you cannot use this information to estimate your actual ending account balance and expenses paid during the period.
| | | | | | | | | |
Expenses and Value of a $1,000 Investment |
assuming a hypothetical 5% annualized return for the six months ended November 30, 2018 |
| | Class A | Class C | Class I | Class Y |
Expenses paid per $1,000† | | $6.12 | | $10.05 | | $4.86 | | $4.51 |
Ending value (after expenses) | | $1,019.00 | | $1,015.09 | | $1,020.26 | | $1,020.61 |
† Expenses are equal to the fund’s annualized expense ratio of 1.21% for Class A, 1.99% for Class C, .96% for Class I and .89% for Class Y, multiplied by the average account value over the period, multiplied by 183/365 (to reflect the one-half year period).
8
STATEMENT OF INVESTMENTS
November 30, 2018
| | | | | | | | |
| |
Description | | | | Shares | | Value ($) | |
Common Stocks - 98.0% | | | | | |
Australia - 1.8% | | | | | |
CSL | | | | 169,700 | | 22,098,221 | |
Canada - 1.6% | | | | | |
Alimentation Couche Tard, Cl. B | | | | 384,500 | | 20,179,268 | |
China - 2.0% | | | | | |
CNOOC | | | | 15,260,000 | | 25,741,295 | |
Denmark - 1.8% | | | | | |
Novo Nordisk, Cl. B | | | | 491,500 | | 22,908,799 | |
Finland - .9% | | | | | |
Kone, Cl. B | | | | 235,400 | | 11,665,262 | |
France - 5.6% | | | | | |
Essilorluxottica | | | | 186,700 | | 23,714,917 | |
L'Oreal | | | | 102,400 | | 24,206,217 | |
LVMH Moet Hennessy Louis Vuitton | | | | 76,800 | | 22,101,636 | |
| | | | | 70,022,770 | |
Hong Kong - 4.7% | | | | | |
AIA Group | | | | 3,621,800 | | 29,706,740 | |
CLP Holdings | | | | 1,301,000 | | 14,341,111 | |
Hong Kong & China Gas | | | | 7,356,787 | | 14,836,875 | |
| | | | | 58,884,726 | |
Japan - 8.4% | | | | | |
Denso | | | | 338,700 | | 15,655,719 | |
FANUC | | | | 96,300 | | 16,598,790 | |
Keyence | | | | 63,214 | | 34,303,681 | |
Shin-Etsu Chemical | | | | 276,900 | | 24,722,561 | |
SMC | | | | 41,500 | | 14,067,921 | |
| | | | | 105,348,672 | |
Spain - 1.9% | | | | | |
Inditex | | | | 801,500 | | 24,591,763 | |
Switzerland - 8.1% | | | | | |
Nestle | | | | 295,000 | | 25,190,036 | |
Novartis | | | | 305,500 | | 27,888,051 | |
Roche Holding | | | | 107,500 | | 27,893,982 | |
SGS | | | | 8,700 | | 20,661,938 | |
| | | | | 101,634,007 | |
Taiwan - 2.1% | | | | | |
Taiwan Semiconductor Manufacturing, ADR | | | | 692,000 | | 26,012,280 | |
United Kingdom - 7.7% | | | | | |
Compass Group | | | | 1,127,884 | | 24,134,820 | |
Experian | | | | 986,500 | | 24,058,312 | |
Linde | | | | 162,900 | | 25,909,245 | |
9
STATEMENT OF INVESTMENTS (continued)
| | | | | | | | |
| |
Description | | | | Shares | | Value ($) | |
Common Stocks - 98.0% (continued) | | | | | |
United Kingdom - 7.7% (continued) | | | | | |
Reckitt Benckiser Group | | | | 271,700 | | 22,604,890 | |
| | | | | 96,707,267 | |
United States - 51.4% | | | | | |
Adobe Systems | | | | 123,700 | a | 31,035,093 | |
Alphabet, Cl. C | | | | 26,297 | a | 28,780,226 | |
Amphenol | | | | 277,500 | | 24,403,350 | |
Automatic Data Processing | | | | 174,900 | | 25,783,758 | |
Cerner | | | | 419,400 | a | 24,287,454 | |
Cisco Systems | | | | 578,400 | | 27,688,008 | |
Cognizant Technology Solutions, Cl. A | | | | 371,700 | | 26,476,191 | |
Colgate-Palmolive | | | | 358,100 | | 22,746,512 | |
Edwards Lifesciences | | | | 172,500 | a | 27,946,725 | |
EOG Resources | | | | 292,500 | | 30,218,175 | |
Fastenal | | | | 465,000 | | 27,555,900 | |
Gilead Sciences | | | | 262,000 | | 18,848,280 | |
Intuitive Surgical | | | | 50,200 | a | 26,649,674 | |
Johnson & Johnson | | | | 186,200 | | 27,352,780 | |
Mastercard, Cl. A | | | | 155,300 | | 31,226,171 | |
Microsoft | | | | 258,000 | | 28,609,620 | |
NIKE, Cl. B | | | | 374,900 | | 28,162,488 | |
Oracle | | | | 545,400 | | 26,593,704 | |
Schlumberger | | | | 351,600 | | 15,857,160 | |
Starbucks | | | | 468,116 | | 31,232,700 | |
Stryker | | | | 164,600 | | 28,880,716 | |
The TJX Companies | | | | 676,800 | | 33,061,680 | |
Walt Disney | | | | 240,500 | | 27,775,345 | |
Waters | | | | 126,900 | a | 25,199,802 | |
| | | | | 646,371,512 | |
Total Common Stocks(cost $707,088,071) | | | | 1,232,165,842 | |
| | | 1-Day
Yield (%) | | | | | |
Investment Companies - 1.8% | | | | | |
Registered Investment Companies - 1.8% | | | | | |
Dreyfus Institutional Preferred Government Plus Money Market Fund
(cost $23,177,506) | | 2.23 | | 23,177,506 | b | 23,177,506 | |
Total Investments(cost $730,265,577) | | 99.8% | | 1,255,343,348 | |
Cash and Receivables (Net) | | .2% | | 2,375,871 | |
Net Assets | | 100.0% | | 1,257,719,219 | |
ADR—American Depository Receipt
a Non-income producing security.
b Investment in affiliated issuer. The investment objective of this investment company is publicly available and can be found within the investment company’s prospectus.
10
| | |
Portfolio Summary (Unaudited)† | Value (%) |
Pharmaceuticals Biotechnology & Life Sciences | 13.7 |
Software & Services | 13.5 |
Health Care Equipment & Services | 10.4 |
Technology Hardware & Equipment | 6.9 |
Energy | 5.7 |
Capital Goods | 5.6 |
Household & Personal Products | 5.5 |
Retailing | 4.6 |
Media & Entertainment | 4.5 |
Consumer Services | 4.4 |
Materials | 4.0 |
Consumer Durables & Apparel | 4.0 |
Commercial & Professional Services | 3.6 |
Insurance | 2.4 |
Utilities | 2.3 |
Semiconductors & Semiconductor Equipment | 2.1 |
Food, Beverage & Tobacco | 2.0 |
Investment Companies | 1.8 |
Food & Staples Retailing | 1.6 |
Automobiles & Components | 1.2 |
| | 99.8 |
† Based on net assets.
See notes to financial statements.
11
STATEMENT OF INVESTMENTS IN AFFILIATED ISSUERS
| | | | | | | |
Registered Investment Company | Value
11/30/17($) | Purchases($) | Sales($) | Value
11/30/18($) | Net
Assets(%) | Dividends/
Distributions($) |
Dreyfus Institutional Preferred Government Plus Money Market Fund | 17,085,359 | 211,568,423 | 205,476,276 | 23,177,506 | 1.8 | 374,092 |
See notes to financial statements.
12
STATEMENT OF ASSETS AND LIABILITIES
November 30, 2018
| | | | | | | |
| | | | | | |
| | | Cost | | Value | |
Assets ($): | | | | |
Investments in securities—See Statement of Investments: | | | |
Unaffiliated issuers | 707,088,071 | | 1,232,165,842 | |
Affiliated issuers | | 23,177,506 | | 23,177,506 | |
Cash denominated in foreign currency | | | 11 | | 11 | |
Tax reclaim receivable | | 1,964,528 | |
Dividends receivable | | 979,934 | |
Receivable for shares of Common Stock subscribed | | 699,103 | |
Prepaid expenses | | | | | 75,009 | |
| | | | | 1,259,061,933 | |
Liabilities ($): | | | | |
Due to The Dreyfus Corporation and affiliates—Note 3(c) | | | | 925,254 | |
Payable for shares of Common Stock redeemed | | 154,187 | |
Unrealized depreciation on foreign currency transactions | | 48,206 | |
Directors fees and expenses payable | | 26,688 | |
Accrued expenses | | | | | 188,379 | |
| | | | | 1,342,714 | |
Net Assets ($) | | | 1,257,719,219 | |
Composition of Net Assets ($): | | | | |
Paid-in capital | | | | | 656,519,240 | |
Total distributable earnings (loss) | | | | | 601,199,979 | |
Net Assets ($) | | | 1,257,719,219 | |
| | | | | | |
Net Asset Value Per Share | Class A | Class C | Class I | Class Y | |
Net Assets ($) | 29,368,685 | 11,008,200 | 858,816,657 | 358,525,677 | |
Shares Outstanding | 1,392,902 | 539,347 | 40,120,034 | 16,768,207 | |
Net Asset Value Per Share ($) | 21.08 | 20.41 | 21.41 | 21.38 | |
| | | | | | |
See notes to financial statements. | | | | | |
13
STATEMENT OF OPERATIONS
Year Ended November 30, 2018
| | | | | | | |
| | | | | | |
| | | | | | |
Investment Income ($): | | | | |
Income: | | | | |
Cash dividends (net of $1,557,932 foreign taxes withheld at source): | |
Unaffiliated issuers | | | 21,410,741 | |
Affiliated issuers | | | 374,092 | |
Total Income | | | 21,784,833 | |
Expenses: | | | | |
Management fee—Note 3(a) | | | 10,707,297 | |
Shareholder servicing costs—Note 3(c) | | | 605,558 | |
Directors’ fees and expenses—Note 3(d) | | | 131,796 | |
Professional fees | | | 115,626 | |
Distribution fees—Note 3(b) | | | 87,240 | |
Custodian fees—Note 3(c) | | | 69,569 | |
Registration fees | | | 68,936 | |
Loan commitment fees—Note 2 | | | 29,179 | |
Prospectus and shareholders’ reports | | | 2,245 | |
Interest expense—Note 2 | | | 1,096 | |
Miscellaneous | | | 70,078 | |
Total Expenses | | | 11,888,620 | |
Less—reduction in fees due to earnings credits—Note 3(c) | | | (40) | |
Net Expenses | | | 11,888,580 | |
Investment Income—Net | | | 9,896,253 | |
Realized and Unrealized Gain (Loss) on Investments—Note 4 ($): | | |
Net realized gain (loss) on investments and foreign currency transactions | 66,535,985 | |
Net realized gain (loss) on forward foreign currency exchange contracts | (198,967) | |
Net Realized Gain (Loss) | | | 66,337,018 | |
Net unrealized appreciation (depreciation) on investments
and foreign currency transactions | | | (1,553,679) | |
Net Realized and Unrealized Gain (Loss) on Investments | | | 64,783,339 | |
Net Increase in Net Assets Resulting from Operations | | 74,679,592 | |
| | | | | | | |
See notes to financial statements. | | | | | |
14
STATEMENT OF CHANGES IN NET ASSETS
| | | | | | | | | | |
| | | | Year Ended November 30, |
| | | | 2018 | | 2017 | a |
Operations ($): | | | | | | | | |
Investment income—net | | | 9,896,253 | | | | 11,865,053 | |
Net realized gain (loss) on investments | | 66,337,018 | | | | 90,046,999 | |
Net unrealized appreciation (depreciation)
on investments | | (1,553,679) | | | | 179,230,679 | |
Net Increase (Decrease) in Net Assets
Resulting from Operations | 74,679,592 | | | | 281,142,731 | |
Distributions ($): | |
Distributions to shareholders: | | | | | | | | |
Class A | | | (1,955,958) | | | | (291,603) | |
Class C | | | (813,025) | | | | (47,239) | |
Class I | | | (67,086,813) | | | | (10,912,493) | |
Class Y | | | (26,820,605) | | | | (3,651,189) | |
Total Distributions | | | (96,676,401) | | | | (14,902,524) | |
Capital Stock Transactions ($): | |
Net proceeds from shares sold: | | | | | | | | |
Class A | | | 6,806,536 | | | | 2,508,326 | |
Class C | | | 1,267,328 | | | | 721,880 | |
Class I | | | 96,404,757 | | | | 98,970,461 | |
Class Y | | | 22,873,279 | | | | 27,899,949 | |
Distributions reinvested: | | | | | | | | |
Class A | | | 1,751,194 | | | | 265,488 | |
Class C | | | 677,592 | | | | 37,478 | |
Class I | | | 65,070,306 | | | | 10,622,378 | |
Class Y | | | 14,346,019 | | | | 1,510,206 | |
Cost of shares redeemed: | | | | | | | | |
Class A | | | (4,167,162) | | | | (17,551,420) | |
Class C | | | (3,825,259) | | | | (3,531,924) | |
Class I | | | (189,562,441) | | | | (313,783,808) | |
Class Y | | | (27,820,801) | | | | (45,711,611) | |
Increase (Decrease) in Net Assets
from Capital Stock Transactions | (16,178,652) | | | | (238,042,597) | |
Total Increase (Decrease) in Net Assets | (38,175,461) | | | | 28,197,610 | |
Net Assets ($): | |
Beginning of Period | | | 1,295,894,680 | | | | 1,267,697,070 | |
End of Period | | | 1,257,719,219 | | | | 1,295,894,680 | |
15
STATEMENT OF CHANGES IN NET ASSETS (continued)
| | | | | | | | | | |
| | | | Year Ended November 30, |
| | | | 2018 | | 2017 | a |
Capital Share Transactions (Shares): | |
Class Ab,c | | | | | | | | |
Shares sold | | | 323,340 | | | | 129,043 | |
Shares issued for distributions reinvested | | | 87,081 | | | | 15,162 | |
Shares redeemed | | | (200,912) | | | | (951,258) | |
Net Increase (Decrease) in Shares Outstanding | 209,509 | | | | (807,053) | |
Class Cc | | | | | | | | |
Shares sold | | | 62,387 | | | | 38,565 | |
Shares issued for distributions reinvested | | | 34,553 | | | | 2,190 | |
Shares redeemed | | | (186,150) | | | | (190,687) | |
Net Increase (Decrease) in Shares Outstanding | (89,210) | | | | (149,932) | |
Class Ib | | | | | | | | |
Shares sold | | | 4,533,874 | | | | 5,128,996 | |
Shares issued for distributions reinvested | | | 3,194,419 | | | | 599,796 | |
Shares redeemed | | | (8,908,304) | | | | (15,943,871) | |
Net Increase (Decrease) in Shares Outstanding | (1,180,011) | | | | (10,215,079) | |
Class Yb | | | | | | | | |
Shares sold | | | 1,059,610 | | | | 1,437,815 | |
Shares issued for distributions reinvested | | | 705,311 | | | | 85,419 | |
Shares redeemed | | | (1,305,570) | | | | (2,381,066) | |
Net Increase (Decrease) in Shares Outstanding | 459,351 | | | | (857,832) | |
| | | | | | | | | | |
aDistributions to shareholders include $172,872 Class A, $7,719,465 Class I and $2,610,134 Class Y of distributions from net investment income and $118,731 Class A, $47,239 Class C, $3,193,028 Class I and $1,041,055 Class Y distributions from net realized gains. Undistributed investment income—net was $11,797,141 in 2017 and is no longer presented as a result of the adoption of SEC’s Disclosure Update and Simplification Rule. | |
bDuring the period ended November 30, 2018, 2,769 Class A shares representing $55,424 were exchanged for 2,734 Class I shares, 8,179 Class Y shares representing $174,775 were exchanged for 8,279 Class A shares, 159,334 Class Y shares representing $3,358,669 were exchanged for 159,097 Class I shares and during the period ended November 30, 2017, 41,874 Class A shares representing $802,238 were exchanged for 41,358 Class I shares, 1,688 Class C shares representing $28,962 were exchanged for 1,631 Class I shares and 133,262 Class Y shares representing $2,579,219 were exchanged for 133,120 Class I shares. | |
cDuring the period ended November 30, 2018, 304 Class C shares representing $6,331 were automatically exchanged for 295 Class A shares. | |
See notes to financial statements. | | | | | | | | |
16
FINANCIAL HIGHLIGHTS
The following tables describe the performance for each share class for the fiscal periods indicated. All information (except portfolio turnover rate) reflects financial results for a single fund share. Total return shows how much your investment in the fund would have increased (or decreased) during each period, assuming you had reinvested all dividends and distributions. These figures have been derived from the fund’s financial statements.
| | | | | | | |
| | | |
| | | Year Ended November 30, |
Class A Shares | | 2018 | 2017 | 2016 | 2015 | 2014 |
Per Share Data ($): | | | | | | |
Net asset value, beginning of period | | 21.53 | 17.51 | 18.66 | 18.89 | 18.02 |
Investment Operations: | | | | | | |
Investment income—neta | | .11 | .11 | .11 | .13 | .14 |
Net realized and unrealized
gain (loss) on investments | | 1.02 | 4.06 | .42 | (.14) | .83 |
Total from Investment Operations | | 1.13 | 4.17 | .53 | (.01) | .97 |
Distributions: | | | | | | |
Dividends from
investment income—net | | (.15) | (.09) | (.19) | (.13) | (.10) |
Dividends from net realized
gain on investments | | (1.43) | (.06) | (1.49) | (.09) | - |
Total Distributions | | (1.58) | (.15) | (1.68) | (.22) | (.10) |
Net asset value, end of period | | 21.08 | 21.53 | 17.51 | 18.66 | 18.89 |
Total Return (%)b | | 5.61 | 24.04 | 3.19 | (.13) | 5.49 |
Ratios/Supplemental Data (%): | | | | | | |
Ratio of total expenses
to average net assets | | 1.20 | 1.22 | 1.22 | 1.23 | 1.23 |
Ratio of net expenses
to average net assets | | 1.20 | 1.22 | 1.22 | 1.23 | 1.23 |
Ratio of net investment income
to average net assets | | .52 | .60 | .63 | .71 | .76 |
Portfolio Turnover Rate | | 8.15 | 6.50 | 11.79 | 10.82 | 7.05 |
Net Assets, end of period ($ x 1,000) | | 29,369 | 25,477 | 34,844 | 43,698 | 55,682 |
a Based on average shares outstanding.
b Exclusive of sales charge.
See notes to financial statements.
17
FINANCIAL HIGHLIGHTS (continued)
| | | | | | | |
| | | |
| | | Year Ended November 30, |
Class C Shares | | 2018 | 2017 | 2016 | 2015 | 2014 |
Per Share Data ($): | | | | | | |
Net asset value, beginning of period | | 20.89 | 17.03 | 18.18 | 18.42 | 17.61 |
Investment Operations: | | | | | | |
Investment (loss)—neta | | (.05) | (.02) | (.02) | (.01) | (.01) |
Net realized and unrealized
gain (loss) on investments | | 1.00 | 3.94 | .40 | (.14) | .82 |
Total from Investment Operations | | .95 | 3.92 | .38 | (.15) | .81 |
Distributions: | | | | | | |
Dividends from
investment income—net | | - | - | (.04) | - | - |
Dividends from net realized
gain on investments | | (1.43) | (.06) | (1.49) | (.09) | - |
Total Distributions | | (1.43) | (.06) | (1.53) | (.09) | - |
Net asset value, end of period | | 20.41 | 20.89 | 17.03 | 18.18 | 18.42 |
Total Return (%)b | | 4.85 | 23.11 | 2.36 | (.83) | 4.60 |
Ratios/Supplemental Data (%): | | | | | | |
Ratio of total expenses
to average net assets | | 1.97 | 1.99 | 1.99 | 1.99 | 2.00 |
Ratio of net expenses
to average net assets | | 1.97 | 1.99 | 1.99 | 1.99 | 2.00 |
Ratio of net investment
(loss) to average net assets | | (.22) | (.10) | (.13) | (.07) | (.05) |
Portfolio Turnover Rate | | 8.15 | 6.50 | 11.79 | 10.82 | 7.05 |
Net Assets, end of period ($ x 1,000) | | 11,008 | 13,132 | 13,258 | 16,303 | 21,221 |
a Based on average shares outstanding.
b Exclusive of sales charge.
See notes to financial statements.
18
| | | | | | | |
| | |
| | | Year Ended November 30, |
Class I Shares | | 2018 | 2017 | 2016 | 2015 | 2014 |
Per Share Data ($): | | | | | | |
Net asset value, beginning of period | | 21.83 | 17.76 | 18.92 | 19.18 | 18.28 |
Investment Operations: | | | | | | |
Investment income—neta | | .17 | .18 | .16 | .20 | .20 |
Net realized and unrealized
gain (loss) on investments | | 1.04 | 4.10 | .43 | (.16) | .85 |
Total from Investment Operations | | 1.21 | 4.28 | .59 | .04 | 1.05 |
Distributions: | | | | | | |
Dividends from
investment income—net | | (.20) | (.15) | (.26) | (.21) | (.15) |
Dividends from net realized
gain on investments | | (1.43) | (.06) | (1.49) | (.09) | - |
Total Distributions | | (1.63) | (.21) | (1.75) | (.30) | (.15) |
Net asset value, end of period | | 21.41 | 21.83 | 17.76 | 18.92 | 19.18 |
Total Return (%) | | 5.89 | 24.40 | 3.50 | .20 | 5.80 |
Ratios/Supplemental Data (%): | | | | | | |
Ratio of total expenses
to average net assets | | .94 | .98 | .91 | .91 | .91 |
Ratio of net expenses
to average net assets | | .94 | .98 | .91 | .91 | .91 |
Ratio of net investment income
to average net assets | | .78 | .92 | .93 | 1.05 | 1.06 |
Portfolio Turnover Rate | | 8.15 | 6.50 | 11.79 | 10.82 | 7.05 |
Net Assets, end of period ($ x 1,000) | | 858,817 | 901,556 | 915,049 | 809,432 | 1,470,169 |
a Based on average shares outstanding.
See notes to financial statements.
19
FINANCIAL HIGHLIGHTS (continued)
| | | | | | | |
| | |
| | | Year Ended November 30, |
Class Y Shares | | 2018 | 2017 | 2016 | 2015 | 2014 |
Per Share Data ($): | | | | | | |
Net asset value, beginning of period | | 21.81 | 17.74 | 18.90 | 19.16 | 18.27 |
Investment Operations: | | | | | | |
Investment income—neta | | .18 | .19 | .17 | .19 | .14 |
Net realized and unrealized
gain (loss) on investments | | 1.04 | 4.10 | .42 | (.15) | .90 |
Total from Investment Operations | | 1.22 | 4.29 | .59 | .04 | 1.04 |
Distributions: | | | | | | |
Dividends from
investment income—net | | (.22) | (.16) | (.26) | (.21) | (.15) |
Dividends from net realized
gain on investments | | (1.43) | (.06) | (1.49) | (.09) | - |
Total Distributions | | (1.65) | (.22) | (1.75) | (.30) | (.15) |
Net asset value, end of period | | 21.38 | 21.81 | 17.74 | 18.90 | 19.16 |
Total Return (%) | | 5.98 | 24.47 | 3.51 | .21 | 5.75 |
Ratios/Supplemental Data (%): | | | | | | |
Ratio of total expenses
to average net assets | | .89 | .90 | .89 | .90 | .90 |
Ratio of net expenses
to average net assets | | .89 | .90 | .89 | .90 | .90 |
Ratio of net investment income
to average net assets | | .85 | .99 | .95 | 1.03 | .74 |
Portfolio Turnover Rate | | 8.15 | 6.50 | 11.79 | 10.82 | 7.05 |
Net Assets, end of period ($ x 1,000) | | 358,526 | 355,729 | 304,547 | 341,823 | 469,801 |
a Based on average shares outstanding.
See notes to financial statements.
20
NOTES TO FINANCIAL STATEMENTS
NOTE 1—Significant Accounting Policies:
Global Stock Fund (the “fund”) is a separate diversified series of Strategic Funds, Inc. (the “Company”), which is registered under the Investment Company Act of 1940, as amended (the “Act”), as an open-end management investment company and operates as a series company currently offering six series, including the fund. The fund’s investment objective is to seek long-term total return. The Dreyfus Corporation (the “Manager” or “Dreyfus”), a wholly-owned subsidiary of The Bank of New York Mellon Corporation (“BNY Mellon”), serves as the fund’s investment adviser. Walter Scott & Partners Limited (“Walter Scott”), a wholly-owned subsidiary of BNY Mellon and an affiliate of Dreyfus, serves as the fund’s sub-investment adviser.
MBSC Securities Corporation (the “Distributor”), a wholly-owned subsidiary of Dreyfus, is the distributor of the fund’s shares. The fund is authorized to issue 600 million shares of $.001 par value Common Stock. The fund currently has authorized five classes of shares: Class A (100 million shares authorized), Class C (100 million shares authorized), Class I (200 million shares authorized), Class T (100 million shares authorized) and Class Y (100 million shares authorized). Class A and Class T shares generally are subject to a sales charge imposed at the time of purchase. Class C shares are subject to a contingent deferred sales charge (“CDSC”) imposed on Class C shares redeemed within one year of purchase. Class C shares automatically convert to Class A shares ten years after the date of purchase, without the imposition of a sales charge. Class I and Class Y shares are sold at net asset value per share generally to institutional investors. As of the date of this report, the fund did not offer Class T shares for purchase. Other differences between the classes include the services offered to and the expenses borne by each class, the allocation of certain transfer agency costs and certain voting rights. Income, expenses (other than expenses attributable to a specific class), and realized and unrealized gains or losses on investments are allocated to each class of shares based on its relative net assets.
The Company accounts separately for the assets, liabilities and operations of each series. Expenses directly attributable to each series are charged to that series’ operations; expenses which are applicable to all series are allocated among them on a pro rata basis.
The Financial Accounting Standards Board (“FASB”) Accounting Standards Codification is the exclusive reference of authoritative U.S. generally accepted accounting principles (“GAAP”) recognized by the
21
NOTES TO FINANCIAL STATEMENTS(continued)
FASB to be applied by nongovernmental entities. Rules and interpretive releases of the Securities and Exchange Commission (“SEC”) under authority of federal laws are also sources of authoritative GAAP for SEC registrants. The fund’s financial statements are prepared in accordance with GAAP, which may require the use of management estimates and assumptions. Actual results could differ from those estimates.
The Companyenters into contracts that contain a variety of indemnifications. The fund’s maximum exposure under these arrangements is unknown. The fund does not anticipate recognizing any loss related to these arrangements.
(a) Portfolio valuation: The fair value of a financial instrument is the amount that would be received to sell an asset or paid to transfer a liability in an orderly transaction between market participants at the measurement date (i.e., the exit price). GAAP establishes a fair value hierarchy that prioritizes the inputs of valuation techniques used to measure fair value. This hierarchy gives the highest priority to unadjusted quoted prices in active markets for identical assets or liabilities (Level 1 measurements) and the lowest priority to unobservable inputs (Level 3 measurements).
Additionally, GAAP provides guidance on determining whether the volume and activity in a market has decreased significantly and whether such a decrease in activity results in transactions that are not orderly. GAAP requires enhanced disclosures around valuation inputs and techniques used during annual and interim periods.
Various inputs are used in determining the value of the fund’s investments relating to fair value measurements. These inputs are summarized in the three broad levels listed below:
Level 1—unadjusted quoted prices in active markets for identical investments.
Level 2—other significant observable inputs (including quoted prices for similar investments, interest rates, prepayment speeds, credit risk, etc.).
Level 3—significant unobservable inputs (including the fund’s own assumptions in determining the fair value of investments).
The inputs or methodology used for valuing securities are not necessarily an indication of the risk associated with investing in those securities.
Changes in valuation techniques may result in transfers in or out of an assigned level within the disclosure hierarchy. Valuation techniques used to value the fund’s investments are as follows:
22
Investments in securities are valued at the last sales price on the securities exchange or national securities market on which such securities are primarily traded. Securities listed on the National Market System for which market quotations are available are valued at the official closing price or, if there is no official closing price that day, at the last sales price. For open short positions, asked prices are used for valuation purposes. Bid price is used when no asked price is available. Registered investment companies that are not traded on an exchange are valued at their net asset value. All of the preceding securities are generally categorized within Level 1 of the fair value hierarchy.
Securities not listed on an exchange or the national securities market, or securities for which there were no transactions, are valued at the average of the most recent bid and asked prices. These securities are generally categorized within Level 2 of the fair value hierarchy.
Fair valuing of securities may be determined with the assistance of a pricing service using calculations based on indices of domestic securities and other appropriate indicators, such as prices of relevant ADRs and futures. Utilizing these techniques may result in transfers between Level 1 and Level 2 of the fair value hierarchy.
When market quotations or official closing prices are not readily available, or are determined not to accurately reflect fair value, such as when the value of a security has been significantly affected by events after the close of the exchange or market on which the security is principally traded (for example, a foreign exchange or market), but before the fund calculates its net asset value, the fund may value these investments at fair value as determined in accordance with the procedures approved by the Company’s Board of Directors (the “Board”). Certain factors may be considered when fair valuing investments such as: fundamental analytical data, the nature and duration of restrictions on disposition, an evaluation of the forces that influence the market in which the securities are purchased and sold, and public trading in similar securities of the issuer or comparable issuers. These securities are either categorized within Level 2 or 3 of the fair value hierarchy depending on the relevant inputs used.
For restricted securities where observable inputs are limited, assumptions about market activity and risk are used and such securities are generally categorized within Level 3 of the fair value hierarchy.
Investments denominated in foreign currencies are translated to U.S. dollars at the prevailing rates of exchange.
The following is a summary of the inputs used as of November 30, 2018in valuing the fund’s investments:
23
NOTES TO FINANCIAL STATEMENTS(continued)
| | | | | |
| | Level 1- Unadjusted Quoted Prices | Level 2 - Other Significant Observable Inputs | Level 3- Significant Unobservable Inputs | Total |
Assets ($) |
Investments in Securities: |
Equity Securities - Domestic Common Stocks† | 718,472,305 | 513,693,537†† | - | 1,232,165,842 |
Investment Company | 23,177,506 | - | - | 23,177,506 |
† See Statement of Investments for additional detailed categorizations.
†† Securities classified within Level 2 at period end as the values were determined pursuant to the fund’s fair valuation procedures.
At November 30, 2018, the amount of securities transferred between levels equals fair value of exchange traded equity securities reported as Level 2 in the table above. At November 30, 2017, $582,941,725 of exchange traded foreign equity securities were classified within Level 2 of the fair value hierarchy pursuant to the fund’s fair valuation procedures. It is the fund’s policy to recognize transfers between levels at the end of the reporting period.
(b) Foreign currency transactions: The fund does not isolate that portion of the results of operations resulting from changes in foreign exchange rates on investments from the fluctuations arising from changes in the market prices of securities held. Such fluctuations are included with the net realized and unrealized gain or loss on investments.
Net realized foreign exchange gains or losses arise from sales of foreign currencies, currency gains or losses realized on securities transactions between trade and settlement date, and the difference between the amounts of dividends, interest and foreign withholding taxes recorded on the fund’s books and the U.S. dollar equivalent of the amounts actually received or paid. Net unrealized foreign exchange gains and losses arise from changes in the value of assets and liabilities other than investments resulting from changes in exchange rates. Foreign currency gains and losses on foreign currency transactions are also included with net realized and unrealized gain or loss on investments.
(c)Securities transactions and investment income: Securities transactions are recorded on a trade date basis. Realized gains and losses from securities transactions are recorded on the identified cost basis. Dividend income is recognized on the ex-dividend date and interest income, including, where applicable, accretion of discount and amortization of premium on investments, is recognized on the accrual basis.
24
(d) Affiliated issuers: Investments in other investment companies advised by Dreyfus are considered “affiliated” under the Act.
(e) Risk: Investing in foreign markets may involve special risks and considerations not typically associated with investing in the U.S. These risks include revaluation of currencies, high rates of inflation, repatriation restrictions on income and capital, and adverse political and economic developments. Moreover, securities issued in these markets may be less liquid, subject to government ownership controls and delayed settlements, and their prices may be more volatile than those of comparable securities in the U.S.
(f) Dividends and distributions to shareholders: Dividends and distributions are recorded on the ex-dividend date. Dividends from investment income-net and dividends from net realized capital gains, if any, are normally declared and paid annually, but the fund may make distributions on a more frequent basis to comply with the distribution requirements of the Internal Revenue Code of 1986, as amended (the “Code”). To the extent that net realized capital gains can be offset by capital loss carryovers, it is the policy of the fund not to distribute such gains. Income and capital gain distributions are determined in accordance with income tax regulations, which may differ from GAAP.
(g) Federal income taxes: It is the policy of the fund to continue to qualify as a regulated investment company, if such qualification is in the best interests of its shareholders, by complying with the applicable provisions of the Code, and to make distributions of taxable income and net realized capital gain sufficient to relieve it from substantially all federal income and excise taxes.
As of and during the period ended November 30, 2018, the fund did not have any liabilities for any uncertain tax positions. The fund recognizes interest and penalties, if any, related to uncertain tax positions as income tax expense in the Statement of Operations. During the period ended November 30, 2018, the fund did not incur any interest or penalties.
Each tax year in the four-year period ended November 30, 2018 remains subject to examination by the Internal Revenue Service and state taxing authorities.
At November 30, 2018, the components of accumulated earnings on a tax basis were as follows: undistributed ordinary income $9,830,156, undistributed capital gains $66,387,983 and unrealized appreciation $524,981,840.
25
NOTES TO FINANCIAL STATEMENTS(continued)
The tax character of distributions paid to shareholders during the fiscal periods ended November 30, 2018 and November 30, 2017 were as follows: ordinary income $17,666,299 and $10,502,471, and long-term capital gains $79,010,102 and $4,400,053, respectively.
(h) New Accounting Pronouncements: In August 2018, the FASB issued Accounting Standards Update 2018-13, Fair Value Measurement (Topic 820): Disclosure Framework—Changes to the Disclosure Requirements for Fair Value Measurement (“ASU 2018-13”). The update provides guidance that eliminates, adds and modifies certain disclosure requirements for fair value measurements. ASU 2018-13 will be effective for annual periods beginning after December 15, 2019. Management is currently assessing the potential impact of these changes to future financial statements.
NOTE 2—Bank Lines of Credit:
The fund participates with other Dreyfus-managed long-term open-end funds in an $1.030 billion unsecured credit facility led by Citibank, N.A. (the “Citibank Credit Facility”) and a $300 million unsecured credit facility provided by The Bank of New York Mellon (the “BNYM Credit Facility”), a subsidiary of BNY Mellon and an affiliate of Dreyfus, each to be utilized primarily for temporary or emergency purposes, including the financing of redemptions (each, a “Facility”). The Citibank Credit Facility is available in two tranches: (i) Tranche A is in an amount equal to $830 million and is available to all long-term open-ended funds, including the fund, and (ii) Tranche B is in amount equal to $200 million and is available only to the Dreyfus Floating Rate Income Fund, a series of The Dreyfus/Laurel Funds, Inc. Prior to October 3, 2018, the unsecured credit facility with Citibank, N.A. was $830 million. In connection therewith, the fund has agreed to pay its pro rata portion of commitment fees for Tranche A of the Citibank Credit Facility and the BNYM Credit Facility. Interest is charged to the fund based on rates determined pursuant to the terms of the respective Facility at the time of borrowing.
The average amount of borrowings outstanding under the Facilities during the period ended November 30, 2018 was approximately $43,800 with a related weighted average annualized interest rate of 2.50%.
NOTE 3—Management Fee, Sub-Investment Advisory Fee and Other Transactions with Affiliates:
(a)Pursuant to a management agreement with Dreyfus, the management fee is computed at the annual rate of .85% of the value of the fund’s average daily net assets and is payable monthly.
26
Pursuant to a sub-investment advisory agreement between Dreyfus and Walter Scott, Dreyfus pays Walter Scott a monthly fee at an annual rate of .41% of the value of the fund’s average daily net assets.
During the period ended November 30, 2018, the Distributor retained $2,634 from commissions earned on sales of the fund’s Class A shares and $118 from CDSC fees on redemptions of the fund’s Class C shares.
(b) Under the Distribution Plan adopted pursuant to Rule 12b-1 under the Act, Class C shares pay the Distributor for distributing its shares at an annual rate of .75% of the value of its average daily net assets. During the period ended November 30, 2018, Class C shares were charged $87,240 pursuant to the Distribution Plan.
(c)Under the Shareholder Services Plan, Class A and Class C shares pay the Distributor at an annual rate of .25% of the value of their average daily net assets for the provision of certain services. The services provided may include personal services relating to shareholder accounts, such as answering shareholder inquiries regarding the fund and providing reports and other information, and services related to the maintenance of shareholder accounts. The Distributor may make payments to Service Agents (securities dealers, financial institutions or other industry professionals) with respect to these services. The Distributor determines the amounts to be paid to Service Agents. During the period ended November 30, 2018, Class A and Class C shares were charged $68,510and $29,080, respectively, pursuant to the Shareholder Services Plan.
The fund has arrangements with the transfer agent and the custodian whereby the fund may receive earnings credits when positive cash balances are maintained, which are used to offset transfer agency and custody fees. For financial reporting purposes, the fund includes net earnings credits, if any, as an expense offset in the Statement of Operations.
The fund compensates Dreyfus Transfer, Inc., a wholly-owned subsidiary of Dreyfus, under a transfer agency agreement for providing transfer agency and cash management services for the fund. The majority of transfer agency fees are comprised of amounts paid on a per account basis, while cash management fees are related to fund subscriptions and redemptions. During the period ended November 30, 2018, the fund was charged $12,053 for transfer agency services. These fees are included in Shareholder servicing costs in the Statement of Operations.
The fund compensates The Bank of New York Mellon under a custody agreement for providing custodial services for the fund. These fees are determined based on net assets, geographic region and transaction activity. During the period ended November 30, 2018, the fund was charged
27
NOTES TO FINANCIAL STATEMENTS(continued)
$69,569 pursuant to the custody agreement. These fees were partially offset by earnings credits of $40.
During the period ended November 30, 2018, the fund was charged $12,780 for services performed by the Chief Compliance Officer and his staff. These fees are included in Miscellaneous in the Statement of Operations.
The components of “Due to The Dreyfus Corporation and affiliates” in the Statement of Assets and Liabilities consist of: management fees $862,997, Distribution Plan fees $6,705, Shareholder Services Plan fees $8,108, custodian fees $39,179, Chief Compliance Officer fees $5,241 and transfer agency fees $3,024.
(d) Each Board member also serves as a Board member of other funds within the Dreyfus complex. Annual retainer fees and attendance fees are allocated to each fund based on net assets.
NOTE 4—Securities Transactions:
The aggregate amount of purchases and sales of investment securities, excluding short-term securities and foreign currency exchange contracts (“forward contracts”), during the period ended November 30, 2018, amounted to $100,982,930 and $212,093,609, respectively.
Derivatives: A derivative is a financial instrument whose performance is derived from the performance of another asset. The fund enters into International Swaps and Derivatives Association, Inc. Master Agreements or similar agreements (collectively, “Master Agreements”) with its over-the-counter (“OTC”) derivative contract counterparties in order to, among other things, reduce its credit risk to counterparties. Master Agreements include provisions for general obligations, representations, collateral and events of default or termination. Under a Master Agreement, the fund may offset with the counterparty certain derivative financial instrument’s payables and/or receivables with collateral held and/or posted and create one single net payment in the event of default or termination.
Each type of derivative instrument that was held by the fund during the period ended November 30, 2018 is discussed below.
Forward Foreign Currency Exchange Contracts: The fund enters into forward contracts in order to hedge its exposure to changes in foreign currency exchange rates on its foreign portfolio holdings, to settle foreign currency transactions or as a part of its investment strategy. When executing forward contracts, the fund is obligated to buy or sell a foreign currency at a specified rate on a certain date in the future. With respect to sales of forward contracts, the fund incurs a loss if the value of the
28
contract increases between the date the forward contract is opened and the date the forward contract is closed. The fund realizes a gain if the value of the contract decreases between those dates. With respect to purchases of forward contracts, the fund incurs a loss if the value of the contract decreases between the date the forward contract is opened and the date the forward contract is closed. The fund realizes a gain if the value of the contract increases between those dates. Any realized or unrealized gains or losses which occurred during the period are reflected in the Statement of Operations. The fund is exposed to foreign currency risk as a result of changes in value of underlying financial instruments. The fund is also exposed to credit risk associated with counterparty nonperformance on these forward contracts, which is generally limited to the unrealized gain on each open contract. This risk may be mitigated by Master Agreements, if any, between the fund and the counterparty and the posting of collateral, if any, by the counterparty to the fund to cover the fund’s exposure to the counterparty. At November 30, 2018, there were no forward contracts outstanding.
The following summarizes the average market value of derivatives outstanding duringthe period ended November 30, 2018:
| | | |
| | Average Market Value ($) |
Forward contracts | | 1,470,814 |
| | | |
At November 30, 2018, the cost of investments for federal income tax purposes was $730,313,303; accordingly, accumulated net unrealized appreciation on investments was $525,030,045, consisting of $544,695,186 gross unrealized appreciation and $19,665,141 gross unrealized depreciation.
29
REPORT OF INDEPENDENT REGISTERED PUBLIC ACCOUNTING FIRM
To the Shareholders and the Board of Directors of Global Stock Fund
Opinion on the Financial Statements
We have audited the accompanying statement of assets and liabilities of Global Stock Fund (the “Fund”) (one of the funds constituting Strategic Funds, Inc.), including the statements of investments and investments in affiliated issuers, as of November 30, 2018, and the related statement of operations for the year then ended, the statements of changes in net assets for each of the two years in the period then ended, the financial highlights for each of the five years in the period then ended and the related notes (collectively referred to as the “financial statements”). In our opinion, the financial statements present fairly, in all material respects, the financial position of the Fund (one of the funds constituting Strategic Funds, Inc.) at November 30, 2018, the results of its operations for the year then ended, the changes in its net assets for each of the two years in the period then ended and its financial highlights for each of the five years in the period then ended, in conformity with U.S. generally accepted accounting principles.
Basis for Opinion
These financial statements are the responsibility of the Fund’s management. Our responsibility is to express an opinion on the Fund’s financial statements based on our audits. We are a public accounting firm registered with the Public Company Accounting Oversight Board (United States) (“PCAOB”) and are required to be independent with respect to the Fund in accordance with the U.S. federal securities laws and the applicable rules and regulations of the Securities and Exchange Commission and the PCAOB.
We conducted our audits in accordance with the standards of the PCAOB. Those standards require that we plan and perform the audit to obtain reasonable assurance about whether the financial statements are free of material misstatement, whether due to error or fraud. The Fund is not required to have, nor were we engaged to perform, an audit of the Fund’s internal control over financial reporting. As part of our audits, we are required to obtain an understanding of internal control over financial reporting, but not for the purpose of expressing an opinion on the effectiveness of the Fund’s internal control over financial reporting. Accordingly, we express no such opinion.
Our audits included performing procedures to assess the risks of material misstatement of the financial statements, whether due to error or fraud, and performing procedures that respond to those risks. Such procedures included examining, on a test basis, evidence regarding the amounts and disclosures in the financial statements. Our procedures included confirmation of securities owned as of November 30, 2018, by correspondence with the custodian and others or by other appropriate auditing procedures where replies from others were not received. Our audits also included evaluating the accounting principles used and significant estimates made by management, as well as evaluating the overall presentation of the financial statements. We believe that our audits provide a reasonable basis for our opinion.

We have served as the auditor of one or more Dreyfus investment companies since at least 1957, but we are unable to determine the specific year.
New York, New York
January 28, 2019
30
IMPORTANT TAX INFORMATION(Unaudited)
For the fiscal year ended November 30, 2018, certain dividends paid by the fund may be subject to a maximum tax rate of 15%, as provided for by the Jobs and Growth Tax Relief Reconciliation Act of 2003. Of the distributions paid during the fiscal year, $17,666,299 represents the maximum amount that may be considered qualified dividend income. Also the fund hereby reports 53.06% of the ordinary dividends paid during the fiscal year ended November 30, 2018 as qualifying for the corporate dividends received deduction. Also, the fund hereby reports $.0991 per share as a short-term capital gain distribution and $1.3353 per share as a long-term capital gain distribution paid on December 29, 2017.
31
INFORMATION ABOUT THE RENEWAL OF THE FUND’S MANAGEMENT AND SUB-INVESTMENT ADVISORY AGREEMENTS (Unaudited)
At a meeting of the fund’s Board of Directors held on November 5-6, 2018, the Board considered the renewal of the fund’s Management Agreement, pursuant to which Dreyfus provides the fund with investment advisory and administrative services (the “Agreement”), and the Sub-Investment Advisory Agreement (together, the “Agreements”), pursuant to which Walter Scott & Partners Limited (the “Subadviser”) provides day-to-day management of the fund’s investments. The Board members, a majority of whom are not “interested persons” (as defined in the Investment Company Act of 1940, as amended) of the fund, were assisted in their review by independent legal counsel and met with counsel in executive session separate from representatives of Dreyfus and the Subadviser. In considering the renewal of the Agreements, the Board considered all factors that it believed to be relevant, including those discussed below. The Board did not identify any one factor as dispositive, and each Board member may have attributed different weights to the factors considered.
Analysis of Nature, Extent, and Quality of Services Provided to the Fund. The Board considered information provided to it at the meeting and in previous presentations from Dreyfus representatives regarding the nature, extent, and quality of the services provided to funds in the Dreyfus fund complex. Dreyfus provided the number of open accounts in the fund, the fund’s asset size and the allocation of fund assets among distribution channels. Dreyfus also had previously provided information regarding the diverse intermediary relationships and distribution channels of funds in the Dreyfus fund complex (such as retail direct or intermediary, in which intermediaries typically are paid by the fund and/or Dreyfus) and Dreyfus’ corresponding need for broad, deep, and diverse resources to be able to provide ongoing shareholder services to each intermediary or distribution channel, as applicable to the fund.
The Board also considered research support available to, and portfolio management capabilities of, the fund’s portfolio management personnel and that Dreyfus also provides oversight of day-to-day fund operations, including fund accounting and administration and assistance in meeting legal and regulatory requirements. The Board also considered Dreyfus’ extensive administrative, accounting and compliance infrastructures, as well as Dreyfus’ supervisory activities over the Subadviser. The Board also considered portfolio management’s brokerage policies and practices (including policies and practices regarding soft dollars) and the standards applied in seeking best execution.
Comparative Analysis of the Fund’s Performance and Management Fee and Expense Ratio. The Board reviewed reports prepared by Broadridge Financial Solutions, Inc. (“Broadridge”), an independent provider of investment company data, which included information comparing (1) the fund’s performance with the performance of a group of comparable funds (the “Performance Group”) and with a broader group of funds (the “Performance Universe”), all for various periods ended September 30, 2018, and (2) the fund’s actual and contractual management fees and total expenses with those of a group of comparable funds (the “Expense Group”) and with a broader group of funds (the
32
“Expense Universe”), the information for which was derived in part from fund financial statements available to Broadridge as of the date of its analysis. Dreyfus previously had furnished the Board with a description of the methodology Broadridge used to select the Performance Group and Performance Universe and the Expense Group and Expense Universe.
Dreyfus representatives stated that the usefulness of performance comparisons may be affected by a number of factors, including different investment limitations and policies that may be applicable to the fund and comparison funds. The Board discussed with representatives of Dreyfus, its affiliates and/or the Subadviser the results of the comparisons and considered that the fund’s total return performance was above the Performance Group median for all periods, except for the four- and five-year periods when it was below the median, and was above the Performance Universe median for all periods (ranking in the first quartile for the one-year period) except the five- and ten-year periods when it was below the median. The Board considered the relative proximity of the fund’s performance to the Performance Group and/or Performance Universe median in certain periods when performance was below median. Dreyfus also provided a comparison of the fund’s calendar year total returns to the returns of the fund’s benchmark index, and it was considered that the fund’s returns were above the returns of the index in six of the ten calendar years shown.
The Board also reviewed the range of actual and contractual management fees and total expenses of the Expense Group and Expense Universe funds and discussed the results of the comparisons. The Board considered that the fund’s contractual management fee was slightly above the Expense Group median, the fund’s actual management fee was at the Expense Group median and approximately equal to the Expense Universe median and the fund’s total expenses were below the Expense Group and Expense Universe medians.
Dreyfus representatives reviewed with the Board the management or investment advisory fees (1) paid by funds advised or administered by Dreyfus that are in the same Lipper category as the fund and (2) paid to Dreyfus or the Subadviser or its affiliates for advising any separate accounts and/or other types of client portfolios that are considered to have similar investment strategies and policies as the fund (the “Similar Clients”), and explained the nature of the Similar Clients. They discussed differences in fees paid and the relationship of the fees paid in light of any differences in the services provided and other relevant factors. The Board considered the relevance of the fee information provided for the Similar Clients to evaluate the appropriateness of the fund’s management fee.
The Board considered the fee to the Subadviser in relation to the fee paid to Dreyfus by the fund and the respective services provided by the Subadviser and Dreyfus. The Board also took into consideration that the Subadviser’s fee is paid by Dreyfus (out of its fee from the fund) and not the fund.
Analysis of Profitability and Economies of Scale. Dreyfus representatives reviewed the expenses allocated and profit received by Dreyfus and its affiliates and the resulting
33
INFORMATION ABOUT THE RENEWAL OF THE FUND’S MANAGEMENT AND SUB-INVESTMENT ADVISORY AGREEMENTS (Unaudited) (continued)
profitability percentage for managing the fund and the aggregate profitability percentage to Dreyfus and its affiliates for managing the funds in the Dreyfus fund complex, and the method used to determine the expenses and profit. The Board concluded that the profitability results were not unreasonable, given the services rendered and service levels provided by Dreyfus. The Board also had been provided with information prepared by an independent consulting firm regarding Dreyfus’ approach to allocating costs to, and determining the profitability of, individual funds and the entire Dreyfus fund complex. The consulting firm also had analyzed where any economies of scale might emerge in connection with the management of a fund.
The Board considered on the advice of its counsel the profitability analysis (1) as part of its evaluation of whether the fees under the Agreements, considered in relation to the mix of services provided by Dreyfus and the Subadviser, including the nature, extent and quality of such services, supported the renewal of the Agreements and (2) in light of the relevant circumstances for the fund and the extent to which economies of scale would be realized if the fund grows and whether fee levels reflect these economies of scale for the benefit of fund shareholders. Since Dreyfus, and not the fund, pays the Subadviser pursuant to the Sub-Investment Advisory Agreement, the Board did not consider the Subadviser’s profitability to be relevant to its deliberations. Dreyfus representatives also stated that, as a result of shared and allocated costs among funds in the Dreyfus fund complex, the extent of economies of scale could depend substantially on the level of assets in the complex as a whole, so that increases and decreases in complex-wide assets can affect potential economies of scale in a manner that is disproportionate to, or even in the opposite direction from, changes in the fund’s asset level. The Board also considered potential benefits to Dreyfus and the Subadviser from acting as investment adviser and sub-investment adviser, respectively, and took into consideration the soft dollar arrangements in effect for trading the fund’s investments.
At the conclusion of these discussions, the Board agreed that it had been furnished with sufficient information to make an informed business decision with respect to the renewal of the Agreements. Based on the discussions and considerations as described above, the Board concluded and determined as follows.
· The Board concluded that the nature, extent and quality of the services provided by Dreyfus and the Subadviser are adequate and appropriate.
· The Board was satisfied with the fund’s performance.
· The Board concluded that the fees paid to Dreyfus and the Subadviser continued to be appropriate under the circumstances and in light of the factors and the totality of the services provided as discussed above.
· The Board determined that the economies of scale which may accrue to Dreyfus and its affiliates in connection with the management of the fund had been adequately considered by Dreyfus in connection with the fee rate charged to the fund pursuant to the Agreement and that, to the extent in the future it were determined that material economies of scale had not been shared with the
34
fund, the Board would seek to have those economies of scale shared with the fund.
In evaluating the Agreements, the Board considered these conclusions and determinations and also relied on its previous knowledge, gained through meetings and other interactions with Dreyfus and its affiliates and the Subadviser, of Dreyfus and the Subadviser and the services provided to the fund by Dreyfus and the Subadviser. The Board also relied on information received on a routine and regular basis throughout the year relating to the operations of the fund and the investment management and other services provided under the Agreements, including information on the investment performance of the fund in comparison to similar mutual funds and benchmark performance indices; general market outlook as applicable to the fund; and compliance reports. In addition, the Board’s consideration of the contractual fee arrangements for this fund had the benefit of a number of years of reviews of the Agreements for the fund, or substantially similar agreements for other Dreyfus funds that the Board oversees, during which lengthy discussions took place between the Board and Dreyfus representatives. Certain aspects of the arrangements may receive greater scrutiny in some years than in others, and the Board’s conclusions may be based, in part, on their consideration of the fund’s arrangements, or substantially similar arrangements for other Dreyfus funds that the Board oversees, in prior years. The Board determined to renew the Agreements.
35
BOARD MEMBERS INFORMATION(Unaudited)
INDEPENDENT BOARD MEMBERS
Joseph S. DiMartino (75)
Chairman of the Board (1995)
Principal Occupation During Past 5 Years:
· Corporate Director and Trustee (1995-present)
Other Public Company Board Memberships During Past 5 Years:
· CBIZ (formerly, Century Business Services, Inc.), a provider of outsourcing functions for small and medium size companies, Director (1997-present)
No. of Portfolios for which Board Member Serves:123
———————
Joni Evans (76)
Board Member (2006)
Principal Occupation During Past 5 Years:
· Chief Executive Officer, www.wowOwow.com, an online community dedicated to women’s conversations and publications (2007-present)
· Principal, Joni Evans Ltd. (publishing) (2006-present)
No. of Portfolios for which Board Member Serves:21
———————
Joan Gulley (71)
Board Member (2017)
Principal Occupation During Past 5 Years:
· PNC Financial Services Group, Inc.(1993-2014), Executive Vice President and Chief Human Resources Officer and Executive Committee Member (2008-2014)
No. of Portfolios for which Board Member Serves:52
———————
Ehud Houminer (78)
Board Member (1994)
Principal Occupation During Past 5 Years:
· Board of Overseers at the Columbia Business School, Columbia
University (1992-present)
Trustee, Ben Gurion University
No. of Portfolios for which Board Member Serves: 52
———————
36
Alan H. Howard (59)
Board Member (2018)
Principal Occupation During Past 5 Years:
· Managing Partner of Heathcote Advisors LLC, a financial advisory services firm (2008 – present)
· President of Dynatech/MPX Holdings LLC (2012 – present), a global supplier and service provider of military aircraft parts, including Chief Executive Officer of an operating subsidiary, Dynatech International LLC (2013 – present)
· Senior Advisor, Rossoff & Co., an independent investment banking firm (2014 – present)
Other Public Company Board Memberships During Past 5 Years:
· Movado Group, a designer and manufacturer of watches, Director (1997-present)
No. of Portfolios for which Board Member Serves:21
———————
Robin A. Melvin (55)
Board Member (1995)
Principal Occupation During Past 5 Years:
· Co-chairman, Illinois Mentoring Partnership, non-profit organization dedicated to increasing the quantity and quality of mentoring services in Illinois; (2014-present; board member since 2013)
No. of Portfolios for which Board Member Serves:99
———————
Burton N. Wallack (68)
Board Member (2006)
Principal Occupation During Past 5 Years:
· President and Co-owner of Wallack Management Company, a real estate management
company (1987-present)
No. of Portfolios for which Board Member Serves:21
———————
Benaree Pratt Wiley (72)
Board Member (2016)
Principal Occupation During Past 5 Years:
· Principal, The Wiley Group, a firm specializing in strategy and business development (2005-present)
Other Public Company Board Memberships During Past 5 Years:
· CBIZ (formerly, Century Business Services, Inc.), a provider of outsourcing functions for small and medium size companies, Director (2008-present)
No. of Portfolios for which Board Member Serves: 78
———————
37
BOARD MEMBERS INFORMATION (Unaudited) (continued)
INTERESTED BOARD MEMBERs
Gordon J. Davis (77)
Board Member (2006)
Principal Occupation During Past 5 Years:
· Partner in the law firm of Venable LLP (2012-present)
Other Public Company Board Memberships During Past 5 Years:
· Consolidated Edison, Inc., a utility company, Director (1997-2014)
· The Phoenix Companies, Inc., a life insurance company, Director (2000-2014)
No. of Portfolios for which Board Member Serves:55
Gordon J. Davis is deemed to be an “interested person” (as defined under the Act) of the Company as a result of his affiliation with Venable LLP, which provides legal services to the Company.
———————
Once elected all Board Members serve for an indefinite term, but achieve Emeritus status upon reaching age 80. The address of the Board Members and Officers is c/o The Dreyfus Corporation, 200 Park Avenue, New York, New York 10166. Additional information about the Board Members is available in the fund’s Statement of Additional Information which can be obtained from Dreyfus free of charge by calling this toll free number: 1-800-DREYFUS.
William Hodding Carter III, Emeritus Board Member
Hans C. Mautner, Emeritus Board Member
38
OFFICERS OF THE FUND(Unaudited)
BRADLEY J. SKAPYAK, President since January 2010.
Chief Operating Officer and a director of the Manager since June 2009, Chairman of Dreyfus Transfer, Inc., an affiliate of the Manager and the transfer agent of the funds, since May 2011 and Chief Executive Officer of MBSC Securities Corporation since August 2016. He is an officer of 62 investment companies (comprised of 123 portfolios) managed by the Manager. He is 60 years old and has been an employee of the Manager since February 1988.
BENNETT A. MACDOUGALL, Chief Legal Officer since October 2015.
Chief Legal Officer of the Manager and Associate General Counsel and Managing Director of BNY Mellon since June 2015; from June 2005 to June 2015, he served in various capacities with Deutsche Bank – Asset & Wealth Management Division, including as Director and Associate General Counsel, and Chief Legal Officer of Deutsche Investment Management Americas Inc. from June 2012 to May 2015. He is an officer of 63 investment companies (comprised of 148 portfolios) managed by the Manager. He is 47 years old and has been an employee of the Manager since June 2015.
JAMES BITETTO, Vice President since August 2005 and Secretary since February 2018.
Managing Counsel of BNY Mellon and Secretary of the Manager, and an officer of 63 investment companies (comprised of 148 portfolios) managed by the Manager. He is 52 years old and has been an employee of the Manager since December 1996.
SONALEE CROSS, Vice President and Assistant Secretary since March 2018.
Counsel of BNY Mellon since October 2016; Associate at Proskauer Rose LLP from April 2016 to September 2016; Attorney at EnTrust Capital from August 2015 to February 2016; Associate at Sidley Austin LLP from September 2013 until August 2015. She is an officer of 63 investment companies (comprised of 148 portfolios) managed by Dreyfus. She is 31 years old and has been an employee of the Manager since October 2016.
MAUREEN E. KANE, Vice President and Assistant Secretary since April 2015.
Managing Counsel of BNY Mellon since July 2014; from October 2004 until July 2014, General Counsel, and from May 2009 until July 2014, Chief Compliance Officer of Century Capital Management. She is an officer of 63 investment companies (comprised of 148 portfolios) managed by the Manager. She is 56 years old and has been an employee of the Manager since July 2014.
SARAH S. KELLEHER, Vice President and Assistant Secretary since April 2014.
Managing Counsel of BNY Mellon since December 2017, from March 2013 to December 2017, Senior Counsel of BNY Mellon. She is an officer of 63 investment companies (comprised of 148 portfolios) managed by the Manager. She is 43 years old and has been an employee of the Manager since March 2013.
JEFF PRUSNOFSKY, Vice President and Assistant Secretary since August 2005.
Senior Managing Counsel of BNY Mellon, and an officer of 63 investment companies (comprised of 148 portfolios) managed by the Manager. He is 53 years old and has been an employee of the Manager since October 1990.
NATALYA ZELENSKY, Vice President and Assistant Secretary since March 2017.
Counsel of BNY Mellon since May 2016; Attorney at Wildermuth Endowment Strategy Fund/Wildermuth Advisory, LLC from November 2015 until May 2016; Assistant General Counsel at RCS Advisory Services from July 2014 until November 2015; Associate at Sutherland, Asbill & Brennan from January 2013 until January 2014. She is an officer of 63 investment companies (comprised of 148 portfolios) managed by Dreyfus. She is 33 years old and has been an employee of the Manager since May 2016.
JAMES WINDELS, Treasurer since November 2001.
Director – Mutual Fund Accounting of the Manager, and an officer of 63 investment companies (comprised of 148 portfolios) managed by the Manager. He is 60 years old and has been an employee of the Manager since April 1985.
39
OFFICERS OF THE FUND (Unaudited)(continued)
GAVIN C. REILLY, Assistant Treasurer since December 2005.
Tax Manager of the Investment Accounting and Support Department of the Manager, and an officer of 63 investment companies (comprised of 148 portfolios) managed by the Manager. He is 50 years old and has been an employee of the Manager since April 1991.
ROBERT S. ROBOL, Assistant Treasurer since December 2002.
Senior Accounting Manager – Dreyfus Financial Reporting of the Manager, and an officer of 63 investment companies (comprised of 148 portfolios) managed by the Manager. He is 54 years old and has been an employee of the Manager since October 1988.
ROBERT SALVIOLO, Assistant Treasurer since July 2007.
Senior Accounting Manager – Equity Funds of the Manager, and an officer of 63 investment companies (comprised of 148 portfolios) managed by the Manager. He is 51 years old and has been an employee of the Manager since June 1989.
ROBERT SVAGNA, Assistant Treasurer since December 2002.
Senior Accounting Manager – Fixed Income and Equity Funds of the Manager, and an officer of 63 investment companies (comprised of 148 portfolios) managed by the Manager. He is 51 years old and has been an employee of the Manager since November 1990.
JOSEPH W. CONNOLLY, Chief Compliance Officer since October 2004.
Chief Compliance Officer of the Manager, the Dreyfus Family of Funds and BNY Mellon Funds Trust (63 investment companies, comprised of 148 portfolios). He is 61 years old and has served in various capacities with the Manager since 1980, including manager of the firm’s Fund Accounting Department from 1997 through October 2001.
CARIDAD M. CAROSELLA, Anti-Money Laundering Compliance Officer since January 2016.
Anti-Money Laundering Compliance Officer of the Dreyfus Family of Funds and BNY Mellon Funds Trust since January 2016; from May 2015 to December 2015, Interim Anti-Money Laundering Compliance Officer of the Dreyfus Family of Funds and BNY Mellon Funds Trust and the Distributor; from January 2012 to May 2015, AML Surveillance Officer of the Distributor and from 2007 to December 2011, Financial Processing Manager of the Distributor. She is an officer of 57 investment companies (comprised of 142 portfolios) managed by the Manager. She is 50 years old and has been an employee of the Distributor since 1997.
40
NOTES
41
Global Stock Fund
200 Park Avenue
New York, NY 10166
Manager
The Dreyfus Corporation
200 Park Avenue
New York, NY 10166
Sub-Investment Adviser
Walter Scott & Partners Limited
(Walter Scott)
One Charlotte Square
Edinburgh, Scotland, UK
Custodian
The Bank of New York Mellon
240 Greenwich Street
New York, NY 10286
Transfer Agent &
Dividend Disbursing Agent
Dreyfus Transfer, Inc.
200 Park Avenue
New York, NY 10166
Distributor
MBSC Securities Corporation
200 Park Avenue
New York, NY 10166
| | |
Ticker Symbols: Class A: DGLAX Class C: DGLCX Class I: DGLRX Class Y: DGLYX |
Telephone Call your financial representative or 1-800-DREYFUS
Mail The Dreyfus Family of Funds, 144 Glenn Curtiss Boulevard, Uniondale, NY 11556-0144
E-mailSend your request toinfo@dreyfus.com
InternetInformation can be viewed online or downloaded atwww.dreyfus.com
The fund files its complete schedule of portfolio holdings with the Securities and Exchange Commission (“SEC”) for the first and third quarters of each fiscal year on Form N-Q. The fund’s Forms N-Q are available on the SEC’s website atwww.sec.gov.
A description of the policies and procedures that the fund uses to determine how to vote proxies relating to portfolio securities and information regarding how the fund voted these proxies for the most recent 12-month period ended June 30 is available atwww.dreyfus.com and on the SEC’s website atwww.sec.gov and without charge, upon request, by calling 1-800-DREYFUS.
| | |
© 2019 MBSC Securities Corporation
6159AR1118 | 
|
International Stock Fund
| | | |

| | ANNUAL REPORT November 30, 2018 |
| |
Save time. Save paper. View your next shareholder report online as soon as it’s available. Log into www.dreyfus.com and sign up for Dreyfus eCommunications. It’s simple and only takes a few minutes. |
| |
The views expressed in this report reflect those of the portfolio manager(s) only through the end of the period covered and do not necessarily represent the views of Dreyfus or any other person in the Dreyfus organization. Any such views are subject to change at any time based upon market or other conditions and Dreyfus disclaims any responsibility to update such views. These views may not be relied on as investment advice and, because investment decisions for a Dreyfus fund are based on numerous factors, may not be relied on as an indication of trading intent on behalf of any Dreyfus fund. |
| |
Not FDIC-Insured • Not Bank-Guaranteed • May Lose Value |
Contents
T H E F U N D
F O R M O R E I N F O R M AT I O N
Back Cover
| | | | |
| |
International Stock Fund
| | The Fund |
A LETTER FROM THE PRESIDENT OF DREYFUS
Dear Shareholder:
We are pleased to present this annual report for International Stock Fund, covering the 12-month period from December 1, 2017 through November 30, 2018. For information about how the fund performed during the reporting period, as well as general market perspectives, we provide a Discussion of Fund Performance on the pages that follow.
The reporting period began with major global economies achieving above-trend growth. In the United States, a robust economy and strong labor markets encouraged the Federal Reserve to continue moving away from its accommodative monetary policy while other major central banks also began to consider monetary tightening. In the equity sphere, both U.S. and non-U.S. markets remained on an uptrend, though investor concerns about U.S. inflation and its effect on interest rates later began to weigh on global returns. Interest rates rose across the yield curve, putting pressure on bond prices.
Later in the reporting period, global growth trends began to diverge and market volatility returned. While the U.S. economy continued to grow at a healthy rate, Japan rebounded, but only briefly, from a weak first quarter, and the Eurozone economy began to moderate. Robust growth and strong corporate earnings continued to support U.S. stocks while other developed markets declined. Late in the reporting period, a broad sell-off occurred, partially offsetting earlier U.S. gains. Emerging markets remained under pressure as weakness in their currencies relative to the U.S. dollar added to investors’ uneasiness.
Fixed income markets continued to struggle as interest rates rose; the yield on the benchmark
10-year Treasury bond breached 3.2% despite only moderate inflation, but investor concerns about slowing global growth brought yields down toward the end of the reporting period.
Despite continuing doubts regarding trade, U.S. inflationary pressures and global growth, we are optimistic that the U.S. economy will remain strong in the near term. However, we remain attentive to signs that indicate potential changes on the horizon. As always, we encourage you to discuss the risks and opportunities in today’s investment environment with your financial advisor.
Thank you for your continued confidence and support.
Sincerely,

Renee Laroche-Morris
President
The Dreyfus Corporation
December 17, 2018
2
DISCUSSION OF FUND PERFORMANCE(Unaudited)
For the period from December 1, 2017 through November 30, 2018, as provided by Charlie Macquaker, Roy Leckie, and Jane Henderson, the three members of the Investment Executive at Walter Scott & Partners Limited (WS), Sub-Investment Adviser
Market and Fund Performance Overview
For the 12-month period ended November 30, 2018, International Stock Fund’s Class A shares achieved a total return of -2.84%, Class C shares returned -3.58%, Class I shares returned -2.53%, and Class Y shares returned -2.48%.1 In comparison, the fund’s benchmark index, the MSCI EAFE Index (the “Index”), achieved a return of -7.94% for the same period.2
International equities produced negative returns during the reporting period. The fund outperformed the Index, largely due to effective stock selection within the consumer and information technology sectors, as well as within the Europe ex-UK and United Kingdom.
The Fund’s Investment Approach
The fund seeks long-term total return. To pursue its goal, the fund normally invests at least 80% of its net assets, plus any borrowings for investment purposes, in stocks. The fund normally invests primarily in foreign companies located in developed markets. The fund ordinarily invests in at least three countries and is not geographically limited in its investment selection but, at times, may invest a substantial portion of its assets in a single country. The fund may invest in the securities of companies of any market capitalization. Walter Scott seeks investment opportunities in companies with fundamental strengths that indicate the potential for sustainable growth. Walter Scott focuses on individual stock selection, building the fund’s portfolio from the bottom up through extensive fundamental research. The investment process begins with the screening of reported company financials. Companies that meet certain broad absolute and trend criteria are candidates for more detailed financial analysis. The fund’s Investment Team collectively reviews and selects those stocks that meet Walter Scott’s criteria and where the expected growth rate is combined with a reasonable valuation for the underlying equity. Geographic and sector allocations are results of, not part of, the investment process, because the Investment Team’s sole focus is on the analysis of and investment in individual companies.
Volatility and Geopolitical Concerns Pressure Non-U.S. Markets
International equity markets gained ground over the first quarter of the reporting period, enabling the Index to reach new record highs in January 2018. The market rally was broadly supported by improving economic conditions and rising corporate earnings. Asian equity markets led the advance at the time, as Japanese equities responded positively to upward revisions of domestic growth forecasts and better-than-expected corporate earnings. Global growth trends enabled U.K. equities to climb, despite a relatively lackluster local economy and concerns regarding the country’s exit (Brexit) from the European Union. Eurozone markets trailed global market averages, despite improving regional economic fundamentals. While they are not represented in the Index, U.S. stocks also posted gains when tax-reform legislation reduced corporate tax rates.
February 2018 and March 2018 saw heightened market volatility and declining stock prices sparked by rising interest rates, perceived U.S. inflationary pressures, and uncertainties surrounding the possibility of more protectionist U.S. trade policies. Increasing commodity prices, a strengthening dollar and weak exports pressured emerging-market equity prices. Downward revisions to international growth expectations also weighed on performance. Financial issues in Turkey and Argentina, the installation of a nationalist party into Italian leadership, and Brexit uncertainty all converged towards the end of the period to tamp down international market returns. Later in the period, a weakening dollar and the prospect of slowing U.S. interest-rate hikes helped to ease pressure on non-U.S. markets.
3
DISCUSSION OF FUND PERFORMANCE(Unaudited) (continued)
Stock Selection Buoyed Fund Results
The fund’s positive results compared to the Index stemmed from the success of our security selection. Stock picks within the consumer staples, consumer discretionary, and information technology sectors benefited results, as did selections among companies located in the U.K. as well as the Europe ex-U.K. and Pacific ex-Japan regions. Underweight exposure to financials and an overweight to the health care sector also helped relative results. Chinese energy producer CNOOC was among the top overall contributors to portfolio performance. The stock price rose as the company benefited from high oil prices earlier in the period and increased production efficiencies. Australian life sciences company CSL was also a top performer. The company raised guidance during the reporting period amid rising sales volumes. In addition, top contributor Coloplast, a Danish health care company, reported higher sales volumes across its various business segments and regional markets.
Conversely, selections within the real estate and industrials sectors, as well as among companies based in Japan, were not beneficial. The top individual detractors included FANUC, Daito Trust Construction, and SMC. FANUC and SMC saw their stock prices fall on the back of concerns that we are entering a period of low demand for automation products. Real estate developer Daito Trust Construction saw its stock price hurt by lackluster results and concerns over changing market demographics.
Maintaining a Company-by-Company Approach
Although we do not manage the fund’s investments in response to macroeconomic trends, it is worth noting that we believe the global economic picture remains strong, supported by fiscal policies that have helped boost corporate earnings, particularly in the U.S. However, at this stage in the market cycle, confidence can be quickly undermined by unexpected political and economic developments as geopolitical tensions potentially escalate and central banks move gradually away from the aggressively accommodative policies of the past decade. We continue to keep a sharp eye on valuations in all markets.
In that context, our focus remains very much unchanged. We must continue to identify and invest in market-leading, financially robust companies with the strategic strengths and vision to generate meaningful returns over the long term. Our distinctly long-term lens allows us to focus on the underlying strengths and opportunities of a business. Not only does that approach mean we waste very little time trying to second-guess short-term market moves, but it ensures we are invested in companies that have the attributes we believe are needed to succeed regardless of the external environment in which they operate. We will continue to look for opportunities to benefit investors, capturing gains when the market rallies, and adding to fundamentally strong companies when the market pulls back.
December 17, 2018
1 Total return includes reinvestment of dividends and any capital gains paid, and does not take into consideration the maximum initial sales charge in the case of Class A shares, or the applicable contingent deferred sales charge imposed on redemptions in the case of Class C shares. Had these charges been reflected, returns would have been lower. Past performance is no guarantee of future results. Share price and investment return fluctuate such that upon redemption, fund shares may be worth more or less than their original cost.
2 Source: Lipper Inc. — The MSCI EAFE Index (Europe, Australasia, Far East) is a free float-adjusted market capitalization-weighted index that is designed to measure the equity market performance of developed markets, excluding the U.S. and Canada. It reflects reinvestment of net dividends and, where applicable, capital gain distributions. Investors cannot invest directly in any index.
Equities are subject generally to market, market sector, market liquidity, issuer, and investment style risks, among other factors, to varying degrees, all of which are more fully described in the fund’s prospectus.
Investing internationally involves special risks, including changes in currency exchange rates, political, economic, and social instability, a lack of comprehensive company information, differing auditing and legal standards, and less market liquidity.
4
FUND PERFORMANCE(Unaudited)
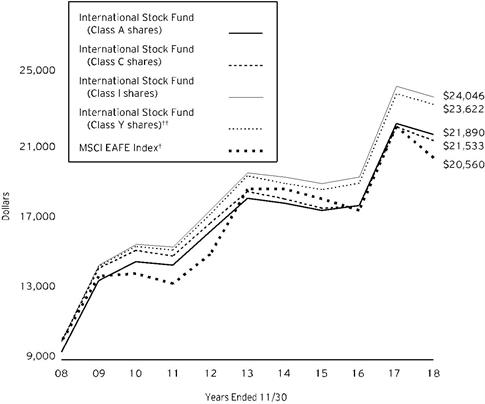
Comparison of change in value of $10,000 investment in International Stock Fund Class A shares, Class C shares, Class I shares and Class Y shares and the MSCI EAFE Index (the “Index”)
† Source: Lipper Inc.
†† The total return figures presented for Class Y shares of the fund reflect the performance of the fund’s Class A shares for the period prior to 7/1/13 (the inception date for Class Y shares), not reflecting the applicable sales charges for Class A shares.
Past performance is not predictive of future performance.
The above graph compares a $10,000 investment made in each of the Class A, Class C, Class I and Class Y shares of International Stock Fund on 11/30/08 to a $10,000 investment made in the Index on that date. All dividends and capital gain distributions are reinvested.
The fund’s performance shown in the line graph above takes into account the maximum initial sales charge on Class A shares and all other applicable fees and expenses on all classes. The Index (Europe, Australasia, Far East) is a free float-adjusted market
capitalization-weighted index that is designed to measure the equity market performance of developed markets, excluding the U.S. and Canada. Unlike a mutual fund, the Index is not subject to charges, fees and other expenses. Investors cannot invest directly in any index. Further information relating to fund performance, including expense reimbursements, if applicable, is contained in the Financial Highlights section of the prospectus and elsewhere in this report.
5
FUND PERFORMANCE(Unaudited) (continued)
| | | | | |
Average Annual Total Returns as of 11/30/18 |
| | Inception | | | |
| Date | 1 Year | 5 Years | 10 Years |
Class A shares | | | | |
with maximum sales charge (5.75%) | 12/29/06 | -8.43% | 2.50% | 8.15% |
without sales charge | 12/29/06 | -2.84% | 3.72% | 8.79% |
Class C shares | | | | |
with applicable redemption charge† | 12/29/06 | -4.54% | 2.94% | 7.97% |
without redemption | 12/29/06 | -3.58% | 2.94% | 7.97% |
Class I shares | 12/29/06 | -2.53% | 4.07% | 9.17% |
Class Y shares | 7/1/13 | -2.48% | 3.89% | 8.98%†† |
MSCI EAFE Index | | -7.94% | 1.84% | 7.47% |
† The maximum contingent deferred sales charge for Class C shares is 1% for shares redeemed within one year of the date of purchase.
†† The total return performance figures presented for Class Y shares of the fund reflect the performance of the fund’s Class A shares for the period prior to 7/1/13 (the inception date for Class Y shares), not reflecting the applicable sales charges for Class A shares.
The performance data quoted represents past performance, which is no guarantee of future results. Share price and investment return fluctuate and an investor’s shares may be worth more or less than original cost upon redemption. Current performance may be lower or higher than the performance quoted. Go to Dreyfus.com for the fund’s most recent month-end returns.
The fund’s performance shown in the graph and table does not reflect the deduction of taxes that a shareholder would pay on fund distributions or the redemption of fund shares. In addition to the performance of Class A shares shown with and without a maximum sales charge, the fund’s performance shown in the table takes into account all other applicable fees and expenses on all classes.
6
UNDERSTANDING YOUR FUND’S EXPENSES(Unaudited)
As a mutual fund investor, you pay ongoing expenses, such as management fees and other expenses. Using the information below, you can estimate how these expenses affect your investment and compare them with the expenses of other funds. You also may pay one-time transaction expenses, including sales charges (loads) and redemption fees, which are not shown in this section and would have resulted in higher total expenses. For more information, see your fund’s prospectus or talk to your financial adviser.
Review your fund’s expenses
The table below shows the expenses you would have paid on a $1,000 investment in International Stock Fund from June 1, 2018 to November 30, 2018. It also shows how much a $1,000 investment would be worth at the close of the period, assuming actual returns and expenses.
| | | | | | | | | | | |
Expenses and Value of a $1,000 Investment | | |
assuming actual returns for the six months ended November 30, 2018 |
| | | | | | | | | |
| | | Class A | | Class C | | Class I | | Class Y |
Expenses paid per $1,000† | | $5.99 | | $9.61 | | $4.47 | | $4.38 |
Ending value (after expenses) | | $959.70 | | $955.80 | | $961.00 | | $961.10 |
COMPARING YOUR FUND’S EXPENSES
WITH THOSE OF OTHER FUNDS(Unaudited)
Using the SEC’s method to compare expenses
The Securities and Exchange Commission (“SEC”) has established guidelines to help investors assess fund expenses. Per these guidelines, the table below shows your fund’s expenses based on a $1,000 investment, assuming a hypothetical 5% annualized return. You can use this information to compare the ongoing expenses (but not transaction expenses or total cost) of investing in the fund with those of other funds. All mutual fund shareholder reports will provide this information to help you make this comparison. Please note that you cannot use this information to estimate your actual ending account balance and expenses paid during the period.
| | | | | | | | | |
Expenses and Value of a $1,000 Investment |
assuming a hypothetical 5% annualized return for the six months ended November 30, 2018 |
| | | | | | | | | |
| | | Class A | | Class C | | Class I | | Class Y |
Expenses paid per $1,000† | | $6.17 | | $9.90 | | $4.61 | | $4.51 |
Ending value (after expenses) | | $1,018.95 | | $1,015.24 | | $1,020.51 | | $1,020.61 |
† Expenses are equal to the fund’s annualized expense ratio of 1.22% for Class A, 1.96% for Class C, .91% for Class I and .89% for Class Y, multiplied by the average account value over the period, multiplied by 183/365 (to reflect the one-half year period).
7
STATEMENT OF INVESTMENTS
November 30, 2018
| | | | | | | | |
| |
Description | | | | Shares | | Value ($) | |
Common Stocks - 98.5% | | | | | |
Australia - 3.2% | | | | | |
Cochlear | | | | 431,100 | | 53,683,543 | |
CSL | | | | 533,400 | | 69,458,993 | |
| | | | | 123,142,536 | |
Canada - 2.3% | | | | | |
Alimentation Couche Tard, Cl. B | | | | 1,629,700 | | 85,529,659 | |
China - 2.4% | | | | | |
CNOOC | | | | 54,274,000 | | 91,551,968 | |
Denmark - 6.5% | | | | | |
Coloplast, Cl. B | | | | 815,800 | | 77,807,123 | |
Novo Nordisk, Cl. B | | | | 1,920,600 | | 89,519,103 | |
Novozymes, Cl. B | | | | 1,719,212 | | 80,083,066 | |
| | | | | 247,409,292 | |
Finland - 2.3% | | | | | |
Kone, Cl. B | | | | 1,783,900 | | 88,401,276 | |
France - 11.5% | | | | | |
Air Liquide | | | | 809,200 | | 97,843,441 | |
Dassault Systemes | | | | 315,677 | | 38,040,408 | |
Essilorluxottica | | | | 578,500 | | 73,481,946 | |
L'Oreal | | | | 321,700 | | 76,046,288 | |
LVMH Moet Hennessy Louis Vuitton | | | | 244,781 | | 70,443,497 | |
Total | | | | 1,473,995 | | 82,054,503 | |
| | | | | 437,910,083 | |
Germany - 5.2% | | | | | |
adidas | | | | 471,500 | | 103,994,969 | |
SAP | | | | 902,200 | | 92,799,293 | |
| | | | | 196,794,262 | |
Hong Kong - 8.0% | | | | | |
AIA Group | | | | 13,613,400 | | 111,659,875 | |
CLP Holdings | | | | 6,249,000 | | 68,883,631 | |
Hang Lung Properties | | | | 25,615,000 | | 51,855,374 | |
Hong Kong & China Gas | | | | 36,135,321 | | 72,876,278 | |
| | | | | 305,275,158 | |
Japan - 24.0% | | | | | |
Daikin Industries | | | | 445,300 | | 49,515,952 | |
Daito Trust Construction | | | | 636,500 | | 83,195,268 | |
Denso | | | | 1,474,600 | | 68,160,386 | |
FANUC | | | | 409,400 | | 70,566,405 | |
Kao | | | | 1,221,000 | | 89,966,321 | |
Keyence | | | | 213,640 | | 115,933,788 | |
Makita | | | | 950,900 | | 37,318,940 | |
MISUMI Group | | | | 1,457,700 | | 33,288,701 | |
8
| | | | | | | | |
| |
Description | | | | Shares | | Value ($) | |
Common Stocks - 98.5% (continued) | | | | | |
Japan - 24.0% (continued) | | | | | |
Murata Manufacturing | | | | 497,600 | | 76,623,951 | |
Shimano | | | | 479,200 | | 70,183,306 | |
Shin-Etsu Chemical | | | | 850,400 | | 75,926,565 | |
SMC | | | | 314,100 | | 106,475,514 | |
Sysmex | | | | 620,900 | | 33,136,020 | |
| | | | | 910,291,117 | |
Netherlands - 1.3% | | | | | |
ASML Holding | | | | 285,400 | | 48,527,962 | |
Spain - 2.5% | | | | | |
Inditex | | | | 3,054,100 | | 93,706,431 | |
Switzerland - 12.6% | | | | | |
Givaudan | | | | 35,300 | | 86,964,209 | |
Kuehne + Nagel International | | | | 489,100 | | 68,908,600 | |
Nestle | | | | 879,000 | | 75,057,769 | |
Novartis | | | | 996,500 | | 90,967,081 | |
Roche Holding | | | | 353,450 | | 91,712,819 | |
SGS | | | | 26,500 | | 62,935,788 | |
| | | | | 476,546,266 | |
Taiwan - 2.4% | | | | | |
Taiwan Semiconductor Manufacturing, ADR | | | | 2,400,400 | | 90,231,035 | |
United Kingdom - 14.3% | | | | | |
Compass Group | | | | 4,908,446 | | 105,032,485 | |
Diageo | | | | 2,301,600 | | 82,920,948 | |
Experian | | | | 3,928,700 | | 95,811,343 | |
Intertek Group | | | | 568,500 | | 34,114,635 | |
Reckitt Benckiser Group | | | | 895,900 | | 74,537,067 | |
Smith & Nephew | | | | 4,500,000 | | 81,849,292 | |
Whitbread | | | | 1,153,800 | | 67,647,872 | |
| | | | | 541,913,642 | |
Total Common Stocks(cost $2,805,225,008) | | | | 3,737,230,687 | |
9
STATEMENT OF INVESTMENTS (continued)
| | | | | | | | |
| |
Description | | 1-Day
Yield (%) | | Shares | | Value ($) | |
Investment Companies - 1.1% | | | | | |
Registered Investment Companies - 1.1% | | | | | |
Dreyfus Institutional Preferred Government Plus Money Market Fund
(cost $41,179,649) | | 2.23 | | 41,179,649 | a | 41,179,649 | |
Total Investments(cost $2,846,404,657) | | 99.6% | | 3,778,410,336 | |
Cash and Receivables (Net) | | .4% | | 14,265,901 | |
Net Assets | | 100.0% | | 3,792,676,237 | |
ADR—American Depository Receipt
a Investment in affiliated issuer. The investment objective of this investment company is publicly available and can be found within the investment company’s prospectus.
| | |
Portfolio Summary (Unaudited)† | Value (%) |
Capital Goods | 10.2 |
Pharmaceuticals Biotechnology & Life Sciences | 9.0 |
Materials | 9.0 |
Health Care Equipment & Services | 8.4 |
Consumer Durables & Apparel | 6.4 |
Household & Personal Products | 6.3 |
Commercial & Professional Services | 5.1 |
Technology Hardware & Equipment | 5.1 |
Energy | 4.6 |
Consumer Services | 4.5 |
Food, Beverage & Tobacco | 4.2 |
Utilities | 3.7 |
Semiconductors & Semiconductor Equipment | 3.7 |
Real Estate | 3.6 |
Software & Services | 3.4 |
Insurance | 2.9 |
Retailing | 2.5 |
Food & Staples Retailing | 2.3 |
Transportation | 1.8 |
Automobiles & Components | 1.8 |
Investment Companies | 1.1 |
| | 99.6 |
† Based on net assets.
See notes to financial statements.
10
STATEMENT OF INVESTMENTS IN AFFILIATED ISSUERS
| | | | | | | |
Registered Investment Company | Value
11/30/17 ($) | Purchases ($) | Sales ($) | Value
11/30/18 ($) | Net
Assets (%) | Dividends/
Distributions ($) |
Dreyfus Institutional Preferred Government Plus Money Market Fund | 90,621,850 | 506,574,693 | 556,016,894 | 41,179,649 | 1.1 | 1,531,549 |
See notes to financial statements.
11
STATEMENT OF ASSETS AND LIABILITIES
November 30, 2018
| | | | | | | |
| | | | | | |
| | | Cost | | Value | |
Assets ($): | | | | |
Investments in securities—See Statement of Investments: | | | |
Unaffiliated issuers | 2,805,225,008 | | 3,737,230,687 | |
Affiliated issuers | | 41,179,649 | | 41,179,649 | |
Cash denominated in foreign currency | | | 419,020 | | 419,019 | |
Tax reclaim receivable | | 10,967,168 | |
Receivable for shares of Common Stock subscribed | | 3,933,359 | |
Dividends receivable | | 3,443,413 | |
Prepaid expenses | | | | | 69,734 | |
| | | | | 3,797,243,029 | |
Liabilities ($): | | | | |
Due to The Dreyfus Corporation and affiliates—Note 3(c) | | | | 2,878,992 | |
Payable for shares of Common Stock redeemed | | 1,122,557 | |
Unrealized depreciation on foreign currency transactions | | 291,651 | |
Directors fees and expenses payable | | 63,837 | |
Accrued expenses | | | | | 209,755 | |
| | | | | 4,566,792 | |
Net Assets ($) | | | 3,792,676,237 | |
Composition of Net Assets ($): | | | | |
Paid-in capital | | | | | 2,800,355,909 | |
Total distributable earnings (loss) | | | | | 992,320,328 | |
Net Assets ($) | | | 3,792,676,237 | |
| | | | | | |
Net Asset Value Per Share | Class A | Class C | Class I | Class Y | |
Net Assets ($) | 25,981,077 | 12,049,874 | 1,953,256,197 | 1,801,389,089 | |
Shares Outstanding | 1,454,440 | 687,517 | 108,606,254 | 101,293,925 | |
Net Asset Value Per Share ($) | 17.86 | 17.53 | 17.98 | 17.78 | |
| | | | | | |
See notes to financial statements. | | | | | |
12
STATEMENT OF OPERATIONS
Year Ended November 30, 2018
| | | | | | | |
| | | | | | |
| | | | | | |
Investment Income ($): | | | | |
Income: | | | | |
Cash dividends (net of $10,147,643 foreign taxes withheld at source): | |
Unaffiliated issuers | | | 81,682,160 | |
Affiliated issuers | | | 1,531,549 | |
Total Income | | | 83,213,709 | |
Expenses: | | | | |
Management fee—Note 3(a) | | | 34,782,087 | |
Shareholder servicing costs—Note 3(c) | | | 718,951 | |
Custodian fees—Note 3(c) | | | 435,333 | |
Directors’ fees and expenses—Note 3(d) | | | 415,411 | |
Professional fees | | | 119,288 | |
Distribution fees—Note 3(b) | | | 101,243 | |
Loan commitment fees—Note 2 | | | 92,074 | |
Registration fees | | | 82,140 | |
Prospectus and shareholders’ reports | | | 78,007 | |
Interest expense—Note 2 | | | 1,578 | |
Miscellaneous | | | 145,942 | |
Total Expenses | | | 36,972,054 | |
Less—reduction in fees due to earnings credits—Note 3(c) | | | (37) | |
Net Expenses | | | 36,972,017 | |
Investment Income—Net | | | 46,241,692 | |
Realized and Unrealized Gain (Loss) on Investments—Note 4 ($): | | |
Net realized gain (loss) on investments and foreign currency transactions | 25,541,691 | |
Net realized gain (loss) on forward foreign currency exchange contracts | (317,193) | |
Net Realized Gain (Loss) | | | 25,224,498 | |
Net unrealized appreciation (depreciation) on investments
and foreign currency transactions | | | (166,813,460) | |
Net unrealized appreciation (depreciation) on
forward foreign currency exchange contracts | | | 57 | |
Net Unrealized Appreciation (Depreciation) | | | (166,813,403) | |
Net Realized and Unrealized Gain (Loss) on Investments | | | (141,588,905) | |
Net (Decrease) in Net Assets Resulting from Operations | | (95,347,213) | |
| | | | | | | |
See notes to financial statements. | | | | | |
13
STATEMENT OF CHANGES IN NET ASSETS
| | | | | | | | | | |
| | | | Year Ended November 30, |
| | | | 2018 | | 2017a | |
Operations ($): | | | | | | | | |
Investment income—net | | | 46,241,692 | | | | 44,099,386 | |
Net realized gain (loss) on investments | | 25,224,498 | | | | 81,617,955 | |
Net unrealized appreciation (depreciation)
on investments | | (166,813,403) | | | | 732,031,088 | |
Net Increase (Decrease) in Net Assets
Resulting from Operations | (95,347,213) | | | | 857,748,429 | |
Distributions ($): | |
Distributions to shareholders: | | | | | | | | |
Class A | | | (208,298) | | | | (490,638) | |
Class I | | | (20,940,163) | | | | (18,172,219) | |
Class Y | | | (22,653,914) | | | | (20,844,125) | |
Total Distributions | | | (43,802,375) | | | | (39,506,982) | |
Capital Stock Transactions ($): | |
Net proceeds from shares sold: | | | | | | | | |
Class A | | | 7,134,048 | | | | 9,237,207 | |
Class C | | | 1,318,463 | | | | 2,309,283 | |
Class I | | | 301,599,131 | | | | 260,549,013 | |
Class Y | | | 269,698,313 | | | | 383,037,695 | |
Distributions reinvested: | | | | | | | | |
Class A | | | 179,438 | | | | 458,846 | |
Class I | | | 19,468,039 | | | | 16,849,413 | |
Class Y | | | 11,153,697 | | | | 11,630,754 | |
Cost of shares redeemed: | | | | | | | | |
Class A | | | (9,798,689) | | | | (46,838,849) | |
Class C | | | (3,687,914) | | | | (4,035,152) | |
Class I | | | (263,591,167) | | | | (222,641,336) | |
Class Y | | | (497,847,755) | | | | (353,027,631) | |
Increase (Decrease) in Net Assets
from Capital Stock Transactions | (164,374,396) | | | | 57,529,243 | |
Total Increase (Decrease) in Net Assets | (303,523,984) | | | | 875,770,690 | |
Net Assets ($): | |
Beginning of Period | | | 4,096,200,221 | | | | 3,220,429,531 | |
End of Period | | | 3,792,676,237 | | | | 4,096,200,221 | |
14
| | | | | | | | | | |
| | | | Year Ended November 30, |
| | | | 2018 | | 2017a | |
Capital Share Transactions (Shares): | |
Class Ab | | | | | | | | |
Shares sold | | | 388,128 | | | | 548,527 | |
Shares issued for distributions reinvested | | | 9,637 | | | | 30,961 | |
Shares redeemed | | | (532,501) | | | | (2,985,380) | |
Net Increase (Decrease) in Shares Outstanding | (134,736) | | | | (2,405,892) | |
Class Cb | | | | | | | | |
Shares sold | | | 73,264 | | | | 139,978 | |
Shares redeemed | | | (203,182) | | | | (251,886) | |
Net Increase (Decrease) in Shares Outstanding | (129,918) | | | | (111,908) | |
Class Ib | | | | | | | | |
Shares sold | | | 16,104,300 | | | | 15,760,725 | |
Shares issued for distributions reinvested | | | 1,041,629 | | | | 1,133,114 | |
Shares redeemed | | | (14,133,188) | | | | (13,441,816) | |
Net Increase (Decrease) in Shares Outstanding | 3,012,741 | | | | 3,452,023 | |
Class Yb | | | | | | | | |
Shares sold | | | 14,555,828 | | | | 23,686,135 | |
Shares issued for distributions reinvested | | | 603,555 | | | | 790,670 | |
Shares redeemed | | | (26,890,318) | | | | (22,002,667) | |
Net Increase (Decrease) in Shares Outstanding | (11,730,935) | | | | 2,474,138 | |
| | | | | | | | | | |
aDistributions to shareholders include only distributions from net investment income. Undistributed investment income—net was $42,761,939 in 2017 and is no longer presented as a result of the adoption of SEC’s Disclosure Update and Simplification Rule. | |
bDuring the period ended November 30, 2018, 852,262 Class Y shares representing $15,686,946 were exchanged for 842,649 Class I shares, 2,012 Class C shares and 3,933 Class Y shares representing $108,868 were exchanged for 5,888 Class A shares and during the period ended November 30, 2017, 54,975 Class A shares representing $928,287 were exchanged for 54,686 Class I shares, 3,061,109 Class I shares representing $46,356,004 were exchanged for 3,093,641 Class Y shares. | |
See notes to financial statements. | | | | | | | | |
15
FINANCIAL HIGHLIGHTS
The following tables describe the performance for each share class for the fiscal periods indicated. All information (except portfolio turnover rate) reflects financial results for a single fund share. Total return shows how much your investment in the fund would have increased (or decreased) during each period, assuming you had reinvested all dividends and distributions. These figures have been derived from the fund’s financial statements.
| | | | | | | |
| | | |
| | | |
| | | Year Ended November 30, |
Class A Shares | | 2018 | 2017 | 2016 | 2015 | 2014 |
Per Share Data ($): | | | | | | |
Net asset value,
beginning of period | | 18.51 | 14.77 | 14.66 | 15.15 | 15.57 |
Investment Operations: | | | | | | |
Investment income—neta | | .15 | .10 | .13 | .16 | .19 |
Net realized and unrealized
gain (loss) on investments | | (.67) | 3.77 | .10 | (.50) | (.43) |
Total from
Investment Operations | | (.52) | 3.87 | .23 | (.34) | (.24) |
Distributions: | | | | | | |
Dividends from
investment income—net | | (.13) | (.13) | (.12) | (.15) | (.18) |
Net asset value, end of period | | 17.86 | 18.51 | 14.77 | 14.66 | 15.15 |
Total Return (%)b | | (2.84) | 26.39 | 1.62 | (2.27) | (1.57) |
Ratios/Supplemental Data (%): | | | | | | |
Ratio of total expenses
to average net assets | | 1.22 | 1.26 | 1.27 | 1.26 | 1.29 |
Ratio of net expenses
to average net assets | | 1.22 | 1.26 | 1.27 | 1.26 | 1.29 |
Ratio of net investment income
to average net assets | | .81 | .64 | .89 | 1.08 | 1.26 |
Portfolio Turnover Rate | | 7.47 | 12.49 | 10.65 | 16.52 | 12.49 |
Net Assets,
end of period ($ x 1,000) | | 25,981 | 29,414 | 59,019 | 85,618 | 142,259 |
a Based on average shares outstanding.
b Exclusive of sales charge.
See notes to financial statements.
16
| | | | | | | |
| | | |
| | | |
| | | Year Ended November 30, |
Class C Shares | | 2018 | 2017 | 2016 | 2015 | 2014 |
Per Share Data ($): | | | | | | |
Net asset value,
beginning of period | | 18.17 | 14.49 | 14.37 | 14.84 | 15.26 |
Investment Operations: | | | | | | |
Investment income—neta | | .01 | .02 | .02 | .04 | .07 |
Net realized and unrealized
gain (loss) on investments | | (.65) | 3.66 | .10 | (.48) | (.42) |
Total from
Investment Operations | | (.64) | 3.68 | .12 | (.44) | (.35) |
Distributions: | | | | | | |
Dividends from
investment income—net | | - | - | - | (.03) | (.07) |
Net asset value, end of period | | 17.53 | 18.17 | 14.49 | 14.37 | 14.84 |
Total Return (%)b | | (3.58) | 25.40 | .83 | (2.97) | (2.28) |
Ratios/Supplemental Data (%): | | | | | | |
Ratio of total expenses
to average net assets | | 1.96 | 2.02 | 2.04 | 2.03 | 2.03 |
Ratio of net expenses
to average net assets | | 1.96 | 2.02 | 2.04 | 2.03 | 2.03 |
Ratio of net investment income
to average net assets | | .07 | .10 | .12 | .30 | .50 |
Portfolio Turnover Rate | | 7.47 | 12.49 | 10.65 | 16.52 | 12.49 |
Net Assets,
end of period ($ x 1,000) | | 12,050 | 14,852 | 13,465 | 16,952 | 24,805 |
a Based on average shares outstanding.
b Exclusive of sales charge.
See notes to financial statements.
17
FINANCIAL HIGHLIGHTS (continued)
| | | | | | | |
| | |
| | |
| | Year Ended November 30, |
Class I Shares | | 2018 | 2017 | 2016 | 2015 | 2014 |
Per Share Data ($): | | | | | | |
Net asset value,
beginning of period | | 18.64 | 14.88 | 14.79 | 15.31 | 15.73 |
Investment Operations: | | | | | | |
Investment income—neta | | .21 | .20 | .18 | .20 | .26 |
Net realized and unrealized
gain (loss) on investments | | (.67) | 3.74 | .10 | (.49) | (.45) |
Total from
Investment Operations | | (.46) | 3.94 | .28 | (.29) | (.19) |
Distributions: | | | | | | |
Dividends from
investment income—net | | (.20) | (.18) | (.19) | (.23) | (.23) |
Net asset value, end of period | | 17.98 | 18.64 | 14.88 | 14.79 | 15.31 |
Total Return (%) | | (2.53) | 26.81 | 1.92 | (1.90) | (1.24) |
Ratios/Supplemental Data (%): | | | | | |
Ratio of total expenses
to average net assets | | .91 | .93 | .94 | .94 | .93 |
Ratio of net expenses
to average net assets | | .91 | .93 | .94 | .94 | .93 |
Ratio of net investment income | | | | | |
to average net assets | | 1.11 | 1.20 | 1.21 | 1.33 | 1.70 |
Portfolio Turnover Rate | | 7.47 | 12.49 | 10.65 | 16.52 | 12.49 |
Net Assets,
end of period ($ x 1,000) | | 1,953,256 | 1,968,366 | 1,520,360 | 1,560,084 | 2,132,444 |
a Based on average shares outstanding.
See notes to financial statements.
18
| | | | | | | |
| | | |
| | |
| | Year Ended November 30, |
Class Y Shares | | 2018 | 2017 | 2016 | 2015 | 2014 |
Per Share Data ($): | | | | | | |
Net asset value,
beginning of period | | 18.43 | 14.72 | 14.63 | 15.15 | 15.72 |
Investment Operations: | | | | | | |
Investment income—neta | | .21 | .20 | .19 | .22 | .14 |
Net realized and unrealized
gain (loss) on investments | | (.66) | 3.70 | .09 | (.51) | (.48) |
Total from Investment Operations | | (.45) | 3.90 | .28 | (.29) | (.34) |
Distributions: | | | | | | |
Dividends from
investment income—net | | (.20) | (.19) | (.19) | (.23) | (.23) |
Net asset value, end of period | | 17.78 | 18.43 | 14.72 | 14.63 | 15.15 |
Total Return (%) | | (2.48) | 26.80 | 1.97 | (1.89) | (2.20) |
Ratios/Supplemental Data (%): | | | | | |
Ratio of total expenses
to average net assets | | .89 | .91 | .91 | .91 | .91 |
Ratio of net expenses
to average net assets | | .89 | .91 | .91 | .91 | .91 |
Ratio of net investment income
to average net assets | | 1.16 | 1.22 | 1.27 | 1.44 | .90 |
Portfolio Turnover Rate | | 7.47 | 12.49 | 10.65 | 16.52 | 12.49 |
Net Assets,
end of period ($ x 1,000) | | 1,801,389 | 2,083,569 | 1,627,586 | 1,625,626 | 1,105,489 |
a Based on average shares outstanding.
See notes to financial statements.
19
NOTES TO FINANCIAL STATEMENTS
NOTE 1—Significant Accounting Policies:
International Stock Fund (the “fund”) is a separate diversified series of Strategic Funds, Inc. (the “Company”), which is registered under the Investment Company Act of 1940, as amended (the “Act”), as an open-end management investment company and operates as a series company currently offering six series, including the fund. The fund’s investment objective is to seek long-term total return. The Dreyfus Corporation (the “Manager” or “Dreyfus”), a wholly-owned subsidiary of The Bank of New York Mellon Corporation (“BNY Mellon”), serves as the fund’s investment adviser. Walter Scott & Partners Limited (“Walter Scott”), a wholly-owned subsidiary of BNY Mellon and an affiliate of Dreyfus, serves as the fund’s sub-investment adviser.
MBSC Securities Corporation (the “Distributor”), a wholly-owned subsidiary of Dreyfus, is the distributor of the fund’s shares. The fund is authorized to issue 700 million shares of $.001 par value Common Stock. The fund currently has authorized five classes of shares: Class A (100 million shares authorized), Class C (100 million shares authorized), Class I (200 million shares authorized), Class T (100 million shares authorized) and Class Y (200 million shares authorized). Class A and Class T shares generally are subject to a sales charge imposed at the time of purchase. Class C shares are subject to a contingent deferred sales charge (“CDSC”) imposed on Class C shares redeemed within one year of purchase. Class C shares automatically convert to Class A shares ten years after the date of purchase, without the imposition of a sales charge. Class I and Class Y shares are sold at net asset value per share generally to institutional investors. As of the date of this report, the fund did not offer Class T shares for purchase. Other differences between the classes include the services offered to and the expenses borne by each class, the allocation of certain transfer agency costs and certain voting rights. Income, expenses (other than expenses attributable to a specific class), and realized and unrealized gains or losses on investments are allocated to each class of shares based on its relative net assets.
The Company accounts separately for the assets, liabilities and operations of each series. Expenses directly attributable to each series are charged to that series’ operations; expenses which are applicable to all series are allocated among them on a pro rata basis.
The Financial Accounting Standards Board (“FASB”) Accounting Standards Codification (“ASC”) is the exclusive reference of authoritative U.S. generally accepted accounting principles (“GAAP”) recognized by the
20
FASB to be applied by nongovernmental entities. Rules and interpretive releases of the Securities and Exchange Commission (“SEC”) under authority of federal laws are also sources of authoritative GAAP for SEC registrants. The fund’s financial statements are prepared in accordance with GAAP, which may require the use of management estimates and assumptions. Actual results could differ from those estimates.
The Companyenters into contracts that contain a variety of indemnifications. The fund’s maximum exposure under these arrangements is unknown. The fund does not anticipate recognizing any loss related to these arrangements.
(a) Portfolio valuation: The fair value of a financial instrument is the amount that would be received to sell an asset or paid to transfer a liability in an orderly transaction between market participants at the measurement date (i.e., the exit price). GAAP establishes a fair value hierarchy that prioritizes the inputs of valuation techniques used to measure fair value. This hierarchy gives the highest priority to unadjusted quoted prices in active markets for identical assets or liabilities (Level 1 measurements) and the lowest priority to unobservable inputs (Level 3 measurements).
Additionally, GAAP provides guidance on determining whether the volume and activity in a market has decreased significantly and whether such a decrease in activity results in transactions that are not orderly. GAAP requires enhanced disclosures around valuation inputs and techniques used during annual and interim periods.
Various inputs are used in determining the value of the fund’s investments relating to fair value measurements. These inputs are summarized in the three broad levels listed below:
Level 1—unadjusted quoted prices in active markets for identical investments.
Level 2—other significant observable inputs (including quoted prices for similar investments, interest rates, prepayment speeds, credit risk, etc.).
Level 3—significant unobservable inputs (including the fund’s own assumptions in determining the fair value of investments).
The inputs or methodology used for valuing securities are not necessarily an indication of the risk associated with investing in those securities.
Changes in valuation techniques may result in transfers in or out of an assigned level within the disclosure hierarchy. Valuation techniques used to value the fund’s investments are as follows:
21
NOTES TO FINANCIAL STATEMENTS(continued)
Investments in securities are valued at the last sales price on the securities exchange or national securities market on which such securities are primarily traded. Securities listed on the National Market System for which market quotations are available are valued at the official closing price or, if there is no official closing price that day, at the last sales price. For open short positions, asked prices are used for valuation purposes. Bid price is used when no asked price is available. Registered investment companies that are not traded on an exchange are valued at their net asset value. All of the preceding securities are generally categorized within Level 1 of the fair value hierarchy.
Securities not listed on an exchange or the national securities market, or securities for which there were no transactions, are valued at the average of the most recent bid and asked prices. These securities are generally categorized within Level 2 of the fair value hierarchy.
Fair valuing of securities may be determined with the assistance of a pricing service using calculations based on indices of domestic securities and other appropriate indicators, such as prices of relevant ADRs and futures. Utilizing these techniques may result in transfers between Level 1 and Level 2 of the fair value hierarchy.
When market quotations or official closing prices are not readily available, or are determined not to accurately reflect fair value, such as when the value of a security has been significantly affected by events after the close of the exchange or market on which the security is principally traded (for example, a foreign exchange or market), but before the fund calculates its net asset value, the fund may value these investments at fair value as determined in accordance with the procedures approved by the Company’s Board of Directors (the “Board”). Certain factors may be considered when fair valuing investments such as: fundamental analytical data, the nature and duration of restrictions on disposition, an evaluation of the forces that influence the market in which the securities are purchased and sold, and public trading in similar securities of the issuer or comparable issuers. These securities are either categorized within Level 2 or 3 of the fair value hierarchy depending on the relevant inputs used.
For restricted securities where observable inputs are limited, assumptions about market activity and risk are used and such securities are generally categorized within Level 3 of the fair value hierarchy.
Investments denominated in foreign currencies are translated to U.S. dollars at the prevailing rates of exchange.
The following is a summary of the inputs used as of November 30, 2018in valuing the fund’s investments:
22
| | | | | |
| | Level 1-
Unadjusted
Quoted Prices | Level 2 -
Other
Significant
Observable
Inputs | Level 3-
Significant Unobservable
Inputs | Total |
Assets ($) |
Investments in Securities: |
Equity Securities -
Common Stocks | 175,760,694 | 3,561,469,993† | - | 3,737,230,687 |
Investment Company | 41,179,649 | - | - | 41,179,649 |
† Securities classified within Level 2 at period end as the values were determined pursuant to the fund’s fair valuation procedures.
At November 30, 2018, the amount of securities transferred between levels equals fair value of exchange traded equity securities reported as Level 2 in the table above. At November 30, 2017, $3,810,967,035 of exchange traded foreign equity securities were classified within Level 2 of the fair value hierarchy pursuant to the fund’s fair valuation procedures. It is the fund’s policy to recognize transfers between levels at the end of the reporting period.
(b) Foreign currency transactions: The fund does not isolate that portion of the results of operations resulting from changes in foreign exchange rates on investments from the fluctuations arising from changes in the market prices of securities held. Such fluctuations are included with the net realized and unrealized gain or loss on investments.
Net realized foreign exchange gains or losses arise from sales of foreign currencies, currency gains or losses realized on securities transactions between trade and settlement date, and the difference between the amounts of dividends, interest and foreign withholding taxes recorded on the fund’s books and the U.S. dollar equivalent of the amounts actually received or paid. Net unrealized foreign exchange gains and losses arise from changes in the value of assets and liabilities other than investments resulting from changes in exchange rates. Foreign currency gains and losses on foreign currency transactions are also included with net realized and unrealized gain or loss on investments.
(c)Securities transactions and investment income: Securities transactions are recorded on a trade date basis. Realized gains and losses from securities transactions are recorded on the identified cost basis. Dividend income is recognized on the ex-dividend date and interest income, including, where applicable, accretion of discount and amortization of premium on investments, is recognized on the accrual basis.
23
NOTES TO FINANCIAL STATEMENTS(continued)
(d) Affiliated issuers: Investments in other investment companies advised by Dreyfus are considered “affiliated” under the Act.
(e) Risk: Investing in foreign markets may involve special risks and considerations not typically associated with investing in the U.S. These risks include revaluation of currencies, high rates of inflation, repatriation restrictions on income and capital, and adverse political and economic developments. Moreover, securities issued in these markets may be less liquid, subject to government ownership controls and delayed settlements, and their prices may be more volatile than those of comparable securities in the U.S.
(f) Dividends and distributions to shareholders: Dividends and distributions are recorded on the ex-dividend date. Dividends from investment income-net and dividends from net realized capital gains, if any, are normally declared and paid annually, but the fund may make distributions on a more frequent basis to comply with the distribution requirements of the Internal Revenue Code of 1986, as amended (the “Code”). To the extent that net realized capital gains can be offset by capital loss carryovers, it is the policy of the fund not to distribute such gains. Income and capital gain distributions are determined in accordance with income tax regulations, which may differ from GAAP.
(g) Federal income taxes: It is the policy of the fund to continue to qualify as a regulated investment company, if such qualification is in the best interests of its shareholders, by complying with the applicable provisions of the Code, and to make distributions of taxable income and net realized capital gain sufficient to relieve it from substantially all federal income and excise taxes.
As of and during the period ended November 30, 2018, the fund did not have any liabilities for any uncertain tax positions. The fund recognizes interest and penalties, if any, related to uncertain tax positions as income tax expense in the Statement of Operations. During the period ended November 30, 2018, the fund did not incur any interest or penalties.
Each tax year in the four-year period ended November 30, 2018 remains subject to examination by the Internal Revenue Service and state taxing authorities.
At November 30, 2018, the components of accumulated earnings on a tax basis were as follows: undistributed ordinary income $44,415,453, undistributed capital gains $16,358,052 and unrealized appreciation $931,546,823.
24
The tax character of distributions paid to shareholders during the fiscal periods ended November 30, 2018 and November 30, 2017 were as follows: ordinary income $43,802,375 and $39,506,982, respectively.
(h) New Accounting Pronouncements: In August 2018, the FASB issued Accounting Standards Update 2018-13, Fair Value Measurement (Topic 820): Disclosure Framework—Changes to the Disclosure Requirements for Fair Value Measurement (“ASU 2018-13”). The update provides guidance that eliminates, adds and modifies certain disclosure requirements for fair value measurements. ASU 2018-13 will be effective for annual periods beginning after December 15, 2019. Management is currently assessing the potential impact of these changes to future financial statements.
NOTE 2—Bank Lines of Credit:
The fund participates with other Dreyfus-managed long-term open-end funds in an $1.030 billion unsecured credit facility led by Citibank, N.A. (the “Citibank Credit Facility”) and a $300 million unsecured credit facility provided by The Bank of New York Mellon (the “BNYM Credit Facility”), a subsidiary of BNY Mellon and an affiliate of Dreyfus, each to be utilized primarily for temporary or emergency purposes, including the financing of redemptions (each, a “Facility”). The Citibank Credit Facility is available in two tranches: (i) Tranche A is in an amount equal to $830 million and is available to all long-term open-ended funds, including the fund, and (ii) Tranche B is in amount equal to $200 million and is available only to the Dreyfus Floating Rate Income Fund, a series of The Dreyfus/Laurel Funds, Inc. Prior to October 3, 2018, the unsecured credit facility with Citibank, N.A. was $830 million. In connection therewith, the fund has agreed to pay its pro rata portion of commitment fees for Tranche A of the Citibank Credit Facility and the BNYM Credit Facility. Interest is charged to the fund based on rates determined pursuant to the terms of the respective Facility at the time of borrowing.
The average amount of borrowings outstanding under the Facilities during the period ended November 30, 2018 was approximately $53,420 with a related weighted average annualized interest rate of 2.95%.
NOTE 3—Management Fee, Sub-Investment Advisory Fee and Other Transactions with Affiliates:
(a)Pursuant to a management agreement with Dreyfus, the management fee is computed at the annual rate of .85% of the value of the fund’s average daily net assets and is payable monthly.
25
NOTES TO FINANCIAL STATEMENTS(continued)
Pursuant to a sub-investment advisory agreement between Dreyfus and Walter Scott, Dreyfus pays Walter Scott a monthly fee at an annual rate of .41% of the value of the fund’s average daily net assets.
During the period ended November 30, 2018, the Distributor retained $2,458 from commissions earned on sales of the fund’s Class A shares and $7,250 from CDSC fees on redemptions of the fund’s Class C shares.
(b) Under the Distribution Plan adopted pursuant to Rule 12b-1 under the Act, Class C shares pay the Distributor for distributing its shares at an annual rate of .75% of the value of its average daily net assets. During the period ended November 30, 2018, Class C shares were charged $101,243 pursuant to the Distribution Plan.
(c)Under the Shareholder Services Plan, Class A and Class C shares pay the Distributor at an annual rate of .25% of the value of their average daily net assets for the provision of certain services. The services provided may include personal services relating to shareholder accounts, such as answering shareholder inquiries regarding the fund and providing reports and other information, and services related to the maintenance of shareholder accounts. The Distributor may make payments to Service Agents (securities dealers, financial institutions or other industry professionals) with respect to these services. The Distributor determines the amounts to be paid to Service Agents. During the period ended November 30, 2018, Class A and Class C shares were charged $73,539and $33,748, respectively, pursuant to the Shareholder Services Plan.
The fund has arrangements with the transfer agent and the custodian whereby the fund may receive earnings credits when positive cash balances are maintained, which are used to offset transfer agency and custody fees. For financial reporting purposes, the fund includes net earnings credits, if any, as an expense offset in the Statement of Operations.
The fund compensates Dreyfus Transfer, Inc., a wholly-owned subsidiary of Dreyfus, under a transfer agency agreement for providing transfer agency and cash management services for the fund. The majority of transfer agency fees are comprised of amounts paid on a per account basis, while cash management fees are related to fund subscriptions and redemptions. During the period ended November 30, 2018, the fund was charged $17,963 for transfer agency services. These fees are included in Shareholder servicing costs in the Statement of Operations.
The fund compensates The Bank of New York Mellon under a custody agreement for providing custodial services for the fund. These fees are determined based on net assets, geographic region and transaction activity. During the period ended November 30, 2018, the fund was charged
26
$435,333 pursuant to the custody agreement. These fees were partially offset by earnings credits of $37.
During the period ended November 30, 2018, the fund was charged $12,780 for services performed by the Chief Compliance Officer and his staff. These fees are included in Miscellaneous in the Statement of Operations.
The components of “Due to The Dreyfus Corporation and affiliates” in the Statement of Assets and Liabilities consist of: management fees $2,627,544, Distribution Plan fees $7,326, Shareholder Services Plan fees $8,091, custodian fees $228,000, Chief Compliance Officer fees $5,241 and transfer agency fees $2,790.
(d) Each Board member also serves as a Board member of other funds within the Dreyfus complex. Annual retainer fees and attendance fees are allocated to each fund based on net assets.
NOTE 4—Securities Transactions:
The aggregate amount of purchases and sales of investment securities, excluding short-term securities and forward currency exchange contracts (“Forward contracts”), during the period ended November 30, 2018, amounted to $298,271,897 and $422,515,087, respectively.
Derivatives: A derivative is a financial instrument whose performance is derived from the performance of another asset. The fund enters into International Swaps and Derivatives Association, Inc. Master Agreements or similar agreements (collectively, “Master Agreements”) with its over-the-counter (“OTC”) derivative contract counterparties in order to, among other things, reduce its credit risk to counterparties. Master Agreements include provisions for general obligations, representations, collateral and events of default or termination. Under a Master Agreement, the fund may offset with the counterparty certain derivative financial instrument’s payables and/or receivables with collateral held and/or posted and create one single net payment in the event of default or termination.
Each type of derivative instrument that was held by the fund during the period ended November 30, 2018 is discussed below.
Forward Foreign Currency Exchange Contracts: The fund enters into forward contracts in order to hedge its exposure to changes in foreign currency exchange rates on its foreign portfolio holdings, to settle foreign currency transactions or as a part of its investment strategy. When executing forward contracts, the fund is obligated to buy or sell a foreign currency at a specified rate on a certain date in the future. With respect to
27
NOTES TO FINANCIAL STATEMENTS(continued)
sales of forward contracts, the fund incurs a loss if the value of the contract increases between the date the forward contract is opened and the date the forward contract is closed. The fund realizes a gain if the value of the contract decreases between those dates. With respect to purchases of forward contracts, the fund incurs a loss if the value of the contract decreases between the date the forward contract is opened and the date the forward contract is closed. The fund realizes a gain if the value of the contract increases between those dates. Any realized or unrealized gains or losses which occurred during the period are reflected in the Statement of Operations. The fund is exposed to foreign currency risk as a result of changes in value of underlying financial instruments. The fund is also exposed to credit risk associated with counterparty nonperformance on these forward contracts, which is generally limited to the unrealized gain on each open contract. This risk may be mitigated by Master Agreements, if any, between the fund and the counterparty and the posting of collateral, if any, by the counterparty to the fund to cover the fund’s exposure to the counterparty. At November 30, 2018, there were no forward contracts outstanding.
The following summarizes the average market value of derivatives outstanding duringthe period ended November 30, 2018:
| | | |
| | Average Market Value ($) |
Forward contracts | | 4,173,859 |
| | | |
At November 30, 2018, the cost of investments for federal income tax purposes was $2,846,571,861; accordingly, accumulated net unrealized appreciation on investments was $931,838,475, consisting of $1,007,998,838 gross unrealized appreciation and $76,160,363 gross unrealized depreciation.
28
REPORT OF INDEPENDENT REGISTERED PUBLIC ACCOUNTING FIRM
To the Shareholders and the Board of Directors of International Stock Fund
Opinion on the Financial Statements
We have audited the accompanying statement of assets and liabilities of International Stock Fund (the “Fund”) (one of the funds constituting Strategic Funds, Inc.), including the statements of investments and investments in affiliated issuers, as of November 30, 2018, and the related statement of operations for the year then ended, the statements of changes in net assets for each of the two years in the period then ended, the financial highlights for each of the five years in the period then ended and the related notes (collectively referred to as the “financial statements”). In our opinion, the financial statements present fairly, in all material respects, the financial position of the Fund (one of the funds constituting Strategic Funds, Inc.) at November 30, 2018, the results of its operations for the year then ended, the changes in its net assets for each of the two years in the period then ended and its financial highlights for each of the five years in the period then ended, in conformity with U.S. generally accepted accounting principles.
Basis for Opinion
These financial statements are the responsibility of the Fund’s management. Our responsibility is to express an opinion on the Fund’s financial statements based on our audits. We are a public accounting firm registered with the Public Company Accounting Oversight Board (United States) (“PCAOB”) and are required to be independent with respect to the Fund in accordance with the U.S. federal securities laws and the applicable rules and regulations of the Securities and Exchange Commission and the PCAOB.
We conducted our audits in accordance with the standards of the PCAOB. Those standards require that we plan and perform the audit to obtain reasonable assurance about whether the financial statements are free of material misstatement, whether due to error or fraud. The Fund is not required to have, nor were we engaged to perform, an audit of the Fund’s internal control over financial reporting. As part of our audits, we are required to obtain an understanding of internal control over financial reporting, but not for the purpose of expressing an opinion on the effectiveness of the Fund’s internal control over financial reporting. Accordingly, we express no such opinion.
Our audits included performing procedures to assess the risks of material misstatement of the financial statements, whether due to error or fraud, and performing procedures that respond to those risks. Such procedures included examining, on a test basis, evidence regarding the amounts and disclosures in the financial statements. Our procedures included confirmation of securities owned as of November 30, 2018, by correspondence with the custodian and others or by other appropriate auditing procedures where replies from others were not received. Our audits also included evaluating the accounting principles used and significant estimates made by management, as well as evaluating the overall presentation of the financial statements. We believe that our audits provide a reasonable basis for our opinion.

We have served as the auditor of one or more Dreyfus investment companies since at least 1957, but we are unable to determine the specific year.
New York, New York
January 28, 2019
29
IMPORTANT TAX INFORMATION(Unaudited)
In accordance with federal tax law, the fund elects to provide each shareholder with their portion of the fund’s foreign taxes paid and the income sourced from foreign countries. Accordingly, the fund hereby reports the following information regarding its fiscal year ended November 30, 2018:
- the total amount of taxes paid to foreign countries was $10,147,643
- the total amount of income sourced from foreign countries was $91,821,940
Where required by federal tax law rules, shareholders will receive notification of their proportionate share of foreign taxes paid and foreign sourced income for the 2018 calendar year with Form 1099-DIV which will be mailed in early 2019. For the fiscal year ended November 30, 2018, certain dividends paid by the fund may be subject to a maximum tax rate of 15%, as provided for by the Jobs and Growth Tax Relief Reconciliation Act of 2003. Of the distributions paid during the fiscal year, $43,802,375 represents the maximum amount that may be considered qualified dividend income.
30
INFORMATION ABOUT THE RENEWAL OF THE FUND’S MANAGEMENT AND SUB-INVESTMENT ADVISORY AGREEMENTS (Unaudited)
At a meeting of the fund’s Board of Directors held on November 5-6, 2018, the Board considered the renewalof the fund’s Management Agreement, pursuant to which Dreyfus provides the fund with investment advisory and administrative services (the “Agreement”), and the Sub-Investment Advisory Agreement (together, the “Agreements”), pursuant to which Walter Scott & Partners Limited (the “Subadviser”) provides day-to-day management of the fund’s investments. The Board members, a majority of whom are not “interested persons” (as defined in the Investment Company Act of 1940, as amended) of the fund, were assisted in their review by independent legal counsel and met with counsel in executive session separate from representatives of Dreyfus and the Subadviser. In considering the renewal of the Agreements, the Board considered all factors that it believed to be relevant, including those discussed below. The Board did not identify any one factor as dispositive, and each Board member may have attributed different weights to the factors considered.
Analysis of Nature, Extent, and Quality of Services Provided to the Fund. The Board considered information provided to it at the meeting and in previous presentations from Dreyfus representatives regarding the nature, extent, and quality of the services provided to funds in the Dreyfus fund complex. Dreyfus provided the number of open accounts in the fund, the fund’s asset size and the allocation of fund assets among distribution channels. Dreyfus also had previously provided information regarding the diverse intermediary relationships and distribution channels of funds in the Dreyfus fund complex (such as retail direct or intermediary, in which intermediaries typically are paid by the fund and/or Dreyfus) and Dreyfus’ corresponding need for broad, deep, and diverse resources to be able to provide ongoing shareholder services to each intermediary or distribution channel, as applicable to the fund.
The Board also considered research support available to, and portfolio management capabilities of, the fund’s portfolio management personnel and that Dreyfus also provides oversight of day-to-day fund operations, including fund accounting and administration and assistance in meeting legal and regulatory requirements. The Board also considered Dreyfus’ extensive administrative, accounting and compliance infrastructures, as well as Dreyfus’ supervisory activities over the Subadviser. The Board also considered portfolio management’s brokerage policies and practices (including policies and practices regarding soft dollars) and the standards applied in seeking best execution.
Comparative Analysis of the Fund’s Performance and Management Fee and Expense Ratio. The Board reviewed reports prepared by Broadridge Financial Solutions, Inc. (“Broadridge”), an independent provider of investment company data, which included information comparing (1) the fund’s performance with the performance of a group of comparable funds (the “Performance Group”) and with a broader group of funds (the “Performance Universe”), all for various periods ended September 30, 2018, and (2) the fund’s actual and contractual management fees and total expenses with those of a group of comparable funds (the “Expense Group”) and with a broader group of funds (the
31
INFORMATION ABOUT THE RENEWAL OF THE FUND’S MANAGEMENT AND SUB-INVESTMENT ADVISORY AGREEMENTS (Unaudited) (continued)
“Expense Universe”), the information for which was derived in part from fund financial statements available to Broadridge as of the date of its analysis. Dreyfus previously had furnished the Board with a description of the methodology Broadridge used to select the Performance Group and Performance Universe and the Expense Group and Expense Universe.
Dreyfus representatives stated that the usefulness of performance comparisons may be affected by a number of factors, including different investment limitations and policies that may be applicable to the fund and comparison funds. The Board discussed with representatives of Dreyfus, its affiliates and/or the Subadviser the results of the comparisons and considered that the fund’s total return performance was above the Performance Group and Performance Universe all periods shown, ranking in the first quartile of the Performance Group and Performance Universe for all periods except the ten-year period. Dreyfus also provided a comparison of the fund’s calendar year total returns to the returns of the fund’s benchmark index, and it was considered that the fund’s returns were above the returns of the index in eight of the ten calendar years shown.
The Board also reviewed the range of actual and contractual management fees and total expenses of the Expense Group and Expense Universe funds and discussed the results of the comparisons. The Board considered that the fund’s contractual management fee was slightly below the Expense Group median, the fund’s actual management fee was above the Expense Group and Expense Universe medians and the fund’s total expenses were below the Expense Group and Expense Universe medians.
Dreyfus representatives reviewed with the Board the management or investment advisory fees (1) paid by funds advised or administered by Dreyfus that are in the same Lipper category as the fund and (2) paid to Dreyfus or the Subadviser or its affiliates for advising any separate accounts and/or other types of client portfolios that are considered to have similar investment strategies and policies as the fund (the “Similar Clients”), and explained the nature of the Similar Clients. They discussed differences in fees paid and the relationship of the fees paid in light of any differences in the services provided and other relevant factors. The Board considered the relevance of the fee information provided for the Similar Clients to evaluate the appropriateness of the fund’s management fee.
The Board considered the fee to the Subadviser in relation to the fee paid to Dreyfus by the fund and the respective services provided by the Subadviser and Dreyfus. The Board also took into consideration that the Subadviser’s fee is paid by Dreyfus (out of its fee from the fund) and not the fund.
Analysis of Profitability and Economies of Scale. Dreyfus representatives reviewed the expenses allocated and profit received by Dreyfus and its affiliates and the resulting profitability percentage for managing the fund and the aggregate profitability percentage to Dreyfus and its affiliates for managing the funds in the Dreyfus fund complex, and the method used to determine the expenses and profit. The Board concluded that the profitability results were not unreasonable, given the services rendered and service levels
32
provided by Dreyfus. The Board also had been provided with information prepared by an independent consulting firm regarding Dreyfus’ approach to allocating costs to, and determining the profitability of, individual funds and the entire Dreyfus fund complex. The consulting firm also had analyzed where any economies of scale might emerge in connection with the management of a fund.
The Board considered on the advice of its counsel the profitability analysis (1) as part of its evaluation of whether the fees under the Agreements, considered in relation to the mix of services provided by Dreyfus and the Subadviser, including the nature, extent and quality of such services, supported the renewal of the Agreements and (2) in light of the relevant circumstances for the fund and the extent to which economies of scale would be realized if the fund grows and whether fee levels reflect these economies of scale for the benefit of fund shareholders. Since Dreyfus, and not the fund, pays the Subadviser pursuant to the Sub-Investment Advisory Agreement, the Board did not consider the Subadviser’s profitability to be relevant to its deliberations. Dreyfus representatives also stated that, as a result of shared and allocated costs among funds in the Dreyfus fund complex, the extent of economies of scale could depend substantially on the level of assets in the complex as a whole, so that increases and decreases in complex-wide assets can affect potential economies of scale in a manner that is disproportionate to, or even in the opposite direction from, changes in the fund’s asset level. The Board also considered potential benefits to Dreyfus and the Subadviser from acting as investment adviser and sub-investment adviser, respectively, and took into consideration the soft dollar arrangements in effect for trading the fund’s investments.
At the conclusion of these discussions, the Board agreed that it had been furnished with sufficient information to make an informed business decision with respect to the renewal of the Agreements. Based on the discussions and considerations as described above, the Board concluded and determined as follows.
· The Board concluded that the nature, extent and quality of the services provided by Dreyfus and the Subadviser are adequate and appropriate.
· The Board was satisfied with the fund’s performance.
· The Board concluded that the fees paid to Dreyfus and the Subadviser continued to be appropriate under the circumstances and in light of the factors and the totality of the services provided as discussed above.
· The Board determined that the economies of scale which may accrue to Dreyfus and its affiliates in connection with the management of the fund had been adequately considered by Dreyfus in connection with the fee rate charged to the fund pursuant to the Agreement and that, to the extent in the future it were determined that material economies of scale had not been shared with the
33
INFORMATION ABOUT THE RENEWAL OF THE FUND’S MANAGEMENT AND SUB-INVESTMENT ADVISORY AGREEMENTS (Unaudited) (continued)
fund, the Board would seek to have those economies of scale shared with the fund.
In evaluating the Agreements, the Board considered these conclusions and determinations and also relied on its previous knowledge, gained through meetings and other interactions with Dreyfus and its affiliates and the Subadviser, of Dreyfus and the Subadviser and the services provided to the fund by Dreyfus and the Subadviser. The Board also relied on information received on a routine and regular basis throughout the year relating to the operations of the fund and the investment management and other services provided under the Agreements, including information on the investment performance of the fund in comparison to similar mutual funds and benchmark performance indices; general market outlook as applicable to the fund; and compliance reports. In addition, the Board’s consideration of the contractual fee arrangements for this fund had the benefit of a number of years of reviews of the Agreements for the fund, or substantially similar agreements for other Dreyfus funds that the Board oversees, during which lengthy discussions took place between the Board and Dreyfus representatives. Certain aspects of the arrangements may receive greater scrutiny in some years than in others, and the Board’s conclusions may be based, in part, on their consideration of the fund’s arrangements, or substantially similar arrangements for other Dreyfus funds that the Board oversees, in prior years. The Board determined to renew the Agreements.
34
BOARD MEMBERS INFORMATION(Unaudited)
INDEPENDENT BOARD MEMBERS
Joseph S. DiMartino (75)
Chairman of the Board (1995)
Principal Occupation During Past 5 Years:
· Corporate Director and Trustee (1995-present)
Other Public Company Board Memberships During Past 5 Years:
· CBIZ (formerly, Century Business Services, Inc.), a provider of outsourcing functions for small and medium size companies, Director (1997-present)
No. of Portfolios for which Board Member Serves:123
———————
Joni Evans (76)
Board Member (2006)
Principal Occupation During Past 5 Years:
· Chief Executive Officer, www.wowOwow.com, an online community dedicated to women’s conversations and publications (2007-present)
· Principal, Joni Evans Ltd. (publishing) (2006-present)
No. of Portfolios for which Board Member Serves:21
———————
Joan Gulley (71)
Board Member (2017)
Principal Occupation During Past 5 Years:
· PNC Financial Services Group, Inc.(1993-2014), Executive Vice President and Chief Human Resources Officer and Executive Committee Member (2008-2014)
No. of Portfolios for which Board Member Serves:52
———————
Ehud Houminer (78)
Board Member (1994)
Principal Occupation During Past 5 Years:
· Board of Overseers at the Columbia Business School, Columbia
University (1992-present)
Trustee, Ben Gurion University
No. of Portfolios for which Board Member Serves: 52
———————
35
BOARD MEMBERS INFORMATION (Unaudited) (continued)
INDEPENDENT BOARD MEMBERS (continued)
Alan H. Howard (59)
Board Member (2018)
Principal Occupation During Past 5 Years:
· Managing Partner of Heathcote Advisors LLC, a financial advisory services firm (2008 – present)
· President of Dynatech/MPX Holdings LLC (2012 – present), a global supplier and service provider of military aircraft parts, including Chief Executive Officer of an operating subsidiary, Dynatech International LLC (2013 – present)
· Senior Advisor, Rossoff & Co., an independent investment banking firm (2014 – present)
Other Public Company Board Memberships During Past 5 Years:
· Movado Group, a designer and manufacturer of watches, Director (1997-present)
No. of Portfolios for which Board Member Serves:21
———————
Robin A. Melvin (55)
Board Member (1995)
Principal Occupation During Past 5 Years:
· Co-chairman, Illinois Mentoring Partnership, non-profit organization dedicated to increasing the quantity and quality of mentoring services in Illinois; (2014-present; board member since 2013)
No. of Portfolios for which Board Member Serves:99
———————
Burton N. Wallack (68)
Board Member (2006)
Principal Occupation During Past 5 Years:
· President and Co-owner of Wallack Management Company, a real estate management
company (1987-present)
No. of Portfolios for which Board Member Serves:21
———————
Benaree Pratt Wiley (72)
Board Member (2016)
Principal Occupation During Past 5 Years:
· Principal, The Wiley Group, a firm specializing in strategy and business development (2005-present)
Other Public Company Board Memberships During Past 5 Years:
· CBIZ (formerly, Century Business Services, Inc.), a provider of outsourcing functions for small and medium size companies, Director (2008-present)
No. of Portfolios for which Board Member Serves: 78
———————
36
INTERESTED BOARD MEMBERs
Gordon J. Davis (77)
Board Member (2006)
Principal Occupation During Past 5 Years:
· Partner in the law firm of Venable LLP (2012-present)
Other Public Company Board Memberships During Past 5 Years:
· Consolidated Edison, Inc., a utility company, Director (1997-2014)
· The Phoenix Companies, Inc., a life insurance company, Director (2000-2014)
No. of Portfolios for which Board Member Serves:55
Gordon J. Davis is deemed to be an “interested person” (as defined under the Act) of the Company as a result of his affiliation with Venable LLP, which provides legal services to the Company.
———————
Once elected all Board Members serve for an indefinite term, but achieve Emeritus status upon reaching age 80. The address of the Board Members and Officers is c/o The Dreyfus Corporation, 200 Park Avenue, New York, New York 10166. Additional information about the Board Members is available in the fund’s Statement of Additional Information which can be obtained from Dreyfus free of charge by calling this toll free number: 1-800-DREYFUS.
William Hodding Carter III, Emeritus Board Member
Hans C. Mautner, Emeritus Board Member
37
OFFICERS OF THE FUND(Unaudited)
BRADLEY J. SKAPYAK, President since January 2010.
Chief Operating Officer and a director of the Manager since June 2009, Chairman of Dreyfus Transfer, Inc., an affiliate of the Manager and the transfer agent of the funds, since May 2011 and Chief Executive Officer of MBSC Securities Corporation since August 2016. He is an officer of 62 investment companies (comprised of 123 portfolios) managed by the Manager. He is 60 years old and has been an employee of the Manager since February 1988.
BENNETT A. MACDOUGALL, Chief Legal Officer since October 2015.
Chief Legal Officer of the Manager and Associate General Counsel and Managing Director of BNY Mellon since June 2015; from June 2005 to June 2015, he served in various capacities with Deutsche Bank – Asset & Wealth Management Division, including as Director and Associate General Counsel, and Chief Legal Officer of Deutsche Investment Management Americas Inc. from June 2012 to May 2015. He is an officer of 63 investment companies (comprised of 148 portfolios) managed by the Manager. He is 47 years old and has been an employee of the Manager since June 2015.
JAMES BITETTO, Vice President since August 2005 and Secretary since February 2018.
Managing Counsel of BNY Mellon and Secretary of the Manager, and an officer of 63 investment companies (comprised of 148 portfolios) managed by the Manager. He is 52 years old and has been an employee of the Manager since December 1996.
SONALEE CROSS, Vice President and Assistant Secretary since March 2018.
Counsel of BNY Mellon since October 2016; Associate at Proskauer Rose LLP from April 2016 to September 2016; Attorney at EnTrust Capital from August 2015 to February 2016; Associate at Sidley Austin LLP from September 2013 until August 2015. She is an officer of 63 investment companies (comprised of 148 portfolios) managed by Dreyfus. She is 31 years old and has been an employee of the Manager since October 2016.
MAUREEN E. KANE, Vice President and Assistant Secretary since April 2015.
Managing Counsel of BNY Mellon since July 2014; from October 2004 until July 2014, General Counsel, and from May 2009 until July 2014, Chief Compliance Officer of Century Capital Management. She is an officer of 63 investment companies (comprised of 148 portfolios) managed by the Manager. She is 56 years old and has been an employee of the Manager since July 2014.
SARAH S. KELLEHER, Vice President and Assistant Secretary since April 2014.
Managing Counsel of BNY Mellon since December 2017, from March 2013 to December 2017, Senior Counsel of BNY Mellon. She is an officer of 63 investment companies (comprised of 148 portfolios) managed by the Manager. She is 43 years old and has been an employee of the Manager since March 2013.
JEFF PRUSNOFSKY, Vice President and Assistant Secretary since August 2005.
Senior Managing Counsel of BNY Mellon, and an officer of 63 investment companies (comprised of 148 portfolios) managed by the Manager. He is 53 years old and has been an employee of the Manager since October 1990.
NATALYA ZELENSKY, Vice President and Assistant Secretary since March 2017.
Counsel of BNY Mellon since May 2016; Attorney at Wildermuth Endowment Strategy Fund/Wildermuth Advisory, LLC from November 2015 until May 2016; Assistant General Counsel at RCS Advisory Services from July 2014 until November 2015; Associate at Sutherland, Asbill & Brennan from January 2013 until January 2014. She is an officer of 63 investment companies (comprised of 148 portfolios) managed by Dreyfus. She is 33 years old and has been an employee of the Manager since May 2016.
JAMES WINDELS, Treasurer since November 2001.
Director – Mutual Fund Accounting of the Manager, and an officer of 63 investment companies (comprised of 148 portfolios) managed by the Manager. He is 60 years old and has been an employee of the Manager since April 1985.
38
GAVIN C. REILLY, Assistant Treasurer since December 2005.
Tax Manager of the Investment Accounting and Support Department of the Manager, and an officer of 63 investment companies (comprised of 148 portfolios) managed by the Manager. He is 50 years old and has been an employee of the Manager since April 1991.
ROBERT S. ROBOL, Assistant Treasurer since December 2002.
Senior Accounting Manager – Dreyfus Financial Reporting of the Manager, and an officer of 63 investment companies (comprised of 148 portfolios) managed by the Manager. He is 54 years old and has been an employee of the Manager since October 1988.
ROBERT SALVIOLO, Assistant Treasurer since July 2007.
Senior Accounting Manager – Equity Funds of the Manager, and an officer of 63 investment companies (comprised of 148 portfolios) managed by the Manager. He is 51 years old and has been an employee of the Manager since June 1989.
ROBERT SVAGNA, Assistant Treasurer since December 2002.
Senior Accounting Manager – Fixed Income and Equity Funds of the Manager, and an officer of 63 investment companies (comprised of 148 portfolios) managed by the Manager. He is 51 years old and has been an employee of the Manager since November 1990.
JOSEPH W. CONNOLLY, Chief Compliance Officer since October 2004.
Chief Compliance Officer of the Manager, the Dreyfus Family of Funds and BNY Mellon Funds Trust (63 investment companies, comprised of 148 portfolios). He is 61 years old and has served in various capacities with the Manager since 1980, including manager of the firm’s Fund Accounting Department from 1997 through October 2001.
CARIDAD M. CAROSELLA, Anti-Money Laundering Compliance Officer since January 2016.
Anti-Money Laundering Compliance Officer of the Dreyfus Family of Funds and BNY Mellon Funds Trust since January 2016; from May 2015 to December 2015, Interim Anti-Money Laundering Compliance Officer of the Dreyfus Family of Funds and BNY Mellon Funds Trust and the Distributor; from January 2012 to May 2015, AML Surveillance Officer of the Distributor and from 2007 to December 2011, Financial Processing Manager of the Distributor. She is an officer of 57 investment companies (comprised of 142 portfolios) managed by the Manager. She is 50 years old and has been an employee of the Distributor since 1997.
39
NOTES
40
NOTES
41
International Stock Fund
200 Park Avenue
New York, NY 10166
Manager
The Dreyfus Corporation
200 Park Avenue
New York, NY 10166
Sub-Investment Adviser
Walter Scott & Partners Limited
(Walter Scott)
One Charlotte Square
Edinburgh, Scotland, UK
Custodian
The Bank of New York Mellon
240 Greenwich Street
New York, NY 10286
Transfer Agent &
Dividend Disbursing Agent
Dreyfus Transfer, Inc.
200 Park Avenue
New York, NY 10166
Distributor
MBSC Securities Corporation
200 Park Avenue
New York, NY 10166
| | |
Ticker Symbols: Class A: DISAX Class C: DISCX Class I: DISRX Class Y: DISYX |
Telephone Call your financial representative or 1-800-DREYFUS
Mail The Dreyfus Family of Funds, 144 Glenn Curtiss Boulevard, Uniondale, NY 11556-0144
E-mailSend your request toinfo@dreyfus.com
InternetInformation can be viewed online or downloaded atwww.dreyfus.com
The fund files its complete schedule of portfolio holdings with the Securities and Exchange Commission (“SEC”) for the first and third quarters of each fiscal year on Form N-Q. The fund’s Forms N-Q are available on the SEC’s website atwww.sec.gov.
A description of the policies and procedures that the fund uses to determine how to vote proxies relating to portfolio securities and information regarding how the fund voted these proxies for the most recent 12-month period ended June 30 is available atwww.dreyfus.com and on the SEC’s website atwww.sec.gov and without charge, upon request, by calling 1-800-DREYFUS.
| | |
© 2019 MBSC Securities Corporation
6155AR1118 | 
|
Item 2. Code of Ethics.
The Registrant has adopted a code of ethics that applies to the Registrant's principal executive officer, principal financial officer, principal accounting officer or controller, or persons performing similar functions. There have been no amendments to, or waivers in connection with, the Code of Ethics during the period covered by this Report.
Item 3. Audit Committee Financial Expert.
The Registrant's Board has determined that Ehud Houminer, a member of the Audit Committee of the Board, is an audit committee financial expert as defined by the Securities and Exchange Commission (the "SEC”). Ehud Houminer is independent" as defined by the SEC for purposes of audit committee financial expert determinations.
Item 4. Principal Accountant Fees and Services.
(a) Audit Fees. The aggregate fees billed for each of the last two fiscal years (the "Reporting Periods") for professional services rendered by the Registrant's principal accountant (the "Auditor") for the audit of the Registrant's annual financial statements or services that are normally provided by the Auditor in connection with the statutory and regulatory filings or engagements for the Reporting Periods, were $162,936 in 2017 and $165,378 in 2018.
(b) Audit-Related Fees. The aggregate fees billed in the Reporting Periods for assurance and related services by the Auditor that are reasonably related to the performance of the audit of the Registrant's financial statements and are not reported under paragraph (a) of this Item 4 were $48,152 in 2017 and $33,205 in 2018. These services consisted of one or more of the following: (i) agreed upon procedures related to compliance with Internal Revenue Code section 817(h), (ii) security counts required by Rule 17f-2 under the Investment Company Act of 1940, as amended, (iii) advisory services as to the accounting or disclosure treatment of Registrant transactions or events and (iv) advisory services to the accounting or disclosure treatment of the actual or potential impact to the Registrant of final or proposed rules, standards or interpretations by the Securities and Exchange Commission, the Financial Accounting Standards Boards or other regulatory or standard-setting bodies.
The aggregate fees billed in the Reporting Periods for non-audit assurance and related services by the Auditor to the Registrant's investment adviser (not including any sub-investment adviser whose role is primarily portfolio management and is subcontracted with or overseen by another investment adviser), and any entity controlling, controlled by or under common control with the investment adviser that provides ongoing services to the Registrant ("Service Affiliates"), that were reasonably related to the performance of the annual audit of the Service Affiliate, which required pre-approval by the Audit Committee were $0 in 2017 and $0 in 2018.
(c) Tax Fees. The aggregate fees billed in the Reporting Periods for professional services rendered by the Auditor for tax compliance, tax advice, and tax planning ("Tax Services") were $15,841 in 2017 and $17,058 in 2018. These services consisted of: (i) review or preparation of U.S. federal, state, local and excise tax returns; (ii) U.S. federal, state and local tax planning, advice and assistance regarding statutory, regulatory or administrative developments; (iii) tax advice regarding tax qualification matters and/or treatment of various financial instruments held or proposed to be acquired or held, and (iv) determination of Passive Foreign Investment Companies. The aggregate fees billed in the Reporting Periods for Tax Services by the Auditor to Service Affiliates, which required pre-approval by the Audit Committee were $0 in 2017 and $0 in 2018.
(d) All Other Fees. The aggregate fees billed in the Reporting Periods for products and services provided by the Auditor, other than the services reported in paragraphs (a) through (c) of this Item, were $356 in 2017 and $396 in 2018. These services consisted of a review of the Registrant's anti-money laundering program.
The aggregate fees billed in the Reporting Periods for Non-Audit Services by the Auditor to Service Affiliates, other than the services reported in paragraphs (b) through (c) of this Item, which required pre-approval by the Audit Committee, were $0 in 2017 and $0 in 2018.
(e)(1)Audit Committee Pre-Approval Policies and Procedures. The Registrant's Audit Committee has established policies and procedures (the "Policy") for pre-approval (within specified fee limits) of the Auditor's engagements for non-audit services to the Registrant and Service Affiliates without specific case-by-case consideration. The pre-approved services in the Policy can include pre-approved audit services, pre-approved audit-related services, pre-approved tax services and pre-approved all other services. Pre-approval considerations include whether the proposed services are compatible with maintaining the Auditor's independence. Pre-approvals pursuant to the Policy are considered annually.
(e)(2)Note. None of the services described in paragraphs (b) through (d) of this Item 4 were approved by the Audit Committee pursuant to paragraph (c)(7)(i)(C) of Rule 2-01 of Regulation S-X.
(f) None of the hours expended on the principal accountant's engagement to audit the registrant's financial statements for the most recent fiscal year were attributed to work performed by persons other than the principal account's full-time, permanent employees.
Non-Audit Fees. The aggregate non-audit fees billed by the Auditor for services rendered to the Registrant, and rendered to Service Affiliates, for the Reporting Periods were $31,197,139 in 2017 and $38,822,724 in 2018.
Auditor Independence. The Registrant's Audit Committee has considered whether the provision of non-audit services that were rendered to Service Affiliates, which were not pre-approved (not requiring pre-approval), is compatible with maintaining the Auditor's independence.
Item 5. Audit Committee of Listed Registrants.
Not applicable.
Item 6. Investments.
(a) Not applicable.
Item 7. Disclosure of Proxy Voting Policies and Procedures for Closed-End Management Investment Companies.
Not applicable.
Item 8. Portfolio Managers of Closed-End Management Investment Companies.
Not applicable.
Item 9. Purchases of Equity Securities by Closed-End Management Investment Companies and Affiliated Purchasers.
Not applicable.
Item 10. Submission of Matters to a Vote of Security Holders.
There have been no material changes to the procedures applicable to Item 10.
Item 11. Controls and Procedures.
(a) The Registrant's principal executive and principal financial officers have concluded, based on their evaluation of the Registrant's disclosure controls and procedures as of a date within 90 days of the filing date of this report, that the Registrant's disclosure controls and procedures are reasonably designed to ensure that information required to be disclosed by the Registrant on Form N-CSR is recorded, processed, summarized and reported within the required time periods and that information required to be disclosed by the Registrant in the reports that it files or submits on Form N-CSR is accumulated and communicated to the Registrant's management, including its principal executive and principal financial officers, as appropriate to allow timely decisions regarding required disclosure.
(b) There were no changes to the Registrant's internal control over financial reporting that occurred during the second fiscal quarter of the period covered by this report that have materially affected, or are reasonably likely to materially affect, the Registrant's internal control over financial reporting.
Item 12. Disclosure of Securities Lending Activities for Closed-End Management Investment Companies.
Not applicable.
Item 13. Exhibits.
(a)(1) Code of ethics referred to in Item 2.
(a)(2) Certifications of principal executive and principal financial officers as required by Rule 30a-2(a) under the Investment Company Act of 1940.
(a)(3) Not applicable.
(b) Certification of principal executive and principal financial officers as required by Rule 30a-2(b) under the Investment Company Act of 1940.
SIGNATURES
Pursuant to the requirements of the Securities Exchange Act of 1934 and the Investment Company Act of 1940, the Registrant has duly caused this Report to be signed on its behalf by the undersigned, thereunto duly authorized.
Strategic Funds, Inc.
By: /s/ Bradley J. Skapyak
Bradley J. Skapyak
President
January 29, 2019
Pursuant to the requirements of the Securities Exchange Act of 1934 and the Investment Company Act of 1940, this Report has been signed below by the following persons on behalf of the Registrant and in the capacities and on the dates indicated.
By: /s/ Bradley J. Skapyak
Bradley J. Skapyak
President
January 29, 2019
By: /s/ James Windels
James Windels
Treasurer
January 25, 2019
EXHIBIT INDEX
(a)(1) Code of ethics referred to in Item 2.
(a)(2) Certifications of principal executive and principal financial officers as required by Rule 30a-2(a) under the Investment Company Act of 1940. (EX-99.CERT)
(b) Certification of principal executive and principal financial officers as required by Rule 30a-2(b) under the Investment Company Act of 1940. (EX-99.906CERT)


