UNITED STATES
SECURITIES AND EXCHANGE COMMISSION
Washington, D.C. 20549
FORM N-CSR
CERTIFIED SHAREHOLDER REPORT OF REGISTERED MANAGEMENT
INVESTMENT COMPANIES
Investment Company Act file number | 811-03940 |
| |
| BNY Mellon Strategic Funds, Inc. | |
| (Exact name of Registrant as specified in charter) | |
| | |
| c/o BNY Mellon Investment Adviser, Inc. 240 Greenwich Street New York, New York 10286 | |
| (Address of principal executive offices) (Zip code) | |
| | |
| Bennett A. MacDougall, Esq. 240 Greenwich Street New York, New York 10286 | |
| (Name and address of agent for service) | |
|
Registrant's telephone number, including area code: | (212) 922-6400 |
| |
Date of fiscal year end: | 05/31 | |
Date of reporting period: | 05/31/2019 | |
| | | | | | | |
The following N-CSR relates only to the Registrant's series listed below and does not relate to any series of the Registrant with a different fiscal year end and, therefore, different N-CSR reporting requirements. A separate N-CSR will be filed for any series with a different fiscal year end, as appropriate.
BNY Mellon Select Managers Small Cap Growth Fund
FORM N-CSR
Item 1. Reports to Stockholders.
BNY Mellon Select Managers Small Cap Growth Fund
| |
ANNUAL REPORT May 31, 2019 |
| |
Save time. Save paper. View your next shareholder report online as soon as it’s available. Log into www.bnymellonim.com/us and sign up for eCommunications. It’s simple and only takes a few minutes. |
| |
The views expressed in this report reflect those of the portfolio manager(s) only through the end of the period covered and do not necessarily represent the views of BNY Mellon Investment Adviser, Inc. or any other person in the BNY Mellon Investment Adviser, Inc. organization. Any such views are subject to change at any time based upon market or other conditions and BNY Mellon Investment Adviser, Inc. disclaims any responsibility to update such views. These views may not be relied on as investment advice and, because investment decisions for a fund in the BNY Mellon Family of Funds are based on numerous factors, may not be relied on as an indication of trading intent on behalf of any fund in the BNY Mellon Family of Funds. |
| |
Not FDIC-Insured • Not Bank-Guaranteed • May Lose Value |
Contents
T H E F U N D
F O R M O R E I N F O R M AT I O N
Back Cover
| | | | |
| |
BNY Mellon Select Managers Small Cap Growth Fund
| | The Fund |
A LETTER FROM THE PRESIDENT OF BNY MELLON INVESTMENT ADVISER, INC.
Dear Shareholder:
We are pleased to present this annual report for BNY Mellon Select Managers Small Cap Growth Fund (formerly Dreyfus Select Managers Small Cap Growth Fund), covering the 12-month period from June 1, 2018 through May 31, 2019. For information about how the fund performed during the reporting period, as well as general market perspectives, we provide a Discussion of Fund Performance on the pages that follow.
At the beginning of the reporting period, developed economies outside of the U.S. continued to weaken, while the U.S. economy sustained its relatively healthy growth rate. Calm markets prevailed throughout the summer, as robust growth and strong corporate earnings supported U.S. stock returns, while other developed markets continued to decline.
The fourth quarter of 2018 saw broad market weakness, due in part to heightened concerns about rising interest rates, trade tensions and slowing global growth. The slump largely erased prior gains on U.S. indices, while losses deepened in international markets. December experienced a sharp sell-off, as it appeared that the U.S. Federal Reserve (the “Fed”) would maintain its hawkish stance on monetary policy. However, comments made by the Fed in January indicated that it would slow the pace of interest-rate increases, and this helped stimulate a rebound across equity markets that continued through much of the reporting period. However, in May, escalating trade tensions once again disrupted equity market progress, causing stock prices to pull back.
Fixed-income markets declined early in the period, as interest rates and inflation rose, pressuring most bond prices. Comparatively strong U.S. equity markets fed investor risk appetites, reducing the demand for Treasuries and increasing yields. But a return of stock market volatility in October triggered a flight to quality, boosting Treasury prices and flattening the yield curve. In January, when the Fed’s comments indicated that rate increases would be less likely in 2019, bond markets rallied. Fixed-income prices benefited from falling rates through the end of the period.
We remain positive on the near-term economic outlook for the U.S. but will monitor relevant data for any signs of a change. As always, we encourage you to discuss the risks and opportunities in today’s investment environment with your financial advisor.
Thank you for your continued confidence and support.
Sincerely,

Renee LaRoche-Morris
President
BNY Mellon Investment Adviser, Inc.
June 17, 2019
2
DISCUSSION OF FUND PERFORMANCE(Unaudited)
For the period from June 1, 2018 through May 31, 2019, as provided by portfolio allocation managers Stephen Kolano and Elena Goncharova
Market and Fund Performance Overview
For the 12-month period ended May 31, 2019, BNY Mellon Select Managers Small Cap Growth Fund’s (formerly, Dreyfus Select Managers Small Cap Growth Fund) Class A, Class C, Class I, and Class Y shares at NAV produced total returns of -3.11%, -3.71%, -2.88%, and -2.84%, respectively.1In comparison, the Russell 2000® Growth Index (the “Index”), the fund’s benchmark, returned -6.88% for the same period.2
Small-cap growth stocks lost ground over the reporting period despite steady economic growth and corporate earnings. The fund outperformed the Index, mainly due to successful asset allocation and strong security selections in the health care and information technology sectors.
The Fund’s Investment Approach
The fund seeks capital appreciation. To pursue its goal, the fund normally invests at least 80% of its net assets in the stocks of small-cap companies. The fund’s portfolio is constructed to have a growth tilt.
The fund uses a “multi-manager” approach by selecting various subadvisers to manage its assets. We may hire, terminate, or replace subadvisers and modify material terms and conditions of subadvisory arrangements without shareholder approval.
The fund’s assets are currently allocated to six subadvisers, each acting independently and using its own methodology to select portfolio investments. At the end of the reporting period, 10% of the fund’s assets were under the management of Redwood Investments, LLC, which employs a blend of quantitative and qualitative research to build growth and core equity portfolios; approximately 18% of the fund’s assets were under the management of Geneva Capital Management, which employs bottom-up fundamental analysis supplemented by top-down considerations to identify companies with a consistent, sustainable record of growth; approximately 16% of the fund’s assets were under the management of Nicholas Investment Partners, L.P., which uses a bottom-up approach to security selection, combining rigorous fundamental analysis with the discipline and objectivity of quantitative analytics; EAM Investors, LLC, which managed 21% of the fund’s assets, chooses investments through bottom-up fundamental analysis using a blend of a quantitative discovery process and a qualitative analysis process; approximately 10% of the fund’s assets were managed by Granite Investment Partners, LLC, which seeks attractively valued small-cap companies with catalysts for growth; and 25% of the fund’s assets were managed by Rice Hall James & Associates LLC, which seeks growing companies with high earnings growth, high or improving returns on invested capital, and sustainable competitive advantages. The percentages of the fund’s assets allocated to the various subadvisers can change over time, within ranges described in the prospectus.
Stocks Rebound on Shift in Federal Reserve Policy
The reporting period began amid steady economic growth and corporate earnings, assisted by the ongoing effects of tax reform in the U.S. This allowed the Federal Reserve (the
3
DISCUSSION OF FUND PERFORMANCE(Unaudited) (continued)
“Fed”) to continue raising interest rates and send signals that it would continue tightening in 2019. The Fed raised short-term interest rates three times during the reporting period, boosting the federal funds target rate to 2.25%-2.50%.
In the fourth quarter of 2018, however, markets experienced a surge in volatility, as investor sentiment shifted to “risk off.” Equities declined despite relatively robust economic growth. The shift in sentiment was driven largely by concern about the Fed’s plan to continue hiking short-term interest rates in 2019 amid more mixed economic data.
In December, the Fed shifted away from its hawkish stance on interest-rate increases, saying that rate hikes in 2019 would be “data-dependent.” The Fed also indicated that the reduction of its balance sheet would be completed by September 2019, implying the Fed would be satisfied with a larger-than-normal balance sheet, adding to the central bank’s more accommodative stance.
With this shift, stocks rallied late in 2018 and continued to rise in 2019. Early in 2019, the Fed’s stance remained unchanged, as inflation remained below its target rate of 2.0%, but markets began to anticipate a rate cut later in 2019.
Asset Allocation and Security Selections Boosted Fund Performance
The fund’s strong performance compared to the Index was mainly the result of strong asset allocation decisions and favorable stock selections by the fund’s underlying portfolio managers, especially in the health care and information technology sectors. Selections by Nicholas Investment Partners, L.P. in the health care sector proved especially beneficial. A position in Amarin, a pharmaceutical company, contributed positively to the fund’s results, as the stock price rose more than fourfold during the reporting period. Shares of CareDx, a molecular diagnostics company, also proved beneficial. Selections by EAM Investors, LLC and Redwood Investments, LLC, were additive to results as well. In the information technology sector, a position in Paycom Software, a software provider, and Fair Isaac, a financial technology company, performed well on better-than-expected earnings and raised guidance. Finally, an overweight to the industrials sector, as well as stock selection, also contributed positively to returns. For example, AAON, a provider of commercial heating and air conditioning systems, performed well on strong demand and strong earnings.
On the other hand, unfavorable stock selection constrained performance somewhat. In the communication services sector, the lack of exposure to Nexstar Media Group, an operator of local television stations, hindered results, as this company outperformed during the reporting period. Holdings of two telecommunications companies, ORBCOMM andpdvWireless, also detracted from results, as these companies’ financial results suffered from strong competition.
4
More Cautious Outlook
The economy is in the latter stages of the business cycle, and wages are continuing to rise, potentially putting greater pressure on corporate earnings. We anticipate that the market will continue to rotate from cyclical stocks, which performed well early in 2019, to more defensive sectors.
June 17, 2019
1 Total return includes reinvestment of dividends and any capital gains paid and does not take into consideration the maximum initial sales charge in the case of Class A shares, or the applicable contingent deferred sales charge imposed on redemptions in the case of Class C shares. Had these charges been reflected, returns would have been lower. Past performance is no guarantee of future results. Share price and investment return fluctuate such that upon redemption, fund shares may be worth more or less than their original cost. Return figures provided reflect the absorption of certain fund expenses by BNY Mellon Investment Adviser, Inc. pursuant to an undertaking in effect through September 30, 2019, at which time it may be extended, terminated, or modified. Had these expenses not been absorbed, the fund’s returns would have been lower.
2 Source: Lipper Inc. — The Russell 2000® Growth Index measures the performance of the small-cap growth segment of the U.S. equity universe. It includes those Russell 2000 companies with higher growth earning potential as defined by Russell’s leading style methodology. The Russell 2000® Growth Index is constructed to provide a comprehensive and unbiased barometer for the small-cap growth segment. The index is completely reconstituted annually to ensure larger stocks do not distort the performance and characteristics of the true small-cap opportunity set and that the represented companies continue to reflect growth characteristics. Investors cannot invest directly in any index.
Please note: the position in any security highlighted with italicized typeface was sold during the reporting period.
Equities are subject generally to market, market sector, market liquidity, issuer, and investment style risks, among other factors, to varying degrees, all of which are more fully described in the fund’s prospectus.
The prices of small company stocks tend to be more volatile than the prices of large company stocks, mainly because these companies have less established and more volatile earnings histories. They also tend to be less liquid than larger company stocks.
5
FUND PERFORMANCE(Unaudited)
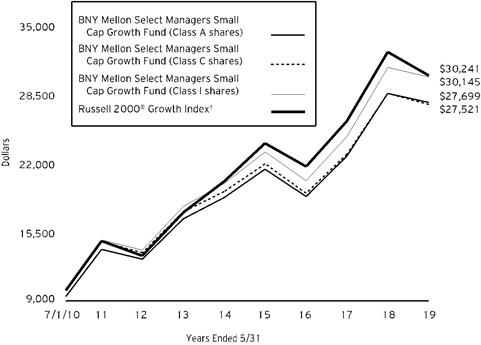
Comparison of change in value of $10,000 investment in Fund Class A shares, Class C shares and Class I shares of BNY Mellon Select Managers Small Cap Growth Fund with a hypothetical investment of $10,000 in the Russell 2000® Growth Index (the “Index”)
† Source: Lipper Inc.
Past performance is not predictive of future performance.
The above graph compares a hypothetical $10,000 investment made in Class A, Class C and Class I shares of BNY Mellon Select Managers Small Cap Growth Fund on 7/1/10 (inception date) to a hypothetical investment of $10,000 investment made in the Index on that date. All dividends and capital gain distributions are reinvested.
The fund’s performance shown in the line graph above takes into account the maximum initial sales charge on Class A shares and all other applicable fees and expenses on all classes. The Index measures the performance of the small-cap growth segment of the U.S. equity universe. It includes those Russell 2000 companies with higher growth earning potential as defined by Russell’s leading style methodology. The Index is constructed to provide a comprehensive and unbiased barometer for the small-cap growth segment. The Index is completely reconstituted annually to ensure larger stocks do not distort the performance and characteristics of the true small-cap opportunity set and that the represented companies continue to reflect growth characteristics. Unlike a mutual fund, the Index is not subject to charges, fees and other expenses. Investors cannot invest directly in any index. Further information relating to fund performance, including expense reimbursements, if applicable, is contained in the Financial Highlights section of the prospectus and elsewhere in this report.
6
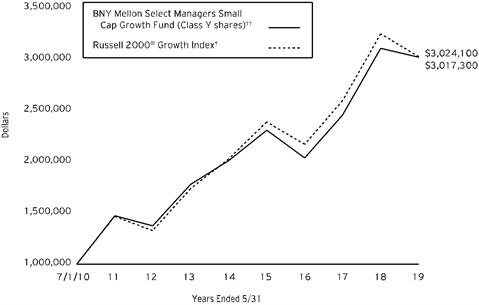
Comparison of change in value of $1,000,000 investment Class Y shares of BNY Mellon Select Managers Small Cap Growth Fund with a hypothetical investment of $1,000,000 in the Russell 2000® Growth Index (the “Index”)
† Source: Lipper Inc.
†† The total return figures presented for Class Y shares of the fund reflect the performance of the fund’s Class A shares for the period prior to 7/1/13 (the inception date for Class Y shares), not reflecting the applicable sales load for Class A shares.
Past performance is not predictive of future performance.
The above graph compares a hypothetical $1,000,000 investment made in Class Y shares of BNY Mellon Select Managers Small Cap Growth Fund on 7/1/10 (inception date) to a hypothetical investment of $1,000,000 made in the Index on that date. All dividends and capital gain distributions are reinvested.
The fund’s performance shown in the line graph above takes into account all applicable fees and expenses of the fund’s Class Y shares. The Index measures the performance of the small-cap growth segment of the U.S. equity universe. It includes those Russell 2000 companies with higher growth earning potential as defined by Russell’s leading style methodology. The Index is constructed to provide a comprehensive and unbiased barometer for the small-cap growth segment. The Index is completely reconstituted annually to ensure larger stocks do not distort the performance and characteristics of the true small-cap opportunity set and that the represented companies continue to reflect growth characteristics. Unlike a mutual fund, the Index is not subject to charges, fees and other expenses. Investors cannot invest directly in any index. Further information relating to fund performance, including expense reimbursements, if applicable, is contained in the Financial Highlights section of the prospectus and elsewhere in this report.
7
FUND PERFORMANCE(Unaudited) (continued)
| | | | | |
Average Annual Total Returns as of 5/31/19 |
| | Inception Date | 1 Year | 5 Years | From
Inception |
Class A shares | | | | |
with maximum sales charge (5.75%) | 7/1/10 | -8.69% | 6.84% | 12.10% |
without sales charge | 7/1/10 | -3.11% | 8.12% | 12.84% |
Class C shares | | | | |
with applicable redemption charge† | 7/1/10 | -4.49% | 7.33% | 12.02% |
without redemption | 7/1/10 | -3.71% | 7.33% | 12.02% |
Class I shares | 7/1/10 | -2.88% | 8.43% | 13.17% |
Class Y shares | 7/1/13 | -2.84% | 8.46% | 13.18%†† |
Russell 2000® Growth Index | 6/30/10 | -6.88% | 8.32% | 13.93%††† |
† The maximum contingent deferred sales charge for Class C shares is 1% for shares redeemed within one year of the date of purchase.
†† The total return performance figures presented for Class Y shares of the fund reflect the performance of the fund’s Class A shares for the period prior to 7/1/13 (the inception date for Class Y shares), not reflecting the applicable sales load for Class A shares.
††† For comparative purposes, the value of the Index as of 6/30/10 is used as the beginning value on 7/1/10.
The performance data quoted represents past performance, which is no guarantee of future results. Share price and investment return fluctuate and an investor’s shares may be worth more or less than original cost upon redemption. Current performance may be lower or higher than the performance quoted. Go to im.bnymellon.com for the fund’s most recent month-end returns.
The fund’s performance shown in the graphs and table does not reflect the deduction of taxes that a shareholder would pay on fund distributions or the redemption of fund shares. In addition to the performance of Class A shares shown with and without a maximum sales charge, the fund's performance shown in the table takes into account all other applicable fees and expenses on all classes.
8
UNDERSTANDING YOUR FUND’S EXPENSES(Unaudited)
As a mutual fund investor, you pay ongoing expenses, such as management fees and other expenses. Using the information below, you can estimate how these expenses affect your investment and compare them with the expenses of other funds. You also may pay one-time transaction expenses, including sales charges (loads) and redemption fees, which are not shown in this section and would have resulted in higher total expenses. For more information, see your fund’s prospectus or talk to your financial adviser.
Review your fund’s expenses
The table below shows the expenses you would have paid on a $1,000 investment in BNY Mellon Select Managers Small Cap Growth Fund from December 1, 2018 to May 31, 2019. It also shows how much a $1,000 investment would be worth at the close of the period, assuming actual returns and expenses.
| | | | | | | | | |
Expenses and Value of a $1,000 Investment |
assuming actual returns for the six months ended May 31, 2019 |
| |
| | Class A | Class C | Class I | Class Y |
Expenses paid per $1,000† | | $6.48 | | $10.21 | | $4.79 | | $4.74 |
Ending value (after expenses) | | $1,000.80 | | $998.10 | | $1,001.20 | | $1,001.60 |
COMPARING YOUR FUND’S EXPENSES
WITH THOSE OF OTHER FUNDS(Unaudited)
Using the SEC’s method to compare expenses
The Securities and Exchange Commission (“SEC”) has established guidelines to help investors assess fund expenses. Per these guidelines, the table below shows your fund’s expenses based on a $1,000 investment, assuming a hypothetical 5% annualized return. You can use this information to compare the ongoing expenses (but not transaction expenses or total cost) of investing in the fund with those of other funds. All mutual fund shareholder reports will provide this information to help you make this comparison. Please note that you cannot use this information to estimate your actual ending account balance and expenses paid during the period.
| | | | | | | | | |
Expenses and Value of a $1,000 Investment |
assuming a hypothetical 5% annualized return for the six months ended May 31, 2019 |
| |
| | Class A | Class C | Class I | Class Y |
Expenses paid per $1,000† | | $6.54 | | $10.30 | | $4.84 | | $4.78 |
Ending value (after expenses) | | $1,018.45 | | $1,014.71 | | $1,020.14 | | $1,020.19 |
† Expenses are equal to the fund’s annualized expense ratio of 1.30% for Class A, 2.05% for Class C, .96% for Class I and .95% for Class Y, multiplied by the average account value over the period, multiplied by 182/365 (to reflect the one-half year period).
9
STATEMENT OF INVESTMENTS
May 31, 2019
| | | | | | | | |
| |
Description | | | | Shares | | Value ($) | |
Common Stocks - 96.1% | | | | | |
Automobiles & Components - 1.7% | | | | | |
Dorman Products | | | | 21,525 | a,b | 1,757,731 | |
Fox Factory Holding | | | | 46,870 | a,b | 3,141,228 | |
LCI Industries | | | | 39,522 | a | 3,275,188 | |
Stoneridge | | | | 35,847 | b | 933,097 | |
| | | | | 9,107,244 | |
Banks - 2.5% | | | | | |
Axos Financial | | | | 134,417 | a,b | 3,670,928 | |
Bank OZK | | | | 54,615 | a | 1,578,373 | |
Central Pacific Financial | | | | 27,019 | | 750,858 | |
Columbia Banking System | | | | 18,689 | | 623,278 | |
Federal Agricultural Mortgage Corp., CI. C | | | | 13,825 | | 946,045 | |
LendingTree | | | | 1,572 | b | 590,663 | |
NMI Holdings, Cl. A | | | | 33,612 | b | 916,263 | |
Pacific Premier Bancorp | | | | 48,557 | | 1,374,163 | |
Seacoast Banking Corporation of Florida | | | | 27,074 | b | 627,846 | |
Texas Capital Bancshares | | | | 25,160 | b | 1,441,668 | |
Western Alliance Bancorp | | | | 19,198 | b | 789,998 | |
| | | | | 13,310,083 | |
Capital Goods - 9.4% | | | | | |
AAON | | | | 59,822 | a | 2,715,321 | |
Advanced Energy Industries | | | | 25,284 | b | 1,268,498 | |
Alarm.com Holdings | | | | 47,728 | a,b | 2,783,019 | |
Albany International | | | | 10,888 | | 762,922 | |
Arcosa | | | | 23,565 | | 798,618 | |
Armstrong World Industries | | | | 26,269 | | 2,330,060 | |
Barnes Group | | | | 27,430 | | 1,418,680 | |
Bloom Energy | | | | 63,358 | | 684,266 | |
Chart Industries | | | | 44,627 | b | 3,419,768 | |
Cubic | | | | 17,741 | | 1,000,947 | |
Donaldson | | | | 42,732 | a | 2,027,633 | |
Encore Wire | | | | 16,308 | | 813,932 | |
Enphase Energy | | | | 57,382 | a,b | 870,485 | |
EnPro Industries | | | | 15,008 | | 832,794 | |
Federal Signal | | | | 31,693 | | 757,146 | |
Generac Holdings | | | | 12,944 | b | 713,862 | |
Great Lakes Dredge and Dock | | | | 80,579 | b | 857,361 | |
Harsco | | | | 41,307 | b | 1,032,675 | |
Kornit Digital | | | | 15,457 | a,b | 438,515 | |
Kratos Defense & Security Solutions | | | | 123,417 | a,b | 2,721,345 | |
Masonite International | | | | 52,867 | b | 2,513,826 | |
10
| | | | | | | | |
| |
Description | | | | Shares | | Value ($) | |
Common Stocks - 96.1% (continued) | | | | | |
Capital Goods - 9.4% (continued) | | | | | |
Mercury Systems | | | | 32,289 | b | 2,220,192 | |
Meritor | | | | 35,690 | b | 719,510 | |
Middleby | | | | 8,683 | a,b | 1,132,871 | |
Moog, Cl. A | | | | 9,043 | | 745,324 | |
MSC Industrial Direct, Cl. A | | | | 16,569 | | 1,170,766 | |
PGT Innovations | | | | 98,196 | b | 1,469,012 | |
Proto Labs | | | | 15,112 | b | 1,516,489 | |
RBC Bearings | | | | 18,969 | b | 2,699,289 | |
SiteOne Landscape Supply | | | | 40,365 | a,b | 2,618,477 | |
Timken | | | | 37,393 | | 1,645,666 | |
Trex | | | | 38,881 | a,b | 2,325,861 | |
Woodward | | | | 11,159 | | 1,215,438 | |
| | | | | 50,240,568 | |
Commercial & Professional Services - 3.2% | | | | | |
Aaron's | | | | 14,398 | | 766,837 | |
AMN Healthcare Services | | | | 8,116 | b | 393,139 | |
Booz Allen Hamilton Holding | | | | 9,690 | | 612,117 | |
Casella Waste Systems, CI. A | | | | 24,619 | b | 953,248 | |
CBIZ | | | | 53,637 | b | 1,062,013 | |
Cimpress | | | | 22,489 | b | 1,967,787 | |
Evo Payments | | | | 20,766 | b | 611,351 | |
Exponent | | | | 52,573 | | 2,946,717 | |
Franklin Covey | | | | 20,726 | b | 644,579 | |
FTI Consulting | | | | 10,645 | b | 893,328 | |
Healthcare Services Group | | | | 34,319 | a | 1,084,824 | |
Insperity | | | | 7,563 | | 861,426 | |
McGrath RentCorp | | | | 5,776 | | 324,784 | |
Tetra Tech | | | | 10,513 | | 709,838 | |
The Brink's Company | | | | 11,620 | | 894,740 | |
TriNet Group | | | | 13,827 | b | 876,355 | |
Willdan Group | | | | 50,165 | a,b | 1,561,135 | |
| | | | | 17,164,218 | |
Consumer Durables & Apparel - 1.7% | | | | | |
Callaway Golf | | | | 138,749 | a | 2,039,610 | |
Clarus | | | | 72,092 | | 919,173 | |
Deckers Outdoor | | | | 7,440 | b | 1,131,624 | |
Helen of Troy | | | | 5,968 | a,b | 797,384 | |
Lovesac Co/The | | | | 33,444 | | 1,205,656 | |
Skyline Champion | | | | 47,181 | | 1,103,564 | |
Steven Madden | | | | 32,173 | | 973,555 | |
YETI Holdings | | | | 36,959 | a | 884,059 | |
| | | | | 9,054,625 | |
11
STATEMENT OF INVESTMENTS (continued)
| | | | | | | | |
| |
Description | | | | Shares | | Value ($) | |
Common Stocks - 96.1% (continued) | | | | | |
Consumer Services - 7.8% | | | | | |
Acushnet Holdings | | | | 43,276 | a | 1,016,553 | |
BJ's Restaurants | | | | 6,106 | | 255,780 | |
Bright Horizons Family Solutions | | | | 32,992 | b | 4,521,883 | |
Career Education | | | | 43,206 | b | 810,977 | |
Century Casinos | | | | 141,524 | b | 1,236,920 | |
Cheesecake Factory | | | | 40,439 | a | 1,748,987 | |
Chegg | | | | 77,842 | a,b | 2,915,961 | |
Dave & Buster's Entertainment | | | | 95,007 | a | 4,725,649 | |
Denny's | | | | 55,001 | b | 1,082,420 | |
Everi Holdings | | | | 81,678 | b | 909,893 | |
frontdoor | | | | 43,324 | b | 1,742,058 | |
Grand Canyon Education | | | | 14,869 | b | 1,782,199 | |
Papa John's International | | | | 23,239 | a | 1,126,394 | |
Planet Fitness, Cl. A | | | | 37,510 | b | 2,868,389 | |
Red Rock Resorts, CI. A | | | | 15,425 | | 322,074 | |
ServiceMaster Global Holdings | | | | 17,019 | b | 919,026 | |
Six Flags Entertainment | | | | 12,158 | | 600,119 | |
Strategic Education | | | | 34,902 | | 6,142,403 | |
Texas Roadhouse | | | | 33,747 | | 1,729,871 | |
Vail Resorts | | | | 11,317 | a | 2,434,400 | |
Wendy's | | | | 58,793 | a | 1,081,203 | |
Wingstop | | | | 20,498 | | 1,633,281 | |
| | | | | 41,606,440 | |
Diversified Financials - 1.9% | | | | | |
Capstead Mortgage | | | | 90,236 | c | 713,767 | |
FirstCash | | | | 8,801 | | 833,631 | |
Focus Financial Partners, CI. A | | | | 19,818 | | 555,895 | |
Green Dot, Cl. A | | | | 10,672 | b | 495,288 | |
Hercules Capital | | | | 77,282 | | 986,118 | |
Legg Mason | | | | 28,089 | | 1,000,530 | |
LPL Financial Holdings | | | | 10,866 | | 871,671 | |
MarketAxess Holdings | | | | 12,254 | | 3,649,486 | |
Moelis & Co., Cl. A | | | | 26,667 | | 847,477 | |
| | | | | 9,953,863 | |
Energy - .8% | | | | | |
DMC Global | | | | 13,022 | a | 880,808 | |
Matador Resources | | | | 86,577 | b | 1,423,326 | |
Newpark Resources | | | | 67,415 | a,b | 471,231 | |
Oceaneering International | | | | 58,216 | b | 954,742 | |
ProPetro Holding | | | | 28,206 | b | 547,761 | |
| | | | | 4,277,868 | |
Food & Staples Retailing - .3% | | | | | |
Chefs' Warehouse | | | | 24,619 | b | 779,684 | |
12
| | | | | | | | |
| |
Description | | | | Shares | | Value ($) | |
Common Stocks - 96.1% (continued) | | | | | |
Food & Staples Retailing - .3% (continued) | | | | | |
Performance Food Group | | | | 25,025 | b | 984,734 | |
| | | | | 1,764,418 | |
Food, Beverage & Tobacco - 2.4% | | | | | |
Farmer Brothers | | | | 27,096 | b | 496,399 | |
Freshpet | | | | 51,975 | b | 2,415,278 | |
Hostess Brands | | | | 74,720 | b | 1,000,501 | |
J&J Snack Foods | | | | 14,445 | a | 2,323,478 | |
Nomad Foods | | | | 102,528 | b | 2,175,644 | |
Simply Good Foods | | | | 212,626 | b | 4,569,333 | |
| | | | | 12,980,633 | |
Health Care Equipment & Services - 10.8% | | | | | |
Axonics Modulation Technologies | | | | 20,177 | a | 663,016 | |
Cantel Medical | | | | 28,636 | | 1,968,439 | |
CryoPort | | | | 45,127 | a,b | 754,523 | |
Ensign Group | | | | 13,753 | | 732,485 | |
Glaukos | | | | 20,161 | b | 1,299,981 | |
Globus Medical, Cl. A | | | | 38,081 | b | 1,496,583 | |
Guardant Health | | | | 17,147 | | 1,318,261 | |
HealthEquity | | | | 30,176 | b | 1,972,303 | |
HealthStream | | | | 33,973 | b | 849,325 | |
Heska | | | | 9,928 | b | 695,953 | |
Inspire Medical Systems | | | | 12,511 | b | 706,496 | |
Insulet | | | | 8,083 | a,b | 887,433 | |
LeMaitre Vascular | | | | 33,922 | a | 875,527 | |
LHC Group | | | | 17,283 | b | 1,957,819 | |
Masimo | | | | 30,240 | b | 3,953,578 | |
Medidata Solutions | | | | 72,368 | a,b | 6,596,344 | |
Merit Medical Systems | | | | 14,461 | b | 746,621 | |
Neogen | | | | 34,033 | b | 1,917,760 | |
Nevro | | | | 12,166 | a,b | 719,132 | |
Novocure | | | | 58,736 | b | 3,120,056 | |
Omnicell | | | | 54,783 | b | 4,352,509 | |
Penumbra | | | | 4,176 | b | 595,915 | |
PetIQ | | | | 54,227 | b | 1,422,374 | |
Premier, Cl. A | | | | 122,676 | b | 4,508,343 | |
R1 RCM | | | | 69,509 | b | 816,036 | |
Shockwave Medical | | | | 10,768 | | 643,819 | |
Silk Road Medical | | | | 6,107 | | 260,525 | |
Tabula Rasa HealthCare | | | | 12,778 | a,b | 577,182 | |
Tactile Systems Technology, CI. I | | | | 42,827 | a,b | 2,056,981 | |
Tandem Diabetes Care | | | | 14,057 | b | 963,748 | |
Teladoc Health | | | | 15,041 | b | 874,183 | |
Teleflex | | | | 12,609 | | 3,635,175 | |
13
STATEMENT OF INVESTMENTS (continued)
| | | | | | | | |
| |
Description | | | | Shares | | Value ($) | |
Common Stocks - 96.1% (continued) | | | | | |
Health Care Equipment & Services - 10.8% (continued) | | | | | |
Vapotherm | | | | 22,880 | | 384,842 | |
ViewRay | | | | 47,167 | a,b | 396,203 | |
Vocera Communications | | | | 71,887 | a,b | 2,326,263 | |
Wright Medical Group | | | | 20,020 | a,b | 615,014 | |
| | | | | 57,660,747 | |
Household & Personal Products - .6% | | | | | |
Inter Parfums | | | | 23,673 | | 1,533,536 | |
Medifast | | | | 11,113 | | 1,433,021 | |
WD-40 | | | | 2,427 | | 379,413 | |
| | | | | 3,345,970 | |
Insurance - 1.7% | | | | | |
eHealth | | | | 9,183 | b | 647,952 | |
Goosehead Insurance, CI. A | | | | 21,485 | b | 786,996 | |
James River Group Holdings, CI. L | | | | 18,871 | | 841,647 | |
Kemper | | | | 29,659 | | 2,461,400 | |
Kinsale Captial Group | | | | 42,151 | | 3,531,833 | |
ProAssurance | | | | 15,374 | | 576,832 | |
| | | | | 8,846,660 | |
Materials - 2.1% | | | | | |
Balchem | | | | 20,461 | | 1,855,608 | |
Carpenter Technology | | | | 25,749 | | 1,044,379 | |
Ingevity | | | | 41,744 | b | 3,660,949 | |
Kaiser Aluminum | | | | 8,779 | | 782,384 | |
Materion | | | | 21,708 | | 1,312,249 | |
Neenah | | | | 13,980 | | 799,097 | |
Sensient Technologies | | | | 22,302 | a | 1,509,845 | |
| | | | | 10,964,511 | |
Media & Entertainment - 1.6% | | | | | |
Cardlytics | | | | 18,995 | b | 435,935 | |
Criteo, ADR | | | | 67,896 | b | 1,246,571 | |
Nexstar Media Group, Cl. A | | | | 7,594 | | 760,539 | |
QuinStreet | | | | 29,169 | a,b | 447,161 | |
Rosetta Stone | | | | 36,272 | b | 894,468 | |
Scholastic | | | | 21,363 | | 706,902 | |
Sinclair Broadcast Group, Cl. A | | | | 18,836 | | 1,011,116 | |
The New York Times, Cl. A | | | | 51,136 | | 1,627,147 | |
Zynga, CI. A | | | | 183,701 | b | 1,155,479 | |
| | | | | 8,285,318 | |
Pharmaceuticals Biotechnology & Life Sciences - 12.7% | | | | | |
Aclaris Therapeutics | | | | 33,054 | b | 154,693 | |
Aerie Pharmaceuticals | | | | 49,312 | a,b | 1,795,943 | |
Aimmune Therapeutics | | | | 33,816 | a,b | 661,779 | |
Akebia Therapeutics | | | | 83,153 | a,b | 370,031 | |
14
| | | | | | | | |
| |
Description | | | | Shares | | Value ($) | |
Common Stocks - 96.1% (continued) | | | | | |
Pharmaceuticals Biotechnology & Life Sciences - 12.7% (continued) | | | | | |
Amarin, ADR | | | | 50,111 | a,b | 888,468 | |
Arena Pharmaceuticals | | | | 14,496 | b | 768,433 | |
Argenx, ADR | | | | 7,179 | a,b | 887,540 | |
Arqule | | | | 122,918 | b | 883,780 | |
Array BioPharma | | | | 61,738 | a,b | 1,631,118 | |
Axsome Therapeutics | | | | 37,646 | a,b | 864,352 | |
BioDelivery Sciences International | | | | 149,969 | b | 650,865 | |
Biohaven Pharmaceutical Holding | | | | 36,486 | b | 2,059,999 | |
BioSpecifics Technologies | | | | 22,034 | b | 1,303,311 | |
Bio-Techne | | | | 15,572 | | 3,084,035 | |
Blueprint Medicines | | | | 10,822 | b | 822,472 | |
Cambrex | | | | 26,583 | a,b | 1,058,003 | |
CareDx | | | | 15,497 | b | 490,015 | |
Clovis Oncology | | | | 15,640 | b | 231,159 | |
Coherus Biosciences | | | | 37,708 | a,b | 712,681 | |
Collegium Pharmaceutical | | | | 56,557 | b | 650,971 | |
Dermira | | | | 55,895 | a,b | 522,059 | |
Eidos Therapeutics | | | | 20,668 | a | 645,048 | |
Emergent BioSolutions | | | | 70,918 | b | 2,831,047 | |
Evolus | | | | 24,460 | a,b | 332,656 | |
Exact Sciences | | | | 7,292 | a,b | 755,670 | |
Fluidigm | | | | 59,890 | b | 783,960 | |
Global Blood Therapeutics | | | | 13,008 | a,b | 790,626 | |
Gossamer Bio | | | | 20,703 | | 379,072 | |
GW Pharmaceuticals, ADR | | | | 7,926 | b | 1,373,100 | |
Halozyme Therapeutics | | | | 61,215 | b | 902,921 | |
Horizon Therapeutics | | | | 82,507 | b | 1,966,141 | |
Immunomedics | | | | 100,593 | b | 1,314,751 | |
Insmed | | | | 44,682 | a,b | 1,081,751 | |
Intersect ENT | | | | 24,437 | b | 576,224 | |
Iovance Biotherapeutics | | | | 43,713 | b | 714,708 | |
Krystal Biotech | | | | 21,510 | b | 675,844 | |
Ligand Pharmaceuticals | | | | 40,685 | a,b | 4,368,755 | |
Medpace Holdings | | | | 5,874 | b | 317,079 | |
Mirati Therapeutics | | | | 9,021 | b | 611,534 | |
MyoKardia | | | | 15,223 | a,b | 709,087 | |
Myriad Genetics | | | | 67,129 | a,b | 1,662,785 | |
NanoString Technologies | | | | 31,650 | b | 900,126 | |
Nektar Therapeutics | | | | 47,263 | a,b | 1,480,277 | |
NeoGenomics | | | | 191,653 | a,b | 4,160,786 | |
Optinose | | | | 78,756 | a,b | 597,758 | |
Pacira Biosciences | | | | 33,170 | b | 1,443,227 | |
15
STATEMENT OF INVESTMENTS (continued)
| | | | | | | | |
| |
Description | | | | Shares | | Value ($) | |
Common Stocks - 96.1% (continued) | | | | | |
Pharmaceuticals Biotechnology & Life Sciences - 12.7% (continued) | �� | | | | |
Prestige Consumer Healthcare | | | | 48,061 | a,b | 1,395,211 | |
Progenics Pharmaceuticals | | | | 159,635 | a,b | 668,871 | |
Puma Biotechnology | | | | 32,246 | b | 476,918 | |
Ra Pharmaceuticals | | | | 27,957 | b | 604,710 | |
Reata Pharmaceuticals, CI. A | | | | 23,097 | b | 1,969,481 | |
Repligen | | | | 31,583 | b | 2,194,071 | |
Revance Therapeutics | | | | 20,664 | b | 222,551 | |
SAGE Therapeutics | | | | 5,557 | a,b | 955,082 | |
Sarepta Therapeutics | | | | 5,249 | a,b | 597,599 | |
Supernus Pharmaceuticals | | | | 98,567 | a,b | 2,959,967 | |
Tricida | | | | 18,246 | a | 670,358 | |
Turning Point Therapeutics | | | | 14,069 | a | 489,883 | |
uniQure | | | | 12,744 | a,b | 755,847 | |
Veracyte | | | | 44,723 | b | 1,013,423 | |
Vericel | | | | 29,860 | b | 467,309 | |
Viking Therapeutics | | | | 76,544 | a,b | 588,623 | |
| | | | | 67,896,544 | |
Real Estate - 2.4% | | | | | |
Agree Realty | | | | 8,381 | a,c | 561,108 | |
Americold Realty Trust | | | | 60,273 | c | 1,886,545 | |
CareTrust | | | | 37,822 | c | 919,453 | |
Innovative Industrial Properties | | | | 14,200 | a,c | 1,193,226 | |
Marcus & Millichap | | | | 22,383 | a,b | 683,577 | |
Monmouth Real Estate Investment | | | | 62,689 | c | 873,885 | |
NexPoint Residential Trust | | | | 16,978 | c | 680,478 | |
QTS Realty Trust, Cl. A | | | | 22,244 | c | 1,027,005 | |
RE/MAX Holdings, Cl. A | | | | 24,192 | | 716,567 | |
Retail Opportunity Investments | | | | 51,400 | c | 860,436 | |
Terreno Realty | | | | 78,059 | c | 3,568,077 | |
| | | | | 12,970,357 | |
Retailing - 4.3% | | | | | |
America's Car-Mart | | | | 9,104 | b | 783,854 | |
At Home | | | | 54,367 | b | 1,035,691 | |
Beacon Roofing Supply | | | | 20,017 | b | 691,788 | |
Etsy | | | | 26,832 | b | 1,671,902 | |
Five Below | | | | 12,528 | b | 1,612,730 | |
Lithia Motors, Cl. A | | | | 5,600 | | 639,240 | |
Monro | | | | 7,386 | a | 588,738 | |
Ollie's Bargain Outlet Holdings | | | | 33,634 | a,b | 3,320,349 | |
Points International | | | | 39,959 | b | 477,510 | |
Pool | | | | 25,692 | a | 4,618,908 | |
Rent-A-Center | | | | 34,885 | b | 832,356 | |
16
| | | | | | | | |
| |
Description | | | | Shares | | Value ($) | |
Common Stocks - 96.1% (continued) | | | | | |
Retailing - 4.3% (continued) | | | | | |
Rubicon Project | | | | 100,617 | b | 553,394 | |
Shutterfly | | | | 66,975 | a,b | 3,179,973 | |
Shutterstock | | | | 61,216 | a,b | 2,329,881 | |
Zumiez | | | | 27,371 | a,b | 541,398 | |
| | | | | 22,877,712 | |
Semiconductors & Semiconductor Equipment - 3.9% | | | | | |
Brooks Automation | | | | 25,651 | a | 910,354 | |
CEVA | | | | 108,115 | b | 2,468,265 | |
Cree | | | | 9,689 | a,b | 534,251 | |
Cypress Semiconductor | | | | 255,698 | | 4,556,538 | |
Inphi | | | | 46,319 | a,b | 2,032,478 | |
Lattice Semiconductor | | | | 100,252 | b | 1,283,226 | |
MKS Instruments | | | | 6,441 | | 460,274 | |
Monolithic Power Systems | | | | 31,202 | | 3,633,474 | |
ON Semiconductor | | | | 71,020 | b | 1,261,315 | |
Semtech | | | | 82,169 | b | 3,272,791 | |
Universal Display | | | | 4,084 | | 600,062 | |
| | | | | 21,013,028 | |
Software & Services - 18.6% | | | | | |
ACI Worldwide | | | | 75,717 | b | 2,382,057 | |
Altair Engineering | | | | 9,284 | b | 353,813 | |
Alteryx, Cl. A | | | | 13,988 | a,b | 1,214,997 | |
Anaplan | | | | 22,719 | | 988,504 | |
AppFolio, Cl. A | | | | 17,159 | a,b | 1,654,128 | |
Aspen Technology | | | | 6,207 | b | 705,177 | |
Avalara | | | | 28,393 | a | 1,920,502 | |
Blackbaud | | | | 23,287 | | 1,791,236 | |
BlackLine | | | | 34,757 | a,b | 1,786,858 | |
Bottomline Technologies | | | | 42,795 | b | 1,869,286 | |
Box, Cl. A | | | | 21,922 | b | 405,338 | |
CACI International, Cl. A | | | | 17,047 | b | 3,469,406 | |
Carbonite | | | | 11,327 | b | 268,110 | |
Coupa Software | | | | 10,319 | a,b | 1,126,938 | |
Descartes Systems Group | | | | 79,129 | b | 3,173,073 | |
Envestnet | | | | 47,598 | b | 3,184,782 | |
Euronet Worldwide | | | | 15,629 | b | 2,423,120 | |
Everbridge | | | | 41,272 | b | 3,245,630 | |
ExlService Holdings | | | | 28,334 | b | 1,679,073 | |
Fair Isaac | | | | 14,827 | b | 4,387,310 | |
Five9 | | | | 51,333 | a,b | 2,635,950 | |
ForeScout Technologies | | | | 30,058 | b | 965,463 | |
Genpact | | | | 23,266 | | 841,066 | |
HubSpot | | | | 7,645 | b | 1,324,726 | |
17
STATEMENT OF INVESTMENTS (continued)
| | | | | | | | |
| |
Description | | | | Shares | | Value ($) | |
Common Stocks - 96.1% (continued) | | | | | |
Software & Services - 18.6% (continued) | | | | | |
j2 Global | | | | 39,652 | a | 3,342,267 | |
LivePerson | | | | 117,233 | b | 3,262,594 | |
Liveramp Holdings | | | | 10,202 | b | 524,179 | |
Manhattan Associates | | | | 13,712 | a,b | 897,725 | |
ManTech International, Cl. A | | | | 15,590 | | 956,758 | |
MAXIMUS | | | | 37,409 | | 2,665,391 | |
Mimecast | | | | 8,469 | b | 384,493 | |
MiX Telematics, ADR | | | | 45,479 | | 726,754 | |
MongoDB | | | | 3,945 | a,b | 553,641 | |
New Relic | | | | 4,252 | b | 426,561 | |
Paycom Software | | | | 17,366 | a,b | 3,683,329 | |
Paylocity Holding | | | | 10,132 | b | 1,015,429 | |
Pegasystems | | | | 13,104 | | 945,323 | |
Perficient | | | | 27,235 | b | 828,761 | |
Pluralsight, CI. A | | | | 25,738 | b | 820,013 | |
PROS Holdings | | | | 19,430 | b | 1,101,681 | |
Q2 Holdings | | | | 33,778 | a,b | 2,473,901 | |
Rapid7 | | | | 37,164 | b | 1,941,818 | |
RingCentral, Cl. A | | | | 5,856 | b | 701,842 | |
ShotSpotter | | | | 10,950 | b | 503,700 | |
SPS Commerce | | | | 6,926 | b | 705,967 | |
Svmk | | | | 46,333 | | 796,928 | |
Telaria | | | | 140,870 | b | 1,056,525 | |
Trade Desk, Cl. A | | | | 26,296 | a,b | 5,227,908 | |
Tyler Technologies | | | | 9,540 | b | 2,035,359 | |
Upland Software | | | | 48,974 | b | 2,291,493 | |
Verint Systems | | | | 14,182 | b | 804,828 | |
Verra Mobility | | | | 66,794 | a,b | 933,780 | |
Virtusa | | | | 10,547 | b | 447,193 | |
Wix.com | | | | 34,867 | a,b | 4,788,634 | |
WNS Holdings, ADR | | | | 68,769 | b | 3,805,676 | |
Workiva | | | | 39,251 | b | 2,183,926 | |
Zendesk | | | | 6,956 | b | 586,043 | |
Zix | | | | 72,408 | b | 648,776 | |
Zscaler | | | | 15,400 | a,b | 1,056,902 | |
Zuora, Cl. A | | | | 30,994 | a,b | 433,606 | |
| | | | | 99,356,247 | |
Technology Hardware & Equipment - 2.3% | | | | | |
Acacia Communications | | | | 11,346 | b | 528,724 | |
CalAmp | | | | 64,175 | b | 652,018 | |
Cray | | | | 44,117 | a,b | 1,544,536 | |
Electronics For Imaging | | | | 11,656 | b | 427,192 | |
ePlus | | | | 21,461 | b | 1,516,434 | |
18
| | | | | | | | |
| |
Description | | | | Shares | | Value ($) | |
Common Stocks - 96.1% (continued) | | | | | |
Technology Hardware & Equipment - 2.3% (continued) | | | | | |
Insight Enterprises | | | | 10,465 | b | 538,738 | |
Ituran Location and Control | | | | 15,485 | | 481,738 | |
Knowles | | | | 78,950 | a,b | 1,241,883 | |
Napco Security Technologies | | | | 31,484 | b | 841,252 | |
Novanta | | | | 22,232 | b | 1,779,005 | |
Rogers | | | | 6,161 | b | 850,157 | |
ViaSat | | | | 10,921 | b | 950,455 | |
Viavi Solutions | | | | 99,657 | b | 1,200,867 | |
| | | | | 12,552,999 | |
Telecommunication Services - .9% | | | | | |
Bandwidth, Cl. A | | | | 10,541 | b | 764,960 | |
Boingo Wireless | | | | 164,088 | b | 3,101,264 | |
ORBCOMM | | | | 86,371 | a,b | 576,958 | |
Pareteum | | | | 154,992 | a,b | 607,569 | |
| | | | | 5,050,751 | |
Transportation - 2.1% | | | | | |
Allegiant Travel | | | | 13,826 | | 1,937,161 | |
Echo Global Logistics | | | | 81,616 | b | 1,605,387 | |
Genesee & Wyoming, Cl. A | | | | 17,588 | b | 1,674,729 | |
Hub Group, Cl. A | | | | 19,530 | b | 760,889 | |
Marten Transport | | | | 125,820 | | 2,216,948 | |
SkyWest | | | | 34,518 | | 2,026,897 | |
XPO Logistics | | | | 16,837 | a,b | 877,039 | |
| | | | | 11,099,050 | |
Utilities - .4% | | | | | |
American States Water | | | | 17,309 | a | 1,262,518 | |
Sjw Group | | | | 16,127 | | 993,907 | |
| | | | | 2,256,425 | |
Total Common Stocks(cost $392,262,179) | | | | 513,636,279 | |
| | | 1-Day
Yield (%) | | | | | |
Investment Companies - 4.2% | | | | | |
Registered Investment Companies - 4.2% | | | | | |
Dreyfus Institutional Preferred Government Plus Money Market Fund
(cost $22,159,636) | | 2.40 | | 22,159,636 | d | 22,159,636 | |
19
STATEMENT OF INVESTMENTS (continued)
| | | | | | | | |
| |
Description | | 1-Day
Yield(%) | | Shares | | Value ($) | |
Investment of Cash Collateral for Securities Loaned - 1.6% | | | | | |
Registered Investment Companies - 1.6% | | | | | |
Dreyfus Institutional Preferred Government Plus Money Market Fund
(cost $8,554,144) | | 2.40 | | 8,554,144 | d | 8,554,144 | |
Total Investments(cost $422,975,959) | | 101.9% | | 544,350,059 | |
Liabilities, Less Cash and Receivables | | (1.9%) | | (9,980,312) | |
Net Assets | | 100.0% | | 534,369,747 | |
ADR—American Depository Receipt
a Security, or portion thereof, on loan. At May 31, 2019, the value of the fund’s securities on loan was $118,618,081 and the value of the collateral held by the fund was $123,126,159, consisting of cash collateral of $8,554,144 and U.S. Government & Agency securities valued at $114,572,015.
b Non-income producing security.
c Investment in real estate investment trust within the United States.
d Investment in affiliated issuer. The investment objective of this investment company is publicly available and can be found within the investment company’s prospectus.
| | |
Portfolio Summary (Unaudited)† | Value (%) |
Information Technology | 24.9 |
Health Care | 23.5 |
Consumer Discretionary | 14.4 |
Industrials | 14.1 |
Financials | 6.1 |
Investment Companies | 5.8 |
Consumer Staples | 3.4 |
Communication Services | 2.5 |
Real Estate | 2.3 |
Materials | 1.7 |
Consumer, Cyclical | 1.3 |
Energy | .8 |
Utilities | .4 |
Consumer, Non-Cyclical | .4 |
Basic Materials | .3 |
| | 101.9 |
† Based on net assets.
See notes to financial statements.
20
STATEMENT OF INVESTMENTS IN AFFILIATED ISSUERS
| | | | | | | |
Investment Companies | Value
5/31/18($) | Purchases($) | Sales($) | Value
5/31/19($) | Net
Assets(%) | Dividends/
Distributions($) |
Registered Investment Companies: | | | | |
Dreyfus Institutional Preferred Government Plus Money Market Fund | - | 512,326,682 | 490,167,046 | 22,159,636 | 4.2 | 411,666 |
Investment of Cash Collateral for Securities Loaned:† | | | |
Dreyfus Institutional Preferred Government Money Market Fund, Institutional Shares | 42,740,154 | 132,837,076 | 175,577,230 | - | - | - |
Dreyfus Institutional Preferred Government Plus Money Market Fund | - | 64,626,778 | 56,072,634 | 8,554,144 | 1.6 | - |
Total | 42,740,154 | 709,790,536 | 721,816,910 | 30,713,780 | 5.8 | 411,666 |
† Effective January 2, 2019, cash collateral for securities lending was transferred from Dreyfus Institutional Preferred Government Money Market Fund, Institutional Shares to Dreyfus Institutional Preferred Government Plus Money Market Fund.
See notes to financial statements.
21
STATEMENT OF ASSETS AND LIABILITIES
May 31, 2019
| | | | | | | |
| | | | | | |
| | | Cost | | Value | |
Assets ($): | | | | |
Investments in securities—See Statement of Investments
(including securities on loan, valued at $118,618,081)—Note 1(b): | | | |
Unaffiliated issuers | 392,262,179 | | 513,636,279 | |
Affiliated issuers | | 30,713,780 | | 30,713,780 | |
Receivable for investment securities sold | | 1,786,103 | |
Receivable for shares of Common Stock subscribed | | 285,478 | |
Dividends, interest and securities lending income receivable | | 280,023 | |
Prepaid expenses | | | | | 55,334 | |
| | | | | 546,756,997 | |
Liabilities ($): | | | | |
Due to BNY Mellon Investment Adviser, Inc. and affiliates—Note 3(c) | | 450,093 | |
Liability for securities on loan—Note 1(b) | | 8,554,144 | |
Payable for investment securities purchased | | 2,718,179 | |
Payable for shares of Common Stock redeemed | | 549,548 | |
Directors fees and expenses payable | | 11,919 | |
Accrued expenses | | | | | 103,367 | |
| | | | | 12,387,250 | |
Net Assets ($) | | | 534,369,747 | |
Composition of Net Assets ($): | | | | |
Paid-in capital | | | | | 410,906,874 | |
Total distributable earnings (loss) | | | | | 123,462,873 | |
Net Assets ($) | | | 534,369,747 | |
| | | | | | |
Net Asset Value Per Share | Class A | Class C | Class I | Class Y | |
Net Assets ($) | 1,630,464 | 478,541 | 12,949,017 | 519,311,725 | |
Shares Outstanding | 70,332 | 22,676 | 538,502 | 21,578,558 | |
Net Asset Value Per Share ($) | 23.18 | 21.10 | 24.05 | 24.07 | |
| | | | | |
See notes to financial statements. | | | | | |
22
STATEMENT OF OPERATIONS
Year Ended May 31, 2019
| | | | | | | |
| | | | | | |
| | | | | | |
Investment Income ($): | | | | |
Income: | | | | |
Cash dividends (net of $11,464 foreign taxes withheld at source): | |
Unaffiliated issuers | | | 3,405,134 | |
Affiliated issuers | | | 411,666 | |
Income from securities lending—Note 1(b) | | | 401,874 | |
Interest | | | 47,308 | |
Total Income | | | 4,265,982 | |
Expenses: | | | | |
Management fee—Note 3(a) | | | 6,243,199 | |
Professional fees | | | 90,256 | |
Directors’ fees and expenses—Note 3(d) | | | 68,714 | |
Registration fees | | | 67,095 | |
Custodian fees—Note 3(c) | | | 54,367 | |
Shareholder servicing costs—Note 3(c) | | | 17,907 | |
Prospectus and shareholders’ reports | | | 17,644 | |
Loan commitment fees—Note 2 | | | 13,237 | |
Distribution fees—Note 3(b) | | | 4,460 | |
Miscellaneous | | | 53,708 | |
Total Expenses | | | 6,630,587 | |
Less—reduction in expenses due to undertaking—Note 3(a) | | | (3,600) | |
Less—reduction in fees due to earnings credits—Note 3(c) | | | (14,843) | |
Net Expenses | | | 6,612,144 | |
Investment (Loss)—Net | | | (2,346,162) | |
Realized and Unrealized Gain (Loss) on Investments—Note 4 ($): | | |
Net realized gain (loss) on investments | 54,704,235 | |
Net unrealized appreciation (depreciation) on investments | | | (90,428,067) | |
Net Realized and Unrealized Gain (Loss) on Investments | | | (35,723,832) | |
Net (Decrease) in Net Assets Resulting from Operations | | (38,069,994) | |
| | | | | | |
See notes to financial statements. | | | | | |
23
STATEMENT OF CHANGES IN NET ASSETS
| | | | | | | | | | |
| | | | Year Ended May 31, |
| | | | 2019 | | 2018 | a |
Operations ($): | | | | | | | | |
Investment (loss)—net | | | (2,346,162) | | | | (1,550,559) | |
Net realized gain (loss) on investments | | 54,704,235 | | | | 79,184,469 | |
Net unrealized appreciation (depreciation)
on investments | | (90,428,067) | | | | 92,692,906 | |
Net Increase (Decrease) in Net Assets
Resulting from Operations | (38,069,994) | | | | 170,326,816 | |
Distributions ($): | |
Distributions to shareholders: | | | | | | | | |
Class A | | | (300,893) | | | | (145,833) | |
Class C | | | (97,308) | | | | (20,837) | |
Class I | | | (3,269,623) | | | | (707,055) | |
Class Y | | | (98,523,649) | | | | (45,798,612) | |
Total Distributions | | | (102,191,473) | | | | (46,672,337) | |
Capital Stock Transactions ($): | |
Net proceeds from shares sold: | | | | | | | | |
Class A | | | 388,146 | | | | 418,471 | |
Class C | | | 117,526 | | | | 283,807 | |
Class I | | | 15,250,615 | | | | 9,965,797 | |
Class Y | | | 77,179,954 | | | | 94,972,058 | |
Distributions reinvested: | | | | | | | | |
Class A | | | 285,487 | | | | 144,814 | |
Class C | | | 95,838 | | | | 20,837 | |
Class I | | | 2,544,517 | | | | 544,813 | |
Class Y | | | 41,630,272 | | | | 20,017,131 | |
Cost of shares redeemed: | | | | | | | | |
Class A | | | (771,412) | | | | (1,693,589) | |
Class C | | | (192,102) | | | | (101,811) | |
Class I | | | (17,108,853) | | | | (7,853,716) | |
Class Y | | | (261,997,698) | | | | (63,029,846) | |
Increase (Decrease) in Net Assets
from Capital Stock Transactions | (142,577,710) | | | | 53,688,766 | |
Total Increase (Decrease) in Net Assets | (282,839,177) | | | | 177,343,245 | |
Net Assets ($): | |
Beginning of Period | | | 817,208,924 | | | | 639,865,679 | |
End of Period | | | 534,369,747 | | | | 817,208,924 | |
24
| | | | | | | | | | |
| | | | Year Ended May 31, |
| | | | 2019 | | 2018 | a |
Capital Share Transactions (Shares): | |
Class A | | | | | | | | |
Shares sold | | | 13,108 | | | | 15,405 | |
Shares issued for distributions reinvested | | | 13,913 | | | | 5,506 | |
Shares redeemed | | | (28,918) | | | | (63,550) | |
Net Increase (Decrease) in Shares Outstanding | (1,897) | | | | (42,639) | |
Class C | | | | | | | | |
Shares sold | | | 4,129 | | | | 10,996 | |
Shares issued for distributions reinvested | | | 5,120 | | | | 848 | |
Shares redeemed | | | (8,353) | | | | (4,036) | |
Net Increase (Decrease) in Shares Outstanding | 896 | | | | 7,808 | |
Class Ib | | | | | | | | |
Shares sold | | | 540,784 | | | | 359,170 | |
Shares issued for distributions reinvested | | | 119,629 | | | | 20,171 | |
Shares redeemed | | | (677,394) | | | | (292,732) | |
Net Increase (Decrease) in Shares Outstanding | (16,981) | | | | 86,609 | |
Class Yb | | | | | | | | |
Shares sold | | | 2,932,914 | | | | 3,476,270 | |
Shares issued for distributions reinvested | | | 1,956,310 | | | | 740,826 | |
Shares redeemed | | | (10,113,225) | | | | (2,297,809) | |
Net Increase (Decrease) in Shares Outstanding | (5,224,001) | | | | 1,919,287 | |
| | | | | | | | | |
aDistributions to shareholders include only distributions from net realized gains on investments. | |
bDuring the period ended May 31, 2019, 510,689 Class Y shares representing $14,339,294 were exchanged for 510,978 Class I shares and during the period ended May 31, 2018, 319,870 Class Y shares representing $9,092,950 were exchanged for 319,953 Class I shares. | |
See notes to financial statements. | | | | | | | | |
25
FINANCIAL HIGHLIGHTS
The following tables describe the performance for each share class for the fiscal periods indicated. All information (except portfolio turnover rate) reflects financial results for a single fund share. Total return shows how much your investment in the fund would have increased (or decreased) during each period, assuming you had reinvested all dividends and distributions. These figures have been derived from the fund’s financial statements.
| | | | | | | |
| | |
| | Year Ended May 31, |
Class A Shares | | 2019 | 2018 | 2017 | 2016 | 2015 |
Per Share Data ($): | | | | | | |
Net asset value, beginning of period | | 28.94 | 24.54 | 20.41 | 24.84 | 23.55 |
Investment Operations: | | | | | | |
Investment (loss)—neta | | (.18) | (.15) | (.13) | (.15) | (.17) |
Net realized and unrealized
gain (loss) on investments | | (1.28) | 6.36 | 4.26 | (2.76) | 3.42 |
Total from Investment Operations | | (1.46) | 6.21 | 4.13 | (2.91) | 3.25 |
Distributions: | | | | | | |
Dividends from net realized
gain on investments | | (4.30) | (1.81) | - | (1.52) | (1.96) |
Net asset value, end of period | | 23.18 | 28.94 | 24.54 | 20.41 | 24.84 |
Total Return (%)b | | (3.11) | 26.05 | 20.24 | (11.99) | 14.30 |
Ratios/Supplemental Data (%): | | | | | | |
Ratio of total expenses
to average net assets | | 1.40 | 1.29 | 1.28 | 1.29 | 1.32 |
Ratio of net expenses
to average net assets | | 1.30 | 1.28 | 1.28 | 1.29 | 1.30 |
Ratio of net investment (loss)
to average net assets | | (.68) | (.56) | (.60) | (.66) | (.71) |
Portfolio Turnover Rate | | 101.14 | 95.50 | 138.00 | 125.11 | 148.55 |
Net Assets, end of period ($ x 1,000) | | 1,630 | 2,090 | 2,819 | 3,716 | 4,834 |
a Based on average shares outstanding.
bExclusive of sales charge.
See notes to financial statements.
26
| | | | | | | |
| | |
| | Year Ended May 31, |
Class C Shares | | 2019 | 2018 | 2017 | 2016 | 2015 |
Per Share Data ($): | | | | | | |
Net asset value, beginning of period | | 26.95 | 23.13 | 19.39 | 23.85 | 22.85 |
Investment Operations: | | | | | | |
Investment (loss)—neta | | (.35) | (.33) | (.31) | (.30) | (.35) |
Net realized and unrealized
gain (loss) on investments | | (1.20) | 5.96 | 4.05 | (2.64) | 3.31 |
Total from Investment Operations | | (1.55) | 5.63 | 3.74 | (2.94) | 2.96 |
Distributions: | | | | | | |
Dividends from net realized
gain on investments | | (4.30) | (1.81) | - | (1.52) | (1.96) |
Net asset value, end of period | | 21.10 | 26.95 | 23.13 | 19.39 | 23.85 |
Total Return (%)b | | (3.71) | 25.11 | 19.29 | (12.67) | 13.49 |
Ratios/Supplemental Data (%): | | | | | | |
Ratio of total expenses
to average net assets | | 2.33 | 2.23 | 2.27 | 2.39 | 2.34 |
Ratio of net expenses
to average net assets | | 2.05 | 2.05 | 2.05 | 2.05 | 2.05 |
Ratio of net investment (loss)
to average net assets | | (1.43) | (1.37) | (1.39) | (1.42) | (1.48) |
Portfolio Turnover Rate | | 101.14 | 95.50 | 138.00 | 125.11 | 148.55 |
Net Assets, end of period ($ x 1,000) | | 479 | 587 | 323 | 253 | 268 |
a Based on average shares outstanding.
bExclusive of sales charge.
See notes to financial statements.
27
FINANCIAL HIGHLIGHTS (continued)
| | | | | | | |
| | |
| | Year Ended May 31, |
Class I Shares | | 2019 | 2018 | 2017 | 2016 | 2015 |
Per Share Data ($): | | | | | | |
Net asset value, beginning of period | | 29.76 | 25.12 | 20.84 | 25.25 | 23.83 |
Investment Operations: | | | | | | |
Investment (loss)—neta | | (.10) | (.07) | (.08) | (.08) | (.10) |
Net realized and unrealized
gain (loss) on investments | | (1.31) | 6.52 | 4.36 | (2.81) | 3.48 |
Total from Investment Operations | | (1.41) | 6.45 | 4.28 | (2.89) | 3.38 |
Distributions: | | | | | | |
Dividends from net realized
gain on investments | | (4.30) | (1.81) | - | (1.52) | (1.96) |
Net asset value, end of period | | 24.05 | 29.76 | 25.12 | 20.84 | 25.25 |
Total Return (%) | | (2.88) | 26.42 | 20.54 | (11.71) | 14.69 |
Ratios/Supplemental Data (%): | | | | | | |
Ratio of total expenses
to average net assets | | .98 | .99 | 1.03 | .98 | .97 |
Ratio of net expenses
to average net assets | | .98 | .98 | 1.01 | .98 | .97 |
Ratio of net investment (loss)
to average net assets | | (.35) | (.26) | (.33) | (.35) | (.53) |
Portfolio Turnover Rate | | 101.14 | 95.50 | 138.00 | 125.11 | 148.55 |
Net Assets, end of period ($ x 1,000) | | 12,949 | 16,532 | 11,777 | 19,373 | 23,882 |
a Based on average shares outstanding.
See notes to financial statements.
28
| | | | | | | |
| | |
| | Year Ended May 31, |
Class Y Shares | | 2019 | 2018 | 2017 | 2016 | 2015 |
Per Share Data ($): | | | | | | |
Net asset value, beginning of period | | 29.77 | 25.12 | 20.83 | 25.23 | 23.81 |
Investment Operations: | | | | | | |
Investment (loss)—neta | | (.09) | (.06) | (.07) | (.07) | (.09) |
Net realized and unrealized
gain (loss) on investments | | (1.31) | 6.52 | 4.36 | (2.81) | 3.47 |
Total from Investment Operations | | (1.40) | 6.46 | 4.29 | (2.88) | 3.38 |
Distributions: | | | | | | |
Dividends from net realized
gain on investments | | (4.30) | (1.81) | - | (1.52) | (1.96) |
Net asset value, end of period | | 24.07 | 29.77 | 25.12 | 20.83 | 25.23 |
Total Return (%) | | (2.84) | 26.46 | 20.60 | (11.68) | 14.66 |
Ratios/Supplemental Data (%): | | | | | | |
Ratio of total expenses
to average net assets | | .95 | .95 | .96 | .96 | .97 |
Ratio of net expenses
to average net assets | | .95 | .94 | .96 | .96 | .97 |
Ratio of net investment (loss)
to average net assets | | (.34) | (.21) | (.28) | (.33) | (.36) |
Portfolio Turnover Rate | | 101.14 | 95.50 | 138.00 | 125.11 | 148.55 |
Net Assets, end of period ($ x 1,000) | | 519,312 | 798,000 | 624,947 | 531,507 | 592,655 |
a Based on average shares outstanding.
See notes to financial statements.
29
NOTES TO FINANCIAL STATEMENTS
NOTE 1—Significant Accounting Policies:
BNY Mellon Select Managers Small Cap Growth Fund (the “fund”) is a separate non-diversified series of BNY Mellon Strategic Funds, Inc. (the “Company”), which is registered under the Investment Company Act of 1940, as amended (the “Act”), as an open-end management investment company and operates as a series company currently offering six series, including the fund. The fund’s investment objective is to seek capital appreciation. BNY Mellon Investment Adviser, Inc. (the “Adviser”), a wholly-owned subsidiary of The Bank of New York Mellon Corporation (“BNY Mellon”), serves as the fund’s investment adviser and the fund’s portfolio allocation manager. Henderson Geneva Capital Management Ltd. (“Henderson”), Nicholas Investment Partners, L.P. (“Nicholas”), EAM Investors, LLC (“EAM”), Granite Investment Partners, LLC (“Granite”), Rice Hall James & Associates (“Rice Hall”) and Redwood Investments, LLC (“Redwood”), serve as the fund’s sub-investment advisers, each managing an allocated portion of the fund’s portfolio.
Effective June 3, 2019, the fund changed its name from Dreyfus Select Managers Small Cap Growth Fund to BNY Mellon Select Managers Small Cap Growth Fund and the Company changed its name from Strategic Funds, Inc. to BNY Mellon Strategic Funds, Inc. In addition, The Dreyfus Corporation, the fund’s investment adviser and administrator, changed its name to “BNY Mellon Investment Adviser, Inc.”, MBSC Securities Corporation, the fund’s distributor, changed its name to “BNY Mellon Securities Corporation” and Dreyfus Transfer, Inc., the fund’s transfer agent, changed its name to “BNY Mellon Transfer, Inc.”
Effective November 7, 2018, the Adviser assumed the portfolio allocation management responsibilities of the fund, of which replacing EACM Advisors LLC (“EACM”).
BNY Mellon Securities Corporation (the “Distributor”), a wholly-owned subsidiary of the Adviser, is the distributor of the fund’s shares. The fund is authorized to issue 425 million shares of $.001 par value Common Stock. The fund currently has authorized four classes of shares: Class A (75 million shares authorized), Class C (75 million shares authorized), Class I (75 million shares authorized), Class T (100 million shares authorized) and Class Y (100 million shares authorized). Class A and Class T shares generally are subject to a sales charge imposed at the time of purchase. Class C shares are subject to a contingent deferred sales charge (“CDSC”) imposed on Class C shares redeemed within one year of purchase. Class C shares automatically convert to Class A shares ten years after the date of
30
purchase, without the imposition of a sales charge. Class I and Class Y shares are sold at net asset value per share generally to institutional investors. As of the date of this report, the fund did not offer Class T shares for purchase. Other differences between the classes include the services offered to and the expenses borne by each class, the allocation of certain transfer agency costs and certain voting rights. Income, expenses (other than expenses attributable to a specific class), and realized and unrealized gains or losses on investments are allocated to each class of shares based on its relative net assets.
The Company accounts separately for the assets, liabilities and operations of each series. Expenses directly attributable to each series are charged to that series’ operations; expenses which are applicable to all series are allocated among them on a pro rata basis.
The Financial Accounting Standards Board (“FASB”) Accounting Standards Codification is the exclusive reference of authoritative U.S. generally accepted accounting principles (“GAAP”) recognized by the FASB to be applied by nongovernmental entities. Rules and interpretive releases of the Securities and Exchange Commission (“SEC”) under authority of federal laws are also sources of authoritative GAAP for SEC registrants. The fund’s financial statements are prepared in accordance with GAAP, which may require the use of management estimates and assumptions. Actual results could differ from those estimates.
The Companyenters into contracts that contain a variety of indemnifications. The fund’s maximum exposure under these arrangements is unknown. The fund does not anticipate recognizing any loss related to these arrangements.
(a) Portfolio valuation: The fair value of a financial instrument is the amount that would be received to sell an asset or paid to transfer a liability in an orderly transaction between market participants at the measurement date (i.e., the exit price). GAAP establishes a fair value hierarchy that prioritizes the inputs of valuation techniques used to measure fair value. This hierarchy gives the highest priority to unadjusted quoted prices in active markets for identical assets or liabilities (Level 1 measurements) and the lowest priority to unobservable inputs (Level 3 measurements).
Additionally, GAAP provides guidance on determining whether the volume and activity in a market has decreased significantly and whether such a decrease in activity results in transactions that are not orderly. GAAP requires enhanced disclosures around valuation inputs and techniques used during annual and interim periods.
31
NOTES TO FINANCIAL STATEMENTS(continued)
Various inputs are used in determining the value of the fund’s investments relating to fair value measurements. These inputs are summarized in the three broad levels listed below:
Level 1—unadjusted quoted prices in active markets for identical investments.
Level 2—other significant observable inputs (including quoted prices for similar investments, interest rates, prepayment speeds, credit risk, etc.).
Level 3—significant unobservable inputs (including the fund’s own assumptions in determining the fair value of investments).
The inputs or methodology used for valuing securities are not necessarily an indication of the risk associated with investing in those securities.
Changes in valuation techniques may result in transfers in or out of an assigned level within the disclosure hierarchy. Valuation techniques used to value the fund’s investments are as follows:
Investments in securities are valued at the last sales price on the securities exchange or national securities market on which such securities are primarily traded. Securities listed on the National Market System for which market quotations are available are valued at the official closing price or, if there is no official closing price that day, at the last sales price. For open short positions, asked prices are used for valuation purposes. Bid price is used when no asked price is available. Registered investment companies that are not traded on an exchange are valued at their net asset value. All of the preceding securities are generally categorized within Level 1 of the fair value hierarchy.
Securities not listed on an exchange or the national securities market, or securities for which there were no transactions, are valued at the average of the most recent bid and asked prices. These securities are generally categorized within Level 2 of the fair value hierarchy.
Fair valuing of securities may be determined with the assistance of a pricing service using calculations based on indices of domestic securities and other appropriate indicators, such as prices of relevant ADRs and futures. Utilizing these techniques may result in transfers between Level 1 and Level 2 of the fair value hierarchy.
When market quotations or official closing prices are not readily available, or are determined not to accurately reflect fair value, such as when the value of a security has been significantly affected by events after the close of the exchange or market on which the security is principally traded (for
32
example, a foreign exchange or market), but before the fund calculates its net asset value, the fund may value these investments at fair value as determined in accordance with the procedures approved by the Company’s Board of Directors (the “Board”). Certain factors may be considered when fair valuing investments such as: fundamental analytical data, the nature and duration of restrictions on disposition, an evaluation of the forces that influence the market in which the securities are purchased and sold, and public trading in similar securities of the issuer or comparable issuers. These securities are either categorized within Level 2 or 3 of the fair value hierarchy depending on the relevant inputs used.
For restricted securities where observable inputs are limited, assumptions about market activity and risk are used and such securities are generally categorized within Level 3 of the fair value hierarchy.
The following is a summary of the inputs used as of May 31, 2019in valuing the fund’s investments:
| | | | | |
| | Level 1 Unadjusted Quoted Prices | Level 2 - Other Significant Observable Inputs | Level 3 Significant Unobservable Inputs | Total |
Assets ($) |
Investments in Securities: |
Equity Securities - Common Stocks† | 513,636,279 | - | - | 513,636,279 |
Investment Company | 30,713,780 | - | - | 30,713,780 |
† See Statement of Investments for additional detailed categorizations.
At May 31, 2019, there were no transfers between levels of the fair value hierarchy. It is the fund’s policy to recognize transfers between levels at the end of the reporting period.
(b)Securities transactions and investment income: Securities transactions are recorded on a trade date basis. Realized gains and losses from securities transactions are recorded on the identified cost basis. Dividend income is recognized on the ex-dividend date and interest income, including, where applicable, accretion of discount and amortization of premium on investments, is recognized on the accrual basis.
Pursuant to a securities lending agreement with The Bank of New York Mellon, a subsidiary of BNY Mellon and an affiliate of the Adviser, the fund may lend securities to qualified institutions. It is the fund’s policy that, at origination, all loans are secured by collateral of at least 102% of the value of U.S. securities loaned and 105% of the value of foreign securities loaned. Collateral equivalent to at least 100% of the market value
33
NOTES TO FINANCIAL STATEMENTS(continued)
of securities on loan is maintained at all times. Collateral is either in the form of cash, which can be invested in certain money market mutual funds managed by the Adviser, or U.S. Government and Agency securities. The fund is entitled to receive all dividends, interest and distributions on securities loaned, in addition to income earned as a result of the lending transaction. Should a borrower fail to return the securities in a timely manner, The Bank of New York Mellon is required to replace the securities for the benefit of the fund or credit the fund with the market value of the unreturned securities and is subrogated to the fund’s rights against the borrower and the collateral. Additionally, the contractual maturity of security lending transactions are on an overnight and continuous basis. During the period ended May 31, 2019, The Bank of New York Mellon earned $80,050 from lending portfolio securities, pursuant to the securities lending agreement.
(c) Affiliated issuers: Investments in other investment companies advised by the Adviser are considered “affiliated” under the Act.
(d) Dividends and distributions to shareholders: Dividends and distributions are recorded on the ex-dividend date. Dividends from investment income-net and dividends from net realized capital gains, if any, are normally declared and paid annually, but the fund may make distributions on a more frequent basis to comply with the distribution requirements of the Internal Revenue Code of 1986, as amended (the “Code”). To the extent that net realized capital gains can be offset by capital loss carryovers, it is the policy of the fund not to distribute such gains. Income and capital gain distributions are determined in accordance with income tax regulations, which may differ from GAAP.
(e) Federal income taxes: It is the policy of the fund to continue to qualify as a regulated investment company, if such qualification is in the best interests of its shareholders, by complying with the applicable provisions of the Code, and to make distributions of taxable income and net realized capital gain sufficient to relieve it from substantially all federal income and excise taxes.
As of and during the period ended May 31, 2019, the fund did not have any liabilities for any uncertain tax positions. The fund recognizes interest and penalties, if any, related to uncertain tax positions as income tax expense in the Statement of Operations. During the period ended May 31, 2019, the fund did not incur any interest or penalties.
Each tax year for the four-year period ended May 31, 2019 remains subject to examination by the Internal Revenue Service and state taxing authorities.
34
At May 31, 2019, the components of accumulated earnings on a tax basis were as follows: undistributed capital gains $11,233,109 and unrealized appreciation $112,915,079. In addition, the fund deferred for tax purposes late year ordinary losses of $685,315 to the first day of the following fiscal year.
The tax character of distributions paid to shareholders during the fiscal periods ended May 31, 2019 and May 31, 2018 were as follows: ordinary income $17,296,566 and $4,100,032, and long-term capital gains $84,894,907 and $42,572,305, respectively.
During the period ended May 31, 2019, as a result of permanent book to tax differences, primarily due to the tax treatment for treating a portion of the proceeds from the redemptions as a distribution for tax purposes and net operating losses, the fund increased total distributable earnings (loss) by $664,973 and decreased paid-in capital by the same amount. Net assets and net asset value per share were not affected by this reclassification.
(e) New Accounting Pronouncements: In August 2018, the FASB issued Accounting Standards Update 2018-13, Fair Value Measurement (Topic 820): Disclosure Framework—Changes to the Disclosure Requirements for Fair Value Measurement (“ASU 2018-13”). The update provides guidance that eliminates, adds and modifies certain disclosure requirements for fair value measurements. ASU 2018-13 will be effective for fiscal years beginning after December 15, 2019. Management is currently assessing the potential impact of these changes to future financial statements.
NOTE 2—Bank Lines of Credit:
The fund participates with other long-term open-end funds managed by the Adviser in a $1.030 billion unsecured credit facility led by Citibank, N.A. (the “Citibank Credit Facility”) and a $300 million unsecured credit facility provided by The Bank of New York Mellon (the “BNYM Credit Facility”), each to be utilized primarily for temporary or emergency purposes, including the financing of redemptions (each, a “Facility”). The Citibank Credit Facility is available in two tranches: (i) Tranche A is in an amount equal to $830 million and is available to all long-term open-ended funds, including the fund, and (ii) Tranche B is in amount equal to $200 million and is available only to BNY Mellon Floating Rate Income Fund, a series of BNY Mellon Investment Funds IV, Inc. Prior to October 3, 2018, the unsecured credit facility with Citibank, N.A. was $830 million. In connection therewith, the fund has agreed to pay its pro rata portion of commitment fees for Tranche A of the Citibank Credit Facility and the BNYM Credit Facility. Interest is charged to the fund based on rates
35
NOTES TO FINANCIAL STATEMENTS(continued)
determined pursuant to the terms of the respective Facility at the time of borrowing. During the period ended May 31, 2019, the fund did not borrow under the Facilities.
NOTE 3—Management Fee, Sub-Investment Advisory Fee and Other Transactions with Affiliates:
(a)Pursuant to a management agreement with the Adviser, the management fee is computed at the annual rate of .90% of the value of the fund’s average daily net assets and is payable monthly. The Adviser has contractually agreed, from June 1, 2018 through September 30, 2019, to waive receipt of its fees and/or assume the direct expenses of the fund, so that the direct expenses of Class A, Class C, Class I and Class Y shares (excluding Rule 12b-1 Distribution Plan fees, Shareholder Services plan fees, taxes, interest expense, brokerage commissions, commitment fees on borrowings and extraordinary expenses) do not exceed 1.05%, 1.05%, 1.05% and .98% of the value of the respective class’ average daily net assets. On or after September 30, 2019, the Adviser may terminate these expense limitations at any time. The reduction in expenses, pursuant to the undertaking, amounted to $3,600 during the period ended May 31, 2019.
Pursuant to a Portfolio Allocation Agreement between the Adviser and EACM, the Adviser pays EACM a monthly fee at an annual .10% of the value of the fund’s average daily net assets. Effective November 7, 2018, The Portfolio Allocation Agreement between Dreyfus and EACM was terminated. Dreyfus assumed the portfolio allocation management responsibilities of EACM.
Pursuant to separate sub-investment advisory agreements between the Adviser and Henderson, Nicholas, EAM, Granite, Rice Hall and Redwood, each serves as the fund’s sub-investment adviser responsible for the day-to-day management of a portion of the fund’s portfolio. The Adviser pays each sub-investment adviser a monthly fee at an annual percentage of the value of the fund’s average daily net assets. The Adviser has obtained an exemptive order from the SEC (the “Order”), upon which the fund may rely, to use a manager of managers approach that permits the Adviser, subject to certain conditions and approval by the Board, to enter into and materially amend sub-investment advisory agreements with one or more sub-investment advisers who are either unaffiliated with the Adviser or are wholly-owned subsidiaries (as defined under the Act) of the Adviser’s ultimate parent company, BNY Mellon, without obtaining shareholder approval. The Order also allows the fund to disclose the sub-investment advisory fee paid by the Adviser to any unaffiliated sub-investment adviser in the aggregate with other unaffiliated sub-investment advisers in documents filed with the SEC and provided to shareholders. In addition,
36
pursuant to the Order, it is not necessary to disclose the sub-investment advisory fee payable by the Adviser separately to a sub-investment adviser that is a wholly-owned subsidiary of BNY Mellon in documents filed with the SEC and provided to shareholders; such fees are to be aggregated with fees payable to the Adviser. The Adviser has ultimate responsibility (subject to oversight by the Board) to supervise any sub-investment adviser and recommend the hiring, termination, and replacement of any sub-investment adviser to the Board.
During the period ended May 31, 2019, the Distributor retained $1,611 from commissions earned on sales of the fund’s Class A shares and $10 from CDSC fees on redemptions of the fund’s Class C shares.
(b) Under the Distribution Plan adopted pursuant to Rule 12b-1 under the Act, Class C shares pay the Distributor for distributing its shares at an annual rate of .75% of the value of its average daily net assets. During the period ended May 31, 2019, Class C shares were charged $4,460 pursuant to the Distribution Plan.
(c)Under the Shareholder Services Plan, Class A and Class C shares pay the Distributor at an annual rate of .25% of the value of their average daily net assets for the provision of certain services. The services provided may include personal services relating to shareholder accounts, such as answering shareholder inquiries regarding the fund and providing reports and other information, and services related to the maintenance of shareholder accounts. The Distributor may make payments to Service Agents (securities dealers, financial institutions or other industry professionals) with respect to these services. The Distributor determines the amounts to be paid to Service Agents. During the period ended May 31, 2019, Class A and Class C shares were charged $4,914and $1,487, respectively, pursuant to the Shareholder Services Plan.
The fund has an arrangement with the transfer agent whereby the fund may receive earnings credits when positive cash balances are maintained, which are used to offset transfer agency fees. The fund had an arrangement with the custodian to receive earnings credits when positive cash balances were maintained, which were used to offset custody fees. Effective February 1, 2019, the arrangement with the custodian changed whereby the fund will no longer receive earnings credits to offset its custody fees and will receive interest income or overdraft fees going forward. For financial reporting purposes, the fund includes net earnings credits, if any, as an expense offset in the Statement of Operations.
The fund compensates BNY Mellon Transfer, Inc., a wholly-owned subsidiary of the Adviser, under a transfer agency agreement for providing
37
NOTES TO FINANCIAL STATEMENTS(continued)
transfer agency and cash management services for the fund. The majority of transfer agency fees are comprised of amounts paid on a per account basis, while cash management fees are related to fund subscriptions and redemptions. During the period ended May 31, 2019, the fund was charged $5,734 for transfer agency services. These fees are included in Shareholder servicing costs in the Statement of Operations.
The fund compensates The Bank of New York Mellon under a custody agreement for providing custodial services for the fund. These fees are determined based on net assets, geographic region and transaction activity. During the period ended May 31, 2019, the fund was charged $54,367 pursuant to the custody agreement. These fees were partially offset by earnings credits of $14,843.
During the period ended May 31, 2019, the fund was charged $21,237 for services performed by the Chief Compliance Officer and his staff. These fees are included in Miscellaneous in the Statement of Operations.
The components of “Due to BNY Mellon Investment Adviser, Inc. and affiliates” in the Statement of Assets and Liabilities consist of: management fees $425,558, Distribution Plan fees $316, Shareholder Services Plan fees $468, custodian fees $15,289, Chief Compliance Officer fees $8,181 and transfer agency fees $987, which are offset against an expense reimbursement currently in effect in the amount of $706.
(d) Each Board member also serves as a Board member of other funds in the BNY Mellon Family of Funds complex. Annual retainer fees and attendance fees are allocated to each fund based on net assets.
NOTE 4—Securities Transactions:
The aggregate amount of purchases and sales of investment securities, excluding short-term securities, during the period ended May 31, 2019, amounted to $675,699,212 and $922,793,585, respectively.
At May 31, 2019, the cost of investments for federal income tax purposes was $431,434,980; accordingly, accumulated net unrealized appreciation on investments was $112,915,079, consisting of $142,540,748 gross unrealized appreciation and $29,625,669 gross unrealized depreciation.
38
REPORT OF INDEPENDENT REGISTERED PUBLIC ACCOUNTING FIRM
To the Shareholders and the Board of Directors of BNY Mellon Select Managers Small Cap Growth Fund (formerly, Dreyfus Select Managers Small Cap Growth Fund)
Opinion on the Financial Statements
We have audited the accompanying statement of assets and liabilities of BNY Mellon Select Managers Small Cap Growth Fund (the “Fund”) (formerly, Dreyfus Select Managers Small Cap Growth Fund) (one of the series constituting BNY Mellon Strategic Funds, Inc.), including the statements of investments and investments in affiliated issuers, as of May 31, 2019, and the related statement of operations for the year then ended, the statements of changes in net assets for each of the two years in the period then ended, the financial highlights for each of the five years in the period then ended and the related notes (collectively referred to as the “financial statements”). In our opinion, the financial statements present fairly, in all material respects, the financial position of the Fund (one of the series constituting BNY Mellon Strategic Funds, Inc.) at May 31, 2019, the results of its operations for the year then ended, the changes in its net assets for each of the two years in the period then ended and its financial highlights for each of the five years in the period then ended, in conformity with U.S. generally accepted accounting principles.
Basis for Opinion
These financial statements are the responsibility of the Fund’s management. Our responsibility is to express an opinion on the Fund’s financial statements based on our audits. We are a public accounting firm registered with the Public Company Accounting Oversight Board (United States) (“PCAOB”) and are required to be independent with respect to the Fund in accordance with the U.S. federal securities laws and the applicable rules and regulations of the Securities and Exchange Commission and the PCAOB.
We conducted our audits in accordance with the standards of the PCAOB. Those standards require that we plan and perform the audit to obtain reasonable assurance about whether the financial statements are free of material misstatement, whether due to error or fraud. The Fund is not required to have, nor were we engaged to perform, an audit of the Fund’s internal control over financial reporting. As part of our audits, we are required to obtain an understanding of internal control over financial reporting, but not for the purpose of expressing an opinion on the effectiveness of the Fund’s internal control over financial reporting. Accordingly, we express no such opinion.
Our audits included performing procedures to assess the risks of material misstatement of the financial statements, whether due to error or fraud, and performing procedures that respond to those risks. Such procedures included examining, on a test basis, evidence regarding the amounts and disclosures in the financial statements. Our procedures included confirmation of securities owned as of May 31, 2019, by correspondence with the custodian and others or by other appropriate auditing procedures where replies from others were not received. Our audits also included evaluating the accounting principles used and significant estimates made by management, as well as evaluating the overall presentation of the financial statements. We believe that our audits provide a reasonable basis for our opinion.

We have served as the auditor of one or more investment companies in the BNY Mellon Family of Funds since at least 1957, but we are unable to determine the specific year.
New York, New York
July 25, 2019
39
IMPORTANT TAX INFORMATION(Unaudited)
For federal tax purposes the fund hereby reports 19.44% of the ordinary dividends paid during the fiscal year ended May 31, 2019 as qualifying for the corporate dividends received deduction. Also certain dividends paid by the fund may be subject to a maximum tax rate of 15%, as provided for by the Jobs and Growth Tax Relief Reconciliation Act of 2003. Of the distributions paid during the fiscal year, $140,084 represents the maximum amount that may be considered qualified dividend income. Shareholders will receive notification in early 2020 of the percentage applicable to the preparation of their 2019 income tax returns. Also, the fund hereby reports $1.3467 per share as a short-term capital gain distribution and $2.9566 per share as a long-term capital gain distribution paid on December 19, 2018.
40
BOARD MEMBERS INFORMATION(Unaudited)
INDEPENDENT BOARD MEMBERS
Joseph S. DiMartino (75)
Chairman of the Board (1995)
Principal Occupation During Past 5 Years:
· Corporate Director and Trustee (1995-present)
Other Public Company Board Memberships During Past 5 Years:
· CBIZ (formerly, Century Business Services, Inc.), a provider of outsourcing functions for small and medium size companies, Director (1997-present)
No. of Portfolios for which Board Member Serves:120
———————
Joni Evans (77)
Board Member (2006)
Principal Occupation During Past 5 Years:
· Chief Executive Officer, www.wowOwow.com, an online community dedicated to women’s conversations and publications (2007-present)
· Principal, Joni Evans Ltd. (publishing) (2006-present)
No. of Portfolios for which Board Member Serves:21
———————
Joan Gulley (71)
Board Member (2017)
Principal Occupation During Past 5 Years:
· PNC Financial Services Group, Inc.(1993-2014), Executive Vice President and Chief Human Resources Officer and Executive Committee Member (2008-2014)
No. of Portfolios for which Board Member Serves:51
———————
Ehud Houminer (78)
Board Member (1994)
Principal Occupation During Past 5 Years:
· Board of Overseers at the Columbia Business School, Columbia
University (1992-present)
Trustee, Ben Gurion University
No. of Portfolios for which Board Member Serves: 51
———————
41
BOARD MEMBERS INFORMATION (Unaudited) (continued)
INDEPENDENT BOARD MEMBERS (continued)
Alan H. Howard (59)
Board Member (2018)
Principal Occupation During Past 5 Years:
· Managing Partner of Heathcote Advisors LLC, a financial advisory services firm (2008 – present)
· President of Dynatech/MPX Holdings LLC (2012 – 2019), a global supplier and service provider of military aircraft parts, including Board Member of two operating subsidiaries, Dynatech International LLC and Military Parts Exchange LLC (2012-2019); Chief Executive Officer of an operating subsidiary, Dynatech International LLC (2013 – 2019)
· Senior Advisor, Rossoff & Co., an independent investment banking firm (2014 – present)
Other Public Company Board Memberships During Past 5 Years:
· Movado Group, a designer and manufacturer of watches, Director (1997-present)
No. of Portfolios for which Board Member Serves:21
———————
Robin A. Melvin (55)
Board Member (1995)
Principal Occupation During Past 5 Years:
· Co-chairman, Illinois Mentoring Partnership, non-profit organization dedicated to increasing the quantity and quality of mentoring services in Illinois; (2014-present; board member since 2013)
No. of Portfolios for which Board Member Serves:98
———————
Burton N. Wallack (68)
Board Member (2006)
Principal Occupation During Past 5 Years:
· President and Co-owner of Wallack Management Company, a real estate management
company (1987-present)
Board member, Mount Sinai Hospital (2017-present)
No. of Portfolios for which Board Member Serves:21
———————
Benaree Pratt Wiley (73)
Board Member (2003)
Principal Occupation During Past 5 Years:
· Principal, The Wiley Group, a firm specializing in strategy and business development (2005-present)
Other Public Company Board Memberships During Past 5 Years:
· CBIZ (formerly, Century Business Services, Inc.), a provider of outsourcing functions for small and medium size companies, Director (2008-present)
No. of Portfolios for which Board Member Serves: 76
———————
42
INTERESTED BOARD MEMBER
Gordon J. Davis (77)
Board Member (2006)
Principal Occupation During Past 5 Years:
· Partner in the law firm of Venable LLP (2012-present)
Other Public Company Board Memberships During Past 5 Years:
· Consolidated Edison, Inc., a utility company, Director (1997-2014)
· The Phoenix Companies, Inc., a life insurance company, Director (2000-2014)
No. of Portfolios for which Board Member Serves:55
Gordon J. Davis is deemed to be an “interested person” (as defined under the Act) of the Company as a result of his affiliation with Venable LLP, which provides legal services to the Company.
———————
Once elected all Board Members serve for an indefinite term, but achieve Emeritus status upon reaching age 80. The address of the Board Members and Officers is c/o BNY Mellon Investment Adviser, Inc. 240 Greenwich Street, New York, New York 10166. Additional information about the Board Members is available in the fund’s Statement of Additional Information which can be obtained from the Adviser free of charge by calling this toll free number: 1-800-373-9387.
William Hodding Carter III, Emeritus Board Member
Hans C. Mautner, Emeritus Board Member
43
OFFICERS OF THE FUND(Unaudited)
RENEE LAROCHE-MORRIS, President since January 2018.
President and a director of BNY Mellon Investment Adviser, Inc. since January 2018. She is an officer of 62 investment companies (comprised of 120 portfolios) managed by the Adviser. She is 47 years old and has been an employee of BNY Mellon since 2003.
JAMES WINDELS, Treasurer since November 2001.
Director- BNY Mellon Fund Administration, and an officer of 63 investment companies (comprised of 143 portfolios) managed by the Adviser. He is 60 years old and has been an employee of the Adviser since April 1985.
BENNETT A. MACDOUGALL, Chief Legal Officer since October 2015.
Chief Legal Officer of the Adviser and Associate General Counsel and Managing Director of BNY Mellon since June 2015; Director and Associate General Counsel of Deutsche Bank – Asset & Wealth Management Division from June 2005 to June 2015, and as Chief Legal Officer of Deutsche Investment Management Americas Inc. from June 2012 to May 2015. He is an officer of 63 investment companies (comprised of 143 portfolios) managed by the Adviser. He is 47 years old and has been an employee of the Adviser since June 2015.
DAVID DIPETRILLO, Vice President since January 2018.
Head of North America Product, BNY Mellon Investment Management since January 2018, Director of Product Strategy, BNY Mellon Investment Management from January 2016 to December 2017; Head of US Retail Product and Channel Marketing, BNY Mellon Investment Management from January 2014 to December 2015. He is an officer of 62 investment companies (comprised of 120 portfolios) managed by the Adviser. He is 41 years old and has been an employee of BNY Mellon since 2005.
JAMES BITETTO, Vice President since August 2005 and Secretary since February 2018.
Managing Counsel of BNY Mellon and Secretary of the Adviser, and an officer of 63 investment companies (comprised of 143 portfolios) managed by the Adviser. He is 52 years old and has been an employee of the Adviser since December 1996.
SONALEE CROSS, Vice President and Assistant Secretary since March 2018.
Counsel of BNY Mellon since October 2016; Associate at Proskauer Rose LLP from April 2016 to September 2016; Attorney at EnTrust Capital from August 2015 to February 2016; Associate at Sidley Austin LLP from September 2013 to August 2015. She is an officer of 63 investment companies (comprised of 143 portfolios) managed by the Adviser. She is 31 years old and has been an employee of the Adviser since October 2016.
DEIRDRE CUNNANE, Vice President and Assistant Secretary since March 2019.
Counsel of BNY Mellon since August 2018; Senior Regulatory Specialist at BNY Mellon Investment Management Services from February 2016 to August 2018; Trustee Associate at BNY Mellon Trust Company (Ireland) Limited from August 2013 to February 2016. She is an officer of 63 investment companies (comprised of 143 portfolios) managed by the Adviser. She is 29 years old and has been an employee of the Adviser since August 2018.
SARAH S. KELLEHER, Vice President and Assistant Secretary since April 2014.
Managing Counsel of BNY Mellon since December 2017, Senior Counsel of BNY Mellon from March 2013 to December 2017. She is an officer of 63 investment companies (comprised of 143 portfolios) managed by the Adviser. She is 43 years old and has been an employee of the Adviser since March 2013.
JEFF PRUSNOFSKY, Vice President and Assistant Secretary since August 2005.
Senior Managing Counsel of BNY Mellon, and an officer of 63 investment companies (comprised of 143 portfolios) managed by the Adviser. He is 54 years old and has been an employee of the Adviser since October 1990.
PETER M. SULLIVAN, Vice President and Assistant Secretary since March 2019.
Managing Counsel of BNY Mellon, and an officer of 63 investment companies (comprised of 143 portfolios) managed by the Adviser. He is 51 years old and has been an employee of the Adviser since April 2004.
44
NATALYA ZELENSKY, Vice President and Assistant Secretary since March 2017.
Counsel of BNY Mellon since May 2016; Attorney at Wildermuth Endowment Strategy Fund/Wildermuth Advisory, LLC from November 2015 to May 2016 and Assistant General Counsel at RCS Advisory Services from July 2014 to November 2015. She is an officer of 63 investment companies (comprised of 143 portfolios) managed by the Adviser. She is 34 years old and has been an employee of the Adviser since May 2016.
GAVIN C. REILLY, Assistant Treasurer since December 2005.
Tax Manager - BNY Mellon Fund Administration, and an officer of 63 investment companies (comprised of 143 portfolios) managed by the Adviser. He is 50 years old and has been an employee of the Adviser since April 1991.
ROBERT S. ROBOL, Assistant Treasurer since August 2005.
Senior Accounting Manager- BNY Mellon Fund Administration, and an officer of 63 investment companies (comprised of 143 portfolios) managed by the Adviser. He is 55 years old and has been an employee of the Adviser since October 1988.
ROBERT SALVIOLO, Assistant Treasurer since July 2007.
Senior Accounting Manager – BNY Mellon Fund Administration, and an officer of 63 investment companies (comprised of 143 portfolios) managed by the Adviser. He is 52 years old and has been an employee of the Adviser since June 1989.
ROBERT SVAGNA, Assistant Treasurer since August 2005.
Senior Accounting Manager – BNY Mellon Fund Administration, and an officer of 63 investment companies (comprised of 143 portfolios) managed by the Adviser. He is 52 years old and has been an employee of the Adviser since November 1990.
JOSEPH W. CONNOLLY, Chief Compliance Officer since October 2004.
Chief Compliance Officer of the Adviser, the BNY Mellon Family of Funds and BNY Mellon Funds Trust (63 investment companies, comprised of 143 portfolios). He is 62 years old and has served in various capacities with the Adviser since 1980, including manager of the firm’s Fund Accounting Department from 1997 through October 2001.
CARIDAD M. CAROSELLA, Anti-Money Laundering Compliance Officer since January 2016.
Anti-Money Laundering Compliance Officer of the BNY Mellon Family of Funds and BNY Mellon Funds Trust since January 2016; from May 2015 to December 2015, Interim Anti-Money Laundering Compliance Officer of the BNY Mellon Family of Funds and BNY Mellon Funds Trust and the Distributor; from January 2012 to May 2015, AML Surveillance Officer of the Distributor. She is an officer of 57 investment companies (comprised of 137 portfolios) managed by the Adviser. She is 50 years old and has been an employee of the Distributor since 1997.
45
BNY Mellon Select Managers Small Cap Growth Fund
240 Greenwich Street
New York, NY 10286
Adviser
BNY Mellon Investment Adviser, Inc.
240 Greenwich Street
New York, NY 10286
Sub-Advisers
Henderson Geneva Capital
Management Ltd.
100 East Wisconsin Avenue,
Suite 2550
Milwaukee, WI 53202
Nicholas Investment Partners, L.P.
6451 El Sicomoro
Rancho Santa Fe, CA 92067
EAM Investors, LLC
2533 South Coast Highway 101,
Suite 240
Cardiff-by-the-Sea, CA 92007
Granite Investment Partners, LLC
2121 Rosecrans Avenue, Suite 2360
El Segundo, CA 90245
Rice Hall James & Associates
600 West Broadway, Suite 1000
San Diego, CA 92101
Redwood Investments, LLC
One Gateway Center, Suite 802
Newton, MA 02458
Custodian
The Bank of New York Mellon
240 Greenwich Street
New York, NY 10286
Transfer Agent &
Dividend Disbursing Agent
BNY Mellon Transfer, Inc.
240 Greenwich Street
New York, NY 10286
Distributor
BNY Mellon Securities Corporation
240 Greenwich Street
New York, NY 10286
| | |
Ticker Symbols: Class A: DSGAX Class C: DSGCX Class I: DSGIX Class Y: DSGYX |
TelephoneCall your financial representative or 1-800-373-9387
MailThe BNY Mellon Family of Funds, 144 Glenn Curtiss Boulevard, Uniondale, NY 11556-0144
E-mailSend your request toinfo@bnymellon.com
InternetInformation can be viewed online or downloaded atwww.bnymellonim.com/us
The fund files its complete schedule of portfolio holdings with the Securities and Exchange Commission (“SEC”) for the first and third quarters of each fiscal year on Form N-PORT. The fund’s Forms N-PORT are available on the SEC’s website atwww.sec.gov.
A description of the policies and procedures that the fund uses to determine how to vote proxies relating to portfolio securities and information regarding how the fund voted these proxies for the most recent 12-month period ended June 30 is available atwww.bnymellonim.com/usand on the SEC’s website atwww.sec.gov and without charge, upon request, by calling 1-800-373-9387.
| | |
© 2019 BNY Mellon Securities Corporation
6289AR0519 | 
|
Item 2. Code of Ethics.
The Registrant has adopted a code of ethics that applies to the Registrant's principal executive officer, principal financial officer, principal accounting officer or controller, or persons performing similar functions. There have been no amendments to, or waivers in connection with, the Code of Ethics during the period covered by this Report.
Item 3. Audit Committee Financial Expert.
The Registrant's Board has determined that Ehud Houminer, a member of the Audit Committee of the Board, is an audit committee financial expert as defined by the Securities and Exchange Commission (the "SEC”). Ehud Houminer is "independent" as defined by the SEC for purposes of audit committee financial expert determinations.
Item 4. Principal Accountant Fees and Services.
(a) Audit Fees. The aggregate fees billed for each of the last two fiscal years (the "Reporting Periods") for professional services rendered by the Registrant's principal accountant (the "Auditor") for the audit of the Registrant's annual financial statements or services that are normally provided by the Auditor in connection with the statutory and regulatory filings or engagements for the Reporting Periods, were $35,222 in 2018 and $37,838 in 2019.
(b) Audit-Related Fees. The aggregate fees billed in the Reporting Periods for assurance and related services by the Auditor that are reasonably related to the performance of the audit of the Registrant's financial statements and are not reported under paragraph (a) of this Item 4 were $6,745 in 2018 and $6,807 in 2019. These services consisted of one or more of the following: (i) agreed upon procedures related to compliance with Internal Revenue Code section 817(h), (ii) security counts required by Rule 17f-2 under the Investment Company Act of 1940, as amended, (iii) advisory services as to the accounting or disclosure treatment of Registrant transactions or events and (iv) advisory services to the accounting or disclosure treatment of the actual or potential impact to the Registrant of final or proposed rules, standards or interpretations by the Securities and Exchange Commission, the Financial Accounting Standards Boards or other regulatory or standard-setting bodies.
The aggregate fees billed in the Reporting Periods for non-audit assurance and related services by the Auditor to the Registrant's investment adviser (not including any sub-investment adviser whose role is primarily portfolio management and is subcontracted with or overseen by another investment adviser), and any entity controlling, controlled by or under common control with the investment adviser that provides ongoing services to the Registrant ("Service Affiliates"), that were reasonably related to the performance of the annual audit of the Service Affiliate, which required pre-approval by the Audit Committee were $0 in 2018 and $0 in 2019.
(c) Tax Fees. The aggregate fees billed in the Reporting Periods for professional services rendered by the Auditor for tax compliance, tax advice, and tax planning ("Tax Services") were $3,875 in 2018 and $3,458 in 2019. These services consisted of: (i) review or preparation of U.S. federal, state, local and excise tax returns; (ii) U.S. federal, state and local tax planning, advice and assistance regarding statutory, regulatory or administrative developments; (iii) tax advice regarding tax qualification matters and/or treatment of various financial instruments held or proposed to be acquired or held, and (iv) determination of Passive Foreign Investment Companies. The aggregate fees billed in the Reporting Periods for Tax Services by the Auditor to Service Affiliates, which required pre-approval by the Audit Committee were $0 in 2018 and $0 in 2019.
(d) All Other Fees. The aggregate fees billed in the Reporting Periods for products and services provided by the Auditor, other than the services reported in paragraphs (a) through (c) of this Item, were $37 in 2018 and $45 in 2019.
The aggregate fees billed in the Reporting Periods for Non-Audit Services by the Auditor to Service Affiliates, other than the services reported in paragraphs (b) through (c) of this Item, which required pre-approval by the Audit Committee, were $0 in 2018 and $0 in 2019.
(e)(1)Audit Committee Pre-Approval Policies and Procedures. The Registrant's Audit Committee has established policies and procedures (the "Policy") for pre-approval (within specified fee limits) of the Auditor's engagements for non-audit services to the Registrant and Service Affiliates without specific case-by-case consideration. The pre-approved services in the Policy can include pre-approved audit services, pre-approved audit-related services, pre-approved tax services and pre-approved all other services. Pre-approval considerations include whether the proposed services are compatible with maintaining the Auditor's independence. Pre-approvals pursuant to the Policy are considered annually.
(e)(2)Note. None of the services described in paragraphs (b) through (d) of this Item 4 were approved by the Audit Committee pursuant to paragraph (c)(7)(i)(C) of Rule 2-01 of Regulation S-X.
(f) None of the hours expended on the principal accountant's engagement to audit the registrant's financial statements for the most recent fiscal year were attributed to work performed by persons other than the principal account's full-time, permanent employees.
Non-Audit Fees. The aggregate non-audit fees billed by the Auditor for services rendered to the Registrant, and rendered to Service Affiliates, for the Reporting Periods were $20,678,286 in 2018 and $28,630,247 in 2019.
Auditor Independence. The Registrant's Audit Committee has considered whether the provision of non-audit services that were rendered to Service Affiliates, which were not pre-approved (not requiring pre-approval), is compatible with maintaining the Auditor's independence.
Item 5. Audit Committee of Listed Registrants.
Not applicable.
Item 6. Investments.
(a) Not applicable.
Item 7. Disclosure of Proxy Voting Policies and Procedures for Closed-End Management Investment Companies.
Not applicable.
Item 8. Portfolio Managers of Closed-End Management Investment Companies.
Not applicable.
Item 9. Purchases of Equity Securities by Closed-End Management Investment Companies and Affiliated Purchasers.
Not applicable.
Item 10. Submission of Matters to a Vote of Security Holders.
There have been no material changes to the procedures applicable to Item 10.
Item 11. Controls and Procedures.
(a) The Registrant's principal executive and principal financial officers have concluded, based on their evaluation of the Registrant's disclosure controls and procedures as of a date within 90 days of the filing date of this report, that the Registrant's disclosure controls and procedures are reasonably designed to ensure that information required to be disclosed by the Registrant on Form N-CSR is recorded, processed, summarized and reported within the required time periods and that information required to be disclosed by the Registrant in the reports that it files or submits on Form N-CSR is accumulated and communicated to the Registrant's management, including its principal executive and principal financial officers, as appropriate to allow timely decisions regarding required disclosure.
(b) There were no changes to the Registrant's internal control over financial reporting that occurred during the second fiscal quarter of the period covered by this report that have materially affected, or are reasonably likely to materially affect, the Registrant's internal control over financial reporting.
Item 12. Disclosure of Securities Lending Activities for Closed-End Management Investment Companies.
Not applicable.
Item 13. Exhibits.
(a)(1) Code of ethics referred to in Item 2.
(a)(2) Certifications of principal executive and principal financial officers as required by Rule 30a-2(a) under the Investment Company Act of 1940.
(a)(3) Not applicable.
(b) Certification of principal executive and principal financial officers as required by Rule 30a-2(b) under the Investment Company Act of 1940.
SIGNATURES
Pursuant to the requirements of the Securities Exchange Act of 1934 and the Investment Company Act of 1940, the Registrant has duly caused this Report to be signed on its behalf by the undersigned, thereunto duly authorized.
BNY Mellon Strategic Funds, Inc.
By: /s/ Renee LaRoche-Morris
Renee LaRoche-Morris
President (Principal Executive Officer)
Date: July 26, 2019
Pursuant to the requirements of the Securities Exchange Act of 1934 and the Investment Company Act of 1940, this Report has been signed below by the following persons on behalf of the Registrant and in the capacities and on the dates indicated.
By: /s/ Renee LaRoche-Morris
Renee LaRoche-Morris
President (Principal Executive Officer)
Date: July 26, 2019
By: /s/ James Windels
James Windels
Treasurer (Principal Financial Officer)
Date: July 26, 2019
EXHIBIT INDEX
(a)(1) Code of ethics referred to in Item 2.
(a)(2) Certifications of principal executive and principal financial officers as required by Rule 30a-2(a) under the Investment Company Act of 1940. (EX-99.CERT)
(b) Certification of principal executive and principal financial officers as required by Rule 30a-2(b) under the Investment Company Act of 1940. (EX-99.906CERT)
