UNITED STATES
SECURITIES AND EXCHANGE COMMISSION
Washington, D.C. 20549
FORM N-CSR
CERTIFIED SHAREHOLDER REPORT OF REGISTERED MANAGEMENT
INVESTMENT COMPANIES
Investment Company Act file number | 811-03940 |
| |
| BNY Mellon Strategic Funds, Inc. | |
| (Exact name of Registrant as specified in charter) | |
| | |
| c/o BNY Mellon Investment Adviser, Inc. 240 Greenwich Street New York, New York 10286 | |
| (Address of principal executive offices) (Zip code) | |
| | |
| Bennett A. MacDougall, Esq. 240 Greenwich Street New York, New York 10286 | |
| (Name and address of agent for service) | |
|
Registrant's telephone number, including area code: | (212) 922-6400 |
| |
Date of fiscal year end: | 05/31 | |
Date of reporting period: | 05/31/2020 | |
| | | | | | | |
The following N-CSR relates only to the Registrant's series listed below and does not relate to any series of the Registrant with a different fiscal year end and, therefore, different N-CSR reporting requirements. A separate N-CSR will be filed for any series with a different fiscal year end, as appropriate.
BNY Mellon Select Managers Small Cap Growth Fund
FORM N-CSR
Item 1. Reports to Stockholders.
BNY Mellon Select Managers Small Cap Growth Fund
| |
ANNUAL REPORT May 31, 2020 |
| |
Save time. Save paper. View your next shareholder report online as soon as it’s available. Log into www.bnymellonim.com/us and sign up for eCommunications. It’s simple and only takes a few minutes. |
| |
The views expressed in this report reflect those of the portfolio manager(s) only through the end of the period covered and do not necessarily represent the views of BNY Mellon Investment Adviser, Inc. or any other person in the BNY Mellon Investment Adviser, Inc. organization. Any such views are subject to change at any time based upon market or other conditions and BNY Mellon Investment Adviser, Inc. disclaims any responsibility to update such views. These views may not be relied on as investment advice and, because investment decisions for a fund in the BNY Mellon Family of Funds are based on numerous factors, may not be relied on as an indication of trading intent on behalf of any fund in the BNY Mellon Family of Funds. |
| |
Not FDIC-Insured • Not Bank-Guaranteed • May Lose Value |
Contents
T H E F U N D
F O R M O R E I N F O R M AT I O N
Back Cover
| | | | |
| |
BNY Mellon Select Managers Small Cap Growth Fund
| | The Fund |
A LETTER FROM THE PRESIDENT OF BNY MELLON INVESTMENT ADVISER, INC.
Dear Shareholder:
We are pleased to present this annual report for BNY Mellon Select Managers Small Cap Growth Fund (formerly, Dreyfus Select Managers Small Cap Growth Fund), covering the 12-month period from June 1, 2019 through May 31, 2020. For information about how the fund performed during the reporting period, as well as general market perspectives, we provide a Discussion of Fund Performance on the pages that follow.
Early in the reporting period, equity markets benefited from the U.S. Federal Reserve’s (the “Fed”) more accommodative stance on interest rates. Trade tensions between the U.S. and China emerged at times, which disrupted markets. Despite the disruption, the pace of the U.S. economy remained steady, and stocks rose in mid-2019. Volatility subsequently returned when investors grew more concerned about the state of the global economy. However, stocks eventually rebounded, rallying through the end of 2019 due to supportive interest rate cuts and the announcement of a trade deal between the U.S. and China. Early in 2020, as COVID-19 spread across the globe, concerns about the economic effects of a widespread quarantine worked to depress equity valuations. Stocks posted historic losses in March 2020, but regained ground in April and May.
Fixed-income markets benefited from Fed interest rate cuts and investor concerns about an economic slowdown. Responding to global economic concerns, the Fed reduced rates in July, September and October 2019. As stocks subsequently rallied, Treasury bonds declined, and rates across much of the yield curve rose until early in 2020, when the potential threat posed by COVID-19 began to emerge. A flight-to-quality ensued, and rates fell significantly. March 2020 brought high volatility and risk-asset spread widening. The Fed cut rates twice in March, resulting in an overnight lending target rate of nearly zero, and the government launched a large stimulus package. In April and May 2020, risk-assets began to recover. Investment-grade bonds generally posted positive returns for the period.
We believe the near-term outlook for the U.S. will be challenging, as the country curbs the spread of COVID-19 and determines a path forward for recovery. However, we are confident that once the economic effects of the virus have been mitigated, the economy will rebound. As always, we will monitor relevant data for any signs of a change. We encourage you to discuss the risks and opportunities in today’s investment environment with your financial advisor.
Thank you for your continued confidence and support.
Sincerely,

Renee LaRoche-Morris
President
BNY Mellon Investment Adviser, Inc.
June 15, 2020
2
DISCUSSION OF FUND PERFORMANCE (Unaudited)
For the period from June 1, 2019 through May 31, 2020, as provided by portfolio allocation managers Stephen Kolano and Elena Goncharova
Market and Fund Performance Overview
For the 12-month period ended May 31, 2020, BNY Mellon Select Managers Small Cap Growth Fund’s (formerly, Dreyfus Select Managers Small Cap Growth Fund) Class A, Class C, Class I and Class Y shares at NAV produced total returns of 7.19%, 6.41%, 7.52% and 7.56%, respectively.1 In comparison, the Russell 2000® Growth Index (the “Index”), the fund’s benchmark, returned 7.32% for the same period.2
Small-cap growth stocks gained ground over the reporting period despite market turmoil related to the COVID-19 virus. The fund’s Class A and C shares lagged the Index, mainly due to mixed results from asset allocation decisions.
The Fund’s Investment Approach
The fund seeks capital appreciation. To pursue its goal, the fund normally invests at least 80% of its assets in the stocks of small-cap companies. The fund’s portfolio is constructed to have a growth tilt.
The fund uses a “multi-manager” approach by selecting various subadvisors to manage its assets. We may hire, terminate or replace subadvisors and modify material terms and conditions of subadvisory arrangements without shareholder approval.
The fund’s assets are currently allocated to six subadvisors, each acting independently and using its own methodology to select portfolio investments. At the end of the reporting period, 13% of the fund’s assets were under the management of Redwood Investments, LLC, which employs a blend of quantitative and qualitative research to build growth and core equity portfolios; approximately 18% of the fund’s assets were under the management of Geneva Capital Management, which employs bottom-up fundamental analysis supplemented by top-down considerations to identify companies with a consistent, sustainable record of growth; approximately 13% of the fund’s assets were under the management of Nicholas Investment Partners, L.P., which uses a bottom-up approach to security selection, combining rigorous fundamental analysis with the discipline and objectivity of quantitative analytics; EAM Investors, LLC, which managed 21% of the fund’s assets, which chooses investments through bottom-up fundamental analysis using a blend of a quantitative discovery process and a qualitative analysis process; approximately 10% of the fund’s assets were managed by Granite Investment Partners, LLC, which seeks attractively valued, small-cap companies with catalysts for growth; and 25% of the fund’s assets were managed by Rice Hall James & Associates LLC, which seeks growing companies with high earnings growth, high or improving returns on invested capital and sustainable competitive advantages. The percentages of the fund’s assets allocated to the various subadvisors can change over time, within ranges described in the prospectus.
Stocks Rebound as COVID-19 Shutdowns Ease
As the reporting period began, investors were somewhat concerned about trade tensions and the global economy. When these concerns appeared to be weighing on economic growth, the Federal Reserve (the “Fed”) reduced the federal funds rate in August, September and October 2019, bringing the target rate to 1.50-1.75%. Other major central banks also took actions to support their economies.
3
DISCUSSION OF FUND PERFORMANCE (Unaudited) (continued)
Stocks rallied in response to these actions and in response to an announcement of a “Phase One” U.S.-China trade agreement. Stocks also benefited from the approval of a new U.S.-Mexico-Canada Trade Agreement by the U.S. House of Representatives, potentially reducing trade uncertainty with America’s neighbors.
However, in 2020, markets experienced a sharp correction, amid growing concerns about COVID-19 in China, erasing gains that occurred late in 2019 and early in 2020. In response, the Fed reduced the federal funds rate by 50 basis points early in March 2020, bringing the target rate down to 1.00–1.25%. The Fed made another cut in mid-March 2020, bringing the federal funds rate target to 0.0-0.25%.
In addition, the Fed and other central banks initiated various programs to ease liquidity concerns in certain markets, and government authorities introduced programs to keep small businesses afloat. Steps were also taken to provide relief to employees who had lost their jobs as a result of government-mandated business shutdowns. At the end of the reporting period, markets began to rebound as these programs took effect, and government shutdowns to slow the spread of the virus began to be relaxed.
Small-cap stocks lagged more than the broader market during the reporting period, due primarily to their greater risk profile. But small-cap growth stocks rebounded, while small-cap value stocks posted negative returns for the period.
Asset Allocation and Security Selections Hindered Fund Performance
The fund’s relative underperformance versus the Index was mainly the result of unfavorable asset allocation and stock selections by the fund’s underlying portfolio managers. The biggest detractors from performance were underweighted positions to the health care sector, which outperformed the Index. As for stock selection, in the health care sector, the fund’s favorable selections in the pharmaceutical industry were offset by poor selections in the health care providers and health technology industries. In the health care providers industry, operators of nursing homes in particular felt the effects of the COVID-19 virus.
On the other hand, the fund benefited slightly from a large overweight to the information technology sector and from an underweight to the industrials sector. Stock selection contributed positively in the information technology and industrials sectors, and in the pharmaceutical industry. In the information technology sector, shares of semiconductor companies Inphi and Monolithic Power Systems were advantageous. In addition, positions in Five9, a maker of cloud-related infrastructure, and Tyler Technologies, an information management company serving local governments, contributed positively to fund performance. In the industrial sector, the fund’s decision not to own staffing companies, which were especially hurt by the COVID-19 lockdown, was beneficial. In the pharmaceuticals industry, shares of Axsome Therapeutics, a maker of drugs for the central nervous system, gained 240% over the reporting period.
A Cautious Outlook
Our outlook reflects uncertainty about the economic impact of the COVID-19 virus, but we see three reasons to be cautiously optimistic. First, efforts to contain the virus and “flatten the curve” have been largely successful. Second, the global policy response, including unprecedented actions in both monetary and fiscal policy, have been rapid and effective, with additional assistance potentially in the works. Third, efforts to produce a vaccine have so far produced hopeful results.
Nevertheless, the possibility of a second wave of the virus remains an open question. In addition, it is unclear at this point how extensive the economic damage of the lockdown has been, and it is
4
uncertain when the economy will move from dependence on fiscal stimulus to a more normal basis. The fund made a reallocation from the more growth-oriented Nicholas Investment Partners L.P. fund to the more defensive Redwood Investments, LLC and Geneva Capital Management funds.
June 15, 2020
1 Total return includes reinvestment of dividends and any capital gains paid and does not take into consideration the maximum initial sales charge in the case of Class A shares, or the applicable contingent deferred sales charge imposed on redemptions in the case of Class C shares. Had these charges been reflected, returns would have been lower. Past performance is no guarantee of future results. Share price and investment return fluctuate such that upon redemption, fund shares may be worth more or less than their original cost. Return figures provided reflect the absorption of certain fund expenses by BNY Mellon Investment Adviser, Inc. pursuant to an undertaking in effect through September 30, 2020, at which time it may be extended, terminated or modified. Had these expenses not been absorbed, the fund’s returns would have been lower.
2 Source: Lipper Inc. — The Russell 2000® Growth Index measures the performance of the small-cap growth segment of the U.S. equity universe. It includes those Russell 2000 companies with higher growth earning potential as defined by Russell’s leading style methodology. The Russell 2000® Growth Index is constructed to provide a comprehensive and unbiased barometer for the small-cap growth segment. The index is completely reconstituted annually to ensure larger stocks do not distort the performance and characteristics of the true small-cap opportunity set, and that the represented companies continue to reflect growth characteristics. Investors cannot invest directly in any index.
Equities are subject generally to market, market sector, market liquidity, issuer and investment style risks, among other factors, to varying degrees, all of which are more fully described in the fund’s prospectus.
The prices of small company stocks tend to be more volatile than the prices of large company stocks, mainly because these companies have less established and more volatile earnings histories. They also tend to be less liquid than larger company stocks.
Recent market risks include pandemic risks related to COVID-19. The effects of COVID-19 have contributed to increased volatility in global markets and will likely affect certain countries, companies, industries and market sectors more dramatically than others. To the extent the fund may overweight its investments in certain countries, companies, industries or market sectors, such positions will increase the fund’s exposure to risk of loss from adverse developments affecting those countries, companies, industries or sectors.
5
FUND PERFORMANCE (Unaudited)
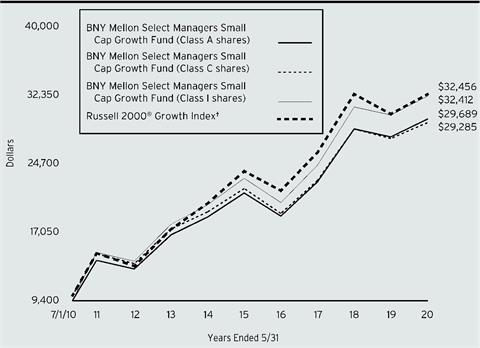
Comparison of change in value of a $10,000 investment in Class A shares, Class C shares and Class I shares of BNY Mellon Select Managers Small Cap Growth Fund with a hypothetical investment of $10,000 in the Russell 2000® Growth Index (the “Index”)
† Source: Lipper Inc.
Past performance is not predictive of future performance.
The above graph compares a hypothetical $10,000 investment made in Class A, Class C and Class I shares of BNY Mellon Select Managers Small Cap Growth Fund on 7/1/10 (inception date) to a hypothetical investment of $10,000 made in the Index on that date. All dividends and capital gain distributions are reinvested.
The fund’s performance shown in the line graph above takes into account the maximum initial sales charge on Class A shares and all other applicable fees and expenses on all classes. The Index measures the performance of the small-cap growth segment of the U.S. equity universe. It includes those Russell 2000 companies with higher growth earning potential as defined by Russell’s leading style methodology. The Index is constructed to provide a comprehensive and unbiased barometer for the small-cap growth segment. The Index is completely reconstituted annually to ensure larger stocks do not distort the performance and characteristics of the true small-cap opportunity set and that the represented companies continue to reflect growth characteristics. Unlike a mutual fund, the Index is not subject to charges, fees and other expenses. Investors cannot invest directly in any index. Further information relating to fund performance, including expense reimbursements, if applicable, is contained in the Financial Highlights section of the prospectus and elsewhere in this report.
6
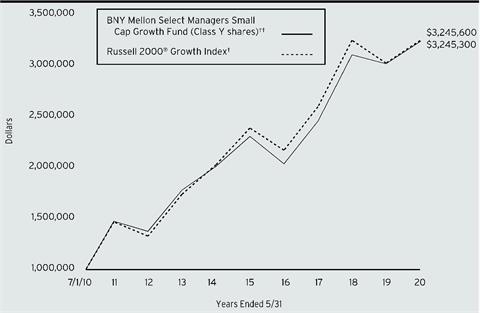
Comparison of change in value of a $1,000,000 investment in Class Y shares of BNY Mellon Select Managers Small Cap Growth Fund with a hypothetical investment of $1,000,000 in the Russell 2000® Growth Index (the “Index”)
† Source: Lipper Inc.
†† The total return figures presented for Class Y shares of the fund reflect the performance of the fund’s Class A shares for the period prior to 7/1/13 (the inception date for Class Y shares), not reflecting the applicable sales load for Class A shares.
Past performance is not predictive of future performance.
The above graph compares a hypothetical $1,000,000 investment made in Class Y shares of BNY Mellon Select Managers Small Cap Growth Fund on 7/1/10 (inception date) to a hypothetical investment of $1,000,000 made in the Index on that date. All dividends and capital gain distributions are reinvested.
The fund’s performance shown in the line graph above takes into account all applicable fees and expenses of the fund’s Class Y shares. The Index measures the performance of the small-cap growth segment of the U.S. equity universe. It includes those Russell 2000 companies with higher growth earning potential as defined by Russell’s leading style methodology. The Index is constructed to provide a comprehensive and unbiased barometer for the small-cap growth segment. The Index is completely reconstituted annually to ensure larger stocks do not distort the performance and characteristics of the true small-cap opportunity set and that the represented companies continue to reflect growth characteristics. Unlike a mutual fund, the Index is not subject to charges, fees and other expenses. Investors cannot invest directly in any index. Further information relating to fund performance, including expense reimbursements, if applicable, is contained in the Financial Highlights section of the prospectus and elsewhere in this report.
7
FUND PERFORMANCE (Unaudited) (continued)
| | | | | |
Average Annual Total Returns as of 5/31/2020 |
| | Inception Date | 1 Year | 5 Years | From
Inception |
Class A shares | | | | |
with maximum sales charge (5.75%) | 7/1/10 | 1.04% | 5.48% | 11.59% |
without sales charge | 7/1/10 | 7.19% | 6.74% | 12.26% |
Class C shares | | | | |
with applicable redemption charge† | 7/1/10 | 5.41% | 5.96% | 11.44% |
without redemption | 7/1/10 | 6.41% | 5.96% | 11.44% |
Class I shares | 7/1/10 | 7.52% | 7.04% | 12.59% |
Class Y shares | 7/1/13 | 7.56% | 7.08% | 12.60%†† |
Russell 2000® Growth Index | 6/30/10 | 7.32% | 6.34% | 11.72%††† |
† The maximum contingent deferred sales charge for Class C shares is 1% for shares redeemed within one year of the date of purchase.
†† The total return performance figures presented for Class Y shares of the fund reflect the performance of the fund’s Class A shares for the period prior to 7/1/13 (the inception date for Class Y shares), not reflecting the applicable sales load for Class A shares.
††† For comparative purposes, the value of the Index as of 6/30/10 is used as the beginning value on 7/1/10.
The performance data quoted represents past performance, which is no guarantee of future results. Share price and investment return fluctuate and an investor’s shares may be worth more or less than original cost upon redemption. Current performance may be lower or higher than the performance quoted. Go to www.bnymellonim.com/us for the fund’s most recent month-end returns.
The fund’s performance shown in the graphs and table does not reflect the deduction of taxes that a shareholder would pay on fund distributions or the redemption of fund shares. In addition to the performance of Class A shares shown with and without a maximum sales charge, the fund’s performance shown in the table takes into account all other applicable fees and expenses on all classes.
8
UNDERSTANDING YOUR FUND’S EXPENSES (Unaudited)
As a mutual fund investor, you pay ongoing expenses, such as management fees and other expenses. Using the information below, you can estimate how these expenses affect your investment and compare them with the expenses of other funds. You also may pay one-time transaction expenses, including sales charges (loads) and redemption fees, which are not shown in this section and would have resulted in higher total expenses. For more information, see your fund’s prospectus or talk to your financial adviser.
Review your fund’s expenses
The table below shows the expenses you would have paid on a $1,000 investment in BNY Mellon Select Managers Small Cap Growth Fund from December 1, 2019 to May 31, 2020. It also shows how much a $1,000 investment would be worth at the close of the period, assuming actual returns and expenses.
| | | | | | | |
Expenses and Value of a $1,000 Investment | |
Assume actual returns for the six months ended May 31, 2020 | |
| | | | | | |
| | Class A | Class C | Class I | Class Y | |
Expense paid per $1,000† | $6.43 | $10.12 | $5.00 | $4.80 | |
Ending value (after expenses) | $977.80 | $974.50 | $979.40 | $979.50 | |
COMPARING YOUR FUND’S EXPENSES
WITH THOSE OF OTHER FUNDS (Unaudited)
Using the SEC’s method to compare expenses
The Securities and Exchange Commission (“SEC”) has established guidelines to help investors assess fund expenses. Per these guidelines, the table below shows your fund’s expenses based on a $1,000 investment, assuming a hypothetical 5% annualized return. You can use this information to compare the ongoing expenses (but not transaction expenses or total cost) of investing in the fund with those of other funds. All mutual fund shareholder reports will provide this information to help you make this comparison. Please note that you cannot use this information to estimate your actual ending account balance and expenses paid during the period.
| | | | | | | |
Expenses and Value of a $1,000 Investment | |
Assuming a hypothetical 5% annualized return for the six months ended May 31, 2020 | |
| | | | | | |
| | Class A | Class C | Class I | Class Y | |
Expense paid per $1,000† | $6.56 | $10.33 | $5.10 | $4.90 | |
Ending value (after expenses) | $1,018.50 | $1,014.75 | $1,019.95 | $1,020.15 | |
†Expenses are equal to the fund’s annualized expense ratio of 1.30% for Class A, 2.05% for Class C, 1.01% for Class I and .97% for Class Y, multiplied by the average account value over the period, multiplied by 183/366 (to reflect the one-half year period). |
9
STATEMENT OF INVESTMENTS
May 31, 2020
| | | | | | | | |
| |
Description | | | | Shares | | Value ($) | |
Common Stocks - 96.7% | | | | | |
Automobiles & Components - 2.0% | | | | | |
Dorman Products | | | | 18,217 | a | 1,273,733 | |
Fox Factory Holding | | | | 39,751 | a,b | 2,866,445 | |
LCI Industries | | | | 27,489 | | 2,719,487 | |
Visteon | | | | 21,120 | a,b | 1,520,640 | |
Winnebago Industries | | | | 16,826 | | 915,334 | |
| | | | | 9,295,639 | |
Banks - 2.1% | | | | | |
Axos Financial | | | | 99,493 | a | 2,168,948 | |
Bank OZK | | | | 37,804 | | 850,212 | |
Central Pacific Financial | | | | 20,771 | | 334,621 | |
Columbia Banking System | | | | 14,351 | | 349,590 | |
Essent Group | | | | 8,233 | | 272,101 | |
Federal Agricultural Mortgage, Cl. C | | | | 9,620 | | 616,931 | |
First Financial Bankshares | | | | 45,647 | | 1,398,624 | |
First Foundation | | | | 20,362 | | 303,394 | |
National Bank Holdings, Cl. A | | | | 20,232 | | 532,102 | |
NMI Holdings, Cl. A | | | | 37,395 | a | 574,574 | |
Pacific Premier Bancorp | | | | 41,095 | | 888,474 | |
Seacoast Banking Corp. of Florida | | | | 36,394 | a | 791,569 | |
Texas Capital Bancshares | | | | 26,425 | a | 707,133 | |
| | | | | 9,788,273 | |
Capital Goods - 8.5% | | | | | |
AAON | | | | 34,499 | b | 1,868,811 | |
AeroVironment | | | | 25,023 | a | 1,772,379 | |
Armstrong World Industries | | | | 27,290 | | 2,057,393 | |
Barnes Group | | | | 23,214 | | 877,025 | |
Donaldson | | | | 25,431 | | 1,206,701 | |
Encore Wire | | | | 12,497 | | 603,480 | |
ESCO Technologies | | | | 18,729 | | 1,547,203 | |
Generac Holdings | | | | 24,620 | a | 2,739,467 | |
H&E Equipment Services | | | | 40,459 | | 693,467 | |
Kornit Digital | | | | 44,924 | a,b | 2,100,197 | |
Kratos Defense & Security Solutions | | | | 60,219 | a | 1,117,062 | |
Lincoln Electric Holdings | | | | 8,733 | | 717,591 | |
Masonite International | | | | 37,163 | a | 2,466,880 | |
Mercury Systems | | | | 16,585 | a | 1,481,870 | |
Moog, Cl. A | | | | 13,480 | | 731,829 | |
MSC Industrial Direct, Cl. A | | | | 6,590 | | 456,951 | |
PGT Innovations | | | | 67,929 | a | 924,514 | |
Plug Power | | | | 125,388 | a,b | 527,883 | |
Proto Labs | | | | 26,531 | a | 3,352,193 | |
10
| | | | | | | | |
| |
Description | | | | Shares | | Value ($) | |
Common Stocks - 96.7% (continued) | | | | | |
Capital Goods - 8.5% (continued) | | | | | |
RBC Bearings | | | | 16,054 | a | 2,257,995 | |
SiteOne Landscape Supply | | | | 32,909 | a,b | 3,498,555 | |
Trex | | | | 50,969 | a,b | 6,122,396 | |
Vicor | | | | 14,646 | a | 893,113 | |
| | | | | 40,014,955 | |
Commercial & Professional Services - 2.7% | | | | | |
Brady, Cl. A | | | | 15,340 | | 784,334 | |
Casella Waste Systems, Cl. A | | | | 12,304 | a | 626,889 | |
CBIZ | | | | 41,284 | a | 935,083 | |
Deluxe | | | | 33,982 | | 792,800 | |
Exponent | | | | 65,207 | | 4,840,968 | |
Franklin Covey | | | | 16,546 | a | 352,430 | |
IAA | | | | 29,660 | a | 1,216,060 | |
McGrath RentCorp | | | | 16,622 | | 926,843 | |
Tetra Tech | | | | 15,385 | | 1,213,876 | |
Willdan Group | | | | 34,925 | a | 853,916 | |
| | | | | 12,543,199 | |
Consumer Durables & Apparel - 1.9% | | | | | |
Acushnet Holdings | | | | 20,807 | b | 695,370 | |
Callaway Golf | | | | 148,511 | b | 2,275,189 | |
Clarus | | | | 27,603 | | 289,831 | |
Deckers Outdoor | | | | 10,109 | a | 1,845,196 | |
Helen of Troy | | | | 8,560 | a | 1,557,235 | |
Peloton Interactive, Cl. A | | | | 17,678 | a | 745,835 | |
Skyline Champion | | | | 36,388 | a | 903,878 | |
TopBuild | | | | 6,449 | a | 739,636 | |
| | | | | 9,052,170 | |
Consumer Services - 5.7% | | | | | |
BJ‘s Restaurants | | | | 29,668 | | 644,389 | |
Bloomin‘ Brands | | | | 55,668 | a,b | 635,172 | |
Bright Horizons Family Solutions | | | | 20,729 | a | 2,319,160 | |
Brinker International | | | | 28,946 | | 762,727 | |
Century Casinos | | | | 105,647 | a | 577,889 | |
Chegg | | | | 29,211 | a | 1,784,208 | |
Darden Restaurants | | | | 9,054 | | 695,890 | |
Draftkings, Cl. A | | | | 24,287 | a,b | 964,194 | |
Dunkin' Brands Group | | | | 7,916 | | 505,595 | |
Eldorado Resorts | | | | 64,771 | a,b | 2,296,779 | |
Frontdoor | | | | 16,906 | a | 771,759 | |
Grand Canyon Education | | | | 5,913 | a | 577,050 | |
Hilton Grand Vacations | | | | 29,846 | a | 642,883 | |
K12 | | | | 48,732 | a | 1,199,782 | |
Papa John's International | | | | 24,788 | | 1,930,737 | |
11
STATEMENT OF INVESTMENTS (continued)
| | | | | | | | |
| |
Description | | | | Shares | | Value ($) | |
Common Stocks - 96.7% (continued) | | | | | |
Consumer Services - 5.7% (continued) | | | | | |
Penn National Gaming | | | | 30,710 | a,b | 1,007,595 | |
Strategic Education | | | | 19,935 | | 3,381,574 | |
Texas Roadhouse | | | | 58,847 | | 3,051,217 | |
Vail Resorts | | | | 7,848 | b | 1,556,494 | |
Wingstop | | | | 15,626 | | 1,905,590 | |
| | | | | 27,210,684 | |
Diversified Financials - .6% | | | | | |
Encore Capital Group | | | | 34,160 | a | 1,085,263 | |
Evercore, Cl. A | | | | 7,169 | | 395,084 | |
Hercules Capital | | | | 59,274 | b | 660,312 | |
Houlihan Lokey | | | | 13,104 | | 792,530 | |
| | | | | 2,933,189 | |
Food & Staples Retailing - .7% | | | | | |
BJ's Wholesale Club Holdings | | | | 21,830 | a | 785,880 | |
Performance Food Group | | | | 49,242 | a | 1,312,299 | |
Sprouts Farmers Market | | | | 54,616 | a | 1,372,500 | |
| | | | | 3,470,679 | |
Food, Beverage & Tobacco - 2.0% | | | | | |
Celsius Holdings | | | | 86,433 | a | 801,234 | |
Freshpet | | | | 54,082 | a | 4,174,049 | |
J&J Snack Foods | | | | 15,099 | b | 1,942,184 | |
The Boston Beer Company, Cl. A | | | | 1,998 | a,b | 1,128,331 | |
The Hain Celestial Group | | | | 20,593 | a | 648,268 | |
The Simply Good Foods Company | | | | 36,315 | a | 618,444 | |
| | | | | 9,312,510 | |
Health Care Equipment & Services - 12.0% | | | | | |
Addus HomeCare | | | | 17,087 | a | 1,690,929 | |
Amedisys | | | | 3,500 | a | 672,175 | |
AMN Healthcare Services | | | | 22,020 | a | 976,807 | |
AtriCure | | | | 16,072 | a | 768,402 | |
Cantel Medical | | | | 17,196 | b | 723,608 | |
Chembio Diagnostics | | | | 52,696 | a | 507,462 | |
CryoPort | | | | 17,376 | a,b | 426,928 | |
Cytosorbents | | | | 60,002 | a,b | 612,620 | |
GenMark Diagnostics | | | | 59,309 | a | 562,842 | |
Globus Medical, Cl. A | | | | 32,228 | a | 1,761,260 | |
Guardant Health | | | | 4,214 | a,b | 380,903 | |
HealthEquity | | | | 28,628 | a | 1,774,077 | |
HealthStream | | | | 29,085 | a | 662,556 | |
iCAD | | | | 55,697 | a | 653,883 | |
Inovalon Holdings, Cl. A | | | | 83,057 | a | 1,563,133 | |
Inspire Medical Systems | | | | 18,309 | a | 1,492,917 | |
Insulet | | | | 4,922 | a | 928,142 | |
12
| | | | | | | | |
| |
Description | | | | Shares | | Value ($) | |
Common Stocks - 96.7% (continued) | | | | | |
Health Care Equipment & Services - 12.0% (continued) | | | | | |
iRhythm Technologies | | | | 8,108 | a,b | 1,007,905 | |
LeMaitre Vascular | | | | 31,624 | | 850,369 | |
LHC Group | | | | 24,008 | a | 3,901,540 | |
Livongo Health | | | | 33,509 | a | 2,008,195 | |
Masimo | | | | 16,801 | a | 4,035,433 | |
Neogen | | | | 28,803 | a | 2,051,350 | |
Nevro | | | | 7,753 | a | 973,777 | |
Novocure | | | | 26,851 | a | 1,810,563 | |
Omnicell | | | | 45,720 | a | 3,059,125 | |
OraSure Technologies | | | | 37,878 | a | 550,746 | |
Penumbra | | | | 8,361 | a,b | 1,441,604 | |
PetIQ | | | | 42,707 | a,b | 1,310,251 | |
Premier, Cl. A | | | | 85,193 | a | 2,963,864 | |
Quidel | | | | 4,643 | a | 812,525 | |
Silk Road Medical | | | | 12,381 | a | 473,821 | |
STAAR Surgical | | | | 46,818 | a,b | 1,816,538 | |
Tabula Rasa HealthCare | | | | 37,968 | a,b | 2,028,630 | |
Tactile Systems Technology | | | | 44,426 | a,b | 2,152,440 | |
Tandem Diabetes Care | | | | 30,247 | a | 2,515,038 | |
Teladoc Health | | | | 12,734 | a,b | 2,216,480 | |
U.S. Physical Therapy | | | | 9,946 | | 737,396 | |
Vapotherm | | | | 23,136 | | 616,112 | |
Vocera Communications | | | | 68,111 | a | 1,337,019 | |
| | | | | 56,829,365 | |
Household & Personal Products - 1.1% | | | | | |
Inter Parfums | | | | 22,852 | | 1,060,561 | |
Medifast | | | | 23,927 | b | 2,448,689 | |
USANA Health Sciences | | | | 6,038 | a | 511,539 | |
WD-40 | | | | 6,347 | b | 1,217,672 | |
| | | | | 5,238,461 | |
Insurance - 2.6% | | | | | |
eHealth | | | | 17,254 | a | 2,250,267 | |
Goosehead Insurance, Cl. A | | | | 21,646 | a,b | 1,297,678 | |
Horace Mann Educators | | | | 13,812 | | 504,414 | |
Kinsale Captial Group | | | | 32,160 | b | 4,802,131 | |
Palomar Holdings | | | | 47,094 | a | 3,504,735 | |
| | | | | 12,359,225 | |
Materials - 1.5% | | | | | |
Balchem | | | | 23,378 | | 2,352,996 | |
Ingevity | | | | 33,943 | a | 1,787,778 | |
Livent | | | | 59,287 | a,b | 399,594 | |
Materion | | | | 14,491 | | 760,777 | |
Novagold Resources | | | | 51,818 | a | 495,380 | |
13
STATEMENT OF INVESTMENTS (continued)
| | | | | | | | |
| |
Description | | | | Shares | | Value ($) | |
Common Stocks - 96.7% (continued) | | | | | |
Materials - 1.5% (continued) | | | | | |
Silgan Holdings | | | | 18,503 | | 618,740 | |
The Scotts Miracle-Gro Company | | | | 5,270 | | 751,344 | |
| | | | | 7,166,609 | |
Media & Entertainment - 1.4% | | | | | |
Cardlytics | | | | 6,548 | a,b | 445,853 | |
Criteo, ADR | | | | 42,817 | a | 438,874 | |
EverQuote, Cl. A | | | | 16,258 | a,b | 876,631 | |
Scholastic | | | | 22,820 | | 670,908 | |
The New York Times Company, Cl. A | | | | 26,118 | | 1,024,609 | |
World Wrestling Entertainment, Cl. A | | | | 44,070 | | 2,039,119 | |
Zynga, Cl. A | | | | 115,449 | a | 1,056,358 | |
| | | | | 6,552,352 | |
Pharmaceuticals Biotechnology & Life Sciences - 16.6% | | | | | |
ACADIA Pharmaceuticals | | | | 24,730 | a | 1,228,586 | |
Acceleron Pharma | | | | 10,445 | a | 1,032,279 | |
Adverum Biotechnologies | | | | 30,239 | a | 623,831 | |
Aerie Pharmaceuticals | | | | 63,550 | a,b | 891,607 | |
Aimmune Therapeutics | | | | 51,177 | a,b | 850,050 | |
Akebia Therapeutics | | | | 102,802 | a | 1,196,615 | |
Allogene Therapeutics | | | | 11,996 | a,b | 577,727 | |
Arcus Biosciences | | | | 16,000 | a | 501,600 | |
argenx, ADR | | | | 4,374 | a | 959,218 | |
Axsome Therapeutics | | | | 13,510 | a,b | 1,040,000 | |
BioCryst Pharmaceuticals | | | | 127,452 | a,b | 572,897 | |
Biohaven Pharmaceutical Holding | | | | 28,409 | a | 1,774,710 | |
BioSpecifics Technologies | | | | 15,346 | a | 954,521 | |
Bio-Techne | | | | 13,179 | | 3,489,799 | |
Bridgebio Pharma | | | | 14,561 | a | 427,074 | |
CareDx | | | | 94,647 | a,b | 3,040,061 | |
Castle Biosciences | | | | 15,051 | a,b | 578,410 | |
Charles River Laboratories International | | | | 4,027 | a | 723,491 | |
ChemoCentryx | | | | 14,263 | a | 889,869 | |
Coherus Biosciences | | | | 73,994 | a | 1,379,248 | |
Collegium Pharmaceutical | | | | 46,523 | a,b | 1,025,832 | |
Cytokinetics | | | | 28,642 | a,b | 593,176 | |
Deciphera Pharmaceuticals | | | | 12,606 | a | 738,333 | |
Emergent BioSolutions | | | | 42,680 | a | 3,563,353 | |
Esperion Therapeutics | | | | 8,879 | a,b | 376,203 | |
Exact Sciences | | | | 5,636 | a,b | 484,020 | |
Exelixis | | | | 25,329 | a | 625,880 | |
Fate Therapeutics | | | | 21,614 | a | 700,942 | |
Global Blood Therapeutics | | | | 22,214 | a | 1,553,203 | |
GW Pharmaceuticals, ADR | | | | 10,861 | a | 1,333,188 | |
14
| | | | | | | | |
| |
Description | | | | Shares | | Value ($) | |
Common Stocks - 96.7% (continued) | | | | | |
Pharmaceuticals Biotechnology & Life Sciences - 16.6% (continued) | | | | | |
Halozyme Therapeutics | | | | 95,235 | a | 2,311,354 | |
Horizon Therapeutics | | | | 75,288 | a | 3,819,361 | |
Immunomedics | | | | 111,227 | a,b | 3,736,115 | |
Insmed | | | | 20,103 | a | 488,302 | |
Iovance Biotherapeutics | | | | 84,034 | a,b | 2,696,651 | |
Kala Pharmaceuticals | | | | 60,583 | a,b | 745,777 | |
Karuna Therapeutics | | | | 5,710 | a | 535,941 | |
Karyopharm Therapeutics | | | | 65,927 | a,b | 1,218,991 | |
Krystal Biotech | | | | 10,472 | a,b | 538,366 | |
Ligand Pharmaceuticals | | | | 25,727 | a,b | 2,613,091 | |
Luminex | | | | 17,429 | | 543,088 | |
Medpace Holdings | | | | 18,381 | a | 1,706,124 | |
Momenta Pharmaceuticals | | | | 26,496 | a | 834,094 | |
MyoKardia | | | | 14,755 | a | 1,509,289 | |
Natera | | | | 41,243 | a | 1,808,505 | |
Nektar Therapeutics | | | | 32,967 | a,b | 715,384 | |
NeoGenomics | | | | 99,429 | a,b | 2,653,761 | |
Novavax | | | | 15,621 | a,b | 719,191 | |
Optinose | | | | 54,893 | a,b | 237,138 | |
Pacira Biosciences | | | | 23,067 | a,b | 1,013,795 | |
Prestige Consumer Healthcare | | | | 33,497 | a | 1,413,573 | |
Principia Biopharma | | | | 10,377 | a | 662,987 | |
PTC Therapeutics | | | | 19,450 | a | 986,309 | |
Puma Biotechnology | | | | 22,497 | a,b | 229,694 | |
Reata Pharmaceuticals, Cl. A | | | | 8,336 | a,b | 1,211,388 | |
Repligen | | | | 30,612 | a,b | 4,009,254 | |
Revance Therapeutics | | | | 45,624 | a,b | 953,542 | |
Sarepta Therapeutics | | | | 3,342 | a,b | 508,886 | |
Supernus Pharmaceuticals | | | | 45,495 | a | 1,097,339 | |
TG Therapeutics | | | | 35,265 | a | 657,692 | |
Turning Point Therapeutics | | | | 8,361 | a,b | 578,999 | |
Twist Bioscience | | | | 11,626 | a | 441,207 | |
uniQure | | | | 5,944 | a | 399,199 | |
Veracyte | | | | 30,900 | a,b | 770,646 | |
Zogenix | | | | 17,930 | a,b | 522,301 | |
| | | | | 78,613,057 | |
Real Estate - 1.7% | | | | | |
Corporate Office Properties Trust | | | | 18,240 | c | 455,453 | |
Hudson Pacific Properties | | | | 15,076 | c | 364,387 | |
Innovative Industrial Properties | | | | 6,131 | c | 501,025 | |
Marcus & Millichap | | | | 17,210 | a | 474,480 | |
Monmouth Real Estate Investment | | | | 43,332 | c | 562,449 | |
15
STATEMENT OF INVESTMENTS (continued)
| | | | | | | | |
| |
Description | | | | Shares | | Value ($) | |
Common Stocks - 96.7% (continued) | | | | | |
Real Estate - 1.7% (continued) | | | | | |
Physicians Realty Trust | | | | 31,290 | c | 540,378 | |
QTS Realty Trust, Cl. A | | | | 35,946 | c | 2,465,896 | |
RE/MAX Holdings, Cl. A | | | | 22,673 | | 634,617 | |
Redfin | | | | 27,050 | a | 811,229 | |
Terreno Realty | | | | 28,028 | c | 1,434,753 | |
| | | | | 8,244,667 | |
Retailing - 4.1% | | | | | |
Camping World Holdings, Cl. A | | | | 34,155 | b | 723,403 | |
Dick's Sporting Goods | | | | 32,296 | b | 1,164,594 | |
Etsy | | | | 42,321 | a | 3,427,155 | |
Five Below | | | | 7,494 | a | 784,247 | |
Floor & Decor Holdings, Cl. A | | | | 21,218 | a | 1,103,336 | |
Lithia Motors, Cl. A | | | | 9,777 | | 1,179,008 | |
Ollie's Bargain Outlet Holdings | | | | 37,491 | a,b | 3,428,552 | |
Points International | | | | 27,782 | a | 208,087 | |
Pool | | | | 13,246 | | 3,563,439 | |
Shutterstock | | | | 42,245 | | 1,601,930 | |
Sportsman's Warehouse Holdings | | | | 62,769 | a | 701,130 | |
Stamps.com | | | | 3,359 | a | 665,586 | |
Williams-Sonoma | | | | 8,374 | | 696,801 | |
| | | | | 19,247,268 | |
Semiconductors & Semiconductor Equipment - 6.5% | | | | | |
ACM Research, Cl. A | | | | 12,273 | a,b | 733,803 | |
Advanced Energy Industries | | | | 30,644 | a | 2,047,939 | |
Brooks Automation | | | | 19,661 | | 785,850 | |
CEVA | | | | 70,472 | a | 2,429,170 | |
Enphase Energy | | | | 14,699 | a,b | 855,335 | |
Entegris | | | | 9,697 | | 580,656 | |
FormFactor | | | | 19,945 | a | 502,016 | |
Inphi | | | | 55,651 | a | 6,993,662 | |
Lattice Semiconductor | | | | 169,703 | a | 4,220,514 | |
Monolithic Power Systems | | | | 27,316 | | 5,729,531 | |
ON Semiconductor | | | | 49,377 | a | 814,227 | |
Power Integrations | | | | 20,185 | | 2,187,045 | |
Semtech | | | | 52,710 | a | 2,803,118 | |
| | | | | 30,682,866 | |
Software & Services - 16.6% | | | | | |
2U | | | | 19,525 | a,b | 712,077 | |
ACI Worldwide | | | | 99,000 | a | 2,730,420 | |
Alarm.com Holdings | | | | 41,363 | a | 1,956,056 | |
Alteryx, Cl. A | | | | 3,601 | a,b | 518,328 | |
AppFolio, Cl. A | | | | 9,803 | a | 1,553,874 | |
Avalara | | | | 10,180 | | 1,089,871 | |
16
| | | | | | | | |
| |
Description | | | | Shares | | Value ($) | |
Common Stocks - 96.7% (continued) | | | | | |
Software & Services - 16.6% (continued) | | | | | |
Bill.Com Holdings | | | | 8,433 | a,b | 587,274 | |
Blackbaud | | | | 19,358 | | 1,134,572 | |
BlackLine | | | | 41,380 | a,b | 3,074,534 | |
Bottomline Technologies | | | | 36,218 | a | 1,832,631 | |
CACI International, Cl. A | | | | 7,026 | a | 1,761,980 | |
Cerence | | | | 21,445 | a,b | 641,420 | |
Cloudflare, Cl. A | | | | 29,572 | a,b | 859,658 | |
Cornerstone OnDemand | | | | 26,701 | a | 1,031,994 | |
Coupa Software | | | | 3,232 | a,b | 735,312 | |
Dynatrace | | | | 26,575 | a | 1,022,340 | |
Elastic | | | | 11,806 | a,b | 1,014,371 | |
Envestnet | | | | 38,049 | a | 2,762,738 | |
Euronet Worldwide | | | | 12,263 | a | 1,161,674 | |
Everbridge | | | | 22,142 | a,b | 3,238,489 | |
Evo Payments, Cl. A | | | | 68,635 | a | 1,519,579 | |
ExlService Holdings | | | | 27,177 | a | 1,662,417 | |
Fair Isaac | | | | 9,270 | a | 3,732,565 | |
Fastly, CI. A | | | | 22,218 | a,b | 958,485 | |
Five9 | | | | 47,271 | a | 4,925,638 | |
I3 Verticals, Cl. A | | | | 33,052 | a | 953,881 | |
j2 Global | | | | 30,349 | b | 2,376,327 | |
Limelight Networks | | | | 1,244 | a | 6,145 | |
LivePerson | | | | 73,702 | a,b | 2,760,140 | |
ManTech International, Cl. A | | | | 7,377 | | 573,488 | |
MAXIMUS | | | | 25,973 | | 1,870,575 | |
Medallia | | | | 53,088 | a,b | 1,501,329 | |
Nuance Communications | | | | 31,840 | a,b | 728,499 | |
Pegasystems | | | | 5,472 | | 520,497 | |
Q2 Holdings | | | | 23,765 | a,b | 1,963,464 | |
Qualys | | | | 15,726 | a,b | 1,813,522 | |
Smartsheet, Cl. A | | | | 19,658 | a | 1,133,480 | |
SolarWinds | | | | 29,225 | | 534,525 | |
SPS Commerce | | | | 10,848 | a | 739,400 | |
Switch, Cl. A | | | | 56,664 | | 1,082,849 | |
The Descartes Systems Group | | | | 67,430 | a | 3,208,994 | |
The Trade Desk, Cl. A | | | | 7,372 | a,b | 2,296,820 | |
TTEC Holdings | | | | 13,249 | | 561,228 | |
Tyler Technologies | | | | 6,959 | a | 2,611,782 | |
Wix.com | | | | 20,936 | a | 4,654,701 | |
WNS Holdings, ADR | | | | 48,883 | a | 2,363,004 | |
Workiva | | | | 34,675 | a | 1,544,424 | |
Zscaler | | | | 6,875 | a,b | 674,369 | |
| | | | | 78,691,740 | |
17
STATEMENT OF INVESTMENTS (continued)
| | | | | | | | |
| |
Description | | | | Shares | | Value ($) | |
Common Stocks - 96.7% (continued) | | | | | |
Technology Hardware & Equipment - 2.4% | | | | | |
Calix | | | | 51,057 | a | 719,904 | |
Ciena | | | | 13,987 | a | 772,922 | |
ePlus | | | | 21,226 | a | 1,564,568 | |
Fabrinet | | | | 5,712 | a | 365,225 | |
FLIR Systems | | | | 12,229 | | 564,980 | |
II-VI | | | | 16,561 | a,b | 787,144 | |
Inseego | | | | 55,750 | a,b | 592,065 | |
Insight Enterprises | | | | 20,304 | a | 1,040,783 | |
Ituran Location and Control | | | | 10,693 | | 182,957 | |
Knowles | | | | 41,797 | a | 628,627 | |
Novanta | | | | 19,325 | a | 1,984,871 | |
Radware | | | | 44,663 | a | 1,063,873 | |
Rogers | | | | 10,255 | a | 1,110,206 | |
| | | | | 11,378,125 | |
Telecommunication Services - 1.1% | | | | | |
Anterix | | | | 12,100 | a | 648,560 | |
Bandwidth, Cl. A | | | | 7,272 | a | 806,101 | |
Boingo Wireless | | | | 169,977 | a | 2,328,685 | |
Cogent Communications Holdings | | | | 11,695 | | 894,901 | |
Shenandoah Telecommunication | | | | 12,490 | a | 657,099 | |
| | | | | 5,335,346 | |
Transportation - 2.6% | | | | | |
Allegiant Travel | | | | 12,937 | | 1,378,437 | |
Echo Global Logistics | | | | 52,881 | a | 1,094,637 | |
Hub Group, Cl. A | | | | 14,965 | a | 699,913 | |
Kirby | | | | 13,340 | a | 684,075 | |
Marten Transport | | | | 112,736 | | 2,884,914 | |
Saia | | | | 12,448 | a | 1,349,861 | |
SkyWest | | | | 22,768 | | 730,170 | |
TFI International | | | | 39,001 | | 1,180,560 | |
Werner Enterprises | | | | 17,624 | | 814,581 | |
XPO Logistics | | | | 20,153 | a,b | 1,588,258 | |
| | | | | 12,405,406 | |
Utilities - .3% | | | | | |
California Water Service Group | | | | 14,456 | | 679,432 | |
SJW Group | | | | 12,365 | | 777,017 | |
| | | | | 1,456,449 | |
Total Common Stocks (cost $328,898,179) | | | | 457,822,234 | |
18
| | | | | | | | |
| |
Description | | 1-Day
Yield (%) | | Shares | | Value ($) | |
Investment Companies - 3.4% | | | | | |
Registered Investment Companies - 3.4% | | | | | |
Dreyfus Institutional Preferred Government Plus Money Market Fund
(cost $16,250,223) | | 0.21 | | 16,250,223 | d | 16,250,223 | |
| | | | | | | | |
Investment of Cash Collateral for Securities Loaned - 2.9% | | | | | |
Registered Investment Companies - 2.9% | | | | | |
Dreyfus Institutional Preferred Government Plus Money Market Fund
(cost $13,516,196) | | 0.21 | | 13,516,196 | d | 13,516,196 | |
Total Investments (cost $358,664,598) | | 103.0% | | 487,588,653 | |
Liabilities, Less Cash and Receivables | | (3.0%) | | (14,182,363) | |
Net Assets | | 100.0% | | 473,406,290 | |
ADR—American Depository Receipt
a Non-income producing security.
b Security, or portion thereof, on loan. At May 31, 2020, the value of the fund’s securities on loan was $79,882,674 and the value of the collateral was $81,010,117, consisting of cash collateral of $13,516,196 and U.S. Government & Agency securities valued at $67,493,921.
c Investment in real estate investment trust within the United States.
d Investment in affiliated issuer. The investment objective of this investment company is publicly available and can be found within the investment company’s prospectus.
| | |
Portfolio Summary (Unaudited) † | Value (%) |
Health Care | 28.6 |
Information Technology | 25.5 |
Industrials | 13.7 |
Consumer Discretionary | 13.7 |
Investment Companies | 6.3 |
Financials | 5.3 |
Consumer Staples | 3.8 |
Communication Services | 2.5 |
Real Estate | 1.8 |
Materials | 1.5 |
Utilities | .3 |
| | 103.0 |
† Based on net assets.
See notes to financial statements.
19
STATEMENT OF INVESTMENTS IN AFFILIATED ISSUERS
| | | | | | | |
Investment Companies | Value
5/31/19($) | Purchases($) | Sales($) | Value
5/31/20($) | Net
Assets(%) | Dividends/ Distributions($) |
Registered Investment Companies; | | | | |
Dreyfus Institutional Preferred Government Plus Money Market Fund | 22,159,636 | 361,797,005 | (367,706,418) | 16,250,223 | 3.4 | 309,124 |
Investment of Cash Collateral for Securities Loaned; | | | |
Dreyfus Institutional Preferred Government Plus Money Market Fund | 8,554,144 | 140,121,494 | (135,159,442) | 13,516,196 | 2.9 | - |
Total | 30,713,780 | 501,918,499 | (502,865,860) | 29,766,419 | 6.3 | 309,124 |
See notes to financial statements.
20
STATEMENT OF ASSETS AND LIABILITIES
May 31, 2020
| | | | | | | |
| | | | | | |
| | | Cost | | Value | |
Assets ($): | | | | |
Investments in securities—See Statement of Investments
(including securities on loan, valued at $79,882,674)—Note 1(c): | | | |
Unaffiliated issuers | 328,898,179 | | 457,822,234 | |
Affiliated issuers | | 29,766,419 | | 29,766,419 | |
Cash | | | | | 148,035 | |
Receivable for investment securities sold | | 2,060,215 | |
Receivable for shares of Common Stock subscribed | | 770,569 | |
Dividends and securities lending income receivable | | 150,485 | |
Tax reclaim receivable | | 442 | |
Prepaid expenses | | | | | 45,255 | |
| | | | | 490,763,654 | |
Liabilities ($): | | | | |
Due to BNY Mellon Investment Adviser, Inc. and affiliates—Note 3(c) | | 367,059 | |
Liability for securities on loan—Note 1(c) | | 13,516,196 | |
Payable for investment securities purchased | | 3,238,585 | |
Payable for shares of Common Stock redeemed | | 126,539 | |
Directors’ fees and expenses payable | | 11,344 | |
Other accrued expenses | | | | | 97,641 | |
| | | | | 17,357,364 | |
Net Assets ($) | | | 473,406,290 | |
Composition of Net Assets ($): | | | | |
Paid-in capital | | | | | 351,283,019 | |
Total distributable earnings (loss) | | | | | 122,123,271 | |
Net Assets ($) | | | 473,406,290 | |
| | | | | | |
Net Asset Value Per Share | Class A | Class C | Class I | Class Y | |
Net Assets ($) | 1,326,067 | 459,837 | 8,825,758 | 462,794,628 | |
Shares Outstanding | 56,120 | 21,654 | 358,398 | 18,765,808 | |
Net Asset Value Per Share ($) | 23.63 | 21.24 | 24.63 | 24.66 | |
| | | | | |
See notes to financial statements. | | | | | |
21
STATEMENT OF OPERATIONS
Year Ended May 31, 2020
| | | | | | | |
| | | | | | |
| | | | | | |
Investment Income ($): | | | | |
Income: | | | | |
Cash dividends (net of $7,906 foreign taxes withheld at source): | |
Unaffiliated issuers | | | 2,634,999 | |
Affiliated issuers | | | 309,124 | |
Income from securities lending—Note 1(c) | | | 303,962 | |
Interest | | | 8,625 | |
Total Income | | | 3,256,710 | |
Expenses: | | | | |
Management fee—Note 3(a) | | | 4,680,602 | |
Professional fees | | | 87,929 | |
Registration fees | | | 68,730 | |
Directors’ fees and expenses—Note 3(d) | | | 53,691 | |
Custodian fees—Note 3(c) | | | 52,421 | |
Chief Compliance Officer fees—Note 3(c) | | | 29,562 | |
Shareholder servicing costs—Note 3(c) | | | 15,549 | |
Loan commitment fees—Note 2 | | | 11,792 | |
Prospectus and shareholders’ reports | | | 4,859 | |
Distribution fees—Note 3(b) | | | 3,530 | |
Miscellaneous | | | 27,827 | |
Total Expenses | | | 5,036,492 | |
Less—reduction in expenses due to undertaking—Note 3(a) | | | (1,787) | |
Net Expenses | | | 5,034,705 | |
Investment (Loss)—Net | | | (1,777,995) | |
Realized and Unrealized Gain (Loss) on Investments—Note 4 ($): | | |
Net realized gain (loss) on investments | 24,126,802 | |
Net change in unrealized appreciation (depreciation) on investments | 7,549,955 | |
Net Realized and Unrealized Gain (Loss) on Investments | | | 31,676,757 | |
Net Increase in Net Assets Resulting from Operations | | 29,898,762 | |
| | | | | | |
See notes to financial statements. | | | | | |
22
STATEMENT OF CHANGES IN NET ASSETS
| | | | | | | | | | |
| | | | Year Ended May 31, |
| | | | 2020 | | 2019 | |
Operations ($): | | | | | | | | |
Investment (loss)—net | | | (1,777,995) | | | | (2,346,162) | |
Net realized gain (loss) on investments | | 24,126,802 | | | | 54,704,235 | |
Net change in unrealized appreciation
(depreciation) on investments | | 7,549,955 | | | | (90,428,067) | |
Net Increase (Decrease) in Net Assets
Resulting from Operations | 29,898,762 | | | | (38,069,994) | |
Distributions ($): | |
Distributions to shareholders: | | | | | | | | |
Class A | | | (78,901) | | | | (300,893) | |
Class C | | | (24,727) | | | | (97,308) | |
Class I | | | (711,853) | | | | (3,269,623) | |
Class Y | | | (25,636,220) | | | | (98,523,649) | |
Total Distributions | | | (26,451,701) | | | | (102,191,473) | |
Capital Stock Transactions ($): | |
Net proceeds from shares sold: | | | | | | | | |
Class A | | | 88,660 | | | | 388,146 | |
Class C | | | 59,800 | | | | 117,526 | |
Class I | | | 8,585,625 | | | | 15,250,615 | |
Class Y | | | 65,152,293 | | | | 77,179,954 | |
Distributions reinvested: | | | | | | | | |
Class A | | | 78,191 | | | | 285,487 | |
Class C | | | 24,297 | | | | 95,838 | |
Class I | | | 563,828 | | | | 2,544,517 | |
Class Y | | | 11,372,693 | | | | 41,630,272 | |
Cost of shares redeemed: | | | | | | | | |
Class A | | | (504,396) | | | | (771,412) | |
Class C | | | (110,403) | | | | (192,102) | |
Class I | | | (12,409,117) | | | | (17,108,853) | |
Class Y | | | (137,311,989) | | | | (261,997,698) | |
Increase (Decrease) in Net Assets
from Capital Stock Transactions | (64,410,518) | | | | (142,577,710) | |
Total Increase (Decrease) in Net Assets | (60,963,457) | | | | (282,839,177) | |
Net Assets ($): | |
Beginning of Period | | | 534,369,747 | | | | 817,208,924 | |
End of Period | | | 473,406,290 | | | | 534,369,747 | |
23
STATEMENT OF CHANGES IN NET ASSETS (continued)
| | | | | | | | | | |
| | | | Year Ended May 31, |
| | | | 2020 | | 2019 | |
Capital Share Transactions (Shares): | |
Class Aa,b | | | | | | | | |
Shares sold | | | 3,973 | | | | 13,108 | |
Shares issued for distributions reinvested | | | 3,189 | | | | 13,913 | |
Shares redeemed | | | (21,374) | | | | (28,918) | |
Net Increase (Decrease) in Shares Outstanding | (14,212) | | | | (1,897) | |
Class Cb | | | | | | | | |
Shares sold | | | 2,945 | | | | 4,129 | |
Shares issued for distributions reinvested | | | 1,099 | | | | 5,120 | |
Shares redeemed | | | (5,066) | | | | (8,353) | |
Net Increase (Decrease) in Shares Outstanding | (1,022) | | | | 896 | |
Class Ia | | | | | | | | |
Shares sold | | | 348,117 | | | | 540,784 | |
Shares issued for distributions reinvested | | | 22,093 | | | | 119,629 | |
Shares redeemed | | | (550,314) | | | | (677,394) | |
Net Increase (Decrease) in Shares Outstanding | (180,104) | | | | (16,981) | |
Class Ya | | | | | | | | |
Shares sold | | | 2,883,667 | | | | 2,932,914 | |
Shares issued for distributions reinvested | | | 445,115 | | | | 1,956,310 | |
Shares redeemed | | | (6,141,532) | | | | (10,113,225) | |
Net Increase (Decrease) in Shares Outstanding | (2,812,750) | | | | (5,224,001) | |
| | | | | | | | | |
aDuring the period ended May 31, 2020, 338,269 Class Y shares representing $8,350,393 were exchanged 338,644 Class I shares and 350 Class Y shares representing $9,247 were exchanged for 364 Class A shares. During the period ended May 31, 2019, 510,689 Class Y shares representing $14,339,294 were exchanged for 510,978 Class I shares. | |
bDuring the period ended May 31, 2020, 88 Class C shares representing $1,953 were automatically converted to 80 Class A shares. | |
See notes to financial statements. | | | | | | | | |
24
FINANCIAL HIGHLIGHTS
The following tables describe the performance for each share class for the fiscal periods indicated. All information (except portfolio turnover rate) reflects financial results for a single fund share. Total return shows how much your investment in the fund would have increased (or decreased) during each period, assuming you had reinvested all dividends and distributions. These figures have been derived from the fund’s financial statements.
| | | | | | | |
| | |
| | Year Ended May 31, |
Class A Shares | | 2020 | 2019 | 2018 | 2017 | 2016 |
Per Share Data ($): | | | | | | |
Net asset value, beginning of period | | 23.18 | 28.94 | 24.54 | 20.41 | 24.84 |
Investment Operations: | | | | | | |
Investment (loss)—neta | | (.16) | (.18) | (.15) | (.13) | (.15) |
Net realized and unrealized
gain (loss) on investments | | 1.87 | (1.28) | 6.36 | 4.26 | (2.76) |
Total from Investment Operations | | 1.71 | (1.46) | 6.21 | 4.13 | (2.91) |
Distributions: | | | | | | |
Dividends from net realized
gain on investments | | (1.26) | (4.30) | (1.81) | - | (1.52) |
Net asset value, end of period | | 23.63 | 23.18 | 28.94 | 24.54 | 20.41 |
Total Return (%)b | | 7.19 | (3.11) | 26.05 | 20.24 | (11.99) |
Ratios/Supplemental Data (%): | | | | | | |
Ratio of total expenses
to average net assets | | 1.39 | 1.40 | 1.29 | 1.28 | 1.29 |
Ratio of net expenses
to average net assets | | 1.30 | 1.30 | 1.28 | 1.28 | 1.29 |
Ratio of net investment (loss)
to average net assets | | (.68) | (.68) | (.56) | (.60) | (.66) |
Portfolio Turnover Rate | | 105.26 | 101.14 | 95.50 | 138.00 | 125.11 |
Net Assets, end of period ($ x 1,000) | | 1,326 | 1,630 | 2,090 | 2,819 | 3,716 |
a Based on average shares outstanding.
b Exclusive of sales charge.
See notes to financial statements.
25
FINANCIAL HIGHLIGHTS (continued)
| | | | | | | |
| | |
| | Year Ended May 31, |
Class C Shares | | 2020 | 2019 | 2018 | 2017 | 2016 |
Per Share Data ($): | | | | | | |
Net asset value, beginning of period | | 21.10 | 26.95 | 23.13 | 19.39 | 23.85 |
Investment Operations: | | | | | | |
Investment (loss)—neta | | (.31) | (.35) | (.33) | (.31) | (.30) |
Net realized and unrealized
gain (loss) on investments | | 1.71 | (1.20) | 5.96 | 4.05 | (2.64) |
Total from Investment Operations | | 1.40 | (1.55) | 5.63 | 3.74 | (2.94) |
Distributions: | | | | | | |
Dividends from net realized
gain on investments | | (1.26) | (4.30) | (1.81) | - | (1.52) |
Net asset value, end of period | | 21.24 | 21.10 | 26.95 | 23.13 | 19.39 |
Total Return (%)b | | 6.41 | (3.71) | 25.11 | 19.29 | (12.67) |
Ratios/Supplemental Data (%): | | | | | | |
Ratio of total expenses
to average net assets | | 2.16 | 2.33 | 2.23 | 2.27 | 2.39 |
Ratio of net expenses
to average net assets | | 2.05 | 2.05 | 2.05 | 2.05 | 2.05 |
Ratio of net investment (loss)
to average net assets | | (1.43) | (1.43) | (1.37) | (1.39) | (1.42) |
Portfolio Turnover Rate | | 105.26 | 101.14 | 95.50 | 138.00 | 125.11 |
Net Assets, end of period ($ x 1,000) | | 460 | 479 | 587 | 323 | 253 |
a Based on average shares outstanding.
b Exclusive of sales charge.
See notes to financial statements.
26
| | | | | | | |
| | |
| | Year Ended May 31, |
Class I Shares | | 2020 | 2019 | 2018 | 2017 | 2016 |
Per Share Data ($): | | | | | | |
Net asset value, beginning of period | | 24.05 | 29.76 | 25.12 | 20.84 | 25.25 |
Investment Operations: | | | | | | |
Investment (loss)—neta | | (.09) | (.10) | (.07) | (.08) | (.08) |
Net realized and unrealized
gain (loss) on investments | | 1.93 | (1.31) | 6.52 | 4.36 | (2.81) |
Total from Investment Operations | | 1.84 | (1.41) | 6.45 | 4.28 | (2.89) |
Distributions: | | | | | | |
Dividends from net realized
gain on investments | | (1.26) | (4.30) | (1.81) | - | (1.52) |
Net asset value, end of period | | 24.63 | 24.05 | 29.76 | 25.12 | 20.84 |
Total Return (%) | | 7.52 | (2.88) | 26.42 | 20.54 | (11.71) |
Ratios/Supplemental Data (%): | | | | | | |
Ratio of total expenses
to average net assets | | 1.01 | .98 | .99 | 1.03 | .98 |
Ratio of net expenses
to average net assets | | 1.01 | .98 | .98 | 1.01 | .98 |
Ratio of net investment (loss)
to average net assets | | (.37) | (.35) | (.26) | (.33) | (.35) |
Portfolio Turnover Rate | | 105.26 | 101.14 | 95.50 | 138.00 | 125.11 |
Net Assets, end of period ($ x 1,000) | | 8,826 | 12,949 | 16,532 | 11,777 | 19,373 |
a Based on average shares outstanding.
See notes to financial statements.
27
FINANCIAL HIGHLIGHTS (continued)
| | | | | | | |
| | |
| | Year Ended May 31, |
Class Y Shares | | 2020 | 2019 | 2018 | 2017 | 2016 |
Per Share Data ($): | | | | | | |
Net asset value, beginning of period | | 24.07 | 29.77 | 25.12 | 20.83 | 25.23 |
Investment Operations: | | | | | | |
Investment (loss)—neta | | (.08) | (.09) | (.06) | (.07) | (.07) |
Net realized and unrealized
gain (loss) on investments | | 1.93 | (1.31) | 6.52 | 4.36 | (2.81) |
Total from Investment Operations | | 1.85 | (1.40) | 6.46 | 4.29 | (2.88) |
Distributions: | | | | | | |
Dividends from net realized
gain on investments | | (1.26) | (4.30) | (1.81) | - | (1.52) |
Net asset value, end of period | | 24.66 | 24.07 | 29.77 | 25.12 | 20.83 |
Total Return (%) | | 7.56 | (2.84) | 26.46 | 20.60 | (11.68) |
Ratios/Supplemental Data (%): | | | | | | |
Ratio of total expenses
to average net assets | | .97 | .95 | .95 | .96 | .96 |
Ratio of net expenses
to average net assets | | .97 | .95 | .94 | .96 | .96 |
Ratio of net investment (loss)
to average net assets | | (.34) | (.34) | (.21) | (.28) | (.33) |
Portfolio Turnover Rate | | 105.26 | 101.14 | 95.50 | 138.00 | 125.11 |
Net Assets, end of period ($ x 1,000) | | 462,795 | 519,312 | 798,000 | 624,947 | 531,507 |
a Based on average shares outstanding.
See notes to financial statements.
28
NOTES TO FINANCIAL STATEMENTS
NOTE 1—Significant Accounting Policies:
BNY Mellon Select Managers Small Cap Growth Fund (the “fund”) is a separate non-diversified series of BNY Mellon Strategic Funds, Inc. (the “Company”), which is registered under the Investment Company Act of 1940, as amended (the “Act”), as an open-end management investment company and operates as a series company currently offering six series, including the fund. The fund’s investment objective is to seek capital appreciation. BNY Mellon Investment Adviser, Inc. (the “Adviser”), a wholly-owned subsidiary of The Bank of New York Mellon Corporation (“BNY Mellon”), serves as the fund’s investment adviser and the fund’s portfolio allocation manager. Geneva Capital Management LLC (“Geneva”), Nicholas Investment Partners, L.P. (“Nicholas”), EAM Investors, LLC (“EAM”), Granite Investment Partners, LLC (“Granite”), Rice Hall James & Associates (“Rice Hall”) and Redwood Investments, LLC (“Redwood”), serve as the fund’s sub-investment advisers, each managing an allocated portion of the fund’s portfolio.
The Company’s Board of Directors (the “Board”) approved, effective December 31, 2019 (the “Effective Date”), the termination of the fund’s authorized Class T shares. Prior to the Effective Date, the fund did not offer such Class T shares for purchase. The authorized Class T shares were reallocated to authorized Class Y shares, increasing authorized Class Y shares from 100 million to 200 million.
Effective June 3, 2019, the fund changed its name from Dreyfus Select Managers Small Cap Growth Fund to BNY Mellon Select Managers Small Cap Growth Fund and the Company changed its name from Strategic Funds, Inc. to BNY Mellon Strategic Funds, Inc. In addition, The Dreyfus Corporation, the fund’s investment adviser, changed its name to “BNY Mellon Investment Adviser, Inc.”, MBSC Securities Corporation, the fund’s distributor, changed its name to “BNY Mellon Securities Corporation” and Dreyfus Transfer, Inc., the fund’s transfer agent, changed its name to “BNY Mellon Transfer, Inc.”
BNY Mellon Securities Corporation (the “Distributor”), a wholly-owned subsidiary of the Adviser, is the distributor of the fund’s shares. The fund is authorized to issue 425 million shares of $.001 par value Common Stock. The fund currently has authorized four classes of shares: Class A (75 million shares authorized), Class C (75 million shares authorized), Class I (75 million shares authorized) and Class Y (200 million shares authorized). Class A shares generally are subject to a sales charge imposed at the time of purchase. Class C shares are subject to a contingent deferred
29
NOTES TO FINANCIAL STATEMENTS (continued)
sales charge (“CDSC”) imposed on Class C shares redeemed within one year of purchase. Class C shares automatically convert to Class A shares ten years after the date of purchase, without the imposition of a sales charge. Class I and Class Y shares are sold at net asset value per share generally to institutional investors. Other differences between the classes include the services offered to and the expenses borne by each class, the allocation of certain transfer agency costs and certain voting rights. Income, expenses (other than expenses attributable to a specific class), and realized and unrealized gains or losses on investments are allocated to each class of shares based on its relative net assets.
The Company accounts separately for the assets, liabilities and operations of each series. Expenses directly attributable to each series are charged to that series’ operations; expenses which are applicable to all series are allocated among them on a pro rata basis.
The Financial Accounting Standards Board (“FASB”) Accounting Standards Codification (“ASC”) is the exclusive reference of authoritative U.S. generally accepted accounting principles (“GAAP”) recognized by the FASB to be applied by nongovernmental entities. Rules and interpretive releases of the Securities and Exchange Commission (“SEC”) under authority of federal laws are also sources of authoritative GAAP for SEC registrants. The fund is an investment company and applies the accounting and reporting guidance of the FASB ASC Topic 946 Financial Services-Investment Companies. The fund’s financial statements are prepared in accordance with GAAP, which may require the use of management estimates and assumptions. Actual results could differ from those estimates.
The Company enters into contracts that contain a variety of indemnifications. The fund’s maximum exposure under these arrangements is unknown. The fund does not anticipate recognizing any loss related to these arrangements.
(a) Portfolio valuation: The fair value of a financial instrument is the amount that would be received to sell an asset or paid to transfer a liability in an orderly transaction between market participants at the measurement date (i.e., the exit price). GAAP establishes a fair value hierarchy that prioritizes the inputs of valuation techniques used to measure fair value. This hierarchy gives the highest priority to unadjusted quoted prices in active markets for identical assets or liabilities (Level 1 measurements) and the lowest priority to unobservable inputs (Level 3 measurements).
Additionally, GAAP provides guidance on determining whether the volume and activity in a market has decreased significantly and whether
30
such a decrease in activity results in transactions that are not orderly. GAAP requires enhanced disclosures around valuation inputs and techniques used during annual and interim periods.
Various inputs are used in determining the value of the fund’s investments relating to fair value measurements. These inputs are summarized in the three broad levels listed below:
Level 1—unadjusted quoted prices in active markets for identical investments.
Level 2—other significant observable inputs (including quoted prices for similar investments, interest rates, prepayment speeds, credit risk, etc.).
Level 3—significant unobservable inputs (including the fund’s own assumptions in determining the fair value of investments).
The inputs or methodology used for valuing securities are not necessarily an indication of the risk associated with investing in those securities.
Changes in valuation techniques may result in transfers in or out of an assigned level within the disclosure hierarchy. Valuation techniques used to value the fund’s investments are as follows:
Investments in equity securities are valued at the last sales price on the securities exchange or national securities market on which such securities are primarily traded. Securities listed on the National Market System for which market quotations are available are valued at the official closing price or, if there is no official closing price that day, at the last sales price. For open short positions, asked prices are used for valuation purposes. Bid price is used when no asked price is available. Registered investment companies that are not traded on an exchange are valued at their net asset value. All of the preceding securities are generally categorized within Level 1 of the fair value hierarchy.
Securities not listed on an exchange or the national securities market, or securities for which there were no transactions, are valued at the average of the most recent bid and asked prices. These securities are generally categorized within Level 2 of the fair value hierarchy.
Fair valuing of securities may be determined with the assistance of a pricing service using calculations based on indices of domestic securities and other appropriate indicators, such as prices of relevant ADRs and futures. Utilizing these techniques may result in transfers between Level 1 and Level 2 of the fair value hierarchy.
31
NOTES TO FINANCIAL STATEMENTS (continued)
When market quotations or official closing prices are not readily available, or are determined not to accurately reflect fair value, such as when the value of a security has been significantly affected by events after the close of the exchange or market on which the security is principally traded (for example, a foreign exchange or market), but before the fund calculates its net asset value, the fund may value these investments at fair value as determined in accordance with the procedures approved by the Board. Certain factors may be considered when fair valuing investments such as: fundamental analytical data, the nature and duration of restrictions on disposition, an evaluation of the forces that influence the market in which the securities are purchased and sold, and public trading in similar securities of the issuer or comparable issuers. These securities are either categorized within Level 2 or 3 of the fair value hierarchy depending on the relevant inputs used.
For securities where observable inputs are limited, assumptions about market activity and risk are used and such securities are generally categorized within Level 3 of the fair value hierarchy.
The following is a summary of the inputs used as of May 31, 2020 in valuing the fund’s investments:
| | | | | |
| | Level 1 Unadjusted Quoted Prices | Level 2 - Other Significant Observable Inputs | Level 3 Significant Unobservable Inputs | Total |
Assets ($) |
Investments in Securities: |
Equity Securities - Common Stocks† | 457,822,234 | - | - | 457,822,234 |
Investment Companies | 29,766,419 | - | - | 29,766,419 |
† See Statement of Investments for additional detailed categorizations, if any.
(b) Foreign Taxes: The fund may be subject to foreign taxes (a portion of which may be reclaimable) on income, stock dividends, realized and unrealized capital gains on investments or certain foreign currency transactions. Foreign taxes are recorded in accordance with the fund’s understanding of the applicable foreign tax regulations and rates that exist in the foreign jurisdictions in which the fund invests. These foreign taxes, if any, are paid by the fund and are reflected in the Statements of Operations. Foreign taxes payable or deferred as of May 31, 2020, if any, are disclosed in the fund’s Statements of Assets and Liabilities.
(c) Securities transactions and investment income: Securities transactions are recorded on a trade date basis. Realized gains and losses from securities transactions are recorded on the identified cost basis. Dividend income is recognized on the ex-dividend date and interest
32
income, including, where applicable, accretion of discount and amortization of premium on investments, is recognized on the accrual basis.
Pursuant to a securities lending agreement with The Bank of New York Mellon, a subsidiary of BNY Mellon and an affiliate of the Adviser, the fund may lend securities to qualified institutions. It is the fund’s policy that, at origination, all loans are secured by collateral of at least 102% of the value of U.S. securities loaned and 105% of the value of foreign securities loaned. Collateral equivalent to at least 100% of the market value of securities on loan is maintained at all times. Collateral is either in the form of cash, which can be invested in certain money market mutual funds managed by the Adviser, or U.S. Government and Agency securities. The fund is entitled to receive all dividends, interest and distributions on securities loaned, in addition to income earned as a result of the lending transaction. Should a borrower fail to return the securities in a timely manner, The Bank of New York Mellon is required to replace the securities for the benefit of the fund or credit the fund with the market value of the unreturned securities and is subrogated to the fund’s rights against the borrower and the collateral. Additionally, the contractual maturity of security lending transactions are on an overnight and continuous basis. During the period ended May 31, 2020, The Bank of New York Mellon earned $58,281 from the lending of the fund’s portfolio securities, pursuant to the securities lending agreement.
(d) Affiliated issuers: Investments in other investment companies advised by the Adviser are considered “affiliated” under the Act.
(e) Risk: Certain events particular to the industries in which the fund’s investments conduct their operations, as well as general economic, political and public health conditions, may have a significant negative impact on the investee’s operations and profitability. In addition, turbulence in financial markets and reduced liquidity in equity, credit and/or fixed income markets may negatively affect many issuers, which could adversely affect the fund. Global economies and financial markets are becoming increasingly interconnected, and conditions and events in one country, region or financial market may adversely impact issuers in a different country, region or financial market. These risks may be magnified if certain events or developments adversely interrupt the global supply chain; in these and other circumstances, such risks might affect companies world-wide. Recent examples include pandemic risks related to COVID-19 and aggressive measures taken world-wide in response by governments, including closing borders, restricting international and domestic travel, and the imposition of prolonged quarantines of large populations, and by
33
NOTES TO FINANCIAL STATEMENTS (continued)
businesses, including changes to operations and reducing staff. To the extent the fund may overweight its investments in certain countries, companies, industries or market sectors, such positions will increase the fund’s exposure to risk of loss from adverse developments affecting those countries, companies, industries or sectors.
(f) Dividends and distributions to shareholders: Dividends and distributions are recorded on the ex-dividend date. Dividends from investment income-net and dividends from net realized capital gains, if any, are normally declared and paid annually, but the fund may make distributions on a more frequent basis to comply with the distribution requirements of the Internal Revenue Code of 1986, as amended (the “Code”). To the extent that net realized capital gains can be offset by capital loss carryovers, it is the policy of the fund not to distribute such gains. Income and capital gain distributions are determined in accordance with income tax regulations, which may differ from GAAP.
(g) Federal income taxes: It is the policy of the fund to continue to qualify as a regulated investment company, if such qualification is in the best interests of its shareholders, by complying with the applicable provisions of the Code, and to make distributions of taxable income and net realized capital gain sufficient to relieve it from substantially all federal income and excise taxes.
As of and during the period ended May 31, 2020, the fund did not have any liabilities for any uncertain tax positions. The fund recognizes interest and penalties, if any, related to uncertain tax positions as income tax expense in the Statement of Operations. During the period ended May 31, 2020, the fund did not incur any interest or penalties.
Each tax year for the four-year period ended May 31, 2020 remains subject to examination by the Internal Revenue Service and state taxing authorities.
At May 31, 2020, the components of accumulated earnings on a tax basis were as follows: undistributed capital gains $5,995,956 and unrealized appreciation $116,949,661. In addition, the fund deferred for tax purposes late year ordinary losses of $822,346 to the first day of the following fiscal year.
The tax character of distributions paid to shareholders during the fiscal periods ended May 31, 2020 and May 31, 2019 were as follows: ordinary income $0 and $17,296,566, and long-term capital gains $26,451,701 and $84,894,907, respectively.
34
During the period ended May 31, 2020, as a result of permanent book to tax differences, primarily due to the tax treatment for treating a portion of the proceeds from the redemptions as a distribution for tax purposes and net operating losses, the fund decreased total distributable earnings (loss) by $4,786,663 and increased paid-in capital by the same amount. Net assets and net asset value per share were not affected by this reclassification.
(h) New Accounting Pronouncements: Effective June 1, 2019, the fund adopted Accounting Standards Update 2018-13, Fair Value Measurement (Topic 820): Disclosure Framework—Changes to the Disclosure Requirements for Fair Value Measurement (“ASU 2018-13”). The update provides guidance that eliminates, adds and modifies certain disclosure requirements for fair value measurements. The adoption of ASU 2018-13 had no impact on the operations of the fund for the period ended May 31, 2020.
NOTE 2—Bank Lines of Credit:
The fund participates with other long-term open-end funds managed by the Adviser in a $927 million unsecured credit facility led by Citibank, N.A. (the “Citibank Credit Facility”) and a $300 million unsecured credit facility provided by The Bank of New York Mellon (the “BNYM Credit Facility”), each to be utilized primarily for temporary or emergency purposes, including the financing of redemptions (each, a “Facility”). The Citibank Credit Facility is available in two tranches: (i) Tranche A is in an amount equal to $747 million and is available to all long-term open-ended funds, including the fund, and (ii) Tranche B is an amount equal to $180 million and is available only to BNY Mellon Floating Rate Income Fund, a series of BNY Mellon Investment Funds IV, Inc. Prior to March 11, 2020, the Citibank Credit Facility was $1.030 billion with Tranche A available in an amount equal to $830 million and Tranche B available in an amount equal to $200 million. In connection therewith, the fund has agreed to pay its pro rata portion of commitment fees for Tranche A of the Citibank Credit Facility and the BNYM Credit Facility. Interest is charged to the fund based on rates determined pursuant to the terms of the respective Facility at the time of borrowing. During the period ended May 31, 2020, the fund did not borrow under the Facilities.
NOTE 3—Management Fee, Sub-Investment Advisory Fee and Other Transactions with Affiliates:
(a) Pursuant to a management agreement with the Adviser, the management fee is computed at the annual rate of .90% of the value of the fund’s average daily net assets and is payable monthly. The Adviser has contractually agreed, from June 1, 2019 through September 30, 2020, to
35
NOTES TO FINANCIAL STATEMENTS (continued)
waive receipt of its fees and/or assume the direct expenses of the fund, so that the direct expenses of Class A, Class C, Class I and Class Y shares (excluding Rule 12b-1 Distribution Plan fees, Shareholder Services Plan fees, taxes, interest expense, brokerage commissions, commitment fees on borrowings and extraordinary expenses) do not exceed 1.05%, 1.05%, 1.05% and .98% of the value of the respective class’ average daily net assets. On or after September 30, 2020, the Adviser may terminate these expense limitations at any time. The reduction in expenses, pursuant to the undertaking, amounted to $1,787 during the period ended May 31, 2020.
Pursuant to separate sub-investment advisory agreements between the Adviser and Geneva, Nicholas, EAM, Granite, Rice Hall and Redwood, each serves as the fund’s sub-investment adviser responsible for the day-to-day management of a portion of the fund’s portfolio. The Adviser pays each sub-investment adviser a monthly fee at an annual percentage of the value of the fund’s average daily net assets. The Adviser has obtained an exemptive order from the SEC (the “Order”), upon which the fund may rely, to use a manager of managers approach that permits the Adviser, subject to certain conditions and approval by the Board, to enter into and materially amend sub-investment advisory agreements with one or more sub-investment advisers who are either unaffiliated with the Adviser or are wholly-owned subsidiaries (as defined under the Act) of the Adviser’s ultimate parent company, BNY Mellon, without obtaining shareholder approval. The Order also allows the fund to disclose the sub-investment advisory fee paid by the Adviser to any unaffiliated sub-investment adviser in the aggregate with other unaffiliated sub-investment advisers in documents filed with the SEC and provided to shareholders. In addition, pursuant to the Order, it is not necessary to disclose the sub-investment advisory fee payable by the Adviser separately to a sub-investment adviser that is a wholly-owned subsidiary of BNY Mellon in documents filed with the SEC and provided to shareholders; such fees are to be aggregated with fees payable to the Adviser. The Adviser has ultimate responsibility (subject to oversight by the Board) to supervise any sub-investment adviser and recommend the hiring, termination, and replacement of any sub-investment adviser to the Board.
During the period ended May 31, 2020, the Distributor retained $74 from commissions earned on sales of the fund’s Class A shares.
(b) Under the Distribution Plan adopted pursuant to Rule 12b-1 under the Act, Class C shares pay the Distributor for distributing its shares at an annual rate of .75% of the value of its average daily net assets. During the period ended May 31, 2020, Class C shares were charged $3,530 pursuant to the Distribution Plan.
36
(c) Under the Shareholder Services Plan, Class A and Class C shares pay the Distributor at an annual rate of .25% of the value of their average daily net assets for the provision of certain services. The services provided may include personal services relating to shareholder accounts, such as answering shareholder inquiries regarding the fund and providing reports and other information, and services related to the maintenance of shareholder accounts. The Distributor may make payments to Service Agents (securities dealers, financial institutions or other industry professionals) with respect to these services. The Distributor determines the amounts to be paid to Service Agents. During the period ended May 31, 2020, Class A and Class C shares were charged $3,787 and $1,177, respectively, pursuant to the Shareholder Services Plan.
The fund has an arrangement with the transfer agent whereby the fund may receive earnings credits when positive cash balances are maintained, which are used to offset transfer agency fees. For financial reporting purposes, the fund includes net earnings credits, if any, as an expense offset in the Statement of Operations.
The fund has an arrangement with the custodian whereby the fund will receive interest income or be charged an overdraft fees when cash balances are maintained. For financial reporting purposes, the fund includes this interest income and overdraft fees, if any, as interest income in the Statements of Operations.
The fund compensates BNY Mellon Transfer, Inc., a wholly-owned subsidiary of the Adviser, under a transfer agency agreement for providing transfer agency and cash management services for the fund. The majority of transfer agency fees are comprised of amounts paid on a per account basis, while cash management fees are related to fund subscriptions and redemptions. During the period ended May 31, 2020, the fund was charged $5,824 for transfer agency services. These fees are included in Shareholder servicing costs in the Statement of Operations.
The fund compensates The Bank of New York Mellon under a custody agreement for providing custodial services for the fund. These fees are determined based on net assets, geographic region and transaction activity. During the period ended May 31, 2020, the fund was charged $52,421 pursuant to the custody agreement.
During the period ended May 31, 2020, the fund was charged $29,562 for services performed by the Chief Compliance Officer and his staff. These fees are included in Chief Compliance Officer fees in the Statement of Operations.
37
NOTES TO FINANCIAL STATEMENTS (continued)
The components of “Due to BNY Mellon Investment Adviser, Inc. and affiliates” in the Statement of Assets and Liabilities consist of: management fees of $339,977, Distribution Plan fees of $277, Shareholder Services Plan fees of $365, custodian fees of $19,000, Chief Compliance Officer fees of $6,260 and transfer agency fees of $1,331, which are offset against an expense reimbursement currently in effect in the amount of $151.
(d) Each Board member also serves as a Board member of other funds in the BNY Mellon Family of Funds complex. Annual retainer fees and attendance fees are allocated to each fund based on net assets.
NOTE 4—Securities Transactions:
The aggregate amount of purchases and sales of investment securities, excluding short-term securities, during the period ended May 31, 2020, amounted to $525,386,752 and $612,714,472, respectively.
At May 31, 2020, the cost of investments for federal income tax purposes was $370,638,992; accordingly, accumulated net unrealized appreciation on investments was $116,949,661, consisting of $141,051,540 gross unrealized appreciation and $24,101,879 gross unrealized depreciation.
38
REPORT OF INDEPENDENT REGISTERED PUBLIC ACCOUNTING FIRM
To the Shareholders and the Board of Directors of BNY Mellon Select Managers Small Cap Growth Fund
Opinion on the Financial Statements
We have audited the accompanying statement of assets and liabilities of BNY Mellon Select Managers Small Cap Growth Fund (the “Fund”) (one of the funds constituting BNY Mellon Strategic Funds, Inc.), including the statements of investments and investments in affiliated issuers, as of May 31, 2020, and the related statement of operations for the year then ended, the statements of changes in net assets for each of the two years in the period then ended, the financial highlights for each of the five years in the period then ended and the related notes (collectively referred to as the “financial statements”). In our opinion, the financial statements present fairly, in all material respects, the financial position of the Fund (one of the funds constituting BNY Mellon Strategic Funds, Inc.) at May 31, 2020, the results of its operations for the year then ended, the changes in its net assets for each of the two years in the period then ended and its financial highlights for each of the five years in the period then ended, in conformity with U.S. generally accepted accounting principles.
Basis for Opinion
These financial statements are the responsibility of the Fund’s management. Our responsibility is to express an opinion on the Fund’s financial statements based on our audits. We are a public accounting firm registered with the Public Company Accounting Oversight Board (United States) (“PCAOB”) and are required to be independent with respect to the Fund in accordance with the U.S. federal securities laws and the applicable rules and regulations of the Securities and Exchange Commission and the PCAOB.
We conducted our audits in accordance with the standards of the PCAOB. Those standards require that we plan and perform the audit to obtain reasonable assurance about whether the financial statements are free of material misstatement, whether due to error or fraud. The Fund is not required to have, nor were we engaged to perform, an audit of the Fund’s internal control over financial reporting. As part of our audits, we are required to obtain an understanding of internal control over financial reporting, but not for the purpose of expressing an opinion on the effectiveness of the Fund’s internal control over financial reporting. Accordingly, we express no such opinion.
Our audits included performing procedures to assess the risks of material misstatement of the financial statements, whether due to error or fraud, and performing procedures that respond to those risks. Such procedures included examining, on a test basis, evidence regarding the amounts and disclosures in the financial statements. Our procedures included confirmation of securities owned as of May 31, 2020, by correspondence with the custodian and others or by other appropriate auditing procedures where replies from others were not received. Our audits also included evaluating the accounting principles used and significant estimates made by management, as well as evaluating the overall presentation of the financial statements. We believe that our audits provide a reasonable basis for our opinion.

We have served as the auditor of one or more investment companies in the BNY Mellon Family of Funds since at least 1957, but we are unable to determine the specific year.
New York, New York
July 27, 2020
39
IMPORTANT TAX INFORMATION (Unaudited)
The fund hereby reports $1.2617 per share as a long-term capital gain distribution paid on December 19, 2019.
40
INFORMATION ABOUT THE RENEWAL OF THE FUND’S SUB-INVESTMENT ADVISORY AGREEMENT (Unaudited)
At a meeting of the fund’s Board of Directors held on February 24, 2020 (the “February Meeting”), the Board considered the approval of a new sub-investment advisory agreement (the “New Sub-Advisory Agreement”) between the Adviser and Geneva Capital Management, LLC (“Geneva”). Due to a change in the ownership and organizational structure of Geneva that was scheduled to occur on March 17, 2020 (the “Transaction”), the then-current sub-investment advisory agreement (the “Initial Sub-Advisory Agreement”) between the Adviser and Geneva would terminate on that date in accordance with the terms of the Initial Sub-Advisory Agreement and the Investment Company Act of 1940, as amended (the “1940 Act”).
At the February Meeting, the Board discussed the Transaction with representatives of the Adviser, as well as the terms of the New Sub-Advisory Agreement and the implications, if any, that the closing of the Transaction would have for Geneva’s performance as a sub-adviser to the fund. At the February Meeting, representatives of the Adviser confirmed that there would be no change in Geneva’s investment process for managing its allocated portion of the fund’s investment portfolio as a result of the Transaction.
At the February Meeting, the Adviser recommended the approval of the New Sub-Advisory Agreement, pursuant to which Geneva would continue to serve as a sub-adviser to the fund. The recommendation for the approval of the New Sub-Advisory Agreement was based on the following considerations, among others: (i) the Transaction was not expected to have a material impact on the nature, extent or quality of the sub-investment advisory services that Geneva provides to the fund; (ii) the Geneva personnel who have been principally responsible for managing Geneva’s allocated portion of the fund’s investment portfolio would continue to serve in their respective senior capacities with Geneva following the Transaction; and (iii) the terms of the New Sub-Advisory Agreement were substantially similar in material respects to the Initial Sub-Advisory Agreement. The Board also considered the fact that the Adviser continued to express confidence in Geneva and its investment management capabilities.
At the February Meeting, the Board, including a majority of the Directors who are not “interested persons” (as that term is defined in the 1940 Act) of the fund or the Adviser (“Independent Directors”), considered and approved the New Sub-Advisory Agreement. In determining whether to approve the New Sub-Advisory Agreement, the Board considered the materials prepared by the Adviser received in advance of the November 5, 2019 Board meeting and the February Meeting and other information, which included: (i) a copy of a form of the New Sub-Advisory Agreement; (ii) information regarding the Transaction and the Adviser’s rationale for retaining Geneva following the closing of the Transaction; (iii) information regarding Geneva’s investment process; (iv) information regarding Geneva’s reputation, investment management business, personnel, and operations, and the effect that the Transaction may have on Geneva’s business and operations; (v) information regarding Geneva’s brokerage and trading policies and practices; (vi) information regarding the level of sub-investment advisory fees charged by Geneva; (vii) information regarding Geneva’s
41
INFORMATION ABOUT THE RENEWAL OF THE FUND’S SUB-INVESTMENT ADVISORY AGREEMENT (Unaudited) (continued)
historical performance returns managing its allocated portion of the fund’s portfolio, including information comparing that performance to a relevant index; (viii) information regarding Geneva’s compliance program; and (ix) Geneva’s Form ADV. The Board also considered the substance of discussions with representatives of the Adviser at a Board meeting held on November 5, 2019 (at which the fund’s Management Agreement, pursuant to which the Adviser provides the fund with investment advisory and administrative services, was approved) and at the February Meeting. Additionally, the Board reviewed materials supplied by counsel that were prepared for use by the Board in fulfilling its duties under the 1940 Act.
Nature, Extent and Quality of Services to be Provided by Geneva. In examining the nature, extent and quality of the services that had been furnished by Geneva to the fund under the Initial Sub-Advisory Agreement, and were expected to be provided by Geneva to the fund under the New Sub-Advisory Agreement, the Board considered: (i) Geneva’s organization, history, reputation, qualification and background, as well as the qualifications of its personnel; (ii) Geneva’s expertise in providing portfolio management services to the fund and the performance history of Geneva’s allocated portion of the fund’s portfolio; (iii) Geneva’s investment strategy for the fund; (iv) Geneva’s performance relative to unmanaged indices; and (v) Geneva’s compliance program. The Board also considered the review process undertaken by the Adviser and the Adviser’s favorable assessment of the nature and quality of the sub-investment advisory services provided and expected to be provided to the fund by Geneva after consummation of the Transaction. The Board also noted that the executive and portfolio management teams of Geneva were expected to stay in place after consummation of the Transaction. The Board concluded that the fund and its shareholders would continue to benefit from the quality and experience of Geneva’s investment professionals. Based on their consideration and review of the foregoing information, the Board concluded that the nature, extent and quality of the sub-investment advisory services provided by Geneva under the Initial Sub-Advisory Agreement, as well as Geneva’s ability to render such services based on its experience, operations and resources, were adequate and appropriate for the fund in light of the fund’s investment objective, and supported a decision to approve the New Sub-Advisory Agreement.
Investment Performance of Geneva. The Board considered Geneva’s investment performance in managing its allocated portion of the fund’s portfolio as a factor in evaluating the New Sub-Advisory Agreement. The Board compared this historical performance to a relevant benchmark and concluded that Geneva’s historical performance record in managing its allocated portion of the fund’s investment portfolio, when viewed together with the other factors considered by the Board, supported a decision to approve the New Sub-Advisory Agreement.
Costs of Services to be Provided and Profitability. The Board considered the proposed fee payable under the New Sub-Advisory Agreement, noting that the proposed fee would be paid by the Adviser and, thus, would not impact the fees paid by the fund. The Board recognized that, because Geneva’s fee would be paid by the Adviser, and not the fund, an analysis of profitability was more appropriate in the context of the Board’s
42
consideration of the Management Agreement and, therefore, the Board received and considered a profitability analysis of the Adviser and its affiliates. The Board noted that the fee payable to Geneva by the Adviser under the New Sub-Advisory Agreement was the same as that payable under the Initial Sub-Advisory Agreement and, thus, approval of the New Sub-Advisory Agreement had no impact on the Adviser’s profitability. The Board concluded that the proposed fee payable to Geneva by the Adviser with respect to the assets to be allocated to Geneva in its capacity as sub-adviser was reasonable and appropriate and the Adviser’s profitability was not excessive in light of the nature, extent and quality of the services provided to the fund by the Adviser and to be provided by Geneva under the New Sub-Advisory Agreement.
Economies of Scale to be Realized. The Board recognized that, because Geneva’s fee would continue to be paid by the Adviser, and not the fund, an analysis of economies of scale was more appropriate in the context of the Board’s consideration of the Management Agreement. Accordingly, consideration of economies of scale with respect to Geneva was not relevant to the Board’s determination to approve the New Sub-Advisory Agreement.
The Board also considered whether there were any ancillary benefits that accrued to Geneva as a result of Geneva’s relationship with the fund. The Board concluded that Geneva may direct fund brokerage transactions to certain brokers to obtain research and other services. However, the Board noted that Geneva was required to select brokers who met the fund’s requirements for seeking best execution, and that the Adviser monitored and evaluated Geneva’s trade execution with respect to fund brokerage transactions on a quarterly basis and provided reports to the Board on these matters. The Board concluded that the benefits that had accrued and were expected to continue to accrue to Geneva by virtue of its relationship with the fund were reasonable.
In considering the materials and information described above, the Independent Directors received assistance from, and met separately with, their independent legal counsel, and were provided with a written description of their statutory responsibilities and the legal standards that are applicable to the approval of investment advisory and sub-investment advisory agreements.
After full consideration of the factors discussed above, with no single factor identified as being of paramount importance, the Board, including a majority of the Independent Directors, with the assistance of independent legal counsel, concluded that the approval of the New Sub-Advisory Agreement was in the best interests of the fund, and approved the New Sub-Advisory Agreement for the fund.
43
LIQUIDITY RISK MANAGEMENT PROGRAM (Unaudited)
Effective June 1, 2019, the fund adopted a liquidity risk management program (the “Liquidity Risk Management Program”) pursuant to the requirements of Rule 22e-4 under the Investment Company Act of 1940, as amended. Rule 22e-4 requires registered open-end funds, including mutual funds and exchange-traded funds but not money market funds, to establish liquidity risk management programs in order to effectively manage fund liquidity and shareholder redemptions. The rule is designed to mitigate the risk that a fund could not meet redemption requests without significantly diluting the interests of remaining investors.
The rule requires the funds to assess, manage and review their liquidity risk at least annually considering applicable factors such as investment strategy and liquidity during normal and foreseeable stressed conditions, including whether the strategy is appropriate for an open-end fund and whether the fund has a relatively concentrated portfolio or large positions in particular issuers. The fund must also assess its use of borrowings and derivatives, short-term and long-term cash flow projections in normal and stressed conditions, holdings of cash and cash equivalents, and borrowing arrangements and other funding sources.
The rule also requires the fund to classify its investments as highly liquid, moderately liquid, less liquid or illiquid based on the number of days the fund expects it would take to liquidate the investment, and to review these classifications at least monthly or more often under certain conditions. The periods range from three or fewer business days for a highly liquid investment to greater than seven calendar days for settlement of a less liquid investment. Illiquid investments are those a fund does not expect to be able to sell or dispose of within seven calendar days without significantly changing the market value. The fund is prohibited from acquiring an investment if, after the acquisition, its holdings of illiquid assets will exceed 15% of its net assets. In addition, if a fund permits redemptions in-kind, the rule requires the fund to establish redemption in-kind policies and procedures governing how and when it will engage in such redemptions.
Pursuant to the rule’s requirements, the Liquidity Risk Management Program has been reviewed and approved by the fund’s board. Furthermore, the board has received a written report prepared by the Program’s Administrator that addresses the operation of the Program, assesses its adequacy and effectiveness and describes any material changes made to the Program.
Assessment of Program
In the opinion of the Program Administrator, the Program approved by the fund board continues to be adequate for the fund and the Program has been implemented effectively. The Program Administrator has monitored the fund’s liquidity risk and the liquidity classification of the securities held by the fund and has determined that the Program is operating effectively.
During the period from June 1, 2019 to March 31, 2020, there were no material changes to the Program and no material liquidity events that impacted the fund. During the period, the fund held sufficient highly liquid assets to meet fund redemptions.
44
Under normal expected foreseeable fund redemption forecasts and foreseeable stressed fund redemption forecasts, the Program Administrator believes that the fund maintains sufficient highly liquid assets to meet expected fund redemptions.
45
BOARD MEMBERS INFORMATION (Unaudited)
INDEPENDENT BOARD MEMBERS
Joseph S. DiMartino (76)
Chairman of the Board (1995)
Principal Occupation During Past 5 Years:
· Director and Trustee of funds in the BNY Mellon Family of Funds and certain other entities (as described in the fund’s Statement of Additional Information) (1995-Present)
Other Public Company Board Memberships During Past 5 Years:
· CBIZ, Inc., a public company providing professional business services, products and solutions, Director (1997-Present)
No. of Portfolios for which Board Member Serves: 114
———————
Joni Evans (78)
Board Member (2006)
Principal Occupation During Past 5 Years:
· Chief Executive Officer, www.wowOwow.com, an online community dedicated to women’s conversations and publications (2007-Present)
· Principal, Joni Evans Ltd. (publishing) (2006-Present)
No. of Portfolios for which Board Member Serves: 20
———————
Joan Gulley (72)
Board Member (2017)
Principal Occupation During Past 5 Years:
· PNC Financial Services Group, Inc.(1993-2014), Executive Vice President and Chief Human Resources Officer and Executive Committee Member (2008-2014)
· Director, Nantucket Library (2015-Present)
No. of Portfolios for which Board Member Serves: 46
———————
Ehud Houminer (79)
Board Member (1994)
Principal Occupation During Past 5 Years:
· Board of Overseers at the Columbia Business School, Columbia
University (1992-Present)
Trustee, Ben Gurion University (2012-2018)
No. of Portfolios for which Board Member Serves: 46
———————
46
Alan H. Howard (60)
Board Member (2018)
Principal Occupation During Past 5 Years:
· Managing Partner of Heathcote Advisors LLC, a financial advisory services firm (2008 – Present)
· President of Dynatech/MPX Holdings LLC (2012 – 2019), a global supplier and service provider of military aircraft parts, including Board Member of two operating subsidiaries, Dynatech International LLC and Military Parts Exchange LLC (2012-2019); Chief Executive Officer of an operating subsidiary, Dynatech International LLC (2013 – 2019)
· Senior Advisor, Rossoff & Co., an independent investment banking firm (2013 – Present)
Other Public Company Board Memberships During Past 5 Years:
· Diamond Offshore Drilling, Inc., a public company that provides contract drilling services, Director (2020-Present)
· Movado Group, Inc., a public company that designs, sources, markets and distributes watches, Director (1997-Present)
No. of Portfolios for which Board Member Serves: 20
———————
Robin A. Melvin (56)
Board Member (1995)
Principal Occupation During Past 5 Years:
· Co-chairman, Mentor Illinois, a non-profit organization dedicated to increasing the quantity and quality of mentoring services in Illinois; (2014-Present); Board member (2013-Present)
No. of Portfolios for which Board Member Serves: 92
———————
Burton N. Wallack (69)
Board Member (2006)
Principal Occupation During Past 5 Years:
President and Co-owner of Wallack Management Company, a real estate management company (1987-Present)
Mount Sinai Hospital Urology Board Member (2017-Present)
No. of Portfolios for which Board Member Serves: 20
———————
47
BOARD MEMBERS INFORMATION (Unaudited) (continued)
INDEPENDENT BOARD MEMBERS (continued)
Benaree Pratt Wiley (74)
Board Member (2003)
Principal Occupation During Past 5 Years:
· Principal, The Wiley Group, a firm specializing in strategy and business development (2005-Present)
Other Public Company Board Memberships During Past 5 Years:
· CBIZ, Inc., a public company providing professional business services, products and solutions, Director (2008-Present)
· Blue Cross Blue Shield of Massachusetts Director (2004-Present)
No. of Portfolios for which Board Member Serves: 74
———————
48
INTERESTED BOARD MEMBER
Gordon J. Davis (78)
Board Member (2006)
Principal Occupation During Past 5 Years:
· Partner in the law firm of Venable LLP (2012-Present)
No. of Portfolios for which Board Member Serves: 52
Gordon J. Davis is deemed to be an “interested person” (as defined under the Act) of the Company as a result of his affiliation with Venable LLP, which provides legal services to the Company.
———————
Once elected all Board Members serve for an indefinite term, but achieve Emeritus status upon reaching age 80. The address of the Board Members and Officers is c/o BNY Mellon Investment Adviser, Inc. 240 Greenwich Street, New York, New York 10286. Additional information about the Board Members is available in the fund’s Statement of Additional Information which can be obtained from the Adviser free of charge by calling this toll free number: 1-800-373-9387.
William Hodding Carter III, Emeritus Board Member
Hans C. Mautner, Emeritus Board Member
49
OFFICERS OF THE FUND (Unaudited)
RENEE LAROCHE-MORRIS, President since May 2019.
President and a director of BNY Mellon Investment Adviser, Inc. since January 2018. She is an officer of 62 investment companies (comprised of 114 portfolios) managed by the Adviser. She is 48 years old and has been an employee of BNY Mellon since 2003.
JAMES WINDELS, Treasurer since November 2001.
Director-BNY Mellon Fund Administration, and an officer of 64 investment companies (comprised of 145 portfolios) managed by the Adviser or an affiliate of the Adviser. He is 61 years old and has been an employee of the Adviser since April 1985.
BENNETT A. MACDOUGALL, Chief Legal Officer since October 2015.
Chief Legal Officer of the Adviser and Associate General Counsel and Managing Director of BNY Mellon since June 2015; Director and Associate General Counsel of Deutsche Bank–Asset & Wealth Management Division from June 2005 to June 2015, and as Chief Legal Officer of Deutsche Investment Management Americas Inc. from June 2012 to May 2015. He is an officer of 64 investment companies (comprised of 145 portfolios) managed by the Adviser or an affiliate of the Adviser. He is 48 years old and has been an employee of the Adviser since June 2015.
DAVID DIPETRILLO, Vice President since May 2019.
Head of North America Product, BNY Mellon Investment Management since January 2018, Director of Product Strategy, BNY Mellon Investment Management from January 2016 to December 2017; Head of US Retail Product and Channel Marketing, BNY Mellon Investment Management from January 2014 to December 2015. He is an officer of 63 investment companies (comprised of 122 portfolios) managed by the Adviser or an affiliate of the Adviser. He is 42 years old and has been an employee of BNY Mellon since 2005.
JAMES BITETTO, Vice President since August 2005 and Secretary since February 2018.
Senior Managing Counsel of BNY Mellon since December 2019; Managing Counsel of BNY Mellon from April 2014 to December 2019; Secretary of the Adviser, and an officer of 64 investment companies (comprised of 145 portfolios) managed by the Adviser or an affiliate of the Adviser. He is 53 years old and has been an employee of the Adviser since December 1996.
SONALEE CROSS, Vice President and Assistant Secretary since March 2018.
Counsel of BNY Mellon since October 2016; Associate at Proskauer Rose LLP from April 2016 to September 2016; Attorney at EnTrust Capital from August 2015 to February 2016; Associate at Sidley Austin LLP from September 2013 to August 2015. She is an officer of 64 investment companies (comprised of 145 portfolios) managed by the Adviser or an affiliate of the Adviser. She is 32 years old and has been an employee of the Adviser since October 2016.
DEIRDRE CUNNANE, Vice President and Assistant Secretary since March 2019.
Counsel of BNY Mellon since August 2018; Senior Regulatory Specialist at BNY Mellon Investment Management Services from February 2016 to August 2018; Trustee Associate at BNY Mellon Trust Company (Ireland) Limited from August 2013 to February 2016. She is an officer of 64 investment companies (comprised of 145 portfolios) managed by the Adviser or an affiliate of the Adviser. She is 29 years old and has been an employee of the Adviser since August 2018.
SARAH S. KELLEHER, Vice President and Assistant Secretary since April 2014.
Managing Counsel of BNY Mellon since December 2017, Senior Counsel of BNY Mellon from March 2013 to December 2017. She is an officer of 64 investment companies (comprised of 145 portfolios) managed by the Adviser or an affiliate of the Adviser. She is 44 years old and has been an employee of the Adviser since March 2013.
JEFF PRUSNOFSKY, Vice President and Assistant Secretary since August 2005.
Senior Managing Counsel of BNY Mellon, and an officer of 64 investment companies (comprised of 145 portfolios) managed by the Adviser or an affiliate of the Adviser. He is 55 years old and has been an employee of the Adviser since October 1990.
50
PETER M. SULLIVAN, Vice President and Assistant Secretary since March 2019.
Managing Counsel of BNY Mellon since March 2009, Senior Counsel of BNY Mellon from April 2004 to March 2009, and an officer of 64 investment companies (comprised of 145 portfolios) managed by the Adviser or an affiliate of the Adviser. He is 52 years old and has been an employee of the Adviser since January 2019.
AMANDA QUINN, Vice President and Assistant Secretary since March 2020.
Counsel of BNY Mellon since June 2019; Regulatory Administration Manager at BNY Mellon Investment Management Services from September 2018 to May 2019; Senior Regulatory Specialist at BNY Mellon Investment Management Services from April 2015 to August 2018. She is an officer of 64 investment companies (comprised of 145 portfolios) managed by the Adviser or an affiliate of the Adviser. She is 35 years old and has been an employee of the Adviser since June 2019.
NATALYA ZELENSKY, Vice President and Assistant Secretary since March 2017.
Managing Counsel of BNY Mellon since December 2019; Counsel of BNY Mellon from May 2016 to December 2019; Attorney at Wildermuth Endowment Strategy Fund/Wildermuth Advisory, LLC from November 2015 to May 2016 and Assistant General Counsel at RCS Advisory Services from July 2014 to November 2015. She is an officer of 64 investment companies (comprised of 145 portfolios) managed by the Adviser or an affiliate of the Adviser. She is 35 years old and has been an employee of the Adviser since May 2016.
GAVIN C. REILLY, Assistant Treasurer since December 2005.
Tax Manager-BNY Mellon Fund Administration, and an officer of 64 investment companies (comprised of 145 portfolios) managed by the Adviser or an affiliate of the Adviser. He is 51 years old and has been an employee of the Adviser since April 1991.
ROBERT S. ROBOL, Assistant Treasurer since August 2005.
Senior Accounting Manager-BNY Mellon Fund Administration, and an officer of 64 investment companies (comprised of 145 portfolios) managed by the Adviser or an affiliate of the Adviser. He is 56 years old and has been an employee of the Adviser since October 1988.
ROBERT SALVIOLO, Assistant Treasurer since July 2007.
Senior Accounting Manager–BNY Mellon Fund Administration, and an officer of 64 investment companies (comprised of 145 portfolios) managed by the Adviser or an affiliate of the Adviser. He is 53 years old and has been an employee of the Adviser since June 1989.
ROBERT SVAGNA, Assistant Treasurer since August 2005.
Senior Accounting Manager–BNY Mellon Fund Administration, and an officer of 64 investment companies (comprised of 145 portfolios) managed by the Adviser or an affiliate of the Adviser. He is 53 years old and has been an employee of the Adviser since November 1990.
JOSEPH W. CONNOLLY, Chief Compliance Officer since October 2004.
Chief Compliance Officer of the Adviser, the BNY Mellon Family of Funds and BNY Mellon Funds Trust (63 investment companies, comprised of 137 portfolios). He is 63 years old and has served in various capacities with the Adviser since 1980, including manager of the firm’s Fund Accounting Department from 1997 through October 2001.
CARIDAD M. CAROSELLA, Anti-Money Laundering Compliance Officer since January 2016.
Anti-Money Laundering Compliance Officer of the BNY Mellon Family of Funds and BNY Mellon Funds Trust since January 2016; from May 2015 to December 2015, Interim Anti-Money Laundering Compliance Officer of the BNY Mellon Family of Funds and BNY Mellon Funds Trust and the Distributor; from January 2012 to May 2015, AML Surveillance Officer of the Distributor. She is an officer of 57 investment companies (comprised of 138 portfolios) managed by the Adviser or an affiliate of the Adviser. She is 51 years old and has been an employee of the Distributor since 1997.
51
NOTES
52
NOTES
53
BNY Mellon Select Managers Small Cap Growth Fund
240 Greenwich Street
New York, NY 10286
Adviser
BNY Mellon Investment Adviser, Inc.
240 Greenwich Street
New York, NY 10286
Sub-Advisers
Geneva Capital
Management, LLC
100 East Wisconsin Avenue,
Suite 2550
Milwaukee, WI 53202
Nicholas Investment Partners, L.P.
6451 El Sicomoro
Rancho Santa Fe, CA 92067
EAM Investors, LLC
2533 South Coast Highway 101,
Suite 240
Cardiff-by-the-Sea, CA 92007
Granite Investment Partners, LLC
2121 Rosecrans Avenue, Suite 2360
El Segundo, CA 90245
Rice Hall James & Associates
600 West Broadway, Suite 1000
San Diego, CA 92101
Redwood Investments, LLC
One Gateway Center, Suite 802
Newton, MA 02458
Custodian
The Bank of New York Mellon
240 Greenwich Street
New York, NY 10286
Transfer Agent &
Dividend Disbursing Agent
BNY Mellon Transfer, Inc.
240 Greenwich Street
New York, NY 10286
Distributor
BNY Mellon Securities Corporation
240 Greenwich Street
New York, NY 10286
| | |
Ticker Symbols: Class A: DSGAX Class C: DSGCX Class I: DSGIX Class Y: DSGYX |
Telephone Call your financial representative or 1-800-373-9387
Mail The BNY Mellon Family of Funds, 144 Glenn Curtiss Boulevard, Uniondale, NY 11556-0144
E-mail Send your request to info@bnymellon.com
Internet Information can be viewed online or downloaded at www.bnymellonim.com/us
The fund files its complete schedule of portfolio holdings with the Securities and Exchange Commission (“SEC”) for the first and third quarters of each fiscal year on Form N-PORT. The fund’s Forms N-PORT are available on the SEC’s website at www.sec.gov.
A description of the policies and procedures that the fund uses to determine how to vote proxies relating to portfolio securities and information regarding how the fund voted these proxies for the most recent 12-month period ended June 30 is available at www.bnymellonim.com/us and on the SEC’s website at www.sec.gov and without charge, upon request, by calling 1-800-373-9387.
| | |
© 2020 BNY Mellon Securities Corporation
6289AR0520 | 
|
Item 2. Code of Ethics.
The Registrant has adopted a code of ethics that applies to the Registrant's principal executive officer, principal financial officer, principal accounting officer or controller, or persons performing similar functions. There have been no amendments to, or waivers in connection with, the Code of Ethics during the period covered by this Report.
Item 3. Audit Committee Financial Expert.
The Registrant's Board has determined that Ehud Houminer, a member of the Audit Committee of the Board, is an audit committee financial expert as defined by the Securities and Exchange Commission (the "SEC”). Ehud Houminer is "independent" as defined by the SEC for purposes of audit committee financial expert determinations.
Item 4. Principal Accountant Fees and Services.
(a) Audit Fees. The aggregate fees billed for each of the last two fiscal years (the "Reporting Periods") for professional services rendered by the Registrant's principal accountant (the "Auditor") for the audit of the Registrant's annual financial statements or services that are normally provided by the Auditor in connection with the statutory and regulatory filings or engagements for the Reporting Periods, were $37,838 in 2019 and $34,853 in 2020.
(b) Audit-Related Fees. The aggregate fees billed in the Reporting Periods for assurance and related services by the Auditor that are reasonably related to the performance of the audit of the Registrant's financial statements and are not reported under paragraph (a) of this Item 4 were $6,807 in 2019 and $7,544 in 2020. These services consisted of one or more of the following: (i) agreed upon procedures related to compliance with Internal Revenue Code section 817(h), (ii) security counts required by Rule 17f-2 under the Investment Company Act of 1940, as amended, (iii) advisory services as to the accounting or disclosure treatment of Registrant transactions or events and (iv) advisory services to the accounting or disclosure treatment of the actual or potential impact to the Registrant of final or proposed rules, standards or interpretations by the Securities and Exchange Commission, the Financial Accounting Standards Boards or other regulatory or standard-setting bodies.
The aggregate fees billed in the Reporting Periods for non-audit assurance and related services by the Auditor to the Registrant's investment adviser (not including any sub-investment adviser whose role is primarily portfolio management and is subcontracted with or overseen by another investment adviser), and any entity controlling, controlled by or under common control with the investment adviser that provides ongoing services to the Registrant ("Service Affiliates"), that were reasonably related to the performance of the annual audit of the Service Affiliate, which required pre-approval by the Audit Committee were $0 in 2019 and $0 in 2020.
(c) Tax Fees. The aggregate fees billed in the Reporting Periods for professional services rendered by the Auditor for tax compliance, tax advice, and tax planning ("Tax Services") were $3,458 in 2019 and $2,482 in 2020. These services consisted of: (i) review or preparation of U.S. federal, state, local and excise tax returns; (ii) U.S. federal, state and local tax planning, advice and assistance regarding statutory, regulatory or administrative developments; (iii) tax advice regarding tax qualification matters and/or treatment of various financial instruments held or proposed to be acquired or held, and (iv) determination of Passive Foreign Investment Companies. The aggregate fees billed in the Reporting Periods for Tax Services by the Auditor to Service Affiliates, which required pre-approval by the Audit Committee were $0 in 2019 and $0 in 2020.
(d) All Other Fees. The aggregate fees billed in the Reporting Periods for products and services provided by the Auditor, other than the services reported in paragraphs (a) through (c) of this Item, were $45 in 2019 and $56 in 2020.
The aggregate fees billed in the Reporting Periods for Non-Audit Services by the Auditor to Service Affiliates, other than the services reported in paragraphs (b) through (c) of this Item, which required pre-approval by the Audit Committee, were $0 in 2019 and $0 in 2020.
(e)(1) Audit Committee Pre-Approval Policies and Procedures. The Registrant's Audit Committee has established policies and procedures (the "Policy") for pre-approval (within specified fee limits) of the Auditor's engagements for non-audit services to the Registrant and Service Affiliates without specific case-by-case consideration. The pre-approved services in the Policy can include pre-approved audit services, pre-approved audit-related services, pre-approved tax services and pre-approved all other services. Pre-approval considerations include whether the proposed services are compatible with maintaining the Auditor's independence. Pre-approvals pursuant to the Policy are considered annually.
(e)(2) Note. None of the services described in paragraphs (b) through (d) of this Item 4 were approved by the Audit Committee pursuant to paragraph (c)(7)(i)(C) of Rule 2-01 of Regulation S-X.
(f) None of the hours expended on the principal accountant's engagement to audit the registrant's financial statements for the most recent fiscal year were attributed to work performed by persons other than the principal account's full-time, permanent employees.
Non-Audit Fees. The aggregate non-audit fees billed by the Auditor for services rendered to the Registrant, and rendered to Service Affiliates, for the Reporting Periods were $679,886 in 2019 and $751,270 in 2020.
Auditor Independence. The Registrant's Audit Committee has considered whether the provision of non-audit services that were rendered to Service Affiliates, which were not pre-approved (not requiring pre-approval), is compatible with maintaining the Auditor's independence.
Item 5. Audit Committee of Listed Registrants.
Not applicable.
Item 6. Investments.
(a) Not applicable.
Item 7. Disclosure of Proxy Voting Policies and Procedures for Closed-End Management Investment Companies.
Not applicable.
Item 8. Portfolio Managers of Closed-End Management Investment Companies.
Not applicable.
Item 9. Purchases of Equity Securities by Closed-End Management Investment Companies and Affiliated Purchasers.
Not applicable.
Item 10. Submission of Matters to a Vote of Security Holders.
There have been no material changes to the procedures applicable to Item 10.
Item 11. Controls and Procedures.
(a) The Registrant's principal executive and principal financial officers have concluded, based on their evaluation of the Registrant's disclosure controls and procedures as of a date within 90 days of the filing date of this report, that the Registrant's disclosure controls and procedures are reasonably designed to ensure that information required to be disclosed by the Registrant on Form N-CSR is recorded, processed, summarized and reported within the required time periods and that information required to be disclosed by the Registrant in the reports that it files or submits on Form N-CSR is accumulated and communicated to the Registrant's management, including its principal executive and principal financial officers, as appropriate to allow timely decisions regarding required disclosure.
(b) There were no changes to the Registrant's internal control over financial reporting that occurred during the second fiscal quarter of the period covered by this report that have materially affected, or are reasonably likely to materially affect, the Registrant's internal control over financial reporting.
Item 12. Disclosure of Securities Lending Activities for Closed-End Management Investment Companies.
Not applicable.
Item 13. Exhibits.
(a)(1) Code of ethics referred to in Item 2.
(a)(2) Certifications of principal executive and principal financial officers as required by Rule 30a-2(a) under the Investment Company Act of 1940.
(a)(3) Not applicable.
(b) Certification of principal executive and principal financial officers as required by Rule 30a-2(b) under the Investment Company Act of 1940.
SIGNATURES
Pursuant to the requirements of the Securities Exchange Act of 1934 and the Investment Company Act of 1940, the Registrant has duly caused this Report to be signed on its behalf by the undersigned, thereunto duly authorized.
BNY Mellon Strategic Funds, Inc.
By: /s/ Renee LaRoche-Morris
Renee LaRoche-Morris
President (Principal Executive Officer)
Date: July 27, 2020
Pursuant to the requirements of the Securities Exchange Act of 1934 and the Investment Company Act of 1940, this Report has been signed below by the following persons on behalf of the Registrant and in the capacities and on the dates indicated.
By: /s/ Renee LaRoche-Morris
Renee LaRoche-Morris
President (Principal Executive Officer)
Date: July 27, 2020
By: /s/ James Windels
James Windels
Treasurer (Principal Financial Officer)
Date: July 24, 2020
EXHIBIT INDEX
(a)(1) Code of ethics referred to in Item 2.
(a)(2) Certifications of principal executive and principal financial officers as required by Rule 30a-2(a) under the Investment Company Act of 1940. (EX-99.CERT)
(b) Certification of principal executive and principal financial officers as required by Rule 30a-2(b) under the Investment Company Act of 1940. (EX-99.906CERT)
