EXHIBIT (17) (b) (i)
IMPORTANT NOTICES REGARDING PRIVACY,
DELIVERY OF SHAREHOLDER DOCUMENTS,
PORTFOLIO HOLDINGS AND PROXY VOTING
Privacy. The Eaton Vance organization is committed to ensuring your financial privacy. Each of the financial institutions identified below has in effect the following policy (Privacy Policy) with respect to nonpublic personal information about its customers:
| Only such information received from you, through application forms or otherwise, and information about |
| | your Eaton Vance fund transactions will be collected. This may include information such as name, address, |
| | social security number, tax status, account balances and transactions. |
| None of such information about you (or former customers) will be disclosed to anyone, except as permitted |
| | by law (which includes disclosure to employees necessary to service your account). In the normal course of |
| | servicing a customer’s account, Eaton Vance may share information with unaffiliated third parties that |
| | perform various required services such as transfer agents, custodians and broker/dealers. |
| Policies and procedures (including physical, electronic and procedural safeguards) are in place that are |
| | designed to protect the confidentiality of such information. |
| We reserve the right to change our Privacy Policy at any time upon proper notification to you. Customers |
| | may want to review our Privacy Policy periodically for changes by accessing the link on our homepage: |
| | www. eatonvance.com. |
Our pledge of privacy applies to the following entities within the Eaton Vance organization: the Eaton Vance Family of Funds, Eaton Vance Management, Eaton Vance Investment Counsel, Boston Management and Research, and Eaton Vance Distributors, Inc.
In addition, our Privacy Policy applies only to those Eaton Vance customers who are individuals and who have a direct relationship with us. If a customer’s account (i.e., fund shares) is held in the name of a third-party financial adviser/brokerdealer, it is likely that only such adviser’s privacy policies apply to the customer. This notice supersedes all previously issued privacy disclosures.
For more information about Eaton Vance’s Privacy Policy, please call 1-800-262-1122.
Delivery of Shareholder Documents. The Securities and Exchange Commission (the “SEC”) permits funds to deliver only one copy of shareholder documents, including prospectuses, proxy statements and shareholder reports, to fund investors with multiple accounts at the same residential or post office box address. This practice is often called “householding” and it helps eliminate duplicate mailings to shareholders.
Eaton Vance, or your financial adviser, may household the mailing of your documents indefinitely unless you instruct Eaton Vance, or your financial adviser, otherwise.
If you would prefer that your Eaton Vance documents not be householded, please contact Eaton Vance at 1-800-262-1122, or contact your financial adviser.
Your instructions that householding not apply to delivery of your Eaton Vance documents will be effective within 30 days of receipt by Eaton Vance or your financial adviser.
Portfolio Holdings. Each Eaton Vance Fund and its underlying Portfolio(s) (if applicable) will file a schedule of portfolio holdings on Form N-Q with the SEC for the first and third quarters of each fiscal year. The Form N-Q will be available on the Eaton Vance website at www.eatonvance.com, by calling Eaton Vance at 1-800-262-1122 or in the EDGAR database on the SEC’s website at www.sec.gov. Form N-Q may also be reviewed and copied at the SEC’s public reference room in Washington, D.C. (call 1-800-732-0330 for information on the operation of the public reference room).
Proxy Voting. From time to time, funds are required to vote proxies related to the securities held by the funds. The Eaton Vance Funds or their underlying Portfolios (if applicable) vote proxies according to a set of policies and procedures approved by the Funds’ and Portfolios’ Boards. You may obtain a description of these policies and procedures and information on how the Funds or Portfolios voted proxies relating to portfolio securities during the most recent 12 month period ended June 30, without charge, upon request, by calling 1-800-262-1122. This description is also available on the SEC’s website at www.sec.gov.
Eaton Vance Emerging Markets Fund as of December 31, 2009
MANAGEMENT’S DISCUSSION OF FUND PERFORMANCE |
Economic and Market Conditions
- Equity markets the world over staged a dramatic comeback during the 12 months ending December 31, 2009, most clawing their way back into positive terri- tory from the depths of a global recession that began to reach historic proportions in the second half of 2008. Significant infusions of government monetary and fiscal stimulus helped moderate the economic downdraft early in 2009, with the world’s emerging-market economies initially leading the way. As investors transitioned from crisis mode to greater degrees of confidence, equities reversed their slide, establishing a bottom in March 2009 and bouncing back sharply throughout the remainder of the calendar year.

- Foreign equities in the developed world, as repre- sented by the MSCI Europe, Australasia, and Far East (EAFE) Index, produced solid results for the 12-month period, with the EAFE posting a 31.8% gain, mod- erately outpacing the 26.5% return of the S&P 500 Index, a proxy for the broad-based U.S. equity market.
Within the developed world, equities in the Far East region – excluding those in Japan, an economy that continued to struggle – did quite well, while those in Europe experienced solid, but somewhat lower growth momentum during the period. - The stimulus-induced momentum in global equities was most pronounced in the emerging markets, which enjoyed four consecutive quarters of positive perfor- mance in 2009, as measured by the MSCI Emerging Markets Index.1 That benchmark for the still-develop- ing world’s equity markets recorded a gain of 78.5% for the year, more than doubling the returns of both the EAFE Index and the S&P 500 Index. Equities in Brazil, Indonesia, India and Russia produced the best returns during the period, while those in Morocco and Argentina were the biggest laggards, both markets posting negative returns.
| Past performance is no guarantee of future results. Returns are historical and are calculated by determining the percentage change in net asset value or offering price (as applicable) with all distributions reinvested. Investment return and principal value will fluctuate so that shares, when redeemed, may be worth more or less than their original cost. Performance is for the stated time period only; due to market volatility, the Fund’s current performance may be lower or higher than the quoted return. For performance as of the most recent month end, please refer to www.eatonvance.com. |
Fund shares are not insured by the FDIC and are not deposits or other obligations of, or guaranteed by, any depository institution. Shares are subject to investment risks, including possible loss of principal invested. Management Discussion |
- Against this background of surging emerging market performance, the Fund2 turned in double- digit returns for the year ending December 31, 2009, although it trailed its benchmark, the MSCI
Emerging Markets Index (the Index). On a regional basis, the Fund’s underperformance was attribut- able to stock selection in India and South Korea, an above-benchmark allocation to Israel, and an underweight exposure to Russia. - On a sector level, Fund returns were hampered by overweighted selections in certain consumer staples stocks – in particular a South Korean tobacco com- pany, India’s largest consumer goods company, and a Taiwan-based operator of convenience stores. The materials sector proved to be a drag on performance as well; the Fund’s mining stocks trailed the results of the Index. A lack of exposure to a Brazilian energy exploration company further stifled relative performance.
- In contrast, the largest positive contribution came from Indonesia, where the Fund’s stock selections gained approximately 230% and outperformed those in the Index by nearly a two-to-one margin.
Overweighting this strong-performing country was also helpful. Security selection in domestic Israeli
| |
| Total Return Performance | |
| 12/31/08 – 12/31/09 | |
|
| Class A3 | 66.05% |
| Class B3 | 65.22 |
| MSCI Emerging Markets Index1 | 78.51 |
| Lipper Emerging Markets Funds Average1 | 75.74 |
| See page 3 for more performance information. | |
1It is not possible to invest directly in an Index or a Lipper Classification. The Index’s total return does not reflect the commissions or expenses that would have been incurred if an investor individually purchased or sold the securities represented in the Index. MSCI Index returns reflect dividends net of any applicable foreign withholding taxes. The Lipper total return is the average total return, at net asset value, of the funds that are in the same Lipper Classification as the Fund.
2The Fund currently invests in a separate registered investment company, Emerging Markets Portfolio, with the same objective and policies as the Fund. References to investments are to the Portfolio’s holdings.
3These returns do not include the 5.75% maximum sales charge for Class A shares or the applicable contingent deferred sales charge (CDSC) for Class B shares. If sales charges were deducted, the returns would be lower. Absent expense reductions by Eaton Vance Management and Lloyd George Investment Management, the returns would be lower. Class A shares are subject to a 1% redemption fee if redeemed or exchanged within 90 days of the settlement of the purchase.
1
Eaton Vance Emerging Markets Fund as of December 31, 2009
MANAGEMENT’S DISCUSSION OF FUND PERFORMANCE |
| and Malaysian stocks also helped boost performance. Having no exposure to stocks in Poland further benefited the Fund’s relative returns, as did the strength of Fund’s holdings in out-of-benchmark Hong Kong, which gained roughly 100%. |
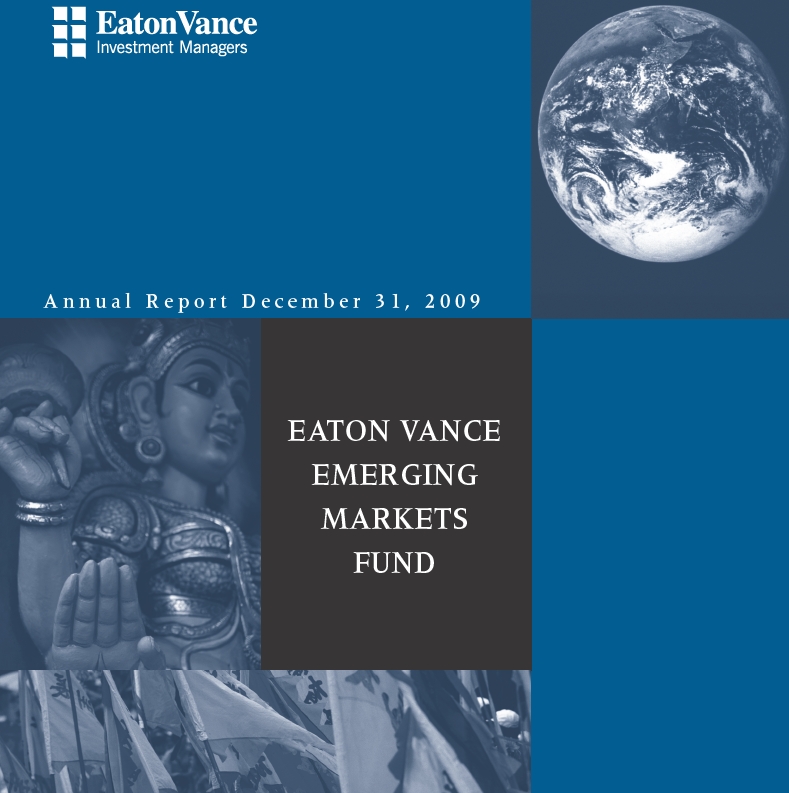
- The Fund’s investments remained diversified across the spectrum of emerging market regions and indus- tries. As of December 31, 2009, its largest regional weightings were in Asia and Latin America, and its largest country weighting at the end of the period was Brazil, followed by China, South Korea and Taiwan.
- The emerging world grew much faster than predicted during the global recession, largely as a result of the relative strength of balance sheets at the sovereign, corporate and household levels. While Brazil led the recovery, China, India, Indonesia and even Russia offered examples of major emerging economies at an early stage of a recovery cycle, characterized by a decline in the cost of capital, strengthening politi- cal foundations and an increasing domestic bias to new growth. The combination of improving top-line revenues and still broadly supportive liquidity con- ditions suggested a continued benign environment for emerging equities. The key issue for investors in 2010, however, is how and when policy makers wit hdraw the monetary and fiscal stimulus that was so supportive of the recovery in 2009.
|
The views expressed throughout this report are those of the portfolio manager and are current only through the end of the period of the report as stated on the cover. These views are subject to change at any time based upon market or other conditions, and the investment adviser disclaims any responsibility to update such views. These views may not be relied on as investment advice and, because investment decisions for a fund are based on many factors, may not be relied on as an indication of trading intent on behalf of any Eaton Vance fund. Portfolio information provided in the report may not be representative of the Fund’s current or future invest- ments and may change due to active management. |
Portfolio Composition
| |
| Top 10 Common Stock Holdings1 | |
|
| By net assets | |
| |
| Hon Hai Precision Industry Co., Ltd. | 4.0% |
| Samsung Electronics Co., Ltd. | 3.9 |
| Vale SA ADR | 3.5 |
| Petroleo Brasileiro SA | 3.5 |
| CNOOC, Ltd. | 3.1 |
| Hyundai Motor Co. | 3.0 |
| Taiwan Semiconductor Manufacturing Co., Ltd. | 2.9 |
| POSCO | 2.9 |
| Rosneft Oil Co. GDR | 2.6 |
| Sberbank of Russian Federation GDR | 2.5 |
| |
| 1 Top 10 Common Stock Holdings represented 31.9% of the Portfolio’s |
| net assets as of 12/31/09. Excludes cash equivalents. | |
| 2 As a percentage of the Portfolio’s net assets as of 12/31/09. Excludes cash equivalents. |
| 3 As a percentage of the Portfolio’s net assets as of 12/31/09. Excludes cash equivalents. |
Eaton Vance Emerging Markets Fund as of December 31, 2009
FUND PERFORMANCE
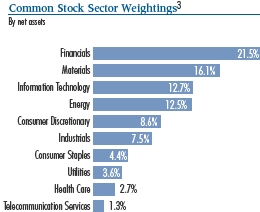
The line graph and table set forth below provide information about the Fund’s performance. The line graph compares the performance of Class B of the Fund with that of the MSCI Emerging Markets Index, a broad-based, unmanaged market index of common stocks traded in the world’s emerging markets. The lines on the graph represent the total returns of a hypothetical investment of $10,000 in each of Class B of the Fund and the MSCI Emerging Markets Index. The table includes the total returns of each Class of the Fund at net asset value and maximum public offering price. The performance presented below does not reflect the deduction of taxes, if any, that a shareholder would pay on distributions or redemptions of Fund shares.
| | |
| Performance1 | Class A | Class B |
| Share Class Symbol | ETEMX | EMEMX |
|
| Average Annual Total Returns (at net asset value) | | |
|
| One Year | 66.05% | 65.22% |
| Five Years | 7.32 | 6.80 |
| Ten Years | 7.27 | 6.69 |
| Life of Fund† | 7.92 | 7.31 |
| |
| SEC Average Annual Total Returns (including sales charge or applicable CDSC) | |
|
| One Year | 56.55% | 60.22% |
| Five Years | 6.06 | 6.52 |
| Ten Years | 6.64 | 6.69 |
| Life of Fund† | 7.49 | 7.31 |
| † Inception dates: Class A: 12/8/94; Class B: 11/30/94 | |
1 Average annual total returns do not include the 5.75% maximum sales charge for Class A shares or the applicable contingent deferred sales charge (CDSC) for Class B shares. If sales charges were deducted, the returns would be lower. SEC average annual total returns for Class A reflect the maximum 5.75% sales charge. SEC returns for Class B reflect the applicable CDSC based on the following schedule: 5% - 1st and 2nd years; 4% - 3rd year; 3% - 4th year; 2% - 5th year; 1% - 6th year.
Absent expense reductions by Eaton Vance Management and Lloyd George Investment Management, the returns would be lower. Class A shares are subject to a 1% redemption fee if redeemed or exchanged within 90 days of the settlement of the purchase.
| | |
| Total Annual | | |
| Operating Expenses2 | Class A | Class B |
| Gross Expense Ratio | 2.42% | 2.92% |
| Net Expense Ratio | 2.27 | 2.77 |
2 Source: Prospectus dated 5/1/09, as revised 9/8/09 and supplemented 9/30/09. Eaton Vance Management and Lloyd George Investment Management have agreed to reduce Total Annual Fund Operating Expenses by 0.05% annually. This agreement is contractual in nature and may not be terminated without shareholder approval. The Adviser and the Administrator have agreed to further reduce the Total Annual Fund Operating Expenses by an additional 0.10% annually through April 30, 2010. Thereafter, the expense reduction may be changed or terminated at any time. Without these reductions, expenses would be higher.
Past performance is no guarantee of future results. Returns are historical and are calculated by determining the percentage change in net asset value or offering price (as applicable) with all distributions reinvested. Investment return and principal value will fluctuate so that shares, when redeemed, may be worth more or less than their original cost. Performance is for the stated time period only; due to market volatility, the Fund’s current performance may be lower or higher than the quoted return. For performance as of the most recent month end, please refer to www.eatonvance.com.
* Sources: Lipper Inc. Class B of the Fund commenced operations on 11/30/94.
A $10,000 hypothetical investment at net asset value in Class A shares on 12/31/99 would have been valued at $20,188 on 12/31/09 ($19,028 at the maximum offering price). It is not possible to invest directly in an Index. The Index's total return does not reflect commissions or expenses that would have been incurred if an investor individually purchased or sold the securities represented in the Index. MSCI Emerging Markets Index returns reflect dividends net of any applicable foreign withholding taxes.
3
Eaton Vance Emerging Markets Fund as of December 31, 2009
FUND EXPENSES
Example: As a shareholder of the Fund, you incur two types of costs: (1) transaction costs, including sales charges (loads) on purchases and redemption fees (if applicable); and (2) ongoing costs, including management fees; distribution or service fees; and other Fund expenses. This Example is intended to help you understand your ongoing costs (in dollars) of investing in the Fund and to compare these costs with the ongoing costs of investing in other mutual funds. The Example is based on an investment of $1,000 invested at the beginning of the period and held for the entire period (July 1, 2009 – December 31, 2009).
Actual Expenses: The first section of the table below provides information about actual account values and actual expenses. You may use the information in this section, together with the amount you invested, to estimate the expenses that you paid over the period. Simply divide your account value by $1,000 (for example, an $8,600 account value divided by $1,000 = 8.6), then multiply the result by the number in the first section under the heading entitled “Expenses Paid During Period” to estimate the expenses you paid on your account during this period.
Hypothetical Example for Comparison Purposes: The second section of the table below provides information about hypothetical account values and hypothetical expenses based on the actual Fund expense ratio and an assumed rate of return of 5% per year (before expenses), which is not the actual return of the Fund. The hypothetical account values and expenses may not be used to estimate the actual ending account balance or expenses you paid for the period. You may use this information to compare the ongoing costs of investing in your Fund and other funds. To do so, compare this 5% hypothetical example with the 5% hypothetical examples that appear in the shareholder reports of the other funds.
Please note that the expenses shown in the table are meant to highlight your ongoing costs only and do not reflect any transactional costs, such as sales charges (loads) or redemption fees (if applicable). Therefore, the second section of the table is useful in comparing ongoing costs only, and will not help you determine the relative total costs of owning different funds. In addition, if these transactional costs were included, your costs would be higher.
| | | | |
| | Eaton Vance Emerging Markets Fund |
| |
| | | Beginning Account Value | Ending Account Value | Expenses Paid During Period* |
| | | (7/1/09) | (12/31/09) | (7/1/09 – 12/31/09) |
|
| Actual | | | |
| Class A | $1,000.00 | $1,267.10 | $14.29** |
| Class B | $1,000.00 | $1,263.90 | $17.12** |
| |
|
| Hypothetical | | | |
| (5% return per year before expenses) | | | |
| Class A | $1,000.00 | $1,012.60 | $12.68** |
| Class B | $1,000.00 | $1,010.10 | $15.20** |
| |
| * | Expenses are equal to the Fund’s annualized expense ratio of 2.50% for Class A shares and 3.00% for Class B shares, |
| | multiplied by the average account value over the period, multiplied by 184/365 (to reflect the one-half year period). The |
| | Example assumes that the $1,000 was invested at the net asset value per share determined at the close of business on |
| | June 30, 2009. The Example reflects expenses of both the Fund and the Portfolio. | |
| |
| ** | Absent a waiver of expenses by affiliates, expenses would be higher. | |
4
Eaton Vance Emerging Markets Fund as of December 31, 2009
FINANCIAL STATEMENTS |
| | |
| Statement of Assets and Liabilities |
| |
| As of December 31, 2009 | | |
| Assets | | |
|
| Investment in Emerging Markets Portfolio, at value | | |
| (identified cost, $47,852,810) | $ 62,181,267 |
| Receivable for Fund shares sold | | 113,384 |
| Receivable from affiliates | | 7,742 |
|
| Total assets | $ 62,302,393 |
|
| Liabilities | | |
|
| Payable for Fund shares redeemed | $ 363,249 |
| Payable to affiliates: | | |
| Management fee | | 12,902 |
| Distribution and service fees | | 31,046 |
| Trustees’ fees | | 125 |
| Accrued expenses | | 71,777 |
|
| Total liabilities | $ 479,099 |
|
| Net Assets | $ 61,823,294 |
|
| Sources of Net Assets | | |
|
| Paid-in capital | $ 64,054,293 |
| Accumulated net realized loss from Portfolio | (16,502,396) |
| Accumulated net investment loss | | (57,060) |
| Net unrealized appreciation from Portfolio | 14,328,457 |
|
| Total | $ 61,823,294 |
|
| Class A Shares | | |
|
| Net Assets | $ 49,305,375 |
| Shares Outstanding | | 2,611,140 |
| Net Asset Value and Redemption Price Per Share | | |
| (net assets shares of beneficial interest outstanding) | $ 18.88 |
| Maximum Offering Price Per Share | | |
| (100 94.25 of net asset value per share) | $ 20.03 |
|
| Class B Shares | | |
|
| Net Assets | $ 12,517,919 |
| Shares Outstanding | | 714,130 |
| Net Asset Value and Offering Price Per Share* | | |
| (net assets shares of beneficial interest outstanding) | $ 17.53 |
|
| On sales of $50,000 or more, the offering price of Class A shares is reduced. | |
| * Redemption price per share is equal to the net asset value less any applicable contingent |
| deferred sales charge. | | |
| |
| S t a t e m e n t o f O p e r a t i o n s | |
| |
| For the Year Ended | |
| December 31, 2009 | |
| Investment Income | |
|
| Dividends allocated from Portfolio (net of foreign taxes, $114,656) | $ 1,274,877 |
| Interest allocated from Portfolio | 22,566 |
| Expenses allocated from Portfolio | (704,939) |
|
| Total investment income from Portfolio | $ 592,504 |
|
| Expenses | |
|
| Management fee | $ 126,516 |
| Distribution and service fees | |
| Class A | 202,638 |
| Class B | 100,786 |
| Trustees’ fees and expenses | 500 |
| Custodian fee | 18,680 |
| Transfer and dividend disbursing agent fees | 167,257 |
| Legal and accounting services | 18,387 |
| Printing and postage | 28,682 |
| Registration fees | 33,124 |
| Miscellaneous | 6,497 |
|
| Total expenses | $ 703,067 |
|
| Deduct — | |
| Reduction and waiver of expenses by affiliates | $ 63,128 |
| Total expense reductions | $ 63,128 |
|
| Net expenses | $ 639,939 |
|
| Net investment loss | $ (47,435) |
|
| Realized and Unrealized | |
| Gain (Loss) from Portfolio | |
|
| Net realized gain (loss) — | |
| Investment transactions (net of foreign capital gains taxes of | |
| $56,225) | $ (3,507,644) |
| Foreign currency transactions | (35,700) |
|
| Net realized loss | $ (3,543,344) |
|
| Change in unrealized appreciation (depreciation) — | |
| Investments (net of increase in accrued foreign capital gains taxes | |
| of $2,432) | $28,956,095 |
| Foreign currency | (3,356) |
|
| Net change in unrealized appreciation (depreciation) | $28,952,739 |
|
| Net realized and unrealized gain | $25,409,395 |
|
| Net increase in net assets from operations | $25,361,960 |
|
See notes to financial statements
5
| | Eaton Vance Emerging Markets Fund as of December 31, 2009
FINANCIAL STATEMENTS CON T ’ D
Statements of Changes in Net Assets |
| | |
| Increase (Decrease) | Year Ended | Year Ended |
| in Net Assets | December 31, 2009 | December 31, 2008 |
|
| From operations — | | |
| Net investment loss | $ (47,435) | $ (117,121) |
| Net realized loss from investment and | | |
| foreign currency transactions | (3,543,344) | (13,025,560) |
| Net change in unrealized appreciation | | |
| (depreciation) from investments and | | |
| foreign currency | 28,952,739 | (67,170,838) |
|
| Net increase (decrease) in net assets from | | |
| operations | $ 25,361,960 | $ (80,313,519) |
|
| Distributions to shareholders — | | |
| From net realized gain | | |
| Class A | $ — | $ (12,351,507) |
| Class B | — | (3,085,102) |
|
| Total distributions to shareholders | $ — | $ (15,436,609) |
|
| Transactions in shares of beneficial | | |
| interest — | | |
| Proceeds from sale of shares | | |
| Class A | $ 10,290,839 | $ 16,950,367 |
| Class B | 2,430,642 | 1,799,558 |
| Net asset value of shares issued to | | |
| shareholders in payment of | | |
| distributions declared | | |
| Class A | — | 9,432,727 |
| Class B | — | 2,570,751 |
| Cost of shares redeemed | | |
| Class A | (16,011,433) | (61,261,834) |
| Class B | (2,430,715) | (9,858,723) |
| Net asset value of shares exchanged | | |
| Class A | 818,656 | 1,430,209 |
| Class B | (818,656) | (1,430,209) |
| Redemption fees | 3,659 | 6,072 |
|
| Net decrease in net assets from Fund share | | |
| transactions | $ (5,717,008) | $ (40,361,082) |
|
| Net increase (decrease) in net assets | $ 19,644,952 | $(136,111,210) |
| |
| Net Assets | | |
|
| At beginning of year | $ 42,178,342 | $ 178,289,552 |
|
| At end of year | $ 61,823,294 | $ 42,178,342 |
|
| | |
| Accumulated net investment | | |
| loss included in net assets | | |
|
| At end of year | $ (57,060) | $ (35,029) |
|
See notes to financial statements
6
Eaton Vance Emerging Markets Fund as of December 31, 2009
FINANCIAL STATEMENTS CON T ’ D
Financial Highlights |
| | | | | |
| | Class A |
|
|
| | Year Ended December 31, |
|
|
| | 2009 | 2008 | 2007 | 2006 | 2005 |
|
| Net asset value — Beginning of year | $11.370 | $ 30.090 | $ 28.540 | $ 23.960 | $20.040 |
|
| Income (Loss) From Operations | | | | | |
|
| Net investment income (loss)(1) | $ 0.002 | $ (0.002) | $ 0.171 | $ 0.231 | $ 0.117 |
| Net realized and unrealized gain (loss) | 7.507 | (15.951) | 6.617 | 5.909 | 5.880 |
|
| Total income (loss) from operations | $ 7.509 | $(15.953) | $ 6.788 | $ 6.140 | $ 5.997 |
|
| Less Distributions | | | | | |
|
| From net investment income | $ — | $ — | $ (0.052) | $ (0.148) | $ (0.127) |
| From net realized gain | — | (2.768) | (5.188) | (1.414) | (1.951) |
|
| Total distributions | $ — | $ (2.768) | $ (5.240) | $ (1.562) | $ (2.078) |
|
| Redemption fees(1) | $ 0.001 | $ 0.001 | $ 0.002 | $ 0.002 | $ 0.001 |
|
| Net asset value — End of year | $18.880 | $ 11.370 | $ 30.090 | $ 28.540 | $23.960 |
|
| Total Return(2) | 66.05% | (57.87)% | 24.29% | 25.68% | 30.27% |
|
| Ratios/Supplemental Data | | | | | |
|
| Net assets, end of year (000’s omitted) | $49,305 | $ 33,791 | $144,419 | $148,614 | $91,770 |
| Ratios (as a percentage of average daily net assets): | | | | | |
| Expenses(3)(4) | 2.56%(5) | 2.37% | 2.23% | 2.30% | 2.41%(5) |
| Net investment income (loss) | 0.01% | (0.01)% | 0.55% | 0.88% | 0.53% |
| Portfolio Turnover of the Portfolio | 75% | 114% | 68% | 35% | 32% |
|
| (1) | Computed using average shares outstanding. |
| (2) | Returns are historical and are calculated by determining the percentage change in net asset value with all distributions reinvested and do not reflect the effect of sales charges. |
| (3) | Includes the Fund’s share of the Portfolio’s allocated expenses. |
| (4) | Excludes the effect of custody fee credits, if any, of less than 0.005%. |
| (5) | The investment adviser to the Portfolio and manager subsidized certain operating expenses (equal to 0.10% of average daily net assets for the year ended December 31, 2009). The investment adviser to the Portfolio voluntarily waived a portion of its investment adviser fee (equal to less than 0.01% of average daily net assets for the year ended December 31, 2005). Absent this waiver and/or subsidy, total return would be lower. |
See notes to financial statements
7
Eaton Vance Emerging Markets Fund as of December 31, 2009
FINANCIAL STATEMENTS CON T ’ D
Financial Highlights |
| | | | | |
| | Class B |
|
|
| | Year Ended December 31, |
|
|
| | 2009 | 2008 | 2007 | 2006 | 2005 |
|
| Net asset value — Beginning of year | $10.600 | $ 28.410 | $27.320 | $22.990 | $19.290 |
|
| Income (Loss) From Operations | | | | | |
|
| Net investment income (loss)(1) | $ (0.071) | $ (0.103) | $ 0.009 | $ 0.149 | $ 0.027 |
| Net realized and unrealized gain (loss) | 7.000 | (14.940) | 6.319 | 5.594 | 5.635 |
|
| Total income (loss) from operations | $ 6.929 | $(15.043) | $ 6.328 | $ 5.743 | $ 5.662 |
|
| Less Distributions | | | | | |
|
| From net investment income | $ — | $ — | $ (0.052) | $ (0.001) | $ (0.012) |
| From net realized gain | — | (2.768) | (5.188) | (1.414) | (1.951) |
|
| Total distributions | $ — | $ (2.768) | $ (5.240) | $ (1.415) | $ (1.963) |
|
| Redemption fees(1) | $ 0.001 | $ 0.001 | $ 0.002 | $ 0.002 | $ 0.001 |
|
| Net asset value — End of year | $17.530 | $ 10.600 | $28.410 | $27.320 | $22.990 |
|
| Total Return(2) | 65.22% | (58.07)% | 23.68% | 25.03% | 29.69% |
|
| Ratios/Supplemental Data | | | | | |
|
| Net assets, end of year (000’s omitted) | $12,518 | $ 8,388 | $33,870 | $31,078 | $26,283 |
| Ratios (as a percentage of average daily net assets): | | | | | |
| Expenses(3)(4) | 3.06%(5) | 2.87% | 2.73% | 2.80% | 2.91%(5) |
| Net investment income (loss) | (0.52)% | (0.51)% | 0.03% | 0.59% | 0.13% |
| Portfolio Turnover of the Portfolio | 75% | 114% | 68% | 35% | 32% |
|
| (1) | Computed using average shares outstanding. |
| (2) | Returns are historical and are calculated by determining the percentage change in net asset value with all distributions reinvested and do not reflect the effect of sales charges. |
| (3) | Includes the Fund’s share of the Portfolio’s allocated expenses. |
| (4) | Excludes the effect of custody fee credits, if any, of less than 0.005%. |
| (5) | The investment adviser to the Portfolio and manager subsidized certain operating expenses (equal to 0.10% of average daily net assets for the year ended December 31, 2009). The investment adviser to the Portfolio voluntarily waived a portion of its investment adviser fee (equal to less than 0.01% of average daily net assets for the year ended December 31, 2005). Absent this waiver and/or subsidy, total return would be lower. |
See notes to financial statements
8
Eaton Vance Emerging Markets Fund as of December 31, 2009
NOTES TO F INANCIAL STATEMENTS |
1 Significant Accounting Policies
Eaton Vance Emerging Markets Fund (the Fund) is a diversified series of Eaton Vance Special Investment Trust (the Trust). The Trust is a Massachusetts business trust registered under the Investment Company Act of 1940, as amended (the 1940 Act), as an open-end management investment company. The Fund offers two classes of shares. Class A shares are generally sold subject to a sales charge imposed at time of purchase. Class B shares are sold at net asset value and are generally subject to a contingent deferred sales charge (see Note 5). Class B shares automatically convert to Class A shares eight years after their purchase as described in the Fund’s prospectus. Each class represents a pro-rata interest in the Fund, but votes separately on class-specific matters and (as noted below) is subject to different expenses. Realized and unrealized gains and losses and net investment income and losses, other than class-specific expenses, are allocated daily to each class of shares based o n the relative net assets of each class to the total net assets of the Fund. Each class of shares differs in its distribution plan and certain other class-specific expenses. The Fund invests all of its investable assets in interests in Emerging Markets Portfolio (the Portfolio), a Massachusetts business trust, having the same investment objective and policies as the Fund. The value of the Fund’s investment in the Portfolio reflects the Fund’s proportionate interest in the net assets of the Portfolio (99.9% at December 31, 2009). The performance of the Fund is directly affected by the performance of the Portfolio. The financial statements of the Portfolio, including the portfolio of investments, are included elsewhere in this report and should be read in conjunction with the Fund’s financial statements.
The following is a summary of significant accounting policies of the Fund. The policies are in conformity with accounting principles generally accepted in the United States of America. A source of authoritative accounting principles applied in the preparation of the Fund’s financial statements is the Financial Accounting Standards Board (FASB) Accounting Standards Codification (the Codification), which superseded existing non-Securities and Exchange Commission accounting and reporting standards for interim and annual reporting periods ending after September 15, 2009. The adoption of the Codification for the current reporting period did not impact the Fund’s application of generally accepted accounting principles.
A Investment Valuation — Valuation of securities by the Portfolio is discussed in Note 1A of the Portfolio’s Notes to Financial Statements, which are included elsewhere in this report.
B Income — The Fund’s net investment income or loss consists of the Fund’s pro-rata share of the net investment income or loss of the Portfolio, less all actual and accrued expenses of the Fund.
C Federal Taxes — The Fund’s policy is to comply with the provisions of the Internal Revenue Code applicable to regulated investment companies and to distribute to shareholders each year substantially all of its net investment income, and all or substantially all of its net realized capital gains. Accordingly, no provision for federal income or excise tax is necessary.
At December 31, 2009, the Fund, for federal income tax purposes, had a capital loss carryforward of $16,539,151 which will reduce its taxable income arising from future net realized gains on investment transactions, if any, to the extent permitted by the Internal Revenue Code, and thus will reduce the amount of distributions to shareholders, which would otherwise be necessary to relieve the Fund of any liability for federal income or excise tax. Such capital loss carryforward will expire on December 31, 2016 ($3,955,777) and December 31, 2017 ($12,583,374).
In addition to the requirements of the Internal Revenue Code, the Fund may also be required to recognize its pro-rata share of the capital gains taxes incurred by the Portfolio. In doing so, the daily net asset value would reflect the Fund’s pro-rata share of the estimated reserve for such taxes incurred by the Portfolio.
As of December 31, 2009, the Fund had no uncertain tax positions that would require financial statement recognition, de-recognition, or disclosure. Each of the Fund’s federal tax returns filed in the 3-year period ended December 31, 2009 remains subject to examination by the Internal Revenue Service.
D Expenses — The majority of expenses of the Trust are directly identifiable to an individual fund. Expenses which are not readily identifiable to a specific fund are allocated taking into consideration, among other things, the nature and type of expense and the relative size of the funds.
E Expense Reduction — State Street Bank and Trust Company (SSBT) serves as custodian of the Fund. Pursuant to the custodian agreement, SSBT receives a fee reduced by credits, which are determined based on the average daily cash balance the Fund maintains with SSBT. All credit balances, if any, used to reduce the Fund’s custodian fees are reported as a reduction of expenses in the Statement of Operations.
F Use of Estimates — The preparation of the financial statements in conformity with accounting principles
Eaton Vance Emerging Markets Fund as of December 31, 2009
NOTES TO F INANCIAL STATEMENTS CON T ’D |
generally accepted in the United States of America requires management to make estimates and assumptions that affect the reported amounts of assets and liabilities at the date of the financial statements and the reported amounts of income and expense during the reporting period. Actual results could differ from those estimates.
G Indemnifications — Under the Trust’s organizational documents, its officers and Trustees may be indemnified against certain liabilities and expenses arising out of the performance of their duties to the Fund. Under Massachusetts law, if certain conditions prevail, shareholders of a Massachusetts business trust, (such as the Trust) could be deemed to have personal liability for the obligations of the Trust. However, the Trust’s Declaration of Trust contains an express disclaimer of liability on the part of Fund shareholders and the By-laws provide that the Trust shall assume the defense on behalf of any Fund shareholders. Moreover, the By-laws also provide for indemnification out of Fund property of any shareholder held personally liable solely by reason of being or having been a shareholder for all loss or expense arising from such liability. Additionally, in the normal course of business, the Fund enters into agreements with service providers that may contain indemnification clauses. The Fund’s maximum exposure under these arrangements is unknown as this would involve future claims that may be made against the Fund that have not yet occurred.
H Redemption Fees — Upon the redemption or exchange of shares by Class A shareholders within 90 days of the settlement of purchase, a fee of 1% of the current net asset value of these shares will be assessed and retained by the Fund for the benefit of the remaining shareholders. The redemption fee is accounted for as an addition to paid-in capital.
I Other — Investment transactions are accounted for on a trade date basis. Dividends to shareholders are recorded on the ex-dividend date.
2 Distributions to Shareholders
It is the present policy of the Fund to make at least one distribution annually (normally in December) of all or substantially all of its net investment income and to distribute annually all or substantially all of its net realized capital gains (reduced by available capital loss carryforwards from prior years, if any). Distributions are declared separately for each class of shares. Shareholders may reinvest income and capital gain distributions in additional shares of the same class of the Fund at the net asset value as of the ex-dividend date or, at the election of the shareholder, receive distributions in cash. The Fund distinguishes between distributions on a tax basis and a financial reporting basis. Accounting principles generally
accepted in the United States of America require that only distributions in excess of tax basis earnings and profits be reported in the financial statements as a return of capital. Permanent differences between book and tax accounting relating to distributions are reclassified to paid-in capital. For tax purposes, distributions from short-term capital gains are considered to be from ordinary income.
The tax character of distributions declared for the years ended December 31, 2009 and December 31, 2008 was as follows:
| | |
| | Year Ended December 31, |
|
|
| | 2009 | 2008 |
|
| Distributions declared from: | | |
| Ordinary income | $ — | $ 1,900,645 |
| Long-term capital gains | $ — | $13,535,964 |
During the year ended December 31, 2009, accumulated net realized loss was decreased by $91,925, accumulated net investment loss was decreased by $25,404 and paid-in capital was decreased by $117,329 due to differences between book and tax accounting, primarily for foreign currency gain (loss), foreign capital gains taxes and net operating losses. These reclassifications had no effect on the net assets or net asset value per share of the Fund.
As of December 31, 2009, the components of distributable earnings (accumulated losses) and unrealized appreciation (depreciation) on a tax basis were as follows:
| |
| Capital loss carryforward | $(16,539,151) |
| Net unrealized appreciation | $ 14,308,152 |
The differences between components of distributable earnings (accumulated losses) on a tax basis and the amounts reflected in the Statement of Assets and Liabilities are primarily due to wash sales, partnership allocations and investments in passive foreign investment companies.
3 Management Fee and Other Transactions with Affiliates
The management fee is earned by Eaton Vance Management (EVM) as compensation for management and administration of the business affairs of the Fund. The fee is computed at an annual rate of 0.25% of the Fund’s average daily net assets up to $500 million and at reduced rates as daily net assets exceed that level, and is payable monthly. For the year ended December 31, 2009, the management fee was equivalent to 0.25% of the Fund’s average daily net assets and amounted to $126,516. In addition, investment adviser and administration fees are paid by the Portfolio to Lloyd George Investment Management (Bermuda) Limited (Lloyd George) and to EVM, respectively. See Note 2 of the Portfolio’s Notes to Financial Statements, which are included elsewhere in this report. Effective March 27, 2006,
10
Eaton Vance Emerging Markets Fund as of December 31, 2009
NOTES TO F INANCIAL STATEMENTS CON T ’D |
Lloyd George and EVM agreed to contractually reduce the Fund’s total operating expenses in an amount equal to 0.05% annually of the Fund’s average daily net assets. Such reduction is shared equally by EVM and Lloyd George and may not be terminated without shareholder approval. In addition, effective April 27, 2009, Lloyd George and EVM have agreed to further reduce the Fund’s total operating expenses by an additional 0.10% annually of the Fund’s average daily net assets through April 30, 2010. Thereafter, this expense reduction may be changed or terminated at any time. Such additional reduction is also shared equally by EVM and Lloyd George. Pursuant to these agreements, EVM and Lloyd George were allocated $63,128 of the Fund’s operating expenses for the year ended December 31, 2009. EVM serves as the sub-transfer agent of the Fund and receives from the transfer agent an aggregate fee based upon the actual expenses incurred by EVM in the performance of thes e services. For the year ended December 31, 2009, EVM earned $7,978 in sub-transfer agent fees. The Fund was informed that Eaton Vance Distributors, Inc. (EVD), an affiliate of EVM and the Fund’s principal underwriter, received $10,699 as its portion of the sales charge on sales of Class A shares for the year ended December 31, 2009. EVD also received distribution and service fees from Class A and Class B shares (see Note 4) and contingent deferred sales charges (see Note 5).
Except for Trustees of the Fund and the Portfolio who are not members of EVM’s or Lloyd George’s organizations, officers and Trustees receive remuneration for their services to the Fund out of the management fee. Certain officers and Trustees of the Fund and the Portfolio are officers of the above organizations.
4 Distribution Plans
The Fund has in effect distribution plans for Class A shares (Class A Plan) and Class B shares (Class B Plan) (collectively, the Plans), pursuant to Rule 12b-1 under the 1940 Act. The Plans require the Fund to pay EVD amounts equal to an annual rate of 0.75% of its average daily net assets attributable to Class B shares and an amount equal to (a) 0.50% of that portion of its average daily net assets attributable to Class A shares which have remained outstanding for less than one year and (b) 0.25% of that portion of its average daily net assets which is attributable to Class A shares which have remained outstanding for more than one year, for providing ongoing distribution services to the Fund. The Fund will automatically discontinue payments to EVD during any period in which there are no outstanding Uncovered Distribution Charges, which are equivalent to the sum of (i) 5% of the aggregate amount received by the Fund for Class B shares sold, plus (ii) interest calculated by applyin g the rate of 1% over the prevailing prime rate to the outstanding balance of Uncovered Distribution Charges of EVD of Class B, reduced by the aggregate amount of contingent deferred sales charges (see Note 5) and amounts theretofore paid or
payable to EVD by Class B and by Lloyd George in consideration of EVD’s distribution efforts. The amounts paid by Lloyd George to EVD are equivalent to 0.15% per annum of the Fund’s average daily net assets attributable to Class B shares and are made from Lloyd George’s own resources, not Fund assets. For the year ended December 31, 2009, the Fund paid or accrued to EVD $114,405 and $75,589 for Class A and Class B shares, respectively, representing 0.28% and 0.75% of the average daily net assets for Class A and Class B shares, respectively. At December 31, 2009, the amount of Uncovered Distribution Charges of EVD calculated under the Class B Plan was approximately $94,000.
The Class A Plan also authorizes the Fund to make payments of service fees to EVD, investment dealers and other persons in amounts not exceeding 0.25% per annum of its average daily net assets attributable to Class A shares based on the value of Fund shares sold by such persons and remaining outstanding for at least one year. The Class B Plan authorizes the Fund to make payments of service fees equal to 0.25% per annum of its average daily net assets attributable to Class B shares. Service fees paid or accrued are for personal services and/or the maintenance of shareholder accounts. They are separate and distinct from the sales commissions and distribution fees payable to EVD and, as such, are not subject to automatic discontinuance when there are no outstanding Uncovered Distribution Charges of EVD. Service fees paid or accrued for the year ended December 31, 2009 amounted to $88,233 and $25,197 for Class A and Class B shares, respectively, representing 0.22% and 0.25% of the aver age daily net assets for Class A and Class B shares, respectively.
5 Contingent Deferred Sales Charges
A contingent deferred sales charge (CDSC) generally is imposed on redemptions of Class B shares made within six years of purchase. Class A shares may be subject to a 1% CDSC if redeemed within 18 months of purchase (depending on the circumstances of purchase). Generally, the CDSC is based upon the lower of the net asset value at date of redemption or date of purchase. No charge is levied on shares acquired by reinvestment of dividends or capital gain distributions. The CDSC for Class B shares is imposed at declining rates that begin at 5% in the case of redemptions in the first and second year after purchase, declining one percentage point each subsequent year. No CDSC is levied on shares which have been sold to EVM or its affiliates or to their respective employees or clients and may be waived under certain other limited conditions. CDSCs received on Class B redemptions are paid to EVD to reduce the amount of Uncovered Distribution Charges calculated under the Fund’s Class B Plan. CDSCs received on Class B redemptions when no Uncovered Distribution Charges exist are credited to the Fund. For the year ended
11
Eaton Vance Emerging Markets Fund as of December 31, 2009
NOTES TO F INANCIAL STATEMENTS CON T ’D |
December 31, 2009, the Fund was informed that EVD received approximately $21,000 of CDSCs paid by Class B shareholders and no CDSCs paid by Class A shareholders.
6 Investment Transactions
For the year ended December 31, 2009, increases and decreases in the Fund’s investment in the Portfolio aggregated $6,993,900 and $13,228,071, respectively.
7 Shares of Beneficial Interest
The Fund’s Declaration of Trust permits the Trustees to issue an unlimited number of full and fractional shares of beneficial interest (without par value). Such shares may be issued in a number of different series (such as the Fund) and classes. Transactions in Fund shares were as follows:
| | |
| | Year Ended December 31, |
|
|
| Class A | 2009 | 2008 |
|
| Sales | 696,588 | 800,810 |
| Issued to shareholders electing to | | |
| receive payments of distributions in | | |
| Fund shares | — | 392,050 |
| Redemptions | (1,114,835) | (3,089,554) |
| Exchange from Class B shares | 57,108 | 69,153 |
|
| Net decrease | (361,139) | (1,827,541) |
|
| | Year Ended December 31, |
|
|
| Class B | 2009 | 2008 |
|
| Sales | 168,705 | 88,757 |
| Issued to shareholders electing to | | |
| receive payments of distributions in | | |
| Fund shares | — | 114,094 |
| Redemptions | (184,177) | (530,436) |
| Exchange to Class A shares | (61,356) | (73,848) |
|
| Net decrease | (76,828) | (401,433) |
|
For the years ended December 31, 2009 and December 31, 2008, the Fund received $3,659 and $6,072, respectively, in redemption fees.
8 Review for Subsequent Events
In connection with the preparation of the financial statements of the Fund as of and for the year ended December 31, 2009, events and transactions subsequent to December 31, 2009 through February 16, 2010, the date the financial statements were issued, have been evaluated by the Fund’s management for possible adjustment and/or disclosure. Management has not identified any subsequent events requiring financial statement disclosure as of the date these financial statements were issued.
12
Eaton Vance Emerging Markets Fund as of D e c e m be r 31, 2009
REPORT OF INDEPENDENT REGISTERED PUBLIC ACCOUNTING FIRM |
To the Trustees of Eaton Vance Special Investment
Trust and Shareholders of Eaton Vance Emerging
Markets Fund:
We have audited the accompanying statement of assets and
liabilities of Eaton Vance Emerging Markets Fund (the
“Fund”) (one of the funds constituting Eaton Vance Special
Investment Trust), as of December 31, 2009, and the related
statement of operations for the year then ended, the
statements of changes in net assets for each of the two years
in the period then ended, and the financial highlights for each
of the five years in the period then ended. These financial
statements and financial highlights are the responsibility of
the Fund’s management. Our responsibility is to express an
opinion on these financial statements and financial highlights
based on our audits.
We conducted our audits in accordance with the standards of
the Public Company Accounting Oversight Board
(United States). Those standards require that we plan and
perform the audit to obtain reasonable assurance about
whether the financial statements and financial highlights are
free of material misstatement. The Fund is not required to
have, nor were we engaged to perform, an audit of its
internal control over financial reporting. Our audits included
consideration of internal control over financial reporting as a
basis for designing audit procedures that are appropriate in
the circumstances, but not for the purpose of expressing an
opinion on the effectiveness of the Fund’s internal control
over financial reporting. Accordingly, we express no such
opinion. An audit also includes examining, on a test basis,
evidence supporting the amounts and disclosures in the
financial statements, assessing the accounting principles used
and significant estimates made by management, as well as
evaluating the overall financial statement presentation. We
believe that our audits provide a reasonable basis for our
opinion.
In our opinion, the financial statements and financial
highlights referred to above present fairly, in all material
respects, the financial position of Eaton Vance Emerging
Markets Fund as of December 31, 2009, the results of its
operations for the year then ended, the changes in its net
assets for each of the two years in the period then ended, and
the financial highlights for each of the five years in the period
then ended, in conformity with accounting principles
generally accepted in the United States of America. |
DELOITTE & TOUCHE LLP
Boston, Massachusetts
February 16, 2010 |
13
Eaton Vance Emerging Markets Fund as of December 31, 2009
FEDERAL TAX IN FORMATION (Unaudited) |
The Form 1099-DIV you received in January 2010 showed the tax status of all distributions paid to your account in calendar year 2009. Shareholders are advised to consult their own tax adviser with respect to the tax consequences of their investment in the Fund. As required by the Internal Revenue Code regulations, shareholders must be notified within 60 days of the Fund’s fiscal year end regarding the status of qualified dividend income for individuals and the foreign tax credit.
Qualified Dividend Income. The Fund designates $170,881, or up to the maximum amount of such dividends allowable pursuant to the Internal Revenue Code, as qualified dividend income eligible for the reduced tax rate of 15%.
Foreign Tax Credit. The Fund paid foreign taxes of $170,881 and recognized foreign source income of $1,381,196.
14
Emerging Markets Portfolio as of D e c e m be r 31, 2009
PORTFOLIO OF INVESTMENTS |
| | |
| Common Stocks — 90.9% | | |
| Security | Shares | Value |
|
| Automobiles — 3.0% | | |
|
| Hyundai Motor Co.(1) | 18,220 | $ 1,885,982 |
|
| | | $ 1,885,982 |
|
| Beverages — 2.1% | | |
|
| Cia de Bebidas das Americas, PFC Shares | 12,850 | $ 1,287,952 |
|
| | | $ 1,287,952 |
|
| Capital Markets — 0.6% | | |
|
| GP Investments, Ltd. BDR(1) | 59,900 | $ 350,936 |
|
| | | $ 350,936 |
|
| Chemicals — 2.9% | | |
|
| OCI Co., Ltd.(1) | 4,580 | $ 857,783 |
|
| Sinofert Holdings, Ltd. | 1,680,000 | 931,926 |
|
| | | $ 1,789,709 |
|
| Commercial Banks — 13.4% | | |
|
| Banco do Brasil SA | 51,950 | $ 886,223 |
| China Construction Bank, Class H | 1,660,000 | 1,417,881 |
| Credicorp, Ltd. | 9,414 | 725,066 |
| Industrial & Commercial Bank of China, Ltd., | | |
| Class H | 1,504,000 | 1,238,639 |
| Itau Unibanco Holding SA, PFC Shares | 47,080 | 1,046,252 |
| Kasikornbank PCL | 241,900 | 630,335 |
| Sberbank of Russian Federation GDR(2) | 5,800 | 1,586,469 |
| Standard Chartered PLC | 33,515 | 832,760 |
|
| | | $ 8,363,625 |
|
| Computers & Peripherals — 0.8% | |
|
| HTC Corp. | 42,000 | $ 481,176 |
|
| | | $ 481,176 |
|
| Construction & Engineering — 1.7% | |
|
| Empresas ICA SAB de CV(1) | 265,800 | $ 619,699 |
|
| Murray & Roberts Holdings, Ltd. | 68,100 | 425,916 |
|
| | | $ 1,045,615 |
|
| | |
| Security | Shares | Value |
|
| Construction Materials — 1.2% | | |
|
| Anhui Conch Cement Co., Ltd., Class H | 112,000 | $ 716,393 |
|
| | | $ 716,393 |
|
| Diversified Financial Services — 3.0% | |
|
| BM&F Bovespa SA | 132,900 | $ 935,109 |
|
| Fubon Financial Holding Co., Ltd.(1) | 766,000 | 941,732 |
|
| | | $ 1,876,841 |
|
| Electric Utilities — 2.1% | | |
|
| Cia Energetica de Minas Gerais, PFC Shares | 73,126 | $ 1,327,273 |
|
| | | $ 1,327,273 |
|
| Electronic Equipment, Instruments & | |
| Components — 4.0% | | |
|
| Hon Hai Precision Industry Co., Ltd. | 529,402 | $ 2,475,830 |
|
| | | $ 2,475,830 |
|
| Energy Equipment & Services — 1.8% | |
|
| Tenaris SA ADR | 25,700 | $ 1,096,105 |
|
| | | $ 1,096,105 |
|
| Food & Staples Retailing — 1.1% | |
|
| Wal-Mart de Mexico SAB de CV, Series V | 160,600 | $ 715,715 |
|
| | | $ 715,715 |
|
| Food Products — 1.1% | | |
|
| Kuala Lumpur Kepong Bhd | 144,000 | $ 692,449 |
|
| | | $ 692,449 |
|
| Gas Utilities — 1.4% | | |
|
| Perusahaan Gas Negara PT | 2,178,000 | $ 900,006 |
|
| | | $ 900,006 |
|
| Health Care Equipment & Supplies — 0.9% | |
|
| Mindray Medical International, Ltd. ADR | 16,900 | $ 573,248 |
|
| | | $ 573,248 |
|
See notes to financial statements
15
Emerging Markets Portfolio as of December 31, 2009
PORTFOLIO OF INVESTMENTS CO N T ’ D |
| | |
| Security | Shares | Value |
|
| Household Durables — 2.6% | | |
|
| Desarrolladora Homex SA de CV(1) | 117,850 | $ 661,228 |
| MRV Engenharia e Participacoes SA | 116,500 | 943,510 |
|
| | | $ 1,604,738 |
|
| Industrial Conglomerates — 2.7% | |
|
| Beijing Enterprises Holdings, Ltd. | 151,500 | $ 1,097,278 |
| Far Eastern New Century Corp. | 454,920 | 568,823 |
|
| | | $ 1,666,101 |
|
| Insurance — 4.4% | | |
|
| China Taiping Insurance Holdings Co., Ltd.(1) | 472,400 | $ 1,526,717 |
|
| Samsung Fire & Marine Insurance Co., Ltd. | 7,180 | 1,228,991 |
|
| | | $ 2,755,708 |
|
| Machinery — 2.2% | | |
|
| United Tractors Tbk PT | 456,583 | $ 747,716 |
|
| Weg SA | 58,500 | 618,266 |
|
| | | $ 1,365,982 |
|
| Media — 0.7% | | |
|
| Grupo Televisa SA ADR | 20,700 | $ 429,732 |
|
| | | $ 429,732 |
|
| Metals & Mining — 12.1% | | |
|
| AngloGold Ashanti, Ltd. | 19,413 | $ 786,358 |
| Cia de Minas Buenaventura SA ADR | 17,300 | 579,031 |
| Grupo Mexico SA de CV, Series B | 287,500 | 656,226 |
| Impala Platinum Holdings, Ltd. | 33,150 | 906,130 |
| Kazakhmys PLC(1) | 29,300 | 620,385 |
| POSCO | 3,400 | 1,793,063 |
| Vale SA ADR | 74,900 | 2,174,347 |
|
| | | $ 7,515,540 |
|
| Multiline Retail — 0.8% | | |
|
| PCD Stores, Ltd.(1) | 1,308,000 | $ 507,788 |
|
| | | $ 507,788 |
|
| Oil, Gas & Consumable Fuels — 10.8% | |
|
| CNOOC, Ltd. | 1,250,000 | $ 1,944,234 |
|
| Petroleo Brasileiro SA | 90,400 | 2,162,642 |
|
| | |
| Security | Shares | Value |
|
| Oil, Gas & Consumable Fuels (continued) | |
|
| PTT Exploration & Production PCL | 224,000 | $ 987,642 |
|
| Rosneft Oil Co. GDR(1) | 185,708 | 1,597,089 |
|
| | | $ 6,691,607 |
|
| Pharmaceuticals — 1.8% | | |
|
| Teva Pharmaceutical Industries, Ltd. ADR | 19,600 | $ 1,101,128 |
|
| | | $ 1,101,128 |
|
| Semiconductors & Semiconductor | |
| Equipment — 8.0% | | |
|
| Samsung Electronics Co., Ltd. | 3,520 | $ 2,413,768 |
|
| Taiwan Semiconductor Manufacturing Co., Ltd. | 893,148 | 1,800,116 |
|
| United Microelectronics Corp.(1) | 1,383,000 | 747,155 |
|
| | | $ 4,961,039 |
|
| Textiles, Apparel & Luxury Goods — 1.5% | |
|
| Anta Sports Products, Ltd. | 300,000 | $ 445,482 |
|
| China Dongxiang Group Co. | 639,000 | 493,866 |
|
| | | $ 939,348 |
|
| Transportation Infrastructure — 0.9% | |
|
| Hong Kong Aircraft Engineering Co., Ltd. | 45,600 | $ 588,739 |
|
| | | $ 588,739 |
|
| Wireless Telecommunication Services — 1.3% |
|
| America Movil SAB de CV, Series L | 352,700 | $ 829,581 |
|
| | | $ 829,581 |
|
| Total Common Stocks | | |
| (identified cost $43,181,975) | | $56,535,886 |
|
| Warrants — 8. 5% | | |
| Security | Shares | Value |
|
| Commercial Banks — 1.5% | | |
|
| ICICI Bank, Ltd., Exp. 10/24/12(3) | 49,675 | $ 934,387 |
|
| | | $ 934,387 |
|
| Construction & Engineering — 1.5% | |
|
| Larsen & Toubro, Ltd., Exp. 1/24/17(1)(3) | 26,010 | $ 937,869 |
|
| | | $ 937,869 |
|
See notes to financial statements
16
Emerging Markets Portfolio as of D e c e m be r 31, 2009
PORTFOLIO OF INVESTMENTS CO N T ’ D |
| | |
| Security | Shares | Value |
|
| IT Services — 1.9% | | |
|
| Infosys Technologies, Ltd., Exp. 6/30/11(1) | 21,380 | $ 1,198,563 |
|
| | | $ 1,198,563 |
|
| Oil, Gas & Consumable Fuels — 1.1% | |
|
| Reliance Industries, Ltd., Exp. 11/7/16(1)(3) | 27,460 | $ 643,665 |
|
| | | $ 643,665 |
|
| Thrifts & Mortgage Finance — 2.5% | |
|
| Housing Development Finance Corporation, Ltd., | | |
| Exp. 5/4/12(1) | 26,835 | $ 1,548,379 |
|
| | | $ 1,548,379 |
|
| Total Warrants | | |
| (identified cost $4,242,664) | | $ 5,262,863 |
|
| Short-Term Investments — | 0.1% | |
| | | |
| | Principal | |
| | Amount | |
| Description | (000’s omitted) | Value |
|
| State Street Bank and Trust Euro Time Deposit, | | |
| 0.01%, 1/4/10 | $ 97 | $ 96,651 |
|
| | | $ 96,651 |
|
| Total Short-Term Investments | | |
| (identified cost $96,651) | | $ 96,651 |
|
| Total Investments — 99.5% | | |
| (identified cost $47,521,290) | | $61,895,400 |
|
| Other Assets, Less Liabilities — 0.5% | $ 286,151 |
|
| Net Assets — 100.0% | | $62,181,551 |
|
The percentage shown for each investment category in the Portfolio
of Investments is based on net assets.
ADR - American Depositary Receipt
BDR - Brazilian Depositary Receipt
GDR - Global Depositary Receipt
PCL - Public Company Ltd.
PFC Shares - Preference Shares
| (1) | Non-income producing security. |
| (2) | Security exempt from registration under Regulation S of the Securities Act of 1933, which exempts from registration securities offered and sold outside the United States. Security may not be offered or sold in the United States except pursuant to an exemption from, or in a transaction not subject to, the registration requirements of the Securities Act of 1933. |
| (3) | Security exempt from registration under Rule 144A of the Securities Act of 1933. These securities may be sold in transactions exempt from registration, normally to qualified institutional buyers. At December 31, 2009, the aggregate value of these securities is $2,515,921 or 4.0% of the Portfolio’s net assets. |
| | |
| Country Concentration of Portfolio | |
| |
| | Percentage | |
| Country | of Net Assets | Value |
|
| Brazil | 18.9% | $11,732,510 |
| China | 17.5 | 10,893,452 |
| South Korea | 13.2 | 8,179,587 |
| Taiwan | 11.3 | 7,014,832 |
| India | 8.5 | 5,262,863 |
| Mexico | 6.3 | 3,912,181 |
| Russia | 5.1 | 3,183,558 |
| South Africa | 3.4 | 2,118,404 |
| Indonesia | 2.6 | 1,647,722 |
| Thailand | 2.6 | 1,617,977 |
| United Kingdom | 2.3 | 1,453,145 |
| Peru | 2.1 | 1,304,097 |
| Israel | 1.8 | 1,101,128 |
| Argentina | 1.8 | 1,096,105 |
| Malaysia | 1.1 | 692,449 |
| Hong Kong | 0.9 | 588,739 |
| United States | 0.1 | 96,651 |
|
| Total Investments | 99.5% | $61,895,400 |
|
| | | | |
| See notes to financial statements |
| 17 |
Emerging Markets Portfolio as of December 31, 2009
FINANCIAL STATEMENTS |
| |
| Statement of Assets and Liabilities |
| |
| As of December 31, 2009 | |
| Assets | |
|
| Investments, at value (identified cost, $47,521,290) | $61,895,400 |
| Foreign currency, at value (identified cost, $34,363) | 34,432 |
| Dividends and interest receivable | 54,791 |
| Receivable for investments sold | 867,289 |
|
| Total assets | $62,851,912 |
|
| Liabilities | |
|
| Demand note payable | $ 200,000 |
| Payable for investments purchased | 310,666 |
| Payable to affiliates: | |
| Investment adviser fee | 38,073 |
| Administration fee | 12,935 |
| Trustees’ fees | 645 |
| Accrued foreign capital gains taxes | 12,394 |
| Accrued expenses | 95,648 |
|
| Total liabilities | $ 670,361 |
|
| Net Assets applicable to investors’ interest in Portfolio | $62,181,551 |
|
| Sources of Net Assets | |
|
| Net proceeds from capital contributions and withdrawals | $47,810,496 |
| Net unrealized appreciation | 14,371,055 |
|
| Total | $62,181,551 |
|
| |
| Statement of Operations | |
| For the Year Ended | |
| December 31, 2009 | |
|
| Investment Income | |
|
| Dividends (net of foreign taxes, $114,657) | $ 1,274,883 |
| Interest | 22,566 |
|
| Total investment income | $ 1,297,449 |
|
| |
| Expenses | |
|
| Investment adviser fee | $ 379,944 |
| Administration fee | 126,814 |
| Trustees’ fees and expenses | 1,330 |
| Custodian fee | 116,521 |
| Legal and accounting services | 71,965 |
| Miscellaneous | 8,370 |
|
| Total expenses | $ 704,944 |
|
| Deduct — | |
| Reduction of custodian fee | $ 2 |
|
| Total expense reductions | $ 2 |
|
| Net expenses | $ 704,942 |
|
| Net investment income | $ 592,507 |
|
| Realized and Unrealized Gain (Loss) | |
|
| Net realized gain (loss) — | |
| Investment transactions (net of foreign capital gains taxes | |
| of $56,225) | $ (3,507,658) |
| Foreign currency transactions | (35,700) |
|
| Net realized loss | $ (3,543,358) |
|
| Change in unrealized appreciation (depreciation) — | |
| Investments (net of increase in accrued foreign capital gains taxes | |
| of $2,432) | $28,956,222 |
| Foreign currency | (3,356) |
|
| Net change in unrealized appreciation (depreciation) | $28,952,866 |
|
| Net realized and unrealized gain | $25,409,508 |
|
| Net increase in net assets from operations | $26,002,015 |
|
See notes to financial statements
18
Emerging Markets Portfolio as of December 31, 2009
FINANCIAL STATEMENTS CON T ’ D
Statements of Changes in Net Assets |
| | |
| Increase (Decrease) | Year Ended | Year Ended |
| in Net Assets | December 31, 2009 | December 31, 2008 |
|
| From operations — | | |
| Net investment income | $ 592,507 | $ 1,138,465 |
| Net realized loss from investment and | | |
| foreign currency transactions | (3,543,358) | (13,025,618) |
| Net change in unrealized appreciation | | |
| (depreciation) from investments and | | |
| foreign currency | 28,952,866 | (67,171,011) |
|
| Net increase (decrease) in net assets from | | |
| operations | $ 26,002,015 | $ (79,058,164) |
|
| Capital transactions — | | |
| Contributions | $ 6,993,900 | $ 19,183,362 |
| Withdrawals | (13,228,071) | (76,262,652) |
|
| Net decrease in net assets from capital | | |
| transactions | $ (6,234,171) | $ (57,079,290) |
|
| Net increase (decrease) in net assets | $ 19,767,844 | $(136,137,454) |
|
| Net Assets | | |
|
| At beginning of year | $ 42,413,707 | $ 178,551,161 |
|
| At end of year | $ 62,181,551 | $ 42,413,707 |
|
See notes to financial statements
19
Emerging Markets Portfolio as of December 31, 2009
FINANCIAL STATEMENTS CON T ’ D
Supplementary Data |
| | | | | |
| | Year Ended December 31, |
|
|
| | 2009 | 2008 | 2007 | 2006 | 2005 |
|
| Ratios/Supplemental Data | | | | | |
|
| Ratios (as a percentage of average daily net assets): | | | | | |
| Expenses(1) | 1.39% | 1.33% | 1.31% | 1.32% | 1.38%(2) |
| Net investment income | 1.17% | 1.03% | 1.45% | 1.89% | 1.59% |
| Portfolio Turnover | 75% | 114% | 68% | 35% | 32% |
|
| Total Return | 67.93% | (57.39)% | 25.41% | 26.86% | 31.60% |
|
| Net assets, end of year (000’s omitted) | $62,182 | $42,414 | $178,551 | $177,728 | $117,679 |
|
| (1) | Excludes the effect of custody fee credits, if any, of less than 0.005%. |
| (2) | The investment adviser voluntarily waived a portion of its investment adviser fee equal to less than 0.01% of average daily net assets for the year ended December 31, 2005. |
See notes to financial statements
20
Emerging Markets Portfolio as of December 31, 2009
NOTES TO F INANCIAL STATEMENTS |
1 Significant Accounting Policies
Emerging Markets Portfolio (the Portfolio) is a Massachusetts business trust registered under the Investment Company Act of 1940, as amended (the 1940 Act), as a diversified, open-end management investment company. The Portfolio’s investment objective is to seek long-term capital appreciation. The Declaration of Trust permits the Trustees to issue interests in the Portfolio. At December 31, 2009, Eaton Vance Emerging Markets Fund held a 99.9% interest in the Portfolio.
The following is a summary of significant accounting policies of the Portfolio. The policies are in conformity with accounting principles generally accepted in the United States of America. A source of authoritative accounting principles applied in the preparation of the Portfolio’s financial statements is the Financial Accounting Standards Board (FASB) Accounting Standards Codification (the Codification), which superseded existing non-Securities and Exchange Commission accounting and reporting standards for interim and annual reporting periods ending after September 15, 2009. The adoption of the Codification for the current reporting period did not impact the Portfolio’s application of generally accepted accounting principles.
A Investment Valuation — Equity securities (including common shares of closed-end investment companies) listed on a U.S. securities exchange generally are valued at the last sale price on the day of valuation or, if no sales took place on such date, at the mean between the closing bid and asked prices therefore on the exchange where such securities are principally traded. Equity securities listed on the NASDAQ Global or Global Select Market generally are valued at the NASDAQ official closing price. Unlisted or listed securities for which closing sales prices or closing quotations are not available are valued at the mean between the latest available bid and asked prices or, in the case of preferred equity securities that are not listed or traded in the over-the-counter market, by a third party pricing service that will use various techniques that consider factors including, but not limited to, prices or yields of securities with similar c haracteristics, benchmark yields, broker/dealer quotes, quotes of underlying common stock, issuer spreads, as well as industry and economic events. Short-term debt securities with a remaining maturity of sixty days or less are generally valued at amortized cost, which approximates market value. Foreign securities and currencies are valued in U.S. dollars, based on foreign currency exchange rate quotations supplied by a third party pricing service. The pricing service uses a proprietary model to determine the exchange rate. Inputs to the model include reported trades and implied bid/ask spreads. The daily valuation of exchange-traded foreign securities generally is determined as of the close of trading on the principal exchange on which such securities trade. Events occurring after the close of trading on foreign exchanges may result in adjustments to the valuation of foreign securities to more accurately reflect their fair value as of the close of regular trading on the New York Stock Exc hange. When valuing foreign equity securities that meet certain criteria, the Trustees have approved the use of a fair value service that values such securities to reflect market trading that occurs after the close of the applicable foreign markets of comparable securities or other instruments that have a strong correlation to the fair-valued securities. Investments for which valuations or market quotations are not readily available or are deemed unreliable are valued at fair value using methods determined in good faith by or at the direction of the Trustees of the Portfolio in a manner that most fairly reflects the security’s value, or the amount that the Portfolio might reasonably expect to receive for the security upon its current sale in the ordinary course. Each such determination is based on a consideration of all relevant factors, which are likely to vary from one pricing context to another. These factors may include, but are not limited to, the type of security, the existence of any contractual restrictions on the security’s disposition, the price and extent of public trading in similar securities of the issuer or of comparable companies or entities, quotations or relevant information obtained from broker-dealers or other market participants, information obtained from the issuer, analysts, and/or the appropriate stock exchange (for exchange-traded securities), an analysis of the company’s or entity’s financial condition, and an evaluation of the forces that influence the issuer and the market(s) in which the security is purchased and sold.
B Investment Transactions — Investment transactions for financial statement purposes are accounted for on a trade date basis. Realized gains and losses on investments sold are determined on the basis of identified cost.
C Income — Dividend income is recorded on the ex-dividend date for dividends received in cash and/or securities. However, if the ex-dividend date has passed, certain dividends from foreign securities are recorded as the Portfolio is informed of the ex-dividend date. Withholding taxes on foreign dividends and capital gains have been provided for in accordance with the Portfolio’s understanding of the applicable countries’ tax rules and rates. Interest income is recorded on the basis of interest accrued, adjusted for amortization of premium or accretion of discount.
D Federal Taxes — The Portfolio has elected to btreated as a partnership for federal tax purposes. No provision is made by the Portfolio for federal or state taxes on any taxable income of the Portfolio because each investor in the Portfolio is ultimately responsible for the
21
Emerging Markets Portfolio as of December 31, 2009
NOTES TO F INANCIAL STATEMENTS CON T ’D |
payment of any taxes on its share of taxable income. Since at least one of the Portfolio’s investors is a regulated investment company that invests all or substantially all of its assets in the Portfolio, the Portfolio normally must satisfy the applicable source of income and diversification requirements (under the Internal Revenue Code) in order for its investors to satisfy them. The Portfolio will allocate, at least annually among its investors, each investor’s distributive share of the Portfolio’s net investment income, net realized capital gains and any other items of income, gain, loss, deduction or credit.
In addition to the requirements of the Internal Revenue Code, the Portfolio may also be subject to local taxes on the recognition of capital gains in certain countries. In determining the daily net asset value, the Portfolio estimates the accrual for such taxes, if any, based on the unrealized appreciation on certain portfolio securities and the related tax rates. Tax expense attributable to unrealized appreciation is included in the change in unrealized appreciation (depreciation) on investments. Capital gains taxes on securities sold are included in net realized gain (loss) on investments.
Effective October 20, 2009, the Portfolio is also subject to a two percent transaction tax on foreign currency inflows for new investments in publicly-held companies in Brazil. Such tax is included in net realized gain (loss) on foreign currency.
As of December 31, 2009, the Portfolio had no uncertain tax positions that would require financial statement recognition, de-recognition, or disclosure. Each of the Portfolio’s federal tax returns filed in the 3-year period ended December 31, 2009 remains subject to examination by the Internal Revenue Service.
E Expense Reduction — State Street Bank and Trust Company (SSBT) serves as custodian of the Portfolio. Pursuant to the custodian agreement, SSBT receives a fee reduced by credits, which are determined based on the average daily cash balance the Portfolio maintains with SSBT. All credit balances, if any, used to reduce the Portfolio’s custodian fees are reported as a reduction of expenses in the Statement of Operations.
F Foreign Currency Translation — Investment valuations, other assets, and liabilities initially expressed in foreign currencies are translated each business day into U.S. dollars based upon current exchange rates. Purchases and sales of foreign investment securities and income and expenses denominated in foreign currencies are translated into U.S. dollars based upon currency exchange rates in effect on the respective dates of such transactions. Recognized gains or losses on investment transactions attributable to changes in foreign currency exchange rates are recorded for financial statement purposes as net realized gains and losses on investments. That portion of unrealized gains and losses on investments that results from fluctuations in foreign currency exchange rates is not separately disclosed.
G Use of Estimates — The preparation of the financial statements in conformity with accounting principles generally accepted in the United States of America requires management to make estimates and assumptions that affect the reported amounts of assets and liabilities at the date of the financial statements and the reported amounts of income and expense during the reporting period. Actual results could differ from those estimates.
H Indemnifications — Under the Portfolio’s organizational documents, its officers and Trustees may be indemnified against certain liabilities and expenses arising out of the performance of their duties to the Portfolio. Under Massachusetts law, if certain conditions prevail, interestholders in the Portfolio could be deemed to have personal liability for the obligations of the Portfolio. However, the Portfolio’s Declaration of Trust contains an express disclaimer of liability on the part of Portfolio interestholders and the By-laws provide that the Portfolio shall assume the defense on behalf of any Portfolio interestholder. Moreover, the By-laws also provide for indemnification out of Portfolio property of any interestholder held personally liable solely by reason of being or having been an interestholder for all loss or expense arising from such liability. Additionally, in the normal course of business, the Portfolio enters in to agreements with service providers that may contain indemnification clauses. The Portfolio’s maximum exposure under these arrangements is unknown as this would involve future claims that may be made against the Portfolio that have not yet occurred.
2 Investment Adviser Fee and Other Transactions with Affiliates
The investment adviser fee is earned by Lloyd George Investment Management (Bermuda) Limited (Lloyd George), an affiliate of Eaton Vance Management (EVM), as compensation for management and investment advisory services rendered to the Portfolio. The fee is computed at an annual rate of 0.75% of the Portfolio’s average daily net assets up to $500 million, and at reduced rates as daily net assets exceed that level, and is payable monthly. For the year ended December 31, 2009, the investment adviser fee was 0.75% of the Portfolio’s average daily net assets and amounted to $379,944. In addition, an administration fee is earned by EVM for administering the business affairs of the Portfolio and is computed at an annual rate of 0.25% of the Portfolio’s average daily net assets up to $500 million, and at reduced rates as daily net assets
22
Emerging Markets Portfolio as of December 31, 2009
NOTES TO F INANCIAL STATEMENTS CON T ’D |
exceed that level. For the year ended December 31, 2009, the administration fee was 0.25% of the Portfolio’s average daily net assets and amounted to $126,814.
Except for Trustees of the Portfolio who are not members of EVM’s or Lloyd George’s organizations, officers and Trustees receive remuneration for their services to the Portfolio out of the investment adviser and administration fees. Certain officers and Trustees of the Portfolio are officers of the above organizations.
3 Purchases and Sales of Investments
Purchases and sales of investments, other than short-term obligations, aggregated $37,303,323 and $43,101,262, respectively, for the year ended December 31, 2009.
4 Federal Income Tax Basis of Investments
The cost and unrealized appreciation (depreciation) of investments of the Portfolio at December 31, 2009, as determined on a federal income tax basis, were as follows:
| |
| Aggregate cost | $47,655,034 |
|
| Gross unrealized appreciation | $15,151,037 |
| Gross unrealized depreciation | (910,671) |
|
| Net unrealized appreciation | $14,240,366 |
|
The net unrealized depreciation on foreign currency transactions, including foreign capital gains taxes, at December 31, 2009 on a federal income tax basis was $3,055.
5 Line of Credit
The Portfolio participates with other portfolios and funds managed by EVM and its affiliates in a $450 million unsecured line of credit agreement with a group of banks. Borrowings are made by the Portfolio solely to facilitate the handling of unusual and/or unanticipated short-term cash requirements. Interest is charged to the Portfolio based on its borrowings at an amount above either the Eurodollar rate or Federal Funds rate. In addition, a fee computed at an annual rate of 0.10% on the daily unused portion of the line of credit is allocated among the participating portfolios and funds at the end of each quarter. Because the line of credit is not available exclusively to the Portfolio, it may be unable to borrow some or all of its requested amounts at any particular time. At December 31, 2009, the Portfolio had a balance outstanding pursuant to this line of credit of $200,000 at an interest rate of 1.36%. Based on the short-term nature of the borrowings under the line of credit a nd variable interest rate, the carrying value of the borrowings approximated its fair value at December 31, 2009. The Portfolio’s average borrowings or allocated fees during the year ended December 31, 2009 were not significant.
6 Risks Associated with Foreign Investments
Investing in securities issued by companies whose principal business activities are outside the United States may involve significant risks not present in domestic investments. For example, there is generally less publicly available information about foreign companies, particularly those not subject to the disclosure and reporting requirements of the U.S. securities laws. Certain foreign issuers are generally not bound by uniform accounting, auditing, and financial reporting requirements and standards of practice comparable to those applicable to domestic issuers. Investments in foreign securities also involve the risk of possible adverse changes in investment or exchange control regulations, expropriation or confiscatory taxation, limitation on the removal of funds or other assets of the Portfolio, political or financial instability or diplomatic and other developments which could affect such investments. Foreign stock markets, while growing in volume and sophistication, are gener ally not as developed as those in the United States, and securities of some foreign issuers (particularly those located in developing countries) may be less liquid and more volatile than securities of comparable U.S. companies. In general, there is less overall governmental supervision and regulation of foreign securities markets, broker-dealers and issuers than in the United States.
7 Fair Value Measurements
Under generally accepted accounting principles for fair value measurements, a three-tier hierarchy to prioritize the assumptions, referred to as inputs, is used in valuation techniques to measure fair value. The three-tier hierarchy of inputs is summarized in the three broad levels listed below.
- Level 1 – quoted prices in active markets for identical investments
- Level 2 – other significant observable inputs (including quoted prices for similar investments, interest rates, prepayment speeds, credit risk, etc.)
- Level 3 – significant unobservable inputs (including a fund’s own assumptions in determining the fair value of investments)
The inputs or methodology used for valuing securities are not necessarily an indication of the risk associated with investing in those securities.
At December 31, 2009, the inputs used in valuing the Portfolio’s investments, which are carried at value, were as follows:
23
Emerging Markets Portfolio as of December 31, 2009
NOTES TO F INANCIAL STATEMENTS CON T ’D |
| | | | |
| | Quoted | | | |
| | Prices in | | | |
| | Active | Significant | | |
| | Markets for | Other | Significant | |
| | Identical | Observable | Unobservable | |
| | Assets | Inputs | Inputs | |
|
|
| Asset Description | (Level 1) | (Level 2) | (Level 3) | Total |
|
| Common Stocks | | | | |
| Consumer Discretionary | $ 2,542,256 | $ 2,825,331 | $ — | $ 5,367,587 |
| Consumer Staples | 2,003,667 | 692,449 | — | 2,696,116 |
| Energy | 5,843,478 | 1,944,234 | — | 7,787,712 |
| Financials | 3,943,587 | 9,403,524 | — | 13,347,111 |
| Health Care | 1,674,376 | — | — | 1,674,376 |
| Industrials | 1,237,964 | 3,428,473 | — | 4,666,437 |
| Information Technology | — | 7,918,045 | — | 7,918,045 |
| Materials | 3,409,604 | 6,612,038 | — | 10,021,642 |
| Telecommunication Services | 829,581 | — | — | 829,581 |
| Utilities | 1,327,273 | 900,006 | — | 2,227,279 |
|
| Total Common Stocks | $22,811,786 | $33,724,100* | $ — | $56,535,886 |
|
| Warrants | $ — | $ 5,262,863 | $ — | $ 5,262,863 |
| Short-Term Investments | — | 96,651 | — | 96,651 |
|
| Total Investments | $22,811,786 | $39,083,614 | $ — | $61,895,400 |
|
| * | Includes foreign equity securities whose values were adjusted to reflect market trading that occurred after the close of trading in their applicable foreign markets. |
The Portfolio held no investments or other financial instruments as of December 31, 2008 whose fair value was determined using Level 3 inputs.
8 Review for Subsequent Events
In connection with the preparation of the financial statements of the Portfolio as of and for the year ended December 31, 2009, events and transactions subsequent to December 31, 2009 through February 16, 2010, the date the financial statements were issued, have been evaluated by the Portfolio’s management for possible adjustment and/or disclosure. Management has not identified any subsequent events requiring financial statement disclosure as of the date these financial statements were issued.
24
Emerging Markets Portfolio as of December 31, 2009
REPORT OF INDEPENDENT REGISTERED PUBLIC ACCOUNTING FIRM |
To the Trustees and Investors of
Emerging Markets Portfolio:
We have audited the accompanying statement of assets and
liabilities of Emerging Markets Portfolio (the “Portfolio”),
including the portfolio of investments, as of December 31,
2009, and the related statement of operations for the year
then ended, the statements of changes in net assets for each
of the two years in the period then ended, and the
supplementary data for each of the five years in the period
then ended. These financial statements and supplementary
data are the responsibility of the Portfolio’s management. Our
responsibility is to express an opinion on these financial
statements and supplementary data based on our audits.
We conducted our audits in accordance with the standards of
the Public Company Accounting Oversight Board (United
States). Those standards require that we plan and perform the
audit to obtain reasonable assurance about whether the
financial statements and supplementary data are free of
material misstatement. The Portfolio is not required to have,
nor were we engaged to perform, an audit of its internal
control over financial reporting. Our audits included
consideration of internal control over financial reporting as a
basis for designing audit procedures that are appropriate in
the circumstances, but not for the purpose of expressing an
opinion on the effectiveness of the Portfolio’s internal control
over financial reporting. Accordingly, we express no such
opinion. An audit also includes examining, on a test basis,
evidence supporting the amounts and disclosures in the
financial statements, assessing the accounting principles used
and significant estimates made by management, as well as
evaluating the overall financial statement presentation. Our
procedures included confirmation of securities owned as of
December 31, 2009, by correspondence with the custodian
and brokers; where replies were not received from brokers,
we performed other auditing procedures. We believe that our
audits provide a reasonable basis for our opinion.
In our opinion, the financial statements and supplementary
data referred to above present fairly, in all material respects,
the financial position of Emerging Markets Portfolio as of
December 31, 2009, the results of its operations for the year
then ended, the changes in its net assets for each of the two
years in the period then ended, and the supplementary data
for each of the five years in the period then ended, in
conformity with accounting principles generally accepted in
the United States of America. |
DELOITTE & TOUCHE LLP
Boston, Massachusetts
February 16, 2010 |
25
Eaton Vance Emerging Markets Fund
BOARD OF TRUSTEES’ ANNUAL APPROVAL OF THE INVESTMENT ADVISORY AGREEMENT
Overview of the Contract Review Process
The Investment Company Act of 1940, as amended (the “1940 Act”), provides, in substance, that each investment advisory agreement between a fund and its investment adviser will continue in effect from year to year only if its continuance is approved at least annually by the fund’s board of trustees, including by a vote of a majority of the trustees who are not “interested persons” of the fund (“Independent Trustees”), cast in person at a meeting called for the purpose of considering such approval.
At a meeting of the Boards of Trustees (each a “Board”) of the Eaton Vance group of mutual funds (the “Eaton Vance Funds”) held on April 27, 2009, the Board, including a majority of the Independent Trustees, voted to approve continuation of existing advisory and sub-advisory agreements for the Eaton Vance Funds for an additional one-year period. In voting its approval, the Board relied upon the affirmative recommendation of the Contract Review Committee of the Board (formerly the Special Committee), which is a committee comprised exclusively of Independent Trustees. Prior to making its recommendation, the Contract Review Committee reviewed information furnished for a series of meetings of the Contract Review Committee held in February, March and April 2009. Such information included, among other things, the following:
Information about Fees, Performance and Expenses
- An independent report comparing the advisory and related fees paid by each fund with fees paid by comparable funds;
- An independent report comparing each fund’s total expense ratio and its components to comparable funds;
- An independent report comparing the investment performance of each fund to the investment performance of comparable funds over various time periods;
- Data regarding investment performance in comparison to relevant peer groups of funds and appropriate indices;
- Comparative information concerning fees charged by each adviser for managing other mutual funds and institutional accounts using investment strategies and techniques similar to those used in managing the fund;
- Profitability analyses for each adviser with respect to each fund;
| Information about Portfolio Management |
- Descriptions of the investment management services provided to each fund, including the investment strategies and processes employed, and any changes in portfolio management processes and personnel;
- Information concerning the allocation of brokerage and the benefits received by each adviser as a result of brokerage allocation, including information concerning the acquisition of research through “soft dollar” benefits received in connection with the funds’ brokerage, and the implementation of a soft dollar reimbursement program established with respect to the funds;
- Data relating to portfolio turnover rates of each fund;
- The procedures and processes used to determine the fair value of fund assets and actions taken to monitor and test the effectiveness of such procedures and processes;
| Information about each Adviser |
- Reports detailing the financial results and condition of each adviser;
- Descriptions of the qualifications, education and experience of the individual investment professionals whose responsibilities include portfolio management and investment research for the funds, and information relating to their compensation and responsibilities with respect to managing other mutual funds and investment accounts;
- Copies of the Codes of Ethics of each adviser and its affiliates, together with information relating to compliance with and the administration of such codes;
- Copies of or descriptions of each adviser’s proxy voting policies and procedures;
- Information concerning the resources devoted to compliance efforts undertaken by each adviser and its affiliates on behalf of the funds (including descriptions of various compliance programs) and their record of compliance with investment policies and restrictions, including policies with respect to market-timing, late trading and selective portfolio disclosure, and with policies on personal securities transactions;
- Descriptions of the business continuity and disaster recovery plans of each adviser and its affiliates;
| Other Relevant Information |
- Information concerning the nature, cost and character of the administrative and other non-investment management services provided by Eaton Vance Management and its affiliates;
- Information concerning management of the relationship with the custodian, subcustodians and fund accountants by each adviser or the funds’ administrator; and
- The terms of each advisory agreement.
26
Eaton Vance Emerging Markets Fund
BOARD OF TRUSTEES’ ANNUAL APPROVAL OF THE INVESTMENT ADVISORY AGREEMENT CONT’D
In addition to the information identified above, the Contract Review Committee considered information provided from time to time by each adviser throughout the year at meetings of the Board and its committees. Over the course of the twelve-month period ended April 30, 2009, the Board met eighteen times and the Contract Review Committee, the Audit Committee, the Governance Committee, the Portfolio Management Committee and the Compliance Reports and Regulatory Matters Committee, each of which is a Committee comprised solely of Independent Trustees, met seven, five, six, six and six times, respectively. At such meetings, the Trustees received, among other things, presentations by the portfolio managers and other investment professionals of each adviser relating to the investment performance of each fund and the investment strategies used in pursuing the fund’s investment objective.
For funds that invest through one or more underlying portfolios, the Board considered similar information about the portfolio(s) when considering the approval of advisory agreements. In addition, in cases where the fund’s investment adviser has engaged a sub-adviser, the Board considered similar information about the sub-adviser when considering the approval of any sub-advisory agreement.
The Contract Review Committee was assisted throughout the contract review process by Goodwin Procter LLP, legal counsel for the Independent Trustees. The members of the Contract Review Committee relied upon the advice of such counsel and their own business judgment in determining the material factors to be considered in evaluating each advisory and sub-advisory agreement and the weight to be given to each such factor. The conclusions reached with respect to each advisory and sub-advisory agreement were based on a comprehensive evaluation of all the information provided and not any single factor. Moreover, each member of the Contract Review Committee may have placed varying emphasis on particular factors in reaching conclusions with respect to each advisory and sub-advisory agreement.
Results of the Process
Based on its consideration of the foregoing, and such other information as it deemed relevant, including the factors and conclusions described below, the Contract Review Committee concluded that the continuance of the investment advisory agreement of Emerging Markets Portfolio (the “Portfolio”), the portfolio in which Eaton Vance Emerging Markets Fund (the “Fund”) invests, with Lloyd George Investment Management (Bermuda) Limited (the “Adviser”), as well as the administration agreement of the Portfolio with Eaton Vance Management (“EVM” or the “Administrator”) and the management contract of the Fund with the Administrator, including their fee structures, is in the interests of shareholders and, therefore, the Contract Review Committee recommended to the Board approval of the agreements. The Board accepted the recommendation of the Contract Review Committee as well as the factors considered and conclusions reached by the Contract Rev iew Committee with respect to the agreements. Accordingly, the Board, including a majority of the Independent Trustees, voted to approve continuation of the investment advisory agreement for the Portfolio, the administration agreement for the Portfolio and the management contract for the Fund.
Nature, Extent and Quality of Services
In considering whether to approve the investment advisory agreement of the Portfolio, the administration agreement of the Portfolio and the management contract of the Fund, the Board evaluated the nature, extent and quality of services provided to the Portfolio by the Adviser and to the Fund and Portfolio by the Administrator.
The Board considered the Adviser’s and Administrator’s management capabilities and the Adviser’s investment process with respect to the types of investments held by the Portfolio, including the education, experience and number of its investment professionals and other personnel who provide portfolio management, investment research, and similar services to the Portfolio. The Board evaluated the abilities and experience of such investment personnel in analyzing factors such as special considerations relevant to investing in emerging markets, including Asia. The Board noted the Adviser’s experience in managing equity funds that invest in Asian securities. The Board noted that the Adviser maintains offices in London, Hong Kong, Singapore and Tokyo, providing its investment team with first hand knowledge of country and market factors affecting securities in which the Portfolio invests. The Board also took into account the resources dedicated to portfolio management a nd other services, including the compensation paid to recruit and retain investment personnel, and the time and attention devoted to the Portfolio by senior management.
The Board also reviewed the compliance programs of the Adviser, the Administrator and relevant affiliates thereof. Among other matters, the Board considered compliance and reporting matters relating to personal trading by investment personnel, selective disclosure of portfolio holdings, late trading, frequent trading, portfolio valuation, business continuity and the allocation of investment opportunities. The Board also evaluated the responses of the Administrator and its affiliates to requests from the Securities and Exchange Commission and the Financial Industry Regulatory Authority.
The Board considered EVM’s recommendations for Board action and other steps taken in response to the unprecedented dislocations experienced in the capital markets over recent periods, including sustained periods of high volatility, credit disruption and government intervention. In particular, the Board considered EVM’s efforts and expertise with respect to each of the following matters as they
27
Eaton Vance Emerging Markets Fund
BOARD OF TRUSTEES’ ANNUAL APPROVAL OF THE INVESTMENT ADVISORY AGREEMENT CONT’D
relate to the Fund and/or other funds within the Eaton Vance family of funds: (i) negotiating and maintaining the availability of bank loan facilities and other sources of credit used for investment purposes or to satisfy liquidity needs; (ii) establishing the fair value of securities and other instruments held in investment portfolios during periods of market volatility and issuer-specific disruptions; and (iii) the ongoing monitoring of investment management processes and risk controls.
After consideration of the foregoing factors, among others, the Board concluded that the nature, extent and quality of services provided by the Adviser and the Administrator, taken as a whole, are appropriate and consistent with the terms of the investment advisory agreement, the administration agreement and the management contract, respectively.
Fund Performance
The Board compared the Fund’s investment performance to a relevant universe of similarly managed funds identified by an independent data provider and appropriate benchmark indices. The Board reviewed comparative performance data for the one-, three-, five- and ten-year periods ended September 30, 2008 for the Fund. The Board noted actions taken by the Adviser in 2008 to improve the performance of the Fund. On the basis of the foregoing and other relevant information, the Board concluded that, under the circumstances, the Fund’s performance was satisfactory.
Management Fees and Expenses
The Board reviewed contractual management fee rates, including any administrative fee rates, payable by the Portfolio and the Fund (referred to collectively as “management fees”). As part of its review, the Board considered the management fees and the Fund’s total expense ratio for the year ended September 30, 2008, as compared to a group of similarly managed funds selected by an independent data provider. The Board considered the fact that the Adviser and the Administrator had undertaken to waive fees and/or pay expenses of the Fund permanently in an agreed-upon amount.
After reviewing the foregoing information, and in light of the nature, extent and quality of the services provided by the Adviser, the Board concluded that the management fees charged for advisory and related services and the Fund’s total expense ratio are reasonable.
Profitability
The Board reviewed the level of profits realized by the Adviser and the Administrator in providing investment advisory and administrative services to the Fund and the Portfolio and to all Eaton Vance Funds as a group. The Board considered the level of profits realized without regard to revenue sharing or other payments to third parties in respect of distribution services. The Board also considered other direct or indirect benefits received by the Adviser in connection with its relationship with the Portfolio, including the benefits of research services that may be available to the Adviser as a result of securities transactions effected for the Portfolio and other investment advisory clients.
The Board concluded that, in light of the foregoing factors and the nature, extent and quality of the services rendered, the profits realized by the Adviser and the Administrator are reasonable.
Economies of Scale
In reviewing management fees and profitability, the Board also considered the extent to which the Adviser, on the one hand, and the Portfolio and the Fund, on the other hand, can expect to realize benefits from economies of scale as the assets of the Fund of the Portfolio increase. The Board acknowledged the difficulty in accurately measuring the benefits resulting from the economies of scale with respect to the management of any specific fund or group of funds. The Board reviewed data summarizing the increases and decreases in the assets of the Fund and of all Eaton Vance Funds as a group over various time periods, and evaluated the extent to which the total expense ratio of the Fund and the Adviser’s and Administrator’s profitability may have been affected by such increases or decreases. Based upon the foregoing, the Board concluded that the benefits from economies of scale are currently being shared equitably by the Adviser and the Administrator, on the one hand, and t he Fund on the other hand. The Board also concluded that the structure of the management fees, which include breakpoints at several asset levels, can be expected to cause such benefits to continue to be shared equitably.
28
Eaton Vance Emerging Markets Fund
MANAGEMENT AND ORGANIZATION
Fund Management. The Trustees of Eaton Vance Special Investment Trust (the Trust) and Emerging Markets Portfolio (the Portfolio) are responsible for the overall management and supervision of the Trust’s and Portfolio’s affairs. The Trustees and officers of the Trust and the Portfolio are listed below. Except as indicated, each individual has held the office shown or other offices in the same company for the last five years. Trustees and officers of the Trust and the Portfolio hold indefinite terms of office. The “Noninterested Trustees” consist of those Trustees who are not “interested persons” of the Trust and the Portfolio, as that term is defined under the 1940 Act. The business address of each Trustee and officer is Two International Place, Boston, Massachusetts 02110. As used below, “EVC” refers to Eaton Vance Corp., “EV” refers to Eaton Vance, Inc., “EVM” refers to Eaton Vance Management, & #147;BMR” refers to Boston Management and Research, “EVD” refers to Eaton Vance Distributors, Inc., “LGM” refers to Lloyd George Management (B.V.I.) Limited, “Lloyd George” refers to Lloyd George Investment Management (Bermuda) Limited and “Fox” refers to Fox Asset Management LLC. EVC and EV are the corporate parent and trustee, respectively, of EVM and BMR. EVD is the Fund’s principal underwriter, the Portfolio’s placement agent and a wholly-owned subsidiary of EVC. Lloyd George is a wholly- owned subsidiary of LGM. Each officer affiliated with Eaton Vance may hold a position with other Eaton Vance affiliates that is comparable to his or her position with EVM listed below.
| | | | | |
| | Position(s) | Term of | | Number of Portfolios | |
| | with the | Office and | | in Fund Complex | |
| Name and | Trust and | Length of | Principal Occupation(s) | Overseen By | |
| Date of Birth | the Portfolio | Service | During Past Five Years | Trustee(1) | Other Directorships Held |
|
| Interested Trustee | | | | |
| |
| Thomas E. Faust Jr. | Trustee and | Trustee since 2007 and | Chairman, Chief Executive Officer and President of EVC, Director | 178 | Director of EVC |
| 5/31/58 | President of | President of the Trust | and President of EV, Chief Executive Officer and President of | | |
| | the Trust | since 2002 | EVM and BMR, and Director of EVD. Trustee and/or officer of | | |
| | | | 178 registered investment companies and 4 private investment | | |
| | | | companies managed by EVM and BMR. Mr. Faust is an | | |
| | | | interested person because of his positions with EVM, BMR, | | |
| | | | EVD, EVC and EV, which are affiliates of the Trust and the | | |
| | | | Portfolio. | | |
| |
| Noninterested Trustees | | | |
| |
| Benjamin C. Esty | Trustee | Since 2005 | Roy and Elizabeth Simmons Professor of Business | 178 | None |
| 1/2/63 | | | Administration and Finance Unit Head, Harvard University | | |
| | | | Graduate School of Business Administration. | | |
| |
| Allen R. Freedman | Trustee | Since 2007 | Former Chairman (2002-2004) and a Director (1983-2004) | 178 | Director of Assurant, Inc. (insurance provider) |
| 4/3/40 | | | of Systems & Computer Technology Corp. (provider of software | | and Stonemor Partners L.P. (owner and |
| | | | to higher education). Formerly, a Director of Loring Ward | | operator of cemeteries) |
| | | | International (fund distributor) (2005-2007). Formerly, | | |
| | | | Chairman and a Director of Indus International, Inc. (provider | | |
| | | | of enterprise management software to the power generating | | |
| | | | industry) (2005-2007). | | |
| |
| William H. Park | Trustee | Since 2003 | Vice Chairman, Commercial Industrial Finance Corp. (specialty | 178 | None |
| 9/19/47 | | | finance company) (since 2006). Formerly, President and Chief | | |
| | | | Executive Officer, Prizm Capital Management, LLC (investment | | |
| | | | management firm) (2002-2005). | | |
| |
| Ronald A. Pearlman | Trustee | Since 2003 | Professor of Law, Georgetown University Law Center. | 178 | None |
| 7/10/40 | | | | | |
| |
| Helen Frame Peters | Trustee | Since 2008 | Professor of Finance, Carroll School of Management, Boston | 178 | Director of BJ’s Wholesale Club, Inc. |
| 3/22/48 | | | College. Adjunct Professor of Finance, Peking University, Beijing, | | (wholesale club retailer) |
| | | | China (since 2005). | | |
| |
| Heidi L. Steiger | Trustee | Since 2007 | Managing Partner, Topridge Associates LLC (global wealth | 178 | Director of Nuclear Electric Insurance Ltd. |
| 7/8/53 | | | management firm) (since 2008); Senior Adviser (since 2008), | | (nuclear insurance provider), Aviva USA |
| | | | President (2005-2008), Lowenhaupt Global Advisors, LLC | | (insurance provider) and CIFG (family of |
| | | | (global wealth management firm). Formerly, President and | | financial guaranty companies) and Advisory |
| | | | Contributing Editor, Worth Magazine (2004-2005). Formerly, | | Director, Berkshire Capital Securities LLC |
| | | | Executive Vice President and Global Head of Private Asset | | (private investment banking firm) |
| | | | Management (and various other positions), Neuberger Berman | | |
| | | | (investment firm) (1986-2004). | | |
29
Eaton Vance Emerging Markets Fund
MANAGEMENT AND ORGANIZATION CON T’D |
| | | | | |
| | Position(s) | Term of | | Number of Portfolios | |
| | with the | Office and | | in Fund Complex | |
| Name and | Trust and | Length of | Principal Occupation(s) | Overseen By | |
| Date of Birth | the Portfolio | Service | During Past Five Years | Trustee(1) | Other Directorships Held |
|
| Noninterested Trustees (continued) | | | |
| |
| |
| Lynn A. Stout | Trustee | Trustee of the Trust | Paul Hastings Professor of Corporate and Securities Law (since | 178 | None |
| 9/14/57 | | since 1998 and of the | 2006) and Professor of Law (2001-2006), University of | | |
| | | Portfolio since 2003 | California at Los Angeles School of Law. | | |
| |
| Ralph F. Verni | Chairman of | Chairman of the Board | Consultant and private investor. | 178 | None |
| 1/26/43 | the Board | since 2007 and Trustee | | | |
| | and Trustee | since 2005 | | | |
| | | |
| Principal Officers who are not Trustees | | |
| |
| | Position(s) | Term of | |
| | with the | Office and | |
| Name and | Trust and | Length of | Principal Occupation(s) |
| Date of Birth | the Portfolio | Service | During Past Five Years |
|
| Michael A. Allison | Vice President of | Since 2007 | Vice President of EVM and BMR. Officer of 22 registered investment |
| 10/26/64 | the Trust | | companies managed by EVM or BMR. |
| J. Scott Craig | Vice President of | Since 2006 | Vice President of EVM and BMR since January 2005. Previously, |
| 3/15/63 | the Trust | | Director-Real Estate Equities and REIT Portfolio Manager at The |
| | | | Northwestern Mutual Life Insurance Company (1992-2004). Officer of |
| | | | 15 registered investment companies managed by EVM or BMR. |
| Gregory R. Greene | Vice President of | Since 2006 | Managing Director of Fox and member of the Investment Committee. |
| 11/13/66 | the Trust | | Officer of 16 registered investment companies managed by EVM or |
| | | | BMR. |
| William Walter Raleigh Kerr(2) | Vice President of | Since 1994 | Chief Executive Officer of Lloyd George and LGM. Officer of 4 registered |
| 8/17/50 | the Portfolio | | investment companies managed by EVM or BMR. |
| Duke E. Laflamme | Vice President | Since 2001 | Vice President of EVM and BMR. Officer of 17 registered investment |
| 7/8/69 | of the Trust | | companies managed by EVM or BMR. |
| Kathryn L. Langridge (2) | Vice President of | Since 2007 | Director and Senior Portfolio Manager of Lloyd George Management |
| 5/26/58 | the Portfolio | | (Europe) Ltd. (since 2007). Previously, Head of International Equity |
| | | | Products for INVESCO Perpetual (1990-2007). Officer of 1 registered |
| | | | investment company managed by EVM or BMR. |
| Hon. Robert Lloyd George(2) | President of | Since 1994 | Chairman of Lloyd George and LGM. Officer of 4 registered investment |
| 8/13/52 | the Portfolio | | companies managed by EVM or BMR. |
| Thomas H. Luster | Vice President of | Since 2002 | Vice President of EVM and BMR. Officer of 54 registered investment |
| 4/8/62 | the Trust | | companies managed by EVM or BMR. |
| Michael R. Mach | Vice President of | Since 2006 | Vice President of EVM and BMR. Officer of 20 registered investment |
| 7/15/47 | the Trust | | companies managed by EVM or BMR. |
| Robert J. Milmore | Vice President of | Since 2006 | Vice President of Fox and member of the Investment Committee. |
| 4/3/69 | the Trust | | Previously, Manager of International Treasury of Cendant Corporation |
| | | | (2001-2005). Officer of 16 registered investment companies managed |
| | | | by EVM or BMR. |
| J. Bradley Ohlmuller | Vice President of | Since 2008 | Principal of Fox and member of the Investment Committee. Officer of |
| 6/14/68 | the Trust | | 16 registered investment companies managed by EVM or BMR. |
| Duncan W. Richardson | Vice President of | Since 2006 | Director of EVC and Executive Vice President and Chief Equity |
| 10/26/57 | the Trust | | Investment Officer of EVC, EVM and BMR. Officer of 82 registered |
| | | | investment companies managed by EVM or BMR. |
| Walter A. Row, III | Vice President of | Since 2007 | Vice President of EVM and BMR. Officer of 23 registered investment |
| 7/20/57 | the Trust | | companies managed by EVM or BMR. |
30
Eaton Vance Emerging Markets Fund
MANAGEMENT AND ORGANIZATION CON T’D |
| | | |
| | Position(s) | Term of | |
| | with the | Office and | |
| Name and | Trust and | Length of | Principal Occupation(s) |
| Date of Birth | the Portfolio | Service | During Past Five Years |
|
| Principal Officers who are not Trustees (continued) | |
| |
| |
| Judith A. Saryan | Vice President of | Since 2006 | Vice President of EVM and BMR. Officer of 55 registered investment |
| 8/21/54 | the Trust | | companies managed by EVM or BMR. |
| Michael W. Weilheimer | Vice President of | Since 2006 | Vice President of EVM and BMR. Officer of 24 registered investment |
| 2/11/61 | the Trust | | companies managed by EVM or BMR. |
| Barbara E. Campbell | Treasurer | Of the Trust since 2005 | Vice President of EVM and BMR. Officer of 178 registered investment |
| 6/19/57 | | and of the Portfolio since | companies managed by EVM or BMR. |
| | 2008 | |
| Maureen A. Gemma | Secretary and Chief Legal | Secretary since 2007 and | Vice President of EVM and BMR. Officer of 178 registered investment |
| 5/24/60 | Officer | Chief Legal Officer since | companies managed by EVM or BMR. |
| | 2008 | |
| Paul M. O’Neil | Chief Compliance Officer | Since 2004 | Vice President of EVM and BMR. Officer of 178 registered investment |
| 7/11/53 | | | companies managed by EVM or BMR. |
| (1) | Includes both master and feeder funds in a master-feeder structure. |
| (2) | The business address for Messrs. Kerr and Lloyd George and Ms. Langridge is Suite 3808, One Exchange Square, Central, Hong Kong. |
The SAI for the Fund includes additional information about the Trustees and officers of the Fund and the Portfolio and can be obtained without charge on Eaton Vance’s website at www.eatonvance.com or by calling 1-800-262-1122.
31
This Page Intentionally Left Blank
Investment Adviser of Emerging Markets Portfolio
Lloyd George Investment Management
(Bermuda) Limited
Suite 3808, One Exchange Square
Central, Hong Kong
Sponsor and Manager of Eaton Vance Emerging Markets Fund
and Administrator of Emerging Markets Portfolio
Eaton Vance Management
Two International Place
Boston, MA 02110
Principal Underwriter*
Eaton Vance Distributors, Inc.
Two International Place
Boston, MA 02110
(617) 482-8260
Custodian
State Street Bank and Trust Company
200 Clarendon Street
Boston, MA 02116
Transfer Agent
PNC Global Investment Servicing
Attn: Eaton Vance Funds
P.O. Box 9653
Providence, RI 02940-9653
(800) 262-1122
Independent Registered Public Accounting Firm
Deloitte & Touche LLP
200 Berkeley Street
Boston, MA 02116-5022 |
Eaton Vance Emerging Markets Fund
Two International Place
Boston, MA 02110 |
* FINRA BrokerCheck. Investors may check the background of their Investment Professional by contacting the Financial Industry Regulatory
Authority (FINRA). FINRA BrokerCheck is a free tool to help investors check the professional background of current and former FINRA-registered
securities firms and brokers. FINRA BrokerCheck is available by calling 1-800-289-9999 and at
www.FINRA.org. The FINRA BrokerCheck brochure describing the program is available to investors at www.FINRA.org.
This report must be preceded or accompanied by a current prospectus. Before investing, investors should consider carefully the Fund’s investment
objective(s), risks, and charges and expenses. The Fund’s current prospectus contains this and other information about the Fund and is available
through your financial advisor. Please read the prospectus carefully before you invest or send money. For further information please call 1-800-262-1122. |