EXHIBIT (17 (b) (ii)
IMPORTANT NOTICES REGARDING PRIVACY,
DELIVERY OF SHAREHOLDER DOCUMENTS,
PORTFOLIO HOLDINGS AND PROXY VOTING
Privacy. The Eaton Vance organization is committed to ensuring your financial privacy. Each of the financial institutions identified below has in effect the following policy (Privacy Policy) with respect to nonpublic personal information about its customers:
| Only such information received from you, through application forms or otherwise, and information about |
| | your Eaton Vance fund transactions will be collected. This may include information such as name, address, |
| | social security number, tax status, account balances and transactions. |
| None of such information about you (or former customers) will be disclosed to anyone, except as permitted |
| | by law (which includes disclosure to employees necessary to service your account). In the normal course of |
| | servicing a customer’s account, Eaton Vance may share information with unaffiliated third parties that |
| | perform various required services such as transfer agents, custodians and broker/dealers. |
| Policies and procedures (including physical, electronic and procedural safeguards) are in place that are |
| | designed to protect the confidentiality of such information. |
| We reserve the right to change our Privacy Policy at any time upon proper notification to you. Customers |
| | may want to review our Privacy Policy periodically for changes by accessing the link on our homepage: |
| | www. eatonvance.com. |
Our pledge of privacy applies to the following entities within the Eaton Vance organization: the Eaton Vance Family of Funds, Eaton Vance Management, Eaton Vance Investment Counsel, Boston Management and Research, and Eaton Vance Distributors, Inc.
In addition, our Privacy Policy applies only to those Eaton Vance customers who are individuals and who have a direct relationship with us. If a customer’s account (i.e., fund shares) is held in the name of a third-party financial adviser/ broker-dealer, it is likely that only such adviser’s privacy policies apply to the customer. This notice supersedes all previously issued privacy disclosures.
For more information about Eaton Vance’s Privacy Policy, please call 1-800-262-1122.
Delivery of Shareholder Documents. The Securities and Exchange Commission (the “SEC”) permits funds to deliver only one copy of shareholder documents, including prospectuses, proxy statements and shareholder reports, to fund investors with multiple accounts at the same residential or post office box address. This practice is often called “householding” and it helps eliminate duplicate mailings to shareholders.
Eaton Vance, or your financial adviser, may household the mailing of your documents indefinitely unless you instruct Eaton Vance, or your financial adviser, otherwise.
If you would prefer that your Eaton Vance documents not be householded, please contact Eaton Vance at 1-800-262-1122, or contact your financial adviser.
Your instructions that householding not apply to delivery of your Eaton Vance documents will be effective within 30 days of receipt by Eaton Vance or your financial adviser.
Portfolio Holdings. Each Eaton Vance Fund and its underlying Portfolio(s) (if applicable) will file a schedule of portfolio holdings on Form N-Q with the SEC for the first and third quarters of each fiscal year. The Form N-Q will be available on the Eaton Vance website at www.eatonvance.com, by calling Eaton Vance at 1-800-262-1122 or in the EDGAR database on the SEC’s website at www.sec.gov. Form N-Q may also be reviewed and copied at the SEC’s public reference room in Washington, D.C. (call 1-800-732-0330 for information on the operation of the public reference room).
Proxy Voting. From time to time, funds are required to vote proxies related to the securities held by the funds. The Eaton Vance Funds or their underlying Portfolios (if applicable) vote proxies according to a set of policies and procedures approved by the Funds’ and Portfolios’ Boards. You may obtain a description of these policies and procedures and information on how the Funds or Portfolios voted proxies relating to portfolio securities during the most recent 12 month period ended June 30, without charge, upon request, by calling 1-800-262-1122. This description is also available on the SEC’s website at www.sec.gov.
Eaton Vance Structured Emerging Markets Fund as of October 31, 2009
MANAGEMENT’S DISCUSSION OF FUND PERFORMANCE
Economic and Market Conditions


• Despite an extremely volatile year, emerging markets generated strong positive performance, as measured by the MSCI Emerging Markets Index (the Index), which recorded a return of 64.13% for the 12 months ending October 31, 2009.1 As the period began late last fall, global equities were already in the midst of a dramatic decline, dragged lower by the failure or near-collapse of several major financial institutions struggling under the enormous weight of troubled assets. On the verge of illiquidity, the credit markets virtually ceased operating, worldwide economic activity ground to a near standstill, and anxious equity investors stayed on the sidelines. At the beginning of the second quarter, however, equity markets began a rally in response to indications that the concerted global effort by world banks to alleviate the credit crisis and stimulate economic growth was succeeding. Th e volatile period finished on a decidedly positive note, with many market indexes for European, U.S. and Asian equities posting solid annual gains.
• Against this backdrop, emerging markets fared very well, with some economies proving more resilient to the financial crisis and global recession than anticipated. Equity indexes tracking the performance of emerging markets widely outperformed the 27.71% return of foreign developed markets, as measured by the MSCI Europe, Australasia and Far East Index.
• Top performers in the Index on an absolute-return basis for the year ending October 31, 2009, included Indonesia (+126%), Peru (+117%), Russia (+110%), Colombia (+94%), Brazil (+92%) and China (+83%). The Index’s nearly 20% weighting in China made the most significant contribution to returns, followed by a 15% allocation to Brazil. By contrast, countries such as Pakistan (-44%) and Jordan (-25%) did not fare as well.
| Past performance is no guarantee of future results. Returns are historical and are calculated by determining the percentage change in net asset value or offering price (as applicable) with all distributions reinvested. Investment return and principal value will fluctuate so that shares, when redeemed, may be worth more or less than their original cost. Performance is for the stated time period only; due to market volatility, the Fund’s current performance may be lower or higher than the quoted return. For performance as of the most recent month end, please refer to www.eatonvance.com. |
Management Discussion
• For the year ending October 31, 2009, the Fund recorded a double-digit return, although it under-performed the Index, its primary benchmark, and the S&P/IFCI Emerging Markets Index, its secondary benchmark. Looking at individual countries, China and Brazil had strong positive returns but the Fund’s underweight in both countries detracted from performance relative to the Index. Fund holdings in Nigeria and United Arab Emirates also were a drag on relative performance, as was the Fund’s exposure to Qatar, Jordan, Kuwait, Ghana and Saudi Arabia. Russia and Indonesia were among the top contributors to the Fund’s return, as the Fund was significantly overweighted in both countries versus the Index. An overweight to Argentina, as well as underweightings in Taiwan and Korea, also added to performance.
• With any multicountry portfolio, country selection and weighting have the largest effect on the risk and return experience of the Fund’s strategy. Our research into emerging countries has resulted in some important observations. Individually, emerging markets can be volatile, but they also exhibit relatively low correlations among each other and developed markets. We believe that due to this tendency to move relatively
| |
| Total Return Performance | |
| 10/31/08 – 10/31/09 | |
| Class A2 | 51.81% |
| Class C2 | 50.69 |
| Class I2 | 52.15 |
| MSCI Emerging Markets Index1 | 64.13 |
| S&P/IFCI Emerging Markets Index1 | 65.33 |
| Lipper Emerging Markets Funds Average1 | 56.55 |
| See page 3 for more performance information. | |
1 It is not possible to invest directly in an Index or a Lipper Classification. The Indices’ total returns do not reflect commissions or expenses that would have been incurred if an investor individually purchased or sold the securities represented in the Indices. MSCI Index returns reflect dividends net of any applicable foreign withholding taxes. The Lipper total return is the average total return, at net asset value, of the funds that are in the same Lipper Classification as the Fund.
2 These returns do not include the 5.75% maximum sales charge for Class A shares or the applicable contingent deferred sales charge (CDSC) for Class C shares. If sales charges were deducted, the returns would be lower. Class I shares are offered to certain investors at net asset value. Absent expense limitations by the adviser, the sub-adviser and the administrator, the returns would be lower.
Fund shares are not insured by the FDIC and are not deposits or other obligations of, or guaranteed by, any depository institution. Shares are subject to investment risks, including possible loss of principal invested.
1
Eaton Vance Structured Emerging Markets Fund as of October 31, 2009
MANAGEMENT’S DISCUSSION OF FUND PERFORMANCE
independently, a structured portfolio that balances exposure to a broad array of emerging market countries can substantially reduce volatility compared to the level found in individual countries or more traditionally concentrated active strategies. While during the depths of the global financial crisis, there was a phenomenon where cross-country correlations rose and markets behaved more similarly than usual. However, they reverted to the historic norm of moving independent of each other as markets recovered throughout the year.
The views expressed throughout this report are those of the portfolio managers and are current only through the end of the period of the report as stated on the cover. These views are subject to change at any time based upon market or other conditions, and the investment adviser disclaims any responsibility to update such views. These views may not be relied on as investment advice and, because investment decisions for a fund are based on many factors, may not be relied on as an indication of trading intent on behalf of any Eaton Vance fund. Portfolio information provided in the report may not be representative of the Fund’s current or future investments and may change due to active management.
Portfolio Composition
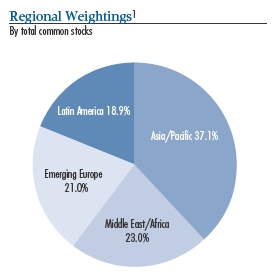
1 As a percentage of the Fund’s total common stocks as of 10/31/09.
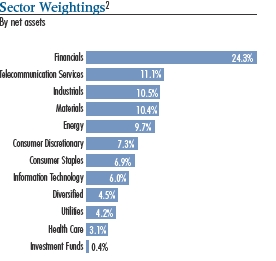
2 As a percentage of the Fund’s net assets as of 10/31/09. Excludes cash equivalents.
2
Eaton Vance Structured Emerging Markets Fund as of October 31, 2009
FUND PERFORMANCE
The line graph and table set forth below provide information about the Fund’s performance. The line graph compares the performance of Class A of the Fund with that of the MSCI Emerging Markets Index and the S&P/IFCI Emerging Markets Index, each an unmanaged index of common stocks traded in emerging markets and available to foreign investors. The lines on the graph represent the total returns of a hypothetical investment of $10,000 in each of Class A, the MSCI Emerging Markets Index and the S&P/IFCI Emerging Markets Index. Class A total returns are presented at net asset value and maximum public offering price. The table includes the total returns of each Class of the Fund at net asset value and maximum public offering price. The performance presented below does not reflect the deduction of taxes, if any, that a shareholder would pay on distributions or redemptions of Fund shares.
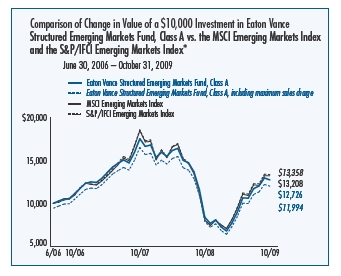
| * | Source: Lipper, Bloomberg. Class A of the Fund commenced invest- ment operations on 6/30/06. |
| | A $10,000 hypothetical investment at net asset value in Class C shares and Class I shares on 6/30/06 (inception date) would have been valued at $12,398 and $12,814, respectively, on 10/31/09. It is not possible to invest directly in an Index. The Indices’ total returns do not reflect commissions or expenses that would have been incurred if an investor individually purchased or sold the securities represented in the Indices. |
| | | |
| Performance1 | Class A | Class C | Class I |
| Share Class Symbol | EAEMX | ECEMX | EIEMX |
|
| Average Annual Total Returns (at net asset value) | | | |
| One Year | 51.81% | 50.69% | 52.15% |
| Life of Fund† | 7.48 | 6.65 | 7.71 |
| | |
| SEC Average Annual Total Returns (including sales charge or applicable CDSC) | |
|
| One Year | 43.01% | 49.69% | 52.15% |
| Life of Fund† | 5.59 | 6.65 | 7.71 |
| † Inception Dates For All Share Classes: 6/30/06 | | | |
1 Average Annual Total Returns do not include the 5.75% maximum sales charge for Class A shares or the applicable contingent deferred sales charge (CDSC) for Class C shares. If sales charges were deducted, the returns would be lower. SEC Average Annual Total Returns for Class A reflect the maximum 5.75% sales charge and, for Class C, reflect a 1% CDSC for the first year. Class A and Class I shares are subject to a 1% redemption fee if redeemed or exchanged within 90 days of settlement of purchase. Class I shares are offered to certain investors at net asset value. Absent expense limitations by the adviser, the sub-adviser and the administrator, the returns would be lower.
| | | |
| Total Annual | | | |
| Operating Expenses2 | Class A | Class C | Class I |
|
| Gross Expense Ratio | 1.72% | 2.47% | 1.48% |
| Net Expense Ratio | 1.62 | 2.37 | 1.37 |
2Source: Prospectus dated 3/1/09. Net expense ratio reflects a contractual expense limitation that continues through February 28, 2010. Thereafter, the expense limitation may be changed or terminated at any time. Without this expense limitation, expenses would be higher.
Past performance is no guarantee of future results. Returns are historical and are calculated by determining the percentage change in net asset value or offering price (as applicable) with all distributions reinvested. Investment return and principal value will fluctuate so that shares, when redeemed, may be worth more or less than their original cost. Performance is for the stated time period only; due to market volatility, the Fund’s current performance may be lower or higher than the quoted return. For performance as of the most recent month end, please refer to www.eatonvance.com.
3
Eaton Vance Structured Emerging Markets Fund as of October 31, 2009
FUND EXPENSES |
Example: As a shareholder of the Fund, you incur two types of costs: (1) transaction costs, including sales charges (loads) on purchases and redemption fees (if applicable); and (2) ongoing costs, including management fees; distribution or service fees; and other Fund expenses. This Example is intended to help you understand your ongoing costs (in dollars) of investing in the Fund and to compare these costs with the ongoing costs of investing in other mutual funds. The Example is based on an investment of $1,000 invested at the beginning of the period and held for the entire period (May 1, 2009 – October 31, 2009).
Actual Expenses: The first section of the table below provides information about actual account values and actual expenses. You may use the information in this section, together with the amount you invested, to estimate the expenses that you paid over the period. Simply divide your account value by $1,000 (for example, an $8,600 account value divided by $1,000 = 8.6), then multiply the result by the number in the first section under the heading entitled “Expenses Paid During Period” to estimate the expenses you paid on your account during this period.
Hypothetical Example for Comparison Purposes: The second section of the table below provides information about hypothetical account values and hypothetical expenses based on the actual Fund expense ratio and an assumed rate of return of 5% per year (before expenses), which is not the actual return of the Fund. The hypothetical account values and expenses may not be used to estimate the actual ending account balance or expenses you paid for the period. You may use this information to compare the ongoing costs of investing in your Fund and other funds. To do so, compare this 5% hypothetical example with the 5% hypothetical examples that appear in the shareholder reports of the other funds.
Please note that the expenses shown in the table are meant to highlight your ongoing costs only and do not reflect any transactional costs, such as sales charges (loads) or redemption fees (if applicable). Therefore, the second section of the table is useful in comparing ongoing costs only, and will not help you determine the relative total costs of owning different funds. In addition, if these transactional costs were included, your costs would be higher.
| | | | |
| Eaton Vance Structured Emerging Markets Fund |
| |
| | | Beginning Account Value | Ending Account Value | Expenses Paid During Period* |
| | | (5/1/09) | (10/31/09) | (5/1/09 – 10/31/09) |
|
| Actual | | | |
| Class A | $1,000.00 | $1,416.90 | $9.75** |
| Class C | $1,000.00 | $1,409.90 | $14.27** |
| Class I | $1,000.00 | $1,417.50 | $8.23** |
| |
|
| Hypothetical | | | |
| (5% return per year before expenses) | | |
| Class A | $1,000.00 | $1,017.10 | $8.13** |
| Class C | $1,000.00 | $1,013.40 | $11.93** |
| Class I | $1,000.00 | $1,018.40 | $6.87** |
| |
| * | Expenses are equal to the Fund’s annualized expense ratio of 1.60% for Class A shares, 2.35% for Class C shares and |
| | 1.35% for Class I shares, multiplied by the average account value over the period, multiplied by 184/365 (to reflect the |
| | one-half year period). The Example assumes that the $1,000 was invested at the net asset value per share determined at |
| | the close of business on April 30, 2009. | | |
| |
| ** | Absent an expense limitation by affiliates, the expenses would be higher. | |
4
Eaton Vance Structured Emerging Markets Fund as of October 31, 2009
PORTFOLIO OF INVESTMENTS |
| | |
| Common Stocks — 97.3% | | |
| |
| Security | Shares | Value |
|
| |
| Argentina — 0.8% | | |
|
| Banco Macro SA, Class B ADR | 46,050 | $ 1,346,042 |
| BBVA Banco Frances SA ADR | 28,788 | 182,228 |
| Cresud SA ADR | 98,500 | 1,213,520 |
| Grupo Financiero Galicia SA, Class B ADR(1) | 88,700 | 514,460 |
| IRSA Inversiones y Representaciones SA GDR(1) | 14,500 | 125,280 |
| MercadoLibre, Inc.(1) | 41,600 | 1,488,864 |
| Petrobras Energia SA ADR | 67,925 | 1,163,555 |
| Telecom Argentina SA, Class B ADR(1) | 119,360 | 2,017,184 |
|
| | | $ 8,051,133 |
|
| |
| Botswana — 0.7% | | |
|
| Barclays Bank of Botswana | 723,650 | $ 708,665 |
| Botswana Insurance Holdings Ltd. | 326,490 | 400,194 |
| First National Bank of Botswana | 4,730,800 | 1,875,657 |
| Letshego | 173,200 | 349,139 |
| Sechaba Breweries Ltd. | 1,113,200 | 2,172,660 |
| Standard Chartered Bank | 531,120 | 1,251,744 |
|
| | | $ 6,758,059 |
|
| |
| Brazil — 6.1% | | |
|
| AES Tiete SA, PFC Shares | 32,900 | $ 370,723 |
| All America Latina Logistica SA | 103,500 | 763,207 |
| American Banknote SA | 4,700 | 46,957 |
| Anhanguera Educacional Participacoes SA(1) | 4,800 | 66,349 |
| B2W Companhia Global do Varejo | 16,970 | 491,298 |
| Banco Bradesco SA, PFC Shares | 149,150 | 2,926,103 |
| Banco do Brasil SA | 53,300 | 853,538 |
| Banco Nossa Caixa SA | 7,500 | 268,307 |
| BM&F Bovespa SA | 90,251 | 584,049 |
| BR Malls Participacoes SA(1) | 22,000 | 243,529 |
| Bradespar SA, PFC Shares | 31,500 | 651,780 |
| Brasil Telecom Participacoes SA | 7,100 | 130,949 |
| Brasil Telecom Participacoes SA, PFC Shares | 36,500 | 367,362 |
| Brasil Telecom SA, PFC Shares | 26,600 | 226,348 |
| Braskem SA, PFC Shares | 11,460 | 76,114 |
| BRF-Brasil Foods SA(1) | 59,120 | 1,433,029 |
| Centrais Eletricas Brasileiras SA, Class B, PFC Shares | 73,400 | 937,500 |
| Cia Brasileira de Distribuicao Grupo Pao de Acucar, | | |
| PFC Shares | 29,782 | 901,102 |
| Cia Brasileira de Distribuicao Grupo Pao de Acucar, | | |
| Class B, PFC Shares | 1,387 | 41,966 |
| Cia de Bebidas das Americas, PFC Shares | 33,758 | 3,061,139 |
| Cia de Companhia de Concessoes Rodoviarias (CCR) | 22,000 | 434,605 |
| Cia de Saneamento Basico do Estado de Sao Paulo | 28,220 | 536,654 |
| | |
| Security | Shares | Value |
|
| |
| Brazil (continued) | | |
|
| Cia de Saneamento de Minas Gerais-Copasa MG | 3,900 | $ 69,627 |
| Cia de Transmissao de Energia Eletrica Paulista, PFC | | |
| Shares | 8,890 | 245,212 |
| Cia Energetica de Minas Gerais, PFC Shares | 55,504 | 866,777 |
| Cia Energetica de Sao Paulo, PFC Shares | 17,500 | 204,643 |
| Cia Paranaense de Energia-Copel, PFC Shares | 10,100 | 175,729 |
| Cia Siderurgica Nacional SA (CSN) | 31,600 | 1,045,799 |
| Contax Participacoes SA, PFC Shares | 1,910 | 85,655 |
| Cosan SA Industria e Comercio(1) | 40,000 | 421,208 |
| CPFL Energia SA | 20,600 | 355,495 |
| Cyrela Brazil Realty SA | 46,000 | 587,534 |
| Diagnosticos da America SA(1) | 3,800 | 94,051 |
| Duratex SA | 39,187 | 269,166 |
| EDP-Energias do Brasil SA | 17,900 | 289,595 |
| Eletropaulo Metropolitana SA, Class B, PFC Shares | 11,280 | 210,988 |
| Empresa Brasileira de Aeronautica SA(1) | 105,700 | 536,420 |
| Estacio Participacoes SA | 13,900 | 181,483 |
| Fertilizantes Fosfatados SA, PFC Shares | 25,300 | 240,132 |
| Gafisa SA | 9,300 | 138,001 |
| Gerdau SA | 5,000 | 57,249 |
| Gerdau SA, PFC Shares | 73,200 | 1,092,847 |
| GVT Holding SA(1) | 22,900 | 655,177 |
| Investimentos Itau SA, PFC Shares | 335,395 | 1,905,826 |
| Itau Unibanco Holding SA, PFC Shares | 212,022 | 4,031,981 |
| Itausa-Investimentos Itau SA | 12,545 | 85,456 |
| JBS SA | 73,400 | 407,083 |
| LLX Logistica SA(1) | 90,000 | 356,608 |
| Localiza Rent a Car SA | 38,100 | 400,119 |
| Lojas Americanas SA, PFC Shares | 58,370 | 384,362 |
| Lojas Renner SA | 17,700 | 311,478 |
| Lupatech SA(1) | 21,200 | 326,857 |
| M Dias Branco SA | 4,300 | 92,708 |
| Marfrig Frigorificos e Comercio de Alimentos SA(1) | 48,500 | 556,968 |
| Medial Saude SA(1) | 12,200 | 99,035 |
| Metalurgica Gerdau SA, PFC Shares | 19,200 | 348,774 |
| MRV Engenharia e Participacoes SA | 18,800 | 349,832 |
| Natura Cosmeticos SA | 15,100 | 270,439 |
| Net Servicos de Comunicacao SA, PFC Shares | 42,836 | 534,964 |
| PDG Realty SA Empreendimentos e Participacoes | 10,600 | 89,657 |
| Petroleo Brasileiro SA | 56,800 | 1,305,858 |
| Petroleo Brasileiro SA, PFC Shares | 424,800 | 8,449,700 |
| Randon Participacoes SA, PFC Shares | 21,200 | 161,262 |
| Redecard SA | 58,200 | 863,947 |
| Rossi Residencial SA | 39,800 | 266,373 |
| Souza Cruz SA | 14,600 | 515,509 |
| Suzano Papel e Celulose SA | 29,300 | 254,479 |
| Tam SA, PFC Shares | 14,800 | 212,137 |
| Tele Norte Leste Participacoes SA | 3,700 | 85,065 |
See notes to financial statements
5
Eaton Vance Structured Emerging Markets Fund as of October 31, 2009
PORTFOLIO OF INVESTMENTS CO N T ’ D |
| | |
| Security | Shares | Value |
|
| |
| Brazil (continued) | | |
|
| Tele Norte Leste Participacoes SA, PFC Shares | 56,900 | $ 1,088,516 |
| Telemar Norte Leste SA, PFC Shares | 3,500 | 110,309 |
| Telesp-Telecomunicacoes de Sao Paulo SA, PFC Shares | 9,600 | 238,147 |
| Terna Participacoes SA | 5,000 | 104,167 |
| Tim Participacoes SA, PFC Shares | 156,500 | 368,685 |
| Totvs SA | 3,298 | 179,709 |
| Tractebel Energia SA | 21,600 | 256,267 |
| Ultrapar Participacoes SA, PFC Shares | 15,746 | 683,971 |
| Usinas Siderurgicas de Minas Gerais SA, PFC Shares | 30,525 | 797,088 |
| Vale SA | 47,300 | 1,202,906 |
| Vale SA, PFC Shares | 276,740 | 6,197,430 |
| Vivo Participacoes SA, PFC Shares | 23,675 | 580,586 |
| Votorantim Celulose e Papel SA(1) | 2,457 | 33,892 |
| Weg SA | 92,300 | 911,683 |
|
| | | $ 58,655,229 |
|
| |
| Bulgaria — 0.4% | | |
|
| Bulgarian American Credit Bank JSCO(1) | 5,700 | $ 76,784 |
| CB First Investment Bank AD(1) | 235,000 | 493,051 |
| Central Cooperative Bank AD(1) | 227,900 | 251,947 |
| Chimimport AD(1) | 329,922 | 620,163 |
| Corporate Commercial Bank AD(1) | 10,400 | 469,778 |
| Doverie Holding AD(1) | 13,760 | 40,017 |
| MonBat AD(1) | 60,235 | 317,357 |
| Petrol AD(1) | 102,500 | 357,142 |
| Sopharma AD(1) | 354,600 | 1,069,101 |
| Vivacom | 44,690 | 103,423 |
|
| | | $ 3,798,763 |
|
| |
| Chile — 3.1% | | |
|
| Administradora de Fondos de Pensiones Provida SA | 44,300 | $ 115,558 |
| AES Gener SA | 1,010,500 | 428,218 |
| Almendral SA | 2,512,600 | 242,529 |
| Antarchile SA, Series A | 38,340 | 660,723 |
| Banco de Chile | 13,030,222 | 1,030,736 |
| Banco de Chile ADR | 2,580 | 119,970 |
| Banco de Credito e Inversiones | 39,113 | 1,135,194 |
| Banco Santander Chile SA | 35,182,310 | 1,789,099 |
| Banmedica SA | 76,180 | 80,492 |
| Cap SA | 32,412 | 842,425 |
| Cencosud SA | 561,531 | 1,729,171 |
| Cia Cervecerias Unidas SA | 82,290 | 580,424 |
| Cia General de Electricidad SA | 61,050 | 384,617 |
| Cia SudAmericana de Vapores SA(1) | 350,331 | 288,341 |
| Colbun SA | 3,335,910 | 785,364 |
| Corpbanca SA | 58,054,570 | 393,627 |
| | |
| Security | Shares | Value |
|
| |
| Chile (continued) | | |
|
| Embotelladora Andina SA, Class B, PFC Shares | 170,541 | $ 523,234 |
| Empresa Nacional de Electricidad SA | 1,229,463 | 1,889,522 |
| Empresas CMPC SA | 41,146 | 1,472,406 |
| Empresas Copec SA | 203,576 | 2,739,946 |
| Empresas La Polar SA | 156,400 | 792,383 |
| Enersis SA | 5,325,221 | 1,891,584 |
| ENTEL SA | 51,500 | 684,791 |
| Grupo Security SA | 1,212,785 | 338,059 |
| Invercap SA | 19,700 | 163,255 |
| Inversiones Aguas Metropolitanas SA | 306,600 | 362,065 |
| Lan Airlines SA | 65,195 | 874,506 |
| Madeco SA | 5,047,652 | 327,986 |
| Masisa SA | 444,800 | 65,771 |
| Minera Valparaiso SA | 12,324 | 371,380 |
| Parque Arauco SA | 452,000 | 468,302 |
| Quinenco SA | 162,900 | 322,149 |
| Ripley Corp. SA | 264,000 | 200,380 |
| S.A.C.I. Falabella SA | 506,600 | 2,431,814 |
| Salfacorp SA | 170,000 | 294,887 |
| Sigdo Koppers SA | 176,300 | 154,402 |
| SM-Chile SA, Class B | 2,424,500 | 279,917 |
| Sociedad de Inversiones Oro Blanco SA | 13,300,000 | 192,881 |
| Sociedad de Inversiones Pampa Calichera SA, Class A | 244,730 | 384,875 |
| Sociedad Quimica y Minera de Chile SA, Series B | 38,540 | 1,415,444 |
| Sonda SA | 381,500 | 525,959 |
| Vina Concha y Toro SA | 255,010 | 540,326 |
|
| | | $ 30,314,712 |
|
| |
| China — 6.4% | | |
|
| Agile Property Holdings, Ltd. | 200,000 | $ 255,481 |
| Air China, Ltd., Class H(1) | 520,000 | 281,478 |
| Alibaba.com Ltd. | 161,000 | 371,757 |
| Aluminum Corp. of China Ltd., Class H(1) | 402,000 | 437,928 |
| American Oriental Bioengineering, Inc.(1) | 21,600 | 85,536 |
| Angang Steel Co., Ltd., Class H | 214,000 | 395,546 |
| Anhui Conch Cement Co., Ltd., Class H | 58,000 | 375,280 |
| Baidu, Inc. ADR(1) | 3,870 | 1,462,550 |
| Bank of China, Ltd., Class H | 4,177,000 | 2,401,877 |
| Bank of Communications, Ltd., Class H | 381,000 | 456,036 |
| Beijing Capital International Airport Co., Ltd., | | |
| Class H(1) | 310,000 | 208,472 |
| Beijing Enterprises Holdings, Ltd. | 69,000 | 411,269 |
| BOC Hong Kong Holdings, Ltd. | 127,500 | 292,846 |
| BYD Co., Ltd., Class H(1) | 74,200 | 680,261 |
| BYD Electronic Co., Ltd.(1) | 415,000 | 386,367 |
| Chaoda Modern Agriculture Holdings, Ltd. | 269,958 | 208,582 |
| China Agri-Industries Holdings, Ltd. | 453,000 | 433,929 |
| | | | |
| See notes to financial statements |
| 6 |
Eaton Vance Structured Emerging Markets Fund as of October 31, 2009
PORTFOLIO OF INVESTMENTS CO N T ’ D |
| | |
| Security | Shares | Value |
|
| |
| China (continued) | | |
|
| China Bluechemical, Ltd., Class H | 468,000 | $ 248,403 |
| China CITIC Bank, Class H | 239,000 | 178,300 |
| China Coal Energy Co., Class H | 311,000 | 430,340 |
| China Communication Services Corp., Ltd., Class H | 378,000 | 196,498 |
| China Communications Construction Co., Ltd., Class H | 481,000 | 517,719 |
| China Construction Bank, Class H | 2,449,000 | 2,111,360 |
| China COSCO Holdings Co., Ltd., Class H | 220,975 | 272,076 |
| China Dongxiang Group Co. | 634,000 | 387,365 |
| China Everbright International, Ltd. | 171,000 | 78,076 |
| China Everbright, Ltd. | 100,000 | 236,244 |
| China Green (Holdings), Ltd. | 72,000 | 63,163 |
| China International Marine Containers Co., Ltd., | | |
| Class B | 146,472 | 146,066 |
| China Life Insurance Co., Ltd., Class H | 545,000 | 2,502,391 |
| China Medical Technologies, Inc. ADR | 9,700 | 152,290 |
| China Mengniu Dairy Co., Ltd.(1) | 297,000 | 830,270 |
| China Merchants Bank Co., Ltd., Class H | 533,650 | 1,365,259 |
| China Merchants Holdings International Co., Ltd. | 154,000 | 492,127 |
| China Mobile, Ltd. | 620,000 | 5,812,141 |
| China National Building Material Co., Ltd., Class H | 122,000 | 262,554 |
| China National Materials Co., Ltd., Class H | 180,000 | 142,645 |
| China Oilfield Services, Ltd., Class H | 110,000 | 118,857 |
| China Overseas Land & Investment, Ltd. | 230,160 | 496,204 |
| China Petroleum & Chemical Corp., Class H | 1,367,000 | 1,155,874 |
| China Pharmaceutical Group, Ltd. | 524,000 | 294,162 |
| China Railway Construction Corp., Class H | 171,000 | 226,231 |
| China Railway Group, Ltd., Class H(1) | 738,000 | 580,065 |
| China Resources Enterprise, Ltd. | 202,000 | 677,814 |
| China Resources Land, Ltd. | 124,000 | 299,018 |
| China Resources Power Holdings Co., Ltd. | 237,600 | 493,428 |
| China Shenhua Energy Co., Ltd., Class H | 259,500 | 1,162,512 |
| China Shipping Container Lines Co., Ltd., Class H(1) | 568,000 | 203,274 |
| China Shipping Development Co., Ltd., Class H | 74,000 | 104,609 |
| China Southern Airlines Co., Ltd., Class H(1) | 234,000 | 68,360 |
| China Taiping Insurance Holdings Co., Ltd.(1) | 101,000 | 353,400 |
| China Telecom Corp., Ltd., Class H | 2,000,000 | 883,954 |
| China Travel International Investment Hong Kong, | | |
| Ltd. | 468,000 | 95,535 |
| China Unicom, Ltd. | 690,372 | 876,077 |
| China Vanke Co., Ltd., Class B | 445,120 | 550,567 |
| China Yurun Food Group, Ltd. | 214,000 | 438,737 |
| China Zhongwang Holdings, Ltd.(1) | 464,000 | 435,578 |
| Chongqing Changan Automobile Co., Ltd., Class B | 212,136 | 157,722 |
| Citic Pacific, Ltd. | 205,000 | 527,002 |
| CNOOC, Ltd. | 1,411,000 | 2,092,066 |
| Cnpc Hong Kong, Ltd. | 200,000 | 209,105 |
| Cosco Pacific, Ltd. | 198,000 | 274,011 |
| Country Garden Holdings Co. | 626,000 | 240,021 |
| | |
| Security | Shares | Value |
|
| |
| China (continued) | | |
|
| Ctrip.com International, Ltd. ADR(1) | 9,000 | $ 481,860 |
| Datang International Power Generation Co., Ltd., | | |
| Class H | 396,000 | 185,048 |
| Dazhong Transportation Group Co., Ltd., Class B | 84,750 | 59,014 |
| Denway Motors, Ltd. | 984,000 | 471,010 |
| Dongfeng Motor Corp., Class H | 664,000 | 790,289 |
| Fibrechem Technologies, Ltd.(1) | 100,200 | 0 |
| Focus Media Holding, Ltd. ADR(1) | 33,500 | 403,340 |
| FU JI Food & Catering Services(1) | 83,000 | 0 |
| Global Bio-chem Technology Group Co., Ltd. | 1,000,000 | 244,675 |
| Golden Eagle Retail Group, Ltd. | 168,000 | 288,947 |
| Guangdong Investment, Ltd. | 352,000 | 185,749 |
| Guangzhou R&F Properties Co., Ltd., Class H | 162,400 | 304,310 |
| Harbin Power Equipment Co., Ltd., Class H | 248,000 | 230,377 |
| Hengdeli Holdings, Ltd. | 210,000 | 68,377 |
| Huaneng Power International, Inc., Class H | 512,000 | 326,180 |
| Industrial & Commercial Bank of China, Ltd., Class H | 3,378,000 | 2,687,587 |
| Inner Mongolia Eerduosi Cashmere Products Co., Ltd., | | |
| Class B | 110,000 | 78,042 |
| Inner Mongolia Yitai Coal Co., Ltd., Class B | 49,800 | 319,282 |
| Jiangsu Expressway Co., Ltd., Class H | 360,000 | 319,227 |
| Jiangxi Copper Co., Ltd., Class H | 174,000 | 394,239 |
| Kingboard Chemical Holdings, Ltd. | 48,500 | 195,208 |
| Konka Group Co., Ltd., Class B | 303,800 | 118,327 |
| Lenovo Group, Ltd. | 512,000 | 287,664 |
| Li Ning Co., Ltd. | 192,500 | 523,490 |
| Maanshan Iron & Steel Co., Ltd., Class H(1) | 166,000 | 99,930 |
| Mindray Medical International, Ltd. ADR | 10,300 | 316,519 |
| NetEase.com, Inc. ADR(1) | 14,300 | 552,266 |
| New Oriental Education & Technology Group, Inc. | | |
| ADR(1) | 7,400 | 516,816 |
| Nine Dragons Paper Holdings, Ltd. | 181,000 | 257,900 |
| Parkson Retail Group, Ltd. | 345,000 | 558,542 |
| PetroChina Co., Ltd., Class H | 1,856,000 | 2,233,287 |
| PICC Property & Casualty Co., Ltd., Class H(1) | 360,000 | 265,616 |
| Ping An Insurance (Group) Co. of China, Ltd., | | |
| Class H | 82,000 | 718,122 |
| Poly (Hong Kong) Investment, Ltd. | 93,000 | 106,413 |
| Ports Design, Ltd. | 39,500 | 106,197 |
| Shanda Interactive Entertainment, Ltd. ADR(1) | 5,800 | 253,344 |
| Shandong Chenming Paper Holdings, Ltd., Class H | 79,800 | 55,639 |
| Shandong Weigao Group Medical Polymer Co., Ltd., | | |
| Class H | 124,000 | 435,097 |
| Shanghai Electric Group Co., Ltd., Class H | 640,000 | 300,562 |
| Shanghai Friendship Group, Inc. Co., Class B | 48,620 | 58,007 |
| Shanghai Industrial Holdings, Ltd. | 53,000 | 248,980 |
| Shanghai Jin Jiang International Hotels Group Co., | | |
| Ltd., Class H | 404,000 | 123,322 |
| Shanghai Zhenhua Heavy Industry Co., Ltd., Class B | 224,250 | 186,028 |
See notes to financial statements
7
Eaton Vance Structured Emerging Markets Fund as of October 31, 2009
PORTFOLIO OF INVESTMENTS CO N T ’ D |
| | |
| Security | Shares | Value |
|
| |
| China (continued) | | |
|
| Shimao Property Holdings, Ltd. | 49,000 | $ 91,145 |
| SINA Corp.(1) | 4,500 | 168,255 |
| Sino-Ocean Land Holdings, Ltd. | 195,000 | 189,391 |
| Sinopec Shanghai Petrochemical Co., Ltd., Class H(1) | 254,000 | 101,799 |
| Sinotrans Shipping, Ltd. | 512,000 | 229,939 |
| Sinotruk Hong Kong, Ltd. | 55,500 | 65,992 |
| Sohu.com, Inc.(1) | 5,300 | 294,680 |
| Suntech Power Holdings Co., Ltd. ADR(1) | 27,000 | 342,090 |
| Tencent Holdings, Ltd. | 79,600 | 1,386,041 |
| Tingyi (Cayman Islands) Holding Corp. | 334,000 | 745,233 |
| Tsingtao Brewery Co., Ltd., Class H | 76,000 | 308,769 |
| Want Want China Holdings, Ltd. | 1,231,000 | 723,221 |
| Wumart Stores, Inc., Class H | 55,000 | 93,409 |
| Yangzijiang Shipbuilding Holdings, Ltd. | 355,000 | 248,495 |
| Yantai Changyu Pioneer Wine Co., Ltd., Class B | 50,200 | 369,021 |
| Yanzhou Coal Mining Co., Ltd., Class H | 260,000 | 401,950 |
| Zhejiang Expressway Co., Ltd., Class H | 210,000 | 178,879 |
| Zijin Mining Group Co., Ltd., Class H | 352,000 | 340,714 |
| ZTE Corp., Class H | 115,752 | 643,610 |
|
| | | $ 61,862,127 |
|
| |
| Colombia — 0.7% | | |
|
| Almacenes Exito SA | 102,500 | $ 796,226 |
| Banco de Bogota | 3,600 | 57,586 |
| Bancolombia SA ADR, PFC Shares | 28,700 | 1,135,946 |
| Cementos Argos SA | 22,360 | 111,772 |
| Cia Colombiana de Inversiones SA | 21,337 | 517,293 |
| Cia de Cemento Argos SA | 72,900 | 553,173 |
| Corporacion Financiera Colombiana SA | 11,604 | 128,772 |
| Ecopetrol SA | 799,340 | 1,018,904 |
| Empresa de Telecommunicaciones de Bogota SA | 647,380 | 312,283 |
| Grupo Aval Acciones y Valores SA | 215,300 | 79,534 |
| Grupo de Inversiones Suramericana | 43,700 | 491,502 |
| Grupo Nacional de Chocolates SA | 67,045 | 698,434 |
| Interconexion Electrica SA | 131,760 | 765,334 |
| ISAGEN SA ESP | 426,200 | 446,333 |
| Proenergia Internacional(1)(2) | 4,360 | 0 |
| Promigas SA | 4,360 | 83,691 |
| Textiles Fabricato Tejicondor SA(1) | 4,522,600 | 47,475 |
|
| | | $ 7,244,258 |
|
| |
| Croatia — 0.7% | | |
|
| Adris Grupa DD, PFC Shares | 11,430 | $ 604,794 |
| Atlantska Plovidba DD | 5,167 | 1,042,438 |
| Dalekovod DD(1) | 4,050 | 320,735 |
| Ericsson Nikola Tesla | 1,100 | 297,965 |
| | |
| Security | Shares | Value |
|
| |
| Croatia (continued) | | |
|
| Hrvatske Telekomunikacije DD | 56,585 | $ 3,066,982 |
| INA Industrija Nafte DD(1) | 2,037 | 689,878 |
| Institut IGH DD | 350 | 254,251 |
| Koncar-Elektroindustrija DD(1) | 3,419 | 315,661 |
| Podravka Prehrambena Industija DD(1) | 5,675 | 324,156 |
| Privredna Banka Zagreb DD(1) | 3,177 | 389,374 |
|
| | | $ 7,306,234 |
|
| |
| Czech Republic — 1.9% | | |
|
| CEZ AS | 139,760 | $ 6,882,362 |
| Komercni Banka AS | 23,364 | 4,581,696 |
| New World Resources NV, Class A | 226,200 | 2,023,819 |
| Philip Morris CR AS | 1,613 | 775,452 |
| Telefonica 02 Czech Republic AS | 98,804 | 2,327,929 |
| Unipetrol AS(1) | 195,323 | 1,458,252 |
|
| | | $ 18,049,510 |
|
| |
| Egypt — 1.6% | | |
|
| Alexandria Mineral Oils Co. | 7,520 | $ 56,781 |
| Arab Cotton Ginning | 292,800 | 278,316 |
| Commercial International Bank | 133,902 | 1,386,290 |
| Delta Sugar Co.(1) | 19,428 | 90,394 |
| Eastern Tobacco | 16,004 | 364,182 |
| Egypt Kuwaiti Holding Co. | 274,179 | 649,462 |
| Egyptian Financial & Industrial Co. | 87,400 | 380,621 |
| Egyptian Financial Group-Hermes Holding SAE | 133,671 | 778,718 |
| Egyptian for Tourism Resorts(1) | 377,250 | 155,103 |
| Egyptian International Pharmaceutical Industrial Co. | 23,900 | 160,790 |
| Egyptian Media Production City(1) | 292,174 | 309,453 |
| El Ezz Aldekhela Steel Alexa Co. | 2,400 | 353,883 |
| El Ezz Steel Rebars SAE | 213,145 | 624,064 |
| El Sewedy Cables Holding Co. | 35,673 | 475,021 |
| El Watany Bank of Egypt | 12,400 | 100,052 |
| Maridive & Oil Services SAE | 119,000 | 518,092 |
| Medinet Nasr for Housing | 10,375 | 61,079 |
| Misr Beni Suef Cement Co. | 5,940 | 140,904 |
| MobiNil-Egyptian Co. for Mobil Services | 14,100 | 542,252 |
| National Societe General Bank | 38,700 | 197,550 |
| Olympic Group Financial Investments | 119,400 | 664,923 |
| Orascom Construction Industries (OCI) | 58,622 | 2,751,360 |
| Orascom Telecom Holding SAE | 243,990 | 1,627,194 |
| Oriental Weavers Co. | 31,299 | 189,994 |
| Palm Hills Developments SAE(1) | 105,000 | 168,813 |
| Pioneers Holding | 272,000 | 332,980 |
| Sidi Kerir Petrochemicals Co. | 227,000 | 485,107 |
| Six of October Development & Investment Co.(1) | 14,000 | 249,196 |
See notes to financial statements
8
Eaton Vance Structured Emerging Markets Fund as of October 31, 2009
PORTFOLIO OF INVESTMENTS CO N T ’ D |
| | |
| Security | Shares | Value |
|
| |
| Egypt (continued) | | |
|
| South Valley Cement(1) | 226,702 | $ 322,747 |
| Suez Cement Co. | 10,700 | 66,126 |
| Talaat Moustafa Group(1) | 389,300 | 515,012 |
| Telecom Egypt | 203,284 | 658,642 |
|
| | | $ 15,655,101 |
|
| |
| Estonia — 0.8% | | |
|
| AS Baltika(1) | 22,505 | $ 24,251 |
| AS Merko Ehitus | 105,168 | 819,705 |
| AS Nordecon International | 349,200 | 726,177 |
| AS Norma | 17,006 | 94,931 |
| AS Olympic Entertainment Group(1) | 1,319,390 | 1,397,787 |
| AS Tallink Group, Ltd.(1) | 4,723,752 | 2,615,374 |
| AS Tallinna Kaubamaja | 208,840 | 1,181,579 |
| AS Tallinna Vesi | 42,390 | 622,396 |
|
| | | $ 7,482,200 |
|
| |
| Ghana — 0.2% | | |
|
| Aluworks Ghana, Ltd.(1) | 457,409 | $ 119,807 |
| CAL Bank, Ltd. | 1,298,010 | 199,589 |
| Cocoa Processing Co., Ltd. | 269,722 | 5,656 |
| Ghana Commercial Bank, Ltd. | 1,453,841 | 914,525 |
| HFC Bank Ghana, Ltd. | 1,235,326 | 535,315 |
| Produce Buying Co., Ltd. | 582,428 | 72,615 |
| Standard Chartered Bank of Ghana, Ltd. | 24,700 | 504,962 |
|
| | | $ 2,352,469 |
|
| |
| Hungary — 2.1% | | |
|
| EGIS Rt. | 6,664 | $ 702,526 |
| Fotex Holding SE Co., Ltd.(1) | 25,100 | 55,867 |
| Magyar Telekom Rt. | 1,004,520 | 4,330,646 |
| MOL Hungarian Oil & Gas Rt.(1) | 59,450 | 4,966,701 |
| OTP Bank Rt.(1) | 232,000 | 6,523,716 |
| Richter Gedeon Rt. | 19,810 | 4,125,664 |
|
| | | $ 20,705,120 |
|
| |
| India — 6.0% | | |
|
| ABB, Ltd. | 5,400 | $ 87,005 |
| ACC, Ltd. | 20,570 | 323,580 |
| Aditya Birla Nuvo, Ltd. | 3,402 | 56,858 |
| Areva T&D India, Ltd. | 34,500 | 203,095 |
| Asian Paints, Ltd. | 8,730 | 302,146 |
| Axis Bank, Ltd. | 28,600 | 542,785 |
| Bajaj Auto, Ltd. | 13,280 | 389,841 |
| Bajaj Hindusthan, Ltd. | 40,000 | 163,167 |
| | |
| Security | Shares | Value |
|
| |
| India (continued) | | |
|
| Bajaj Holdings & Investment, Ltd. | 5,130 | $ 52,717 |
| Bank of Baroda | 9,660 | 103,358 |
| Bank of India | 64,300 | 448,956 |
| Bharat Forge, Ltd. | 19,650 | 101,639 |
| Bharat Heavy Electricals, Ltd. | 24,640 | 1,151,421 |
| Bharti Airtel, Ltd. | 425,860 | 2,629,284 |
| Cairn India, Ltd.(1) | 79,000 | 435,929 |
| Canara Bank, Ltd. | 12,400 | 89,964 |
| Cipla, Ltd. | 95,010 | 565,099 |
| Colgate-Palmolive (India), Ltd. | 9,000 | 133,260 |
| Container Corp. of India, Ltd. | 14,760 | 343,763 |
| Crompton Greaves, Ltd. | 16,800 | 135,102 |
| Dabur India, Ltd. | 72,200 | 232,173 |
| Deccan Chronicle Holdings, Ltd. | 27,600 | 79,807 |
| Divi’s Laboratories, Ltd. | 7,400 | 82,676 |
| DLF, Ltd. | 31,200 | 241,815 |
| Dr. Reddy’s Laboratories, Ltd. | 22,620 | 484,213 |
| Educomp Solutions, Ltd. | 24,565 | 409,750 |
| Essar Oil, Ltd.(1) | 102,130 | 283,570 |
| Exide Industries, Ltd. | 35,200 | 72,640 |
| Gail India, Ltd. | 105,050 | 765,417 |
| GlaxoSmithKline Pharmaceuticals, Ltd. | 4,480 | 148,065 |
| Glenmark Pharmaceuticals, Ltd. | 44,960 | 212,102 |
| GMR Infrastructure(1) | 248,000 | 325,308 |
| Grasim Industries, Ltd. | 2,830 | 129,680 |
| Gujarat Ambuja Cements, Ltd. | 44,800 | 84,063 |
| Gujarat State Petronet, Ltd.(1) | 144,200 | 243,776 |
| GVK Power & Infrastructure, Ltd.(1) | 180,000 | 167,287 |
| HCL Technologies, Ltd. | 21,100 | 135,283 |
| HDFC Bank, Ltd. | 32,624 | 1,113,976 |
| Hero Honda Motors, Ltd. | 20,500 | 676,769 |
| Hindalco Industries, Ltd. | 90,810 | 232,708 |
| Hindustan Unilever, Ltd. | 288,600 | 1,705,695 |
| Hindustan Zinc, Ltd. | 6,840 | 129,820 |
| Housing Development & Infrastructure, Ltd.(1) | 29,714 | 196,035 |
| Housing Development Finance Corp. | 44,700 | 2,486,953 |
| ICICI Bank, Ltd. | 125,670 | 2,081,089 |
| Idea Cellular, Ltd.(1) | 273,500 | 297,236 |
| IFCI, Ltd. | 68,000 | 62,486 |
| Indiabulls Financial Services, Ltd. | 18,100 | 63,961 |
| Indiabulls Real Estate, Ltd.(1) | 91,700 | 470,962 |
| Indiabulls Securities, Ltd. | 94,300 | 90,804 |
| Indian Hotels Co., Ltd. | 52,680 | 80,728 |
| Indian Oil Corp., Ltd. | 71,000 | 465,580 |
| Infosys Technologies, Ltd. | 82,600 | 3,850,764 |
| Infosys Technologies, Ltd. ADR | 3,800 | 174,800 |
| Infrastructure Development Finance Co., Ltd. | 76,600 | 236,543 |
| ITC, Ltd. | 276,530 | 1,495,974 |
See notes to financial statements
9
Eaton Vance Structured Emerging Markets Fund as of October 31, 2009
PORTFOLIO OF INVESTMENTS CO N T ’ D |
| | |
| Security | Shares | Value |
|
| |
| India (continued) | | |
|
| IVRCL Infrastructures & Projects, Ltd. | 95,800 | $ 699,447 |
| Jaiprakash Associates, Ltd. | 111,200 | 489,233 |
| Jindal Steel & Power, Ltd. | 77,700 | 1,041,500 |
| JSW Steel, Ltd. | 7,600 | 120,200 |
| Kotak Mahindra Bank, Ltd. | 59,100 | 876,920 |
| Lanco Infratech, Ltd.(1) | 13,900 | 141,658 |
| Larsen & Toubro, Ltd. | 36,360 | 1,195,456 |
| Larsen & Toubro, Ltd. GDR | 1,600 | 53,419 |
| Lupin, Ltd. | 3,900 | 102,163 |
| Mahindra & Mahindra, Ltd. | 53,480 | 1,028,377 |
| Maruti Udyog, Ltd. | 25,450 | 746,417 |
| Motor Industries Co., Ltd. | 1,130 | 101,760 |
| Mphasis, Ltd. | 14,800 | 210,347 |
| Mundra Port & Special Economic Zone, Ltd. | 29,400 | 310,966 |
| Nestle India, Ltd. | 9,530 | 518,629 |
| Nicholas Piramal India, Ltd. | 32,000 | 254,177 |
| NTPC, Ltd. | 305,300 | 1,364,441 |
| Oil & Natural Gas Corp., Ltd. | 70,470 | 1,682,322 |
| Power Grid Corp. of India, Ltd. | 185,700 | 403,664 |
| Punj Lloyd, Ltd. | 36,200 | 152,094 |
| Ranbaxy Laboratories, Ltd.(1) | 28,560 | 233,138 |
| Reliance Capital, Ltd. | 36,835 | 573,493 |
| Reliance Communications, Ltd. | 230,960 | 848,155 |
| Reliance Industries, Ltd. | 126,419 | 5,103,639 |
| Reliance Infrastructure, Ltd. | 41,400 | 909,836 |
| Reliance Natural Resources, Ltd.(1) | 207,800 | 277,872 |
| Reliance Power, Ltd.(1) | 145,300 | 425,528 |
| Satyam Computer Services, Ltd. | 144,150 | 311,051 |
| Sesa Goa, Ltd. | 37,000 | 238,583 |
| Shree Renuka Sugars, Ltd. | 55,000 | 214,225 |
| Siemens India, Ltd. | 7,380 | 78,914 |
| State Bank of India | 12,000 | 551,199 |
| State Bank of India GDR | 9,600 | 876,812 |
| Steel Authority of India, Ltd. | 155,400 | 537,563 |
| Sterlite Industries (India), Ltd. | 49,280 | 796,436 |
| Sun Pharmaceuticals Industries, Ltd. | 22,200 | 651,334 |
| Sun TV Network, Ltd. | 12,400 | 81,505 |
| Suzlon Energy, Ltd.(1) | 78,150 | 108,107 |
| Tata Communications, Ltd. | 31,000 | 251,639 |
| Tata Consultancy Services, Ltd. | 85,500 | 1,141,963 |
| Tata Motors, Ltd. | 21,050 | 248,634 |
| Tata Power Co., Ltd. | 29,990 | 837,650 |
| Tata Steel, Ltd. | 38,896 | 384,386 |
| Tata Tea, Ltd. | 11,800 | 214,252 |
| Tata Teleservices Maharashtra, Ltd.(1) | 365,500 | 202,551 |
| Titan Industries, Ltd. | 3,300 | 87,389 |
| Torrent Power, Ltd. | 44,700 | 262,954 |
| Unitech, Ltd. | 35,100 | 59,518 |
| | |
| Security | Shares | Value |
|
| |
| India (continued) | | |
|
| United Spirits, Ltd. | 18,500 | $ 411,787 |
| Voltas, Ltd. | 39,000 | 131,367 |
| Wipro, Ltd. | 52,100 | 668,177 |
| Zee Entertainment Enterprises, Ltd. | 73,557 | 354,612 |
|
| | | $ 57,836,936 |
|
| |
| Indonesia — 3.0% | | |
|
| Adaro Energy PT | 6,000,000 | $ 946,599 |
| Aneka Tambang Tbk PT | 2,434,000 | 565,643 |
| Astra Argo Lestari Tbk PT | 321,000 | 712,611 |
| Astra International Tbk PT | 1,254,200 | 4,035,133 |
| Bakrie & Brothers Tbk PT(1) | 47,245,500 | 479,706 |
| Bakrie Sumatera Plantations Tbk PT | 556,500 | 39,586 |
| Bank Central Asia Tbk PT | 4,759,500 | 2,241,256 |
| Bank Danamon Indonesia Tbk PT | 2,004,803 | 935,253 |
| Bank Mandiri Tbk PT | 3,135,500 | 1,504,585 |
| Bank Pan Indonesia Tbk PT(1) | 1,456,500 | 116,935 |
| Bank Rakyat Indonesia PT | 2,407,500 | 1,751,931 |
| Barito Pacific Tbk PT(1) | 665,800 | 94,842 |
| Berlian Laju Tanker Tbk PT | 904,000 | 66,057 |
| Bumi Resources Tbk PT | 11,727,000 | 2,823,128 |
| Energi Mega Persada Tbk PT(1) | 1,550,700 | 44,842 |
| Gudang Garam Tbk PT | 179,000 | 263,315 |
| Indah Kiat Pulp & Paper Corp. Tbk PT(1) | 1,021,000 | 188,928 |
| Indocement Tunggal Prakarsa Tbk PT | 167,000 | 190,157 |
| Indofood Sukses Makmur Tbk PT | 2,314,000 | 731,314 |
| Indosat Tbk PT | 1,134,000 | 602,357 |
| International Nickel Indonesia Tbk PT(1) | 1,665,500 | 690,199 |
| Kalbe Farma Tbk PT | 1,745,500 | 218,912 |
| Lippo Karawaci Tbk PT(1) | 5,149,500 | 348,333 |
| Medco Energi Internasional Tbk PT | 2,095,000 | 585,519 |
| Perusahaan Gas Negara PT | 3,904,000 | 1,452,615 |
| Perusahaan Perkebunan London Sumatra Indonesia | | |
| Tbk PT | 155,500 | 123,985 |
| PT AKR Corporindo Tbk | 861,500 | 100,762 |
| PT Indo Tambangraya Megah Tbk | 221,500 | 516,501 |
| Semen Gresik (Persero) Tbk PT | 301,000 | 212,718 |
| Tambang Batubara Bukit Asam Tbk PT | 404,500 | 630,161 |
| Telekomunikasi Indonesia Tbk PT | 2,855,000 | 2,458,479 |
| Unilever Indonesia Tbk PT | 711,800 | 744,457 |
| United Tractors Tbk PT | 1,577,000 | 2,417,932 |
|
| | | $ 28,834,751 |
|
| |
| Israel — 3.1% | | |
|
| Alony Hetz Properties & Investments, Ltd. | 18,100 | $ 64,290 |
| Alvarion, Ltd.(1) | 8,900 | 35,706 |
| Avner Oil & Gas, Ltd. | 850,000 | 266,867 |
See notes to financial statements
10
Eaton Vance Structured Emerging Markets Fund as of October 31, 2009
PORTFOLIO OF INVESTMENTS CO N T ’ D |
| | |
| Security | Shares | Value |
|
| |
| Israel (continued) | | |
|
|
| Bank Hapoalim B.M.(1) | 354,331 | $ 1,293,573 |
| Bank Leumi Le-Israel(1) | 432,508 | 1,689,153 |
| Bezeq Israeli Telecommunication Corp., Ltd. | 546,135 | 1,218,821 |
| Cellcom Israel, Ltd. | 26,200 | 788,358 |
| Check Point Software Technologies, Ltd.(1) | 55,206 | 1,715,250 |
| Clal Industries, Ltd.(1) | 14,400 | 73,463 |
| Clal Insurance Enterprise Holdings, Ltd.(1) | 2,810 | 59,487 |
| Delek Group, Ltd. | 2,130 | 351,895 |
| Discount Investment Corp. | 16,400 | 385,361 |
| Elbit Systems, Ltd. | 9,950 | 602,831 |
| Ezchip Semiconductor, Ltd.(1) | 6,700 | 80,199 |
| Frutarom | 8,107 | 65,755 |
| Gazit Globe (1982), Ltd. | 12,000 | 110,902 |
| Gilat Satellite Networks, Ltd.(1) | 11,760 | 52,802 |
| Harel Insurance Investments & Financial Services, | | |
| Ltd.(1) | 11,680 | 552,873 |
| Housing & Construction Holdings, Ltd. | 118,000 | 206,684 |
| IDB Holding Corp., Ltd. | 2,900 | 68,193 |
| Israel Chemicals, Ltd. | 235,061 | 2,745,614 |
| Israel Corp., Ltd.(1) | 1,275 | 876,878 |
| Israel Discount Bank, Ltd., Series A | 346,200 | 660,870 |
| Isramco Negev 2, LP(1) | 3,686,000 | 379,057 |
| Koor Industries, Ltd. | 8,510 | 243,996 |
| Makhteshim-Agan Industries, Ltd. | 104,897 | 490,278 |
| Mellanox Technologies, Ltd.(1) | 4,200 | 73,853 |
| Menorah Mivtachim Holdings, Ltd.(1) | 6,900 | 79,109 |
| Migdal Insurance & Financial, Ltd. Holdings(1) | 38,400 | 60,185 |
| Mizrahi Tefahot Bank, Ltd.(1) | 61,040 | 496,086 |
| Ness Technologies, Inc.(1) | 17,200 | 113,348 |
| Nice Systems, Ltd.(1) | 18,423 | 573,274 |
| Oil Refineries, Ltd. | 162,600 | 89,304 |
| Orbotech, Ltd.(1) | 20,000 | 186,000 |
| Ormat Industries, Ltd. | 27,300 | 237,985 |
| Osem Investment, Ltd. | 19,544 | 253,535 |
| Partner Communications Co., Ltd. | 41,300 | 783,083 |
| Paz Oil Co., Ltd. | 2,100 | 327,093 |
| Strauss Group, Ltd. | 23,300 | 302,011 |
| Supersol, Ltd. | 26,000 | 123,043 |
| Teva Pharmaceutical Industries, Ltd. ADR | 220,704 | 11,141,138 |
|
| | | $ 29,918,203 |
|
|
| |
| Jordan — 0.8% | | |
|
|
| Arab Bank PLC | 201,285 | $ 3,790,785 |
| Arab Potash Co., PLC | 23,800 | 1,010,362 |
| Bank of Jordan | 11,100 | 35,391 |
| Capital Bank of Jordan(1) | 185,557 | 361,551 |
| Jordan Ahli Bank | 14,700 | 31,474 |
| | |
| Security | Shares | Value |
|
| |
| Jordan (continued) | | |
|
|
| Jordan Petroleum Refinery | 28,400 | $ 292,298 |
| Jordan Phosphate Mines | 15,900 | 387,610 |
| Jordan Steel | 57,402 | 213,781 |
| Jordan Telecom Corp. | 37,600 | 270,897 |
| Jordanian Electric Power Co. | 113,889 | 603,112 |
| Lafarge Jordan Cement | 5,600 | 55,700 |
| Middle East Complex for Engineering, Electric, & | | |
| Heavy Industries PLC(1) | 69,800 | 150,469 |
| Taameer Jordan Co.(1) | 279,605 | 229,122 |
| Union Land Development(1) | 32,100 | 99,710 |
| United Arab Investors(1) | 335,925 | 284,582 |
|
| | | $ 7,816,844 |
|
|
| |
| Kazakhstan — 0.3% | | |
|
|
| KazMunaiGas Exploration Production GDR | 123,400 | $ 2,910,702 |
|
| | | $ 2,910,702 |
|
|
| |
| Kenya — 0.8% | | |
|
|
| Athi River Mining, Ltd. | 78,100 | $ 99,578 |
| Bamburi Cement Co., Ltd. | 172,700 | 378,929 |
| Barclays Bank of Kenya, Ltd. | 716,965 | 427,263 |
| East African Breweries, Ltd. | 884,080 | 1,679,648 |
| Equity Bank, Ltd. | 5,398,700 | 1,032,289 |
| KenolKobil, Ltd. | 409,000 | 255,625 |
| Kenya Airways, Ltd. | 345,800 | 112,079 |
| Kenya Commercial Bank, Ltd. | 2,795,300 | 731,866 |
| Kenya Electricity Generating Co., Ltd. | 2,321,100 | 322,535 |
| Kenya Power & Lighting, Ltd. | 83,900 | 158,368 |
| Mumias Sugar Co., Ltd. | 856,800 | 78,577 |
| Nation Media Group, Ltd. | 206,200 | 330,526 |
| Safaricom, Ltd. | 34,362,672 | 1,840,258 |
| Standard Chartered Bank Kenya, Ltd. | 62,800 | 121,555 |
|
| | | $ 7,569,096 |
|
|
| |
| Kuwait — 0.9% | | |
|
|
| Aerated Concrete Industries Co. | 189,000 | $ 264,382 |
| Agility(1) | 50,000 | 202,833 |
| Al Safwa Group Co.(1) | 800,000 | 144,302 |
| Boubyan Bank KSC(1) | 100,000 | 181,850 |
| Boubyan Petrochemicals Co. | 220,000 | 319,287 |
| Burgan Bank SAK(1) | 196,000 | 267,319 |
| Burgan Co. For Well Drilling, Trading & | | |
| Maintenance KSCC | 75,250 | 148,205 |
| Commercial Bank of Kuwait SAK | 50,000 | 173,107 |
| Commercial Real Estate Co. KSCC(1) | 406,600 | 179,163 |
| Global Investment House KSCC(1) | 527,500 | 199,231 |
See notes to financial statements
11
Eaton Vance Structured Emerging Markets Fund as of October 31, 2009
PORTFOLIO OF INVESTMENTS CO N T ’ D |
| | |
| Security | Shares | Value |
|
| |
| Kuwait (continued) | | |
|
|
| Gulf Bank(1) | 260,000 | $ 295,506 |
| Gulf Cable & Electrical Industries | 50,000 | 323,082 |
| Kuwait Finance House KSC | 247,100 | 1,019,682 |
| Kuwait Foods Co. (Americana) | 45,000 | 283,266 |
| Kuwait International Bank(1) | 154,000 | 119,559 |
| Kuwait Projects Co. Holdings KSC | 45,000 | 76,325 |
| Mabanee Co. SAKC(1) | 38,500 | 95,594 |
| Mobile Telecommunications Co. | 387,500 | 1,571,953 |
| National Bank of Kuwait SAK | 322,750 | 1,354,433 |
| National Industries Group Holding(1) | 390,000 | 511,453 |
| National Investment Co.(1) | 120,000 | 182,549 |
| National Real Estate Co.(1) | 210,000 | 212,457 |
| Sultan Center Food Products Co.(1) | 220,000 | 187,725 |
|
| | | $ 8,313,263 |
|
|
| |
| Latvia — 0.1% | | |
|
|
| Grindeks(1) | 42,000 | $ 393,716 |
| Latvian Shipping Co.(1) | 735,000 | 686,512 |
|
| | | $ 1,080,228 |
|
|
| |
| Lebanon — 0.3% | | |
|
|
| Solidere | 83,555 | $ 2,182,457 |
| Solidere GDR(3) | 28,500 | 748,856 |
|
| | | $ 2,931,313 |
|
|
| |
| Lithuania — 0.3% | | |
|
|
| Apranga PVA(1) | 278,536 | $ 268,568 |
| Invalda PVA(1) | 19,100 | 17,298 |
| Klaipedos Nafta PVA | 1,345,900 | 548,656 |
| Lietuvos Dujos | 31,900 | 32,257 |
| Lietuvos Energija(1) | 42,400 | 54,510 |
| Pieno Zvaigzdes | 63,600 | 81,106 |
| Rokiskio Suris(1) | 69,800 | 90,506 |
| Rytu Skirstomieji Tinklai(1) | 88,200 | 80,109 |
| Sanitas(1) | 55,400 | 223,885 |
| Siauliu Bankas(1) | 774,861 | 353,963 |
| Ukio Bankas Commercial Bank(1) | 1,672,935 | 850,198 |
|
| | | $ 2,601,056 |
|
|
| |
| Malaysia — 3.1% | | |
|
|
| Airasia Bhd(1) | 915,300 | $ 359,890 |
| Alliance Financial Group Bhd | 385,700 | 275,587 |
| AMMB Holdings Bhd | 459,200 | 631,363 |
| Astro All Asia Networks PLC | 414,000 | 399,290 |
| Batu Kawan Bhd | 90,500 | 262,441 |
| | |
| Security | Shares | Value |
|
| |
| Malaysia (continued) | | |
|
|
| Berjaya Sports Toto Bhd | 297,214 | $ 374,632 |
| British American Tobacco Malaysia Bhd | 35,500 | 466,214 |
| Bursa Malaysia Bhd | 131,700 | 311,498 |
| CIMB Group Holdings Bhd | 363,800 | 1,319,842 |
| Dialog Group Bhd | 221,900 | 83,712 |
| Digi.com Bhd | 65,600 | 418,897 |
| Gamuda Bhd | 1,076,200 | 982,617 |
| Genting Bhd | 626,600 | 1,317,198 |
| Genting Plantations Bhd | 163,400 | 292,131 |
| Hong Leong Bank Bhd | 178,000 | 389,227 |
| Hong Leong Financial Group Bhd | 145,000 | 262,328 |
| IGB Corp. Bhd(1) | 173,500 | 98,544 |
| IJM Corp. Bhd | 645,490 | 900,354 |
| IOI Corp. Bhd | 925,705 | 1,435,313 |
| Kencana Petroleum Bhd | 233,700 | 148,042 |
| Kinsteel Bhd | 202,200 | 54,490 |
| KNM Group Bhd | 4,983,800 | 1,131,071 |
| Kuala Lumpur Kepong Bhd | 128,500 | 561,176 |
| Kulim (Malaysia) Bhd | 141,000 | 303,212 |
| Lafarge Malayan Cement Bhd | 270,150 | 476,729 |
| Lion Industries Corp. Bhd | 540,300 | 220,935 |
| Malayan Banking Bhd | 727,487 | 1,408,920 |
| Malaysian Airline System Bhd(1) | 165,733 | 150,044 |
| Malaysian Airline System Bhd, PFC Shares | 33,533 | 7,714 |
| Malaysian Bulk Carriers Bhd | 102,200 | 92,934 |
| Malaysian Resources Corp. Bhd(1) | 949,000 | 374,968 |
| MISC Bhd | 317,000 | 824,009 |
| MMC Corp. Bhd | 540,000 | 391,351 |
| Multi-Purpose Holdings Bhd | 121,440 | 65,781 |
| Parkson Holdings Bhd | 205,040 | 304,213 |
| Petra Perdana Bhd | 83,400 | 63,281 |
| Petronas Dagangan Bhd | 259,700 | 675,582 |
| Petronas Gas Bhd | 135,200 | 386,450 |
| PLUS (Projek Lebuhraya Utara Selatan) | | |
| Expressways Bhd | 411,900 | 397,038 |
| PPB Group Bhd | 117,700 | 519,772 |
| Public Bank Bhd | 306,720 | 955,468 |
| Resorts World Bhd | 1,117,800 | 892,847 |
| RHB Capital Bhd | 62,100 | 97,424 |
| SapuraCrest Petroleum Bhd | 208,100 | 125,552 |
| Sarawak Energy Bhd | 152,400 | 115,353 |
| Shell Refining Co. Bhd | 36,900 | 115,701 |
| Sime Darby Bhd | 1,254,839 | 3,244,518 |
| Sino Hua-An International Bhd(1) | 401,500 | 54,737 |
| SP Setia Bhd | 228,600 | 257,059 |
| TA Enterprise Bhd | 323,000 | 72,170 |
| TA Global Bhd(1) | 193,800 | 55,242 |
| TA Global Bhd, PFC Shares(1) | 193,800 | 0 |
See notes to financial statements
12
Eaton Vance Structured Emerging Markets Fund as of October 31, 2009
PORTFOLIO OF INVESTMENTS CO N T ’ D |
| | |
| Security | Shares | Value |
|
| |
| Malaysia (continued) | | |
|
|
| Tanjong PLC | 72,100 | $ 319,029 |
| Telekom Malaysia Bhd | 381,100 | 334,922 |
| Tenaga Nasional Bhd | 502,100 | 1,230,658 |
| Titan Chemicals Corp. Bhd(1) | 168,000 | 56,559 |
| TM International Bhd(1) | 1,004,850 | 855,769 |
| Top Glove Corp. Bhd | 97,000 | 231,090 |
| UEM Land Holdings Bhd(1) | 510,500 | 247,275 |
| UMW Holdings Bhd | 78,000 | 143,653 |
| Wah Seong Corp. Bhd | 432,125 | 304,552 |
| WCT Bhd | 351,800 | 267,960 |
| WTK Holdings Bhd | 154,250 | 51,998 |
| YNH Property Bhd(1) | 158,059 | 77,772 |
| YTL Corp. Bhd | 189,006 | 401,930 |
| YTL Power International Bhd | 615,821 | 386,970 |
|
| | | $ 30,034,998 |
|
|
| |
| Mauritius — 0.8% | | |
|
|
| Ireland Blyth, Ltd. | 31,600 | $ 62,418 |
| Mauritius Commercial Bank | 509,000 | 2,448,100 |
| Mauritius Development Investment Trust Co., Ltd. | 80,700 | 12,005 |
| Naiade Resorts, Ltd. | 359,100 | 528,263 |
| New Mauritius Hotels, Ltd. | 525,350 | 2,316,386 |
| Rogers & Co., Ltd. | 13,200 | 141,283 |
| State Bank of Mauritius, Ltd. | 425,800 | 1,126,083 |
| Sun Resorts, Ltd. | 234,775 | 620,892 |
| United Basalt Products, Ltd. | 36,000 | 84,496 |
| United Docks, Ltd.(1) | 27,400 | 83,332 |
|
| | | $ 7,423,258 |
|
|
| |
| Mexico — 6.2% | | |
|
|
| Alfa SA de CV, Series A | 281,000 | $ 1,436,524 |
| America Movil SAB de CV, Series L | 5,940,920 | 13,043,815 |
| Axtel SA de CV, Series CPO(1) | 367,100 | 273,857 |
| Banco Compartamos SA de CV | 282,800 | 1,159,793 |
| Bolsa Mexicana de Valores SA de CV(1) | 630,000 | 725,248 |
| Carso Global Telecom SA de CV, Series A1(1) | 171,400 | 665,933 |
| Carso Infraestructura y Construccion SA(1) | 358,400 | 200,864 |
| Cemex SAB de CV, Series CPO(1) | 5,100,658 | 5,311,676 |
| Coca-Cola Femsa SA de CV, Series L | 30,200 | 164,452 |
| Consorcio ARA SA de CV(1) | 459,200 | 288,657 |
| Corporacion GEO SA de CV, Series B(1) | 194,300 | 514,896 |
| Corporacion Moctezuma SA de CV | 27,500 | 58,421 |
| Desarrolladora Homex SA de CV(1) | 81,500 | 485,775 |
| Embotelladoras Arca SA | 100,000 | 250,611 |
| Empresas ICA SAB de CV(1) | 513,100 | 1,125,002 |
| Fomento Economico Mexicano SA de CV, Series UBD | 784,900 | 3,328,933 |
| | |
| Security | Shares | Value |
|
| |
| Mexico (continued) | | |
|
|
| Grupo Aeroportuario del Pacifico SA de CV, Class B | 41,500 | $ 104,349 |
| Grupo Aeroportuario del Sureste SAB de CV, Class B | 95,500 | 390,571 |
| Grupo Bimbo SA de CV, Series A | 223,300 | 1,290,544 |
| Grupo Carso SA de CV, Series A1 | 484,700 | 1,503,612 |
| Grupo Elektra SA de CV | 24,000 | 979,722 |
| Grupo Financiero Banorte SA de CV, Class O | 1,469,300 | 4,819,493 |
| Grupo Financiero Inbursa SA de CV, Class O | 1,027,700 | 2,900,871 |
| Grupo Mexico SA de CV, Series B(1) | 2,363,326 | 4,653,714 |
| Grupo Modelo SA de CV, Series C(1) | 260,000 | 1,205,112 |
| Grupo Simec SA de CV, Series B(1) | 92,000 | 225,197 |
| Grupo Televisa SA, Series CPO | 535,800 | 2,045,607 |
| Impulsora del Desarrollo y el Empleo en America | | |
| Latina SA de CV, Series B1(1) | 919,900 | 905,705 |
| Industrias CH SA, Series B(1) | 25,700 | 82,606 |
| Industrias Penoles SA de CV | 67,800 | 1,255,381 |
| Kimberly-Clark de Mexico SA de CV | 189,500 | 752,044 |
| Mexichem SA de CV | 597,991 | 971,459 |
| Organizacion Soriana SAB de CV, Class B(1) | 120,000 | 267,288 |
| Promotora y Operadora de Infraestructura SA de CV(1) | 77,700 | 141,233 |
| Telefonos de Mexico SA de CV, Series L | 1,636,000 | 1,385,249 |
| Telmex Internacional SAB de CV, Class L | 1,602,300 | 1,031,491 |
| TV Azteca SA de CV, Series CPO | 625,000 | 321,878 |
| Urbi Desarrollos Urbanos SA de CV(1) | 178,400 | 351,294 |
| Wal-Mart de Mexico SAB de CV, Series V | 848,100 | 3,018,250 |
|
| | | $ 59,637,127 |
|
|
| |
| Morocco — 1.5% | | |
|
|
| Attijariwafa Bank | 46,400 | $ 1,587,342 |
| Banque Centrale Populaire | 25,280 | 877,211 |
| Banque Marocaine du Commerce Exterieur (BMCE) | 63,600 | 2,013,756 |
| Banque Marocaine pour le Commerce et l’Industrie | | |
| (BMCI) | 2,860 | 321,677 |
| Centrale Laitiere | 85 | 112,463 |
| Ciments du Maroc | 2,250 | 459,514 |
| Compagnie Generale Immobiliere | 2,150 | 523,827 |
| Cosumar Compagnie Sucriere Marocaine et de | | |
| Raffinage | 1,230 | 241,825 |
| Credit Immobilier et Hotelier | 1,440 | 68,729 |
| Douja Promotion Groupe Addoha SA | 56,300 | 831,163 |
| Holcim Maroc SA | 2,260 | 537,420 |
| Lafarge Ciments | 3,010 | 572,628 |
| Managem(1) | 7,755 | 268,160 |
| Maroc Telecom | 142,500 | 2,619,534 |
| ONA SA | 10,770 | 1,836,352 |
| RISMA(1) | 1,900 | 63,693 |
| Samir(1) | 3,480 | 267,263 |
| Societe des Brasseries du Maroc | 1,590 | 687,052 |
| Societe Nationale d’Investissement | 2,375 | 522,604 |
See notes to financial statements
13
Eaton Vance Structured Emerging Markets Fund as of October 31, 2009
PORTFOLIO OF INVESTMENTS CO N T ’ D |
| | |
| Security | Shares | Value |
|
| |
| Morocco (continued) | | |
|
|
| SONASID (Societe Nationale de Siderurgie) | 1,320 | $ 358,013 |
| Wafa Assurance | 1,090 | 272,958 |
|
| | | $ 15,043,184 |
|
|
| |
| Nigeria — 0.8% | | |
|
|
| Access Bank PLC | 5,970,288 | $ 252,499 |
| Afribank Nigeria PLC(1) | 5,727,146 | 96,022 |
| African Petroleum PLC | 285,989 | 64,121 |
| Ashaka Cement PLC | 221,861 | 19,313 |
| Benue Cement Co. PLC | 1,460,000 | 408,184 |
| Dangote Sugar Refinery PLC | 5,767,032 | 574,993 |
| Diamond Bank PLC | 5,100,000 | 257,776 |
| Ecobank Transnational, Inc. | 1,922,518 | 184,968 |
| Fidelity Bank/Nigeria | 12,200,000 | 181,541 |
| First Bank of Nigeria PLC | 9,985,105 | 983,019 |
| First City Monument Bank PLC(1) | 4,500,000 | 182,889 |
| Guaranty Trust Bank PLC | 6,274,612 | 644,763 |
| Guiness Nigeria PLC | 442,075 | 398,750 |
| Intercontinental Bank PLC(1) | 3,062,209 | 56,552 |
| Lafarge Cement WAPCO Nigeria PLC | 1,228,000 | 251,898 |
| Nestle Foods Nigeria PLC | 151,000 | 213,615 |
| Nigerian Breweries PLC | 1,848,611 | 668,043 |
| Oando PLC | 448,000 | 276,508 |
| Oceanic Bank International PLC(1) | 4,301,220 | 68,124 |
| PlatinumHabib Bank PLC | 2,767,885 | 39,987 |
| PZ Cussons Nigeria PLC | 1,185,000 | 173,558 |
| Skye Bank PLC | 4,525,000 | 149,451 |
| UAC of Nigeria PLC | 900,000 | 244,734 |
| Union Bank of Nigeria PLC | 4,658,654 | 224,751 |
| United Bank for Africa PLC | 6,181,798 | 487,420 |
| Zenith Bank, Ltd. | 6,479,912 | 619,628 |
|
| | | $ 7,723,107 |
|
|
| |
| Oman — 0.8% | | |
|
|
| Bank Dhofar SAOG | 373,466 | $ 586,799 |
| Bank Muscat SAOG | 567,695 | 1,329,460 |
| Bank Sohar(1) | 887,000 | 498,351 |
| Dhofar International Development & Investment | | |
| Holding Co. | 27,600 | 28,986 |
| Galfar Engineering & Contracting SAOG | 368,360 | 612,486 |
| National Bank of Oman, Ltd. | 184,410 | 154,755 |
| Oman Cables Industry SAOG | 93,600 | 352,231 |
| Oman Cement Co., SAOG | 205,500 | 392,350 |
| Oman Flour Mills Co., Ltd. SAOG | 164,100 | 248,782 |
| Oman International Bank SAOG | 342,950 | 263,400 |
| Oman Telecommunications Co. | 486,400 | 1,654,808 |
| Ominvest | 172,199 | 221,076 |
| | |
| Security | Shares | Value |
|
| |
| Oman (continued) | | |
|
|
| Raysut Cement Co., SAOG | 130,245 | $ 509,575 |
| Renaissance Holdings Co. | 301,173 | 524,991 |
| Shell Oman Marketing Co. | 34,398 | 186,777 |
|
| | | $ 7,564,827 |
|
|
| |
| Pakistan — 0.8% | | |
|
|
| Adamjee Insurance Co., Ltd. | 201,050 | $ 305,770 |
| Allied Bank, Ltd. | 117,524 | 81,900 |
| Azgard Nine, Ltd.(1) | 491,400 | 141,940 |
| Bank Alfalah, Ltd.(1) | 1,295,638 | 208,172 |
| D.G. Khan Cement Co., Ltd.(1) | 258,360 | 89,373 |
| Engro Chemical Pakistan, Ltd. | 326,200 | 649,271 |
| Fauji Fertilizer Co., Ltd. | 292,352 | 367,368 |
| Habib Bank, Ltd. | 160,000 | 236,930 |
| Hub Power Co., Ltd. | 1,346,700 | 467,470 |
| Indus Motor Co., Ltd. | 24,000 | 53,525 |
| Jahangir Siddiqui & Co., Ltd.(1) | 500,000 | 211,031 |
| Kot Addu Power Co., Ltd. | 218,000 | 120,240 |
| Lucky Cement, Ltd. | 326,500 | 256,972 |
| Muslim Commercial Bank, Ltd. | 489,102 | 1,249,145 |
| National Bank of Pakistan | 211,694 | 209,410 |
| Nishat Mills, Ltd. | 937,800 | 676,925 |
| Oil & Gas Development Co., Ltd. | 524,000 | 649,974 |
| Pakistan Oil Fields, Ltd. | 124,000 | 321,894 |
| Pakistan Petroleum, Ltd. | 224,742 | 469,156 |
| Pakistan State Oil Co., Ltd. | 93,700 | 342,668 |
| Pakistan Telecommunication Co., Ltd. | 1,706,100 | 383,566 |
| SUI Northern Gas Pipelines, Ltd. | 211,000 | 67,550 |
| United Bank, Ltd. | 362,587 | 250,942 |
|
| | | $ 7,811,192 |
|
|
| |
| Peru — 1.5% | | |
|
|
| Alicorp SA | 384,800 | $ 284,400 |
| Austral Group SA(1) | 658,650 | 76,982 |
| Cia de Minas Buenaventura SA ADR | 77,980 | 2,617,789 |
| Cia Minera Atacocha SA, Class B, PFC Shares | 39,750 | 20,907 |
| Cia Minera Milpo SA(1) | 317,997 | 830,793 |
| Credicorp, Ltd. | 45,770 | 3,156,635 |
| Edegel SA | 1,180,000 | 608,456 |
| Edelnor SA | 108,248 | 101,401 |
| Empresa Agroindustrial Casa Grande SA(1) | 69,120 | 180,582 |
| Energia del Sur SA | 39,900 | 167,336 |
| Ferreyros SA | 331,542 | 307,722 |
| Grana y Montero SA | 210,612 | 208,512 |
| Luz del Sur SAA | 90,550 | 138,517 |
| Minsur SA | 162,200 | 401,458 |
See notes to financial statements
14
Eaton Vance Structured Emerging Markets Fund as of October 31, 2009
PORTFOLIO OF INVESTMENTS CO N T ’ D |
| | |
| Security | Shares | Value |
|
| |
| Peru (continued) | | |
|
|
| Sociedad Minera Cerro Verde SA | 19,790 | $ 451,212 |
| Sociedad Minera el Brocal SA | 8,970 | 131,050 |
| Southern Copper Corp. | 111,180 | 3,502,170 |
| Volcan Cia Minera SA, Class B(1) | 1,157,519 | 1,364,830 |
|
| | | $ 14,550,752 |
|
|
| |
| Philippines — 1.6% | | |
|
|
| Aboitiz Equity Ventures, Inc. | 3,911,000 | $ 675,115 |
| Aboitiz Power Corp. | 1,765,000 | 274,257 |
| Alliance Global Group, Inc.(1) | 4,540,000 | 403,577 |
| Altlas Consolidated Mining & Development Corp.(1) | 500,000 | 91,394 |
| Ayala Corp. | 134,196 | 812,006 |
| Ayala Land, Inc. | 3,951,800 | 854,472 |
| Banco De Oro | 701,020 | 508,840 |
| Bank of the Philippine Islands | 943,100 | 917,619 |
| Benpres Holdings Corp.(1) | 4,600,000 | 336,775 |
| Filinvest Land, Inc. | 3,449,000 | 64,929 |
| First Gen Corp.(1) | 709,950 | 234,085 |
| First Philippine Holdings Corp.(1) | 70,100 | 68,621 |
| Globe Telecom, Inc. | 18,040 | 345,879 |
| Holcim Philippines, Inc. | 1,492,000 | 150,299 |
| International Container Terminal Services, Inc. | 388,900 | 164,668 |
| JG Summit Holding, Inc. | 2,411,900 | 318,790 |
| Jollibee Foods Corp. | 363,300 | 386,475 |
| Manila Electric Co. | 300,400 | 1,167,999 |
| Manila Water Co. | 254,600 | 85,936 |
| Megaworld Corp. | 2,476,800 | 77,870 |
| Megaworld Corp.(4) | 619,200 | 19,468 |
| Metropolitan Bank & Trust Co. | 581,600 | 491,979 |
| Philex Mining Corp.(1) | 4,017,125 | 955,125 |
| Philippine Long Distance Telephone Co. | 45,620 | 2,451,816 |
| PNOC Energy Development Corp. | 4,051,000 | 349,865 |
| Robinsons Land Corp. | 411,400 | 104,465 |
| San Miguel Corp., Class B | 649,500 | 894,501 |
| SM Investments Corp. | 155,938 | 1,018,426 |
| SM Prime Holdings, Inc. | 3,202,799 | 664,142 |
| Universal Robina Corp. | 1,399,600 | 365,017 |
| Vista Land & Lifescapes, Inc.(1) | 3,675,000 | 150,164 |
|
| | | $ 15,404,574 |
|
|
| |
| Poland — 3.0% | | |
|
|
| Agora SA(1) | 79,030 | $ 518,594 |
| AmRest Holdings NV(1) | 4,410 | 107,338 |
| Bank Handlowy w Warszawie SA(1) | 14,170 | 310,753 |
| Bank Millennium SA(1) | 176,600 | 289,844 |
| Bank Pekao SA(1) | 58,138 | 3,120,511 |
| | |
| Security | Shares | Value |
|
| |
| Poland (continued) | | |
|
|
| Bank Zachodni WBK SA(1) | 10,600 | $ 565,886 |
| Bioton SA(1) | 3,980,100 | 313,063 |
| BRE Bank SA(1) | 6,003 | 556,501 |
| Budimex SA | 18,100 | 496,787 |
| Cersanit SA(1) | 87,100 | 426,276 |
| Cyfrowy Polsat SA | 111,200 | 536,839 |
| Debica SA | 2,520 | 53,964 |
| Dom Development SA | 7,570 | 115,187 |
| Echo Investment SA(1) | 150,000 | 215,121 |
| Eurocash SA | 63,000 | 307,539 |
| Farmacol SA(1) | 4,040 | 57,688 |
| Getin Holding SA(1) | 233,150 | 663,544 |
| Globe Trade Centre SA(1) | 53,590 | 462,378 |
| Grupa Kety SA(1) | 9,600 | 348,406 |
| Grupa Lotos SA(1) | 26,453 | 240,445 |
| ING Bank Slaski SA w Katowicach(1) | 1,685 | 378,117 |
| KGHM Polska Miedz SA | 64,080 | 2,156,973 |
| LPP SA(1) | 275 | 136,062 |
| Mondi Swiecie SA(1) | 9,600 | 234,439 |
| Mostostal-Warszawa SA(1) | 3,160 | 72,252 |
| Multimedia Polska SA(1) | 89,740 | 215,685 |
| Netia SA(1) | 401,654 | 584,635 |
| NG2 SA | 3,810 | 53,184 |
| Orbis SA(1) | 30,000 | 474,295 |
| PBG SA(1) | 11,720 | 912,886 |
| Polimex Mostostal SA | 636,500 | 818,440 |
| Polish Oil & Gas | 558,200 | 679,710 |
| Polnord SA(1) | 20,350 | 241,656 |
| Polski Koncern Naftowy Orlen SA(1) | 151,000 | 1,571,717 |
| Powszechna Kasa Oszczednosci Bank Polski SA | 264,710 | 3,136,546 |
| Przedsiebiorstwo Eksportu i Importu KOPEX SA(1) | 13,800 | 122,786 |
| Softbank SA | 68,173 | 1,369,739 |
| Telekomunikacja Polska SA | 767,350 | 4,503,355 |
| TVN SA | 260,420 | 1,290,525 |
| Vistula Group SA(1) | 400,000 | 301,202 |
| Zaklad Przetworstwa Hutniczego Stalprodukt SA | 1,900 | 346,937 |
|
| | | $ 29,307,805 |
|
|
| |
| Qatar — 1.6% | | |
|
|
| Aamal Holding | 60,200 | $ 525,728 |
| Barwa Real Estate Co.(1) | 40,993 | 383,063 |
| Commercial Bank of Qatar | 34,157 | 667,035 |
| Doha Bank, Ltd. | 33,176 | 424,558 |
| First Finance Co. | 53,357 | 329,536 |
| Gulf International Services QSC | 61,750 | 560,619 |
| Industries Qatar | 89,335 | 2,722,241 |
| Masraf Al Rayan | 223,300 | 759,237 |
See notes to financial statements
15
Eaton Vance Structured Emerging Markets Fund as of October 31, 2009
PORTFOLIO OF INVESTMENTS CO N T ’ D |
| | |
| Security | Shares | Value |
|
| |
| Qatar (continued) | | |
|
|
| Qatar Electricity & Water Co. | 37,000 | $ 1,012,144 |
| Qatar Fuel | 10,020 | 458,210 |
| Qatar Gas Transport Co., Ltd. (NAKILAT)(1) | 203,330 | 1,351,033 |
| Qatar Insurance Co. | 18,635 | 329,662 |
| Qatar International Islamic Bank | 27,943 | 346,564 |
| Qatar Islamic Bank | 34,387 | 775,102 |
| Qatar National Bank | 48,092 | 2,010,558 |
| Qatar National Cement Co. | 10,500 | 235,874 |
| Qatar National Navigation | 23,896 | 437,736 |
| Qatar Shipping Co. | 43,836 | 403,618 |
| Qatar Telecom QSC | 41,902 | 1,852,855 |
| Salam International Investment Co., Ltd. | 53,000 | 164,507 |
| United Development Co. | 4,780 | 49,645 |
|
| | | $ 15,799,525 |
|
|
| |
| Romania — 0.8% | | |
|
|
| Antibiotice SA | 409,100 | $ 92,221 |
| Banca Transilvania | 2,691,296 | 1,598,610 |
| Biofarm Bucuresti(1) | 7,119,988 | 479,804 |
| BRD-Group Societe Generale | 777,000 | 3,249,673 |
| Impact SA(1) | 253,290 | 46,914 |
| Rompetrol Rafinare SA(1) | 12,930,500 | 283,314 |
| SNP Petrom SA(1) | 15,699,400 | 1,375,514 |
| Transelectrica SA | 134,000 | 538,246 |
|
| | | $ 7,664,296 |
|
|
| |
| Russia — 6.2% | | |
|
|
| Aeroflot-Russian International Airlines | 229,000 | $ 313,405 |
| AvtoVAZ(1) | 263,394 | 133,071 |
| Cherepovets MK Severstal GDR(3) | 24,050 | 173,481 |
| Comstar United Telesystems GDR | 151,550 | 784,120 |
| CTC Media, Inc.(1) | 91,467 | 1,470,789 |
| Evraz Group SA GDR(1)(3) | 20,135 | 487,853 |
| Federal Grid Co. Unified Energy System JSC(1) | 10,725,782 | 113,490 |
| Gazprom OAO ADR | 53,450 | 1,290,818 |
| Holding MRSK OAO(1) | 911,500 | 106,499 |
| Irkutskenergo(1) | 327,400 | 150,139 |
| Irkutskenergo OJSC(1)(2) | 338,903 | 0 |
| JSC Severstal-Avto(1) | 9,262 | 142,808 |
| KamAZ(1) | 127,700 | 305,603 |
| LUKOIL ADR | 89,800 | 5,209,445 |
| Magnitogorsk Iron & Steel Works GDR(1)(3) | 32,100 | 303,262 |
| Mechel ADR | 22,400 | 384,384 |
| Mining & Metallurgical Co.(1) | 2,680 | 347,987 |
| MMC Norilsk Nickel ADR(1) | 151,400 | 1,989,231 |
| Mobile TeleSystems | 604,700 | 4,139,778 |
| | |
| Security | Shares | Value |
|
| |
| Russia (continued) | | |
|
|
| Mobile TeleSystems ADR | 2,200 | $ 99,660 |
| Mosenergo(1) | 971,603 | 87,494 |
| NovaTek OAO GDR(3) | 30,416 | 1,526,926 |
| Novolipetsk Steel GDR(1) | 21,400 | 560,680 |
| Novolipetsk Steel GDR(1)(3) | 6,536 | 170,238 |
| OAO Gazprom | 73,400 | 436,115 |
| OAO Gazprom ADR | 485,749 | 11,649,250 |
| OAO Rosneft Oil Co. GDR | 53,820 | 409,238 |
| OAO Seventh Continent(1) | 16,900 | 143,563 |
| OAO TMK GDR | 10,700 | 193,670 |
| OAO TMK GDR(3) | 2,500 | 45,162 |
| OGK-3(1) | 967,658 | 50,831 |
| OGK-4 OJSC(1) | 1,090,428 | 55,612 |
| Pegas Nonwovens SA | 11,200 | 263,098 |
| PIK Group GDR(1) | 44,400 | 175,090 |
| Polyus Gold ADR | 5,600 | 150,526 |
| RBC Information Systems(1) | 54,450 | 87,617 |
| Rosneft Oil Co. GDR | 166,000 | 1,269,900 |
| Rostelecom ADR | 30,400 | 1,187,120 |
| RusHydro(1) | 31,395,041 | 1,089,439 |
| Sberbank | 4,279,388 | 9,352,102 |
| Sberbank, PFC Shares | 539,250 | 812,104 |
| Sistema JSFC(1) | 104,800 | 66,155 |
| Sistema JSFC GDR(1) | 41,430 | 672,276 |
| Surgutneftegaz | 163,200 | 142,156 |
| Surgutneftegaz ADR | 332,960 | 2,938,969 |
| Surgutneftegaz, PFC Shares | 914,700 | 381,151 |
| Tatneft | 26,233 | 109,137 |
| Tatneft GDR | 61,566 | 1,594,367 |
| TGK-2(1) | 13,779,634 | 3,114 |
| TGK-4(1) | 16,839,141 | 5,490 |
| Transneft | 470 | 393,982 |
| Uralsvyazinform | 2,952,700 | 69,388 |
| Vimpel-Communications ADR | 150,740 | 2,702,768 |
| VTB Bank OJSC GDR(3) | 429,970 | 1,711,404 |
| Wimm-Bill-Dann Foods OJSC ADR(1) | 2,665 | 180,101 |
| X5 Retail Group NV GDR(1) | 62,194 | 1,485,530 |
|
| | | $ 60,117,586 |
|
|
| |
| Slovenia — 0.8% | | |
|
|
| Gorenje DD(1) | 8,720 | $ 167,037 |
| Istrabenz(1) | 3,000 | 31,980 |
| KRKA DD | 27,995 | 2,953,952 |
| Luka Koper(1) | 15,750 | 633,064 |
| Mercator Poslovni Sistem | 2,532 | 633,974 |
| Nova Kreditna Banka Maribor | 43,500 | 839,629 |
| Petrol | 880 | 432,452 |
See notes to financial statements
16
Eaton Vance Structured Emerging Markets Fund as of October 31, 2009
PORTFOLIO OF INVESTMENTS CO N T ’ D |
| | |
| Security | Shares | Value |
|
| |
| Slovenia (continued) | | |
|
|
| Sava DD | 940 | $ 276,405 |
| Telekom Slovenije DD | 3,270 | 717,615 |
| Zavarovalnica Triglav DD | 18,800 | 741,773 |
|
| | | $ 7,427,881 |
|
|
| |
| South Africa — 6.1% | | |
|
|
| ABSA Group, Ltd. | 55,150 | $ 873,021 |
| Adcock Ingram Holdings, Ltd. | 33,300 | 226,520 |
| Adcorp Holdings, Ltd. | 16,900 | 57,829 |
| AECI, Ltd. | 6,330 | 49,036 |
| African Bank Investments, Ltd. | 140,814 | 549,794 |
| African Rainbow Minerals, Ltd. | 19,600 | 379,487 |
| Allan Gray Property Trust | 84,300 | 68,534 |
| Allied Electronics Corp., Ltd. | 17,182 | 64,204 |
| Allied Electronics Corp., Ltd., PFC Shares | 69,600 | 240,052 |
| Anglo Platinum, Ltd.(1) | 10,280 | 888,571 |
| AngloGold Ashanti, Ltd. | 70,471 | 2,632,034 |
| Aquarius Platinum, Ltd.(1) | 41,700 | 177,824 |
| Aspen Pharmacare Holdings, Ltd.(1) | 91,031 | 767,196 |
| Aveng, Ltd. | 238,790 | 1,266,413 |
| AVI, Ltd. | 119,300 | 316,975 |
| Barloworld, Ltd. | 122,520 | 763,900 |
| Bidvest Group, Ltd. | 162,296 | 2,541,384 |
| Clicks Group, Ltd. | 89,300 | 282,488 |
| DataTec, Ltd. | 140,700 | 518,216 |
| Discovery Holdings, Ltd. | 101,945 | 405,125 |
| ElementOne, Ltd.(1) | 44,850 | 77,478 |
| FirstRand, Ltd. | 664,950 | 1,497,726 |
| Foschini, Ltd. | 68,500 | 542,114 |
| Gold Fields, Ltd. | 132,135 | 1,690,538 |
| Grindrod, Ltd. | 165,300 | 379,919 |
| Group Five, Ltd. | 81,460 | 416,818 |
| Growthpoint Properties, Ltd. | 217,000 | 384,041 |
| Harmony Gold Mining Co., Ltd. | 71,910 | 720,264 |
| Hyprop Investments, Ltd. | 67,500 | 391,739 |
| Illovo Sugar, Ltd. | 27,600 | 125,098 |
| Impala Platinum Holdings, Ltd. | 98,730 | 2,172,404 |
| Imperial Holdings, Ltd. | 62,680 | 645,301 |
| Investec, Ltd. | 72,500 | 535,015 |
| JD Group, Ltd. | 58,290 | 324,834 |
| JSE, Ltd. | 15,200 | 117,197 |
| Kumba Iron Ore, Ltd. | 14,960 | 446,662 |
| Kumba Resources, Ltd. | 38,610 | 433,687 |
| Lewis Group, Ltd. | 32,500 | 227,574 |
| Liberty Holdings, Ltd. | 44,700 | 386,474 |
| Massmart Holdings, Ltd. | 57,700 | 666,615 |
| Medi-Clinic Corp., Ltd. | 52,200 | 160,321 |
| | |
| Security | Shares | Value |
|
| |
| South Africa (continued) | | |
|
|
| Metropolitan Holdings, Ltd. | 162,100 | $ 274,459 |
| Mittal Steel South Africa, Ltd. | 29,277 | 393,992 |
| Mondi, Ltd. | 9,900 | 55,861 |
| Mr. Price Group, Ltd. | 72,100 | 329,877 |
| MTN Group, Ltd. | 645,340 | 9,608,619 |
| Murray & Roberts Holdings, Ltd. | 160,250 | 1,143,836 |
| Mvelaphanda Group, Ltd.(1) | 65,900 | 59,705 |
| Nampak, Ltd. | 171,938 | 372,959 |
| Naspers, Ltd., Class N | 83,492 | 3,013,933 |
| Nedbank Group, Ltd. | 46,830 | 703,954 |
| Netcare, Ltd.(1) | 280,550 | 413,178 |
| Northam Platinum, Ltd. | 14,400 | 67,294 |
| Pangbourne Properties, Ltd. | 28,800 | 60,098 |
| Pick’n Pay Holdings, Ltd. | 36,500 | 82,838 |
| Pick’n Pay Stores, Ltd. | 45,170 | 234,811 |
| Pretoria Portland Cement Co., Ltd. | 102,827 | 430,454 |
| Raubex Group, Ltd. | 93,000 | 291,210 |
| Redefine Income Fund, Ltd. | 475,000 | 436,597 |
| Remgro, Ltd. | 74,100 | 867,447 |
| Reunert, Ltd. | 111,160 | 782,985 |
| RMB Holdings, Ltd. | 174,300 | 636,339 |
| Sanlam, Ltd. | 344,190 | 944,976 |
| Santam, Ltd. | 5,583 | 71,900 |
| Sappi, Ltd. | 75,636 | 279,494 |
| Sasol, Ltd. | 90,950 | 3,407,468 |
| Shoprite Holdings, Ltd. | 80,000 | 651,914 |
| Spar Group, Ltd. | 54,600 | 481,506 |
| Standard Bank Group, Ltd. | 238,121 | 2,971,984 |
| Steinhoff International Holdings, Ltd. | 352,040 | 850,729 |
| Sun International, Ltd.(1) | 11,182 | 129,865 |
| Telkom South Africa, Ltd. | 115,950 | 649,643 |
| Tiger Brands, Ltd. | 40,100 | 802,941 |
| Truworths International, Ltd. | 92,400 | 528,865 |
| Vodacom Group (Pty), Ltd.(1) | 111,000 | 769,658 |
| Wilson Bayly Holmes-Ovcon, Ltd. | 28,100 | 406,869 |
| Woolworths Holdings, Ltd. | 160,409 | 358,148 |
|
| | | $ 58,976,828 |
|
|
| |
| South Korea — 6.0% | | |
|
|
| Amorepacific Corp. | 418 | $ 288,861 |
| Busan Bank | 15,470 | 175,415 |
| Cheil Industries, Inc. | 11,000 | 410,385 |
| CJ CheilJedang Corp. | 596 | 100,788 |
| CJ O Shopping Co., Ltd. | 1,580 | 104,364 |
| Daegu Bank | 7,550 | 100,173 |
| Daelim Industrial Co., Ltd. | 1,670 | 105,981 |
| Daewoo Engineering & Construction Co., Ltd. | 12,241 | 124,705 |
See notes to financial statements
17
Eaton Vance Structured Emerging Markets Fund as of October 31, 2009
PORTFOLIO OF INVESTMENTS CO N T ’ D |
| | |
| Security | Shares | Value |
|
| |
| South Korea (continued) | | |
|
|
| Daewoo International Corp. | 3,471 | $ 94,806 |
| Daewoo Motor Sales Corp.(1) | 23,045 | 191,263 |
| Daewoo Securities Co., Ltd. | 9,010 | 136,899 |
| Daewoo Shipbuilding & Marine Engineering Co., Ltd. | 18,880 | 248,336 |
| Dong-A Pharmaceutical Co., Ltd. | 3,320 | 322,845 |
| Dongbu Insurance Co., Ltd. | 1,640 | 49,763 |
| Dongkuk Steel Mill Co., Ltd. | 12,930 | 274,589 |
| Doosan Corp. | 3,160 | 219,138 |
| Doosan Heavy Industries & Construction Co., Ltd. | 2,570 | 137,919 |
| GLOVIS Co., Ltd. | 1,680 | 146,503 |
| GS Engineering & Construction Corp. | 3,290 | 288,507 |
| GS Holdings Corp. | 11,000 | 272,473 |
| Hana Financial Group, Inc. | 34,930 | 1,035,940 |
| Hanarotelecom, Inc.(1) | 28,346 | 116,533 |
| Hanjin Heavy Industries & Construction Co., Ltd. | 9,813 | 175,339 |
| Hanjin Shipping Co., Ltd. | 19,170 | 260,537 |
| Hankook Tire Co., Ltd. | 21,040 | 402,167 |
| Hanmi Pharm Co., Ltd. | 2,150 | 207,916 |
| Hanwha Chemical Corp. | 18,100 | 168,288 |
| Hanwha Corp. | 9,490 | 303,253 |
| Hite Brewery Co., Ltd. | 1,789 | 243,425 |
| Honam Petrochemical Corp. | 1,770 | 121,405 |
| Hynix Semiconductor, Inc.(1) | 57,940 | 860,208 |
| Hyosung Corp. | 4,500 | 247,326 |
| Hyundai Department Store Co., Ltd. | 6,215 | 594,062 |
| Hyundai Development Co. | 7,860 | 232,627 |
| Hyundai Engineering & Construction Co., Ltd. | 11,670 | 644,287 |
| Hyundai Heavy Industries Co., Ltd. | 6,105 | 836,221 |
| Hyundai Marine & Fire Insurance Co., Ltd. | 13,800 | 254,885 |
| Hyundai Merchant Marine Co., Ltd. | 20,100 | 412,051 |
| Hyundai Mipo Dockyard Co., Ltd. | 775 | 63,848 |
| Hyundai Mobis | 9,400 | 1,253,426 |
| Hyundai Motor Co. | 20,300 | 1,841,300 |
| Hyundai Securities Co., Ltd. | 25,370 | 288,043 |
| Hyundai Steel Co. | 8,400 | 533,619 |
| Industrial Bank of Korea(1) | 35,580 | 431,040 |
| Kangwon Land, Inc. | 23,740 | 317,206 |
| KB Financial Group, Inc.(1) | 41,611 | 2,001,484 |
| KB Financial Group, Inc. ADR(1) | 7,759 | 368,087 |
| KCC Corp. | 1,445 | 416,558 |
| Kia Motors Corp.(1) | 34,490 | 512,298 |
| Komipharm International Co., Ltd.(1) | 1,200 | 63,161 |
| Korea Electric Power Corp.(1) | 50,820 | 1,440,037 |
| Korea Exchange Bank | 42,760 | 485,928 |
| Korea Express Co., Ltd.(1) | 4,349 | 238,789 |
| Korea Gas Corp. | 5,680 | 239,662 |
| Korea Investment Holdings Co., Ltd. | 6,490 | 173,085 |
| Korea Line Corp. | 4,000 | 162,541 |
| | |
| Security | Shares | Value |
|
| |
| South Korea (continued) | | |
|
|
| Korea Zinc Co., Ltd. | 4,440 | $ 686,229 |
| Korean Air Lines Co., Ltd.(1) | 11,002 | 418,680 |
| Korean Reinsurance Co. | 37,903 | 342,461 |
| KT Corp. | 29,473 | 960,738 |
| KT Corp. ADR | 7,675 | 123,184 |
| KT&G Corp. | 14,095 | 820,860 |
| LG Chem, Ltd. | 6,598 | 1,137,036 |
| LG Corp. | 7,220 | 409,036 |
| LG Dacom Corp. | 4,150 | 65,538 |
| LG Display Co., Ltd. | 13,010 | 311,323 |
| LG Electronics, Inc. | 11,300 | 1,050,453 |
| LG Hausys, Ltd.(1) | 658 | 65,782 |
| LG Household & Health Care, Ltd. | 1,850 | 384,230 |
| LG Life Sciences, Ltd.(1) | 5,000 | 289,471 |
| LG Telecom, Ltd. | 36,265 | 271,706 |
| LIG Insurance Co., Ltd. | 12,400 | 254,032 |
| Lotte Shopping Co., Ltd. | 3,265 | 922,137 |
| LS Corp. | 3,530 | 288,402 |
| Macquarie Korea Infrastructure Fund | 31,415 | 132,264 |
| Mirae Asset Securities Co., Ltd. | 4,880 | 255,083 |
| Namhae Chemical Corp. | 15,250 | 188,626 |
| NCsoft Corp. | 1,350 | 144,376 |
| NHN Corp.(1) | 4,875 | 719,013 |
| Nong Shim Co., Ltd. | 1,400 | 284,204 |
| OCI Co., Ltd. | 2,370 | 416,369 |
| POSCO | 11,317 | 4,690,077 |
| S-Oil Corp. | 5,785 | 279,853 |
| S1 Corp. | 5,750 | 230,158 |
| Samsung Card Co., Ltd. | 14,060 | 557,054 |
| Samsung Corp. | 10,590 | 431,021 |
| Samsung Digital Imaging Co., Ltd.(1) | 4,494 | 181,512 |
| Samsung Electro-Mechanics Co., Ltd. | 7,100 | 590,329 |
| Samsung Electronics Co., Ltd. | 12,851 | 7,732,870 |
| Samsung Electronics Co., Ltd., PFC Shares | 1,928 | 772,339 |
| Samsung Engineering Co., Ltd. | 4,600 | 406,699 |
| Samsung Fine Chemicals Co., Ltd. | 8,450 | 334,841 |
| Samsung Fire & Marine Insurance Co., Ltd. | 5,885 | 1,071,505 |
| Samsung Heavy Industries Co., Ltd. | 22,310 | 422,043 |
| Samsung SDI Co., Ltd. | 4,500 | 513,732 |
| Samsung Securities Co., Ltd. | 6,340 | 310,763 |
| Samsung Techwin Co., Ltd. | 5,295 | 405,448 |
| Shinhan Financial Group Co., Ltd.(1) | 58,523 | 2,220,418 |
| Shinsegae Co., Ltd. | 1,422 | 613,932 |
| SK Chemicals Co., Ltd. | 2,160 | 117,752 |
| SK Energy Co., Ltd. | 9,599 | 881,653 |
| SK Holdings Co., Ltd. | 3,665 | 290,737 |
| SK Telecom Co., Ltd. | 8,200 | 1,248,848 |
| SK Telecom Co., Ltd. ADR | 9,450 | 157,910 |
See notes to financial statements
18
Eaton Vance Structured Emerging Markets Fund as of October 31, 2009
PORTFOLIO OF INVESTMENTS CO N T ’ D |
| | |
| Security | Shares | Value |
|
| |
| South Korea (continued) | | |
|
|
| STX Pan Ocean Co., Ltd. | 9,800 | $ 91,320 |
| Tong Yang Securities, Inc. | 5,665 | 51,903 |
| Woongjin Coway Co., Ltd. | 3,650 | 122,014 |
| Woori Finance Holdings Co., Ltd.(1) | 13,960 | 187,903 |
| Woori Investment & Securities Co., Ltd. | 17,000 | 213,708 |
| Yuhan Corp. | 1,786 | 288,540 |
|
| | | $ 58,098,410 |
|
|
| |
| Taiwan — 6.2% | | |
|
|
| Acer, Inc. | 280,626 | $ 661,474 |
| Advanced Semiconductor Engineering, Inc. | 434,677 | 342,587 |
| Altek Corp. | 94,560 | 160,200 |
| Ambassador Hotel | 58,000 | 58,803 |
| AmTRAN Technology Co., Ltd. | 72,630 | 69,028 |
| Asia Cement Corp. | 428,005 | 449,396 |
| Asia Optical Co., Inc. | 146,907 | 237,088 |
| Asustek Computer, Inc. | 434,193 | 797,463 |
| AU Optronics Corp. | 971,837 | 861,779 |
| BES Engineering Corp. | 297,000 | 82,338 |
| Capital Securities Corp.(1) | 143,055 | 66,329 |
| Catcher Technology Co., Ltd. | 97,647 | 236,382 |
| Cathay Financial Holding Co., Ltd.(1) | 1,120,765 | 1,921,961 |
| Chang Hwa Commercial Bank | 950,000 | 413,342 |
| Cheng Shin Rubber Industry Co., Ltd. | 293,491 | 603,087 |
| Chi Mei Optoelectronics Corp.(1) | 840,427 | 419,276 |
| Chicony Electronics Co., Ltd. | 40,419 | 88,391 |
| China Airlines, Ltd.(1) | 774,411 | 240,711 |
| China Development Financial Holding Corp.(1) | 1,982,376 | 516,412 |
| China Life Insurance Co., Ltd.(1) | 96,300 | 69,937 |
| China Motor Corp.(1) | 186,315 | 127,801 |
| China Petrochemical Development Corp.(1) | 820,800 | 293,711 |
| China Steel Corp. | 1,822,121 | 1,617,753 |
| Chinatrust Financial Holding Co., Ltd. | 1,345,421 | 808,158 |
| Chinese Maritime Transport, Ltd. | 26,000 | 68,321 |
| Chong Hong Construction Co., Ltd. | 34,270 | 62,365 |
| Chunghwa Picture Tubes, Ltd.(1) | 1,620,000 | 166,191 |
| Chunghwa Telecom Co., Ltd. | 998,177 | 1,752,066 |
| Chunghwa Telecom Co., Ltd. ADR | 28,347 | 492,671 |
| Clevo Co.(1) | 47,426 | 59,188 |
| Compal Electronics, Inc. | 474,066 | 592,679 |
| Coretronic Corp. | 62,505 | 68,437 |
| Delta Electronics, Inc. | 246,105 | 683,367 |
| Dynapack International Technology Corp. | 25,374 | 77,522 |
| E.Sun Financial Holding Co., Ltd.(1) | 807,478 | 314,318 |
| Elan Microelectronics Corp. | 165,300 | 223,816 |
| Epistar Corp. | 103,472 | 301,311 |
| EVA Airways Corp.(1) | 742,744 | 278,605 |
| | |
| Security | Shares | Value |
|
| |
| Taiwan (continued) | | |
|
|
| Evergreen International Storage & Transport Corp.(1) | 319,000 | $ 258,174 |
| Evergreen Marine Corp.(1) | 582,050 | 293,975 |
| Everlight Electronics Co., Ltd. | 97,642 | 266,920 |
| Far Eastern Department Stores, Ltd. | 597,915 | 614,239 |
| Far Eastern New Century Corp. | 386,556 | 455,833 |
| Far EasTone Telecommunications Co., Ltd. | 401,074 | 451,249 |
| Faraday Technology Corp. | 29,434 | 45,745 |
| Farglory Land Development Co., Ltd. | 20,252 | 40,688 |
| Federal Corp.(1) | 77,625 | 58,114 |
| Feng Hsin Iron & Steel Co., Ltd. | 183,260 | 277,075 |
| First Financial Holding Co., Ltd. | 862,645 | 498,342 |
| First Steamship Co., Ltd. | 171,771 | 217,107 |
| Formosa Chemicals & Fibre Corp. | 733,980 | 1,367,784 |
| Formosa International Hotels Corp. | 8,470 | 105,681 |
| Formosa Petrochemical Corp. | 375,320 | 915,242 |
| Formosa Plastics Corp. | 936,670 | 1,796,614 |
| Formosa Taffeta Co., Ltd. | 169,000 | 114,568 |
| Formosan Rubber Group, Inc. | 108,000 | 80,604 |
| Foxconn International Holdings, Ltd.(1) | 255,000 | 223,961 |
| Foxconn Technology Co., Ltd. | 81,259 | 270,700 |
| Fubon Financial Holding Co., Ltd.(1) | 1,124,000 | 1,247,225 |
| Giant Manufacturing Co., Ltd. | 144,120 | 373,723 |
| Goldsun Development & Construction Co., Ltd. | 151,011 | 68,316 |
| Great Wall Enterprise Co., Ltd. | 91,448 | 94,687 |
| Greatek Electronics, Inc. | 52,915 | 50,145 |
| HannStar Display Corp.(1) | 938,299 | 176,915 |
| Highwealth Construction Corp. | 63,705 | 79,120 |
| Hon Hai Precision Industry Co., Ltd. | 771,959 | 3,023,631 |
| Hotai Motor Co., Ltd. | 61,000 | 141,708 |
| HTC Corp. | 77,364 | 768,266 |
| Hua Nan Financial Holdings Co., Ltd. | 772,912 | 449,077 |
| Innolux Display Corp. | 271,920 | 358,149 |
| Inotera Memories, Inc.(1) | 379,000 | 223,927 |
| Inventec Appliances Corp. | 82,120 | 79,380 |
| Inventec Co., Ltd. | 585,200 | 323,729 |
| KGI Securities Co., Ltd. | 629,000 | 288,191 |
| Largan Precision Co., Ltd. | 13,795 | 157,992 |
| Lien Hwa Industrial Corp. | 113,019 | 51,751 |
| Lite-On Technology Corp. | 346,596 | 456,488 |
| Macronix International Co., Ltd. | 667,860 | 338,535 |
| Masterlink Securities Corp.(1) | 110,000 | 42,765 |
| MediaTek, Inc. | 117,196 | 1,640,273 |
| Mega Financial Holding Co., Ltd. | 1,311,000 | 730,067 |
| Merida Industry Co., Ltd. | 37,950 | 61,132 |
| Motech Industries, Inc. | 74,431 | 197,045 |
| Nan Kang Rubber Tire Co., Ltd.(1) | 120,900 | 120,373 |
| Nan Ya Plastics Corp. | 1,031,608 | 1,641,059 |
| Novatek Microelectronics Corp., Ltd. | 108,942 | 245,781 |
See notes to financial statements
19
Eaton Vance Structured Emerging Markets Fund as of October 31, 2009
PORTFOLIO OF INVESTMENTS CO N T ’ D |
| | |
| Security | Shares | Value |
|
| |
| Taiwan (continued) | | |
|
|
| Oriental Union Chemical Corp. | 331,300 | $ 227,743 |
| Pan-International Industrial Co., Ltd. | 148,484 | 216,364 |
| Phison Electronics Corp. | 14,305 | 95,755 |
| Polaris Securities Co., Ltd.(1) | 470,300 | 241,324 |
| Pou Chen Corp. | 630,705 | 432,425 |
| Powerchip Semiconductor Corp.(1) | 977,805 | 109,035 |
| Powertech Technology, Inc. | 118,969 | 325,668 |
| President Chain Store Corp. | 197,664 | 447,231 |
| Qisda Corp.(1) | 330,000 | 183,039 |
| Quanta Computer, Inc. | 315,508 | 596,835 |
| Radiant Opto-Electronics Corp. | 73,202 | 81,448 |
| Realtek Semiconductor Corp. | 115,670 | 245,887 |
| RichTek Technology Corp. | 34,741 | 266,545 |
| Ritek Corp.(1) | 252,000 | 60,045 |
| Ruentex Development Co., Ltd. | 71,000 | 79,621 |
| Ruentex Industries, Ltd.(1) | 276,000 | 450,491 |
| Sanyang Industrial Co., Ltd.(1) | 742,327 | 297,592 |
| Shih Wei Navigation Co., Ltd. | 39,923 | 54,656 |
| Shin Kong Financial Holding Co., Ltd.(1) | 906,589 | 368,853 |
| Shin Zu Shing Co., Ltd. | 20,450 | 93,462 |
| Shinkong Synthetic Fibers Corp. | 197,000 | 48,628 |
| Siliconware Precision Industries Co. | 355,243 | 467,052 |
| Simplo Technology Co., Ltd. | 58,520 | 300,498 |
| Sincere Navigation | 65,800 | 73,146 |
| Sino-American Silicon Products, Inc. | 98,196 | 212,557 |
| SinoPac Financial Holdings Co., Ltd.(1) | 1,418,000 | 523,687 |
| Solar Applied Materials Technology Corp. | 108,794 | 226,771 |
| Star Up Netcom Co., Ltd.(1)(2) | 34,320 | 0 |
| Synnex Technology International Corp. | 190,877 | 361,134 |
| TA Chen Stainless Pipe Co., Ltd.(1) | 53,000 | 36,312 |
| Tainan Spinning Co., Ltd.(1) | 220,000 | 81,199 |
| Taishin Financial Holdings Co., Ltd.(1) | 1,054,000 | 412,482 |
| Taiwan Business Bank(1) | 1,026,000 | 250,523 |
| Taiwan Cement Corp. | 535,994 | 549,901 |
| Taiwan Cooperative Bank | 539,330 | 318,225 |
| Taiwan Fertilizer Co., Ltd. | 145,000 | 450,150 |
| Taiwan Kolin Co., Ltd.(1)(2) | 177,000 | 0 |
| Taiwan Mobile Co., Ltd. | 467,427 | 835,969 |
| Taiwan Semiconductor Manufacturing Co., Ltd. | 2,664,465 | 4,833,331 |
| Taiwan Tea Corp.(1) | 361,095 | 205,314 |
| Tatung Co., Ltd.(1) | 1,526,000 | 336,091 |
| Teco Electric & Machinery Co., Ltd. | 482,000 | 191,884 |
| Transcend Information, Inc. | 19,826 | 62,007 |
| Tripod Technology Corp. | 43,401 | 108,601 |
| Tsann Kuen Enterprise Co., Ltd. | 22,880 | 47,135 |
| TSRC Corp. | 79,000 | 92,023 |
| Tung Ho Steel Enterprise Corp. | 243,060 | 231,039 |
| U-Ming Marine Transport Corp. | 186,000 | 337,361 |
| | |
| Security | Shares | Value |
|
| |
| Taiwan (continued) | | |
|
|
| Uni-President Enterprises Corp. | 820,843 | $ 915,888 |
| Unimicron Technology Corp. | 202,000 | 230,478 |
| United Microelectronics Corp.(1) | 1,574,090 | 756,686 |
| Walsin Lihwa Corp.(1) | 227,000 | 73,562 |
| Wan Hai Lines, Ltd.(1) | 215,250 | 99,028 |
| Waterland Financial Holdings(1) | 884,377 | 269,044 |
| Wei Chuan Food Corp.(1) | 165,000 | 214,769 |
| Wistron Corp. | 279,578 | 468,033 |
| WPG Holdings Co., Ltd. | 188,615 | 258,048 |
| Yageo Corp. | 230,000 | 63,390 |
| Yang Ming Marine Transport | 637,050 | 225,035 |
| Yieh Phui Enterprise | 968,880 | 314,315 |
| Yuanta Financial Holding Co., Ltd. | 1,220,225 | 805,261 |
| Yuen Foong Yu Paper Manufacturing Co., Ltd.(1) | 266,464 | 95,401 |
| Yulon Motor Co., Ltd. | 334,809 | 374,490 |
| Zinwell Corp. | 44,871 | 77,182 |
|
| | | $ 59,773,978 |
|
|
| |
| Thailand — 3.3% | | |
|
|
| Advanced Info Service PCL(5) | 1,040,600 | $ 2,895,312 |
| Airports of Thailand PCL(5) | 491,000 | 565,550 |
| Asian Property Development PCL(5) | 2,397,500 | 401,675 |
| Bangkok Bank PCL | 252,500 | 834,882 |
| Bangkok Bank PCL(5) | 101,800 | 341,437 |
| Bangkok Dusit Medical Services PCL(5) | 284,400 | 205,908 |
| Bangkok Expressway PCL(5) | 127,000 | 69,912 |
| Bank of Ayudhya PCL(5) | 1,442,400 | 785,633 |
| Banpu PCL(5) | 62,400 | 802,288 |
| BEC World PCL(5) | 1,567,600 | 1,050,538 |
| Big C Supercenter PCL(5) | 42,900 | 53,906 |
| Bumrungrad Hospital PCL(5) | 415,500 | 344,955 |
| Cal-Comp Electronics (Thailand) PCL(5) | 613,900 | 63,915 |
| Central Pattana PCL(5) | 249,600 | 162,044 |
| Ch. Karnchang PCL(5) | 892,200 | 160,156 |
| Charoen Pokphand Foods PCL(5) | 4,153,900 | 1,199,256 |
| CP ALL PCL(5) | 2,981,100 | 1,694,567 |
| Delta Electronics (Thailand) PCL(5) | 1,087,100 | 562,658 |
| Electricity Generating PCL(5) | 207,400 | 469,552 |
| G J Steel PCL(1)(5) | 8,819,100 | 60,685 |
| Glow Energy PCL | 470,700 | 450,633 |
| Hana Microelectronics PCL(5) | 530,700 | 295,318 |
| IRPC PCL(5) | 5,180,100 | 595,111 |
| Italian-Thai Development PCL(1)(5) | 1,858,000 | 176,767 |
| Kasikornbank PCL(5) | 526,000 | 1,275,155 |
| Khon Kaen Sugar Industry PCL | 897,000 | 335,452 |
| Kim Eng Securities Thailand PCL(5) | 134,000 | 52,518 |
| Krung Thai Bank PCL(5) | 692,000 | 182,187 |
See notes to financial statements
20
Eaton Vance Structured Emerging Markets Fund as of October 31, 2009
PORTFOLIO OF INVESTMENTS CO N T ’ D |
| | |
| Security | Shares | Value |
|
| |
| Thailand (continued) | | |
|
|
| Land & Houses PCL | 1,242,800 | $ 207,080 |
| Land & Houses PCL(5) | 1,350,700 | 241,570 |
| Loxley PCL(1)(5) | 1,072,600 | 80,224 |
| LPN Development PCL(5) | 400,000 | 83,770 |
| Major Cineplex Group PCL(5) | 182,300 | 39,814 |
| Minor International PCL(5) | 2,325,270 | 685,233 |
| Precious Shipping PCL(5) | 258,800 | 143,240 |
| PTT Aromatics & Refining PCL(5) | 587,652 | 374,480 |
| PTT Chemical PCL(5) | 159,800 | 298,803 |
| PTT Exploration & Production PCL(5) | 584,300 | 2,534,734 |
| PTT PCL(5) | 429,260 | 2,966,614 |
| Quality House PCL(5) | 2,038,700 | 152,483 |
| Ratchaburi Electricity Generating Holding PCL(5) | 278,700 | 308,509 |
| Samart Corp. PCL | 366,600 | 66,355 |
| Siam Cement PCL | 113,600 | 703,828 |
| Siam Cement PCL(5) | 36,800 | 222,245 |
| Siam City Bank PCL(5) | 159,500 | 113,093 |
| Siam City Cement PCL(5) | 47,690 | 315,318 |
| Siam Commercial Bank PCL(5) | 767,800 | 1,774,497 |
| Siam Makro PCL(5) | 35,000 | 83,508 |
| Sino Thai Engineering & Construction PCL(1)(5) | 2,479,500 | 493,304 |
| Thai Airways International PCL(1)(5) | 256,300 | 151,825 |
| Thai Beverage PCL | 4,106,000 | 744,465 |
| Thai Oil PCL(5) | 451,500 | 557,199 |
| Thai Tap Water Supply Co., Ltd | 1,710,000 | 210,776 |
| Thai Union Frozen Products PCL(5) | 400,100 | 332,170 |
| Thanachart Capital PCL(5) | 263,400 | 155,242 |
| Thoresen Thai Agencies PCL(5) | 424,160 | 339,455 |
| TMB Bank PCL(1)(5) | 8,975,900 | 295,392 |
| Total Access Communication PCL | 474,800 | 551,390 |
| TPI Polene PCL(1) | 432,000 | 124,075 |
| True Corp. PCL(1)(5) | 4,165,100 | 431,152 |
|
| | | $ 31,869,813 |
|
|
| |
| Turkey — 3.0% | | |
|
|
| Adana Cimento Sanayii TAS | 15,371 | $ 62,517 |
| Akbank TAS | 418,950 | 2,263,070 |
| Akcansa Cimento AS | 16,400 | 64,948 |
| Akenerji Elektrik Uretim AS | 18,300 | 164,224 |
| Aksa Akrilik Kimya Sanayii AS(1) | 60,209 | 64,838 |
| Aksigorta AS | 40,300 | 121,710 |
| Anadolu Efes Biracilik ve Malt Sanayii AS | 157,739 | 1,802,134 |
| Arcelik AS(1) | 393,854 | 1,286,189 |
| Asya Katilim Bankasi AS(1) | 300,000 | 620,499 |
| Aygaz AS | 27,013 | 95,686 |
| BIM Birlesik Magazalar AS | 26,630 | 965,499 |
| Cimsa Cimento Sanayi ve Ticaret AS | 18,200 | 78,637 |
| | |
| Security | Shares | Value |
|
| |
| Turkey (continued) | | |
|
|
| Dogan Sirketler Grubu Holding AS(1) | 1,219,509 | $ 802,313 |
| Dogan Yayin Holding AS(1) | 92,474 | 64,319 |
| Eczacibasi Ilac Sanayi ve Ticaret AS | 127,500 | 131,769 |
| Enka Insaat ve Sanayi AS | 268,348 | 1,082,879 |
| Eregli Demir ve Celik Fabrikalari TAS(1) | 571,481 | 1,551,368 |
| Ford Otomotiv Sanayi AS | 24,800 | 155,963 |
| Haci Omer Sabanci Holding AS | 161,763 | 591,405 |
| Hurriyet Gazetecilik ve Matbaacilik AS(1) | 128,238 | 136,721 |
| Ihlas Holding AS(1) | 299,200 | 100,951 |
| Is Gayrimenkul Yatirim Ortakligi AS | 136,465 | 143,473 |
| Kardemir Karabuk Demir Celik Sanayi ve Ticaret AS, | | |
| Class D(1) | 1,355,360 | 536,293 |
| KOC Holding AS(1) | 634,634 | 1,616,700 |
| Koza Davetiyeleri(1) | 33,000 | 85,685 |
| Petkim Petrokimya Holding AS(1) | 119,300 | 575,123 |
| Petrol Ofisi AS(1) | 32,978 | 123,042 |
| Tekfen Holding AS(1) | 203,217 | 581,885 |
| Tofas Turk Otomobil Fabrikasi AS | 34,700 | 87,179 |
| Trakya Cam Sanayii AS(1) | 144,992 | 170,486 |
| Tupras-Turkiye Petrol Rafinerileri AS | 86,870 | 1,492,078 |
| Turcas Petrolculuk AS | 30,939 | 94,585 |
| Turk Hava Yollari Anonim Ortakligi (THY) AS | 140,500 | 392,243 |
| Turk Sise ve Cam Fabrikalari AS(1) | 520,300 | 546,026 |
| Turk Telekomunikasyon AS | 241,000 | 731,508 |
| Turkcell Iletisim Hizmetleri AS | 386,800 | 2,559,207 |
| Turkiye Garanti Bankasi AS | 843,000 | 3,061,389 |
| Turkiye Halk Bankasi AS | 115,500 | 691,226 |
| Turkiye Is Bankasi | 343,256 | 1,300,021 |
| Turkiye Vakiflar Bankasi TAO(1) | 226,200 | 548,552 |
| Ulker Gida Sanayi ve Ticaret AS | 25,959 | 60,722 |
| Yapi ve Kredi Bankasi AS(1) | 486,385 | 1,000,025 |
| Yazicilar Holding AS | 21,200 | 128,530 |
| Zorlu Enerji Elektrik Uretim AS(1) | 91,054 | 173,988 |
|
| | | $ 28,907,605 |
|
|
| |
| United Arab Emirates — 1.5% | | |
|
|
| Aabar Petroleum Investments Co. (PJSC)(1) | 1,512,000 | $ 1,061,311 |
| Abu Dhabi Commercial Bank | 592,000 | 314,009 |
| Abu Dhabi National Hotels | 326,200 | 395,211 |
| Air Arabia | 2,037,000 | 618,157 |
| Ajman Bank (PJSC)(1) | 634,400 | 185,478 |
| Aldar Properties (PJSC) | 533,600 | 843,411 |
| Amlak Finance (PJSC)(1) | 227,500 | 68,997 |
| Arabtec Holding Co.(1) | 960,300 | 839,349 |
| Aramex (PJSC)(1) | 893,182 | 397,692 |
| Dana Gas(1) | 3,726,200 | 1,160,396 |
| DP World, Ltd. | 3,916,300 | 1,929,573 |
See notes to financial statements
21
Eaton Vance Structured Emerging Markets Fund as of October 31, 2009
PORTFOLIO OF INVESTMENTS CO N T ’ D
| | |
| Security | Shares | Value |
|
| |
| United Arab Emirates (continued) | |
|
|
| Dubai Financial Market | 1,113,000 | $ 706,987 |
| Dubai Investments (PJSC) | 583,777 | 200,100 |
| Dubai Islamic Bank | 248,474 | 199,618 |
| Emaar Properties (PJSC)(1) | 1,754,100 | 2,082,689 |
| Emirates NBD (PJSC) | 381,700 | 455,596 |
| First Gulf Bank (PJSC) | 146,700 | 748,273 |
| Gulf Navigation Holding | 1,850,000 | 377,951 |
| National Bank of Abu Dhabi (PJSC) | 250,250 | 907,739 |
| National Central Cooling Co. (Tabreed)(1) | 743,356 | 194,110 |
| Ras Al Khaimah Cement Co. | 327,000 | 110,355 |
| Ras Al Khaimah Co.(1) | 490,450 | 133,664 |
| Ras Al Khaimah Properties (PJSC) | 1,144,000 | 230,979 |
| Sorouh Real Estate Co. | 388,500 | 375,807 |
| Union National Bank | 359,700 | 369,694 |
| Union Properties (PJSC)(1) | 290,158 | 77,729 |
| Waha Capital (PJSC) | 196,900 | 48,838 |
|
| | | $ 15,033,713 |
|
|
| |
| Vietnam — 0.6% | | |
|
|
| FPT Corp. | 58,800 | $ 277,428 |
| Kinh Bac City Development Share Holding Corp.(1) | 135,000 | 538,383 |
| PetroVietnam Drilling and Well Services JSC | 39,000 | 198,116 |
| Petrovietnam Fertilizer and Chemical JSC | 135,900 | 330,773 |
| Pha Lai Thermal Power JSC(1) | 136,990 | 199,001 |
| Saigon Securities, Inc. | 274,300 | 1,443,504 |
| Songda Urban & Industrial Zone Investment and | | |
| Development JSC | 61,300 | 635,247 |
| Viet Nam Construction and Import-Export JSC | 190,900 | 671,340 |
| Vietnam Dairy Products JSC | 211,000 | 1,017,391 |
| Vincom JSC | 71,795 | 335,815 |
| Vinh Son - Song Hinh Hydropower JSC | 130,000 | 264,796 |
|
| | | $ 5,911,794 |
|
|
| |
| Total Common Stocks | | |
| (identified cost $878,946,098) | | $942,129,560 |
|
|
|
| |
| Convertible Bonds — 0 . 0% | | |
| |
| | Principal | |
| Security | Amount | Value |
|
| |
| Oman — 0.0% | | |
|
|
| Bank Muscat SAOG, 7.00%, 3/20/14 | OMR 10,672 | $ 25,443 |
|
| |
| Total Convertible Bonds | | |
| (identified cost $0) | | $ 25,443 |
|
|
|
| | | |
| Equity-Linke d Securitie s | — 0.7% | | |
| |
| | Maturity | | |
| Security | Date | Shares | Value |
|
| |
| Saudi Arabia — 0.7% | | | |
|
|
| Al Rajhi Bank (HSBC Bank plc)(6)(7) | 4/30/12 | 35,493 | $ 716,976 |
| Alinma Bank (HSBC Bank plc)(1)(6)(7) | 6/4/12 | 53,800 | 196,553 |
| Almarai Co., Ltd. (HSBC Bank plc)(1)(6)(7) | 3/27/12 | 5,000 | 226,673 |
| Arab National Bank (HSBC Bank plc)(1)(6)(7) | 6/4/12 | 15,700 | 195,941 |
| Banque Saudi Fransi (HSBC Bank plc)(1)(6)(7) | 4/30/12 | 16,484 | 198,693 |
| Dar Al Arkan Real Estate Development Co. | | | |
| (HSBC Bank plc)(1)(6)(7) | 8/13/12 | 58,000 | 258,303 |
| Etihad Etisalat Co. (HSBC Bank plc)(1)(6)(7) | 4/2/12 | 45,162 | 540,756 |
| Jarir Marketing Co. (HSBC Bank plc)(1)(6)(7) | 6/4/12 | 6,500 | 234,873 |
| Mobile Telecommunications Co. | | | |
| (HSBC Bank plc)(1)(6)(7) | 6/4/12 | 72,000 | 208,325 |
| National Industrialization C | | | |
| (HSBC Bank plc)(1)(6)(7) | 5/14/12 | 37,300 | 270,556 |
| Rabigh Refining and Petrochemicals Co. | | | |
| (HSBC Bank plc)(1)(6)(7) | 4/2/12 | 21,500 | 216,152 |
| Riyad Bank (HSBC Bank plc)(6)(7) | 6/11/12 | 32,800 | 251,035 |
| Samba Financial Group (HSBC Bank plc)(6)(7) | 4/30/12 | 15,208 | 223,057 |
| Saudi Arabian Fertilizer Co. | | | |
| (HSBC Bank plc)(6)(7) | 6/4/12 | 6,650 | 207,485 |
| Saudi Basic Industries Corp. | | | |
| (HSBC Bank plc)(1)(6)(7) | 3/26/12 | 33,596 | 732,413 |
| Saudi British Bank (HSBC Bank plc)(1)(6)(7) | 10/2/12 | 16,800 | 231,847 |
| Saudi Cable Co. (HSBC Bank plc)(1)(6)(7) | 9/21/12 | 30,000 | 232,005 |
| Saudi Electricity Co. (HSBC Bank plc)(1)(6)(7) | 6/25/12 | 80,000 | 237,872 |
| Saudi Industrial Investment Group, | | | |
| (HSBC Bank plc)(6)(7) | 6/11/12 | 40,000 | 265,608 |
| Saudi International Petrochemicals Co. | | | |
| (HSBC Bank plc)(1)(6)(7) | 9/21/12 | 37,000 | 238,287 |
| Saudi Kayan Petrochemical Co. | | | |
| (HSBC Bank plc)(1)(6)(7) | 6/4/12 | 49,000 | 247,622 |
| Saudi Telecom Co. (HSBC Bank plc)(6)(7) | 5/21/12 | 24,000 | 309,127 |
| Savola (HSBC Bank plc)(6)(7) | 4/20/12 | 61,000 | 484,761 |
|
| |
| Total Equity-Linked Securities | | |
| (identified cost $6,139,328) | | | $ 6,924,920 |
|
|
|
| |
| |
| Inve stme nt Funds — 0.4% | | |
| |
| Security | Shares | Value |
|
|
|
| Saudi Arabia Investment Fund, Ltd. | 31,546 | $ 1,236,603 |
| Vietnam Enterprise Investments, Ltd.(1) | 1,359,727 | 2,719,454 |
|
| |
| Total Investment Funds | | | |
| (identified cost $7,036,614) | | | $ 3,956,057 |
|
|
|
See notes to financial statements
22
Eaton Vance Structured Emerging Markets Fund as of October 31, 2009
PORTFOLIO OF INVESTMENTS CO N T ’ D |
| | |
| Rights — 0.0% | | |
| Security | Shares | Value |
|
| Empresas La Polar, Exp. 11/27/09(1) | 20,334 | $ 8,043 |
|
| |
| Total Rights (identified cost $0) | | $ 8,043 |
|
|
|
| |
| Warrants — 0. 0% | | |
| Security | Shares | Value |
|
| Bangkok Land PCL, Exp. 5/2/13, strike THB 1.10(1) | 310,077 | $ 1,484 |
|
| |
| Total Warrants (identified cost $0) | $ 1,484 |
|
| |
| Short-Term Investments — 1.1% | |
| | Principal | |
| Security | Amount | Value |
|
| State Street Bank & Trust Repurchase Agreement, | | |
| dated 10/30/09, with a maturity date of | | |
| 11/2/09, an interest rate of 0.01%, and | | |
| repurchased proceeds of $10,730,009; | | |
| collateralized by Federal Home Loan Bank bond | | |
| with an interest rate of 4.375%, a maturity date | | |
| of 9/17/10 and a market value of | | |
| $10,946,988 | $10,730,000 | $ 10,730,000 |
|
| |
| Total Short-Term Investments | | |
| (identified cost $10,730,000) | | $ 10,730,000 |
|
|
|
| |
| Total Investments — 99.5% | | |
| (identified cost $902,852,040) | | $963,775,507 |
|
|
|
| |
| Other Assets, Less Liabilities — 0.5% | $ 4,813,852 |
|
| |
| Net Assets — 100.0% | | $968,589,359 |
|
|
|
The percentage shown for each investment category in the Portfolio of Investments is based on net assets.
ADR - American Depositary Receipt
GDR - Global Depositary Receipt
PCL - Public Company Ltd.
PFC Shares - Preference Shares
OMR - Omani Rial |
(1) Non-income producing security.
(2) Security valued at fair value using methods determined in good faith by or at the direction of the Trustees.
(3) Security exempt from registration under Regulation S of the Securities Act of 1933, which exempts from registration securities offered and sold outside the United States. Security may not be offered or sold in the United States except pursuant to an exemption from, or in a transaction not subject to, the registration requirements of the Securities Act of 1933.
(4) Security acquired in a delayed delivery transaction.
(5) Indicates a foreign registered security. Shares issued to foreign investors in markets that have foreign ownership limits.
(6) Security exempt from registration under Rule 144A of the Securities Act of 1933. These securities may be sold in transactions exempt from registration, normally to qualified institutional buyers. At October 31, 2009, the aggregate value of these securities is $6,924,920 or 0.7% of the Fund’s net assets.
(7) Security whose performance, including redemption at maturity, is linked to the price of the underlying equity security. The investment is subject to credit risk of the issuing financial institution in addition to the market risk of the underlying security.
| | | |
| Currency Concentration of Portfolio | |
| |
| | | Percentage | |
| Currency | | of Net Assets | Value |
|
|
|
| United States Dollar | | 13.6% | $132,044,749 |
| Mexican Peso | | 6.2 | 59,637,127 |
| New Taiwan Dollar | | 6.1 | 59,057,346 |
| South African Rand | | 6.1 | 58,799,004 |
| Brazilian Real | | 6.1 | 58,655,229 |
| South Korean Won | | 5.9 | 57,357,909 |
| Indian Rupee | | 5.9 | 56,731,905 |
| Hong Kong Dollar | | 5.8 | 56,107,674 |
| Thailand Baht | | 3.2 | 30,575,442 |
| Chilean Peso | | 3.1 | 30,202,785 |
| Malaysian Ringgit | | 3.1 | 30,034,998 |
| Polish Zloty | | 3.0 | 29,307,805 |
| New Turkish Lira | | 3.0 | 28,907,605 |
| Indonesian Rupiah | | 3.0 | 28,834,751 |
| Hungarian Forint | | 2.1 | 20,705,120 |
| Czech Koruna | | 1.9 | 18,312,608 |
| Israeli Shekel | | 1.6 | 15,841,108 |
| Qatari Riyal�� | | 1.6 | 15,799,525 |
| Philippine Peso | | 1.6 | 15,404,573 |
| Moroccan Dirham | | 1.6 | 15,043,184 |
| Euro | | 1.5 | 14,910,081 |
| Egyptian Pound | | 1.5 | 14,487,547 |
| United Arab Emirates Dirham | | 1.3 | 13,104,140 |
| Other currency, less than 1% each | | 10.7 | 103,913,292 |
|
|
|
| Total Investments | | 99.5% | $963,775,507 |
|
|
|
See notes to financial statements
23
Eaton Vance Structured Emerging Markets Fund as of October 31, 2009
PORTFOLIO OF INVESTMENTS CO N T ’ D
Industry Classification of Portfolio
| | |
| | Percentage | |
| Sector | of Net Assets | Value |
|
| Financials | 24.3% | $235,595,107 |
| Telecommunication Services | 11.1 | 106,893,157 |
| Industrials | 10.5 | 101,276,070 |
| Materials | 10.4 | 100,685,107 |
| Energy | 9.7 | 94,381,194 |
| Consumer Discretionary | 7.3 | 70,989,052 |
| Consumer Staples | 6.9 | 67,002,855 |
| Information Technology | 6.0 | 58,248,021 |
| Diversified | 4.5 | 43,949,933 |
| Utilities | 4.2 | 40,244,041 |
| Health Care | 3.1 | 29,789,943 |
| Other | 1.1 | 10,764,970 |
| Investment Funds | 0.4 | 3,956,057 |
|
| Total Investments | 99.5% | $963,775,507 |
|
See notes to financial statements
24
Eaton Vance Structured Emerging Markets Fund as of October 31, 200
FINANCIAL STATEMENTS
Statement of Assets and Liabilities
| |
| As of October 31, 2009 | |
| Assets | |
|
|
| Investments, at value (identified cost, $902,852,040) | $963,775,507 |
| Cash | 5,497 |
| Foreign currency, at value (identified cost, $1,953,104) | 1,944,970 |
| Dividends and interest receivable | 1,026,104 |
| Receivable for investments sold | 51,750 |
| Receivable for Fund shares sold | 10,548,650 |
| Tax reclaims receivable | 8,634 |
| Receivable from affiliates | 30,547 |
|
| Total assets | $977,391,659 |
|
| Liabilities | |
|
|
| Payable for investments purchased | $ 4,894,242 |
| Payable for delayed delivery transactions | 6,502 |
| Payable for Fund shares redeemed | 1,869,913 |
| Payable to affiliates: | |
| Investment adviser fee | 692,201 |
| Administration fee | 125,833 |
| Distribution and service fees | 38,229 |
| Trustees’ fees | 2,320 |
| Accrued foreign capital gains taxes | 448,412 |
| Accrued expenses | 724,648 |
|
| Total liabilities | $ 8,802,300 |
|
| Net Assets | $968,589,359 |
|
| Sources of Net Assets | |
|
|
| Paid-in capital | $949,007,967 |
| Accumulated net realized loss | (48,580,158) |
| Accumulated undistributed net investment income | 7,642,943 |
| Net unrealized appreciation | 60,518,607 |
|
| Total | $968,589,359 |
|
| Class A Shares | |
|
|
| Net Assets | $104,727,302 |
| Shares Outstanding | 8,421,570 |
| Net Asset Value and Redemption Price Per Share | |
| (net assets shares of beneficial interest outstanding) | $ 12.44 |
| Maximum Offering Price Per Share | |
| (100 94.25 of net asset value per share) | $ 13.20 |
|
| Class C Shares | |
|
|
| Net Assets | $ 16,917,666 |
| Shares Outstanding | 1,377,649 |
| Net Asset Value and Offering Price Per Share* | |
| (net assets shares of beneficial interest outstanding) | $ 12.28 |
|
| Class I Shares | |
|
|
| Net Assets | $846,944,391 |
| Shares Outstanding | 67,971,456 |
| Net Asset Value, Offering Price and Redemption Price Per Share | |
| (net assets shares of beneficial interest outstanding) | $ 12.46 |
|
| On sales of $50,000 or more, the offering price of Class A shares is reduced. |
| * Redemption price per share is equal to the net asset value less any applicable contingent |
| deferred sales charge. | |
Statement of Operations | |
| | |
| For the Year Ended | |
| October 31, 2009 | |
| Investment Income | |
|
|
| Dividends (net of foreign taxes, $1,679,614) | $ 16,513,120 |
| Interest | 260 |
|
| Total investment income | $ 16,513,380 |
|
| Expenses | |
|
|
| Investment adviser fee | $ 4,772,724 |
| Administration fee | 854,671 |
| Distribution and service fees | |
| Class A | 189,851 |
| Class C | 108,667 |
| Trustees’ fees and expenses | 23,904 |
| Custodian fee | 1,526,420 |
| Transfer and dividend disbursing agent fees | 249,988 |
| Legal and accounting services | 89,800 |
| Printing and postage | 67,080 |
| Registration fees | 88,241 |
| Miscellaneous | 45,018 |
|
| Total expenses | $ 8,016,364 |
|
| Deduct — | |
| Reduction of custodian fee | $ 312 |
| Allocation of expenses to affiliates | 101,012 |
|
| Total expense reductions | $ 101,324 |
|
| Net expenses | $ 7,915,040 |
|
| Net investment income | $ 8,598,340 |
|
| Realized and Unrealized Gain (Loss) | |
|
|
| Net realized gain (loss) — | |
| Investments transactions, net of foreign capital gains taxes | |
| of $27,757 | $ (42,401,184) |
| Foreign currency transactions | (881,729) |
|
| Net realized loss | $ (43,282,913) |
|
| Change in unrealized appreciation (depreciation) — | |
| Investments, net of increase in accrued foreign capital gains taxes | |
| of $448,345 | $322,447,722 |
| Foreign currency | 165,934 |
|
| Net change in unrealized appreciation (depreciation) | $322,613,656 |
|
| Net realized and unrealized gain | $279,330,743 |
|
| Net increase in net assets from operations | $287,929,083 |
|
See notes to financial statements
25
Eaton Vance Structured Emerging Markets Fund as of October 31, 2009
FINANCIAL STATEMENTS CON T ’ D
Statements of Changes in Net Assets |
| | |
| Increase (Decrease) | Year Ended | Year Ended |
| in Net Assets | October 31, 2009 | October 31, 2008 |
|
| From operations — | | |
| Net investment income | $ 8,598,340 | $ 6,568,060 |
| Net realized loss from investment and | | |
| foreign currency transactions | (43,282,913) | (6,600,278) |
| Net change in unrealized appreciation | | |
| (depreciation) from investments and | | |
| foreign currency | 322,613,656 | (331,473,357) |
|
| Net increase (decrease) in net assets from | | |
| operations | $ 287,929,083 | $ (331,505,575) |
|
| Distributions to shareholders — | | |
| From net investment income | | |
| Class A | $ (624,412) | $ (471,949) |
| Class C | (11,551) | (25,778) |
| Class I | (4,282,038) | (1,661,688) |
| From net realized gain | | |
| Class A | — | (531,214) |
| Class C | — | (66,805) |
| Class I | — | (1,583,872) |
|
| Total distributions to shareholders | $ (4,918,001) | $ (4,341,306) |
|
| Transactions in shares of beneficial | | |
| interest — | | |
| Proceeds from sale of shares | | |
| Class A | $ 51,867,958 | $ 101,864,082 |
| Class C | 6,034,674 | 13,401,394 |
| Class I | 468,912,908 | 316,476,690 |
| Net asset value of shares issued to | | |
| shareholders in payment of | | |
| distributions declared | | |
| Class A | 535,855 | 889,210 |
| Class C | 8,492 | 58,770 |
| Class I | 2,225,488 | 2,075,352 |
| Cost of shares redeemed | | |
| Class A | (55,161,766) | (40,412,113) |
| Class C | (3,379,341) | (4,043,712) |
| Class I | (147,551,579) | (57,995,706) |
| Redemption fees | 48,379 | 22,156 |
|
| Net increase in net assets from Fund share | | |
| transactions | $ 323,541,068 | $ 332,336,123 |
|
| Net increase (decrease) in net assets | $ 606,552,150 | $ (3,510,758) |
|
| | |
| | Year Ended | Year Ended |
| Net Assets | October 31, 2009 | October 31, 2008 |
|
| At beginning of year | $ 362,037,209 | $ 365,547,967 |
|
| At end of year | $ 968,589,359 | $ 362,037,209 |
|
| |
| Accumulated undistributed | | |
| net investment income | | |
| included in net assets | | |
|
|
| At end of year | $ 7,642,943 | $ 4,833,026 |
|
See notes to financial statements
26
Eaton Vance Structured Emerging Markets Fund as of October 31, 2009
FINANCIAL STATEMENTS CON T ’ D
Financial Highlights |
| | | | |
| | Class A |
| |
|
| | Year Ended October 31, | Period Ended |
| |
|
| | 2009 | 2008 | 2007 | October 31, 2006(1) |
|
|
| Net asset value — Beginning of period | $ 8.290 | $17.500 | $11.150 | $10.000 |
|
| |
| Income (Loss) From Operations | | | | |
|
|
| Net investment income(2) | $ 0.121 | $ 0.190 | $ 0.110 | $ 0.010 |
| Net realized and unrealized gain (loss) | 4.120 | (9.216) | 6.215 | 1.140 |
|
| Total income (loss) from operations | $ 4.241 | $ (9.026) | $ 6.325 | $ 1.150 |
|
| |
| Less Distributions | | | | |
|
|
| From net investment income | $ (0.092) | $ (0.087) | $ — | $ — |
| From net realized gain | — | (0.098) | — | — |
|
| Total distributions | $ (0.092) | $ (0.185) | $ — | $ — |
|
| Redemption fees(2) | $ 0.001 | $ 0.001 | $ 0.025 | $ 0.000(3) |
|
| Net asset value — End of period | $ 12.440 | $ 8.290 | $17.500 | $11.150 |
|
| Total Return(4) | 51.81% | (52.10)% | 56.95% | 11.50%(5) |
|
| |
| Ratios/Supplemental Data | | | | |
|
|
| Net assets, end of period (000’s omitted) | $104,727 | $74,062 | $81,611 | $ 1,451 |
| Ratios (as a percentage of average daily net assets): | | | | |
| Expenses(6)(7) | 1.57% | 1.50% | 1.50% | 1.50%(8) |
| Net investment income | 1.26% | 1.33% | 0.77% | 0.32%(8) |
| Portfolio Turnover | 11% | 5% | 6% | 6%(5) |
|
| (1) | For the period from the start of business, June 30, 2006, to October 31, 2006. |
| (2) | Computed using average shares outstanding. |
| (3) | Amount represents less than $0.0005 per share. |
| (4) | Returns are historical and are calculated by determining the percentage change in net asset value with all distributions reinvested and do not reflect the effect of sales charges. |
| (5) | Not annualized. |
| (6) | The adviser and administrator waived a portion of its fees and subsidized certain operating expenses (equal to 0.02%, 0.20%, 0.52% and 9.49% of average daily net assets for the years ended October 31, 2009, 2008 and 2007 and the period ended October 31, 2006, respectively). |
| (7) | Excludes the effect of custody fee credits, if any, of less than 0.005%. |
| (8) | Annualized. |
See notes to financial statements
27
Eaton Vance Structured Emerging Markets Fund as of October 31, 2009
FINANCIAL STATEMENTS CON T ’ D
Financial Highlights |
| | | | |
| | Class C |
| |
|
| | Year Ended October 31, | Period Ended |
| |
|
| | 2009 | 2008 | 2007 | October 31, 2006(1) |
|
|
| Net asset value — Beginning of period | $ 8.160 | $17.320 | $11.120 | $10.000 |
|
| |
| Income (Loss) From Operations | | | | |
|
|
| Net investment income (loss)(2) | $ 0.042 | $ 0.092 | $ 0.010 | $ (0.010) |
| Net realized and unrealized gain (loss) | 4.087 | (9.117) | 6.190 | 1.130 |
|
| Total income (loss) from operations | $ 4.129 | $ (9.025) | $ 6.200 | $ 1.120 |
|
| |
| Less Distributions | | | | |
|
|
| From net investment income | $ (0.010) | $ (0.038) | $ — | $ — |
| From net realized gain | — | (0.098) | — | — |
|
| Total distributions | $ (0.010) | $ (0.136) | $ — | $ — |
|
| Redemption fees(2) | $ 0.001 | $ 0.001 | $ — | $ — |
|
| Net asset value — End of period | $12.280 | $ 8.160 | $17.320 | $11.120 |
|
| Total Return(3) | 50.69% | (52.50)% | 55.76% | 11.20%(4) |
|
| |
| Ratios/Supplemental Data | | | | |
|
|
| Net assets, end of period (000’s omitted) | $16,918 | $ 9,828 | $10,218 | $ 132 |
| Ratios (as a percentage of average daily net assets): | | | | |
| Expenses(5)(6) | 2.32% | 2.25% | 2.25% | 2.25%(7) |
| Net investment income (loss) | 0.44% | 0.65% | 0.06% | (0.30)%(7) |
| Portfolio Turnover | 11% | 5% | 6% | 6%(4) |
|
| (1) | For the period from the start of business, June 30, 2006, to October 31, 2006. |
| (2) | Computed using average shares outstanding. |
| (3) | Returns are historical and are calculated by determining the percentage change in net asset value with all distributions reinvested and do not reflect the effect of sales charges. |
| (4) | Not annualized. |
| (5) | The adviser and administrator waived a portion of its fees and subsidized certain operating expenses (equal to 0.02%, 0.20%, 0.52% and 9.49% of average daily net assets for the years ended October 31, 2009, 2008 and 2007 and the period ended October 31, 2006, respectively). |
| (6) | Excludes the effect of custody fee credits, if any, of less than 0.005%. |
| (7) | Annualized. |
See notes to financial statements
28
Eaton Vance Structured Emerging Markets Fund as of October 31, 2009
FINANCIAL STATEMENTS CON T ’ D
Financ ial Highlig hts |
| | | | |
| | Class I |
| |
|
| | Year Ended October 31, | Period Ended |
| |
|
| | 2009 | 2008 | 2007 | October 31, 2006(1) |
|
|
| Net asset value — Beginning of period | $ 8.320 | $ 17.540 | $ 11.150 | $10.000 |
|
| |
| Income (Loss) From Operations | | | | |
|
|
| Net investment income(2) | $ 0.156 | $ 0.231 | $ 0.160 | $ 0.030 |
| Net realized and unrealized gain (loss) | 4.109 | (9.251) | 6.232 | 1.120 |
|
| Total income (loss) from operations | $ 4.265 | $ (9.020) | $ 6.392 | $ 1.150 |
|
| |
| Less Distributions | | | | |
|
|
| From net investment income | $ (0.126) | $ (0.103) | $ (0.002) | $ — |
| From net realized gain | — | (0.098) | — | — |
|
| Total distributions | $ (0.126) | $ (0.201) | $ (0.002) | $ — |
|
| Redemption fees(2) | $ 0.001 | $ 0.001 | $ 0.000(3) | $— |
|
| Net asset value — End of period | $ 12.460 | $ 8.320 | $ 17.540 | $11.150 |
|
| Total Return(4) | 52.15% | (51.99)% | 57.34% | 11.50%(5) |
|
| |
| Ratios/Supplemental Data | | | | |
|
|
| Net assets, end of period (000’s omitted) | $846,944 | $278,147 | $273,719 | $15,405 |
| Ratios (as a percentage of average daily net assets): | | | | |
| Expenses(6)(7) | 1.33% | 1.25% | 1.25% | 1.25%(8) |
| Net investment income | 1.56% | 1.62% | 1.12% | 0.88%(8) |
| Portfolio Turnover | 11% | 5% | 6% | 6%(5) |
|
| (1) | For the period from the start of business, June 30, 2006, to October 31, 2006. |
| (2) | Computed using average shares outstanding. |
| (3) | Amount represents less than $0.0005 per share. |
| (4) | Returns are historical and are calculated by determining the percentage change in net asset value with all distributions reinvested. |
| (5) | Not annualized. |
| (6) | The adviser and administrator waived a portion of its fees and subsidized certain operating expenses (equal to 0.02%, 0.20%, 0.52% and 9.49% of average daily net assets for the years ended October 31, 2009, 2008 and 2007 and the period ended October 31, 2006, respectively). |
| (7) | Excludes the effect of custody fee credits, if any, of less than 0.005%. |
| (8) | Annualized. |
See notes to financial statements
29
Eaton Vance Structured Emerging Markets Fund as of October 31, 2009
NOTES TO FINANCIAL STATEMENTS |
1 Significant Accounting Policies
Eaton Vance Structured Emerging Markets Fund (the Fund) is a diversified series of Eaton Vance Mutual Funds Trust (the Trust). The Trust is a Massachusetts business trust registered under the Investment Company Act of 1940, as amended (the 1940 Act), as an open-end management investment company. The Fund’s investment objective is to seek long-term capital appreciation. The Fund offers three classes of shares. Class A shares are generally sold subject to a sales charge imposed at time of purchase. Class C shares are sold at net asset value and are generally subject to a contingent deferred sales charge (see Note 5). Class I shares are sold at net asset value and are not subject to a sales charge. Each class represents a pro-rata interest in the Fund, but votes separately on class-specific matters and (as noted below) is subject to different expenses. Realized and unrealized gains and losses and net investment income and losses, oth er than class-specific expenses, are allocated daily to each class of shares based on the relative net assets of each class to the total net assets of the Fund. Each class of shares differs in its distribution plan and certain other class-specific expenses.
The following is a summary of significant accounting policies of the Fund. The policies are in conformity with accounting principles generally accepted in the United States of America. A source of authoritative accounting principles applied in the preparation of the Fund’s financial statements is the Financial Accounting Standards Board (FASB) Accounting Standards Codification (the Codification), which superseded existing non-Securities and Exchange Commission accounting and reporting standards for interim and annual reporting periods ending after September 15, 2009. The adoption of the Codification for the current reporting period did not impact the Fund’s application of generally accepted accounting principles.
A Investment Valuation — Equity securities
(including common shares of closed-end investment companies) listed on a U.S. securities exchange generally are valued at the last sale price on the day of valuation or, if no sales took place on such date, at the mean between the closing bid and asked prices therefore on the exchange where such securities are principally traded. Equity securities listed on the NASDAQ Global or Global Select Market generally are valued at the NASDAQ official closing price. Unlisted or listed securities for which closing sales prices or closing quotations are not available are valued at the mean between the latest available bid and asked prices or, in the case of preferred equity securities that are not listed or traded in the over-the-counter market, by a third party pricing service that will use various techniques that consider factors including, but not limited to, prices or yields of securities with similar characteristics, benchmark yields, broker/dealer quotes, quotes of underlying common stoc k, issuer spreads, as well as industry and economic events. Debt obligations
(including short-term obligations with a remaining maturity of more than sixty days) will normally be valued on the basis of quotations provided by third party pricing services. The pricing services will use various techniques that consider factors including, but not limited to, reported trades or dealer quotations, prices or yields of securities with similar characteristics, benchmark yields, broker/ dealer quotes, issuer spreads, as well as industry and economic events. Short-term debt securities with a remaining maturity of sixty days or less are generally valued at amortized cost, which approximates market value. Foreign securities and currencies are valued in U.S. dollars, based on foreign currency exchange rate quotations supplied by a third party pricing service. The pricing service uses a proprietary model to determine the exchange rate. Inputs to the model include reported trades and implied bid/ask spreads. The daily valuation of exchange-traded foreign securities general ly is determined as of the close of trading on the principal exchange on which such securities trade. Events occurring after the close of trading on foreign exchanges may result in adjustments to the valuation of foreign securities to more accurately reflect their fair value as of the close of regular trading on the New York Stock Exchange. When valuing foreign equity securities that meet certain criteria, the Trustees have approved the use of a fair value service that values such securities to reflect market trading that occurs after the close of the applicable foreign markets of comparable securities or other instruments that have a strong correlation to the fair-valued securities. Investments for which valuations or market quotations are not readily available or are deemed unreliable are valued at fair value using methods determined in good faith by or at the direction of the Trustees of the Fund in a manner that most fairly reflects the security’s value, or the amount that the Fund might reasonably expect to receive for the security upon its current sale in the ordinary course. Each such determination is based on a consideration of all relevant factors, which are likely to vary from one pricing context to another. These factors may include, but are not limited to, the type of security, the existence of any contractual restrictions on the security’s disposition, the price and extent of public trading in similar securities of the issuer or of comparable companies or entities, quotations or relevant information obtained from broker-dealers or other market participants, information obtained from the issuer, analysts, and/or the appropriate stock exchange (for exchange-traded securities), an analysis of the company’s or entity’s financial condition, and an evaluation of the forces that influence the issuer and the market(s) in which the security is purchased and sold.
B Investment Transactions — Investment transactions for financial statement purposes are accounted
30
Eaton Vance Structured Emerging Markets Fund as of October 31, 2009
NOTES TO FINANCIAL STATEMENTS CON T ’D |
for on a trade date basis. Realized gains and losses on investments sold are determined on the basis of identified cost.
C Income — Dividend income is recorded on the ex-dividend date for dividends received in cash and/or securities. However, if the ex-dividend date has passed, certain dividends from foreign securities are recorded as the Fund is informed of the ex-dividend date. Withholding taxes on foreign dividends and capital gains have been provided for in accordance with the Fund’s understanding of the applicable countries’ tax rules and rates. Interest income is recorded on the basis of interest accrued, adjusted for amortization of premium or accretion of discount.
D Federal Taxes — The Fund’s policy is to comply with the provisions of the Internal Revenue Code applicable to regulated investment companies and to distribute to shareholders each year substantially all of its net investment income, and all or substantially all of its net realized capital gains. Accordingly, no provision for federal income or excise tax is necessary.
In addition to the requirements of the Internal Revenue Code, the Fund may also be subject to local taxes on the recognition of capital gains in certain countries. In determining the daily net asset value, the Fund estimates the accrual for such taxes, if any, based on the unrealized appreciation on certain portfolio securities and the related tax rates. Tax expense attributable to unrealized appreciation is included in the change in unrealized appreciation (depreciation) on investments. Capital gains taxes on securities sold are included in net realized gain (loss) on investments.
At October 31, 2009, the Fund, for federal income tax purposes, had a capital loss carryforward of $41,752,868 which will reduce its taxable income arising from future net realized gains on investment transactions, if any, to the extent permitted by the Internal Revenue Code, and thus will reduce the amount of distributions to shareholders, which would otherwise be necessary to relieve the Fund of any liability for federal income or excise tax. Such capital loss carryforward will expire on October 31, 2016 ($5,017,454) and October 31, 2017 ($36,735,414).
As of October 31, 2009, the Fund had no uncertain tax positions that would require financial statement recognition, de-recognition, or disclosure. Each of the Fund’s federal tax returns filed in the 3-year period ended October 31, 2009 remains subject to examination by the Internal Revenue Service.
E Expenses — The majority of expenses of the Trust are directly identifiable to an individual fund. Expenses which are not readily identifiable to a specific fund are allocated taking into consideration, among other things, the nature and type of expense and the relative size of the funds.
F Expense Reduction — State Street Bank and Trust Company (SSBT) serves as custodian of the Fund. Pursuant to the custodian agreement, SSBT receives a fee reduced by credits, which are determined based on the average daily cash balance the Fund maintains with SSBT. All credit balances, if any, used to reduce the Fund’s custodian fees are reported as a reduction of expenses in the Statement of Operations.
G Foreign Currency Translation — Investment valuations, other assets, and liabilities initially expressed in foreign currencies are translated each business day into U.S. dollars based upon current exchange rates. Purchases and sales of foreign investment securities and income and expenses denominated in foreign currencies are translated into U.S. dollars based upon currency exchange rates in effect on the respective dates of such transactions. Recognized gains or losses on investment transactions attributable to changes in foreign currency exchange rates are recorded for financial statement purposes as net realized gains and losses on investments. That portion of unrealized gains and losses on investments that results from fluctuations in foreign currency exchange rates is not separately disclosed.
H Use of Estimates — The preparation of the financial statements in conformity with accounting principles generally accepted in the United States of America requires management to make estimates and assumptions that affect the reported amounts of assets and liabilities at the date of the financial statements and the reported amounts of income and expense during the reporting period. Actual results could differ from those estimates.
I Indemnifications — Under the Trust’s organizational documents, its officers and Trustees may be indemnified against certain liabilities and expenses arising out of the performance of their duties to the Fund, and shareholders are indemnified against personal liability for the obligations of the Trust. Additionally, in the normal course of business, the Fund enters into agreements with service providers that may contain indemnification clauses. The Fund’s maximum exposure under these arrangements is unknown as this would involve future claims that may be made against the Fund that have not yet occurred.
J Redemption Fees — Upon the redemption or exchange of shares by Class A or Class I shareholders within 90 days of the settlement of purchase, a fee of 1% of the current net asset value of these shares will be
31
Eaton Vance Structured Emerging Markets Fund as of October 31, 2009
NOTES TO FINANCIAL STATEMENTS CON T ’D |
assessed and retained by the Fund for the benefit of the remaining shareholders. The redemption fee is accounted for as an addition to paid-in capital.
K Repurchase Agreements — The Fund may enter into repurchase agreements collateralized by U.S. Treasury obligations, U.S. agency obligations, commercial paper and mortgage-backed securities involving any or all of its assets with banks and broker-dealers determined to be creditworthy by the Fund’s investment adviser, Eaton Vance Management (EVM). Under a repurchase agreement, the Fund buys a security at one price and simultaneously promises to sell that same security back to the seller at a higher price for settlement at a later date. The Fund’s repurchase agreements provide that the value of the collateral underlying the repurchase agreement will always be at least equal to the repurchase price, including any accrued interest earned on the repurchase agreement, and will be marked to market daily. The repurchase date is usually overnight, but may be within seven days of the original purch ase date. In the event of bankruptcy of the counterparty or a third party custodian, the Fund might experience delays in recovering its cash or experience a loss.
2 Distributions to Shareholders
It is the present policy of the Fund to make at least one distribution annually (normally in December) of all or substantially all of its net investment income and to distribute annually all or substantially all of its net realized capital gains (reduced by available capital loss carryforwards from prior years, if any). Distributions are declared separately for each class of shares. Shareholders may reinvest income and capital gain distributions in additional shares of the same class of the Fund at the net asset value as of the ex-dividend date or, at the election of the shareholder, receive distributions in cash. The Fund distinguishes between distributions on a tax basis and a financial reporting basis. Accounting principles generally accepted in the United States of America require that only distributions in excess of tax basis earnings and profits be reported in the financial statements as a return of capital. Permanent differences between book and tax accounting relating to di stributions are reclassified to paid-in capital. For tax purposes, distributions from short-term capital gains are considered to be from ordinary income.
The tax character of distributions declared for the years ended October 31, 2009 and October 31, 2008 was as follows:
| | |
| | Year Ended October 31, |
| |
|
| | 2009 | 2008 |
|
|
| Distributions declared from: | | |
| Ordinary income | $4,918,001 | $3,219,590 |
| Long-term capital gains | $ — | $1,121,716 |
During the year ended October 31, 2009, accumulated net realized loss was decreased by $870,422 and accumulated undistributed net investment income was decreased by $870,422 due to differences between book and tax accounting, primarily for foreign currency gain (loss) and investments in passive foreign investment companies (PFICs). These reclassifications had no effect on the net assets or net asset value per share of the Fund.
As of October 31, 2009, the components of distributable earnings (accumulated losses) and unrealized appreciation (depreciation) on a tax basis were as follows:
| |
| Undistributed ordinary income | $ 8,716,377 |
| Capital loss carryforward | $(41,752,868) |
| Net unrealized appreciation | $ 52,617,883 |
The differences between components of distributable earnings (accumulated losses) on a tax basis and the amounts reflected in the Statement of Assets and Liabilities are primarily due to wash sales and investments in PFICs.
3 Investment Adviser Fee and Other Transactions with Affiliates
The investment adviser fee is earned by EVM as compensation for management and investment advisory services rendered to the Fund. The fee is computed at an annual rate of 0.85% of the Fund’s average daily net assets up to $500 million, 0.80% from $500 million up to $1 billion and at reduced rates as daily net assets exceed that level, and is payable monthly. For the year ended October 31, 2009, the investment adviser fee amounted to $4,772,724 or 0.83% of the Fund’s average daily net assets. Pursuant to a sub-advisory agreement, EVM has delegated the investment management of the Fund to Parametric Portfolio Associates, LLC (Parametric), an affiliate of EVM. EVM pays Parametric a portion of its advisory fee for sub-advisory services provided to the Fund. The administration fee is earned by EVM for administering the business affairs of the Fund and is computed at an annual rate of 0.15% of the Fund’s average daily net assets. For the year ended October 31, 2009, the ad ministration fee amounted to $854,671.
EVM has agreed to waive its fees and reimburse expenses to the extent that total annual operating expenses exceed 1.60%, 2.35% and 1.35% of the average daily net assets of Class A, Class C and Class I, respectively, through February 28, 2010. Thereafter, the waiver and reimbursement may be changed or terminated at any time. Prior to March 1, 2009, EVM had agreed to waive its fees and reimburse expenses to the extent that total annual operating expenses exceeded 1.50%, 2.25% and 1.25% of the average daily net assets of Class A, Class C and Class I, respectively. Pursuant to these agreements, EVM waived fees and reimbursed expenses of $101,012 for the year ended October 31, 2009.
32
Eaton Vance Structured Emerging Markets Fund as of October 31, 2009
NOTES TO FINANCIAL STATEMENTS CON T ’D |
EVM serves as the sub-transfer agent of the Fund and receives from the transfer agent an aggregate fee based upon the actual expenses incurred by EVM in the performance of these services. For the year ended October 31, 2009, EVM earned $8,106 in sub-transfer agent fees. The Fund was informed that Eaton Vance Distributors, Inc. (EVD), an affiliate of EVM and the Fund’s principal underwriter, received $18,206 as its portion of the sales charge on sales of Class A shares for the year ended October 31, 2009. EVD also received distribution and service fees from Class A and Class C shares (see Note 4) and contingent deferred sales charges (see Note 5).
Except for Trustees of the Fund who are not members of EVM’s organization, officers and Trustees receive remuneration for their services to the Fund out of the investment adviser fee. Trustees of the Fund who are not affiliated with EVM may elect to defer receipt of all or a percentage of their annual fees in accordance with the terms of the Trustees Deferred Compensation Plan. For the year ended October 31, 2009, no significant amounts have been deferred. Certain officers and Trustees of the Fund are officers of EVM.
4 Distribution Plans
The Fund has in effect a distribution plan for Class A shares (Class A Plan) pursuant to Rule 12b-1 under the 1940 Act. The Class A Plan provides that the Fund will pay EVD a distribution and service fee of 0.25% per annum of its average daily net assets attributable to Class A shares for distribution services and facilities provided to the Fund by EVD, as well as for personal services and/or the maintenance of shareholder accounts. Distribution and service fees paid or accrued to EVD for the year ended October 31, 2009 amounted to $189,851 for Class A shares.
The Fund also has in effect a distribution plan for Class C shares (Class C Plan) pursuant to Rule 12b-1 under the 1940 Act. The Class C Plan requires the Fund to pay EVD amounts equal to 0.75% per annum of its average daily net assets attributable to Class C shares for providing ongoing distribution services and facilities to the Fund. The Fund will automatically discontinue payments to EVD during any period in which there are no outstanding Uncovered Distribution Charges, which are equivalent to the sum of (i) 6.25% of the aggregate amount received by the Fund for Class C shares sold, plus (ii) interest calculated by applying the rate of 1% over the prevailing prime rate to the outstanding balance of Uncovered Distribution Charges of EVD of Class C, reduced by the aggregate amount of contingent deferred sales charges (see Note 5) and amounts theretofore paid or payable to EVD by Class C. For the year ended October 31, 2009, the Fund paid or accrued to EVD $81,500 for Class C shar es representing 0.75% of the average daily net assets of Class C shares. At October 31, 2009, the amount of Uncovered Distribution Charges of EVD calculated under the Class C Plan was approximately $1,299,000.
The Class C Plan also authorizes the Fund to make payments of service fees to EVD, financial intermediaries and other persons equal to 0.25% per annum of its average daily net assets attributable to that class. Service fees paid or accrued are for personal services and/or the maintenance of shareholder accounts. They are separate and distinct from the sales commissions and distribution fees payable to EVD and, as such, are not subject to automatic discontinuance when there are no outstanding Uncovered Distribution Charges of EVD. Service fees paid or accrued for the year ended October 31, 2009 amounted to $27,167 for Class C shares.
5 Contingent Deferred Sales Charges
A contingent deferred sales charge (CDSC) of 1% generally is imposed on redemptions of Class C shares made within one year of purchase. Class A shares may be subject to a 1% CDSC if redeemed within 18 months of purchase (depending on the circumstances of purchase).
Generally, the CDSC is based upon the lower of the net asset value at date of redemption or date of purchase. No charge is levied on shares acquired by reinvestment of dividends or capital gain distributions. No CDSC is levied on shares which have been sold to EVM or its affiliates or to their respective employees or clients and may be waived under certain other limited conditions. CDSCs received on Class C redemptions are paid to EVD to reduce the amount of Uncovered Distribution Charges calculated under the Fund’s Class C Plan. CDSCs received on Class C redemptions when no Uncovered Distribution Charges exist are credited to the Fund. For the year ended October 31, 2009, the Fund was informed that EVD received approximately $17,000 and $14,000 of CDSCs paid by Class A and Class C shareholders, respectively.
6 Purchases and Sales of Investments
Purchases and sales of investments, other than short-term obligations, aggregated $376,944,049 and $64,090,361, respectively, for the year ended October 31, 2009.
7 Shares of Beneficial Interest
The Fund’s Declaration of Trust permits the Trustees to issue an unlimited number of full and fractional shares of beneficial interest (without par value). Such shares may be issued in a number of different series (such as the Fund) and classes. Transactions in Fund shares were as follows:
33
Eaton Vance Structured Emerging Markets Fund as of October 31, 2009
NOTES TO FINANCIAL STATEMENTS CON T ’D |
| | |
| | Year Ended October 31, |
| |
|
| Class A | 2009 | 2008 |
|
| Sales | 5,726,915 | 7,647,293 |
| Issued to shareholders electing to | | |
| receive payments of distributions in | | |
| Fund shares | 67,744 | 53,728 |
| Redemptions | (6,304,186) | (3,432,341) |
|
| Net increase (decrease) | (509,527) | 4,268,680 |
|
| |
| | Year Ended October 31, |
| |
|
| Class C | 2009 | 2008 |
|
| Sales | 569,119 | 941,092 |
| Issued to shareholders electing to | | |
| receive payments of distributions in | | |
| Fund shares | 1,081 | 3,583 |
| Redemptions | (396,257) | (331,065) |
|
| Net increase | 173,943 | 613,610 |
|
| |
| | Year Ended October 31, |
| |
|
| Class I | 2009 | 2008 |
|
| Sales | 51,045,504 | 22,610,736 |
| Issued to shareholders electing to | | |
| receive payments of distributions in | | |
| Fund shares | 281,707 | 125,248 |
| Redemptions | (16,779,246) | (4,920,012) |
|
| Net increase | 34,547,965 | 17,815,972 |
|
For the years ended October 31, 2009 and October 31, 2008, the Fund received $48,379 and $22,156, respectively, in redemption fees.
8 Federal Income Tax Basis of Investments
The cost and unrealized appreciation (depreciation) of investments of the Fund at October 31, 2009, as determined on a federal income tax basis, were as follows:
| |
| Aggregate cost | $910,752,764 |
|
| Gross unrealized appreciation | $130,462,151 |
| Gross unrealized depreciation | (77,439,408) |
|
| Net unrealized appreciation | $ 53,022,743 |
|
9 Line of Credit
The Fund participates with other portfolios and funds managed by EVM and its affiliates in a $450 million unsecured line of credit agreement with a group of banks. Borrowings are made by the Fund solely to facilitate the handling of unusual and/or unanticipated short-term cash requirements. Interest is charged to the Fund based on its borrowings at an amount above either the Eurodollar rate or Federal Funds rate. In addition, a fee computed at an annual rate of 0.10% on the daily unused portion of the line of credit is allocated among the participating portfolios and funds at the end of each quarter. The Fund did not have any significant borrowings or allocated fees during the year ended October 31, 2009.
10 Risks Associated with Foreign Investments
Investing in securities issued by companies whose principal business activities are outside the United States may involve significant risks not present in domestic investments. For example, there is generally less publicly available information about foreign companies, particularly those not subject to the disclosure and reporting requirements of the U.S. securities laws. Certain foreign issuers are generally not bound by uniform accounting, auditing, and financial reporting requirements and standards of practice comparable to those applicable to domestic issuers. Investments in foreign securities also involve the risk of possible adverse changes in investment or exchange control regulations, expropriation or confiscatory taxation, limitation on the removal of funds or other assets of the Fund, political or financial instability or diplomatic and other developments which could affect such investments. Foreign stock markets, while growing in volume and sophistication, are generally not as developed as those in the United States, and securities of some foreign issuers (particularly those located in developing countries) may be less liquid and more volatile than securities of comparable U.S. companies. In general, there is less overall governmental supervision and regulation of foreign securities markets, broker-dealers and issuers than in the United States.
11 Fair Value Measurements
The Fund adopted FASB Statement of Financial Accounting Standards No. 157 (FAS 157), “Fair Value Measurements”, (currently FASB Accounting Standards Codification (ASC) 820-10), effective November 1, 2008. Such standard established a three-tier hierarchy to prioritize the assumptions, referred to as inputs, used in valuation techniques to measure fair value. The three-tier hierarchy of inputs is summarized in the three broad levels listed below.
• Level 1 – quoted prices in active markets for identical investments
• Level 2 – other significant observable inputs (including quoted prices for similar investments, interest rates, prepayment speeds, credit risk, etc.)
• Level 3 – significant unobservable inputs (including a fund’s own assumptions in determining the fair value of investments)
34
Eaton Vance Structured Emerging Markets Fund as of October 31, 2009
NOTES TO FINANCIAL STATEMENTS CON T ’D |
The inputs or methodology used for valuing securities are not necessarily an indication of the risk associated with investing in those securities.
At October 31, 2009, the inputs used in valuing the Fund’s investments, which are carried at value, were as follows:
| | | | | |
| | Quoted | | | | |
| | Prices in | | | | |
| | Active | Significant | | | |
| | Markets for | Other | Significant | |
| | Identical | Observable | Unobservable | |
| | Assets | Inputs | Inputs | | Total |
| |
|
|
|
| Asset Description | (Level 1) | (Level 2) | (Level 3) | | |
|
|
| Common Stocks | | | | | |
| Asia/Pacific | $ 32,218,550 | $317,408,830 | $ 0 | $349,627,380 |
| Emerging Europe | 12,364,613 | 184,947,168 | | 0 | 197,311,781 |
| Latin America | 178,453,211 | — | | 0 | 178,453,211 |
| Middle East/Africa | 47,651,389 | 169,085,799 | | — | 216,737,188 |
|
|
|
| Total Common Stocks | $270,687,763 | $671,441,797* | $ 0 | $942,129,560 |
| Convertible Bonds | — | 25,443 | | — | 25,443 |
| Equity-Linked Securities | — | 6,924,920 | | — | 6,924,920 |
| Investment Funds | — | 3,956,057 | | — | 3,956,057 |
| Rights | 8,043 | — | | — | 8,043 |
| Warrants | 1,484 | — | | — | 1,484 |
| Short-Term Investments | — | 10,730,000 | | — | 10,730,000 |
|
|
|
| Total Investments | $270,697,290 | $693,078,217 | $ 0 | $963,775,507 |
|
| |
| * Includes foreign equity securities whose values were |
| adjusted to reflect market trading that occurred after the |
| close of trading in their applicable foreign markets. |
The following is a reconciliation of Level 3 assets for which significant unobservable inputs were used to determine fair value:
| |
| | Investments in |
| | Common Stocks |
|
|
| Balance as of October 31, 2008 | $ 0 |
| Realized gains (losses) | — |
| Change in net unrealized appreciation (depreciation)* | 0 |
| Net purchases (sales) | 0 |
| Accrued discount (premium) | — |
| Net transfers to (from) Level 3 | — |
|
| Balance as of October 31, 2009 | $ 0 |
|
| Change in net unrealized appreciation (depreciation) on | |
| investments still held as of October 31, 2009* | $ 0 |
|
| |
| * Amount is included in the related amount on investments |
| in the Statement of Operations. | |
All Level 3 investments held at October 31, 2009 and October 31, 2008 were valued at $0
12 Review for Subsequent Events
In connection with the preparation of the financial statements of the Fund as of and for the year ended October 31, 2009, events and transactions subsequent to October 31, 2009 through December 21, 2009, the date the financial statements were issued, have been evaluated by the Fund’s management for possible adjustment and/or disclosure. Management has not identified any subsequent events requiring financial statement disclosure as of the date these financial statements were issued.
35
Eaton Vance Structured Emerging Markets Fund as of October 31, 2009
REPORT OF INDEPENDENT REGISTERED PUBLIC ACCOUNTING FIRM |
To the Trustees of Eaton Vance Mutual Funds
Trust and Shareholders of Eaton Vance Structured
Emerging Markets Fund:
We have audited the accompanying statement of assets and
liabilities of Eaton Vance Structured Emerging Markets Fund
(the ”Fund”)(one of the funds constituting Eaton Vance
Mutual Funds Trust), including the portfolio of investments,
as of October 31, 2009, and the related statement of
operations for the year then ended, the statements of changes
in net assets for each of the two years in the period then
ended, and the financial highlights for each of the three years
in the period then ended. These financial statements and
financial highlights are the responsibility of the Fund’s
management. Our responsibility is to express an opinion on
these financial statements and financial highlights, based on
our audits. The financial highlights for the period from the
start of business, June 30, 2006, to October 31, 2006, were
audited by other auditors. Those auditors expressed an
unqualified opinion on those financial highlights in their
report dated December 20, 2006.
We conducted our audits in accordance with the standards of
the Public Company Accounting Oversight Board (United
States). Those standards require that we plan and perform the
audit to obtain reasonable assurance about whether the
financial statements and financial highlights are free of
material misstatement. The Fund is not required to have, nor
were we engaged to perform, an audit of its internal control
over financial reporting. Our audits included consideration of
internal control over financial reporting as a basis for
designing audit procedures that are appropriate in the
circumstances, but not for the purpose of expressing an
opinion on the effectiveness of the Fund’s internal control
over financial reporting. Accordingly, we express no such
opinion. An audit also includes examining, on a test basis,
evidence supporting the amounts and disclosures in the
financial statements, assessing the accounting principles used
and significant estimates made by management, as well as
evaluating the overall financial statement presentation. Our
procedures included confirmation of securities owned as of
October 31, 2009, by correspondence with the custodian and
brokers; where replies were not received from brokers, we
performed other auditing procedures. We believe that our
audits provide a reasonable basis for our opinion.
In our opinion, the financial statements and financial
highlights referred to above present fairly, in all material
respects, the financial position of Eaton Vance Structured
Emerging Markets Fund as of October 31, 2009, the results of
its operations for the year then ended, the changes in its net
assets for each of the two years in the period then ended, and
the financial highlights for each of the three years in the
period then ended, in conformity with accounting principles
generally accepted in the United States of America. |
DELOITTE & TOUCHE LLP
Boston, Massachusetts
December 21, 2009 |
36
Eaton Vance Structured Emerging Markets Fund as of October 31, 2009
FEDERAL TAX IN FORMATION (Unaudited) |
The Form 1099-DIV you receive in January 2010 will show the tax status of all distributions paid to your account in calendar year 2009. Shareholders are advised to consult their own tax adviser with respect to the tax consequences of their investment in the Fund. As required by the Internal Revenue Code regulations, shareholders must be notified within 60 days of the Fund’s fiscal year end regarding the status of qualified dividend income for individuals and the foreign tax credit.
Qualified Dividend Income. The Fund designates $11,212,254 or up to the maximum amount of such dividends allowable pursuant to the Internal Revenue Code, as qualified dividend income eligible for the reduced tax rate of 15%.
Foreign Tax Credit. The Fund paid foreign taxes of $1,597,789 and recognized foreign source income of $18,192,734.
37
Eaton Vance Structured Emerging Markets Fund
BOARD OF TRUSTEES’ ANNUAL APPROVAL OF THE INVESTMENT ADVISORY AGREEMENT
Overview of the Contract Review Process
The Investment Company Act of 1940, as amended (the “1940 Act”), provides, in substance, that each investment advisory agreement between a fund and its investment adviser will continue in effect from year to year only if its continuance is approved at least annually by the fund’s board of trustees, including by a vote of a majority of the trustees who are not “interested persons” of the fund (“Independent Trustees”), cast in person at a meeting called for the purpose of considering such approval.
At a meeting of the Boards of Trustees (each a “Board”) of the Eaton Vance group of mutual funds (the “Eaton Vance Funds”) held on April 27, 2009, the Board, including a majority of the Independent Trustees, voted to approve continuation of existing advisory and sub-advisory agreements for the Eaton Vance Funds for an additional one-year period. In voting its approval, the Board relied upon the affirmative recommendation of the Contract Review Committee of the Board (formerly the Special Committee), which is a committee comprised exclusively of Independent Trustees. Prior to making its recommendation, the Contract Review Committee reviewed information furnished for a series of meetings of the Contract Review Committee held in February, March and April 2009. Such information included, among other things, the following:
Information about Fees, Performance and Expenses
- An independent report comparing the advisory and related fees paid by each fund with fees paid by comparable funds;
- An independent report comparing each fund’s total expense ratio and its components to comparable funds;
- An independent report comparing the investment performance of each fund to the investment performance of comparable funds over various time periods;
- Data regarding investment performance in comparison to relevant peer groups of funds and appropriate indices;
- Comparative information concerning fees charged by each adviser for managing other mutual funds and institutional accounts using investment strategies and techniques similar to those used in managing the fund;
- Profitability analyses for each adviser with respect to each fund;
| Information about Portfolio Management |
- Descriptions of the investment management services provided to each fund, including the investment strategies and processes employed, and any changes in portfolio management processes and personnel;
- Information concerning the allocation of brokerage and the benefits received by each adviser as a result of brokerage allocation, including information concerning the acquisition of research through “soft dollar” benefits received in connection with the funds’ brokerage, and the implementation of a soft dollar reimbursement program established with respect to the funds;
- Data relating to portfolio turnover rates of each fund;
- The procedures and processes used to determine the fair value of fund assets and actions taken to monitor and test the effectiveness of such procedures and processes;
| Information about each Adviser |
- Reports detailing the financial results and condition of each adviser;
- Descriptions of the qualifications, education and experience of the individual investment professionals whose responsibilities include portfolio management and investment research for the funds, and information relating to their compensation and responsibilities with respect to managing other mutual funds and investment accounts;
- Copies of the Codes of Ethics of each adviser and its affiliates, together with information relating to compliance with and the administration of such codes;
- Copies of or descriptions of each adviser’s proxy voting policies and procedures;
- Information concerning the resources devoted to compliance efforts undertaken by each adviser and its affiliates on behalf of the funds (including descriptions of various compliance programs) and their record of compliance with investment policies and restrictions, including policies with respect to market-timing, late trading and selective portfolio disclosure, and with policies on personal securities transactions;
- Descriptions of the business continuity and disaster recovery plans of each adviser and its affiliates;
| Other Relevant Information |
- Information concerning the nature, cost and character of the administrative and other non-investment management services provided by Eaton Vance Management and its affiliates;
- Information concerning management of the relationship with the custodian, subcustodians and fund accountants by each adviser or the funds’ administrator; and
- The terms of each advisory agreement.
38
Eaton Vance Structured Emerging Markets Fund
BOARD OF TRUSTEES’ ANNUAL APPROVAL OF THE INVESTMENT ADVISORY AGREEMENT CONT’D
In addition to the information identified above, the Contract Review Committee considered information provided from time to time by each adviser throughout the year at meetings of the Board and its committees. Over the course of the twelve-month period ended April 30, 2009, the Board met eighteen times and the Contract Review Committee, the Audit Committee, the Governance Committee, the Portfolio Management Committee and the Compliance Reports and Regulatory Matters Committee, each of which is a Committee comprised solely of Independent Trustees, met seven, five, six, six and six times, respectively. At such meetings, the Trustees received, among other things, presentations by the portfolio managers and other investment professionals of each adviser relating to the investment performance of each fund and the investment strategies used in pursuing the fund’s investment objective.
For funds that invest through one or more underlying portfolios, the Board considered similar information about the portfolio(s) when considering the approval of advisory agreements. In addition, in cases where the fund’s investment adviser has engaged a sub-adviser, the Board considered similar information about the sub-adviser when considering the approval of any sub-advisory agreement.
The Contract Review Committee was assisted throughout the contract review process by Goodwin Procter LLP, legal counsel for the Independent Trustees. The members of the Contract Review Committee relied upon the advice of such counsel and their own business judgment in determining the material factors to be considered in evaluating each advisory and sub-advisory agreement and the weight to be given to each such factor. The conclusions reached with respect to each advisory and sub-advisory agreement were based on a comprehensive evaluation of all the information provided and not any single factor. Moreover, each member of the Contract Review Committee may have placed varying emphasis on particular factors in reaching conclusions with respect to each advisory and sub-advisory agreement.
Results of the Process
Based on its consideration of the foregoing, and such other information as it deemed relevant, including the factors and conclusions described below, the Contract Review Committee concluded that the continuance of the investment advisory agreement of Eaton Vance Structured Emerging Markets Fund (the “Fund”) with Eaton Vance Management (the “Adviser”), and the sub-advisory agreement with Parametric Portfolio Associates (the “Sub-adviser”), including the fee structure of each agreement, are in the interests of shareholders and, therefore, the Contract Review Committee recommended to the Board approval of the agreements. The Board accepted the recommendation of the Contract Review Committee as well as the factors considered and conclusions reached by the Contract Review Committee with respect to the agreements. Accordingly, the Board, including a majority of the Independent Trustees, voted to approve the investment advisory agreement and sub-advisory agre ement for the Fund.
Nature, Extent and Quality of Services
In considering whether to approve the investment advisory agreement and sub-advisory agreement of the Fund, the Board evaluated the nature, extent and quality of services provided to the Fund by the Adviser and the Sub-adviser.
The Board considered the Adviser’s and Sub-adviser’s management capabilities and investment process with respect to the types of investments held by the Fund, including the education, experience and number of its investment professionals and other personnel who provide portfolio management, investment research, and similar services to the Fund. The Board evaluated the abilities and experience of such investment personnel in analyzing factors such as special considerations relevant to investing in emerging markets. The Board noted the Adviser’s in-house equity research capabilities. The Board also took into account the resources dedicated to portfolio management and other services, including the compensation paid to recruit and retain investment personnel, and the time and attention devoted to the Fund by senior management. With respect to the Sub-adviser, the Board noted the Sub-adviser’s experience in deploying quantitative-based investment strategies.
The Board also reviewed the compliance programs of the Adviser and relevant affiliates thereof, including the Sub-adviser. Among other matters, the Board considered compliance and reporting matters relating to personal trading by investment personnel, selective disclosure of portfolio holdings, late trading, frequent trading, portfolio valuation, business continuity and the allocation of investment opportunities. The Board also evaluated the responses of the Adviser and its affiliates to requests from regulatory authorities such as the Securities and Exchange Commission and the Financial Industry Regulatory Authority.
The Board considered shareholder and other administrative services provided or managed by Eaton Vance Management and its affiliates, including transfer agency and accounting services. The Board evaluated the benefits to shareholders of investing in a fund that is a part of a large family of funds, including the ability, in many cases, to exchange an investment among different funds without incurring additional sales charges.
The Board considered the Adviser’s recommendations for Board action and other steps taken in response to the unprecedented dislocations experienced in the capital markets over recent periods, including sustained periods of high volatility, credit disruption and
39
Eaton Vance Structured Emerging Markets Fund
BOARD OF TRUSTEES’ ANNUAL APPROVAL OF THE INVESTMENT ADVISORY AGREEMENT CONT’D
government intervention. In particular, the Board considered the Adviser’s efforts and expertise with respect to each of the following matters as they relate to the Fund and/or other funds within the Eaton Vance family of funds: (i) negotiating and maintaining the availability of bank loan facilities and other sources of credit used for investment purposes or to satisfy liquidity needs; (ii) establishing the fair value of securities and other instruments held in investment portfolios during periods of market volatility and issuer-specific disruptions; and (iii) the ongoing monitoring of investment management processes and risk controls.
After consideration of the foregoing factors, among others, the Board concluded that the nature, extent and quality of services to be provided by the Adviser and Sub-adviser, taken as a whole, are appropriate and consistent with the terms of the investment advisory and sub-advisory agreements.
Fund Performance
The Board compared the Fund’s investment performance to a relevant universe of similarly managed funds identified by an independent data provider and appropriate benchmark indices. The Board reviewed comparative performance data for the one-year ended September 30, 2008 for the Fund. The Board concluded that the Fund’s performance was satisfactory.
Management Fees and Expenses
The Board reviewed contractual investment advisory fee rates, including any administrative fee rates, paid by the Fund (referred to as “management fees”). As part of its review, the Board considered the Fund’s management fees and expense ratio for the one-year ended September 30, 2008. The Board considered the fact that the Adviser had waived fees and/or paid expenses for the Fund.
After reviewing the foregoing information, and in light of the nature, extent and quality of the services provided by the Adviser, the Board concluded with respect to the Fund that the management fees charged for advisory and related services and the Fund’s total expense ratio are reasonable.
Profitability
The Board reviewed the level of profits realized by the Adviser and relevant affiliates thereof, including the Sub-adviser, in providing investment advisory and administrative services to the Fund and to all Eaton Vance Funds as a group. The Board considered the level of profits realized without regard to revenue sharing or other payments by the Adviser and its affiliates to third parties in respect of distribution services. The Board also considered other direct or indirect benefits received by the Adviser and its affiliates in connection with its relationship with the Fund, including the benefits of research services that may be available to the Adviser or Sub-adviser as a result of securities transactions effected for the Fund and other investment advisory clients.
The Board concluded that, in light of the foregoing factors and the nature, extent and quality of the services rendered, the profits realized by the Adviser and its affiliates, including the Sub-adviser, are reasonable.
Economies of Scale
In reviewing management fees, the Board also considered the extent to which the Adviser and its affiliates, including the Sub-adviser, on the one hand, and the Fund, on the other hand, can expect to realize benefits from economies of scale as the assets of the Fund increase. The Board acknowledged the difficulty in accurately measuring the benefits resulting from the economies of scale with respect to the management of any specific fund or group of funds. The Board reviewed data summarizing the increases and decreases in the assets of the Portfolios and of all Eaton Vance Funds as a group over various time periods, and evaluated the extent to which the total expense ratio of the Fund and the profitability of the Adviser and its affiliates may have been affected by such increases or decreases. The Board noted the structure of the advisory fee, which includes breakpoints at several asset levels. Based upon the foregoing, the Board concluded that the benefits from economies of scale a re currently being shared equitably by the Adviser and its affiliates, including the Sub-adviser, and the Fund.
40
Eaton Vance Structured Emerging Markets Fund
MANAGEMENT AND ORGANIZATION
Fund Management. The Trustees of Eaton Vance Mutual Funds Trust (the Trust) are responsible for the overall management and supervision of the Trust’s affairs. The Trustees and officers of the Trust are listed below. Except as indicated, each individual has held the office shown or other offices in the same company for the last five years. Trustees and officers of the Trust hold indefinite terms of office. The “Noninterested Trustees” consist of those Trustees who are not “interested persons” of the Trust, as that term is defined under the 1940 Act. The business address of each Trustee and officer is Two International Place, Boston, Massachusetts 02110. As used below, “EVC” refers to Eaton Vance Corp., “EV” refers to Eaton Vance, Inc., “EVM” refers to Eaton Vance Management, “BMR” refers to Boston Management and Research, “Parametric” refers to Parametric Portfolio Associates LLC an d “EVD” refers to Eaton Vance Distributors, Inc. EVC and EV are the corporate parent and trustee, respectively, of EVM and BMR. EVD is the Fund’s principal underwriter and a wholly-owned subsidiary of EVC. Each officer affiliated with Eaton Vance may hold a position with other Eaton Vance affiliates that is comparable to his or her position with EVM listed below.
| | | | | |
| | | Term of | | Number of Portfolios | |
| | Position(s) | Office and | | in Fund Complex | |
| Name and | with the | Length of | Principal Occupation(s) | Overseen By | |
| Date of Birth | Trust | Service | During Past Five Years | Trustee(1) | Other Directorships Held |
|
| Interested Trustee | | | | |
| |
| Thomas E. Faust Jr. | Trustee and | Trustee since 2007 and | Chairman, Chief Executive Officer and President of EVC, Director | 176 | Director of EVC |
| 5/31/58 | President | President since 2002 | and President of EV, Chief Executive Officer and President of | | |
| | | | EVM and BMR, and Director of EVD. Trustee and/or officer of | | |
| | | | 176 registered investment companies and 4 private investment | | |
| | | | companies managed by EVM or BMR. Mr. Faust is an interested | | |
| | | | person because of his positions with EVM, BMR, EVD, EVC and | | |
| | | | EV, which are affiliates of the Trust. | | |
| |
| Noninterested Trustees | | | |
| |
| Benjamin C. Esty | Trustee | Since 2005 | Roy and Elizabeth Simmons Professor of Business Administration | 176 | None |
| 1/2/63 | | | and Finance Unit Head, Harvard University Graduate School of | | |
| | | | Business Administration. | | |
| |
| Allen R. Freedman | Trustee | Since 2007 | Former Chairman (2002-2004) and a Director (1983-2004) of | 176 | Director of Assurant, Inc. (insurance provider) |
| 4/3/40 | | | Systems & Computer Technology Corp. (provider of software to | | and Stonemor Partners, L.P. (owner and |
| | | | higher education). Formerly, a Director of Loring Ward | | operator of cemeteries) |
| | | | International (fund distributor) (2005-2007). Formerly, | | |
| | | | Chairman and a Director of Indus International, Inc. (provider of | | |
| | | | enterprise management software to the power generating | | |
| | | | industry) (2005-2007). | | |
| |
| William H. Park | Trustee | Since 2003 | Vice Chairman, Commercial Industrial Finance Corp. (specialty | 176 | None |
| 9/19/47 | | | finance company) (since 2006). Formerly, President and Chief | | |
| | | | Executive Officer, Prizm Capital Management, LLC (investment | | |
| | | | management firm) (2002-2005). | | |
| |
| Ronald A. Pearlman | Trustee | Since 2003 | Professor of Law, Georgetown University Law Center. | 176 | None |
| 7/10/40 | | | | | |
| |
| Helen Frame Peters | Trustee | Since 2008 | Professor of Finance, Carroll School of Management, Boston | 176 | Director of BJ’s Wholesale Club, Inc. |
| 3/22/48 | | | College. Adjunct Professor of Finance, Peking University, Beijing, | | (wholesale club retailer) |
| | | | China (since 2005). | | |
| |
| Heidi L. Steiger | Trustee | Since 2007 | Managing Partner, Topridge Associates LLC (global wealth | 176 | Director of Nuclear Electric Insurance Ltd. |
| 7/8/53 | | | management firm) (since 2008); Senior Advisor (since 2008), | | (nuclear insurance provider), Aviva USA |
| | | | President (2005-2008), Lowenhaupt Global Advisors, LLC | | (insurance provider) and CIFG (family of |
| | | | (global wealth management firm). Formerly, President and | | financial guaranty companies) and Advisory |
| | | | Contributing Editor, Worth Magazine (2004-2005). Formerly, | | Director of Berkshire Capital Securities LLC |
| | | | Executive Vice President and Global Head of Private Asset | | (private investment banking firm) |
| | | | Management (and various other positions), Neuberger Berman | | |
| | | | (investment firm) (1986-2004). | | |
41
Eaton Vance Structured Emerging Markets Fund
MANAGEMENT AND ORGANIZATION CON T’D
| | | | | |
| | | Term of | | Number of Portfolios | |
| | Position(s) | Office and | | in Fund Complex | |
| Name and | with the | Length of | Principal Occupation(s) | Overseen By | |
| Date of Birth | Trust | Service | During Past Five Years | Trustee(1) | Other Directorships Held |
|
| Noninterested Trustees (continued) | | | |
| |
| |
| Lynn A. Stout | Trustee | Since 1998 | Paul Hastings Professor of Corporate and Securities Law (since | 176 | None |
| 9/14/57 | | | 2006) and Professor of Law (2001-2006), University of | | |
| | | | California at Los Angeles School of Law. | | |
| |
| Ralph F. Verni | Chairman of | Chairman of the Board | Consultant and private investor. | 176 | None |
| 1/26/43 | the Board | since 2007 and Trustee | | | |
| | and Trustee | since 2005 | | | |
| | | |
| Principal Officers who are not Trustees | | |
| |
| | | Term of | |
| | Position(s) | Office and | |
| Name and | with the | Length of | Principal Occupation(s) |
| Date of Birth | Trust | Service | During Past Five Years |
|
| |
| William H. Ahern, Jr. | Vice President | Since 1995 | Vice President of EVM and BMR. Officer of 76 registered investment companies |
| 7/28/59 | | | managed by EVM or BMR. |
| |
| John R. Baur | Vice President | Since 2008 | Vice President of EVM and BMR. Previously, attended Johnson Graduate School |
| 2/10/70 | | | of Management, Cornell University (2002-2005), and prior thereto he was an |
| | | | Account Team Representative in Singapore for Applied Materials, Inc. Officer of |
| | | | 35 registered investment companies managed by EVM or BMR. |
| |
| Michael A. Cirami | Vice President | Since 2008 | Vice President of EVM and BMR. Officer of 35 registered investment companies |
| 12/24/75 | | | managed by EVM or BMR. |
| |
| Cynthia J. Clemson | Vice President | Since 2005 | Vice President of EVM and BMR. Officer of 92 registered investment companies |
| 3/2/63 | | | managed by EVM or BMR. |
| |
| Charles B. Gaffney | Vice President | Since 2007 | Director of Equity Research and a Vice President of EVM and BMR. Officer of |
| 12/4/72 | | | 32 registered investment companies managed by EVM or BMR. |
| |
| Christine M. Johnston | Vice President | Since 2007 | Vice President of EVM and BMR. Officer of 37 registered investment companies |
| 11/9/72 | | | managed by EVM or BMR. |
| |
| Aamer Khan | Vice President | Since 2005 | Vice President of EVM and BMR. Officer of 35 registered investment companies |
| 6/7/60 | | | managed by EVM or BMR. |
| |
| Thomas H. Luster | Vice President | Since 2006 | Vice President of EVM and BMR. Officer of 54 registered investment companies |
| 4/8/62 | | | managed by EVM or BMR. |
| |
| Robert B. MacIntosh | Vice President | Since 1998 | Vice President of EVM and BMR. Officer of 91 registered investment companies |
| 1/22/57 | | | managed by EVM or BMR. |
| |
| Jeffrey A. Rawlins | Vice President | Since 2009 | Vice President of EVM and BMR. Previously, a Managing Director of the Fixed |
| 10/6/61 | | | Income Group at State Street Research and Management (1989-2005). Officer |
| | | | of 31 registered investment companies managed by EVM or BMR. |
| |
| Duncan W. Richardson | Vice President | Since 2001 | Director of EVC and Executive Vice President and Chief Equity Investment Officer |
| 10/26/57 | | | of EVC, EVM and BMR. Officer of 82 registered investment companies managed |
| | | | by EVM or BMR. |
| |
| Judith A. Saryan | Vice President | Since 2003 | Vice President of EVM and BMR. Officer of 51 registered investment companies |
| 8/21/54 | | | managed by EVM or BMR. |
| |
| Susan Schiff | Vice President | Since 2002 | Vice President of EVM and BMR. Officer of 37 registered investment companies |
| 3/13/61 | | | managed by EVM or BMR. |
42
Eaton Vance Structured Emerging Markets Fund
| | | |
| | | Term of | |
| | Position(s) | Office and | |
| Name and | with the | Length of | Principal Occupation(s) |
| Date of Birth | Trust | Service | During Past Five Years |
|
| Principal Officers who are not Trustees (continued) | |
| |
| |
| Thomas Seto | Vice President | Since 2007 | Vice President and Director of Portfolio Management of Parametric. Officer of |
| 9/27/62 | | | 32 registered investment companies managed by EVM or BMR. |
| |
| David M. Stein | Vice President | Since 2007 | Managing Director and Chief Investment Officer of Parametric. Officer of 32 |
| 5/4/51 | | | registered investment companies managed by EVM or BMR. |
| |
| Dan R. Strelow | Vice President | Since 2009 | Vice President of EVM and BMR since 2005. Previously, a Managing Director |
| 5/27/59 | | | (since 1988) and Chief Investment Officer (since 2001) of the Fixed Income |
| | | | Group at State Street Research and Management. Officer of 31 registered |
| | | | investment companies managed by EVM or BMR. |
| |
| Mark S. Venezia | Vice President | Since 2007 | Vice President of EVM and BMR. Officer of 38 registered investment companies |
| 5/23/49 | | | managed by EVM or BMR. |
| |
| Adam A. Weigold | Vice President | Since 2007 | Vice President of EVM and BMR. Officer of 69 registered investment companies |
| 3/22/75 | | | managed by EVM or BMR. |
| |
| Barbara E. Campbell | Treasurer | Since 2005 | Vice President of EVM and BMR. Officer of 176 registered investment |
| 6/19/57 | | | companies managed by EVM or BMR. |
| |
| Maureen A. Gemma | Secretary and Chief Legal | Secretary since 2007 and | Vice President of EVM and BMR. Officer of 176 registered investment |
| 5/24/60 | Officer | Chief Legal Officer since | companies managed by EVM or BMR. |
| | | 2008 | |
| |
| Paul M. O’Neil | Chief Compliance Officer | Since 2004 | Vice President of EVM and BMR. Officer of 176 registered investment |
| 7/11/53 | | | companies managed by EVM or BMR. |
| |
| (1) Includes both master and feeder funds in a master-feeder structure. | |
The SAI for the Fund includes additional information about the Trustees and officers of the Fund and can be obtained without charge on Eaton Vance’s website at www.eatonvance.com or by calling 1-800-262-1122.
43
This Page Intentionally Left Blank
Investment Adviser and Administrator of
Eaton Vance Structured Emerging Markets Fund
Eaton Vance Management
Two International Place
Boston, MA 02110
Sub-Adviser of Eaton Vance Structured Emerging Markets Fund
Parametric Portfolio Associates, LLC
1151 Fairview Avenue N.
Seattle, WA 98109
Principal Underwriter*
Eaton Vance Distributors, Inc.
Two International Place
Boston, MA 02110
(617) 482-8260
Custodian
State Street Bank and Trust Company
200 Clarendon Street
Boston, MA 02116
Transfer Agent
PNC Global Investment Servicing
Attn: Eaton Vance Funds
P.O. Box 9653
Providence, RI 02940-9653
(800) 262-1122
Independent Registered Public Accounting Firm
Deloitte & Touche LLP
200 Berkeley Street
Boston, MA 02116-5022
Eaton Vance Structured Emerging Markets Fund
Two International Place
Boston, MA 02110 |
* FINRA BrokerCheck. Investors may check the background of their Investment Professional by contacting the Financial Industry Regulatory
Authority (FINRA). FINRA BrokerCheck is a free tool to help Investors check the professional background of current and former FINRA-registered
securities firms and brokers. FINRA BrokerCheck is available by calling 1-800-289-9999 and at
www.FINRA.org. The FINRA BrokerCheck brochure describing the program is available to investors at www.FINRA.org.
This report must be preceded or accompanied by a current prospectus. Before investing, investors should consider carefully the Fund’s investment
objective(s), risks, and charges and expenses. The Fund’s current prospectus contains this and other information about the Fund and is available
through your financial advisor. Please read the prospectus carefully before you invest or send money. For further information please call 1-800-262-1122. |