UNITED STATES
SECURITIES AND EXCHANGE COMMISSION
Washington, D.C. 20549
FormN-CSR
CERTIFIED SHAREHOLDER REPORT OF REGISTERED
MANAGEMENT INVESTMENT COMPANIES
Investment Company Act File Number:811-04015
Eaton Vance Mutual Funds Trust
(Exact Name of Registrant as Specified in Charter)
Two International Place, Boston, Massachusetts 02110
(Address of Principal Executive Offices)
Maureen A. Gemma
Two International Place, Boston, Massachusetts 02110
(Name and Address of Agent for Services)
(617)482-8260
(Registrant’s Telephone Number)
February 28
Date of Fiscal Year End
February 29, 2020
Date of Reporting Period
| Item 1. | Reports to Stockholders |

Parametric
Dividend Income Fund
Annual Report
February 29, 2020
Important Note. Beginning on January 1, 2021, as permitted by regulations adopted by the Securities and Exchange Commission, paper copies of the Fund’s annual and semi-annual shareholder reports will no longer be sent by mail unless you specifically request paper copies of the reports. Instead, the reports will be made available on the Fund’s website (eatonvance.com/ppafunddocuments), and you will be notified by mail each time a report is posted and provided with a website address to access the report.
If you already elected to receive shareholder reports electronically, you will not be affected by this change and you need not take any action. If you are a direct investor, you may elect to receive shareholder reports and other communications from the Fund electronically by signing up for e-Delivery at eatonvance.com/edelivery. If you own your shares through a financial intermediary (such as a broker-dealer or bank), you must contact your financial intermediary to sign up.
You may elect to receive all future Fund shareholder reports in paper free of charge. If you are a direct investor, you can inform the Fund that you wish to continue receiving paper copies of your shareholder reports by calling 1-800-260-0761. If you own these shares through a financial intermediary, you must contact your financial intermediary or follow instructions included with this disclosure, if applicable, to elect to continue to receive paper copies of your shareholder reports. Your election to receive reports in paper will apply to all Eaton Vance funds held directly or to all funds held through your financial intermediary, as applicable.

Commodity Futures Trading Commission Registration. Effective December 31, 2012, the Commodity Futures Trading Commission (“CFTC”) adopted certain regulatory changes that subject registered investment companies and advisers to regulation by the CFTC if a fund invests more than a prescribed level of its assets in certain CFTC-regulated instruments (including futures, certain options and swap agreements) or markets itself as providing investment exposure to such instruments. The investment adviser has claimed an exclusion from the definition of “commodity pool operator” under the Commodity Exchange Act with respect to its management of the Fund. Accordingly neither the Fund nor the adviser with respect to the operation of the Fund is subject to CFTC regulation. Because of its management of other strategies, the Fund’s adviser is registered with the CFTC as a commodity pool operator. The adviser is also registered as a commodity trading advisor.
Fund shares are not insured by the FDIC and are not deposits or other obligations of, or guaranteed by, any depository institution. Shares are subject to investment risks, including possible loss of principal invested.
This report must be preceded or accompanied by a current summary prospectus or prospectus. Before investing, investors should consider carefully the investment objective, risks, and charges and expenses of a mutual fund. This and other important information is contained in the summary prospectus and prospectus, which can be obtained from a financial intermediary. Prospective investors should read the prospectus carefully before investing. For further information, please call 1-800-260-0761.
Annual ReportFebruary 29, 2020
Parametric
Dividend Income Fund
Table of Contents
| | | | |
Management’s Discussion of Fund Performance | | | 2 | |
| |
Performance | | | 3 | |
| |
Fund Profile | | | 4 | |
| |
Endnotes and Additional Disclosures | | | 5 | |
| |
Fund Expenses | | | 6 | |
| |
Financial Statements | | | 7 | |
| |
Report of Independent Registered Public Accounting Firm | | | 21 | |
| |
Federal Tax Information | | | 22 | |
| |
Management and Organization | | | 23 | |
| |
Important Notices | | | 26 | |
Parametric
Dividend Income Fund
February 29, 2020
Management’s Discussion of Fund Performance1
Economic and Market Conditions
At the start of the12-month period opened on March 1, 2019, investors appeared to be taking a “glass is half full” approach. Although U.S. manufacturing output and business investment remained weak — held back by slowing global growth and anon-again/off-again U.S.-China trade war — strong spending by U.S. consumers and dovish remarks by the U.S. Federal Reserve (the Fed) combined to lift investor sentiment. After four federal funds rate hikes in 2018, markets were projecting the Fed might lower rates in 2019 to stimulate the economy. U.S. unemployment, meanwhile, remained low and hiring remained strong.
As a result, U.S. stocks climbed in March and April 2019. Even a global stock pullback in May — sparked by heightened concerns about the U.S.-China trade dispute — proved to be temporary, and the U.S. stock rally resumed in June and July. After holding interest rates steady through the first half of the year, the Fed cut the federal funds rate on July 31, 2019 — its first reduction in over a decade — followed by two additional rate cuts in September and October to end the period at 1.50% – 1.75%.
After a mild downturn in August, U.S. equities rallied again in the final months of 2019, spurred by optimism about a U.S.- China trade détente and better-than-expected U.S. employment reports. The year ended with two events in December that did much to allay investor concerns about international trade and tariffs: passage of the United States-Mexico-Canada Agreement by the U.S. House of Representatives and the Trump administration’s agreement to aso-called“phase-one” trade deal with China.
In the last two months of the period, however, the outbreak of the coronavirus in China and its spread across the globe reversed much of the markets’ extraordinary gains in 2019. Consumer spending and industrial output in the world’s second-largest economy took a nosedive, as citizens were urged to stay home in an effort to contain the virus and factories delayed reopening until after the Chinese New Year.
As investors around the world worried about the negative effects on the global supply chain and global GDP, nearly all major equity indexes posted negative returns in January and February of 2020.
During the12-month period ended February 29, 2020, the blue-chip Dow Jones Industrial Average®2 returned 0.44%, while the broader U.S. equity market represented by the S&P 500® Index returned 8.19%. The technology-laden Nasdaq Composite Index returned 14.94% during the period.Large-cap U.S. stocks, as measured by the S&P 500® Index, generally outperformed theirsmall-cap counterparts, as measured by the Russell 2000® Index. As a group, growth stocks outpaced value stocks in both large- andsmall-cap categories as measured by the Russell 1000® Growth and Value Indexes (large caps) and the Russell 2000® Growth and Value Indexes (small caps).
Fund Performance
For the12-month period ended February 29, 2020, Parametric Dividend Income Fund (the Fund) returned –4.76% for Investor Class shares at net asset value (NAV), underperforming its benchmark, the Russell 1000® Value Index (the Index), which returned 0.54%.
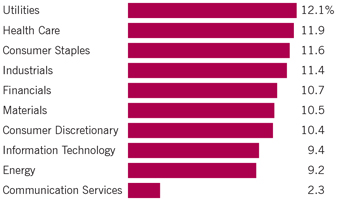
The Fund is structured with a focus on broad diversification6by both allocating a relatively equal weight among each of the Index’s 11 sectors; and allocating a relatively equal weight among select securities — those that rank the highest on Parametric’s combinedlow-risk/high-yield score — within each of the Index’s 11 sectors. The Fund’s equal-weighting approach may result in a portfolio with overweight positions in smaller sectors and underweight positions in larger sectors, as measured by market capitalization.
The Fund’s emphasis on diversification by targeting an equal- sector weighting detracted from performance relative to the Index during the period. An overweight exposure to the energy sector, which lagged the Index, was the largest sector-level detractor. An overweight allocation to the materials sector also detracted. Conversely, the Fund’s overweight allocation to the utilities sector contributed to relative results during the period.
In aggregate the Fund’s emphasis on diversification at the security level also detracted from performance relative to the Index. Security selections in the consumer discretionary sector made up the lion’s share of relative underperformance due, in part, to an overweight position in Six Flags Entertainment Corp., which plummeted after missing earnings and slashing its dividend; and an overweight position in Tupperware Brands Corp. (Tupperware), which declined over 40% during the period amid a first-quarter dividend cut and a third-quarter dividend suspension. By period- end, Tupperware was sold from the Fund.
Stock selections within the financials sector also detracted from relative results due, in part, to an overweight position in Franklin Resources, Inc. The asset manager’s stock price declined over 30% during the period as a result of poor asset flows and the CEO’s decision to step down.
Conversely, stock selections within the health care sector contributed to performance relative to the Index, partially due to the Fund’s underweight position in Pfizer, Inc., which declined in price amid lower-than-expected revenues and the announcement of a merger between the company’s Upjohn Co. business and generic drug firm Mylan NV. The Fund’s overweight positions in West Pharmaceutical Services, Inc. and Quest Diagnostics, Inc., both of which returned over 25% during the period, also contributed to relative results.
See Endnotes and Additional Disclosures in this report.
Past performance is no guarantee of future results. Returns are historical and are calculated by determining the percentage change in net asset value (NAV) or offering price (as applicable) with all distributions reinvested. Investment return and principal value will fluctuate so that shares, when redeemed, may be worth more or less than their original cost. Performance for periods less than or equal to one year is cumulative. Performance is for the stated time period only; due to market volatility, current Fund performance may be lower or higher than the quoted return. For performance as of the most recentmonth-end, please refer to eatonvance.com.
Parametric
Dividend Income Fund
February 29, 2020
Performance2, 3
Portfolio ManagersThomas C. Seto and Alexander Paulsen, each of Parametric Portfolio Associates LLC
| | | | | | | | | | | | | | | | | | | | |
| % Average Annual Total Returns | | Class Inception Date | | | Performance
Inception Date | | | One Year | | | Five Years | | | Since Inception | |
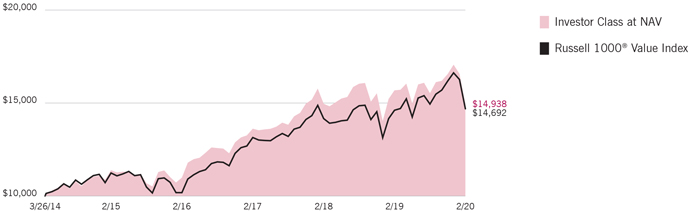
Investor Class at NAV | | | 03/26/2014 | | | | 03/26/2014 | | | | –4.76 | % | | | 5.57 | % | | | 7.00 | % |
Institutional Class at NAV | | | 03/26/2014 | | | | 03/26/2014 | | | | –4.50 | | | | 5.84 | | | | 7.26 | |
Russell 1000® Value Index | | | — | | | | — | | | | 0.54 | % | | | 5.50 | % | | | 6.70 | % |
| | | | | |
| | | | | | | | | | | | | | | | | | | | |
| % Total Annual Operating Expense Ratios4 | | | | | | | | | | | Investor Class | | | Institutional
Class | |
Gross | | | | | | | | | | | | | | | 0.91 | % | | | 0.66 | % |
Net | | | | | | | | | | | | | | | 0.65 | | | | 0.40 | |
Growth of $10,000
This graph shows the change in value of a hypothetical investment of $10,000 in Investor Class of the Fund for the period indicated. For comparison, the same investment is shown in the indicated index.
| | | | | | | | | | | | | | | | |
| Growth of Investment | | Amount Invested | | | Period Beginning | | | At NAV | | | With Maximum Sales Charge | |
Institutional Class | | $ | 50,000 | | | | 03/26/2014 | | | $ | 75,789 | | | | N.A. | |
See Endnotes and Additional Disclosures in this report.
Past performance is no guarantee of future results. Returns are historical and are calculated by determining the percentage change in net asset value (NAV) or offering price (as applicable) with all distributions reinvested. Investment return and principal value will fluctuate so that shares, when redeemed, may be worth more or less than their original cost. Performance for periods less than or equal to one year is cumulative. Performance is for the stated time period only; due to market volatility, current Fund performance may be lower or higher than the quoted return. For performance as of the most recentmonth-end, please refer to eatonvance.com.
Parametric
Dividend Income Fund
February 29, 2020
Fund Profile
Sector Allocation (% of net assets)5
Top 10 Holdings (% of net assets)5
| | | | |
| |
Healthcare Services Group, Inc. | | | 0.7 | % |
| |
NextEra Energy, Inc. | | | 0.7 | |
| |
Jack Henry & Associates, Inc. | | | 0.7 | |
| |
Cardinal Health, Inc. | | | 0.7 | |
| |
Newmont Corp. | | | 0.7 | |
| |
Clorox Co. (The) | | | 0.7 | |
| |
Republic Services, Inc. | | | 0.7 | |
| |
Duke Energy Corp. | | | 0.7 | |
| |
Ameren Corp. | | | 0.7 | |
| |
West Pharmaceutical Services, Inc. | | | 0.6 | |
| |
Total | | | 6.9 | % |
See Endnotes and Additional Disclosures in this report.
Parametric
Dividend Income Fund
February 29, 2020
Endnotes and Additional Disclosures
| 1 | The views expressed in this report are those of the portfolio manager(s) and are current only through the date stated at the top of this page. These views are subject to change at any time based upon market or other conditions, and Eaton Vance and the Fund(s) disclaim any responsibility to update such views. These views may not be relied upon as investment advice and, because investment decisions are based on many factors, may not be relied upon as an indication of trading intent on behalf of any Eaton Vance fund. This commentary may contain statements that are not historical facts, referred to as “forward-looking statements.” The Fund’s actual future results may differ significantly from those stated in any forward-looking statement, depending on factors such as changes in securities or financial markets or general economic conditions, the volume of sales and purchases of Fund shares, the continuation of investment advisory, administrative and service contracts, and other risks discussed from time to time in the Fund’s filings with the Securities and Exchange Commission. |
| 2 | Dow Jones Industrial Average® is a price-weighted average of 30 blue-chip stocks that are generally the leaders in their industry. S&P 500® Index is an unmanaged index of large- cap stocks commonly used as a measure of U.S. stock market performance. S&P Dow Jones Indices are a product of S&P Dow Jones Indices LLC (“S&P DJI”) and have been licensed for use. S&P® and S&P 500® are registered trademarks of S&P DJI; Dow Jones® is a registered trademark of Dow Jones Trademark Holdings LLC (“Dow Jones”); S&P DJI, Dow Jones and their respective affiliates do not sponsor, endorse, sell or promote the Fund, will not have any liability with respect thereto and do not have any liability for any errors, omissions, or interruptions of the S&P Dow Jones Indices. Nasdaq Composite Index is a market capitalization- weighted index of all domestic and international securities listed on Nasdaq. Source: Nasdaq, Inc. The information is provided by Nasdaq (with its affiliates, are referred to as the “Corporations”) and Nasdaq’s third party licensors on an “as is” basis and the Corporations make no guarantees and bear no liability of any kind with respect to the information or the Fund. Russell 2000® Index is an unmanaged index of 2,000 U.S.small-cap stocks. Russell 1000® Growth Index is an unmanaged index of U.S.large-cap growth stocks. Russell 1000® Value Index is an unmanaged index of U.S.large-cap value stocks. Russell 2000® Growth Index is an unmanaged index of U.S.small-cap growth stocks. Russell 2000® Value Index is an unmanaged index of U.S.small-cap value stocks. Unless otherwise stated, index returns do not reflect the effect of any applicable sales charges, commissions, expenses, taxes or leverage, as applicable. It is not possible to invest directly in an index. |
| 3 | Returns are historical and are calculated by determining the percentage change in NAV with all distributions reinvested. Unless otherwise stated, performance does not reflect the deduction of taxes on Fund distributions or redemptions of Fund shares. Performance since inception for an index, if presented, is the performance since the Fund’s or oldest share class’ inception, as applicable. |
| 4 | Source: Fund prospectus. Net expense ratios reflect a contractual expense reimbursement that continues through 6/30/20. Without the reimbursement, performance would have been lower. The expense ratios for the current reporting period can be found in the Financial Highlights section of this report. |
| 5 | Excludes cash and cash equivalents. |
| 6 | Diversification cannot ensure a profit or eliminate the risk of loss. |
| | Fund profile subject to change due to active management. |
Parametric
Dividend Income Fund
February 29, 2020
Fund Expenses
Example: As a Fund shareholder, you incur two types of costs: (1) transaction costs, including sales charges (loads) on purchases and redemption fees (if applicable); and (2) ongoing costs, including management fees; distribution and/or service fees; and other Fund expenses. This Example is intended to help you understand your ongoing costs (in dollars) of Fund investing and to compare these costs with the ongoing costs of investing in other mutual funds. The Example is based on an investment of $1,000 invested at the beginning of the period and held for the entire period (September 1, 2019 – February 29, 2020).
Actual Expenses: The first section of the table below provides information about actual account values and actual expenses. You may use the information in this section, together with the amount you invested, to estimate the expenses that you paid over the period. Simply divide your account value by $1,000 (for example, an $8,600 account value divided by $1,000 = 8.6), then multiply the result by the number in the first section under the heading entitled “Expenses Paid During Period” to estimate the expenses you paid on your account during this period.
Hypothetical Example for Comparison Purposes: The second section of the table below provides information about hypothetical account values and hypothetical expenses based on the actual Fund expense ratio and an assumed rate of return of 5% per year (before expenses), which is not the actual Fund return. The hypothetical account values and expenses may not be used to estimate the actual ending account balance or expenses you paid for the period. You may use this information to compare the ongoing costs of investing in your Fund and other funds. To do so, compare this 5% hypothetical example with the 5% hypothetical examples that appear in the shareholder reports of the other funds.
Please note that the expenses shown in the table are meant to highlight your ongoing costs only and do not reflect any transactional costs, such as sales charges (loads) or redemption fees (if applicable). Therefore, the second section of the table is useful in comparing ongoing costs only, and will not help you determine the relative total costs of owning different funds. In addition, if these transactional costs were included, your costs would be higher.
| | | | | | | | | | | | | | | | |
| | | Beginning
Account Value
(9/1/19) | | | Ending
Account Value
(2/29/20) | | | Expenses Paid
During Period*
(9/1/19 – 2/29/20) | | | Annualized
Expense
Ratio | |
| | | | |
Actual | | | | | | | | | | | | | | | | |
Investor Class | | $ | 1,000.00 | | | $ | 961.90 | | | $ | 3.17 | ** | | | 0.65 | % |
Institutional Class | | $ | 1,000.00 | | | $ | 962.40 | | | $ | 1.95 | ** | | | 0.40 | % |
| | | | | |
Hypothetical | | | | | | | | | | | | | | | | |
(5% return per year before expenses) | | | | | | | | | | | | | | | | |
Investor Class | | $ | 1,000.00 | | | $ | 1,021.60 | | | $ | 3.27 | ** | | | 0.65 | % |
Institutional Class | | $ | 1,000.00 | | | $ | 1,022.90 | | | $ | 2.01 | ** | | | 0.40 | % |
| * | Expenses are equal to the Fund’s annualized expense ratio for the indicated Class, multiplied by the average account value over the period, multiplied by 182/366 (to reflect the one-half year period). The Example assumes that the $1,000 was invested at the net asset value per share determined at the close of business on August 31, 2019. |
| ** | Absent an allocation of certain expenses to affiliates, expenses would be higher. |
Parametric
Dividend Income Fund
February 29, 2020
Portfolio of Investments
| | | | | | | | |
| Common Stocks — 99.5% | |
| Security | | Shares | | | Value | |
|
| Aerospace & Defense — 1.2% | |
| | |
Lockheed Martin Corp. | | | 755 | | | $ | 279,252 | |
| | |
United Technologies Corp. | | | 2,029 | | | | 264,967 | |
| | |
| | | | | | | $ | 544,219 | |
|
| Air Freight & Logistics — 1.6% | |
| | |
C.H. Robinson Worldwide, Inc.(1) | | | 3,614 | | | $ | 249,005 | |
| | |
Expeditors International of Washington, Inc. | | | 3,864 | | | | 272,103 | |
| | |
United Parcel Service, Inc., Class B | | | 2,578 | | | | 233,283 | |
| | |
| | | | | | | $ | 754,391 | |
|
| Auto Components — 0.6% | |
| | |
Gentex Corp. | | | 10,352 | | | $ | 276,398 | |
| | |
| | | | | | | $ | 276,398 | |
|
| Automobiles — 0.5% | |
| | |
Ford Motor Co. | | | 32,208 | | | $ | 224,168 | |
| | |
| | | | | | | $ | 224,168 | |
|
| Banks — 2.6% | |
| | |
Cullen/Frost Bankers, Inc. | | | 3,100 | | | $ | 243,009 | |
| | |
F.N.B. Corp. | | | 22,565 | | | | 227,681 | |
| | |
PacWest Bancorp | | | 7,498 | | | | 237,237 | |
| | |
People’s United Financial, Inc. | | | 16,698 | | | | 233,605 | |
| | |
Umpqua Holdings Corp. | | | 17,077 | | | | 262,815 | |
| | |
| | | | | | | $ | 1,204,347 | |
|
| Beverages — 1.2% | |
| | |
Coca-Cola Co. (The) | | | 5,444 | | | $ | 291,199 | |
| | |
PepsiCo, Inc. | | | 2,158 | | | | 284,921 | |
| | |
| | | | | | | $ | 576,120 | |
|
| Biotechnology — 1.8% | |
| | |
AbbVie, Inc. | | | 3,407 | | | $ | 292,014 | |
| | |
Amgen, Inc. | | | 1,255 | | | | 250,661 | |
| | |
Gilead Sciences, Inc. | | | 4,330 | | | | 300,329 | |
| | |
| | | | | | | $ | 843,004 | |
|
| Building Products — 0.6% | |
| | |
Johnson Controls International PLC | | | 7,414 | | | $ | 271,130 | |
| | |
| | | | | | | $ | 271,130 | |
| | | | | | | | |
| Security | | Shares | | | Value | |
|
| Capital Markets — 1.7% | |
| | |
Federated Hermes, Inc., Class B | | | 9,068 | | | $ | 261,612 | |
| | |
Franklin Resources, Inc. | | | 10,870 | | | | 236,531 | |
| | |
T. Rowe Price Group, Inc. | | | 2,485 | | | | 293,255 | |
| | |
| | | | | | | $ | 791,398 | |
|
| Chemicals — 4.7% | |
| | |
Air Products and Chemicals, Inc. | | | 1,288 | | | $ | 282,858 | |
| | |
Celanese Corp. | | | 2,436 | | | | 228,351 | |
| | |
Corteva, Inc. | | | 10,504 | | | | 285,709 | |
| | |
Dow, Inc. | | | 5,137 | | | | 207,586 | |
| | |
DuPont de Nemours, Inc. | | | 4,820 | | | | 206,778 | |
| | |
Eastman Chemical Co. | | | 3,574 | | | | 219,837 | |
| | |
International Flavors & Fragrances, Inc. | | | 2,376 | | | | 284,597 | |
| | |
Linde PLC | | | 1,439 | | | | 274,863 | |
| | |
LyondellBasell Industries NV, Class A | | | 2,966 | | | | 211,950 | |
| | |
| | | | | | | $ | 2,202,529 | |
|
| Commercial Services & Supplies — 2.0% | |
| | |
Healthcare Services Group, Inc.(1) | | | 12,457 | | | $ | 343,066 | |
| | |
Republic Services, Inc. | | | 3,379 | | | | 304,989 | |
| | |
Waste Management, Inc. | | | 2,592 | | | | 287,219 | |
| | |
| | | | | | | $ | 935,274 | |
|
| Communications Equipment — 1.6% | |
| | |
Cisco Systems, Inc. | | | 6,068 | | | $ | 242,295 | |
| | |
InterDigital, Inc. | | | 5,257 | | | | 278,043 | |
| | |
Juniper Networks, Inc. | | | 11,454 | | | | 243,054 | |
| | |
| | | | | | | $ | 763,392 | |
|
| Containers & Packaging — 2.0% | |
| | |
International Paper Co. | | | 6,097 | | | $ | 225,345 | |
| | |
Packaging Corp. of America | | | 2,699 | | | | 244,584 | |
| | |
Sonoco Products Co. | | | 4,885 | | | | 235,506 | |
| | |
WestRock Co. | | | 7,053 | | | | 234,512 | |
| | |
| | | | | | | $ | 939,947 | |
|
| Distributors — 0.5% | |
| | |
Genuine Parts Co. | | | 2,854 | | | $ | 248,983 | |
| | |
| | | | | | | $ | 248,983 | |
|
| Diversified Consumer Services — 0.5% | |
| | |
Graham Holdings Co., Class B | | | 447 | | | $ | 224,787 | |
| | |
| | | | | | | $ | 224,787 | |
| | | | |
| | 7 | | See Notes to Financial Statements. |
Parametric
Dividend Income Fund
February 29, 2020
Portfolio of Investments — continued
| | | | | | | | |
| Security | | Shares | | | Value | |
|
| Diversified Telecommunication Services — 1.1% | |
| | |
AT&T, Inc. | | | 7,719 | | | $ | 271,863 | |
| | |
Verizon Communications, Inc. | | | 4,853 | | | | 262,839 | |
| | |
| | | | | | | $ | 534,702 | |
|
| Electric Utilities — 6.9% | |
| | |
American Electric Power Co., Inc. | | | 3,208 | | | $ | 286,346 | |
| | |
Avangrid, Inc. | | | 5,784 | | | | 287,407 | |
| | |
Duke Energy Corp. | | | 3,322 | | | | 304,628 | |
| | |
Entergy Corp. | | | 2,533 | | | | 296,133 | |
| | |
Evergy, Inc. | | | 4,476 | | | | 292,507 | |
| | |
Eversource Energy | | | 3,465 | | | | 299,584 | |
| | |
NextEra Energy, Inc. | | | 1,245 | | | | 314,686 | |
| | |
OGE Energy Corp. | | | 6,784 | | | | 258,470 | |
| | |
Pinnacle West Capital Corp. | | | 3,221 | | | | 288,247 | |
| | |
Portland General Electric Co. | | | 5,379 | | | | 292,671 | |
| | |
Southern Co. (The) | | | 4,799 | | | | 289,668 | |
| | |
| | | | | | | $ | 3,210,347 | |
|
| Electrical Equipment — 1.1% | |
| | |
Eaton Corp. PLC | | | 3,175 | | | $ | 288,036 | |
| | |
Emerson Electric Co. | | | 3,691 | | | | 236,630 | |
| | |
| | | | | | | $ | 524,666 | |
|
| Electronic Equipment, Instruments & Components — 1.2% | |
| | |
Dolby Laboratories, Inc., Class A | | | 4,415 | | | $ | 290,065 | |
| | |
National Instruments Corp. | | | 6,967 | | | | 280,631 | |
| | |
| | | | | | | $ | 570,696 | |
|
| Energy Equipment & Services — 1.7% | |
| | |
Baker Hughes Co. | | | 11,525 | | | $ | 185,437 | |
| | |
Halliburton Co. | | | 11,635 | | | | 197,330 | |
| | |
Helmerich & Payne, Inc. | | | 6,165 | | | | 227,427 | |
| | |
Schlumberger, Ltd. | | | 7,432 | | | | 201,333 | |
| | |
| | | | | | | $ | 811,527 | |
|
| Food & Staples Retailing — 1.7% | |
| | |
Costco Wholesale Corp. | | | 1,023 | | | $ | 287,606 | |
| | |
Walgreens Boots Alliance, Inc. | | | 4,849 | | | | 221,890 | |
| | |
Walmart, Inc. | | | 2,524 | | | | 271,785 | |
| | |
| | | | | | | $ | 781,281 | |
|
| Food Products — 4.4% | |
| | |
Archer-Daniels-Midland Co. | | | 6,510 | | | $ | 245,101 | |
| | |
Bunge, Ltd. | | | 5,170 | | | | 242,732 | |
| | | | | | | | |
| Security | | Shares | | | Value | |
|
| Food Products (continued) | |
| | |
General Mills, Inc. | | | 5,618 | | | $ | 275,282 | |
| | |
Hormel Foods Corp.(1) | | | 6,723 | | | | 279,677 | |
| | |
Ingredion, Inc. | | | 3,013 | | | | 250,983 | |
| | |
Kellogg Co. | | | 4,400 | | | | 266,068 | |
| | |
Kraft Heinz Co. (The) | | | 9,469 | | | | 234,547 | |
| | |
Mondelez International, Inc., Class A | | | 5,278 | | | | 278,678 | |
| | |
| | | | | | | $ | 2,073,068 | |
|
| Gas Utilities — 0.6% | |
| | |
Atmos Energy Corp. | | | 2,599 | | | $ | 268,347 | |
| | |
| | | | | | | $ | 268,347 | |
|
| Health Care Equipment & Supplies — 3.6% | |
| | |
Abbott Laboratories | | | 3,503 | | | $ | 269,836 | |
| | |
Baxter International, Inc. | | | 3,587 | | | | 299,407 | |
| | |
Becton, Dickinson and Co. | | | 1,122 | | | | 266,834 | |
| | |
Medtronic PLC | | | 2,680 | | | | 269,796 | |
| | |
Stryker Corp. | | | 1,444 | | | | 275,212 | |
| | |
West Pharmaceutical Services, Inc. | | | 2,008 | | | | 302,324 | |
| | |
| | | | | | | $ | 1,683,409 | |
|
| Health Care Providers & Services — 2.5% | |
| | |
Cardinal Health, Inc. | | | 5,961 | | | $ | 310,688 | |
| | |
Chemed Corp. | | | 686 | | | | 286,487 | |
| | |
Quest Diagnostics, Inc. | | | 2,771 | | | | 293,892 | |
| | |
UnitedHealth Group, Inc. | | | 1,026 | | | | 261,589 | |
| | |
| | | | | | | $ | 1,152,656 | |
|
| Hotels, Restaurants & Leisure — 3.5% | |
| | |
Carnival Corp. | | | 5,886 | | | $ | 196,946 | |
| | |
Cracker Barrel Old Country Store, Inc.(1) | | | 1,849 | | | | 265,017 | |
| | |
Darden Restaurants, Inc. | | | 2,768 | | | | 269,880 | |
| | |
Extended Stay America, Inc. | | | 19,436 | | | | 213,407 | |
| | |
Las Vegas Sands Corp. | | | 4,351 | | | | 253,707 | |
| | |
Six Flags Entertainment Corp. | | | 6,331 | | | | 160,048 | |
| | |
Vail Resorts, Inc. | | | 1,235 | | | | 262,573 | |
| | |
| | | | | | | $ | 1,621,578 | |
|
| Household Durables — 1.1% | |
| | |
Garmin, Ltd. | | | 3,105 | | | $ | 274,451 | |
| | |
Leggett & Platt, Inc. | | | 5,905 | | | | 234,192 | |
| | |
| | | | | | | $ | 508,643 | |
| | | | |
| | 8 | | See Notes to Financial Statements. |
Parametric
Dividend Income Fund
February 29, 2020
Portfolio of Investments — continued
| | | | | | | | |
| Security | | Shares | | | Value | |
|
| Household Products — 3.1% | |
| | |
Church & Dwight Co., Inc. | | | 4,268 | | | $ | 296,712 | |
| | |
Clorox Co. (The) | | | 1,915 | | | | 305,289 | |
| | |
Colgate-Palmolive Co. | | | 4,383 | | | | 296,159 | |
| | |
Kimberly-Clark Corp. | | | 2,170 | | | | 284,682 | |
| | |
Procter & Gamble Co. (The) | | | 2,422 | | | | 274,243 | |
| | |
| | | | | | | $ | 1,457,085 | |
|
| Industrial Conglomerates — 1.1% | |
| | |
3M Co. | | | 1,589 | | | $ | 237,142 | |
| | |
Honeywell International, Inc. | | | 1,703 | | | | 276,176 | |
| | |
| | | | | | | $ | 513,318 | |
|
| Insurance — 5.9% | |
| | |
Aflac, Inc. | | | 5,639 | | | $ | 241,631 | |
| | |
American Financial Group, Inc. | | | 2,736 | | | | 252,861 | |
| | |
Cincinnati Financial Corp. | | | 2,747 | | | | 256,130 | |
| | |
Everest Re Group, Ltd. | | | 1,032 | | | | 255,812 | |
| | |
Fidelity National Financial, Inc. | | | 6,670 | | | | 258,529 | |
| | |
Hanover Insurance Group, Inc. (The) | | | 2,177 | | | | 258,062 | |
| | |
Hartford Financial Services Group, Inc. (The) | | | 4,840 | | | | 241,758 | |
| | |
Old Republic International Corp. | | | 12,842 | | | | 253,244 | |
| | |
Principal Financial Group, Inc. | | | 5,284 | | | | 234,557 | |
| | |
Prudential Financial, Inc. | | | 3,025 | | | | 228,236 | |
| | |
Travelers Cos., Inc. (The) | | | 2,113 | | | | 253,159 | |
| | |
| | | | | | | $ | 2,733,979 | |
|
| IT Services — 4.1% | |
| | |
Accenture PLC, Class A | | | 1,444 | | | $ | 260,772 | |
| | |
Amdocs, Ltd. | | | 4,204 | | | | 268,005 | |
| | |
Automatic Data Processing, Inc. | | | 1,792 | | | | 277,294 | |
| | |
International Business Machines Corp. | | | 2,262 | | | | 294,399 | |
| | |
Jack Henry & Associates, Inc. | | | 2,057 | | | | 312,129 | |
| | |
Paychex, Inc. | | | 3,379 | | | | 261,805 | |
| | |
Western Union Co. (The) | | | 11,355 | | | | 254,239 | |
| | |
| | | | | | | $ | 1,928,643 | |
|
| Life Sciences Tools & Services — 1.2% | |
| | |
Agilent Technologies, Inc. | | | 3,551 | | | $ | 273,676 | |
| | |
Bio-Techne Corp. | | | 1,398 | | | | 264,068 | |
| | |
| | | | | | | $ | 537,744 | |
|
| Machinery — 1.7% | |
| | |
Cummins, Inc. | | | 1,697 | | | $ | 256,739 | |
| | |
Graco, Inc. | | | 5,748 | | | | 283,491 | |
| | | | | | | | |
| Security | | Shares | | | Value | |
|
| Machinery (continued) | |
| | |
Snap-on, Inc. | | | 1,798 | | | $ | 260,261 | |
| | |
| | | | | | | $ | 800,491 | |
|
| Media — 1.2% | |
| | |
Interpublic Group of Cos., Inc. (The) | | | 13,115 | | | $ | 280,136 | |
| | |
Omnicom Group, Inc. | | | 3,763 | | | | 260,701 | |
| | |
| | | | | | | $ | 540,837 | |
|
| Metals & Mining — 2.7% | |
| | |
Newmont Corp. | | | 6,950 | | | $ | 310,179 | |
| | |
Nucor Corp. | | | 4,965 | | | | 205,303 | |
| | |
Reliance Steel & Aluminum Co. | | | 2,512 | | | | 256,952 | |
| | |
Royal Gold, Inc. | | | 2,440 | | | | 235,387 | |
| | |
Southern Copper Corp. | | | 7,096 | | | | 238,780 | |
| | |
| | | | | | | $ | 1,246,601 | |
| | |
| Multi-Utilities — 4.7% | | | | | | |
| | |
Ameren Corp. | | | 3,849 | | | $ | 304,071 | |
| | |
Consolidated Edison, Inc. | | | 3,178 | | | | 250,490 | |
| | |
Dominion Energy, Inc. | | | 3,613 | | | | 282,465 | |
| | |
DTE Energy Co. | | | 2,240 | | | | 250,141 | |
| | |
MDU Resources Group, Inc. | | | 9,721 | | | | 269,563 | |
| | |
NorthWestern Corp. | | | 4,100 | | | | 288,394 | |
| | |
Public Service Enterprise Group, Inc. | | | 4,959 | | | | 254,446 | |
| | |
WEC Energy Group, Inc. | | | 3,258 | | | | 300,811 | |
| | |
| | | | | | | $ | 2,200,381 | |
|
| Multiline Retail — 1.0% | |
| | |
Kohl’s Corp. | | | 5,888 | | | $ | 230,515 | |
| | |
Macy’s, Inc. | | | 17,091 | | | | 226,114 | |
| | |
| | | | | | | $ | 456,629 | |
|
| Oil, Gas & Consumable Fuels — 7.5% | |
| | |
Cabot Oil & Gas Corp. | | | 16,297 | | | $ | 227,017 | |
| | |
Chevron Corp. | | | 2,334 | | | | 217,856 | |
| | |
ConocoPhillips | | | 4,325 | | | | 209,417 | |
| | |
CVR Energy, Inc. | | | 7,254 | | | | 206,159 | |
| | |
EOG Resources, Inc. | | | 3,394 | | | | 214,704 | |
| | |
Equitrans Midstream Corp.(1) | | | 21,670 | | | | 152,990 | |
| | |
Exxon Mobil Corp. | | | 4,107 | | | | 211,264 | |
| | |
HollyFrontier Corp. | | | 5,724 | | | | 192,784 | |
| | |
Kinder Morgan, Inc. | | | 14,142 | | | | 271,102 | |
| | |
Marathon Petroleum Corp. | | | 4,802 | | | | 227,711 | |
| | |
Occidental Petroleum Corp. | | | 6,914 | | | | 226,364 | |
| | | | |
| | 9 | | See Notes to Financial Statements. |
Parametric
Dividend Income Fund
February 29, 2020
Portfolio of Investments — continued
| | | | | | | | |
| Security | | Shares | | | Value | |
|
| Oil, Gas & Consumable Fuels (continued) | |
| | |
ONEOK, Inc. | | | 4,014 | | | $ | 267,814 | |
| | |
Phillips 66 | | | 2,518 | | | | 188,498 | |
| | |
Targa Resources Corp.(1) | | | 7,348 | | | | 238,075 | |
| | |
Valero Energy Corp. | | | 3,027 | | | | 200,539 | |
| | |
Williams Cos., Inc. (The) | | | 12,338 | | | | 235,039 | |
| | |
| | | | | | | $ | 3,487,333 | |
|
| Paper & Forest Products — 1.1% | |
| | |
Domtar Corp. | | | 7,831 | | | $ | 225,298 | |
| | |
Louisiana-Pacific Corp. | | | 10,180 | | | | 289,621 | |
| | |
| | | | | | | $ | 514,919 | |
|
| Pharmaceuticals — 2.9% | |
| | |
Bristol-Myers Squibb Co. | | | 4,729 | | | $ | 279,295 | |
| | |
Eli Lilly & Co. | | | 2,316 | | | | 292,117 | |
| | |
Johnson & Johnson | | | 2,094 | | | | 281,601 | |
| | |
Merck & Co., Inc. | | | 3,340 | | | | 255,710 | |
| | |
Pfizer, Inc. | | | 7,248 | | | | 242,228 | |
| | |
| | | | | | | $ | 1,350,951 | |
| | |
| Professional Services — 0.5% | | | | | | |
| | |
Robert Half International, Inc. | | | 4,481 | | | $ | 225,887 | |
| | |
| | | | | | | $ | 225,887 | |
|
| Semiconductors & Semiconductor Equipment — 1.7% | |
| | |
Intel Corp. | | | 5,056 | | | $ | 280,709 | |
| | |
Maxim Integrated Products, Inc. | | | 4,912 | | | | 273,205 | |
| | |
Texas Instruments, Inc. | | | 2,299 | | | | 262,408 | |
| | |
| | | | | | | $ | 816,322 | |
|
| Software — 0.6% | |
| | |
Microsoft Corp. | | | 1,827 | | | $ | 295,992 | |
| | |
| | | | | | | $ | 295,992 | |
|
| Specialty Retail — 1.8% | |
| | |
Best Buy Co., Inc. | | | 3,444 | | | $ | 260,539 | |
| | |
Tiffany & Co. | | | 2,258 | | | | 301,646 | |
| | |
Williams-Sonoma, Inc.(1) | | | 4,131 | | | | 257,733 | |
| | |
| | | | | | | $ | 819,918 | |
|
| Textiles, Apparel & Luxury Goods — 1.0% | |
| | |
Tapestry, Inc. | | | 11,250 | | | $ | 263,812 | |
| | |
VF Corp. | | | 2,795 | | | | 201,240 | |
| | |
| | | | | | | $ | 465,052 | |
| | | | | | | | |
| Security | | Shares | | | Value | |
|
| Thrifts & Mortgage Finance — 0.5% | |
| | |
New York Community Bancorp, Inc. | | | 23,727 | | | $ | 256,489 | |
| | |
| | | | | | | $ | 256,489 | |
|
| Tobacco — 1.1% | |
| | |
Altria Group, Inc. | | | 5,601 | | | $ | 226,112 | |
| | |
Philip Morris International, Inc. | | | 3,541 | | | | 289,902 | |
| | |
| | | | | | | $ | 516,014 | |
|
| Trading Companies & Distributors — 1.6% | |
| | |
Fastenal Co. | | | 8,162 | | | $ | 279,304 | |
| | |
MSC Industrial Direct Co., Inc., Class A | | | 3,537 | | | | 218,657 | |
| | |
Watsco, Inc. | | | 1,681 | | | | 263,883 | |
| | |
| | | | | | | $ | 761,844 | |
| |
Total Common Stocks
(identified cost $45,786,110) | | | $ | 46,467,436 | |
| | |
| Short-Term Investments — 0.5% | | | | | | | | |
| Description | | Units | | | Value | |
| | |
Eaton Vance Cash Reserves Fund, LLC, 1.75%(2) | | | 233,191 | | | $ | 233,238 | |
| |
Total Short-Term Investments
(identified cost $233,238) | | | $ | 233,238 | |
| |
Total Investments — 100.0%
(identified cost $46,019,348) | | | $ | 46,700,674 | |
| |
Other Assets, Less Liabilities — 0.0%(3) | | | $ | 8,194 | |
| |
Net Assets — 100.0% | | | $ | 46,708,868 | |
The percentage shown for each investment category in the Portfolio of Investments is based on net assets.
| (1) | All or a portion of this security was on loan at February 29, 2020. The aggregate market value of securities on loan at February 29, 2020 was $1,101,025. |
| (2) | Affiliated investment company, available to Eaton Vance portfolios and funds, which invests in high quality, U.S. dollar denominated money market instruments. The rate shown is the annualized seven-day yield as of February 29, 2020. |
| (3) | Amount is less than 0.05%. |
| | | | |
| | 10 | | See Notes to Financial Statements. |
Parametric
Dividend Income Fund
February 29, 2020
Statement of Assets and Liabilities
| | | | |
| Assets | | February 29, 2020 | |
| |
Unaffiliated investments, at value including $1,101,025 of securities on loan (identified cost, $45,786,110) | | $ | 46,467,436 | |
| |
Affiliated investment, at value (identified cost, $233,238) | | | 233,238 | |
| |
Dividends receivable | | | 148,780 | |
| |
Dividends receivable from affiliated investment | | | 210 | |
| |
Receivable for Fund shares sold | | | 963 | |
| |
Securities lending income receivable | | | 265 | |
| |
Receivable from affiliates | | | 6,244 | |
| |
Total assets | | $ | 46,857,136 | |
|
| Liabilities | |
| |
Payable for Fund shares redeemed | | $ | 67,363 | |
| |
Payable to affiliates: | | | | |
| |
Investment adviser and administration fee | | | 12,681 | |
| |
Distribution and service fees | | | 823 | |
| |
Accrued expenses | | | 67,401 | |
| |
Total liabilities | | $ | 148,268 | |
| |
Net Assets | | $ | 46,708,868 | |
|
| Sources of Net Assets | |
| |
Paid-in capital | | $ | 49,006,699 | |
| |
Accumulated loss | | | (2,297,831 | ) |
| |
Total | | $ | 46,708,868 | |
|
| Investor Class Shares | |
| |
Net Assets | | $ | 3,612,474 | |
| |
Shares Outstanding | | | 302,285 | |
| |
Net Asset Value, Offering Price and Redemption Price Per Share | | | | |
| |
(net assets ÷ shares of beneficial interest outstanding) | | $ | 11.95 | |
|
| Institutional Class Shares | |
| |
Net Assets | | $ | 43,096,394 | |
| |
Shares Outstanding | | | 3,598,971 | |
| |
Net Asset Value, Offering Price and Redemption Price Per Share | | | | |
| |
(net assets ÷ shares of beneficial interest outstanding) | | $ | 11.97 | |
| | | | |
| | 11 | | See Notes to Financial Statements. |
Parametric
Dividend Income Fund
February 29, 2020
Statement of Operations
| | | | |
| Investment Income | | Year Ended
February 29, 2020 | |
| |
Dividends | | $ | 1,918,736 | |
| |
Dividends from affiliated investment | | | 5,412 | |
| |
Securities lending income, net | | | 1,549 | |
| |
Total investment income | | $ | 1,925,697 | |
| |
| Expenses | | | | |
| |
Investment adviser and administration fee | | $ | 169,155 | |
| |
Distribution and service fees | | | | |
| |
Investor Class | | | 13,206 | |
| |
Trustees’ fees and expenses | | | 3,240 | |
| |
Custodian fee | | | 26,445 | |
| |
Transfer and dividend disbursing agent fees | | | 16,193 | |
| |
Legal and accounting services | | | 40,262 | |
| |
Printing and postage | | | 12,521 | |
| |
Registration fees | | | 42,760 | |
| |
Miscellaneous | | | 11,515 | |
| |
Total expenses | | $ | 335,297 | |
| |
Deduct — | | | | |
| |
Allocation of expenses to affiliates | | $ | 96,011 | |
| |
Total expense reductions | | $ | 96,011 | |
| |
Net expenses | | $ | 239,286 | |
| |
Net investment income | | $ | 1,686,411 | |
| |
| Realized and Unrealized Gain (Loss) | | | | |
| |
Net realized gain (loss) — | | | | |
| |
Investment transactions | | $ | (285,562 | ) |
| |
Investment transactions — affiliated investment | | | 137 | |
| |
Net realized loss | | $ | (285,425 | ) |
| |
Change in unrealized appreciation (depreciation) — | | | | |
| |
Investments | | $ | (3,163,823 | ) |
| |
Investments — affiliated investment | | | (5 | ) |
| |
Net change in unrealized appreciation (depreciation) | | $ | (3,163,828 | ) |
| |
Net realized and unrealized loss | | $ | (3,449,253 | ) |
| |
Net decrease in net assets from operations | | $ | (1,762,842 | ) |
| | | | |
| | 12 | | See Notes to Financial Statements. |
Parametric
Dividend Income Fund
February 29, 2020
Statements of Changes in Net Assets
| | | | | | | | |
| Increase (Decrease) in Net Assets | | Year Ended
February 29, 2020 | | | Year Ended
February 28, 2019 | |
| | |
From operations — | | | | | | | | |
| | |
Net investment income | | $ | 1,686,411 | | | $ | 1,599,130 | |
| | |
Net realized loss | | | (285,425 | ) | | | (1,427,079 | ) |
| | |
Net change in unrealized appreciation (depreciation) | | | (3,163,828 | ) | | | 1,169,862 | |
| | |
Net increase (decrease) in net assets from operations | | $ | (1,762,842 | ) | | $ | 1,341,913 | |
| | |
Distributions to shareholders — | | | | | | | | |
| | |
Investor Class | | $ | (138,069 | ) | | $ | (316,362 | ) |
| | |
Institutional Class | | | (1,432,548 | ) | | | (2,434,344 | ) |
| | |
Total distributions to shareholders | | $ | (1,570,617 | ) | | $ | (2,750,706 | ) |
| | |
Transactions in shares of beneficial interest — | | | | | | | | |
| | |
Proceeds from sale of shares | | | | | | | | |
| | |
Investor Class | | $ | 517,738 | | | $ | 3,262,205 | |
| | |
Institutional Class | | | 11,968,522 | | | | 50,419,160 | |
| | |
Net asset value of shares issued to shareholders in payment of distributions declared | | | | | | | | |
| | |
Investor Class | | | 138,069 | | | | 316,362 | |
| | |
Institutional Class | | | 743,989 | | | | 1,591,258 | |
| | |
Cost of shares redeemed | | | | | | | | |
| | |
Investor Class | | | (3,365,043 | ) | | | (2,512,977 | ) |
| | |
Institutional Class | | | (17,902,158 | ) | | | (20,468,647 | ) |
| | |
Net increase (decrease) in net assets from Fund share transactions | | $ | (7,898,883 | ) | | $ | 32,607,361 | |
| | |
Net increase (decrease) in net assets | | $ | (11,232,342 | ) | | $ | 31,198,568 | |
|
| Net Assets | |
| | |
At beginning of year | | $ | 57,941,210 | | | $ | 26,742,642 | |
| | |
At end of year | | $ | 46,708,868 | | | $ | 57,941,210 | |
| | | | |
| | 13 | | See Notes to Financial Statements. |
Parametric
Dividend Income Fund
February 29, 2020
Financial Highlights
| | | | | | | | | | | | | | | | | | | | |
| | | Investor Class | |
| | | |
| | | Year Ended
February 29, 2020 | | | Year Ended February 28, | | | Year Ended
February 29, 2016 | |
| | | 2019 | | | 2018 | | | 2017 | |
| | | | | | |
Net asset value — Beginning of year | | $ | 12.870 | | | $ | 12.910 | | | $ | 12.170 | | | $ | 10.080 | | | $ | 10.930 | |
| | | | | |
| Income (Loss) From Operations | | | | | | | | | | | | | | | | | | | | |
| | | | | |
Net investment income(1) | | $ | 0.362 | | | $ | 0.366 | | | $ | 0.328 | | | $ | 0.275 | | | $ | 0.284 | |
| | | | | |
Net realized and unrealized gain (loss) | | | (0.950 | ) | | | 0.216 | | | | 0.854 | | | | 2.114 | | | | (0.666 | ) |
| | | | | |
Total income (loss) from operations | | $ | (0.588 | ) | | $ | 0.582 | | | $ | 1.182 | | | $ | 2.389 | | | $ | (0.382 | ) |
| | | | | |
| Less Distributions | | | | | | | | | | | | | | | | | | | | |
| | | | | |
From net investment income | | $ | (0.325 | ) | | $ | (0.306 | ) | | $ | (0.305 | ) | | $ | (0.249 | ) | | $ | (0.301 | ) |
| | | | | |
From net realized gain | | | (0.007 | ) | | | (0.316 | ) | | | (0.137 | ) | | | (0.050 | ) | | | (0.167 | ) |
| | | | | |
Total distributions | | $ | (0.332 | ) | | $ | (0.622 | ) | | $ | (0.442 | ) | | $ | (0.299 | ) | | $ | (0.468 | ) |
| | | | | |
Net asset value — End of year | | $ | 11.950 | | | $ | 12.870 | | | $ | 12.910 | | | $ | 12.170 | | | $ | 10.080 | |
| | | | | |
Total Return(2)(3) | | | (4.76 | )% | | | 4.81 | % | | | 9.87 | % | | | 23.97 | % | | | (3.51 | )% |
| | | | | |
| Ratios/Supplemental Data | | | | | | | | | | | | | | | | | | | | |
| | | | | |
Net assets, end of year (000’s omitted) | | $ | 3,612 | | | $ | 6,597 | | | $ | 5,633 | | | $ | 2,450 | | | $ | 97 | |
| | | | | |
Ratios (as a percentage of average daily net assets): | | | | | | | | | | | | | | | | | | | | |
| | | | | |
Expenses(3) | | | 0.65 | % | | | 0.65 | % | | | 0.65 | % | | | 0.68 | % | | | 0.85 | % |
| | | | | |
Net investment income | | | 2.78 | % | | | 2.82 | % | | | 2.61 | % | | | 2.34 | % | | | 2.77 | % |
| | | | | |
Portfolio Turnover | | | 51 | % | | | 77 | % | | | 30 | % | | | 26 | % | | | 31 | % |
| (1) | Computed using average shares outstanding. |
| (2) | Returns are historical and are calculated by determining the percentage change in net asset value with all distributions reinvested. |
| (3) | The investment adviser and administrator and the sub-adviser reimbursed certain operating expenses (equal to 0.17%, 0.26%, 0.62%, 1.60% and 3.22% of average daily net assets for the years ended February 29, 2020, February 28, 2019, 2018, 2017 and February 29, 2016, respectively). Absent this reimbursement, total return would be lower. |
| | | | |
| | 14 | | See Notes to Financial Statements. |
Parametric
Dividend Income Fund
February 29, 2020
Financial Highlights — continued
| | | | | | | | | | | | | | | | | | | | |
| | | Institutional Class | |
| | | |
| | | Year Ended
February 29, 2020 | | | Year Ended February 28, | | | Year Ended
February 29, 2016 | |
| | | 2019 | | | 2018 | | | 2017 | |
| | | | | | |
Net asset value — Beginning of year | | $ | 12.890 | | | $ | 12.930 | | | $ | 12.190 | | | $ | 10.090 | | | $ | 10.930 | |
| | | | | |
| Income (Loss) From Operations | | | | | | | | | | | | | | | | | | | | |
| | | | | |
Net investment income(1) | | $ | 0.394 | | | $ | 0.399 | | | $ | 0.358 | | | $ | 0.310 | | | $ | 0.334 | |
| | | | | |
Net realized and unrealized gain (loss) | | | (0.947 | ) | | | 0.215 | | | | 0.851 | | | | 2.108 | | | | (0.683 | ) |
| | | | | |
Total income (loss) from operations | | $ | (0.553 | ) | | $ | 0.614 | | | $ | 1.209 | | | $ | 2.418 | | | $ | (0.349 | ) |
| | | | | |
| Less Distributions | | | | | | | | | | | | | | | | | | | | |
| | | | | |
From net investment income | | $ | (0.360 | ) | | $ | (0.338 | ) | | $ | (0.332 | ) | | $ | (0.268 | ) | | $ | (0.324 | ) |
| | | | | |
From net realized gain | | | (0.007 | ) | | | (0.316 | ) | | | (0.137 | ) | | | (0.050 | ) | | | (0.167 | ) |
| | | | | |
Total distributions | | $ | (0.367 | ) | | $ | (0.654 | ) | | $ | (0.469 | ) | | $ | (0.318 | ) | | $ | (0.491 | ) |
| | | | | |
Net asset value — End of year | | $ | 11.970 | | | $ | 12.890 | | | $ | 12.930 | | | $ | 12.190 | | | $ | 10.090 | |
| | | | | |
Total Return(2)(3) | | | (4.50 | )% | | | 5.06 | % | | | 10.09 | % | | | 24.26 | % | | | (3.21 | )% |
| | | | | |
| Ratios/Supplemental Data | | | | | | | | | | | | | | | | | | | | |
| | | | | |
Net assets, end of year (000’s omitted) | | $ | 43,096 | | | $ | 51,344 | | | $ | 21,110 | | | $ | 15,070 | | | $ | 3,689 | |
| | | | | |
Ratios (as a percentage of average daily net assets): | | | | | | | | | | | | | | | | | | | | |
| | | | | |
Expenses(3) | | | 0.40 | % | | | 0.40 | % | | | 0.40 | % | | | 0.51 | % | | | 0.60 | % |
| | | | | |
Net investment income | | | 3.01 | % | | | 3.07 | % | | | 2.84 | % | | | 2.71 | % | | | 3.21 | % |
| | | | | |
Portfolio Turnover | | | 51 | % | | | 77 | % | | | 30 | % | | | 26 | % | | | 31 | % |
| (1) | Computed using average shares outstanding. |
| (2) | Returns are historical and are calculated by determining the percentage change in net asset value with all distributions reinvested. |
| (3) | The investment adviser and administrator and the sub-adviser reimbursed certain operating expenses (equal to 0.17%, 0.26%, 0.62%, 1.89% and 3.22% of average daily net assets for the years ended February 29, 2020, February 28, 2019, 2018, 2017 and February 29, 2016, respectively). Absent this reimbursement, total return would be lower. |
| | | | |
| | 15 | | See Notes to Financial Statements. |
Parametric
Dividend Income Fund
February 29, 2020
Notes to Financial Statements
1 Significant Accounting Policies
Parametric Dividend Income Fund (the Fund) is a diversified series of Eaton Vance Mutual Funds Trust (the Trust). The Trust is a Massachusetts business trust registered under the Investment Company Act of 1940, as amended (the 1940 Act), as an open-end management investment company. The Fund’s investment objective is total return and current income. The Fund offers Investor Class and Institutional Class shares, which are offered at net asset value and are not subject to a sales charge. Each class represents a pro-rata interest in the Fund, but votes separately on class-specific matters and (as noted below) is subject to different expenses. Realized and unrealized gains and losses and net investment income and losses, other than class-specific expenses, are allocated daily to each class of shares based on the relative net assets of each class to the total net assets of the Fund. Each class of shares differs in its distribution plan and certain other class-specific expenses.
The following is a summary of significant accounting policies of the Fund. The policies are in conformity with accounting principles generally accepted in the United States of America (U.S. GAAP). The Fund is an investment company and follows accounting and reporting guidance in the Financial Accounting Standards Board (FASB) Accounting Standards Codification Topic 946.
A Investment Valuation — The following methodologies are used to determine the market value or fair value of investments.
Equity Securities.Equity securities listed on a U.S. securities exchange generally are valued at the last sale or closing price on the day of valuation or, if no sales took place on such date, at the mean between the closing bid and ask prices on the exchange where such securities are principally traded. Equity securities listed on the NASDAQ Global or Global Select Market generally are valued at the NASDAQ official closing price. Unlisted or listed securities for which closing sales prices or closing quotations are not available are valued at the mean between the latest available bid and ask prices.
Affiliated Fund.The Fund may invest in Eaton Vance Cash Reserves Fund, LLC (Cash Reserves Fund), an affiliated investment company managed by Eaton Vance Management (EVM). While Cash Reserves Fund is not a registered money market mutual fund, it conducts all of its investment activities in accordance with the requirements of Rule 2a-7 under the 1940 Act. Investments in Cash Reserves Fund are valued at the closing net asset value per unit on the valuation day. Cash Reserves Fund generally values its investment securities based on available market quotations provided by a third party pricing service.
Fair Valuation.Investments for which valuations or market quotations are not readily available or are deemed unreliable are valued at fair value using methods determined in good faith by or at the direction of the Trustees of the Fund in a manner that most fairly reflects the security’s “fair value”, which is the amount that the Fund might reasonably expect to receive for the security upon its current sale in the ordinary course. Each such determination is based on a consideration of relevant factors, which are likely to vary from one pricing context to another. These factors may include, but are not limited to, the type of security, the existence of any contractual restrictions on the security’s disposition, the price and extent of public trading in similar securities of the issuer or of comparable companies or entities, quotations or relevant information obtained from broker/dealers or other market participants, information obtained from the issuer, analysts, and/or the appropriate stock exchange (for exchange-traded securities), an analysis of the company’s or entity’s financial statements, and an evaluation of the forces that influence the issuer and the market(s) in which the security is purchased and sold.
B Investment Transactions — Investment transactions for financial statement purposes are accounted for on a trade date basis. Realized gains and losses on investments sold are determined on the basis of identified cost.
C Income — Dividend income is recorded on the ex-dividend date for dividends received in cash and/or securities.
D Federal Taxes — The Fund’s policy is to comply with the provisions of the Internal Revenue Code applicable to regulated investment companies and to distribute to shareholders each year substantially all of its net investment income, and all or substantially all of its net realized capital gains. Accordingly, no provision for federal income or excise tax is necessary.
As of February 29, 2020, the Fund had no uncertain tax positions that would require financial statement recognition, de-recognition, or disclosure. The Fund files a U.S. federal income tax return annually after its fiscal year-end, which is subject to examination by the Internal Revenue Service for a period of three years from the date of filing.
E Expenses — The majority of expenses of the Trust are directly identifiable to an individual fund. Expenses which are not readily identifiable to a specific fund are allocated taking into consideration, among other things, the nature and type of expense and the relative size of the funds.
F Use of Estimates — The preparation of the financial statements in conformity with U.S. GAAP requires management to make estimates and assumptions that affect the reported amounts of assets and liabilities at the date of the financial statements and the reported amounts of income and expense during the reporting period. Actual results could differ from those estimates.
G Indemnifications — Under the Trust’s organizational documents, its officers and Trustees may be indemnified against certain liabilities and expenses arising out of the performance of their duties to the Fund. Under Massachusetts law, if certain conditions prevail, shareholders of a Massachusetts business trust (such as the Trust) could be deemed to have personal liability for the obligations of the Trust. However, the Trust’s Declaration of Trust contains an express disclaimer of liability on the part of Fund shareholders and the By-laws provide that the Trust shall assume, upon request by the shareholder, the defense on behalf of any Fund shareholders. Moreover, the By-laws also provide for indemnification out of Fund property of any shareholder held personally liable solely by reason of being or having been a shareholder for all loss or expense arising from such liability. Additionally, in the normal course of business, the Fund enters into agreements with service providers that may contain indemnification clauses. The Fund’s maximum exposure under these arrangements is unknown as this would involve future claims that may be made against the Fund that have not yet occurred.
Parametric
Dividend Income Fund
February 29, 2020
Notes to Financial Statements — continued
2 Distributions to Shareholders and Income Tax Information
It is the present policy of the Fund to make quarterly distributions of all or substantially all of its net investment income and to distribute annually all or substantially all of its net realized capital gains. Distributions to shareholders are recorded on the ex-dividend date. Distributions are declared separately for each class of shares. Shareholders may reinvest income and capital gain distributions in additional shares of the same class of the Fund at the net asset value as of the ex-dividend date or, at the election of the shareholder, receive distributions in cash. Distributions to shareholders are determined in accordance with income tax regulations, which may differ from U.S. GAAP. As required by U.S. GAAP, only distributions in excess of tax basis earnings and profits are reported in the financial statements as a return of capital. Permanent differences between book and tax accounting relating to distributions are reclassified to paid-in capital. For tax purposes, distributions from short-term capital gains are considered to be from ordinary income.
The tax character of distributions declared for the years ended February 29, 2020 and February 28, 2019 was as follows:
| | | | | | | | |
| | | Year Ended
February 29, 2020 | | | Year Ended
February 28, 2019 | |
| | |
Ordinary income | | $ | 1,539,004 | | | $ | 1,839,004 | |
| | |
Long-term capital gains | | $ | 31,613 | | | $ | 911,702 | |
During the year ended February 29, 2020, accumulated loss was increased by $30,723 and paid-in capital was increased by $30,723 due to the Fund’s use of equalization accounting. Tax equalization accounting allows the Fund to treat as a distribution that portion of redemption proceeds representing a redeeming shareholder’s portion of undistributed taxable income and net capital gains. These reclassifications had no effect on the net assets or net asset value per share of the Fund.
As of February 29, 2020, the components of distributable earnings (accumulated loss) on a tax basis were as follows:
| | | | |
| | |
Undistributed ordinary income | | $ | 196,812 | |
| |
Deferred capital losses | | $ | (1,036,119 | ) |
| |
Net unrealized depreciation | | $ | (1,458,524 | ) |
At February 29, 2020, the Fund, for federal income tax purposes, had deferred capital losses of $1,036,119 which would reduce its taxable income arising from future net realized gains on investment transactions, if any, to the extent permitted by the Internal Revenue Code, and thus would reduce the amount of distributions to shareholders, which would otherwise be necessary to relieve the Fund of any liability for federal income or excise tax. The deferred capital losses are treated as arising on the first day of the Fund’s next taxable year and retain the same short-term or long-term character as when originally deferred. Of the deferred capital losses at February 29, 2020, $786,480 are short-term and $249,639 are long-term.
The cost and unrealized appreciation (depreciation) of investments of the Fund at February 29, 2020, as determined on a federal income tax basis, were as follows:
| | | | |
| |
Aggregate cost | | $ | 48,159,198 | |
| |
Gross unrealized appreciation | | $ | 2,531,916 | |
| |
Gross unrealized depreciation | | | (3,990,440 | ) |
| |
Net unrealized depreciation | | $ | (1,458,524 | ) |
3 Investment Adviser and Administration Fee and Other Transactions with Affiliates
The investment adviser and administration fee is earned by EVM as compensation for investment advisory and administrative services rendered to the Fund. Pursuant to the investment advisory and administration agreement and subsequent fee reduction agreement between the Fund and EVM, the fee is computed at an annual rate of 0.30% of the Fund’s average daily net assets up to $1 billion and is payable monthly. On net assets of $1 billion and over, the annual fee is reduced. The fee reduction cannot be terminated or reduced without the approval of a majority vote of the Trustees of the Fund who are not interested persons of EVM or the Fund and by the vote of a majority of shareholders. For the year ended February 29, 2020, the investment adviser and administration fee amounted to $169,155 or 0.30% of the Fund’s average daily net assets. Pursuant to a sub-advisory agreement, EVM has delegated the investment management of the Fund to Parametric Portfolio Associates LLC (Parametric), a wholly-owned indirect subsidiary of Eaton Vance Corp. EVM pays Parametric a portion of its investment adviser and administration fee for sub-advisory services provided to the Fund. The Fund invests its cash in Cash Reserves Fund. EVM does not currently receive a fee for advisory services provided to Cash Reserves Fund.
Parametric
Dividend Income Fund
February 29, 2020
Notes to Financial Statements — continued
EVM and Parametric have agreed to reimburse the Fund’s expenses to the extent that total annual operating expenses (relating to ordinary operating expenses only) exceed 0.65% and 0.40% of the Fund’s average daily net assets for Investor Class and Institutional Class, respectively. This agreement may be changed or terminated after June 30, 2020. Pursuant to this agreement, EVM and Parametric were allocated $96,011 in total of the Fund’s operating expenses for the year ended February 29, 2020.
EVM provides sub-transfer agency and related services to the Fund pursuant to a Sub-Transfer Agency Support Services Agreement. For the year ended February 29, 2020, EVM earned $973 from the Fund pursuant to such agreement, which is included in transfer and dividend disbursing agent fees on the Statement of Operations. Eaton Vance Distributors, Inc. (EVD), an affiliate of EVM and the Fund’s principal underwriter, received distribution and service fees from Investor Class shares (see Note 4).
Trustees and officers of the Fund who are members of EVM’s organization receive remuneration for their services to the Fund out of the investment adviser and administration fee. Trustees of the Fund who are not affiliated with EVM may elect to defer receipt of all or a percentage of their annual fees in accordance with the terms of the Trustees Deferred Compensation Plan. For the year ended February 29, 2020, no significant amounts have been deferred. Certain officers and Trustees of the Fund are officers of EVM.
4 Distribution Plan
The Fund has in effect a distribution plan for Investor Class shares (Investor Class Plan) pursuant to Rule 12b-1 under the 1940 Act. Pursuant to the Investor Class Plan, the Fund pays EVD a distribution and service fee of 0.25% per annum of its average daily net assets attributable to Investor Class shares for distribution services and facilities provided to the Fund by EVD, as well as for personal services and/or the maintenance of shareholder accounts. Distribution and service fees paid or accrued to EVD for the year ended February 29, 2020 amounted to $13,206 for Investor Class shares.
Distribution and service fees are subject to the limitations contained in the Financial Industry Regulatory Authority Rule 2341(d).
5 Purchases and Sales of Investments
Purchases and sales of investments, other than short-term obligations, aggregated $28,011,469 and $35,644,905, respectively, for the year ended February 29, 2020.
6 Shares of Beneficial Interest
The Fund’s Declaration of Trust permits the Trustees to issue an unlimited number of full and fractional shares of beneficial interest (without par value). Such shares may be issued in a number of different series (such as the Fund) and classes. Transactions in Fund shares were as follows:
| | | | | | | | |
| Investor Class | | Year Ended
February 29, 2020 | | | Year Ended
February 28, 2019 | |
| | |
Sales | | | 39,503 | | | | 245,182 | |
| | |
Issued to shareholders electing to receive payments of distributions in Fund shares | | | 10,611 | | | | 25,777 | |
| | |
Redemptions | | | (260,637 | ) | | | (194,519 | ) |
| | |
Net increase (decrease) | | | (210,523 | ) | | | 76,440 | |
| | |
| Institutional Class | | Year Ended
February 29, 2020 | | | Year Ended
February 28, 2019 | |
| | |
Sales | | | 919,890 | | | | 3,813,730 | |
| | |
Issued to shareholders electing to receive payments of distributions in Fund shares | | | 57,016 | | | | 129,170 | |
| | |
Redemptions | | | (1,360,642 | ) | | | (1,592,576 | ) |
| | |
Net increase (decrease) | | | (383,736 | ) | | | 2,350,324 | |
7 Line of Credit
The Fund participates with other portfolios and funds managed by EVM and its affiliates in an $800 million unsecured line of credit agreement with a group of banks, which is in effect through October 27, 2020. In connection with the renewal of the agreement on October 29, 2019, funds managed by
Parametric
Dividend Income Fund
February 29, 2020
Notes to Financial Statements — continued
Calvert Research and Management, an affiliate of EVM, were added as participating funds to the agreement and the borrowing limit was increased from $625 million. Borrowings are made by the Fund solely for temporary purposes related to redemptions and other short-term cash needs. Interest is charged to the Fund based on its borrowings at an amount above either the Eurodollar rate or Federal Funds rate. In addition, a fee computed at an annual rate of 0.15% on the daily unused portion of the line of credit is allocated among the participating portfolios and funds at the end of each quarter. Because the line of credit is not available exclusively to the Fund, it may be unable to borrow some or all of its requested amounts at any particular time. The Fund did not have any significant borrowings or allocated fees during the year ended February 29, 2020.
8 Securities Lending Agreement
The Fund has established a securities lending agreement with State Street Bank and Trust Company (SSBT) as securities lending agent in which the Fund lends portfolio securities to qualified borrowers in exchange for collateral consisting of either cash or securities issued or guaranteed by the U.S. government or its agencies or instrumentalities in an amount at least equal to the market value of the securities on loan. The market value of securities loaned is determined daily and any additional required collateral is delivered to the Fund on the next business day. Cash collateral is invested in the State Street Navigator Securities Lending Government Money Market Portfolio, a money market fund registered under the 1940 Act. The Fund earns interest on the amount invested but it must pay (and at times receive from) the broker a loan rebate fee computed as a varying percentage of the collateral received. For security loans secured by non-cash collateral, the Fund earns a negotiated lending fee from the borrower. A portion of the income earned by the Fund from its investment of cash collateral, net of rebate fees, and lending fees received is allocated to SSBT for its services as lending agent and the portion allocated to the Fund is presented as securities lending income, net on the Statement of Operations. Non-cash collateral is held by the lending agent on behalf of the Fund and cannot be sold or re-pledged by the Fund; accordingly, such collateral is not reflected in the Statement of Assets and Liabilities.
The Fund is subject to possible delay in the recovery of loaned securities. Pursuant to the securities lending agreement, SSBT has provided indemnification to the Fund in the event of default by a borrower with respect to a loan. The Fund bears the risk of loss with respect to the investment of cash collateral.
At February 29, 2020, the value of the securities loaned (all common stock) and the value of the collateral received, which exceeded the value of the securities loaned, amounted to $1,101,025 and $1,151,312, respectively. Collateral received was comprised of U.S. government and/or agencies securities of $1,151,312. The securities lending transactions have no contractual maturity date and each of the Fund and borrower has the option to terminate a loan at any time.
9 Investments in Affiliated Funds
At February 29, 2020, the value of the Fund’s investment in affiliated funds was $233,238, which represents 0.5% of the Fund’s net assets. Transactions in affiliated funds by the Fund for the year ended February 29, 2020 were as follows:
| | | | | | | | | | | | | | | | | | | | | | | | | | | | | | | | |
| Name of affiliated fund | | Value,
beginning
of period | | | Purchases | | | Sales
proceeds | | | Net realized
gain (loss) | | | Change in
unrealized
appreciation
(depreciation) | | | Value,
end of
period | | | Dividend
income | | | Units,
end of
period | |
| | | | | | | | |
Short-Term Investments | | | | | | | | | | | | | | | | | | | | | | | | | | | | | | | | |
| | | | | | | | |
Eaton Vance Cash Reserves Fund, LLC | | $ | 287,433 | | | $ | 13,391,625 | | | $ | (13,445,952 | ) | | $ | 137 | | | $ | (5 | ) | | $ | 233,238 | | | $ | 5,412 | | | | 233,191 | |
10 Fair Value Measurements
Under generally accepted accounting principles for fair value measurements, a three-tier hierarchy to prioritize the assumptions, referred to as inputs, is used in valuation techniques to measure fair value. The three-tier hierarchy of inputs is summarized in the three broad levels listed below.
| • | | Level 1 – quoted prices in active markets for identical investments |
| • | | Level 2 – other significant observable inputs (including quoted prices for similar investments, interest rates, prepayment speeds, credit risk, etc.) |
| • | | Level 3 – significant unobservable inputs (including a fund’s own assumptions in determining the fair value of investments) |
In cases where the inputs used to measure fair value fall in different levels of the fair value hierarchy, the level disclosed is determined based on the lowest level input that is significant to the fair value measurement in its entirety. The inputs or methodology used for valuing securities are not necessarily an indication of the risk associated with investing in those securities.
Parametric
Dividend Income Fund
February 29, 2020
Notes to Financial Statements — continued
At February 29, 2020, the hierarchy of inputs used in valuing the Fund’s investments, which are carried at value, were as follows:
| | | | | | | | | | | | | | | | |
| Asset Description | | Level 1 | | | Level 2 | | | Level 3 | | | Total | |
| | | | |
Common Stocks | | $ | 46,467,436 | * | | $ | — | | | $ | — | | | $ | 46,467,436 | |
| | | | |
Short-Term Investments | | | — | | | | 233,238 | | | | — | | | | 233,238 | |
| | | | |
Total Investments | | $ | 46,467,436 | | | $ | 233,238 | | | $ | — | | | $ | 46,700,674 | |
| * | The level classification by major category of investments is the same as the category presentation in the Portfolio of Investments. |
11 Subsequent Event
An outbreak of respiratory disease caused by a novel coronavirus that was first detected in China in December 2019 has continued to spread rapidly internationally. This coronavirus has resulted in closing borders, enhanced health screenings, changes to healthcare service preparation and delivery, quarantines, cancellations, disruptions to supply chains and customer activity, as well as general concern and uncertainty, and in March 2020, a declaration of a national emergency in the United States. The near-term impact of this coronavirus has resulted in substantial market volatility. The ultimate economic and market impact of this coronavirus cannot be reliably estimated as of April 17, 2020, the date these financial statements were issued.
Parametric
Dividend Income Fund
February 29, 2020
Report of Independent Registered Public Accounting Firm
To the Trustees of Eaton Vance Mutual Funds Trust and Shareholders of Parametric Dividend Income Fund:
Opinion on the Financial Statements and Financial Highlights
We have audited the accompanying statement of assets and liabilities of Parametric Dividend Income Fund (the “Fund”) (one of the funds constituting Eaton Vance Mutual Funds Trust), including the portfolio of investments, as of February 29, 2020, the related statement of operations for the year then ended, the statements of changes in net assets for each of the two years in the period then ended, the financial highlights for each of the five years in the period then ended, and the related notes. In our opinion, the financial statements and financial highlights present fairly, in all material respects, the financial position of the Fund as of February 29, 2020, and the results of its operations for the year then ended, the changes in its net assets for each of the two years in the period then ended, and the financial highlights for each of the five years in the period then ended, in conformity with accounting principles generally accepted in the United States of America.
Basis for Opinion
These financial statements and financial highlights are the responsibility of the Fund’s management. Our responsibility is to express an opinion on the Fund’s financial statements and financial highlights based on our audits. We are a public accounting firm registered with the Public Company Accounting Oversight Board (United States) (PCAOB) and are required to be independent with respect to the Fund in accordance with the U.S. federal securities laws and the applicable rules and regulations of the Securities and Exchange Commission and the PCAOB.
We conducted our audits in accordance with the standards of the PCAOB. Those standards require that we plan and perform the audit to obtain reasonable assurance about whether the financial statements and financial highlights are free of material misstatement, whether due to error or fraud. The Fund is not required to have, nor were we engaged to perform, an audit of its internal control over financial reporting. As part of our audits we are required to obtain an understanding of internal control over financial reporting but not for the purpose of expressing an opinion on the effectiveness of the Fund’s internal control over financial reporting. Accordingly, we express no such opinion.
Our audits included performing procedures to assess the risks of material misstatement of the financial statements and financial highlights, whether due to error or fraud, and performing procedures that respond to those risks. Such procedures included examining, on a test basis, evidence regarding the amounts and disclosures in the financial statements and financial highlights. Our audits also included evaluating the accounting principles used and significant estimates made by management, as well as evaluating the overall presentation of the financial statements and financial highlights. Our procedures included confirmation of securities owned as of February 29, 2020, by correspondence with the custodian and brokers; when replies were not received from brokers, we performed other auditing procedures. We believe that our audits provide a reasonable basis for our opinion.
/s/ Deloitte & Touche LLP
Boston, Massachusetts
April 17, 2020
We have served as the auditor of one or more Eaton Vance investment companies since 1959.
Parametric
Dividend Income Fund
February 29, 2020
Federal Tax Information (Unaudited)
The Form 1099-DIV you receive in February 2021 will show the tax status of all distributions paid to your account in calendar year 2020. Shareholders are advised to consult their own tax adviser with respect to the tax consequences of their investment in the Fund. As required by the Internal Revenue Code and/or regulations, shareholders must be notified regarding the status of qualified dividend income for individuals and the dividends received deduction for corporations.
Qualified Dividend Income. For the fiscal year ended February 29, 2020, the Fund designates approximately $1,839,980, or up to the maximum amount of such dividends allowable pursuant to the Internal Revenue Code, as qualified dividend income eligible for the reduced tax rate of 15%.
Dividends Received Deduction. Corporate shareholders are generally entitled to take the dividends received deduction on the portion of the Fund’s dividend distribution that qualifies under tax law. For the Fund’s fiscal 2020 ordinary income dividends, 99.36% qualifies for the corporate dividends received deduction.
Parametric
Dividend Income Fund
February 29, 2020
Management and Organization
Fund Management. The Trustees of Eaton Vance Mutual Funds Trust (the Trust) are responsible for the overall management and supervision of the Trust’s affairs. The Trustees and officers of the Trust are listed below. Except as indicated, each individual has held the office shown or other offices in the same company for the last five years. Trustees and officers of the Trust hold indefinite terms of office. The “noninterested Trustees” consist of those Trustees who are not “interested persons” of the Trust, as that term is defined under the 1940 Act. The business address of each Trustee and officer is Two International Place, Boston, Massachusetts 02110. As used below, “EVC” refers to Eaton Vance Corp., “EV” refers to Eaton Vance, Inc., “EVM” refers to Eaton Vance Management, “BMR” refers to Boston Management and Research and “EVD” refers to Eaton Vance Distributors, Inc. EVC and EV are the corporate parent and trustee, respectively, of EVM and BMR. EVD is the Fund’s principal underwriter and a wholly-owned subsidiary of EVC. Each officer affiliated with Eaton Vance may hold a position with other Eaton Vance affiliates that is comparable to his or her position with EVM listed below. Each Trustee oversees 159 portfolios in the Eaton Vance Complex (including all master and feeder funds in a master feeder structure). Each officer serves as an officer of certain other Eaton Vance funds. Each Trustee and officer serves until his or her successor is elected.
| | | | | | |
| Name and Year of Birth | | Position(s)
with the
Trust | | Trustee
Since(1) | | Principal Occupation(s) and Directorships
During Past Five Years and Other Relevant Experience |
|
| Interested Trustee |
| | | |
Thomas E. Faust Jr. 1958 | | Trustee | | 2007 | | Chairman, Chief Executive Officer and President of EVC, Director and President of EV, Chief Executive Officer and President of EVM and BMR, and Director of EVD. Trustee and/or officer of 159 registered investment companies. Mr. Faust is an interested person because of his positions with EVM, BMR, EVD, EVC and EV, which are affiliates of the Trust. Directorships in the Last Five Years. Director of EVC and Hexavest Inc. (investment management firm). |
|
| Noninterested Trustees |
| | | |
Mark R. Fetting 1954 | | Trustee | | 2016 | | Private investor. Formerly held various positions at Legg Mason, Inc. (investment management firm) (2000-2012), including President, Chief Executive Officer, Director and Chairman (2008-2012), Senior Executive Vice President (2004-2008) and Executive Vice President (2001-2004). Formerly, President of Legg Mason family of funds (2001-2008). Formerly, Division President and Senior Officer of Prudential Financial Group, Inc. and related companies (investment management firm)(1991-2000). Other Directorships in the Last Five Years. None. |
| | | |
Cynthia E. Frost 1961 | | Trustee | | 2014 | | Private investor. Formerly, Chief Investment Officer of Brown University (university endowment) (2000-2012). Formerly, Portfolio Strategist for Duke Management Company (university endowment manager) (1995-2000). Formerly, Managing Director, Cambridge Associates (investment consulting company) (1989-1995). Formerly, Consultant, Bain and Company (management consulting firm) (1987-1989). Formerly, Senior Equity Analyst, BA Investment Management Company (1983-1985). Other Directorships in the Last Five Years. None. |
| | | |
George J. Gorman 1952 | | Trustee | | 2014 | | Principal at George J. Gorman LLC (consulting firm). Formerly, Senior Partner at Ernst & Young LLP (a registered public accounting firm) (1974-2009). Other Directorships in the Last Five Years. Formerly, Trustee of the BofA Funds Series Trust (11 funds) (2011-2014) and of the Ashmore Funds (9 funds) (2010-2014). |
| | | |
Valerie A. Mosley 1960 | | Trustee | | 2014 | | Chairwoman and Chief Executive Officer of Valmo Ventures (a consulting and investment firm). Former Partner and Senior Vice President, Portfolio Manager and Investment Strategist at Wellington Management Company, LLP (investment management firm) (1992-2012). Former Chief Investment Officer, PG Corbin Asset Management(1990-1992). Formerly worked in institutional corporate bond sales at Kidder Peabody (1986-1990). Other Directorships in the Last Five Years. Director of Envestnet, Inc. (provider of intelligent systems for wealth management and financial wellness) (since 2018). Director of Dynex Capital, Inc. (mortgage REIT) (since 2013). |
Parametric
Dividend Income Fund
February 29, 2020
Management and Organization — continued
| | | | | | |
| Name and Year of Birth | | Position(s)
with the
Trust | | Trustee
Since(1) | | Principal Occupation(s) and Directorships
During Past Five Years and Other Relevant Experience |
|
| Noninterested Trustees (continued) |
| | | |
William H. Park 1947 | | Chairperson of the Board and Trustee | | 2016 (Chairperson) 2003 (Trustee) | | Private investor. Formerly, Consultant (management and transactional) (2012-2014). Formerly, Chief Financial Officer, Aveon Group L.P. (investment management firm) (2010-2011). Formerly, Vice Chairman, Commercial Industrial Finance Corp. (specialty finance company) (2006-2010). Formerly, President and Chief Executive Officer, Prizm Capital Management, LLC (investment management firm) (2002-2005). Formerly, Executive Vice President and Chief Financial Officer, United Asset Management Corporation (investment management firm) (1982-2001). Formerly, Senior Manager, Price Waterhouse (now PricewaterhouseCoopers) (a registered public accounting firm) (1972-1981). Other Directorships in the Last Five Years. None. |
| | | |
Helen Frame Peters 1948 | | Trustee | | 2008 | | Professor of Finance, Carroll School of Management, Boston College. Formerly, Dean, Carroll School of Management, Boston College (2000-2002). Formerly, Chief Investment Officer, Fixed Income, Scudder Kemper Investments (investment management firm) (1998-1999). Formerly, Chief Investment Officer, Equity and Fixed Income, Colonial Management Associates (investment management firm) (1991-1998). Other Directorships in the Last Five Years. None. |
| | | |
Keith Quinton 1958 | | Trustee | | 2018 | | Independent Investment Committee Member at New Hampshire Retirement System (since 2017). Formerly, Portfolio Manager and Senior Quantitative Analyst at Fidelity Investments (investment management firm) (2001-2014). Other Directorships in the Last Five Years. Director (since 2016) and Chairman (since 2019) of New Hampshire Municipal Bond Bank. |
| | | |
Marcus L. Smith 1966 | | Trustee | | 2018 | | Private investor. Member of Posse Boston Advisory Board (foundation) (since 2015). Formerly, Portfolio Manager at MFS Investment Management (investment management firm) (1994-2017). Other Directorships in the Last Five Years. Director of MSCI Inc. (global provider of investment decision support tools) (since 2017). Formerly, Director of DCT Industrial Trust Inc. (logistics real estate company) (2017-2018). |
| | | |
Susan J. Sutherland 1957 | | Trustee | | 2015 | | Private investor. Formerly, Associate, Counsel and Partner at Skadden, Arps, Slate, Meagher & Flom LLP (law firm) (1982-2013). Other Directorships in the Last Five Years. Formerly, Director of Montpelier Re Holdings Ltd. (global provider of customized insurance and reinsurance products) (2013-2015). |
| | | |
Scott E. Wennerholm 1959 | | Trustee | | 2016 | | Formerly, Trustee at Wheelock College (postsecondary institution) (2012-2018). Formerly, Consultant at GF Parish Group (executive recruiting firm) (2016-2017). Formerly, Chief Operating Officer and Executive Vice President at BNY Mellon Asset Management (investment management firm) (2005-2011). Formerly, Chief Operating Officer and Chief Financial Officer at Natixis Global Asset Management (investment management firm) (1997-2004). Formerly, Vice President at Fidelity Investments Institutional Services (investment management firm) (1994-1997). Other Directorships in the Last Five Years. None. |
| | | | | | |
| Name and Year of Birth | | Position(s)
with the
Trust | | Officer
Since(2) | | Principal Occupation(s)
During Past Five Years |
|
| Principal Officers who are not Trustees |
| | | |
Payson F. Swaffield 1956 | | President | | 2003 | | Vice President and Chief Income Investment Officer of EVM and BMR. Also Vice President of Calvert Research and Management (“CRM”). |
| | | |
Maureen A. Gemma 1960 | | Vice President, Secretary and Chief Legal Officer | | 2005 | | Vice President of EVM and BMR. Also Vice President of CRM. |
| | | |
James F. Kirchner 1967 | | Treasurer | | 2007 | | Vice President of EVM and BMR. Also Vice President of CRM. |
Parametric
Dividend Income Fund
February 29, 2020
Management and Organization — continued
| | | | | | |
| Name and Year of Birth | | Position(s)
with the
Trust | | Officer
Since(2) | | Principal Occupation(s)
During Past Five Years |
|
| Principal Officers who are not Trustees (continued) |
| | | |
Richard F. Froio 1968 | | Chief Compliance Officer | | 2017 | | Vice President of EVM and BMR since 2017. Formerly, Deputy Chief Compliance Officer (Adviser/Funds) and Chief Compliance Officer (Distribution) at PIMCO (2012-2017) and Managing Director at BlackRock/Barclays Global Investors (2009-2012). |
| (1) | Year first appointed to serve as Trustee for a fund in the Eaton Vance family of funds. Each Trustee has served continuously since appointment unless indicated otherwise. |
| (2) | Year first elected to serve as officer of a fund in the Eaton Vance family of funds when the officer has served continuously. Otherwise, year of most recent election as an officer of a fund in the Eaton Vance family of funds. Titles may have changed since initial election. |
The SAI for the Fund includes additional information about the Trustees and officers of the Fund and can be obtained without charge on Eaton Vance’s website at www.eatonvance.com or by calling 1-800-260-0761.
Eaton Vance Funds
IMPORTANT NOTICES
Privacy. The Eaton Vance organization is committed to ensuring your financial privacy. Each entity listed below has adopted a privacy policy and procedures (“Privacy Program”) Eaton Vance believes is reasonably designed to protect your personal information and to govern when and with whom Eaton Vance may share your personal information.
| • | | At the time of opening an account, Eaton Vance generally requires you to provide us with certain information such as name, address, social security number, tax status, account numbers, and account balances. This information is necessary for us to both open an account for you and to allow us to satisfy legal requirements such as applicable anti-money laundering reviews and know-your-customer requirements. |
| • | | On an ongoing basis, in the normal course of servicing your account, Eaton Vance may share your information with unaffiliated third parties that perform various services for Eaton Vance and/or your account. These third parties include transfer agents, custodians, broker/dealers and our professional advisers, including auditors, accountants, and legal counsel. Eaton Vance may additionally share your personal information with our affiliates. |
| • | | We believe our Privacy Program is reasonably designed to protect the confidentiality of your personal information and to prevent unauthorized access to that information. |
| • | | We reserve the right to change our Privacy Program at any time upon proper notification to you. You may want to review our Privacy Program periodically for changes by accessing the link on our homepage: www.eatonvance.com. |
Our pledge of protecting your personal information applies to the following entities within the Eaton Vance organization: the Eaton Vance Family of Funds, Eaton Vance Management, Eaton Vance Investment Counsel, Eaton Vance Distributors, Inc., Eaton Vance Trust Company, Eaton Vance Management (International) Limited, Eaton Vance Advisers International Limited, Eaton Vance Global Advisors Limited, Eaton Vance Management’s Real Estate Investment Group, Boston Management and Research, Calvert Research and Management, and Calvert Funds. This Privacy Notice supersedes all previously issued privacy disclosures. For more information about our Privacy Program or about how your personal information may be used, please call 1-800-262-1122.
Delivery of Shareholder Documents. The Securities and Exchange Commission (SEC) permits funds to deliver only one copy of shareholder documents, including prospectuses, proxy statements and shareholder reports, to fund investors with multiple accounts at the same residential or post office box address. This practice is often called “householding” and it helps eliminate duplicate mailings to shareholders.Eaton Vance, or your financial intermediary, may household the mailing of your documents indefinitely unless you instruct Eaton Vance, or your financial intermediary, otherwise.If you would prefer that your Eaton Vance documents not be householded, please contact Eaton Vance at 1-800-260-0761, or contact your financial intermediary. Your instructions that householding not apply to delivery of your Eaton Vance documents will typically be effective within 30 days of receipt by Eaton Vance or your financial intermediary.
Portfolio Holdings. Each Eaton Vance Fund and its underlying Portfolio(s) (if applicable) files a schedule of portfolio holdings on Part F toForm N-PORT with the SEC for the first and third quarters of each fiscal year. The Form N-PORT will be available on the Eaton Vance website at www.eatonvance.com, by calling Eaton Vance at 1-800-260-0761 or in the EDGAR database on the SEC’s website at www.sec.gov.
Proxy Voting. From time to time, funds are required to vote proxies related to the securities held by the funds. The Eaton Vance Funds or their underlying Portfolios (if applicable) vote proxies according to a set of policies and procedures approved by the Funds’ and Portfolios’ Boards. You may obtain a description of these policies and procedures and information on how the Funds or Portfolios voted proxies relating to portfolio securities during the most recent 12-month period ended June 30, without charge, upon request, by calling 1-800-260-0761 and by accessing the SEC’s website at www.sec.gov.
This Page Intentionally Left Blank
This Page Intentionally Left Blank
Investment Adviser and Administrator
Eaton Vance Management
Two International Place
Boston, MA 02110
Investment Sub-Adviser
Parametric Portfolio Associates LLC
800 Fifth Avenue, Suite 2800
Seattle, WA 98104
Principal Underwriter*
Eaton Vance Distributors, Inc.
Two International Place
Boston, MA 02110
(617) 482-8260
Custodian
State Street Bank and Trust Company
State Street Financial Center, One Lincoln Street
Boston, MA 02111
Transfer Agent
BNY Mellon Investment Servicing (US) Inc.
Attn: Eaton Vance Funds
P.O. Box 9653
Providence, RI 02940-9653
(800) 260-0761
Independent Registered Public Accounting Firm
Deloitte & Touche LLP
200 Berkeley Street
Boston, MA 02116-5022
Fund Offices
Two International Place
Boston, MA 02110
| * | FINRA BrokerCheck. Investors may check the background of their Investment Professional by contacting the Financial Industry Regulatory Authority (FINRA). FINRA BrokerCheck is a free tool to help investors check the professional background of current and former FINRA-registered securities firms and brokers. FINRA BrokerCheck is available by calling 1-800-289-9999 and at www.FINRA.org. The FINRA BrokerCheck brochure describing this program is available to investors at www.FINRA.org. |

17885 2.29.20
The registrant (sometimes referred to as the “Fund”) has adopted a code of ethics applicable to its Principal Executive Officer, Principal Financial Officer and Principal Accounting Officer. The registrant undertakes to provide a copy of such code of ethics to any person upon request, without charge, by calling1-800-262-1122. The registrant has not amended the code of ethics as described in FormN-CSR during the period covered by this report. The registrant has not granted any waiver, including an implicit waiver, from a provision of the code of ethics as described in FormN-CSR during the period covered by this report.
| Item 3. | Audit Committee Financial Expert |
The registrant’s Board of Trustees (the “Board”) has designated George J. Gorman and William H. Park, each an independent trustee, as audit committee financial experts. Mr. Gorman is a certified public accountant who is the Principal at George J. Gorman LLC (a consulting firm). Previously, Mr. Gorman served in various capacities at Ernst & Young LLP (a registered public accounting firm), including as Senior Partner. Mr. Gorman also has experience serving as an independent trustee and audit committee financial expert of other mutual fund complexes. Mr. Park is a certified public accountant who is a private investor. Previously, he served as a consultant, as the Chief Financial Officer of Aveon Group, L.P. (an investment management firm), as the Vice Chairman of Commercial Industrial Finance Corp. (specialty finance company), as President and Chief Executive Officer of Prizm Capital Management, LLC (investment management firm), as Executive Vice President and Chief Financial Officer of United Asset Management Corporation (an institutional investment management firm) and as a Senior Manager at Price Waterhouse (now PricewaterhouseCoopers) (a registered public accounting firm).
| Item 4. | Principal Accountant Fees and Services |
Parametric Dividend Income Fund (the “Fund(s)”) is a series of Eaton Vance Mutual Funds Trust (the “Trust”), a Massachusetts business trust, which, including the Fund, contains a total of 33 series (the “Series”). The Trust is registered under the Investment Company Act of 1940 as anopen-end management investment company. This FormN-CSR relates to the Fund’s annual report.
(a)-(d)
The following table presents the aggregate fees billed to the Fund for the Fund’s fiscal years ended February 28, 2019 and February 29, 2020 by the Fund’s principal accountant, Deloitte & Touche LLP (“D&T”), for professional services rendered for the audit of the Fund’s annual financial statements and fees billed for other services rendered by D&T during such periods.
Parametric Dividend Income Fund
| | | | | | | | |
Fiscal Years Ended | | 2/28/19 | | | 2/29/20 | |
Audit Fees | | $ | 25,850 | | | $ | 26,250 | |
Audit-Related Fees(1) | | $ | 0 | | | $ | 0 | |
Tax Fees(2) | | $ | 11,190 | | | $ | 11,413 | |
All Other Fees(3) | | $ | 0 | | | $ | 0 | |
| | | | | | | | |
Total | | $ | 37,040 | | | $ | 37,663 | |
| | | | | | | | |
| (1) | Audit-related fees consist of the aggregate fees billed for assurance and related services that are reasonably related to the performance of the audit of financial statements and are not reported under the category of audit fees. |
| (2) | Tax fees consist of the aggregate fees billed for professional services rendered by the principal accountant relating to tax compliance, tax advice, and tax planning and specifically include fees for tax return preparation and other related tax compliance/planning matters. |
| (3) | All other fees consist of the aggregate fees billed for products and services provided by the principal accountant other than audit, audit-related, and tax services. |
The various Series comprising the Trust have differing fiscal year ends (January 31, February 28, September 30, October 31 or December 31). The following table presents the aggregate audit, audit-related, tax, and other fees billed to all of the Series in the Trust by D&T for the last two fiscal years of each Series.
| | | | | | | | | | | | | | | | | | | | | | | | | | | | | | | | | | | | | | | | | | | | |
Fiscal
Years
Ended | | 9/30/18 | | | 10/31/18 | | | 12/31/18 | | | 1/31/19 | | | 2/28/19 | | | 7/31/19* | | | 9/30/19 | | | 10/31/19 | | | 12/31/19 | | | 1/31/20 | | | 2/29/20 | |
Audit Fees | | $ | 99,625 | | | $ | 621,075 | | | $ | 105,320 | | | $ | 191,680 | | | $ | 25,850 | | | $ | 37,050 | | | $ | 98,300 | | | $ | 661,708 | | | $ | 106,700 | | | $ | 156,850 | | | $ | 26,250 | |
Audit-Related Fees(1) | | $ | 0 | | | $ | 0 | | | $ | 0 | | | $ | 0 | | | $ | 0 | | | $ | 0 | | | $ | 0 | | | $ | 0 | | | $ | 0 | | | $ | 0 | | | $ | 0 | |
Tax Fees(2) | | $ | 28,606 | | | $ | 430,938 | | | $ | 65,089 | | | $ | 85,957 | | | $ | 11,190 | | | $ | 16,000 | | | $ | 24,768 | | | $ | 345,480 | | | $ | 63,478 | | | $ | 69,073 | | | $ | 11,413 | |
All Other Fees(3) | | $ | 0 | | | $ | 0 | | | $ | 0 | | | $ | 0 | | | $ | 0 | | | $ | 0 | | | $ | 0 | | | $ | 0 | | | $ | 0 | | | $ | 0 | | | $ | 0 | |
| | | | | | | | | | | | | | | | | | | | | | | | | | | | | | | | | | | | | | | | | | | | |
Total | | $ | 128,231 | | | $ | 1,052,013 | | | $ | 170,409 | | | $ | 277,637 | | | $ | 37,040 | | | $ | 53,050 | | | $ | 123,068 | | | $ | 1,007,188 | | | $ | 170,178 | | | $ | 225,923 | | | $ | 37,663 | |
| | | | | | | | | | | | | | | | | | | | | | | | | | | | | | | | | | | | | | | | | | | | |
| * | Information is not presented for the fiscal period ended 7/31/18 as no Series in the Trust with such fiscal year end was in operation during the last two fiscal years. As of September 9, 2019, no Series in the Trust has a July 31 fiscal year end |
| (1) | Audit-related fees consist of the aggregate fees billed for assurance and related services that are reasonably related to the performance of the audit of financial statements and are not reported under the category of audit fees. Includes consent fee forN-14 registration statements related to fund mergers. |
| (2) | Tax fees consist of the aggregate fees billed for professional services rendered by the principal accountant relating to tax compliance, tax advice, and tax planning and specifically include fees for tax return preparation and other related tax compliance/planning matters. |
| (3) | All other fees consist of the aggregate fees billed for products and services provided by the principal accountant other than audit, audit-related, and tax services. |
(e)(1) The registrant’s audit committee has adopted policies and procedures relating to thepre-approval of services provided by the registrant’s principal accountant (the“Pre-Approval Policies”). ThePre-Approval Policies establish a framework intended to assist the audit committee in the proper discharge of itspre-approval responsibilities. As a general matter, thePre-Approval Policies (i) specify certain types of audit, audit-related, tax, and other services determined to bepre-approved by the audit committee; and (ii) delineate specific procedures governing the mechanics of thepre-approval process, including the approval and monitoring of audit andnon-audit service fees. Unless a service is specificallypre-approved under thePre-Approval Policies, it must be separatelypre-approved by the audit committee.
ThePre-Approval Policies and the types of audit andnon-audit servicespre-approved therein must be reviewed and ratified by the registrant’s audit committee at least annually. The registrant’s audit committee maintains full responsibility for the appointment, compensation, and oversight of the work of the registrant’s principal accountant.
(e)(2) No services described in paragraphs (b)-(d) above were approved by the registrant’s audit committee pursuant to the “de minimis exception” set forth in Rule2-01(c)(7)(i)(C) of RegulationS-X.
(f) Not applicable.
(g)The following table presents (i) the aggregatenon-audit fees (i.e., fees for audit-related, tax, and other services) billed for services rendered to all of the Series in the Trust by D&T for the last two fiscal years of each Series; and (ii) the aggregatenon-audit fees (i.e., fees for audit-related, tax, and other services) billed to the Eaton Vance organization by D&T for the last two fiscal years of each Series.
| | | | | | | | | | | | | | | | | | | | | | | | | | | | | | | | | | | | | | | | | | | | |
Fiscal Years Ended | | 9/30/18 | | | 10/31/18 | | | 12/31/18 | | | 1/31/19 | | | 2/28/19 | | | 7/31/19* | | | 9/30/19 | | | 10/31/19 | | | 12/31/19 | | | 1/31/20 | | | 2/29/20 | |
Registrant(1) | | $ | 28,606 | | | $ | 430,938 | | | $ | 65,089 | | | $ | 85,957 | | | $ | 11,190 | | | $ | 16,000 | | | $ | 24,768 | | | $ | 345,480 | | | $ | 63,478 | | | $ | 69,073 | | | $ | 11,413 | |
Eaton Vance(2) | | $ | 126,485 | | | $ | 126,485 | | | $ | 126,485 | | | $ | 126,485 | | | $ | 126,485 | | | $ | 60,130 | | | $ | 59,903 | | | $ | 59,903 | | | $ | 59,903 | | | $ | 59,903 | | | $ | 59,903 | |
| * | Information is not presented for the fiscal period ended 7/31/18 as no Series in the Trust with such fiscal year end was in operation during the last two fiscal years. As of September 9, 2019, no Series in the Trust has a July 31 fiscal year end |
| (1) | Includes all of the Series of the Trust. During the fiscal years reported above, certain of the Funds were “feeder” funds in a “master-feeder” fund structure or funds of funds. |
| (2) | Various subsidiaries of Eaton Vance Corp. act in either an investment advisory and/or service provider capacity with respect to the Series and/or their respective “master” funds (if applicable). |
(h) The registrant’s audit committee has considered whether the provision by the registrant’s principal accountant ofnon-audit services to the registrant’s investment adviser and any entity controlling, controlled by, or under common control with the adviser that provides ongoing services to the registrant that were notpre-approved pursuant to Rule2-01(c)(7)(ii) of RegulationS-X is compatible with maintaining the principal accountant’s independence.
| Item 5. | Audit Committee of Listed Registrants |
Not applicable.
| Item 6. | Schedule of Investments |
Please see schedule of investments contained in the Report to Stockholders included under Item 1 of this FormN-CSR.
| Item 7. | Disclosure of Proxy Voting Policies and Procedures forClosed-End Management Investment Companies |
Not applicable.
| Item 8. | Portfolio Managers ofClosed-End Management Investment Companies |
Not applicable.
| Item 9. | Purchases of Equity Securities byClosed-End Management Investment Company and Affiliated Purchasers |
Not applicable.
| Item 10. | Submission of Matters to a Vote of Security Holders |
No material changes.
| Item 11. | Controls and Procedures |
(a) It is the conclusion of the registrant’s principal executive officer and principal financial officer that the effectiveness of the registrant’s current disclosure controls and procedures (such disclosure controls and procedures having been evaluated within 90 days of the date of this filing) provide reasonable assurance that the information required to be disclosed by the registrant has been recorded, processed, summarized and reported within the time period specified in the Commission’s rules and forms and that the information required to be disclosed by the registrant has been accumulated and communicated to the registrant’s principal executive officer and principal financial officer in order to allow timely decisions regarding required disclosure.
(b) There have been no changes in the registrant’s internal controls over financial reporting during the period covered by this report that has materially affected, or is reasonably likely to materially affect, the registrant’s internal control over financial reporting.
| Item 12. | Disclosure of Securities Lending Activities forClosed-End Management Investment Companies |
Not applicable.
Signatures
Pursuant to the requirements of the Securities Exchange Act of 1934 and the Investment Company Act of 1940, the registrant has duly caused this report to be signed on its behalf by the undersigned, thereunto duly authorized.
| | |
| Eaton Vance Mutual Funds Trust |
| |
| By: | | /s/ Payson F. Swaffield |
| | Payson F. Swaffield |
| | President |
Date: April 23, 2020
Pursuant to the requirements of the Securities Exchange Act of 1934 and the Investment Company Act of 1940, this report has been signed below by the following persons on behalf of the registrant and in the capacities and on the dates indicated.
| | |
| |
| By: | | /s/ James F. Kirchner |
| | James F. Kirchner |
| | Treasurer |
Date: April 23, 2020
| | |
| |
| By: | | /s/ Payson F. Swaffield |
| | Payson F. Swaffield |
| | President |
Date: April 23, 2020