UNITED STATES
SECURITIES AND EXCHANGE COMMISSION
Washington, D.C. 20549
Form N-CSR
CERTIFIED SHAREHOLDER REPORT OF REGISTERED
MANAGEMENT INVESTMENT COMPANIES
Investment Company Act File Number: 811-04015
Eaton Vance Mutual Funds Trust
(Exact Name of Registrant as Specified in Charter)
Two International Place, Boston, Massachusetts 02110
(Address of Principal Executive Offices)
Maureen A. Gemma
Two International Place, Boston, Massachusetts 02110
(Name and Address of Agent for Services)
(617) 482-8260
(Registrant’s Telephone Number)
September 30
Date of Fiscal Year End
September 30, 2020
Date of Reporting Period
| Item 1. | Reports to Stockholders |

Eaton Vance
Core Plus Bond Fund
Annual Report
September 30, 2020
Important Note. Beginning on January 1, 2021, as permitted by regulations adopted by the Securities and Exchange Commission, paper copies of the Fund’s annual and semi-annual shareholder reports will no longer be sent by mail unless you specifically request paper copies of the reports. Instead, the reports will be made available on the Fund’s website (eatonvance.com/funddocuments), and you will be notified by mail each time a report is posted and provided with a website address to access the report.
If you already elected to receive shareholder reports electronically, you will not be affected by this change and you need not take any action. If you are a direct investor, you may elect to receive shareholder reports and other communications from the Fund electronically by signing up for e-Delivery at eatonvance.com/edelivery. If you own your shares through a financial intermediary (such as a broker-dealer or bank), you must contact your financial intermediary to sign up.
You may elect to receive all future Fund shareholder reports in paper free of charge. If you are a direct investor, you can inform the Fund that you wish to continue receiving paper copies of your shareholder reports by calling 1-800-262-1122. If you own these shares through a financial intermediary, you must contact your financial intermediary or follow instructions included with this disclosure, if applicable, to elect to continue to receive paper copies of your shareholder reports. Your election to receive reports in paper will apply to all Eaton Vance funds held directly or to all funds held through your financial intermediary, as applicable.

Commodity Futures Trading Commission Registration. Effective December 31, 2012, the Commodity Futures Trading Commission (“CFTC”) adopted certain regulatory changes that subject registered investment companies and advisers to regulation by the CFTC if a fund invests more than a prescribed level of its assets in certain CFTC-regulated instruments (including futures, certain options and swap agreements) or markets itself as providing investment exposure to such instruments. The investment adviser has claimed an exclusion from the definition of “commodity pool operator” under the Commodity Exchange Act with respect to its management of the Fund. Accordingly, neither the Fund nor the adviser with respect to the operation of the Fund is subject to CFTC regulation. Because of its management of other strategies, the Fund’s adviser is registered with the CFTC as a commodity pool operator. The adviser is also registered as a commodity trading advisor.
Fund shares are not insured by the FDIC and are not deposits or other obligations of, or guaranteed by, any depository institution. Shares are subject to investment risks, including possible loss of principal invested.
This report must be preceded or accompanied by a current summary prospectus or prospectus. Before investing, investors should consider carefully the investment objective, risks, and charges and expenses of a mutual fund. This and other important information is contained in the summary prospectus and prospectus, which can be obtained from a financial intermediary. Prospective investors should read the prospectus carefully before investing. For further information, please call 1-800-262-1122.
Annual Report September 30, 2020
Eaton Vance
Core Plus Bond Fund
Eaton Vance
Core Plus Bond Fund
September 30, 2020
Management’s Discussion of Fund Performance1
Economic and Market Conditions
As the 12-month period opened on October 1, 2019, interest rates were trending modestly upward amid better-than-expected U.S. employment reports and cautious optimism about a détente in U.S.-China trade relations. Interest rates continued to move upward through the end of 2019.
In January 2020, however, news of the novel coronavirus outbreak in China began to raise investor concerns and led to a “flight to quality” that sparked a brief fixed-income market rally. As the virus turned into a global pandemic in February and March, it ended the longest-ever period of U.S. economic expansion and brought about a global economic slowdown. Credit markets along with equity markets declined in value amid unprecedented volatility.
In response, the U.S. Federal Reserve (the Fed) announced two emergency rate cuts in March 2020 — lowering the federal funds rate to 0.00%-0.25% — along with other measures designed to shore up credit markets. At its July meeting, the Fed provided additional reassurances that it would maintain rates close to zero percent for the foreseeable future and use all tools at its disposal to support the U.S. economy. These moves helped calm the markets and initiated a new fixed-income rally that began in April and lasted through most of the summer.
Midway through August, however, the fixed-income rally stalled as investors grew concerned about a resurgence of the coronavirus and the consequences for the nascent economic recovery. For the rest of the period, fixed-income prices were flat to down, driven in part by Congress’ failure to pass another stimulus bill — following the expiration of support from the federal CARES Act passed in March 2020, which boosted unemployment benefits and helped businesses keep workers employed. As the period ended, the U.S. Senate and House were deadlocked on an additional stimulus bill, and coronavirus cases were rising.
For the period as a whole, most fixed-income asset classes delivered positive returns, with strong gains from April through mid-August 2020, which compensated for losses in March. The Bloomberg Barclays U.S. Aggregate Bond Index, a broad measure of the U.S. bond market, returned 6.98% for the period. As corporate bonds benefited from Fed policy — which included purchases of corporate investment-grade debt and high yield exchange-traded funds — the Bloomberg Barclays U.S. Corporate Bond Index returned 7.90% for the period.
High yield bonds, which had fared poorly early in the period, outperformed investment-grade bonds in the second half of the period as investors searched for yield in a low-rate environment. For the period as a whole, the Bloomberg Barclays U.S. Corporate High Yield Index returned 3.25%.
Fund Performance
For the 12-month period ended September 30, 2020, Eaton Vance Core Plus Bond Fund (the Fund) returned 2.21% for Class A shares at net asset value (NAV), underperforming its benchmark, the Bloomberg Barclays U.S. Aggregate Bond Index (the Index), which returned 6.98%.
The Fund’s underperformance versus the Index was driven largely by security selection in commercial mortgage-backed securities (CMBS) and asset-backed securities (ABS); security selection and an overweight allocation, relative to the Index, in dollar-denominated emerging market (EM) debt; a lack of mortgage-backed securities (MBS) holdings, an Index sector that performed well; and an underweight allocation to U.S. Treasurys.
With regard to CMBS, the Fund’s holdings in retail and office building CMBS declined during the period, as many retail businesses closed or delayed mortgage and rent payments, and demand for office space fell due to employees working from home. The Fund’s overweight allocation to ABS, which are generally highly rated and backed largely by consumer debt, delivered positive performance, but underperformed the Index. The
Fund’s holdings in dollar-denominated EM debt underperformed the Index due to the Fund’s holdings in weak-performing sectors, including transportation and finance.
The Fund’s lack of exposure to MBS, which comprised about 26% of the Index during the period, detracted from performance versus the Index as well. The implicit U.S. government guarantee inherent in MBS — because most are issued by the Federal National Mortgage Association (Fannie Mae) and the Federal Home Loan Mortgage Corporation (Freddie Mac) — made them a beneficiary of investors’ preference for higher quality assets during the period’s market turmoil. Similarly, U.S. Treasurys were one of the best-performing fixed-income asset classes in a period when investors favored assets perceived as less risky, and the Fund’s underweight allocation hurt Index-relative results.
In contrast, the Fund’s allocations to three out-of-Index asset classes that performed well — convertible bonds, collateralized mortgage obligations (CMOs), and high yield bonds — contributed to performance versus the Index. The Fund’s holdings in CMOs, which are sensitive to interest rate changes, performed well during the period. The Fund purchased CMOs when the housing market was experiencing extreme uncertainty, and those securities rose in price as interest rates declined and the housing market recovered during the period.
See Endnotes and Additional Disclosures in this report.
Past performance is no guarantee of future results. Returns are historical and are calculated by determining the percentage change in net asset value (NAV) or offering price (as applicable) with all distributions reinvested. Investment return and principal value will fluctuate so that shares, when redeemed, may be worth more or less than their original cost. Performance for periods less than or equal to one year is cumulative. Performance is for the stated time period only; due to market volatility, current Fund performance may be lower or higher than the quoted return. For performance as of the most recent month-end, please refer to eatonvance.com.
Eaton Vance
Core Plus Bond Fund
September 30, 2020
Performance2,3
Portfolio Managers Matthew T. Buckley, CFA, John H. Croft, CFA and Vishal Khanduja, CFA
| | | | | | | | | | | | | | | | | | | | |
| % Average Annual Total Returns | | Class Inception Date | | | Performance Inception Date | | | One Year | | | Five Years | | | Ten Years | |
| | | | | |
Class A at NAV | | | 11/17/2009 | | | | 11/17/2009 | | | | 2.21 | % | | | 5.46 | % | | | 4.77 | % |
Class A with 4.75% Maximum Sales Charge | | | — | | | | — | | | | –2.66 | | | | 4.44 | | | | 4.26 | |
Class C at NAV | | | 11/17/2009 | | | | 11/17/2009 | | | | 1.45 | | | | 4.68 | | | | 4.00 | |
Class C with 1% Maximum Sales Charge | | | — | | | | — | | | | 0.46 | | | | 4.68 | | | | 4.00 | |
Class I at NAV | | | 11/17/2009 | | | | 11/17/2009 | | | | 2.37 | | | | 5.71 | | | | 5.02 | |
|
| |
| | | | | |
Bloomberg Barclays U.S. Aggregate Bond Index | | | — | | | | — | | | | 6.98 | % | | | 4.17 | % | | | 3.63 | % |
| | | | | |
| % Total Annual Operating Expense Ratios4 | | | | | | | | Class A | | | Class C | | | Class I | |
| | | | | |
Gross | | | | | | | | | | | 0.85 | % | | | 1.60 | % | | | 0.60 | % |
Net | | | | | | | | | | | 0.74 | | | | 1.49 | | | | 0.49 | |
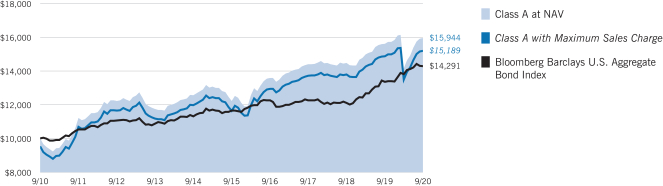
Growth of $10,000
This graph shows the change in value of a hypothetical investment of $10,000 in Class A of the Fund for the period indicated. For comparison, the same investment is shown in the indicated index.
| | | | | | | | | | | | | | | | |
| Growth of Investment | | Amount Invested | | | Period Beginning | | | At NAV | | | With Maximum Sales Charge | |
| | | | |
Class C | | | $10,000 | | | | 09/30/2010 | | | | $14,810 | | | | N.A. | |
Class I | | | $250,000 | | | | 09/30/2010 | | | | $408,331 | | | | N.A. | |
See Endnotes and Additional Disclosures in this report.
Past performance is no guarantee of future results. Returns are historical and are calculated by determining the percentage change in net asset value (NAV) or offering price (as applicable) with all distributions reinvested. Investment return and principal value will fluctuate so that shares, when redeemed, may be worth more or less than their original cost. Performance for periods less than or equal to one year is cumulative. Performance is for the stated time period only; due to market volatility, current Fund performance may be lower or higher than the quoted return. For performance as of the most recent month-end, please refer to eatonvance.com.
Eaton Vance
Core Plus Bond Fund
September 30, 2020
Fund Profile
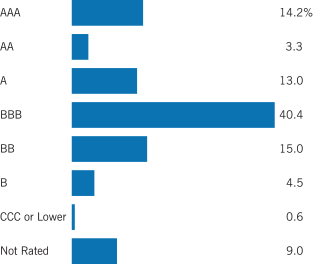
Credit Quality (% of bond holdings)5
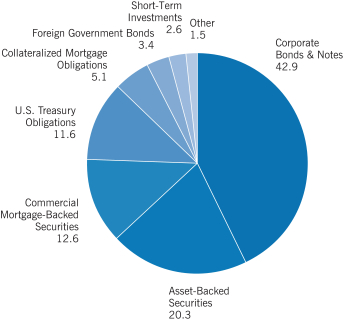
Asset Allocation (% of total investments)6
See Endnotes and Additional Disclosures in this report.
Eaton Vance
Core Plus Bond Fund
September 30, 2020
Endnotes and Additional Disclosures
| 1 | The views expressed in this report are those of the portfolio manager(s) and are current only through the date stated at the top of this page. These views are subject to change at any time based upon market or other conditions, and Eaton Vance and the Fund(s) disclaim any responsibility to update such views. These views may not be relied upon as investment advice and, because investment decisions are based on many factors, may not be relied upon as an indication of trading intent on behalf of any Eaton Vance fund. This commentary may contain statements that are not historical facts, referred to as “forward-looking statements.” The Fund’s actual future results may differ significantly from those stated in any forward-looking statement, depending on factors such as changes in securities or financial markets or general economic conditions, the volume of sales and purchases of Fund shares, the continuation of investment advisory, administrative and service contracts, and other risks discussed from time to time in the Fund’s filings with the Securities and Exchange Commission. |
| 2 | Bloomberg Barclays U.S. Aggregate Bond Index is an unmanaged index of domestic investment-grade bonds, including corporate, government and mortgage-backed securities. Unless otherwise stated, index returns do not reflect the effect of any applicable sales charges, commissions, expenses, taxes or leverage, as applicable. It is not possible to invest directly in an index. |
| 3 | Total Returns at NAV do not include applicable sales charges. If sales charges were deducted, the returns would be lower. Total Returns shown with maximum sales charge reflect the stated maximum sales charge. Unless otherwise stated, performance does not reflect the deduction of taxes on Fund distributions or redemptions of Fund shares. |
Effective May 1, 2015, the Fund changed its investment objective and policies. Prior to May 1, 2015, the Fund invested primarily in Build America Bonds. Performance prior to May 1, 2015 reflects the Fund’s performance under its former investment objective and policies.
| 4 | Source: Fund prospectus. Net expense ratios reflect a contractual expense reimbursement that continues through 1/31/21. Without the reimbursement, performance would have been lower. The expense ratios for the current reporting period can be found in the Financial Highlights section of this report. |
| 5 | Ratings are based on Moody’s Investors Service, Inc. (“Moody’s”), S&P Global Ratings (“S&P”) or Fitch Ratings (“Fitch”), as applicable. If securities are rated differently by the ratings agencies, the highest rating is applied. Ratings, which are subject to change, apply to the creditworthiness of the issuers of the underlying securities and not to the Fund or its shares. Credit ratings measure the quality of a bond based on the issuer’s creditworthiness, with ratings ranging from AAA, being the highest, to D, being the lowest based on S&P’s measures. Ratings of BBB or higher by S&P or Fitch (Baa or higher by Moody’s) are considered to be investment-grade quality. Credit ratings are based largely on the ratings agency’s analysis at the time of rating. The rating assigned to any particular security is not necessarily a reflection of the issuer’s current financial condition and does not necessarily reflect its assessment of the volatility of a security’s market value or of the liquidity of an investment in the security. Holdings designated as “Not Rated” (if any) are not rated by the national ratings agencies stated above. |
| 6 | Other, if any, represents any investment type less than 1% of total investments. |
| | Fund profile subject to change due to active management. |
| | Bloomberg Barclays U.S. Corporate Bond Index measures the performance of investment-grade U.S. corporate securities with a maturity of one year or more. Bloomberg Barclays U.S. Corporate High Yield Index measures USD-denominated, non-investment grade corporate securities. |
| | Duration is a measure of the expected change in price of a bond — in percentage terms — given a one percent change in interest rates, all else being constant. Securities with lower durations tend to be less sensitive to interest rate changes. |
Eaton Vance
Core Plus Bond Fund
September 30, 2020
Fund Expenses
Example: As a Fund shareholder, you incur two types of costs: (1) transaction costs, including sales charges (loads) on purchases and redemption fees (if applicable); and (2) ongoing costs, including management fees; distribution and/or service fees; and other Fund expenses. This Example is intended to help you understand your ongoing costs (in dollars) of Fund investing and to compare these costs with the ongoing costs of investing in other mutual funds. The Example is based on an investment of $1,000 invested at the beginning of the period and held for the entire period (April 1, 2020 – September 30, 2020).
Actual Expenses: The first section of the table below provides information about actual account values and actual expenses. You may use the information in this section, together with the amount you invested, to estimate the expenses that you paid over the period. Simply divide your account value by $1,000 (for example, an $8,600 account value divided by $1,000 = 8.6), then multiply the result by the number in the first section under the heading entitled “Expenses Paid During Period” to estimate the expenses you paid on your account during this period.
Hypothetical Example for Comparison Purposes: The second section of the table below provides information about hypothetical account values and hypothetical expenses based on the actual Fund expense ratio and an assumed rate of return of 5% per year (before expenses), which is not the actual Fund return. The hypothetical account values and expenses may not be used to estimate the actual ending account balance or expenses you paid for the period. You may use this information to compare the ongoing costs of investing in your Fund and other funds. To do so, compare this 5% hypothetical example with the 5% hypothetical examples that appear in the shareholder reports of the other funds.
Please note that the expenses shown in the table are meant to highlight your ongoing costs only and do not reflect any transactional costs, such as sales charges (loads) or redemption fees (if applicable). Therefore, the second section of the table is useful in comparing ongoing costs only, and will not help you determine the relative total costs of owning different funds. In addition, if these transactional costs were included, your costs would be higher.
| | | | | | | | | | | | | | | | |
| | | Beginning Account Value
(4/1/20) | | | Ending Account Value
(9/30/20) | | | Expenses Paid
During Period*
(4/1/20 – 9/30/20) | | | Annualized Expense
Ratio | |
| | | | |
Actual | | | | | | | | | | | | | | | | |
Class A | | $ | 1,000.00 | | | $ | 1,126.20 | | | $ | 3.93 | ** | | | 0.74 | % |
Class C | | $ | 1,000.00 | | | $ | 1,123.10 | | | $ | 7.91 | ** | | | 1.49 | % |
Class I | | $ | 1,000.00 | | | $ | 1,127.70 | | | $ | 2.61 | ** | | | 0.49 | % |
| | | | | |
Hypothetical | | | | | | | | | | | | | | | | |
(5% return per year before expenses) | | | | | | | | | | | | | | | | |
Class A | | $ | 1,000.00 | | | $ | 1,021.30 | | | $ | 3.74 | ** | | | 0.74 | % |
Class C | | $ | 1,000.00 | | | $ | 1,017.60 | | | $ | 7.52 | ** | | | 1.49 | % |
Class I | | $ | 1,000.00 | | | $ | 1,022.60 | | | $ | 2.48 | ** | | | 0.49 | % |
| * | Expenses are equal to the Fund’s annualized expense ratio for the indicated Class, multiplied by the average account value over the period, multiplied by 183/366 (to reflect the one-half year period). The Example assumes that the $1,000 was invested at the net asset value per share determined at the close of business on March 31, 2020. |
| ** | Absent an allocation of certain expenses to an affiliate, expenses would be higher. |
Eaton Vance
Core Plus Bond Fund
September 30, 2020
Portfolio of Investments
| | | | | | | | | | |
| Corporate Bonds & Notes — 42.1% | |
| Security | | | | Principal Amount (000’s omitted)* | | | Value | |
|
| Aerospace & Defense — 1.1% | |
| | | |
Azul Investments LLP, 5.875%, 10/26/24(1) | | | | | 5,665 | | | $ | 4,260,137 | |
| | | |
Delta Air Lines, Inc., 7.375%, 1/15/26 | | | | | 3,727 | | | | 3,912,271 | |
| |
| | | | $ | 8,172,408 | |
|
| Agriculture — 0.5% | |
| | | |
Camposol S.A., 6.00%, 2/3/27(1) | | | | | 3,410 | | | $ | 3,502,718 | |
| |
| | | | $ | 3,502,718 | |
|
| Automotive — 0.3% | |
| | | |
General Motors Co., 5.40%, 4/1/48 | | | | | 1,931 | | | $ | 2,136,739 | |
| |
| | | | $ | 2,136,739 | |
|
| Banks — 6.7% | |
| | | |
Australia & New Zealand Banking Group, Ltd., 2.95% to 7/22/25, 7/22/30(1)(2) | | | | | 3,531 | | | $ | 3,661,385 | |
| | | |
Banco Mercantil del Norte S.A./Grand Cayman, 5.75% to 10/4/26, 10/4/31(1)(2) | | | | | 6,225 | | | | 6,308,664 | |
| | | |
Banco Mercantil del Norte S.A./Grand Cayman, 7.50% to 6/27/29 (1)(2)(3) | | | | | 745 | | | | 735,047 | |
| | | |
Banco Santander S.A., 3.80%, 2/23/28 | | | | | 3,200 | | | | 3,518,867 | |
| | | |
BankUnited, Inc., 5.125%, 6/11/30 | | | | | 3,399 | | | | 3,740,813 | |
| | | |
Barclays PLC, 6.125% to 12/15/25(2)(3) | | | | | 3,000 | | | | 3,048,411 | |
| | | |
BBVA Bancomer S.A., 5.125% to 1/18/28, 1/18/33(1)(2) | | | | | 7,120 | | | | 6,864,748 | |
| | | |
Commonwealth Bank of Australia,
3.61% to 9/12/29, 9/12/34(1)(2) | | | | | 5,600 | | | | 6,103,555 | |
| | | |
Deutsche Bank AG/New York NY, 2.222% to 9/18/23, 9/18/24(2) | | | | | 1,845 | | | | 1,858,436 | |
| | | |
Discover Bank, 4.682% to 8/9/23, 8/9/28(2) | | | | | 2,040 | | | | 2,140,276 | |
| | | |
HSBC Holdings PLC, 2.357% to 8/18/30, 8/18/31(2) | | | | | 1,332 | | | | 1,322,381 | |
| | | |
Lloyds Banking Group PLC, 2.438% to 2/5/25, 2/5/26(2) | | | | | 4,204 | | | | 4,363,028 | |
| | | |
Santander Holdings USA, Inc., 3.45%, 6/2/25 | | | | | 2,746 | | | | 2,933,523 | |
| | | |
Standard Chartered PLC,
6.00% to 7/26/25(1)(2)(3) | | | | | 1,869 | | | | 1,906,380 | |
| |
| | | | $ | 48,505,514 | |
|
| Biotechnology — 0.7% | |
| | | |
Royalty Pharma PLC, 2.20%, 9/2/30(1) | | | | | 1,885 | | | $ | 1,878,138 | |
| | | |
Royalty Pharma PLC, 3.30%, 9/2/40(1) | | | | | 3,068 | | | | 3,016,735 | |
| |
| | | | $ | 4,894,873 | |
|
| Building Materials — 1.0% | |
| | | |
Cemex SAB de CV, 7.375%, 6/5/27(1) | | | | | 1,465 | | | $ | 1,584,976 | |
| | | |
Owens Corning, 3.95%, 8/15/29 | | | | | 4,875 | | | | 5,528,198 | |
| |
| | | | $ | 7,113,174 | |
| | | | | | | | | | |
| Security | | | | Principal Amount (000’s omitted)* | | | Value | |
|
| Chemicals — 1.0% | |
| | | |
Alpek SAB de CV, 4.25%, 9/18/29(1) | | | | | 2,490 | | | $ | 2,462,050 | |
| | | |
Huntsman International, LLC, 4.50%, 5/1/29 | | | | | 4,420 | | | | 4,972,528 | |
| |
| | | | $ | 7,434,578 | |
|
| Commercial Services — 1.5% | |
| | | |
Ashtead Capital, Inc., 4.125%, 8/15/25(1) | | | | | 2,765 | | | $ | 2,844,708 | |
| | | |
Ashtead Capital, Inc., 4.25%, 11/1/29(1) | | | | | 2,785 | | | | 2,939,279 | |
| | | |
Block Financial, LLC, 3.875%, 8/15/30 | | | | | 2,825 | | | | 2,843,444 | |
| | | |
Western Union Co. (The), 6.20%, 11/17/36 | | | | | 2,075 | | | | 2,502,409 | |
| |
| | | | $ | 11,129,840 | |
|
| Computers — 1.0% | |
| | | |
DXC Technology Co., 4.125%, 4/15/25 | | | | | 3,019 | | | $ | 3,265,349 | |
| | | |
HP, Inc., 3.40%, 6/17/30 | | | | | 3,373 | | | | 3,623,489 | |
| |
| | | | $ | 6,888,838 | |
|
| Consumer Products — 1.3% | |
| | | |
Grupo KUO SAB de CV, 5.75%, 7/7/27(1) | | | | | 3,884 | | | $ | 3,797,542 | |
| | | |
JBS USA LUX S.A./JBS USA Food Co./JBS USA Finance, Inc., 5.50%, 1/15/30(1) | | | | | 5,415 | | | | 5,909,119 | |
| |
| | | | $ | 9,706,661 | |
|
| Diversified Financial Services — 4.7% | |
| | | |
AerCap Ireland Capital DAC/AerCap Global Aviation Trust, 4.50%, 9/15/23 | | | | | 1,829 | | | $ | 1,886,072 | |
| | | |
AerCap Ireland Capital DAC/AerCap Global Aviation Trust, 6.50%, 7/15/25 | | | | | 1,096 | | | | 1,184,660 | |
| | | |
Affiliated Managers Group, Inc., 3.30%, 6/15/30 | | | | | 3,396 | | | | 3,634,822 | |
| | | |
Alpha Holding S.A. de CV,
9.00%, 2/10/25(1) | | | | | 5,025 | | | | 3,826,538 | |
| | | |
Banco BTG Pactual S.A./Cayman Islands, 4.50%, 1/10/25(1) | | | | | 5,550 | | | | 5,674,931 | |
| | | |
Brookfield Finance, Inc., 4.70%, 9/20/47 | | | | | 3,240 | | | | 3,784,935 | |
| | | |
Neuberger Berman Group, LLC/Neuberger Berman Finance Corp., 4.875%, 4/15/45(1) | | | | | 1,685 | | | | 1,870,063 | |
| | | |
Stifel Financial Corp., 4.00%, 5/15/30 | | | | | 4,769 | | | | 5,281,839 | |
| | | |
UniCredit SpA, 5.861% to 6/19/27,
6/19/32(1)(2) | | | | | 6,349 | | | | 6,768,602 | |
| |
| | | | $ | 33,912,462 | |
|
| Diversified Manufacturing — 0.3% | |
| | | |
Ellaktor Value PLC, 6.375%, 12/15/24(1) | | EUR | | | 1,887 | | | $ | 1,922,520 | |
| |
| | | | $ | 1,922,520 | |
|
| Electric Utilities — 1.2% | |
| | | |
Edison International, 3.55%, 11/15/24 | | | | | 1,365 | | | $ | 1,440,506 | |
| | | | |
| | 7 | | See Notes to Financial Statements. |
Eaton Vance
Core Plus Bond Fund
September 30, 2020
Portfolio of Investments — continued
| | | | | | | | | | |
| Security | | | | Principal Amount (000’s omitted)* | | | Value | |
|
| Electric Utilities (continued) | |
| | | |
Engie Energia Chile S.A., 3.40%, 1/28/30(1) | | | | | 3,890 | | | $ | 4,206,062 | |
| | | |
Pacific Gas and Electric Co., 2.50%, 2/1/31 | | | | | 2,955 | | | | 2,822,441 | |
| |
| | | | $ | 8,469,009 | |
|
| Electrical and Electronic Equipment — 1.4% | |
| | | |
Ingram Micro, Inc., 5.45%, 12/15/24 | | | | | 7,537 | | | $ | 8,056,884 | |
| | | |
Jabil, Inc., 3.00%, 1/15/31 | | | | | 1,969 | | | | 2,014,062 | |
| |
| | | | $ | 10,070,946 | |
|
| Energy — 0.7% | |
| | | |
Empresa Electrica Cochrane SpA, 5.50%, 5/14/27(1) | | | | | 4,741 | | | $ | 4,901,122 | |
| |
| | | | $ | 4,901,122 | |
|
| Financial Services — 1.1% | |
| | | |
Alliance Data Systems Corp., 4.75%, 12/15/24(1) | | | | | 4,624 | | | $ | 4,342,745 | |
| | | |
Carlyle Finance Subsidiary, LLC, 3.50%, 9/19/29(1) | | | | | 3,343 | | | | 3,644,047 | |
| |
| | | | $ | 7,986,792 | |
|
| Foods — 0.6% | |
| | | |
Smithfield Foods, Inc., 5.20%, 4/1/29(1) | | | | | 4,000 | | | $ | 4,681,034 | |
| |
| | | | $ | 4,681,034 | |
|
| Health Care — 0.4% | |
| | | |
Centene Corp., 3.375%, 2/15/30 | | | | | 990 | | | $ | 1,028,675 | |
| | | |
Centene Corp., 4.25%, 12/15/27 | | | | | 1,705 | | | | 1,788,110 | |
| |
| | | | $ | 2,816,785 | |
|
| Insurance — 1.6% | |
| | | |
Brown & Brown, Inc., 4.50%, 3/15/29 | | | | | 2,137 | | | $ | 2,441,062 | |
| | | |
Kemper Corp., 2.40%, 9/30/30 | | | | | 2,278 | | | | 2,248,452 | |
| | | |
Radian Group, Inc., 4.875%, 3/15/27 | | | | | 6,755 | | | | 6,738,112 | |
| |
| | | | $ | 11,427,626 | |
|
| Machinery — 1.4% | |
| | | |
Flowserve Corp., 3.50%, 10/1/30 | | | | | 1,366 | | | $ | 1,355,269 | |
| | | |
nVent Finance S.a.r.l., 4.55%, 4/15/28 | | | | | 6,210 | | | | 6,708,698 | |
| | | |
Valmont Industries, Inc., 5.25%, 10/1/54 | | | | | 2,184 | | | | 2,376,461 | |
| |
| | | | $ | 10,440,428 | |
|
| Media — 2.2% | |
| | | |
Charter Communications Operating, LLC/Charter Communications Operating Capital, 4.80%, 3/1/50 | | | | | 5,215 | | | $ | 5,989,976 | |
| | | | | | | | | | |
| Security | | | | Principal Amount (000’s omitted)* | | | Value | |
|
| Media (continued) | |
| | | |
Comcast Corp., 2.45%, 8/15/52 | | | | | 2,920 | | | $ | 2,744,589 | |
| | | |
Discovery Communications, LLC, 5.20%, 9/20/47 | | | | | 5,815 | | | | 6,982,112 | |
| |
| | | | $ | 15,716,677 | |
|
| Mining — 0.1% | |
| | | |
Reliance Steel & Aluminum Co., 2.15%, 8/15/30 | | | | | 631 | | | $ | 618,212 | |
| |
| | | | $ | 618,212 | |
|
| Oil and Gas — 2.1% | |
| | | |
Apache Corp., 4.25%, 1/15/30 | | | | | 2,540 | | | $ | 2,293,937 | |
| | | |
Gran Tierra Energy, Inc., 7.75%, 5/23/27(1) | | | | | 1,200 | | | | 419,262 | |
| | | |
National Oilwell Varco, Inc., 3.60%, 12/1/29 | | | | | 2,654 | | | | 2,578,970 | |
| | | |
Neptune Energy Bondco PLC, 6.625%, 5/15/25(1) | | | | | 6,119 | | | | 5,472,956 | |
| | | |
Patterson-UTI Energy, Inc., 3.95%, 2/1/28 | | | | | 5,555 | | | | 4,297,774 | |
| |
| | | | $ | 15,062,899 | |
|
| Pipelines — 0.7% | |
| | | |
Plains All America Pipeline, L.P./PAA Finance Corp., 3.55%, 12/15/29 | | | | | 4,976 | | | $ | 4,824,218 | |
| |
| | | | $ | 4,824,218 | |
|
| Real Estate Investment Trusts (REITs) — 1.9% | |
| | | |
Iron Mountain, Inc., 4.50%, 2/15/31(1) | | | | | 3,801 | | | $ | 3,829,089 | |
| | | |
Iron Mountain, Inc., 5.00%, 7/15/28(1) | | | | | 503 | | | | 516,199 | |
| | | |
Newmark Group, Inc., 6.125%, 11/15/23 | | | | | 5,219 | | | | 5,440,014 | |
| | | |
Service Properties Trust, 4.75%, 10/1/26 | | | | | 4,820 | | | | 4,307,393 | |
| |
| | | | $ | 14,092,695 | |
|
| Retail-Specialty and Apparel — 2.7% | |
| | | |
Macy’s Retail Holdings, Inc., 4.30%, 2/15/43 | | | | | 8,507 | | | $ | 4,810,198 | |
| | | |
Macy’s Retail Holdings, Inc., 4.375%, 9/1/23 | | | | | 2,115 | | | | 1,639,125 | |
| | | |
Nordstrom, Inc., 4.375%, 4/1/30 | | | | | 3,450 | | | | 2,795,397 | |
| | | |
Nordstrom, Inc., 5.00%, 1/15/44 | | | | | 8,015 | | | | 5,685,297 | |
| | | |
Tapestry, Inc., 4.125%, 7/15/27 | | | | | 4,436 | | | | 4,370,481 | |
| |
| | | | $ | 19,300,498 | |
|
| Technology — 0.8% | |
| | | |
Seagate HDD Cayman, 5.75%, 12/1/34 | | | | | 2,589 | | | $ | 2,945,305 | |
| | | |
Trimble, Inc., 4.90%, 6/15/28 | | | | | 2,145 | | | | 2,533,112 | |
| |
| | | | $ | 5,478,417 | |
|
| Telecommunications — 0.8% | |
| | | |
AT&T, Inc., 3.10%, 2/1/43 | | | | | 4,000 | | | $ | 3,924,067 | |
| | | | |
| | 8 | | See Notes to Financial Statements. |
Eaton Vance
Core Plus Bond Fund
September 30, 2020
Portfolio of Investments — continued
| | | | | | | | | | | | |
| Security | | | | | Principal Amount (000’s omitted)* | | | Value | |
|
| Telecommunications (continued) | |
| | | |
AT&T, Inc., 3.30%, 2/1/52 | | | | | | | 2,188 | | | $ | 2,049,524 | |
| |
| | | | $ | 5,973,591 | |
|
| Thrifts & Mortgage Finance — 0.9% | |
| | | |
Nationwide Building Society, 4.125% to 10/18/27, 10/18/32(1)(2) | | | | | | | 6,160 | | | $ | 6,563,411 | |
| |
| | | | $ | 6,563,411 | |
|
| Transportation — 1.4% | |
| | | |
A.P. Moller - Maersk A/S,
3.875%, 9/28/25(1) | | | | | | | 1,631 | | | $ | 1,781,701 | |
| | | |
A.P. Moller - Maersk A/S,
4.50%, 6/20/29(1) | | | | | | | 4,090 | | | | 4,612,577 | |
| | | |
JSL Europe S.A., 7.75%, 7/26/24(1) | | | | | | | 3,920 | | | | 4,052,300 | |
| | | |
| | | | | | | | | | | $ | 10,446,578 | |
| |
Total Corporate Bonds & Notes
(identified cost $302,023,153) | | | $ | 304,191,263 | |
|
| Collateralized Mortgage Obligations — 5.0% | |
| Security | | | | | Principal Amount (000’s omitted) | | | Value | |
| | | |
Federal Home Loan Mortgage Corp.
Structured Agency Credit Risk Debt Notes: | | | | | | | | | |
| | | |
Series 2018-DNA1, Class M2, 1.948%, (1 mo. USD LIBOR + 1.80%), 7/25/30(4) | | | | | | $ | 7,341 | | | $ | 7,218,266 | |
| | | |
Series 2018-DNA1, Class M2AT, 1.198%, (1 mo. USD LIBOR + 1.05%), 7/25/30(4) | | | | | | | 1,957 | | | | 1,948,431 | |
| | | |
Series 2019-DNA3, Class M2, 2.198%, (1 mo. USD LIBOR + 2.05%), 7/25/49(1)(4) | | | | | | | 5,340 | | | | 5,244,351 | |
| | | |
Series 2019-DNA4, Class M2, 2.098%, (1 mo. USD LIBOR + 1.95%), 10/25/49(1)(4) | | | | | | | 2,242 | | | | 2,224,756 | |
| | | |
Series 2019-HQA1, Class M2, 2.498%, (1 mo. USD LIBOR + 2.35%), 2/25/49(1)(4) | | | | | | | 5,429 | | | | 5,391,011 | |
| | | |
Series 2019-HQA2, Class M2, 2.198%, (1 mo. USD LIBOR + 2.05%), 4/25/49(1)(4) | | | | | | | 1,828 | | | | 1,799,799 | |
| | | |
| | | | | | | | | | | $ | 23,826,614 | |
| | | |
Federal National Mortgage Association Connecticut
Avenue Securities: | | | | | | | | | |
| | | |
Series 2014-C03, Class 1M2, 3.148%, (1 mo. USD LIBOR + 3.00%), 7/25/24(4) | | | | | | $ | 4,232 | | | $ | 3,710,005 | |
| | | |
Series 2018-C06, Class 1M2, 2.148%, (1 mo. USD LIBOR + 2.00%), 3/25/31(4) | | | | | | | 1,303 | | | | 1,283,025 | |
| | | |
Series 2018-R07, Class 1M2, 2.548%, (1 mo. USD LIBOR + 2.40%), 4/25/31(1)(4) | | | | | | | 2,255 | | | | 2,249,029 | |
| | | |
Series 2019-R02, Class 1M2, 2.448%, (1 mo. USD LIBOR + 2.30%), 8/25/31(1)(4) | | | | | | | 1,596 | | | | 1,590,441 | |
| | | | | | | | | | | | |
| Security | | | | | Principal Amount (000’s omitted) | | | Value | |
| | | |
Federal National Mortgage Association Connecticut
Avenue Securities: (continued) | | | | | | | | | |
| | | |
Series 2019-R05, Class 1M2, 2.148%, (1 mo. USD LIBOR + 2.00%), 7/25/39(1)(4) | | | | | | $ | 2,079 | | | $ | 2,075,682 | |
| | | |
| | | | | | | | | | | $ | 10,908,182 | |
| | | |
| Federal National Mortgage Association: | | | | | | | | | |
| | | |
Series 2020-DNA4, Class M2, 3.898%, (1 mo. USD LIBOR + 3.75%), 8/25/50(1)(4) | | | | | | $ | 1,410 | | | $ | 1,428,087 | |
| | | |
| | | | | | | | | | | $ | 1,428,087 | |
| |
Total Collateralized Mortgage Obligations
(identified cost $36,644,253) | | | $ | 36,162,883 | |
|
| Commercial Mortgage-Backed Securities — 12.4% | |
| Security | | | | | Principal Amount (000’s omitted) | | | Value | |
| | | |
| BAMLL Commercial Mortgage Securities Trust | | | | | | | | | |
| | | |
Series 2019-BPR, Class ENM, 3.843%, 11/5/32(1)(5) | | | | | | $ | 7,255 | | | $ | 5,273,470 | |
| | | |
Series 2019-BPR, Class FNM, 3.843%, 11/5/32(1)(5) | | | | | | | 7,215 | | | | 4,572,958 | |
| | | |
| CFCRE Commercial Mortgage Trust | | | | | | | | | |
| | | |
Series 2016-C3, Class D,
3.052%, 1/10/48(1)(5) | | | | | | | 1,500 | | | | 888,190 | |
| | | |
Series 2016-C7, Class D,
4.578%, 12/10/54(1)(5) | | | | | | | 1,725 | | | | 1,389,623 | |
| | | |
| Citigroup Commercial Mortgage Trust | | | | | | | | | |
| | | |
Series 2017-MDRB, Class C, 2.652%, (1 mo. USD LIBOR + 2.50%), 7/15/30(1)(4) | | | | | | | 1,000 | | | | 947,503 | |
| | | |
Series 2017-MDRC, Class C, 1.452%, (1 mo. USD LIBOR + 1.30%), 7/15/30(1)(4) | | | | | | | 1,850 | | | | 1,748,417 | |
| | | |
Series 2017-MDRC, Class D, 2.402%, (1 mo. USD LIBOR + 2.25%), 7/15/30(1)(4) | | | | | | | 1,600 | | | | 1,468,567 | |
| | | |
| COMM Mortgage Trust | | | | | | | | | |
| | | |
Series 2013-CR11, Class D, 5.286%, 8/10/50(1)(5) | | | | | | | 8,603 | | | | 6,974,045 | |
| | | |
Series 2015-CR22, Class D, 4.244%, 3/10/48(1)(5) | | | | | | | 2,324 | | | | 2,063,144 | |
| | | |
| Credit Suisse Mortgage Trust | | | | | | | | | |
| | | |
Series 2016-NXSR, Class D, 4.504%, 12/15/49(1)(5) | | | | | | | 2,000 | | | | 1,636,134 | |
| | | |
Federal National Mortgage Association Multifamily
Connecticut Avenue Securities Trust | | | | | | | | | |
| | | |
Series 2019-01, Class M7, 1.848%, (1 mo. USD LIBOR + 1.70%), 10/15/49(1)(4) | | | | | | | 907 | | | | 871,925 | |
| | | |
Series 2019-01, Class M10, 3.398%, (1 mo. USD LIBOR + 3.25%),
10/15/49(1)(4) | | | | | | | 905 | | | | 842,179 | |
| | | |
Series 2020-01, Class M10, 3.898%, (1 mo. USD LIBOR + 3.75%), 3/25/50(1)(4) | | | | | | | 3,245 | | | | 3,056,496 | |
| | | |
| JPMBB Commercial Mortgage Securities Trust | | | | | | | | | |
| | | |
Series 2014-C22, Class D, 4.706%, 9/15/47(1)(5) | | | | | | | 1,980 | | | | 1,287,803 | |
| | | |
Series 2014-C25, Class D, 4.094%, 11/15/47(1)(5) | | | | | | | 3,575 | | | | 2,569,054 | |
| | | |
Series 2015-C29, Class D, 3.852%, 5/15/48(5) | | | | | | | 500 | | | | 380,336 | |
| | | | |
| | 9 | | See Notes to Financial Statements. |
Eaton Vance
Core Plus Bond Fund
September 30, 2020
Portfolio of Investments — continued
| | | | | | | | | | | | |
| Security | | | | | Principal Amount (000’s omitted) | | | Value | |
| | | |
JPMorgan Chase Commercial Mortgage Securities
Trust | | | | | | | | | |
| | | |
Series 2011-C5, Class D, 5.605%, 8/15/46(1)(5) | | | | | | $ | 2,454 | | | $ | 2,055,724 | |
| | | |
Series 2013-C16, Class D, 5.195%, 12/15/46(1)(5) | | | | | | | 1,500 | | | | 1,447,255 | |
| | | |
Series 2014-DSTY, Class B, 3.771%, 6/10/27(1) | | | | | | | 1,384 | | | | 415,455 | |
| | | |
Morgan Stanley Bank of America Merrill Lynch
Trust | | | | | | | | | |
| | | |
Series 2016-C29, Class C, 4.905%, 5/15/49(5) | | | | | | | 4,199 | | | | 4,037,509 | |
| | | |
Series 2016-C29, Class D, 3.00%, 5/15/49(1) | | | | | | | 7,048 | | | | 5,415,988 | |
| | | |
Series 2016-C32, Class D, 3.396%, 12/15/49(1)(5) | | | | | | | 5,000 | | | | 3,436,400 | |
| | | |
| Morgan Stanley Capital I Trust | | | | | | | | | |
| | | |
Series 2016-UBS12, Class D, 3.312%, 12/15/49(1) | | | | | | | 7,150 | | | | 5,264,745 | |
| | | |
Series 2019-BPR, Class B, 2.252%, (1 mo. USD LIBOR + 2.10%),
5/15/36(1)(4) | | | | | | | 5,114 | | | | 4,679,863 | |
| | | |
Series 2019-BPR, Class C, 3.202%, (1 mo. USD LIBOR + 3.05%),
5/15/36(1)(4) | | | | | | | 1,540 | | | | 1,347,415 | |
| | | |
| Motel 6 Trust | | | | | | | | | |
| | | |
Series 2017-MTL6, Class C, 1.552%, (1 mo. USD LIBOR + 1.40%),
8/15/34(1)(4) | | | | | | | 802 | | | | 784,801 | |
| | | |
Series 2017-MTL6, Class E, 3.402%, (1 mo. USD LIBOR + 3.25%),
8/15/34(1)(4) | | | | | | | 664 | | | | 648,383 | |
| | | |
| Natixis Commercial Mortgage Securities Trust | | | | | | | | | |
| | | |
Series 2018-FL1, Class C, 2.362%, (1 mo. USD LIBOR + 2.20%),
6/15/35(1)(4) | | | | | | | 3,219 | | | | 2,931,196 | |
| | | |
| RETL Trust | | | | | | | | | |
| | | |
Series 2019-RVP, Class B, 1.702%, (1 mo. USD LIBOR + 1.55%),
3/15/36(1)(4) | | | | | | | 4,425 | | | | 4,217,500 | |
| | | |
| Toorak Mortgage Corp., Ltd. | | | | | | | | | |
| | | |
Series 2020-1, Class A1, 2.734% to 1/25/23, 3/25/23(1)(6) | | | | | | | 3,160 | | | | 3,206,662 | |
| | | |
| UBS-Barclays Commercial Mortgage Trust | | | | | | | | | |
| | | |
Series 2013-C6, Class D, 4.451%, 4/10/46(1)(5) | | | | | | | 2,000 | | | | 1,307,425 | |
| | | |
| Wells Fargo Commercial Mortgage Trust | | | | | | | | | |
| | | |
Series 2015-C31, Class D, 3.852%, 11/15/48 | | | | | | | 5,598 | | | | 4,652,494 | |
| | | |
Series 2016-C35, Class D, 3.142%, 7/15/48(1) | | | | | | | 2,150 | | | | 1,598,011 | |
| | | |
Series 2016-C36, Class D, 2.942%, 11/15/59(1) | | | | | | | 6,000 | | | | 3,939,203 | |
| | | |
| WF-RBS Commercial Mortgage Trust | | | | | | | | | |
| | | |
Series 2014-C24, Class D, 3.692%, 11/15/47(1) | | | | | | | 4,150 | | | | 2,245,463 | |
| |
Total Commercial Mortgage-Backed Securities
(identified cost $99,987,431) | | | $ | 89,601,336 | |
|
| Asset-Backed Securities — 20.0% | |
| Security | | | | | Principal Amount (000’s omitted) | | | Value | |
| | | |
| Aaset Trust | | | | | | | | | |
| | | |
Series 2019-2, Class B, 4.458%, 10/16/39(1) | | | | | | $ | 3,375 | | | $ | 2,566,182 | |
| | | |
| ARI Fleet Lease Trust | | | | | | | | | |
| | | |
Series 2018-B, Class A2,
3.22%, 8/16/27(1) | | | | | | | 416 | | | | 420,975 | |
| | | | | | | | | | |
| Security | | | | Principal Amount (000’s omitted) | | | Value | |
| | | |
| Avant Loans Funding Trust | | | | | | | | |
| | | |
Series 2018-A, Class C, 4.79%, 5/15/24(1) | | | | $ | 4,244 | | | $ | 4,257,115 | |
| | | |
| CIG Auto Receivables Trust | | | | | | | | |
| | | |
Series 2019-1A, Class A, 3.33%, 8/15/24(1) | | | | | 668 | | | | 676,188 | |
| | | |
| Coinstar Funding, LLC | | | | | | | | |
| | | |
Series 2017-1A, Class A2, 5.216%, 4/25/47(1) | | | | | 12,132 | | | | 11,540,459 | |
| | | |
| Conn’s Receivables Funding, LLC | | | | | | | | |
| | | |
Series 2018-A, Class A, 3.25%, 1/15/23(1) | | | | | 8 | | | | 8,016 | |
| | | |
Series 2018-A, Class B, 4.65%, 1/15/23(1) | | | | | 429 | | | | 428,311 | |
| | | |
Series 2019-A, Class A, 3.40%, 10/16/23(1) | | | | | 136 | | | | 136,569 | |
| | | |
Series 2019-A, Class B, 4.36%, 10/16/23(1) | | | | | 2,004 | | | | 2,004,928 | |
| | | |
Series 2019-B, Class B, 3.62%, 6/17/24(1) | | | | | 4,025 | | | | 3,982,246 | |
| | | |
| Consumer Loan Underlying Bond Credit Trust | | | | | | | | |
| | | |
Series 2019-P1, Class A, 2.94%, 7/15/26(1) | | | | | 2,126 | | | | 2,144,415 | |
| | | |
| Driven Brands Funding, LLC | | | | | | | | |
| | | |
Series 2019-2A, Class A2, 3.981%, 10/20/49(1) | | | | | 3,662 | | | | 3,799,992 | |
| | | |
| Exeter Automobile Receivables Trust | | | | | | | | |
| | | |
Series 2019-3A, Class A, 2.59%, 9/15/22(1) | | | | | 394 | | | | 395,243 | |
| | | |
| ExteNet LLC | | | | | | | | |
| | | |
Series 2019-1A, Class A2, 3.204%, 7/26/49(1) | | | | | 2,475 | | | | 2,527,264 | |
| | | |
Series 2019-1A, Class B, 4.14%, 7/26/49(1) | | | | | 2,730 | | | | 2,761,139 | |
| | | |
Series 2019-1A, Class C,
5.219%, 7/26/49(1) | | | | | 2,090 | | | | 2,073,901 | |
| | | |
| Falcon Aerospace, Ltd. | | | | | | | | |
| | | |
Series 2019-1, Class B, 4.791%, 9/15/39(1) | | | | | 4,952 | | | | 3,061,351 | |
| | | |
Series 2019-1, Class C, 6.656%, 9/15/39(1) | | | | | 2,791 | | | | 1,256,610 | |
| | | |
| FOCUS Brands Funding, LLC | | | | | | | | |
| | | |
Series 2017-1A, Class A2I, 3.857%, 4/30/47(1) | | | | | 2,801 | | | | 2,599,313 | |
| | | |
| Foundation Finance Trust | | | | | | | | |
| | | |
Series 2017-1A, Class A, 3.30%, 7/15/33(1) | | | | | 234 | | | | 238,276 | |
| | | |
| FREED ABS Trust | | | | | | | | |
| | | |
Series 2019-1, Class A, 3.42%, 6/18/26(1) | | | | | 97 | | | | 96,879 | |
| | | |
Series 2019-2, Class A, 2.62%, 11/18/26(1) | | | | | 3,960 | | | | 3,964,870 | |
| | | |
Series 2020-FP1, Class A,
2.52%, 3/18/27(1) | | | | | 2,458 | | | | 2,459,306 | |
| | | |
| Helios Issuer, LLC | | | | | | | | |
| | | |
Series 2017-1A, Class C, 8.00%, 9/20/49(1) | | | | | 5,026 | | | | 4,976,555 | |
| | | |
Series 2018-1A, Class B, 7.71%, 7/20/48(1) | | | | | 1,645 | | | | 1,586,725 | |
| | | |
| Horizon Aircraft Finance I, Ltd. | | | | | | | | |
| | | |
Series 2018-1, Class A,
4.458%, 12/15/38(1) | | | | | 1,269 | | | | 1,211,585 | |
| | | |
| Horizon Aircraft Finance II, Ltd. | | | | | | | | |
| | | |
Series 2019-1, Class A, 3.721%, 7/15/39(1) | | | | | 2,202 | | | | 2,077,344 | |
| | | |
| InSite Issuer, LLC | | | | | | | | |
| | | |
Series 2016-1A, Class A, 2.883%, 11/15/46(1) | | | | | 1,605 | | | | 1,649,429 | |
| | | |
| Jack in the Box Funding, LLC | | | | | | | | |
| | | |
Series 2019-1A, Class A2I, 3.982%, 8/25/49(1) | | | | | 1,226 | | | | 1,263,128 | |
| | | |
| LL ABS Trust | | | | | | | | |
| | | |
Series 2019-1A, Class A, 2.87%, 3/15/27(1) | | | | | 1,715 | | | | 1,722,240 | |
| | | |
Series 2020-1A, Class A, 2.33%, 7/15/22(1) | | | | | 425 | | | | 425,174 | |
| | | | |
| | 10 | | See Notes to Financial Statements. |
Eaton Vance
Core Plus Bond Fund
September 30, 2020
Portfolio of Investments — continued
| | | | | | | | | | |
| Security | | | | Principal Amount (000’s omitted) | | | Value | |
| | | |
| Lunar Aircraft, Ltd. | | | | | | | | |
| | | |
Series 2020-1A, Class B,
4.335%, 2/15/45(1) | | | | $ | 734 | | | $ | 497,821 | |
| | | |
Series 2020-1A, Class C,
6.413%, 2/15/45(1) | | | | | 258 | | | | 118,253 | |
| | | |
| Marlette Funding Trust | | | | | | | | |
| | | |
Series 2019-2A, Class A, 3.13%, 7/16/29(1) | | | | | 400 | | | | 404,741 | |
| | | |
Series 2020-2A, Class B, 1.83%, 9/16/30(1) | | | | | 1,305 | | | | 1,311,136 | |
| | | |
| MelTel Land Funding, LLC | | | | | | | | |
| | | |
Series 2019-1A, Class B,
4.701%, 4/15/49(1) | | | | | 515 | | | | 526,925 | |
| | | |
| Mosaic Solar Loan Trust | | | | | | | | |
| | | |
Series 2019-2A, Class B, 3.28%, 9/20/40(1) | | | | | 3,455 | | | | 3,546,639 | |
| | | |
Series 2020-1A, Class C, 4.47%, 4/20/46(1) | | | | | 1,630 | | | | 1,658,482 | |
| | | |
| MVW, LLC | | | | | | | | |
| | | |
Series 2020-1A, Class A,
1.74%, 10/20/37(1) | | | | | 603 | | | | 610,756 | |
| | | |
| Planet Fitness Master Issuer, LLC | | | | | | | | |
| | | |
Series 2018-1A, Class A2I,
4.262%, 9/5/48(1) | | | | | 3,626 | | | | 3,644,718 | |
| | | |
Series 2019-1A, Class A2, 3.858%, 12/5/49(1) | | | | | 2,422 | | | | 2,281,055 | |
| | | |
| Prestige Auto Receivables Trust | | | | | | | | |
| | | |
Series 2019-1A, Class A2,
2.44%, 7/15/22(1) | | | | | 454 | | | | 455,243 | |
| | | |
| Prosper Marketplace Issuance Trust | | | | | | | | |
| | | |
Series 2018-1A, Class C, 4.87%, 6/17/24(1) | | | | | 334 | | | | 334,745 | |
| | | |
| Purchasing Power Funding, LLC | | | | | | | | |
| | | |
Series 2018-A, Class A, 3.34%, 8/15/22(1) | | | | | 300 | | | | 300,462 | |
| | | |
| SERVPRO Master Issuer, LLC | | | | | | | | |
| | | |
Series 2019-1A, Class A2, 3.882%, 10/25/49(1) | | | | | 8,425 | | | | 8,932,497 | |
| | | |
| Skopos Auto Receivables Trust | | | | | | | | |
| | | |
Series 2019-1A, Class A,
2.90%, 12/15/22(1) | | | | | 2,766 | | | | 2,784,632 | |
| | | |
| Small Business Lending Trust | | | | | | | | |
| | | |
Series 2019-A, Class A, 2.85%, 7/15/26(1) | | | | | 1,561 | | | | 1,536,609 | |
| | | |
Series 2020-A, Class A, 2.62%, 12/15/26(1) | | | | | 1,266 | | | | 1,257,633 | |
| | | |
| Sonic Capital, LLC | | | | | | | | |
| | | |
Series 2020-1A, Class A2I, 3.845%, 1/20/50(1) | | | | | 7,190 | | | | 7,644,224 | |
| | | |
| SpringCastle America Funding, LLC | | | | | | | | |
| | | |
Series 2020-AA, Class A,
1.97%, 9/25/37(1) | | | | | 2,495 | | | | 2,508,520 | |
| | | |
| Springleaf Funding Trust | | | | | | | | |
| | | |
Series 2015-BA, Class A,
3.48%, 5/15/28(1) | | | | | 1,010 | | | | 1,014,266 | |
| | | |
| Stack Infrastructure Issuer, LLC | | | | | | | | |
| | | |
Series 2019-1A, Class A2,
4.54%, 2/25/44(1) | | | | | 5,939 | | | | 6,414,578 | |
| | | |
Series 2019-2A, Class A2, 3.08%, 10/25/44(1) | | | | | 1,135 | | | | 1,165,070 | |
| | | |
| Tesla Auto Lease Trust | | | | | | | | |
| | | |
Series 2018-B, Class B, 4.12%, 10/20/21(1) | | | | | 1,000 | | | | 1,022,444 | |
| | | |
Series 2019-A, Class E, 5.48%, 5/22/23(1) | | | | | 3,630 | | | | 3,804,587 | |
| | | |
Series 2020-A, Class E, 4.64%, 8/20/24(1) | | | | | 750 | | | | 778,840 | |
| | | |
| Theorem Funding Trust | | | | | | | | |
| | | |
Series 2020-1A, Class A,
2.48%, 10/15/26(1) | | | | | 1,875 | | | | 1,876,926 | |
| | | |
| Upgrade Receivables Trust | | | | | | | | |
| | | |
Series 2018-1A, Class C,
5.17%, 11/15/24(1) | | | | | 2,901 | | | | 2,887,219 | |
| | | |
Series 2019-1A, Class B, 4.09%, 3/15/25(1) | | | | | 2,906 | | | | 2,913,295 | |
| | | |
Series 2019-2A, Class A,
2.77%, 10/15/25(1) | | | | | 1,652 | | | | 1,657,091 | |
| | | | | | | | | | | | |
| Security | | | | | Principal Amount (000’s omitted) | | | Value | |
| | | |
| Vantage Data Centers Issuer, LLC | | | | | | | | | |
| | | |
Series 2018-1A, Class A2, 4.072%, 2/16/43(1) | | | | | | $ | 1,218 | | | $ | 1,262,653 | |
| | | |
Series 2018-2A, Class A2, 4.196%, 11/16/43(1) | | | | | | | 982 | | | | 1,019,591 | |
| | | |
Series 2019-1A, Class A2, 3.188%, 7/15/44(1) | | | | | | | 5,435 | | | | 5,563,670 | |
| | | |
Series 2020-2A, Class A2, 1.992%, 9/15/45(1)(7) | | | | | | | 2,935 | | | | 2,943,685 | |
| | | |
| Willis Engine Structured Trust | | | | | | | | | |
| | | |
Series 2020-A, Class B, 4.212%, 3/15/45(1) | | | | | | | 1,774 | | | | 1,083,551 | |
| | | |
Series 2020-A, Class C, 6.657%, 3/15/45(1) | | | | | | | 877 | | | | 383,657 | |
| | | |
Total Asset-Backed Securities
(identified cost $149,524,398) | | | | | | | | | | $ | 144,457,942 | |
|
| Foreign Government Bonds — 3.4% | |
| Security | | | | | Principal Amount (000’s omitted) | | | Value | |
| | | |
| Australia — 0.3% | | | | | | | | | |
| | | |
Australia Government Bond, 2.50%, 5/21/30(8) | | | AUD | | | | 2,462 | | | $ | 2,044,242 | |
| | | |
| | | | | | | | | | | $ | 2,044,242 | |
| | | |
| Brazil — 1.1% | | | | | | | | | |
| | | |
Nota do Tesouro Nacional, 10.00%, 1/1/25 | | | BRL | | | | 31,070 | | | $ | 6,275,687 | |
| | | |
Nota do Tesouro Nacional, 10.00%, 1/1/29 | | | BRL | | | | 6,500 | | | | 1,337,316 | |
| | | |
| | | | | | | | | | | $ | 7,613,003 | |
| | | |
| Mexico — 0.6% | | | | | | | | | |
| | | |
Mexican Bonos, 7.75%, 5/29/31 | | | MXN | | | | 89,055 | | | $ | 4,544,639 | |
| | | |
| | | | | | | | | | | $ | 4,544,639 | |
| | | |
| Norway — 0.6% | | | | | | | | | |
| | | |
Norway Government Bond, 1.375%, 8/19/30(1)(8) | | | NOK | | | | 34,669 | | | $ | 3,989,323 | |
| | | |
| | | | | | | | | | | $ | 3,989,323 | |
| | | |
| Supranational — 0.8% | | | | | | | | | |
| | | |
European Bank for Reconstruction & Development, 6.45%, 12/13/22 | | | IDR | | | | 89,482,200 | | | $ | 6,092,968 | |
| |
| | | | $ | 6,092,968 | |
| |
Total Foreign Government Bonds
(identified cost $26,682,033) | | | $ | 24,284,175 | |
| | | | |
| | 11 | | See Notes to Financial Statements. |
Eaton Vance
Core Plus Bond Fund
September 30, 2020
Portfolio of Investments — continued
| | | | | | | | | | |
| Senior Floating-Rate Loans — 0.2%(9) | |
| Borrower/Tranche Description | | | | Principal Amount (000’s omitted) | | | Value | |
|
| Retailers (Except Food and Drug) — 0.2% | |
| | | |
PetSmart, Inc., Term Loan, 4.50%, (3 mo. USD LIBOR + 3.50%, Floor 1.00%), 3/11/22 | | | | $ | 1,383 | | | $ | 1,381,339 | |
| |
Total Senior Floating-Rate Loans
(identified cost $1,353,143) | | | $ | 1,381,339 | |
|
| Convertible Bonds — 0.4% | |
| Security | | | | Principal Amount (000’s omitted) | | | Value | |
|
| Computers — 0.0% | |
| | | |
Western Digital Corp., 1.50%, 2/1/24 | | | | $ | 184 | | | $ | 175,609 | |
| |
| | | | $ | 175,609 | |
|
| Software — 0.4% | |
| | | |
J2 Global, Inc., 1.75%, 11/1/26(1) | | | | $ | 2,970 | | | $ | 2,640,991 | |
| |
| | | | $ | 2,640,991 | |
| |
Total Convertible Bonds
(identified cost $2,697,981) | | | $ | 2,816,600 | |
|
| Preferred Stocks — 0.8% | |
| Security | | | | Shares | | | Value | |
|
| Oil and Gas — 0.0% | |
| | | |
Chesapeake Energy Corp., 5.75%, Convertible(10)(11) | | | | | 400 | | | $ | 0 | |
| |
| | | | $ | 0 | |
|
| Real Estate Management & Development — 0.8% | |
| | | |
Brookfield Property Partners, L.P., Series A, 5.75% | | | | | 190,000 | | | $ | 3,395,300 | |
| | | |
Brookfield Property Partners, L.P., Series A2, 6.375% | | | | | 136,000 | | | | 2,696,880 | |
| |
| | | | $ | 6,092,180 | |
| |
Total Preferred Stocks
(identified cost $8,468,050) | | | $ | 6,092,180 | |
| | | | | | | | | | |
| U.S. Treasury Obligations — 11.5% | |
| Security | | | | Principal Amount (000’s omitted) | | | Value | |
| | | |
U.S. Treasury Inflation-Protected Note, 0.25%, 1/15/25(12) | | | | $ | 15,050 | | | $ | 16,058,713 | |
| | | |
U.S. Treasury Inflation-Protected Note, 0.625%, 4/15/23(12) | | | | | 13,887 | | | | 14,526,185 | |
| | | |
U.S. Treasury Note, 0.25%, 9/30/25 | | | | | 4,070 | | | | 4,064,754 | |
| | | |
U.S. Treasury Note, 0.625%, 5/15/30 | | | | | 10,345 | | | | 10,309,439 | |
| | | |
U.S. Treasury Note, 0.625%, 8/15/30 | | | | | 6,222 | | | | 6,186,515 | |
| | | |
U.S. Treasury Note, 1.625%, 10/15/20 | | | | | 15,800 | | | | 15,809,273 | |
| | | |
U.S. Treasury Note, 1.75%, 10/31/20 | | | | | 15,800 | | | | 15,821,371 | |
| |
Total U.S. Treasury Obligations
(identified cost $80,846,350) | | | $ | 82,776,250 | |
| |
| Short-Term Investments — 2.5% | | | | | |
| Description | | | | Units | | | Value | |
| | | |
Eaton Vance Cash Reserves Fund, LLC, 0.15%(13) | | | | | 18,277,199 | | | $ | 18,277,199 | |
| |
Total Short-Term Investments
(identified cost $18,277,199) | | | $ | 18,277,199 | |
| |
Total Investments — 98.3%
(identified cost $726,503,991) | | | $ | 710,041,167 | |
| |
Other Assets, Less Liabilities — 1.7% | | | $ | 12,026,707 | |
| |
Net Assets — 100.0% | | | $ | 722,067,874 | |
The percentage shown for each investment category in the Portfolio of Investments is based on net assets.
| | * | In U.S. dollars unless otherwise indicated. |
| | (1) | Security exempt from registration under Rule 144A of the Securities Act of 1933, as amended. These securities may be sold in certain transactions in reliance on an exemption from registration (normally to qualified institutional buyers). At September 30, 2020, the aggregate value of these securities is $380,482,749 or 52.7% of the Fund’s net assets. |
| | (2) | Security converts to variable rate after the indicated fixed-rate coupon period. |
| | (3) | Perpetual security with no stated maturity date but may be subject to calls by the issuer. |
| | (4) | Variable rate security. The stated interest rate represents the rate in effect at September 30, 2020. |
| | (5) | Weighted average fixed-rate coupon that changes/updates monthly. Rate shown is the rate at September 30, 2020. |
| | (6) | Step coupon security. Interest rate represents the rate in effect at September 30, 2020. |
| | | | |
| | 12 | | See Notes to Financial Statements. |
Eaton Vance
Core Plus Bond Fund
September 30, 2020
Portfolio of Investments — continued
| | (8) | Security exempt from registration under Regulation S of the Securities Act of 1933, as amended, which exempts from registration securities offered and sold outside the United States. Security may not be offered or sold in the United States except pursuant to an exemption from, or in a transaction not subject to, the registration requirements of the Securities Act of 1933, as amended. At September 30, 2020, the aggregate value of these securities is $6,033,565 or 0.8% of the Fund’s net assets. |
| | (9) | Senior floating-rate loans (Senior Loans) often require prepayments from excess cash flows or permit the borrowers to repay at their election. The degree to which borrowers repay, whether as a contractual requirement or at their election, cannot be predicted with accuracy. As a result, the actual remaining maturity may be substantially less than the stated maturities shown. However, Senior Loans will typically have an expected average life of approximately two to four years. Senior Loans typically have rates of interest which are redetermined periodically by reference to a base lending rate, plus a spread. These base lending rates are primarily the London Interbank Offered Rate (“LIBOR”) and secondarily, the prime rate offered by one or more major United States banks (the “Prime Rate”). Base lending rates may be subject to a floor, or minimum rate. Senior Loans are generally subject to contractual restrictions that must be satisfied before they can be bought or sold. |
| (10) | For fair value measurement disclosure purposes, security is categorized as Level 3 (see Note 11). |
| (11) | Non-income producing security. |
| (12) | Inflation-linked security whose principal is adjusted for inflation based on changes in the U.S. Consumer Price Index. Interest is calculated based on the inflation-adjusted principal. |
| (13) | Affiliated investment company, available to Eaton Vance portfolios and funds, which invests in high quality, U.S. dollar denominated money market instruments. The rate shown is the annualized seven-day yield as of September 30, 2020. |
| | | | | | | | |
| Country Concentration of Portfolio | |
| Country | | Percentage of
Total Investments | | | Value | |
| | |
United States | | | 78.4 | % | | $ | 556,590,372 | |
| | |
United Kingdom | | | 4.9 | | | | 35,169,252 | |
| | |
Mexico | | | 4.2 | | | | 30,124,204 | |
| | |
Brazil | | | 3.0 | | | | 21,600,371 | |
| | |
Australia | | | 1.7 | | | | 11,809,182 | |
| | |
Chile | | | 1.3 | | | | 9,107,184 | |
| | |
Italy | | | 0.9 | | | | 6,768,602 | |
| | |
Denmark | | | 0.9 | | | | 6,394,278 | |
| | |
Supranational | | | 0.9 | | | | 6,092,968 | |
| | |
Cayman Islands | | | 0.6 | | | | 4,317,961 | |
| | |
Canada | | | 0.6 | | | | 4,204,197 | |
| | |
Norway | | | 0.6 | | | | 3,989,323 | |
| | |
Spain | | | 0.5 | | | | 3,518,867 | |
| | |
Peru | | | 0.5 | | | | 3,502,718 | |
| | |
Ireland | | | 0.4 | | | | 3,070,732 | |
| | |
Greece | | | 0.3 | | | | 1,922,520 | |
| | |
Germany | | | 0.3 | | | | 1,858,436 | |
| | |
Total Investments | | | 100.0 | % | | $ | 710,041,167 | |
| | | | | | | | | | | | | | | | | | | | | | | | |
| Forward Foreign Currency Exchange Contracts | |
| Currency Purchased | | | Currency Sold | | | Counterparty | | Settlement Date | | | Unrealized Appreciation | | | Unrealized (Depreciation) | |
| | | | | | | |
| EUR | | | 1,754,903 | | | USD | | | 2,084,164 | | | State Street Bank and Trust Company | | | 11/30/20 | | | $ | — | | | $ | (24,116 | ) |
| | | | | | | |
| USD | | | 6,638,089 | | | EUR | | | 5,605,471 | | | State Street Bank and Trust Company | | | 11/30/20 | | | | 57,932 | | | | — | |
| | |
| | | | $ | 57,932 | | | $ | (24,116 | ) |
| | | | | | | | | | | | | | | | | | | | |
| Futures Contracts | |
| | | | | |
| Description | | Number of
Contracts | | | Position | | | Expiration
Date | | | Notional
Amount | | | Value/Unrealized Appreciation (Depreciation) | |
| | | | | |
Interest Rate Futures | | | | | | | | | | | | | | | | | | | | |
| | | | | |
| U.S. Long Treasury Bond | | | 179 | | | | Long | | | | 12/21/20 | | | $ | 31,554,344 | | | $ | (39,982 | ) |
| | | | | |
| U.S. Ultra-Long Treasury Bond | | | 215 | | | | Long | | | | 12/21/20 | | | | 47,689,688 | | | | (14,043 | ) |
| | | | | |
| U.S. 10-Year Ultra-Long Treasury Note | | | (478 | ) | | | Short | | | | 12/21/20 | | | | (76,442,656 | ) | | | (197,080 | ) |
| | | | | |
| | | | | | | | | | | | | | | | | | | $ | (251,105 | ) |
| | | | |
| | 13 | | See Notes to Financial Statements. |
Eaton Vance
Core Plus Bond Fund
September 30, 2020
Portfolio of Investments — continued
Abbreviations:
| | | | |
| | |
| LIBOR | | – | | London Interbank Offered Rate |
Currency Abbreviations:
| | | | |
| | |
| AUD | | – | | Australian Dollar |
| | |
| BRL | | – | | Brazilian Real |
| | |
| EUR | | – | | Euro |
| | |
| IDR | | – | | Indonesian Rupiah |
| | |
| MXN | | – | | Mexican Peso |
| | |
| NOK | | – | | Norwegian Krone |
| | |
| USD | | – | | United States Dollar |
| | | | |
| | 14 | | See Notes to Financial Statements. |
Eaton Vance
Core Plus Bond Fund
September 30, 2020
Statement of Assets and Liabilities
| | | | |
| Assets | | September 30, 2020 | |
| |
Unaffiliated investments, at value (identified cost, $708,226,792) | | $ | 691,763,968 | |
| |
Affiliated investment, at value (identified cost, $18,277,199) | | | 18,277,199 | |
| |
Cash | | | 21,777 | |
| |
Deposits for derivatives collateral — financial futures contracts | | | 2,178,700 | |
| |
Foreign currency, at value (identified cost, $1,644) | | | 925 | |
| |
Interest receivable | | | 5,296,199 | |
| |
Dividends receivable from affiliated investment | | | 3,766 | |
| |
Receivable for investments sold | | | 13,144,265 | |
| |
Receivable for Fund shares sold | | | 1,253,624 | |
| |
Receivable for open forward foreign currency exchange contracts | | | 57,932 | |
| |
Tax reclaims receivable | | | 27,412 | |
| |
Receivable from affiliate | | | 42,069 | |
| |
Total assets | | $ | 732,067,836 | |
|
| Liabilities | |
| |
Payable for investments purchased | | $ | 2,410,499 | |
| |
Payable for when-issued securities | | | 2,935,000 | |
| |
Payable for Fund shares redeemed | | | 3,621,675 | |
| |
Payable for variation margin on open financial futures contracts | | | 373,784 | |
| |
Payable for open forward foreign currency exchange contracts | | | 24,116 | |
| |
Distributions payable | | | 9,044 | |
| |
Payable to affiliates: | | | | |
| |
Investment adviser fee | | | 272,469 | |
| |
Distribution and service fees | | | 73,440 | |
| |
Accrued expenses | | | 279,935 | |
| |
Total liabilities | | $ | 9,999,962 | |
| |
Net Assets | | $ | 722,067,874 | |
|
| Sources of Net Assets | |
| |
Paid-in capital | | $ | 741,706,563 | |
| |
Accumulated loss | | | (19,638,689 | ) |
| |
Net Assets | | $ | 722,067,874 | |
|
| Class A Shares | |
| |
Net Assets | | $ | 136,688,175 | |
| |
Shares Outstanding | | | 11,561,241 | |
| |
Net Asset Value and Redemption Price Per Share | | | | |
| |
(net assets ÷ shares of beneficial interest outstanding) | | $ | 11.82 | |
| |
Maximum Offering Price Per Share | | | | |
| |
(100 ÷ 95.25 of net asset value per share) | | $ | 12.41 | |
|
| Class C Shares | |
| |
Net Assets | | $ | 54,188,862 | |
| |
Shares Outstanding | | | 4,585,924 | |
| |
Net Asset Value and Offering Price Per Share* | | | | |
| |
(net assets ÷ shares of beneficial interest outstanding) | | $ | 11.82 | |
|
| Class I Shares | |
| |
Net Assets | | $ | 531,190,837 | |
| |
Shares Outstanding | | | 44,965,963 | |
| |
Net Asset Value, Offering Price and Redemption Price Per Share | | | | |
| |
(net assets ÷ shares of beneficial interest outstanding) | | $ | 11.81 | |
On sales of $50,000 or more, the offering price of Class A shares is reduced.
| * | Redemption price per share is equal to the net asset value less any applicable contingent deferred sales charge. |
| | | | |
| | 15 | | See Notes to Financial Statements. |
Eaton Vance
Core Plus Bond Fund
September 30, 2020
Statement of Operations
| | | | |
| Investment Income | | Year Ended
September 30, 2020 | |
| |
Interest (net of foreign taxes, $2,857) | | $ | 33,629,402 | |
| |
Dividends (net of foreign taxes, $1,016) | | | 742,926 | |
| |
Dividends from affiliated investment | | | 1,161,725 | |
| |
Total investment income | | $ | 35,534,053 | |
| |
| Expenses | | | | |
| |
Investment adviser fee | | $ | 3,887,627 | |
| |
Distribution and service fees | | | | |
| |
Class A | | | 384,931 | |
| |
Class C | | | 586,859 | |
| |
Trustees’ fees and expenses | | | 38,087 | |
| |
Custodian fee | | | 254,143 | |
| |
Transfer and dividend disbursing agent fees | | | 539,001 | |
| |
Legal and accounting services | | | 92,712 | |
| |
Printing and postage | | | 76,753 | |
| |
Registration fees | | | 199,767 | |
| |
Miscellaneous | | | 62,752 | |
| |
Total expenses | | $ | 6,122,632 | |
| |
Deduct — | | | | |
| |
Allocation of expenses to affiliate | | $ | 914,506 | |
| |
Total expense reductions | | $ | 914,506 | |
| |
Net expenses | | $ | 5,208,126 | |
| |
Net investment income | | $ | 30,325,927 | |
| |
| Realized and Unrealized Gain (Loss) | | | | |
| |
Net realized gain (loss) — | | | | |
| |
Investment transactions | | $ | (6,650,858 | ) |
| |
Investment transactions — affiliated investment | | | (20,243 | ) |
| |
Financial futures contracts | | | 4,816,720 | |
| |
Foreign currency transactions | | | (33,465 | ) |
| |
Forward foreign currency exchange contracts | | | (365,565 | ) |
| |
Net realized loss | | $ | (2,253,411 | ) |
| |
Change in unrealized appreciation (depreciation) — | | | | |
| |
Investments (including net decrease of $1,951 in accrued foreign capital gains taxes) | | $ | (27,826,878 | ) |
| |
Investments — affiliated investment | | | (516 | ) |
| |
Financial futures contracts | | | 78,683 | |
| |
Foreign currency | �� | | (5,598 | ) |
| |
Forward foreign currency exchange contracts | | | 33,816 | |
| |
Net change in unrealized appreciation (depreciation) | | $ | (27,720,493 | ) |
| |
Net realized and unrealized loss | | $ | (29,973,904 | ) |
| |
Net increase in net assets from operations | | $ | 352,023 | |
| | | | |
| | 16 | | See Notes to Financial Statements. |
Eaton Vance
Core Plus Bond Fund
September 30, 2020
Statements of Changes in Net Assets
| | | | | | | | |
| | | Year Ended September 30, | |
| Increase (Decrease) in Net Assets | | 2020 | | | 2019 | |
| | |
From operations — | | | | | | | | |
| | |
Net investment income | | $ | 30,325,927 | | | $ | 16,150,235 | |
| | |
Net realized gain (loss) | | | (2,253,411 | ) | | | 2,395,935 | |
| | |
Net change in unrealized appreciation (depreciation) | | | (27,720,493 | ) | | | 15,710,047 | |
| | |
Net increase in net assets from operations | | $ | 352,023 | | | $ | 34,256,217 | |
| | |
Distributions to shareholders — | | | | | | | | |
| | |
Class A | | $ | (5,568,953 | ) | | $ | (2,807,716 | ) |
| | |
Class C | | | (1,682,983 | ) | | | (955,369 | ) |
| | |
Class I | | | (25,149,896 | ) | | | (13,044,946 | ) |
| | |
Total distributions to shareholders | | $ | (32,401,832 | ) | | $ | (16,808,031 | ) |
| | |
Transactions in shares of beneficial interest — | | | | | | | | |
| | |
Proceeds from sale of shares | | | | | | | | |
| | |
Class A | | $ | 75,252,560 | | | $ | 106,534,158 | |
| | |
Class C | | | 25,929,494 | | | | 36,217,560 | |
| | |
Class I | | | 457,605,711 | | | | 554,980,078 | |
| | |
Net asset value of shares issued to shareholders in payment of distributions declared | | | | | | | | |
| | |
Class A | | | 5,504,624 | | | | 2,704,090 | |
| | |
Class C | | | 1,647,997 | | | | 907,018 | |
| | |
Class I | | | 25,102,517 | | | | 12,950,089 | |
| | |
Cost of shares redeemed | | | | | | | | |
| | |
Class A | | | (78,530,159 | ) | | | (18,826,622 | ) |
| | |
Class C | | | (21,860,405 | ) | | | (6,212,159 | ) |
| | |
Class I | | | (549,152,100 | ) | | | (110,877,083 | ) |
| | |
Net asset value of shares converted | | | | | | | | |
| | |
Class A | | | 1,954,252 | | | | 1,058,491 | |
| | |
Class C | | | (1,954,252 | ) | | | (1,058,491 | ) |
| | |
Net increase (decrease) in net assets from Fund share transactions | | $ | (58,499,761 | ) | | $ | 578,377,129 | |
| | |
Net increase (decrease) in net assets | | $ | (90,549,570 | ) | | $ | 595,825,315 | |
|
| Net Assets | |
| | |
At beginning of year | | $ | 812,617,444 | | | $ | 216,792,129 | |
| | |
At end of year | | $ | 722,067,874 | | | $ | 812,617,444 | |
| | | | |
| | 17 | | See Notes to Financial Statements. |
Eaton Vance
Core Plus Bond Fund
September 30, 2020
Financial Highlights
| | | | | | | | | | | | | | | | | | | | |
| | | Class A | |
| |
| | | Year Ended September 30, | |
| | | 2020 | | | 2019 | | | 2018 | | | 2017 | | | 2016 | |
| | | | | |
Net asset value — Beginning of year | | $ | 11.990 | | | $ | 11.570 | | | $ | 11.930 | | | $ | 11.630 | | | $ | 11.040 | |
| | | | | |
| Income (Loss) From Operations | | | | | | | | | | | | | | | | | | | | |
| | | | | |
Net investment income(1) | | $ | 0.395 | | | $ | 0.427 | | | $ | 0.402 | | | $ | 0.367 | | | $ | 0.415 | |
| | | | | |
Net realized and unrealized gain (loss) | | | (0.143 | ) | | | 0.451 | | | | (0.344 | ) | | | 0.319 | | | | 0.774 | |
| | | | | |
Total income from operations | | $ | 0.252 | | | $ | 0.878 | | | $ | 0.058 | | | $ | 0.686 | | | $ | 1.189 | |
| | | | | |
| Less Distributions | | | | | | | | | | | | | | | | | | | | |
| | | | | |
From net investment income | | $ | (0.413 | ) | | $ | (0.458 | ) | | $ | (0.409 | ) | | $ | (0.322 | ) | | $ | (0.450 | ) |
| | | | | |
From net realized gain | | | (0.009 | ) | | | — | | | | (0.009 | ) | | | — | | | | (0.149 | ) |
| | | | | |
Tax return of capital | | | — | | | | — | | | | — | | | | (0.064 | ) | | | — | |
| | | | | |
Total distributions | | $ | (0.422 | ) | | $ | (0.458 | ) | | $ | (0.418 | ) | | $ | (0.386 | ) | | $ | (0.599 | ) |
| | | | | |
Net asset value — End of year | | $ | 11.820 | | | $ | 11.990 | | | $ | 11.570 | | | $ | 11.930 | | | $ | 11.630 | |
| | | | | |
Total Return(2)(3) | | | 2.21 | % | | | 7.76 | % | | | 0.50 | % | | | 6.01 | % | | | 11.21 | % |
| | | | | |
| Ratios/Supplemental Data | | | | | | | | | | | | | | | | | | | | |
| | | | | |
Net assets, end of year (000’s omitted) | | $ | 136,688 | | | $ | 137,889 | | | $ | 43,503 | | | $ | 33,927 | | | $ | 17,977 | |
| | | | | |
Ratios (as a percentage of average daily net assets): | | | | | | | | | | | | | | | | | | | | |
| | | | | |
Expenses(3) | | | 0.74 | % | | | 0.74 | % | | | 0.74 | % | | | 0.77 | % | | | 0.80 | % |
| | | | | |
Net investment income | | | 3.38 | % | | | 3.62 | % | | | 3.43 | % | | | 3.13 | % | | | 3.74 | % |
| | | | | |
Portfolio Turnover | | | 89 | % | | | 75 | % | | | 43 | % | | | 61 | % | | | 71 | % |
| (1) | Computed using average shares outstanding. |
| (2) | Returns are historical and are calculated by determining the percentage change in net asset value with all distributions reinvested and do not reflect the effect of sales charges. |
| (3) | The investment adviser and administrator reimbursed certain operating expenses (equal to 0.11%, 0.11%, 0.22%, 0.36% and 0.53% of average daily net assets for the years ended September 30, 2020, 2019, 2018, 2017 and 2016, respectively). Absent this reimbursement, total return would be lower. |
| | | | |
| | 18 | | See Notes to Financial Statements. |
Eaton Vance
Core Plus Bond Fund
September 30, 2020
Financial Highlights — continued
| | | | | | | | | | | | | | | | | | | | |
| | | Class C | |
| |
| | | Year Ended September 30, | |
| | | 2020 | | | 2019 | | | 2018 | | | 2017 | | | 2016 | |
| | | | | |
Net asset value — Beginning of year | | $ | 11.990 | | | $ | 11.560 | | | $ | 11.920 | | | $ | 11.620 | | | $ | 11.040 | |
| | | | | |
| Income (Loss) From Operations | | | | | | | | | | | | | | | | | | | | |
| | | | | |
Net investment income(1) | | $ | 0.307 | | | $ | 0.344 | | | $ | 0.313 | | | $ | 0.282 | | | $ | 0.331 | |
| | | | | |
Net realized and unrealized gain (loss) | | | (0.142 | ) | | | 0.456 | | | | (0.343 | ) | | | 0.317 | | | | 0.765 | |
| | | | | |
Total income (loss) from operations | | $ | 0.165 | | | $ | 0.800 | | | $ | (0.030 | ) | | $ | 0.599 | | | $ | 1.096 | |
| | | | | |
| Less Distributions | | | | | | | | | | | | | | | | | | | | |
| | | | | |
From net investment income | | $ | (0.326 | ) | | $ | (0.370 | ) | | $ | (0.321 | ) | | $ | (0.249 | ) | | $ | (0.367 | ) |
| | | | | |
From net realized gain | | | (0.009 | ) | | | — | | | | (0.009 | ) | | | — | | | | (0.149 | ) |
| | | | | |
Tax return of capital | | | — | | | | — | | | | — | | | | (0.050 | ) | | | — | |
| | | | | |
Total distributions | | $ | (0.335 | ) | | $ | (0.370 | ) | | $ | (0.330 | ) | | $ | (0.299 | ) | | $ | (0.516 | ) |
| | | | | |
Net asset value — End of year | | $ | 11.820 | | | $ | 11.990 | | | $ | 11.560 | | | $ | 11.920 | | | $ | 11.620 | |
| | | | | |
Total Return(2)(3) | | | 1.45 | % | | | 7.05 | % | | | (0.25 | )% | | | 5.23 | % | | | 10.30 | % |
| | | | | |
| Ratios/Supplemental Data | | | | | | | | | | | | | | | | | | | | |
| | | | | |
Net assets, end of year (000’s omitted) | | $ | 54,189 | | | $ | 52,001 | | | $ | 20,926 | | | $ | 19,197 | | | $ | 12,574 | |
| | | | | |
Ratios (as a percentage of average daily net assets): | | | | | | | | | | | | | | | | | | | | |
| | | | | |
Expenses(3) | | | 1.49 | % | | | 1.49 | % | | | 1.49 | % | | | 1.52 | % | | | 1.55 | % |
| | | | | |
Net investment income | | | 2.63 | % | | | 2.93 | % | | | 2.67 | % | | | 2.41 | % | | | 2.98 | % |
| | | | | |
Portfolio Turnover | | | 89 | % | | | 75 | % | | | 43 | % | | | 61 | % | | | 71 | % |
| (1) | Computed using average shares outstanding. |
| (2) | Returns are historical and are calculated by determining the percentage change in net asset value with all distributions reinvested and do not reflect the effect of sales charges. |
| (3) | The investment adviser and administrator reimbursed certain operating expenses (equal to 0.11%, 0.11%, 0.22%, 0.36% and 0.53% of average daily net assets for the years ended September 30, 2020, 2019, 2018, 2017 and 2016, respectively). Absent this reimbursement, total return would be lower. |
| | | | |
| | 19 | | See Notes to Financial Statements. |
Eaton Vance
Core Plus Bond Fund
September 30, 2020
Financial Highlights — continued
| | | | | | | | | | | | | | | | | | | | |
| | | Class I | |
| |
| | | Year Ended September 30, | |
| | | 2020 | | | 2019 | | | 2018 | | | 2017 | | | 2016 | |
| | | | | |
Net asset value — Beginning of year | | $ | 11.990 | | | $ | 11.560 | | | $ | 11.920 | | | $ | 11.620 | | | $ | 11.040 | |
| | | | | |
| Income (Loss) From Operations | | | | | | | | | | | | | | | | | | | | |
| | | | | |
Net investment income(1) | | $ | 0.423 | | | $ | 0.457 | | | $ | 0.440 | | | $ | 0.399 | | | $ | 0.442 | |
| | | | | |
Net realized and unrealized gain (loss) | | | (0.152 | ) | | | 0.460 | | | | (0.352 | ) | | | 0.316 | | | | 0.765 | |
| | | | | |
Total income from operations | | $ | 0.271 | | | $ | 0.917 | | | $ | 0.088 | | | $ | 0.715 | | | $ | 1.207 | |
| | | | | |
| Less Distributions | | | | | | | | | | | | | | | | | | | | |
| | | | | |
From net investment income | | $ | (0.442 | ) | | $ | (0.487 | ) | | $ | (0.439 | ) | | $ | (0.346 | ) | | $ | (0.478 | ) |
| | | | | |
From net realized gain | | | (0.009 | ) | | | — | | | | (0.009 | ) | | | — | | | | (0.149 | ) |
| | | | | |
Tax return of capital | | | — | | | | — | | | | — | | | | (0.069 | ) | | | — | |
| | | | | |
Total distributions | | $ | (0.451 | ) | | $ | (0.487 | ) | | $ | (0.448 | ) | | $ | (0.415 | ) | | $ | (0.627 | ) |
| | | | | |
Net asset value — End of year | | $ | 11.810 | | | $ | 11.990 | | | $ | 11.560 | | | $ | 11.920 | | | $ | 11.620 | |
| | | | | |
Total Return(2)(3) | | | 2.37 | % | | | 8.12 | % | | | 0.74 | % | | | 6.28 | % | | | 11.40 | % |
| | | | | |
| Ratios/Supplemental Data | | | | | | | | | | | | | | | | | | | | |
| | | | | |
Net assets, end of year (000’s omitted) | | $ | 531,191 | | | $ | 622,727 | | | $ | 152,363 | | | $ | 41,563 | | | $ | 6,700 | |
| | | | | |
Ratios (as a percentage of average daily net assets): | | | | | | | | | | | | | | | | | | | | |
| | | | | |
Expenses(3) | | | 0.49 | % | | | 0.49 | % | | | 0.49 | % | | | 0.52 | % | | | 0.55 | % |
| | | | | |
Net investment income | | | 3.62 | % | | | 3.89 | % | | | 3.77 | % | | | 3.40 | % | | | 4.00 | % |
| | | | | |
Portfolio Turnover | | | 89 | % | | | 75 | % | | | 43 | % | | | 61 | % | | | 71 | % |
| (1) | Computed using average shares outstanding. |
| (2) | Returns are historical and are calculated by determining the percentage change in net asset value with all distributions reinvested. |
| (3) | The investment adviser and administrator reimbursed certain operating expenses (equal to 0.11%, 0.11%, 0.22%, 0.36% and 0.53% of average daily net assets for the years ended September 30, 2020, 2019, 2018, 2017 and 2016, respectively). Absent this reimbursement, total return would be lower. |
| | | | |
| | 20 | | See Notes to Financial Statements. |
Eaton Vance
Core Plus Bond Fund
September 30, 2020
Notes to Financial Statements
1 Significant Accounting Policies
Eaton Vance Core Plus Bond Fund (the Fund) is a diversified series of Eaton Vance Mutual Funds Trust (the Trust). The Trust is a Massachusetts business trust registered under the Investment Company Act of 1940, as amended (the 1940 Act), as an open-end management investment company. The Fund’s investment objective is total return. The Fund offers three classes of shares. Class A shares are generally sold subject to a sales charge imposed at time of purchase. Class C shares are sold at net asset value and are generally subject to a contingent deferred sales charge (see Note 5). Effective January 25, 2019, Class C shares generally automatically convert to Class A shares ten years after their purchase and, effective November 5, 2020, automatically convert to Class A shares eight years after their purchase as described in the Fund’s prospectus. Class I shares are sold at net asset value and are not subject to a sales charge. Each class represents a pro-rata interest in the Fund, but votes separately on class-specific matters and (as noted below) is subject to different expenses. Realized and unrealized gains and losses are allocated daily to each class of shares based on the relative net assets of each class to the total net assets of the Fund. Net investment income, other than class-specific expenses, is allocated daily to each class of shares based upon the ratio of the value of each class’s paid shares to the total value of all paid shares. Each class of shares differs in its distribution plan and certain other class-specific expenses.
The following is a summary of significant accounting policies of the Fund. The policies are in conformity with accounting principles generally accepted in the United States of America (U.S. GAAP). The Fund is an investment company and follows accounting and reporting guidance in the Financial Accounting Standards Board (FASB) Accounting Standards Codification Topic 946.
A Investment Valuation — The following methodologies are used to determine the market value or fair value of investments.
Debt Obligations. Debt obligations are generally valued on the basis of valuations provided by third party pricing services, as derived from such services’ pricing models. Inputs to the models may include, but are not limited to, reported trades, executable bid and ask prices, broker/dealer quotations, prices or yields of securities with similar characteristics, interest rates, anticipated prepayments, benchmark curves or information pertaining to the issuer, as well as industry and economic events. The pricing services may use a matrix approach, which considers information regarding securities with similar characteristics to determine the valuation for a security. Short-term debt obligations purchased with a remaining maturity of sixty days or less for which a valuation from a third party pricing service is not readily available may be valued at amortized cost, which approximates fair value.
Equity Securities. Equity securities listed on a U.S. securities exchange generally are valued at the last sale or closing price on the day of valuation or, if no sales took place on such date, at the mean between the closing bid and ask prices on the exchange where such securities are principally traded. Equity securities listed on the NASDAQ Global or Global Select Market generally are valued at the NASDAQ official closing price. Unlisted or listed securities for which closing sales prices or closing quotations are not available are valued at the mean between the latest available bid and ask prices or, in the case of preferred equity securities that are not listed or traded in the over-the-counter market, by a third party pricing service that uses various techniques that consider factors including, but not limited to, prices or yields of securities with similar characteristics, benchmark yields, broker/dealer quotes, quotes of underlying common stock, issuer spreads, as well as industry and economic events.
Senior Floating-Rate Loans. Interests in senior floating-rate loans (Senior Loans) for which reliable market quotations are readily available are valued generally at the average mean of bid and ask quotations obtained from a third party pricing service.
Derivatives. Financial futures contracts are valued at the closing settlement price established by the board of trade or exchange on which they are traded. Forward foreign currency exchange contracts are generally valued at the mean of the average bid and average ask prices that are reported by currency dealers to a third party pricing service at the valuation time. Such third party pricing service valuations are supplied for specific settlement periods and the Fund’s forward foreign currency exchange contracts are valued at an interpolated rate between the closest preceding and subsequent settlement period reported by the third party pricing service.
Foreign Securities and Currencies. Foreign securities and currencies are valued in U.S. dollars, based on foreign currency exchange rate quotations supplied by a third party pricing service. The pricing service uses a proprietary model to determine the exchange rate. Inputs to the model include reported trades and implied bid/ask spreads.
Affiliated Fund. The Fund may invest in Eaton Vance Cash Reserves Fund, LLC (Cash Reserves Fund), an affiliated investment company managed by Eaton Vance Management (EVM). While Cash Reserves Fund is not a registered money market mutual fund, it conducts all of its investment activities in accordance with the requirements of Rule 2a-7 under the 1940 Act. Investments in Cash Reserves Fund are valued at the closing net asset value per unit on the valuation day. Cash Reserves Fund generally values its investment securities based on available market quotations provided by a third party pricing service.
Fair Valuation. Investments for which valuations or market quotations are not readily available or are deemed unreliable are valued at fair value using methods determined in good faith by or at the direction of the Trustees of the Fund in a manner that most fairly reflects the security’s “fair value”, which is the amount that the Fund might reasonably expect to receive for the security upon its current sale in the ordinary course. Each such determination is based on a consideration of relevant factors, which are likely to vary from one pricing context to another. These factors may include, but are not limited to, the type of security, the existence of any contractual restrictions on the security’s disposition, the price and extent of public trading in similar securities of the issuer or of comparable companies or entities, quotations or relevant information obtained from broker/dealers or other market participants, information obtained from the issuer, analysts, and/or the appropriate stock exchange (for exchange-traded securities), an analysis of the company’s or entity’s financial statements, and an evaluation of the forces that influence the issuer and the market(s) in which the security is purchased and sold.
Eaton Vance
Core Plus Bond Fund
September 30, 2020
Notes to Financial Statements — continued
B Investment Transactions — Investment transactions for financial statement purposes are accounted for on a trade date basis. Realized gains and losses on investments sold are determined on the basis of identified cost.
C Income — Interest income is recorded on the basis of interest accrued, adjusted for amortization of premium or accretion of discount. Fees associated with loan amendments are recognized immediately. Dividend income is recorded on the ex-dividend date for dividends received in cash and/or securities. Withholding taxes on foreign interest and dividends have been provided for in accordance with the Fund’s understanding of the applicable countries’ tax rules and rates. Inflation adjustments to the principal amount of inflation-adjusted bonds and notes are reflected as interest income. Deflation adjustments to the principal amount of an inflation-adjusted bond or note are reflected as reductions to interest income to the extent of interest income previously recorded on such bond or note.
D Federal Taxes — The Fund’s policy is to comply with the provisions of the Internal Revenue Code applicable to regulated investment companies and to distribute to shareholders each year substantially all of its net investment income, and all or substantially all of its net realized capital gains. Accordingly, no provision for federal income or excise tax is necessary.
In addition to the requirements of the Internal Revenue Code, the Fund may also be subject to local taxes on the recognition of capital gains in certain countries. In determining the daily net asset value, the Fund estimates the accrual for such taxes, if any, based on the unrealized appreciation on certain portfolio securities and the related tax rates. Taxes attributable to unrealized appreciation are included in the change in unrealized appreciation (depreciation) on investments. Capital gains taxes on securities sold are included in net realized gain (loss) on investments.
As of September 30, 2020, the Fund had no uncertain tax positions that would require financial statement recognition, de-recognition, or disclosure. The Fund files a U.S. federal income tax return annually after its fiscal year-end, which is subject to examination by the Internal Revenue Service for a period of three years from the date of filing.
E Expenses — The majority of expenses of the Trust are directly identifiable to an individual fund. Expenses which are not readily identifiable to a specific fund are allocated taking into consideration, among other things, the nature and type of expense and the relative size of the funds.
F Foreign Currency Translation — Investment valuations, other assets, and liabilities initially expressed in foreign currencies are translated each business day into U.S. dollars based upon current exchange rates. Purchases and sales of foreign investment securities and income and expenses denominated in foreign currencies are translated into U.S. dollars based upon currency exchange rates in effect on the respective dates of such transactions. Recognized gains or losses on investment transactions attributable to changes in foreign currency exchange rates are recorded for financial statement purposes as net realized gains and losses on investments. That portion of unrealized gains and losses on investments that results from fluctuations in foreign currency exchange rates is not separately disclosed.
G Use of Estimates — The preparation of the financial statements in conformity with U.S. GAAP requires management to make estimates and assumptions that affect the reported amounts of assets and liabilities at the date of the financial statements and the reported amounts of income and expense during the reporting period. Actual results could differ from those estimates.
H Indemnifications — Under the Trust’s organizational documents, its officers and Trustees may be indemnified against certain liabilities and expenses arising out of the performance of their duties to the Fund. Under Massachusetts law, if certain conditions prevail, shareholders of a Massachusetts business trust (such as the Trust) could be deemed to have personal liability for the obligations of the Trust. However, the Trust’s Declaration of Trust contains an express disclaimer of liability on the part of Fund shareholders and the By-laws provide that the Trust shall assume, upon request by the shareholder, the defense on behalf of any Fund shareholders. Moreover, the By-laws also provide for indemnification out of Fund property of any shareholder held personally liable solely by reason of being or having been a shareholder for all loss or expense arising from such liability. Additionally, in the normal course of business, the Fund enters into agreements with service providers that may contain indemnification clauses. The Fund’s maximum exposure under these arrangements is unknown as this would involve future claims that may be made against the Fund that have not yet occurred.
I Financial Futures Contracts — Upon entering into a financial futures contract, the Fund is required to deposit with the broker, either in cash or securities, an amount equal to a certain percentage of the contract amount (initial margin). Subsequent payments, known as variation margin, are made or received by the Fund each business day, depending on the daily fluctuations in the value of the underlying security, and are recorded as unrealized gains or losses by the Fund. Gains (losses) are realized upon the expiration or closing of the financial futures contracts. Should market conditions change unexpectedly, the Fund may not achieve the anticipated benefits of the financial futures contracts and may realize a loss. Futures contracts have minimal counterparty risk as they are exchange traded and the clearinghouse for the exchange is substituted as the counterparty, guaranteeing counterparty performance.
J Forward Foreign Currency Exchange Contracts — The Fund may enter into forward foreign currency exchange contracts for the purchase or sale of a specific foreign currency at a fixed price on a future date. The forward foreign currency exchange contracts are adjusted by the daily exchange rate of the underlying currency and any gains or losses are recorded as unrealized until such time as the contracts have been closed. Risks may arise upon entering these contracts from the potential inability of counterparties to meet the terms of their contracts and from movements in the value of a foreign currency relative to the U.S. dollar.
K When-Issued Securities and Delayed Delivery Transactions — The Fund may purchase or sell securities on a delayed delivery or when-issued basis. Payment and delivery may take place after the customary settlement period for that security. At the time the transaction is negotiated, the price of the security that will be delivered is fixed. The Fund maintains cash and/or security positions for these commitments such that sufficient liquid assets will be
Eaton Vance
Core Plus Bond Fund
September 30, 2020
Notes to Financial Statements — continued
available to make payments upon settlement. Securities purchased on a delayed delivery or when-issued basis are marked-to-market daily and begin earning interest on settlement date. Losses may arise due to changes in the market value of the underlying securities or if the counterparty does not perform under the contract.
2 Distributions to Shareholders and Income Tax Information
The Fund declares dividends daily to shareholders of record at the time of declaration. Distributions are generally paid monthly. Distributions of realized capital gains are made at least annually. Distributions to shareholders are recorded on the ex-dividend date. Distributions are declared separately for each class of shares. Shareholders may reinvest income and capital gain distributions in additional shares of the same class of the Fund at the net asset value as of the ex-dividend date or, at the election of the shareholder, receive distributions in cash. Distributions to shareholders are determined in accordance with income tax regulations, which may differ from U.S. GAAP. As required by U.S. GAAP, only distributions in excess of tax basis earnings and profits are reported in the financial statements as a return of capital. Permanent differences between book and tax accounting relating to distributions are reclassified to paid-in capital. For tax purposes, distributions from short-term capital gains are considered to be from ordinary income.
The tax character of distributions declared for the years ended September 30, 2020 and September 30, 2019 was as follows:
| | | | | | | | |
| | | Year Ended September 30, | |
| | | 2020 | | | 2019 | |
| | |
Ordinary income | | $ | 32,401,832 | | | $ | 16,808,031 | |
During the year ended September 30, 2020, accumulated loss was increased by $215,887 and paid-in capital was increased by $215,887 due to the Fund’s use of equalization accounting. Tax equalization accounting allows the Fund to treat as a distribution that portion of redemption proceeds representing a redeeming shareholder’s portion of undistributed taxable income and net capital gains. These reclassifications had no effect on the net assets or net asset value per share of the Fund.
As of September 30, 2020, the components of distributable earnings (accumulated loss) on a tax basis were as follows:
| | | | |
| | |
Undistributed long-term capital gains | | $ | 1,965,763 | |
| |
Post October capital losses | | $ | (4,553,780 | ) |
| |
Late year ordinary losses | | $ | (526,113 | ) |
| |
Net unrealized depreciation | | $ | (16,515,515 | ) |
| |
Distributions payable | | $ | (9,044 | ) |
At September 30, 2020, the Fund had a net capital loss of $4,553,780 attributable to security transactions incurred after October 31, 2019 that it has elected to defer. This net capital loss is treated as arising on the first day of the Fund’s taxable year ending September 30, 2021.
Additionally, at September 30, 2020, the Fund had a late year ordinary loss of $526,113 which it has elected to defer to the following taxable year pursuant to income tax regulations. Late year ordinary losses represent certain specified losses realized in that portion of a taxable year after October 31 that are treated as ordinary for tax purposes plus ordinary losses attributable to that portion of a taxable year after December 31.
The cost and unrealized appreciation (depreciation) of investments, including open derivative contracts, of the Fund at September 30, 2020, as determined on a federal income tax basis, were as follows:
| | | | |
| |
Aggregate cost | | $ | 726,543,361 | |
| |
Gross unrealized appreciation | | $ | 19,924,468 | |
| |
Gross unrealized depreciation | | | (36,426,662 | ) |
| |
Net unrealized depreciation | | $ | (16,502,194 | ) |
3 Investment Adviser Fee and Other Transactions with Affiliates
The investment adviser fee is earned by Boston Management and Research (BMR), a subsidiary of EVM and an indirect subsidiary of Eaton Vance Corp., as compensation for investment advisory services rendered to the Fund. Pursuant to the investment advisory agreement and subsequent fee reduction agreement between the Fund and BMR, the fee is computed at an annual rate of 0.45% of the Fund’s average daily net assets up to $1 billion and is
Eaton Vance
Core Plus Bond Fund
September 30, 2020
Notes to Financial Statements — continued
payable monthly. On net assets of $1 billion and over, the annual fee is reduced. The fee reduction cannot be terminated without the consent of the Trustees and shareholders. For the year ended September 30, 2020, the Fund’s investment adviser fee amounted to $3,887,627 or 0.45% of the Fund’s average daily net assets. The Fund invests its cash in Cash Reserves Fund. EVM does not currently receive a fee for advisory services provided to Cash Reserves Fund.
BMR has agreed to reimburse the Fund’s expenses to the extent that total annual operating expenses (relating to ordinary operating expenses only) exceed 0.74%, 1.49% and 0.49% of the Fund’s average daily net assets for Class A, Class C and Class I, respectively. This agreement may be changed or terminated after January 31, 2021. Pursuant to this agreement, BMR was allocated $914,506 of the Fund’s operating expenses for the year ended September 30, 2020.
EVM serves as the administrator of the Fund, but receives no compensation. EVM provides sub-transfer agency and related services to the Fund pursuant to a Sub-Transfer Agency Support Services Agreement. For the year ended September 30, 2020, EVM earned $7,726 from the Fund pursuant to such agreement, which is included in transfer and dividend disbursing agent fees on the Statement of Operations. The Fund was informed that Eaton Vance Distributors, Inc. (EVD), an affiliate of EVM and the Fund’s principal underwriter, received $32,007 as its portion of the sales charge on sales of Class A shares for the year ended September 30, 2020. EVD also received distribution and service fees from Class A and Class C shares (see Note 4) and contingent deferred sales charges (see Note 5).
During the year ended September 30, 2020, BMR reimbursed the Fund $9,380 for a net realized loss due to a trading error. The impact of the reimbursement was less than $0.01 per share for each class and had no significant impact on total return.
Trustees and officers of the Fund who are members of EVM’s or BMR’s organizations receive remuneration for their services to the Fund out of the investment adviser fee. Trustees of the Fund who are not affiliated with the investment adviser may elect to defer receipt of all or a percentage of their annual fees in accordance with the terms of the Trustees Deferred Compensation Plan. For the year ended September 30, 2020, no significant amounts have been deferred. Certain officers and Trustees of the Fund are officers of the above organizations.
4 Distribution Plans
The Fund has in effect a distribution plan for Class A shares (Class A Plan) pursuant to Rule 12b-1 under the 1940 Act. Pursuant to the Class A Plan, the Fund pays EVD a distribution and service fee of 0.25% per annum of its average daily net assets attributable to Class A shares for distribution services and facilities provided to the Fund by EVD, as well as for personal services and/or the maintenance of shareholder accounts. Distribution and service fees paid or accrued to EVD for the year ended September 30, 2020 amounted to $384,931 for Class A shares.
The Fund also has in effect a distribution plan for Class C shares (Class C Plan) pursuant to Rule 12b-1 under the 1940 Act. Pursuant to the Class C Plan, the Fund pays EVD amounts equal to 0.75% per annum of its average daily net assets attributable to Class C shares for providing ongoing distribution services and facilities to the Fund. For the year ended September 30, 2020, the Fund paid or accrued to EVD $440,144 for Class C shares.
Pursuant to the Class C Plan, the Fund also makes payments of service fees to EVD, financial intermediaries and other persons in amounts equal to 0.25% per annum of its average daily net assets attributable to that class. Service fees paid or accrued are for personal services and/or the maintenance of shareholder accounts. They are separate and distinct from the sales commissions and distribution fees payable to EVD. Service fees paid or accrued for the year ended September 30, 2020 amounted to $146,715 for Class C shares.
Distribution and service fees are subject to the limitations contained in the Financial Industry Regulatory Authority Rule 2341(d).
5 Contingent Deferred Sales Charges
A contingent deferred sales charge (CDSC) of 1% generally is imposed on redemptions of Class C shares made within 12 months of purchase. Class A shares may be subject to a 1% CDSC if redeemed within 18 months of purchase (depending on the circumstances of purchase). Generally, the CDSC is based upon the lower of the net asset value at date of redemption or date of purchase. No charge is levied on shares acquired by reinvestment of dividends or capital gain distributions. For the year ended September 30, 2020, the Fund was informed that EVD received approximately $17,000 and $14,000 of CDSCs paid by Class A and Class C shareholders, respectively.
6 Purchases and Sales of Investments
Purchases and sales of investments, other than short-term obligations, and including maturities, paydowns and principal repayments on Senior Loans, for the year ended September 30, 2020 were as follows:
| | | | | | | | |
| | | Purchases | | | Sales | |
| | |
Investments (non-U.S. Government) | | $ | 613,571,086 | | | $ | 607,370,173 | |
| | |
U.S. Government and Agency Securities | | | 91,872,578 | | | | 74,142,145 | |
| | |
| | | $ | 705,443,664 | | | $ | 681,512,318 | |
Eaton Vance
Core Plus Bond Fund
September 30, 2020
Notes to Financial Statements — continued
7 Shares of Beneficial Interest
The Fund’s Declaration of Trust permits the Trustees to issue an unlimited number of full and fractional shares of beneficial interest (without par value). Such shares may be issued in a number of different series (such as the Fund) and classes. Transactions in Fund shares were as follows:
| | | | | | | | |
| | | Year Ended September 30, | |
| Class A | | 2020 | | | 2019 | |
| | |
Sales | | | 6,302,006 | | | | 9,020,427 | |
| | |
Issued to shareholders electing to receive payments of distributions in Fund shares | | | 472,350 | | | | 229,199 | |
| | |
Redemptions | | | (6,877,085 | ) | | | (1,607,150 | ) |
| | |
Converted from Class C shares | | | 168,107 | | | | 92,036 | |
| | |
Net increase | | | 65,378 | | | | 7,734,512 | |
| |
| | | Year Ended September 30, | |
| Class C | | 2020 | | | 2019 | |
| | |
Sales | | | 2,176,977 | | | | 3,073,859 | |
| | |
Issued to shareholders electing to receive payments of distributions in Fund shares | | | 141,502 | | | | 77,163 | |
| | |
Redemptions | | | (1,901,835 | ) | | | (531,535 | ) |
| | |
Converted to Class A shares | | | (168,167 | ) | | | (92,028 | ) |
| | |
Net increase | | | 248,477 | | | | 2,527,459 | |
| |
| | | Year Ended September 30, | |
| Class I | | 2020 | | | 2019 | |
| | |
Sales | | | 38,844,043 | | | | 47,131,144 | |
| | |
Issued to shareholders electing to receive payments of distributions in Fund shares | | | 2,151,884 | | | | 1,098,871 | |
| | |
Redemptions | | | (47,985,690 | ) | | | (9,455,127 | ) |
| | |
Net increase (decrease) | | | (6,989,763 | ) | | | 38,774,888 | |
8 Financial Instruments
The Fund may trade in financial instruments with off-balance sheet risk in the normal course of its investing activities. These financial instruments may include financial futures contracts and forward foreign currency exchange contracts and may involve, to a varying degree, elements of risk in excess of the amounts recognized for financial statement purposes. The notional or contractual amounts of these instruments represent the investment the Fund has in particular classes of financial instruments and do not necessarily represent the amounts potentially subject to risk. The measurement of the risks associated with these instruments is meaningful only when all related and offsetting transactions are considered. A summary of obligations under these financial instruments at September 30, 2020 is included in the Portfolio of Investments. At September 30, 2020, the Fund had sufficient cash and/or securities to cover commitments under these contracts.
In the normal course of pursuing its investment objective, the Fund is subject to the following risks:
Interest Rate Risk: The Fund enters into interest rate futures contracts to seek to hedge against fluctuations in interest rates and/or to change the effective duration of its portfolio.
Foreign Exchange Risk: The Fund engages in forward foreign currency exchange contracts to enhance total return, to seek to hedge against fluctuations in currency exchange rates and/or as a substitute for the purchase or sale of securities or currencies.
The Fund enters into forward foreign currency exchange contracts that may contain provisions whereby the counterparty may terminate the contract under certain conditions, including but not limited to a decline in the Fund’s net assets below a certain level over a certain period of time, which would trigger a
Eaton Vance
Core Plus Bond Fund
September 30, 2020
Notes to Financial Statements — continued
payment by the Fund for those derivatives in a liability position. At September 30, 2020, the fair value of derivatives with credit-related contingent features in a net liability position was $24,116. At September 30, 2020, there were no assets pledged by the Fund for such liability.
The over-the-counter (OTC) derivatives in which the Fund invests are subject to the risk that the counterparty to the contract fails to perform its obligations under the contract. To mitigate this risk, the Fund has entered into an International Swaps and Derivatives Association, Inc. Master Agreement (“ISDA Master Agreement”) or similar agreement with its substantially all its derivative counterparties. An ISDA Master Agreement is a bilateral agreement between the Fund and a counterparty that governs certain OTC derivatives and typically contains, among other things, set-off provisions in the event of a default and/or termination event as defined under the relevant ISDA Master Agreement. Under an ISDA Master Agreement, the Fund may, under certain circumstances, offset with the counterparty certain derivative financial instruments’ payables and/or receivables with collateral held and/or posted and create one single net payment. The provisions of the ISDA Master Agreement typically permit a single net payment in the event of default including the bankruptcy or insolvency of the counterparty. However, bankruptcy or insolvency laws of a particular jurisdiction may impose restrictions on or prohibitions against the right of offset in bankruptcy or insolvency. Certain ISDA Master Agreements allow counterparties to OTC derivatives to terminate derivative contracts prior to maturity in the event the Fund’s net assets decline by a stated percentage or the Fund fails to meet the terms of its ISDA Master Agreements, which would cause the counterparty to accelerate payment by the Fund of any net liability owed to it.
The collateral requirements for derivatives traded under an ISDA Master Agreement are governed by a Credit Support Annex to the ISDA Master Agreement. Collateral requirements are determined at the close of business each day and are typically based on changes in market values for each transaction under an ISDA Master Agreement and netted into one amount for such agreement. Generally, the amount of collateral due from or to a counterparty is subject to a minimum transfer threshold amount before a transfer is required, which may vary by counterparty. Collateral pledged for the benefit of the Fund and/or counterparty is held in segregated accounts by the Fund’s custodian and cannot be sold, re-pledged, assigned or otherwise used while pledged. The portion of such collateral representing cash, if any, is reflected as deposits for derivatives collateral and, in the case of cash pledged by a counterparty for the benefit of the Fund, a corresponding liability on the Statement of Assets and Liabilities. Securities pledged by the Fund as collateral, if any, are identified as such in the Portfolio of Investments.
The fair value of open derivative instruments (not considered to be hedging instruments for accounting disclosure purposes) by risk exposure at September 30, 2020 was as follows:
| | | | | | | | | | |
| | | | | Fair Value | |
| Risk | | Derivative | | Asset
Derivative | | | Liability
Derivative | |
| | | |
Interest Rate | | Futures contracts | | $ | — | | | $ | (251,105 | )(1) |
| | | |
Foreign Exchange | | Forward foreign currency exchange contracts | | | 57,932 | (2) | | | (24,116 | )(3) |
| | | |
Total | | | | $ | 57,932 | | | $ | (275,221 | ) |
| | | |
Derivatives not subject to master netting or similar agreements | | | | $ | — | | | $ | (251,105 | ) |
| | | |
Total Derivatives subject to master netting or similar agreements | | | | $ | 57,932 | | | $ | (24,116 | ) |
| (1) | Only the current day’s variation margin on open futures contracts is reported within the Statement of Assets and Liabilities as Receivable or Payable for variation margin on open financial futures contracts, as applicable. |
| (2) | Statement of Assets and Liabilities location: Receivable for open forward foreign currency exchange contracts. |
| (3) | Statement of Assets and Liabilities location: Payable for open forward foreign currency exchange contracts. |
The Fund’s derivative assets and liabilities at fair value by risk, which are reported gross in the Statement of Assets and Liabilities, are presented in the table above. The following tables present the Fund’s derivative assets and liabilities by counterparty, net of amounts available for offset under a master netting agreement and net of the related collateral received by the Fund for such assets and pledged by the Fund for such liabilities as of September 30, 2020.
| | | | | | | | | | | | | | | | | | | | |
| Counterparty | | Derivative Assets
Subject to
Master Netting
Agreement | | | Derivatives
Available
for Offset | | | Non-cash
Collateral
Received(a) | | | Cash
Collateral
Received(a) | | | Net Amount
of Derivative
Assets(b) | |
| | | | | |
State Street Bank and Trust Company | | $ | 57,932 | | | $ | (24,116 | ) | | $ | — | | | $ | — | | | $ | 33,816 | |
Eaton Vance
Core Plus Bond Fund
September 30, 2020
Notes to Financial Statements — continued
| | | | | | | | | | | | | | | | | | | | |
| Counterparty | | Derivative Liabilities
Subject to
Master Netting
Agreement | | | Derivatives
Available
for Offset | | | Non-cash
Collateral
Pledged(a) | | | Cash
Collateral
Pledged(a) | | | Net Amount
of Derivative
Liabilities(c) | |
| | | | | |
State Street Bank and Trust Company | | $ | (24,116 | ) | | $ | 24,116 | | | $ | — | | | $ | — | | | $ | — | |
| (a) | In some instances, the total collateral received and/or pledged may be more than the amount shown due to overcollateralization. |
| (b) | Net amount represents the net amount due from the counterparty in the event of default. |
| (c) | Net amount represents the net amount payable to the counterparty in the event of default. |
The effect of derivative instruments (not considered to be hedging instruments for accounting disclosure purposes) on the Statement of Operations by risk exposure for the year ended September 30, 2020 was as follows:
| | | | | | | | | | |
| Risk | | Derivative | | Realized Gain (Loss)
on Derivatives Recognized
in Income(1) | | | Change in Unrealized
Appreciation (Depreciation) on
Derivatives Recognized in Income(2) | |
| | | |
Interest Rate | | Futures contracts | | $ | 4,816,720 | | | $ | 78,683 | |
| | | |
Foreign Exchange | | Forward foreign currency exchange contracts | | | (365,565 | ) | | | 33,816 | |
| | | |
Total | | | | $ | 4,451,155 | | | $ | 112,499 | |
| (1) | Statement of Operations location: Net realized gain (loss) – Financial futures contracts and Forward foreign currency exchange contracts, respectively. |
| (2) | Statement of Operations location: Change in unrealized appreciation (depreciation) – Financial futures contracts and Forward foreign currency exchange contracts, respectively. |
The average notional cost of futures contracts and average notional amounts of other derivative contracts outstanding during the year ended September 30, 2020, which are indicative of the volume of these derivative types, were approximately as follows:
| | | | | | | | | | |
Futures
Contracts — Long | | | Futures
Contracts — Short | | | Forward
Foreign Currency
Exchange Contracts* | |
| | |
| | $111,029,000 | | | $ | 17,486,000 | | | $ | 4,931,000 | |
| * | The average notional amount of forward foreign currency exchange contracts is based on the absolute value of notional amounts of currency purchased and currency sold. |
9 Line of Credit
The Fund participates with other portfolios and funds managed by EVM and its affiliates in an $800 million unsecured line of credit agreement with a group of banks, which is in effect through October 27, 2020. In connection with the renewal of the agreement on October 29, 2019, funds managed by Calvert Research and Management, an affiliate of EVM, were added as participating funds to the agreement and the borrowing limit was increased from $625 million. Borrowings are made by the Fund solely for temporary purposes related to redemptions and other short-term cash needs. Interest is charged to the Fund based on its borrowings at an amount above either the Eurodollar rate or Federal Funds rate. In addition, a fee computed at an annual rate of 0.15% on the daily unused portion of the line of credit is allocated among the participating portfolios and funds at the end of each quarter. Because the line of credit is not available exclusively to the Fund, it may be unable to borrow some or all of its requested amounts at any particular time. The Fund did not have any significant borrowings or allocated fees during the year ended September 30, 2020. Effective October 27, 2020, the Fund renewed its line of credit agreement, which expires October 26, 2021, at substantially the same terms.
Eaton Vance
Core Plus Bond Fund
September 30, 2020
Notes to Financial Statements — continued
10 Investments in Affiliated Funds
At September 30, 2020, the value of the Fund’s investment in affiliated funds was $18,277,199, which represents 2.5% of the Fund’s net assets. Transactions in affiliated funds by the Fund for the year ended September 30, 2020 were as follows:
| | | | | | | | | | | | | | | | | | | | | | | | | | | | | | | | |
| Name of affiliated fund | | Value,
beginning
of period | | | Purchases | | | Sales proceeds | | | Net
realized
gain (loss) | | | Change in
unrealized
appreciation
(depreciation) | | | Value, end
of period | | | Dividend
income | | | Units, end
of period | |
|
Short-Term Investments | |
| | | | | | | | |
Eaton Vance Cash Reserves Fund, LLC | | $ | 129,677,910 | | | $ | 506,207,121 | | | $ | (617,587,073 | ) | | $ | (20,243 | ) | | $ | (516 | ) | | $ | 18,277,199 | | | $ | 1,161,725 | | | | 18,277,199 | |
11 Fair Value Measurements
Under generally accepted accounting principles for fair value measurements, a three-tier hierarchy to prioritize the assumptions, referred to as inputs, is used in valuation techniques to measure fair value. The three-tier hierarchy of inputs is summarized in the three broad levels listed below.
| • | | Level 1 – quoted prices in active markets for identical investments |
| • | | Level 2 – other significant observable inputs (including quoted prices for similar investments, interest rates, prepayment speeds, credit risk, etc.) |
| • | | Level 3 – significant unobservable inputs (including a fund’s own assumptions in determining the fair value of investments) |
In cases where the inputs used to measure fair value fall in different levels of the fair value hierarchy, the level disclosed is determined based on the lowest level input that is significant to the fair value measurement in its entirety. The inputs or methodology used for valuing securities are not necessarily an indication of the risk associated with investing in those securities.
At September 30, 2020, the hierarchy of inputs used in valuing the Fund’s investments and open derivative instruments, which are carried at value, were as follows:
| | | | | | | | | | | | | | | | |
| Asset Description | | Level 1 | | | Level 2 | | | Level 3* | | | Total | |
| | | | |
Corporate Bonds & Notes | | $ | — | | | $ | 304,191,263 | | | $ | — | | | $ | 304,191,263 | |
| | | | |
Collateralized Mortgage Obligations | | | — | | | | 36,162,883 | | | | — | | | | 36,162,883 | |
| | | | |
Commercial Mortgage-Backed Securities | | | — | | | | 89,601,336 | | | | — | | | | 89,601,336 | |
| | | | |
Asset-Backed Securities | | | — | | | | 144,457,942 | | | | — | | | | 144,457,942 | |
| | | | |
Foreign Government Bonds | | | — | | | | 24,284,175 | | | | — | | | | 24,284,175 | |
| | | | |
Senior Floating-Rate Loans | | | — | | | | 1,381,339 | | | | — | | | | 1,381,339 | |
| | | | |
Convertible Bonds | | | — | | | | 2,816,600 | | | | — | | | | 2,816,600 | |
| | | | |
Preferred Stocks | | | 6,092,180 | | | | — | | | | 0 | | | | 6,092,180 | |
| | | | |
U.S. Treasury Obligations | | | — | | | | 82,776,250 | | | | — | | | | 82,776,250 | |
| | | | |
Short-Term Investments | | | — | | | | 18,277,199 | | | | — | | | | 18,277,199 | |
| | | | |
Total Investments | | $ | 6,092,180 | | | $ | 703,948,987 | | | $ | 0 | | | $ | 710,041,167 | |
| | | | |
Forward Foreign Currency Exchange Contracts | | $ | — | | | $ | 57,932 | | | $ | — | | | $ | 57,932 | |
| | | | |
Total | | $ | 6,092,180 | | | $ | 704,006,919 | | | $ | 0 | | | $ | 710,099,099 | |
| | | | |
Liability Description | | | | | | | | | | | | | | | | |
| | | | |
Forward Foreign Currency Exchange Contracts | | $ | — | | | $ | (24,116 | ) | | $ | — | | | $ | (24,116 | ) |
| | | | |
Futures Contracts | | | (251,105 | ) | | | — | | | | — | | | | (251,105 | ) |
| | | | |
Total | | $ | (251,105 | ) | | $ | (24,116 | ) | | $ | — | | | $ | (275,221 | ) |
| * | None of the unobservable inputs for Level 3 assets, individually or collectively, had a material impact on the Fund. |
Eaton Vance
Core Plus Bond Fund
September 30, 2020
Notes to Financial Statements — continued
Level 3 investments at the beginning and/or end of the period in relation to net assets were not significant and accordingly, a reconciliation of Level 3 assets for year ended September 30, 2020 is not presented.
12 Risks and Uncertainties
Risks Associated with Foreign Investments
Investing in securities issued by companies whose principal business activities are outside the United States may involve significant risks not present in domestic investments. For example, there is generally less publicly available information about foreign companies, particularly those not subject to the disclosure and reporting requirements of the U.S. securities laws. Certain foreign issuers are generally not bound by uniform accounting, auditing, and financial reporting requirements and standards of practice comparable to those applicable to domestic issuers. Investments in foreign securities also involve the risk of possible adverse changes in investment or exchange control regulations, expropriation or confiscatory taxation, limitation on the removal of funds or other assets of the Fund, political or financial instability or diplomatic and other developments which could affect such investments. Foreign securities markets, while growing in volume and sophistication, are generally not as developed as those in the United States, and securities of some foreign issuers (particularly those located in developing countries) may be less liquid and more volatile than securities of comparable U.S. companies. In general, there is less overall governmental supervision and regulation of foreign securities markets, broker/dealers and issuers than in the United States.
Pandemic Risk
An outbreak of respiratory disease caused by a novel coronavirus was first detected in China in December 2019 and subsequently spread internationally. This coronavirus has resulted in closing borders, enhanced health screenings, changes to healthcare service preparation and delivery, quarantines, cancellations, disruptions to supply chains and customer activity, as well as general concern and uncertainty. Health crises caused by outbreaks, such as the coronavirus outbreak, may exacerbate other pre-existing political, social and economic risks and disrupt normal market conditions and operations. The impact of this outbreak has negatively affected the worldwide economy, the economies of individual countries, individual companies, and the market in general, and may continue to do so in significant and unforeseen ways, as may other epidemics and pandemics that may arise in the future. Any such impact could adversely affect the Fund’s performance, or the performance of the securities in which the Fund invests.
13 Subsequent Event
On October 8, 2020, Morgan Stanley and Eaton Vance Corp. (“Eaton Vance”) announced that they had entered into a definitive agreement under which Morgan Stanley would acquire Eaton Vance. Under the Investment Company Act of 1940, as amended, consummation of this transaction may result in the automatic termination of the Fund’s investment advisory agreement, and any related sub-advisory agreement(s), if applicable. Thus, the Fund’s Board will be asked to approve a new investment advisory agreement (and new sub-advisory agreement(s), if applicable). If approved by the Fund’s Board, the new investment advisory agreement (and new sub-advisory agreement(s), if applicable) is expected to be presented to Fund shareholders for approval, and, if approved, would take effect upon the closing of the transaction.
Eaton Vance
Core Plus Bond Fund
September 30, 2020
Report of Independent Registered Public Accounting Firm
To the Trustees of Eaton Vance Mutual Funds Trust and Shareholders of Eaton Vance Core Plus Bond Fund:
Opinion on the Financial Statements and Financial Highlights
We have audited the accompanying statement of assets and liabilities of Eaton Vance Core Plus Bond Fund (the “Fund”) (one of the funds constituting Eaton Vance Mutual Funds Trust), including the portfolio of investments, as of September 30, 2020, the related statement of operations for the year then ended, the statements of changes in net assets for each of the two years in the period then ended, the financial highlights for each of the five years in the period then ended, and the related notes. In our opinion, the financial statements and financial highlights present fairly, in all material respects, the financial position of the Fund as of September 30, 2020, and the results of its operations for the year then ended, the changes in its net assets for each of the two years in the period then ended, and the financial highlights for each of the five years in the period then ended, in conformity with accounting principles generally accepted in the United States of America.
Basis for Opinion
These financial statements and financial highlights are the responsibility of the Fund’s management. Our responsibility is to express an opinion on the Fund’s financial statements and financial highlights based on our audits. We are a public accounting firm registered with the Public Company Accounting Oversight Board (United States) (PCAOB) and are required to be independent with respect to the Fund in accordance with the U.S. federal securities laws and the applicable rules and regulations of the Securities and Exchange Commission and the PCAOB.
We conducted our audits in accordance with the standards of the PCAOB. Those standards require that we plan and perform the audit to obtain reasonable assurance about whether the financial statements and financial highlights are free of material misstatement, whether due to error or fraud. The Fund is not required to have, nor were we engaged to perform, an audit of its internal control over financial reporting. As part of our audits we are required to obtain an understanding of internal control over financial reporting but not for the purpose of expressing an opinion on the effectiveness of the Fund’s internal control over financial reporting. Accordingly, we express no such opinion.
Our audits included performing procedures to assess the risks of material misstatement of the financial statements and financial highlights, whether due to error or fraud, and performing procedures that respond to those risks. Such procedures included examining, on a test basis, evidence regarding the amounts and disclosures in the financial statements and financial highlights. Our audits also included evaluating the accounting principles used and significant estimates made by management, as well as evaluating the overall presentation of the financial statements and financial highlights. Our procedures included confirmation of securities owned as of September 30, 2020, by correspondence with the custodian and brokers; when replies were not received from brokers, we performed other auditing procedures. We believe that our audits provide a reasonable basis for our opinion.
/s/ Deloitte & Touche LLP
Boston, Massachusetts
November 19, 2020
We have served as the auditor of one or more Eaton Vance investment companies since 1959.
Eaton Vance
Core Plus Bond Fund
September 30, 2020
Federal Tax Information (Unaudited)
The Form 1099-DIV you receive in February 2021 will show the tax status of all distributions paid to your account in calendar year 2020. Shareholders are advised to consult their own tax adviser with respect to the tax consequences of their investment in the Fund. As required by the Internal Revenue Code and/or regulations, shareholders must be notified regarding the status of capital gains dividends.
Capital Gains Dividends. The Fund hereby designates as a capital gain dividend with respect to the taxable year ended September 30, 2020, $2,181,650 or, if subsequently determined to be different, the net capital gain of such year.
Eaton Vance
Core Plus Bond Fund
September 30, 2020
Board of Trustees’ Contract Approval
Overview of the Contract Review Process
The Investment Company Act of 1940, as amended (the “1940 Act”), provides, in substance, that the investment advisory agreement between a fund and its investment adviser will continue in effect from year-to-year only if its continuation is approved on an annual basis by a vote of the fund’s board of trustees, including a majority of the trustees who are not “interested persons” of the fund (“independent trustees”), cast in person at a meeting called for the purpose of considering such approval.
At a meeting held on April 22, 2020 (the “April 2020 Meeting”), the Boards of Trustees/Directors comprised of the same individuals (collectively, the “Board”) that oversees a majority of the registered investment companies advised by Eaton Vance Management or its affiliate, Boston Management and Research (the “Eaton Vance Funds”), including a majority of the independent trustees (the “Independent Trustees”), voted to approve the continuation of existing investment advisory agreements and sub-advisory agreements(1) for each of the Eaton Vance Funds for an additional one-year period. The Board relied upon the affirmative recommendation of its Contract Review Committee, which is a committee exclusively comprised of Independent Trustees. Prior to making its recommendation, the Contract Review Committee reviewed information furnished by the adviser and sub-adviser to each of the Eaton Vance Funds (including information specifically requested by the Board) for a series of formal meetings held between February and April 2020. Members of the Contract Review Committee also considered information received at prior meetings of the Board and its committees, to the extent such information was relevant to the Contract Review Committee’s annual evaluation of the investment advisory agreements and sub-advisory agreements.
In connection with its evaluation of the investment advisory agreements and sub-advisory agreements, the Board considered various information relating to the Eaton Vance Funds. This included information applicable to all or groups of Eaton Vance Funds, which is referenced immediately below, and information applicable to the particular Eaton Vance Fund covered by this report (additional fund-specific information is referenced below under “Results of the Contract Review Process”). (For funds that invest through one or more underlying portfolios, references to “each fund” in this section may include information that was considered at the portfolio-level.)
Information about Fees, Performance and Expenses
| | • | | A report from an independent data provider comparing advisory and other fees paid by each fund to such fees paid by comparable funds, as identified by the independent data provider (“comparable funds”); |
| | • | | A report from an independent data provider comparing each fund’s total expense ratio (and its components) to those of comparable funds; |
| | • | | A report from an independent data provider comparing the investment performance of each fund (including, as relevant, total return data, income data, Sharpe ratios and information ratios) to the investment performance of comparable funds and, as applicable, benchmark indices, over various time periods; |
| | • | | In certain instances, data regarding investment performance relative to customized groups of peer funds and blended indices identified by the adviser in consultation with the Portfolio Management Committee of the Board; |
| | • | | Comparative information concerning the fees charged and services provided by the adviser and sub-adviser to each fund in managing other accounts (which may include other mutual funds, collective investment funds and institutional accounts) using investment strategies and techniques similar to those used in managing such fund(s), if any; |
| | • | | Profitability analyses with respect to the adviser and sub-adviser to each of the funds; |
Information about Portfolio Management and Trading
| | • | | Descriptions of the investment management services provided to each fund, as well as each of the funds’ investment strategies and policies; |
| | • | | The procedures and processes used to determine the fair value of fund assets, when necessary, and actions taken to monitor and test the effectiveness of such procedures and processes; |
| | • | | Information about the policies and practices of each fund’s adviser and sub-adviser (in the context of a sub-adviser, only those with trading responsibilities) with respect to trading, including their processes for seeking best execution of portfolio transactions; |
| | • | | Information about the allocation of brokerage transactions and the benefits, if any, received by the adviser and sub-adviser (in the context of a sub-adviser, only those with trading responsibilities) to each fund as a result of brokerage allocation, including, as applicable, information concerning the acquisition of research through client commission arrangements and policies with respect to “soft dollars”; |
| | • | | Data relating to the portfolio turnover rate of each fund; |
Information about each Adviser and Sub-adviser
| | • | | Reports detailing the financial results and condition of the adviser and sub-adviser to each fund; |
| | • | | Information regarding the individual investment professionals whose responsibilities include portfolio management and investment research for the funds, and, for portfolio managers and certain other investment professionals, information relating to their responsibilities with respect to managing other mutual funds and investment accounts, as applicable; |
| (1) | Not all Eaton Vance Funds have entered into a sub-advisory agreement with a sub-adviser. Accordingly, references to “sub-adviser” or “sub-advisory agreement” in this “Overview” section may not be applicable to the particular Eaton Vance Fund covered by this report. |
Eaton Vance
Core Plus Bond Fund
September 30, 2020
Board of Trustees’ Contract Approval — continued
| | • | | The Code of Ethics of the adviser and its affiliates and the sub-adviser of each fund, together with information relating to compliance with, and the administration of, such codes; |
| | • | | Policies and procedures relating to proxy voting and the handling of corporate actions and class actions; |
| | • | | Information concerning the resources devoted to compliance efforts undertaken by the adviser and its affiliates and the sub-adviser of each fund, if any, including descriptions of their various compliance programs and their record of compliance; |
| | • | | Information concerning the business continuity and disaster recovery plans of the adviser and its affiliates and the sub-adviser of each fund, if any; |
| | • | | A description of Eaton Vance Management’s and Boston Management and Research’s oversight of sub-advisers, including with respect to regulatory and compliance issues, investment management and other matters; |
Other Relevant Information
| | • | | Information concerning the nature, cost and character of the administrative and other non-investment advisory services provided by Eaton Vance Management and its affiliates; |
| | • | | Information concerning oversight of the relationship with the custodian, subcustodians and fund accountants by the adviser and/or administrator to each of the funds; |
| | • | | For an Eaton Vance Fund structured as an exchange-listed closed-end fund, information concerning the benefits of the closed-end fund structure, as well as, where relevant, the closed-end fund’s market prices, trading volume data, distribution rates and other relevant matters; and |
| | • | | The terms of each investment advisory agreement and sub-advisory agreement. |
During the various meetings of the Board and its committees throughout the twelve months ended April 2020, the Trustees received information from portfolio managers and other investment professionals of the advisers and sub-advisers of the funds regarding investment and performance matters, and considered various investment and trading strategies used in pursuing the funds’ investment objectives. The Trustees also received information regarding risk management techniques employed in connection with the management of the funds. The Board and its committees evaluated issues pertaining to industry and regulatory developments, compliance procedures, fund governance and other issues with respect to the funds, and received and participated in reports and presentations provided by Eaton Vance Management, Boston Management and Research and fund sub-advisers, with respect to such matters. In addition to the formal meetings of the Board and its committees, the Independent Trustees held regular teleconferences to discuss, among other topics, matters relating to the continuation of investment advisory agreements and sub-advisory agreements.
The Contract Review Committee was advised throughout the contract review process by Goodwin Procter LLP, independent legal counsel for the Independent Trustees. The members of the Contract Review Committee, with the advice of such counsel, exercised their own business judgment in determining the material factors to be considered in evaluating each investment advisory agreement and sub-advisory agreement and the weight to be given to each such factor. The conclusions reached with respect to each investment advisory agreement and sub-advisory agreement were based on a comprehensive evaluation of all the information provided and not any single factor. Moreover, each member of the Contract Review Committee may have placed varying emphasis on particular factors in reaching conclusions with respect to each investment advisory agreement and sub-advisory agreement. In evaluating each investment advisory agreement and sub-advisory agreement, including the fee structures and other terms contained in such agreements, the members of the Contract Review Committee were also informed by multiple years of analysis and discussion with the adviser and sub-adviser to each of the Eaton Vance Funds.
In voting its approval of the continuation of existing investment advisory agreements and sub-advisory agreements at the April 2020 Meeting, the Board relied on an order issued by the Securities and Exchange Commission on March 25, 2020, which provided temporary relief from the in-person voting requirements under Section 15 of the 1940 Act in response to the impacts of the COVID-19 pandemic.
Results of the Contract Review Process
Based on its consideration of the foregoing, and such other information it deemed relevant, including the factors and conclusions described below, the Contract Review Committee concluded that the continuation of the investment advisory agreement between Eaton Vance Core Plus Bond Fund (the “Fund”) and Boston Management and Research (the “Adviser”), including its fee structure, is in the interests of shareholders and, therefore, recommended to the Board approval of the agreement. Based on the recommendation of the Contract Review Committee, the Board, including a majority of the Independent Trustees, voted to approve continuation of the investment advisory agreement for the Fund.
Nature, Extent and Quality of Services
In considering whether to approve the investment advisory agreement for the Fund, the Board evaluated the nature, extent and quality of services provided to the Fund by the Adviser.
The Board considered the Adviser’s management capabilities and investment processes in light of the types of investments held by the Fund, including the education, experience and number of investment professionals and other personnel who provide portfolio management, investment research, and similar services to the Fund, including recent changes to such personnel. The Board considered, where relevant, the abilities and experience of the Adviser’s investment professionals in analyzing factors such as credit risk and special considerations relevant to investing in income securities. The Board considered the Adviser’s in-house research capabilities. The Board also took into account the resources dedicated to portfolio management and other services, the
Eaton Vance
Core Plus Bond Fund
September 30, 2020
Board of Trustees’ Contract Approval — continued
compensation methods of the Adviser and other factors, including the reputation and resources of the Adviser to recruit and retain highly qualified research, advisory and supervisory investment professionals. In addition, the Board considered the time and attention devoted to the Eaton Vance Funds, including the Fund, by senior management, as well as the infrastructure, operational capabilities and support staff in place to assist in the portfolio management and operations of the Fund, including the provision of administrative services. The Board also considered the business-related and other risks to which the Adviser or its affiliates may be subject in managing the Fund.
The Board considered the compliance programs of the Adviser and relevant affiliates thereof. The Board considered compliance and reporting matters regarding, among other things, personal trading by investment professionals, disclosure of portfolio holdings, late trading, frequent trading, portfolio valuation, business continuity and the allocation of investment opportunities. The Board also considered the responses of the Adviser and its affiliates to requests in recent years from regulatory authorities, such as the Securities and Exchange Commission and the Financial Industry Regulatory Authority.
The Board considered other administrative services provided or overseen by Eaton Vance Management and its affiliates, including transfer agency and accounting services. The Board evaluated the benefits to shareholders of investing in a fund that is a part of a large fund complex offering exposure to a variety of asset classes and investment disciplines, as well as the ability, in many cases, to exchange an investment among different funds without incurring additional sales charges.
After consideration of the foregoing factors, among others, the Board concluded that the nature, extent and quality of services provided by the Adviser, taken as a whole, are appropriate and consistent with the terms of the investment advisory agreement.
Fund Performance
The Board compared the Fund’s investment performance to that of comparable funds identified by an independent data provider (the peer group), as well as an appropriate benchmark index. The Board’s review included comparative performance data with respect to the Fund for the one-, three- and five-year periods ended September 30, 2019. In this regard, the Board noted that the performance of the Fund was higher than the median performance of the Fund’s peer group for the three-year period. The Board also noted that the performance of the Fund was higher than its benchmark index for the three-year period. The Board concluded that the performance of the Fund was satisfactory.
Management Fees and Expenses
The Board considered contractual fee rates payable by the Fund for advisory and administrative services (referred to collectively as “management fees”). As part of its review, the Board considered the Fund’s management fees and total expense ratio for the one-year period ended September 30, 2019, as compared to those of comparable funds, before and after giving effect to any undertaking to waive fees or reimburse expenses. The Board also considered factors that had an impact on the Fund’s total expense ratio relative to comparable funds.
After considering the foregoing information, and in light of the nature, extent and quality of the services provided by the Adviser, the Board concluded that the management fees charged for advisory and related services are reasonable.
Profitability and “Fall-Out” Benefits
The Board considered the level of profits realized by the Adviser and relevant affiliates thereof in providing investment advisory and administrative services to the Fund and to all Eaton Vance Funds as a group. The Board considered the level of profits realized without regard to marketing support or other payments by the Adviser and its affiliates to third parties in respect of distribution or other services.
The Board concluded that, in light of the foregoing factors and the nature, extent and quality of the services rendered, the profits realized by the Adviser and its affiliates are deemed not to be excessive.
The Board also considered direct or indirect fall-out benefits received by the Adviser and its affiliates in connection with their respective relationships with the Fund, including the benefits of research services that may be available to the Adviser as a result of securities transactions effected for the Fund and other investment advisory clients.
Economies of Scale
In reviewing management fees and profitability, the Board also considered the extent to which the Adviser and its affiliates, on the one hand, and the Fund, on the other hand, can expect to realize benefits from economies of scale as the assets of the Fund increase. The Board acknowledged the difficulty in accurately measuring the benefits resulting from economies of scale, if any, with respect to the management of any specific fund or group of funds. The Board reviewed data summarizing the increases and decreases in the assets of the Fund and of all Eaton Vance Funds as a group over various time periods, and evaluated the extent to which the total expense ratio of the Fund and the profitability of the Adviser and its affiliates may have been affected by such increases or decreases. Based upon the foregoing, the Board concluded that the Fund currently shares in the benefits from economies of scale, if any, when they are realized by the Adviser. The Board also concluded that the structure of the advisory fee, which includes breakpoints at several asset levels, will allow the Fund to continue to benefit from any economies of scale in the future.
Eaton Vance
Core Plus Bond Fund
September 30, 2020
Liquidity Risk Management Program
The Fund has implemented a written liquidity risk management program (Program) and related procedures to manage its liquidity in accordance with Rule 22e-4 under the Investment Company Act of 1940, as amended (Liquidity Rule). The Liquidity Rule defines “liquidity risk” as the risk that a fund could not meet requests to redeem shares issued by the fund without significant dilution of the remaining investors’ interests in the fund. The Fund’s Board of Trustees/Directors has designated the investment adviser to serve as the administrator of the Program and the related procedures. The administrator has established a Liquidity Risk Management Oversight Committee (Committee) to perform the functions necessary to administer the Program. As part of the Program, the administrator is responsible for identifying illiquid investments and categorizing the relative liquidity of the Fund’s investments in accordance with the Liquidity Rule. Under the Program, the administrator assesses, manages, and periodically reviews the Fund’s liquidity risk, and is responsible for making certain reports to the Fund’s Board of Trustees/Directors and the Securities and Exchange Commission (SEC) regarding the liquidity of the Fund’s investments, and to notify the Board of Trustees/Directors and the SEC of certain liquidity events specified in the Liquidity Rule. The liquidity of the Fund’s portfolio investments is determined based on a number of factors including, but not limited to, relevant market, trading and investment-specific considerations under the Program.
At a meeting of the Fund’s Board of Trustees/Directors, the Committee provided a written report to the Fund’s Board of Trustees/Directors pertaining to the operation, adequacy, and effectiveness of implementation of the Program, as well as the operation of the highly liquid investment minimum (if applicable) for the period December 1, 2018 through December 31, 2019 (Review Period). The Program operated effectively during the Review Period, supporting the administrator’s ability to assess, manage and monitor Fund liquidity risk, including during periods of market volatility and net redemptions. During the Review Period, the Fund met redemption requests on a timely basis.
There can be no assurance that the Program will achieve its objectives in the future. Please refer to the Fund’s prospectus for more information regarding the Fund’s exposure to liquidity risk and other principal risks to which an investment in the Fund may be subject.
Eaton Vance
Core Plus Bond Fund
September 30, 2020
Management and Organization
Fund Management. The Trustees of Eaton Vance Mutual Funds Trust (the Trust) are responsible for the overall management and supervision of the Trust’s affairs. The Trustees and officers of the Trust are listed below. Except as indicated, each individual has held the office shown or other offices in the same company for the last five years. Trustees and officers of the Trust hold indefinite terms of office. The “Noninterested Trustees” consist of those Trustees who are not “interested persons” of the Trust, as that term is defined under the 1940 Act. The business address of each Trustee and officer is Two International Place, Boston, Massachusetts 02110. As used below, “EVC” refers to Eaton Vance Corp., “EV” refers to Eaton Vance, Inc., “EVM” refers to Eaton Vance Management, “BMR” refers to Boston Management and Research and “EVD” refers to Eaton Vance Distributors, Inc. EVC and EV are the corporate parent and trustee, respectively, of EVM and BMR. EVD is the Fund’s principal underwriter and a wholly-owned subsidiary of EVC. Each officer affiliated with Eaton Vance may hold a position with other Eaton Vance affiliates that is comparable to his or her position with EVM listed below. Each Trustee oversees 143 portfolios (with the exception of Messrs. Faust and Wennerholm and Ms. Frost who oversee 142 portfolios) in the Eaton Vance Complex (including all master and feeder funds in a master feeder structure). Each officer serves as an officer of certain other Eaton Vance funds. Each Trustee and officer serves until his or her successor is elected.
| | | | | | |
| Name and Year of Birth | | Trust
Position(s) | | Trustee
Since(1) | | Principal Occupation(s) and Other Directorships
During Past Five Years and Other Relevant Experience |
|
| Interested Trustee |
| | | |
Thomas E. Faust Jr. 1958 | | Trustee | | 2007 | | Chairman, Chief Executive Officer and President of EVC, Director and President of EV, Chief Executive Officer and President of EVM and BMR, and Director of EVD. Trustee and/or officer of 142 registered investment companies. Mr. Faust is an interested person because of his positions with EVM, BMR, EVD, EVC and EV, which are affiliates of the Trust. Other Directorships in the Last Five Years. Director of EVC and Hexavest Inc. (investment management firm). |
|
| Noninterested Trustees |
| | | |
Mark R. Fetting 1954 | | Trustee | | 2016 | | Private investor. Formerly held various positions at Legg Mason, Inc. (investment management firm) (2000-2012), including President, Chief Executive Officer, Director and Chairman (2008-2012), Senior Executive Vice President (2004-2008) and Executive Vice President (2001-2004). Formerly, President of Legg Mason family of funds (2001-2008). Formerly, Division President and Senior Officer of Prudential Financial Group, Inc. and related companies (investment management firm) (1991-2000). Other Directorships in the Last Five Years. None. |
| | | |
Cynthia E. Frost 1961 | | Trustee | | 2014 | | Private investor. Formerly, Chief Investment Officer of Brown University (university endowment) (2000-2012). Formerly, Portfolio Strategist for Duke Management Company (university endowment manager) (1995-2000). Formerly, Managing Director, Cambridge Associates (investment consulting company) (1989-1995). Formerly, Consultant, Bain and Company (management consulting firm) (1987-1989). Formerly, Senior Equity Analyst, BA Investment Management Company (1983-1985). Other Directorships in the Last Five Years. None. |
| | | |
George J. Gorman 1952 | | Trustee | | 2014 | | Principal at George J. Gorman LLC (consulting firm). Formerly, Senior Partner at Ernst & Young LLP (a registered public accounting firm) (1974-2009). Other Directorships in the Last Five Years. Formerly, Trustee of the BofA Funds Series Trust (11 funds) (2011-2014) and of the Ashmore Funds (9 funds) (2010-2014). |
| | | |
Valerie A. Mosley 1960 | | Trustee | | 2014 | | Chairwoman and Chief Executive Officer of Valmo Ventures (a consulting and investment firm). Former Partner and Senior Vice President, Portfolio Manager and Investment Strategist at Wellington Management Company, LLP (investment management firm) (1992-2012). Former Chief Investment Officer, PG Corbin Asset Management (1990-1992). Formerly worked in institutional corporate bond sales at Kidder Peabody (1986-1990). Other Directorships in the Last Five Years. Director of DraftKings, Inc. (digital sports entertainment and gaming company) (since September 2020). Director of Groupon, Inc. (e-commerce provider) (since April 2020). Director of Envestnet, Inc. (provider of intelligent systems for wealth management and financial wellness) (since 2018). Director of Dynex Capital, Inc. (mortgage REIT) (since 2013). |
Eaton Vance
Core Plus Bond Fund
September 30, 2020
Management and Organization — continued
| | | | | | |
| Name and Year of Birth | | Trust
Position(s) | | Trustee
Since(1) | | Principal Occupation(s) and Other Directorships
During Past Five Years and Other Relevant Experience |
|
| Noninterested Trustees (continued) |
| | | |
William H. Park 1947 | | Chairperson of the Board and Trustee | | 2016 (Chairperson) and 2003 (Trustee) | | Private investor. Formerly, Consultant (management and transactional) (2012-2014). Formerly, Chief Financial Officer, Aveon Group L.P. (investment management firm) (2010-2011). Formerly, Vice Chairman, Commercial Industrial Finance Corp. (specialty finance company) (2006-2010). Formerly, President and Chief Executive Officer, Prizm Capital Management, LLC (investment management firm) (2002-2005). Formerly, Executive Vice President and Chief Financial Officer, United Asset Management Corporation (investment management firm) (1982-2001). Formerly, Senior Manager, Price Waterhouse (now PricewaterhouseCoopers) (a registered public accounting firm) (1972-1981). Other Directorships in the Last Five Years. None. |
| | | |
Helen Frame Peters 1948 | | Trustee | | 2008 | | Professor of Finance, Carroll School of Management, Boston College. Formerly, Dean, Carroll School of Management, Boston College (2000-2002). Formerly, Chief Investment Officer, Fixed Income, Scudder Kemper Investments (investment management firm) (1998-1999). Formerly, Chief Investment Officer, Equity and Fixed Income, Colonial Management Associates (investment management firm) (1991-1998). Other Directorships in the Last Five Years. None. |
| | | |
Keith Quinton 1958 | | Trustee | | 2018 | | Private investor, researcher and lecturer. Independent Investment Committee Member at New Hampshire Retirement System (since 2017). Formerly, Portfolio Manager and Senior Quantitative Analyst at Fidelity Investments (investment management firm) (2001-2014). Other Directorships in the Last Five Years. Director (since 2016) and Chairman (since 2019) of New Hampshire Municipal Bond Bank. |
| | | |
Marcus L. Smith 1966 | | Trustee | | 2018 | | Private investor. Member of Posse Boston Advisory Board (foundation) (since 2015). Formerly, Portfolio Manager at MFS Investment Management (investment management firm) (1994-2017). Other Directorships in the Last Five Years. Director of MSCI Inc. (global provider of investment decision support tools) (since 2017). Formerly, Director of DCT Industrial Trust Inc. (logistics real estate company) (2017-2018). |
| | | |
Susan J. Sutherland 1957 | | Trustee | | 2015 | | Private investor. Director of Ascot Group Limited and certain of its subsidiaries (insurance and reinsurance) (since 2018). Formerly, Director of Hagerty Holding Corp. (insurance and reinsurance) (2015-2018). Formerly, Associate, Counsel and Partner at Skadden, Arps, Slate, Meagher & Flom LLP (law firm) (1982-2013). Other Directorships in the Last Five Years. Formerly, Director of Montpelier Re Holdings Ltd. (global provider of customized insurance and reinsurance products) (2013-2015). |
| | | |
Scott E. Wennerholm 1959 | | Trustee | | 2016 | | Private Investor. Formerly, Trustee at Wheelock College (postsecondary institution) (2012-2018). Formerly, Consultant at GF Parish Group (executive recruiting firm) (2016-2017). Formerly, Chief Operating Officer and Executive Vice President at BNY Mellon Asset Management (investment management firm) (2005-2011). Formerly, Chief Operating Officer and Chief Financial Officer at Natixis Global Asset Management (investment management firm) (1997-2004). Formerly, Vice President at Fidelity Investments Institutional Services (investment management firm) (1994-1997). Other Directorships in the Last Five Years. None. |
| | | | | | |
| Name and Year of Birth | | Trust
Position(s) | | Officer
Since(2) | | Principal Occupation(s)
During Past Five Years |
|
| Principal Officers who are not Trustees |
| | | |
Eric A. Stein 1980 | | President | | 2020 | | Vice President and Chief Investment Officer, Fixed Income of EVM and BMR. Also Vice President of Calvert Research and Management (“CRM”). |
| | | |
Maureen A. Gemma 1960 | | Vice President, Secretary and Chief Legal Officer | | 2005 | | Vice President of EVM and BMR. Also Vice President of CRM. |
| | | |
James F. Kirchner 1967 | | Treasurer | | 2007 | | Vice President of EVM and BMR. Also Vice President of CRM. |
Eaton Vance
Core Plus Bond Fund
September 30, 2020
Management and Organization — continued
| | | | | | |
| Name and Year of Birth | | Trust
Position(s) | | Officer
Since(2) | | Principal Occupation(s)
During Past Five Years |
|
| Principal Officers who are not Trustees (continued) |
| | | |
Richard F. Froio 1968 | | Chief Compliance Officer | | 2017 | | Vice President of EVM and BMR since 2017. Formerly Deputy Chief Compliance Officer (Adviser/Funds) and Chief Compliance Officer (Distribution) at PIMCO (2012-2017) and Managing Director at BlackRock/Barclays Global Investors (2009-2012). |
| (1) | Year first appointed to serve as Trustee for a fund in the Eaton Vance family of funds. Each Trustee has served continuously since appointment unless indicated otherwise. |
| (2) | Year first elected to serve as officer of a fund in the Eaton Vance family of funds when the officer has served continuously. Otherwise, year of most recent election as an officer of a fund in the Eaton Vance family of funds. Titles may have changed since initial election. |
The SAI for the Fund includes additional information about the Trustees and officers of the Fund and can be obtained without charge on Eaton Vance’s website at www.eatonvance.com or by calling 1-800-262-1122.
Eaton Vance Funds
IMPORTANT NOTICES
Privacy. The Eaton Vance organization is committed to ensuring your financial privacy. Each entity listed below has adopted a privacy policy and procedures (“Privacy Program”) Eaton Vance believes is reasonably designed to protect your personal information and to govern when and with whom Eaton Vance may share your personal information.
| • | | At the time of opening an account, Eaton Vance generally requires you to provide us with certain information such as name, address, social security number, tax status, account numbers, and account balances. This information is necessary for us to both open an account for you and to allow us to satisfy legal requirements such as applicable anti-money laundering reviews and know-your-customer requirements. |
| • | | On an ongoing basis, in the normal course of servicing your account, Eaton Vance may share your information with unaffiliated third parties that perform various services for Eaton Vance and/or your account. These third parties include transfer agents, custodians, broker/dealers and our professional advisers, including auditors, accountants, and legal counsel. Eaton Vance may additionally share your personal information with our affiliates. |
| • | | We believe our Privacy Program is reasonably designed to protect the confidentiality of your personal information and to prevent unauthorized access to that information. |
| • | | We reserve the right to change our Privacy Program at any time upon proper notification to you. You may want to review our Privacy Program periodically for changes by accessing the link on our homepage: www.eatonvance.com. |
Our pledge of protecting your personal information applies to the following entities within the Eaton Vance organization: the Eaton Vance Family of Funds, Eaton Vance Management, Eaton Vance Investment Counsel, Eaton Vance Distributors, Inc., Eaton Vance Trust Company, Eaton Vance Management (International) Limited, Eaton Vance Advisers International Ltd., Eaton Vance Global Advisors Limited, Eaton Vance Management’s Real Estate Investment Group, Boston Management and Research, Calvert Research and Management, and Calvert Funds. This Privacy Notice supersedes all previously issued privacy disclosures. For more information about our Privacy Program or about how your personal information may be used, please call 1-800-262-1122.
Delivery of Shareholder Documents. The Securities and Exchange Commission (SEC) permits funds to deliver only one copy of shareholder documents, including prospectuses, proxy statements and shareholder reports, to fund investors with multiple accounts at the same residential or post office box address. This practice is often called “householding” and it helps eliminate duplicate mailings to shareholders. Eaton Vance, or your financial intermediary, may household the mailing of your documents indefinitely unless you instruct Eaton Vance, or your financial intermediary, otherwise. If you would prefer that your Eaton Vance documents not be householded, please contact Eaton Vance at 1-800-262-1122, or contact your financial intermediary. Your instructions that householding not apply to delivery of your Eaton Vance documents will typically be effective within 30 days of receipt by Eaton Vance or your financial intermediary.
Portfolio Holdings. Each Eaton Vance Fund and its underlying Portfolio(s) (if applicable) files a schedule of portfolio holdings on Part F to Form N-PORT with the SEC. Certain information filed on Form N-PORT may be viewed on the Eaton Vance website at www.eatonvance.com, by calling Eaton Vance at 1-800-262-1122 or in the EDGAR database on the SEC’s website at www.sec.gov.
Proxy Voting. From time to time, funds are required to vote proxies related to the securities held by the funds. The Eaton Vance Funds or their underlying Portfolios (if applicable) vote proxies according to a set of policies and procedures approved by the Funds’ and Portfolios’ Boards. You may obtain a description of these policies and procedures and information on how the Funds or Portfolios voted proxies relating to portfolio securities during the most recent 12-month period ended June 30, without charge, upon request, by calling 1-800-262-1122 and by accessing the SEC’s website at www.sec.gov.
This Page Intentionally Left Blank
Investment Adviser
Boston Management and Research
Two International Place
Boston, MA 02110
Administrator
Eaton Vance Management
Two International Place
Boston, MA 02110
Principal Underwriter*
Eaton Vance Distributors, Inc.
Two International Place
Boston, MA 02110
(617) 482-8260
Custodian
State Street Bank and Trust Company
State Street Financial Center, One Lincoln Street
Boston, MA 02111
Transfer Agent
BNY Mellon Investment Servicing (US) Inc.
Attn: Eaton Vance Funds
P.O. Box 9653
Providence, RI 02940-9653
(800) 262-1122
Independent Registered Public Accounting Firm
Deloitte & Touche LLP
200 Berkeley Street
Boston, MA 02116-5022
Fund Offices
Two International Place
Boston, MA 02110
| * | FINRA BrokerCheck. Investors may check the background of their Investment Professional by contacting the Financial Industry Regulatory Authority (FINRA). FINRA BrokerCheck is a free tool to help investors check the professional background of current and former FINRA-registered securities firms and brokers. FINRA BrokerCheck is available by calling 1-800-289-9999 and at www.FINRA.org. The FINRA BrokerCheck brochure describing this program is available to investors at www.FINRA.org. |

4595 9.30.20

Eaton Vance
Municipal Income Funds
Annual Report
September 30, 2020
AMT-Free • National
Important Note. Beginning on January 1, 2021, as permitted by regulations adopted by the Securities and Exchange Commission, paper copies of each Fund’s annual and semi-annual shareholder reports will no longer be sent by mail unless you specifically request paper copies of the reports. Instead, the reports will be made available on the Funds’ website (eatonvance.com/funddocuments), and you will be notified by mail each time a report is posted and provided with a website address to access the report.
If you already elected to receive shareholder reports electronically, you will not be affected by this change and you need not take any action. If you are a direct investor, you may elect to receive shareholder reports and other communications from the Funds electronically by signing up for e-Delivery at eatonvance.com/edelivery. If you own your shares through a financial intermediary (such as a broker-dealer or bank), you must contact your financial intermediary to sign up.
You may elect to receive all future Fund shareholder reports in paper free of charge. If you are a direct investor, you can inform the Funds that you wish to continue receiving paper copies of your shareholder reports by calling 1-800-262-1122. If you own these shares through a financial intermediary, you must contact your financial intermediary or follow instructions included with this disclosure, if applicable, to elect to continue to receive paper copies of your shareholder reports. Your election to receive reports in paper will apply to all Eaton Vance funds held directly or to all funds held through your financial intermediary, as applicable.

Commodity Futures Trading Commission Registration. Effective December 31, 2012, the Commodity Futures Trading Commission (“CFTC”) adopted certain regulatory changes that subject registered investment companies and advisers to regulation by the CFTC if a fund invests more than a prescribed level of its assets in certain CFTC-regulated instruments (including futures, certain options and swap agreements) or markets itself as providing investment exposure to such instruments. Each investment adviser has claimed an exclusion from the definition of “commodity pool operator” under the Commodity Exchange Act with respect to its management of each Fund. Accordingly, neither the Funds nor the adviser with respect to the operation of the Funds is subject to CFTC regulation. Because of its management of other strategies, each Fund’s adviser is registered with the CFTC as a commodity pool operator. Each adviser is also registered as a commodity trading advisor.
Fund shares are not insured by the FDIC and are not deposits or other obligations of, or guaranteed by, any depository institution. Shares are subject to investment risks, including possible loss of principal invested.
This report must be preceded or accompanied by a current summary prospectus or prospectus. Before investing, investors should consider carefully the investment objective, risks, and charges and expenses of a mutual fund. This and other important information is contained in the summary prospectus and prospectus, which can be obtained from a financial intermediary. Prospective investors should read the prospectus carefully before investing. For further information, please call 1-800-262-1122.
Annual Report September 30, 2020
Eaton Vance
Municipal Income Funds
Eaton Vance
Municipal Income Funds
September 30, 2020
Management’s Discussion of Fund Performance1
Economic and Market Conditions
As the 12-month period opened on October 1, 2019, Treasury and municipal bond rates were trending modestly upward, amid better- than-expected U.S. employment reports and cautious optimism about a détente in U.S.-China trade relations. Rates continued to move upward through the end of 2019.
In January 2020, however, news of the outbreak of a new coronavirus in China raised investor concerns and led to a “flight to quality” that sparked a brief bond market rally. As the virus turned into a global pandemic in February and March, however, it ended the longest-ever U.S. economic expansion and brought about a global economic slowdown. Economic activity decreased and credit markets, along with equities, declined in value amid significant volatility.
In response, the U.S. Federal Reserve (the Fed) announced two emergency rate cuts in March 2020 — lowering the federal funds rate to 0.00%-0.25% — along with other measures intended to shore up credit markets. At its July meeting, the Fed provided additional reassurances that it would maintain rates around zero for the foreseeable future and use all the monetary tools at its disposal to support the U.S. economy. These moves helped calm the markets and initiated a new municipal bond rally that began in April and lasted through most of the summer.
The municipal bond rally was also driven by technical market factors as demand overwhelmed supply. As municipal bonds offered attractive tax-exempt yields versus other fixed-income asset classes, municipal bond funds reported net inflows from May through September 2020 — following substantial outflows in March and April.
Midway through August, however, the municipal rally stalled. Rates hit bottom for the fiscal year on August 11, with 10-year municipal bonds at a yield of 0.58%. During the rest of the period, prices fell and yields rose, driven in part by Congress’ failure to pass another stimulus bill, $400-$500 billion of which had been projected for state and local government assistance.
As issuers rushed to take advantage of low yields in late August and September, increased supply reversed the supply-demand dynamic from earlier in the summer — putting further downward pressure on municipal bond prices and upward pressure on yields. In addition, the Fed announced at the end of August a policy shift to allow inflation to run above its 2% target until the U.S. unemployment rate is very low — raising inflation concerns among some investors.
For the period as a whole, rates declined across the municipal bond yield curve, with the greatest declines occurring at the short end of the curve. The Bloomberg Barclays Municipal Bond Index (the Index), a broad measure of the asset class, returned 4.09% during the period — despite a 3.63% decline in March 2020. Reflecting investors’ “flight to quality” in response to the pandemic, municipal bonds with higher credit ratings generally outperformed lower rated issues during the period.
Fund Performance
For the 12-month period ended September 30, 2020, Eaton Vance AMT-Free Municipal Income Fund Class A shares at net asset value (NAV) and Eaton Vance National Municipal Income Fund Class A shares at NAV both underperformed the 4.09% return of the Funds’ benchmark, the Index.
The Funds’ overall strategy is to normally invest in bonds with maturities of 10 years or more, in order to pursue their potentially higher yields and a greater income stream compared with shorter maturity issues.
The Funds may seek to enhance tax-exempt income through the use of leveraged investments by purchasing residual interest bonds. Leveraged investments have the effect of magnifying the Funds’ exposure to their underlying investments in both up and down markets. During this period, when rates fell and bond prices rose for the period as a whole, leveraged investments amplified the appreciation in the price of bonds held by the Funds and generated additional tax-exempt bond income, enhancing the total return of the Funds. By comparison, the Index does not employ leveraged investments. The Fed’s actions during the period to lower interest rates also reduced the borrowing costs associated with residual interest bonds, further contributing to the positive performance impact of the Funds’ leveraged investments.
Fund-Specific Results
Eaton Vance AMT-Free Municipal Income Fund returned 3.12% for Class A shares at NAV, underperforming the 4.09% return of the Index during the period. Detractors from results relative to the Index included security selection and an overweight position, relative to the Index, in Illinois bonds; security selection in the education sector; and overweight positions in bonds rated A and BBB. In contrast, contributors to Fund performance versus the Index included leveraged investments, security selection in the electric utilities sector, and an overweight position in zero-coupon bonds.
Eaton Vance National Municipal Income Fund returned 3.84% for Class A shares at NAV, underperforming the 4.09% return of the Index during the period. Detractors from performance versus the Index included an overweight in bonds from issuers in New York and Illinois — two of the financially hardest-hit states early in the coronavirus pandemic — as prices of those bonds declined due to uncertainty about the economic effects of the pandemic. Security selection in zero-coupon bonds also detracted from relative results, as did security selection in the transportation sector, which was hurt by plunging revenues from travel and public transit. Contributors to performance relative to the Index included leveraged investments; security selection in general obligation bonds; and the Fund’s allocation to taxable municipal bonds, which are not represented in the Index and generally outperformed tax-exempt municipal bonds during the period.
See Endnotes and Additional Disclosures in this report.
Past performance is no guarantee of future results. Returns are historical and are calculated by determining the percentage change in net asset value (NAV) or offering price (as applicable) with all distributions reinvested. Investment return and principal value will fluctuate so that shares, when redeemed, may be worth more or less than their original cost. Performance for periods less than or equal to one year is cumulative. Performance is for the stated time period only; due to market volatility, current Fund performance may be lower or higher than the quoted return. For performance as of the most recent month-end, please refer to eatonvance.com.
Eaton Vance
AMT-Free Municipal Income Fund
September 30, 2020
Performance2,3
Portfolio Manager Cynthia J. Clemson
| | | | | | | | | | | | | | | | | | | | |
| % Average Annual Total Returns | | Class
Inception Date | | | Performance
Inception Date | | | One Year | | | Five Years | | | Ten Years | |
| | | | | |
Class A at NAV | | | 01/06/1998 | | | | 03/16/1978 | | | | 3.12 | % | | | 3.74 | % | | | 4.15 | % |
Class A with 4.75% Maximum Sales Charge | | | — | | | | — | | | | –1.76 | | | | 2.74 | | | | 3.64 | |
Class C at NAV | | | 05/02/2006 | | | | 03/16/1978 | | | | 2.36 | | | | 2.97 | | | | 3.38 | |
Class C with 1% Maximum Sales Charge | | | — | | | | — | | | | 1.36 | | | | 2.97 | | | | 3.38 | |
Class I at NAV | | | 03/16/1978 | | | | 03/16/1978 | | | | 3.48 | | | | 4.02 | | | | 4.41 | |
|
| |
| | | | | |
Bloomberg Barclays Municipal Bond Index | | | — | | | | — | | | | 4.09 | % | | | 3.84 | % | | | 3.99 | % |
| | | | | |
| % Total Annual Operating Expense Ratios4 | | | | | | | | Class A | | | Class C | | | Class I | |
| | | | | |
| | | | | | | | | | | 1.04 | % | | | 1.79 | % | | | 0.79 | % |
| | | | | |
| % Distribution Rates/Yields5 | | | | | | | | Class A | | | Class C | | | Class I | |
| | | | | |
Distribution Rate | | | | | | | | | | | 3.00 | % | | | 2.27 | % | | | 3.24 | % |
Taxable-Equivalent Distribution Rate | | | | | | | | | | | 5.07 | | | | 3.83 | | | | 5.47 | |
SEC 30-day Yield | | | | | | | | | | | 1.17 | | | | 0.50 | | | | 1.47 | |
Taxable-Equivalent SEC 30-day Yield | | | | | | | | | | | 1.97 | | | | 0.85 | | | | 2.49 | |
| | | | | |
| % Total Leverage6 | | | | | | | | | | | | | | | |
| | | | | |
Residual Interest Bond (RIB) Financing | | | | | | | | | | | | | | | | | | | 8.01 | % |
Growth of $10,000
This graph shows the change in value of a hypothetical investment of $10,000 in Class A of the Fund for the period indicated. For comparison, the same investment is shown in the indicated index.
| | | | | | | | |
| Growth of Investment | | Amount Invested | | Period Beginning | | At NAV | | With Maximum Sales Charge |
| | | | |
Class C | | $10,000 | | 09/30/2010 | | $13,941 | | N.A. |
Class I | | $250,000 | | 09/30/2010 | | $385,100 | | N.A. |
See Endnotes and Additional Disclosures in this report.
Past performance is no guarantee of future results. Returns are historical and are calculated by determining the percentage change in net asset value (NAV) or offering price (as applicable) with all distributions reinvested. Investment return and principal value will fluctuate so that shares, when redeemed, may be worth more or less than their original cost. Performance for periods less than or equal to one year is cumulative. Performance is for the stated time period only; due to market volatility, current Fund performance may be lower or higher than the quoted return. For performance as of the most recent month-end, please refer to eatonvance.com.
Eaton Vance
AMT-Free Municipal Income Fund
September 30, 2020
Fund Profile
Credit Quality (% of total investments)7,8
See Endnotes and Additional Disclosures in this report.
Eaton Vance
National Municipal Income Fund
September 30, 2020
Performance2,3
Portfolio Manager Craig R. Brandon, CFA
| | | | | | | | | | | | | | | | | | | | |
| % Average Annual Total Returns | | Class
Inception Date | | | Performance
Inception Date | | | One Year | | | Five Years | | | Ten Years | |
| | | | | |
Class A at NAV | | | 04/05/1994 | | | | 12/19/1985 | | | | 3.84 | % | | | 4.38 | % | | | 4.43 | % |
Class A with 4.75% Maximum Sales Charge | | | — | | | | — | | | | –1.13 | | | | 3.37 | | | | 3.92 | |
Class C at NAV | | | 12/03/1993 | | | | 12/19/1985 | | | | 3.08 | | | | 3.60 | | | | 3.66 | |
Class C with 1% Maximum Sales Charge | | | — | | | | — | | | | 2.08 | | | | 3.60 | | | | 3.66 | |
Class I at NAV | | | 07/01/1999 | | | | 12/19/1985 | | | | 4.10 | | | | 4.58 | | | | 4.67 | |
|
| |
| | | | | |
Bloomberg Barclays Municipal Bond Index | | | — | | | | — | | | | 4.09 | % | | | 3.84 | % | | | 3.99 | % |
| | | | | |
| % Total Annual Operating Expense Ratios4 | | | | | | | | Class A | | | Class C | | | Class I | |
| | | | | |
| | | | | | | | | | | 0.80 | % | | | 1.55 | % | | | 0.55 | % |
| | | | | |
| % Distribution Rates/Yields5 | | | | | | | | Class A | | | Class C | | | Class I | |
| | | | | |
Distribution Rate | | | | | | | | | | | 2.65 | % | | | 1.93 | % | | | 2.89 | % |
Taxable-Equivalent Distribution Rate | | | | | | | | | | | 4.48 | | | | 3.26 | | | | 4.88 | |
SEC 30-day Yield | | | | | | | | | | | 1.08 | | | | 0.42 | | | | 1.38 | |
Taxable-Equivalent SEC 30-day Yield | | | | | | | | | | | 1.83 | | | | 0.70 | | | | 2.33 | |
| | | | | |
| % Total Leverage6 | | | | | | | | | | | | | | | |
| | | | | |
RIB Financing | | | | | | | | | | | | | | | | | | | 2.85 | % |
Growth of $10,000
This graph shows the change in value of a hypothetical investment of $10,000 in Class A of the Fund for the period indicated. For comparison, the same investment is shown in the indicated index.
| | | | | | | | | | | | | | | | |
| Growth of Investment | | Amount Invested | | | Period Beginning | | | At NAV | | | With Maximum Sales Charge | |
| | | | |
Class C | | | $10,000 | | | | 09/30/2010 | | | | $14,325 | | | | N.A. | |
Class I | | | $250,000 | | | | 09/30/2010 | | | | $394,583 | | | | N.A. | |
See Endnotes and Additional Disclosures in this report.
Past performance is no guarantee of future results. Returns are historical and are calculated by determining the percentage change in net asset value (NAV) or offering price (as applicable) with all distributions reinvested. Investment return and principal value will fluctuate so that shares, when redeemed, may be worth more or less than their original cost. Performance for periods less than or equal to one year is cumulative. Performance is for the stated time period only; due to market volatility, current Fund performance may be lower or higher than the quoted return. For performance as of the most recent month-end, please refer to eatonvance.com.
Eaton Vance
National Municipal Income Fund
September 30, 2020
Fund Profile
Credit Quality (% of total investments)7,8
See Endnotes and Additional Disclosures in this report.
Eaton Vance
Municipal Income Funds
September 30, 2020
Endnotes and Additional Disclosures
| 1 | The views expressed in this report are those of the portfolio manager(s) and are current only through the date stated at the top of this page. These views are subject to change at any time based upon market or other conditions, and Eaton Vance and the Fund(s) disclaim any responsibility to update such views. These views may not be relied upon as investment advice and, because investment decisions are based on many factors, may not be relied upon as an indication of trading intent on behalf of any Eaton Vance fund. This commentary may contain statements that are not historical facts, referred to as “forward-looking statements.” The Fund’s actual future results may differ significantly from those stated in any forward-looking statement, depending on factors such as changes in securities or financial markets or general economic conditions, the volume of sales and purchases of Fund shares, the continuation of investment advisory, administrative and service contracts, and other risks discussed from time to time in the Fund’s filings with the Securities and Exchange Commission. |
| 2 | Bloomberg Barclays Municipal Bond Index is an unmanaged index of municipal bonds traded in the U.S. Unless otherwise stated, index returns do not reflect the effect of any applicable sales charges, commissions, expenses, taxes or leverage, as applicable. It is not possible to invest directly in an index. |
| 3 | Total Returns at NAV do not include applicable sales charges. If sales charges were deducted, the returns would be lower. Total Returns shown with maximum sales charge reflect the stated maximum sales charge. Unless otherwise stated, performance does not reflect the deduction of taxes on Fund distributions or redemptions of Fund shares. |
| 4 | Source: Fund prospectus. The expense ratios for the current reporting period can be found in the Financial Highlights section of this report. |
| 5 | The Distribution Rate is based on the Fund’s last regular distribution per share in the period (annualized) divided by the Fund’s NAV at the end of the period. The Fund’s distributions may be comprised of amounts characterized for federal income tax purposes as tax-exempt income, qualified and non-qualified ordinary dividends, capital gains and nondividend distributions, also known as return of capital. The Fund will determine the federal income tax character of distributions paid to a shareholder after the end of the calendar year. This is reported on the IRS form 1099- DIV and provided to the shareholder shortly after each year-end. The Fund’s distributions are determined by the investment adviser based on its current assessment of the Fund’s long-term return potential. As portfolio and market conditions change, the rate of distributions paid by the Fund could change. Taxable-equivalent performance is based on the highest combined federal and state income tax rates, where applicable. Lower tax rates would result in lower tax-equivalent performance. Actual tax rates will vary depending on your income, exemptions and deductions. Rates do not include local taxes. The SEC Yield is a standardized measure based on the estimated yield to maturity of a fund’s investments over a 30-day period and is based on the maximum offer price at the date specified. The SEC Yield is not based on the distributions made by the Fund, which may differ. |
| 6 | Fund employs RIB financing. The leverage created by RIB investments provides an opportunity for increased income but, at the same time, creates special risks (including the likelihood of greater volatility of NAV). The cost of leverage rises and falls with changes in short-term interest rates. See “Floating Rate Notes Issued in Conjunction with Securities Held” in the notes to the financial statements for more information about RIB financing. RIB leverage represents the amount of Floating Rate Notes outstanding at period end as a percentage of Fund net assets plus Floating Rate Notes. |
| 7 | Ratings are based on Moody’s Investors Service, Inc. (“Moody’s”), S&P Global Ratings (“S&P”) or Fitch Ratings (“Fitch”), as applicable. If securities are rated differently by the ratings agencies, the highest rating is applied. Ratings, which are subject to change, apply to the creditworthiness of the issuers of the underlying securities and not to the Fund or its shares. Credit ratings measure the quality of a bond based on the issuer’s creditworthiness, with ratings ranging from AAA, being the highest, to D, being the lowest based on S&P’s measures. Ratings of BBB or higher by S&P or Fitch (Baa or higher by Moody’s) are considered to be investment-grade quality. Credit ratings are based largely on the ratings agency’s analysis at the time of rating. The rating assigned to any particular security is not necessarily a reflection of the issuer’s current financial condition and does not necessarily reflect its assessment of the volatility of a security’s market value or of the liquidity of an investment in the security. Holdings designated as “Not Rated” (if any) are not rated by the national ratings agencies stated above. |
| 8 | The chart includes the municipal bonds held by a trust that issues residual interest bonds, consistent with the Portfolio of Investments. |
| | Fund profiles subject to change due to active management. |
Additional Information
Yield curve is a graphical representation of the yields offered by bonds of various maturities. The yield curve flattens when long-term interest rates fall and/or short-term interest rates increase, and the yield curve steepens when long-term interest rates increase and/or short-term interest rates fall.
Eaton Vance
Municipal Income Funds
September 30, 2020
Fund Expenses
Example: As a Fund shareholder, you incur two types of costs: (1) transaction costs, including sales charges (loads) on purchases and redemption fees (if applicable); and (2) ongoing costs, including management fees; distribution and/or service fees; and other Fund expenses. This Example is intended to help you understand your ongoing costs (in dollars) of Fund investing and to compare these costs with the ongoing costs of investing in other mutual funds. The Example is based on an investment of $1,000 invested at the beginning of the period and held for the entire period (April 1, 2020 – September 30, 2020).
Actual Expenses: The first section of each table below provides information about actual account values and actual expenses. You may use the information in this section, together with the amount you invested, to estimate the expenses that you paid over the period. Simply divide your account value by $1,000 (for example, an $8,600 account value divided by $1,000 = 8.6), then multiply the result by the number in the first section under the heading entitled “Expenses Paid During Period” to estimate the expenses you paid on your account during this period.
Hypothetical Example for Comparison Purposes: The second section of each table below provides information about hypothetical account values and hypothetical expenses based on the actual Fund expense ratio and an assumed rate of return of 5% per year (before expenses), which is not the actual Fund return. The hypothetical account values and expenses may not be used to estimate the actual ending account balance or expenses you paid for the period. You may use this information to compare the ongoing costs of investing in your Fund and other funds. To do so, compare this 5% hypothetical example with the 5% hypothetical examples that appear in the shareholder reports of the other funds.
Please note that the expenses shown in each table are meant to highlight your ongoing costs only and do not reflect any transactional costs, such as sales charges (loads) or redemption fees (if applicable). Therefore, the second section of each table is useful in comparing ongoing costs only, and will not help you determine the relative total costs of owning different funds. In addition, if these transactional costs were included, your costs would be higher.
Eaton Vance AMT-Free Municipal Income Fund
| | | | | | | | | | | | | | | | |
| | | Beginning
Account Value
(4/1/20) | | | Ending
Account Value
(9/30/20) | | | Expenses Paid
During Period*
(4/1/20 – 9/30/20) | | | Annualized
Expense
Ratio | |
| | | | |
Actual | | | | | | | | | | | | | | | | |
Class A | | $ | 1,000.00 | | | $ | 1,025.10 | | | $ | 4.40 | | | | 0.87 | % |
Class C | | $ | 1,000.00 | | | $ | 1,022.50 | | | $ | 8.19 | | | | 1.62 | % |
Class I | | $ | 1,000.00 | | | $ | 1,027.60 | | | $ | 3.14 | | | | 0.62 | % |
| | | | | |
Hypothetical | | | | | | | | | | | | | | | | |
(5% return per year before expenses) | | | | | | | | | | | | | | | | |
Class A | | $ | 1,000.00 | | | $ | 1,020.70 | | | $ | 4.40 | | | | 0.87 | % |
Class C | | $ | 1,000.00 | | | $ | 1,016.90 | | | $ | 8.17 | | | | 1.62 | % |
Class I | | $ | 1,000.00 | | | $ | 1,021.90 | | | $ | 3.13 | | | | 0.62 | % |
| * | Expenses are equal to the Fund’s annualized expense ratio for the indicated Class, multiplied by the average account value over the period, multiplied by 183/366 (to reflect the one-half year period). The Example assumes that the $1,000 was invested at the net asset value per share determined at the close of business on March 31, 2020. |
Eaton Vance
Municipal Income Funds
September 30, 2020
Fund Expenses — continued
Eaton Vance National Municipal Income Fund
| | | | | | | | | | | | | | | | |
| | | Beginning
Account Value
(4/1/20) | | | Ending
Account Value
(9/30/20) | | | Expenses Paid
During Period*
(4/1/20 – 9/30/20) | | | Annualized
Expense
Ratio | |
| | | | |
Actual | | | | | | | | | | | | | | | | |
Class A | | $ | 1,000.00 | | | $ | 1,041.30 | | | $ | 3.42 | | | | 0.67 | % |
Class C | | $ | 1,000.00 | | | $ | 1,037.40 | | | $ | 7.18 | | | | 1.41 | % |
Class I | | $ | 1,000.00 | | | $ | 1,042.60 | | | $ | 2.14 | | | | 0.42 | % |
| | | | | |
Hypothetical | | | | | | | | | | | | | | | | |
(5% return per year before expenses) | | | | | | | | | | | | | | | | |
Class A | | $ | 1,000.00 | | | $ | 1,021.70 | | | $ | 3.39 | | | | 0.67 | % |
Class C | | $ | 1,000.00 | | | $ | 1,018.00 | | | $ | 7.11 | | | | 1.41 | % |
Class I | | $ | 1,000.00 | | | $ | 1,022.90 | | | $ | 2.12 | | | | 0.42 | % |
| * | Expenses are equal to the Fund’s annualized expense ratio for the indicated Class, multiplied by the average account value over the period, multiplied by 183/366 (to reflect the one-half year period). The Example assumes that the $1,000 was invested at the net asset value per share determined at the close of business on March 31, 2020. |
Eaton Vance
AMT-Free Municipal Income Fund
September 30, 2020
Portfolio of Investments
| | | | | | | | |
| Tax-Exempt Investments — 107.4% | |
| Security | | Principal
Amount
(000’s omitted) | | | Value | |
|
| Bond Bank — 4.4% | |
| | |
New York State Environmental Facilities Corp., 5.00%, 10/15/35(1) | | $ | 9,900 | | | $ | 9,937,224 | |
| | |
Oklahoma Water Resources Board, 4.00%, 10/1/43 | | | 1,000 | | | | 1,165,570 | |
| | |
Texas Water Development Board, 3.00%, 10/15/38(2) | | | 3,500 | | | | 3,892,035 | |
| | |
| | | | | | | $ | 14,994,829 | |
|
| Education — 5.4% | |
| | |
Connecticut Health and Educational Facilities Authority, (Choate Rosemary Hall), 4.00%, 7/1/38 | | $ | 315 | | | $ | 383,210 | |
| | |
Connecticut Health and Educational Facilities Authority, (Choate Rosemary Hall), 4.00%, 7/1/39 | | | 380 | | | | 460,340 | |
| | |
Connecticut Health and Educational Facilities Authority, (Choate Rosemary Hall), 4.00%, 7/1/42 | | | 860 | | | | 1,033,006 | |
| | |
Connecticut Health and Educational Facilities Authority, (Choate Rosemary Hall), 5.00%, 7/1/32 | | | 175 | | | | 234,874 | |
| | |
Connecticut Health and Educational Facilities Authority, (Fairfield University), 5.00%, 7/1/46 | | | 5,000 | | | | 5,657,000 | |
| | |
Connecticut Health and Educational Facilities Authority, (Sacred Heart University), 4.00%, 7/1/45 | | | 875 | | | | 976,351 | |
| | |
Connecticut Health and Educational Facilities Authority, (Sacred Heart University), 5.00%, 7/1/40 | | | 900 | | | | 1,116,171 | |
| | |
District of Columbia, (KIPP DC), 4.00%, 7/1/39 | | | 100 | | | | 108,413 | |
| | |
District of Columbia, (KIPP DC), 4.00%, 7/1/44 | | | 100 | | | | 107,031 | |
| | |
District of Columbia, (KIPP DC), 4.00%, 7/1/49 | | | 135 | | | | 143,666 | |
| | |
Pennsylvania Higher Educational Facilities Authority, (Drexel University), 5.00%, 5/1/37 | | | 1,750 | | | | 2,094,785 | |
| | |
Pima County Community College District, AZ, 5.00%, 7/1/35 | | | 725 | | | | 912,768 | |
| | |
University of California, 5.25%, 5/15/35 | | | 3,555 | | | | 4,145,592 | |
| | |
Waco Education Finance Corp., TX, (Baylor University), 4.00%, 3/1/37 | | | 1,000 | | | | 1,176,080 | |
| | |
| | | | | | | $ | 18,549,287 | |
|
| Electric Utilities — 4.4% | |
| | |
Chula Vista, CA, (San Diego Gas and Electric), 5.875%, 2/15/34 | | $ | 3,520 | | | $ | 3,533,200 | |
| | |
Long Island Power Authority, NY, Electric System Revenue, 5.00%, 9/1/37 | | | 2,000 | | | | 2,617,520 | |
| | |
Lower Colorado River Authority, TX, (LCRA Transmission Services Corp.), 5.00%, 5/15/40 | | | 1,000 | | | | 1,251,900 | |
| | |
New York Power Authority, 4.00%, 11/15/45 | | | 2,285 | | | | 2,675,849 | |
| | |
New York Power Authority, 4.00%, 11/15/50 | | | 715 | | | | 831,981 | |
| | |
Northern Municipal Power Agency, MN, 5.00%, 1/1/31 | | | 200 | | | | 243,470 | |
| | |
Northern Municipal Power Agency, MN, 5.00%, 1/1/35 | | | 170 | | | | 203,631 | |
| | |
Northern Municipal Power Agency, MN, 5.00%, 1/1/36 | | | 160 | | | | 191,040 | |
| | | | | | | | |
| Security | | Principal
Amount
(000’s omitted) | | | Value | |
|
| Electric Utilities (continued) | |
| | |
Utility Debt Securitization Authority, NY, 5.00%, 12/15/33 | | $ | 2,895 | | | $ | 3,312,546 | |
| | |
| | | | | | | $ | 14,861,137 | |
|
| Escrowed / Prerefunded — 7.6% | |
| | |
Henrico County Economic Development Authority, VA, (Bon Secours Health System, Inc.), Prerefunded to 11/1/22, 5.00%, 11/1/30 | | $ | 1,185 | | | $ | 1,299,909 | |
| | |
Massachusetts Development Finance Agency, (Tufts Medical Center), Prerefunded to 1/1/21, 6.75%, 1/1/36 | | | 470 | | | | 477,699 | |
| | |
Massachusetts Development Finance Agency, (Tufts Medical Center), Prerefunded to 1/1/21, 6.75%, 1/1/36 | | | 315 | | | | 320,160 | |
| | |
New Jersey Turnpike Authority, Prerefunded to 7/1/22, 5.00%, 1/1/30 | | | 3,060 | | | | 3,318,295 | |
| | |
North Carolina Capital Facilities Finance Agency, (Duke University), Prerefunded to 10/1/25, 5.00%, 10/1/41 | | | 1,480 | | | | 1,823,108 | |
| | |
Oklahoma Development Finance Authority, (St. John Health System), Prerefunded to 2/15/22, 5.00%, 2/15/34 | | | 2,035 | | | | 2,168,516 | |
| | |
Oregon Facilities Authority, (Lewis & Clark College), Prerefunded to 10/1/21, 5.625%, 10/1/36 | | | 1,050 | | | | 1,106,721 | |
| | |
Savannah Economic Development Authority, GA, Escrowed to Maturity, 0.00%, 12/1/21 | | | 6,000 | | | | 5,974,920 | |
| | |
Washington, Prerefunded to 2/1/21, 5.25%, 2/1/36(1) | | | 6,000 | | | | 6,102,300 | |
| | |
West Virginia University, Prerefunded to 10/1/22, 5.00%, 10/1/31 | | | 3,000 | | | | 3,288,780 | |
| | |
| | | | | | | $ | 25,880,408 | |
|
| General Obligations — 19.1% | |
| | |
California, 5.00%, 4/1/35 | | $ | 2,125 | | | $ | 2,439,691 | |
| | |
California, 5.25%, 10/1/29 | | | 560 | | | | 587,406 | |
| | |
California, 5.25%, 10/1/32 | | | 3,480 | | | | 3,648,884 | |
| | |
Chicago Board of Education, IL, 5.00%, 12/1/21 | | | 230 | | | | 238,108 | |
| | |
Chicago Board of Education, IL, 5.00%, 12/1/46 | | | 10 | | | | 10,199 | |
| | |
Chicago Board of Education, IL, 5.00%, 12/1/42 | | | 260 | | | | 264,085 | |
| | |
Chicago Board of Education, IL, 5.00%, 12/1/44 | | | 1,405 | | | | 1,497,589 | |
| | |
Chicago, IL, 5.00%, 1/1/39 | | | 1,400 | | | | 1,441,510 | |
| | |
Chicago, IL, 5.00%, 1/1/44 | | | 1,490 | | | | 1,514,719 | |
| | |
Corpus Christi Independent School District, TX, (PSF Guaranteed), 4.00%, 8/15/45 | | | 2,250 | | | | 2,666,857 | |
| | |
District of Columbia, 5.00%, 6/1/37(1) | | | 7,000 | | | | 8,726,340 | |
| | |
Fennville Public Schools, MI, 4.00%, 5/1/34 | | | 1,000 | | | | 1,163,320 | |
| | |
Foothill-De Anza Community College District, CA, 5.00%, 8/1/34 | | | 1,150 | | | | 1,340,130 | |
| | |
Foothill-De Anza Community College District, CA, 5.00%, 8/1/36 | | | 1,150 | | | | 1,336,323 | |
| | |
Gallatin County School District No. 44, MT, 4.00%, 6/1/35 | | | 520 | | | | 618,363 | |
| | | | |
| | 10 | | See Notes to Financial Statements. |
Eaton Vance
AMT-Free Municipal Income Fund
September 30, 2020
Portfolio of Investments — continued
| | | | | | | | |
| Security | | Principal
Amount
(000’s omitted) | | | Value | |
|
| General Obligations (continued) | |
| | |
Harris County, TX, 3.00%, 10/1/38(2) | | $ | 1,120 | | | $ | 1,245,227 | |
| | |
Illinois, 4.00%, 6/1/33 | | | 1,000 | | | | 983,870 | |
| | |
Illinois, 4.00%, 11/1/40 | | | 1,000 | | | | 942,720 | |
| | |
Illinois, 5.00%, 5/1/35 | | | 2,000 | | | | 2,053,400 | |
| | |
Illinois, 5.50%, 5/1/39 | | | 205 | | | | 224,649 | |
| | |
Illinois, 5.75%, 5/1/45 | | | 210 | | | | 230,754 | |
| | |
Kane, Cook and DuPage Counties School District No. 46, IL, 5.00%, 1/1/31 | | | 4,470 | | | | 5,095,174 | |
| | |
Lodi Unified School District, CA, (Election of 2016), 4.00%, 8/1/33 | | | 1,250 | | | | 1,485,975 | |
| | |
New York, NY, 4.00%, 10/1/35 | | | 2,935 | | | | 3,416,810 | |
| | |
New York, NY, 4.00%, 3/1/36 | | | 2,520 | | | | 2,943,058 | |
| | |
New York, NY, 4.00%, 8/1/42(1) | | | 7,000 | | | | 7,940,380 | |
| | |
Renton School District No. 403, WA, 4.00%, 12/1/33 | | | 1,230 | | | | 1,512,580 | |
| | |
Renton School District No. 403, WA, 4.00%, 12/1/34 | | | 1,300 | | | | 1,592,396 | |
| | |
Salem-Keizer School District No. 24J, OR, 0.00%, 6/15/24 | | | 1,220 | | | | 1,197,308 | |
| | |
San Rafael City High School District, CA, (Election of 2015), 4.00%, 8/1/36 | | | 1,190 | | | | 1,435,664 | |
| | |
Springfield School District No. 19, OR, 5.00%, 6/15/30 | | | 1,085 | | | | 1,306,807 | |
| | |
Union R-XI School District, MO, 5.00%, 3/1/38 | | | 2,100 | | | | 2,470,230 | |
| | |
University of Connecticut, 5.00%, 2/15/32 | | | 650 | | | | 725,985 | |
| | |
Washington, 5.00%, 6/1/38(2) | | | 710 | | | | 920,274 | |
| | |
| | | | | | | $ | 65,216,785 | |
|
| Hospital — 10.2% | |
| | |
California Health Facilities Financing Authority, (Catholic Healthcare West), 5.25%, 3/1/28 | | $ | 535 | | | $ | 544,865 | |
| | |
California Health Facilities Financing Authority, (St. Joseph Health System), 5.00%, 7/1/33 | | | 1,720 | | | | 1,892,379 | |
| | |
California Health Facilities Financing Authority, (St. Joseph Health System), 5.00%, 7/1/37 | | | 2,300 | | | | 2,518,477 | |
| | |
California Health Facilities Financing Authority, (Sutter Health), 5.25%, 8/15/31 | | | 1,325 | | | | 1,378,013 | |
| | |
California Statewide Communities Development Authority, (Loma Linda University Medical Center), 5.25%, 12/1/34 | | | 3,000 | | | | 3,284,580 | |
| | |
Chattanooga Health, Educational and Housing Facility Board, TN, (CommonSpirit Health), 4.00%, 8/1/37 | | | 1,250 | | | | 1,418,613 | |
| | |
Colorado Health Facilities Authority, (Vail Valley Medical Center), 5.00%, 1/15/35 | | | 2,000 | | | | 2,318,460 | |
| | |
Delaware Health Facilities Authority, (Beebe Medical Center), 5.00%, 6/1/36 | | | 3,730 | | | | 4,397,782 | |
| | |
Delaware Health Facilities Authority, (Beebe Medical Center), 5.00%, 6/1/37 | | | 1,000 | | | | 1,175,050 | |
| | |
Escambia County Health Facilities Authority, FL, (Baptist Health Care Corp. Obligated Group), 4.00%, 8/15/50 | | | 520 | | | | 566,670 | |
| | |
Massachusetts Development Finance Agency, (Children’s Hospital), 5.00%, 10/1/31 | | | 2,110 | | | | 2,405,400 | |
| | | | | | | | |
| Security | | Principal
Amount
(000’s omitted) | | | Value | |
|
| Hospital (continued) | |
| | |
Missouri Health and Educational Facilities Authority, (Mercy Health), 5.00%, 11/15/47 | | $ | 3,000 | | | $ | 3,529,560 | |
| | |
New York Dormitory Authority, (Montefiore Obligated Group), 4.00%, 9/1/45 | | | 1,000 | | | | 1,081,650 | |
| | |
Ohio, (University Hospitals Health Systems, Inc.), 5.00%, 1/15/36 | | | 2,500 | | | | 2,903,775 | |
| | |
Tarrant County Cultural Education Facilities Finance Corp., TX, (Cook Children’s Medical Center), 5.25%, 12/1/39(1) | | | 5,000 | | | | 5,521,550 | |
| | |
| | | | | | | $ | 34,936,824 | |
|
| Housing — 0.6% | |
| | |
Phoenix Industrial Development Authority, AZ, (Downtown Phoenix Student Housing, LLC - Arizona State University), 5.00%, 7/1/37 | | $ | 500 | | | $ | 537,135 | |
| | |
Phoenix Industrial Development Authority, AZ, (Downtown Phoenix Student Housing, LLC - Arizona State University), 5.00%, 7/1/42 | | | 1,250 | | | | 1,325,625 | |
| | |
Texas Student Housing Corp., (University of North Texas), 9.375%, 7/1/06(3) | | | 285 | | | | 285,000 | |
| | |
| | | | | | | $ | 2,147,760 | |
|
| Insured – Education — 1.0% | |
| | |
Northern Illinois University, IL, (BAM), 5.00%, 4/1/31 | | $ | 950 | | | $ | 1,205,902 | |
| | |
Virginia College Building Authority, (Washington and Lee University), (NPFG), 5.25%, 1/1/31 | | | 1,750 | | | | 2,323,107 | |
| | |
| | | | | | | $ | 3,529,009 | |
|
| Insured – Electric Utilities — 0.7% | |
| | |
Ohio Municipal Electric Generation Agency, (NPFG), 0.00%, 2/15/29 | | $ | 2,865 | | | $ | 2,528,649 | |
| | |
| | | | | | | $ | 2,528,649 | |
|
| Insured – Escrowed / Prerefunded — 2.0% | |
| | |
Detroit, MI, Sewage Disposal System, (AGM), Prerefunded to 7/1/22, 5.00%, 7/1/39 | | $ | 4,825 | | | $ | 5,232,278 | |
| | |
Texas Transportation Commission, (Central Texas Turnpike System), (AMBAC), Escrowed to Maturity, 0.00%, 8/15/21 | | | 1,560 | | | | 1,556,755 | |
| | |
| | | | | | | $ | 6,789,033 | |
|
| Insured – General Obligations — 1.2% | |
| | |
Atlantic City, NJ, (AGM), 4.00%, 3/1/42 | | $ | 145 | | | $ | 160,035 | |
| | |
Chicago Board of Education, IL, (AGM), 5.00%, 12/1/24 | | | 505 | | | | 583,664 | |
| | |
McCook, IL, (AGM), 4.00%, 12/1/29 | | | 240 | | | | 292,152 | |
| | |
McCook, IL, (AGM), 4.00%, 12/1/30 | | | 200 | | | | 241,996 | |
| | |
McCook, IL, (AGM), 4.00%, 12/1/33 | | | 500 | | | | 594,910 | |
| | | | |
| | 11 | | See Notes to Financial Statements. |
Eaton Vance
AMT-Free Municipal Income Fund
September 30, 2020
Portfolio of Investments — continued
| | | | | | | | |
| Security | | Principal
Amount
(000’s omitted) | | | Value | |
|
| Insured – General Obligations (continued) | |
| | |
McCook, IL, (AGM), 4.00%, 12/1/34 | | $ | 440 | | | $ | 522,038 | |
| | |
Proviso Township High School District No. 209, IL, (AGM), 4.00%, 12/1/38 | | | 1,500 | | | | 1,680,495 | |
| | |
| | | | | | | $ | 4,075,290 | |
|
| Insured – Lease Revenue / Certificates of Participation — 2.1% | |
| | |
Anaheim Public Financing Authority, CA, (Anaheim Public Improvements), (AGM), 0.00%, 9/1/31 | | $ | 8,680 | | | $ | 7,076,023 | |
| | |
| | | | | | | $ | 7,076,023 | |
|
| Insured – Other Revenue — 2.4% | |
| | |
Harris County-Houston Sports Authority, TX, (AGM), (NPFG), 0.00%, 11/15/34 | | $ | 10,600 | | | $ | 6,177,256 | |
| | |
New York City Industrial Development Agency, NY, (Yankee Stadium), (AGM), 3.00%, 3/1/38(2) | | | 555 | | | | 576,817 | |
| | |
New York City Industrial Development Agency, NY, (Yankee Stadium), (AGM), 3.00%, 3/1/49(2) | | | 1,315 | | | | 1,325,468 | |
| | |
| | | | | | | $ | 8,079,541 | |
|
| Insured – Special Tax Revenue — 5.1% | |
| | |
Alabama Public School and College Authority, (AGM), 2.50%, 12/1/27 | | $ | 5,265 | | | $ | 5,272,213 | |
| | |
Massachusetts, Dedicated Tax Revenue, (NPFG), 5.50%, 1/1/27 | | | 6,000 | | | | 7,549,980 | |
| | |
Massachusetts, Dedicated Tax Revenue, (NPFG), 5.50%, 1/1/30 | | | 2,565 | | | | 3,404,755 | |
| | |
Successor Agency to San Francisco City and County Redevelopment Agency, CA, (NPFG), 5.00%, 8/1/43 | | | 1,100 | | | | 1,269,840 | |
| | |
| | | | | | | $ | 17,496,788 | |
|
| Insured – Transportation — 8.6% | |
| | |
Chicago, IL, (O’Hare International Airport), (AGM), 5.00%, 1/1/28 | | $ | 1,000 | | | $ | 1,092,460 | |
| | |
Chicago, IL, (O’Hare International Airport), (AGM), 5.125%, 1/1/31 | | | 1,000 | | | | 1,090,080 | |
| | |
Chicago, IL, (O’Hare International Airport), (AGM), 5.25%, 1/1/32 | | | 785 | | | | 856,231 | |
| | |
E-470 Public Highway Authority, CO, (NPFG), 0.00%, 9/1/39 | | | 7,120 | | | | 3,363,701 | |
| | |
Metropolitan Transportation Authority, NY, Green Bonds, (AGM), 4.00%, 11/15/46 | | | 1,230 | | | | 1,321,783 | |
| | |
Metropolitan Transportation Authority, NY, Green Bonds, (AGM), 5.00%, 11/15/44 | | | 1,705 | | | | 1,986,137 | |
| | |
Pennsylvania Turnpike Commission, (AGM), 6.375%, 12/1/38 | | | 11,000 | | | | 14,576,650 | |
| | |
Texas Transportation Commission, (Central Texas Turnpike System), (AMBAC), 0.00%, 8/15/21 | | | 5,285 | | | | 5,263,913 | |
| | |
| | | | | | | $ | 29,550,955 | |
| | | | | | | | |
| Security | | Principal
Amount
(000’s omitted) | | | Value | |
|
| Insured – Water and Sewer — 0.7% | |
| | |
Michigan Finance Authority, (Detroit Water and Sewerage Department), (AGM), 5.00%, 7/1/32 | | $ | 655 | | | $ | 752,412 | |
| | |
Michigan Finance Authority, (Detroit Water and Sewerage Department), (AGM), 5.00%, 7/1/33 | | | 565 | | | | 647,456 | |
| | |
Michigan Finance Authority, (Detroit Water and Sewerage Department), (AGM), 5.00%, 7/1/35 | | | 280 | | | | 319,309 | |
| | |
Michigan Finance Authority, (Detroit Water and Sewerage Department), (AGM), 5.00%, 7/1/37 | | | 565 | | | | 641,868 | |
| | |
| | | | | | | $ | 2,361,045 | |
|
| Lease Revenue / Certificates of Participation — 2.5% | |
| | |
Hudson Yards Infrastructure Corp., NY, 4.00%, 2/15/44 | | $ | 4,830 | | | $ | 5,252,963 | |
| | |
New Jersey Economic Development Authority, (School Facilities Construction), 5.00%, 6/15/37 | | | 3,000 | | | | 3,412,740 | |
| | |
| | | | | | | $ | 8,665,703 | |
|
| Other Revenue — 0.4% | |
| | |
Central Falls Detention Facility Corp., RI, 7.25%, 7/15/35(3) | | $ | 1,200 | | | $ | 216,000 | |
| | |
Mercer County Improvement Authority, NJ, 4.00%, 3/15/40 | | | 935 | | | | 1,102,739 | |
| | |
| | | | | | | $ | 1,318,739 | |
|
| Senior Living / Life Care — 3.5% | |
| | |
National Finance Authority, NH, (The Vista), 5.25%, 7/1/39(4) | | $ | 265 | | | $ | 269,362 | |
| | |
National Finance Authority, NH, (The Vista), 5.625%, 7/1/46(4) | | | 360 | | | | 369,853 | |
| | |
National Finance Authority, NH, (The Vista), 5.75%, 7/1/54(4) | | | 775 | | | | 798,343 | |
| | |
Palm Beach County Health Facilities Authority, FL, (Sinai Residences of Boca Raton), 7.25%, 6/1/39 | | | 570 | | | | 623,090 | |
| | |
Palm Beach County Health Facilities Authority, FL, (Sinai Residences of Boca Raton), 7.50%, 6/1/49 | | | 2,690 | | | | 2,945,362 | |
| | |
Saint Louis County Industrial Development Authority, MO, (St. Andrew’s Resources for Seniors Obligated Group), 5.00%, 12/1/35 | | | 1,700 | | | | 1,675,027 | |
| | |
Tempe Industrial Development Authority, AZ, (Friendship Village of Tempe), 6.00%, 12/1/32 | | | 160 | | | | 162,699 | |
| | |
Tempe Industrial Development Authority, AZ, (Friendship Village of Tempe), 6.25%, 12/1/42 | | | 660 | | | | 669,530 | |
| | |
Washington Housing Finance Commission, (Horizon House), 5.00%, 1/1/32(4) | | | 1,575 | | | | 1,734,311 | |
| | |
Washington Housing Finance Commission, (Horizon House), 5.00%, 1/1/38(4) | | | 2,325 | | | | 2,518,975 | |
| | |
Washington Housing Finance Commission, (Transforming Age), 5.00%, 1/1/34(4) | | | 245 | | | | 265,695 | |
| | |
| | | | | | | $ | 12,032,247 | |
| | | | |
| | 12 | | See Notes to Financial Statements. |
Eaton Vance
AMT-Free Municipal Income Fund
September 30, 2020
Portfolio of Investments — continued
| | | | | | | | |
| Security | | Principal
Amount
(000’s omitted) | | | Value | |
|
| Special Tax Revenue — 6.8% | |
| | |
Bridgeville, DE, (Heritage Shores Special Development District), 5.45%, 7/1/35 | | $ | 885 | | | $ | 867,796 | |
| | |
Connecticut, Special Tax Revenue, 4.00%, 5/1/36 | | | 3,500 | | | | 4,090,520 | |
| | |
Jurupa Public Financing Authority, CA, 5.00%, 9/1/31 | | | 1,200 | | | | 1,372,296 | |
| | |
New York City Transitional Finance Authority, NY, Future Tax Revenue, 4.00%, 11/1/38 | | | 5,240 | | | | 6,010,594 | |
| | |
New York City Transitional Finance Authority, NY, Future Tax Revenue, 5.00%, 11/1/37 | | | 1,000 | | | | 1,186,270 | |
| | |
New York Dormitory Authority, Personal Income Tax Revenue, 5.00%, 3/31/21 | | | 600 | | | | 614,448 | |
| | |
New York State Urban Development Corp., Personal Income Tax Revenue, 4.00%, 3/15/34 | | | 3,065 | | | | 3,677,142 | |
| | |
New York State Urban Development Corp., Personal Income Tax Revenue, 5.00%, 3/15/31 | | | 1,480 | | | | 1,969,318 | |
| | |
River Hall Community Development District, FL, (Capital Improvements), 5.45%, 5/1/36 | | | 930 | | | | 935,431 | |
| | |
San Francisco Bay Area Rapid Transit District, CA, Sales Tax Revenue, 4.00%, 7/1/35 | | | 2,000 | | | | 2,343,080 | |
| | |
| | | | | | | $ | 23,066,895 | |
|
| Transportation — 10.9% | |
| | |
Central Texas Regional Mobility Authority, 5.00%, 1/1/45 | | $ | 1,550 | | | $ | 1,896,565 | |
| | |
Central Texas Regional Mobility Authority, Prerefunded to 1/1/21, 5.75%, 1/1/31 | | | 415 | | | | 420,752 | |
| | |
Chicago, IL, (O’Hare International Airport), 4.00%, 1/1/35(2) | | | 2,500 | | | | 2,859,825 | |
| | |
Dallas and Fort Worth, TX, (Dallas/Fort Worth International Airport), 5.25%, 11/1/30 | | | 1,100 | | | | 1,240,712 | |
| | |
Dallas and Fort Worth, TX, (Dallas/Fort Worth International Airport), 5.25%, 11/1/31 | | | 1,455 | | | | 1,636,860 | |
| | |
Delaware River Port Authority of Pennsylvania and New Jersey, 5.00%, 1/1/31 | | | 235 | | | | 265,273 | |
| | |
Grand Parkway Transportation Corp., TX, 5.125%, 10/1/43 | | | 1,100 | | | | 1,142,801 | |
| | |
Memphis-Shelby County Airport Authority, TN, 4.00%, 7/1/37 | | | 500 | | | | 584,815 | |
| | |
Memphis-Shelby County Airport Authority, TN, 4.00%, 7/1/38 | | | 375 | | | | 437,768 | |
| | |
Memphis-Shelby County Airport Authority, TN, 4.00%, 7/1/39 | | | 500 | | | | 581,245 | |
| | |
Miami-Dade County, FL, Aviation Revenue, 5.00%, 10/1/33 | | | 2,650 | | | | 3,016,839 | |
| | |
New Orleans Aviation Board, LA, 5.00%, 1/1/43 | | | 1,555 | | | | 1,803,707 | |
| | |
New York Thruway Authority, 3.00%, 1/1/49 | | | 2,950 | | | | 3,062,837 | |
| | |
New York Thruway Authority, 5.00%, 1/1/38 | | | 2,000 | | | | 2,536,820 | |
| | |
New York Thruway Authority, 5.00%, 1/1/46 | | | 4,000 | | | | 4,567,800 | |
| | |
Port Authority of New York and New Jersey, 5.00%, 7/15/31 | | | 2,500 | | | | 3,274,750 | |
| | |
San Joaquin Hills Transportation Corridor Agency, CA, 5.00%, 1/15/34 | | | 5,235 | | | | 5,876,130 | |
| | |
Texas Private Activity Bond Surface Transportation Corp., (North Tarrant Express Managed Lanes Project), 4.00%, 12/31/37 | | | 275 | | | | 310,288 | |
| | | | | | | | |
| Security | | Principal
Amount
(000’s omitted) | | | Value | |
|
| Transportation (continued) | |
| | |
Texas Private Activity Bond Surface Transportation Corp., (North Tarrant Express Managed Lanes Project), 4.00%, 12/31/38 | | $ | 510 | | | $ | 573,546 | |
| | |
Texas Private Activity Bond Surface Transportation Corp., (North Tarrant Express Managed Lanes Project), 4.00%, 12/31/39 | | | 265 | | | | 297,089 | |
| | |
Texas Private Activity Bond Surface Transportation Corp., (North Tarrant Express Managed Lanes Project), 5.00%, 12/31/35 | | | 355 | | | | 439,359 | |
| | |
Texas Transportation Commission, 0.00%, 8/1/40 | | | 1,000 | | | | 447,700 | |
| | |
| | | | | | | $ | 37,273,481 | |
|
| Water and Sewer — 7.8% | |
| | |
Atlanta, GA, Water and Wastewater Revenue, 5.00%, 11/1/35(1) | | $ | 6,990 | | | $ | 8,802,787 | |
| | |
Eastern Municipal Water District Financing Authority, CA, 5.00%, 7/1/36 | | | 1,000 | | | | 1,345,200 | |
| | |
Fulton County, GA, Water and Sewerage Revenue, 4.00%, 1/1/32 | | | 1,375 | | | | 1,712,205 | |
| | |
Houston, TX, Combined Utility System Revenue, 4.00%, 11/15/43 | | | 2,500 | | | | 3,000,350 | |
| | |
New York City Municipal Water Finance Authority, NY, (Water and Sewer System), 4.00%, 6/15/41 | | | 4,000 | | | | 4,637,520 | |
| | |
New York City Municipal Water Finance Authority, NY, (Water and Sewer System), 5.00%, 6/15/48 | | | 5,000 | | | | 6,018,400 | |
| | |
San Diego Public Facilities Financing Authority, CA, Water Revenue, 4.00%, 8/1/40 | | | 1,000 | | | | 1,218,940 | |
| | |
| | | | | | | $ | 26,735,402 | |
| |
Total Tax-Exempt Investments — 107.4%
(identified cost $341,462,045) | | | $ | 367,165,830 | |
| |
Other Assets, Less Liabilities — (7.4)% | | | $ | (25,230,034 | ) |
| |
Net Assets — 100.0% | | | $ | 341,935,796 | |
The percentage shown for each investment category in the Portfolio of Investments is based on net assets.
At September 30, 2020, the concentration of the Fund’s investments in the various states, determined as a percentage of net assets, is as follows:
| | | | |
| |
| New York | | | 24.2% | |
| |
| California | | | 14.6% | |
| |
| Texas | | | 11.8% | |
| |
| Others, representing less than 10% individually | | | 56.8% | |
| | | | |
| | 13 | | See Notes to Financial Statements. |
Eaton Vance
AMT-Free Municipal Income Fund
September 30, 2020
Portfolio of Investments — continued
The Fund invests primarily in debt securities issued by municipalities. The ability of the issuers of the debt securities to meet their obligations may be affected by economic developments in a specific industry or municipality. At September 30, 2020, 22.2% of total investments are backed by bond insurance of various financial institutions and financial guaranty assurance agencies. The aggregate percentage insured by an individual financial institution or financial guaranty assurance agency ranged from 0.3% to 14.4% of total investments.
| (1) | Security represents the municipal bond held by a trust that issues residual interest bonds (see Note 1H). |
| (2) | When-issued/delayed delivery security. |
| (3) | Defaulted security. Issuer has defaulted on the payment of interest and/or principal or has filed for bankruptcy. |
| (4) | Security exempt from registration under Rule 144A of the Securities Act of 1933, as amended. These securities may be sold in certain transactions in reliance on an exemption from registration (normally to qualified institutional buyers). At September 30, 2020, the aggregate value of these securities is $5,956,539 or 1.7% of the Fund’s net assets. |
Abbreviations:
| | | | |
| | |
| AGM | | – | | Assured Guaranty Municipal Corp. |
| | |
| AMBAC | | – | | AMBAC Financial Group, Inc. |
| | |
| BAM | | – | | Build America Mutual Assurance Co. |
| | |
| NPFG | | – | | National Public Finance Guarantee Corp. |
| | |
| PSF | | – | | Permanent School Fund |
| | | | |
| | 14 | | See Notes to Financial Statements. |
Eaton Vance
National Municipal Income Fund
September 30, 2020
Portfolio of Investments
| | | | | | | | |
| Tax-Exempt Municipal Securities — 96.8% | |
| Security | | Principal
Amount
(000’s omitted) | | | Value | |
|
| Bond Bank — 2.6% | |
| | |
Connecticut, (State Revolving Fund), Green Bonds, 5.00%, 3/1/28 | | $ | 10,000 | | | $ | 12,037,300 | |
| | |
Iowa Finance Authority, (State Revolving Fund), 5.00%, 8/1/32 | | | 12,000 | | | | 13,407,000 | |
| | |
New York State Environmental Facilities Corp., (State Revolving Fund), Green Bonds, 5.00%, 8/15/44 | | | 12,740 | | | | 16,319,303 | |
| | |
Ohio Water Development Authority, Water Pollution Control Loan Fund, 5.00%, 6/1/29 | | | 10,000 | | | | 13,407,400 | |
| | |
Rickenbacker Port Authority, OH, (OASBO Expanded Asset Pooled Financing Program), 5.375%, 1/1/32 | | | 12,110 | | | | 15,906,243 | |
| | |
Texas Water Development Board, 3.00%, 10/15/39(1) | | | 4,000 | | | | 4,436,240 | |
| | |
Texas Water Development Board, 3.00%, 10/15/40(1) | | | 3,500 | | | | 3,868,550 | |
| | |
Texas Water Development Board, (State Revolving Fund), 4.00%, 8/1/36 | | | 5,000 | | | | 6,135,650 | |
| | |
Wisconsin, Environmental Improvement Fund Revenue, Green Bonds, 5.00%, 6/1/36 | | | 5,000 | | | | 6,532,150 | |
| | |
| | | | | | | $ | 92,049,836 | |
|
| Cogeneration — 0.1% | |
| | |
Northampton County Industrial Development Authority, PA, (Northampton Generating), (AMT), 5.00%, 12/31/23(2) | | $ | 14,652 | | | $ | 3,663,079 | |
| | |
| | | | | | | $ | 3,663,079 | |
|
| Education — 6.2% | |
| | |
Allegheny County Higher Education Building Authority, PA, (Carnegie Mellon University), 5.00%, 8/1/27 | | $ | 3,335 | | | $ | 4,301,150 | |
| | |
Connecticut Health and Educational Facilities Authority, (Choate Rosemary Hall), 4.00%, 7/1/36 | | | 480 | | | | 587,419 | |
| | |
Connecticut Health and Educational Facilities Authority, (Choate Rosemary Hall), 4.00%, 7/1/37 | | | 150 | | | | 182,835 | |
| | |
Connecticut Health and Educational Facilities Authority, (Choate Rosemary Hall), 5.00%, 7/1/29 | | | 220 | | | | 293,502 | |
| | |
Connecticut Health and Educational Facilities Authority, (Choate Rosemary Hall), 5.00%, 7/1/30 | | | 185 | | | | 251,755 | |
| | |
Connecticut Health and Educational Facilities Authority, (Yale University), 5.00%, 7/1/27 | | | 5,000 | | | | 6,465,050 | |
| | |
District of Columbia, (District of Columbia International School), 5.00%, 7/1/49 | | | 2,290 | | | | 2,579,135 | |
| | |
Florida Higher Educational Facilities Financing Authority, (Jacksonville University), 4.75%, 6/1/38(3) | | | 2,245 | | | | 2,200,167 | |
| | |
Maryland Health and Higher Educational Facilities Authority, (Loyola University Maryland), 5.00%, 10/1/22 | | | 500 | | | | 537,695 | |
| | |
Maryland Health and Higher Educational Facilities Authority, (Loyola University Maryland), 5.00%, 10/1/23 | | | 500 | | | | 561,975 | |
| | |
Maryland Health and Higher Educational Facilities Authority, (Loyola University Maryland), 5.00%, 10/1/24 | | | 500 | | | | 581,060 | |
| | | | | | | | |
| Security | | Principal
Amount
(000’s omitted) | | | Value | |
|
| Education (continued) | |
| | |
Massachusetts Development Finance Agency, (Harvard University), 5.00%, 7/15/34 | | $ | 18,855 | | | $ | 23,106,803 | |
| | |
Michigan State University, 5.00%, 2/15/31 | | | 1,200 | | | | 1,563,288 | |
| | |
New Jersey Educational Facilities Authority, (Princeton University), 5.00%, 7/1/33 | | | 4,370 | | | | 5,538,582 | |
| | |
New York Dormitory Authority, (Columbia University), 5.00%, 10/1/38 | | | 19,235 | | | | 24,282,649 | |
| | |
New York Dormitory Authority, (Rockefeller University), 5.00%, 7/1/35 | | | 4,250 | | | | 5,577,785 | |
| | |
New York Dormitory Authority, (Rockefeller University), 5.00%, 7/1/53 | | | 15,000 | | | | 19,138,050 | |
| | |
Oklahoma Agricultural and Mechanical Colleges, (Oklahoma State University), 5.00%, 9/1/31 | | | 1,000 | | | | 1,347,430 | |
| | |
Oklahoma Agricultural and Mechanical Colleges, (Oklahoma State University), 5.00%, 9/1/32 | | | 1,000 | | | | 1,333,800 | |
| | |
Purdue University, IN, 5.00%, 7/1/30 | | | 600 | | | | 829,872 | |
| | |
Purdue University, IN, 5.00%, 7/1/31 | | | 1,000 | | | | 1,371,950 | |
| | |
Purdue University, IN, 5.00%, 7/1/35 | | | 685 | | | | 919,071 | |
| | |
Purdue University, IN, 5.00%, 7/1/36 | | | 1,500 | | | | 2,003,160 | |
| | |
Troy Capital Resource Corp., NY, (Rensselaer Polytechnic Institute), 5.00%, 9/1/39 | | | 6,000 | | | | 7,192,980 | |
| | |
University of California, 5.25%, 5/15/36 | | | 7,080 | | | | 8,239,562 | |
| | |
University of California, 5.25%, 5/15/37 | | | 13,000 | | | | 15,103,790 | |
| | |
University of California, 5.25%, 5/15/38 | | | 7,700 | | | | 8,934,079 | |
| | |
University of Missouri, 5.00%, 11/1/30 | | | 5,000 | | | | 6,869,500 | |
| | |
University of Virginia, 5.00%, 4/1/38 | | | 13,205 | | | | 16,321,380 | |
| | |
University of Virginia, 5.00%, 4/1/39 | | | 40,970 | | | | 50,519,288 | |
| | |
Waco Education Finance Corp., TX, (Baylor University), 4.00%, 3/1/36 | | | 1,000 | | | | 1,180,080 | |
| | |
| | | | | | | $ | 219,914,842 | |
|
| Electric Utilities — 5.3% | |
| | |
Colorado Springs, CO, Utilities System Revenue, 4.00%, 11/15/36 | | $ | 525 | | | $ | 651,646 | |
| | |
Colorado Springs, CO, Utilities System Revenue, 4.00%, 11/15/37 | | | 650 | | | | 803,699 | |
| | |
Los Angeles Department of Water & Power, CA, Power System Revenue, 5.00%, 7/1/38 | | | 6,130 | | | | 7,950,978 | |
| | |
Los Angeles Department of Water & Power, CA, Power System Revenue, 5.00%, 7/1/42 | | | 1,870 | | | | 2,270,535 | |
| | |
Lower Colorado River Authority, TX, (LCRA Transmission Services Corp.), 5.00%, 5/15/45 | | | 1,500 | | | | 1,854,540 | |
| | |
Mesa, AZ, Utility Systems Revenue, 5.00%, 7/1/33 | | | 1,005 | | | | 1,315,826 | |
| | |
New Smyrna Beach Utilities Commission, FL, 4.00%, 10/1/31 | | | 880 | | | | 1,088,331 | |
| | |
New Smyrna Beach Utilities Commission, FL, 4.00%, 10/1/41 | | | 435 | | | | 515,314 | |
| | | | |
| | 15 | | See Notes to Financial Statements. |
Eaton Vance
National Municipal Income Fund
September 30, 2020
Portfolio of Investments — continued
| | | | | | | | |
| Security | | Principal
Amount
(000’s omitted) | | | Value | |
|
| Electric Utilities (continued) | |
| | |
New Smyrna Beach Utilities Commission, FL, 4.00%, 10/1/42 | | $ | 300 | | | $ | 354,360 | |
| | |
New Smyrna Beach Utilities Commission, FL, 4.00%, 10/1/45 | | | 700 | | | | 821,212 | |
| | |
New York Power Authority, 4.00%, 11/15/55 | | | 22,000 | | | | 25,394,820 | |
| | |
Omaha Public Power District, NE, 5.00%, 2/1/39 | | | 10,805 | | | | 12,573,887 | |
| | |
Public Power Generation Agency, NE, (Whelan Energy Center Unit 2), 5.00%, 1/1/28 | | | 6,025 | | | | 7,080,701 | |
| | |
Sacramento Municipal Utility District, CA, 4.00%, 8/15/40 | | | 6,200 | | | | 7,542,486 | |
| | |
Sacramento Municipal Utility District, CA, 5.00%, 8/15/35 | | | 1,000 | | | | 1,353,770 | |
| | |
Sacramento Municipal Utility District, CA, 5.00%, 8/15/37 | | | 8,800 | | | | 11,792,440 | |
| | |
Sacramento Municipal Utility District, CA, 5.00%, 8/15/38 | | | 11,000 | | | | 14,664,870 | |
| | |
San Antonio, TX, Electric and Gas Systems Revenue, 4.00%, 2/1/30 | | | 2,000 | | | | 2,534,800 | |
| | |
Utility Debt Securitization Authority, NY, 5.00%, 12/15/30(4) | | | 22,500 | | | | 25,791,750 | |
| | |
Utility Debt Securitization Authority, NY, 5.00%, 12/15/31(4) | | | 27,500 | | | | 31,504,275 | |
| | |
Utility Debt Securitization Authority, NY, 5.00%, 12/15/40 | | | 13,260 | | | | 16,517,584 | |
| | |
Utility Debt Securitization Authority, NY, Series 2015, 5.00%, 12/15/33 | | | 10,000 | | | | 12,167,400 | |
| | |
| | | | | | | $ | 186,545,224 | |
|
| Escrowed / Prerefunded — 6.6% | |
| | |
Bexar County Health Facilities Development Corp., TX, (St. Luke’s Lutheran Hospital), Escrowed to Maturity, 7.00%, 5/1/21 | | $ | 860 | | | $ | 892,001 | |
| | |
Detroit, MI, Sewage Disposal System, Prerefunded to 7/1/22, 5.25%, 7/1/39 | | | 22,500 | | | | 24,497,325 | |
| | |
Detroit, MI, Water Supply System, Prerefunded to 7/1/21, 5.00%, 7/1/41 | | | 2,185 | | | | 2,264,621 | |
| | |
Detroit, MI, Water Supply System, Prerefunded to 7/1/21, 5.25%, 7/1/41 | | | 56,420 | | | | 58,580,886 | |
| | |
Massachusetts Development Finance Agency, (Tufts Medical Center), Prerefunded to 1/1/21, 6.75%, 1/1/36 | | | 4,505 | | | | 4,578,792 | |
| | |
Massachusetts Development Finance Agency, (Tufts Medical Center), Prerefunded to 1/1/21, 6.75%, 1/1/36 | | | 3,005 | | | | 3,054,222 | |
| | |
Michigan Finance Authority, (Detroit Water and Sewerage Department), Prerefunded to 7/1/22, 5.00%, 7/1/44 | | | 8,090 | | | | 8,765,434 | |
| | |
Oregon Department of Transportation, Prerefunded to 11/15/23, 5.00%, 11/15/38 | | | 250 | | | | 287,382 | |
| | |
Oregon Facilities Authority, (Lewis & Clark College), Prerefunded to 10/1/21, 5.625%, 10/1/36 | | | 9,930 | | | | 10,466,419 | |
| | |
Pennsylvania Turnpike Commission, Prerefunded to 12/1/20, 5.35%, 12/1/30 | | | 4,515 | | | | 4,553,603 | |
| | |
Pennsylvania Turnpike Commission, Prerefunded to 12/1/20, 5.35%, 12/1/30 | | | 3,490 | | | | 3,520,119 | |
| | |
Pennsylvania Turnpike Commission, Prerefunded to 12/1/20, 5.45%, 12/1/35 | | | 12,125 | | | | 12,231,700 | |
| | | | | | | | |
| Security | | Principal
Amount
(000’s omitted) | | | Value | |
|
| Escrowed / Prerefunded (continued) | |
| | |
Pennsylvania Turnpike Commission, Prerefunded to 12/1/20, 6.00%, 12/1/34 | | $ | 3,585 | | | $ | 3,619,344 | |
| | |
Pennsylvania Turnpike Commission, Prerefunded to 12/1/20, 6.00%, 12/1/34 | | | 3,795 | | | | 3,831,356 | |
| | |
Pennsylvania Turnpike Commission, Prerefunded to 12/1/20, 6.00%, 12/1/34 | | | 17,620 | | | | 17,790,209 | |
| | |
Pennsylvania Turnpike Commission, Prerefunded to 12/1/20, 6.50%, 12/1/36 | | | 10,000 | | | | 10,104,700 | |
| | |
Rutgers State University, NJ, Prerefunded to 5/1/23, 5.00%, 5/1/43(4) | | | 37,000 | | | | 41,599,470 | |
| | |
Southwestern Illinois Development Authority, (Memorial Group, Inc.), Prerefunded to 11/1/23, 7.25%, 11/1/33 | | | 9,170 | | | | 11,091,207 | |
| | |
Unified Government of Wyandotte County/Kansas City, KS, Utility System Revenue, Prerefunded to 9/1/22, 5.00%, 9/1/32 | | | 10,000 | | | | 10,914,400 | |
| | |
| | | | | | | $ | 232,643,190 | |
|
| General Obligations — 23.6% | |
| | |
Aiken County Consolidated School District, SC, 4.00%, 4/1/37 | | $ | 5,370 | | | $ | 6,443,087 | |
| | |
Anaheim Union High School District, CA, (Election of 2014), 4.00%, 8/1/30 | | | 2,070 | | | | 2,524,013 | |
| | |
Anaheim Union High School District, CA, (Election of 2014), 4.00%, 8/1/31 | | | 2,295 | | | | 2,778,075 | |
| | |
Antelope Valley Community College District, CA, (Election of 2016), 4.00%, 8/1/45 | | | 2,500 | | | | 2,977,125 | |
| | |
Belmont, MA, 4.00%, 3/15/32 | | | 3,030 | | | | 3,690,722 | |
| | |
Cabrillo Unified School District, CA, (Election of 2018), 5.00%, 8/1/45 | | | 1,750 | | | | 2,165,065 | |
| | |
Cabrillo Unified School District, CA, (Election of 2018), 5.00%, 8/1/50 | | | 15,580 | | | | 19,131,149 | |
| | |
California, 0.54%, (SIFMA + 0.43%), 12/1/23 (Put Date), 12/1/29(5) | | | 15,000 | | | | 15,005,400 | |
| | |
California, 3.00%, 11/1/34 | | | 3,000 | | | | 3,361,740 | |
| | |
California, 3.00%, 11/1/35 | | | 2,125 | | | | 2,368,992 | |
| | |
California, 4.00%, 11/1/35 | | | 4,750 | | | | 5,811,150 | |
| | |
California, 4.00%, 3/1/36 | | | 15,980 | | | | 19,208,439 | |
| | |
California, 4.00%, 3/1/38 | | | 4,650 | | | | 5,546,287 | |
| | |
California, 5.00%, 3/1/34 | | | 3,145 | | | | 4,154,042 | |
| | |
California, 5.00%, 3/1/35 | | | 23,410 | | | | 30,810,603 | |
| | |
California, 5.00%, 3/1/35 | | | 5,000 | | | | 6,580,650 | |
| | |
California, 5.00%, 4/1/35 | | | 4,000 | | | | 5,161,600 | |
| | |
Centennial School District No. 28Jt, OR, 5.00%, 6/15/45 | | | 10,000 | | | | 12,752,300 | |
| | |
Chicago Board of Education, IL, 5.00%, 12/1/21 | | | 1,980 | | | | 2,049,795 | |
| | |
Chicago Board of Education, IL, 5.00%, 12/1/42 | | | 2,770 | | | | 2,813,517 | |
| | |
Chicago Board of Education, IL, 5.00%, 12/1/44 | | | 15,110 | | | | 16,105,749 | |
| | |
Chicago Board of Education, IL, 5.00%, 12/1/46 | | | 85 | | | | 86,687 | |
| | | | |
| | 16 | | See Notes to Financial Statements. |
Eaton Vance
National Municipal Income Fund
September 30, 2020
Portfolio of Investments — continued
| | | | | | | | |
| Security | | Principal
Amount
(000’s omitted) | | | Value | |
|
| General Obligations (continued) | |
| | |
Chicago, IL, 5.00%, 1/1/39 | | $ | 2,100 | | | $ | 2,162,265 | |
| | |
Chicago, IL, 5.00%, 1/1/40 | | | 1,500 | | | | 1,540,440 | |
| | |
Clackamas Community College District, OR, 5.00%, 6/15/38 | | | 760 | | | | 923,560 | |
| | |
Clackamas Community College District, OR, 5.00%, 6/15/39 | | | 1,000 | | | | 1,212,300 | |
| | |
Clackamas Community College District, OR, 5.00%, 6/15/40 | | | 1,250 | | | | 1,511,925 | |
| | |
Collin County Community College District, TX, 4.00%, 8/15/37 | | | 1,000 | | | | 1,204,610 | |
| | |
Collin County, TX, 4.00%, 2/15/36 | | | 5,705 | | | | 6,892,952 | |
| | |
Connecticut, 4.00%, 1/15/37 | | | 15,000 | | | | 17,533,050 | |
| | |
Dane County, WI, 2.00%, 4/1/27(1) | | | 3,505 | | | | 3,779,091 | |
| | |
Dane County, WI, 2.00%, 4/1/28(1) | | | 2,575 | | | | 2,749,894 | |
| | |
Dane County, WI, 2.00%, 4/1/29(1) | | | 2,645 | | | | 2,798,913 | |
| | |
Dane County, WI, 2.00%, 4/1/30(1) | | | 2,705 | | | | 2,845,389 | |
| | |
Darien, CT, 4.00%, 8/1/39 | | | 80 | | | | 94,419 | |
| | |
Desert Community College District, CA, 5.00%, 8/1/37 | | | 5,350 | | | | 6,473,018 | |
| | |
District of Columbia, 5.00%, 10/15/30 | | | 4,000 | | | | 5,324,200 | |
| | |
Erie County, NY, 3.00%, 6/24/21 | | | 7,500 | | | | 7,642,650 | |
| | |
Fort Bend Independent School District, TX, (PSF Guaranteed), 3.00%, 8/15/36 | | | 600 | | | | 668,256 | |
| | |
Fort Bend Independent School District, TX, (PSF Guaranteed), 4.00%, 8/15/45 | | | 1,980 | | | | 2,343,271 | |
| | |
Garden City Public Schools, MI, 4.00%, 5/1/43 | | | 1,560 | | | | 1,823,375 | |
| | |
Garden City Public Schools, MI, 5.00%, 5/1/32 | | | 430 | | | | 570,008 | |
| | |
Garden City Public Schools, MI, 5.00%, 5/1/33 | | | 1,345 | | | | 1,771,540 | |
| | |
Garden City Public Schools, MI, 5.00%, 5/1/35 | | | 1,060 | | | | 1,385,176 | |
| | |
Garden City Public Schools, MI, 5.00%, 5/1/37 | | | 815 | | | | 1,055,890 | |
| | |
Garden City Public Schools, MI, 5.00%, 5/1/39 | | | 900 | | | | 1,158,165 | |
| | |
Garden City Public Schools, MI, 5.00%, 5/1/46 | | | 3,505 | | | | 4,426,500 | |
| | |
Hall County School District, GA, 4.00%, 2/1/38 | | | 1,500 | | | | 1,852,005 | |
| | |
Harris County Flood Control District, TX, 3.00%, 10/1/38 | | | 1,875 | | | | 2,075,381 | |
| | |
Harris County, TX, 3.00%, 10/1/39(1) | | | 1,240 | | | | 1,372,048 | |
| | |
Harris County, TX, 3.00%, 10/1/40(1) | | | 1,000 | | | | 1,101,370 | |
| | |
Harris County, TX, 3.00%, 10/1/45(1) | | | 5,000 | | | | 5,421,400 | |
| | |
Hartford County Metropolitan District, CT, 5.00%, 7/15/23 | | | 1,000 | | | | 1,122,840 | |
| | |
Hartford County Metropolitan District, CT, 5.00%, 7/15/24 | | | 1,000 | | | | 1,161,090 | |
| | |
Hawaii, 5.00%, 1/1/34 | | | 13,700 | | | | 17,214,461 | |
| | |
Hennepin County Regional Railroad Authority, MN, 5.00%, 12/1/30 | | | 4,040 | | | | 5,336,234 | |
| | |
Hermiston School District No. 8R, OR, 0.00%, 6/15/42 | | | 6,475 | | | | 3,491,773 | |
| | |
Hermiston School District No. 8R, OR, 0.00%, 6/15/45 | | | 4,595 | | | | 2,191,953 | |
| | |
Hillsboro School District No. 1J, OR, 4.00%, 6/15/37 | | | 4,370 | | | | 5,305,879 | |
| | |
Hillsboro School District No. 1J, OR, 4.00%, 6/15/39 | | | 8,000 | | | | 9,645,760 | |
| | |
Hillsboro School District No. 1J, OR, 4.00%, 6/15/40 | | | 5,000 | | | | 6,009,250 | |
| | |
Howard County, MD, 4.00%, 8/15/35 | | | 2,065 | | | | 2,560,393 | |
| | |
Howard County, MD, 4.00%, 8/15/36 | | | 6,610 | | | | 8,156,145 | |
| | | | | | | | |
| Security | | Principal
Amount
(000’s omitted) | | | Value | |
|
| General Obligations (continued) | |
| | |
Howard County, MD, 4.00%, 8/15/37 | | $ | 5,000 | | | $ | 6,145,400 | |
| | |
Howard County, MD, 4.00%, 8/15/38 | | | 6,245 | | | | 7,647,939 | |
| | |
Hudsonville Public Schools, MI, 4.00%, 5/1/37 | | | 1,500 | | | | 1,806,525 | |
| | |
Hudsonville Public Schools, MI, 4.00%, 5/1/39 | | | 1,060 | | | | 1,263,668 | |
| | |
Hudsonville Public Schools, MI, 4.00%, 5/1/44 | | | 1,975 | | | | 2,319,539 | |
| | |
Illinois, 5.00%, 2/1/24 | | | 10,705 | | | | 11,396,222 | |
| | |
Illinois, 5.00%, 11/1/24 | | | 11,295 | | | | 12,148,563 | |
| | |
Illinois, 5.00%, 2/1/27 | | | 18,500 | | | | 19,510,840 | |
| | |
Illinois, 5.00%, 2/1/29 | | | 15,000 | | | | 16,232,400 | |
| | |
Illinois, 5.00%, 5/1/39 | | | 10,000 | | | | 10,203,600 | |
| | |
Illinois, 5.25%, 7/1/30 | | | 6,150 | | | | 6,395,446 | |
| | |
Illinois, 5.50%, 5/1/39 | | | 870 | | | | 953,390 | |
| | |
Illinois, 5.75%, 5/1/45 | | | 890 | | | | 977,959 | |
| | |
Issaquah School District No. 411, WA, 4.00%, 12/1/33 | | | 14,000 | | | | 17,524,920 | |
| | |
Johnson County, KS, 2.00%, 9/1/33 | | | 2,595 | | | | 2,770,681 | |
| | |
Johnson County, KS, 2.00%, 9/1/34 | | | 3,340 | | | | 3,540,300 | |
| | |
Johnson County, KS, 3.00%, 9/1/30 | | | 3,065 | | | | 3,600,118 | |
| | |
Kane, Cook and DuPage Counties School District No. 46, IL, 5.00%, 1/1/29 | | | 1,920 | | | | 2,190,528 | |
| | |
Kane, Cook and DuPage Counties School District No. 46, IL, 5.00%, 1/1/30 | | | 4,105 | | | | 4,680,521 | |
| | |
Klein Independent School District, TX, (PSF Guaranteed), 5.00%, 2/1/36 | | | 14,180 | | | | 14,392,842 | |
| | |
La Canada Unified School District, CA, (Election of 2017), 4.00%, 8/1/49 | | | 1,970 | | | | 2,268,731 | |
| | |
Lake Washington School District No. 414, WA, 4.00%, 12/1/28 | | | 10,000 | | | | 12,552,100 | |
| | |
Lodi Unified School District, CA, (Election of 2016), 4.00%, 8/1/36 | | | 1,250 | | | | 1,456,950 | |
| | |
Lodi Unified School District, CA, (Election of 2016), 4.00%, 8/1/39 | | | 2,935 | | | | 3,375,309 | |
| | |
Massachusetts, 5.00%, 7/1/35 | | | 10,000 | | | | 11,976,800 | |
| | |
Massachusetts, 5.00%, 3/1/37 | | | 10,900 | | | | 12,480,718 | |
| | |
Minneapolis-St. Paul Metropolitan Council, MN, 4.00%, 3/1/30 | | | 1,250 | | | | 1,527,362 | |
| | |
Minnesota, 2.00%, 8/1/32 | | | 4,000 | | | | 4,220,840 | |
| | |
New York, NY, 4.00%, 10/1/35 | | | 5,875 | | | | 6,839,440 | |
| | |
New York, NY, 4.00%, 3/1/36 | | | 8,000 | | | | 9,078,640 | |
| | |
New York, NY, 4.00%, 8/1/38 | | | 8,530 | | | | 9,795,767 | |
| | |
New York, NY, 4.00%, 8/1/42(4) | | | 28,000 | | | | 31,761,520 | |
| | |
Novi Community School District, MI, 5.00%, 5/1/41 | | | 1,100 | | | | 1,412,972 | |
| | |
Novi Community School District, MI, 5.00%, 5/1/42 | | | 1,700 | | | | 2,174,963 | |
| | |
Novi Community School District, MI, 5.00%, 5/1/43 | | | 1,150 | | | | 1,470,171 | |
| | |
Ocean County, NJ, 3.00%, 8/1/33 | | | 3,330 | | | | 3,814,049 | |
| | |
Oklahoma City, OK, 5.00%, 3/1/25 | | | 500 | | | | 604,305 | |
| | | | |
| | 17 | | See Notes to Financial Statements. |
Eaton Vance
National Municipal Income Fund
September 30, 2020
Portfolio of Investments — continued
| | | | | | | | |
| Security | | Principal
Amount
(000’s omitted) | | | Value | |
|
| General Obligations (continued) | |
| | |
Oxnard Union High School District, CA, (Election of 2018), 5.00%, 8/1/43 | | $ | 3,750 | | | $ | 4,550,550 | |
| | |
Oxnard Union High School District, CA, (Election of 2018), 5.00%, 8/1/45 | | | 7,500 | | | | 9,303,600 | |
| | |
Paradise Valley Unified School District No. 69, AZ, 4.00%, 7/1/35 | | | 350 | | | | 426,185 | |
| | |
Park City, UT, 4.00%, 2/1/31 | | | 3,490 | | | | 4,307,428 | |
| | |
Port of Houston Authority, TX, 3.00%, 10/1/39 | | | 4,650 | | | | 5,170,335 | |
| | |
Randolph County, NC, Limited Obligation Bonds, 5.00%, 10/1/33 | | | 350 | | | | 455,728 | |
| | |
Richmond Community Schools, MI, 4.00%, 5/1/36 | | | 2,200 | | | | 2,584,890 | |
| | |
Richmond Community Schools, MI, 4.00%, 5/1/37 | | | 2,655 | | | | 3,107,890 | |
| | |
Richmond Community Schools, MI, 4.00%, 5/1/38 | | | 2,665 | | | | 3,111,814 | |
| | |
Richmond Community Schools, MI, 4.00%, 5/1/39 | | | 2,665 | | | | 3,100,008 | |
| | |
Riverside Unified School District, CA, (Election of 2016), 4.00%, 8/1/32 | | | 2,250 | | | | 2,700,022 | |
| | |
Riverside Unified School District, CA, (Election of 2016), 4.00%, 8/1/33 | | | 1,350 | | | | 1,604,853 | |
| | |
Riverside Unified School District, CA, (Election of 2016), 4.00%, 8/1/34 | | | 1,100 | | | | 1,298,803 | |
| | |
San Antonio, TX, 3.00%, 8/1/39 | | | 5,000 | | | | 5,553,850 | |
| | |
San Bernardino Community College District, CA, (Election of 2018), 4.00%, 8/1/38 | | | 675 | | | | 783,392 | |
| | |
San Bernardino Community College District, CA, (Election of 2018), 4.00%, 8/1/39 | | | 600 | | | | 694,626 | |
| | |
San Francisco Bay Area Rapid Transit District, CA, (Election of 2016), Green Bonds, 4.00%, 8/1/45 | | | 4,970 | | | | 5,834,184 | |
| | |
San Francisco Unified School District, CA, (Election of 2016), 4.00%, 6/15/33 | | | 4,000 | | | | 4,798,080 | |
| | |
San Francisco Unified School District, CA, (Election of 2016), 4.00%, 6/15/36 | | | 3,000 | | | | 3,539,220 | |
| | |
Tennessee, 5.00%, 9/1/28 | | | 3,000 | | | | 3,887,220 | |
| | |
Texas, (Texas Transportation Commission), Prerefunded to 10/1/24, 5.00%, 10/1/44 | | | 10,000 | | | | 11,905,700 | |
| | |
Tomball Independent School District, TX, (PSF Guaranteed), 4.00%, 2/15/33 | | | 750 | | | | 935,625 | |
| | |
Virginia Beach, VA, 4.00%, 7/15/32 | | | 2,300 | | | | 2,856,508 | |
| | |
Walled Lake Consolidated School District, MI, 5.00%, 5/1/41 | | | 700 | | | | 905,597 | |
| | |
Walled Lake Consolidated School District, MI, 5.00%, 5/1/42 | | | 1,000 | | | | 1,289,560 | |
| | |
Walled Lake Consolidated School District, MI, 5.00%, 5/1/45 | | | 1,365 | | | | 1,740,935 | |
| | |
Walled Lake Consolidated School District, MI, 5.00%, 5/1/50 | | | 2,500 | | | | 3,154,450 | |
| | |
Washington County, OR, 4.00%, 3/1/30 | | | 1,000 | | | | 1,156,030 | |
| | |
Washington, 5.00%, 2/1/33 | | | 13,140 | | | | 15,054,892 | |
| | |
Washington, 5.00%, 8/1/35 | | | 14,355 | | | | 17,967,005 | |
| | | | | | | | |
| Security | | Principal
Amount
(000’s omitted) | | | Value | |
|
| General Obligations (continued) | |
| | |
Washington, 5.00%, 6/1/36 | | $ | 6,280 | | | $ | 8,156,527 | |
| | |
Washington, 5.00%, 8/1/36 | | | 13,010 | | | | 17,317,611 | |
| | |
Washington, 5.00%, 8/1/38 | | | 25,430 | | | | 33,574,466 | |
| | |
Washington, 5.00%, 2/1/39 | | | 4,685 | | | | 5,505,718 | |
| | |
Washington, 5.00%, 6/1/39(1) | | | 2,125 | | | | 2,745,606 | |
| | |
Washington, 5.00%, 2/1/40 | | | 870 | | | | 1,064,019 | |
| | |
Washington, 5.00%, 6/1/41(1) | | | 2,000 | | | | 2,567,560 | |
| | |
West Linn-Wilsonville School District No. 3JT, OR, 0.00%, 6/15/40 | | | 1,200 | | | | 732,288 | |
| | |
West Linn-Wilsonville School District No. 3JT, OR, 0.00%, 6/15/41 | | | 1,500 | | | | 882,990 | |
| | |
West Sonoma County Union High School District, CA, (Election of 2018), 5.00%, 8/1/46 | | | 1,000 | | | | 1,238,440 | |
| | |
West Sonoma County Union High School District, CA, (Election of 2018), 5.00%, 8/1/49 | | | 3,430 | | | | 4,235,021 | |
| | |
Wisconsin, 5.00%, 5/1/31 | | | 9,365 | | | | 12,192,481 | |
| | |
Wisconsin, 5.00%, 5/1/36 | | | 6,645 | | | | 8,419,215 | |
| | |
Wisconsin, 5.00%, 5/1/38 | | | 22,500 | | | | 26,733,825 | |
| | |
| | | | | | | $ | 837,091,811 | |
|
| Hospital — 7.7% | |
| | |
Allegheny County Hospital Development Authority, PA, (UPMC Health System), 5.00%, 7/15/32 | | $ | 2,250 | | | $ | 2,865,600 | |
| | |
Arlington County Industrial Development Authority, VA, (Virginia Hospital Center), 4.00%, 7/1/38 | | | 1,000 | | | | 1,171,230 | |
| | |
Arlington County Industrial Development Authority, VA, (Virginia Hospital Center), 4.00%, 7/1/45 | | | 3,000 | | | | 3,433,440 | |
| | |
Brookhaven Development Authority, GA, (Children’s Healthcare of Atlanta), 5.00%, 7/1/31 | | | 755 | | | | 986,136 | |
| | |
California Health Facilities Financing Authority, (Catholic Healthcare West), 5.25%, 3/1/28 | | | 5,700 | | | | 5,805,108 | |
| | |
California Health Facilities Financing Authority, (St. Joseph Health System), 5.00%, 7/1/33 | | | 17,530 | | | | 19,286,857 | |
| | |
California Health Facilities Financing Authority, (St. Joseph Health System), 5.00%, 7/1/37 | | | 25,465 | | | | 27,883,920 | |
| | |
California Health Facilities Financing Authority, (Sutter Health), 5.25%, 8/15/31 | | | 13,675 | | | | 14,222,137 | |
| | |
Colorado Health Facilities Authority, (SCL Health System), 4.00%, 1/1/36 | | | 2,000 | | | | 2,339,440 | |
| | |
Connecticut Health and Educational Facilities Authority, (Nuvance Health), 4.00%, 7/1/34 | | | 2,455 | | | | 2,722,325 | |
| | |
DeKalb Private Hospital Authority, GA, (Children’s Healthcare of Atlanta), 5.00%, 7/1/31 | | | 1,000 | | | | 1,306,140 | |
| | |
Douglas County Hospital Authority No. 2, NE, (Children’s Hospital Obligated Group), 4.00%, 11/15/36 | | | 425 | | | | 499,078 | |
| | |
Douglas County Hospital Authority No. 2, NE, (Children’s Hospital Obligated Group), 4.00%, 11/15/41 | | | 590 | | | | 680,441 | |
| | | | |
| | 18 | | See Notes to Financial Statements. |
Eaton Vance
National Municipal Income Fund
September 30, 2020
Portfolio of Investments — continued
| | | | | | | | |
| Security | | Principal
Amount
(000’s omitted) | | | Value | |
|
| Hospital (continued) | |
| | |
Escambia County Health Facilities Authority, FL, (Baptist Health Care Corp. Obligated Group), 4.00%, 8/15/50 | | $ | 4,340 | | | $ | 4,729,515 | |
| | |
Fulton County Development Authority, GA, (Piedmont Healthcare, Inc.), 4.00%, 7/1/37 | | | 2,000 | | | | 2,300,580 | |
| | |
Hamilton County, OH, (UC Health), 5.00%, 9/15/50 | | | 8,000 | | | | 9,431,040 | |
| | |
Illinois Finance Authority, (Edward-Elmhurst Healthcare), 0.86%, (SIFMA + 0.75%), 7/1/23 (Put Date), 1/1/46(5) | | | 9,500 | | | | 9,505,605 | |
| | |
Illinois Finance Authority, (Presence Health Network), 5.00%, 2/15/26 | | | 7,500 | | | | 9,202,050 | |
| | |
Illinois Finance Authority, (Presence Health Network), 5.00%, 2/15/33 | | | 1,500 | | | | 1,819,875 | |
| | |
Kentucky Economic Development Finance Authority, (CommonSpirit Health), 5.00%, 8/1/44 | | | 6,000 | | | | 7,182,060 | |
| | |
Medford Hospital Facilities Authority, OR, (Asante Health System), 4.00%, 8/15/50 | | | 2,000 | | | | 2,244,360 | |
| | |
Medford Hospital Facilities Authority, OR, (Asante Health System), 5.00%, 8/15/45 | | | 3,000 | | | | 3,712,410 | |
| | |
Minneapolis and St. Paul Housing and Redevelopment Authority, MN, (Allina Health System), 5.00%, 11/15/23 | | | 1,700 | | | | 1,932,883 | |
| | |
Minneapolis and St. Paul Housing and Redevelopment Authority, MN, (Allina Health System), 5.00%, 11/15/27 | | | 1,150 | | | | 1,463,559 | |
| | |
Missouri Health and Educational Facilities Authority, (Mosaic Health System), 4.00%, 2/15/44 | | | 2,200 | | | | 2,477,222 | |
| | |
Missouri Health and Educational Facilities Authority, (SSM Health Care), 5.00%, 6/1/30 | | | 7,505 | | | | 8,492,133 | |
| | |
Montana Facility Finance Authority, (SCL Health System), 4.00%, 1/1/38 | | | 2,150 | | | | 2,495,354 | |
| | |
New York Dormitory Authority, (Memorial Sloan-Kettering Cancer Center), 4.00%, 7/1/38 | | | 3,400 | | | | 4,002,072 | |
| | |
New York Dormitory Authority, (NYU Langone Hospitals Obligated Group), 4.00%, 7/1/50 | | | 5,330 | | | | 5,955,262 | |
| | |
New York Dormitory Authority, (NYU Langone Hospitals Obligated Group), 4.00%, 7/1/53 | | | 10,000 | | | | 11,145,600 | |
| | |
North Carolina Medical Care Commission, (Rex Healthcare), 4.00%, 7/1/40 | | | 1,400 | | | | 1,593,130 | |
| | |
Oklahoma Development Finance Authority, (OU Medicine), 5.00%, 8/15/38 | | | 1,750 | | | | 2,032,538 | |
| | |
Oklahoma Development Finance Authority, (OU Medicine), 5.25%, 8/15/43 | | | 5,200 | | | | 6,071,156 | |
| | |
Oregon Facilities Authority, (Samaritan Health Services), 5.00%, 10/1/35 | | | 2,260 | | | | 2,633,397 | |
| | |
Oregon Health and Science University, 4.00%, 7/1/44 | | | 1,685 | | | | 1,947,152 | |
| | |
Pennsylvania Economic Development Financing Authority, (UPMC), 4.00%, 4/15/45 | | | 3,250 | | | | 3,652,935 | |
| | |
Public Finance Authority, WI, (Blue Ridge HealthCare), 5.00%, 1/1/36 | | | 470 | | | | 584,807 | |
| | |
Public Finance Authority, WI, (Blue Ridge HealthCare), 5.00%, 1/1/37 | | | 500 | | | | 619,550 | |
| | |
Tampa, FL, (BayCare Health System), 5.00%, 11/15/46 | | | 10,500 | | | | 12,302,640 | |
| | | | | | | | |
| Security | | Principal
Amount
(000’s omitted) | | | Value | |
|
| Hospital (continued) | |
| | |
Tarrant County Cultural Education Facilities Finance Corp., TX, (Cook Children’s Medical Center), 4.00%, 12/1/34 | | $ | 2,685 | | | $ | 3,189,753 | |
| | |
University of Kansas Hospital Authority, 5.00%, 9/1/45 | | | 25,500 | | | | 29,181,435 | |
| | |
Virginia Small Business Financing Authority, (Sentara Healthcare), 4.00%, 11/1/36 | | | 5,000 | | | | 5,813,500 | |
| | |
Virginia Small Business Financing Authority, (Sentara Healthcare), 4.00%, 11/1/38 | | | 5,000 | | | | 5,774,200 | |
| | |
Washington Health Care Facilities Authority, (Overlake Hospital Medical Center), 5.00%, 7/1/42 | | | 2,250 | | | | 2,658,892 | |
| | |
West Virginia Hospital Finance Authority, (West Virginia United Health System Obligated Group), 5.375%, 6/1/38 | | | 21,895 | | | | 23,820,665 | |
| | |
| | | | | | | $ | 273,169,182 | |
|
| Housing — 0.4% | |
| | |
Massachusetts Housing Finance Agency, (Mill Road Apartments), 0.66%, (SIFMA + 0.55%), 11/1/23 (Put Date), 11/1/48(5) | | $ | 3,955 | | | $ | 3,955,000 | |
| | |
Texas Student Housing Corp., (University of Northern Texas), 6.85%, 7/1/31 | | | 10,640 | | | | 10,347,506 | |
| | |
| | | | | | | $ | 14,302,506 | |
|
| Industrial Development Revenue — 1.9% | |
| | |
Metropolitan Nashville Airport Authority, TN, (Aero Nashville), 5.20%, 7/1/26 | | $ | 265 | | | $ | 265,164 | |
| | |
Miami-Dade County Industrial Development Authority, FL, (Waste Management, Inc.), (AMT), 0.91%, (SIFMA + 0.80%), 11/1/21 (Put Date), 11/1/48(5) | | | 5,000 | | | | 5,001,900 | |
| | |
Mission Economic Development Corp., TX, (Waste Management, Inc.), (AMT), 0.91%, (SIFMA + 0.80%), 11/1/21 (Put Date), 11/1/48(5) | | | 10,000 | | | | 10,003,900 | |
| | |
New Jersey Economic Development Authority, (New Jersey-American Water Co., Inc.), (AMT), 2.20% to 12/3/29 (Put Date), 10/1/39 | | | 13,900 | | | | 14,713,845 | |
| | |
New York Transportation Development Corp., (Delta Air Lines, Inc. - LaGuardia Airport Terminals C&D Redevelopment), (AMT), 5.00%, 10/1/35 | | | 29,085 | | | | 31,453,973 | |
| | |
Tuscaloosa County Industrial Development Authority, AL, (Hunt Refining Co.), 5.25%, 5/1/44(3) | | | 3,685 | | | | 4,072,994 | |
| | |
Vermont Economic Development Authority, (Casella Waste Systems, Inc.), (AMT), 4.625% to 4/3/28 (Put Date), 4/1/36(3) | | | 475 | | | | 527,188 | |
| | |
| | | | | | | $ | 66,038,964 | |
|
| Insured – General Obligations — 0.9% | |
| | |
Grandville Public Schools, MI, (AGM), 4.00%, 5/1/35 | | $ | 785 | | | $ | 953,814 | |
| | |
Grandville Public Schools, MI, (AGM), 4.00%, 5/1/36 | | | 1,045 | | | | 1,263,729 | |
| | |
Grandville Public Schools, MI, (AGM), 4.00%, 5/1/37 | | | 1,000 | | | | 1,204,350 | |
| | | | |
| | 19 | | See Notes to Financial Statements. |
Eaton Vance
National Municipal Income Fund
September 30, 2020
Portfolio of Investments — continued
| | | | | | | | |
| Security | | Principal
Amount
(000’s omitted) | | | Value | |
|
| Insured – General Obligations (continued) | |
| | |
Grandville Public Schools, MI, (AGM), 4.00%, 5/1/38 | | $ | 1,000 | | | $ | 1,200,060 | |
| | |
Grandville Public Schools, MI, (AGM), 4.00%, 5/1/39 | | | 1,000 | | | | 1,196,020 | |
| | |
Grandville Public Schools, MI, (AGM), 4.00%, 5/1/40 | | | 650 | | | | 774,930 | |
| | |
Nassau County, NY, (AGM), 5.00%, 4/1/44 | | | 10,205 | | | | 12,753,188 | |
| | |
Santa Rosa High School District, CA, (Election of 2014), (AGM), 5.00%, 8/1/43 | | | 3,930 | | | | 4,764,064 | |
| | |
Ukiah Unified School District, CA, (Election of 2020), (AGM), 5.00%, 8/1/38 | | | 1,330 | | | | 1,666,424 | |
| | |
Ukiah Unified School District, CA, (Election of 2020), (AGM), 5.00%, 8/1/45 | | | 2,000 | | | | 2,464,480 | |
| | |
Ukiah Unified School District, CA, (Election of 2020), (AGM), 5.00%, 8/1/49 | | | 2,250 | | | | 2,763,315 | |
| | |
| | | | | | | $ | 31,004,374 | |
|
| Insured – Hospital — 0.1% | |
| | |
Connecticut Health and Educational Facilities Authority, (Hartford HealthCare Obligated Group), (AGM), 4.00%, 7/1/36 | | $ | 1,700 | | | $ | 1,960,763 | |
| | |
| | | | | | | $ | 1,960,763 | |
|
| Insured – Other Revenue — 1.3% | |
| | |
Harris County-Houston Sports Authority, TX, (AGM), (NPFG), 0.00%, 11/15/34 | | $ | 58,155 | | | $ | 33,890,408 | |
| | |
New York City Industrial Development Agency, NY, (Yankee Stadium), (AGM), 3.00%, 3/1/39(1) | | | 3,000 | | | | 3,080,310 | |
| | |
New York City Industrial Development Agency, NY, (Yankee Stadium), (AGM), 3.00%, 3/1/40(1) | | | 430 | | | | 442,659 | |
| | |
New York City Industrial Development Agency, NY, (Yankee Stadium), (AGM), 3.00%, 3/1/49(1) | | | 9,135 | | | | 9,207,715 | |
| | |
| | | | | | | $ | 46,621,092 | |
|
| Insured – Special Tax Revenue — 0.5% | |
| | |
Massachusetts, Dedicated Tax Revenue, (NPFG), 5.50%, 1/1/29 | | $ | 11,000 | | | $ | 14,375,020 | |
| | |
Massachusetts, Dedicated Tax Revenue, (NPFG), 5.50%, 1/1/30 | | | 3,080 | | | | 4,088,361 | |
| | |
| | | | | | | $ | 18,463,381 | |
|
| Insured – Transportation — 2.4% | |
| | |
E-470 Public Highway Authority, CO, (NPFG), 0.00%, 9/1/37 | | $ | 13,335 | | | $ | 6,988,607 | |
| | |
Kansas City Industrial Development Authority, MO, (Kansas City International Airport Terminal Modernization), (AGM), (AMT), 5.00%, 3/1/49 | | | 14,800 | | | | 17,645,004 | |
| | |
Metropolitan Transportation Authority, NY, Green Bonds, (AGM), 4.00%, 11/15/46 | | | 6,140 | | | | 6,598,167 | |
| | | | | | | | |
| Security | | Principal
Amount
(000’s omitted) | | | Value | |
|
| Insured – Transportation (continued) | |
| | |
Metropolitan Transportation Authority, NY, Green Bonds, (AGM), 4.00%, 11/15/48(4) | | $ | 8,900 | | | $ | 9,618,230 | |
| | |
North Texas Tollway Authority, (AGC), 6.20%, 1/1/42 | | | 37,070 | | | | 44,426,912 | |
| | |
| | | | | | | $ | 85,276,920 | |
|
| Lease Revenue / Certificates of Participation — 1.9% | |
| | |
Hillsborough County, FL, 4.00%, 8/1/31 | | $ | 4,840 | | | $ | 5,961,138 | |
| | |
Hillsborough County, FL, 4.00%, 8/1/34 | | | 5,445 | | | | 6,600,538 | |
| | |
Hudson Yards Infrastructure Corp., NY, 4.00%, 2/15/44 | | | 6,410 | | | | 6,971,324 | |
| | |
Los Angeles County, CA, Tax and Revenue Anticipation Notes, 4.00%, 6/30/21 | | | 20,000 | | | | 20,570,200 | |
| | |
New Jersey Economic Development Authority, (School Facilities Construction), 5.00%, 6/15/34 | | | 8,460 | | | | 9,764,193 | |
| | |
New Jersey Economic Development Authority, (School Facilities Construction), 5.00%, 6/15/35 | | | 13,300 | | | | 15,290,478 | |
| | |
New Jersey Economic Development Authority, (School Facilities Construction), 5.00%, 6/15/39 | | | 2,165 | | | | 2,454,872 | |
| | |
| | | | | | | $ | 67,612,743 | |
|
| Nursing Home — 0.1% | |
| | |
Mississippi Business Finance Corp., (Magnolia Healthcare), 7.99%, 7/1/25 | | $ | 4,940 | | | $ | 4,983,472 | |
| | |
| | | | | | | $ | 4,983,472 | |
|
| Other Revenue — 3.4% | |
| | |
Battery Park City Authority, NY, 5.00%, 11/1/40 | | $ | 1,000 | | | $ | 1,294,490 | |
| | |
Central Falls Detention Facility Corp., RI, 7.25%, 7/15/35(6) | | | 250 | | | | 45,000 | |
| | |
DuPage County, IL, (The Morton Arboretum), Green Bonds, 3.00%, 5/15/47 | | | 5,085 | | | | 5,109,510 | |
| | |
Kalispel Tribe of Indians, WA, Series A, 5.25%, 1/1/38(3) | | | 1,865 | | | | 2,086,152 | |
| | |
Kalispel Tribe of Indians, WA, Series B, 5.25%, 1/1/38(3) | | | 1,000 | | | | 1,118,580 | |
| | |
New York City Transitional Finance Authority, NY, (Building Aid), 5.00%, 7/15/33 | | | 10,000 | | | | 11,643,800 | |
| | |
New York City Transitional Finance Authority, NY, (Building Aid), 5.00%, 7/15/43 | | | 24,670 | | | | 29,116,027 | |
| | |
New York City Trust for Cultural Resources, NY, (Museum of Modern Art), 4.00%, 4/1/26 | | | 3,885 | | | | 4,540,011 | |
| | |
New York City Trust for Cultural Resources, NY, (Museum of Modern Art), 4.00%, 4/1/27 | | | 1,705 | | | | 1,999,675 | |
| | |
Oregon, Lottery Revenue, 5.00%, 4/1/36 | | | 4,045 | | | | 5,018,308 | |
| | |
Texas Municipal Gas Acquisition and Supply Corp. I, Gas Supply Revenue, 6.25%, 12/15/26 | | | 17,960 | | | | 21,189,747 | |
| | |
Texas Municipal Gas Acquisition and Supply Corp. III, Gas Supply Revenue, 5.00%, 12/15/30 | | | 4,845 | | | | 5,198,346 | |
| | |
Texas Municipal Gas Acquisition and Supply Corp. III, Gas Supply Revenue, 5.00%, 12/15/32 | | | 29,755 | | | | 31,783,398 | |
| | | | |
| | 20 | | See Notes to Financial Statements. |
Eaton Vance
National Municipal Income Fund
September 30, 2020
Portfolio of Investments — continued
| | | | | | | | |
| Security | | Principal
Amount
(000’s omitted) | | | Value | |
|
| Other Revenue (continued) | |
| | |
Washington Health Care Facilities Authority, (Fred Hutchinson Cancer Research Center), 1.201%, (67% of 1 mo. USD LIBOR + 1.10%), 7/1/22 (Put Date), 1/1/42(5) | | $ | 1,000 | | | $ | 1,006,200 | |
| | |
| | | | | | | $ | 121,149,244 | |
|
| Senior Living / Life Care — 0.4% | |
| | |
Clackamas County Hospital Facility Authority, OR, (Rose Villa), 5.25%, 11/15/50 | | $ | 250 | | | $ | 265,050 | |
| | |
Clackamas County Hospital Facility Authority, OR, (Rose Villa), 5.375%, 11/15/55 | | | 300 | | | | 319,347 | |
| | |
Logan County, CO, (TLC Care Choices, Inc.), 6.875%, 12/1/23(7) | | | 409 | | | | 110,475 | |
| | |
New Hope Cultural Education Facilities Finance Corp., TX, (Longhorn Village), 5.00%, 1/1/47 | | | 8,000 | | | | 8,563,920 | |
| | |
Rockville, MD, (Ingleside at King Farm), 5.00%, 11/1/31 | | | 1,010 | | | | 1,045,865 | |
| | |
Rockville, MD, (Ingleside at King Farm), 5.00%, 11/1/32 | | | 525 | | | | 539,784 | |
| | |
Tarrant County Cultural Education Facilities Finance Corp., TX, (MRC Stevenson Oaks), 6.75%, 11/15/51 | | | 3,250 | | | | 3,412,500 | |
| | |
Wisconsin Health and Educational Facilities Authority, (Saint John’s Communities, Inc.), 5.00%, 9/15/37 | | | 495 | | | | 506,068 | |
| | |
Wisconsin Health and Educational Facilities Authority, (Saint John’s Communities, Inc.), 5.00%, 9/15/40 | | | 750 | | | | 772,155 | |
| | |
| | | | | | | $ | 15,535,164 | |
|
| Special Tax Revenue — 8.3% | |
| | |
Connecticut, Special Tax Revenue, 4.00%, 5/1/39 | | $ | 2,650 | | | $ | 3,063,268 | |
| | |
District of Columbia, Income Tax Revenue, 4.00%, 5/1/45 | | | 6,500 | | | | 7,671,885 | |
| | |
Illinois Sports Facilities Authority, 5.00%, 6/15/29 | | | 2,250 | | | | 2,577,488 | |
| | |
Illinois Sports Facilities Authority, 5.00%, 6/15/30 | | | 1,200 | | | | 1,358,016 | |
| | |
New River Community Development District, FL, (Capital Improvements), 5.00%, 5/1/13(6) | | | 230 | | | | 0 | |
| | |
New River Community Development District, FL, (Capital Improvements), 5.35%, 5/1/38(6) | | | 80 | | | | 0 | |
| | |
New River Community Development District, FL, (Capital Improvements), 5.75%, 5/1/38 | | | 370 | | | | 370,958 | |
| | |
New York City Transitional Finance Authority, NY, Future Tax Revenue, 3.00%, 5/1/46 | | | 2,880 | | | | 2,996,006 | |
| | |
New York City Transitional Finance Authority, NY, Future Tax Revenue, 3.00%, 5/1/48 | | | 2,840 | | | | 2,947,068 | |
| | |
New York City Transitional Finance Authority, NY, Future Tax Revenue, 4.00%, 8/1/38 | | | 5,000 | | | | 5,691,800 | |
| | |
New York City Transitional Finance Authority, NY, Future Tax Revenue, 4.00%, 5/1/42 | | | 5,695 | | | | 6,265,013 | |
| | |
New York City Transitional Finance Authority, NY, Future Tax Revenue, 5.00%, 8/1/35 | | | 10,485 | | | | 12,983,471 | |
| | | | | | | | |
| Security | | Principal
Amount
(000’s omitted) | | | Value | |
|
| Special Tax Revenue (continued) | |
| | |
New York City Transitional Finance Authority, NY, Future Tax Revenue, 5.00%, 5/1/36 | | $ | 4,050 | | | $ | 4,996,404 | |
| | |
New York City Transitional Finance Authority, NY, Future Tax Revenue, 5.00%, 5/1/39 | | | 9,240 | | | | 11,254,782 | |
| | |
New York City Transitional Finance Authority, NY, Future Tax Revenue, 2015 Series B, 5.00%, 8/1/39 | | | 4,585 | | | | 5,262,204 | |
| | |
New York City Transitional Finance Authority, NY, Future Tax Revenue, 2018 Series A, 5.00%, 8/1/39 | | | 11,845 | | | | 14,512,142 | |
| | |
New York Dormitory Authority, Personal Income Tax Revenue, 5.00%, 3/31/21 | | | 12,000 | | | | 12,288,960 | |
| | |
New York Dormitory Authority, Personal Income Tax Revenue, 5.00%, 2/15/45 | | | 9,995 | | | | 11,472,461 | |
| | |
New York Dormitory Authority, Personal Income Tax Revenue, 5.00%, 2/15/48 | | | 10,000 | | | | 12,348,800 | |
| | |
New York Dormitory Authority, Sales Tax Revenue, 5.00%, 3/15/36 | | | 7,840 | | | | 9,494,162 | |
| | |
New York Dormitory Authority, Sales Tax Revenue, 5.00%, 3/15/40 | | | 10,000 | | | | 12,028,100 | |
| | |
New York Dormitory Authority, Sales Tax Revenue, (AMT), 5.00%, 3/15/27 | | | 1,620 | | | | 2,015,118 | |
| | |
New York Dormitory Authority, Sales Tax Revenue, (AMT), 5.00%, 3/15/28 | | | 1,705 | | | | 2,165,162 | |
| | |
New York Dormitory Authority, Sales Tax Revenue, (AMT), 5.00%, 3/15/29 | | | 1,790 | | | | 2,286,564 | |
| | |
New York Dormitory Authority, Sales Tax Revenue, (AMT), 5.00%, 3/15/31 | | | 970 | | | | 1,224,848 | |
| | |
New York Dormitory Authority, Sales Tax Revenue, (AMT), 5.00%, 3/15/32 | | | 2,070 | | | | 2,598,699 | |
| | |
New York State Urban Development Corp., Personal Income Tax Revenue, 4.00%, 3/15/37 | | | 4,000 | | | | 4,720,360 | |
| | |
New York State Urban Development Corp., Personal Income Tax Revenue, 4.00%, 3/15/38 | | | 7,000 | | | | 8,216,390 | |
| | |
New York State Urban Development Corp., Personal Income Tax Revenue, 4.00%, 3/15/39 | | | 10,000 | | | | 11,677,200 | |
| | |
New York State Urban Development Corp., Personal Income Tax Revenue, 4.00%, 3/15/41 | | | 3,510 | | | | 4,070,687 | |
| | |
New York State Urban Development Corp., Personal Income Tax Revenue, 4.00%, 3/15/42 | | | 10,000 | | | | 11,556,800 | |
| | |
New York State Urban Development Corp., Personal Income Tax Revenue, 4.00%, 3/15/45 | | | 5,000 | | | | 5,739,500 | |
| | |
New York State Urban Development Corp., Personal Income Tax Revenue, 5.00%, 3/15/30 | | | 1,000 | | | | 1,338,680 | |
| | |
New York State Urban Development Corp., Personal Income Tax Revenue, 5.00%, 3/15/31 | | | 18,760 | | | | 24,962,431 | |
| | |
New York State Urban Development Corp., Personal Income Tax Revenue, 5.00%, 3/15/35 | | | 12,000 | | | | 14,426,760 | |
| | |
New York State Urban Development Corp., Personal Income Tax Revenue, 5.00%, 3/15/41 | | | 10,000 | | | | 12,208,900 | |
| | | | |
| | 21 | | See Notes to Financial Statements. |
Eaton Vance
National Municipal Income Fund
September 30, 2020
Portfolio of Investments — continued
| | | | | | | | |
| Security | | Principal
Amount
(000’s omitted) | | | Value | |
|
| Special Tax Revenue (continued) | |
| | |
Puerto Rico Sales Tax Financing Corp., 4.329%, 7/1/40 | | $ | 5,536 | | | $ | 5,655,965 | |
| | |
Puerto Rico Sales Tax Financing Corp., 4.784%, 7/1/58 | | | 2,219 | | | | 2,319,632 | |
| | |
Puerto Rico Sales Tax Financing Corp., 5.00%, 7/1/58 | | | 10,000 | | | | 10,595,900 | |
| | |
San Francisco Bay Area Rapid Transit District, CA, Sales Tax Revenue, 4.00%, 7/1/37 | | | 3,075 | | | | 3,577,424 | |
| | |
San Francisco Bay Area Rapid Transit District, CA, Sales Tax Revenue, 4.00%, 7/1/38 | | | 7,495 | | | | 8,670,816 | |
| | |
Southern Hills Plantation I Community Development District, FL, Series A1, 5.80%, 5/1/35 | | | 440 | | | | 362,309 | |
| | |
Southern Hills Plantation I Community Development District, FL, Series A2, 5.80%, 5/1/35(7) | | | 310 | | | | 236,195 | |
| | |
Sterling Hill Community Development District, FL, 6.20%, 5/1/35 | | | 1,532 | | | | 964,937 | |
| | |
Texas Transportation Commission, Prerefunded to 4/1/24, 5.00%, 4/1/33(4) | | | 10,000 | | | | 11,675,800 | |
| | |
| | | | | | | $ | 292,850,065 | |
|
| Student Loan — 0.1% | |
| | |
New Jersey Higher Education Student Assistance Authority, (AMT), 4.00%, 12/1/28 | | $ | 4,580 | | | $ | 4,865,105 | |
| | |
| | | | | | | $ | 4,865,105 | |
|
| Transportation — 19.5% | |
| | |
Atlanta, GA, Airport Revenue, (AMT), 4.00%, 7/1/34 | | $ | 3,480 | | | $ | 4,017,869 | |
| | |
Atlanta, GA, Airport Revenue, (AMT), 4.00%, 7/1/36 | | | 5,000 | | | | 5,725,000 | |
| | |
Austin, TX, Airport System Revenue, (AMT), 5.00%, 11/15/35 | | | 2,625 | | | | 3,237,885 | |
| | |
Charleston County Airport District, SC, (AMT), 5.50%, 7/1/38 | | | 10,000 | | | | 11,061,000 | |
| | |
Chicago, IL, (Midway International Airport), 5.00%, 1/1/33 | | | 3,830 | | | | 4,254,402 | |
| | |
Chicago, IL, (Midway International Airport), (AMT), 5.00%, 1/1/34 | | | 5,250 | | | | 5,747,700 | |
| | |
Chicago, IL, (O’Hare International Airport), 4.00%, 1/1/36(1) | | | 7,000 | | | | 7,970,970 | |
| | |
Chicago, IL, (O’Hare International Airport), 5.00%, 1/1/32(1) | | | 15,160 | | | | 19,326,878 | |
| | |
Chicago, IL, (O’Hare International Airport), 5.00%, 1/1/36 | | | 6,000 | | | | 6,894,840 | |
| | |
Chicago, IL, (O’Hare International Airport), (AMT), 5.00%, 1/1/23 | | | 1,125 | | | | 1,228,489 | |
| | |
Chicago, IL, (O’Hare International Airport), (AMT), 5.00%, 1/1/25 | | | 16,100 | | | | 17,600,037 | |
| | |
Chicago, IL, (O’Hare International Airport), (AMT), 5.00%, 1/1/33 | | | 7,300 | | | | 8,349,594 | |
| | |
Chicago, IL, (O’Hare International Airport), (AMT), 5.00%, 1/1/39 | | | 4,000 | | | | 4,802,560 | |
| | |
Dallas and Fort Worth, TX, (Dallas/Fort Worth International Airport), 4.00%, 11/1/35 | | | 11,000 | | | | 13,007,720 | |
| | |
Dallas and Fort Worth, TX, (Dallas/Fort Worth International Airport), 5.25%, 11/1/31 | | | 10,395 | | | | 11,694,271 | |
| | | | | | | | |
| Security | | Principal
Amount
(000’s omitted) | | | Value | |
|
| Transportation (continued) | |
| | |
Dallas and Fort Worth, TX, (Dallas/Fort Worth International Airport), (AMT), 5.25%, 11/1/30 | | $ | 11,015 | | | $ | 12,338,342 | |
| | |
Delaware River and Bay Authority of Delaware and New Jersey, 4.00%, 1/1/34 | | | 2,600 | | | | 3,040,492 | |
| | |
Delaware River and Bay Authority of Delaware and New Jersey, 4.00%, 1/1/39 | | | 3,225 | | | | 3,693,721 | |
| | |
Delaware River Port Authority of Pennsylvania and New Jersey, 5.00%, 1/1/31 | | | 1,845 | | | | 2,082,673 | |
| | |
Denver City and County, CO, Airport System Revenue, (AMT), 5.00%, 12/1/37 | | | 10,000 | | | | 12,009,200 | |
| | |
Hawaii, Airports System Revenue, (AMT), 5.00%, 7/1/41 | | | 2,935 | | | | 3,353,326 | |
| | |
Hawaii, Airports System Revenue, (AMT), 5.00%, 7/1/48 | | | 10,000 | | | | 11,662,600 | |
| | |
Kansas City Industrial Development Authority, MO, (Kansas City International Airport Terminal Modernization), (AMT), 5.00%, 3/1/46 | | | 17,130 | | | | 20,246,632 | |
| | |
Kansas Department of Transportation, 5.00%, 9/1/30 | | | 20,000 | | | | 23,287,200 | |
| | |
Los Angeles Department of Airports, CA, (Los Angeles International Airport), (AMT), 5.00%, 5/15/24 | | | 1,200 | | | | 1,380,708 | |
| | |
Los Angeles Department of Airports, CA, (Los Angeles International Airport), (AMT), 5.00%, 5/15/26 | | | 1,335 | | | | 1,625,256 | |
| | |
Los Angeles Department of Airports, CA, (Los Angeles International Airport), (AMT), 5.00%, 5/15/33 | | | 5,000 | | | | 6,107,900 | |
| | |
Los Angeles Department of Airports, CA, (Los Angeles International Airport), (AMT), 5.00%, 5/15/40 | | | 6,000 | | | | 6,896,100 | |
| | |
Los Angeles Department of Airports, CA, (Los Angeles International Airport), (AMT), 5.00%, 5/15/41 | | | 9,000 | | | | 10,370,430 | |
| | |
Louisiana Offshore Terminal Authority, (LOOP LLC), 2.00% to 10/1/22 (Put Date), 10/1/40 | | | 2,000 | | | | 2,022,780 | |
| | |
Love Field Airport Modernization Corp., TX, (AMT), 5.00%, 11/1/24 | | | 1,500 | | | | 1,730,130 | |
| | |
Maryland Economic Development Corp., (Transportation Facilities), 5.00%, 6/1/35 | | | 1,050 | | | | 1,179,937 | |
| | |
Massachusetts Port Authority, 5.00%, 7/1/32 | | | 3,800 | | | | 4,966,600 | |
| | |
Massachusetts Port Authority, (AMT), 5.00%, 7/1/26 | | | 10,105 | | | | 12,466,943 | |
| | |
Massachusetts Port Authority, (AMT), 5.00%, 7/1/30 | | | 3,000 | | | | 3,901,080 | |
| | |
Massachusetts Port Authority, (AMT), 5.00%, 7/1/31 | | | 2,965 | | | | 3,816,074 | |
| | |
Massachusetts Port Authority, (AMT), 5.00%, 7/1/32 | | | 4,200 | | | | 5,349,834 | |
| | |
Massachusetts Port Authority, (AMT), 5.00%, 7/1/33 | | | 3,855 | | | | 4,882,936 | |
| | |
Memphis-Shelby County Airport Authority, TN, (AMT), 5.00%, 7/1/35 | | | 3,440 | | | | 4,162,641 | |
| | |
Memphis-Shelby County Airport Authority, TN, (AMT), 5.00%, 7/1/36 | | | 3,200 | | | | 3,857,504 | |
| | |
Metropolitan Transportation Authority, NY, Green Bonds, 0.00%, 11/15/32 | | | 15,960 | | | | 10,159,976 | |
| | |
Metropolitan Washington Airports Authority, D.C., (AMT), 5.00%, 10/1/28 | | | 4,500 | | | | 5,187,330 | |
| | |
Metropolitan Washington Airports Authority, D.C., (AMT), 5.00%, 10/1/32 | | | 10,000 | | | | 11,884,800 | |
| | | | |
| | 22 | | See Notes to Financial Statements. |
Eaton Vance
National Municipal Income Fund
September 30, 2020
Portfolio of Investments — continued
| | | | | | | | |
| Security | | Principal
Amount
(000’s omitted) | | | Value | |
|
| Transportation (continued) | |
| | |
Metropolitan Washington Airports Authority, D.C., (AMT), 5.00%, 10/1/42 | | $ | 2,000 | | | $ | 2,353,500 | |
| | |
Miami-Dade County, FL, Aviation Revenue, (AMT), 4.00%, 10/1/44 | | | 5,000 | | | | 5,480,450 | |
| | |
Miami-Dade County, FL, Aviation Revenue, (AMT), 5.00%, 10/1/33 | | | 23,250 | | | | 26,140,672 | |
| | |
Miami-Dade County, FL, Aviation Revenue, (AMT), 5.00%, 10/1/36 | | | 10,000 | | | | 11,189,900 | |
| | |
Miami-Dade County, FL, Aviation Revenue, (AMT), 5.00%, 10/1/38 | | | 1,935 | | | | 2,309,481 | |
| | |
Miami-Dade County, FL, Aviation Revenue, (AMT), 5.00%, 10/1/40 | | | 32,530 | | | | 37,965,763 | |
| | |
Miami-Dade County, FL, Aviation Revenue, (AMT), 5.00%, 10/1/41 | | | 2,470 | | | | 2,923,097 | |
| | |
Minneapolis-St. Paul Metropolitan Airports Commission, MN, (AMT), 5.00%, 1/1/32 | | | 3,710 | | | | 4,615,425 | |
| | |
New Jersey Economic Development Authority, (Transit Transportation Project), 4.00%, 11/1/44 | | | 8,250 | | | | 8,541,390 | |
| | |
New Jersey Transportation Trust Fund Authority, (Transportation Program), 1.31%, (SIFMA + 1.20%), 12/15/21 (Put Date), 6/15/34(5) | | | 2,275 | | | | 2,275,842 | |
| | |
New Jersey Turnpike Authority, Series 2014A, 5.00%, 1/1/31 | | | 10,000 | | | | 11,427,600 | |
| | |
New Jersey Turnpike Authority, Series 2015E, 5.00%, 1/1/31 | | | 2,680 | | | | 3,108,505 | |
| | |
New Jersey Turnpike Authority, Series 2017B, 5.00%, 1/1/31 | | | 3,560 | | | | 4,421,128 | |
| | |
New York Thruway Authority, 3.00%, 1/1/49 | | | 6,550 | | | | 6,800,537 | |
| | |
New York Thruway Authority, 4.00%, 1/1/41 | | | 10,000 | | | | 11,485,800 | |
| | |
New York Thruway Authority, 4.00%, 1/1/42 | | | 10,000 | | | | 11,446,000 | |
| | |
New York Thruway Authority, 4.00%, 1/1/43 | | | 10,000 | | | | 11,416,200 | |
| | |
New York Thruway Authority, 5.00%, 1/1/36 | | | 12,500 | | | | 15,866,375 | |
| | |
New York Thruway Authority, 5.00%, 1/1/39 | | | 1,845 | | | | 2,330,881 | |
| | |
New York Thruway Authority, 5.00%, 1/1/40 | | | 17,155 | | | | 21,606,379 | |
| | |
New York Transportation Development Corp., (LaGuardia Airport Terminal B Redevelopment), (AMT), 5.00%, 7/1/41 | | | 1,705 | | | | 1,830,727 | |
| | |
New York Transportation Development Corp., (LaGuardia Airport Terminal B Redevelopment), (AMT), 5.00%, 7/1/46 | | | 14,325 | | | | 15,275,750 | |
| | |
New York Transportation Development Corp., (LaGuardia Airport Terminal B Redevelopment), (AMT), 5.25%, 1/1/50 | | | 1,180 | | | | 1,268,512 | |
| | |
North Texas Tollway Authority, 5.00%, 1/1/29 | | | 5,000 | | | | 6,035,150 | |
| | |
Pennsylvania Turnpike Commission, Prerefunded to 12/1/20, 5.35%, 12/1/30 | | | 5,005 | | | | 5,047,793 | |
| | |
Port Authority of New York and New Jersey, 5.00%, 7/15/31 | | | 5,000 | | | | 6,549,500 | |
| | | | | | | | |
| Security | | Principal
Amount
(000’s omitted) | | | Value | |
|
| Transportation (continued) | |
| | |
Port Authority of New York and New Jersey, (AMT), 4.00%, 9/1/34 | | $ | 9,600 | | | $ | 10,521,984 | |
| | |
Port Authority of New York and New Jersey, (AMT), 5.00%, 9/15/31 | | | 15,000 | | | | 18,411,000 | |
| | |
Port Authority of New York and New Jersey, (AMT), 5.00%, 10/1/35 | | | 5,000 | | | | 5,874,650 | |
| | |
Port Authority of New York and New Jersey, (AMT), 5.00%, 4/1/36 | | | 10,230 | | | | 12,013,191 | |
| | |
Port of Seattle, WA, (AMT), 5.00%, 4/1/23 | | | 2,000 | | | | 2,212,860 | |
| | |
Port of Seattle, WA, (AMT), 5.00%, 4/1/24 | | | 2,165 | | | | 2,480,765 | |
| | |
Port of Seattle, WA, (AMT), 5.00%, 4/1/25 | | | 1,500 | | | | 1,770,375 | |
| | |
Raleigh-Durham Airport Authority, NC, (AMT), Series 2020A, 5.00%, 5/1/36 | | | 1,000 | | | | 1,261,240 | |
| | |
Salt Lake City, UT, (Salt Lake City International Airport), (AMT), 5.00%, 7/1/38 | | | 7,165 | | | | 8,523,412 | |
| | |
San Francisco City and County Airport Commission, CA, (San Francisco International Airport), (AMT), 5.00%, 5/1/41 | | | 25,630 | | | | 29,335,842 | |
| | |
San Francisco City and County Airport Commission, CA, (San Francisco International Airport), (AMT), 5.00%, 5/1/44 | | | 8,535 | | | | 9,468,302 | |
| | |
San Francisco City and County Airport Commission, CA, (San Francisco International Airport), (AMT), 5.00%, 5/1/46 | | | 5,000 | | | | 5,679,500 | |
| | |
Texas Private Activity Bond Surface Transportation Corp., (North Tarrant Express Managed Lanes Project), 4.00%, 12/31/37 | | | 2,230 | | | | 2,516,154 | |
| | |
Texas Private Activity Bond Surface Transportation Corp., (North Tarrant Express Managed Lanes Project), 4.00%, 12/31/38 | | | 4,140 | | | | 4,655,844 | |
| | |
Texas Private Activity Bond Surface Transportation Corp., (North Tarrant Express Managed Lanes Project), 4.00%, 12/31/39 | | | 2,140 | | | | 2,399,133 | |
| | |
Texas Private Activity Bond Surface Transportation Corp., (North Tarrant Express Managed Lanes Project), 5.00%, 12/31/35 | | | 2,885 | | | | 3,570,563 | |
| | |
Texas Private Activity Bond Surface Transportation Corp., (North Tarrant Express Segment 3C), (AMT), 5.00%, 6/30/58 | | | 12,635 | | | | 14,513,066 | |
| | |
| | | | | | | $ | 693,502,598 | |
|
| Water and Sewer — 3.5% | |
| | |
Charlotte, NC, Water and Sewer System Revenue, 4.00%, 7/1/36 | | $ | 2,000 | | | $ | 2,472,060 | |
| | |
Columbia, SC, Waterworks and Sewer System Revenue, 5.00%, 2/1/49 | | | 2,340 | | | | 2,936,372 | |
| | |
Dallas, TX, Waterworks and Sewer System Revenue, 4.00%, 10/1/49 | | | 5,000 | | | | 5,962,250 | |
| | | | |
| | 23 | | See Notes to Financial Statements. |
Eaton Vance
National Municipal Income Fund
September 30, 2020
Portfolio of Investments — continued
| | | | | | | | |
| Security | | Principal
Amount
(000’s omitted) | | | Value | |
|
| Water and Sewer (continued) | |
| | |
East Bay Municipal Utility District, CA, Water System Revenue, 5.00%, 6/1/35 | | $ | 2,905 | | | $ | 3,648,448 | |
| | |
East Bay Municipal Utility District, CA, Water System Revenue, 5.00%, 6/1/37 | | | 7,280 | | | | 8,668,369 | |
| | |
East Bay Municipal Utility District, CA, Water System Revenue, Green Bonds, 5.00%, 6/1/35 | | | 1,000 | | | | 1,327,460 | |
| | |
East Bay Municipal Utility District, CA, Water System Revenue, Green Bonds, 5.00%, 6/1/37 | | | 4,200 | | | | 5,531,610 | |
| | |
Eastern Municipal Water District Financing Authority, CA, 4.00%, 7/1/38 | | | 1,200 | | | | 1,479,336 | |
| | |
Eastern Municipal Water District Financing Authority, CA, 5.00%, 7/1/37 | | | 1,300 | | | | 1,741,935 | |
| | |
Fulton County, GA, Water and Sewerage Revenue, 4.00%, 1/1/34 | | | 1,750 | | | | 2,149,840 | |
| | |
Grand Rapids, MI, Sanitary Sewer System Revenue, 5.00%, 1/1/45 | | | 1,245 | | | | 1,583,989 | |
| | |
Great Lakes Water Authority, MI, 5.00%, 7/1/40 | | | 350 | | | | 444,241 | |
| | |
Great Lakes Water Authority, MI, 5.00%, 7/1/45 | | | 750 | | | | 939,000 | |
| | |
Henrico County, VA, Water and Sewer System Revenue, 3.00%, 5/1/46(1) | | | 1,150 | | | | 1,245,933 | |
| | |
Horsham Water and Sewer Authority, PA, 4.00%, 11/15/31(1) | | | 300 | | | | 369,522 | |
| | |
Horsham Water and Sewer Authority, PA, 4.00%, 11/15/32(1) | | | 275 | | | | 336,366 | |
| | |
Horsham Water and Sewer Authority, PA, 4.00%, 11/15/33(1) | | | 275 | | | | 333,922 | |
| | |
Horsham Water and Sewer Authority, PA, 4.00%, 11/15/34(1) | | | 335 | | | | 405,434 | |
| | |
Horsham Water and Sewer Authority, PA, 4.00%, 11/15/35(1) | | | 230 | | | | 277,214 | |
| | |
Horsham Water and Sewer Authority, PA, 4.00%, 11/15/36(1) | | | 360 | | | | 431,111 | |
| | |
Madison Water and Wastewater Board, AL, 4.00%, 12/1/32 | | | 335 | | | | 409,196 | |
| | |
Madison Water and Wastewater Board, AL, 4.00%, 12/1/33 | | | 260 | | | | 315,983 | |
| | |
Madison Water and Wastewater Board, AL, 4.00%, 12/1/34 | | | 350 | | | | 424,028 | |
| | |
Madison Water and Wastewater Board, AL, 4.00%, 12/1/36 | | | 610 | | | | 732,439 | |
| | |
Madison Water and Wastewater Board, AL, 4.00%, 12/1/38 | | | 535 | | | | 635,510 | |
| | |
Madison Water and Wastewater Board, AL, 4.00%, 12/1/39 | | | 240 | | | | 284,194 | |
| | |
Memphis, TN, Water System Revenue, 3.00%, 12/1/35 | | | 325 | | | | 368,267 | |
| | |
Memphis, TN, Water System Revenue, 3.00%, 12/1/36 | | | 565 | | | | 637,071 | |
| | |
Metropolitan Water District of Southern California, 5.00%, 7/1/35 | | | 6,955 | | | | 9,118,005 | |
| | |
Metropolitan Water District of Southern California, 5.00%, 7/1/38 | | | 4,270 | | | | 5,531,657 | |
| | |
Michigan Finance Authority, (Detroit Water and Sewerage Department), 5.00%, 7/1/33 | | | 8,095 | | | | 9,260,275 | |
| | |
Michigan Finance Authority, (Detroit Water and Sewerage Department), 5.00%, 7/1/44 | | | 5 | | | | 5,303 | |
| | | | | | | | |
| Security | | Principal
Amount
(000’s omitted) | | | Value | |
|
| Water and Sewer (continued) | |
| | |
Missoula, MT, Water System Revenue, 4.00%, 7/1/37 | | $ | 600 | | | $ | 711,288 | |
| | |
Missoula, MT, Water System Revenue, 5.00%, 7/1/33 | | | 565 | | | | 720,720 | |
| | |
Missoula, MT, Water System Revenue, 5.00%, 7/1/35 | | | 1,135 | | | | 1,438,465 | |
| | |
Missoula, MT, Water System Revenue, 5.00%, 7/1/36 | | | 800 | | | | 1,010,008 | |
| | |
New York City Municipal Water Finance Authority, NY, (Water and Sewer System), 5.00%, 6/15/35 | | | 4,310 | | | | 5,224,496 | |
| | |
New York City Municipal Water Finance Authority, NY, (Water and Sewer System), 5.00%, 6/15/48 | | | 14,730 | | | | 17,730,206 | |
| | |
Port St. Lucie, FL, Stormwater Utility Revenue, 4.00%, 5/1/37 | | | 500 | | | | 595,845 | |
| | |
Port St. Lucie, FL, Stormwater Utility Revenue, 4.00%, 5/1/38 | | | 1,000 | | | | 1,188,560 | |
| | |
Port St. Lucie, FL, Stormwater Utility Revenue, 4.00%, 5/1/39 | | | 1,075 | | | | 1,273,606 | |
| | |
Salt Lake City, UT, Public Utilities Revenue, 4.00%, 2/1/38 | | | 1,600 | | | | 1,914,240 | |
| | |
Salt Lake City, UT, Public Utilities Revenue, 4.00%, 2/1/39 | | | 1,000 | | | | 1,192,770 | |
| | |
Salt Lake City, UT, Public Utilities Revenue, 4.00%, 2/1/45 | | | 805 | | | | 945,263 | |
| | |
San Diego Public Facilities Financing Authority, CA, Water Revenue, 4.00%, 8/1/38 | | | 1,000 | | | | 1,226,670 | |
| | |
San Diego Public Facilities Financing Authority, CA, Water Revenue, 4.00%, 8/1/39 | | | 1,250 | | | | 1,528,625 | |
| | |
San Diego Public Facilities Financing Authority, CA, Water Revenue, 4.00%, 8/1/45 | | | 3,400 | | | | 4,086,086 | |
| | |
Tarrant Regional Water District, TX, 5.00%, 3/1/30 | | | 10,000 | | | | 11,554,200 | |
| | |
Trinity River Authority, TX, (Mountain Creek Regional Wastewater System), 4.00%, 8/1/36 | | | 695 | | | | 850,722 | |
| | |
Virginia Beach, VA, Storm Water Utility Revenue, 4.00%, 11/15/31 | | | 1,085 | | | | 1,335,440 | |
| | |
| | | | | | | $ | 124,533,550 | |
| |
Total Tax-Exempt Municipal Securities — 96.8%
(identified cost $3,247,133,540) | | | $ | 3,433,777,105 | |
|
| Taxable Municipal Securities — 7.5% | |
| Security | | Principal
Amount
(000’s omitted) | | | Value | |
|
| Cogeneration — 0.0%(8) | |
| | |
Northampton County Industrial Development Authority, PA, (Northampton Generating), 5.00%, 12/31/23(2) | | $ | 4,464 | | | $ | 1,116,023 | |
| | |
| | | | | | | $ | 1,116,023 | |
|
| Education — 0.2% | |
| | |
California State University, 2.965%, 11/1/39 | | $ | 2,000 | | | $ | 2,052,980 | |
| | |
Massachusetts School Building Authority, 2.95%, 5/15/43(1) | | | 5,000 | | | | 5,036,400 | |
| | |
| | | | | | | $ | 7,089,380 | |
| | | | |
| | 24 | | See Notes to Financial Statements. |
Eaton Vance
National Municipal Income Fund
September 30, 2020
Portfolio of Investments — continued
| | | | | | | | |
| Security | | Principal
Amount
(000’s omitted) | | | Value | |
|
| Electric Utilities — 0.0%(8) | |
| | |
Lincoln, NE, Electric System Revenue, 1.649%, 9/1/31 | | $ | 1,000 | | | $ | 1,010,610 | |
| | |
| | | | | | | $ | 1,010,610 | |
|
| General Obligations — 3.8% | |
| | |
Amarillo Independent School District, TX, (PSF Guaranteed), 2.054%, 2/1/37(1) | | $ | 3,100 | | | $ | 3,156,389 | |
| | |
Amarillo Independent School District, TX, (PSF Guaranteed), 2.104%, 2/1/38(1) | | | 4,695 | | | | 4,780,120 | |
| | |
Amarillo Independent School District, TX, (PSF Guaranteed), 2.284%, 2/1/43(1) | | | 2,900 | | | | 2,945,994 | |
| | |
Argyle Independent School District, TX, (PSF Guaranteed), 2.077%, 8/15/37(1) | | | 1,425 | | | | 1,431,783 | |
| | |
Argyle Independent School District, TX, (PSF Guaranteed), 2.23%, 8/15/39(1) | | | 860 | | | | 864,059 | |
| | |
Austin, TX, 2.286%, 9/1/40(1) | | | 2,750 | | | | 2,765,180 | |
| | |
Bexar County, TX, 2.088%, 6/15/37 | | | 2,415 | | | | 2,474,554 | |
| | |
Bexar County, TX, 2.118%, 6/15/38 | | | 3,665 | | | | 3,742,478 | |
| | |
Central Unified School District, CA, 2.686%, 8/1/38(1) | | | 2,725 | | | | 2,751,187 | |
| | |
Central Unified School District, CA, 2.886%, 8/1/42(1) | | | 3,000 | | | | 3,035,040 | |
| | |
Chicago, IL, 7.75%, 1/1/42 | | | 4,050 | | | | 4,383,963 | |
| | |
Clint Independent School District, TX, (PSF Guaranteed), 2.225%, 2/15/39 | | | 2,000 | | | | 2,052,180 | |
| | |
Clint Independent School District, TX, (PSF Guaranteed), 2.265%, 2/15/40 | | | 1,230 | | | | 1,260,676 | |
| | |
Clint Independent School District, TX, (PSF Guaranteed), 2.335%, 2/15/45 | | | 6,665 | | | | 6,747,713 | |
| | |
Coppell Independent School District, TX, (PSF Guaranteed), 2.164%, 8/15/39 | | | 1,010 | | | | 1,013,838 | |
| | |
Crowley Independent School District, TX, (PSF Guaranteed), 2.084%, 8/1/37 | | | 13,000 | | | | 13,206,440 | |
| | |
Crowley Independent School District, TX, (PSF Guaranteed), 2.134%, 8/1/38 | | | 12,100 | | | | 12,293,358 | |
| | |
Crowley Independent School District, TX, (PSF Guaranteed), 2.184%, 8/1/39 | | | 12,425 | | | | 12,584,288 | |
| | |
Crowley Independent School District, TX, (PSF Guaranteed), 2.314%, 8/1/45 | | | 3,415 | | | | 3,440,749 | |
| | |
Dripping Springs Independent School District, TX , (PSF Guaranteed), 2.245%, 2/15/39 | | | 1,095 | | | | 1,122,594 | |
| | |
Dripping Springs Independent School District, TX , (PSF Guaranteed), 2.365%, 2/15/44 | | | 2,250 | | | | 2,263,567 | |
| | |
Encinitas Union School District, CA, 2.184%, 8/1/36(1) | | | 3,750 | | | | 3,772,987 | |
| | |
Encinitas Union School District, CA, 2.384%, 8/1/38(1) | | | 2,575 | | | | 2,613,213 | |
| | |
Fresno Unified School District, CA, 3.013%, 8/1/47 | | | 7,500 | | | | 7,515,075 | |
| | |
Jefferson Elementary School District, CA, 2.50%, 9/1/38(1) | | | 3,855 | | | | 3,817,375 | |
| | |
Lockhart Independent School District, TX , (PSF Guaranteed), 2.071%, 8/1/37(1) | | | 1,450 | | | | 1,460,904 | |
| | |
Lockhart Independent School District, TX , (PSF Guaranteed), 2.121%, 8/1/38(1) | | | 1,225 | | | | 1,234,359 | |
| | | | | | | | |
| Security | | Principal
Amount
(000’s omitted) | | | Value | |
|
| General Obligations (continued) | |
| | |
Lockhart Independent School District, TX , (PSF Guaranteed), 2.171%, 8/1/39(1) | | $ | 1,130 | | | $ | 1,138,125 | |
| | |
Lockhart Independent School District, TX , (PSF Guaranteed), 2.211%, 8/1/40(1) | | | 1,000 | | | | 1,007,100 | |
| | |
Lockhart Independent School District, TX , (PSF Guaranteed), 2.311%, 8/1/44(1) | | | 2,395 | | | | 2,389,372 | |
| | |
Lower Paxton Township, PA, 2.784%, 4/1/40(1) | | | 1,000 | | | | 1,029,160 | |
| | |
Prosper Independent School District, TX, (PSF Guaranteed), 2.059%, 2/15/37(1) | | | 2,750 | | | | 2,783,495 | |
| | |
Prosper Independent School District, TX, (PSF Guaranteed), 2.099%, 2/15/38(1) | | | 1,215 | | | | 1,230,856 | |
| | |
Prosper Independent School District, TX, (PSF Guaranteed), 2.161%, 2/15/39(1) | | | 2,975 | | | | 3,007,160 | |
| | |
Redondo Beach Unified School District, CA, 2.311%, 8/1/37 | | | 665 | | | | 677,635 | |
| | |
Rockwall Independent School District, TX, (PSF Guaranteed), 2.076%, 2/15/37 | | | 645 | | | | 657,881 | |
| | |
Schertz-Cibolo-Universal City Independent School District, TX, (PSF Guaranteed), 2.054%, 2/1/39 | | | 500 | | | | 503,275 | |
| | |
Seguin Independent School District, TX, (PSF Guaranteed), 2.062%, 8/15/37(1) | | | 2,370 | | | | 2,370,806 | |
| | |
Seguin Independent School District, TX, (PSF Guaranteed), 2.092%, 8/15/38(1) | | | 1,165 | | | | 1,165,571 | |
| | |
Seguin Independent School District, TX, (PSF Guaranteed), 2.142%, 8/15/39(1) | | | 1,080 | | | | 1,081,037 | |
| | |
Seguin Independent School District, TX, (PSF Guaranteed), 2.192%, 8/15/40(1) | | | 1,235 | | | | 1,236,112 | |
| | |
Sussex County, DE, 2.181%, 3/15/40(1) | | | 2,250 | | | | 2,238,885 | |
| | |
Sussex County, DE, 2.321%, 3/15/45(1) | | | 3,000 | | | | 2,974,980 | |
| | |
| | | | | | | $ | 134,221,513 | |
|
| Hospital — 1.0% | |
| | |
California Statewide Communities Development Authority, (Loma Linda University Medical Center), 6.00%, 12/1/24 | | $ | 34,250 | | | $ | 36,553,312 | |
| | |
| | | | | | | $ | 36,553,312 | |
|
| Insured – General Obligations — 0.3% | |
| | |
Hayward Unified School District, CA, (AGM), 2.372%, 8/1/35 | | $ | 4,235 | | | $ | 4,333,252 | |
| | |
Livonia Public Schools School District, MI, (BAM), 2.816%, 5/1/39(1) | | | 1,600 | | | | 1,621,104 | |
| | |
Livonia Public Schools School District, MI, (BAM), 2.916%, 5/1/41(1) | | | 2,000 | | | | 2,028,000 | |
| | |
Livonia Public Schools School District, MI, (BAM), 2.966%, 5/1/42(1) | | | 2,000 | | | | 2,027,340 | |
| | |
| | | | | | | $ | 10,009,696 | |
| | | | |
| | 25 | | See Notes to Financial Statements. |
Eaton Vance
National Municipal Income Fund
September 30, 2020
Portfolio of Investments — continued
| | | | | | | | |
| Security | | Principal
Amount
(000’s omitted) | | | Value | |
|
| Insured – Lease Revenue / Certificates of Participation — 0.0%(8) | |
| | |
Lake Worth Beach, FL, (BAM), 2.99%, 7/1/40 | | $ | 750 | | | $ | 762,105 | |
| | |
| | | | | | | $ | 762,105 | |
|
| Insured – Transportation — 1.3% | |
| | |
Alameda Corridor Transportation Authority, CA, (AMBAC), 0.00%, 10/1/26 | | $ | 22,500 | | | $ | 19,098,675 | |
| | |
Alameda Corridor Transportation Authority, CA, (AMBAC), 0.00%, 10/1/27 | | | 34,390 | | | | 28,133,083 | |
| | |
| | | | | | | $ | 47,231,758 | |
|
| Insured – Water and Sewer — 0.0%(8) | |
| | |
Russellville, AR, Water and Sewer Revenue, (BAM), 2.816%, 7/1/40(1) | | $ | 1,250 | | | $ | 1,250,663 | |
| | |
| | | | | | | $ | 1,250,663 | |
|
| Lease Revenue / Certificates of Participation — 0.2% | |
| | |
Michigan State Building Authority, 2.705%, 10/15/40 | | $ | 7,050 | | | $ | 7,078,905 | |
| | |
| | | | | | | $ | 7,078,905 | |
|
| Senior Living / Life Care — 0.1% | |
| | |
Montgomery County Industrial Development Authority, PA, (ACTS Retirement-Life Communities, Inc. Obligated Group), 2.45%, 11/15/23 | | $ | 1,250 | | | $ | 1,249,863 | |
| | |
Montgomery County Industrial Development Authority, PA, (ACTS Retirement-Life Communities, Inc. Obligated Group), 2.89%, 11/15/26 | | | 1,000 | | | | 997,520 | |
| | |
| | | | | | | $ | 2,247,383 | |
|
| Transportation — 0.1% | |
| | |
Ohio Turnpike and Infrastructure Commission, 3.096%, 2/15/40 | | $ | 3,000 | | | $ | 3,181,470 | |
| | |
| | | | | | | $ | 3,181,470 | |
|
| Water and Sewer — 0.5% | |
| | |
Henrico County, VA, Water and Sewer System Revenue, 2.317%, 5/1/40(1) | | $ | 12,000 | | | $ | 11,927,040 | |
| | |
Henrico County, VA, Water and Sewer System Revenue, 2.417%, 5/1/44(1) | | | 3,500 | | | | 3,475,465 | |
| | |
Houston, TX, Combined Utility System Revenue, 2.022%, 11/15/35 | | | 500 | | | | 500,285 | |
| | |
| | | | | | | $ | 15,902,790 | |
| | | | | | |
| | | | | Value | |
| |
Total Taxable Municipal Securities — 7.5%
(identified cost $257,329,248) | | $ | 267,655,608 | |
| |
Total Investments — 104.3%
(identified cost $3,504,462,788) | | $ | 3,701,432,713 | |
| |
Other Assets, Less Liabilities — (4.3)% | | $ | (152,559,517 | ) |
| |
Net Assets — 100.0% | | $ | 3,548,873,196 | |
The percentage shown for each investment category in the Portfolio of Investments is based on net assets.
At September 30, 2020, the concentration of the Fund’s investments in the various states and territories, determined as a percentage of net assets, is as follows:
| | | | |
| |
| New York | | | 23.1% | |
| |
| California | | | 16.9% | |
| |
| Texas | | | 12.9% | |
| |
| Others, representing less than 10% individually | | | 51.4% | |
The Fund invests primarily in debt securities issued by municipalities. The ability of the issuers of the debt securities to meet their obligations may be affected by economic developments in a specific industry or municipality. At September 30, 2020, 6.6% of total investments are backed by bond insurance of various financial institutions and financial guaranty assurance agencies. The aggregate percentage insured by an individual financial institution or financial guaranty assurance agency ranged from 0.2% to 3.2% of total investments.
| (1) | When-issued/delayed delivery security. |
| (2) | Represents a payment-in-kind security which may pay interest in additional principal at the issuer’s discretion. |
| (3) | Security exempt from registration under Rule 144A of the Securities Act of 1933, as amended. These securities may be sold in certain transactions in reliance on an exemption from registration (normally to qualified institutional buyers). At September 30, 2020, the aggregate value of these securities is $10,005,081 or 0.3% of the Fund’s net assets. |
| (4) | Security represents the municipal bond held by a trust that issues residual interest bonds (see Note 1H). |
| (5) | Floating rate security. The stated interest rate represents the rate in effect at September 30, 2020. |
| (6) | Defaulted security. Issuer has defaulted on the payment of interest and/or principal or has filed for bankruptcy. |
| (7) | Security is in default and making only partial interest payments. |
| (8) | Amount is less than 0.05%. |
| | | | |
| | 26 | | See Notes to Financial Statements. |
Eaton Vance
National Municipal Income Fund
September 30, 2020
Portfolio of Investments — continued
Abbreviations:
| | | | |
| | |
| AGC | | – | | Assured Guaranty Corp. |
| | |
| AGM | | – | | Assured Guaranty Municipal Corp. |
| | |
| AMBAC | | – | | AMBAC Financial Group, Inc. |
| | |
| AMT | | – | | Interest earned from these securities may be considered a tax preference item for purposes of the Federal Alternative Minimum Tax. |
| | |
| BAM | | – | | Build America Mutual Assurance Co. |
| | |
| LIBOR | | – | | London Interbank Offered Rate |
| | |
| NPFG | | – | | National Public Finance Guarantee Corp. |
| | |
| PSF | | – | | Permanent School Fund |
| | |
| SIFMA | | – | | Securities Industry and Financial Markets Association Municipal Swap Index |
Currency Abbreviations:
| | | | |
| | |
| USD | | – | | United States Dollar |
| | | | |
| | 27 | | See Notes to Financial Statements. |
Eaton Vance
Municipal Income Funds
September 30, 2020
Statements of Assets and Liabilities
| | | | | | | | |
| | | September 30, 2020 | |
| Assets | | AMT-Free Fund | | | National Fund | |
| | |
Investments — | | | | | | | | |
| | |
Identified cost | | $ | 341,462,045 | | | $ | 3,504,462,788 | |
| | |
Unrealized appreciation | | | 25,703,785 | | | | 196,969,925 | |
| | |
Investments, at value | | $ | 367,165,830 | | | $ | 3,701,432,713 | |
| | |
Cash | | $ | 11,593,968 | | | $ | 118,729,853 | |
| | |
Interest receivable | | | 4,136,595 | | | | 36,690,462 | |
| | |
Receivable for investments sold | | | 32,281 | | | | 12,140,370 | |
| | |
Receivable for Fund shares sold | | | 620,714 | | | | 7,540,323 | |
| | |
Total assets | | $ | 383,549,388 | | | $ | 3,876,533,721 | |
|
| Liabilities | |
| | |
Payable for floating rate notes issued | | $ | 29,836,363 | | | $ | 104,543,843 | |
| | |
Payable for investments purchased | | | — | | | | 7,590,000 | |
| | |
Payable for when-issued/delayed delivery securities | | | 10,733,316 | | | | 205,074,108 | |
| | |
Payable for Fund shares redeemed | | | 543,230 | | | | 6,911,610 | |
| | |
Distributions payable | | | 124,202 | | | | 1,275,089 | |
| | |
Payable to affiliates: | | | | | | | | |
| | |
Investment adviser fee | | | 115,035 | | | | 876,387 | |
| | |
Distribution and service fees | | | 45,386 | | | | 441,602 | |
| | |
Interest expense and fees payable | | | 79,324 | | | | 258,932 | |
| | |
Accrued expenses | | | 136,736 | | | | 688,954 | |
| | |
Total liabilities | | $ | 41,613,592 | | | $ | 327,660,525 | |
| | |
Net Assets | | $ | 341,935,796 | | | $ | 3,548,873,196 | |
|
| Sources of Net Assets | |
| | |
Paid-in capital | | $ | 343,305,617 | | | $ | 3,512,251,765 | |
| | |
Distributable earnings (accumulated loss) | | | (1,369,821 | ) | | | 36,621,431 | |
| | |
Net Assets | | $ | 341,935,796 | | | $ | 3,548,873,196 | |
| | |
| Class A Shares | | | | | | | | |
| | |
Net Assets | | $ | 158,729,128 | | | $ | 1,620,505,306 | |
| | |
Shares Outstanding | | | 17,152,284 | | | | 158,275,992 | |
| | |
Net Asset Value and Redemption Price Per Share | | | | | | | | |
| | |
(net assets ÷ shares of beneficial interest outstanding) | | $ | 9.25 | | | $ | 10.24 | |
| | |
Maximum Offering Price Per Share | | | | | | | | |
| | |
(100 ÷ 95.25 of net asset value per share) | | $ | 9.71 | | | $ | 10.75 | |
| |
| Class C Shares | | | | | |
| | |
Net Assets | | $ | 15,093,796 | | | $ | 131,329,995 | |
| | |
Shares Outstanding | | | 1,640,369 | | | | 12,826,729 | |
| | |
Net Asset Value and Offering Price Per Share* | | | | | | | | |
| | |
(net assets ÷ shares of beneficial interest outstanding) | | $ | 9.20 | | | $ | 10.24 | |
| |
| Class I Shares | | | | | |
| | |
Net Assets | | $ | 168,112,872 | | | $ | 1,797,037,895 | |
| | |
Shares Outstanding | | | 16,633,600 | | | | 175,529,926 | |
| | |
Net Asset Value, Offering Price and Redemption Price Per Share | | | | | | | | |
| | |
(net assets ÷ shares of beneficial interest outstanding) | | $ | 10.11 | | | $ | 10.24 | |
On sales of $50,000 or more, the offering price of Class A shares is reduced.
| * | Redemption price per share is equal to the net asset value less any applicable contingent deferred sales charge. |
| | | | |
| | 28 | | See Notes to Financial Statements. |
Eaton Vance
Municipal Income Funds
September 30, 2020
Statements of Operations
| | | | | | | | |
| | | Year Ended September 30, 2020 | |
| Investment Income | | AMT-Free Fund | | | National Fund | |
| | |
Interest | | $ | 12,807,709 | | | $ | 107,620,596 | |
| | |
Total investment income | | $ | 12,807,709 | | | $ | 107,620,596 | |
|
| Expenses | |
| | |
Investment adviser fee | | $ | 1,359,467 | | | $ | 10,209,281 | |
| | |
Distribution and service fees | | | | | | | | |
| | |
Class A | | | 378,484 | | | | 3,984,013 | |
| | |
Class C | | | 179,569 | | | | 1,565,368 | |
| | |
Trustees’ fees and expenses | | | 17,178 | | | | 108,500 | |
| | |
Custodian fee | | | 77,143 | | | | 614,591 | |
| | |
Transfer and dividend disbursing agent fees | | | 89,228 | | | | 1,181,719 | |
| | |
Legal and accounting services | | | 69,119 | | | | 166,737 | |
| | |
Printing and postage | | | 26,663 | | | | 192,828 | |
| | |
Registration fees | | | 78,545 | | | | 220,696 | |
| | |
Interest expense and fees | | | 447,697 | | | | 1,586,669 | |
| | |
Miscellaneous | | | 44,366 | | | | 178,316 | |
| | |
Total expenses | | $ | 2,767,459 | | | $ | 20,008,718 | |
| | |
Net investment income | | $ | 10,040,250 | | | $ | 87,611,878 | |
|
| Realized and Unrealized Gain (Loss) | |
| | |
Net realized gain (loss) — | | | | | | | | |
| | |
Investment transactions | | $ | (778,647 | ) | | $ | 32,976,127 | |
| | |
Net realized gain (loss) | | $ | (778,647 | ) | | $ | 32,976,127 | |
| | |
Change in unrealized appreciation (depreciation) — | | | | | | | | |
| | |
Investments | | $ | (3,878,667 | ) | | $ | (3,801,019 | ) |
| | |
Net change in unrealized appreciation (depreciation) | | $ | (3,878,667 | ) | | $ | (3,801,019 | ) |
| | |
Net realized and unrealized gain (loss) | | $ | (4,657,314 | ) | | $ | 29,175,108 | |
| | |
Net increase in net assets from operations | | $ | 5,382,936 | | | $ | 116,786,986 | |
| | | | |
| | 29 | | See Notes to Financial Statements. |
Eaton Vance
Municipal Income Funds
September 30, 2020
Statements of Changes in Net Assets
| | | | | | | | |
| | | Year Ended September 30, 2020 | |
| Increase (Decrease) in Net Assets | | AMT-Free Fund | | | National Fund | |
| | |
From operations — | | | | | | | | |
| | |
Net investment income | | $ | 10,040,250 | | | $ | 87,611,878 | |
| | |
Net realized gain (loss) | | | (778,647 | ) | | | 32,976,127 | |
| | |
Net change in unrealized appreciation (depreciation) | | | (3,878,667 | ) | | | (3,801,019 | ) |
| | |
Net increase in net assets from operations | | $ | 5,382,936 | | | $ | 116,786,986 | |
| | |
Distributions to shareholders — | | | | | | | | |
| | |
Class A | | $ | (4,671,695 | ) | | $ | (44,576,688 | ) |
| | |
Class C | | | (421,058 | ) | | | (3,225,704 | ) |
| | |
Class I | | | (5,343,767 | ) | | | (45,916,178 | ) |
| | |
Total distributions to shareholders | | $ | (10,436,520 | ) | | $ | (93,718,570 | ) |
| | |
Transactions in shares of beneficial interest — | | | | | | | | |
| | |
Proceeds from sale of shares | | | | | | | | |
| | |
Class A | | $ | 23,022,478 | | | $ | 191,525,800 | |
| | |
Class C | | | 2,632,842 | | | | 28,102,719 | |
| | |
Class I | | | 148,037,705 | | | | 1,035,176,603 | |
| | |
Net asset value of shares issued to shareholders in payment of distributions declared | | | | | | | | |
| | |
Class A | | | 4,121,688 | | | | 37,938,752 | |
| | |
Class C | | | 351,377 | | | | 2,661,618 | |
| | |
Class I | | | 3,986,156 | | | | 38,645,320 | |
| | |
Cost of shares redeemed | | | | | | | | |
| | |
Class A | | | (20,744,572 | ) | | | (255,941,582 | ) |
| | |
Class C | | | (6,017,910 | ) | | | (46,493,384 | ) |
| | |
Class I | | | (124,755,998 | ) | | | (632,198,120 | ) |
| | |
Net asset value of shares converted | | | | | | | | |
| | |
Class A | | | 1,573,683 | | | | 26,478,940 | |
| | |
Class C | | | (1,573,683 | ) | | | (26,478,940 | ) |
| | |
Net increase in net assets from Fund share transactions | | $ | 30,633,766 | | | $ | 399,417,726 | |
| | |
Net increase in net assets | | $ | 25,580,182 | | | $ | 422,486,142 | |
|
| Net Assets | |
| | |
At beginning of year | | $ | 316,355,614 | | | $ | 3,126,387,054 | |
| | |
At end of year | | $ | 341,935,796 | | | $ | 3,548,873,196 | |
| | | | |
| | 30 | | See Notes to Financial Statements. |
Eaton Vance
Municipal Income Funds
September 30, 2020
Statements of Changes in Net Assets — continued
| | | | | | | | |
| | | Year Ended September 30, 2019 | |
| Increase (Decrease) in Net Assets | | AMT-Free Fund | | | National Fund | |
| | |
From operations — | | | | | | | | |
| | |
Net investment income | | $ | 10,837,542 | | | $ | 90,078,958 | |
| | |
Net realized gain | | | 496,446 | | | | 22,467,982 | |
| | |
Net change in unrealized appreciation (depreciation) | | | 12,485,361 | | | | 115,156,982 | |
| | |
Net increase in net assets from operations | | $ | 23,819,349 | | | $ | 227,703,922 | |
| | |
Distributions to shareholders — | | | | | | | | |
| | |
Class A | | $ | (5,125,467 | ) | | $ | (49,279,956 | ) |
| | |
Class B | | | — | | | | (23,586 | ) |
| | |
Class C | | | (675,044 | ) | | | (6,179,246 | ) |
| | |
Class I | | | (5,080,058 | ) | | | (34,955,784 | ) |
| | |
Total distributions to shareholders | | $ | (10,880,569 | ) | | $ | (90,438,572 | ) |
| | |
Transactions in shares of beneficial interest — | | | | | | | | |
| | |
Proceeds from sale of shares | | | | | | | | |
| | |
Class A | | $ | 17,120,080 | | | $ | 132,818,482 | |
| | |
Class B | | | — | | | | 15,727 | |
| | |
Class C | | | 3,443,300 | | | | 28,224,568 | |
| | |
Class I | | | 37,835,385 | | | | 787,247,276 | |
| | |
Net asset value of shares issued to shareholders in payment of distributions declared | | | | | | | | |
| | |
Class A | | | 4,583,249 | | | | 41,711,115 | |
| | |
Class B | | | — | | | | 20,042 | |
| | |
Class C | | | 558,182 | | | | 5,138,875 | |
| | |
Class I | | | 3,665,870 | | | | 29,299,489 | |
| | |
Cost of shares redeemed | | | | | | | | |
| | |
Class A | | | (27,446,522 | ) | | | (234,832,240 | ) |
| | |
Class B | | | — | | | | (416,016 | ) |
| | |
Class C | | | (7,032,598 | ) | | | (64,286,308 | ) |
| | |
Class I | | | (33,790,772 | ) | | | (276,494,610 | ) |
| | |
Net asset value of shares converted(1) | | | | | | | | |
| | |
Class A | | | 10,699,119 | | | | 170,804,852 | |
| | |
Class B | | | — | | | | (1,625,188 | ) |
| | |
Class C | | | (10,699,119 | ) | | | (169,179,664 | ) |
| | |
Net increase (decrease) in net assets from Fund share transactions | | $ | (1,063,826 | ) | | $ | 448,446,400 | |
| | |
Net increase in net assets | | $ | 11,874,954 | | | $ | 585,711,750 | |
|
| Net Assets | |
| | |
At beginning of year | | $ | 304,480,660 | | | $ | 2,540,675,304 | |
| | |
At end of year | | $ | 316,355,614 | | | $ | 3,126,387,054 | |
| (1) | Includes the conversion of Class B to Class A shares at the close of business on August 15, 2019 upon the termination of Class B. |
| | | | |
| | 31 | | See Notes to Financial Statements. |
Eaton Vance
Municipal Income Funds
September 30, 2020
Financial Highlights
| | | | | | | | | | | | | | | | | | | | |
| | | AMT-Free Fund — Class A | |
| |
| | | Year Ended September 30, | |
| | | 2020 | | | 2019 | | | 2018 | | | 2017 | | | 2016 | |
| | | | | |
Net asset value — Beginning of year | | $ | 9.250 | | | $ | 8.870 | | | $ | 9.130 | | | $ | 9.430 | | | $ | 9.210 | |
| | | | | |
| Income (Loss) From Operations | | | | | | | | | | | | | | | | | | | | |
| | | | | |
Net investment income(1) | | $ | 0.274 | | | $ | 0.317 | | | $ | 0.336 | | | $ | 0.351 | | | $ | 0.358 | |
| | | | | |
Net realized and unrealized gain (loss) | | | 0.011 | (2) | | | 0.381 | | | | (0.262 | ) | | | (0.298 | ) | | | 0.218 | |
| | | | | |
Total income from operations | | $ | 0.285 | | | $ | 0.698 | | | $ | 0.074 | | | $ | 0.053 | | | $ | 0.576 | |
| | | | | |
| Less Distributions | | | | | | | | | | | | | | | | | | | | |
| | | | | |
From net investment income | | $ | (0.285 | ) | | $ | (0.318 | ) | | $ | (0.334 | ) | | $ | (0.353 | ) | | $ | (0.356 | ) |
| | | | | |
Total distributions | | $ | (0.285 | ) | | $ | (0.318 | ) | | $ | (0.334 | ) | | $ | (0.353 | ) | | $ | (0.356 | ) |
| | | | | |
Net asset value — End of year | | $ | 9.250 | | | $ | 9.250 | | | $ | 8.870 | | | $ | 9.130 | | | $ | 9.430 | |
| | | | | |
Total Return(3) | | | 3.12 | % | | | 8.02 | % | | | 0.83 | % | | | 0.64 | % | | | 6.33 | % |
| | | | | |
| Ratios/Supplemental Data | | | | | | | | | | | | | | | | | | | | |
| | | | | |
Net assets, end of year (000’s omitted) | | $ | 158,729 | | | $ | 150,853 | | | $ | 139,623 | | | $ | 155,589 | | | $ | 198,762 | |
| | | | | |
Ratios (as a percentage of average daily net assets): | | | | | | | | | | | | | | | | | | | | |
| | | | | |
Expenses excluding interest and fees | | | 0.78 | % | | | 0.81 | % | | | 0.81 | % | | | 0.82 | % | | | 0.81 | % |
| | | | | |
Interest and fee expense(4) | | | 0.14 | % | | | 0.23 | % | | | 0.24 | % | | | 0.16 | % | | | 0.10 | % |
| | | | | |
Total expenses | | | 0.92 | % | | | 1.04 | % | | | 1.05 | % | | | 0.98 | % | | | 0.91 | % |
| | | | | |
Net investment income | | | 2.97 | % | | | 3.51 | % | | | 3.74 | % | | | 3.86 | % | | | 3.81 | % |
| | | | | |
Portfolio Turnover | | | 58 | % | | | 33 | % | | | 18 | % | | | 33 | % | | | 21 | % |
| (1) | Computed using average shares outstanding. |
| (2) | The per share amount is not in accord with the net realized and unrealized gain (loss) on investments for the period because of the timing of sales of Fund shares and the amount of the per share realized and unrealized gains and losses at such time. |
| (3) | Returns are historical and are calculated by determining the percentage change in net asset value with all distributions reinvested and do not reflect the effect of sales charges. |
| (4) | Interest and fee expense relates to the liability for floating rate notes issued in conjunction with residual interest bond transactions (see Note 1H). |
| | | | |
| | 32 | | See Notes to Financial Statements. |
Eaton Vance
Municipal Income Funds
September 30, 2020
Financial Highlights — continued
| | | | | | | | | | | | | | | | | | | | |
| | | AMT-Free Fund — Class C | |
| |
| | | Year Ended September 30, | |
| | | 2020 | | | 2019 | | | 2018 | | | 2017 | | | 2016 | |
| | | | | |
Net asset value — Beginning of year | | $ | 9.200 | | | $ | 8.820 | | | $ | 9.080 | | | $ | 9.380 | | | $ | 9.160 | |
| | | | | |
| Income (Loss) From Operations | | | | | | | | | | | | | | | | | | | | |
| | | | | |
Net investment income(1) | | $ | 0.204 | | | $ | 0.249 | | | $ | 0.267 | | | $ | 0.281 | | | $ | 0.286 | |
| | | | | |
Net realized and unrealized gain (loss) | | | 0.011 | (2) | | | 0.380 | | | | (0.262 | ) | | | (0.298 | ) | | | 0.218 | |
| | | | | |
Total income (loss) from operations | | $ | 0.215 | | | $ | 0.629 | | | $ | 0.005 | | | $ | (0.017 | ) | | $ | 0.504 | |
| | | | | |
| Less Distributions | | | | | | | | | | | | | | | | | | | | |
| | | | | |
From net investment income | | $ | (0.215 | ) | | $ | (0.249 | ) | | $ | (0.265 | ) | | $ | (0.283 | ) | | $ | (0.284 | ) |
| | | | | |
Total distributions | | $ | (0.215 | ) | | $ | (0.249 | ) | | $ | (0.265 | ) | | $ | (0.283 | ) | | $ | (0.284 | ) |
| | | | | |
Net asset value — End of year | | $ | 9.200 | | | $ | 9.200 | | | $ | 8.820 | | | $ | 9.080 | | | $ | 9.380 | |
| | | | | |
Total Return(3) | | | 2.36 | % | | | 7.24 | % | | | 0.06 | % | | | (0.12 | )% | | | 5.56 | % |
| | | | | |
| Ratios/Supplemental Data | | | | | | | | | | | | | | | | | | | | |
| | | | | |
Net assets, end of year (000’s omitted) | | $ | 15,094 | | | $ | 19,715 | | | $ | 32,545 | | | $ | 39,099 | | | $ | 45,606 | |
| | | | | |
Ratios (as a percentage of average daily net assets): | | | | | | | | | | | | | | | | | | | | |
| | | | | |
Expenses excluding interest and fees | | | 1.53 | % | | | 1.56 | % | | | 1.56 | % | | | 1.57 | % | | | 1.56 | % |
| | | | | |
Interest and fee expense(4) | | | 0.14 | % | | | 0.23 | % | | | 0.24 | % | | | 0.16 | % | | | 0.10 | % |
| | | | | |
Total expenses | | | 1.67 | % | | | 1.79 | % | | | 1.80 | % | | | 1.73 | % | | | 1.66 | % |
| | | | | |
Net investment income | | | 2.23 | % | | | 2.78 | % | | | 2.99 | % | | | 3.11 | % | | | 3.06 | % |
| | | | | |
Portfolio Turnover | | | 58 | % | | | 33 | % | | | 18 | % | | | 33 | % | | | 21 | % |
| (1) | Computed using average shares outstanding. |
| (2) | The per share amount is not in accord with the net realized and unrealized gain (loss) on investments for the period because of the timing of sales of Fund shares and the amount of the per share realized and unrealized gains and losses at such time. |
| (3) | Returns are historical and are calculated by determining the percentage change in net asset value with all distributions reinvested and do not reflect the effect of sales charges. |
| (4) | Interest and fee expense relates to the liability for floating rate notes issued in conjunction with residual interest bond transactions (see Note 1H). |
| | | | |
| | 33 | | See Notes to Financial Statements. |
Eaton Vance
Municipal Income Funds
September 30, 2020
Financial Highlights — continued
| | | | | | | | | | | | | | | | | | | | |
| | | AMT-Free Fund — Class I | |
| |
| | | Year Ended September 30, | |
| | | 2020 | | | 2019 | | | 2018 | | | 2017 | | | 2016 | |
| | | | | |
Net asset value — Beginning of year | | $ | 10.100 | | | $ | 9.680 | | | $ | 9.970 | | | $ | 10.300 | | | $ | 10.060 | |
| | | | | |
| Income (Loss) From Operations | | | | | | | | | | | | | | | | | | | | |
| | | | | |
Net investment income(1) | | $ | 0.323 | | | $ | 0.370 | | | $ | 0.391 | | | $ | 0.407 | | | $ | 0.415 | |
| | | | | |
Net realized and unrealized gain (loss) | | | 0.023 | (2) | | | 0.422 | | | | (0.292 | ) | | | (0.327 | ) | | | 0.240 | |
| | | | | |
Total income from operations | | $ | 0.346 | | | $ | 0.792 | | | $ | 0.099 | | | $ | 0.080 | | | $ | 0.655 | |
| | | | | |
| Less Distributions | | | | | | | | | | | | | | | | | | | | |
| | | | | |
From net investment income | | $ | (0.336 | ) | | $ | (0.372 | ) | | $ | (0.389 | ) | | $ | (0.410 | ) | | $ | (0.415 | ) |
| | | | | |
Total distributions | | $ | (0.336 | ) | | $ | (0.372 | ) | | $ | (0.389 | ) | | $ | (0.410 | ) | | $ | (0.415 | ) |
| | | | | |
Net asset value — End of year | | $ | 10.110 | | | $ | 10.100 | | | $ | 9.680 | | | $ | 9.970 | | | $ | 10.300 | |
| | | | | |
Total Return(3) | | | 3.48 | % | | | 8.34 | % | | | 1.02 | % | | | 0.87 | % | | | 6.60 | % |
| | | | | |
| Ratios/Supplemental Data | | | | | | | | | | | | | | | | | | | | |
| | | | | |
Net assets, end of year (000’s omitted) | | $ | 168,113 | | | $ | 145,788 | | | $ | 132,313 | | | $ | 154,177 | | | $ | 154,458 | |
| | | | | |
Ratios (as a percentage of average daily net assets): | | | | | | | | | | | | | | | | | | | | |
| | | | | |
Expenses excluding interest and fees | | | 0.53 | % | | | 0.56 | % | | | 0.56 | % | | | 0.57 | % | | | 0.56 | % |
| | | | | |
Interest and fee expense(4) | | | 0.14 | % | | | 0.23 | % | | | 0.24 | % | | | 0.16 | % | | | 0.10 | % |
| | | | | |
Total expenses | | | 0.67 | % | | | 0.79 | % | | | 0.80 | % | | | 0.73 | % | | | 0.66 | % |
| | | | | |
Net investment income | | | 3.21 | % | | | 3.76 | % | | | 3.98 | % | | | 4.09 | % | | | 4.04 | % |
| | | | | |
Portfolio Turnover | | | 58 | % | | | 33 | % | | | 18 | % | | | 33 | % | | | 21 | % |
| (1) | Computed using average shares outstanding. |
| (2) | The per share amount is not in accord with the net realized and unrealized gain (loss) on investments for the period because of the timing of sales of Fund shares and the amount of the per share realized and unrealized gains and losses at such time. |
| (3) | Returns are historical and are calculated by determining the percentage change in net asset value with all distributions reinvested. |
| (4) | Interest and fee expense relates to the liability for floating rate notes issued in conjunction with residual interest bond transactions (see Note 1H). |
| | | | |
| | 34 | | See Notes to Financial Statements. |
Eaton Vance
Municipal Income Funds
September 30, 2020
Financial Highlights — continued
| | | | | | | | | | | | | | | | | | | | |
| | | National Fund — Class A | |
| |
| | | Year Ended September 30, | |
| | | 2020 | | | 2019 | | | 2018 | | | 2017 | | | 2016 | |
| | | | | |
Net asset value — Beginning of year | | $ | 10.140 | | | $ | 9.650 | | | $ | 9.930 | | | $ | 10.170 | | | $ | 9.810 | |
| | | | | |
| Income (Loss) From Operations | | | | | | | | | | | | | | | | | | | | |
| | | | | |
Net investment income(1) | | $ | 0.265 | | | $ | 0.322 | | | $ | 0.350 | | | $ | 0.366 | | | $ | 0.385 | |
| | | | | |
Net realized and unrealized gain (loss) | | | 0.119 | | | | 0.491 | | | | (0.277 | ) | | | (0.242 | ) | | | 0.357 | |
| | | | | |
Total income from operations | | $ | 0.384 | | | $ | 0.813 | | | $ | 0.073 | | | $ | 0.124 | | | $ | 0.742 | |
| | | | | |
| Less Distributions | | | | | | | | | | | | | | | | | | | | |
| | | | | |
From net investment income | | $ | (0.284 | ) | | $ | (0.323 | ) | | $ | (0.353 | ) | | $ | (0.364 | ) | | $ | (0.382 | ) |
| | | | | |
Total distributions | | $ | (0.284 | ) | | $ | (0.323 | ) | | $ | (0.353 | ) | | $ | (0.364 | ) | | $ | (0.382 | ) |
| | | | | |
Net asset value — End of year | | $ | 10.240 | | | $ | 10.140 | | | $ | 9.650 | | | $ | 9.930 | | | $ | 10.170 | |
| | | | | |
Total Return(2) | | | 3.84 | % | | | 8.57 | % | | | 0.76 | % | | | 1.31 | % | | | 7.68 | % |
| | | | | |
| Ratios/Supplemental Data | | | | | | | | | | | | | | | | | | | | |
| | | | | |
Net assets, end of year (000’s omitted) | | $ | 1,620,505 | | | $ | 1,605,407 | | | $ | 1,419,239 | | | $ | 1,600,127 | | | $ | 1,857,375 | |
| | | | | |
Ratios (as a percentage of average daily net assets): | | | | | | | | | | | | | | | | | | | | |
| | | | | |
Expenses excluding interest and fees | | | 0.64 | % | | | 0.68 | % | | | 0.69 | % | | | 0.68 | % | | | 0.67 | % |
| | | | | |
Interest and fee expense(3) | | | 0.05 | % | | | 0.12 | % | | | 0.19 | % | | | 0.16 | % | | | 0.12 | % |
| | | | | |
Total expenses | | | 0.69 | % | | | 0.80 | % | | | 0.88 | % | | | 0.84 | % | | | 0.79 | % |
| | | | | |
Net investment income | | | 2.61 | % | | | 3.26 | % | | | 3.58 | % | | | 3.71 | % | | | 3.83 | % |
| | | | | |
Portfolio Turnover | | | 105 | % | | | 89 | % | | | 67 | % | | | 70 | % | | | 71 | % |
| (1) | Computed using average shares outstanding. |
| (2) | Returns are historical and are calculated by determining the percentage change in net asset value with all distributions reinvested and do not reflect the effect of sales charges. |
| (3) | Interest and fee expense relates to the liability for floating rate notes issued in conjunction with residual interest bond transactions (see Note 1H). |
| | | | |
| | 35 | | See Notes to Financial Statements. |
Eaton Vance
Municipal Income Funds
September 30, 2020
Financial Highlights — continued
| | | | | | | | | | | | | | | | | | | | |
| | | National Fund — Class C | |
| |
| | | Year Ended September 30, | |
| | | 2020 | | | 2019 | | | 2018 | | | 2017 | | | 2016 | |
| | | | | |
Net asset value — Beginning of year | | $ | 10.140 | | | $ | 9.650 | | | $ | 9.930 | | | $ | 10.170 | | | $ | 9.810 | |
| | | | | |
| Income (Loss) From Operations | | | | | | | | | | | | | | | | | | | | |
| | | | | |
Net investment income(1) | | $ | 0.190 | | | $ | 0.252 | | | $ | 0.276 | | | $ | 0.292 | | | $ | 0.310 | |
| | | | | |
Net realized and unrealized gain (loss) | | | 0.119 | | | | 0.488 | | | | (0.276 | ) | | | (0.242 | ) | | | 0.357 | |
| | | | | |
Total income from operations | | $ | 0.309 | | | $ | 0.740 | | | $ | — | | | $ | 0.050 | | | $ | 0.667 | |
| | | | | |
| Less Distributions | | | | | | | | | | | | | | | | | | | | |
| | | | | |
From net investment income | | $ | (0.209 | ) | | $ | (0.250 | ) | | $ | (0.280 | ) | | $ | (0.290 | ) | | $ | (0.307 | ) |
| | | | | |
Total distributions | | $ | (0.209 | ) | | $ | (0.250 | ) | | $ | (0.280 | ) | | $ | (0.290 | ) | | $ | (0.307 | ) |
| | | | | |
Net asset value — End of year | | $ | 10.240 | | | $ | 10.140 | | | $ | 9.650 | | | $ | 9.930 | | | $ | 10.170 | |
| | | | | |
Total Return(2) | | | 3.08 | % | | | 7.77 | % | | | 0.01 | % | | | 0.56 | % | | | 6.88 | % |
| | | | | |
| Ratios/Supplemental Data | | | | | | | | | | | | | | | | | | | | |
| | | | | |
Net assets, end of year (000’s omitted) | | $ | 131,330 | | | $ | 172,417 | | | $ | 363,026 | | | $ | 462,269 | | | $ | 576,664 | |
| | | | | |
Ratios (as a percentage of average daily net assets): | | | | | | | | | | | | | | | | | | | | |
| | | | | |
Expenses excluding interest and fees | | | 1.39 | % | | | 1.43 | % | | | 1.44 | % | | | 1.43 | % | | | 1.42 | % |
| | | | | |
Interest and fee expense(3) | | | 0.05 | % | | | 0.12 | % | | | 0.19 | % | | | 0.16 | % | | | 0.12 | % |
| | | | | |
Total expenses | | | 1.44 | % | | | 1.55 | % | | | 1.63 | % | | | 1.59 | % | | | 1.54 | % |
| | | | | |
Net investment income | | | 1.87 | % | | | 2.57 | % | | | 2.83 | % | | | 2.96 | % | | | 3.08 | % |
| | | | | |
Portfolio Turnover | | | 105 | % | | | 89 | % | | | 67 | % | | | 70 | % | | | 71 | % |
| (1) | Computed using average shares outstanding. |
| (2) | Returns are historical and are calculated by determining the percentage change in net asset value with all distributions reinvested and do not reflect the effect of sales charges. |
| (3) | Interest and fee expense relates to the liability for floating rate notes issued in conjunction with residual interest bond transactions (see Note 1H). |
| | | | |
| | 36 | | See Notes to Financial Statements. |
Eaton Vance
Municipal Income Funds
September 30, 2020
Financial Highlights — continued
| | | | | | | | | | | | | | | | | | | | |
| | | National Fund — Class I | |
| |
| | | Year Ended September 30, | |
| | | 2020 | | | 2019 | | | 2018 | | | 2017 | | | 2016 | |
| | | | | |
Net asset value — Beginning of year | | $ | 10.140 | | | $ | 9.650 | | | $ | 9.930 | | | $ | 10.170 | | | $ | 9.810 | |
| | | | | |
| Income (Loss) From Operations | | | | | | | | | | | | | | | | | | | | |
| | | | | |
Net investment income(1) | | $ | 0.289 | | | $ | 0.341 | | | $ | 0.374 | | | $ | 0.390 | | | $ | 0.410 | |
| | | | | |
Net realized and unrealized gain (loss) | | | 0.120 | | | | 0.495 | | | | (0.277 | ) | | | (0.241 | ) | | | 0.357 | |
| | | | | |
Total income from operations | | $ | 0.409 | | | $ | 0.836 | | | $ | 0.097 | | | $ | 0.149 | | | $ | 0.767 | |
| | | | | |
| Less Distributions | | | | | | | | | | | | | | | | | | | | |
| | | | | |
From net investment income | | $ | (0.309 | ) | | $ | (0.346 | ) | | $ | (0.377 | ) | | $ | (0.389 | ) | | $ | (0.407 | ) |
| | | | | |
Total distributions | | $ | (0.309 | ) | | $ | (0.346 | ) | | $ | (0.377 | ) | | $ | (0.389 | ) | | $ | (0.407 | ) |
| | | | | |
Net asset value — End of year | | $ | 10.240 | | | $ | 10.140 | | | $ | 9.650 | | | $ | 9.930 | | | $ | 10.170 | |
| | | | | |
Total Return(2) | | | 4.10 | % | | | 8.83 | % | | | 1.01 | % | | | 1.56 | % | | | 7.94 | % |
| | | | | |
| Ratios/Supplemental Data | | | | | | | | | | | | | | | | | | | | |
| | | | | |
Net assets, end of year (000’s omitted) | | $ | 1,797,038 | | | $ | 1,348,563 | | | $ | 756,446 | | | $ | 777,063 | | | $ | 701,153 | |
| | | | | |
Ratios (as a percentage of average daily net assets): | | | | | | | | | | | | | | | | | | | | |
| | | | | |
Expenses excluding interest and fees | | | 0.39 | % | | | 0.43 | % | | | 0.44 | % | | | 0.43 | % | | | 0.42 | % |
| | | | | |
Interest and fee expense(3) | | | 0.05 | % | | | 0.12 | % | | | 0.19 | % | | | 0.16 | % | | | 0.12 | % |
| | | | | |
Total expenses | | | 0.44 | % | | | 0.55 | % | | | 0.63 | % | | | 0.59 | % | | | 0.54 | % |
| | | | | |
Net investment income | | | 2.85 | % | | | 3.45 | % | | | 3.83 | % | | | 3.95 | % | | | 4.09 | % |
| | | | | |
Portfolio Turnover | | | 105 | % | | | 89 | % | | | 67 | % | | | 70 | % | | | 71 | % |
| (1) | Computed using average shares outstanding. |
| (2) | Returns are historical and are calculated by determining the percentage change in net asset value with all distributions reinvested. |
| (3) | Interest and fee expense relates to the liability for floating rate notes issued in conjunction with residual interest bond transactions (see Note 1H). |
| | | | |
| | 37 | | See Notes to Financial Statements. |
Eaton Vance
Municipal Income Funds
September 30, 2020
Notes to Financial Statements
1 Significant Accounting Policies
Eaton Vance AMT-Free Municipal Income Fund (AMT-Free Fund) and Eaton Vance National Municipal Income Fund (National Fund) (each individually referred to as the Fund, and collectively, the Funds) are a diversified series of Eaton Vance Mutual Funds Trust and Eaton Vance Municipals Trust, respectively (collectively, the Trusts). The Trusts are Massachusetts business trusts registered under the Investment Company Act of 1940, as amended (the 1940 Act), as open-end management investment companies. The Funds’ investment objective is to provide current income exempt from regular federal income tax. The Funds offer three classes of shares. Class A shares are generally sold subject to a sales charge imposed at time of purchase. Class C shares are sold at net asset value and are generally subject to a contingent deferred sales charge (see Note 5). Effective January 25, 2019, Class C shares generally automatically convert to Class A shares ten years after their purchase and, effective November 5, 2020, automatically convert to Class A shares eight years after their purchase as described in the Funds’ prospectus. Class I shares are sold at net asset value and are not subject to a sales charge. Each class represents a pro-rata interest in the Fund, but votes separately on class-specific matters and (as noted below) is subject to different expenses. Realized and unrealized gains and losses are allocated daily to each class of shares based on the relative net assets of each class to the total net assets of the Fund. Net investment income, other than class-specific expenses, is allocated daily to each class of shares based upon the ratio of the value of each class’s paid shares to the total value of all paid shares. Each class of shares differs in its distribution plan and certain other class-specific expenses.
The following is a summary of significant accounting policies of the Funds. The policies are in conformity with accounting principles generally accepted in the United States of America (U.S. GAAP). Each Fund is an investment company and follows accounting and reporting guidance in the Financial Accounting Standards Board (FASB) Accounting Standards Codification Topic 946.
A Investment Valuation — The following methodologies are used to determine the market value or fair value of investments.
Debt Obligations. Debt obligations are generally valued on the basis of valuations provided by third party pricing services, as derived from such services’ pricing models. Inputs to the models may include, but are not limited to, reported trades, executable bid and ask prices, broker/dealer quotations, prices or yields of securities with similar characteristics, interest rates, anticipated prepayments, benchmark curves or information pertaining to the issuer, as well as industry and economic events. The pricing services may use a matrix approach, which considers information regarding securities with similar characteristics to determine the valuation for a security. Short-term debt obligations purchased with a remaining maturity of sixty days or less for which a valuation from a third party pricing service is not readily available may be valued at amortized cost, which approximates fair value.
Fair Valuation. Investments for which valuations or market quotations are not readily available or are deemed unreliable are valued at fair value using methods determined in good faith by or at the direction of the Trustees of a Fund in a manner that most fairly reflects the security’s “fair value”, which is the amount that a Fund might reasonably expect to receive for the security upon its current sale in the ordinary course. Each such determination is based on a consideration of relevant factors, which are likely to vary from one pricing context to another. These factors may include, but are not limited to, the type of security, the existence of any contractual restrictions on the security’s disposition, the price and extent of public trading in similar securities of the issuer or of comparable entities, quotations or relevant information obtained from broker/dealers or other market participants, information obtained from the issuer, analysts, and/or the appropriate stock exchange (for exchange-traded securities), an analysis of the entity’s financial statements, and an evaluation of the forces that influence the issuer and the market(s) in which the security is purchased and sold.
B Investment Transactions and Related Income — Investment transactions for financial statement purposes are accounted for on a trade date basis. Realized gains and losses on investments sold are determined on the basis of identified cost. Interest income is recorded on the basis of interest accrued, adjusted for amortization of premium or accretion of discount.
C Federal Taxes — Each Fund’s policy is to comply with the provisions of the Internal Revenue Code applicable to regulated investment companies and to distribute to shareholders each year substantially all of its taxable, if any, and tax-exempt net investment income, and all or substantially all of its net realized capital gains. Accordingly, no provision for federal income or excise tax is necessary. Each Fund intends to satisfy conditions which will enable it to designate distributions from the interest income generated by its investments in non-taxable municipal securities, which are exempt from regular federal income tax when received by each Fund, as exempt-interest dividends. For National Fund, the portion of such interest, if any, earned on private activity bonds issued after August 7, 1986, may be considered a tax preference item to shareholders.
As of September 30, 2020, the Funds had no uncertain tax positions that would require financial statement recognition, de-recognition, or disclosure. Each Fund files a U.S. federal income tax return annually after its fiscal year-end, which is subject to examination by the Internal Revenue Service for a period of three years from the date of filing.
D Expenses — The majority of expenses of the Trusts are directly identifiable to an individual fund. Expenses which are not readily identifiable to a specific fund are allocated taking into consideration, among other things, the nature and type of expense and the relative size of the funds.
E Legal Fees — Legal fees and other related expenses incurred as part of negotiations of the terms and requirement of capital infusions, or that are expected to result in the restructuring of, or a plan of reorganization for, an investment are recorded as realized losses. Ongoing expenditures to protect or enhance an investment are treated as operating expenses.
F Use of Estimates — The preparation of the financial statements in conformity with U.S. GAAP requires management to make estimates and assumptions that affect the reported amounts of assets and liabilities at the date of the financial statements and the reported amounts of income and expense during the reporting period. Actual results could differ from those estimates.
Eaton Vance
Municipal Income Funds
September 30, 2020
Notes to Financial Statements — continued
G Indemnifications — Under each Trust’s organizational documents, its officers and Trustees may be indemnified against certain liabilities and expenses arising out of the performance of their duties to the Funds. Under Massachusetts law, if certain conditions prevail, shareholders of a Massachusetts business trust (such as a Trust) could be deemed to have personal liability for the obligations of the Trust. However, each Trust’s Declaration of Trust contains an express disclaimer of liability on the part of Fund shareholders and the By-laws provide that the Trust shall assume, upon request by the shareholder, the defense on behalf of any Fund shareholders. Moreover, the By-laws also provide for indemnification out of Fund property of any shareholder held personally liable solely by reason of being or having been a shareholder for all loss or expense arising from such liability. Additionally, in the normal course of business, each Fund enters into agreements with service providers that may contain indemnification clauses. Each Fund’s maximum exposure under these arrangements is unknown as this would involve future claims that may be made against each Fund that have not yet occurred.
H Floating Rate Notes Issued in Conjunction with Securities Held — The Funds may invest in residual interest bonds, also referred to as inverse floating rate securities, whereby a Fund may sell a variable or fixed rate bond for cash to a Special-Purpose Vehicle (the SPV), (which is generally organized as a trust), while at the same time, buying a residual interest in the assets and cash flows of the SPV. The bond is deposited into the SPV with the same CUSIP number as the bond sold to the SPV by the Fund, and which may have been, but is not required to be, the bond purchased from the Fund (the Bond). The SPV also issues floating rate notes (Floating Rate Notes) which are sold to third-parties. The residual interest bond held by a Fund gives the Fund the right (1) to cause the holders of the Floating Rate Notes to generally tender their notes at par, and (2) to have the Bond held by the SPV transferred to the Fund, thereby terminating the SPV. Should the Fund exercise such right, it would generally pay the SPV the par amount due on the Floating Rate Notes and exchange the residual interest bond for the underlying Bond. Pursuant to generally accepted accounting principles for transfers and servicing of financial assets and extinguishment of liabilities, the Funds account for the transaction described above as a secured borrowing by including the Bond in their Portfolio of Investments and the Floating Rate Notes as a liability under the caption “Payable for floating rate notes issued” in their Statement of Assets and Liabilities. The Floating Rate Notes have interest rates that generally reset weekly and their holders have the option to tender their notes to the SPV for redemption at par at each reset date. Accordingly, the fair value of the payable for floating rate notes issued approximates its carrying value. If measured at fair value, the payable for floating rate notes would have been considered as Level 2 in the fair value hierarchy (see Note 9) at September 30, 2020. Interest expense related to a Fund’s liability with respect to Floating Rate Notes is recorded as incurred. The SPV may be terminated by the Fund, as noted above, or by the occurrence of certain termination events as defined in the trust agreement, such as a downgrade in the credit quality of the underlying Bond, bankruptcy of or payment failure by the issuer of the underlying Bond, the inability to remarket Floating Rate Notes that have been tendered due to insufficient buyers in the market, or the failure by the SPV to obtain renewal of the liquidity agreement under which liquidity support is provided for the Floating Rate Notes up to one year. At September 30, 2020, the amounts of the Funds’ Floating Rate Notes and related interest rates and collateral were as follows:
| | | | | | | | |
| | | AMT-Free Fund | | | National Fund | |
| | |
Floating Rate Notes Outstanding | | $ | 29,836,363 | | | $ | 104,543,843 | |
| | |
Interest Rate or Range of Interest Rates (%) | | | 0.15 - 0.17 | | | | 0.10 - 0.22 | |
| | |
Collateral for Floating Rate Notes Outstanding | | $ | 47,030,581 | | | $ | 151,951,045 | |
For the year ended September 30, 2020, the Funds’ average settled Floating Rate Notes outstanding and the average interest rate including fees were as follows:
| | | | | | | | |
| | | AMT-Free Fund | | | National Fund | |
| | |
Average Floating Rate Notes Outstanding | | $ | 29,775,000 | | | $ | 108,824,959 | |
| | |
Average Interest Rate | | | 1.50 | % | | | 1.46 | % |
In certain circumstances, the Funds may enter into shortfall and forbearance agreements with brokers by which a Fund agrees to reimburse the broker for the difference between the liquidation value of the Bond held by the SPV and the liquidation value of the Floating Rate Notes, as well as any shortfalls in interest cash flows. The Funds had no shortfalls as of September 30, 2020.
The Funds may also purchase residual interest bonds in a secondary market transaction without first owning the underlying bond. Such transactions are not required to be treated as secured borrowings. Shortfall agreements, if any, related to residual interest bonds purchased in a secondary market transaction are disclosed in the Portfolio of Investments.
The Funds’ investment policies and restrictions expressly permit investments in residual interest bonds. Such bonds typically offer the potential for yields exceeding the yields available on fixed rate bonds with comparable credit quality and maturity. These securities tend to underperform the market for fixed rate bonds in a rising long-term interest rate environment, but tend to outperform the market for fixed rate bonds when long-term interest rates decline. The value and income of residual interest bonds are generally more volatile than that of a fixed rate bond. The Funds’ investment policies do not allow the
Eaton Vance
Municipal Income Funds
September 30, 2020
Notes to Financial Statements — continued
Funds to borrow money except as permitted by the 1940 Act. Management believes that the Funds’ restrictions on borrowing money and issuing senior securities (other than as specifically permitted) do not apply to Floating Rate Notes issued by the SPV and included as a liability in the Funds’ Statement of Assets and Liabilities. As secured indebtedness issued by an SPV, Floating Rate Notes are distinct from the borrowings and senior securities to which the Funds’ restrictions apply. Residual interest bonds held by the Funds are securities exempt from registration under Rule 144A of the Securities Act of 1933.
I When-Issued Securities and Delayed Delivery Transactions — The Funds may purchase or sell securities on a delayed delivery or when-issued basis. Payment and delivery may take place after the customary settlement period for that security. At the time the transaction is negotiated, the price of the security that will be delivered is fixed. The Funds maintain cash and/or security positions for these commitments such that sufficient liquid assets will be available to make payments upon settlement. Securities purchased on a delayed delivery or when-issued basis are marked-to-market daily and begin earning interest on settlement date. Losses may arise due to changes in the market value of the underlying securities or if the counterparty does not perform under the contract.
2 Distributions to Shareholders and Income Tax Information
The net investment income of each Fund is determined daily and substantially all of the net investment income so determined is declared as a dividend to shareholders of record at the time of declaration. Distributions are declared separately for each class of shares. Distributions are paid monthly. Distributions of realized capital gains are made at least annually. Shareholders may reinvest income and capital gain distributions in additional shares of the same class of a Fund at the net asset value as of the reinvestment date or, at the election of the shareholder, receive distributions in cash. Distributions to shareholders are determined in accordance with income tax regulations, which may differ from U.S. GAAP. As required by U.S. GAAP, only distributions in excess of tax basis earnings and profits are reported in the financial statements as a return of capital. Permanent differences between book and tax accounting relating to distributions are reclassified to paid-in capital. For tax purposes, distributions from short-term capital gains are considered to be from ordinary income.
The tax character of distributions declared for the years ended September 30, 2020 and September 30, 2019 was as follows:
| | | | | | | | | | | | | | | | |
| | | AMT-Free Fund | | | National Fund | |
| | | Year Ended September 30, | | | Year Ended September 30, | |
| | | 2020 | | | 2019 | | | 2020 | | | 2019 | |
| | | | |
Tax-exempt income | | $ | 10,435,763 | | | $ | 10,804,193 | | | $ | 88,786,223 | | | $ | 85,494,039 | |
| | | | |
Ordinary income | | $ | 757 | | | $ | 76,376 | | | $ | 4,932,347 | | | $ | 4,944,533 | |
As of September 30, 2020, the components of distributable earnings (accumulated loss) on a tax basis were as follows:
| | | | | | | | |
| | | AMT-Free
Fund | | | National Fund | |
| | |
Undistributed tax-exempt income | | $ | 1,235,291 | | | $ | 5,256,119 | |
| | |
Deferred capital losses | | $ | (28,640,391 | ) | | $ | (166,281,868 | ) |
| | |
Net unrealized appreciation | | $ | 26,159,481 | | | $ | 198,922,269 | |
| | |
Distributions payable | | $ | (124,202 | ) | | $ | (1,275,089 | ) |
At September 30, 2020, the following Funds, for federal income tax purposes, had deferred capital losses which would reduce the respective Fund’s taxable income arising from future net realized gains on investment transactions, if any, to the extent permitted by the Internal Revenue Code, and thus would reduce the amount of distributions to shareholders, which would otherwise be necessary to relieve the Funds of any liability for federal income or excise tax. The deferred capital losses are treated as arising on the first day of a Fund’s next taxable year and retain the same short-term or long-term character as when originally deferred. The amounts of the deferred capital losses are as follows:
| | | | | | | | |
| | | AMT-Free
Fund | | | National Fund | |
| | |
Deferred capital losses: | | | | | | | | |
| | |
Short-term | | $ | 15,794,902 | | | $ | 111,957,326 | |
| | |
Long-term | | $ | 12,845,489 | | | $ | 54,324,542 | |
Eaton Vance
Municipal Income Funds
September 30, 2020
Notes to Financial Statements — continued
The cost and unrealized appreciation (depreciation) of investments of each Fund at September 30, 2020, as determined on a federal income tax basis, were as follows:
| | | | | | | | |
| | | AMT-Free Fund | | | National Fund | |
| | |
Aggregate cost | | $ | 311,169,986 | | | $ | 3,397,966,601 | |
| | |
Gross unrealized appreciation | | $ | 28,084,171 | | | $ | 220,783,592 | |
| | |
Gross unrealized depreciation | | | (1,924,690 | ) | | | (21,861,323 | ) |
| | |
Net unrealized appreciation | | $ | 26,159,481 | | | $ | 198,922,269 | |
3 Investment Adviser Fee and Other Transactions with Affiliates
The investment adviser fee is earned by Eaton Vance Management (EVM), a wholly-owned subsidiary of Eaton Vance Corp., for AMT-Free Fund and Boston Management and Research (BMR), a subsidiary of EVM and an indirect subsidiary of Eaton Vance Corp., for National Fund as compensation for management and investment advisory services rendered to each Fund. The fee is based upon a percentage of average daily net assets plus a percentage of gross income (i.e., income other than gains from the sale of securities) as presented in the following table and is payable monthly.
| | | | | | | | |
| Daily Net Assets | | Annual Asset
Rate | | | Daily Income
Rate | |
| | |
Up to $500 million | | | 0.300 | % | | | 3.00 | % |
| | |
$500 million but less than $1 billion | | | 0.275 | | | | 2.75 | |
| | |
$1 billion but less than $1.5 billion | | | 0.250 | | | | 2.50 | |
| | |
$1.5 billion but less than $2 billion | | | 0.225 | | | | 2.25 | |
| | |
$2 billion but less than $3 billion | | | 0.200 | | | | 2.00 | |
| | |
$3 billion and over | | | 0.175 | | | | 1.75 | |
For the year ended September 30, 2020, investment adviser fees incurred by the Funds and the effective annual rates, as a percentage of average daily net assets, were as follows:
| | | | | | | | |
| | | AMT-Free
Fund | | | National Fund | |
| | |
Investment Adviser Fee | | $ | 1,359,467 | | | $ | 10,209,281 | |
| | |
Effective Annual Rate | | | 0.41 | % | | | 0.31 | % |
EVM serves as the administrator of each Fund, but receives no compensation. EVM provides sub-transfer agency and related services to the Funds pursuant to a Sub-Transfer Agency Support Services Agreement. Eaton Vance Distributors, Inc. (EVD), an affiliate of EVM and the Funds’ principal underwriter, received a portion of the sales charge on sales of Class A shares of the Funds. EVD also received distribution and service fees from Class A and Class C shares (see Note 4) and contingent deferred sales charges (see Note 5). Sub-transfer agent fees earned by EVM, which are included in transfer and dividend disbursing agent fees on the Statements of Operations, and Class A sales charges that the Funds were informed were received by EVD for the year ended September 30, 2020 were as follows:
| | | | | | | | |
| | | AMT-Free
Fund | | | National
Fund | |
| | |
EVM’s Sub-Transfer Agent Fees | | $ | 11,077 | | | $ | 128,978 | |
| | |
EVD’s Class A Sales Charges | | $ | 13,353 | | | $ | 139,301 | |
Eaton Vance
Municipal Income Funds
September 30, 2020
Notes to Financial Statements — continued
Trustees and officers of the Funds who are members of EVM’s or BMR’s organizations receive remuneration for their services to the Funds out of the investment adviser fee. Trustees of the Funds who are not affiliated with the investment advisers may elect to defer receipt of all or a percentage of their annual fees in accordance with the terms of the Trustees Deferred Compensation Plan. For the year ended September 30, 2020, no significant amounts have been deferred. Certain officers and Trustees of the Funds are officers of the above organizations.
4 Distribution Plans
Each Fund has in effect a distribution plan for Class A shares (Class A Plan) pursuant to Rule 12b-1 under the 1940 Act. Pursuant to the Class A Plan, each Fund pays EVD a distribution and service fee of 0.25% per annum of its average daily net assets attributable to Class A shares for distribution services and facilities provided to each Fund by EVD, as well as for personal services and/or the maintenance of shareholder accounts. Distribution and service fees paid or accrued to EVD for the year ended September 30, 2020 for Class A shares amounted to the following:
| | | | | | | | |
| | | AMT-Free Fund | | | National Fund | |
| | |
Class A Distribution and Service Fees | | $ | 378,484 | | | $ | 3,984,013 | |
Each Fund also has in effect a distribution plan for Class C shares (Class C Plan) pursuant to Rule 12b-1 under the 1940 Act. Pursuant to the Class C Plan, each Fund pays EVD amounts equal to 0.75% per annum of its average daily net assets attributable to Class C shares for providing ongoing distribution services and facilities to the respective Funds. For the year ended September 30, 2020, the Funds paid or accrued to EVD the following distribution fees:
| | | | | | | | |
| | | AMT-Free Fund | | | National Fund | |
| | |
Class C Distribution Fees | | $ | 134,677 | | | $ | 1,174,026 | |
The Class C Plan also authorizes each Fund to make payments of service fees to EVD, financial intermediaries and other persons in amounts equal to 0.25% per annum of the average daily net assets attributable to Class C shares. Service fees paid or accrued are for personal services and/or the maintenance of shareholder accounts. They are separate and distinct from the Class C sales commissions and distribution fees payable to EVD. Service fees paid or accrued for the year ended September 30, 2020 amounted to the following:
| | | | | | | | |
| | | AMT-Free
Fund | | | National
Fund | |
| | |
Class C Service Fees | | $ | 44,892 | | | $ | 391,342 | |
Distribution and service fees are subject to the limitations contained in the Financial Industry Regulatory Authority Rule 2341(d).
5 Contingent Deferred Sales Charges
A contingent deferred sales charge (CDSC) of 1% generally is imposed on redemptions of Class C shares made within 12 months of purchase. Class A shares may be subject to a 1% CDSC if redeemed within 18 months of purchase (depending on the circumstances of purchase). Generally, the CDSC is based upon the lower of the net asset value at date of redemption or date of purchase. No charge is levied on shares acquired by reinvestment of dividends or capital gain distributions. For the year ended September 30, 2020, the Funds were informed that EVD received approximately the following amounts of CDSCs paid by Class A and Class C shareholders:
| | | | | | | | |
| | | AMT-Free
Fund | | | National
Fund | |
| | |
Class A | | $ | 20 | | | $ | 39,000 | |
| | |
Class C | | $ | 50 | | | $ | 17,000 | |
Eaton Vance
Municipal Income Funds
September 30, 2020
Notes to Financial Statements — continued
6 Purchases and Sales of Investments
Purchases and sales of investments, other than short-term obligations, for the year ended September 30, 2020 were as follows:
| | | | | | | | |
| | | AMT-Free Fund | | | National Fund | |
| | |
Purchases | | $ | 229,929,930 | | | $ | 3,953,494,024 | |
| | |
Sales | | $ | 200,725,498 | | | $ | 3,527,497,499 | |
7 Shares of Beneficial Interest
Each Fund’s Declaration of Trust permits the Trustees to issue an unlimited number of full and fractional shares of beneficial interest (without par value). Such shares may be issued in a number of different series (such as the Funds) and classes. Transactions in Fund shares were as follows:
| | | | | | | | | | | | | | | | |
AMT-Free Fund | | | | | | | | | | | | |
| | | | | | Year Ended September 30, 2020 | |
| | | | | | Class A | | | Class C | | | Class I | |
| | | | |
Sales | | | | | | | 2,489,112 | | | | 286,876 | | | | 14,620,548 | |
| | | | |
Issued to shareholders electing to receive payments of distributions in Fund shares | | | | | | | 446,020 | | | | 38,242 | | | | 394,814 | |
| | | | |
Redemptions | | | | | | | (2,260,135 | ) | | | (657,145 | ) | | | (12,811,555 | ) |
| | | | |
Converted from Class C shares | | | | | | | 169,973 | | | | — | | | | — | |
| | | | |
Converted to Class A shares | | | | | | | — | | | | (170,955 | ) | | | — | |
| | | | |
Net increase (decrease) | | | | | | | 844,970 | | | | (502,982 | ) | | | 2,203,807 | |
| | |
| | | | | | Year Ended September 30, 2019 | |
| | | | | | Class A | | | Class C | | | Class I | |
| | | | |
Sales | | | | | | | 1,899,582 | | | | 386,747 | | | | 3,849,738 | |
| | | | |
Issued to shareholders electing to receive payments of distributions in Fund shares | | | | | | | 507,029 | | | | 62,385 | | | | 371,109 | |
| | | | |
Redemptions | | | | | | | (3,048,646 | ) | | | (790,414 | ) | | | (3,453,702 | ) |
| | | | |
Converted from Class C shares | | | | | | | 1,200,770 | | | | — | | | | — | |
| | | | |
Converted to Class A shares | | | | | | | — | | | | (1,206,708 | ) | | | — | |
| | | | |
Net increase (decrease) | | | | | | | 558,735 | | | | (1,547,990 | ) | | | 767,145 | |
| | | | |
National Fund | | | | | | | | | | | | |
| | | Year Ended September 30, 2020 | |
| | | Class A | | | Class B | | | Class C | | | Class I | |
| | | | |
Sales | | | 18,938,747 | | | | — | | | | 2,768,098 | | | | 102,367,062 | |
| | | | |
Issued to shareholders electing to receive payments of distributions in Fund shares | | | 3,734,240 | | | | — | | | | 262,024 | | | | 3,801,170 | |
| | | | |
Redemptions | | | (25,343,714 | ) | | | — | | | | (4,575,561 | ) | | | (63,630,096 | ) |
| | | | |
Converted from Class C shares | | | 2,628,910 | | | | — | | | | — | | | | — | |
| | | | |
Converted to Class A shares | | | — | | | | — | | | | (2,628,854 | ) | | | — | |
| | | | |
Net increase (decrease) | | | (41,817 | ) | | | — | | | | (4,174,293 | ) | | | 42,538,136 | |
Eaton Vance
Municipal Income Funds
September 30, 2020
Notes to Financial Statements — continued
| | | | | | | | | | | | | | | | |
| | | Year Ended September 30, 2019 | |
| | | Class A | | | Class B(1) | | | Class C | | | Class I | |
| | | | |
Sales | | | 13,405,753 | | | | 1,628 | | | | 2,854,164 | | | | 79,852,684 | |
| | | | |
Issued to shareholders electing to receive payments of distributions in Fund shares | | | 4,222,148 | | | | 2,056 | | | | 524,297 | | | | 2,955,582 | |
| | | | |
Redemptions | | | (23,904,165 | ) | | | (42,058 | ) | | | (6,560,819 | ) | | | (28,172,127 | ) |
| | | | |
Converted from Class B shares | | | 165,069 | | | | — | | | | — | | | | — | |
| | | | |
Converted from Class C shares | | | 17,419,337 | | | | — | | | | — | | | | — | |
| | | | |
Converted to Class A shares | | | — | | | | (165,036 | ) | | | (17,422,262 | ) | | | — | |
| | | | |
Net increase (decrease) | | | 11,308,142 | | | | (203,410 | ) | | | (20,604,620 | ) | | | 54,636,139 | |
| (1) | At the close of business on August 15, 2019, Class B shares of National Fund were converted into Class A and Class B was terminated. |
8 Line of Credit
The Funds participate with other portfolios and funds managed by EVM and its affiliates in an $800 million unsecured line of credit agreement with a group of banks, which is in effect through October 27, 2020. In connection with the renewal of the agreement on October 29, 2019, funds managed by Calvert Research and Management, an affiliate of EVM, were added as participating funds to the agreement and the borrowing limit was increased from $625 million. Borrowings are made by the Funds solely for temporary purposes related to redemptions and other short-term cash needs. Interest is charged to each Fund based on its borrowings at an amount above either the Eurodollar rate or Federal Funds rate. In addition, a fee computed at an annual rate of 0.15% on the daily unused portion of the line of credit is allocated among the participating portfolios and funds at the end of each quarter. Because the line of credit is not available exclusively to the Funds, a Fund may be unable to borrow some or all of its requested amounts at any particular time. The Funds did not have any significant borrowings or allocated fees during the year ended September 30, 2020.
Effective October 27, 2020, the Funds renewed their line of credit agreement, which expires October 26, 2021, at substantially the same terms.
9 Fair Value Measurements
Under generally accepted accounting principles for fair value measurements, a three-tier hierarchy to prioritize the assumptions, referred to as inputs, is used in valuation techniques to measure fair value. The three-tier hierarchy of inputs is summarized in the three broad levels listed below.
| • | | Level 1 – quoted prices in active markets for identical investments |
| • | | Level 2 – other significant observable inputs (including quoted prices for similar investments, interest rates, prepayment speeds, credit risk, etc.) |
| • | | Level 3 – significant unobservable inputs (including a fund’s own assumptions in determining the fair value of investments) |
In cases where the inputs used to measure fair value fall in different levels of the fair value hierarchy, the level disclosed is determined based on the lowest level input that is significant to the fair value measurement in its entirety. The inputs or methodology used for valuing securities are not necessarily an indication of the risk associated with investing in those securities.
At September 30, 2020, the hierarchy of inputs used in valuing the Funds’ investments, which are carried at value, were as follows:
| | | | | | | | | | | | | | | | |
AMT-Free Fund | |
| Asset Description | | Level 1 | | | Level 2 | | | Level 3 | | | Total | |
| | | | |
Tax-Exempt Investments | | $ | — | | | $ | 367,165,830 | | | $ | — | | | $ | 367,165,830 | |
| | | | |
Total Investments | | $ | — | | | $ | 367,165,830 | | | $ | — | | | $ | 367,165,830 | |
Eaton Vance
Municipal Income Funds
September 30, 2020
Notes to Financial Statements — continued
| | | | | | | | | | | | | | | | |
National Fund | |
| Asset Description | | Level 1 | | | Level 2 | | | Level 3 | | | Total | |
| | | | |
Tax-Exempt Municipal Securities | | $ | — | | | $ | 3,433,777,105 | | | $ | — | | | $ | 3,433,777,105 | |
| | | | |
Taxable Municipal Securities | | | — | | | | 267,655,608 | | | | — | | | | 267,655,608 | |
| | | | |
Total Investments | | $ | — | | | $ | 3,701,432,713 | | | $ | — | | | $ | 3,701,432,713 | |
10 Risks and Uncertainties
Pandemic Risk
An outbreak of respiratory disease caused by a novel coronavirus was first detected in China in December 2019 and subsequently spread internationally. This coronavirus has resulted in closing borders, enhanced health screenings, changes to healthcare service preparation and delivery, quarantines, cancellations, disruptions to supply chains and customer activity, as well as general concern and uncertainty. Health crises caused by outbreaks, such as the coronavirus outbreak, may exacerbate other pre-existing political, social and economic risks and disrupt normal market conditions and operations. The impact of this outbreak has negatively affected the worldwide economy, the economies of individual countries, individual companies, and the market in general, and may continue to do so in significant and unforeseen ways, as may other epidemics and pandemics that may arise in the future. Any such impact could adversely affect the Funds’ performance, or the performance of the securities in which the Funds invest.
11 Subsequent Event
On October 8, 2020, Morgan Stanley and Eaton Vance Corp. (“Eaton Vance”) announced that they had entered into a definitive agreement under which Morgan Stanley would acquire Eaton Vance. Under the Investment Company Act of 1940, as amended, consummation of this transaction may result in the automatic termination of each Fund’s investment advisory agreement, and any related sub-advisory agreement(s), if applicable. Thus, each Fund’s Board will be asked to approve a new investment advisory agreement (and new sub-advisory agreement(s), if applicable). If approved by each Fund’s Board, the new investment advisory agreement (and new sub-advisory agreement(s), if applicable) is expected to be presented to Fund shareholders for approval, and, if approved, would take effect upon the closing of the transaction.
Eaton Vance
AMT-Free Municipal Income Fund
September 30, 2020
Report of Independent Registered Public Accounting Firm
To the Trustees of Eaton Vance Mutual Funds Trust and Shareholders of Eaton Vance AMT-Free Municipal Income Fund:
Opinion on the Financial Statements and Financial Highlights
We have audited the accompanying statement of assets and liabilities of Eaton Vance AMT-Free Municipal Income Fund (the “Fund”) (one of the funds constituting Eaton Vance Mutual Funds Trust), including the portfolio of investments, as of September 30, 2020, the related statement of operations for the year then ended, the statements of changes in net assets for each of the two years in the period then ended, the financial highlights for each of the five years in the period then ended, and the related notes. In our opinion, the financial statements and financial highlights present fairly, in all material respects, the financial position of the Fund as of September 30, 2020, and the results of its operations for the year then ended, the changes in its net assets for each of the two years in the period then ended, and the financial highlights for each of the five years in the period then ended, in conformity with accounting principles generally accepted in the United States of America.
Basis for Opinion
These financial statements and financial highlights are the responsibility of the Fund’s management. Our responsibility is to express an opinion on the Fund’s financial statements and financial highlights based on our audits. We are a public accounting firm registered with the Public Company Accounting Oversight Board (United States) (PCAOB) and are required to be independent with respect to the Fund in accordance with the U.S. federal securities laws and the applicable rules and regulations of the Securities and Exchange Commission and the PCAOB.
We conducted our audits in accordance with the standards of the PCAOB. Those standards require that we plan and perform the audit to obtain reasonable assurance about whether the financial statements and financial highlights are free of material misstatement, whether due to error or fraud. The Fund is not required to have, nor were we engaged to perform, an audit of its internal control over financial reporting. As part of our audits we are required to obtain an understanding of internal control over financial reporting but not for the purpose of expressing an opinion on the effectiveness of the Fund’s internal control over financial reporting. Accordingly, we express no such opinion.
Our audits included performing procedures to assess the risks of material misstatement of the financial statements and financial highlights, whether due to error or fraud, and performing procedures that respond to those risks. Such procedures included examining, on a test basis, evidence regarding the amounts and disclosures in the financial statements and financial highlights. Our audits also included evaluating the accounting principles used and significant estimates made by management, as well as evaluating the overall presentation of the financial statements and financial highlights. Our procedures included confirmation of securities owned as of September 30, 2020, by correspondence with the custodian and brokers; when replies were not received from brokers, we performed other auditing procedures. We believe that our audits provide a reasonable basis for our opinion.
/s/ Deloitte & Touche LLP
Boston, Massachusetts
November 19, 2020
We have served as the auditor of one or more Eaton Vance investment companies since 1959.
Eaton Vance
National Municipal Income Fund
September 30, 2020
Report of Independent Registered Public Accounting Firm
To the Trustees of Eaton Vance Municipals Trust and Shareholders of Eaton Vance National Municipal Income Fund:
Opinion on the Financial Statements and Financial Highlights
We have audited the accompanying statement of assets and liabilities of Eaton Vance National Municipal Income Fund (the “Fund”) (one of the funds constituting Eaton Vance Municipals Trust), including the portfolio of investments, as of September 30, 2020, the related statement of operations for the year then ended, the statements of changes in net assets for each of the two years in the period then ended, the financial highlights for each of the five years in the period then ended, and the related notes. In our opinion, the financial statements and financial highlights present fairly, in all material respects, the financial position of the Fund as of September 30, 2020, and the results of its operations for the year then ended, the changes in its net assets for each of the two years in the period then ended, and the financial highlights for each of the five years in the period then ended, in conformity with accounting principles generally accepted in the United States of America.
Basis for Opinion
These financial statements and financial highlights are the responsibility of the Fund’s management. Our responsibility is to express an opinion on the Fund’s financial statements and financial highlights based on our audits. We are a public accounting firm registered with the Public Company Accounting Oversight Board (United States) (PCAOB) and are required to be independent with respect to the Fund in accordance with the U.S. federal securities laws and the applicable rules and regulations of the Securities and Exchange Commission and the PCAOB.
We conducted our audits in accordance with the standards of the PCAOB. Those standards require that we plan and perform the audit to obtain reasonable assurance about whether the financial statements and financial highlights are free of material misstatement, whether due to error or fraud. The Fund is not required to have, nor were we engaged to perform, an audit of its internal control over financial reporting. As part of our audits we are required to obtain an understanding of internal control over financial reporting but not for the purpose of expressing an opinion on the effectiveness of the Fund’s internal control over financial reporting. Accordingly, we express no such opinion.
Our audits included performing procedures to assess the risks of material misstatement of the financial statements and financial highlights, whether due to error or fraud, and performing procedures that respond to those risks. Such procedures included examining, on a test basis, evidence regarding the amounts and disclosures in the financial statements and financial highlights. Our audits also included evaluating the accounting principles used and significant estimates made by management, as well as evaluating the overall presentation of the financial statements and financial highlights. Our procedures included confirmation of securities owned as of September 30, 2020, by correspondence with the custodian and brokers; when replies were not received from brokers, we performed other auditing procedures. We believe that our audits provide a reasonable basis for our opinion.
/s/ Deloitte & Touche LLP
Boston, Massachusetts
November 19, 2020
We have served as the auditor of one or more Eaton Vance investment companies since 1959.
Eaton Vance
Municipal Income Funds
September 30, 2020
Federal Tax Information (Unaudited)
The Form 1099-DIV you receive in February 2021 will show the tax status of all distributions paid to your account in calendar year 2020. Shareholders are advised to consult their own tax adviser with respect to the tax consequences of their investment in the Funds. As required by the Internal Revenue Code and/or regulations, shareholders must be notified regarding exempt-interest dividends.
Exempt-Interest Dividends. For the fiscal year ended September 30, 2020, the Funds designate the following percentages of distributions from net investment income as exempt-interest dividends:
| | | | |
| |
AMT-Free Municipal Income Fund | | | 99.99 | % |
| |
National Municipal Income Fund | | | 94.74 | % |
Eaton Vance
Municipal Income Funds
September 30, 2020
Board of Trustees’ Contract Approval
Overview of the Contract Review Process
The Investment Company Act of 1940, as amended (the “1940 Act”), provides, in substance, that the investment advisory agreement between a fund and its investment adviser will continue in effect from year-to-year only if its continuation is approved on an annual basis by a vote of the fund’s board of trustees, including a majority of the trustees who are not “interested persons” of the fund (“independent trustees”), cast in person at a meeting called for the purpose of considering such approval.
At a meeting held on April 22, 2020 (the “April 2020 Meeting”), the Boards of Trustees/Directors comprised of the same individuals (collectively, the “Board”) that oversees a majority of the registered investment companies advised by Eaton Vance Management or its affiliate, Boston Management and Research (the “Eaton Vance Funds”), including a majority of the independent trustees (the “Independent Trustees”), voted to approve the continuation of existing investment advisory agreements and sub-advisory agreements(1) for each of the Eaton Vance Funds for an additional one-year period. The Board relied upon the affirmative recommendation of its Contract Review Committee, which is a committee exclusively comprised of Independent Trustees. Prior to making its recommendation, the Contract Review Committee reviewed information furnished by the adviser and sub-adviser to each of the Eaton Vance Funds (including information specifically requested by the Board) for a series of formal meetings held between February and April 2020. Members of the Contract Review Committee also considered information received at prior meetings of the Board and its committees, to the extent such information was relevant to the Contract Review Committee’s annual evaluation of the investment advisory agreements and sub-advisory agreements.
In connection with its evaluation of the investment advisory agreements and sub-advisory agreements, the Board considered various information relating to the Eaton Vance Funds. This included information applicable to all or groups of Eaton Vance Funds, which is referenced immediately below, and information applicable to the particular Eaton Vance Fund covered by this report (additional fund-specific information is referenced below under “Results of the Contract Review Process”). (For funds that invest through one or more underlying portfolios, references to “each fund” in this section may include information that was considered at the portfolio-level.)
Information about Fees, Performance and Expenses
| | • | | A report from an independent data provider comparing advisory and other fees paid by each fund to such fees paid by comparable funds, as identified by the independent data provider (“comparable funds”); |
| | • | | A report from an independent data provider comparing each fund’s total expense ratio (and its components) to those of comparable funds; |
| | • | | A report from an independent data provider comparing the investment performance of each fund (including, as relevant, total return data, income data, Sharpe ratios and information ratios) to the investment performance of comparable funds and, as applicable, benchmark indices, over various time periods; |
| | • | | In certain instances, data regarding investment performance relative to customized groups of peer funds and blended indices identified by the adviser in consultation with the Portfolio Management Committee of the Board; |
| | • | | Comparative information concerning the fees charged and services provided by the adviser and sub-adviser to each fund in managing other accounts (which may include other mutual funds, collective investment funds and institutional accounts) using investment strategies and techniques similar to those used in managing such fund(s), if any; |
| | • | | Profitability analyses with respect to the adviser and sub-adviser to each of the funds; |
Information about Portfolio Management and Trading
| | • | | Descriptions of the investment management services provided to each fund, as well as each of the funds’ investment strategies and policies; |
| | • | | The procedures and processes used to determine the fair value of fund assets, when necessary, and actions taken to monitor and test the effectiveness of such procedures and processes; |
| | • | | Information about the policies and practices of each fund’s adviser and sub-adviser (in the context of a sub-adviser, only those with trading responsibilities) with respect to trading, including their processes for seeking best execution of portfolio transactions; |
| | • | | Information about the allocation of brokerage transactions and the benefits, if any, received by the adviser and sub-adviser (in the context of a sub-adviser, only those with trading responsibilities) to each fund as a result of brokerage allocation, including, as applicable, information concerning the acquisition of research through client commission arrangements and policies with respect to “soft dollars”; |
| | • | | Data relating to the portfolio turnover rate of each fund; |
Information about each Adviser and Sub-adviser
| | • | | Reports detailing the financial results and condition of the adviser and sub-adviser to each fund; |
| | • | | Information regarding the individual investment professionals whose responsibilities include portfolio management and investment research for the funds, and, for portfolio managers and certain other investment professionals, information relating to their responsibilities with respect to managing other mutual funds and investment accounts, as applicable; |
| (1) | Not all Eaton Vance Funds have entered into a sub-advisory agreement with a sub-adviser. Accordingly, references to “sub-adviser” or “sub-advisory agreement” in this “Overview” section may not be applicable to the particular Eaton Vance Fund covered by this report. |
Eaton Vance
Municipal Income Funds
September 30, 2020
Board of Trustees’ Contract Approval — continued
| | • | | The Code of Ethics of the adviser and its affiliates and the sub-adviser of each fund, together with information relating to compliance with, and the administration of, such codes; |
| | • | | Policies and procedures relating to proxy voting and the handling of corporate actions and class actions; |
| | • | | Information concerning the resources devoted to compliance efforts undertaken by the adviser and its affiliates and the sub-adviser of each fund, if any, including descriptions of their various compliance programs and their record of compliance; |
| | • | | Information concerning the business continuity and disaster recovery plans of the adviser and its affiliates and the sub-adviser of each fund, if any; |
| | • | | A description of Eaton Vance Management’s and Boston Management and Research’s oversight of sub-advisers, including with respect to regulatory and compliance issues, investment management and other matters; |
Other Relevant Information
| | • | | Information concerning the nature, cost and character of the administrative and other non-investment advisory services provided by Eaton Vance Management and its affiliates; |
| | • | | Information concerning oversight of the relationship with the custodian, subcustodians and fund accountants by the adviser and/or administrator to each of the funds; |
| | • | | For an Eaton Vance Fund structured as an exchange-listed closed-end fund, information concerning the benefits of the closed-end fund structure, as well as, where relevant, the closed-end fund’s market prices, trading volume data, distribution rates and other relevant matters; and |
| | • | | The terms of each investment advisory agreement and sub-advisory agreement. |
During the various meetings of the Board and its committees throughout the twelve months ended April 2020, the Trustees received information from portfolio managers and other investment professionals of the advisers and sub-advisers of the funds regarding investment and performance matters, and considered various investment and trading strategies used in pursuing the funds’ investment objectives. The Trustees also received information regarding risk management techniques employed in connection with the management of the funds. The Board and its committees evaluated issues pertaining to industry and regulatory developments, compliance procedures, fund governance and other issues with respect to the funds, and received and participated in reports and presentations provided by Eaton Vance Management, Boston Management and Research and fund sub-advisers, with respect to such matters. In addition to the formal meetings of the Board and its committees, the Independent Trustees held regular teleconferences to discuss, among other topics, matters relating to the continuation of investment advisory agreements and sub-advisory agreements.
The Contract Review Committee was advised throughout the contract review process by Goodwin Procter LLP, independent legal counsel for the Independent Trustees. The members of the Contract Review Committee, with the advice of such counsel, exercised their own business judgment in determining the material factors to be considered in evaluating each investment advisory agreement and sub-advisory agreement and the weight to be given to each such factor. The conclusions reached with respect to each investment advisory agreement and sub-advisory agreement were based on a comprehensive evaluation of all the information provided and not any single factor. Moreover, each member of the Contract Review Committee may have placed varying emphasis on particular factors in reaching conclusions with respect to each investment advisory agreement and sub-advisory agreement. In evaluating each investment advisory agreement and sub-advisory agreement, including the fee structures and other terms contained in such agreements, the members of the Contract Review Committee were also informed by multiple years of analysis and discussion with the adviser and sub-adviser to each of the Eaton Vance Funds.
In voting its approval of the continuation of existing investment advisory agreements and sub-advisory agreements at the April 2020 Meeting, the Board relied on an order issued by the Securities and Exchange Commission on March 25, 2020, which provided temporary relief from the in-person voting requirements under Section 15 of the 1940 Act in response to the impacts of the COVID-19 pandemic.
Results of the Contract Review Process
Based on its consideration of the foregoing, and such other information it deemed relevant, including the factors and conclusions described below, the Contract Review Committee concluded that (i) the continuation of the investment advisory agreement between Eaton Vance AMT-Free Municipal Income Fund (the “AMT-Free Muni Income Fund”) and Eaton Vance Management (“EVM”) and (ii) the continuation of the investment advisory agreement between Eaton Vance National Municipal Income Fund (the “National Muni Income Fund”, together with the AMT-Free Muni Income Fund, the “Funds” and each, a “Fund”) and Boston Management and Research (“BMR”) (EVM, with respect to the AMT-Free Muni Income Fund, and BMR, with respect to the National Muni Income Fund, are each referred to herein as the “Adviser”), including their respective fee structures, are in the interests of shareholders and, therefore, recommended to the Board approval of each agreement. Based on the recommendation of the Contract Review Committee, the Board, including a majority of the Independent Trustees, voted to approve continuation of the investment advisory agreement for each Fund.
Nature, Extent and Quality of Services
In considering whether to approve the investment advisory agreement for each Fund, the Board evaluated the nature, extent and quality of services provided to the Funds by the applicable Adviser.
Eaton Vance
Municipal Income Funds
September 30, 2020
Board of Trustees’ Contract Approval — continued
The Board considered each Adviser’s management capabilities and investment processes in light of the types of investments held by each Fund, respectively, including the education, experience and number of investment professionals and other personnel who provide portfolio management, investment research, and similar services to the Funds. In particular, the Board considered, where relevant, the abilities and experience of each Adviser’s investment professionals in analyzing factors such as credit risk, tax efficiency, and special considerations relevant to investing in municipal obligations. The Board considered each Adviser’s municipal bond team, which includes investment professionals and credit specialists who provide services to the applicable Fund. The Board also took into account the resources dedicated to portfolio management and other services, the compensation methods of each Adviser and other factors, including the reputation and resources of the Adviser to recruit and retain highly qualified research, advisory and supervisory investment professionals. In addition, the Board considered the time and attention devoted to the Eaton Vance Funds, including each Fund, by senior management, as well as the infrastructure, operational capabilities and support staff in place to assist in the portfolio management and operations of the Funds, including the provision of administrative services. The Board also considered the business-related and other risks to which the Advisers or its affiliates may be subject in managing the Funds.
The Board considered the compliance programs of each Adviser and relevant affiliates thereof. The Board considered compliance and reporting matters regarding, among other things, personal trading by investment professionals, disclosure of portfolio holdings, late trading, frequent trading, portfolio valuation, business continuity and the allocation of investment opportunities. The Board also considered the responses of each Adviser and its affiliates to requests in recent years from regulatory authorities, such as the Securities and Exchange Commission and the Financial Industry Regulatory Authority.
The Board considered other administrative services provided or overseen by Eaton Vance Management and its affiliates, including transfer agency and accounting services. The Board evaluated the benefits to shareholders of investing in a fund that is a part of a large fund complex offering exposure to a variety of asset classes and investment disciplines, as well as the ability, in many cases, to exchange an investment among different funds without incurring additional sales charges.
After consideration of the foregoing factors, among others, the Board concluded that the nature, extent and quality of services provided by each Adviser, taken as a whole, are appropriate and consistent with the terms of the applicable investment advisory agreement.
Fund Performance
The Board compared each Fund’s investment performance to that of comparable funds identified by an independent data provider (the peer group), as well as an appropriate benchmark index, and assessed each Fund’s performance on the basis of total return and current income return. The Board’s review included comparative performance data with respect to each Fund for the one-, three-, five- and ten-year periods ended September 30, 2019.
In this regard, the Board noted each Fund’s performance relative to its peer group and benchmark index for the three-year period, as follows:
| | | | |
| Fund | | Performance Relative to: |
| | Median of Peer Group | | Benchmark Index |
| | |
Eaton Vance AMT-Free Municipal Income Fund | | Consistent with | | Lower |
| | |
Eaton Vance National Municipal Income Fund | | Higher | | Higher |
The Board considered, among other things, each Adviser’s efforts to generate competitive levels of tax-exempt current income over time through investments that, relative to comparable funds, focus on higher quality municipal bonds with longer maturities. The Board concluded that the performance of each Fund was satisfactory.
Management Fees and Expenses
The Board considered contractual fee rates payable by each Fund for advisory and administrative services (referred to collectively as “management fees”). As part of its review, the Board considered each Fund’s management fees and total expense ratio for the one-year period ended September 30, 2019, as compared to those of comparable funds, before and after giving effect to any undertaking to waive fees or reimburse expenses. The Board also considered factors that had an impact on each Fund’s total expense ratio relative to comparable funds.
After considering the foregoing information, and in light of the nature, extent and quality of the services provided by each Adviser, the Board concluded that the management fees charged for advisory and related services are reasonable.
Profitability and “Fall-Out” Benefits
The Board considered the level of profits realized by each Adviser and relevant affiliates thereof in providing investment advisory and administrative services to each Fund and to all Eaton Vance Funds as a group. The Board considered the level of profits realized without regard to marketing support or other payments by each Adviser and its affiliates to third parties in respect of distribution or other services.
Eaton Vance
Municipal Income Funds
September 30, 2020
Board of Trustees’ Contract Approval — continued
The Board concluded that, in light of the foregoing factors and the nature, extent and quality of the services rendered, the profits realized by each Adviser and its affiliates are deemed not to be excessive.
The Board also considered direct or indirect fall-out benefits received by each Adviser and its affiliates in connection with their respective relationships with the Funds, including the benefits of research services that may be available to each Adviser as a result of securities transactions effected for the Funds and other investment advisory clients.
Economies of Scale
In reviewing management fees and profitability, the Board also considered the extent to which the applicable Adviser and its affiliates, on the one hand, and each Fund, on the other hand, can expect to realize benefits from economies of scale as the assets of each Fund increase. The Board acknowledged the difficulty in accurately measuring the benefits resulting from economies of scale, if any, with respect to the management of any specific fund or group of funds. The Board reviewed data summarizing the increases and decreases in the assets of each Fund and of all Eaton Vance Funds as a group over various time periods, and evaluated the extent to which the total expense ratio of each Fund and the profitability of each Adviser and its affiliates may have been affected by such increases or decreases. Based upon the foregoing, the Board concluded that each Fund currently shares in the benefits from economies of scale, if any, when they are realized by the Adviser. The Board also concluded that the structure of each advisory fee, which includes breakpoints at several asset levels, will allow each Fund to continue to benefit from any economies of scale in the future.
Eaton Vance
Municipal Income Funds
September 30, 2020
Liquidity Risk Management Program
The Fund has implemented a written liquidity risk management program (Program) and related procedures to manage its liquidity in accordance with Rule 22e-4 under the Investment Company Act of 1940, as amended (Liquidity Rule). The Liquidity Rule defines “liquidity risk” as the risk that a fund could not meet requests to redeem shares issued by the fund without significant dilution of the remaining investors’ interests in the fund. The Fund’s Board of Trustees/Directors has designated the investment adviser to serve as the administrator of the Program and the related procedures. The administrator has established a Liquidity Risk Management Oversight Committee (Committee) to perform the functions necessary to administer the Program. As part of the Program, the administrator is responsible for identifying illiquid investments and categorizing the relative liquidity of the Fund’s investments in accordance with the Liquidity Rule. Under the Program, the administrator assesses, manages, and periodically reviews the Fund’s liquidity risk, and is responsible for making certain reports to the Fund’s Board of Trustees/Directors and the Securities and Exchange Commission (SEC) regarding the liquidity of the Fund’s investments, and to notify the Board of Trustees/Directors and the SEC of certain liquidity events specified in the Liquidity Rule. The liquidity of the Fund’s portfolio investments is determined based on a number of factors including, but not limited to, relevant market, trading and investment-specific considerations under the Program.
At a meeting of the Fund’s Board of Trustees/Directors, the Committee provided a written report to the Fund’s Board of Trustees/Directors pertaining to the operation, adequacy, and effectiveness of implementation of the Program, as well as the operation of the highly liquid investment minimum (if applicable) for the period December 1, 2018 through December 31, 2019 (Review Period). The Program operated effectively during the Review Period, supporting the administrator’s ability to assess, manage and monitor Fund liquidity risk, including during periods of market volatility and net redemptions. During the Review Period, the Fund met redemption requests on a timely basis.
There can be no assurance that the Program will achieve its objectives in the future. Please refer to the Fund’s prospectus for more information regarding the Fund’s exposure to liquidity risk and other principal risks to which an investment in the Fund may be subject.
Eaton Vance
Municipal Income Funds
September 30, 2020
Management and Organization
Fund Management. The Trustees of Eaton Vance Municipals Trust and Eaton Vance Mutual Funds Trust (collectively, the Trusts) are responsible for the overall management and supervision of the Trusts’ affairs. The Trustees and officers of the Trusts are listed below. Except as indicated, each individual has held the office shown or other offices in the same company for the last five years. Trustees and officers of the Trusts hold indefinite terms of office. The “Noninterested Trustees” consist of those Trustees who are not “interested persons” of the Trusts, as that term is defined under the 1940 Act. The business address of each Trustee and officer is Two International Place, Boston, Massachusetts 02110. As used below, “EVC” refers to Eaton Vance Corp., “EV” refers to Eaton Vance, Inc., “EVM” refers to Eaton Vance Management, “BMR” refers to Boston Management and Research and “EVD” refers to Eaton Vance Distributors, Inc. EVC and EV are the corporate parent and trustee, respectively, of EVM and BMR. EVD is the Funds’ principal underwriter and a wholly-owned subsidiary of EVC. Each officer affiliated with Eaton Vance may hold a position with other Eaton Vance affiliates that is comparable to his or her position with EVM listed below. Each Trustee oversees 143 portfolios (with the exception of Messrs. Faust and Wennerholm and Ms. Frost who oversee 142 portfolios) in the Eaton Vance Complex (including all master and feeder funds in a master feeder structure). Each officer serves as an officer of certain other Eaton Vance funds. Each Trustee and officer serves until his or her successor is elected.
| | | | | | |
| Name and Year of Birth | | Trust
Position(s) | | Trustee Since(1) | | Principal Occupation(s) and Other Directorships During Past Five Years and Other Relevant Experience |
|
| Interested Trustee |
| | | |
Thomas E. Faust Jr. 1958 | | Trustee | | 2007 | | Chairman, Chief Executive Officer and President of EVC, Director and President of EV, Chief Executive Officer and President of EVM and BMR, and Director of EVD. Trustee and/or officer of 142 registered investment companies. Mr. Faust is an interested person because of his positions with EVM, BMR, EVD, EVC and EV, which are affiliates of the Trusts. Other Directorships in the Last Five Years. Director of EVC and Hexavest Inc. (investment management firm). |
|
| Noninterested Trustees |
| | | |
Mark R. Fetting 1954 | | Trustee | | 2016 | | Private investor. Formerly held various positions at Legg Mason, Inc. (investment management firm) (2000-2012), including President, Chief Executive Officer, Director and Chairman (2008-2012), Senior Executive Vice President (2004-2008) and Executive Vice President (2001-2004). Formerly, President of Legg Mason family of funds (2001-2008). Formerly, Division President and Senior Officer of Prudential Financial Group, Inc. and related companies (investment management firm) (1991-2000). Other Directorships in the Last Five Years. None. |
| | | |
Cynthia E. Frost 1961 | | Trustee | | 2014 | | Private investor. Formerly, Chief Investment Officer of Brown University (university endowment) (2000-2012). Formerly, Portfolio Strategist for Duke Management Company (university endowment manager) (1995-2000). Formerly, Managing Director, Cambridge Associates (investment consulting company) (1989-1995). Formerly, Consultant, Bain and Company (management consulting firm) (1987-1989). Formerly, Senior Equity Analyst, BA Investment Management Company (1983-1985). Other Directorships in the Last Five Years. None. |
| | | |
George J. Gorman 1952 | | Trustee | | 2014 | | Principal at George J. Gorman LLC (consulting firm). Formerly, Senior Partner at Ernst & Young LLP (a registered public accounting firm) (1974-2009). Other Directorships in the Last Five Years. Formerly, Trustee of the BofA Funds Series Trust (11 funds) (2011-2014) and of the Ashmore Funds (9 funds) (2010-2014). |
| | | |
Valerie A. Mosley 1960 | | Trustee | | 2014 | | Chairwoman and Chief Executive Officer of Valmo Ventures (a consulting and investment firm). Former Partner and Senior Vice President, Portfolio Manager and Investment Strategist at Wellington Management Company, LLP (investment management firm) (1992-2012). Former Chief Investment Officer, PG Corbin Asset Management (1990-1992). Formerly worked in institutional corporate bond sales at Kidder Peabody (1986-1990). Other Directorships in the Last Five Years. Director of DraftKings, Inc. (digital sports entertainment and gaming company) (since September 2020). Director of Groupon, Inc. (e-commerce provider) (since April 2020). Director of Envestnet, Inc. (provider of intelligent systems for wealth management and financial wellness) (since 2018). Director of Dynex Capital, Inc. (mortgage REIT) (since 2013). |
Eaton Vance
Municipal Income Funds
September 30, 2020
Management and Organization — continued
| | | | | | |
| Name and Year of Birth | | Trust
Position(s) | | Trustee Since(1) | | Principal Occupation(s) and Other Directorships During Past Five Years and Other Relevant Experience |
|
| Noninterested Trustees (continued) |
| | | |
William H. Park 1947 | | Chairperson of the Board and Trustee | | 2016 (Chairperson) and 2003 (Trustee) | | Private investor. Formerly, Consultant (management and transactional) (2012-2014). Formerly, Chief Financial Officer, Aveon Group L.P. (investment management firm) (2010-2011). Formerly, Vice Chairman, Commercial Industrial Finance Corp. (specialty finance company) (2006-2010). Formerly, President and Chief Executive Officer, Prizm Capital Management, LLC (investment management firm) (2002-2005). Formerly, Executive Vice President and Chief Financial Officer, United Asset Management Corporation (investment management firm) (1982-2001). Formerly, Senior Manager, Price Waterhouse (now PricewaterhouseCoopers) (a registered public accounting firm) (1972-1981). Other Directorships in the Last Five Years. None. |
| | | |
Helen Frame Peters 1948 | | Trustee | | 2008 | | Professor of Finance, Carroll School of Management, Boston College. Formerly, Dean, Carroll School of Management, Boston College (2000-2002). Formerly, Chief Investment Officer, Fixed Income, Scudder Kemper Investments (investment management firm) (1998-1999). Formerly, Chief Investment Officer, Equity and Fixed Income, Colonial Management Associates (investment management firm) (1991-1998). Other Directorships in the Last Five Years. None. |
| | | |
Keith Quinton 1958 | | Trustee | | 2018 | | Private investor, researcher and lecturer. Independent Investment Committee Member at New Hampshire Retirement System (since 2017). Formerly, Portfolio Manager and Senior Quantitative Analyst at Fidelity Investments (investment management firm) (2001-2014). Other Directorships in the Last Five Years. Director (since 2016) and Chairman (since 2019) of New Hampshire Municipal Bond Bank. |
| | | |
Marcus L. Smith 1966 | | Trustee | | 2018 | | Private investor. Member of Posse Boston Advisory Board (foundation) (since 2015). Formerly, Portfolio Manager at MFS Investment Management (investment management firm) (1994-2017). Other Directorships in the Last Five Years. Director of MSCI Inc. (global provider of investment decision support tools) (since 2017). Formerly, Director of DCT Industrial Trust Inc. (logistics real estate company) (2017-2018). |
| | | |
Susan J. Sutherland 1957 | | Trustee | | 2015 | | Private investor. Director of Ascot Group Limited and certain of its subsidiaries (insurance and reinsurance) (since 2018). Formerly, Director of Hagerty Holding Corp. (insurance and reinsurance) (2015-2018). Formerly, Associate, Counsel and Partner at Skadden, Arps, Slate, Meagher & Flom LLP (law firm) (1982-2013). Other Directorships in the Last Five Years. Formerly, Director of Montpelier Re Holdings Ltd. (global provider of customized insurance and reinsurance products) (2013-2015). |
| | | |
Scott E. Wennerholm 1959 | | Trustee | | 2016 | | Private Investor. Formerly, Trustee at Wheelock College (postsecondary institution) (2012-2018). Formerly, Consultant at GF Parish Group (executive recruiting firm) (2016-2017). Formerly, Chief Operating Officer and Executive Vice President at BNY Mellon Asset Management (investment management firm) (2005-2011). Formerly, Chief Operating Officer and Chief Financial Officer at Natixis Global Asset Management (investment management firm) (1997-2004). Formerly, Vice President at Fidelity Investments Institutional Services (investment management firm) (1994-1997). Other Directorships in the Last Five Years. None. |
Eaton Vance
Municipal Income Funds
September 30, 2020
Management and Organization — continued
| | | | | | |
| Name and Year of Birth | | Trust
Position(s) | | Officer
Since(2) | | Principal Occupation(s) During Past Five Years |
|
| Principal Officers who are not Trustees |
| | | |
Eric A. Stein 1980 | | President | | 2020 | | Vice President and Chief Investment Officer, Fixed Income of EVM and BMR. Also Vice President of Calvert Research and Management (“CRM”). |
| | | |
Maureen A. Gemma 1960 | | Vice President, Secretary and Chief Legal Officer | | 2005 | | Vice President of EVM and BMR. Also Vice President of CRM. |
| | | |
James F. Kirchner 1967 | | Treasurer | | 2007 | | Vice President of EVM and BMR. Also Vice President of CRM. |
| | | |
Richard F. Froio 1968 | | Chief Compliance Officer | | 2017 | | Vice President of EVM and BMR since 2017. Formerly Deputy Chief Compliance Officer (Adviser/Funds) and Chief Compliance Officer (Distribution) at PIMCO (2012-2017) and Managing Director at BlackRock/Barclays Global Investors (2009-2012). |
| (1) | Year first appointed to serve as Trustee for a fund in the Eaton Vance family of funds. Each Trustee has served continuously since appointment unless indicated otherwise. |
| (2) | Year first elected to serve as officer of a fund in the Eaton Vance family of funds when the officer has served continuously. Otherwise, year of most recent election as an officer of a fund in the Eaton Vance family of funds. Titles may have changed since initial election. |
The SAI for the Funds includes additional information about the Trustees and officers of the Funds and can be obtained without charge on Eaton Vance’s website at www.eatonvance.com or by calling 1-800-262-1122.
Eaton Vance Funds
IMPORTANT NOTICES
Privacy. The Eaton Vance organization is committed to ensuring your financial privacy. Each entity listed below has adopted a privacy policy and procedures (“Privacy Program”) Eaton Vance believes is reasonably designed to protect your personal information and to govern when and with whom Eaton Vance may share your personal information.
| • | | At the time of opening an account, Eaton Vance generally requires you to provide us with certain information such as name, address, social security number, tax status, account numbers, and account balances. This information is necessary for us to both open an account for you and to allow us to satisfy legal requirements such as applicable anti-money laundering reviews and know-your-customer requirements. |
| • | | On an ongoing basis, in the normal course of servicing your account, Eaton Vance may share your information with unaffiliated third parties that perform various services for Eaton Vance and/or your account. These third parties include transfer agents, custodians, broker/dealers and our professional advisers, including auditors, accountants, and legal counsel. Eaton Vance may additionally share your personal information with our affiliates. |
| • | | We believe our Privacy Program is reasonably designed to protect the confidentiality of your personal information and to prevent unauthorized access to that information. |
| • | | We reserve the right to change our Privacy Program at any time upon proper notification to you. You may want to review our Privacy Program periodically for changes by accessing the link on our homepage: www.eatonvance.com. |
Our pledge of protecting your personal information applies to the following entities within the Eaton Vance organization: the Eaton Vance Family of Funds, Eaton Vance Management, Eaton Vance Investment Counsel, Eaton Vance Distributors, Inc., Eaton Vance Trust Company, Eaton Vance Management (International) Limited, Eaton Vance Advisers International Ltd., Eaton Vance Global Advisors Limited, Eaton Vance Management’s Real Estate Investment Group, Boston Management and Research, Calvert Research and Management, and Calvert Funds. This Privacy Notice supersedes all previously issued privacy disclosures. For more information about our Privacy Program or about how your personal information may be used, please call 1-800-262-1122.
Delivery of Shareholder Documents. The Securities and Exchange Commission (SEC) permits funds to deliver only one copy of shareholder documents, including prospectuses, proxy statements and shareholder reports, to fund investors with multiple accounts at the same residential or post office box address. This practice is often called “householding” and it helps eliminate duplicate mailings to shareholders. Eaton Vance, or your financial intermediary, may household the mailing of your documents indefinitely unless you instruct Eaton Vance, or your financial intermediary, otherwise. If you would prefer that your Eaton Vance documents not be householded, please contact Eaton Vance at 1-800-262-1122, or contact your financial intermediary. Your instructions that householding not apply to delivery of your Eaton Vance documents will typically be effective within 30 days of receipt by Eaton Vance or your financial intermediary.
Portfolio Holdings. Each Eaton Vance Fund and its underlying Portfolio(s) (if applicable) files a schedule of portfolio holdings on Part F to Form N-PORT with the SEC. Certain information filed on Form N-PORT may be viewed on the Eaton Vance website at www.eatonvance.com, by calling Eaton Vance at 1-800-262-1122 or in the EDGAR database on the SEC’s website at www.sec.gov.
Proxy Voting. From time to time, funds are required to vote proxies related to the securities held by the funds. The Eaton Vance Funds or their underlying Portfolios (if applicable) vote proxies according to a set of policies and procedures approved by the Funds’ and Portfolios’ Boards. You may obtain a description of these policies and procedures and information on how the Funds or Portfolios voted proxies relating to portfolio securities during the most recent 12-month period ended June 30, without charge, upon request, by calling 1-800-262-1122 and by accessing the SEC’s website at www.sec.gov.
This Page Intentionally Left Blank
This Page Intentionally Left Blank
This Page Intentionally Left Blank
Investment Advisers
AMT-Free Municipal Income Fund
Eaton Vance Management
Two International Place
Boston, MA 02110
National Municipal Income Fund
Boston Management and Research
Two International Place
Boston, MA 02110
Administrator
Eaton Vance Management
Two International Place
Boston, MA 02110
Principal Underwriter*
Eaton Vance Distributors, Inc.
Two International Place
Boston, MA 02110
(617) 482-8260
Custodian
State Street Bank and Trust Company
State Street Financial Center, One Lincoln Street
Boston, MA 02111
Transfer Agent
BNY Mellon Investment Servicing (US) Inc.
Attn: Eaton Vance Funds
P.O. Box 9653
Providence, RI 02940-9653
(800) 262-1122
Independent Registered Public Accounting Firm
Deloitte & Touche LLP
200 Berkeley Street
Boston, MA 02116-5022
Fund Offices
Two International Place
Boston, MA 02110
| * | FINRA BrokerCheck. Investors may check the background of their Investment Professional by contacting the Financial Industry Regulatory Authority (FINRA). FINRA BrokerCheck is a free tool to help investors check the professional background of current and former FINRA-registered securities firms and brokers. FINRA BrokerCheck is available by calling 1-800-289-9999 and at www.FINRA.org. The FINRA BrokerCheck brochure describing this program is available to investors at www.FINRA.org. |

448 9.30.20
The registrant (sometimes referred to as the “Fund”) has adopted a code of ethics applicable to its Principal Executive Officer, Principal Financial Officer and Principal Accounting Officer. The registrant undertakes to provide a copy of such code of ethics to any person upon request, without charge, by calling 1-800-262-1122. The registrant has not amended the code of ethics as described in Form N-CSR during the period covered by this report. The registrant has not granted any waiver, including an implicit waiver, from a provision of the code of ethics as described in Form N-CSR during the period covered by this report.
| Item 3. | Audit Committee Financial Expert |
The registrant’s Board of Trustees (the “Board”) has designated George J. Gorman and William H. Park, each an independent trustee, as audit committee financial experts. Mr. Gorman is a certified public accountant who is the Principal at George J. Gorman LLC (a consulting firm). Previously, Mr. Gorman served in various capacities at Ernst & Young LLP (a registered public accounting firm), including as Senior Partner. Mr. Gorman
also has experience serving as an independent trustee and audit committee financial expert of other mutual fund complexes. Mr. Park is a certified public accountant who is a private investor. Previously, he served as a consultant, as the Chief Financial Officer of Aveon Group, L.P. (an investment management firm), as the Vice Chairman of Commercial Industrial Finance Corp. (specialty finance company), as President and Chief Executive Officer of Prizm Capital Management, LLC (investment management firm), as Executive Vice President and Chief Financial Officer of United Asset Management Corporation (an institutional investment management firm) and as a Senior Manager at Price Waterhouse (now PricewaterhouseCoopers) (a registered public accounting firm).
| Item 4. | Principal Accountant Fees and Services |
Eaton Vance AMT-Free Municipal Income Fund and Eaton Vance Core Plus Bond Fund (the “Fund(s)”) are series of Eaton Vance Mutual Funds Trust (the “Trust”), a Massachusetts business trust, which, including the Funds, contains a total of 33 series (the “Series”). The Trust is registered under the Investment Company Act of 1940 as an open-end management investment company. This Form N-CSR relates to the Funds’ annual reports.
(a)-(d)
The following tables present the aggregate fees billed to each Fund for the Funds’ fiscal years ended September 30, 2019 and September 30, 2020 by the Funds’ principal accountant, Deloitte and Touche LLP (“D&T”), for professional services rendered for the audit of the Funds’ annual financial statements and fees billed for other services rendered by D&T during those periods.
Eaton Vance AMT-Free Municipal Income Fund
| | | | | | | | |
Fiscal Years Ended | | 9/30/19 | | | 9/30/20 | |
Audit Fees | | $ | 50,550 | | | $ | 50,550 | |
Audit-Related Fees(1) | | $ | 0 | | | $ | 0 | |
Tax Fees(2) | | $ | 13,751 | | | $ | 12,441 | |
All Other Fees(3) | | $ | 0 | | | $ | 0 | |
| | | | | | | | |
Total | | $ | 64,301 | | | $ | 62,991 | |
| | | | | | | | |
Eaton Vance Core Plus Bond Fund
| | | | | | | | |
Fiscal Years Ended | | 9/30/19 | | | 9/30/20 | |
Audit Fees | | $ | 47,750 | | | $ | 60,250 | |
Audit-Related Fees(1) | | $ | 0 | | | $ | 0 | |
Tax Fees(2) | | $ | 11,017 | | | $ | 12,507 | |
All Other Fees(3) | | $ | 0 | | | $ | 0 | |
| | | | | | | | |
Total | | $ | 58,767 | | | $ | 72,757 | |
| | | | | | | | |
| (1) | Audit-related fees consist of the aggregate fees billed for assurance and related services that are reasonably related to the performance of the audit of the registrant’s financial statements and are not reported under the category of audit fees. |
| (2) | Tax fees consist of the aggregate fees billed for professional services rendered by the principal accountant relating to tax compliance, tax advice, and tax planning and specifically include fees for tax return preparation and other related tax compliance/planning matters. |
| (3) | All other fees consist of the aggregate fees billed for products and services provided by the principal accountant other than audit, audit-related, and tax services. |
The various Series comprising the Trust have differing fiscal year ends (January 31, February 28/29, July 31, September 30, October 31 or December 31). The following table presents the aggregate audit, audit-related, tax, and other fees billed to all of the Series in the Trust by D&T for the last two fiscal years of each Series.
| | | | | | | | | | | | | | | | | | | | | | | | | | | | | | | | | | | | | | | | | | | | |
Fiscal Years Ended | | 10/31/18 | | | 12/31/18 | | | 1/31/19 | | | 2/28/19 | | | 7/31/19 | | | 9/30/19 | | | 10/31/19 | | | 12/31/19 | | | 1/31/20 | | | 2/29/20 | | | 9/30/20 | |
Audit Fees | | $ | 621,075 | | | $ | 105,320 | | | $ | 191,680 | | | $ | 25,850 | | | $ | 37,050 | | | $ | 98,300 | | | $ | 661,708 | | | $ | 106,700 | | | $ | 156,850 | | | $ | 26,250 | | | $ | 110,800 | |
Audit-Related Fees(1) | | $ | 0 | | | $ | 0 | | | $ | 0 | | | $ | 0 | | | $ | 0 | | | $ | 0 | | | $ | 0 | | | $ | 0 | | | $ | 0 | | | $ | 0 | | | $ | 0 | |
Tax Fees(2) | | $ | 430,938 | | | $ | 65,089 | | | $ | 85,957 | | | $ | 11,190 | | | $ | 16,000 | | | $ | 24,768 | | | $ | 345,480 | | | $ | 63,478 | | | $ | 69,073 | | | $ | 11,413 | | | $ | 24,948 | |
All Other Fees(3) | | $ | 0 | | | $ | 0 | | | $ | 0 | | | $ | 0 | | | $ | 0 | | | $ | 0 | | | $ | 0 | | | $ | 0 | | | $ | 0 | | | $ | 0 | | | $ | 0 | |
| | | | | | | | | | | | | | | | | | | | | | | | | | | | | | | | | | | | | | | | | | | | |
Total | | $ | 1,052,013 | | | $ | 170,409 | | | $ | 277,637 | | | $ | 37,040 | | | $ | 53,050 | | | $ | 123,068 | | | $ | 1,007,188 | | | $ | 170,178 | | | $ | 225,923 | | | $ | 37,663 | | | $ | 135,748 | |
| | | | | | | | | | | | | | | | | | | | | | | | | | | | | | | | | | | | | | | | | | | | |
| (1) | Audit-related fees consist of the aggregate fees billed for assurance and related services that are reasonably related to the performance of the audit of the registrant’s financial statements and are not reported under the category of audit fees. |
| (2) | Tax fees consist of the aggregate fees billed for professional services rendered by the principal accountant relating to tax compliance, tax advice, and tax planning and specifically include fees for tax return preparation and other related tax compliance/planning matters. |
| (3) | All other fees consist of the aggregate fees billed for products and services provided by the principal accountant other than audit, audit-related, and tax services. |
(e)(1) The registrant’s audit committee has adopted policies and procedures relating to the pre-approval of services provided by the registrant’s principal accountant (the “Pre-Approval Policies”). The Pre-Approval Policies establish a framework intended to assist the audit committee in the proper discharge of its pre-approval responsibilities. As a general matter, the Pre-Approval Policies (i) specify certain types of audit, audit-related, tax, and other services determined to be pre-approved by the audit committee; and (ii) delineate specific procedures governing the mechanics of the pre-approval process, including the approval and monitoring of audit and non-audit service fees. Unless a service is specifically pre-approved under the Pre-Approval Policies, it must be separately pre-approved by the audit committee.
The Pre-Approval Policies and the types of audit and non-audit services pre-approved therein must be reviewed and ratified by the registrant’s audit committee at least annually. The registrant’s audit committee maintains full responsibility for the appointment, compensation, and oversight of the work of the registrant’s principal accountant.
(e)(2) No services described in paragraphs (b)-(d) above were approved by the registrant’s audit committee pursuant to the “de minimis exception” set forth in Rule 2-01(c)(7)(i)(C) of Regulation S-X.
(f) Not applicable.
(g) The following table presents (i) the aggregate non-audit fees (i.e., fees for audit-related, tax, and other services) billed for services rendered to all of the Series in the Trust by D&T for the last two fiscal years of each Series; and (ii) the aggregate non-audit fees (i.e., fees for audit-related, tax, and other services) billed to the Eaton Vance organization by D&T for the last two fiscal years of each Series.
| | | | | | | | | | | | | | | | | | | | | | | | | | | | | | | | | | | | | | | | | | | | |
Fiscal Years Ended | | 10/31/18 | | | 12/31/18 | | | 1/31/19 | | | 2/28/19 | | | 7/31/19 | | | 9/30/19 | | | 10/31/19 | | | 12/31/19 | | | 1/31/20 | | | 2/29/20 | | | 9/30/20 | |
Registrant(1) | | $ | 430,938 | | | $ | 65,089 | | | $ | 85,957 | | | $ | 11,190 | | | $ | 16,000 | | | $ | 24,768 | | | $ | 430,938 | | | $ | 345,480 | | | $ | 63,478 | | | $ | 11,413 | | | $ | 24,948 | |
Eaton Vance(2) | | $ | 126,485 | | | $ | 126,485 | | | $ | 126,485 | | | $ | 126,485 | | | $ | 60,130 | | | $ | 59,903 | | | $ | 126,485 | | | $ | 59,903 | | | $ | 59,903 | | | $ | 59,903 | | | $ | 51,800 | |
| (1) | Includes all of the Series of the Trust. During the fiscal years reported above, certain of the Funds were “feeder” funds in a “master-feeder” fund structure or funds of funds. |
| (2) | Various subsidiaries of Eaton Vance Corp. act in either an investment advisory and/or service provider capacity with respect to the Series and/or their respective “master” funds (if applicable). |
(h) The registrant’s audit committee has considered whether the provision by the registrant’s principal accountant of non-audit services to the registrant’s investment adviser and any entity controlling, controlled by, or under common control with the adviser that provides ongoing services to the registrant that were not pre-approved pursuant to Rule 2-01(c)(7)(ii) of Regulation S-X is compatible with maintaining the principal accountant’s independence.
| Item 5. | Audit Committee of Listed Registrants |
Not applicable.
| Item 6. | Schedule of Investments |
Please see schedule of investments contained in the Report to Stockholders included under Item 1 of this Form N-CSR.
| Item 7. | Disclosure of Proxy Voting Policies and Procedures for Closed-End Management Investment Companies |
Not applicable.
| Item 8. | Portfolio Managers of Closed-End Management Investment Companies |
Not applicable.
| Item 9. | Purchases of Equity Securities by Closed-End Management Investment Company and Affiliated Purchasers |
Not applicable.
| Item 10. | Submission of Matters to a Vote of Security Holders |
No material changes.
| Item 11. | Controls and Procedures |
(a) It is the conclusion of the registrant’s principal executive officer and principal financial officer that the effectiveness of the registrant’s current disclosure controls and procedures (such disclosure controls and procedures having been evaluated within 90 days of the date of this filing) provide reasonable assurance that the information required to be disclosed by the registrant has been recorded, processed, summarized and reported within the time period specified in the Commission’s rules and forms and that the information required to be disclosed by the registrant has been accumulated and communicated to the registrant’s principal executive officer and principal financial officer in order to allow timely decisions regarding required disclosure.
(b) There have been no changes in the registrant’s internal controls over financial reporting during the period covered by this report that has materially affected, or is reasonably likely to materially affect, the registrant’s internal control over financial reporting.
| Item 12. | Disclosure of Securities Lending Activities for Closed-End Management Investment Companies |
Not applicable.
Signatures
Pursuant to the requirements of the Securities Exchange Act of 1934 and the Investment Company Act of 1940, the registrant has duly caused this report to be signed on its behalf by the undersigned, thereunto duly authorized.
| | |
| Eaton Vance Mutual Funds Trust |
| |
| By: | | /s/ Eric A. Stein |
| | Eric A. Stein |
| | President |
| |
| Date: | | November 23, 2020 |
Pursuant to the requirements of the Securities Exchange Act of 1934 and the Investment Company Act of 1940, this report has been signed below by the following persons on behalf of the registrant and in the capacities and on the dates indicated.
| | |
| By: | | /s/ James F. Kirchner |
| | James F. Kirchner |
| | Treasurer |
| |
| Date: | | November 23, 2020 |
| |
| By: | | /s/ Eric A. Stein |
| | Eric A. Stein |
| | President |
| |
| Date: | | November 23, 2020 |