UNITED STATES
SECURITIES AND EXCHANGE COMMISSION
Washington, D.C. 20549
FORM N-CSR
CERTIFIED SHAREHOLDER REPORT OF REGISTERED MANAGEMENT INVESTMENT COMPANIES
Investment Company Act file number 811-04087
Manning & Napier Fund, Inc.
(Exact name of registrant as specified in charter)
290 Woodcliff Drive, Fairport, NY 14450
(Address of principal executive offices)(Zip Code)
James Mikolaichik 290 Woodcliff Drive, Fairport, NY 14450
(Name and address of agent for service)
Registrant’s telephone number, including area code: 585-325-6880
Date of fiscal year end: December 31
Date of reporting period: January 1, 2015 through December 31, 2015
Form N-CSR is to be used by management investment companies to file reports with the Commission not later than 10 days after the transmission to stockholders of any report that is required to be transmitted to stockholders under Rule 30e-1 under the Investment Company Act of 1940 (17 CFR 270.30e-1). The Commission may use the information provided on Form N-CSR in its regulatory, disclosure review, inspection, and policymaking roles.
A registrant is required to disclose the information specified by Form N-CSR, and the Commission will make this information public. A registrant is not required to respond to the collection of information contained in Form N-CSR unless the Form displays a currently valid Office of Management and Budget (“OMB”) control number. Please direct comments concerning the accuracy of the information collection burden estimate and any suggestions for reducing the burden to Secretary, Securities and Exchange Commission, 100 F Street, NE, Washington, DC 20549. The OMB has reviewed this collection of information under the clearance requirements of 44 U.S.C. § 3507.
ITEM 1: REPORTS TO STOCKHOLDERS.
Real Estate Series
Management Discussion and Analysis
(unaudited)
Dear Shareholders:
Volatility defined global equity markets during the past year, largely driven by macroeconomic factors. Markets around the world experienced a correction in late August amidst a broad selloff triggered by renewed concerns about economic growth in emerging markets — China in particular — and uncertainty about the effects of that slowdown on overall global growth. Developed economies continued to provide accommodative monetary policy to combat growth concerns, although in December the U.S. Federal Reserve raised the federal funds rate for the first time in nearly a decade. For much of the year, Europe struggled with uncertainty regarding Greece’s ability to secure bailout funding from its creditors, which negatively affected investor sentiment. China’s economy slowed, but the government continued to demonstrate a willingness to provide support through a combination of policy-easing maneuvers and targeted stimulus measures. The U.S. economy remained on a path of slow growth that nevertheless made it the best performing developed economy. U.S. stocks were largely flat for the year, whereas global equity markets moderately declined. Looking ahead, we expect the slow global growth environment to remain in place for the foreseeable future.
As always, we appreciate your business.
| Sincerely, |
Manning & Napier Advisors, LLC
1
Real Estate Series
Fund Commentary
(unaudited)
Investment Objective
To provide high current income and long-term capital appreciation by investing principally in companies in the real estate industry. Under normal circumstances, at least 80% of the Series’ assets will be invested in securities of companies that are principally engaged in the U.S. real estate industry. These companies include those directly engaged in the real estate industry as well as in industries serving and/or related to the real estate industry.
Performance Commentary
Regarding U.S. real estate, we believe that low levels of housing inventory, recovering household formation, and single-family affordability will result in a continued recovery for homebuilders and timber real estate investment trusts (REITs). We also view shopping centers as favorably positioned to benefit from low levels of new completions and stable demand from discount and grocery retailers. Continued improvement in labor markets including healthy employment growth should also support demand for housing and home ownership. Some categories of real estate investments may face volatility in the near term as investors carefully weigh the Federal Reserve’s intentions concerning interest rates, which could create attractive buying opportunities.
The MSCI U.S. Real Estate Investment Trust (REIT) Index delivered positive absolute returns of 1.28% during 2015. The Real Estate Series delivered positive absolute returns as well, returning 4.14% and outperforming the benchmark on a relative basis. Stock selection was the primary driver of the Series’ outperformance relative to the MSCI U.S. REIT Index during the year. In aggregate, sub-industry positioning also aided relative returns.
More specifically, stock selection in sub-industries such as Office REITs, Apartment REITs, and Homebuilders aided relative returns. The Series’ underweight to Healthcare REITs and Diversified REITs as compared to the benchmark also aided relative performance. Offsetting a portion of the relative performance tailwind was the Series’ overweight to Hospitality and underweight to Apartment REITs relative to the benchmark.
During 2016 we believe investors should expect further gyrations in equity markets due to catalysts such as geopolitical risks, the diverging monetary policies of major central banks, commodity price pressures, and the potential for global growth to deviate from expectations. With the Federal Reserve having raised the federal funds rate, we think they now will seek to remain flexible and proceed slowly with small increases that do not follow a well-defined schedule. Broadly speaking, valuations in the developed world remain neutral at best, whereas valuations in select emerging markets are relatively more attractive. Shareholders should expect us to view volatility as a buying opportunity given that our indicators do not suggest capital risk is a significant near-term concern. In light of the current environment, it is important that investors remain active, flexible, and selective in their approach in order to avoid overvalued areas of the market, something Manning & Napier has done for over 45 years as an active investment manager.
Performance data quoted represents past performance and does not guarantee future results. The investment return and principal value of an investment will fluctuate, so that an investor’s shares, when redeemed, may be worth more or less than their original cost. Current performance may be higher or lower than that quoted; investors can obtain the most recent month-end performance at www.manning-napier.com or by calling (800) 466-3863. Performance for the Real Estate Series Class S shares is provided above. Performance for the Class I shares will be higher based on the Class’ lower expenses.
Please see the next page for additional performance information as of December 31, 2015.
All investments involve risks, including potential loss of principal. Funds whose investments are concentrated in a specific industry or sector may be subject to a higher degree of market risk than funds whose investments are diversified among a variety of sectors. The Real Estate Series is subject to risks associated with the direct ownership of real estate, including the potential for falling real estate prices and the possibility of being highly leveraged; an investment in the Series will be closely aligned with the performance of the real estate markets. Additionally, like all derivatives, investments in options can be highly volatile and involve risks in addition to the risks of the underlying instrument on which the derivative is based, such as counterparty, correlation and liquidity risk.
2
Real Estate Series
Performance Update as of December 31, 2015
(unaudited)
| AVERAGE ANNUAL TOTAL RETURNS AS OF DECEMBER 31, 2015 | ||||||||||||
| ONE YEAR1 | FIVE YEAR | SINCE INCEPTION2 | ||||||||||
Manning & Napier Fund, Inc. - Real Estate Series - Class S3 | 4.14 | % | 11.96 | % | 14.75 | % | ||||||
Manning & Napier Fund, Inc. - Real Estate Series - Class I3,4 | 4.43 | % | 12.15 | % | 14.91 | % | ||||||
S&P 500 Total Return Index5 | 1.38 | % | 12.57 | % | 13.07 | % | ||||||
MSCI U.S. Real Estate Investment Trust (REIT) Index6 | 1.28 | % | 10.59 | % | 14.54 | % | ||||||
The following graph compares the value of a $10,000 investment in the Manning & Napier Fund, Inc. - Real Estate Series - Class S from its inception1 (November 10, 2009) to present (December 31, 2015) to the S&P 500 Total Return Index and the MSCI U.S. REIT Index.
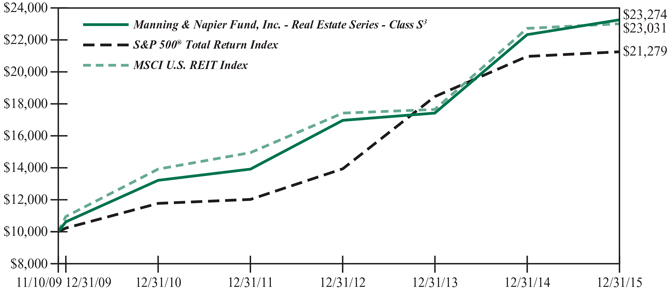
1The returns shown are based on net asset values calculated for shareholder transactions and may differ from the returns shown in the financial highlights, which reflect adjustments made to the net asset values in accordance with accounting principles generally accepted in the United States of America.
2Performance numbers for the Series and Index are calculated from November 10, 2009, the Class S inception date.
3The Series’ performance does not reflect the deduction of taxes that a shareholder would pay on fund distributions or the redemption of shares. The Series’ performance is historical and may not be indicative of future results. The performance returns shown are inclusive of the net expense ratio of the Series. For the year ended December 31, 2015, this net expense ratio was 1.09% for Class S and 0.84% for Class I. The gross expense ratio, which does not account for any voluntary or contractual waivers currently in effect, was 1.09% for Class S and 0.84% for Class I for the year ended December 31, 2015.
4 For periods prior to the inception of Class I on August 1, 2012, the performance figures are hypothetical and reflect the performance of the Manning & Napier Fund, Inc. - Real Estate Series - Class S.
5The S&P 500 Total Return Index is an unmanaged, capitalization-weighted measure of 500 widely held common stocks listed on the New York Stock Exchange, American Stock Exchange, and the Over-the-Counter market. The Index returns assume daily reinvestment of dividends and do not reflect any fees or expenses. Index returns provided by Bloomberg.
6The MSCI U.S. Real Estate Investment Trust (REIT) Index is a free float-adjusted, market capitalization-weighted index that is comprised of equity REITs that are included in the MSCI U.S. Investment Market 2500 Index, with the exception of specialty equity REITs that do not generate a majority of their revenue and income from real estate rental and leasing operations. The Index represents approximately 85% of the U.S. REIT universe. The Index returns do not reflect any fees or expenses. The Index returns are net of withholding taxes. They assume daily reinvestment of net dividends thus accounting for any applicable dividend taxation. Index returns provided by Bloomberg.
3
Real Estate Series
Shareholder Expense Example
(unaudited)
As a shareholder of the Series, you incur ongoing costs, including management fees, shareholder service fees and other Series expenses. This example is intended to help you understand your ongoing costs (in dollars) of investing in the Series and to compare these costs with the ongoing costs of investing in other mutual funds.
The example is based on an investment of $1,000 invested in each class at the beginning of the period and held for the entire period (July 1, 2015 to December 31, 2015).
Actual Expenses
The Actual lines of the table below provide information about actual account values and actual expenses. You may use the information in this line, together with the amount you invested, to estimate the expenses that you paid over the period. Simply divide your account value by $1,000 (for example, an $8,600 account value divided by $1,000 = 8.6), then multiply the result by the number in the Actual line for the Class in which you have invested under the heading entitled “Expenses Paid During Period” to estimate the expenses you paid on your account during this period.
Hypothetical Example for Comparison Purposes
The Hypothetical lines of each Class in the table below provide information about hypothetical account values and hypothetical
expenses based on the Class’ actual expense ratio and an assumed rate of return of 5% per year before expenses, which is not the Class’ actual return. The hypothetical account values and expenses may not be used to estimate the actual ending account balance or expenses you paid during the period. You may use this information to compare the ongoing costs of investing in a class of the Series and other funds. To do so, compare this 5% hypothetical example with the 5% hypothetical examples that appear in the shareholder reports of the other funds.
Please note that the expenses shown in the table are meant to highlight your ongoing costs only and do not reflect any transaction costs, such as sales charges (loads), redemption fees, or exchange fees that you may incur in other mutual funds. Therefore, the Hypothetical lines for each Class in the table are useful in comparing ongoing costs only, and will not help you determine the relative total costs of owning different funds.
BEGINNING ACCOUNT VALUE 7/1/15 | ENDING ACCOUNT VALUE 12/31/15 | EXPENSES PAID DURING PERIOD* 7/1/15-12/31/15 | ANNUALIZED EXPENSE RATIO | |||||
Class S | ||||||||
Actual | $1,000.00 | $1,079.80 | $5.82 | 1.11% | ||||
Hypothetical (5% return before expenses) | $1,000.00 | $1,019.61 | $5.65 | 1.11% | ||||
Class I | ||||||||
Actual | $1,000.00 | $1,080.90 | $4.51 | 0.86% | ||||
Hypothetical (5% return before expenses) | $1,000.00 | $1,020.87 | $4.38 | 0.86% |
*Expenses are equal to each Class’ annualized expense ratio (for the six-month period), multiplied by the average account value over the period, multiplied by 184/365 (to reflect the one-half year period). Expenses are based on the most recent fiscal half year; therefore, the expense ratios stated above may differ from the expense ratios stated in the financial highlights, which are based on one-year data.
4
Real Estate Series
Portfolio Composition as of December 31, 2015
(unaudited)
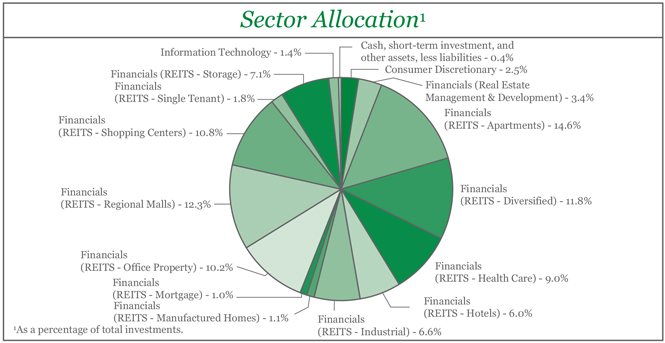
Top Ten Stock Holdings2 | ||||||||||||
Simon Property Group, Inc. | 6.3 | % | Prologis, Inc. | 2.5% | ||||||||
AvalonBay Communities, Inc. | 3.5 | % | Paramount Group, Inc. | 2.4% | ||||||||
Weyerhaeuser Co. | 3.3 | % | Brixmor Property Group, Inc. | 2.2% | ||||||||
General Growth Properties, Inc. | 2.8 | % | Public Storage | 2.2% | ||||||||
Mid-America Apartment Communities, Inc. | 2.5 | % | Physicians Realty Trust | 2.2% | ||||||||
| 2As a percentage of total investments. | ||||||||||||
5
Real Estate Series
Investment Portfolio - December 31, 2015
| SHARES | VALUE (NOTE 2) | |||||||
COMMON STOCKS - 99.6% | ||||||||
Consumer Discretionary - 2.5% | ||||||||
Hotels, Restaurants & Leisure - 0.9% | ||||||||
Accor S.A. (France)1 | 57,150 | $ | 2,475,177 | |||||
|
| |||||||
Household Durables - 1.6% | ||||||||
DR Horton, Inc | 24,110 | 772,243 | ||||||
Lennar Corp. - Class A | 24,826 | 1,214,240 | ||||||
Toll Brothers, Inc.* | 34,762 | 1,157,575 | ||||||
TRI Pointe Group, Inc.* | 89,920 | 1,139,286 | ||||||
|
| |||||||
| 4,283,344 | ||||||||
|
| |||||||
Total Consumer Discretionary | 6,758,521 | |||||||
|
| |||||||
Financials - 95.7% | ||||||||
Real Estate Management & Development - 3.4% | ||||||||
CBRE Group, Inc. - Class A* | 58,850 | 2,035,033 | ||||||
First Capital Realty, Inc. (Canada) | 123,580 | 1,638,862 | ||||||
Forest City Enterprises, Inc. - Class A* | 248,840 | 5,457,061 | ||||||
|
| |||||||
| 9,130,956 | ||||||||
|
| |||||||
REITS - Apartments - 14.6% | ||||||||
American Campus Communities, Inc. | 85,810 | 3,547,385 | ||||||
American Homes 4 Rent - Class A | 81,600 | 1,359,456 | ||||||
Apartment Investment & Management Co. - Class A | 129,240 | 5,173,477 | ||||||
AvalonBay Communities, Inc. | 50,470 | 9,293,041 | ||||||
Education Realty Trust, Inc. | 92,520 | 3,504,658 | ||||||
Equity Residential | 57,620 | 4,701,216 | ||||||
Mid-America Apartment Communities, Inc. | 74,280 | 6,745,367 | ||||||
UDR, Inc. | 128,920 | 4,843,524 | ||||||
|
| |||||||
| 39,168,124 | ||||||||
|
| |||||||
REITS - Diversified - 11.8% | ||||||||
CatchMark Timber Trust, Inc. - Class A | 262,070 | 2,964,012 | ||||||
CoreSite Realty Corp. | 24,220 | 1,373,758 | ||||||
Crown Castle International Corp. | 42,850 | 3,704,383 | ||||||
Digital Realty Trust, Inc. | 19,070 | 1,442,073 | ||||||
Lamar Advertising Co. - Class A | 47,270 | 2,835,255 | ||||||
Liberty Property Trust | 118,310 | 3,673,525 | ||||||
Outfront Media, Inc. | 182,275 | 3,979,063 | ||||||
Vornado Realty Trust | 27,350 | 2,733,906 | ||||||
Weyerhaeuser Co. | 296,650 | 8,893,567 | ||||||
|
| |||||||
| 31,599,542 | ||||||||
|
| |||||||
REITS - Health Care - 9.0% | ||||||||
Care Capital Properties, Inc. | 39,395 | 1,204,305 | ||||||
Community Healthcare Trust, Inc. | 254,140 | 4,683,800 | ||||||
HCP, Inc. | 73,900 | 2,825,936 | ||||||
Healthcare Realty Trust, Inc. | 94,160 | 2,666,611 | ||||||
The accompanying notes are an integral part of the financial statements.
6
Real Estate Series
Investment Portfolio - December 31, 2015
| SHARES | VALUE (NOTE 2) | |||||||
COMMON STOCKS (continued) | ||||||||
Financials (continued) | ||||||||
REITS - Health Care (continued) | ||||||||
Healthcare Trust of America, Inc. - Class A | 150,100 | $ | 4,048,197 | |||||
Physicians Realty Trust | 343,270 | 5,787,532 | ||||||
Ventas, Inc. | 49,420 | 2,788,771 | ||||||
|
| |||||||
| 24,005,152 | ||||||||
|
| |||||||
REITS - Hotels - 6.0% | ||||||||
Chesapeake Lodging Trust | 227,700 | 5,728,932 | ||||||
Host Hotels & Resorts, Inc. | 195,490 | 2,998,817 | ||||||
LaSalle Hotel Properties | 183,670 | 4,621,137 | ||||||
Pebblebrook Hotel Trust | 96,484 | 2,703,482 | ||||||
|
| |||||||
| 16,052,368 | ||||||||
|
| |||||||
REITS - Industrial - 6.6% | ||||||||
DCT Industrial Trust, Inc. | 70,510 | 2,634,959 | ||||||
Prologis, Inc. | 156,300 | 6,708,396 | ||||||
Rexford Industrial Realty, Inc. | 251,420 | 4,113,231 | ||||||
Terreno Realty Corp. | 179,930 | 4,070,017 | ||||||
|
| |||||||
| 17,526,603 | ||||||||
|
| |||||||
REITS - Manufactured Homes - 1.1% | ||||||||
Equity LifeStyle Properties, Inc. | 42,630 | 2,842,142 | ||||||
|
| |||||||
REITS - Mortgage - 1.0% | ||||||||
American Capital Agency Corp. | 70,480 | 1,222,123 | ||||||
Annaly Capital Management, Inc. | 141,840 | 1,330,459 | ||||||
|
| |||||||
| 2,552,582 | ||||||||
|
| |||||||
REITS - Office Property - 10.2% | ||||||||
Alexandria Real Estate Equities, Inc. | 62,800 | 5,674,608 | ||||||
Boston Properties, Inc. | 22,930 | 2,924,492 | ||||||
Columbia Property Trust, Inc. | 111,530 | 2,618,724 | ||||||
Douglas Emmett, Inc. | 148,330 | 4,624,929 | ||||||
Mack-Cali Realty Corp. | 210,620 | 4,917,977 | ||||||
Paramount Group, Inc. | 358,630 | 6,491,203 | ||||||
|
| |||||||
| 27,251,933 | ||||||||
|
| |||||||
REITS - Regional Malls - 12.3% | ||||||||
Fibra Shop Portafolios Inmobiliarios S.A.P.I. de C.V. (Mexico) | 1,905,315 | 1,928,033 | ||||||
General Growth Properties, Inc. | 270,250 | 7,353,503 | ||||||
Simon Property Group, Inc. | 86,640 | 16,846,282 | ||||||
Tanger Factory Outlet Centers, Inc. | 79,170 | 2,588,859 | ||||||
Taubman Centers, Inc. | 56,110 | 4,304,759 | ||||||
|
| |||||||
| 33,021,436 | ||||||||
|
| |||||||
REITS - Shopping Centers - 10.8% | ||||||||
Brixmor Property Group, Inc. | 229,020 | 5,913,296 | ||||||
The accompanying notes are an integral part of the financial statements.
7
Real Estate Series
Investment Portfolio - December 31, 2015
| SHARES | VALUE (NOTE 2) | |||||||
COMMON STOCKS (continued) | ||||||||
Financials (continued) | ||||||||
REITS - Shopping Centers (continued) | ||||||||
DDR Corp. | 304,610 | $ | 5,129,632 | |||||
Equity One, Inc. | 113,630 | 3,085,055 | ||||||
Kite Realty Group Trust | 105,137 | 2,726,202 | ||||||
Retail Opportunity Investments Corp. | 151,050 | 2,703,795 | ||||||
Scentre Group (Australia)1 | 957,107 | 2,903,039 | ||||||
Urban Edge Properties | 157,170 | 3,685,637 | ||||||
Westfield Corp. (Australia)1 | 384,480 | 2,645,185 | ||||||
|
| |||||||
| 28,791,841 | ||||||||
|
| |||||||
REITS - Single Tenant - 1.8% | ||||||||
Agree Realty Corp. | 144,110 | 4,898,299 | ||||||
|
| |||||||
REITS - Storage - 7.1% | ||||||||
CubeSmart | 188,030 | 5,757,479 | ||||||
Extra Space Storage, Inc. | 23,450 | 2,068,525 | ||||||
Public Storage | 23,470 | 5,813,519 | ||||||
Sovran Self Storage, Inc. | 50,901 | 5,462,186 | ||||||
|
| |||||||
| 19,101,709 | ||||||||
|
| |||||||
Total Financials | 255,942,687 | |||||||
|
| |||||||
Information Technology - 1.4% | ||||||||
Internet Software & Services - 1.4% | ||||||||
InterXion Holding N.V. - ADR (Netherlands)* | 120,890 | 3,644,834 | ||||||
|
| |||||||
Utilities - 0.0% | ||||||||
Electric Utilities - 0.0% | ||||||||
Prime AET&D Holdings No.1 Ltd. (Australia)*2 | 125,000 | — | ||||||
|
| |||||||
TOTAL COMMON STOCKS | ||||||||
(Identified Cost $236,167,130) | 266,346,042 | |||||||
|
| |||||||
The accompanying notes are an integral part of the financial statements.
8
Real Estate Series
Investment Portfolio - December 31, 2015
| SHARES | VALUE (NOTE 2) | |||||||
SHORT-TERM INVESTMENT - 0.1% | ||||||||
Dreyfus Cash Management, Inc. - Institutional Shares3, 0.23% | ||||||||
(Identified Cost $ 327,770) | 327,770 | $ | 327,770 | |||||
|
| |||||||
TOTAL INVESTMENTS - 99.7% | ||||||||
(Identified Cost $ 236,494,900) | 266,673,812 | |||||||
OTHER ASSETS, LESS LIABILITIES - 0.3% | 790,926 | |||||||
|
| |||||||
NET ASSETS - 100% | $ | 267,464,738 | ||||||
|
| |||||||
No. - Number
ADR - American Depositary Receipt
REITS - Real Estate Investment Trusts
*Non-income producing security.
1A factor from a third party vendor was applied to determine the security’s fair value following the close of local trading.
2Security has been valued at fair value as determined in good faith by the Advisor.
3Rate shown is the current yield as of December 31, 2015.
The Global Industry Classification Standard (GICS) was developed by and is the exclusive property and a service mark of MSCI Inc. (MSCI) and Standard & Poor’s, a division of The McGraw-Hill Companies, Inc. (S&P), and is licensed for use by Manning & Napier when referencing GICS sectors. Neither MSCI, S&P, nor any third party involved in making or compiling the GICS or any GICS classifications makes any express or implied warranties or representations with respect to such standard or classification, nor shall any such party have any liability therefrom.
The accompanying notes are an integral part of the financial statements.
9
Real Estate Series
Statement of Assets and Liabilities
December 31, 2015
ASSETS: | ||||
Investments, at value (identified cost $236,494,900) (Note 2) | $ | 266,673,812 | ||
Foreign currency (cost $1,858) | 1,800 | |||
Dividends receivable | 1,062,018 | |||
Receivable for fund shares sold | 304,392 | |||
Prepaid expenses | 1,471 | |||
|
| |||
TOTAL ASSETS | 268,043,493 | |||
|
| |||
LIABILITIES: | ||||
Accrued management fees (Note 3) | 168,370 | |||
Accrued shareholder services fees (Class S)(Note 3) | 45,662 | |||
Accrued fund accounting and administration fees (Note 3) | 19,905 | |||
Accrued transfer agent fees (Note 3) | 11,913 | |||
Accrued Chief Compliance Officer service fees (Note 3) | 429 | |||
Payable for fund shares repurchased | 291,901 | |||
Other payables and accrued expenses | 40,575 | |||
|
| |||
TOTAL LIABILITIES | 578,755 | |||
|
| |||
TOTAL NET ASSETS | $ | 267,464,738 | ||
|
| |||
NET ASSETS CONSIST OF: | ||||
Capital stock | $ | 222,785 | ||
Additional paid-in-capital | 233,612,228 | |||
Distributions in excess of net investment income | (100,961 | ) | ||
Accumulated net realized gain on investments, foreign currency and translation of other assets and liabilities | 3,551,808 | |||
Net unrealized appreciation on investments, foreign currency and translation of other assets and liabilities | 30,178,878 | |||
|
| |||
TOTAL NET ASSETS | $ | 267,464,738 | ||
|
| |||
NET ASSET VALUE, OFFERING PRICE AND REDEMPTION PRICE PER SHARE - Class S | $ | 14.15 | ||
|
| |||
NET ASSET VALUE, OFFERING PRICE AND REDEMPTION PRICE PER SHARE - Class I | $ | 7.26 | ||
|
| |||
The accompanying notes are an integral part of the financial statements.
10
Real Estate Series
Statement of Operations
For the Year Ended December 31, 2015
INVESTMENT INCOME: | ||||
Dividends (net of foreign taxes withheld, $52,411) | $ | 7,379,248 | ||
|
| |||
EXPENSES: | ||||
Management fees (Note 3) | 2,100,779 | |||
Shareholder services fees (Class S)(Note 3) | 566,732 | |||
Fund accounting and administration fees (Note 3) | 64,355 | |||
Transfer agent fees (Note 3) | 37,412 | |||
Directors’ fees (Note 3) | 10,740 | |||
Chief Compliance Officer service fees (Note 3) | 2,541 | |||
Custodian fees | 18,587 | |||
Miscellaneous | 122,734 | |||
|
| |||
Total Expenses | 2,923,880 | |||
|
| |||
NET INVESTMENT INCOME | 4,455,368 | |||
|
| |||
REALIZED AND UNREALIZED GAIN (LOSS) ON INVESTMENTS AND FOREIGN CURRENCY: | ||||
Net realized gain (loss) on- | ||||
Investments | 34,474,354 | |||
Options written | 190,635 | |||
Foreign currency and translation of other assets and liabilities | (29,820 | ) | ||
|
| |||
| 34,635,169 | ||||
|
| |||
Net change in unrealized appreciation (depreciation) on- | ||||
Investments | (28,775,682 | ) | ||
Foreign currency and translation of other assets and liabilities | 1,939 | |||
|
| |||
| (28,773,743 | ) | |||
|
| |||
NET REALIZED AND UNREALIZED GAIN (LOSS) ON INVESTMENTS AND FOREIGN CURRENCY | 5,861,426 | |||
|
| |||
NET INCREASE IN NET ASSETS RESULTING FROM OPERATIONS | $ | 10,316,794 | ||
|
| |||
The accompanying notes are an integral part of the financial statements.
11
Real Estate Series
Statements of Changes in Net Assets
| \ | FOR THE YEAR ENDED 12/31/15 | FOR THE YEAR ENDED 12/31/14 | ||||||
INCREASE (DECREASE) IN NET ASSETS: | ||||||||
OPERATIONS: | ||||||||
Net investment income | $ | 4,455,368 | $ | 7,145,687 | ||||
Net realized gain on investments and foreign currency | 34,635,169 | 19,278,792 | ||||||
Net change in unrealized appreciation (depreciation) on investments and foreign currency | (28,773,743 | ) | 33,939,661 | |||||
|
|
|
| |||||
Net increase from operations | 10,316,794 | 60,364,140 | ||||||
|
|
|
| |||||
DISTRIBUTIONS TO SHAREHOLDERS (Note 9): | ||||||||
From net investment income (Class S) | (3,328,087 | ) | (6,031,527 | ) | ||||
From net investment income (Class I) | (1,564,163 | ) | (2,316,228 | ) | ||||
From net realized gain on investments (Class S) | (22,906,487 | ) | (14,939,980 | ) | ||||
From net realized gain on investments (Class I) | (9,274,444 | ) | 5,249,295 | |||||
|
|
|
| |||||
Total distributions to shareholders | (37,073,181 | ) | (28,537,030 | ) | ||||
|
|
|
| |||||
CAPITAL STOCK ISSUED AND REPURCHASED: | ||||||||
Net increase from capital share transactions (Note 5) | 12,520,155 | 44,396,863 | ||||||
|
|
|
| |||||
Net increase (decrease) in net assets | (14,236,232 | ) | 76,223,973 | |||||
NET ASSETS: | ||||||||
Beginning of year | 281,700,970 | 205,476,997 | ||||||
|
|
|
| |||||
End of year (including distributions in excess of net investment income of $100,961 and $1,703,240, respectively) | $ | 267,464,738 | $ | 281,700,970 | ||||
|
|
|
| |||||
The accompanying notes are an integral part of the financial statements.
12
Real Estate Series
Financial Highlights - Class S*
| FOR THE YEARS ENDED | ||||||||||||||||||||
| 12/31/15 | 12/31/14 | 12/31/13 | 12/31/12 | 12/31/11 | ||||||||||||||||
Per share data (for a share outstanding throughout each year): | ||||||||||||||||||||
Net asset value - Beginning of year | $ | 15.46 | $ | 13.32 | $ | 14.57 | $ | 12.65 | $ | 12.58 | ||||||||||
|
|
|
|
|
|
|
|
|
| |||||||||||
Income from investment operations: | ||||||||||||||||||||
Net investment income1 | 0.24 | 0.44 | 2 | 0.24 | 0.21 | 0.15 | ||||||||||||||
Net realized and unrealized gain on investments | 0.34 | 3.24 | 0.10 | 2.54 | 0.49 | |||||||||||||||
|
|
|
|
|
|
|
|
|
| |||||||||||
Total from investment operations | 0.58 | 3.68 | 0.34 | 2.75 | 0.64 | |||||||||||||||
|
|
|
|
|
|
|
|
|
| |||||||||||
Less distributions to shareholders: | ||||||||||||||||||||
From net investment income | (0.24 | ) | (0.44 | ) | (0.21 | ) | (0.29 | ) | (0.15 | ) | ||||||||||
From net realized gain on investments | (1.65 | ) | (1.10 | ) | (1.38 | ) | (0.54 | ) | (0.42 | ) | ||||||||||
|
|
|
|
|
|
|
|
|
| |||||||||||
Total distributions to shareholders | (1.89 | ) | (1.54 | ) | (1.59 | ) | (0.83 | ) | (0.57 | ) | ||||||||||
|
|
|
|
|
|
|
|
|
| |||||||||||
Net asset value - End of year | $ | 14.15 | $ | 15.46 | $ | 13.32 | $ | 14.57 | $ | 12.65 | ||||||||||
|
|
|
|
|
|
|
|
|
| |||||||||||
Net assets - End of year | ||||||||||||||||||||
(000’s omitted) | $ | 217,216 | $ | 231,188 | $ | 168,167 | $ | 170,898 | $ | 167,153 | ||||||||||
|
|
|
|
|
|
|
|
|
| |||||||||||
Total return3 | 4.14 | % | 28.14 | % | 2.67 | % | 21.93 | % | 5.29 | % | ||||||||||
Ratios (to average net assets)/Supplemental Data: | ||||||||||||||||||||
Expenses | 1.09 | % | 1.11 | % | 1.12 | % | 1.10 | % | 1.18 | % | ||||||||||
Net investment income | 1.54 | % | 2.89 | %2 | 1.57 | % | 1.49 | % | 1.21 | % | ||||||||||
Portfolio turnover | 57 | % | 44 | % | 40 | % | 14 | % | 34 | % | ||||||||||
| *Effective August 1, 2012, the shares of the Series have been designated as Class S. | ||||||||||||||||||||
1Calculated based on average shares outstanding during the years.
2Reflects a special dividend paid out during the period by two of the Series’ holdings. Had the Series not received the special dividends, the net investment income per share would have been $0.22 and the net investment income ratio would have been 1.49%.
3Represents aggregate total return for the years indicated, and assumes reinvestment of all distributions.
The accompanying notes are an integral part of the financial statements.
13
Real Estate Series
Financial Highlights - Class I
| FOR THE YEARS ENDED | FOR THE PERIOD | |||||||||||||||
| 12/31/15 | 12/31/14 | 12/31/13 | 8/1/121 TO 12/31/12 | |||||||||||||
Per share data (for a share outstanding throughout each period): | ||||||||||||||||
Net asset value - Beginning of period | $ | 8.86 | $ | 8.18 | $ | 9.55 | $ | 10.00 | ||||||||
|
|
|
|
|
|
|
| |||||||||
Income from investment operations: | ||||||||||||||||
Net investment income2 | 0.16 | 0.29 | 3 | 0.19 | 0.08 | |||||||||||
Net realized and unrealized gain on investments | 0.17 | 1.97 | 0.04 | 0.32 | ||||||||||||
|
|
|
|
|
|
|
| |||||||||
Total from investment operations | 0.33 | 2.26 | 0.23 | 0.40 | ||||||||||||
|
|
|
|
|
|
|
| |||||||||
Less distributions to shareholders: | ||||||||||||||||
From net investment income | (0.28 | ) | (0.48 | ) | (0.22 | ) | (0.31 | ) | ||||||||
From net realized gain on investments | (1.65 | ) | (1.10 | ) | (1.38 | ) | (0.54 | ) | ||||||||
|
|
|
|
|
|
|
| |||||||||
Total distributions to shareholders | (1.93 | ) | (1.58 | ) | (1.60 | ) | (0.85 | ) | ||||||||
|
|
|
|
|
|
|
| |||||||||
Net asset value - End of period | $ | 7.26 | $ | 8.86 | $ | 8.18 | $ | 9.55 | ||||||||
|
|
|
|
|
|
|
| |||||||||
Net assets - End of period (000’s omitted) | $ | 50,249 | $ | 50,513 | $ | 37,310 | $ | 26,396 | ||||||||
|
|
|
|
|
|
|
| |||||||||
Total return4 | 4.43 | % | 28.44 | % | 2.94 | % | 4.16 | % | ||||||||
Ratios (to average net assets)/Supplemental Data: | ||||||||||||||||
Expenses | 0.84 | % | 0.86 | % | 0.87 | % | 0.87 | %5 | ||||||||
Net investment income | 1.81 | % | 3.14 | %3 | 1.88 | % | 1.95 | %5 | ||||||||
Portfolio turnover | 57 | % | 44 | % | 40 | % | 14 | % | ||||||||
1Commencement of operations.
2Calculated based on average shares outstanding during the periods.
3Reflects a special dividend paid out during the period by two of the Series’ holdings. Had the Series not received the special dividends, the net investment income per share would have been $0.16 and the net investment income ratio would have been 1.74%.
4Represents aggregate total return for the periods indicated, and assumes reinvestment of all distributions. Periods less than one year are not annualized.
5Annualized.
The accompanying notes are an integral part of the financial statements.
14
Real Estate Series
Notes to Financial Statements
| 1. | Organization |
Real Estate Series (the “Series”) is a no-load diversified series of Manning & Napier Fund, Inc. (the “Fund”). The Fund is organized in Maryland and is registered under the Investment Company Act of 1940, as amended, as an open-end management investment company.
The Series’ investment objective is to provide high current income and long-term capital appreciation by investing principally in companies in the real estate industry.
The Fund’s advisor is Manning & Napier Advisors, LLC (the “Advisor”). Shares of the Series are offered to investors, clients and employees of the Advisor and its affiliates. The Series is authorized to issue two classes of shares (Class S and Class I). Each class of shares is substantially the same, except that Class S shares bear shareholder services fees. The total authorized capital stock of the Fund consists of 15 billion shares of common stock each having a par value of $0.01. As of December 31, 2015, 10.7 billion shares have been designated in total among 41 series, of which 100 million have been designated as Real Estate Series Class S common stock and 100 million have been designated as Real Estate Series Class I common stock.
| 2. | Significant Accounting Policies |
The following is a summary of significant accounting policies followed by the Series. The Series is an investment company and, accordingly, follows the investment company accounting and reporting guidance of the Financial Accounting Standards Board Accounting Standards Codification Topic 946 - Investment Companies, which is part of accounting principles generally accepted in the United States of America (“GAAP”).
Security Valuation
Portfolio securities, including domestic equities, foreign equities, warrants and options, listed on an exchange other than the NASDAQ Stock Market are valued at the latest quoted sales price of the exchange on which the security is primarily traded. Securities not traded on valuation date or securities not listed on an exchange are valued at the latest quoted bid price provided by the Fund’s pricing service. Securities listed on the NASDAQ Stock Market are valued in accordance with the NASDAQ Official Closing Price.
Short-term investments that mature in sixty days or less may be valued at amortized cost, which approximates fair value. Investments in open-end investment companies are valued at their net asset value per share on valuation date.
Volume and level of activity in established markets for an asset or liability are evaluated to determine whether recent transactions and quoted prices are determinative of fair value. Where there have been significant decreases in volume and level of activity, further analysis and adjustment may be necessary to estimate fair value. The Series measures fair value in these instances by the use of inputs and valuation techniques which may be based upon current market prices of securities that are comparable in coupon, rating, maturity and industry and/or expectation of future cash flows. As a result of trading in relatively thin markets and/or markets that experience significant volatility, the prices used by the Series to value these securities may differ from the value that would be realized if these securities were sold, and the differences could be material.
Securities for which representative valuations or prices are not available from the Series’ pricing service may be valued at fair value as determined in good faith by the Advisor under procedures approved by and under the general supervision and responsibility of the Fund’s Board of Directors (the “Board”). Due to the inherent uncertainty of valuations of such securities, the fair value may differ significantly from the values that would have been used had a ready market for such securities existed. If trading or events occurring after the close of the principal market in which securities are traded are expected to materially affect the value of those securities, then they may be valued at their fair value, taking this trading or these events into account. In accordance with the procedures approved by the Board, the values of certain securities trading outside the U.S. were adjusted following the close of local trading using a factor from a third party vendor. The third party vendor uses statistical analyses and quantitative models, which consider among other things subsequent movement and changes in the prices of indices, securities and exchange rates in other markets, to determine the factors which are used to adjust local market prices. The value of
15
Real Estate Series
Notes to Financial Statements (continued)
| 2. | Significant Accounting Policies (continued) |
Security Valuation (continued)
securities used for net asset value calculation under these procedures may differ from published prices for the same securities. It is the Fund’s policy to classify each foreign equity security where a factor from a third party vendor is provided as a Level 2 security.
Various inputs are used in determining the value of the Series’ assets or liabilities carried at fair value. These inputs are summarized in three broad levels. Level 1 includes quoted prices in active markets for identical assets and liabilities. Level 2 includes other significant observable inputs (including quoted prices for similar securities, interest rates, prepayment speeds, credit risk, etc.). Level 3 includes significant unobservable inputs (including the Series’ own assumptions in determining the fair value of investments). A financial instrument’s level within the fair value hierarchy is based on the lowest level of any input both individually and in aggregate that is significant to the fair value measurement. The inputs or methodology used for valuing securities are not necessarily an indication of the risk associated with investing in those securities.
The following is a summary of the valuation levels used for major security types as of December 31, 2015 in valuing the Series’ assets or liabilities carried at fair value:
| DESCRIPTION | TOTAL | LEVEL 1 | LEVEL 2 | LEVEL 3 | ||||||||||||
Assets: | ||||||||||||||||
Equity securities: | ||||||||||||||||
Consumer Discretionary | $ | 6,758,521 | $ | 4,283,344 | $ | 2,475,177 | $ | — | ||||||||
Financials | 255,942,687 | 250,394,463 | 5,548,224 | — | ||||||||||||
Information Technology | 3,644,834 | 3,644,834 | — | — | ||||||||||||
Utilities | — | — | — | — | * | |||||||||||
Mutual funds | 327,770 | 327,770 | — | — | ||||||||||||
|
|
|
|
|
|
|
| |||||||||
Total assets | $ | 266,673,812 | $ | 258,650,411 | $ | 8,023,401 | $ | — | ||||||||
|
|
|
|
|
|
|
| |||||||||
*Prime AET&D Holdings No.1 Ltd. is a Level 3 security as of December 31, 2015. However, there is no value for this security reported in the financial statements. There was no activity in this security for the year ended December 31, 2015.
Please see the Investment Portfolio for foreign securities where a factor from a third party vendor was applied to determine the securities’ fair value following the close of local trading. Such securities are included in Level 2 in the table above.
The Fund’s policy is to recognize transfers in and transfers out of the valuation levels as of the beginning of the reporting period. There were no transfers between fair value levels during the year ended December 31, 2015.
Security Transactions, Investment Income and Expenses
Security transactions are accounted for on trade date. Dividend income is recorded on the ex-dividend date, except that if the ex-dividend date has passed, certain dividends from foreign securities are recorded as soon as the Series is informed of the ex-dividend date. Non-cash dividends, if any, are recorded at the fair value of the securities received. Interest income, including amortization of premium and accretion of discounts using the effective interest method, is earned from settlement date and accrued daily.
Expenses are recorded on an accrual basis. Most expenses of the Fund can be attributed to a specific series. Expenses which cannot be directly attributed are apportioned among the series in the Fund in such a manner as deemed equitable by the Fund’s Board, taking into consideration, among other things, the nature and type of expense. Income, expenses (other than shareholder services fees), and realized and unrealized gains and losses are prorated among the classes based on the relative net assets of each class. Class specific expenses are directly charged to that class.
The Fund records distributions received in excess of income from underlying investments as a reduction of cost of investments and/or realized gain. Such amounts are based on estimates if actual amounts are not available and actual amounts of income, realized gain and return of capital may differ from the estimated amounts. The Fund adjusts the estimated amounts of
16
Real Estate Series
Notes to Financial Statements (continued)
| 2. | Significant Accounting Policies (continued) |
Security Transactions, Investment Income and Expenses (continued)
components of distributions (and consequently its net investment income) as necessary once the issuers provide information about the actual composition of the distributions.
The Series uses the identified cost method for determining realized gain or loss on investments for both financial statement and federal income tax reporting purposes.
Option Contracts
The Series may write (sell) or buy call or put options on securities and other financial instruments. When the Series writes a call, the Series gives the purchaser the right to buy the underlying security from the Series at the price specified in the option contract (the “exercise price”) at any time during the option period. When the Series writes a put option, the Series gives the purchaser the right to sell to the Series the underlying security at the exercise price at any time during the option period. The Series will only write options on a “covered basis.” This means that the Series will own the underlying security when the Series writes a call or the Series will put aside cash, U.S. Government securities, or other liquid assets in an amount not less than the exercise price at all times the put option is outstanding.
When the Series writes an option, an amount equal to the premium received is reflected as a liability and is subsequently marked-to-market to reflect the current market value of the option. The Series, as a writer of an option, has no control over whether the underlying security or financial instrument may be sold (call) or purchased (put) and, as a result, bears the market risk of an unfavorable change in the price of the security or financial instrument underlying the written option. There is a risk that the Series may not be able to enter into a closing transaction because of an illiquid market.
The Series may also purchase options in an attempt to hedge against fluctuations in the value of its portfolio and to protect against declines in the value of the securities. The premium paid by the Series for the purchase of an option is reflected as an investment and subsequently marked-to-market to reflect the current market value of the option. The risk associated with purchasing options is limited to the premium paid.
When a security is purchased or sold through an exercise of an option, the related premium paid (or received) is added to (or deducted from) the basis of the security acquired or deducted from (or added to) the proceeds of the security sold. When an option expires (or the Series enters into a closing transaction), the Series realizes a gain or loss on the option to the extent of the premium received or paid (or gain or loss to the extent the cost of the closing transaction exceeds the premium paid or received).
The measurement of the risks associated with option contracts is meaningful only when all related and offsetting transactions are considered. No such investments were held by the Series on December 31, 2015.
17
Real Estate Series
Notes to Financial Statements (continued)
| 2. | Significant Accounting Policies (continued) |
The following table presents the effect of the derivative instruments on the Statement of Operations:
| STATEMENT OF OPERATIONS | ||||||
Derivative | Location of Gain or (Loss) on Derivatives | | Realized Gain (Loss) on Derivatives | | ||
Equity contracts | Net realized gain (loss) on options written | $ | 190,635 | |||
The average month-end balances for the period of January 1, 2015 to December 31, 2015 of outstanding derivative financial instruments were as follows:
Options: | ||||
Average number of option contracts written | 1,823 | |||
Average notional value of option contracts written | $ | 15,198,500 | ||
Written Option Rollforward
Transactions in options written for the year ended December 31, 2015, were as follows:
| CALLS | ||||||||
| CONTRACTS | PREMIUMS RECEIVED | |||||||
Outstanding options, beginning of year | — | — | ||||||
Options written | 4,095 | $ | 265,977 | |||||
Options exercised | (962 | ) | (62,049 | ) | ||||
Options expired | (2,683 | ) | (192,846 | ) | ||||
Options closed | (450 | ) | (11,082 | ) | ||||
|
|
|
| |||||
Outstanding options, end of year | — | $ | — | |||||
|
|
|
| |||||
Foreign Currency Translation
The books and records of the Series are maintained in U.S. dollars. Foreign currencies, investments and other assets and liabilities are translated into U.S. dollars at the current exchange rates. Purchases and sales of investment securities and income and expenses are translated on the respective dates of such transactions. The Series does not isolate realized and unrealized gains and losses attributable to changes in the exchange rates from gains and losses that arise from changes in the market value of investments. Such fluctuations are included with net realized and unrealized gain or loss on investments. Net realized foreign currency gains and losses represent foreign currency gains and losses between trade date and settlement date on securities transactions, gains and losses on disposition of foreign currencies and the difference between the amount of income and foreign withholding taxes recorded on the books of the Series and the amounts actually received or paid.
Federal Taxes
The Series’ policy is to comply with the provisions of the Internal Revenue Code applicable to regulated investment companies. The Series is not subject to federal income tax or excise tax to the extent that the Series distributes to shareholders each year its taxable income, including any net realized gains on investments, in accordance with requirements of the Internal Revenue Code. Accordingly, no provision for federal income tax or excise tax has been made in the financial statements.
Management evaluates its tax positions to determine if the tax positions taken meet the minimum recognition threshold in connection with accounting for uncertainties in income tax positions taken or expected to be taken for the purposes of measuring and recognizing tax liabilities in the financial statements. Recognition of tax benefits of an uncertain tax position is required only when the position is “more likely than not” to be sustained assuming examination by taxing authorities. At December 31, 2015, the Series has recorded no liability for net unrecognized tax benefits relating to uncertain income tax positions taken or expected to be taken in future tax returns.
18
Real Estate Series
Notes to Financial Statements (continued)
| 2. | Significant Accounting Policies (continued) |
Federal Taxes (continued)
The Series files income tax returns in the U.S. federal jurisdiction, various states and foreign jurisdictions, as required. No income tax returns are currently under investigation. The statute of limitations on the Series’ tax returns remains open for the years ended December 31, 2012 through December 31, 2015. The Series is not aware of any tax positions for which it is reasonably possible that the total amounts of unrecognized tax benefits will significantly change in the next twelve months.
Foreign Taxes
Based on the Series’ understanding of the tax rules and rates related to income, gains and currency purchase/repatriation transactions for foreign jurisdictions in which it invests, the Series will provide for foreign taxes, and where appropriate, deferred foreign tax.
Distributions of Income and Gains
Distributions to shareholders of net investment income and net realized gains are made annually. An additional distribution may be necessary to avoid taxation of the Series. Distributions are recorded on the ex-dividend date.
Indemnifications
The Fund’s organizational documents provide former and current directors and officers with a limited indemnification against liabilities arising in connection with the performance of their duties to the Fund. In the normal course of business, the Fund may also enter into contracts that provide general indemnifications. The Fund’s maximum exposure under these arrangements is unknown as this would be dependent on future claims that may be made against the Fund. The risk of material loss from such claims is considered remote.
Other
The preparation of financial statements in conformity with GAAP requires management to make estimates and assumptions that affect the reported amounts of assets and liabilities and the disclosure of contingent assets and liabilities at the date of the financial statements and the reported amounts of income and expenses during the reporting period. Actual results could differ from those estimates.
| 3. | Transactions with Affiliates |
The Fund has an Investment Advisory Agreement (the “Agreement”) with the Advisor, for which the Series pays a fee, computed daily and payable monthly, at an annual rate of 0.75% of the Series’ average daily net assets.
Under the Agreement, personnel of the Advisor provide the Series with advice and assistance in the choice of investments and the execution of securities transactions, and otherwise maintain the Series’ organization. The Advisor also provides the Fund with necessary office space and fund administration and support services. The salaries of all officers of the Fund (except a percentage of the Fund’s Chief Compliance Officer’s salary, which is paid by the Fund), and of all Directors who are “affiliated persons” of the Fund, or of the Advisor, and all personnel of the Fund, or of the Advisor, performing services relating to research, statistical and investment activities, are paid by the Advisor. Each “non-affiliated” Director receives an annual stipend, which is allocated among all the active series of the Fund. In addition, these Directors also receive a fee per Board meeting attended plus a fee for each committee meeting attended and are reimbursed for travel and other out-of-pocket expenses incurred by them in connection with attending such meetings. The Fund also has an Audit Committee Chair, who receives an additional annual stipend for this role.
The Class S shares of the Series are subject to a shareholder services fee in accordance with a shareholder services plan adopted by the Board. The shareholder services fee is intended to compensate financial intermediaries, including affiliates of the Fund, in connection with the provision of direct client service, personal services, maintenance of shareholder accounts and reporting services. For these services, Class S of the Series pays a fee, computed daily and payable monthly, at an annual rate of 0.25% of the average daily net assets of Class S. The Fund has a Shareholder Services Agreement with the Advisor, for which the Advisor receives the shareholder services fee as stated above.
19
Real Estate Series
Notes to Financial Statements (continued)
| 3. | Transactions with Affiliates (continued) |
The Advisor has contractually agreed, until at least April 30, 2016, to waive its management fee and, if necessary, pay other operating expenses of the Series in order to maintain total direct annual fund operating expenses for the Series, exclusive of each share class’ shareholder services fee, at no more than 0.95% of average daily net assets. The Advisor did not waive any fees for the year ended December 31, 2015. The Advisor is not eligible to recoup any expenses that have been waived or reimbursed in prior years.
Manning & Napier Investor Services, Inc., a registered broker-dealer affiliate of the Advisor, acts as distributor for the Fund’s shares. The services of Manning & Napier Investor Services, Inc. are provided at no additional cost to the Series.
Pursuant to a master services agreement dated November 1, 2014, the Fund pays the Advisor an annual fee related to fund accounting and administration of 0.0085% on the first $25 billion of average daily net assets (excluding Target Series and Strategic Income Series); 0.0075% on the next $15 billion of average daily net assets (excluding Target Series and Strategic Income Series); and 0.0065% of the average daily net assets in excess of $40 billion (excluding Target Series and Strategic Income Series); plus a base fee of $30,400 per series. Transfer agent fees are charged to the Fund on a per account basis. Additionally, certain transaction and out-of-pocket expenses, including charges for reporting relating to the Fund’s compliance program, are charged. The Advisor has agreements with BNY Mellon Investment Servicing (U.S.) Inc. (“BNY”) under which BNY serves as sub-accountant services agent and sub-transfer agent.
Expenses not directly attributable to a Series are allocated based on each Series’ relative net assets or number of accounts, depending on the expense.
| 4. | Purchases and Sales of Securities |
For the year ended December 31, 2015, purchases and sales of securities, other than U.S. Government securities and short-term securities, were $156,014,850 and $169,441,440, respectively. There were no purchases or sales of U.S. Government securities.
| 5. | Capital Stock Transactions |
Transactions in shares of Class S and I shares of Real Estate Series were:
| CLASS S | FOR THE YEAR ENDED 12/31/2015 | FOR THE YEAR ENDED 12/31/2014 | ||||||||||||||
| SHARES | AMOUNT | SHARES | AMOUNT | |||||||||||||
Sold | 1,827,297 | $ | 28,669,799 | 2,877,508 | $ | 43,298,509 | ||||||||||
Reinvested | 1,845,882 | 25,692,698 | 1,371,635 | 20,505,790 | ||||||||||||
Repurchased | (3,271,852 | ) | (50,497,891 | ) | (1,925,594 | ) | (29,217,124 | ) | ||||||||
|
|
|
|
|
|
|
| |||||||||
Total | 401,327 | $ | 3,864,606 | 2,323,549 | $ | 34,587,175 | ||||||||||
|
|
|
|
|
|
|
| |||||||||
| CLASS I | FOR THE YEAR ENDED 12/31/15 | FOR THE YEAR ENDED 12/31/14 | ||||||||||||||
| SHARES | AMOUNT | SHARES | AMOUNT | |||||||||||||
Sold | 1,408,025 | $ | 12,266,405 | 1,529,781 | $ | 13,799,732 | ||||||||||
Reinvested | 1,409,104 | 10,193,308 | 828,373 | 7,151,070 | ||||||||||||
Repurchased | (1,593,713 | ) | (13,804,164 | ) | (1,221,118 | ) | (11,141,114 | ) | ||||||||
|
|
|
|
|
|
|
| |||||||||
Total | 1,223,416 | $ | 8,655,549 | 1,137,036 | $ | 9,809,688 | ||||||||||
|
|
|
|
|
|
|
| |||||||||
Approximately 90% of the shares outstanding are held by fiduciary accounts where the Advisor has sole investment discretion.
20
Real Estate Series
Notes to Financial Statements (continued)
| 6. | Financial Instruments |
The Series may trade in instruments including written and purchased options, forward foreign currency exchange contracts and futures contracts and other derivatives in the normal course of investing activities to assist in managing exposure to various market risks. The Series may be subject to various elements of risk, which may involve, to a varying degree, elements of risk in excess of the amounts recognized for financial statement purposes. These risks include: the risk that changes in the value of a derivative may not correlate perfectly with the underlying asset, rate or index; counterparty credit risk related to over the counter derivative counterparties’ failure to perform under contract terms; liquidity risk related to the lack of a liquid market for these contracts allowing the fund to close out its position(s); and documentation risk relating to disagreement over contract terms. No such investments were held by the Series as of December 31, 2015.
| 7. | Foreign Securities |
Investing in securities of foreign companies and foreign governments involves special risks and considerations not typically associated with investing in securities of domestic companies and the U.S. Government. These risks include revaluation of currencies and future adverse political and economic developments. Moreover, securities of foreign companies and foreign governments and their markets may be less liquid and their prices more volatile than those of comparable domestic companies and the U.S. Government.
| 8. | Real Estate Securities |
The Series may focus its investments in certain real estate related industries; hence, the Series may subject itself to a greater degree of risk than a series that is more diversified.
| 9. | Federal Income Tax Information |
The amount and characterization of certain income and capital gains to be distributed are determined in accordance with federal income tax regulations, which may differ from GAAP. These differences are primarily due to differing book and tax treatments in the timing and/or treatment of the recognition of net investment income or gains and losses, including foreign currency gains and losses, redesignation of distributions paid, investments in passive foreign investment companies (PFICs), equalization and qualified late-year losses. The Series may periodically make reclassifications among its capital accounts to reflect income and gains available for distribution (or available capital loss carryovers) under income tax regulations without impacting the Series’ net asset value. For the year ended December 31, 2015, $2,039,161 was reclassified to Distributions in Excess of Net Investment Income, $2,046,950 was reclassified from Accumulated Net Realized Gain on Investments and $7,789 was reclassified to Additional paid-in-capital. Any such reclassifications are not reflected in the financial highlights.
The tax character of distributions paid were as follows:
FOR THE YEAR ENDED 12/31/15 | FOR THE YEAR ENDED 12/31/14 | |||||||
Ordinary income | $ | 4,320,877 | $ | 10,317,395 | ||||
Long-term capital gains | 32,752,304 | 18,219,635 | ||||||
At December 31, 2015, the tax basis of components of distributable earnings and the net unrealized appreciation based on identified cost for federal income tax purposes were as follows:
Cost for federal income tax purposes | $ | 236,598,072 | ||
Unrealized appreciation | 37,432,084 | |||
Unrealized depreciation | (7,356,344 | ) | ||
|
| |||
Net unrealized appreciation | $ | 30,075,740 | ||
|
| |||
Undistributed long-term gains | $ | 3,554,019 |
21
Real Estate Series
Report of Independent Registered Public Accounting Firm
To the Board of Directors of Manning & Napier Fund, Inc. and Shareholders of Real Estate Series:
In our opinion, the accompanying statement of assets and liabilities, including the investment portfolio, and the related statements of operations and of changes in net assets and the financial highlights present fairly, in all material respects, the financial position of Real Estate Series (a series of Manning & Napier Fund, Inc., hereafter referred to as the “Series”) at December 31, 2015, the results of its operations for the year then ended, the changes in its net assets for each of the two years in the period then ended and the financial highlights for each of the periods presented, in conformity with accounting principles generally accepted in the United States of America. These financial statements and financial highlights (hereafter referred to as “financial statements”) are the responsibility of the Series’ management. Our responsibility is to express an opinion on these financial statements based on our audits. We conducted our audits of these financial statements in accordance with the standards of the Public Company Accounting Oversight Board (United States). Those standards require that we plan and perform the audit to obtain reasonable assurance about whether the financial statements are free of material misstatement. An audit includes examining, on a test basis, evidence supporting the amounts and disclosures in the financial statements, assessing the accounting principles used and significant estimates made by management, and evaluating the overall financial statement presentation. We believe that our audits, which included confirmation of securities at December 31, 2015 by correspondence with the custodian and brokers, provide a reasonable basis for our opinion.

New York, New York
February 19, 2016
22
Real Estate Series
Supplemental Tax Information
(unaudited)
All reportings are based on financial information available as of the date of this annual report and, accordingly, are subject to change.
For federal income tax purposes, the Series reports for the current fiscal year $103,181 or, if different, the maximum amount allowable under the tax law as qualified dividend income.
For corporate shareholders, the percentage of investment income (dividend income plus short-term gains, if any) that qualifies for the dividends received deduction for the current fiscal year is 7.66%, or if different, the maximum allowable under tax law.
The Series designates $32,605,834 as Long-Term Capital Gain dividends pursuant to Section 852(b) of the Internal Revenue Code for the fiscal year ended December 31, 2015.
23
Real Estate Series
Renewal of Investment Advisory Agreement
(unaudited)
At the Manning & Napier Fund, Inc. (the “Fund”) Board of Directors’ (the “Board”) meeting, held on November 17, 2015, the Investment Advisory Agreement (the “Agreement”) between the Fund and Manning & Napier Advisors, LLC (the “Advisor”) was considered by the Board for renewal. In connection with the decision whether to renew the Agreement, a variety of material was prepared for and considered by the Board.
Representatives of the Advisor attended the meeting and presented additional oral and written information to the Board to assist the Board in its considerations. The discussion immediately below outlines the materials and information presented to the Board in connection with the Board’s 2015 Annual consideration of the Agreement and the conclusions made by the Directors when determining to continue the Agreement.
| • | The Board considered the services provided by the Advisor under the Agreement including, among others: deciding what securities to purchase and sell for each Series; arranging for the purchase and sale of such securities by placing orders with broker-dealers; administering the affairs of the Fund (including the books and records of the Fund not maintained by third party service providers such as the custodian or sub-transfer agent); arranging for the insurance coverage for the Fund; and supervising the preparation of tax returns, SEC filings (including registration statements) and reports to shareholders for the Fund. The Board also considered the nature and quality of such services provided under the Agreement in light of the Advisor’s services provided to the Fund for 29 years. The Board discussed the quality of these services with representatives from the Advisor and concluded that the Advisor was performing its services to the Fund required under the Agreement in a reasonable manner. |
| • | The Board considered the performance of each Series since its inception, as well as performance over multiple time periods. Performance for one or more of the following time periods was considered as applicable to the Series’ inception date: inception, three year, five year, ten year, and current market cycle. A market cycle includes periods of both rising and falling markets. Returns for established benchmark indices for each Series were provided. In addition, the Board considered a number of other factors relevant to performance at the meeting (and considers on a quarterly basis) including: a peer group performance analysis consisting of Morningstar universes of mutual funds with similar investment objectives, investment performance of core products, product offerings, performance on an aggregate basis vs. performance over reasonable time periods and the Advisor’s investment process. The Directors acknowledged the challenging performance and discussed the investment process of the Advisor. The Directors confirmed that qualitative factors such as the Advisor’s investment process, including recent enhancements, were an important subset to be considered as part of their consideration of performance. The Board discussed the performance with representatives from the Advisor and concluded that the investment performance of each of the Fund’s Series was reasonable based on the Series’ actual performance and comparative performance, especially for those series with performance over the current market cycle. |
| • | The Board considered the costs of the Advisor’s services and the profits of the Advisor as they relate to the Advisor’s services to the Fund under the Agreement. In reviewing the Advisor’s costs and profits, the Board discussed the Advisor’s revenues generated from the Fund (on both an actual and adjusted basis) and its expenses associated with providing the services under the Agreement. In addition, the Board reviewed the Advisor’s expenses associated with Fund activities outside of the Agreement (such as expense reimbursements pursuant to expense caps and payments made by the Advisor to third party platforms on which shares of the Fund are available for purchase). It was noted by representatives of the Advisor that 22 of the 36 active Series of the Fund are currently experiencing expenses above the capped expense ratios, and thus the Advisor is incurring those expenses over the cap. After discussing the above costs and profits, the Board concluded that the Advisor’s profitability relating to its services provided under the Agreement was reasonable. |
| • | The Board considered the fees and expenses of the various Series of the Fund. The Advisor presented the advisory fees and total expenses for each Series, including the advisory fee adjusted for any expense waivers or reimbursements (either contractual or voluntary) paid by the Advisor. The advisory fees and expense ratios of each Series were compared to an average (on both a mean and median basis) of similar funds as disclosed on the Morningstar database. Representatives of the Advisor discussed with the Board the levels of its advisory fee for each Series of the Fund and as compared to the median and mean advisory fees for similar funds as listed on Morningstar. Expense ratios for every Series, except the Tax Managed Series, Equity Income Class S, High Yield Bond Class S, Pro-Blend Series Classes C and R, and Target Series’ Classes R and K, are lower than, or substantially similar to the Morningstar mean and median reported total expense ratio. |
24
Real Estate Series
Renewal of Investment Advisory Agreement
(unaudited)
| The higher than mean and median total expense ratios for Classes C and R reflect higher distribution, marketing and shareholder service fees payable to broker-dealers through a 100bp 12b-1 fee for Class C and a 50bp 12b-1 fee for Class R. Based on their review of the information provided, the Board concluded that the fees and expenses of each Series of the Fund were reasonable on a comparative basis. |
| • | The Board also considered the other benefits the Advisor derives from its relationship with the Fund. Such other benefits include certain research services provided by soft dollars. The Board reviewed the broker-dealers who provided research to the Advisor and the products and services paid for, in whole or in part, using soft dollar commissions. Given the level of soft dollar transactions involving the Fund, the Board concluded that these additional benefits to the Advisor were reasonable. |
| • | In addition to the factors described above, the Board considered the Advisor’s personnel, investment strategies, policies and procedures relating to compliance with personal securities transactions, reputation, expertise and resources in domestic and foreign financial markets. The Board concluded that these factors support the conclusion that the Advisor performs its services in a reasonable manner. |
| • | The Board then considered economies of scale and concluded that the current fee schedule to the advisory agreement remained reasonable given the multiple uses of the Fund (for the Advisor’s discretionary investment account clients in addition to direct investors), the current profitability of the Advisor’s services to the Fund under the Agreement, the number of newly established series of the Fund and the overall size of the Fund complex. |
Based on the Board’s deliberations and their evaluation of the information described above, the Board, including a majority of Directors that are not “interested persons” as defined in the Investment Company Act of 1940, concluded that the compensation under the Agreement was fair and reasonable in light of the services and expenses and such other matters as the Directors considered to be relevant in the exercise of their reasonable judgment. Accordingly, the Board approved the renewal of the Agreement. In the course of their deliberations, the Directors did not identify any particular information that was all important or controlling.
25
Real Estate Series
Directors’ and Officers’ Information
(unaudited)
The Statement of Additional Information provides additional information about the Fund’s directors and officers and can be obtained without charge by calling 1-800-466-3863, at www.manningnapieradvisors.com, or on the EDGAR Database on the SEC Internet web site (http:// www.sec.gov). The following chart shows certain information about the Fund’s officers and directors, including their principal occupations during the last five years. Unless specific dates are provided, the individuals have held the listed positions for longer than five years.
Interested Director/Officer
| Name: | James E. Mikolaichik* | |
| Address: | 290 Woodcliff Drive | |
| Fairport, NY 14450 | ||
| Age: | 44 | |
| Current Position(s) Held with Fund: | Principal Executive Officer, President, Chairman & Director | |
| Term of Office1 & Length of Time Served: | Indefinite - Chairman and Director since August 2015 | |
| Principal Occupation(s) During Past 5 Years: | Chief Financial Officer (since 2011) - Manning & Napier Advisors, LLC; Executive Vice President and Head of Strategy (2008-2011) and Chief Risk Officer (2004-2008) - Old Mutual Asset Management Holds or has held one or more of the following title for various subsidiaries and affiliates: Chief Financial Officer. | |
| Number of Portfolios Overseen within Fund Complex: | 41 | |
| Other Directorships Held Outside Fund Complex: | N/A |
Independent Directors
| ||
| Name: | Stephen B. Ashley | |
| Address: | 290 Woodcliff Drive | |
| Fairport, NY 14450 | ||
| Age: | 75 | |
| Current Position(s) Held with Fund: | Director, Audit Committee Member, Governance & Nominating Committee Member | |
| Term of Office & Length of Time Served: | Indefinite - Since 1996 | |
| Principal Occupation(s) During Past 5 Years: | Chairman, Director, President & Chief Executive Officer (1997 to present) - The Ashley Group (property management and investment); Director (1995-2008) and Chairman (non-executive) (2004-2008) - Fannie Mae (mortgage). | |
| Number of Portfolios Overseen within Fund Complex: | 41 | |
| Other Directorships Held Outside Fund Complex: | Fannie Mae (1995-2008) The Ashley Group (1995-2008) Genesee Corporation (1987-2007) |
| Name: | Paul A. Brooke | |
| Address: | 290 Woodcliff Drive | |
| Fairport, NY 14450 | ||
| Age: | 70 | |
| Current Position(s) Held with Fund: | Director, Audit Committee Member, Governance & Nominating Committee Member | |
| Term of Office & Length of Time Served: | Indefinite - Since 2007 | |
| Principal Occupation(s) During Past 5 Years: | Chairman & CEO (2005-2009) - Ithaka Acquisition Corporation (investments); Chairman (2007-2009) Alsius Corporation (investments); Managing Member, PMSV Holdings LLC (investments) since 1991; Managing Member, Venbio (investments) since 2010. | |
| Number of Portfolios Overseen within Fund Complex: | 41 | |
| Other Directorships Held Outside Fund Complex: | Incyte Corp. (2000-present) ViroPharma, Inc. (2000-2014) HLTH Corp (WebMD) (2000-2010) Cheyne Capital International (2000-present) GMP Companies (2000-2011) Cytos Biotechnology Ltd. (2012-2014)
|
26
Real Estate Series
Directors’ and Officers’ Information
(unaudited)
Independent Directors (continued)
| Name: | Peter L. Faber | |
| Address: | 290 Woodcliff Drive | |
| Fairport, NY 14450 | ||
| Age: | 77 | |
| Current Position(s) Held with Fund: | Director, Governance & Nominating Committee Member | |
| Term of Office & Length of Time Served: | Indefinite - Since 1987 | |
| Principal Occupation(s) During Past 5 Years: | Senior Counsel (2006-2012), Partner (1995-2006 & 2013-present) - McDermott, Will & Emery LLP (law firm) | |
| Number of Portfolios Overseen within Fund Complex: | 41 | |
| Other Directorships Held Outside Fund Complex: | Boston Early Music Festival (non-profit)(2007-present) Amherst Early Music, Inc. (non-profit)(2009-present) Gotham Early Music Scene, Inc. (non-profit)(2009-present) Partnership for New York City, Inc. (non-profit) (1989-2010) New York Collegium (non-profit) (2004-2011) | |
| Name: | Harris H. Rusitzky | |
| Address: | 290 Woodcliff Drive | |
| Fairport, NY 14450 | ||
| Age: | 80 | |
| Current Position(s) Held with Fund: | Director, Audit Committee Member, Governance & Nominating Committee Member | |
| Term of Office & Length of Time Served: | Indefinite - Since 1985 | |
| Principal Occupation(s) During Past 5 Years: | President, The Greening Group (business consultants) since 1994; Partner, The Restaurant Group (restaurants) since 2006 | |
| Number of Portfolios Overseen within Fund Complex: | 41 | |
| Other Directorships Held Outside Fund Complex: | Rochester Institute of Technology (university)(1972-present) Culinary Institute of America (non-profit college)(1985-present) George Eastman House (museum)(1988-present) National Restaurant Association (restaurant trade organization)(1978- present) | |
| Name: | Chester N. Watson | |
| Address: | 290 Woodcliff Drive | |
| Fairport, NY 14450 | ||
| Age: | 65 | |
| Current Position(s) Held with Fund: | Director, Audit Committee Chairman, Governance & Nominating Committee Member | |
| Term of Office & Length of Time Served: | Indefinite - Since 2012 | |
| Principal Occupation(s) During Past 5 Years: | General Auditor (2003-2011) - General Motors Company (auto manufacturer) | |
| Number of Portfolios Overseen within Fund Complex: | 41 | |
| Other Directorships Held Outside Fund Complex: | Rochester Institute of Technology (university)(2005-present) |
Officers
| Name: | Jeffrey S. Coons, Ph.D., CFA | |
| Address: | 290 Woodcliff Drive | |
| Fairport, NY 14450 | ||
| Age: | 52 | |
| Current Position(s) Held with Fund: | Vice President | |
| Term of Office1 & Length of Time Served: | Since 2004 | |
| Principal Occupation(s) During Past 5 Years: | President since 2010, Co-Director of Research (2002-2015) - Manning & Napier Advisors, LLC Holds one or more of the following titles for various subsidiaries and affiliates: President, Director, Treasurer or Senior Trust Officer. | |
| Number of Portfolios Overseen within Fund Complex: | 41 | |
| Other Directorships Held Outside Fund Complex: | N/A
|
27
Real Estate Series
Directors’ and Officers’ Information
(unaudited)
Officers (continued)
| Name: | Elizabeth Craig | |
| Address: | 290 Woodcliff Drive | |
| Fairport, NY 14450 | ||
| Age: | 28 | |
| Current Position(s) Held with Fund: | Assistant Corporate Secretary | |
| Term of Office1 & Length of Time Served: | Since 2011 | |
| Principal Occupation(s) During Past 5 Years: | Fund Administration Manager since 2015; Mutual Fund Compliance Specialist (2009-2015) - Manning & Napier Advisors, LLC | |
| Number of Portfolios Overseen within Fund Complex: | 41 | |
| Other Directorships Held Outside Fund Complex: | N/A | |
| Name: | Christine Glavin | |
| Address: | 290 Woodcliff Drive | |
| Fairport, NY 14450 | ||
| Age: | 49 | |
| Current Position(s) Held with Fund: | Principal Financial Officer, Chief Financial Officer | |
| Term of Office1 & Length of Time Served: | Principal Financial Officer since 2002; Chief Financial Officer since 2001 | |
| Principal Occupation(s) During Past 5 Years: | Director of Fund Reporting since 2011; Fund Reporting Manager (1997-2011) - Manning & Napier Advisors, LLC; Assistant Treasurer since 2008 - Exeter Trust Company | |
| Number of Portfolios Overseen within Fund Complex: | 41 | |
| Other Directorships Held Outside Fund Complex: | N/A | |
| Name: | Jodi L. Hedberg | |
| Address: | 290 Woodcliff Drive | |
| Fairport, NY 14450 | ||
| Age: | 48 | |
| Current Position(s) Held with Fund: | Corporate Secretary, Chief Compliance Officer, Anti-Money Laundering Compliance Officer | |
| Term of Office1 & Length of Time Served: | Corporate Secretary since 1997; Chief Compliance Officer since 2004; Anti-Money Laundering Compliance Officer since 2002 | |
| Principal Occupation(s) During Past 5 Years: | Director of Compliance since 2005; Compliance Manager (1995-2005) - Manning & Napier Advisors, LLC and affiliates; Corporate Secretary - Manning & Napier Investor Services, Inc. since 2006 | |
| Number of Portfolios Overseen within Fund Complex: | 41 | |
| Other Directorships Held Outside Fund Complex: | N/A | |
| Name: | Richard Yates | |
| Address: | 290 Woodcliff Drive | |
| Fairport, NY 14450 | ||
| Age: | 50 | |
| Current Position(s) Held with Fund: | Chief Legal Officer | |
| Term of Office1 & Length of Time Served: | Chief Legal Officer since 2004 | |
| Principal Occupation(s) During Past 5 Years: | Counsel - Manning & Napier Advisors, LLC and affiliates since 2000; Holds one or more of the following titles for various affiliates; Director or Corporate Secretary | |
| Number of Portfolios Overseen within Fund Complex: | 41 | |
| Other Directorships Held Outside Fund Complex: | N/A |
*Interested Director, within the meaning of the Investment Company Act of 1940 by reason of his position with the Fund’s investment advisor and distributor. Mr. Mikolaichik serves as the Chief Financial Officer for Manning & Napier Advisors, LLC.
1The term of office of all officers shall be one year and until their respective successors are chosen and qualified, or his or her earlier resignation or removal as provided in the Fund’s By-Laws.
28
Real Estate Series
Results of Special Meeting of Shareholders
(unaudited)
A Special Meeting of the Shareholders of the Fund was held on August 18, 2015. The number of votes necessary to conduct the meeting and approve the proposal was obtained, and the results of the vote of shareholders of all the Series of the Fund voting together in the aggregate is listed below:
PROPOSAL 1:
Election of Directors
| NUMBER OF SHARES VOTED FOR | NUMBER OF SHARES WITHELD | |||||||
Stephen B. Ashley | 883,968,395 | 8,618,094 | ||||||
Paul A. Brooke | 884,510,661 | 8,075,828 | ||||||
Peter L. Faber | 884,140,893 | 8,445,596 | ||||||
James E. Mikolaichik | 883,391,832 | 9,194,657 | ||||||
Harris H. Rusitzky | 620,022,215 | 272,564,274 | ||||||
Chester N. Watson | 884,638,809 | 7,947,680 | ||||||
29
Real Estate Series
Literature Requests
(unaudited)
Proxy Voting Policies and Procedures
A description of the policies and procedures that the Fund uses to determine how to vote proxies relating to portfolio securities is available, without charge, upon request:
| By phone | 1-800-466-3863 | |||
| On the Securities and Exchange | ||||
| Commission’s (SEC) web site | http://www.sec.gov |
Proxy Voting Record
Information regarding how the Fund voted proxies relating to portfolio securities during the most recent 12-month period ended June 30th is available, without charge, upon request:
| By phone | 1-800-466-3863 | |||
| On the SEC’s web site | http://www.sec.gov |
Quarterly Portfolio Holdings
The Series’ complete schedule of portfolio holdings for the 1st and 3rd quarters of each fiscal year are provided on Form N-Q, and are available, without charge, upon request:
| By phone | 1-800-466-3863 | |||
| On the SEC’s web site | http://www.sec.gov |
The Series’ Form N-Q may be reviewed and copied at the SEC’s Public Reference Room in Washington, D.C. Information on the operation of the Public Reference Room may be obtained by calling 1-800-SEC-0330.
Prospectus and Statement of Additional Information (SAI)
For more information about any of the Manning & Napier Fund, Inc. Series, you may obtain a prospectus and SAI at www.manning-napier.com or by calling (800) 466-3863. Before investing, carefully consider the objectives, risks, charges and expenses of the investment and read the prospectus carefully as it contains this and other information about the investment company. In addition, this information can be found on the SEC’s web site, http://www.sec.gov.
Additional information available at www.manning-napier.com
1. Fund Holdings - Month-End
2. Fund Holdings - Quarter-End
3. Shareholder Report - Annual
4. Shareholder Report - Semi-Annual
The Fund also offers electronic notification or “e-delivery” when certain documents are available on-line to be downloaded or reviewed. Direct shareholders can elect to receive electronic notification when shareholder reports, prospectus updates, and/or statements are available. If you do not currently have on-line access to your account, you can establish access by going to www.manning-napier.com, click on “Login” in the top corner of the page, and follow the prompts to self-enroll. Once enrolled, you can set your electronic notification preferences by clicking on the Account Options tab located within the green toolbar and then select E-Delivery Option. Should you have any questions on either how to establish on-line access or how to update your account settings, please contact Investor Services at 1-800-466-3863.
The Manning & Napier Fund, Inc. is managed by Manning & Napier Advisors, LLC. Manning & Napier Investor Services, Inc., an affiliate of Manning & Napier Advisors, LLC, is the distributor of the Fund shares.
MNRES-12/15-AR
International Series
Management Discussion and Analysis
(unaudited)
Dear Shareholders:
Volatility defined global equity markets during the past year, largely driven by macroeconomic factors. Markets around the world experienced a correction in late August amidst a broad selloff triggered by renewed concerns about economic growth in emerging markets — China in particular — and uncertainty about the effects of that slowdown on overall global growth. Developed economies continued to provide accommodative monetary policy to combat growth concerns, although in December the U.S. Federal Reserve raised the federal funds rate for the first time in nearly a decade. For much of the year, Europe struggled with uncertainty regarding Greece’s ability to secure bailout funding from its creditors, which negatively affected investor sentiment. China’s economy slowed, but the government continued to demonstrate a willingness to provide support through a combination of policy-easing maneuvers and targeted stimulus measures. The U.S. economy remained on a path of slow growth that nevertheless made it the best performing developed economy. U.S. stocks were largely flat for the year, whereas global equity markets moderately declined. Looking ahead, we expect the slow global growth environment to remain in place for the foreseeable future.
As always, we appreciate your business.
Sincerely,
Manning & Napier Advisors, LLC
1
International Series
Fund Commentary
(unaudited)
Investment Objective
To provide long-term growth by investing principally in common stock of companies located outside the U.S., which may include investments of any market capitalization in developed and emerging markets. In managing the Series, a “top-down” approach is implemented to examine economic trends and industry-specific factors in order to identify investment opportunities such as those being created by economic and political changes taking place around the world.
Performance Commentary
International equity markets struggled during 2015, with both developed and emerging markets ending the year in negative territory. Weakness was most pronounced in emerging markets, as declining prices for oil and other commodities weighed on the asset class. U.S. dollar strength and emerging market currency weakness also pressured emerging market returns, especially for U.S.-dollar-based investors. The MSCI ACWI ex USA (ACWIxUS) experienced a return of -5.66%. The International Series held up better than its benchmark, but experienced negative absolute returns as well, returning -3.72%. Importantly, the Series has provided robust positive absolute returns over the current international stock market cycle, which began in April 2003.
From a country positioning and selection perspective, the Series’ outperformance relative to the ACWIxUS Index during the year was driven by stock selection. In contrast, the aggregate impact of country allocations was a detractor from relative performance.
Regarding major contributors to relative performance, stock selection in Germany, the United Kingdom, China, and Australia aided relative returns. The Series’ lack of exposure to Canada also aided relative returns. At a sector level, stock selection in Information Technology and Health Care aided relative performance. The Series’ overweight to Consumer Staples and underweight to Materials relative to the benchmark also aided relative returns. Consumer Staples was among the strongest performing sectors within the benchmark during the year, whereas Materials was among the weakest.
Offsetting a portion of the relative performance tailwind was the Series’ overweight to Brazil and underweight to Japan, which challenged relative returns. Stock selection in Japan, India, and Hong Kong also challenged relative performance. At a sector level, stock selection in Industrials, Consumer Staples, and Consumer Discretionary detracted from relative returns.
During 2016 we believe investors should expect further gyrations in equity markets due to catalysts such as geopolitical risks, the diverging monetary policies of major central banks, commodity price pressures, and the potential for global growth to deviate from expectations. With the Federal Reserve having raised the federal funds rate, we think they now will seek to remain flexible and proceed slowly with small increases that do not follow a well-defined schedule. Broadly speaking, valuations in the developed world remain neutral at best, whereas valuations in select emerging markets are relatively more attractive. Shareholders should expect us to view volatility as a buying opportunity given that our indicators do not suggest capital risk is a significant near-term concern. In light of the current environment, it is important that investors remain active, flexible, and selective in their approach in order to avoid overvalued areas of the market, something Manning & Napier has done for over 45 years as an active investment manager.
Performance data quoted represents past performance and does not guarantee future results. The investment return and principal value of an investment will fluctuate, so that an investor’s shares, when redeemed, may be worth more or less than their original cost. Current performance may be higher or lower than that quoted; investors can obtain the most recent month-end performance at www.manning-napier.com or by calling (800) 466-3863. Performance for the International Series Class S shares is provided above. Performance for the Class I shares will be higher based on the Class’ lower expenses.
Please see the next page for additional performance information as of December 31, 2015.
All investments involve risks, including possible loss of principal. Funds whose investments are concentrated in foreign countries may be subject to fluctuating currency values, different accounting standards, and economic and political instability. The value of the Series may be affected by changes in exchange rates between foreign currencies and the U.S. dollar. Investments in emerging markets may be more volatile than investments in more developed markets.
2
International Series
Performance Update as of December 31, 2015
(unaudited)
| AVERAGE ANNUAL TOTAL RETURNS AS OF DECEMBER 31, 2015 | ||||||||||||||||
| ONE YEAR1 | FIVE YEAR | TEN YEAR | SINCE INCEPTION2 | |||||||||||||
Manning & Napier Fund, Inc. - International Series - Class S3 | -3.72 | % | 1.58 | % | 4.11 | % | 7.59 | % | ||||||||
Manning & Napier Fund, Inc. - International Series - Class I3,4 | -3.55 | % | 1.77 | % | 4.21 | % | 7.64 | % | ||||||||
Standard & Poor’s (S&P) 500 Total Return Index5 | 1.38 | % | 12.57 | % | 7.31 | % | 9.24 | % | ||||||||
MSCI ACWI ex USA Index6 | -5.66 | % | 1.06 | % | 2.92 | % | 5.82 | % | ||||||||
The following graph compares the value of a $10,000 investment in the Manning & Napier Fund, Inc. - International Series - Class S for the ten years ended December 31, 2015 to the S&P 500 Total Return Index and the MSCI ACWI ex USA Index.
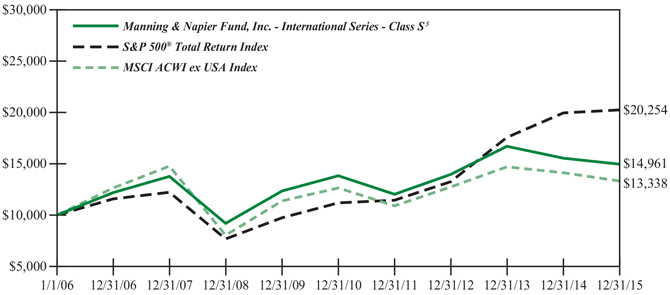
1The returns shown are based on net asset values calculated for shareholder transactions and may differ from the returns shown in the financial highlights, which reflect adjustments made to the net asset values in accordance with accounting principles generally accepted in the United States of America.
2Performance numbers for the Series and the S&P 500 Total Return Index are calculated from August 27, 1992, the Class S inception date. Prior to 2001, the MSCI ACWI ex USA Index only published month-end numbers; therefore, performance numbers for the Index are calculated from August 31, 1992.
3The Series’ performance does not reflect the deduction of taxes that a shareholder would pay on fund distributions or the redemption of shares. The Series’ performance is historical and may not be indicative of future results. The performance returns shown are inclusive of the net expense ratio of the Series. For the year ended December 31, 2015, this net expense ratio was 1.10% for Class S and 0.85% for Class I. The gross expense ratio, which does not account for any voluntary or contractual waivers currently in effect, was 1.13% for Class S and 0.88% for Class I for the year ended December 31, 2015.
4For periods prior to the inception of Class I on March 15, 2012, the performance figures are hypothetical and reflect the performance of the Manning & Napier Fund, Inc. - International Series - Class S.
5The S&P 500 Total Return Index is an unmanaged, capitalization-weighted measure of 500 widely held common stocks listed on the New York Stock Exchange, American Stock Exchange, and the Over-the-Counter market. The Index returns assume daily reinvestment of dividends and do not reflect any fees or expenses. Index returns provided by Bloomberg.
6The MSCI ACWI ex USA Index is a free float-adjusted market capitalization index that is designed to measure equity market performance in the global developed and emerging markets and consists of 43 developed and emerging market country indices outside the U.S. The Index returns do not reflect any fees or expenses. The Index is denominated in U.S. dollars. The Index returns assume daily investment of gross dividends (which do not account for applicable dividend taxation) prior to December 31, 1998, as net returns were not available. Subsequent to December 31, 1998, the Index returns are net of withholding taxes. They assume daily reinvestment of net dividends thus accounting for any applicable dividend taxation. Index returns provided by Bloomberg.
3
International Series
Shareholder Expense Example
(unaudited)
As a shareholder of the Series, you incur ongoing costs, including management fees, shareholder service fees and other Series expenses. This example is intended to help you understand your ongoing costs (in dollars) of investing in the Series and to compare these costs with the ongoing costs of investing in other mutual funds.
The example is based on an investment of $1,000 invested in each class at the beginning of the period and held for the entire period (July 1, 2015 to December 31, 2015).
Actual Expenses
The Actual lines of the table below provide information about actual account values and actual expenses. You may use the information in this line, together with the amount you invested, to estimate the expenses that you paid over the period. Simply divide your account value by $1,000 (for example, an $8,600 account value divided by $1,000 = 8.6), then multiply the result by the number in the Actual line for the Class in which you have invested under the heading entitled “Expenses Paid During Period” to estimate the expenses you paid on your account during this period.
Hypothetical Example for Comparison Purposes
The Hypothetical lines of each Class in the table below provide information about hypothetical account values and hypothetical expenses based on the Class’ actual expense ratio and an assumed rate of return of 5% per year before expenses, which is not the Class’ actual return. The hypothetical account values and expenses may not be used to estimate the actual ending account balance or expenses you paid during the period. You may use this information to compare the ongoing costs of investing in a class of the Series and other funds. To do so, compare this 5% hypothetical example with the 5% hypothetical examples that appear in the shareholder reports of the other funds.
Please note that the expenses shown in the table are meant to highlight your ongoing costs only and do not reflect any transaction costs, such as sales charges (loads), redemptions fees, or exchange fees that you may incur in other mutual funds. Therefore, the second line of the table is useful in comparing ongoing costs only, and will not help you determine the relative total costs of owning different funds.
| BEGINNING ACCOUNT VALUE 7/1/15 | ENDING ACCOUNT VALUE 12/31/15 | EXPENSES PAID DURING PERIOD* 7/1/15-12/31/15 | ANNUALIZED EXPENSE RATIO | |||||
Class S | ||||||||
Actual | $1,000.00 | $936.20 | $5.37 | 1.10% | ||||
Hypothetical | $1,000.00 | $1,019.66 | $5.60 | 1.10% | ||||
(5% return before expenses) | ||||||||
Class I | ||||||||
Actual | $1,000.00 | $936.70 | $4.15 | 0.85% | ||||
Hypothetical | ||||||||
(5% return before expenses) | $1,000.00 | $1,020.92 | $4.33 | 0.85% |
*Expenses are equal to the Class’ annualized expense ratio (for the six-month period), multiplied by the average account value over the period, multiplied by 184/365 (to reflect the one-half year period). Expenses are based on the most recent fiscal half year; therefore, the expense ratios stated above may differ from the expense ratios stated in the financial highlights, which are based on one-year data. The Class’ total return would have been lower had certain expenses not been waived during the period.
4
International Series
Portfolio Composition as of December 31, 2015
(unaudited)
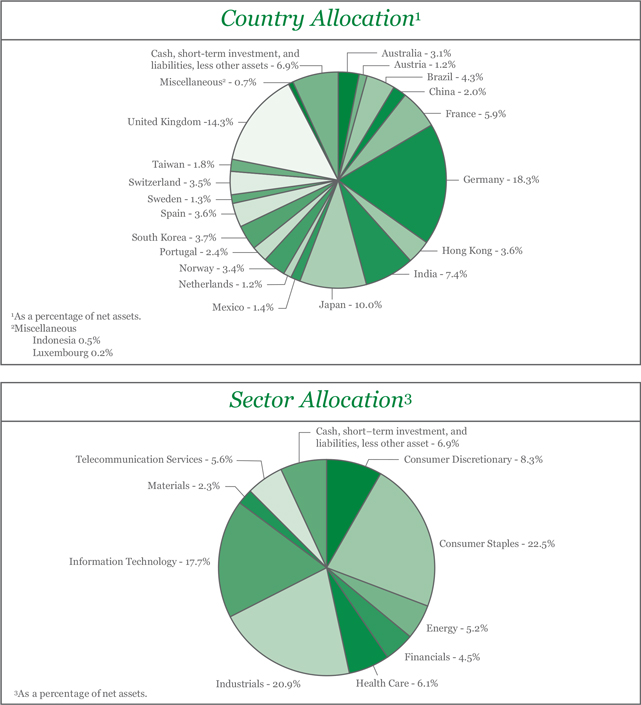
5
International Series
Investment Portfolio - December 31, 2015
| SHARES | VALUE (NOTE 2) | |||||||
COMMON STOCKS - 93.1% | ||||||||
Consumer Discretionary - 8.3% | ||||||||
Auto Components - 0.7% | ||||||||
F.C.C. Co. Ltd. (Japan)1 | 158,000 | $ | 3,360,686 | |||||
|
| |||||||
Diversified Consumer Services - 2.0% | ||||||||
Fu Shou Yuan International Group Ltd. (China)1 | 13,236,000 | 10,265,084 | ||||||
|
| |||||||
Internet & Catalog Retail - 3.6% | ||||||||
ASOS plc (United Kingdom)*1 | 156,760 | 7,964,978 | ||||||
Rakuten, Inc. (Japan)1 | 894,190 | 10,299,061 | ||||||
|
| |||||||
| 18,264,039 | ||||||||
|
| |||||||
Textiles, Apparel & Luxury Goods - 2.0% | ||||||||
Kering (France)1 | 59,760 | 10,217,519 | ||||||
|
| |||||||
Total Consumer Discretionary | 42,107,328 | |||||||
|
| |||||||
Consumer Staples - 22.5% | ||||||||
Beverages - 6.7% | ||||||||
AMBEV S.A. - ADR (Brazil) | 1,542,450 | 6,879,327 | ||||||
Diageo plc (United Kingdom)1 | 431,750 | 11,790,195 | ||||||
Treasury Wine Estates Ltd. (Australia)1 | 2,590,414 | 15,553,181 | ||||||
|
| |||||||
| 34,222,703 | ||||||||
|
| |||||||
Food & Staples Retailing - 2.5% | ||||||||
Dairy Farm International Holdings Ltd. (Hong Kong)1 | 1,132,600 | 6,871,624 | ||||||
Tesco plc (United Kingdom)*1 | 2,618,070 | 5,752,656 | ||||||
|
| |||||||
| 12,624,280 | ||||||||
|
| |||||||
Food Products - 7.8% | ||||||||
Adecoagro S.A. (Luxembourg)* | 72,140 | 886,601 | ||||||
Danone S.A. (France)1 | 107,012 | 7,231,213 | ||||||
Grupo Bimbo S.A.B. de C.V. - Class A (Mexico)* | 2,604,000 | 6,915,494 | ||||||
Nestle S.A. (Switzerland)1 | 105,220 | 7,811,033 | ||||||
Sao Martinho S.A. (Brazil) | 386,750 | 4,476,280 | ||||||
Suedzucker AG (Germany)1 | 625,447 | 12,396,664 | ||||||
|
| |||||||
| 39,717,285 | ||||||||
|
| |||||||
Personal Products - 3.6% | ||||||||
Unilever plc - ADR (United Kingdom) | 420,230 | 18,120,317 | ||||||
|
| |||||||
Tobacco - 1.9% | ||||||||
Gudang Garam Tbk PT (Indonesia)1 | 730,000 | 2,897,311 | ||||||
Swedish Match AB (Sweden)1 | 191,000 | 6,749,445 | ||||||
|
| |||||||
| 9,646,756 | ||||||||
|
| |||||||
Total Consumer Staples | 114,331,341 | |||||||
|
| |||||||
Energy - 5.2% | ||||||||
Energy Equipment & Services - 1.6% | ||||||||
Spectrum ASA (Norway)1 | 578,746 | 1,798,028 | ||||||
The accompanying notes are an integral part of the financial statements.
6
International Series
Investment Portfolio - December 31, 2015
| SHARES | VALUE (NOTE 2) | |||||||
COMMON STOCKS (continued) | ||||||||
Energy (continued) | ||||||||
Energy Equipment & Services (continued) | ||||||||
TGS Nopec Geophysical Co. ASA (Norway)1 | 391,280 | $ | 6,227,987 | |||||
|
| |||||||
| 8,026,015 | ||||||||
|
| |||||||
Oil, Gas & Consumable Fuels - 3.6% | ||||||||
Galp Energia SGPS S.A. (Portugal)1 | 1,050,040 | 12,252,640 | ||||||
Royal Dutch Shell plc - Class B (Netherlands)1 | 88,430 | 2,015,414 | ||||||
Royal Dutch Shell plc - Class B - ADR (Netherlands) | 87,780 | 4,041,391 | ||||||
|
| |||||||
| 18,309,445 | ||||||||
|
| |||||||
Total Energy | 26,335,460 | |||||||
|
| |||||||
Financials - 4.5% | ||||||||
Banks - 0.6% | ||||||||
IDFC Bank Ltd. (India)*1 | 3,023,300 | 2,780,808 | ||||||
|
| |||||||
Capital Markets - 1.0% | ||||||||
Daiwa Securities Group, Inc. (Japan)1 | 830,000 | 5,074,367 | ||||||
|
| |||||||
Diversified Financial Services - 0.4% | ||||||||
IDFC Ltd. (India)1 | 3,023,300 | 2,196,539 | ||||||
|
| |||||||
Insurance - 0.9% | ||||||||
Mapfre S.A. (Spain)1 | 1,877,000 | 4,698,462 | ||||||
|
| |||||||
Real Estate Investment Trusts (REITS) - 1.6% | ||||||||
Alstria Office REIT AG (Germany)1 | 595,480 | 7,932,757 | ||||||
|
| |||||||
Total Financials | 22,682,933 | |||||||
|
| |||||||
Health Care - 6.1% | ||||||||
Health Care Providers & Services - 2.6% | ||||||||
Fresenius Medical Care AG & Co. KGaA - ADR (Germany) | 200,000 | 8,368,000 | ||||||
Odontoprev S.A. (Brazil) | 2,000,000 | 4,777,251 | ||||||
|
| |||||||
| 13,145,251 | ||||||||
|
| |||||||
Pharmaceuticals - 3.5% | ||||||||
AstraZeneca plc - ADR (United Kingdom) | 308,740 | 10,481,723 | ||||||
GlaxoSmithKline plc (United Kingdom)1 | 172,980 | 3,493,497 | ||||||
Novartis AG - ADR (Switzerland) | 49,000 | 4,215,960 | ||||||
|
| |||||||
| 18,191,180 | ||||||||
|
| |||||||
Total Health Care | 31,336,431 | |||||||
|
| |||||||
Industrials - 20.9% | ||||||||
Commercial Services & Supplies - 1.0% | ||||||||
Aggreko plc (United Kingdom)1 | 381,247 | 5,132,267 | ||||||
|
| |||||||
Construction & Engineering - 2.2% | ||||||||
Larsen & Toubro Ltd. (India)1 | 591,285 | 11,365,336 | ||||||
|
| |||||||
Electrical Equipment - 2.4% | ||||||||
Bharat Heavy Electricals Ltd. (India)1 | 2,049,250 | 5,217,058 | ||||||
The accompanying notes are an integral part of the financial statements.
7
International Series
Investment Portfolio - December 31, 2015
| SHARES | VALUE (NOTE 2) | |||||||
COMMON STOCKS (continued) | ||||||||
Industrials (continued) | ||||||||
Electrical Equipment (continued) | ||||||||
Schneider Electric SE (France)1 | 66,000 | $ | 3,749,081 | |||||
Teco Electric and Machinery Co. Ltd. (Taiwan)1 | 4,084,000 | 3,254,258 | ||||||
|
| |||||||
| 12,220,397 | ||||||||
|
| |||||||
Industrial Conglomerates - 4.5% | ||||||||
Siemens AG (Germany)1 | 237,600 | 22,986,943 | ||||||
|
| |||||||
Machinery - 7.7% | ||||||||
Alstom S.A. (France)*1 | 295,560 | 9,027,896 | ||||||
ANDRITZ AG (Austria)1 | 123,000 | 5,986,227 | ||||||
FANUC Corp. (Japan)1 | 37,540 | 6,467,762 | ||||||
GEA Group AG (Germany)1 | 322,720 | 13,038,234 | ||||||
Jain Irrigation Systems Ltd. - DVR (India)1 | 39,801 | 26,738 | ||||||
Jain Irrigation Systems Ltd. (India)1 | 4,464,000 | 4,640,848 | ||||||
|
| |||||||
| 39,187,705 | ||||||||
|
| |||||||
Professional Services - 3.1% | ||||||||
Applus Services S.A. (Spain)1 | 621,990 | 5,628,482 | ||||||
Intertek Group plc (United Kingdom)1 | 240,170 | 9,824,588 | ||||||
|
| |||||||
| 15,453,070 | ||||||||
|
| |||||||
Total Industrials | 106,345,718 | |||||||
|
| |||||||
Information Technology - 17.7% | ||||||||
Electronic Equipment, Instruments & Components - 7.3% | ||||||||
Hitachi Ltd. (Japan)1 | 2,677,660 | 15,172,628 | ||||||
Keyence Corp. (Japan)1 | 19,409 | 10,667,287 | ||||||
PAX Global Technology Ltd. (Hong Kong)1 | 11,264,000 | 11,556,516 | ||||||
|
| |||||||
| 37,396,431 | ||||||||
|
| |||||||
Semiconductors & Semiconductor Equipment - 1.2% | ||||||||
MediaTek, Inc. (Taiwan)1 | 794,830 | 6,011,696 | ||||||
|
| |||||||
Software - 5.5% | ||||||||
SAP SE (Germany)1 | 284,360 | 22,564,992 | ||||||
Totvs S.A. (Brazil) | 721,250 | 5,656,970 | ||||||
|
| |||||||
| 28,221,962 | ||||||||
|
| |||||||
Technology Hardware, Storage & Peripherals - 3.7% | ||||||||
Samsung Electronics Co. Ltd. (South Korea)1 | 17,490 | 18,654,524 | ||||||
|
| |||||||
Total Information Technology | 90,284,613 | |||||||
|
| |||||||
Materials - 2.3% | ||||||||
Chemicals - 2.3% | ||||||||
Givaudan S.A. (Switzerland)1 | 3,400 | 6,170,871 | ||||||
Symrise AG (Germany)1 | 87,320 | 5,780,479 | ||||||
|
| |||||||
Total Materials | 11,951,350 | |||||||
|
| |||||||
The accompanying notes are an integral part of the financial statements.
8
International Series
Investment Portfolio - December 31, 2015
| SHARES | VALUE (NOTE 2) | |||||||
COMMON STOCKS (continued) | ||||||||
Telecommunication Services - 5.6% | ||||||||
Diversified Telecommunication Services - 3.4% | ||||||||
Telefonica S.A. - ADR (Spain) | 727,200 | $ | 8,042,832 | |||||
Telenor ASA - ADR (Norway) | 184,380 | 9,177,514 | ||||||
|
| |||||||
| 17,220,346 | ||||||||
|
| |||||||
Wireless Telecommunication Services - 2.2% | ||||||||
Bharti Infratel Ltd. (India)1 | 1,759,490 | 11,352,065 | ||||||
|
| |||||||
Total Telecommunication Services | 28,572,411 | |||||||
|
| |||||||
TOTAL COMMON STOCKS | ||||||||
(Identified Cost $500,583,744) | 473,947,585 | |||||||
|
| |||||||
SHORT-TERM INVESTMENT - 7.0% | ||||||||
Dreyfus Cash Management, Inc. - Institutional Shares2, 0.23%, | ||||||||
(Identified Cost $35,745,314) | 35,745,314 | 35,745,314 | ||||||
|
| |||||||
TOTAL INVESTMENTS - 100.1% | ||||||||
(Identified Cost $536,329,058) | 509,692,899 | |||||||
LIABILITIES, LESS OTHER ASSETS - (0.1%) | (550,229 | ) | ||||||
|
| |||||||
NET ASSETS - 100% | $ | 509,142,670 | ||||||
|
| |||||||
ADR - American Depositary Receipt
DVR - Differential Voting Rights
*Non-income producing security.
1A factor from a third party vendor was applied to determine the security’s fair value following the close of local trading.
2Rate shown is the current yield as of December 31, 2015.
The Series’ portfolio holds, as a percentage of net assets, greater than 10% in the following countries:
Germany 18.5%; United Kingdom 14.3%; Japan 10%.
The Global Industry Classification Standard (GICS) was developed by and is the exclusive property and a service mark of MSCI Inc. (MSCI) and Standard & Poor’s, a division of The McGraw-Hill Companies, Inc. (S&P), and is licensed for use by Manning & Napier when referencing GICS sectors. Neither MSCI, S&P, nor any third party involved in making or compiling the GICS or any GICS classifications makes any express or implied warranties or representations with respect to such standard or classification, nor shall any such party have any liability therefrom.
The accompanying notes are an integral part of the financial statements.
9
International Series
Statement of Assets & Liabilities
December 31, 2015
ASSETS: | ||||
Investments, at value (identified cost $536,329,058) (Note 2) | $ | 509,692,899 | ||
Foreign tax reclaims receivable | 1,569,846 | |||
Dividends receivable | 411,386 | |||
Receivable for fund shares sold | 375,731 | |||
Prepaid and other expenses | 3,721 | |||
Receivable for securities sold | 3,325 | |||
|
| |||
TOTAL ASSETS | 512,056,908 | |||
|
| |||
LIABILITIES: | ||||
Accrued management fees (Note 3) | 336,557 | |||
Accrued shareholder services fees (Class S) (Note 3) | 82,003 | |||
Accrued transfer agent fees (Note 3) | 64,386 | |||
Accrued fund accounting and administration fees (Note 3) | 31,944 | |||
Accrued Chief Compliance Officer service fees (Note 3) | 429 | |||
Accrued Directors’ fees (Note 3) | 209 | |||
Accrued foreign capital gains tax (Note 2) | 140,749 | |||
Payable for securities purchased | 1,267,914 | |||
Payable for fund shares repurchased | 805,066 | |||
Other payables and accrued expenses | 184,981 | |||
|
| |||
TOTAL LIABILITIES | 2,914,238 | |||
|
| |||
TOTAL NET ASSETS | $ | 509,142,670 | ||
|
| |||
NET ASSETS CONSIST OF: | ||||
Capital stock | $ | 649,213 | ||
Additional paid-in-capital | 537,648,290 | |||
Undistributed net investment income | 132,093 | |||
Accumulated net realized loss on investments, foreign currency and translation of other assets and liabilities | (2,298,906 | ) | ||
Net unrealized depreciation on investments (net of foreign capital gains tax of $140,749), foreign currency and translation of other assets and liabilities | (26,988,020 | ) | ||
|
| |||
TOTAL NET ASSETS | $ | 509,142,670 | ||
|
| |||
NET ASSET VALUE, OFFERING PRICE AND REDEMPTION PRICE PER SHARE - Class S | ||||
($377,769,803/50,869,229 shares) | $ | 7.43 | ||
|
| |||
NET ASSET VALUE, OFFERING PRICE AND REDEMPTION PRICE PER SHARE - Class I | ||||
($131,372,867/14,052,081 shares) | $ | 9.35 | ||
|
| |||
The accompanying notes are an integral part of the financial statements.
10
International Series
Statement of Operations
For the Year Ended December 31, 2015
INVESTMENT INCOME: | ||||
Dividends (net of foreign taxes withheld, $1,277,663) | $ | 12,019,457 | ||
|
| |||
EXPENSES: | ||||
Management fees (Note 3) | 4,396,617 | |||
Shareholder services fees (Class S)(Note 3) | 1,121,397 | |||
Transfer agent fees (Note 3) | 187,152 | |||
Fund accounting and administration fees (Note 3) | 95,661 | |||
Directors’ fees (Note 3) | 22,615 | |||
Chief Compliance Officer service fees (Note 3) | 2,541 | |||
Custodian fees | 276,366 | |||
Miscellaneous | 158,216 | |||
|
| |||
Total Expenses | 6,260,565 | |||
Less reduction of expenses (Note 3) | (160,092 | ) | ||
|
| |||
Net Expenses | 6,100,473 | |||
|
| |||
NET INVESTMENT INCOME | 5,918,984 | |||
|
| |||
REALIZED AND UNREALIZED GAIN (LOSS) ON INVESTMENTS AND FOREIGN CURRENCY: | ||||
Net realized gain (loss) on- | 9,464,621 | |||
Foreign currency and translation of other assets and liabilities | (436,619 | ) | ||
|
| |||
| 9,028,002 | ||||
|
| |||
Net change in unrealized appreciation (depreciation) on- | (33,931,127 | ) | ||
Foreign currency and translation of other assets and liabilities | (96,887 | ) | ||
|
| |||
| (34,028,014 | ) | |||
|
| |||
NET REALIZED AND UNREALIZED GAIN (LOSS) ON INVESTMENTS AND FOREIGN CURRENCY | (25,000,012 | ) | ||
|
| |||
NET DECREASE IN NET ASSETS RESULTING FROM OPERATIONS | $ | (19,081,028 | ) | |
|
| |||
The accompanying notes are an integral part of the financial statements.
11
International Series
Statements of Changes in Net Assets
FOR THE YEAR ENDED | FOR THE YEAR ENDED | |||||||
INCREASE (DECREASE) IN NET ASSETS: | ||||||||
OPERATIONS: | ||||||||
Net investment income | $ | 5,918,984 | $ | 8,960,558 | ||||
Net realized gain on investments and foreign currency | 9,028,002 | 68,919,989 | ||||||
Net change in unrealized depreciation on investments and foreign currency | (34,028,014 | ) | (127,193,320 | ) | ||||
|
|
|
| |||||
Net decrease from operations | (19,081,028 | ) | (49,312,773 | ) | ||||
|
|
|
| |||||
DISTRIBUTIONS TO SHAREHOLDERS (Note 8): | ||||||||
From net investment income (Class S) | (3,477,202 | ) | (6,758,776 | ) | ||||
From net investment income (Class I) | (1,250,441 | ) | (1,659,943 | ) | ||||
From net realized gain on investments (Class S) | (14,908,889 | ) | (53,674,182 | ) | ||||
From net realized gain on investments (Class I) | (4,021,064 | ) | (10,868,137 | ) | ||||
|
|
|
| |||||
Total distributions to shareholders | (23,657,596 | ) | (72,961,038 | ) | ||||
|
|
|
| |||||
CAPITAL STOCK ISSUED AND REPURCHASED: | ||||||||
Net decrease from capital share transactions (Note 5) | (65,272,859 | ) | (38,957,031 | ) | ||||
|
|
|
| |||||
Net decrease in net assets | (108,011,483 | ) | (161,230,842 | ) | ||||
NET ASSETS: | ||||||||
Beginning of year | 617,154,153 | 778,384,995 | ||||||
|
|
|
| |||||
End of year (including undistributed net investment income of $132,093 and $111,901, respectively) | $ | 509,142,670 | $ | 617,154,153 | ||||
|
|
|
| |||||
The accompanying notes are an integral part of the financial statements.
12
International Series
Financial Highlights - Class S*
| FOR THE YEARS ENDED | ||||||||||||||||||||
| 12/31/15 | 12/31/14 | 12/31/13 | 12/31/12 | 12/31/11 | ||||||||||||||||
Per share data (for a share outstanding throughout each year): | ||||||||||||||||||||
Net asset value - Beginning of year | $ | 8.10 | $ | 9.91 | $ | 8.70 | $ | 7.61 | $ | 8.85 | ||||||||||
|
|
|
|
|
|
|
|
|
| |||||||||||
Income (loss) from investment operations: | ||||||||||||||||||||
Net investment income1 | 0.08 | 0.12 | 0.11 | 0.10 | 0.13 | |||||||||||||||
Net realized and unrealized gain (loss) on investments | (0.39 | ) | (0.84 | ) | 1.59 | 1.10 | (1.26 | ) | ||||||||||||
|
|
|
|
|
|
|
|
|
| |||||||||||
Total from investment operations | (0.31 | ) | (0.72 | ) | 1.70 | 1.20 | (1.13 | ) | ||||||||||||
|
|
|
|
|
|
|
|
|
| |||||||||||
Less distributions to shareholders: | ||||||||||||||||||||
From net investment income | (0.07 | ) | (0.12 | ) | (0.12 | ) | (0.10 | ) | (0.10 | ) | ||||||||||
From return of capital | — | — | — | (0.01 | ) | — | ||||||||||||||
From net realized gain on investments | (0.29 | ) | (0.97 | ) | (0.37 | ) | — | (0.01 | ) | |||||||||||
|
|
|
|
|
|
|
|
|
| |||||||||||
Total distributions to shareholders | (0.36 | ) | (1.09 | ) | (0.49 | ) | (0.11 | ) | (0.11 | ) | ||||||||||
|
|
|
|
|
|
|
|
|
| |||||||||||
Net asset value - End of year | $ | 7.43 | $ | 8.10 | $ | 9.91 | $ | 8.70 | $ | 7.61 | ||||||||||
|
|
|
|
|
|
|
|
|
| |||||||||||
Net assets - End of year (000’s omitted) | $ | 377,770 | $ | 490,833 | $ | 637,598 | $ | 565,609 | $ | 513,267 | ||||||||||
|
|
|
|
|
|
|
|
|
| |||||||||||
Total return2 | (3.72 | %) | (7.03 | %) | 19.69 | % | 15.78 | % | (12.82 | %) | ||||||||||
Ratios (to average net assets)/Supplemental Data: | ||||||||||||||||||||
Expenses** | 1.10 | % | 1.10 | % | 1.10 | % | 1.10 | % | 1.16 | % | ||||||||||
Net investment income | 0.96 | % | 1.20 | % | 1.21 | % | 1.30 | % | 1.49 | % | ||||||||||
Portfolio turnover | 33 | % | 22 | % | 22 | % | 22 | % | 7 | % | ||||||||||
*Effective December 31, 2011, the shares of the Series have been designated as Class S. **The investment advisor did not impose all or a portion of its management and/or other fees, and in some periods may have paid a portion of the Series’ expenses. If these expenses had been incurred by the Class, the expense ratio (to average net assets) would have increased by the following amounts: |
| |||||||||||||||||||
| 0.03 | % | 0.04 | % | 0.03 | % | 0.07 | % | N/A | ||||||||||||
1Calculated based on average shares outstanding during the years.
2Represents aggregate total return for the years indicated, and assumes reinvestment of all distributions. Total return would have been lower had certain expenses not been waived or reimbursed during certain years.
The accompanying notes are an integral part of the financial statements.
13
International Series
Financial Highlights - Class I
| FOR THE YEARS ENDED | FOR THE PERIOD | |||||||||||||||
| 12/31/15 | 12/31/14 | 12/31/13 | 3/15/121 TO 12/31/12 | |||||||||||||
Per share data (for a share outstanding throughout each year): | ||||||||||||||||
Net asset value - Beginning of year | $ | 10.10 | $ | 12.05 | $ | 10.47 | $ | 10.00 | ||||||||
|
|
|
|
|
|
|
| |||||||||
Income (loss) from investment operations: | ||||||||||||||||
Net investment income2 | 0.12 | 0.17 | 0.17 | 0.13 | ||||||||||||
Net realized and unrealized gain (loss) on investments | (0.49 | ) | (1.00 | ) | 1.91 | 0.46 | ||||||||||
|
|
|
|
|
|
|
| |||||||||
Total from investment operations | (0.37 | ) | (0.83 | ) | 2.08 | 0.59 | ||||||||||
|
|
|
|
|
|
|
| |||||||||
Less distributions to shareholders: | ||||||||||||||||
From net investment income | (0.09 | ) | (0.15 | ) | (0.13 | ) | (0.11 | ) | ||||||||
From return of capital | — | — | — | (0.01 | ) | |||||||||||
From net realized gain on investments | (0.29 | ) | (0.97 | ) | (0.37 | ) | — | |||||||||
|
|
|
|
|
|
|
| |||||||||
Total distributions to shareholders | (0.38 | ) | (1.12 | ) | (0.50 | ) | (0.12 | ) | ||||||||
|
|
|
|
|
|
|
| |||||||||
Net asset value - End of year | $ | 9.35 | $ | 10.10 | $ | 12.05 | $ | 10.47 | ||||||||
|
|
|
|
|
|
|
| |||||||||
Net assets - End of year (000’s omitted) | $ | 131,373 | $ | 126,321 | $ | 140,787 | $ | 95,925 | ||||||||
|
|
|
|
|
|
|
| |||||||||
Total return3 | (3.55 | %) | (6.72 | %) | 19.97 | % | 5.88 | % | ||||||||
Ratios (to average net assets)/Supplemental Data: | ||||||||||||||||
Expenses* | 0.85 | % | 0.85 | % | 0.85 | % | 0.85 | %4 | ||||||||
Net investment income | 1.18 | % | 1.42 | % | 1.48 | % | 1.67 | %4 | ||||||||
Portfolio turnover | 33 | % | 22 | % | 22 | % | 22 | % | ||||||||
| *The investment advisor did not impose all or a portion of its management and/or other fees during the period, and may have paid a portion of the Series’ expenses. If these expenses had been incurred by the Class, the expense ratio (to average net assets) would have increased by the following amounts: | ||||||||||||||||
| 0.03% | 0.04 | % | 0.03 | % | 0.09 | %4 | ||||||||||
1Commencement of operations.
2Calculated based on average shares outstanding during the periods.
3Represents aggregate total return for the periods indicated, and assumes reinvestment of all distributions. Total return would have been lower had certain expenses not been waived during certain periods. Periods less than one year are not annualized.
4Annualized.
The accompanying notes are an integral part of the financial statements.
14
International Series
Notes to Financial Statements
| 1. | Organization |
International Series (the “Series”) is a no-load diversified series of Manning & Napier Fund, Inc. (the “Fund”). The Fund is organized in Maryland and is registered under the Investment Company Act of 1940, as amended, as an open-end management investment company.
The Series’ investment objective is to provide long-term growth by investing principally in the common stocks of companies located outside the United States.
The Fund’s advisor is Manning & Napier Advisors, LLC (the “Advisor”). Shares of the Series are offered to investors, clients and employees of the Advisor and its affiliates. The Series is authorized to issue two classes of shares (Class S and Class I). Each class of shares is substantially the same, except that Class S shares bear shareholder services fees. The total authorized capital stock of the Fund consists of 15 billion shares of common stock each having a par value of $0.01. As of December 31, 2015, 10.7 billion shares have been designated in total among 41 series, of which 250 million have been designated as International Series Class S common stock and 100 million have been designated as International Series Class I common stock.
| 2. | Significant Accounting Policies |
The following is a summary of significant accounting policies followed by the Series. The Series is an investment company and, accordingly, follows the investment company accounting and reporting guidance of the Financial Accounting Standards Board Accounting Standards Codification Topic 946 - Investment Companies, which is part of accounting principles generally accepted in the United States of America (“GAAP”).
Security Valuation
Portfolio securities, including domestic equities, foreign equities, warrants and options, listed on an exchange other than the NASDAQ Stock Market are valued at the latest quoted sales price of the exchange on which the security is primarily traded. Securities not traded on valuation date or securities not listed on an exchange are valued at the latest quoted bid price provided by the Fund’s pricing service. Securities listed on the NASDAQ Stock Market are valued in accordance with the NASDAQ Official Closing Price.
Short-term investments that mature in sixty days or less may be valued at amortized cost, which approximates fair value. Investments in open-end investment companies are valued at their net asset value per share on valuation date.
Volume and level of activity in established markets for an asset or liability are evaluated to determine whether recent transactions and quoted prices are determinative of fair value. Where there have been significant decreases in volume and level of activity, further analysis and adjustment may be necessary to estimate fair value. The Series measures fair value in these instances by the use of inputs and valuation techniques which may be based upon current market prices of securities that are comparable in coupon, rating, maturity and industry and/or expectation of future cash flows. As a result of trading in relatively thin markets and/or markets that experience significant volatility, the prices used by the Series to value these securities may differ from the value that would be realized if these securities were sold, and the differences could be material.
Securities for which representative valuations or prices are not available from the Series’ pricing service may be valued at fair value as determined in good faith by the Advisor under procedures approved by and under the general supervision and responsibility of the Fund’s Board of Directors (the “Board”). Due to the inherent uncertainty of valuations of such securities, the fair value may differ significantly from the values that would have been used had a ready market for such securities existed. If trading or events occurring after the close of the principal market in which securities are traded are expected to materially affect the value of those securities, then they may be valued at their fair value, taking this trading or these events into account. In accordance with the procedures approved by the Board, the values of certain securities trading outside the U.S. were adjusted following the close of local trading using a factor from a third party vendor. The third party vendor uses statistical analyses and quantitative models, which consider among other things subsequent movement and changes in the prices of indices, securities and exchange rates in other markets, to determine the factors which are used to adjust local market prices. The value of
15
International Series
Notes to Financial Statements (continued)
| 2. | Significant Accounting Policies (continued) |
Security Valuation (continued)
securities used for net asset value calculation under these procedures may differ from published prices for the same securities. It is the Fund’s policy to classify each foreign equity security where a factor from a third party vendor is provided as a Level 2 security.
Various inputs are used in determining the value of the Series’ assets or liabilities carried at fair value. These inputs are summarized in three broad levels. Level 1 includes quoted prices in active markets for identical assets and liabilities. Level 2 includes other significant observable inputs (including quoted prices for similar securities, interest rates, prepayment speeds, credit risk, etc.). Level 3 includes significant unobservable inputs (including the Series’ own assumptions in determining the fair value of investments). A financial instrument’s level within the fair value hierarchy is based on the lowest level of any input both individually and in aggregate that is significant to the fair value measurement. The inputs or methodology used for valuing securities are not necessarily an indication of the risk associated with investing in those securities.
The following is a summary of the valuation levels used for major security types as of December 31, 2015 in valuing the Series’ assets or liabilities carried at fair value:
| DESCRIPTION | TOTAL | LEVEL 1 | LEVEL 2 | LEVEL 3 | ||||||||||||
Assets: | ||||||||||||||||
Equity securities: | ||||||||||||||||
Consumer Discretionary | $ | 42,107,328 | $ | — | $ | 42,107,328 | $ | — | ||||||||
Consumer Staples | 114,331,341 | 37,278,019 | 77,053,322 | — | ||||||||||||
Energy | 26,335,460 | 4,041,391 | 22,294,069 | — | ||||||||||||
Financials | 22,682,933 | — | 22,682,933 | — | ||||||||||||
Health Care | 31,336,431 | 27,842,934 | 3,493,497 | — | ||||||||||||
Industrials | 106,345,718 | — | 106,345,718 | — | ||||||||||||
Information Technology | 90,284,613 | 5,656,970 | 84,627,643 | — | ||||||||||||
Materials | 11,951,350 | — | 11,951,350 | — | ||||||||||||
Telecommunication Services | 28,572,411 | 17,220,346 | 11,352,065 | — | ||||||||||||
Mutual fund | 35,745,314 | 35,745,314 | — | — | ||||||||||||
|
|
|
|
|
|
|
| |||||||||
Total assets | $ | 509,692,899 | $ | 127,784,974 | $ | 381,907,925 | $ | — | ||||||||
|
|
|
|
|
|
|
| |||||||||
Please see the Investment Portfolio for foreign securities where a factor from a third party vendor was applied to determine the security’s fair value following close of local trading. Such securities are included in Level 2 in the table above.
There were no Level 3 securities held by the Series as of December 31, 2014 or December 31, 2015.
The Fund’s policy is to recognize transfers in and transfers out of the valuation levels as of the beginning of the reporting period. There were no transfers between Level 1 and Level 2 during the year ended December 31, 2015.
Security Transactions, Investment Income and Expenses
Security transactions are accounted for on trade date. Dividend income is recorded on the ex-dividend date, except that if the ex-dividend date has passed, certain dividends from foreign securities are recorded as soon as the Series is informed of the ex-dividend date. Non-cash dividends, if any, are recorded at the fair value of the securities received. Interest income, including amortization of premium and accretion of discounts using the effective interest method, is earned from settlement date and accrued daily.
Expenses are recorded on an accrual basis. Most expenses of the Fund can be attributed to a specific series. Expenses which cannot be directly attributed are apportioned among the series in the Fund in such a manner as deemed equitable by the Fund’s Board, taking into consideration, among other things, the nature and type of expense. Income, expenses (other than shareholder services fees), and realized and unrealized gains and losses are prorated among the classes based on the relative net assets of each class. Class specific expenses are directly charged to that class.
16
International Series
Notes to Financial Statements (continued)
| 2. | Significant Accounting Policies (continued) |
Security Transactions, Investment Income and Expenses (continued)
The Series uses the identified cost method for determining realized gain or loss on investments for both financial statement and federal income tax reporting purposes.
Foreign Currency Translation
The books and records of the Series are maintained in U.S. dollars. Foreign currencies, investments and other assets and liabilities are translated into U.S. dollars at the current exchange rates. Purchases and sales of investment securities and income and expenses are translated on the respective dates of such transactions. The Series does not isolate realized and unrealized gains and losses attributable to changes in the exchange rates from gains and losses that arise from changes in the fair value of investments. Such fluctuations are included with net realized and unrealized gain or loss on investments. Net realized foreign currency gains and losses represent foreign currency gains and losses between trade date and settlement date on securities transactions, gains and losses on disposition of foreign currencies and the difference between the amount of income and foreign withholding taxes recorded on the books of the Series and the amounts actually received or paid.
Federal Taxes
The Series’ policy is to comply with the provisions of the Internal Revenue Code applicable to regulated investment companies. The Series is not subject to federal income tax or excise tax to the extent that the Series distributes to shareholders each year its taxable income, including any net realized gains on investments, in accordance with requirements of the Internal Revenue Code. Accordingly, no provision for federal income tax or excise tax has been made in the financial statements.
Management evaluates its tax positions to determine if the tax positions taken meet the minimum recognition threshold in connection with accounting for uncertainties in income tax positions taken or expected to be taken for the purposes of measuring and recognizing tax liabilities in the financial statements. Recognition of tax benefits of an uncertain tax position is required only when the position is “more likely than not” to be sustained assuming examination by taxing authorities. At December 31, 2015, the Series has recorded no liability for net unrecognized tax benefits relating to uncertain income tax positions taken or expected to be taken in future tax returns.
The Series files income tax returns in the U.S. federal jurisdiction, various states and foreign jurisdictions, as required. No income tax returns are currently under investigation. The statute of limitations on the Series’ tax returns remains open for the years ended December 31, 2012 through December 31, 2015. The Series is not aware of any tax positions for which it is reasonably possible that the total amounts of unrecognized tax benefits will significantly change in the next twelve months.
Foreign Taxes
Based on the Series’ understanding of the tax rules and rates related to income, gains and currency purchase/repatriation transactions for foreign jurisdictions in which it invests, the Series will provide for foreign taxes, and where appropriate, deferred foreign tax. The Series is subject to a tax imposed on short term capital gains on securities of issuers domiciled in India. The Series records an estimated deferred tax liability for securities that have been held for less than a year at the end of the reporting period, assuming those positions were disposed of at the end of the period. This amount is reported in Accrued foreign capital gains tax in the accompanying Statement of Assets and Liabilities. Realized losses on the sale of securities of issuers domiciled in India can be carried forward for eight years to offset potential future short term realized capital gains.
Distributions of Income and Gains
Distributions to shareholders of net investment income and net realized gains are made annually. An additional distribution may be necessary to avoid taxation of the Series. Distributions are recorded on the ex-dividend date.
Indemnifications
The Fund’s organizational documents provide former and current directors and officers with a limited indemnification against liabilities arising in connection with the performance of their duties to the Fund. In the normal course of business, the Fund may also enter into contracts that provide general indemnifications. The Fund’s maximum exposure under these arrangements is unknown as this would be dependent on future claims that may be made against the Fund. The risk of material loss from such claims is considered remote.
17
International Series
Notes to Financial Statements (continued)
| 2. | Significant Accounting Policies (continued) |
Other
The preparation of financial statements in conformity with GAAP requires management to make estimates and assumptions that affect the reported amounts of assets and liabilities and the disclosure of contingent assets and liabilities at the date of the financial statements and the reported amounts of income and expenses during the reporting period. Actual results could differ from those estimates.
| 3. | Transactions with Affiliates |
The Fund has an Investment Advisory Agreement (the “Agreement”) with the Advisor, for which the Series pays a fee, computed daily and payable monthly, at an annual rate of 0.75% of the Series’ average daily net assets.
Under the Agreement, personnel of the Advisor provide the Series with advice and assistance in the choice of investments and the execution of securities transactions, and otherwise maintain the Series’ organization. The Advisor also provides the Fund with necessary office space and fund administration and support services. The salaries of all officers of the Fund (except a percentage of the Fund’s Chief Compliance Officer’s salary, which is paid by the Fund), and of all Directors who are “affiliated persons” of the Fund, or of the Advisor, and all personnel of the Fund, or of the Advisor, performing services relating to research, statistical and investment activities, are paid by the Advisor. Each “non-affiliated” Director receives an annual stipend, which is allocated among all the active series of the Fund. In addition, these Directors also receive a fee per Board meeting attended plus a fee for each committee meeting attended and are reimbursed for travel and other out-of-pocket expenses incurred by them in connection with attending such meetings. The Fund also has an Audit Committee Chair, who receives an additional annual stipend for this role.
The Class S shares of the Series are subject to a shareholder services fee in accordance with a shareholder services plan adopted by the Board. The shareholder services fee is intended to compensate financial intermediaries, including affiliates of the Fund, in connection with the provision of direct client service, personal services, maintenance of shareholder accounts and reporting services. For these services, Class S of the Series pays a fee, computed daily and payable monthly, at an annual rate of 0.25% of the average daily net assets of Class S. The Fund has a Shareholder Services Agreement with the Advisor, for which the Advisor receives the shareholder services fee as stated above.
The Advisor has contractually agreed, until at least April 30, 2016, to waive its management fee and, if necessary, pay other operating expenses of the Series in order to maintain total direct annual fund operating expenses for the Series, exclusive of each share class’ shareholder services fee, at no more than 0.85% of average daily net assets. Accordingly, the Advisor waived fees of $160,092 for the year ended December 31, 2015, which is included as a reduction of expenses on the Statement of Operations. The Advisor is not eligible to recoup any expenses that have been waived or reimbursed in prior years.
Manning & Napier Investor Services, Inc., a registered broker-dealer affiliate of the Advisor, acts as distributor for the Fund’s shares. The services of Manning & Napier Investor Services, Inc. are provided at no additional cost to the Series.
Pursuant to a master services agreement dated November 1, 2014, the Fund pays the Advisor an annual fee related to fund accounting and administration of 0.0085% on the first $25 billion of average daily net assets (excluding Target Series and Strategic Income Series); 0.0075% on the next $15 billion of average daily net assets (excluding Target Series and Strategic Income Series); and 0.0065% of the average daily net assets in excess of $40 billion (excluding Target Series and Strategic Income Series); plus a base fee of $30,400 per series. Transfer agent fees are charged to the Fund on a per account basis. Additionally, certain transaction and out-of-pocket expenses, including charges for reporting relating to the Fund’s compliance program, are charged. The Advisor has agreements with BNY Mellon Investment Servicing (U.S.) Inc. (“BNY”) under which BNY serves as sub-accountant services agent and sub-transfer agent.
Expenses not directly attributable to a series are allocated based on each series’ relative net assets or number of accounts, depending on the expense.
18
International Series
Notes to Financial Statements (continued)
| 4. | Purchases and Sales of Securities |
For the year ended December 31, 2015, purchases and sales of securities, other than U.S. Government securities and short-term securities, were $180,860,401 and $300,802,684, respectively. There were no purchases or sales of U.S. Government securities.
| 5. | Capital Stock Transactions |
Transactions in shares of Class S and I shares of International Series were:
| CLASS S | FOR THE YEAR ENDED 12/31/15 | FOR THE YEAR ENDED 12/31/14 | ||||||||||||||
| SHARES | AMOUNT | SHARES | AMOUNT | |||||||||||||
Sold | 4,705,134 | $ | 38,413,613 | 5,034,580 | $ | 48,663,625 | ||||||||||
Reinvested | 2,447,961 | 17,992,425 | 7,333,073 | 58,712,204 | ||||||||||||
Repurchased | (16,866,486 | ) | (137,354,113 | ) | (16,134,004 | ) | (154,441,126 | ) | ||||||||
|
|
|
|
|
|
|
| |||||||||
Total | (9,713,391 | ) | $ | (80,948,075 | ) | (3,766,351 | ) | $ | (47,065,297 | ) | ||||||
|
|
|
|
|
|
|
| |||||||||
| CLASS I | FOR THE YEAR ENDED 12/31/15 | FOR THE YEAR ENDED 12/31/14 | ||||||||||||||
| SHARES | AMOUNT | SHARES | AMOUNT | |||||||||||||
Sold | 3,508,323 | $ | 35,671,017 | 1,936,083 | $ | 23,008,129 | ||||||||||
Reinvested | 568,141 | 5,249,638 | 1,242,972 | 12,385,248 | ||||||||||||
Repurchased | (2,532,905 | ) | (25,245,439 | ) | (2,350,034 | ) | (27,285,111 | ) | ||||||||
|
|
|
|
|
|
|
| |||||||||
Total | 1,543,559 | $ | 15,675,216 | 829,021 | $ | 8,108,266 | ||||||||||
|
|
|
|
|
|
|
| |||||||||
Approximately 62% of the shares outstanding are held by fiduciary accounts where the Advisor has sole investment discretion.
| 6. | Financial Instruments |
The Series may trade in instruments including written and purchased options, forward foreign currency exchange contracts and futures contracts and other derivatives in the normal course of investing activities to assist in managing exposure to various market risks. The Series may be subject to various elements of risk, which may involve, to a varying degree, elements of risk in excess of the amounts recognized for financial statement purposes. These risks include: the risk that changes in the value of a derivative may not correlate perfectly with the underlying asset, rate or index; counterparty credit risk related to over the counter derivative counterparties’ failure to perform under contract terms; liquidity risk related to the lack of a liquid market for these contracts allowing the fund to close out its position(s); and documentation risk relating to disagreement over contract terms. No such investments were held by the Series as of December 31, 2015.
| 7. | Foreign Securities |
Investing in securities of foreign companies and foreign governments involves special risks and considerations not typically associated with investing in securities of domestic companies and the U.S. Government. These risks include revaluation of currencies and future adverse political and economic developments. Moreover, securities of foreign companies and foreign governments and their markets may be less liquid and their prices more volatile than those of comparable domestic companies and the U.S. Government.
| 8. | Federal Income Tax Information |
The amount and characterization of certain income and capital gains to be distributed are determined in accordance with federal income tax regulations, which may differ from GAAP. These differences are primarily due to differing book and tax treatments in the timing and/or treatment of the recognition of net investment income or gains and losses, including foreign currency gains and losses, foreign taxes, qualified late-year losses and investments in passive foreign investment companies (PFICs). The Series may periodically make reclassifications among its capital accounts to reflect income and gains available for distribution
19
International Series
Notes to Financial Statements (continued)
| 8. | Federal Income Tax Information (continued) |
(or available capital loss carryovers) under income tax regulations without impacting the Series’ net asset value. For the year ended December 31, 2015, $1,171,149 was reclassified within the capital accounts from Undistributed Net Investment Income to Accumulated Net Realized Loss. Any such reclassifications are not reflected in the financial highlights.
The tax character of distributions paid were as follows:
| FOR THE YEAR ENDED 12/31/15 | FOR THE YEAR ENDED 12/31/14 | |||||||
Ordinary income | $ | 15,507,821 | $ | 16,622,851 | ||||
Long-term capital gains | 8,149,775 | 56,338,187 | ||||||
At December 31, 2015, the tax basis of components of distributable earnings and the net unrealized depreciation based on the identified cost of investments for federal income tax purposes were as follows:
Cost for federal income tax purposes | $ | 536,424,036 | ||
Unrealized appreciation | 54,812,382 | |||
Unrealized depreciation | (81,543,519 | ) | ||
|
| |||
Net unrealized depreciation | $ | (26,731,137 | ) | |
|
| |||
Undistributed ordinary income | $ | 132,093 | ||
Qualified late-year losses1 | $ | 2,203,928 |
1The Series has elected to defer certain qualified late-year losses and recognize such losses in the year ending December 31, 2016.
20
International Series
Report of Independent Registered Public Accounting Firm
To the Board of Directors of Manning & Napier Fund, Inc. and Shareholders of International Series:
In our opinion, the accompanying statement of assets and liabilities, including the investment portfolio, and the related statements of operations and of changes in net assets and the financial highlights present fairly, in all material respects, the financial position of International Series (a series of Manning & Napier Fund, Inc., hereafter referred to as the “Series”) at December 31, 2015, the results of its operations for the year then ended, the changes in its net assets for each of the two years in the period then ended and the financial highlights for each of the periods presented, in conformity with accounting principles generally accepted in the United States of America. These financial statements and financial highlights (hereafter referred to as “financial statements”) are the responsibility of the Series’ management. Our responsibility is to express an opinion on these financial statements based on our audits. We conducted our audits of these financial statements in accordance with the standards of the Public Company Accounting Oversight Board (United States). Those standards require that we plan and perform the audit to obtain reasonable assurance about whether the financial statements are free of material misstatement. An audit includes examining, on a test basis, evidence supporting the amounts and disclosures in the financial statements, assessing the accounting principles used and significant estimates made by management, and evaluating the overall financial statement presentation. We believe that our audits, which included confirmation of securities at December 31, 2015 by correspondence with the custodian and brokers, provide a reasonable basis for our opinion.

New York, New York
February 19, 2016
21
International Series
Supplemental Tax Information
(unaudited)
All reportings are based on financial information available as of the date of this annual report and, accordingly are subject to change.
For federal income tax purposes, the Series reports for the current fiscal year $11,531,897 or, if different, the maximum amount allowable under the tax law as qualified dividend income.
The Series has elected to pass through to its shareholders the foreign taxes paid for the year ended December 31, 2015. The Series had $13,287,163 in foreign source income and paid foreign taxes of $927,826.
22
International Series
Renewal of Investment Advisory Agreement
(unaudited)
At the Manning & Napier Fund, Inc. (the “Fund”) Board of Directors’ (the “Board”) meeting, held on November 17, 2015, the Investment Advisory Agreement (the “Agreement”) between the Fund and Manning & Napier Advisors, LLC (the “Advisor”) was considered by the Board for renewal. In connection with the decision whether to renew the Agreement, a variety of material was prepared for and considered by the Board.
Representatives of the Advisor attended the meeting and presented additional oral and written information to the Board to assist the Board in its considerations. The discussion immediately below outlines the materials and information presented to the Board in connection with the Board’s 2015 Annual consideration of the Agreement and the conclusions made by the Directors when determining to continue the Agreement.
| • | The Board considered the services provided by the Advisor under the Agreement including, among others: deciding what securities to purchase and sell for each Series; arranging for the purchase and sale of such securities by placing orders with broker-dealers; administering the affairs of the Fund (including the books and records of the Fund not maintained by third party service providers such as the custodian or sub-transfer agent); arranging for the insurance coverage for the Fund; and supervising the preparation of tax returns, SEC filings (including registration statements) and reports to shareholders for the Fund. The Board also considered the nature and quality of such services provided under the Agreement in light of the Advisor’s services provided to the Fund for 29 years. The Board discussed the quality of these services with representatives from the Advisor and concluded that the Advisor was performing its services to the Fund required under the Agreement in a reasonable manner. |
| • | The Board considered the performance of each Series since its inception, as well as performance over multiple time periods. Performance for one or more of the following time periods was considered as applicable to the Series’ inception date: inception, three year, five year, ten year, and current market cycle. A market cycle includes periods of both rising and falling markets. Returns for established benchmark indices for each Series were provided. In addition, the Board considered a number of other factors relevant to performance at the meeting (and considers on a quarterly basis) including: a peer group performance analysis consisting of Morningstar universes of mutual funds with similar investment objectives, investment performance of core products, product offerings, performance on an aggregate basis vs. performance over reasonable time periods and the Advisor’s investment process. The Directors acknowledged the challenging performance and discussed the investment process of the Advisor. The Directors confirmed that qualitative factors such as the Advisor’s investment process, including recent enhancements, were an important subset to be considered as part of their consideration of performance. The Board discussed the performance with representatives from the Advisor and concluded that the investment performance of each of the Fund’s Series was reasonable based on the Series’ actual performance and comparative performance, especially for those series with performance over the current market cycle. |
| • | The Board considered the costs of the Advisor’s services and the profits of the Advisor as they relate to the Advisor’s services to the Fund under the Agreement. In reviewing the Advisor’s costs and profits, the Board discussed the Advisor’s revenues generated from the Fund (on both an actual and adjusted basis) and its expenses associated with providing the services under the Agreement. In addition, the Board reviewed the Advisor’s expenses associated with Fund activities outside of the Agreement (such as expense reimbursements pursuant to expense caps and payments made by the Advisor to third party platforms on which shares of the Fund are available for purchase). It was noted by representatives of the Advisor that 22 of the 36 active Series of the Fund are currently experiencing expenses above the capped expense ratios, and thus the Advisor is incurring those expenses over the cap. After discussing the above costs and profits, the Board concluded that the Advisor’s profitability relating to its services provided under the Agreement was reasonable. |
| • | The Board considered the fees and expenses of the various Series of the Fund. The Advisor presented the advisory fees and total expenses for each Series, including the advisory fee adjusted for any expense waivers or reimbursements (either contractual or voluntary) paid by the Advisor. The advisory fees and expense ratios of each Series were compared to an average (on both a mean and median basis) of similar funds as disclosed on the Morningstar database. Representatives of the Advisor discussed with the Board the levels of its advisory fee for each Series of the Fund and as compared to the median and mean advisory fees for similar funds as listed on Morningstar. Expense ratios for every Series, except the Tax Managed Series, Equity Income Class S, High Yield Bond Class S, Pro-Blend Series Classes C and R, and Target Series’ Classes R and K, are lower than, or substantially similar to the Morningstar mean and median reported total expense ratio. |
23
International Series
Renewal of Investment Advisory Agreement
(unaudited)
The higher than mean and median total expense ratios for Classes C and R reflect higher distribution, marketing and shareholder service fees payable to broker-dealers through a 100bp 12b-1 fee for Class C and a 50bp 12b-1 fee for Class R. Based on their review of the information provided, the Board concluded that the fees and expenses of each Series of the Fund were reasonable on a comparative basis. |
| • | The Board also considered the other benefits the Advisor derives from its relationship with the Fund. Such other benefits include certain research services provided by soft dollars. The Board reviewed the broker-dealers who provided research to the Advisor and the products and services paid for, in whole or in part, using soft dollar commissions. Given the level of soft dollar transactions involving the Fund, the Board concluded that these additional benefits to the Advisor were reasonable. |
| • | In addition to the factors described above, the Board considered the Advisor’s personnel, investment strategies, policies and procedures relating to compliance with personal securities transactions, reputation, expertise and resources in domestic and foreign financial markets. The Board concluded that these factors support the conclusion that the Advisor performs its services in a reasonable manner. |
| • | The Board then considered economies of scale and concluded that the current fee schedule to the advisory agreement remained reasonable given the multiple uses of the Fund (for the Advisor’s discretionary investment account clients in addition to direct investors), the current profitability of the Advisor’s services to the Fund under the Agreement, the number of newly established series of the Fund and the overall size of the Fund complex. |
Based on the Board’s deliberations and their evaluation of the information described above, the Board, including a majority of Directors that are not “interested persons” as defined in the Investment Company Act of 1940, concluded that the compensation under the Agreement was fair and reasonable in light of the services and expenses and such other matters as the Directors considered to be relevant in the exercise of their reasonable judgment. Accordingly, the Board approved the renewal of the Agreement. In the course of their deliberations, the Directors did not identify any particular information that was all important or controlling.
24
International Series
Directors’ and Officers’ Information
(unaudited)
The Statement of Additional Information provides additional information about the Fund’s directors and officers and can be obtained without charge by calling 1-800-466-3863, at www.manningnapieradvisors.com, or on the EDGAR Database on the SEC Internet web site (http:// www.sec.gov). The following chart shows certain information about the Fund’s officers and directors, including their principal occupations during the last five years. Unless specific dates are provided, the individuals have held the listed positions for longer than five years.
| Interested Director/Officer | ||
| Name: | James E. Mikolaichik* | |
| Address: | 290 Woodcliff Drive | |
| Fairport, NY 14450 | ||
| Age: | 44 | |
| Current Position(s) Held with Fund: | Principal Executive Officer, President, Chairman & Director | |
| Term of Office1 & Length of Time Served: | Indefinite - Chairman and Director since August 2015 | |
| Principal Occupation(s) During Past 5 Years: | Chief Financial Officer (since 2011) - Manning & Napier Advisors, LLC; Executive Vice President and Head of Strategy (2008-2011) and Chief Risk Officer (2004-2008) - Old Mutual Asset Management Holds or has held one or more of the following title for various subsidiaries and affiliates: Chief Financial Officer. | |
| Number of Portfolios Overseen within Fund Complex: | 41 | |
Other Directorships Held Outside Fund Complex:
| N/A
|
| Independent Directors | ||
| Name: | Stephen B. Ashley | |
| Address: | 290 Woodcliff Drive | |
| Fairport, NY 14450 | ||
| Age: | 75 | |
| Current Position(s) Held with Fund: | Director, Audit Committee Member, Governance & Nominating Committee Member | |
| Term of Office & Length of Time Served: | Indefinite - Since 1996 | |
| Principal Occupation(s) During Past 5 Years: | Chairman, Director, President & Chief Executive Officer (1997 to present) - The Ashley Group (property management and investment); Director (1995-2008) and Chairman (non-executive) (2004-2008) - Fannie Mae (mortgage). | |
| Number of Portfolios Overseen within Fund Complex: | 41 | |
| Other Directorships Held Outside Fund Complex: | Fannie Mae (1995-2008) The Ashley Group (1995-2008) Genesee Corporation (1987-2007)
|
| Name: | Paul A. Brooke | |
| Address: | 290 Woodcliff Drive | |
| Fairport, NY 14450 | ||
| Age: | 70 | |
| Current Position(s) Held with Fund: | Director, Audit Committee Member, Governance & Nominating Committee Member | |
| Term of Office & Length of Time Served: | Indefinite - Since 2007 | |
| Principal Occupation(s) During Past 5 Years: | Chairman & CEO (2005-2009) - Ithaka Acquisition Corporation | |
| (investments); Chairman (2007-2009) Alsius Corporation (investments); Managing Member, PMSV Holdings LLC (investments) since 1991; Managing Member, Venbio (investments) since 2010. | ||
| Number of Portfolios Overseen within Fund Complex: | 41 | |
| Other Directorships Held Outside Fund Complex: | Incyte Corp. (2000-present) ViroPharma, Inc. (2000-2014) HLTH Corp (WebMD) (2000-2010) Cheyne Capital International (2000-present) GMP Companies (2000-2011) Cytos Biotechnology Ltd. (2012-2014)
|
25
International Series
Directors’ and Officers’ Information
(unaudited)
Independent Directors (continued)
| Name: | Peter L. Faber | |
| Address: | 290 Woodcliff Drive | |
| Fairport, NY 14450 | ||
| Age: | 77 | |
| Current Position(s) Held with Fund: | Director, Governance & Nominating Committee Member | |
| Term of Office & Length of Time Served: | Indefinite - Since 1987 | |
| Principal Occupation(s) During Past 5 Years: | Senior Counsel (2006-2012), Partner (1995-2006 & 2013-present) - McDermott, Will & Emery LLP (law firm) | |
| Number of Portfolios Overseen within Fund Complex: | 41 | |
| Other Directorships Held Outside Fund Complex: | Boston Early Music Festival (non-profit)(2007-present) Amherst Early Music, Inc. (non-profit)(2009-present) Gotham Early Music Scene, Inc. (non-profit)(2009-present) Partnership for New York City, Inc. (non-profit) (1989-2010) New York Collegium (non-profit) (2004-2011)
|
| Name: | Harris H. Rusitzky | |
| Address: | 290 Woodcliff Drive Fairport, NY 14450 | |
| Age: | 80 | |
| Current Position(s) Held with Fund: | Director, Audit Committee Member, Governance & Nominating Committee Member | |
| Term of Office & Length of Time Served: | Indefinite - Since 1985 | |
| Principal Occupation(s) During Past 5 Years: | President, The Greening Group (business consultants) since 1994; Partner, The Restaurant Group (restaurants) since 2006 | |
| Number of Portfolios Overseen within Fund Complex: | 41 | |
| Other Directorships Held Outside Fund Complex: | Rochester Institute of Technology (university)(1972-present) Culinary Institute of America (non-profit college)(1985-present) George Eastman House (museum)(1988-present) National Restaurant Association (restaurant trade organization)(1978- present)
|
| Name: | Chester N. Watson | |
| Address: | 290 Woodcliff Drive | |
| Fairport, NY 14450 | ||
| Age: | 65 | |
| Current Position(s) Held with Fund: | Director, Audit Committee Chairman, Governance & Nominating Committee Member | |
| Term of Office & Length of Time Served: | Indefinite - Since 2012 | |
| Principal Occupation(s) During Past 5 Years: | General Auditor (2003-2011) - General Motors Company (auto manufacturer) | |
| Number of Portfolios Overseen within Fund Complex: | 41 | |
Other Directorships Held Outside Fund Complex:
| Rochester Institute of Technology (university)(2005-present)
|
| Officers | ||
| Name: | Jeffrey S. Coons, Ph.D., CFA | |
| Address: | 290 Woodcliff Drive | |
| Fairport, NY 14450 | ||
| Age: | 52 | |
| Current Position(s) Held with Fund: | Vice President | |
| Term of Office1 & Length of Time Served: | Since 2004 | |
| Principal Occupation(s) During Past 5 Years: | President since 2010, Co-Director of Research (2002-2015) - Manning & Napier Advisors, LLC Holds one or more of the following titles for various subsidiaries and affiliates: President, Director, Treasurer or Senior Trust Officer. | |
| Number of Portfolios Overseen within Fund Complex: | 41 | |
Other Directorships Held Outside Fund Complex:
| N/A
|
26
International Series
Directors’ and Officers’ Information
(unaudited)
| Officers (continued) | ||
| Name: | Elizabeth Craig | |
| Address: | 290 Woodcliff Drive | |
| Fairport, NY 14450 | ||
| Age: | 28 | |
| Current Position(s) Held with Fund: | Assistant Corporate Secretary | |
| Term of Office1 & Length of Time Served: | Since 2011 | |
| Principal Occupation(s) During Past 5 Years: | Fund Administration Manager since 2015; Mutual Fund Compliance Specialist (2009-2015) - Manning & Napier Advisors, LLC | |
| Number of Portfolios Overseen within Fund Complex: | 41 | |
Other Directorships Held Outside Fund Complex:
| N/A
|
| Name: | Christine Glavin | |
| Address: | 290 Woodcliff Drive | |
| Fairport, NY 14450 | ||
| Age: | 49 | |
| Current Position(s) Held with Fund: | Principal Financial Officer, Chief Financial Officer | |
| Term of Office1 & Length of Time Served: | Principal Financial Officer since 2002; Chief Financial Officer since 2001 | |
| Principal Occupation(s) During Past 5 Years: | Director of Fund Reporting since 2011; Fund Reporting Manager (1997-2011) - Manning & Napier Advisors, LLC; Assistant Treasurer since 2008 - Exeter Trust Company | |
| Number of Portfolios Overseen within Fund Complex: | 41 | |
Other Directorships Held Outside Fund Complex:
| N/A
|
| Name: | Jodi L. Hedberg | |
| Address: | 290 Woodcliff Drive | |
| Fairport, NY 14450 | ||
| Age: | 48 | |
| Current Position(s) Held with Fund: | Corporate Secretary, Chief Compliance Officer, Anti-Money Laundering Compliance Officer | |
| Term of Office1 & Length of Time Served: | Corporate Secretary since 1997; Chief Compliance Officer since 2004; Anti-Money Laundering Compliance Officer since 2002 | |
| Principal Occupation(s) During Past 5 Years: | Director of Compliance since 2005; Compliance Manager (1995-2005) - Manning & Napier Advisors, LLC and affiliates; Corporate Secretary - Manning & Napier Investor Services, Inc. since 2006 | |
| Number of Portfolios Overseen within Fund Complex: | 41 | |
Other Directorships Held Outside Fund Complex:
| N/A
|
| Name: | Richard Yates | |
| Address: | 290 Woodcliff Drive | |
| Fairport, NY 14450 | ||
| Age: | 50 | |
| Current Position(s) Held with Fund: | Chief Legal Officer | |
| Term of Office1 & Length of Time Served: | Chief Legal Officer since 2004 | |
| Principal Occupation(s) During Past 5 Years: | Counsel - Manning & Napier Advisors, LLC and affiliates since 2000; Holds one or more of the following titles for various affiliates; Director or Corporate Secretary | |
| Number of Portfolios Overseen within Fund Complex: | 41 | |
Other Directorships Held Outside Fund Complex:
| N/A
|
*Interested Director, within the meaning of the Investment Company Act of 1940 by reason of his position with the Fund’s investment advisor and distributor. Mr. Mikolaichik serves as the Chief Financial Officer for Manning & Napier Advisors, LLC.
1The term of office of all officers shall be one year and until their respective successors are chosen and qualified, or his or her earlier resignation or removal as provided in the Fund’s By-Laws.
27
International Series
Results of Special Meeting of Shareholders
(unaudited)
A Special Meeting of the Shareholders of the Fund was held on August 18, 2015. The number of votes necessary to conduct the meeting and approve the proposal was obtained, and the results of the vote of shareholders of all the Series of the Fund voting together in the aggregate is listed below:
PROPOSAL 1:
Election of Directors
| NUMBER OF SHARES VOTED FOR | NUMBER OF SHARES WITHELD | |||||||
Stephen B. Ashley | 883,968,395 | 8,618,094 | ||||||
Paul A. Brooke | 884,510,661 | 8,075,828 | ||||||
Peter L. Faber | 884,140,893 | 8,445,596 | ||||||
James E. Mikolaichik | 883,391,832 | 9,194,657 | ||||||
Harris H. Rusitzky | 620,022,215 | 272,564,274 | ||||||
Chester N. Watson | 884,638,809 | 7,947,680 | ||||||
28
International Series
Literature Requests
(unaudited)
Proxy Voting Policies and Procedures
A description of the policies and procedures that the Fund uses to determine how to vote proxies relating to portfolio securities is available, without charge, upon request:
| By phone | 1-800-466-3863 | |||
| On the Securities and Exchange | ||||
| Commission’s (SEC) web site | http://www.sec.gov |
Proxy Voting Record
Information regarding how the Fund voted proxies relating to portfolio securities during the most recent 12-month period ended June 30th is available, without charge, upon request:
| By phone | 1-800-466-3863 | |||
| On the SEC’s web site | http://www.sec.gov |
Quarterly Portfolio Holdings
The Series’ complete schedule of portfolio holdings for the 1st and 3rd quarters of each fiscal year are provided on Form N-Q, and are available, without charge, upon request:
| By phone | 1-800-466-3863 | |||
| On the SEC’s web site | http://www.sec.gov |
The Series’ Form N-Q may be reviewed and copied at the SEC’s Public Reference Room in Washington, D.C. Information on the operation of the Public Reference Room may be obtained by calling 1-800-SEC-0330.
Prospectus and Statement of Additional Information (SAI)
For more information about any of the Manning & Napier Fund, Inc. Series, you may obtain a prospectus and SAI at www.manning-napier.com or by calling (800) 466-3863. Before investing, carefully consider the objectives, risks, charges and expenses of the investment and read the prospectus carefully as it contains this and other information about the investment company. In addition, this information can be found on the SEC’s web site, http://www.sec.gov.
Additional information available at www.manning-napier.com
1. Fund Holdings - Month-End
2. Fund Holdings - Quarter-End
3. Shareholder Report - Annual
4. Shareholder Report - Semi-Annual
The Fund also offers electronic notification or “e-delivery” when certain documents are available on-line to be downloaded or reviewed. Direct shareholders can elect to receive electronic notification when shareholder reports, prospectus updates, and/or statements are available. If you do not currently have on-line access to your account, you can establish access by going to www.manning-napier.com, click on “Login” in the top corner of the page, and follow the prompts to self-enroll. Once enrolled, you can set your electronic notification preferences by clicking on the Account Options tab located within the green toolbar and then select E-Delivery Option. Should you have any questions on either how to establish on-line access or how to update your account settings, please contact Investor Services at 1-800-466-3863.
The Manning & Napier Fund, Inc. is managed by Manning & Napier Advisors, LLC. Manning & Napier Investor Services, Inc., an affiliate of Manning & Napier Advisors, LLC, is the distributor of the Fund shares.
MNINT-12/15-AR

World Opportunities Series
Management Discussion and Analysis
(unaudited)
Dear Shareholders:
Volatility defined global equity markets during the past year, largely driven by macroeconomic factors. Markets around the world experienced a correction in late August amidst a broad selloff triggered by renewed concerns about economic growth in emerging markets — China in particular — and uncertainty about the effects of that slowdown on overall global growth. Developed economies continued to provide accommodative monetary policy to combat growth concerns, although in December the U.S. Federal Reserve raised the federal funds rate for the first time in nearly a decade. For much of the year, Europe struggled with uncertainty regarding Greece’s ability to secure bailout funding from its creditors, which negatively affected investor sentiment. China’s economy slowed, but the government continued to demonstrate a willingness to provide support through a combination of policy-easing maneuvers and targeted stimulus measures. The U.S. economy remained on a path of slow growth that nevertheless made it the best performing developed economy. U.S. stocks were largely flat for the year, whereas global equity markets moderately declined. Looking ahead, we expect the slow global growth environment to remain in place for the foreseeable future.
As always, we appreciate your business.
Sincerely,
Manning & Napier Advisors, LLC
1
World Opportunities Series
Fund Commentary
(unaudited)
Investment Objective
To maximize long-term growth by investing principally in the common stocks of companies located around the world. The Series invests primarily in foreign companies, including those in developed and emerging markets.
Performance Commentary
International equity markets struggled during 2015, with both developed and emerging markets ending the year in negative territory. Weakness was most pronounced in emerging markets, as declining prices for oil and other commodities weighed on the asset class. U.S. dollar strength and emerging market currency weakness also pressured emerging market returns, especially for U.S.-dollar-based investors. The MSCI ACWI ex USA (ACWIxUS) experienced a return of -5.66%. The World Opportunities Series also struggled, returning -5.91%, slightly underperforming its benchmark on a relative basis. Importantly, the Series has provided robust positive absolute returns over the current international stock market cycle, which began in April 2003.
The Series’ underperformance relative to the ACWIxUS during the year was driven by stock selection. Conversely, sector positioning aided relative returns. Regarding major detractors from relative performance, stock selection in Industrials, Telecommunication Services, Consumer Discretionary, and Energy challenged relative returns. From a country positioning and selection perspective, the Series’ underweight to Japan relative to the benchmark, overweight to Brazil and China, and stock selection in Canada, Mexico, and Australia challenged relative returns.
Offsetting a portion of the relative performance weakness was stock selection in Information Technology and Financials, which aided relative returns. The Series’ overweights to Consumer Staples and Health Care relative to the benchmark, as well as an underweight to Financials, also aided relative performance. At a country level, stock selection in China, the United Kingdom, Germany, and Japan contributed positively to relative returns, as did the Series’ overweight as compared to the benchmark to Belgium and Ireland.
In regard to the Series’ current positioning, from a sector allocation perspective, our focus on growth during recent years and on companies that we believe have control of their destiny has led to meaningful allocations to Consumer Staples, Consumer Discretionary, Information Technology, and Health Care. The Series contains relatively little exposure to Telecommunication Services and lacks exposure to Financials and Utilities. Regionally, about 65% of the Series is allocated to Europe, roughly 20% to Emerging Markets, and approximately 7% to the Americas, with the remaining assets allocated to the Pacific region.
During 2016 we believe investors should expect further gyrations in equity markets due to catalysts such as geopolitical risks, the diverging monetary policies of major central banks, commodity price pressures, and the potential for global growth to deviate from expectations. With the Federal Reserve having raised the federal funds rate, we think they now will seek to remain flexible and proceed slowly with small increases that do not follow a well-defined schedule. Broadly speaking, valuations in the developed world remain neutral at best, whereas valuations in select emerging markets are relatively more attractive. Shareholders should expect us to view volatility as a buying opportunity given that our indicators do not suggest capital risk is a significant near-term concern. In light of the current environment, it is important that investors remain active, flexible, and selective in their approach in order to avoid overvalued areas of the market, something Manning & Napier has done for over 45 years as an active investment manager.
Performance data quoted represents past performance and does not guarantee future results. The investment return and principal value of an investment will fluctuate, so that an investor’s shares, when redeemed, may be worth more or less than their original cost. Current performance may be higher or lower than that quoted; investors can obtain the most recent month-end performance at www.manning-napier.com or by calling (800) 466-3863.
Please see the next page for additional performance information as of December 31, 2015.
All investments involve risks, including possible loss of principal. Funds whose investments are concentrated in foreign countries may be subject to fluctuating currency values, different accounting standards, and economic and political instability. The value of the Series may be affected by changes in exchange rates between foreign currencies and the U.S. dollar. Investments in emerging markets may be more volatile than investments in more developed markets.
2
World Opportunities Series
Performance Update as of December 31, 2015
(unaudited)
| AVERAGE ANNUAL TOTAL RETURNS AS OF DECEMBER 31, 2015 | ||||||||||||||||
ONE YEAR1 | FIVE YEAR | TEN YEAR | SINCE INCEPTION2 | |||||||||||||
Manning & Napier Fund, Inc. - World Opportunities Series3 | -5.91 | % | 0.10 | % | 3.50 | % | 7.16 | % | ||||||||
MSCI ACWI ex USA Index4 | -5.66 | % | 1.06 | % | 2.92 | % | 4.59 | % | ||||||||
The following graph compares the value of a $10,000 investment in the Manning & Napier Fund, Inc. - World Opportunities Series for the ten years ended December 31, 2015 to the MSCI ACWI ex USA Index.
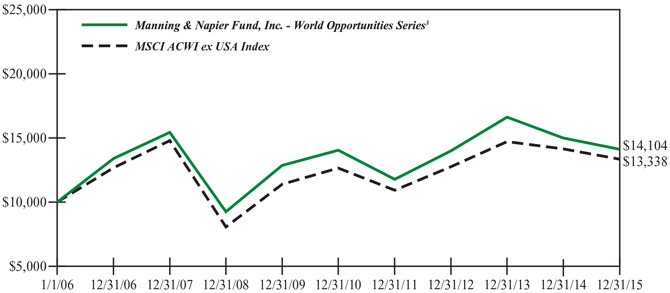
1The returns shown are based on net asset values calculated for shareholder transactions and may differ from the returns shown in the financial highlights, which reflect adjustments made to the net asset values in accordance with accounting principles generally accepted in the United States of America.
2Performance numbers for the Series are calculated from September 6, 1996, the Series’ inception date. Prior to 2001, the MSCI ACWI ex USA Index only published month-end numbers; therefore, performance numbers for the Index are calculated from September 30, 1996.
3The Series’ performance does not reflect the deduction of taxes that a shareholder would pay on fund distributions or the redemption of shares. The Series’ performance is historical and may not be indicative of future results. The performance returns shown are inclusive of the net expense ratio of the Series. For the year ended December 31, 2015, this net expense ratio was 1.08%. The gross expense ratio, which does not account for any voluntary or contractual waivers currently in effect, was 1.08% for the year ended December 31, 2015.
4The MSCI ACWI ex USA Index is a free float-adjusted market capitalization index that is designed to measure equity market performance in the global developed and emerging markets and consists of 43 developed and emerging market country indices outside the U.S. The Index returns do not reflect any fees or expenses. The Index is denominated in U.S. dollars. The Index returns assume daily investment of gross dividends (which do not account for applicable dividend taxation) prior to December 31, 1998, as net returns were not available. Subsequent to December 31, 1998, the Index returns are net of withholding taxes. They assume daily reinvestment of net dividends thus accounting for any applicable dividend taxation. Index returns provided by Bloomberg.
3
World Opportunities Series
Shareholder Expense Example
(unaudited)
As a shareholder of the Series, you incur ongoing costs, including management fees, shareholder service fees and other Series expenses. This example is intended to help you understand your ongoing costs (in dollars) of investing in the Series and to compare these costs with the ongoing costs of investing in other mutual funds.
The example is based on an investment of $1,000 invested at the beginning of the period and held for the entire period (July 1, 2015 to December 31, 2015).
Actual Expenses
The first line of the table below provides information about actual account values and actual expenses. You may use the information in this line, together with the amount you invested, to estimate the expenses that you paid over the period. Simply divide your account value by $1,000 (for example, an $8,600 account value divided by $1,000 = 8.6), then multiply the result by the number in the first line under the heading entitled “Expenses Paid During Period” to estimate the expenses you paid on your account during this period.
Hypothetical Example for Comparison Purposes
The second line of the table below provides information about hypothetical account values and hypothetical expenses based on the Series’ actual expense ratio and an assumed rate of return of 5% per year before expenses, which is not the Series’ actual return. The hypothetical account values and expenses may not be used to estimate the actual ending account balance or expenses you paid during the period. You may use this information to compare the ongoing costs of investing in the Series and other funds. To do so, compare this 5% hypothetical example with the 5% hypothetical examples that appear in the shareholder reports of the other funds.
Please note that the expenses shown in the table are meant to highlight your ongoing costs only and do not reflect any transaction costs such as sales charges (loads), redemption fees, or exchange fees that you may incur in other mutual funds. Therefore, the second line of the table is useful in comparing ongoing costs only, and will not help you determine the relative total costs of owning different funds.
| BEGINNING ACCOUNT VALUE 7/1/15 | ENDING ACCOUNT VALUE 12/31/15 | EXPENSES PAID DURING PERIOD* 7/1/15-12/31/15 | ||||
Actual | $1,000.00 | $909.90 | $4.96 | |||
Hypothetical | ||||||
(5% return before expenses) | $1,000.00 | $1,020.01 | $5.24 |
*Expenses are equal to the Series’ annualized expense ratio (for the six-month period) of 1.03%, multiplied by the average account value over the period, multiplied by 184/365 (to reflect the one-half year period). Expenses are based on the most recent fiscal half year; therefore, the expense ratios stated above may differ from the expense ratios stated in the financial highlights, which is based on one-year data.
4
World Opportunities Series
Portfolio Composition as of December 31, 2015
(unaudited)
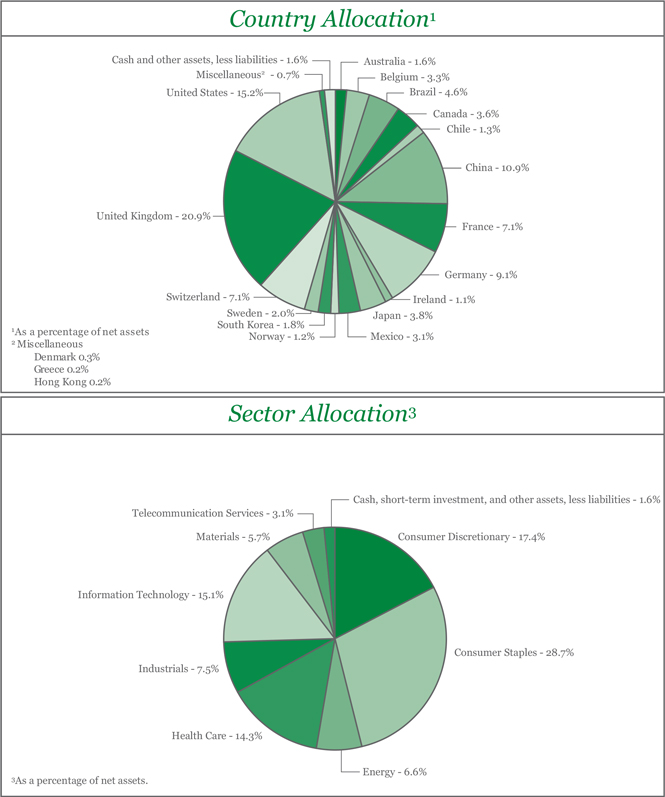
5
World Opportunities Series
Investment Portfolio - December 31, 2015
| SHARES | VALUE (NOTE 2) | |||||||
COMMON STOCKS - 98.4% | ||||||||
Consumer Discretionary - 17.4% | ||||||||
Diversified Consumer Services - 2.0% | ||||||||
Kroton Educacional S.A. (Brazil) | 13,338,613 | $ | 32,130,675 | |||||
|
| |||||||
Hotels, Restaurants & Leisure - 3.0% | ||||||||
Accor S.A. (France)1 | 1,105,508 | 47,879,756 | ||||||
|
| |||||||
Media - 7.1% | ||||||||
ITV plc (United Kingdom)1 | 10,271,862 | 41,820,605 | ||||||
Liberty Global plc - Class A - ADR (United Kingdom)* | 1,369,430 | 58,009,055 | ||||||
Modern Times Group AB - Class B (Sweden)1 | 490,046 | 12,512,724 | ||||||
|
| |||||||
| 112,342,384 | ||||||||
|
| |||||||
Specialty Retail - 2.1% | ||||||||
Kingfisher plc (United Kingdom)1 | 6,761,340 | 32,748,636 | ||||||
|
| |||||||
Textiles, Apparel & Luxury Goods - 3.2% | ||||||||
lululemon athletica, Inc.* | 985,250 | 51,696,068 | ||||||
|
| |||||||
Total Consumer Discretionary | 276,797,519 | |||||||
|
| |||||||
Consumer Staples - 28.7% | ||||||||
Beverages - 11.5% | ||||||||
AMBEV S.A. - ADR (Brazil) | 9,249,696 | 41,253,644 | ||||||
Anheuser-Busch InBev N.V. (Belgium)1 | 422,130 | 52,533,196 | ||||||
Diageo plc (United Kingdom)1 | 1,840,530 | 50,261,048 | ||||||
Remy Cointreau S.A. (France)1 | 123,120 | 8,818,557 | ||||||
SABMiller plc (United Kingdom)1 | 503,550 | 30,124,570 | ||||||
|
| |||||||
| 182,991,015 | ||||||||
|
| |||||||
Food & Staples Retailing - 2.9% | ||||||||
Carrefour S.A. (France)1 | 545,655 | 15,747,468 | ||||||
Tesco plc (United Kingdom)*1 | 13,607,230 | 29,899,016 | ||||||
|
| |||||||
| 45,646,484 | ||||||||
|
| |||||||
Food Products - 5.2% | ||||||||
Danone S.A. (France)1 | 600,940 | 40,607,830 | ||||||
Nestle S.A. (Switzerland)1 | 567,930 | 42,160,428 | ||||||
|
| |||||||
| 82,768,258 | ||||||||
|
| |||||||
Personal Products - 4.2% | ||||||||
Beiersdorf AG (Germany)1 | 195,766 | 17,793,535 | ||||||
Unilever plc - ADR (United Kingdom) | 1,149,140 | 49,550,917 | ||||||
|
| |||||||
| 67,344,452 | ||||||||
|
| |||||||
Tobacco - 4.9% | ||||||||
Japan Tobacco, Inc. (Japan)1 | 1,633,100 | 59,957,260 | ||||||
Swedish Match AB (Sweden)1 | 524,831 | 18,546,167 | ||||||
|
| |||||||
| 78,503,427 | ||||||||
|
| |||||||
Total Consumer Staples | 457,253,636 | |||||||
|
| |||||||
The accompanying notes are an integral part of the financial statements.
6
World Opportunities Series
Investment Portfolio - December 31, 2015
| SHARES | VALUE (NOTE 2) | |||||||
COMMON STOCKS (continued) | ||||||||
Energy - 6.6% | ||||||||
Energy Equipment & Services - 3.0% | ||||||||
Schlumberger Ltd | 691,240 | $ | 48,213,990 | |||||
|
| |||||||
Oil, Gas & Consumable Fuels - 3.6% | ||||||||
Cameco Corp. (Canada) | 3,997,510 | 49,289,298 | ||||||
Whitehaven Coal Ltd. (Australia)*1 | 14,044,782 | 7,088,843 | ||||||
|
| |||||||
| 56,378,141 | ||||||||
|
| |||||||
Total Energy | 104,592,131 | |||||||
|
| |||||||
Health Care - 14.3% | ||||||||
Health Care Equipment & Supplies - 5.1% | ||||||||
BioMerieux (France)1 | 6,065 | 723,710 | ||||||
Medtronic plc | 791,850 | 60,909,102 | ||||||
Shandong Weigao Group Medical Polymer Co. Ltd. - Class H (China)1 | 28,592,000 | 19,550,585 | ||||||
|
| |||||||
| 81,183,397 | ||||||||
|
| |||||||
Health Care Providers & Services - 4.3% | ||||||||
Fresenius Medical Care AG & Co. KGaA (Germany)1 | 807,690 | 67,874,245 | ||||||
|
| |||||||
Life Sciences Tools & Services - 1.5% | ||||||||
QIAGEN N.V.*1 | 693,540 | 18,797,939 | ||||||
QIAGEN N.V. - ADR* | 184,002 | 5,087,655 | ||||||
|
| |||||||
| 23,885,594 | ||||||||
|
| |||||||
Pharmaceuticals - 3.4% | ||||||||
Novartis AG - ADR (Switzerland) | 638,500 | 54,936,540 | ||||||
|
| |||||||
Total Health Care | 227,879,776 | |||||||
|
| |||||||
Industrials - 7.5% | ||||||||
Airlines - 1.1% | ||||||||
Ryanair Holdings plc - ADR (Ireland) | 210,098 | 18,165,073 | ||||||
|
| |||||||
Commercial Services & Supplies - 1.7% | ||||||||
Aggreko plc (United Kingdom)1 | 1,943,693 | 26,165,587 | ||||||
|
| |||||||
Machinery - 2.0% | ||||||||
Sulzer AG (Switzerland)1 | 173,680 | 16,324,810 | ||||||
The Weir Group plc (United Kingdom)1 | 1,016,010 | 14,924,055 | ||||||
|
| |||||||
| 31,248,865 | ||||||||
|
| |||||||
Marine - 0.7% | ||||||||
D/S Norden A/S (Denmark)*1 | 240,147 | 4,258,021 | ||||||
Diana Shipping, Inc. (Greece)* | 724,738 | 3,152,610 | ||||||
Pacific Basin Shipping Ltd. (Hong Kong)1 | 15,452,000 | 3,381,932 | ||||||
Star Bulk Carriers Corp. (Greece)* | 1,332,568 | 806,337 | ||||||
|
| |||||||
| 11,598,900 | ||||||||
|
| |||||||
The accompanying notes are an integral part of the financial statements.
7
World Opportunities Series
Investment Portfolio - December 31, 2015
| SHARES | VALUE (NOTE 2) | |||||||
COMMON STOCKS (continued) | ||||||||
Industrials (continued) | ||||||||
Trading Companies & Distributors - 2.0% | ||||||||
Brenntag AG (Germany)1 | 613,488 | $ | 31,967,656 | |||||
|
| |||||||
Total Industrials | 119,146,081 | |||||||
|
| |||||||
Information Technology - 15.1% | ||||||||
Internet Software & Services - 9.7% | ||||||||
Alibaba Group Holding Ltd. - ADR (China)* | 703,570 | 57,179,134 | ||||||
Baidu, Inc. - ADR (China)* | 272,080 | 51,434,003 | ||||||
Tencent Holdings Ltd. - Class H (China)1 | 2,297,895 | 44,992,752 | ||||||
|
| |||||||
| 153,605,889 | ||||||||
|
| |||||||
IT Services - 3.6% | ||||||||
Amdocs Ltd. - ADR | 1,055,627 | 57,605,565 | ||||||
|
| |||||||
Technology Hardware, Storage & Peripherals - 1.8% | ||||||||
Samsung Electronics Co. Ltd. (South Korea)1 | 26,700 | 28,477,747 | ||||||
|
| |||||||
Total Information Technology | 239,689,201 | |||||||
|
| |||||||
Materials - 5.7% | ||||||||
Chemicals - 1.7% | ||||||||
Potash Corp. of Saskatchewan, Inc. (Canada) | 410,540 | 7,028,445 | ||||||
Sociedad Quimica y Minera de Chile S.A. - ADR (Chile) | 1,051,908 | 19,996,771 | ||||||
|
| |||||||
| 27,025,216 | ||||||||
|
| |||||||
Metals & Mining - 4.0% | ||||||||
Alumina Ltd. (Australia)1 | 22,348,136 | 18,650,404 | ||||||
Norsk Hydro ASA (Norway)1 | 4,989,326 | 18,545,828 | ||||||
ThyssenKrupp AG (Germany)1 | 1,366,050 | 27,079,854 | ||||||
|
| |||||||
| 64,276,086 | ||||||||
|
| |||||||
Total Materials | 91,301,302 | |||||||
|
| |||||||
Telecommunication Services - 3.1% | ||||||||
Wireless Telecommunication Services - 3.1% | ||||||||
America Movil S.A.B. de C.V. - Class L - ADR (Mexico) | 3,322,125 | 46,709,078 | ||||||
Telesites S.A.B. de C.V. (Mexico)* | 3,322,125 | 2,166,624 | ||||||
|
| |||||||
Total Telecommunication Services | 48,875,702 | |||||||
|
| |||||||
TOTAL COMMON STOCKS | ||||||||
(Identified Cost $1,745,338,090) | 1,565,535,348 | |||||||
|
| |||||||
The accompanying notes are an integral part of the financial statements.
8
World Opportunities Series
Investment Portfolio - December 31, 2015
| SHARES | VALUE (NOTE 2) | |||||||
SHORT-TERM INVESTMENT - 1.3% | ||||||||
Dreyfus Cash Management, Inc. - Institutional Shares2, 0.23%, (Identified Cost $20,906,895) | 20,906,895 | $ | 20,906,895 | |||||
|
| |||||||
TOTAL INVESTMENTS - 99.7% | ||||||||
(Identified Cost $1,766,244,985) | 1,586,442,243 | |||||||
OTHER ASSETS, LESS LIABILITIES - 0.3% | 5,483,081 | |||||||
|
| |||||||
NET ASSETS - 100% | $ | 1,591,925,324 | ||||||
|
| |||||||
KEY:
ADR - American Depositary Receipt
*Non-income producing security.
1A factor from a third party vendor was applied to determine the security’s fair value following the close of local trading.
2Rate shown is the current yield as of December 31, 2015.
The Series’ portfolio holds, as a percentage of net assets, greater than 10% in the following countries: United Kingdom - 20.9%; China - 10.9%.
The Global Industry Classification Standard (GICS) was developed by and is the exclusive property and a service mark of MSCI Inc. (MSCI) and Standard & Poor’s, a division of The McGraw-Hill Companies, Inc. (S&P), and is licensed for use by Manning & Napier when referencing GICS sectors. Neither MSCI, S&P, nor any third party involved in making or compiling the GICS or any GICS classifications makes any express or implied warranties or representations with respect to such standard or classification, nor shall any such party have any liability therefrom.
The accompanying notes are an integral part of the financial statements.
9
World Opportunities Series
Statement of Assets and Liabilities
December 31, 2015
ASSETS: | ||||
Investments (identified cost $1,766,244,985) | $ | 1,586,442,243 | ||
Receivable for fund shares sold | 9,400,237 | |||
Foreign tax reclaims receivable | 9,063,871 | |||
Dividends receivable | 2,472,529 | |||
Receivable for securities sold | 25,786 | |||
|
| |||
TOTAL ASSETS | 1,607,404,666 | |||
|
| |||
LIABILITIES: | ||||
Accrued management fees (Note 3) | 1,399,418 | |||
Accrued transfer agent fees (Note 3) | 210,041 | |||
Accrued fund accounting and administration fees (Note 3) | 102,512 | |||
Accrued directors’ fees (Note 3) | 6,299 | |||
Accrued Chief Compliance Officer service fees (Note 3) | 429 | |||
Payable for fund shares repurchased | 7,010,957 | |||
Payable for securities purchased | 6,060,060 | |||
Other payables and accrued expenses | 689,626 | |||
|
| |||
TOTAL LIABILITIES | 15,479,342 | |||
|
| |||
TOTAL NET ASSETS | $ | 1,591,925,324 | ||
|
| |||
NET ASSETS CONSIST OF: | ||||
Capital stock | $ | 2,352,083 | ||
Additional paid-in-capital | 2,175,228,094 | |||
Distributions in excess of net investment income | (166,451 | ) | ||
Accumulated net realized loss on investments, foreign currency and translation of other assets and liabilities | (404,390,887 | ) | ||
Net unrealized depreciation on investments, foreign currency and translation of other assets and liabilities | (181,097,515 | ) | ||
|
| |||
TOTAL NET ASSETS | $ | 1,591,925,324 | ||
|
| |||
NET ASSET VALUE, OFFERING PRICE AND REDEMPTION PRICE PER SHARE - Class A | ||||
($1,591,925,324/235,208,312 shares) | $ | 6.77 | ||
|
| |||
The accompanying notes are an integral part of the financial statements.
10
World Opportunities Series
Statement of Operations
For the Year Ended December 31, 2015
INVESTMENT INCOME: | ||||
Dividends (net of foreign taxes withheld, $6,325,563) (Note 2) | $ | 69,333,033 | ||
|
| |||
EXPENSES: | ||||
Management fees (Note 3) | 31,947,350 | |||
Transfer agent fees (Note 3) | 672,455 | |||
Fund accounting and administration fees (Note 3) | 308,392 | |||
Directors’ fees (Note 3) | 128,890 | |||
Chief Compliance Officer service fees (Note 3) | 2,541 | |||
Custodian fees | 554,305 | |||
Miscellaneous | 867,899 | |||
|
| |||
Total Expenses | 34,481,832 | |||
|
| |||
NET INVESTMENT INCOME | 34,851,201 | |||
|
| |||
REALIZED AND UNREALIZED GAIN (LOSS) ON INVESTMENTS AND FOREIGN CURRENCY: | ||||
Net realized gain (loss) on- | ||||
Investments | (231,490,514 | ) | ||
Foreign currency and translation of other assets and liabilities | 1,134,000 | |||
|
| |||
| (230,356,514 | ) | |||
|
| |||
Net change in unrealized appreciation (depreciation) on- | ||||
Investments | 143,440,403 | |||
Foreign currency and translation of other assets and liabilities | (456,294 | ) | ||
|
| |||
| 142,984,109 | ||||
|
| |||
NET REALIZED AND UNREALIZED GAIN (LOSS) ON INVESTMENTS AND FOREIGN CURRENCY | (87,372,405 | ) | ||
|
| |||
NET DECREASE IN NET ASSETS RESULTING FROM OPERATIONS | $ | (52,521,204 | ) | |
|
| |||
The accompanying notes are an integral part of the financial statements.
11
World Opportunities Series
Statements of Changes in Net Assets
FOR THE YEAR ENDED | FOR THE YEAR ENDED | |||||||
DECREASE IN NET ASSETS: | ||||||||
OPERATIONS: | ||||||||
Net investment income | $ | 34,851,201 | $ | 88,301,678 | ||||
Net realized gain (loss) on investments and foreign currency | (230,356,514 | ) | 315,261,349 | |||||
Net change in unrealized appreciation (depreciation) on investments and foreign currency | 142,984,109 | (1,121,031,627 | ) | |||||
|
|
|
| |||||
Net decrease from operations | (52,521,204 | ) | (717,468,600 | ) | ||||
|
|
|
| |||||
DISTRIBUTIONS TO SHAREHOLDERS (Note 9): | ||||||||
From net investment income | (29,507,717 | ) | (72,063,094 | ) | ||||
From net realized gain on investments | — | (529,776,133 | ) | |||||
|
|
|
| |||||
Total distributions to shareholders | (29,507,717 | ) | (601,839,227 | ) | ||||
|
|
|
| |||||
CAPITAL STOCK ISSUED AND REPURCHASED: | ||||||||
Net decrease from capital share transactions (Note 5) | (3,770,237,638 | ) | (1,161,377,106 | ) | ||||
|
|
|
| |||||
Net decrease in net assets | (3,852,266,559 | ) | (2,480,684,933 | ) | ||||
NET ASSETS: | ||||||||
Beginning of year | 5,444,191,883 | 7,924,876,816 | ||||||
|
|
|
| |||||
End of year (including distributions in excess of net investment income of $166,451 and $2,917,428, respectively) | $ | 1,591,925,324 | $ | 5,444,191,883 | ||||
|
|
|
| |||||
The accompanying notes are an integral part of the financial statements.
12
World Opportunities Series
Financial Highlights
| FOR THE YEARS ENDED | ||||||||||||||||||||
| 12/31/15 | 12/31/14 | 12/31/13 | 12/31/12 | 12/31/11 | ||||||||||||||||
Per share data (for a share outstanding throughout each year): | ||||||||||||||||||||
Net asset value - Beginning of year | $ | 7.33 | $ | 9.05 | $ | 7.75 | $ | 6.63 | $ | 8.61 | ||||||||||
|
|
|
|
|
|
|
|
|
| |||||||||||
Income (loss) from investment operations: | ||||||||||||||||||||
Net investment income1 | 0.08 | 0.10 | 0.10 | 0.12 | 0.24 | 2 | ||||||||||||||
Net realized and unrealized gain (loss) on investments | (0.51 | ) | (1.01 | ) | 1.35 | 1.13 | (1.64 | ) | ||||||||||||
|
|
|
|
|
|
|
|
|
| |||||||||||
Total from investment operations | (0.43 | ) | (0.91 | ) | 1.45 | 1.25 | (1.40 | ) | ||||||||||||
|
|
|
|
|
|
|
|
|
| |||||||||||
Less distributions to shareholders: | ||||||||||||||||||||
From net investment income | (0.13 | ) | (0.10 | ) | (0.10 | ) | (0.13 | ) | (0.24 | ) | ||||||||||
From net realized gain on investments | — | (0.71 | ) | (0.05 | ) | — | (0.34 | ) | ||||||||||||
|
|
|
|
|
|
|
|
|
| |||||||||||
Total distributions to shareholders | (0.13 | ) | (0.81 | ) | (0.15 | ) | (0.13 | ) | (0.58 | ) | ||||||||||
|
|
|
|
|
|
|
|
|
| |||||||||||
Net asset value - End of year | $ | 6.77 | $ | 7.33 | $ | 9.05 | $ | 7.75 | $ | 6.63 | ||||||||||
|
|
|
|
|
|
|
|
|
| |||||||||||
Net assets - End of year (000’s omitted) | $ | 1,591,925 | $ | 5,444,192 | $ | 7,924,877 | $ | 6,925,778 | $ | 5,967,029 | ||||||||||
|
|
|
|
|
|
|
|
|
| |||||||||||
Total return3 | (5.91 | %) | (9.77 | %) | 18.79 | % | 18.81 | % | (16.14 | %)2 | ||||||||||
Ratios (to average net assets)/Supplemental Data: | ||||||||||||||||||||
Expenses | 1.08 | % | 1.07 | % | 1.07 | % | 1.08 | % | 1.09 | % | ||||||||||
Net investment income | 1.09 | % | 1.16 | % | 1.17 | % | 1.64 | % | 2.84 | %2 | ||||||||||
Portfolio turnover | 71 | % | 43 | % | 46 | % | 45 | % | 52 | % | ||||||||||
1Calculated based on average shares outstanding during the years.
2Includes a special dividend paid by one of the Series’ securities during the year. Without the special dividend, the Series’ net investment income per share, total return and net investment income ratio would have been $0.11, (17.71%) and 1.30%, respectively.
3Represents aggregate total return for the years indicated, and assumes reinvestment of all distributions.
The accompanying notes are an integral part of the financial statements.
13
World Opportunities Series
Notes to Financial Statements
| 1. | Organization |
World Opportunities Series (the “Series”) is a no-load diversified series of Manning & Napier Fund, Inc. (the “Fund”). The Fund is organized in Maryland and is registered under the Investment Company Act of 1940 (the “1940 Act”), as amended, as an open-end management investment company.
The Series’ investment objective is to provide long-term growth by investing principally in the common stocks of companies located around the world.
The Fund’s advisor is Manning & Napier Advisors, LLC (the “Advisor”). Shares of the Series are offered to investors, clients and employees of the Advisor and its affiliates. The total authorized capital stock of the Fund consists of 15 billion shares of common stock each having a par value of $0.01. As of December 31, 2015, 10.7 billion shares have been designated in total among 41 series, of which 2.5 billion have been designated as World Opportunities Series Class A common stock.
| 2. | Significant Accounting Policies |
The following is a summary of significant accounting policies followed by the Series. The Series is an investment company and, accordingly, follows the investment company accounting and reporting guidance of the Financial Accounting Standards Board Accounting Standards Codification Topic 946 - Investment Companies, which is part of accounting principles generally accepted in the United States of America (“GAAP”).
Security Valuation
Portfolio securities, including domestic equities, foreign equities, warrants and options, listed on an exchange other than the NASDAQ Stock Market are valued at the latest quoted sales price of the exchange on which the security is primarily traded. Securities not traded on valuation date or securities not listed on an exchange are valued at the latest quoted bid price provided by the Fund’s pricing service. Securities listed on the NASDAQ Stock Market are valued in accordance with the NASDAQ Official Closing Price.
Short-term investments that mature in sixty days or less may be valued at amortized cost, which approximates fair value. Investments in open-end investment companies are valued at their net asset value per share on valuation date.
Volume and level of activity in established markets for an asset or liability are evaluated to determine whether recent transactions and quoted prices are determinative of fair value. Where there have been significant decreases in volume and level of activity, further analysis and adjustment may be necessary to estimate fair value. The Series measures fair value in these instances by the use of inputs and valuation techniques which may be based upon current market prices of securities that are comparable in coupon, rating, maturity and industry and/or expectation of future cash flows. As a result of trading in relatively thin markets and/or markets that experience significant volatility, the prices used by the Series to value these securities may differ from the value that would be realized if these securities were sold, and the differences could be material.
Securities for which representative valuations or prices are not available from the Series’ pricing service may be valued at fair value as determined in good faith by the Advisor under procedures approved by and under the general supervision and responsibility of the Fund’s Board of Directors (the “Board”). Due to the inherent uncertainty of valuations of such securities, the fair value may differ significantly from the values that would have been used had a ready market for such securities existed. If trading or events occurring after the close of the principal market in which securities are traded are expected to materially affect the value of those securities, then they may be valued at their fair value, taking this trading or these events into account. In accordance with the procedures approved by the Board, the values of certain securities trading outside the U.S. were adjusted following the close of local trading using a factor from a third party vendor. The third party vendor uses statistical analyses and quantitative models, which consider among other things subsequent movement and changes in the prices of indices, securities and exchange rates in other markets, to determine the factors which are used to adjust local market prices. The value of securities used for net asset value calculation under these procedures may differ from published prices for the same securities. It is the Fund’s policy to classify each foreign equity security where a factor from a third party vendor is provided as a Level 2 security.
14
World Opportunities Series
Notes to Financial Statements (continued)
| 2. | Significant Accounting Policies (continued) |
Security Valuation (continued)
Various inputs are used in determining the value of the Series’ assets or liabilities carried at fair value. These inputs are summarized in three broad levels. Level 1 includes quoted prices in active markets for identical assets and liabilities. Level 2 includes other significant observable inputs (including quoted prices for similar securities, interest rates, prepayment speeds, credit risk, etc.). Level 3 includes significant unobservable inputs (including the Series’ own assumptions in determining the fair value of investments). A financial instrument’s level within the fair value hierarchy is based on the lowest level of any input both individually and in aggregate that is significant to the fair value measurement. The inputs or methodology used for valuing securities are not necessarily an indication of the risk associated with investing in those securities.
The following is a summary of the valuation levels used for major security types as of December 31, 2015 in valuing the Series’ assets or liabilities carried at fair value:
| DESCRIPTION | TOTAL | LEVEL 1 | LEVEL 2 | LEVEL 3 | ||||||||||||
Assets: | ||||||||||||||||
Equity securities: | ||||||||||||||||
Consumer Discretionary | $ | 276,797,519 | $ | 141,835,798 | $ | 134,961,721 | $ | — | ||||||||
Consumer Staples | 457,253,636 | 90,804,561 | 366,449,075 | — | ||||||||||||
Energy | 104,592,131 | 97,503,288 | 7,088,843 | — | ||||||||||||
Health Care | 227,879,776 | 120,933,297 | 106,946,479 | — | ||||||||||||
Industrials | 119,146,081 | 22,124,020 | 97,022,061 | — | ||||||||||||
Information Technology | 239,689,201 | 166,218,702 | 73,470,499 | — | ||||||||||||
Materials | 91,301,302 | 27,025,216 | 64,276,086 | — | ||||||||||||
Telecommunication Services | 48,875,702 | 48,875,702 | — | — | ||||||||||||
Mutual funds | 20,906,895 | 20,906,895 | — | — | ||||||||||||
|
|
|
|
|
|
|
| |||||||||
Total assets | $ | 1,586,442,243 | $ | 736,227,479 | $ | 850,214,764 | $ | — | ||||||||
|
|
|
|
|
|
|
| |||||||||
Please see the Investment Portfolio for foreign securities where a factor from a third party vendor was applied to determine the securities’ fair value following the close of local trading. Such securities are included in Level 2 in the table above.
There were no Level 3 securities held by the Series as of December 31, 2014 or December 31, 2015.
The Fund’s policy is to recognize transfers in and transfers out of the valuation levels as of the beginning of the reporting period. There were no transfers between Level 1 and Level 2 during the year ended December 31, 2015.
Security Transactions, Investment Income and Expenses
Security transactions are accounted for on trade date. Dividend income is recorded on the ex-dividend date, except that if the ex-dividend date has passed, certain dividends from foreign securities are recorded as soon as the Series is informed of the ex-dividend date. Non-cash dividends, if any, are recorded at the fair value of the securities received. Interest income, including amortization of premium and accretion of discounts using the effective interest method, is earned from settlement date and accrued daily.
Expenses are recorded on an accrual basis. Most expenses of the Fund can be attributed to a specific series. Expenses which cannot be directly attributed are apportioned among the series in the Fund in such a manner as deemed equitable by the Fund’s Board, taking into consideration, among other things, the nature and type of expense.
The Series uses the identified cost method for determining realized gain or loss on investments for both financial statement and federal income tax reporting purposes.
Foreign Currency Translation
The books and records of the Series are maintained in U.S. dollars. Foreign currencies, investments and other assets and liabilities are translated into U.S. dollars at the current exchange rates. Purchases and sales of investment securities and income and expenses are translated on the respective dates of such transactions. The Series does not isolate realized and
15
World Opportunities Series
Notes to Financial Statements (continued)
| 2. | Significant Accounting Policies (continued) |
Foreign Currency Translation (continued)
unrealized gains and losses attributable to changes in the exchange rates from gains and losses that arise from changes in the fair value of investments. Such fluctuations are included with net realized and unrealized gain or loss on investments. Net realized foreign currency gains and losses represent foreign currency gains and losses between trade date and settlement date on securities transactions, gains and losses on disposition of foreign currencies and the difference between the amount of income and foreign withholding taxes recorded on the books of the Series and the amounts actually received or paid.
Federal Taxes
The Series’ policy is to comply with the provisions of the Internal Revenue Code applicable to regulated investment companies. The Series is not subject to federal income tax or excise tax to the extent that the Series distributes to shareholders each year its taxable income, including any net realized gains on investments, in accordance with requirements of the Internal Revenue Code. Accordingly, no provision for federal income tax or excise tax has been made in the financial statements.
Management evaluates its tax positions to determine if the tax positions taken meet the minimum recognition threshold in connection with accounting for uncertainties in income tax positions taken or expected to be taken for the purposes of measuring and recognizing tax liabilities in the financial statements. Recognition of tax benefits of an uncertain tax position is required only when the position is “more likely than not” to be sustained assuming examination by taxing authorities. At December 31, 2015, the Series has recorded no liability for net unrecognized tax benefits relating to uncertain income tax positions taken or expected to be taken in future tax returns.
The Series files income tax returns in the U.S. federal jurisdiction, various states and foreign jurisdictions, as required. No income tax returns are currently under investigation. The statute of limitations on the Series’ tax returns remains open for the years ended December 31, 2012 through December 31, 2015. The Series is not aware of any tax positions for which it is reasonably possible that the total amounts of unrecognized tax benefits will significantly change in the next twelve months.
Foreign Taxes
Based on the Series’ understanding of the tax rules and rates related to income, gains and currency purchase/repatriation transactions for foreign jurisdictions in which it invests, the Series will provide for foreign taxes, and where appropriate, deferred foreign tax.
Distributions of Income and Gains
Distributions to shareholders of net investment income and net realized gains are made annually. An additional distribution may be necessary to avoid taxation of the Series. Distributions are recorded on the ex-dividend date.
Indemnifications
The Fund’s organizational documents provide former and current directors and officers with a limited indemnification against liabilities arising in connection with the performance of their duties to the Fund. In the normal course of business, the Fund may also enter into contracts that provide general indemnifications. The Fund’s maximum exposure under these arrangements is unknown as this would be dependent on future claims that may be made against the Fund. The risk of material loss from such claims is considered remote.
Other
The preparation of financial statements in conformity with GAAP requires management to make estimates and assumptions that affect the reported amounts of assets and liabilities and the disclosure of contingent assets and liabilities at the date of the financial statements and the reported amounts of income and expenses during the reporting period. Actual results could differ from those estimates.
| 3. | Transactions with Affiliates |
The Fund has an Investment Advisory Agreement (the “Agreement”) with the Advisor, for which the Series pays a fee, computed daily and payable monthly, at an annual rate of 1.00% of the Series’ average daily net assets.
16
World Opportunities Series
Notes to Financial Statements (continued)
| 3. | Transactions with Affiliates (continued) |
Under the Agreement, personnel of the Advisor provide the Series with advice and assistance in the choice of investments and the execution of securities transactions, and otherwise maintain the Series’ organization. The Advisor also provides the Fund with necessary office space and fund administration and support services. The salaries of all officers of the Fund (except a percentage of the Fund’s Chief Compliance Officer’s salary, which is paid by the Fund), and of all Directors who are “affiliated persons” of the Fund, or of the Advisor, and all personnel of the Fund, or of the Advisor, performing services relating to research, statistical and investment activities, are paid by the Advisor. Each “non-affiliated” Director receives an annual stipend, which is allocated among all the active series of the Fund. In addition, these Directors also receive a fee per Board meeting attended plus a fee for each committee meeting attended and are reimbursed for travel and other out-of-pocket expenses incurred by them in connection with attending such meetings. The Fund also has an Audit Committee Chair, who receives an additional annual stipend for this role.
Manning & Napier Investor Services, Inc., a registered broker-dealer affiliate of the Advisor, acts as distributor for the Fund’s shares. The services of Manning & Napier Investor Services, Inc. are provided at no additional cost to the Series.
The Advisor did not waive any fees for the year ended December 31, 2015. The Advisor is not eligible to recoup any expenses that have been waived or reimbursed in prior years.
Pursuant to a master services agreement dated November 1, 2014, the Fund pays the Advisor an annual fee related to fund accounting and administration of 0.0085% on the first $25 billion of average daily net assets (excluding Target Series and Strategic Income Series); 0.0075% on the next $15 billion of average daily net assets (excluding Target Series and Strategic Income Series); and 0.0065% of the average daily net assets in excess of $40 billion (excluding Target Series and Strategic Income Series); plus a base fee of $30,400 per series. Transfer agent fees are charged to the Fund on a per account basis. Additionally, certain transaction and out-of-pocket expenses, including charges for reporting relating to the Fund’s compliance program, are charged. The Advisor has agreements with BNY Mellon Investment Servicing (U.S.) Inc. (“BNY”) under which BNY serves as sub-accountant services agent and sub-transfer agent.
Expenses not directly attributable to a series are allocated based on each series’ relative net assets or number of accounts, depending on the expense.
| 4. | Purchases and Sales of Securities |
For the year ended December 31, 2015, purchases and sales of securities, other than U.S. Government securities and short-term securities, were $2,219,333,371 and $5,867,243,287, respectively. There were no purchases or sales of U.S. Government securities.
| 5. | Capital Stock Transactions |
Transactions in Class A shares of World Opportunities Series were:
FOR THE YEAR ENDED 12/31/15 | FOR THE YEAR ENDED 12/31/14 | |||||||||||||||
| SHARES | AMOUNT | SHARES | AMOUNT | |||||||||||||
Sold | 72,756,351 | $ | 537,227,756 | 152,753,313 | $ | 1,333,900,544 | ||||||||||
Reinvested | 4,151,198 | 27,884,107 | 61,467,184 | 444,829,184 | ||||||||||||
Repurchased | (584,198,654 | ) | (4,335,349,501 | ) | (347,523,122 | ) | (2,940,106,834 | ) | ||||||||
|
|
|
|
|
|
|
| |||||||||
Total | (507,291,105 | ) | $ | (3,770,237,638 | ) | (133,302,625 | ) | $ | (1,161,377,106 | ) | ||||||
|
|
|
|
|
|
|
| |||||||||
Approximately 8% of the shares outstanding are held by fiduciary accounts where the Advisor has sole investment discretion.
17
World Opportunities Series
Notes to Financial Statements (continued)
| 6. | Line of Credit |
The Series has entered into a $50 million credit facility (the “line of credit”) with Bank of New York Mellon. The Series may borrow under the line of credit for temporary or emergency purposes, including funding shareholder redemptions and other short-term liquidity purposes. The Series pays an annual commitment fee on the unused portion of the line of credit which amounted to $25,667 for the year ended December 31, 2015, which is included in miscellaneous expenses in the Statement of Operations. Interest on the used portion is charged to the Series based on rates determined pursuant to the terms of the agreement at the time of borrowing. During the year ended December 31, 2015, the Series did not borrow under the line of credit. The line of credit expired on June 5, 2015 and was not renewed.
| 7. | Financial Instruments |
The Series may trade in instruments including written and purchased options, forward foreign currency exchange contracts and futures contracts and other derivatives in the normal course of investing activities to assist in managing exposure to various market risks. The Series may be subject to various elements of risk, which may involve, to a varying degree, elements of risk in excess of the amounts recognized for financial statement purposes. These risks include: the risk that changes in the value of a derivative may not correlate perfectly with the underlying asset, rate or index; counterparty credit risk related to over the counter derivative counterparties’ failure to perform under contract terms; liquidity risk related to the lack of a liquid market for these contracts allowing the fund to close out its position(s); and documentation risk relating to disagreement over contract terms. No such investments were held by the Series on December 31, 2015.
| 8. | Foreign Securities |
Investing in securities of foreign companies and foreign governments involves special risks and considerations not typically associated with investing in securities of domestic companies and the U.S. Government. These risks include revaluation of currencies and future adverse political and economic developments. Moreover, securities of foreign companies and foreign governments and their markets may be less liquid and their prices more volatile than those of comparable domestic companies and the U.S. Government.
| 9. | Federal Income Tax Information |
The amount and characterization of certain income and capital gains to be distributed are determined in accordance with federal income tax regulations, which may differ from GAAP. These differences are primarily due to differing book and tax treatments in the timing and/or treatment of the recognition of net investment income or gains and losses, including foreign currency gains and losses, qualified late year losses, losses deferred due to wash sales and earnings and profits distributed to shareholders on the redemption of shares. The Series may periodically make reclassifications among its capital accounts to reflect income and gains available for distribution (or available capital loss carryovers) under income tax regulations without impacting the Series’ net asset value. For the fiscal year ended December 31, 2015, amounts were reclassified within the capital accounts to increase Additional Paid in Capital by $3,726,507, decrease Distributions in Excess of Net Investment Income by $2,592,507 and decrease Accumulated Net Realized Loss on Investments by $1,134,000. Any such reclassifications are not reflected in the financial highlights.
The tax character of distributions paid were as follows:
| FOR THE YEAR ENDED 12/31/15 | FOR THE YEAR ENDED 12/31/14 | |||||||
Ordinary income | $ | 29,507,717 | $ | 147,867,959 | ||||
Long-term capital gains | — | 453,971,268 | ||||||
18
World Opportunities Series
Notes to Financial Statements (continued)
| 9. | Federal Income Tax Information (continued) |
At December 31, 2015, the tax basis of components of distributable earnings and the net unrealized depreciation based on identified cost for federal income tax purposes were as follows:
Cost for federal income tax purposes | $ | 1,805,339,205 | ||
Unrealized appreciation | 71,173,568 | |||
Unrealized depreciation | (290,070,530 | ) | ||
|
| |||
Net unrealized | $ | (218,896,962 | ) | |
|
| |||
Capital loss carryover | $ | (365,296,667 | ) | |
Qualified late-year losses1 | $ | 166,451 |
1The Series has elected to defer certain qualified late-year losses and recognize such losses in the year ending December 31, 2016.
At December 31, 2015, the Series had net short-term capital loss carryforwards of $64,492,049 and net long-term capital loss carryforwards of $300,804,618, which may be carried forward indefinitely.
19
World Opportunities Series
Report of Independent Registered Public Accounting Firm
To the Board of Directors of Manning & Napier Fund, Inc. and Shareholders of World Opportunities Series:
In our opinion, the accompanying statement of assets and liabilities, including the investment portfolio, and the related statements of operations and of changes in net assets and the financial highlights present fairly, in all material respects, the financial position of World Opportunities Series (a series of Manning & Napier Fund, Inc., hereafter referred to as the “Series”) at December 31, 2015, the results of its operations for the year then ended, the changes in its net assets for each of the two years in the period then ended and the financial highlights for each of the five years in the period then ended, in conformity with accounting principles generally accepted in the United States of America. These financial statements and financial highlights (hereafter referred to as “financial statements”) are the responsibility of the Series’ management. Our responsibility is to express an opinion on these financial statements based on our audits. We conducted our audits of these financial statements in accordance with the standards of the Public Company Accounting Oversight Board (United States). Those standards require that we plan and perform the audit to obtain reasonable assurance about whether the financial statements are free of material misstatement. An audit includes examining, on a test basis, evidence supporting the amounts and disclosures in the financial statements, assessing the accounting principles used and significant estimates made by management, and evaluating the overall financial statement presentation. We believe that our audits, which included confirmation of securities at December 31, 2015 by correspondence with the custodian and brokers, provide a reasonable basis for our opinion.

New York, New York
February 19, 2016
20
World Opportunities Series
Supplemental Tax Information
(unaudited)
All reportings are based on financial information available as of the date of this annual report and, accordingly are subject to change.
For federal income tax purposes, the Series reports for the current fiscal year $73,082,760 or, if different, the maximum amount allowable under the tax law as qualified dividend income.
The Series has elected to pass through to its shareholders the foreign taxes paid for the year ended December 31, 2015. The Series had $57,464,689 in foreign source income and paid foreign taxes of $4,456,567.
21
World Opportunities Series
Renewal of Investment Advisory Agreement
(unaudited)
At the Manning & Napier Fund, Inc. (the “Fund”) Board of Directors’ (the “Board”) meeting, held on November 17, 2015, the Investment Advisory Agreement (the “Agreement”) between the Fund and Manning & Napier Advisors, LLC (the “Advisor”) was considered by the Board for renewal. In connection with the decision whether to renew the Agreement, a variety of material was prepared for and considered by the Board.
Representatives of the Advisor attended the meeting and presented additional oral and written information to the Board to assist the Board in its considerations. The discussion immediately below outlines the materials and information presented to the Board in connection with the Board’s 2015 Annual consideration of the Agreement and the conclusions made by the Directors when determining to continue the Agreement.
| • | The Board considered the services provided by the Advisor under the Agreement including, among others: deciding what securities to purchase and sell for each Series; arranging for the purchase and sale of such securities by placing orders with broker-dealers; administering the affairs of the Fund (including the books and records of the Fund not maintained by third party service providers such as the custodian or sub-transfer agent); arranging for the insurance coverage for the Fund; and supervising the preparation of tax returns, SEC filings (including registration statements) and reports to shareholders for the Fund. The Board also considered the nature and quality of such services provided under the Agreement in light of the Advisor’s services provided to the Fund for 29 years. The Board discussed the quality of these services with representatives from the Advisor and concluded that the Advisor was performing its services to the Fund required under the Agreement in a reasonable manner. |
| • | The Board considered the performance of each Series since its inception, as well as performance over multiple time periods. Performance for one or more of the following time periods was considered as applicable to the Series’ inception date: inception, three year, five year, ten year, and current market cycle. A market cycle includes periods of both rising and falling markets. Returns for established benchmark indices for each Series were provided. In addition, the Board considered a number of other factors relevant to performance at the meeting (and considers on a quarterly basis) including: a peer group performance analysis consisting of Morningstar universes of mutual funds with similar investment objectives, investment performance of core products, product offerings, performance on an aggregate basis vs. performance over reasonable time periods and the Advisor’s investment process. The Directors acknowledged the challenging performance and discussed the investment process of the Advisor. The Directors confirmed that qualitative factors such as the Advisor’s investment process, including recent enhancements, were an important subset to be considered as part of their consideration of performance. The Board discussed the performance with representatives from the Advisor and concluded that the investment performance of each of the Fund’s Series was reasonable based on the Series’ actual performance and comparative performance, especially for those series with performance over the current market cycle. |
| • | The Board considered the costs of the Advisor’s services and the profits of the Advisor as they relate to the Advisor’s services to the Fund under the Agreement. In reviewing the Advisor’s costs and profits, the Board discussed the Advisor’s revenues generated from the Fund (on both an actual and adjusted basis) and its expenses associated with providing the services under the Agreement. In addition, the Board reviewed the Advisor’s expenses associated with Fund activities outside of the Agreement (such as expense reimbursements pursuant to expense caps and payments made by the Advisor to third party platforms on which shares of the Fund are available for purchase). It was noted by representatives of the Advisor that 22 of the 36 active Series of the Fund are currently experiencing expenses above the capped expense ratios, and thus the Advisor is incurring those expenses over the cap. After discussing the above costs and profits, the Board concluded that the Advisor’s profitability relating to its services provided under the Agreement was reasonable. |
| • | The Board considered the fees and expenses of the various Series of the Fund. The Advisor presented the advisory fees and total expenses for each Series, including the advisory fee adjusted for any expense waivers or reimbursements (either contractual or voluntary) paid by the Advisor. The advisory fees and expense ratios of each Series were compared to an average (on both a mean and median basis) of similar funds as disclosed on the Morningstar database. Representatives of the Advisor discussed with the Board the levels of its advisory fee for each Series of the Fund and as compared to the median and mean advisory fees for similar funds as listed on Morningstar. Expense ratios for every Series, except the Tax Managed Series, Equity Income Class S, High Yield Bond Class S, Pro-Blend Series Classes C and R, and Target Series’ Classes R and K, are lower than, or substantially similar to the Morningstar mean and median reported total expense ratio. |
22
World Opportunities Series
Renewal of Investment Advisory Agreement
(unaudited)
The higher than mean and median total expense ratios for Classes C and R reflect higher distribution, marketing and shareholder service fees payable to broker-dealers through a 100bp 12b-1 fee for Class C and a 50bp 12b-1 fee for Class R. Based on their review of the information provided, the Board concluded that the fees and expenses of each Series of the Fund were reasonable on a comparative basis. |
| • | The Board also considered the other benefits the Advisor derives from its relationship with the Fund. Such other benefits include certain research services provided by soft dollars. The Board reviewed the broker-dealers who provided research to the Advisor and the products and services paid for, in whole or in part, using soft dollar commissions. Given the level of soft dollar transactions involving the Fund, the Board concluded that these additional benefits to the Advisor were reasonable. |
| • | In addition to the factors described above, the Board considered the Advisor’s personnel, investment strategies, policies and procedures relating to compliance with personal securities transactions, reputation, expertise and resources in domestic and foreign financial markets. The Board concluded that these factors support the conclusion that the Advisor performs its services in a reasonable manner. |
| • | The Board then considered economies of scale and concluded that the current fee schedule to the advisory agreement remained reasonable given the multiple uses of the Fund (for the Advisor’s discretionary investment account clients in addition to direct investors), the current profitability of the Advisor’s services to the Fund under the Agreement, the number of newly established series of the Fund and the overall size of the Fund complex. |
Based on the Board’s deliberations and their evaluation of the information described above, the Board, including a majority of Directors that are not “interested persons” as defined in the Investment Company Act of 1940, concluded that the compensation under the Agreement was fair and reasonable in light of the services and expenses and such other matters as the Directors considered to be relevant in the exercise of their reasonable judgment. Accordingly, the Board approved the renewal of the Agreement. In the course of their deliberations, the Directors did not identify any particular information that was all important or controlling.
23
World Opportunities Series
Directors’ and Officers’ Information
(unaudited)
The Statement of Additional Information provides additional information about the Fund’s directors and officers and can be obtained without charge by calling 1-800-466-3863, at www.manningnapieradvisors.com, or on the EDGAR Database on the SEC Internet web site (http:// www.sec.gov). The following chart shows certain information about the Fund’s officers and directors, including their principal occupations during the last five years. Unless specific dates are provided, the individuals have held the listed positions for longer than five years.
Interested Director/Officer
| ||
| Name: | James E. Mikolaichik* | |
| Address: | 290 Woodcliff Drive Fairport, NY 14450 | |
| Age: | 44 | |
| Current Position(s) Held with Fund: | Principal Executive Officer, President, Chairman & Director | |
| Term of Office1 & Length of Time Served: | Indefinite - Chairman and Director since August 2015 | |
| Principal Occupation(s) During Past 5 Years: | Chief Financial Officer (since 2011) - Manning & Napier Advisors, LLC; Executive Vice President and Head of Strategy (2008-2011) and Chief Risk Officer (2004-2008) - Old Mutual Asset Management Holds or has held one or more of the following title for various subsidiaries and affiliates: Chief Financial Officer. | |
| Number of Portfolios Overseen within Fund Complex: | 41 | |
| Other Directorships Held Outside Fund Complex: | N/A | |
Independent Directors
| ||
| Name: | Stephen B. Ashley | |
| Address: | 290 Woodcliff Drive Fairport, NY 14450 | |
| Age: | 75 | |
| Current Position(s) Held with Fund: | Director, Audit Committee Member, Governance & Nominating Committee Member | |
| Term of Office & Length of Time Served: | Indefinite - Since 1996 | |
| Principal Occupation(s) During Past 5 Years: | Chairman, Director, President & Chief Executive Officer (1997 to present) - The Ashley Group (property management and investment); Director (1995-2008) and Chairman (non-executive) (2004-2008) - Fannie Mae (mortgage). | |
| Number of Portfolios Overseen within Fund Complex: | 41 | |
| Other Directorships Held Outside Fund Complex: | Fannie Mae (1995-2008) The Ashley Group (1995-2008) Genesee Corporation (1987-2007) | |
| Name: | Paul A. Brooke | |
| Address: | 290 Woodcliff Drive Fairport, NY 14450 | |
| Age: | 70 | |
| Current Position(s) Held with Fund: | Director, Audit Committee Member, Governance & Nominating Committee Member | |
| Term of Office & Length of Time Served: | Indefinite - Since 2007 | |
| Principal Occupation(s) During Past 5 Years: | Chairman & CEO (2005-2009) - Ithaka Acquisition Corporation (investments); Chairman (2007-2009) Alsius Corporation (investments); Managing Member, PMSV Holdings LLC (investments) since 1991; Managing Member, Venbio (investments) since 2010. | |
| Number of Portfolios Overseen within Fund Complex: | 41 | |
| Other Directorships Held Outside Fund Complex: | Incyte Corp. (2000-present) ViroPharma, Inc. (2000-2014) HLTH Corp (WebMD) (2000-2010) Cheyne Capital International (2000-present) GMP Companies (2000-2011) Cytos Biotechnology Ltd. (2012-2014) | |
24
World Opportunities Series
Directors’ and Officers’ Information
(unaudited)
Independent Directors (continued)
| Name: | Peter L. Faber | |
| Address: | 290 Woodcliff Drive Fairport, NY 14450 | |
| Age: | 77 | |
| Current Position(s) Held with Fund: | Director, Governance & Nominating Committee Member | |
| Term of Office & Length of Time Served: | Indefinite - Since 1987 | |
| Principal Occupation(s) During Past 5 Years: | Senior Counsel (2006-2012), Partner (1995-2006 & 2013-present) - McDermott, Will & Emery LLP (law firm) | |
| Number of Portfolios Overseen within Fund Complex: | 41 | |
| Other Directorships Held Outside Fund Complex: | Boston Early Music Festival (non-profit)(2007-present) Amherst Early Music, Inc. (non-profit)(2009-present) Gotham Early Music Scene, Inc. (non-profit)(2009-present) Partnership for New York City, Inc. (non-profit) (1989-2010) New York Collegium (non-profit) (2004-2011) | |
| Name: | Harris H. Rusitzky | |
| Address: | 290 Woodcliff Drive Fairport, NY 14450 | |
| Age: | 80 | |
| Current Position(s) Held with Fund: | Director, Audit Committee Member, Governance & Nominating Committee Member | |
| Term of Office & Length of Time Served: | Indefinite - Since 1985 | |
| Principal Occupation(s) During Past 5 Years: | President, The Greening Group (business consultants) since 1994; Partner, The Restaurant Group (restaurants) since 2006 | |
| Number of Portfolios Overseen within Fund Complex: | 41 | |
| Other Directorships Held Outside Fund Complex: | Rochester Institute of Technology (university)(1972-present) Culinary Institute of America (non-profit college)(1985-present) George Eastman House (museum)(1988-present) National Restaurant Association (restaurant trade organization)(1978-present) | |
| Name: | Chester N. Watson | |
| Address: | 290 Woodcliff Drive Fairport, NY 14450 | |
| Age: | 65 | |
| Current Position(s) Held with Fund: | Director, Audit Committee Chairman, Governance & Nominating | |
| Committee Member | ||
| Term of Office & Length of Time Served: | Indefinite - Since 2012 | |
| Principal Occupation(s) During Past 5 Years: | General Auditor (2003-2011) - General Motors Company (auto manufacturer) | |
| Number of Portfolios Overseen within Fund Complex: | 41 | |
| Other Directorships Held Outside Fund Complex: | Rochester Institute of Technology (university)(2005-present) | |
Officers
| ||
| Name: | Jeffrey S. Coons, Ph.D., CFA | |
| Address: | 290 Woodcliff Drive Fairport, NY 14450 | |
| Age: | 52 | |
| Current Position(s) Held with Fund: | Vice President | |
| Term of Office1 & Length of Time Served: | Since 2004 | |
| Principal Occupation(s) During Past 5 Years: | President since 2010, Co-Director of Research (2002-2015) - Manning & Napier Advisors, LLC Holds one or more of the following titles for various subsidiaries and affiliates: President, Director, Treasurer or Senior Trust Officer. | |
| Number of Portfolios Overseen within Fund Complex: | 41 | |
| Other Directorships Held Outside Fund Complex: | N/A | |
25
World Opportunities Series
Directors’ and Officers’ Information
(unaudited)
Officers (continued)
| Name: | Elizabeth Craig | |
| Address: | 290 Woodcliff Drive Fairport, NY 14450 | |
| Age: | 28 | |
| Current Position(s) Held with Fund: | Assistant Corporate Secretary | |
| Term of Office1 & Length of Time Served: | Since 2011 | |
| Principal Occupation(s) During Past 5 Years: | Fund Administration Manager since 2015; Mutual Fund Compliance Specialist (2009-2015) - Manning & Napier Advisors, LLC | |
| Number of Portfolios Overseen within Fund Complex: | 41 | |
| Other Directorships Held Outside Fund Complex: | N/A | |
| Name: | Christine Glavin | |
| Address: | 290 Woodcliff Drive Fairport, NY 14450 | |
| Age: | 49 | |
| Current Position(s) Held with Fund: | Principal Financial Officer, Chief Financial Officer | |
| Term of Office1 & Length of Time Served: | Principal Financial Officer since 2002; Chief Financial Officer since 2001 | |
| Principal Occupation(s) During Past 5 Years: | Director of Fund Reporting since 2011; Fund Reporting Manager (1997-2011) - Manning & Napier Advisors, LLC; Assistant Treasurer since 2008 - Exeter Trust Company | |
| Number of Portfolios Overseen within Fund Complex: | 41 | |
| Other Directorships Held Outside Fund Complex: | N/A | |
| Name: | Jodi L. Hedberg | |
| Address: | 290 Woodcliff Drive Fairport, NY 14450 | |
| Age: | 48 | |
| Current Position(s) Held with Fund: | Corporate Secretary, Chief Compliance Officer, Anti-Money Laundering Compliance Officer | |
| Term of Office1 & Length of Time Served: | Corporate Secretary since 1997; Chief Compliance Officer since 2004; Anti-Money Laundering Compliance Officer since 2002 | |
| Principal Occupation(s) During Past 5 Years: | Director of Compliance since 2005; Compliance Manager (1995-2005) - Manning & Napier Advisors, LLC and affiliates; Corporate Secretary - Manning & Napier Investor Services, Inc. since 2006 | |
| Number of Portfolios Overseen within Fund Complex: | 41 | |
| Other Directorships Held Outside Fund Complex: | N/A | |
| Name: | Richard Yates | |
| Address: | 290 Woodcliff Drive Fairport, NY 14450 | |
| Age: | 50 | |
| Current Position(s) Held with Fund: | Chief Legal Officer | |
| Term of Office1 & Length of Time Served: | Chief Legal Officer since 2004 | |
| Principal Occupation(s) During Past 5 Years: | Counsel - Manning & Napier Advisors, LLC and affiliates since 2000; Holds one or more of the following titles for various affiliates; Director or Corporate Secretary | |
| Number of Portfolios Overseen within Fund Complex: | 41 | |
| Other Directorships Held Outside Fund Complex: | N/A | |
*Interested Director, within the meaning of the Investment Company Act of 1940 by reason of his position with the Fund’s investment advisor and distributor. Mr. Mikolaichik serves as the Chief Financial Officer for Manning & Napier Advisors, LLC.
1The term of office of all officers shall be one year and until their respective successors are chosen and qualified, or his or her earlier resignation or removal as provided in the Fund’s By-Laws.
26
World Opportunities Series
Results of Special Meeting of Shareholders
(unaudited)
A Special Meeting of the Shareholders of the Fund was held on August 18, 2015. The number of votes necessary to conduct the meeting and approve the proposal was obtained, and the results of the vote of shareholders of all the Series of the Fund voting together in the aggregate is listed below:
PROPOSAL 1:
Election of Directors
| NUMBER OF SHARES VOTED FOR | NUMBER OF SHARES WITHELD | |||||||
Stephen B. Ashley | 883,968,395 | 8,618,094 | ||||||
Paul A. Brooke | 884,510,661 | 8,075,828 | ||||||
Peter L. Faber | 884,140,893 | 8,445,596 | ||||||
James E. Mikolaichik | 883,391,832 | 9,194,657 | ||||||
Harris H. Rusitzky | 620,022,215 | 272,564,274 | ||||||
Chester N. Watson | 884,638,809 | 7,947,680 | ||||||
27
World Opportunities Series
Literature Requests
(unaudited)
Proxy Voting Policies and Procedures
A description of the policies and procedures that the Fund uses to determine how to vote proxies relating to portfolio securities is available, without charge, upon request:
| By phone | 1-800-466-3863 | |||
| On the Securities and Exchange | ||||
| Commission’s (SEC) web site | http://www.sec.gov |
Proxy Voting Record
Information regarding how the Fund voted proxies relating to portfolio securities during the most recent 12-month period ended June 30th is available, without charge, upon request:
| By phone | 1-800-466-3863 | |||
| On the SEC’s web site | http://www.sec.gov |
Quarterly Portfolio Holdings
The Series’ complete schedule of portfolio holdings for the 1st and 3rd quarters of each fiscal year are provided on Form N-Q, and are available, without charge, upon request:
| By phone | 1-800-466-3863 | |||
| On the SEC’s web site | http://www.sec.gov |
The Series’ Form N-Q may be reviewed and copied at the SEC’s Public Reference Room in Washington, D.C. Information on the operation of the Public Reference Room may be obtained by calling 1-800-SEC-0330.
Prospectus and Statement of Additional Information (SAI)
For more information about any of the Manning & Napier Fund, Inc. Series, you may obtain a prospectus and SAI at www.manning-napier.com or by calling (800) 466-3863. Before investing, carefully consider the objectives, risks, charges and expenses of the investment and read the prospectus carefully as it contains this and other information about the investment company. In addition, this information can be found on the SEC’s web site, http://www.sec.gov.
Additional information available at www.manning-napier.com
1. Fund Holdings - Month-End
2. Fund Holdings - Quarter-End
3. Shareholder Report - Annual
4. Shareholder Report - Semi-Annual
The Fund also offers electronic notification or “e-delivery” when certain documents are available on-line to be downloaded or reviewed. Direct shareholders can elect to receive electronic notification when shareholder reports, prospectus updates, and/or statements are available. If you do not currently have on-line access to your account, you can establish access by going to www.manning-napier.com, click on “Login” in the top corner of the page, and follow the prompts to self-enroll. Once enrolled, you can set your electronic notification preferences by clicking on the Account Options tab located within the green toolbar and then select E-Delivery Option. Should you have any questions on either how to establish on-line access or how to update your account settings, please contact Investor Services at 1-800-466-3863.
The Manning & Napier Fund, Inc. is managed by Manning & Napier Advisors, LLC. Manning & Napier Investor Services, Inc., an affiliate of Manning & Napier Advisors, LLC, is the distributor of the Fund shares.
MNWOP-12/15-AR

Ohio Tax Exempt Series
Management Discussion and Analysis
(unaudited)
Dear Shareholders:
Volatility defined global financial markets during the past year, largely driven by macroeconomic factors. Renewed concerns about economic growth in emerging markets — China in particular — and uncertainty about the effects of that slowdown on overall global growth triggered market gyrations. Developed economies continued to provide accommodative monetary policy to combat growth concerns, although in December the U.S. Federal Reserve raised the federal funds rate for the first time in nearly a decade. For much of the year, Europe struggled with uncertainty regarding Greece’s ability to secure bailout funding from its creditors, which negatively affected investor sentiment. China’s economy slowed, but the government continued to demonstrate a willingness to provide support through a combination of policy-easing maneuvers and targeted stimulus measures. The U.S. economy remained on a path of slow growth that nevertheless made it the best performing developed economy. Looking ahead, we expect the slow global growth environment to remain in place for the foreseeable future.
As always, we appreciate your business.
Sincerely,
Manning & Napier Advisors, LLC
1
Ohio Tax Exempt Series
Fund Commentary
(unaudited)
Investment Objective
To provide as high a level of current income exempt from federal income tax and Ohio State personal income tax as the Advisor believes is consistent with the preservation of capital. The Series invests primarily in municipal bonds that provide income exempt from federal income tax and Ohio State personal income tax.
Performance Commentary
Domestic fixed income markets generated modestly positive absolute returns in 2015, although performance across sectors was mixed. Municipal, mortgage-backed, and Treasury securities turned in positive performance for the year, whereas high yield and investment grade corporate bonds were negative.
During 2015, municipal bond yields increased along the shorter end of the yield curve, while decreasing along the rest of the curve. Meanwhile, the Bank of America Merrill Lynch 1-12 Year Municipal Bond Index returned 2.34%. Over the same time period, the Ohio Tax Exempt Series returned 1.31%, underperforming its benchmark.
The Series maintains a significant overweight versus the benchmark to revenue bonds versus general obligation bonds, as well as an overweight to middle-tier (single-A and triple-B) credits within the revenue sector. In our view, revenue bonds continue to offer attractive spreads while exhibiting stable credit fundamentals, and tend to outperform in a rising rate environment as they are cyclical in nature. In addition, the revenue bond sector is generally insulated from political risk and long-term structural risks relating to pension obligations, which the general obligation sector is exposed to.
During 2016 we expect the fixed income landscape to continue to shift as the Federal Reserve considers further changes to U.S. monetary policy. Having raised the federal funds rate, we believe they now will seek to remain flexible and proceed slowly with small increases that do not follow a well-defined schedule. The diverging monetary policies of major central banks, geopolitical risks, commodity price pressures, and the potential for global growth to deviate from expectations could cause volatility in financial markets. In light of the current environment, it is important that investors remain active, flexible, and selective in their approach in order to avoid overvalued and risky areas of the market, something Manning & Napier has done for over 45 years.
Performance data quoted represents past performance and does not guarantee future results. The investment return and principal value of an investment will fluctuate, so that an investor’s shares, when redeemed, may be worth more or less than their original cost. Current performance may be higher or lower than that quoted; investors can obtain the most recent month-end performance at www.manning-napier.com or by calling (800) 466-3863.
Please see the next page for additional performance information as of December 31, 2015.
For regulatory purposes, this is not an offering in all states.
All investments involve risks, including possible loss of principal. There is an inverse relationship between bond prices and interest rates; as interest rates rise, bond prices (and therefore the value of bond funds) fall. Likewise, as interest rates fall, bond prices and the value of bond funds rise. The income earned by the Series may be subject to the Alternative Minimum Tax (AMT), depending on your tax situation.
2
Ohio Tax Exempt Series
Performance Update as of December 31, 2015
(unaudited)
| AVERAGE ANNUAL TOTAL RETURNS AS OF DECEMBER 31, 2015 | ||||||||||||||||
| ONE YEAR1 | FIVE YEAR | TEN YEAR | SINCE INCEPTION2 | |||||||||||||
Manning & Napier Fund, Inc. - Ohio Tax Exempt Series3 | 1.31 | % | 2.49 | % | 2.98 | % | 3.87 | % | ||||||||
Bank of America (BofA) Merrill Lynch 1-12 Year Municipal Bond Index4 | 2.34 | % | 3.46 | % | 4.08 | % | 4.76 | % | ||||||||
The following graph compares the value of a $10,000 investment in the Manning & Napier Fund, Inc. - Ohio Tax Exempt Series for the ten years ended December 31, 2015 to the BofA Merrill Lynch 1-12 Year Municipal Bond Index.
1The returns shown are based on net asset values calculated for shareholder transactions and may differ from the returns shown in the financial highlights, which reflect adjustments made to the net asset values in accordance with accounting principles generally accepted in the United States of America.
2Performance numbers for the Series and Index are calculated from February 14, 1994, the Series’ inception date.
3The Series’ performance does not reflect the deduction of taxes that a shareholder would pay on fund distributions or the redemption of shares. The Series’ performance is historical and may not be indicative of future results. The performance returns shown are inclusive of the net expense ratio of the Series. For the year ended December 31, 2015, this net expense ratio was 0.77%. The gross expense ratio, which does not account for any voluntary or contractual waivers currently in effect, was 0.77% for the year ended December 31, 2015.
4The Bank of America (BofA) Merrill Lynch 1-12 Year Municipal Bond Index is a subset of the BofA Merrill Lynch U.S. Municipal Securities Index, an unmanaged, market-weighted index comprised of investment-grade, fixed rate, coupon bearing municipal bonds. The Index includes securities with maturities greater than one year but less than twelve years. The Index returns assume reinvestment of coupons and do not reflect any fees or expenses. Index returns provided by Interactive Data.
3
Ohio Tax Exempt Series
Shareholder Expense Example
(unaudited)
As a shareholder of the Series, you incur ongoing costs, including management fees, shareholder service fees and other Series expenses. This example is intended to help you understand your ongoing costs (in dollars) of investing in the Series and to compare these costs with the ongoing costs of investing in other mutual funds.
The example is based on an investment of $1,000 invested at the beginning of the period and held for the entire period (July 1, 2015 to December 31, 2015).
Actual Expenses
The first line of the table below provides information about actual account values and actual expenses. You may use the information in this line, together with the amount you invested, to estimate the expenses that you paid over the period. Simply divide your account value by $1,000 (for example, an $8,600 account value divided by $1,000 = 8.6), then multiply the result by the number in the first line under the heading entitled “Expenses Paid During Period” to estimate the expenses you paid on your account during this period.
Hypothetical Example for Comparison Purposes
The second line of the table below provides information about hypothetical account values and hypothetical expenses based on the Series’ actual expense ratio and an assumed rate of return of 5% per year before expenses, which is not the Series’ actual return. The hypothetical account values and expenses may not be used to estimate the actual ending account balance or expenses you paid during the period. You may use this information to compare the ongoing costs of investing in the Series and other funds. To do so, compare this 5% hypothetical example with the 5% hypothetical examples that appear in the shareholder reports of the other funds.
Please note that the expenses shown in the table are meant to highlight your ongoing costs only and do not reflect any transaction costs such as sales charges (loads), redemption fees, or exchange fees that you may incur in other mutual funds. Therefore, the second line of the table is useful in comparing ongoing costs only, and will not help you determine the relative total costs of owning different funds.
| BEGINNING ACCOUNT VALUE 7/1/15 | ENDING ACCOUNT VALUE 12/31/15 | EXPENSES PAID DURING PERIOD* 7/1/15-12/31/15 | ||||
Actual | $1,000.00 | $1,012.10 | $4.01 | |||
Hypothetical | ||||||
(5% return before expenses) | $1,000.00 | $1,021.22 | $4.02 |
*Expenses are equal to the Series’ annualized expense ratio (for the six-month period) of 0.79%, multiplied by the average account value over the period, multiplied by 184/365 (to reflect the one-half year period). Expenses are based on the most recent fiscal half year; therefore, the expense ratios stated above may differ from the expense ratios stated in the financial highlights, which is based on one-year data.
4
Ohio Tax Exempt Series
Portfolio Composition as of December 31, 2015
(unaudited)
5
Ohio Tax Exempt Series
Investment Portfolio - December 31, 2015
| COUPON RATE | MATURITY DATE | CREDIT RATING1 (UNAUDITED) | PRINCIPAL AMOUNT | VALUE (NOTE 2) | ||||||||||||||||
OHIO MUNICIPAL SECURITIES - 96.9% | ||||||||||||||||||||
Akron, Various Purposes Impt., G.O. Bond | 3.000% | 12/1/2017 | Aa3 | $ | 100,000 | $ | 103,994 | |||||||||||||
Akron, Various Purposes Impt., Series A, G.O. Bond | 1.250% | 12/1/2017 | AA2 | 350,000 | 352,265 | |||||||||||||||
Akron, Various Purposes Impt., Series A, G.O. Bond | 5.000% | 12/1/2017 | AA2 | 100,000 | 107,786 | |||||||||||||||
Akron, Various Purposes Impt., Series A, G.O. Bond | 5.000% | 12/1/2018 | AA2 | 225,000 | 249,806 | |||||||||||||||
Akron, Various Purposes Impt., Series C, G.O. Bond | 3.000% | 12/1/2017 | AA2 | 300,000 | 311,982 | |||||||||||||||
American Municipal Power, Inc., Fremont Energy Center Project, Series B, Revenue Bond | 5.000% | 2/15/2019 | A1 | 720,000 | 801,886 | |||||||||||||||
American Municipal Power, Inc., Fremont Energy Center Project, Series B, Revenue Bond | 5.000% | 2/15/2022 | A1 | 200,000 | 237,022 | |||||||||||||||
American Municipal Power, Inc., Prairie State Energy Campus Project, Series A, Revenue Bond, AGC | 4.375% | 2/15/2020 | A1 | 100,000 | 108,973 | |||||||||||||||
American Municipal Power, Inc., Prairie State Energy Campus Project, Unrefunded Balance, Series A, Revenue Bond, AGC | 4.500% | 2/15/2018 | A1 | 100,000 | 107,205 | |||||||||||||||
Barberton City School District, G.O. Bond | 4.000% | 12/1/2019 | AA2 | 625,000 | 689,500 | |||||||||||||||
Batavia Local School District, G.O. Bond, NATL | 5.625% | 12/1/2022 | A2 | 150,000 | 167,774 | |||||||||||||||
Beavercreek City School District, G.O. Bond | 5.000% | 12/1/2023 | Aa1 | 500,000 | 615,615 | |||||||||||||||
Butler County Sewer System, Revenue Bond, AGM | 5.000% | 12/1/2017 | Aa3 | 750,000 | 807,195 | |||||||||||||||
Butler County, Prerefunded Balance, G.O. Bond, AMBAC | 5.000% | 12/1/2016 | Aa2 | 5,000 | 5,205 | |||||||||||||||
Butler County, Unrefunded Balance, G.O. Bond, AMBAC | 5.000% | 12/1/2016 | Aa2 | 95,000 | 98,756 | |||||||||||||||
Centerville City School District, School Impt., G.O. Bond | 3.000% | 12/1/2016 | Aa1 | 100,000 | 102,139 | |||||||||||||||
Cincinnati City School District, School Impt., G.O. Bond | 4.500% | 6/1/2018 | Aa2 | 350,000 | 379,159 | |||||||||||||||
Cincinnati City School District, School Impt., G.O. Bond, AGM | 5.000% | 12/1/2018 | Aa2 | 400,000 | 444,712 | |||||||||||||||
Cincinnati Water System, Prerefunded Balance, Series A, Revenue Bond | 5.000% | 12/1/2017 | Aaa | 110,000 | 114,519 | |||||||||||||||
Cincinnati Water System, Water Utility Impt., Series A, Revenue Bond | 5.000% | 12/1/2016 | Aaa | 150,000 | 156,200 | |||||||||||||||
Cincinnati Water System, Water Utility Impt., Series A, Revenue Bond | 5.000% | 12/1/2018 | Aaa | 230,000 | 256,376 | |||||||||||||||
Cincinnati Water System, Water Utility Impt., Series A, Revenue Bond | 5.000% | 12/1/2018 | Aaa | 120,000 | 133,762 | |||||||||||||||
Cincinnati Water System, Water Utility Impt., Series A, Revenue Bond | 4.250% | 12/1/2019 | Aaa | 200,000 | 223,702 | |||||||||||||||
Cincinnati, Public Impt., Series A, G.O. Bond | 5.000% | 12/1/2017 | Aa2 | 500,000 | 538,315 | |||||||||||||||
Cincinnati, Public Impt., Series B, G.O. Bond | 4.250% | 12/1/2017 | Aa2 | 140,000 | 144,421 | |||||||||||||||
Cincinnati, Various Purposes Impt., Series C, G.O. Bond | 4.250% | 12/1/2017 | Aa2 | 150,000 | 159,363 | |||||||||||||||
Cleveland Department of Public Utilities Division of Public Power, Prerefunded Balance, Series A-1, Revenue Bond, NATL | 5.000% | 11/15/2018 | A3 | 1,000,000 | 1,039,130 | |||||||||||||||
The accompanying notes are an integral part of the financial statements.
6
Ohio Tax Exempt Series
Investment Portfolio - December 31, 2015
| COUPON RATE | MATURITY DATE | CREDIT RATING1 (UNAUDITED) | PRINCIPAL AMOUNT | VALUE (NOTE 2) | ||||||||||||||||
OHIO MUNICIPAL SECURITIES (continued) | ||||||||||||||||||||
Cleveland Department of Public Utilities Division of Water, Series T, Revenue Bond | 5.000% | 1/1/2019 | Aa1 | $ | 370,000 | $ | 412,702 | |||||||||||||
Cleveland Department of Public Utilities Division of Water, Series Y, Revenue Bond | 5.000% | 1/1/2022 | Aa1 | 1,000,000 | 1,197,570 | |||||||||||||||
Cleveland Department of Public Utilities Division of Water, Water Utility Impt., 2nd Lien, Series A, Revenue Bond | 5.000% | 1/1/2019 | Aa2 | 235,000 | 261,825 | |||||||||||||||
Cleveland, Public Impt., Revenue Bond | 4.000% | 11/15/2020 | A1 | 220,000 | 243,984 | |||||||||||||||
Columbus City School District, Facilities Construction & Impt., Prerefunded Balance, G.O. Bond, AGM | 5.000% | 12/1/2017 | Aa2 | 265,000 | 275,648 | |||||||||||||||
Columbus City School District, Facilities Construction & Impt., Prerefunded Balance, G.O. Bond, AGM | 5.000% | 12/1/2018 | Aa2 | 125,000 | 130,023 | |||||||||||||||
Columbus, Recreational Facilities Impt., Series A, G.O. Bond | 4.000% | 2/15/2021 | Aaa | 500,000 | 565,430 | |||||||||||||||
Columbus, Various Purposes Impt., Series 2, G.O. Bond | 4.000% | 2/15/2017 | Aaa | 100,000 | 103,797 | |||||||||||||||
Columbus, Various Purposes Impt., Series A, G.O. Bond | 5.000% | 12/15/2016 | Aaa | 105,000 | 109,507 | |||||||||||||||
Columbus, Various Purposes Impt., Series A, G.O. Bond | 5.000% | 8/15/2018 | Aaa | 100,000 | 110,430 | |||||||||||||||
Cuyahoga County, G.O. Bond | 5.000% | 12/1/2018 | Aa1 | 250,000 | 278,135 | |||||||||||||||
Cuyahoga County, Limited Tax, Various Purposes Impt., Series A, G.O. Bond | 4.000% | 12/1/2018 | Aa1 | 400,000 | 433,560 | |||||||||||||||
Cuyahoga County, Public Impt., Revenue Bond | 2.000% | 12/1/2017 | Aa1 | 280,000 | 285,919 | |||||||||||||||
Cuyahoga County, Public Impt., Revenue Bond | 2.000% | 12/1/2018 | Aa1 | 185,000 | 190,141 | |||||||||||||||
Cuyahoga County, Public Impt., Revenue Bond | 2.000% | 12/1/2019 | Aa1 | 85,000 | 87,604 | |||||||||||||||
Cuyahoga County, Public Impt., Revenue Bond | 5.000% | 12/1/2024 | Aa1 | 500,000 | 623,665 | |||||||||||||||
Cuyahoga County, Public Impt., Series A, G.O. Bond | 5.000% | 12/1/2020 | Aa1 | 395,000 | 463,134 | |||||||||||||||
Cuyahoga County, Public Impt., Series A, Revenue Bond | 2.000% | 12/1/2021 | Aa1 | 155,000 | 159,497 | |||||||||||||||
Cuyahoga County, Public Impt., Series A, Revenue Bond | 2.000% | 12/1/2022 | Aa1 | 170,000 | 173,956 | |||||||||||||||
Dayton, Water Utility Impt., Revenue Bond | 2.000% | 12/1/2021 | Aa2 | 245,000 | 249,662 | |||||||||||||||
Dayton, Water Utility Impt., Revenue Bond | 2.250% | 12/1/2022 | Aa2 | 200,000 | 205,080 | |||||||||||||||
Dayton, Water Utility Impt., Revenue Bond | 2.500% | 12/1/2023 | Aa2 | 200,000 | 207,000 | |||||||||||||||
Delaware County Sanitary Sewer System, Revenue Bond, AGM | 4.500% | 12/1/2019 | Aa2 | 150,000 | 157,356 | |||||||||||||||
Delaware County Sanitary Sewer System, Sewer Impt., Revenue Bond | 1.000% | 12/1/2016 | Aa2 | 255,000 | 256,257 | |||||||||||||||
Delaware County, Public Impt., Revenue Bond | 3.000% | 12/1/2024 | Aa1 | 305,000 | 324,587 | |||||||||||||||
Dublin City School District, Various Purposes Impt., Series A, G.O. Bond | 5.000% | 12/1/2017 | Aa1 | 400,000 | 431,768 | |||||||||||||||
Dublin, Various Purposes Impt., G.O. Bond | 3.500% | 12/1/2035 | Aaa | 450,000 | 463,397 | |||||||||||||||
Fairfield City School District, G.O. Bond | 3.000% | 12/1/2016 | Aa3 | 330,000 | 337,164 | |||||||||||||||
Fairfield City School District, G.O. Bond | 5.000% | 12/1/2020 | Aa3 | 200,000 | 233,340 | |||||||||||||||
Fairfield County, Public Impt., G.O. Bond | 2.000% | 12/1/2018 | Aa2 | 300,000 | 307,638 | |||||||||||||||
The accompanying notes are an integral part of the financial statements.
7
Ohio Tax Exempt Series
Investment Portfolio - December 31, 2015
| COUPON RATE | MATURITY DATE | CREDIT RATING1 (UNAUDITED) | PRINCIPAL AMOUNT | VALUE (NOTE 2) | ||||||||||||||||
OHIO MUNICIPAL SECURITIES (continued) | ||||||||||||||||||||
Franklin County, G.O. Bond | 4.000% | 6/1/2017 | Aaa | $ | 1,145,000 | $ | 1,199,101 | |||||||||||||
Franklin County, G.O. Bond | 5.000% | 12/1/2025 | Aaa | 275,000 | 346,286 | |||||||||||||||
Franklin County, Various Purposes Impt., G.O. Bond | 5.000% | 12/1/2020 | Aaa | 100,000 | 110,828 | |||||||||||||||
Franklin County, Various Purposes Impt., | ||||||||||||||||||||
Prerefunded Balance, G.O. Bond | 5.000% | 12/1/2027 | Aaa | 500,000 | 539,440 | |||||||||||||||
Gahanna, Public Impt., G.O. Bond | 4.000% | 12/1/2023 | Aa1 | 300,000 | 347,370 | |||||||||||||||
Gahanna, Public Impt., G.O. Bond | 4.000% | 12/1/2024 | Aa1 | 375,000 | 435,881 | |||||||||||||||
Greater Cleveland Regional Transit Authority, Capital Impt., Revenue Bond | 5.000% | 12/1/2026 | Aa1 | 500,000 | 617,915 | |||||||||||||||
Greater Cleveland Regional Transit Authority, Transit Impt., Revenue Bond | 4.000% | 12/1/2017 | Aa1 | 350,000 | 370,188 | |||||||||||||||
Greater Cleveland Regional Transit Authority, Transit Impt., Revenue Bond | 5.000% | 12/1/2018 | Aa1 | 350,000 | 388,427 | |||||||||||||||
Greene County Water System, Series A, Revenue Bond, NATL | 5.250% | 12/1/2020 | Aa2 | 100,000 | 116,825 | |||||||||||||||
Hamilton City School District, Various Purposes Impt., G.O. Bond | 4.000% | 12/1/2018 | AA2 | 200,000 | 215,910 | |||||||||||||||
Hamilton County Sewer System, Series A, Revenue Bond | 5.000% | 12/1/2020 | Aa2 | 500,000 | 586,245 | |||||||||||||||
Hamilton County Sewer System, Series A, Revenue Bond | 5.000% | 12/1/2024 | Aa2 | 570,000 | 709,399 | |||||||||||||||
Hamilton County Sewer System, Sewer Impt., Series A, Revenue Bond | 4.000% | 12/1/2018 | Aa2 | 150,000 | 162,585 | |||||||||||||||
Hamilton County Sewer System, Sewer Impt., Series A, Revenue Bond | 5.000% | 12/1/2020 | Aa2 | 500,000 | 586,245 | |||||||||||||||
Hamilton County, Limited Tax, Riverfront Infrastructure, Parking Facility Impt., G.O. Bond | 2.000% | 12/1/2016 | Aa2 | 200,000 | 202,712 | |||||||||||||||
Hamilton County, Limited Tax, Riverfront Infrastructure, Parking Facility Impt., G.O. Bond | 5.000% | 12/1/2021 | Aa2 | 500,000 | 597,595 | |||||||||||||||
Hamilton County, Various Purposes Impt., G.O. Bond | 4.000% | 12/1/2024 | Aa2 | 320,000 | 369,971 | |||||||||||||||
Hamilton Local School District, School Impt., Prerefunded Balance, G.O. Bond, AGM | 4.500% | 12/1/2033 | A2 | 200,000 | 203,478 | |||||||||||||||
Hancock County, Various Purposes Impt., G.O. Bond, NATL | 4.000% | 12/1/2016 | Aa2 | 200,000 | 200,572 | |||||||||||||||
Hilliard School District, School Impt., Series A, G.O. Bond | 5.000% | 12/1/2018 | Aa1 | 500,000 | 556,575 | |||||||||||||||
Hilliard, Limited Tax, Various Purposes Impt., G.O. Bond | 3.000% | 12/1/2018 | Aa1 | 100,000 | 105,113 | |||||||||||||||
Huber Heights City School District, School Impt., G.O. Bond | 5.000% | 12/1/2019 | A1 | 300,000 | 341,301 | |||||||||||||||
Huber Heights, Various Purposes Impt., G.O. Bond, AGM | 5.000% | 6/1/2017 | Aa2 | 115,000 | 121,887 | |||||||||||||||
Independence, Various Purposes Impt., G.O. Bond | 3.000% | 12/1/2017 | Aa1 | 100,000 | 103,699 | |||||||||||||||
Ironton City School District, School Impt., Prerefunded Balance, G.O. Bond, NATL | 4.250% | 12/1/2028 | A3 | 200,000 | 206,828 | |||||||||||||||
The accompanying notes are an integral part of the financial statements.
8
Ohio Tax Exempt Series
Investment Portfolio - December 31, 2015
| COUPON RATE | MATURITY DATE | CREDIT RATING1 (UNAUDITED) | PRINCIPAL AMOUNT | VALUE (NOTE 2) | ||||||||||||||||
OHIO MUNICIPAL SECURITIES (continued) | ||||||||||||||||||||
Kenston Local School District, School Impt., G.O. Bond | 2.000% | 12/1/2017 | Aa1 | $ | 100,000 | $ | 101,807 | |||||||||||||
Lakota Local School District, Butler County, G.O. Bond | 5.000% | 12/1/2019 | Aa1 | 175,000 | 199,381 | |||||||||||||||
Marysville City Wastewater Treatment System, Revenue Bond, BAM | 4.000% | 12/1/2017 | AA2 | 200,000 | 211,144 | |||||||||||||||
Marysville City Wastewater Treatment System, Revenue Bond, BAM | 4.000% | 12/1/2018 | AA2 | 335,000 | 360,849 | |||||||||||||||
Miami County, Various Purposes Impt., G.O. Bond | 5.000% | 12/1/2018 | Aa2 | 200,000 | 221,806 | |||||||||||||||
Middleburg Heights, G.O. Bond | 3.750% | 12/1/2017 | Aa1 | 100,000 | 105,432 | |||||||||||||||
Middletown, Various Purposes Impt., G.O. Bond, AGM | 4.500% | 12/1/2018 | Aa3 | 100,000 | 108,085 | |||||||||||||||
Middletown, Various Purposes Impt., G.O. Bond, AGM | 5.000% | 12/1/2021 | Aa3 | 230,000 | 250,810 | |||||||||||||||
New Albany, Limited Tax, Recreational Facility Impt., G.O. Bond | 3.000% | 12/1/2020 | Aaa | 340,000 | 366,414 | |||||||||||||||
North Ridgeville, Water Utility Impt., G.O. Bond, AGC | 4.750% | 12/1/2018 | Aa2 | 200,000 | 220,924 | |||||||||||||||
Northeast Ohio Regional Sewer District, Sewer Impt., Revenue Bond | 5.000% | 11/15/2021 | Aa1 | 750,000 | 895,688 | |||||||||||||||
Ohio State Turnpike Commission, Highway Impt., Series A, Revenue Bond | 5.000% | 2/15/2018 | Aa3 | 275,000 | 298,617 | |||||||||||||||
Ohio State Turnpike Commission, Highway Impt., Series A, Revenue Bond | 5.000% | 2/15/2019 | Aa3 | 375,000 | 419,730 | |||||||||||||||
Ohio State Turnpike Commission, Highway Impt., Series A-1, Revenue Bond | 5.000% | 2/15/2024 | A1 | 400,000 | 476,252 | |||||||||||||||
Ohio State Turnpike Commission, Series A, Revenue Bond | 3.250% | 2/15/2016 | Aa3 | 100,000 | 100,373 | |||||||||||||||
Ohio State Turnpike Commission, Series A, Revenue Bond, NATL | 5.500% | 2/15/2019 | Aa3 | 260,000 | 294,993 | |||||||||||||||
The Ohio State University, Series A, Prerefunded Balance, Revenue Bond | 5.000% | 12/1/2016 | WR3 | 400,000 | 416,432 | |||||||||||||||
Ohio State Water Development Authority, Drinking Water Assistance, Revenue Bond | 5.000% | 6/1/2021 | Aaa | 500,000 | 593,845 | |||||||||||||||
Ohio State Water Development Authority, Fresh Water, Revenue Bond | 5.500% | 12/1/2021 | Aaa | 125,000 | 153,159 | |||||||||||||||
Ohio State Water Development Authority, Pollution Control, Series C, Revenue Bond | 3.000% | 12/1/2021 | Aaa | 300,000 | 325,278 | |||||||||||||||
Ohio State Water Development Authority, Pure Water, Prerefunded Balance, Series I, Revenue Bond, AMBAC | 6.000% | 12/1/2016 | Aaa | 5,000 | 5,148 | |||||||||||||||
Ohio State Water Development Authority, Series A, Revenue Bond | 5.000% | 12/1/2017 | Aaa | 150,000 | 161,973 | |||||||||||||||
Ohio State Water Development Authority, Series B-1, Revenue Bond | 5.000% | 12/1/2017 | Aaa | 125,000 | 134,977 | |||||||||||||||
The accompanying notes are an integral part of the financial statements.
9
Ohio Tax Exempt Series
Investment Portfolio - December 31, 2015
| COUPON RATE | MATURITY DATE | CREDIT RATING1 (UNAUDITED) | PRINCIPAL AMOUNT | VALUE (NOTE 2) | ||||||||||||||||
OHIO MUNICIPAL SECURITIES (continued) | ||||||||||||||||||||
Ohio State Water Development Authority, Sewer Impt., Series A, Revenue Bond | 5.000% | 6/1/2020 | Aaa | $ | 450,000 | $ | 521,955 | |||||||||||||
Ohio State, Infrastructure Impt., Series A, G.O. Bond | 5.000% | 9/1/2025 | Aa1 | 350,000 | 441,161 | |||||||||||||||
Ohio State, School Impt., Series B, G.O. Bond | 5.000% | 6/15/2024 | Aa1 | 1,150,000 | 1,395,835 | |||||||||||||||
Ohio State, Series A, G.O. Bond | 5.000% | 9/15/2021 | Aa1 | 500,000 | 596,245 | |||||||||||||||
Ohio State, Series B, Revenue Bond | 5.000% | 12/15/2018 | Aa2 | 650,000 | 721,669 | |||||||||||||||
Ohio State, Series B, Revenue Bond | 5.000% | 12/15/2019 | Aa2 | 350,000 | 399,000 | |||||||||||||||
Olentangy Local School District, Public Impt., Unrefunded Balance, G.O. Bond, AGM | 5.000% | 12/1/2030 | Aa1 | 100,000 | 101,940 | |||||||||||||||
Olentangy Local School District, School Impt., G.O. Bond | 5.000% | 12/1/2019 | Aa1 | 100,000 | 114,261 | |||||||||||||||
Olentangy Local School District, School Impt., Series A, G.O. Bond | 4.300% | 12/1/2016 | Aa1 | 150,000 | 154,859 | |||||||||||||||
Olentangy Local School District, Series B, G.O. Bond | 5.000% | 12/1/2018 | Aa1 | 150,000 | 166,698 | |||||||||||||||
Olentangy Local School District, Series B, G.O. Bond | 3.000% | 12/1/2020 | Aa1 | 115,000 | 124,447 | |||||||||||||||
Oregon City School District, School Impt., G.O. Bond | 4.000% | 12/1/2017 | Aa3 | 100,000 | 105,768 | |||||||||||||||
Portage County, Limited Tax, Various Purposes Impt., G.O. Bond | 4.000% | 12/1/2017 | AA2 | 250,000 | 265,117 | |||||||||||||||
Sandy Valley Local School District, School Impt., Prerefunded Balance, G.O. Bond, XLCA | 4.500% | 12/1/2033 | A2 | 100,000 | 101,732 | |||||||||||||||
Sheffield, Limited Tax, Various Purposes Impt., G.O. Bond | 2.000% | 12/1/2018 | AA2 | 140,000 | 143,422 | |||||||||||||||
Springboro Community City School District, G.O. Bond, AGM | 5.250% | 12/1/2018 | Aa3 | 200,000 | 222,748 | |||||||||||||||
Springboro Sewer System, Revenue Bond | 4.000% | 6/1/2018 | Aa2 | 100,000 | 106,496 | |||||||||||||||
Springboro, Limited Tax, Public Impt., G.O. Bond | 5.000% | 12/1/2019 | Aa1 | 100,000 | 110,373 | |||||||||||||||
Summit County, Series A, G.O. Bond, NATL | 4.750% | 12/1/2019 | Aa1 | 120,000 | 124,636 | |||||||||||||||
Summit County, Various Purposes Impt., Series R, G.O. Bond, NATL | 5.500% | 12/1/2019 | Aa1 | 100,000 | 116,249 | |||||||||||||||
Sylvania City School District, School Impt., Prerefunded Balance, G.O. Bond, AGC | 5.000% | 12/1/2020 | A1 | 150,000 | 159,016 | |||||||||||||||
Sylvania City School District, School Impt., Prerefunded Balance, G.O. Bond, AGC | 5.000% | 12/1/2025 | A1 | 270,000 | 286,230 | |||||||||||||||
Toledo Water System, Water Utility Impt., Revenue Bond | 5.000% | 11/15/2018 | Aa3 | 500,000 | 554,415 | |||||||||||||||
Toledo Water System, Water Utility Impt., Revenue Bond | 5.000% | 11/15/2019 | Aa3 | 500,000 | 569,635 | |||||||||||||||
Toledo, Limited Tax, Capital Impt., G.O. Bond | 5.000% | 12/1/2019 | A2 | 275,000 | 311,173 | |||||||||||||||
Troy, Limited Tax, Water & Sewer Impt., G.O. Bond | 2.000% | 12/1/2020 | Aa1 | 100,000 | 102,236 | |||||||||||||||
Upper Arlington, Various Purposes Impt., G.O. Bond | 4.000% | 12/1/2024 | Aaa | 535,000 | 627,100 | |||||||||||||||
Westerville, Various Purposes Impt., G.O. Bond | 5.000% | 12/1/2020 | Aaa | 100,000 | 117,041 | |||||||||||||||
The accompanying notes are an integral part of the financial statements.
10
Ohio Tax Exempt Series
Investment Portfolio - December 31, 2015
| COUPON RATE | MATURITY DATE | CREDIT RATING1 (UNAUDITED) | PRINCIPAL AMOUNT/ SHARES | VALUE (NOTE 2) | ||||||||||||||||
OHIO MUNICIPAL SECURITIES (continued) | ||||||||||||||||||||
Worthington City School District, G.O. Bond | 4.000% | 12/1/2018 | Aa1 | $ | 400,000 | $ | 433,140 | |||||||||||||
|
| |||||||||||||||||||
TOTAL MUNICIPAL BONDS | 43,096,628 | |||||||||||||||||||
|
| |||||||||||||||||||
SHORT-TERM INVESTMENT - 4.2% | ||||||||||||||||||||
General AMT - Free Municipal Money Market Fund - Class R | 0.01%4 | 1,854,086 | 1,854,086 | |||||||||||||||||
|
| |||||||||||||||||||
TOTAL INVESTMENTS - 101.1% | 44,950,714 | |||||||||||||||||||
LIABILITIES, LESS OTHER ASSETS - (1.1%) | (498,802 | ) | ||||||||||||||||||
|
| |||||||||||||||||||
NET ASSETS - 100% | $ | 44,451,912 | ||||||||||||||||||
|
| |||||||||||||||||||
KEY:
G.O. Bond - General Obligation Bond
Impt. - Improvement
Scheduled principal and interest payments are guaranteed by:
AGC (Assured Guaranty Corp.)
AGM (Assurance Guaranty Municipal Corp.)
AMBAC (AMBAC Assurance Corp.)
BAM (Build America Mutual Assurance Co.)
NATL (National Public Finance Guarantee Corp.)
XLCA (XL Capital Assurance)
The insurance does not guarantee the market value of the municipal bonds.
1Credit ratings from Moody’s (unaudited).
2Credit ratings from S&P (unaudited).
3Credit rating has been withdrawn. As of December 31, 2015, there is no rating available (unaudited).
4Rate shown is the current yield as of December 31, 2015.
The accompanying notes are an integral part of the financial statements.
11
Ohio Tax Exempt Series
Statement of Assets and Liabilities
December 31, 2015
ASSETS: | ||||
Investments, at value (identified cost $44,424,418) (Note 2) | $ | 44,950,714 | ||
Interest receivable | 235,965 | |||
|
| |||
TOTAL ASSETS | 45,186,679 | |||
|
| |||
LIABILITIES: | ||||
Accrued management fees (Note 3) | 18,996 | |||
Accrued fund accounting and administration fees (Note 3) | 17,971 | |||
Accrued Chief Compliance Officer service fees (Note 3) | 429 | |||
Accrued transfer agent fees (Note 3) | 422 | |||
Payable for securities purchased | 688,963 | |||
Other payables and accrued expenses | 7,986 | |||
|
| |||
TOTAL LIABILITIES | 734,767 | |||
|
| |||
TOTAL NET ASSETS | $ | 44,451,912 | ||
|
| |||
NET ASSETS CONSIST OF: | ||||
Capital stock | $ | 41,787 | ||
Additional paid-in-capital | 43,910,025 | |||
Undistributed net investment income | 50,887 | |||
Accumulated net realized loss on investments | (77,083 | ) | ||
Net unrealized appreciation on investments | 526,296 | |||
|
| |||
TOTAL NET ASSETS | $ | 44,451,912 | ||
|
| |||
NET ASSET VALUE, OFFERING PRICE AND REDEMPTION PRICE PER SHARE - Class A | $ | 10.64 | ||
|
| |||
The accompanying notes are an integral part of the financial statements.
12
Ohio Tax Exempt Series
Statement of Operations
For the Year Ended December 31, 2015
INVESTMENT INCOME: | ||||
Interest | $ | 628,015 | ||
Dividends | 237 | |||
|
| |||
Total Investment Income | 628,252 | |||
|
| |||
EXPENSES: | ||||
Management fees (Note 3) | 226,654 | |||
Fund accounting and administration fees (Note 3) | 60,842 | |||
Chief Compliance Officer service fees (Note 3) | 2,541 | |||
Directors’ fees (Note 3) | 1,780 | |||
Transfer agent fees (Note 3) | 989 | |||
Audit fees | 33,817 | |||
Custodian fees | 1,955 | |||
Miscellaneous | 18,381 | |||
|
| |||
Total Expenses | 346,959 | |||
|
| |||
NET INVESTMENT INCOME | 281,293 | |||
|
| |||
REALIZED AND UNREALIZED GAIN ON INVESTMENTS: | ||||
Net realized loss on investments | (45,591 | ) | ||
Net change in unrealized appreciation on investments | 323,164 | |||
|
| |||
NET REALIZED AND UNREALIZED GAIN (LOSS) ON INVESTMENTS | 277,573 | |||
|
| |||
NET INCREASE IN NET ASSETS RESULTING FROM OPERATIONS | $ | 558,866 | ||
|
| |||
The accompanying notes are an integral part of the financial statements.
13
Ohio Tax Exempt Series
Statements of Changes in Net Assets
| FOR THE YEAR ENDED 12/31/15 | FOR THE YEAR ENDED 12/31/14 | |||||||
INCREASE (DECREASE) IN NET ASSETS: | ||||||||
OPERATIONS: | ||||||||
Net investment income | $ | 281,293 | $ | 275,269 | ||||
Net realized gain (loss) on investments | (45,591 | ) | 117,853 | |||||
Net change in unrealized appreciation on investments | 323,164 | 138,436 | ||||||
|
|
|
| |||||
Net increase from operations | 558,866 | 531,558 | ||||||
|
|
|
| |||||
DISTRIBUTIONS TO SHAREHOLDERS (Note 8): | ||||||||
From net investment income | (286,649 | ) | (241,046 | ) | ||||
From net realized gain on investments | — | (179,131 | ) | |||||
|
|
|
| |||||
Total distributions to shareholders | (286,649 | ) | (420,177 | ) | ||||
|
|
|
| |||||
CAPITAL STOCK ISSUED AND REPURCHASED: | ||||||||
Net increase (decrease) from capital share transactions (Note 5) | (416,052 | ) | 4,291,335 | |||||
|
|
|
| |||||
Net increase (decrease) in net assets | (143,835 | ) | 4,402,716 | |||||
NET ASSETS: | ||||||||
Beginning of year | 44,595,747 | 40,193,031 | ||||||
|
|
|
| |||||
End of year (including undistributed net investment income of $50,887 and $56,243, respectively) | $ | 44,451,912 | $ | 44,595,747 | ||||
|
|
|
| |||||
The accompanying notes are an integral part of the financial statements.
14
Ohio Tax Exempt Series
Financial Highlights
| FOR THE YEARS ENDED | ||||||||||||||||||||
| 12/31/15 | 12/31/14 | 12/31/13 | 12/31/12 | 12/31/11 | ||||||||||||||||
Per share data (for a share outstanding throughout each year): | ||||||||||||||||||||
Net asset value - Beginning of year | $ | 10.57 | $ | 10.54 | $ | 10.93 | $ | 10.77 | $ | 10.30 | ||||||||||
|
|
|
|
|
|
|
|
|
| |||||||||||
Income (loss) from investment operations: | ||||||||||||||||||||
Net investment income1 | 0.07 | 0.07 | 0.14 | 0.16 | 0.26 | |||||||||||||||
Net realized and unrealized gain (loss) on investments | 0.07 | 0.06 | (0.31 | ) | 0.17 | 0.62 | ||||||||||||||
|
|
|
|
|
|
|
|
|
| |||||||||||
Total from investment operations | 0.14 | 0.13 | (0.17 | ) | 0.33 | 0.88 | ||||||||||||||
|
|
|
|
|
|
|
|
|
| |||||||||||
Less distributions to shareholders: | ||||||||||||||||||||
From net investment income | (0.07 | ) | (0.06 | ) | (0.14 | ) | (0.17 | ) | (0.25 | ) | ||||||||||
From net realized gain on investments | — | (0.04 | ) | (0.08 | ) | — | 2 | (0.16 | ) | |||||||||||
|
|
|
|
|
|
|
|
|
| |||||||||||
Total distributions to shareholders | (0.07 | ) | (0.10 | ) | (0.22 | ) | (0.17 | ) | (0.41 | ) | ||||||||||
|
|
|
|
|
|
|
|
|
| |||||||||||
Net asset value - End of year | $ | 10.64 | $ | 10.57 | $ | 10.54 | $ | 10.93 | $ | 10.77 | ||||||||||
|
|
|
|
|
|
|
|
|
| |||||||||||
Net assets - End of year (000’s omitted) | $ | 44,452 | $ | 44,596 | $ | 40,193 | $ | 38,749 | $ | 37,676 | ||||||||||
|
|
|
|
|
|
|
|
|
| |||||||||||
Total return3 | 1.31 | % | 1.27 | % | (1.59 | %) | 3.09 | % | 8.65 | % | ||||||||||
Ratios (to average net assets)/Supplemental Data: | ||||||||||||||||||||
Expenses | 0.77 | % | 0.72 | % | 0.78 | % | 0.76 | % | 0.80 | % | ||||||||||
Net investment income | 0.62 | % | 0.65 | % | 1.34 | % | 1.45 | % | 2.41 | % | ||||||||||
Portfolio turnover | 32 | % | 41 | % | 27 | % | 9 | % | 60 | % | ||||||||||
1Calculated based on average shares outstanding during the years.
2Less than $0.01 per share.
3Represents aggregate total return for the years indicated, and assumes reinvestment of all distributions.
The accompanying notes are an integral part of the financial statements.
15
Ohio Tax Exempt Series
Notes to Financial Statements
| 1. | Organization |
Ohio Tax Exempt Series (the “Series”) is a no-load diversified series of Manning & Napier Fund, Inc. (the “Fund”). The Fund is organized in Maryland and is registered under the Investment Company Act of 1940, as amended, as an open-end management investment company.
The Series’ investment objective is to provide as high a level of current income exempt from federal income tax and Ohio State personal income tax as the Advisor believes is consistent with the preservation of capital.
The Fund’s advisor is Manning & Napier Advisors, LLC (the “Advisor”). Shares of the Series are offered to investors, clients and employees of the Advisor and its affiliates. The total authorized capital stock of the Fund consists of 15 billion shares of common stock each having a par value of $0.01. As of December 31, 2015, 10.7 billion shares have been designated in total among 41 series, of which 100 million have been designated as Ohio Tax Exempt Series Class A common stock.
| 2. | Significant Accounting Policies |
The following is a summary of significant accounting policies followed by the Series. The Series is an investment company and, accordingly, follows the investment company accounting and reporting guidance of the Financial Accounting Standards Board Accounting Standards Codification Topic 946 - Investment Companies, which is part of accounting principles generally accepted in the United States of America (“GAAP”).
Security Valuation
Municipal securities will normally be valued on the basis of market valuations provided by an independent pricing service (the “Service”). The Service utilizes the latest price quotations and a matrix system (which considers such factors as security prices of similar securities, yields, maturities and ratings). The Service has been approved by the Fund’s Board of Directors (the “Board”).
Short-term investments that mature in sixty days or less may be valued at amortized cost, which approximates fair value. Investments in open-end investment companies are valued at their net asset value per share on valuation date.
Volume and level of activity in established markets for an asset or liability are evaluated to determine whether recent transactions and quoted prices are determinative of fair value. Where there have been significant decreases in volume and level of activity, further analysis and adjustment may be necessary to estimate fair value. The Series measures fair value in these instances by the use of inputs and valuation techniques which may be based upon current market prices of securities that are comparable in coupon, rating, maturity and industry and/or expectation of future cash flows. As a result of trading in relatively thin markets and/or markets that experience significant volatility, the prices used by the Series to value these securities may differ from the value that would be realized if these securities were sold, and the differences could be material.
Securities for which representative valuations or prices are not available from the Series’ pricing service may be valued at fair value as determined in good faith by the Advisor under procedures approved by and under the general supervision and responsibility of the Board. Due to the inherent uncertainty of valuations of such securities, the fair value may differ significantly from the values that would have been used had a ready market for such securities existed. If trading or events occurring after the close of the principal market in which securities are traded are expected to materially affect the value of those securities, then they may be valued at their fair value, taking this trading or these events into account.
Various inputs are used in determining the value of the Series’ assets or liabilities carried at fair value. These inputs are summarized in three broad levels. Level 1 includes quoted prices in active markets for identical assets and liabilities. Level 2 includes other significant observable inputs (including quoted prices for similar securities, interest rates, prepayment speeds, credit risk, etc.). Level 3 includes significant unobservable inputs (including the Series’ own assumptions in determining the fair value of investments). A financial instrument’s level within the fair value hierarchy is based on the lowest level of any input both individually and in aggregate that is significant to the fair value measurement. The inputs or methodology used for valuing securities are not necessarily an indication of the risk associated with investing in those securities.
16
Ohio Tax Exempt Series
Notes to Financial Statements (continued)
| 2. | Significant Accounting Policies (continued) |
Security Valuation (continued)
The following is a summary of the valuation levels used for major security types as of December 31, 2015 in valuing the Series’ assets or liabilities carried at fair value:
| DESCRIPTION | TOTAL | LEVEL 1 | LEVEL 2 | LEVEL 3 | ||||||||||||
Assets: | ||||||||||||||||
Debt securities: | ||||||||||||||||
States and political subdivisions (municipals) | $ | 43,096,628 | $ | — | $ | 43,096,628 | $ | — | ||||||||
Mutual fund | 1,854,086 | 1,854,086 | — | — | ||||||||||||
|
|
|
|
|
|
|
| |||||||||
Total assets | $ | 44,950,714 | $ | 1,854,086 | $ | 43,096,628 | $ | — | ||||||||
|
|
|
|
|
|
|
| |||||||||
There were no Level 3 securities held by the Series as of December 31, 2014 or December 31, 2015.
The Fund’s policy is to recognize transfers in and transfers out of the valuation levels as of the beginning of the reporting period. There were no transfers between Level 1 and Level 2 during the year ended December 31, 2015.
Security Transactions, Investment Income and Expenses
Security transactions are accounted for on trade date. Dividend income is recorded on the ex-dividend date, except that if the ex-dividend date has passed, certain dividends from foreign securities are recorded as soon as the Series is informed of the ex-dividend date. Non-cash dividends, if any, are recorded at the fair value of the securities received. Interest income, including amortization of premium and accretion of discounts using the effective interest method, is earned from settlement date and accrued daily.
Expenses are recorded on an accrual basis. Most expenses of the Fund can be attributed to a specific series. Expenses which cannot be directly attributed are apportioned among the series in the Fund in such a manner as deemed equitable by the Fund’s Board, taking into consideration, among other things, the nature and type of expense.
The Series uses the identified cost method for determining realized gain or loss on investments for both financial statement and federal income tax reporting purposes.
Federal Taxes
The Series’ policy is to comply with the provisions of the Internal Revenue Code applicable to regulated investment companies. The Series is not subject to federal income tax or excise tax to the extent that the Series distributes to shareholders each year its taxable income, including any net realized gains on investments, in accordance with requirements of the Internal Revenue Code. Accordingly, no provision for federal income tax or excise tax has been made in the financial statements.
Management evaluates its tax positions to determine if the tax positions taken meet the minimum recognition threshold in connection with accounting for uncertainties in income tax positions taken or expected to be taken for the purposes of measuring and recognizing tax liabilities in the financial statements. Recognition of tax benefits of an uncertain tax position is required only when the position is “more likely than not” to be sustained assuming examination by taxing authorities. At December 31, 2015, the Series has recorded no liability for net unrecognized tax benefits relating to uncertain income tax positions taken or expected to be taken in future tax returns.
The Series files income tax returns in the U.S. federal jurisdiction and various states, as required. No income tax returns are currently under investigation. The statute of limitations on the Series’ tax returns remains open for the years ended December 31, 2012 through December 31, 2015. The Series is not aware of any tax positions for which it is reasonably possible that the total amounts of unrecognized tax benefits will significantly change in the next twelve months.
Distributions of Income and Gains
Distributions to shareholders of net investment income are made quarterly. Distributions of net realized gains are made annually. An additional distribution may be necessary to avoid taxation of the Series. Distributions are recorded on the ex-dividend date.
17
Ohio Tax Exempt Series
Notes to Financial Statements (continued)
| 2. | Significant Accounting Policies (continued) |
Indemnifications
The Fund’s organizational documents provide former and current directors and officers with a limited indemnification against liabilities arising in connection with the performance of their duties to the Fund. In the normal course of business, the Fund may also enter into contracts that provide general indemnifications. The Fund’s maximum exposure under these arrangements is unknown as this would be dependent on future claims that may be made against the Fund. The risk of material loss from such claims is considered remote.
Other
The preparation of financial statements in conformity with GAAP requires management to make estimates and assumptions that affect the reported amounts of assets and liabilities and the disclosure of contingent assets and liabilities at the date of the financial statements and the reported amounts of income and expenses during the reporting period. Actual results could differ from those estimates.
| 3. | Transactions with Affiliates |
The Fund has an Investment Advisory Agreement (the “Agreement”) with the Advisor, for which the Series pays a fee, computed daily and payable monthly, at an annual rate of 0.50% of the Series’ average daily net assets.
Under the Agreement, personnel of the Advisor provide the Series with advice and assistance in the choice of investments and the execution of securities transactions, and otherwise maintain the Series’ organization. The Advisor also provides the Fund with necessary office space and fund administration and support services. The salaries of all officers of the Fund (except a percentage of the Fund’s Chief Compliance Officer’s salary, which is paid by the Fund), and of all Directors who are “affiliated persons” of the Fund, or of the Advisor, and all personnel of the Fund, or of the Advisor, performing services relating to research, statistical and investment activities, are paid by the Advisor. Each “non-affiliated” Director receives an annual stipend, which is allocated among all the active series of the Fund. In addition, these Directors also receive a fee per Board meeting attended plus a fee for each committee meeting attended and are reimbursed for travel and other out-of-pocket expenses incurred by them in connection with attending such meetings. The Fund also has an Audit Committee Chair, who receives an additional annual stipend for this role.
The Advisor has contractually agreed, until at least April 30, 2016, to waive its management fee and, if necessary, pay other operating expenses of the Series in order to maintain total direct annual fund operating expenses for the Series at no more than 0.85% of average daily net assets each year. The Advisor did not waive any fees for the year ended December 31, 2015. The Advisor is not eligible to recoup any expenses that have been waived or reimbursed in prior years.
Manning & Napier Investor Services, Inc., a registered broker-dealer affiliate of the Advisor, acts as distributor for the Fund’s shares. The services of Manning & Napier Investor Services, Inc. are provided at no additional cost to the Series.
Pursuant to a master services agreement dated November 1, 2014, the Fund pays the Advisor an annual fee related to fund accounting and administration of 0.0085% on the first $25 billion of average daily net assets (excluding Target Series and Strategic Income Series); 0.0075% on the next $15 billion of average daily net assets (excluding Target Series and Strategic Income Series); and 0.0065% of the average daily net assets in excess of $40 billion (excluding Target Series and Strategic Income Series); plus a base fee of $30,400 per series. Transfer agent fees are charged to the Fund on a per account basis. Additionally, certain transaction and out-of-pocket expenses, including charges for reporting relating to the Fund’s compliance program, are charged. The Advisor has agreements with BNY Mellon Investment Servicing (U.S.) Inc. (“BNY”) under which BNY serves as sub-accountant services agent and sub-transfer agent.
Expenses not directly attributable to a series are allocated based on each series’ relative net assets or number of accounts, depending on the expense.
18
Ohio Tax Exempt Series
Notes to Financial Statements (continued)
| 4. | Purchases and Sales of Securities |
For the year ended December 31, 2015, purchases and sales of securities, other than U.S. Government securities and short-term securities, were $14,947,861 and $13,812,997, respectively. There were no purchases or sales of U.S. Government securities.
| 5. | Capital Stock Transactions |
Transactions in shares of Ohio Tax Exempt Series were:
| FOR THE YEAR ENDED 12/31/15 | FOR THE YEAR ENDED 12/31/14 | |||||||||||||||
| SHARES | AMOUNT | SHARES | AMOUNT | |||||||||||||
Sold | 444,806 | $ | 4,719,459 | 785,090 | $ | 8,344,570 | ||||||||||
Reinvested | 26,854 | 281,527 | 39,016 | 414,025 | ||||||||||||
Repurchased | (511,356 | ) | (5,417,038 | ) | (420,466 | ) | (4,467,260 | ) | ||||||||
|
|
|
|
|
|
|
| |||||||||
Total | (39,696 | ) | $ | (416,052 | ) | 403,640 | $ | 4,291,335 | ||||||||
|
|
|
|
|
|
|
| |||||||||
Over 90% of the shares outstanding are held by fiduciary accounts where the Advisor has sole investment discretion.
| 6. | Financial Instruments |
The Series may trade in instruments including written and purchased options, forward foreign currency exchange contracts and futures contracts and other derivatives in the normal course of investing activities to assist in managing exposure to various market risks. The Series may be subject to various elements of risk, which may involve, to a varying degree, elements of risk in excess of the amounts recognized for financial statement purposes. These risks include: the risk that changes in the value of a derivative may not correlate perfectly with the underlying asset, rate or index; counterparty credit risk related to over the counter derivative counterparties’ failure to perform under contract terms; liquidity risk related to the lack of a liquid market for these contracts allowing the fund to close out its position(s); and documentation risk relating to disagreement over contract terms. No such investments were held by the Series as of December 31, 2015.
| 7. | Concentration of Credit |
The Series primarily invests in debt obligations issued by the State of Ohio and its political subdivisions, agencies and public authorities to obtain funds for various public purposes. The Series is more susceptible to factors adversely affecting issues of Ohio municipal securities than is a municipal bond fund that is not concentrated in these issues to the same extent.
| 8. | Federal Income Tax Information |
The amount and characterization of certain income and capital gains to be distributed are determined in accordance with federal income tax regulations, which may differ from GAAP. These differences are primarily due to differing book and tax treatments in the timing and/or treatment of the recognition of net investment income or gains and losses and qualified late-year losses. The Series may periodically make reclassifications among its capital accounts to reflect income and gains available for distribution (or available capital loss carryovers) under income tax regulations without impacting the Series’ net asset value.
The tax character of distributions paid were as follows:
| FOR THE YEAR ENDED 12/31/15 | FOR THE YEAR ENDED 12/31/14 | |||
Ordinary income | $ — | $ 2,669 | ||
Tax exempt income | 286,649 | 238,385 | ||
Long-term capital gains | — | 179,123 |
At December 31, 2015, the tax basis of components of distributable earnings and the net unrealized appreciation based on identified cost for federal income tax purposes were as follows:
19
Ohio Tax Exempt Series
Notes to Financial Statements (continued)
| 8. | Federal Income Tax Information (continued) |
Cost for federal income tax purposes | $ | 44,424,418 | ||
Unrealized appreciation | 552,807 | |||
Unrealized depreciation | (26,511 | ) | ||
|
| |||
Net unrealized appreciation | $ | 526,296 | ||
|
| |||
Undistributed tax exempt income | $ | 50,887 | ||
Capital Loss Carryforwards | $ | (77,083 | ) |
At December 31, 2015, the Series had net short-term capital loss carryforwards of $11,099 and net long-term capital loss carryforwards of $65,984, which may be carried forward indefinitely.
20
Ohio Tax Exempt Series
Report of Independent Registered Public Accounting Firm
To the Board of Directors of Manning & Napier Fund, Inc. and Shareholders of Ohio Tax Exempt Series:
In our opinion, the accompanying statement of assets and liabilities, including the investment portfolio, and the related statements of operations and of changes in net assets and the financial highlights present fairly, in all material respects, the financial position of Ohio Tax Exempt Series (a series of Manning & Napier Fund, Inc., hereafter referred to as the “Series”) at December 31, 2015, the results of its operations for the year then ended, the changes in its net assets for each of the two years in the period then ended and the financial highlights for each of the five years in the period then ended, in conformity with accounting principles generally accepted in the United States of America. These financial statements and financial highlights (hereafter referred to as “financial statements”) are the responsibility of the Series’ management. Our responsibility is to express an opinion on these financial statements based on our audits. We conducted our audits of these financial statements in accordance with the standards of the Public Company Accounting Oversight Board (United States). Those standards require that we plan and perform the audit to obtain reasonable assurance about whether the financial statements are free of material misstatement. An audit includes examining, on a test basis, evidence supporting the amounts and disclosures in the financial statements, assessing the accounting principles used and significant estimates made by management, and evaluating the overall financial statement presentation. We believe that our audits, which included confirmation of securities at December 31, 2015 by correspondence with the custodian and brokers, provide a reasonable basis for our opinion.

New York, New York
February 19, 2016
21
Ohio Tax Exempt Series
Supplemental Tax Information
(unaudited)
All reportings are based on financial information available as of the date of this annual report and, accordingly are subject to change.
The Series hereby reports $286,649 as tax exempt dividends for the year ended December 31, 2015. It is the intention of the Series to designate the maximum allowable under tax law.
22
Ohio Tax Exempt Series
Renewal of Investment Advisory Agreement
(unaudited)
At the Manning & Napier Fund, Inc. (the “Fund”) Board of Directors’ (the “Board”) meeting, held on November 17, 2015, the Investment Advisory Agreement (the “Agreement”) between the Fund and Manning & Napier Advisors, LLC (the “Advisor”) was considered by the Board for renewal. In connection with the decision whether to renew the Agreement, a variety of material was prepared for and considered by the Board.
Representatives of the Advisor attended the meeting and presented additional oral and written information to the Board to assist the Board in its considerations. The discussion immediately below outlines the materials and information presented to the Board in connection with the Board’s 2015 Annual consideration of the Agreement and the conclusions made by the Directors when determining to continue the Agreement.
| • | The Board considered the services provided by the Advisor under the Agreement including, among others: deciding what securities to purchase and sell for each Series; arranging for the purchase and sale of such securities by placing orders with broker-dealers; administering the affairs of the Fund (including the books and records of the Fund not maintained by third party service providers such as the custodian or sub-transfer agent); arranging for the insurance coverage for the Fund; and supervising the preparation of tax returns, SEC filings (including registration statements) and reports to shareholders for the Fund. The Board also considered the nature and quality of such services provided under the Agreement in light of the Advisor’s services provided to the Fund for 29 years. The Board discussed the quality of these services with representatives from the Advisor and concluded that the Advisor was performing its services to the Fund required under the Agreement in a reasonable manner. |
| • | The Board considered the performance of each Series since its inception, as well as performance over multiple time periods. Performance for one or more of the following time periods was considered as applicable to the Series’ inception date: inception, three year, five year, ten year, and current market cycle. A market cycle includes periods of both rising and falling markets. Returns for established benchmark indices for each Series were provided. In addition, the Board considered a number of other factors relevant to performance at the meeting (and considers on a quarterly basis) including: a peer group performance analysis consisting of Morningstar universes of mutual funds with similar investment objectives, investment performance of core products, product offerings, performance on an aggregate basis vs. performance over reasonable time periods and the Advisor’s investment process. The Directors acknowledged the challenging performance and discussed the investment process of the Advisor. The Directors confirmed that qualitative factors such as the Advisor’s investment process, including recent enhancements, were an important subset to be considered as part of their consideration of performance. The Board discussed the performance with representatives from the Advisor and concluded that the investment performance of each of the Fund’s Series was reasonable based on the Series’ actual performance and comparative performance, especially for those series with performance over the current market cycle. |
| • | The Board considered the costs of the Advisor’s services and the profits of the Advisor as they relate to the Advisor’s services to the Fund under the Agreement. In reviewing the Advisor’s costs and profits, the Board discussed the Advisor’s revenues generated from the Fund (on both an actual and adjusted basis) and its expenses associated with providing the services under the Agreement. In addition, the Board reviewed the Advisor’s expenses associated with Fund activities outside of the Agreement (such as expense reimbursements pursuant to expense caps and payments made by the Advisor to third party platforms on which shares of the Fund are available for purchase). It was noted by representatives of the Advisor that 22 of the 36 active Series of the Fund are currently experiencing expenses above the capped expense ratios, and thus the Advisor is incurring those expenses over the cap. After discussing the above costs and profits, the Board concluded that the Advisor’s profitability relating to its services provided under the Agreement was reasonable. |
| • | The Board considered the fees and expenses of the various Series of the Fund. The Advisor presented the advisory fees and total expenses for each Series, including the advisory fee adjusted for any expense waivers or reimbursements (either contractual or voluntary) paid by the Advisor. The advisory fees and expense ratios of each Series were compared to an average (on both a mean and median basis) of similar funds as disclosed on the Morningstar database. Representatives of the Advisor discussed with the Board the levels of its advisory fee for each Series of the Fund and as compared to the median and mean advisory fees for similar funds as listed on Morningstar. Expense ratios for every Series, except the Tax Managed Series, Equity Income Class S, High Yield Bond Class S, Pro-Blend Series Classes C and R, and Target Series’ Classes R and K, are lower than, or substantially similar to the Morningstar mean and median reported total expense ratio. |
23
Ohio Tax Exempt Series
Renewal of Investment Advisory Agreement
(unaudited)
The higher than mean and median total expense ratios for Classes C and R reflect higher distribution, marketing and shareholder service fees payable to broker-dealers through a 100bp 12b-1 fee for Class C and a 50bp 12b-1 fee for Class R. Based on their review of the information provided, the Board concluded that the fees and expenses of each Series of the Fund were reasonable on a comparative basis.
| • | The Board also considered the other benefits the Advisor derives from its relationship with the Fund. Such other benefits include certain research services provided by soft dollars. The Board reviewed the broker-dealers who provided research to the Advisor and the products and services paid for, in whole or in part, using soft dollar commissions. Given the level of soft dollar transactions involving the Fund, the Board concluded that these additional benefits to the Advisor were reasonable. |
| • | In addition to the factors described above, the Board considered the Advisor’s personnel, investment strategies, policies and procedures relating to compliance with personal securities transactions, reputation, expertise and resources in domestic and foreign financial markets. The Board concluded that these factors support the conclusion that the Advisor performs its services in a reasonable manner. |
| • | The Board then considered economies of scale and concluded that the current fee schedule to the advisory agreement remained reasonable given the multiple uses of the Fund (for the Advisor’s discretionary investment account clients in addition to direct investors), the current profitability of the Advisor’s services to the Fund under the Agreement, the number of newly established series of the Fund and the overall size of the Fund complex. |
Based on the Board’s deliberations and their evaluation of the information described above, the Board, including a majority of Directors that are not “interested persons” as defined in the Investment Company Act of 1940, concluded that the compensation under the Agreement was fair and reasonable in light of the services and expenses and such other matters as the Directors considered to be relevant in the exercise of their reasonable judgment. Accordingly, the Board approved the renewal of the Agreement. In the course of their deliberations, the Directors did not identify any particular information that was all important or controlling.
24
Ohio Tax Exempt Series
Directors’ and Officers’ Information
(unaudited)
The Statement of Additional Information provides additional information about the Fund’s directors and officers and can be obtained without charge by calling 1-800-466-3863, at www.manningnapieradvisors.com, or on the EDGAR Database on the SEC Internet web site (http:// www.sec.gov). The following chart shows certain information about the Fund’s officers and directors, including their principal occupations during the last five years. Unless specific dates are provided, the individuals have held the listed positions for longer than five years.
| Interested Director/Officer | ||
| Name: | James E. Mikolaichik* | |
| Address: | 290 Woodcliff Drive | |
| Fairport, NY 14450 | ||
| Age: | 44 | |
| Current Position(s) Held with Fund: | Principal Executive Officer, President, Chairman & Director | |
| Term of Office1 & Length of Time Served: | Indefinite - Chairman and Director since August 2015 | |
| Principal Occupation(s) During Past 5 Years: | Chief Financial Officer (since 2011) - Manning & Napier Advisors, LLC; Executive Vice President and Head of Strategy (2008-2011) and Chief Risk Officer (2004-2008) - Old Mutual Asset Management Holds or has held one or more of the following title for various subsidiaries and affiliates: Chief Financial Officer. | |
| Number of Portfolios Overseen within Fund Complex: | 41 | |
| Other Directorships Held Outside Fund Complex: | N/A | |
| Independent Directors | ||
| Name: | Stephen B. Ashley | |
| Address: | 290 Woodcliff Drive | |
| Fairport, NY 14450 | ||
| Age: | 75 | |
| Current Position(s) Held with Fund: | Director, Audit Committee Member, Governance & Nominating Committee Member | |
| Term of Office & Length of Time Served: | Indefinite - Since 1996 | |
| Principal Occupation(s) During Past 5 Years: | Chairman, Director, President & Chief Executive Officer (1997 to present) - The Ashley Group (property management and investment); Director (1995-2008) and Chairman (non-executive) (2004-2008) - Fannie Mae (mortgage). | |
| Number of Portfolios Overseen within Fund Complex: | �� | 41 |
| Other Directorships Held Outside Fund Complex: | Fannie Mae (1995-2008) The Ashley Group (1995-2008) Genesee Corporation (1987-2007) | |
| Name: | Paul A. Brooke | |
| Address: | 290 Woodcliff Drive | |
| Fairport, NY 14450 | ||
| Age: | 70 | |
| Current Position(s) Held with Fund: | Director, Audit Committee Member, Governance & Nominating Committee Member | |
| Term of Office & Length of Time Served: | Indefinite - Since 2007 | |
| Principal Occupation(s) During Past 5 Years: | Chairman & CEO (2005-2009) - Ithaka Acquisition Corporation (investments); Chairman (2007-2009) Alsius Corporation (investments); Managing Member, PMSV Holdings LLC (investments) since 1991; Managing Member, Venbio (investments) since 2010. | |
| Number of Portfolios Overseen within Fund Complex: | 41 | |
| Other Directorships Held Outside Fund Complex: | Incyte Corp. (2000-present) ViroPharma, Inc. (2000-2014) HLTH Corp (WebMD) (2000-2010) Cheyne Capital International (2000-present) GMP Companies (2000-2011) Cytos Biotechnology Ltd. (2012-2014)
| |
25
Ohio Tax Exempt Series
Directors’ and Officers’ Information
(unaudited)
Independent Directors (continued)
| Name: | Peter L. Faber | |
| Address: | 290 Woodcliff Drive | |
| Fairport, NY 14450 | ||
| Age: | 77 | |
| Current Position(s) Held with Fund: | Director, Governance & Nominating Committee Member | |
| Term of Office & Length of Time Served: | Indefinite - Since 1987 | |
| Principal Occupation(s) During Past 5 Years: | Senior Counsel (2006-2012), Partner (1995-2006 & 2013-present) - McDermott, Will & Emery LLP (law firm) | |
| Number of Portfolios Overseen within Fund Complex: | 41 | |
| Other Directorships Held Outside Fund Complex: | Boston Early Music Festival (non-profit)(2007-present) Amherst Early Music, Inc. (non-profit)(2009-present) Gotham Early Music Scene, Inc. (non-profit)(2009-present) Partnership for New York City, Inc. (non-profit) (1989-2010) New York Collegium (non-profit) (2004-2011) | |
| Name: | Harris H. Rusitzky | |
| Address: | 290 Woodcliff Drive | |
| Fairport, NY 14450 | ||
| Age: | 80 | |
| Current Position(s) Held with Fund: | Director, Audit Committee Member, Governance & Nominating Committee Member | |
| Term of Office & Length of Time Served: | Indefinite - Since 1985 | |
| Principal Occupation(s) During Past 5 Years: | President, The Greening Group (business consultants) since 1994; | |
| Partner, The Restaurant Group (restaurants) since 2006 | ||
| Number of Portfolios Overseen within Fund Complex: | 41 | |
| Other Directorships Held Outside Fund Complex: | Rochester Institute of Technology (university)(1972-present) Culinary Institute of America (non-profit college)(1985-present) George Eastman House (museum)(1988-present) National Restaurant Association (restaurant trade organization)(1978-present) | |
| Name: | Chester N. Watson | |
| Address: | 290 Woodcliff Drive | |
| Fairport, NY 14450 | ||
| Age: | 65 | |
| Current Position(s) Held with Fund: | Director, Audit Committee Chairman, Governance & Nominating Committee Member | |
| Term of Office & Length of Time Served: | Indefinite - Since 2012 | |
| Principal Occupation(s) During Past 5 Years: | General Auditor (2003-2011) - General Motors Company (auto manufacturer) | |
| Number of Portfolios Overseen within Fund Complex: | 41 | |
| Other Directorships Held Outside Fund Complex: | Rochester Institute of Technology (university)(2005-present) | |
| Officers | ||
| Name: | Jeffrey S. Coons, Ph.D., CFA | |
| Address: | 290 Woodcliff Drive | |
| Fairport, NY 14450 | ||
| Age: | 52 | |
| Current Position(s) Held with Fund: | Vice President | |
| Term of Office1 & Length of Time Served: | Since 2004 | |
| Principal Occupation(s) During Past 5 Years: | President since 2010, Co-Director of Research (2002-2015) - Manning & Napier Advisors, LLC Holds one or more of the following titles for various subsidiaries and affiliates: President, Director, Treasurer or Senior Trust Officer. | |
| Number of Portfolios Overseen within Fund Complex: | 41 | |
| Other Directorships Held Outside Fund Complex: | N/A | |
26
Ohio Tax Exempt Series
Directors’ and Officers’ Information
(unaudited)
Officers (continued)
| Name: | Elizabeth Craig | |
| Address: | 290 Woodcliff Drive | |
| Fairport, NY 14450 | ||
| Age: | 28 | |
| Current Position(s) Held with Fund: | Assistant Corporate Secretary | |
| Term of Office1 & Length of Time Served: | Since 2011 | |
| Principal Occupation(s) During Past 5 Years: | Fund Administration Manager since 2015; Mutual Fund Compliance Specialist (2009-2015) - Manning & Napier Advisors, LLC | |
| Number of Portfolios Overseen within Fund Complex: | 41 | |
| Other Directorships Held Outside Fund Complex: | N/A | |
| Name: | Christine Glavin | |
| Address: | 290 Woodcliff Drive | |
| Fairport, NY 14450 | ||
| Age: | 49 | |
| Current Position(s) Held with Fund: | Principal Financial Officer, Chief Financial Officer | |
| Term of Office1 & Length of Time Served: | Principal Financial Officer since 2002; Chief Financial Officer since 2001 | |
| Principal Occupation(s) During Past 5 Years: | Director of Fund Reporting since 2011; Fund Reporting Manager (1997-2011) - Manning & Napier Advisors, LLC; Assistant Treasurer since 2008 - Exeter Trust Company | |
| Number of Portfolios Overseen within Fund Complex: | 41 | |
| Other Directorships Held Outside Fund Complex: | N/A | |
| Name: | Jodi L. Hedberg | |
| Address: | 290 Woodcliff Drive | |
| Fairport, NY 14450 | ||
| Age: | 48 | |
| Current Position(s) Held with Fund: | Corporate Secretary, Chief Compliance Officer, Anti-Money Laundering Compliance Officer | |
| Term of Office1 & Length of Time Served: | Corporate Secretary since 1997; Chief Compliance Officer since 2004; Anti-Money Laundering Compliance Officer since 2002 | |
| Principal Occupation(s) During Past 5 Years: | Director of Compliance since 2005; Compliance Manager (1995-2005) - Manning & Napier Advisors, LLC and affiliates; Corporate Secretary - Manning & Napier Investor Services, Inc. since 2006 | |
| Number of Portfolios Overseen within Fund Complex: | 41 | |
| Other Directorships Held Outside Fund Complex: | N/A | |
| Name: | Richard Yates | |
| Address: | 290 Woodcliff Drive | |
| Fairport, NY 14450 | ||
| Age: | 50 | |
| Current Position(s) Held with Fund: | Chief Legal Officer | |
| Term of Office1 & Length of Time Served: | Chief Legal Officer since 2004 | |
| Principal Occupation(s) During Past 5 Years: | Counsel - Manning & Napier Advisors, LLC and affiliates since 2000; Holds one or more of the following titles for various affiliates; Director or Corporate Secretary | |
| Number of Portfolios Overseen within Fund Complex: | 41 | |
| Other Directorships Held Outside Fund Complex: | N/A | |
*Interested Director, within the meaning of the Investment Company Act of 1940 by reason of his position with the Fund’s investment advisor and distributor. Mr. Mikolaichik serves as the Chief Financial Officer for Manning & Napier Advisors, LLC.
1The term of office of all officers shall be one year and until their respective successors are chosen and qualified, or his or her earlier resignation or removal as provided in the Fund’s By-Laws.
27
Ohio Tax Exempt Series
Results of Special Meeting of Shareholders
(unaudited)
A Special Meeting of the Shareholders of the Fund was held on August 18, 2015. The number of votes necessary to conduct the meeting and approve the proposal was obtained, and the results of the vote of shareholders of all the Series of the Fund voting together in the aggregate is listed below:
PROPOSAL 1:
Election of Directors
| NUMBER OF SHARES VOTED FOR | NUMBER OF SHARES WITHELD | |||
Stephen B. Ashley | 883,968,395 | 8,618,094 | ||
Paul A. Brooke | 884,510,661 | 8,075,828 | ||
Peter L. Faber | 884,140,893 | 8,445,596 | ||
James E. Mikolaichik | 883,391,832 | 9,194,657 | ||
Harris H. Rusitzky | 620,022,215 | 272,564,274 | ||
Chester N. Watson | 884,638,809 | 7,947,680 |
28
Ohio Tax Exempt Series
Literature Requests
(unaudited)
Proxy Voting Policies and Procedures
A description of the policies and procedures that the Fund uses to determine how to vote proxies relating to portfolio securities is available, without charge, upon request:
| By phone | 1-800-466-3863 | |||
| On the Securities and Exchange | ||||
| Commission’s (SEC) web site | http://www.sec.gov |
Proxy Voting Record
Information regarding how the Fund voted proxies relating to portfolio securities during the most recent 12-month period ended June 30th is available, without charge, upon request:
| By phone | 1-800-466-3863 | |||
| On the SEC’s web site | http://www.sec.gov |
Quarterly Portfolio Holdings
The Series’ complete schedule of portfolio holdings for the 1st and 3rd quarters of each fiscal year are provided on Form N-Q, and are available, without charge, upon request:
| By phone | 1-800-466-3863 | |||
| On the SEC’s web site | http://www.sec.gov |
The Series’ Form N-Q may be reviewed and copied at the SEC’s Public Reference Room in Washington, D.C. Information on the operation of the Public Reference Room may be obtained by calling 1-800-SEC-0330.
Prospectus and Statement of Additional Information (SAI)
For more information about any of the Manning & Napier Fund, Inc. Series, you may obtain a prospectus and SAI at www.manning-napier.com or by calling (800) 466-3863. Before investing, carefully consider the objectives, risks, charges and expenses of the investment and read the prospectus carefully as it contains this and other information about the investment company. In addition, this information can be found on the SEC’s web site, http://www.sec.gov.
Additional information available at www.manning-napier.com
1. Fund Holdings - Month-End
2. Fund Holdings - Quarter-End
3. Shareholder Report - Annual
4. Shareholder Report - Semi-Annual
The Fund also offers electronic notification or “e-delivery” when certain documents are available on-line to be downloaded or reviewed. Direct shareholders can elect to receive electronic notification when shareholder reports, prospectus updates, and/or statements are available. If you do not currently have on-line access to your account, you can establish access by going to www.manning-napier.com, click on “Login” in the top corner of the page, and follow the prompts to self-enroll. Once enrolled, you can set your electronic notification preferences by clicking on the Account Options tab located within the green toolbar and then select E-Delivery Option. Should you have any questions on either how to establish on-line access or how to update your account settings, please contact Investor Services at 1-800-466-3863.
The Manning & Napier Fund, Inc. is managed by Manning & Napier Advisors, LLC. Manning & Napier Investor Services, Inc., an affiliate of Manning & Napier Advisors, LLC, is the distributor of the Fund shares.
MNOTE-12/15-AR

Diversified Tax Exempt Series
Management Discussion and Analysis
(unaudited)
Dear Shareholders:
Volatility defined global financial markets during the past year, largely driven by macroeconomic factors. Renewed concerns about economic growth in emerging markets — China in particular — and uncertainty about the effects of that slowdown on overall global growth triggered market gyrations. Developed economies continued to provide accommodative monetary policy to combat growth concerns, although in December the U.S. Federal Reserve raised the federal funds rate for the first time in nearly a decade. For much of the year, Europe struggled with uncertainty regarding Greece’s ability to secure bailout funding from its creditors, which negatively affected investor sentiment. China’s economy slowed, but the government continued to demonstrate a willingness to provide support through a combination of policy-easing maneuvers and targeted stimulus measures. The U.S. economy remained on a path of slow growth that nevertheless made it the best performing developed economy. Looking ahead, we expect the slow global growth environment to remain in place for the foreseeable future.
As always, we appreciate your business.
Sincerely,
Manning & Napier Advisors, LLC
1
Diversified Tax Exempt Series
Fund Commentary
(unaudited)
Investment Objective
To provide as high a level of current income exempt from federal income tax as the Advisor believes is consistent with the preservation of capital. The Series invests primarily in municipal bonds that provide income exempt from federal income tax.
Performance Commentary
Domestic fixed income markets generated modestly positive absolute returns in 2015, although performance across sectors was mixed. Municipal, mortgage-backed, and Treasury securities turned in positive performance for the year, whereas high yield and investment grade corporate bonds were negative.
During 2015, municipal bond yields increased along the shorter end of the yield curve, while decreasing along the rest of the curve. Meanwhile, the Bank of America Merrill Lynch 1-12 Year Municipal Bond Index returned 2.34%. Over the same time period, the Diversified Tax Exempt Series returned 1.51%, underperforming its benchmark.
The Series maintains a significant overweight versus the benchmark to revenue bonds versus general obligation bonds, as well as an overweight to middle-tier (single-A and triple-B) credits within the revenue sector. In our view, revenue bonds continue to offer attractive spreads while exhibiting stable credit fundamentals, and tend to outperform in a rising rate environment as they are cyclical in nature. In addition, the revenue bond sector is generally insulated from political risk and long-term structural risks relating to pension obligations, which the general obligation sector is exposed to.
During 2016 we expect the fixed income landscape to continue to shift as the Federal Reserve considers further changes to U.S. monetary policy. Having raised the federal funds rate, we believe they now will seek to remain flexible and proceed slowly with small increases that do not follow a well-defined schedule. The diverging monetary policies of major central banks, geopolitical risks, commodity price pressures, and the potential for global growth to deviate from expectations could cause volatility in financial markets. In light of the current environment, it is important that investors remain active, flexible, and selective in their approach in order to avoid overvalued and risky areas of the market, something Manning & Napier has done for over 45 years.
Performance data quoted represents past performance and does not guarantee future results. The investment return and principal value of an investment will fluctuate, so that an investor’s shares, when redeemed, may be worth more or less than their original cost. Current performance may be higher or lower than that quoted; investors can obtain the most recent month-end performance at www.manning-napier.com or by calling (800) 466-3863.
Please see the next page for additional performance information as of December 31, 2015.
All investments involve risks, including possible loss of principal. There is an inverse relationship between bond prices and interest rates; as interest rates rise, bond prices (and therefore the value of bond funds) fall. Likewise, as interest rates fall, bond prices and the value of bond funds rise. The income earned by the Series may be subject to the Alternative Minimum Tax (AMT), depending on your tax situation.
2
Diversified Tax Exempt Series
Performance Update as of December 31, 2015
(unaudited)
| AVERAGE ANNUAL TOTAL RETURNS AS OF DECEMBER 31, 2015 | ||||||||||||||||
ONE YEAR1 | FIVE YEAR | TEN YEAR | SINCE INCEPTION2 | |||||||||||||
Manning & Napier Fund, Inc. - Diversified Tax Exempt Series3 | 1.51 | % | 2.55 | % | 3.07 | % | 4.04 | % | ||||||||
Bank of America (BofA) Merrill Lynch 1-12 Year Municipal Bond Index4 | 2.34 | % | 3.46 | % | 4.08 | % | 4.76 | % | ||||||||
The following graph compares the value of a $10,000 investment in the Manning & Napier Fund, Inc. - Diversified Tax Exempt Series for the ten years ended December 31, 2015 to the BofA Merrill Lynch 1-12 Year Municipal Bond Index.

1The returns shown are based on net asset values calculated for shareholder transactions and may differ from the returns shown in the financial highlights, which reflect adjustments made to the net asset values in accordance with accounting principles generally accepted in the United States of America.
2Performance numbers for the Series and Index are calculated from February 14, 1994, the Series’ inception date.
3The Series’ performance does not reflect the deduction of taxes that a shareholder would pay on fund distributions or the redemption of shares. The Series’ performance is historical and may not be indicative of future results. The performance returns shown are inclusive of the net expense ratio of the Series. For the year ended December 31, 2015, this net expense ratio was 0.57%. The gross expense ratio, which does not account for any voluntary or contractual waivers currently in effect, was 0.57% for the year ended December 31, 2015.
4The Bank of America (BofA) Merrill Lynch 1-12 Year Municipal Bond Index is a subset of the BofA Merrill Lynch U.S. Municipal Securities Index, an unmanaged, market-weighted index comprised of investment-grade, fixed rate, coupon bearing municipal bonds. The Index includes securities with maturities greater than one year but less than twelve years. The Index returns assume reinvestment of coupons and do not reflect any fees or expenses. Index returns provided by Interactive Data.
3
Diversified Tax Exempt Series
Shareholder Expense Example
(unaudited)
As a shareholder of the Series, you incur ongoing costs, including management fees, shareholder service fees and other Series expenses. This example is intended to help you understand your ongoing costs (in dollars) of investing in the Series and to compare these costs with the ongoing costs of investing in other mutual funds.
The example is based on an investment of $1,000 invested at the beginning of the period and held for the entire period (July 1, 2015 to December 31, 2015).
Actual Expenses
The first line of the table below provides information about actual account values and actual expenses. You may use the information in this line, together with the amount you invested, to estimate the expenses that you paid over the period. Simply divide your account value by $1,000 (for example, an $8,600 account value divided by $1,000 = 8.6), then multiply the result by the number in the first line under the heading entitled “Expenses Paid During Period” to estimate the expenses you paid on your account during this period.
Hypothetical Example for Comparison Purposes
The second line of the table below provides information about hypothetical account values and hypothetical expenses based on the Series’ actual expense ratio and an assumed rate of return of 5% per year before expenses, which is not the Series’ actual return. The hypothetical account values and expenses may not be used to estimate the actual ending account balance or expenses you paid during the period. You may use this information to compare the ongoing costs of investing in the Series and other funds. To do so, compare this 5% hypothetical example with the 5% hypothetical examples that appear in the shareholder reports of the other funds.
Please note that the expenses shown in the table are meant to highlight your ongoing costs only and do not reflect any transaction costs, such as sales charges (loads), redemptions fees, or exchange fees that you may incur in other mutual funds. Therefore, the second line of the table is useful in comparing ongoing costs only, and will not help you determine the relative total costs of owning different funds.
| BEGINNING ACCOUNT VALUE 7/1/15 | ENDING ACCOUNT VALUE 12/31/15 | EXPENSES PAID DURING PERIOD* 7/1/15-12/31/15 | ||||
Actual | $1,000.00 | $1,013.20 | $2.89 | |||
Hypothetical | ||||||
(5% return before expenses) | $1,000.00 | $1,022.33 | $2.91 |
*Expenses are equal to the Series’ annualized expense ratio (for the six-month period) of 0.57%, multiplied by the average account value over the period, multiplied by 184/365 (to reflect the one-half year period). Expenses are based on the most recent fiscal half year; therefore, the expense ratio stated above may differ from the expense ratio stated in the financial highlights, which is based on one-year data.
4
Diversified Tax Exempt Series
Portfolio Composition as of December 31, 2015
(unaudited)
Top Ten States2 |
| |||||||||||
Florida | 8.1 | % | Texas | 5.4 | % | |||||||
New York | 8.0 | % | North Carolina | 4.1 | % | |||||||
Pennsylvania | 7.0 | % | Illinois | 3.8 | % | |||||||
Ohio | 6.0 | % | Nebraska | 3.6 | % | |||||||
Washington | 5.9 | % | Kansas | 3.6 | % | |||||||
| 2As a percentage of total investments. | ||||||||||||
5
Diversified Tax Exempt Series
Investment Portfolio - December 31, 2015
| COUPON RATE | MATURITY DATE | CREDIT RATING1 | PRINCIPAL AMOUNT | VALUE (NOTE 2) | ||||||||||||||||
MUNICIPAL BONDS - 96.2% | ||||||||||||||||||||
ALASKA - 0.2% | ||||||||||||||||||||
Alaska Municipal Bond Bank Authority, Series 2, Revenue Bond | 5.000% | 9/1/2022 | Aa2 | $ | 500,000 | $ | 592,335 | |||||||||||||
|
| |||||||||||||||||||
ARIZONA - 3.4% | ||||||||||||||||||||
Arizona Health Facilities Authority, Banner Health, Prerefunded Balance, Series A, Revenue Bond | 5.000% | 1/1/2019 | AA2 | 795,000 | 829,575 | |||||||||||||||
Mesa, Multiple Utility Impt., Revenue Bond | 5.000% | 7/1/2023 | Aa2 | 1,050,000 | 1,282,711 | |||||||||||||||
Mesa, Multiple Utility Impt., Revenue Bond | 5.000% | 7/1/2024 | Aa2 | 1,200,000 | 1,485,420 | |||||||||||||||
Pima County Sewer System, Series A, Revenue Bond | 5.000% | 7/1/2019 | AA2 | 1,000,000 | 1,129,860 | |||||||||||||||
Pima County Sewer System, Series B, Revenue Bond | 5.000% | 7/1/2020 | AA2 | 1,400,000 | 1,622,054 | |||||||||||||||
Salt River Project Agricultural Impt. & Power District, Series A, Revenue Bond | 5.000% | 12/1/2018 | Aa1 | 1,340,000 | 1,491,621 | |||||||||||||||
Salt River Project Agricultural Impt. & Power District, Series B, Revenue Bond | 4.000% | 1/1/2018 | Aa1 | 1,715,000 | 1,820,490 | |||||||||||||||
Salt River Project Agricultural Impt. & Power District, Series B, Revenue Bond | 5.000% | 12/1/2020 | Aa1 | 400,000 | 468,996 | |||||||||||||||
Tucson Water System, Series A, Revenue Bond | 5.000% | 7/1/2018 | Aa2 | 1,400,000 | 1,538,292 | |||||||||||||||
Yavapai County Industrial Development Authority, Northern Arizona Healthcare System, Revenue Bond | 5.000% | 10/1/2020 | AA2 | 460,000 | 530,739 | |||||||||||||||
|
| |||||||||||||||||||
| 12,199,758 | ||||||||||||||||||||
|
| |||||||||||||||||||
COLORADO - 2.1% | ||||||||||||||||||||
Boulder Water & Sewer, Revenue Bond | 5.000% | 12/1/2019 | Aa1 | 1,500,000 | 1,716,900 | |||||||||||||||
Colorado Springs Utilities System, Series C-1, Revenue Bond | 5.000% | 11/15/2019 | Aa2 | 2,435,000 | 2,785,056 | |||||||||||||||
Denver Wastewater Management Division Department of Public Works, Revenue Bond | 4.000% | 11/1/2020 | Aa2 | 1,500,000 | 1,692,720 | |||||||||||||||
Platte River Power Authority, Series GG, Revenue Bond, AGM | 5.000% | 6/1/2018 | Aa2 | 1,210,000 | 1,325,567 | |||||||||||||||
|
| |||||||||||||||||||
| 7,520,243 | ||||||||||||||||||||
|
| |||||||||||||||||||
CONNECTICUT - 0.1% | ||||||||||||||||||||
Connecticut Municipal Electric Energy Cooperative, Series A, Revenue Bond | 4.000% | 1/1/2017 | Aa3 | 420,000 | 434,003 | |||||||||||||||
|
| |||||||||||||||||||
DELAWARE - 0.6% | ||||||||||||||||||||
Delaware River & Bay Authority, Series C, Revenue Bond | 5.000% | 1/1/2019 | A1 | 2,000,000 | 2,220,160 | |||||||||||||||
|
| |||||||||||||||||||
The accompanying notes are an integral part of the financial statements.
6
Diversified Tax Exempt Series
Investment Portfolio - December 31, 2015
| COUPON RATE | MATURITY DATE | CREDIT RATING1 | PRINCIPAL AMOUNT | VALUE (NOTE 2) | ||||||||||||||||
MUNICIPAL BONDS (continued) | ||||||||||||||||||||
DISTRICT OF COLUMBIA - 0.3% | ||||||||||||||||||||
District of Columbia Water & Sewer Authority, Series C, Revenue Bond | 5.000% | 10/1/2022 | Aa3 | $ | 1,000,000 | $ | 1,212,600 | |||||||||||||
|
| |||||||||||||||||||
FLORIDA - 8.0% | ||||||||||||||||||||
Cape Coral, Water Utility Impt., Special Assessment, NATL | 4.500% | 7/1/2021 | A2 | 1,755,000 | 1,812,933 | |||||||||||||||
Daytona Beach Utility System, Water Utility Impt., Revenue Bond, AGM | 5.000% | 11/1/2019 | A1 | 1,010,000 | 1,144,532 | |||||||||||||||
Florida Municipal Power Agency, St. Lucie Project, Series A, Revenue Bond | 5.000% | 10/1/2018 | A2 | 1,065,000 | 1,172,150 | |||||||||||||||
Florida Municipal Power Agency, Stanton II Project, Swap Termination, Series A, Revenue Bond | 4.000% | 10/1/2017 | A1 | 635,000 | 668,750 | |||||||||||||||
Florida’s Turnpike Enterprise, Series A, Revenue Bond | 5.000% | 7/1/2017 | Aa3 | 1,000,000 | 1,062,960 | |||||||||||||||
Florida’s Turnpike Enterprise, Series C, Revenue Bond | 5.000% | 7/1/2019 | Aa3 | 920,000 | 1,040,492 | |||||||||||||||
Fort Lauderdale, Water & Sewer, Revenue Bond | 5.000% | 9/1/2020 | Aa1 | 1,545,000 | 1,802,721 | |||||||||||||||
Fort Myers Utility System, Utility Impt., Revenue Bond | 5.000% | 10/1/2019 | Aa3 | 785,000 | 892,647 | |||||||||||||||
JEA Electric System, Series B, Revenue Bond | 5.000% | 10/1/2019 | Aa3 | 2,000,000 | 2,274,260 | |||||||||||||||
JEA Electric System, Swap Termination, Series B, Revenue Bond | 5.000% | 10/1/2019 | Aa3 | 1,500,000 | 1,705,695 | |||||||||||||||
Miami-Dade County Expressway Authority, Swap Termination, Series A, Revenue Bond, AGM | 4.000% | 7/1/2018 | A2 | 1,000,000 | 1,067,480 | |||||||||||||||
Miami-Dade County, Transit System Sales Surtax, Transit Impt., Series A, Revenue Bond, AGC | 4.000% | 7/1/2017 | A1 | 1,465,000 | 1,534,309 | |||||||||||||||
Miami-Dade County, Water & Sewer System, Revenue Bond | 5.000% | 10/1/2023 | Aa3 | 2,000,000 | 2,441,960 | |||||||||||||||
Miami-Dade County, Water & Sewer System, Series B, Revenue Bond, AGM | 5.250% | 10/1/2019 | Aa3 | 500,000 | 573,130 | |||||||||||||||
Okaloosa County, Water & Sewer, Revenue Bond | 5.000% | 7/1/2023 | Aa3 | 2,065,000 | 2,488,139 | |||||||||||||||
Orlando Utilities Commission, Series A, Revenue Bond | 4.000% | 10/1/2017 | Aa2 | 400,000 | 422,088 | |||||||||||||||
Orlando-Orange County Expressway Authority, Revenue Bond | 5.000% | 7/1/2018 | A2 | 675,000 | 740,266 | |||||||||||||||
Orlando-Orange County Expressway Authority, Revenue Bond | 5.000% | 7/1/2019 | A2 | 500,000 | 564,380 | |||||||||||||||
Orlando-Orange County Expressway Authority, Swap Termination, Series B, Revenue Bond | 5.000% | 7/1/2020 | A2 | 1,165,000 | 1,345,645 | |||||||||||||||
Port St. Lucie Utility System, Revenue Bond, AGC | 5.000% | 9/1/2017 | A1 | 1,730,000 | 1,845,841 | |||||||||||||||
Port St. Lucie Utility System, Revenue Bond, AGC | 5.000% | 9/1/2018 | A1 | 400,000 | 440,204 | |||||||||||||||
Port St. Lucie Utility System, Water Utility Impt., Revenue Bond, NATL | 5.250% | 9/1/2023 | A1 | 500,000 | 600,905 | |||||||||||||||
The accompanying notes are an integral part of the financial statements.
7
Diversified Tax Exempt Series
Investment Portfolio - December 31, 2015
| COUPON RATE | MATURITY DATE | CREDIT RATING1 | PRINCIPAL AMOUNT | VALUE (NOTE 2) | ||||||||||||||||
MUNICIPAL BONDS (continued) | ||||||||||||||||||||
FLORIDA (continued) | ||||||||||||||||||||
South Miami Health Facilities Authority, Baptist Health South Florida Group, Revenue Bond | 5.000% | 8/15/2018 | Aa2 | $ | 500,000 | $ | 533,565 | |||||||||||||
Tampa, BayCare Health System, Revenue Bond | 5.000% | 11/15/2018 | Aa2 | 500,000 | 554,415 | |||||||||||||||
|
| |||||||||||||||||||
| 28,729,467 | ||||||||||||||||||||
|
| |||||||||||||||||||
GEORGIA - 3.3% | ||||||||||||||||||||
Atlanta, Water & Wastewater, Series B, Revenue Bond | 5.000% | 11/1/2017 | Aa3 | 1,000,000 | 1,075,760 | |||||||||||||||
Atlanta, Water & Wastewater, Series B, Revenue Bond | 5.000% | 11/1/2019 | Aa3 | 1,160,000 | 1,323,061 | |||||||||||||||
DeKalb County, Water & Sewerage, Revenue Bond | 5.000% | 10/1/2019 | Aa3 | 500,000 | 567,285 | |||||||||||||||
DeKalb County, Water & Sewerage, Series A, Revenue Bond | 5.000% | 10/1/2018 | Aa3 | 1,585,000 | 1,749,903 | |||||||||||||||
Fulton County Water & Sewerage, Revenue Bond | 5.000% | 1/1/2017 | Aa3 | 1,000,000 | 1,043,600 | |||||||||||||||
Fulton County Water & Sewerage, Revenue Bond | 5.000% | 1/1/2019 | Aa3 | 1,200,000 | 1,336,224 | |||||||||||||||
Municipal Electric Authority of Georgia, Series A, Revenue Bond | 5.250% | 1/1/2019 | A2 | 2,250,000 | 2,519,145 | |||||||||||||||
Municipal Electric Authority of Georgia, Series A, Revenue Bond | 5.250% | 1/1/2019 | A2 | 500,000 | 559,810 | |||||||||||||||
Municipal Electric Authority of Georgia, Series A, Revenue Bond | 5.000% | 11/1/2019 | A1 | 485,000 | 552,202 | |||||||||||||||
Municipal Electric Authority of Georgia, Series A, Revenue Bond | 5.000% | 11/1/2020 | A1 | 1,000,000 | 1,163,740 | |||||||||||||||
|
| |||||||||||||||||||
| 11,890,730 | ||||||||||||||||||||
|
| |||||||||||||||||||
HAWAII - 0.9% | ||||||||||||||||||||
Honolulu County Wastewater System, Sewer Impt., Series A, Revenue Bond | 5.000% | 7/1/2020 | Aa3 | 1,000,000 | 1,129,140 | |||||||||||||||
Honolulu County Wastewater System, Sewer Impt., Series A, Revenue Bond | 5.000% | 7/1/2023 | Aa3 | 1,750,000 | 2,127,615 | |||||||||||||||
|
| |||||||||||||||||||
| 3,256,755 | ||||||||||||||||||||
|
| |||||||||||||||||||
ILLINOIS - 3.7% | ||||||||||||||||||||
Aurora, Waterworks & Sewerage, Series B, Revenue Bond | 3.000% | 12/1/2022 | AA2 | 500,000 | 530,670 | |||||||||||||||
Aurora, Waterworks & Sewerage, Series B, Revenue Bond | 3.000% | 12/1/2023 | AA2 | 625,000 | 659,738 | |||||||||||||||
Central Lake County Joint Action Water Agency, Revenue Bond | 4.000% | 5/1/2018 | Aa2 | 750,000 | 801,038 | |||||||||||||||
Central Lake County Joint Action Water Agency, Revenue Bond | 4.000% | 5/1/2019 | Aa2 | 760,000 | 828,195 | |||||||||||||||
The accompanying notes are an integral part of the financial statements.
8
Diversified Tax Exempt Series
Investment Portfolio - December 31, 2015
| COUPON RATE | MATURITY DATE | CREDIT RATING1 | PRINCIPAL AMOUNT | VALUE (NOTE 2) | ||||||||||||||||
MUNICIPAL BONDS (continued) | ||||||||||||||||||||
ILLINOIS (continued) | ||||||||||||||||||||
Central Lake County Joint Action Water Agency, Series A, Revenue Bond | 2.000% | 5/1/2017 | Aa2 | $ | 575,000 | $ | 583,412 | |||||||||||||
Chicago Wastewater Transmission Revenue, Second Lien, Series C, Revenue Bond | 5.000% | 1/1/2019 | A2 | 500,000 | 541,945 | |||||||||||||||
Chicago Waterworks, Water Utility Impt., Revenue Bond | 3.000% | 11/1/2016 | Baa2 | 875,000 | 886,664 | |||||||||||||||
Chicago Waterworks, Water Utility Impt., Revenue Bond | 5.000% | 11/1/2017 | Baa2 | 600,000 | 633,672 | |||||||||||||||
Du Page & Will Counties Community School District No. 204 Indian Prairie, Series A, G.O. Bond | 5.000% | 12/30/2018 | Aa1 | 820,000 | 909,774 | |||||||||||||||
Illinois Municipal Electric Agency, Series A, Revenue Bond | 5.000% | 2/1/2018 | A1 | 500,000 | 539,755 | |||||||||||||||
Illinois Municipal Electric Agency, Series A, Revenue Bond | 5.000% | 2/1/2025 | A1 | 2,000,000 | 2,414,960 | |||||||||||||||
Illinois State Toll Highway Authority, Series A, Revenue Bond | 5.000% | 12/1/2019 | Aa3 | 1,000,000 | 1,136,850 | |||||||||||||||
Illinois State, Public Impt., G.O. Bond | 4.000% | 7/1/2016 | Baa1 | 2,000,000 | 2,030,060 | |||||||||||||||
Sangamon & Morgan Counties Community Unit School District No. 16 New Berlin, School Impt., G.O. Bond, NATL | 5.500% | 2/1/2019 | A3 | 725,000 | 813,443 | |||||||||||||||
|
| |||||||||||||||||||
| 13,310,176 | ||||||||||||||||||||
|
| |||||||||||||||||||
INDIANA - 2.2% | ||||||||||||||||||||
Avon Community School Building Corp., Revenue Bond, AMBAC | 4.250% | 7/15/2018 | AA2 | 1,450,000 | 1,519,571 | |||||||||||||||
Fort Wayne Waterworks, Water Utility Impt., Revenue Bond | 2.000% | 12/1/2020 | Aa3 | 745,000 | 762,999 | |||||||||||||||
Indiana Finance Authority, Beacon Health System, Series A, Revenue Bond | 5.000% | 8/15/2017 | AA2 | 500,000 | 533,400 | |||||||||||||||
Indiana Municipal Power Agency, Series A, Revenue Bond | 5.000% | 1/1/2019 | A1 | 2,540,000 | 2,818,816 | |||||||||||||||
Indiana Municipal Power Agency, Series A, Revenue Bond | 4.000% | 1/1/2020 | A1 | 750,000 | 824,985 | |||||||||||||||
Lafayette, Sewage Works, Revenue Bond | 4.000% | 7/1/2017 | AA2 | 500,000 | 523,655 | |||||||||||||||
Lafayette, Sewage Works, Sewer Impt., Revenue Bond | 3.000% | 1/1/2017 | AA2 | 470,000 | 481,040 | |||||||||||||||
Lafayette, Sewage Works, Sewer Impt., Revenue Bond | 3.000% | 7/1/2018 | AA2 | 475,000 | 497,315 | |||||||||||||||
|
| |||||||||||||||||||
| 7,961,781 | ||||||||||||||||||||
|
| |||||||||||||||||||
IOWA - 0.7% | ||||||||||||||||||||
Cedar Falls, Electric Utility, Revenue Bond | 5.000% | 12/1/2023 | Aa2 | 2,000,000 | 2,440,640 | |||||||||||||||
The accompanying notes are an integral part of the financial statements.
9
Diversified Tax Exempt Series
Investment Portfolio - December 31, 2015
| COUPON RATE | MATURITY DATE | CREDIT RATING1 | PRINCIPAL AMOUNT | VALUE (NOTE 2) | ||||||||||||||||
MUNICIPAL BONDS (continued) | ||||||||||||||||||||
KANSAS - 3.5% | ||||||||||||||||||||
Kansas Development Finance Authority, Series D, Revenue Bond | 5.000% | 11/15/2020 | Aa2 | $ | 500,000 | $ | 571,800 | |||||||||||||
Kansas Turnpike Authority, Series A, Revenue Bond | 5.000% | 9/1/2019 | AA2 | 2,965,000 | 3,360,264 | |||||||||||||||
Topeka Combined Utility, Series A, Revenue Bond | 4.000% | 8/1/2019 | Aa3 | 845,000 | 922,334 | |||||||||||||||
Wichita, Water & Sewer Utility, Series A, Revenue Bond | 5.000% | 10/1/2017 | AA2 | 2,000,000 | 2,143,660 | |||||||||||||||
Wichita, Water & Sewer Utility, Series A, Revenue Bond | 5.000% | 10/1/2018 | AA2 | 1,000,000 | 1,106,190 | |||||||||||||||
Wichita, Water & Sewer Utility, Series B, Revenue Bond | 5.000% | 10/1/2019 | AA2 | 2,000,000 | 2,269,940 | |||||||||||||||
Wyandotte County-Kansas City Unified Government Utility System, Water Utility Impt., Series A, Revenue Bond | 4.000% | 9/1/2018 | A3 | 450,000 | 482,589 | |||||||||||||||
Wyandotte County-Kansas City Unified Government Utility System, Water Utility Impt., Series A, Revenue Bond | 5.000% | 9/1/2020 | A3 | 1,495,000 | 1,727,263 | |||||||||||||||
|
| |||||||||||||||||||
| 12,584,040 | ||||||||||||||||||||
|
| |||||||||||||||||||
KENTUCKY - 0.2% | ||||||||||||||||||||
Kentucky Turnpike Authority, Series A, Revenue Bond | 5.000% | 7/1/2019 | Aa2 | 500,000 | 563,465 | |||||||||||||||
|
| |||||||||||||||||||
LOUISIANA - 1.6% | ||||||||||||||||||||
City of New Orleans LA Sewerage Service Revenue | 5.000% | 6/1/2021 | A2 | 600,000 | 698,328 | |||||||||||||||
Lafayette Utilities, Sewer Impt., Revenue Bond | 4.000% | 11/1/2018 | A1 | 1,135,000 | 1,223,893 | |||||||||||||||
Lafayette Utilities, Water & Sewer Impt., Revenue Bond | 5.000% | 11/1/2019 | A1 | 990,000 | 1,124,779 | |||||||||||||||
New Orleans, Water Utility Impt., Revenue Bond | 5.000% | 12/1/2020 | A2 | 1,700,000 | 1,952,535 | |||||||||||||||
St. Charles Parish Waterworks & Wastewater District No. 1, Revenue Bond | 2.000% | 7/1/2017 | A2 | 750,000 | 761,363 | |||||||||||||||
|
| |||||||||||||||||||
| 5,760,898 | ||||||||||||||||||||
|
| |||||||||||||||||||
MAINE - 0.6% | ||||||||||||||||||||
Maine Municipal Bond Bank, Various Purposes Impt., Series E, Revenue Bond | 4.000% | 11/1/2021 | Aa2 | 570,000 | 645,143 | |||||||||||||||
Maine Turnpike Authority, Revenue Bond | 5.000% | 7/1/2017 | Aa3 | 1,500,000 | 1,594,440 | |||||||||||||||
|
| |||||||||||||||||||
| 2,239,583 | ||||||||||||||||||||
|
| |||||||||||||||||||
MARYLAND - 0.6% | ||||||||||||||||||||
Baltimore, Water Utility Impt., Series A, Revenue Bond | 4.000% | 7/1/2018 | Aa3 | 500,000 | 536,175 | |||||||||||||||
The accompanying notes are an integral part of the financial statements.
10
Diversified Tax Exempt Series
Investment Portfolio - December 31, 2015
| COUPON RATE | MATURITY DATE | CREDIT RATING1 | PRINCIPAL AMOUNT | VALUE (NOTE 2) | ||||||||||||||||
MUNICIPAL BONDS (continued) | ||||||||||||||||||||
MARYLAND (continued) | ||||||||||||||||||||
Maryland Health & Higher Educational Facilities Authority, Revenue Bond | 5.000% | 7/1/2019 | A2 | $ | 500,000 | $ | 557,460 | |||||||||||||
Maryland State, Public Impt., Series A, G.O. Bond | 5.250% | 3/1/2017 | Aaa | 1,000,000 | 1,053,950 | |||||||||||||||
|
| |||||||||||||||||||
| 2,147,585 | ||||||||||||||||||||
|
| |||||||||||||||||||
MASSACHUSETTS - 2.3% | ||||||||||||||||||||
Commonwealth of Massachusetts, Public Impt., Series D-2, G.O. Bond3 | 0.310% | 8/1/2043 | Aa1 | 1,225,000 | 1,223,971 | |||||||||||||||
Commonwealth of Massachusetts, Series C, G.O.Bond | 3.625% | 10/1/2040 | Aa1 | 3,000,000 | 3,020,760 | |||||||||||||||
Lynn Water & Sewer Commission, Revenue Bond | 5.000% | 6/1/2017 | A1 | 1,500,000 | 1,589,505 | |||||||||||||||
Massachusetts Health & Educational Facilities Authority, Series G, Revenue Bond | 5.000% | 7/1/2018 | Aa3 | 600,000 | 637,632 | |||||||||||||||
Massachusetts Municipal Wholesale Electric Co., Project No. 3, Revenue Bond | 5.000% | 7/1/2016 | A3 | 1,000,000 | 1,023,260 | |||||||||||||||
Massachusetts Municipal Wholesale Electric Co., Project No. 6, Revenue Bond | 5.000% | 7/1/2017 | A3 | 590,000 | 626,875 | |||||||||||||||
|
| |||||||||||||||||||
| 8,122,003 | ||||||||||||||||||||
|
| |||||||||||||||||||
MICHIGAN - 1.3% | ||||||||||||||||||||
Ann Arbor Sewage Disposal System, Revenue Bond | 3.000% | 7/1/2020 | AA2 | 1,000,000 | 1,077,490 | |||||||||||||||
Bay City School District, G.O. Bond | 3.000% | 11/1/2016 | AA2 | 500,000 | 509,600 | |||||||||||||||
Emmet County, Public Impt., G.O. Bond | 2.250% | 5/1/2018 | Aa3 | 910,000 | 932,068 | |||||||||||||||
Grand Rapids, Water Supply System, Revenue Bond | 5.000% | 1/1/2018 | Aa2 | 550,000 | 594,137 | |||||||||||||||
Walled Lake Consolidated School District, G.O. Bond | 5.000% | 5/1/2019 | Aa1 | 1,000,000 | 1,117,410 | |||||||||||||||
West Ottawa Public Schools, Series I, G.O. Bond | 5.000% | 5/1/2019 | Aa2 | 400,000 | 446,964 | |||||||||||||||
|
| |||||||||||||||||||
| 4,677,669 | ||||||||||||||||||||
|
| |||||||||||||||||||
MINNESOTA - 0.8% | ||||||||||||||||||||
Minnesota Agricultural & Economic Development | ||||||||||||||||||||
Board, Series C-1, Revenue Bond, AGC | 5.000% | 2/15/2016 | AA2 | 540,000 | 542,862 | |||||||||||||||
Minnesota Municipal Power Agency, Series A, Revenue Bond | 5.000% | 10/1/2018 | A2 | 2,130,000 | 2,347,942 | |||||||||||||||
Western Minnesota Municipal Power Agency, Prerefunded Balance, Revenue Bond | 6.625% | 1/1/2016 | Aaa | 35,000 | 35,000 | |||||||||||||||
|
| |||||||||||||||||||
| 2,925,804 | ||||||||||||||||||||
|
| |||||||||||||||||||
The accompanying notes are an integral part of the financial statements.
11
Diversified Tax Exempt Series
Investment Portfolio - December 31, 2015
| COUPON RATE | MATURITY DATE | CREDIT RATING1 | PRINCIPAL AMOUNT | VALUE (NOTE 2) | ||||||||||||||||
MUNICIPAL BONDS (continued) | ||||||||||||||||||||
MISSISSIPPI - 0.2% | ||||||||||||||||||||
Mississippi Hospital Equipment & Facilities Authority, Series 1, Revenue Bond | 5.000% | 10/1/2017 | Aa3 | $ | 750,000 | $ | 801,360 | |||||||||||||
|
| |||||||||||||||||||
MISSOURI - 2.4% | ||||||||||||||||||||
Kansas City, Sanitary Sewer System, Revenue Bond | 4.000% | 1/1/2017 | Aa2 | 2,155,000 | 2,227,731 | |||||||||||||||
Kansas City, Sanitary Sewer System, Series A, Revenue Bond | 2.000% | 1/1/2018 | Aa2 | 2,425,000 | 2,476,289 | |||||||||||||||
Missouri Housing Development Commission, Series A, Revenue Bond | 1.600% | 11/1/2019 | AA2 | 295,000 | 297,649 | |||||||||||||||
Missouri Joint Municipal Electric Utility Commission, Prerefunded Balance, Series A, Revenue Bond, AMBAC | 5.000% | 1/1/2021 | A2 | 1,535,000 | 1,602,233 | |||||||||||||||
Missouri Joint Municipal Electric Utility Commission, Revenue Bond | 5.000% | 1/1/2018 | A3 | 500,000 | 538,780 | |||||||||||||||
Missouri Joint Municipal Electric Utility Commission, Series A, Revenue Bond | 4.000% | 1/1/2018 | A2 | 750,000 | 794,445 | |||||||||||||||
Missouri State Health & Educational Facilities Authority, Revenue Bond | 5.000% | 1/1/2020 | Aa2 | 725,000 | 830,147 | |||||||||||||||
|
| |||||||||||||||||||
| 8,767,274 | ||||||||||||||||||||
|
| |||||||||||||||||||
NEBRASKA - 3.6% | ||||||||||||||||||||
Lincoln Electric System, Revenue Bond | 5.000% | 9/1/2021 | AA2 | 2,000,000 | 2,379,660 | |||||||||||||||
Municipal Energy Agency of Nebraska, Series A, Revenue Bond | 5.000% | 4/1/2018 | A2 | 630,000 | 684,155 | |||||||||||||||
Municipal Energy Agency of Nebraska, Series A, Revenue Bond | 5.000% | 4/1/2018 | A2 | 500,000 | 542,980 | |||||||||||||||
Nebraska Public Power District, Prerefunded Balance, Series B, Revenue Bond | 5.000% | 1/1/2019 | A1 | 600,000 | 648,654 | |||||||||||||||
Nebraska Public Power District, Revenue Bond | 5.000% | 1/1/2019 | A1 | 1,000,000 | 1,112,580 | |||||||||||||||
Nebraska Public Power District, Series A, Revenue Bond | 5.000% | 1/1/2019 | A1 | 500,000 | 556,290 | |||||||||||||||
Nebraska Public Power District, Series B, Revenue Bond | 5.000% | 1/1/2020 | A1 | 1,000,000 | 1,142,080 | |||||||||||||||
Nebraska Public Power District, Series C, Revenue Bond | 5.000% | 1/1/2018 | A1 | 2,160,000 | 2,333,340 | |||||||||||||||
Omaha Public Power District, Series A, Revenue Bond | 4.000% | 2/1/2018 | A1 | 1,120,000 | 1,189,126 | |||||||||||||||
Omaha Public Power District, Series C, Revenue Bond | 5.000% | 2/1/2018 | Aa2 | 675,000 | 731,545 | |||||||||||||||
Omaha Public Power District, Series C, Revenue Bond | 5.000% | 2/1/2019 | Aa2 | 1,265,000 | 1,412,170 | |||||||||||||||
|
| |||||||||||||||||||
| 12,732,580 | ||||||||||||||||||||
|
| |||||||||||||||||||
The accompanying notes are an integral part of the financial statements.
12
Diversified Tax Exempt Series
Investment Portfolio - December 31, 2015
| COUPON RATE | MATURITY DATE | CREDIT RATING1 | PRINCIPAL AMOUNT | VALUE (NOTE 2) | ||||||||||||||||
MUNICIPAL BONDS (continued) | ||||||||||||||||||||
NEW HAMPSHIRE - 0.8% | ||||||||||||||||||||
New Hampshire State Turnpike System, Series B, Revenue Bond | 5.000% | 2/1/2020 | A1 | $ | 2,575,000 | $ | 2,945,826 | |||||||||||||
|
| |||||||||||||||||||
NEW JERSEY - 1.5% | ||||||||||||||||||||
Hudson County, G.O. Bond | 2.000% | 12/1/2017 | AA2 | 1,000,000 | 1,020,430 | |||||||||||||||
New Jersey Health Care Facilities Financing Authority, Kennedy Health System, Revenue Bond | 2.000% | 7/1/2018 | A3 | 455,000 | 463,372 | |||||||||||||||
New Jersey State Turnpike Authority, Series A, Revenue Bond | 3.000% | 1/1/2016 | A3 | 1,100,000 | 1,100,000 | |||||||||||||||
New Jersey State Turnpike Authority, Series B, Revenue Bond | 5.000% | 1/1/2019 | A3 | 1,625,000 | 1,803,376 | |||||||||||||||
New Jersey State Turnpike Authority, Series H, Revenue Bond | 5.000% | 1/1/2020 | A3 | 915,000 | 1,014,296 | |||||||||||||||
|
| |||||||||||||||||||
| 5,401,474 | ||||||||||||||||||||
|
| |||||||||||||||||||
NEW MEXICO - 1.4% | ||||||||||||||||||||
Albuquerque Bernalillo County Water Utility Authority, | ||||||||||||||||||||
Water Utility Impt., Revenue Bond | 5.000% | 7/1/2022 | Aa2 | 1,250,000 | 1,512,688 | |||||||||||||||
Albuquerque Bernalillo County Water Utility Authority, Water Utility Impt., Revenue Bond | 5.000% | 7/1/2023 | Aa2 | 2,000,000 | 2,451,920 | |||||||||||||||
Las Cruces, Multiple Utility Impt., Revenue Bond | 2.000% | 6/1/2018 | Aa2 | 875,000 | 896,683 | |||||||||||||||
|
| |||||||||||||||||||
| 4,861,291 | ||||||||||||||||||||
|
| |||||||||||||||||||
NEW YORK - 7.9% | ||||||||||||||||||||
Metropolitan Transportation Authority, Series D-1, Revenue Bond | 5.000% | 11/15/2024 | A1 | 1,385,000 | 1,715,198 | |||||||||||||||
Metropolitan Transportation Authority, Series F, Revenue Bond | 5.000% | 11/15/2017 | A1 | 1,145,000 | 1,233,841 | |||||||||||||||
Metropolitan Transportation Authority, Series F, Revenue Bond | 5.000% | 11/15/2018 | A1 | 725,000 | 805,649 | |||||||||||||||
Metropolitan Transportation Authority, Series F, Revenue Bond | 5.000% | 11/15/2019 | A1 | 1,315,000 | 1,502,427 | |||||||||||||||
Metropolitan Transportation Authority, Transit Impt., Subseries D-2, Revenue Bond3 | 0.370% | 11/15/2044 | A1 | 1,600,000 | 1,588,384 | |||||||||||||||
Nassau County, Public Impt., Series A, G.O. Bond | 5.000% | 4/1/2019 | A2 | 1,000,000 | 1,116,510 | |||||||||||||||
New York City, Public Impt., Series F-1, G.O. Bond | 5.000% | 6/1/2024 | Aa2 | 2,880,000 | 3,559,795 | |||||||||||||||
New York City, Series 1, G.O. Bond | 5.000% | 8/1/2023 | Aa2 | 2,000,000 | 2,450,840 | |||||||||||||||
New York City, Series A, G.O. Bond | 5.000% | 8/1/2023 | Aa2 | 2,000,000 | 2,450,840 | |||||||||||||||
New York State Dormitory Authority, Series 1, Revenue Bond | 4.000% | 7/1/2020 | Aa3 | 420,000 | 468,926 | |||||||||||||||
The accompanying notes are an integral part of the financial statements.
13
Diversified Tax Exempt Series
Investment Portfolio - December 31, 2015
| COUPON RATE | MATURITY DATE | CREDIT RATING1 | PRINCIPAL AMOUNT | VALUE (NOTE 2) | ||||||||||||||||
MUNICIPAL BONDS (continued) | ||||||||||||||||||||
NEW YORK (continued) | ||||||||||||||||||||
New York State Thruway Authority Highway & Bridge Trust Fund, Highway Impt., Series B, Revenue Bond | 5.000% | 4/1/2019 | AA2 | $ | 2,135,000 | $ | 2,361,417 | |||||||||||||
New York State Thruway Authority, Highway Impt., Series H, Revenue Bond, NATL | 5.000% | 1/1/2017 | A2 | 600,000 | 625,848 | |||||||||||||||
New York State Thruway Authority, Highway Impt., Series I, Revenue Bond | 4.000% | 1/1/2019 | A2 | 1,000,000 | 1,078,880 | |||||||||||||||
New York State Urban Development Corp., Highway Impt., Series C, Revenue Bond | 5.000% | 3/15/2024 | Aa1 | 765,000 | 941,202 | |||||||||||||||
Triborough Bridge & Tunnel Authority, Highway Impt., Series A, Revenue Bond | 4.000% | 11/15/2018 | Aa3 | 500,000 | 542,250 | |||||||||||||||
Triborough Bridge & Tunnel Authority, Series B, Revenue Bond | 5.000% | 11/15/2017 | Aa3 | 575,000 | 619,056 | |||||||||||||||
Triborough Bridge & Tunnel Authority, Series B, Revenue Bond | 4.000% | 11/15/2019 | Aa3 | 725,000 | 803,902 | |||||||||||||||
Triborough Bridge & Tunnel Authority, Series B, Revenue Bond | 5.000% | 11/15/2020 | Aa3 | 920,000 | 1,078,534 | |||||||||||||||
Triborough Bridge & Tunnel Authority, Subseries A, Revenue Bond | 5.000% | 11/15/2023 | A1 | 2,805,000 | 3,434,302 | |||||||||||||||
|
| |||||||||||||||||||
| 28,377,801 | ||||||||||||||||||||
|
| |||||||||||||||||||
NORTH CAROLINA - 4.1% | ||||||||||||||||||||
Cape Fear Public Utility Authority, Sewer Impt., Revenue Bond | 5.000% | 8/1/2019 | Aa2 | 1,240,000 | 1,361,718 | |||||||||||||||
Charlotte, Water & Sewer System, Revenue Bond | 5.000% | 12/1/2020 | Aaa | 1,400,000 | 1,649,578 | |||||||||||||||
The Charlotte-Mecklenburg Hospital Authority, Series A, Revenue Bond | 5.000% | 1/15/2017 | Aa3 | 415,000 | 433,829 | |||||||||||||||
The Charlotte-Mecklenburg Hospital Authority, Series A, Revenue Bond | 3.000% | 1/15/2018 | Aa3 | 500,000 | 520,275 | |||||||||||||||
North Carolina Eastern Municipal Power Agency, Prerefunded Balance, Series A, Revenue Bond, AGC | 5.250% | 1/1/2019 | A3 | 1,265,000 | 1,373,031 | |||||||||||||||
North Carolina Medical Care Commission, Moses Cone Health System, Revenue Bond | 5.000% | 10/1/2020 | AA2 | 580,000 | 667,110 | |||||||||||||||
North Carolina Municipal Power Agency No. 1, Series A, Revenue Bond | 5.000% | 1/1/2020 | A2 | 400,000 | 455,660 | |||||||||||||||
North Carolina Municipal Power Agency No. 1, Series A, Revenue Bond | 5.000% | 1/1/2024 | A2 | 3,000,000 | 3,647,460 | |||||||||||||||
North Carolina Municipal Power Agency No. 1, Unrefunded Balance, Series A, Revenue Bond | 5.250% | 1/1/2017 | A2 | 1,270,000 | 1,328,141 | |||||||||||||||
North Carolina State, Series B, G.O. Bond | 5.000% | 6/1/2017 | Aaa | 3,000,000 | 3,182,670 | |||||||||||||||
|
| |||||||||||||||||||
| 14,619,472 | ||||||||||||||||||||
|
| |||||||||||||||||||
The accompanying notes are an integral part of the financial statements.
14
Diversified Tax Exempt Series
Investment Portfolio - December 31, 2015
| COUPON RATE | MATURITY DATE | CREDIT RATING1 | PRINCIPAL AMOUNT | VALUE (NOTE 2) | ||||||||||||||||
MUNICIPAL BONDS (continued) | ||||||||||||||||||||
NORTH DAKOTA - 0.2% | ||||||||||||||||||||
North Dakota Public Finance Authority, Series A, Revenue Bond | 4.000% | 6/1/2018 | AA2 | $ | 800,000 | $ | 854,344 | |||||||||||||
|
| |||||||||||||||||||
OHIO - 5.9% | ||||||||||||||||||||
American Municipal Power, Inc., Fremont Energy Center Project, Series B, Revenue Bond | 5.000% | 2/15/2018 | A1 | 425,000 | 459,880 | |||||||||||||||
American Municipal Power, Inc., Fremont Energy Center Project, Series B, Revenue Bond | 5.000% | 2/15/2023 | A1 | 1,895,000 | 2,239,454 | |||||||||||||||
American Municipal Power, Inc., Prairie State Energy Campus Project, Unrefunded Balance, Revenue Bond | 5.000% | 2/15/2016 | A1 | 330,000 | 331,927 | |||||||||||||||
American Municipal Power, Inc., Prairie State Energy Campus Project, Unrefunded Balance, Revenue Bond | 5.250% | 2/15/2023 | A1 | 25,000 | 27,155 | |||||||||||||||
Franklin County, Ohio Health Corp., Revenue Bond | 5.000% | 5/15/2018 | Aa2 | 640,000 | 700,262 | |||||||||||||||
Northeast Ohio Regional Sewer District, Sewer Impt., Prerefunded Balance, Revenue Bond, NATL | 5.000% | 11/15/2018 | Aa1 | 1,000,000 | 1,058,420 | |||||||||||||||
Ohio State Turnpike Commission, Series A, Revenue Bond, NATL | 5.500% | 2/15/2018 | Aa3 | 1,000,000 | 1,096,360 | |||||||||||||||
Ohio State Turnpike Commission, Series A, Revenue Bond, NATL | 5.500% | 2/15/2019 | Aa3 | 3,735,000 | 4,237,694 | |||||||||||||||
Ohio State, Highway Impt., Revenue Bond | 4.000% | 12/15/2017 | Aa2 | 1,000,000 | 1,059,730 | |||||||||||||||
Ohio State, School Impt., Series B, G.O. Bond | 5.000% | 6/15/2024 | Aa1 | 4,200,000 | 5,097,834 | |||||||||||||||
Toledo Water System, Revenue Bond | 3.000% | 11/15/2017 | Aa3 | 1,000,000 | 1,038,610 | |||||||||||||||
Toledo Water System, Water Utility Impt., Revenue Bond | 5.000% | 11/15/2018 | Aa3 | 1,175,000 | 1,302,875 | |||||||||||||||
Toledo Water System, Water Utility Impt., Revenue Bond | 5.000% | 11/15/2019 | Aa3 | 1,010,000 | 1,150,663 | |||||||||||||||
Toledo Water System, Water Utility Impt., Series A, Revenue Bond | 5.000% | 11/15/2022 | Aa3 | 610,000 | 717,336 | |||||||||||||||
Toledo, Capital Impt., G.O. Bond | 5.000% | 12/1/2020 | A2 | 610,000 | 702,061 | |||||||||||||||
|
| |||||||||||||||||||
| 21,220,261 | ||||||||||||||||||||
|
| |||||||||||||||||||
OKLAHOMA - 2.1% | ||||||||||||||||||||
Oklahoma City Water Utilities Trust, Series B, Revenue Bond | 5.000% | 7/1/2017 | Aaa | 655,000 | 696,036 | |||||||||||||||
Oklahoma Development Finance Authority, Prerefunded Balance, Series C, Revenue Bond | 5.000% | 8/15/2018 | Aa3 | 500,000 | 551,565 | |||||||||||||||
Oklahoma Turnpike Authority, Series A, Revenue Bond | 5.000% | 1/1/2017 | Aa3 | 855,000 | 892,543 | |||||||||||||||
Oklahoma Turnpike Authority, Series A, Revenue Bond | 5.000% | 1/1/2020 | Aa3 | 2,750,000 | 3,149,987 | |||||||||||||||
The accompanying notes are an integral part of the financial statements.
15
Diversified Tax Exempt Series
Investment Portfolio - December 31, 2015
| COUPON RATE | MATURITY DATE | CREDIT RATING1 | PRINCIPAL AMOUNT | VALUE (NOTE 2) | ||||||||||||||||
MUNICIPAL BONDS (continued) | ||||||||||||||||||||
OKLAHOMA (continued) | ||||||||||||||||||||
Oklahoma Turnpike Authority, Series A, Revenue Bond | 5.000% | 1/1/2022 | Aa3 | $ | 2,000,000 | $ | 2,358,180 | |||||||||||||
|
| |||||||||||||||||||
| 7,648,311 | ||||||||||||||||||||
|
| |||||||||||||||||||
OREGON - 0.9% | ||||||||||||||||||||
Medford Hospital Facilities Authority, Asante Health | ||||||||||||||||||||
System, Revenue Bond, AGM | 5.000% | 8/15/2019 | AA2 | 440,000 | 492,276 | |||||||||||||||
Oregon State Housing & Community Services Department, Series A, Revenue Bond | 1.950% | 7/1/2020 | Aa2 | 230,000 | 232,284 | |||||||||||||||
Portland Sewer System, Series A, Revenue Bond | 5.000% | 8/1/2019 | Aa3 | 1,285,000 | 1,456,059 | |||||||||||||||
Washington County Clean Water Services, Sewer Impt., Series B, Revenue Bond | 5.000% | 10/1/2021 | Aa2 | 1,015,000 | 1,208,906 | |||||||||||||||
|
| |||||||||||||||||||
| 3,389,525 | ||||||||||||||||||||
|
| |||||||||||||||||||
PENNSYLVANIA - 7.0% | ||||||||||||||||||||
Allegheny County Hospital Development Authority, University of Pittsburgh Medical Center, Revenue Bond | 5.000% | 8/15/2019 | Aa3 | 640,000 | 723,456 | |||||||||||||||
Allegheny County Hospital Development Authority, University of Pittsburgh Medical Center, Series A, Revenue Bond | 5.000% | 5/15/2018 | Aa3 | 500,000 | 546,250 | |||||||||||||||
Allegheny County Sanitary Authority, Revenue Bond, AGM | 5.000% | 6/1/2018 | A1 | 1,465,000 | 1,600,439 | |||||||||||||||
Allegheny County Sanitary Authority, Revenue Bond, AGM | 5.000% | 12/1/2019 | A1 | 1,500,000 | 1,707,120 | |||||||||||||||
Central Bradford Progress Authority, Guthrie Healthcare System, Revenue Bond | 5.250% | 12/1/2018 | AA2 | 600,000 | 668,976 | |||||||||||||||
Lancaster County Hospital Authority, Lancaster General, Revenue Bond | 4.000% | 7/1/2017 | Aa3 | 460,000 | 480,916 | |||||||||||||||
North Wales Water Authority, Series A, Revenue Bond | 5.000% | 11/1/2020 | AA2 | 1,000,000 | 1,159,100 | |||||||||||||||
Pennsylvania Turnpike Commission, Highway Impt., Series A-1, Revenue Bond | 5.000% | 12/1/2023 | A1 | 1,200,000 | 1,457,448 | |||||||||||||||
Pennsylvania Turnpike Commission, Series A, Revenue Bond, AGM | 5.250% | 7/15/2018 | Aa3 | 615,000 | 677,472 | |||||||||||||||
Pennsylvania Turnpike Commission, Series A, Revenue Bond, AGM | 5.250% | 7/15/2019 | Aa3 | 1,050,000 | 1,191,582 | |||||||||||||||
Pennsylvania Turnpike Commission, Series B, Revenue Bond | 5.000% | 12/1/2017 | A1 | 2,440,000 | 2,627,538 | |||||||||||||||
Pennsylvania Turnpike Commission, Series B, Revenue Bond | 5.000% | 12/1/2020 | A1 | 1,000,000 | 1,140,380 | |||||||||||||||
The accompanying notes are an integral part of the financial statements.
16
Diversified Tax Exempt Series
Investment Portfolio - December 31, 2015
| COUPON RATE | MATURITY DATE | CREDIT RATING1 | PRINCIPAL AMOUNT | VALUE (NOTE 2) | ||||||||||||||||
MUNICIPAL BONDS (continued) | ||||||||||||||||||||
PENNSYLVANIA (continued) | ||||||||||||||||||||
Pennsylvania Turnpike Commission, Subseries B, Revenue Bond | 5.000% | 6/1/2017 | A3 | $ | 1,000,000 | $ | 1,057,770 | |||||||||||||
Philadelphia, Water & Wastewater, Prerefunded Balance, Revenue Bond, NATL | 5.600% | 8/1/2018 | AA2 | 20,000 | 22,070 | |||||||||||||||
Philadelphia, Water & Wastewater, Series A, Revenue Bond | 5.000% | 1/1/2018 | A1 | 385,000 | 415,577 | |||||||||||||||
Philadelphia, Water & Wastewater, Series A, Revenue Bond | 5.000% | 7/1/2018 | A1 | 500,000 | 548,085 | |||||||||||||||
Philadelphia, Water & Wastewater, Series B, Revenue Bond | 5.000% | 11/1/2017 | A1 | 750,000 | 805,957 | |||||||||||||||
Philadelphia, Water & Wastewater, Series B, Revenue Bond | 5.000% | 11/1/2018 | A1 | 1,370,000 | 1,516,576 | |||||||||||||||
Philadelphia, Water & Wastewater, Series C, Revenue Bond, AGM | 5.000% | 8/1/2017 | A1 | 1,000,000 | 1,065,500 | |||||||||||||||
Philadelphia, Water & Wastewater, Swap Termination,Series A, Revenue Bond, AGM | 5.000% | 6/15/2019 | A1 | 1,000,000 | 1,126,950 | |||||||||||||||
Pittsburgh Water & Sewer Authority, Series B, Revenue Bond, AGM | 5.000% | 9/1/2019 | A2 | 1,000,000 | 1,133,310 | |||||||||||||||
Pittsburgh Water & Sewer Authority, Swap Termination, Series A, Revenue Bond, AGM | 5.000% | 9/1/2018 | A2 | 1,325,000 | 1,460,388 | |||||||||||||||
Pittsburgh, Series B, G.O. Bond | 5.000% | 9/1/2018 | A1 | 1,000,000 | 1,099,680 | |||||||||||||||
Southcentral General Authority, Wellspan Health Obligated Group, Prerefunded Balance, Revenue Bond | 5.625% | 6/1/2018 | WR4 | 465,000 | 516,396 | |||||||||||||||
Southcentral General Authority, Wellspan Health Obligated Group, Unrefunded Balance, Revenue Bond | 5.625% | 6/1/2018 | Aa3 | 190,000 | 209,980 | |||||||||||||||
|
| |||||||||||||||||||
| 24,958,916 | ||||||||||||||||||||
|
| |||||||||||||||||||
RHODE ISLAND - 0.3% | ||||||||||||||||||||
Rhode Island Clean Water Finance Agency, Series A, Revenue Bond, NATL | 5.000% | 10/1/2035 | A3 | 1,000,000 | 1,002,240 | |||||||||||||||
|
| |||||||||||||||||||
SOUTH CAROLINA - 3.0% | ||||||||||||||||||||
Charleston, Waterworks & Sewer System, Revenue Bond | 5.000% | 1/1/2022 | Aaa | 530,000 | 626,041 | |||||||||||||||
Piedmont Municipal Power Agency, Revenue Bond, AGC | 5.000% | 1/1/2018 | A3 | 1,690,000 | 1,821,076 | |||||||||||||||
Piedmont Municipal Power Agency, Revenue Bond, NATL | 6.250% | 1/1/2021 | A3 | 1,000,000 | 1,219,760 | |||||||||||||||
South Carolina State Public Service Authority, Prerefunded Balance, Series A, Revenue Bond, AMBAC | 4.250% | 1/1/2017 | A1 | 1,550,000 | 1,606,156 | |||||||||||||||
The accompanying notes are an integral part of the financial statements.
17
Diversified Tax Exempt Series
Investment Portfolio - December 31, 2015
| COUPON RATE | MATURITY DATE | CREDIT RATING1 | PRINCIPAL AMOUNT | VALUE (NOTE 2) | ||||||||||||||||
MUNICIPAL BONDS (continued) | ||||||||||||||||||||
SOUTH CAROLINA (continued) | ||||||||||||||||||||
South Carolina State Public Service Authority, Prerefunded Balance, Series B, Revenue Bond, NATL | 5.000% | 1/1/2019 | A1 | $ | 85,000 | $ | 94,890 | |||||||||||||
South Carolina State Public Service Authority, Series A, Revenue Bond | 5.000% | 12/1/2019 | A1 | 2,500,000 | 2,847,275 | |||||||||||||||
South Carolina State Public Service Authority, Series C, Revenue Bond | 5.000% | 12/1/2020 | A1 | 1,000,000 | 1,166,270 | |||||||||||||||
South Carolina Transportation Infrastructure Bank, Series A, Revenue Bond | 5.000% | 10/1/2018 | A1 | 685,000 | 756,665 | |||||||||||||||
South Carolina Transportation Infrastructure Bank, Series A, Revenue Bond, AMBAC | 5.250% | 10/1/2018 | A1 | 700,000 | 777,959 | |||||||||||||||
|
| |||||||||||||||||||
| 10,916,092 | ||||||||||||||||||||
|
| |||||||||||||||||||
TENNESSEE - 2.6% | ||||||||||||||||||||
Knoxville Electric System Revenue, Series FF, Revenue Bond | 5.000% | 7/1/2023 | Aa2 | 800,000 | 961,832 | |||||||||||||||
Knoxville Electric System Revenue, Series FF, Revenue Bond | 5.000% | 7/1/2025 | Aa2 | 705,000 | 833,796 | |||||||||||||||
Knoxville Wastewater System, Series A, Revenue Bond | 4.000% | 4/1/2020 | Aa2 | 685,000 | 762,200 | |||||||||||||||
Knoxville Wastewater System, Sewer Impt., Series B, Revenue Bond | 4.000% | 4/1/2024 | Aa2 | 400,000 | 442,992 | |||||||||||||||
Madison Suburban Utility District, Revenue Bond, AGM | 5.000% | 2/1/2019 | A1 | 655,000 | 727,299 | |||||||||||||||
Memphis Electric System, Revenue Bond | 5.000% | 12/1/2018 | Aa2 | 2,000,000 | 2,223,860 | |||||||||||||||
Memphis Electric System, Revenue Bond | 5.000% | 12/1/2018 | Aa2 | 1,000,000 | 1,111,930 | |||||||||||||||
Metropolitan Government of Nashville & Davidson County, Series A, Revenue Bond, AGM | 4.000% | 1/1/2018 | Aa2 | 445,000 | 472,372 | |||||||||||||||
Metropolitan Government of Nashville & Davidson County, Series A, Revenue Bond, AGM | 5.250% | 1/1/2019 | Aa2 | 1,505,000 | 1,688,821 | |||||||||||||||
|
| |||||||||||||||||||
| 9,225,102 | ||||||||||||||||||||
|
| |||||||||||||||||||
TEXAS - 5.4% | ||||||||||||||||||||
Austin Electric Utility, Revenue Bond | 5.000% | 11/15/2020 | A1 | 1,600,000 | 1,861,024 | |||||||||||||||
Austin Electric Utility, Series A, Revenue Bond | 5.000% | 11/15/2022 | A1 | 500,000 | 601,690 | |||||||||||||||
Austin Electric Utility, Series A, Revenue Bond, AMBAC | 5.000% | 11/15/2016 | A1 | 600,000 | 623,334 | |||||||||||||||
Corpus Christi Utility System, Multiple Utility Impt., Revenue Bond | 5.000% | 7/15/2018 | A1 | 1,000,000 | 1,095,350 | |||||||||||||||
Fort Worth Water & Sewer System, Revenue Bond | 5.000% | 2/15/2020 | Aa1 | 550,000 | 632,043 | |||||||||||||||
Harris County Cultural Education Facilities Finance Corp., Revenue Bond | 4.000% | 12/1/2019 | A1 | 500,000 | 546,105 | |||||||||||||||
The accompanying notes are an integral part of the financial statements.
18
Diversified Tax Exempt Series
Investment Portfolio - December 31, 2015
| COUPON RATE | MATURITY DATE | CREDIT RATING 1 | PRINCIPAL AMOUNT | VALUE (NOTE 2) | ||||||||||||||||
MUNICIPAL BONDS (continued) | ||||||||||||||||||||
TEXAS (continued) | ||||||||||||||||||||
Harris County, Senior Lien, Toll Road Impt., Series B, Revenue Bond | 5.000% | 8/15/2023 | Aa2 | $ | 600,000 | $ | 735,240 | |||||||||||||
Houston Combined Utility System, Series S, Revenue Bond3 | 0.910% | 5/15/2034 | AA2 | 1,000,000 | 995,770 | |||||||||||||||
Irving Waterworks & Sewer System, Water Utility Impt., Revenue Bond | 4.000% | 8/15/2018 | Aa1 | 1,110,000 | 1,195,381 | |||||||||||||||
Metropolitan Transit Authority of Harris County, Transit Impt., Revenue Bond | 5.000% | 11/1/2019 | Aa2 | 845,000 | 963,444 | |||||||||||||||
North Texas Municipal Water District, Sewer Impt., Revenue Bond | 3.500% | 6/1/2035 | Aa2 | 1,000,000 | 1,014,790 | |||||||||||||||
North Texas Municipal Water District, Water Utility Impt., Revenue Bond | 5.000% | 9/1/2023 | Aa2 | 2,535,000 | 3,105,933 | |||||||||||||||
Tarrant Regional Water District, Revenue Bond | 5.000% | 3/1/2017 | AAA2 | 900,000 | 945,360 | |||||||||||||||
Texas State, Highway Impt., Series B, G.O. Bond | 5.000% | 4/1/2017 | Aaa | 1,575,000 | 1,660,050 | |||||||||||||||
Trinity River Authority Central Regional Wastewater System Revenue, Revenue Bond | 5.000% | 8/1/2024 | AAA2 | 2,200,000 | 2,668,688 | |||||||||||||||
Trinity River Authority LLC, Tarrant County Water Project, Revenue Bond | 5.000% | 2/1/2019 | AA2 | 500,000 | 557,040 | |||||||||||||||
|
| |||||||||||||||||||
| 19,201,242 | ||||||||||||||||||||
|
| |||||||||||||||||||
UTAH - 1.2% | ||||||||||||||||||||
Intermountain Power Agency, Series A, Revenue Bond | 5.000% | 7/1/2020 | A1 | 2,000,000 | 2,191,100 | |||||||||||||||
Provo Energy System Revenue, Series A, Revenue Bond, BAM | 5.000% | 2/1/2026 | AA2 | 975,000 | 1,186,897 | |||||||||||||||
Utah Transit Authority, Subseries B, Revenue Bond | 1.600% | 6/15/2018 | A1 | 1,025,000 | 1,035,394 | |||||||||||||||
|
| |||||||||||||||||||
| 4,413,391 | ||||||||||||||||||||
|
| |||||||||||||||||||
VIRGINIA - 0.7% | ||||||||||||||||||||
Fairfax County Industrial Development Authority, Inova Health, Series C, Revenue Bond | 5.000% | 5/15/2018 | Aa2 | 500,000 | 547,455 | |||||||||||||||
Norfolk Economic Development Authority, Sentara Healthcare, Series B, Revenue Bond | 4.000% | 11/1/2018 | Aa2 | 400,000 | 432,144 | |||||||||||||||
Virginia Resources Authority, Sewer Impt., Series B, Revenue Bond | 5.000% | 10/1/2019 | Aaa | 1,290,000 | 1,473,528 | |||||||||||||||
|
| |||||||||||||||||||
| 2,453,127 | ||||||||||||||||||||
|
| |||||||||||||||||||
WASHINGTON - 5.9% | ||||||||||||||||||||
Benton County Public Utility District No. 1, Revenue Bond | 5.000% | 11/1/2018 | Aa3 | 400,000 | 442,088 | |||||||||||||||
Everett Water & Sewer, Revenue Bond | 5.000% | 12/1/2020 | AA2 | 1,330,000 | 1,559,412 | |||||||||||||||
The accompanying notes are an integral part of the financial statements.
19
Diversified Tax Exempt Series
Investment Portfolio - December 31, 2015
| COUPON RATE | MATURITY DATE | CREDIT RATING 1 | PRINCIPAL AMOUNT | VALUE (NOTE 2) | ||||||||||||||||
MUNICIPAL BONDS (continued) | ||||||||||||||||||||
WASHINGTON (continued) | ||||||||||||||||||||
Everett, G.O. Bond3 | 0.410% | 12/1/2034 | AA2 | $ | 970,000 | $ | 953,335 | |||||||||||||
King County Sewer Revenue, Series B, Revenue Bond | 5.000% | 1/1/2020 | Aa2 | 750,000 | 859,087 | |||||||||||||||
Seattle Municipal Light & Power, Series A, Revenue Bond | 5.000% | 6/1/2019 | Aa2 | 1,675,000 | 1,889,132 | |||||||||||||||
Seattle Municipal Light & Power, Series B, Revenue Bond | 5.000% | �� | 2/1/2017 | Aa2 | 1,585,000 | 1,659,669 | ||||||||||||||
Seattle Water System Revenue, Revenue Bond | 5.000% | 5/1/2026 | Aa1 | 4,000,000 | 4,953,040 | |||||||||||||||
Seattle, Drainage & Wastewater, Sewer Impt., Revenue Bond | 5.000% | 9/1/2021 | Aa1 | 2,000,000 | 2,379,660 | |||||||||||||||
Tacoma, Sewer Impt., Revenue Bond | 5.000% | 12/1/2018 | Aa2 | 1,060,000 | 1,176,865 | |||||||||||||||
Tacoma, Sewer Impt., Revenue Bond | 4.000% | 12/1/2019 | Aa2 | 1,095,000 | 1,207,227 | |||||||||||||||
Tacoma, Water Revenue, Series A, Revenue Bond | 4.000% | 12/1/2018 | Aa2 | 1,000,000 | 1,081,800 | |||||||||||||||
Washington Health Care Facilities Authority, Providence Health & Services, Series A, Revenue Bond | 5.000% | 10/1/2018 | Aa3 | 475,000 | 524,965 | |||||||||||||||
Washington State, Series 2011-A, G.O. Bond | 5.000% | 1/1/2020 | Aa1 | 2,000,000 | 2,290,900 | |||||||||||||||
|
| |||||||||||||||||||
| 20,977,180 | ||||||||||||||||||||
|
| |||||||||||||||||||
WEST VIRGINIA - 0.4% | ||||||||||||||||||||
Fairmont, Series D, Revenue Bond, AGM | 3.000% | 7/1/2018 | A2 | 1,210,000 | 1,268,685 | |||||||||||||||
|
| |||||||||||||||||||
WISCONSIN - 2.1% | ||||||||||||||||||||
Milwaukee Sewerage System, Sewer Impt., Series S1, Revenue Bond | 5.000% | 6/1/2021 | Aa2 | 470,000 | 554,182 | |||||||||||||||
Wisconsin Health & Educational Facilities Authority, Ascension Health Credit, Series A, Revenue Bond | 5.000% | 11/15/2018 | Aa2 | 600,000 | 666,018 | |||||||||||||||
Wisconsin Health & Educational Facilities Authority, Froedtert Health, Series A, Revenue Bond | 4.000% | 4/1/2017 | AA2 | 565,000 | 586,973 | |||||||||||||||
Wisconsin Health & Educational Facilities Authority, ProHealth Care, Inc., Revenue Bond | 3.000% | 8/15/2019 | A1 | 510,000 | 536,132 | |||||||||||||||
Wisconsin Public Power, Inc., Series A, Revenue Bond, AGM | 5.000% | 7/1/2016 | A1 | 515,000 | 526,639 | |||||||||||||||
Wisconsin Public Power, Inc., Series A, Revenue Bond, AGM | 5.250% | 7/1/2020 | A1 | 1,100,000 | 1,210,022 | |||||||||||||||
WPPI Energy, Series A, Revenue Bond | 4.000% | 7/1/2017 | A1 | 1,120,000 | 1,172,987 | |||||||||||||||
WPPI Energy, Series A, Revenue Bond | 5.000% | 7/1/2020 | A1 | 2,000,000 | 2,307,760 | |||||||||||||||
|
| |||||||||||||||||||
| 7,560,713 | ||||||||||||||||||||
|
| |||||||||||||||||||
The accompanying notes are an integral part of the financial statements.
20
Diversified Tax Exempt Series
Investment Portfolio - December 31, 2015
| COUPON RATE | MATURITY DATE | CREDIT RATING1 | PRINCIPAL AMOUNT/ SHARES | VALUE (NOTE 2) | ||||||||||||||||
MUNICIPAL BONDS (continued) | ||||||||||||||||||||
WYOMING - 0.2% | ||||||||||||||||||||
Wyoming Municipal Power Agency, Inc., Series A, Revenue Bond | 5.000% | 1/1/2018 | A2 | $ | 500,000 | $ | 537,745 | |||||||||||||
|
| |||||||||||||||||||
TOTAL MUNICIPAL BONDS | ||||||||||||||||||||
(Identified Cost $341,178,046) | 344,923,647 | |||||||||||||||||||
|
| |||||||||||||||||||
SHORT-TERM INVESTMENT - 2.6% | ||||||||||||||||||||
General AMT - Free Municipal Money Market Fund - Class R | ||||||||||||||||||||
(Identified Cost $9,316,726) | 0.01%5 | 9,316,726 | 9,316,726 | |||||||||||||||||
|
| |||||||||||||||||||
TOTAL INVESTMENTS - 98.8% | ||||||||||||||||||||
(Identified Cost $350,494,772) | 354,240,373 | |||||||||||||||||||
OTHER ASSETS, LESS LIABILITIES - 1.2% | 4,343,144 | |||||||||||||||||||
|
| |||||||||||||||||||
NET ASSETS - 100% | $ | 358,583,517 | ||||||||||||||||||
|
| |||||||||||||||||||
KEY:
G.O. Bond - General Obligation Bond
Impt. - Improvement
No. - Number
Scheduled principal and interest payments are guaranteed by:
AGC (Assurance Guaranty Corp.)
AGM (Assurance Guaranty Municipal Corp.)
AMBAC (AMBAC Assurance Corp.)
BAM (Build America Mutual Assurance Co.)
NATL (National Public Finance Guarantee Corp.)
The insurance does not guarantee the market value of the municipal bonds.
1Credit ratings from Moody’s (unaudited).
2Credit ratings from S&P (unaudited).
3The coupon rate is floating and is the effective rate as of December 31, 2015.
4Credit rating has been withdrawn. As of December 31, 2015, there is no rating available (unaudited).
5Rate shown is the current yield as of December 31, 2015.
The accompanying notes are an integral part of the financial statements.
21
Diversified Tax Exempt Series
Statement of Assets and Liabilities
December 31, 2015
ASSETS: | ||||
Investments, at value (identified cost $350,494,772) (Note 2) | $ | 354,240,373 | ||
Interest receivable | 4,491,771 | |||
Receivable for fund shares sold | 152,300 | |||
|
| |||
TOTAL ASSETS | 358,884,444 | |||
|
| |||
LIABILITIES: | ||||
Accrued management fees (Note 3) | 152,067 | |||
Accrued fund accounting and administration fees (Note 3) | 38,628 | |||
Accrued transfer agent fees (Note 3) | 1,316 | |||
Accrued Chief Compliance Officer service fees (Note 3) | 429 | |||
Payable for fund shares repurchased | 85,030 | |||
Other payables and accrued expenses | 23,457 | |||
|
| |||
TOTAL LIABILITIES | 300,927 | |||
|
| |||
TOTAL NET ASSETS | $ | 358,583,517 | ||
|
| |||
NET ASSETS CONSIST OF: | ||||
Capital stock | $ | 323,999 | ||
Additional paid-in-capital | 354,909,914 | |||
Undistributed net investment income | 476,821 | |||
Accumulated net realized loss on investments | (872,818 | ) | ||
Net unrealized appreciation (depreciation) on investments | 3,745,601 | |||
|
| |||
TOTAL NET ASSETS | $ | 358,583,517 | ||
|
| |||
NET ASSET VALUE, OFFERING PRICE AND REDEMPTION PRICE PER SHARE - Class A | ||||
($358,583,517/32,399,888 shares) | $ | 11.07 | ||
|
| |||
The accompanying notes are an integral part of the financial statements.
22
Diversified Tax Exempt Series
Statement of Operations
For the Year Ended December 31, 2015
INVESTMENT INCOME: | ||||
Interest | $ | 5,289,791 | ||
Dividends | 1,068 | |||
|
| |||
Total Investment Income | 5,290,859 | |||
|
| |||
EXPENSES: | ||||
Management fees (Note 3) | 1,937,080 | |||
Fund accounting and administration fees (Note 3) | 118,425 | |||
Directors’ fees (Note 3) | 15,106 | |||
Transfer agent fees (Note 3) | 3,567 | |||
Chief Compliance Officer service fees (Note 3) | 2,541 | |||
Custodian fees | 16,169 | |||
Miscellaneous | 96,462 | |||
|
| |||
Total Expenses | 2,189,350 | |||
|
| |||
NET INVESTMENT INCOME | 3,101,509 | |||
|
| |||
REALIZED AND UNREALIZED GAIN (LOSS) ON INVESTMENTS: | ||||
Net realized gain on investments | 136,777 | |||
Net change in unrealized appreciation (depreciation) on investments | 2,207,553 | |||
|
| |||
NET REALIZED AND UNREALIZED GAIN (LOSS) ON INVESTMENTS | 2,344,330 | |||
|
| |||
NET INCREASE IN NET ASSETS RESULTING FROM OPERATIONS | $ | 5,445,839 | ||
|
| |||
The accompanying notes are an integral part of the financial statements.
23
Diversified Tax Exempt Series
Statements of Changes in Net Assets
| FOR THE YEAR ENDED 12/31/15 | FOR THE YEAR ENDED 12/31/14 | |||||||
INCREASE (DECREASE) IN NET ASSETS: | ||||||||
OPERATIONS: | ||||||||
Net investment income | $ | 3,101,509 | $ | 2,701,194 | ||||
Net realized gain (loss) on investments | 136,777 | (491,642 | ) | |||||
Net change in unrealized appreciation (depreciation) on investments | 2,207,553 | 3,108,451 | ||||||
|
|
|
| |||||
Net increase from operations | 5,445,839 | 5,318,003 | ||||||
|
|
|
| |||||
DISTRIBUTIONS TO SHAREHOLDERS (Note 7): | ||||||||
From net investment income | (3,270,501 | ) | (2,488,998 | ) | ||||
|
|
|
| |||||
CAPITAL STOCK ISSUED AND REPURCHASED: | ||||||||
Net increase (decrease) from capital share transactions (Note 5) | (19,862,558 | ) | 37,762,519 | |||||
|
|
|
| |||||
Net increase (decrease) in net assets | (17,687,220 | ) | 40,591,524 | |||||
NET ASSETS: | ||||||||
Beginning of year | 376,270,737 | 335,679,213 | ||||||
|
|
|
| |||||
End of year (including undistributed net investment income of $476,821 and | $ | 358,583,517 | $ | 376,270,737 | ||||
|
|
|
| |||||
The accompanying notes are an integral part of the financial statements.
24
Diversified Tax Exempt Series
Financial Highlights
| FOR THE YEARS ENDED | ||||||||||||||||||||
| 12/31/15 | 12/31/14 | 12/31/13 | 12/31/12 | 12/31/11 | ||||||||||||||||
Per share data (for a share outstanding throughout each year): | ||||||||||||||||||||
Net asset value - Beginning of year | $ | 11.00 | $ | 10.91 | $ | 11.39 | $ | 11.28 | $ | 10.77 | ||||||||||
|
|
|
|
|
|
|
|
|
| |||||||||||
Income (loss) from investment operations: | ||||||||||||||||||||
Net investment income1 | 0.09 | 0.08 | 0.14 | 0.20 | 0.30 | |||||||||||||||
Net realized and unrealized gain (loss) on investments | 0.08 | 0.09 | (0.29 | ) | 0.14 | 0.58 | ||||||||||||||
|
|
|
|
|
|
|
|
|
| |||||||||||
Total from investment operations | 0.17 | 0.17 | (0.15 | ) | 0.34 | 0.88 | ||||||||||||||
|
|
|
|
|
|
|
|
|
| |||||||||||
Less distributions to shareholders: | ||||||||||||||||||||
From net investment income | (0.10 | ) | (0.08 | ) | (0.13 | ) | (0.20 | ) | (0.29 | ) | ||||||||||
From net realized gain on investments | — | — | (0.20 | ) | (0.03 | ) | (0.08 | ) | ||||||||||||
|
|
|
|
|
|
|
|
|
| |||||||||||
Total distributions to shareholders | (0.10 | ) | (0.08 | ) | (0.33 | ) | (0.23 | ) | (0.37 | ) | ||||||||||
|
|
|
|
|
|
|
|
|
| |||||||||||
Net asset value - End of year | $ | 11.07 | $ | 11.00 | $ | 10.91 | $ | 11.39 | $ | 11.28 | ||||||||||
|
|
|
|
|
|
|
|
|
| |||||||||||
Net assets - End of year (000’s omitted) | $ | 358,584 | $ | 376,271 | $ | 335,679 | $ | 332,228 | $ | 306,440 | ||||||||||
|
|
|
|
|
|
|
|
|
| |||||||||||
Total return2 | 1.51 | % | 1.51 | % | (1.28 | %) | 3.01 | % | 8.25 | % | ||||||||||
Ratios (to average net assets)/Supplemental Data: | ||||||||||||||||||||
Expenses | 0.57 | % | 0.56 | % | 0.57 | % | 0.57 | % | 0.58 | % | ||||||||||
Net investment income | 0.80 | % | 0.75 | % | 1.21 | % | 1.71 | % | 2.67 | % | ||||||||||
Portfolio turnover | 33 | % | 25 | % | 58 | % | 9 | % | 53 | % | ||||||||||
1Calculated based on average shares outstanding during the years.
2Represents aggregate total return for the years indicated, and assumes reinvestment of all distributions.
The accompanying notes are an integral part of the financial statements.
25
Diversified Tax Exempt Series
Notes to Financial Statements
| 1. | Organization |
Diversified Tax Exempt Series (the “Series”) is a no-load diversified series of Manning & Napier Fund, Inc. (the “Fund”). The Fund is organized in Maryland and is registered under the Investment Company Act of 1940, as amended, as an open-end management investment company.
The Series’ investment objective is to provide as high a level of current income exempt from federal income tax as the Advisor believes is consistent with the preservation of capital.
The Fund’s advisor is Manning & Napier Advisors, LLC (the “Advisor”). Shares of the Series are offered to investors, clients and employees of the Advisor and its affiliates. The total authorized capital stock of the Fund consists of 15 billion shares of common stock each having a par value of $0.01. As of December 31, 2015, 10.7 billion shares have been designated in total among 41 series, of which 100 million have been designated as Diversified Tax Exempt Series Class A common stock.
| 2. | Significant Accounting Policies |
The following is a summary of significant accounting policies followed by the Series. The Series is an investment company and, accordingly, follows the investment company accounting and reporting guidance of the Financial Accounting Standards Board Accounting Standards Codification Topic 946 - Investment Companies, which is part of accounting principles generally accepted in the United States of America (“GAAP”).
Security Valuation
Municipal securities will normally be valued on the basis of market valuations provided by an independent pricing service (the “Service”). The Service utilizes the latest price quotations and a matrix system (which considers such factors as security prices of similar securities, yields, maturities and ratings). The Service has been approved by the Fund’s Board of Directors (the “Board”).
Short-term investments that mature in sixty days or less may be valued at amortized cost, which approximates fair value. Investments in open-end investment companies are valued at their net asset value per share on valuation date.
Volume and level of activity in established markets for an asset or liability are evaluated to determine whether recent transactions and quoted prices are determinative of fair value. Where there have been significant decreases in volume and level of activity, further analysis and adjustment may be necessary to estimate fair value. The Series measures fair value in these instances by the use of inputs and valuation techniques which may be based upon current market prices of securities that are comparable in coupon, rating, maturity and industry and/or expectation of future cash flows. As a result of trading in relatively thin markets and/or markets that experience significant volatility, the prices used by the Series to value these securities may differ from the value that would be realized if these securities were sold, and the differences could be material.
Securities for which representative valuations or prices are not available from the Series’ pricing service may be valued at fair value as determined in good faith by the Advisor under procedures approved by and under the general supervision and responsibility of the Board. Due to the inherent uncertainty of valuations of such securities, the fair value may differ significantly from the values that would have been used had a ready market for such securities existed. If trading or events occurring after the close of the principal market in which securities are traded are expected to materially affect the value of those securities, then they may be valued at their fair value, taking this trading or these events into account.
Various inputs are used in determining the value of the Series’ assets or liabilities carried at fair value. These inputs are summarized in three broad levels. Level 1 includes quoted prices in active markets for identical assets and liabilities. Level 2 includes other significant observable inputs (including quoted prices for similar securities, interest rates, prepayment speeds, credit risk, etc.). Level 3 includes significant unobservable inputs (including the Series’ own assumptions in determining the fair value of investments). A financial instrument’s level within the fair value hierarchy is based on the lowest level of any input both individually and in aggregate that is significant to the fair value measurement. The inputs or methodology used for valuing securities are not necessarily an indication of the risk associated with investing in those securities.
26
Diversified Tax Exempt Series
Notes to Financial Statements (continued)
| 2. | Significant Accounting Policies (continued) |
Security Valuation (continued)
The following is a summary of the valuation levels used for major security types as of December 31, 2015 in valuing the Series’ assets or liabilities carried at fair value:
| DESCRIPTION | TOTAL | LEVEL 1 | LEVEL 2 | LEVEL 3 | ||||||||||||
Assets: | ||||||||||||||||
Debt securities: | ||||||||||||||||
States and political subdivisions (municipals) | $ | 344,923,647 | $ | — | $ | 344,923,647 | $ | — | ||||||||
Mutual fund | 9,316,726 | 9,316,726 | — | — | ||||||||||||
|
|
|
|
|
|
|
| |||||||||
Total assets | $ | 354,240,373 | $ | 9,316,726 | $ | 344,923,647 | $ | — | ||||||||
|
|
|
|
|
|
|
| |||||||||
There were no Level 3 securities held by the Series as of December 31, 2014 or December 31, 2015.
The Fund’s policy is to recognize transfers in and transfers out of the valuation levels as of the beginning of the reporting period. There were no transfers between Level 1 and Level 2 during the year ended December 31, 2015.
Security Transactions, Investment Income and Expenses
Security transactions are accounted for on trade date. Dividend income is recorded on the ex-dividend date, except that if the ex-dividend date has passed, certain dividends from foreign securities are recorded as soon as the Series is informed of the ex-dividend date. Non-cash dividends, if any, are recorded at the fair value of the securities received. Interest income, including amortization of premium and accretion of discounts using the effective interest method, is earned from settlement date and accrued daily.
Expenses are recorded on an accrual basis. Most expenses of the Fund can be attributed to a specific series. Expenses which cannot be directly attributed are apportioned among the series in the Fund in such a manner as deemed equitable by the Fund’s Board, taking into consideration, among other things, the nature and type of expense.
The Series uses the identified cost method for determining realized gain or loss on investments for both financial statement and federal income tax reporting purposes.
Federal Taxes
The Series’ policy is to comply with the provisions of the Internal Revenue Code applicable to regulated investment companies. The Series is not subject to federal income tax or excise tax to the extent that the Series distributes to shareholders each year its taxable income, including any net realized gains on investments, in accordance with requirements of the Internal Revenue Code. Accordingly, no provision for federal income tax or excise tax has been made in the financial statements.
Management evaluates its tax positions to determine if the tax positions taken meet the minimum recognition threshold in connection with accounting for uncertainties in income tax positions taken or expected to be taken for the purposes of measuring and recognizing tax liabilities in the financial statements. Recognition of tax benefits of an uncertain tax position is required only when the position is “more likely than not” to be sustained assuming examination by taxing authorities. At December 31, 2015, the Series has recorded no liability for net unrecognized tax benefits relating to uncertain income tax positions taken or expected to be taken in future tax returns.
The Series files income tax returns in the U.S. federal jurisdiction and various states, as required. No income tax returns are currently under investigation. The statute of limitations on the Series’ tax returns remains open for the years ended December 31, 2012 through December 31, 2015. The Series is not aware of any tax positions for which it is reasonably possible that the total amounts of unrecognized tax benefits will significantly change in the next twelve months.
Distributions of Income and Gains
Distributions to shareholders of net investment income are made quarterly. Distributions of net realized gains are made annually. An additional distribution may be necessary to avoid taxation of the Series. Distributions are recorded on the ex-dividend date.
27
Diversified Tax Exempt Series
Notes to Financial Statements (continued)
| 2. | Significant Accounting Policies (continued) |
Indemnifications
The Fund’s organizational documents provide former and current directors and officers with a limited indemnification against liabilities arising in connection with the performance of their duties to the Fund. In the normal course of business, the Fund may also enter into contracts that provide general indemnifications. The Fund’s maximum exposure under these arrangements is unknown as this would be dependent on future claims that may be made against the Fund. The risk of material loss from such claims is considered remote.
Other
The preparation of financial statements in conformity with GAAP requires management to make estimates and assumptions that affect the reported amounts of assets and liabilities and the disclosure of contingent assets and liabilities at the date of the financial statements and the reported amounts of income and expenses during the reporting period. Actual results could differ from those estimates.
| 3. | Transactions with Affiliates |
The Fund has an Investment Advisory Agreement (the “Agreement”) with the Advisor, for which the Series pays a fee, computed daily and payable monthly, at an annual rate of 0.50% of the Series’ average daily net assets.
Under the Agreement, personnel of the Advisor provide the Series with advice and assistance in the choice of investments and the execution of securities transactions, and otherwise maintain the Series’ organization. The Advisor also provides the Fund with necessary office space and fund administration and support services. The salaries of all officers of the Fund (except a percentage of the Fund’s Chief Compliance Officer’s salary, which is paid by the Fund), and of all Directors who are “affiliated persons” of the Fund, or of the Advisor, and all personnel of the Fund, or of the Advisor, performing services relating to research, statistical and investment activities, are paid by the Advisor. Each “non-affiliated” Director receives an annual stipend, which is allocated among all the active series of the Fund. In addition, these Directors also receive a fee per Board meeting attended plus a fee for each committee meeting attended and are reimbursed for travel and other out-of-pocket expenses incurred by them in connection with attending such meetings. The Fund also has an Audit Committee Chair, who receives an additional annual stipend for this role.
The Advisor has contractually agreed, until at least April 30, 2016, to waive its management fee and, if necessary, pay other operating expenses of the Series in order to maintain total direct annual fund operating expenses for the Series at no more than 0.85% of average daily net assets each year. The Advisor did not waive any fees for the year ended December 31, 2015. The Advisor is not eligible to recoup any expenses that have been waived or reimbursed in prior years.
Manning & Napier Investor Services, Inc., a registered broker-dealer affiliate of the Advisor, acts as distributor for the Fund’s shares. The services of Manning & Napier Investor Services, Inc. are provided at no additional cost to the Series.
Pursuant to a master services agreement dated November 1, 2014, the Fund pays the Advisor an annual fee related to fund accounting and administration of 0.0085% on the first $25 billion of average daily net assets (excluding Target Series and Strategic Income Series); 0.0075% on the next $15 billion of average daily net assets (excluding Target Series and Strategic Income Series); and 0.0065% of the average daily net assets in excess of $40 billion (excluding Target Series and Strategic Income Series); plus a base fee of $30,400 per series. Transfer agent fees are charged to the Fund on a per account basis. Additionally, certain transaction and out-of-pocket expenses, including charges for reporting relating to the Fund’s compliance program, are charged. The Advisor has agreements with BNY Mellon Investment Servicing (U.S.) Inc. (“BNY”) under which BNY serves as sub-accountant services agent and sub-transfer agent.
Expenses not directly attributable to a series are allocated based on each series’ relative net assets or number of accounts, depending on the expense.
28
Diversified Tax Exempt Series
Notes to Financial Statements (continued)
| 4. | Purchases and Sales of Securities |
For the year ended December 31, 2015, purchases and sales of securities, other than U.S. Government securities and short-term securities, were $123,630,704 and $126,777,999, respectively. There were no purchases or sales of U.S. Government securities.
| 5. | Capital Stock Transactions |
Transactions in shares of Diversified Tax Exempt Series were:
FOR THE YEAR ENDED 12/31/15 | FOR THE YEAR ENDED 12/31/14 | |||||||||||||||
| SHARES | AMOUNT | SHARES | AMOUNT | |||||||||||||
Sold | 5,130,993 | $ | 56,681,868 | 7,642,752 | $ | 84,158,145 | ||||||||||
Reinvested | 275,078 | 3,024,888 | 209,581 | 2,308,920 | ||||||||||||
Repurchased | (7,210,048 | ) | (79,569,314 | ) | (4,422,619 | ) | (48,704,546 | ) | ||||||||
|
|
|
|
|
|
|
| |||||||||
Total | (1,803,977 | ) | $ | (19,862,558 | ) | 3,429,714 | $ | 37,762,519 | ||||||||
|
|
|
|
|
|
|
| |||||||||
Over 90% of the shares outstanding are held by fiduciary accounts where the Advisor has sole investment discretion.
| 6. | Financial Instruments |
The Series may trade in instruments including written and purchased options, forward foreign currency exchange contracts and futures contracts and other derivatives in the normal course of investing activities to assist in managing exposure to various market risks. The Series may be subject to various elements of risk, which may involve, to a varying degree, elements of risk in excess of the amounts recognized for financial statement purposes. These risks include: the risk that changes in the value of a derivative may not correlate perfectly with the underlying asset, rate or index; counterparty credit risk related to over the counter derivative counterparties’ failure to perform under contract terms; liquidity risk related to the lack of a liquid market for these contracts allowing the fund to close out its position(s); and documentation risk relating to disagreement over contract terms. No such investments were held by the Series as of December 31, 2015.
| 7. | Federal Income Tax Information |
The amount and characterization of certain income and capital gains to be distributed are determined in accordance with federal income tax regulations, which may differ from GAAP. These differences are primarily due to differing book and tax treatments in the timing and/or treatment of the recognition of net investment income or gains and losses, including market discount on investments. The Series may periodically make reclassifications among its capital accounts to reflect income and gains available for distribution (or available capital loss carryovers) under income tax regulations without impacting the Series’ net asset value.
29
Diversified Tax Exempt Series
Notes to Financial Statements (continued)
| 7. | Federal Income Tax Information (continued) |
The tax character of distributions paid were as follows:
| FOR THE YEAR ENDED 12/31/15 | FOR THE YEAR ENDED 12/31/14 | |||||||
Tax exempt income | $ | 3,270,501 | $ | 2,488,998 | ||||
At December 31, 2015, the tax basis of components of distributable earnings and the net unrealized appreciation based on identified cost for federal income tax purposes were as follows:
Cost for federal income tax purposes | $ | 350,493,892 | ||
Unrealized appreciation | 3,991,825 | |||
Unrealized depreciation | (245,344 | ) | ||
|
| |||
Net unrealized appreciation | $ | 3,746,481 | ||
|
| |||
Undistributed tax exempt income | $ | 475,941 | ||
Capital loss carryforwards | $ | (872,818 | ) |
The capital loss carryover utilized in the current year was $184,137.
As of December 31, 2015, the Series had net short-term capital loss carryforwards of $269,285 and net long-term capital loss carryforwards of $603,533, which may be carried forward indefinitely.
30
Diversified Tax Exempt Series
Report of Independent Registered Public Accounting Firm
To the Board of Directors of Manning & Napier Fund, Inc. and Shareholders of Diversified Tax Exempt Series:
In our opinion, the accompanying statement of assets and liabilities, including the investment portfolio, and the related statements of operations and of changes in net assets and the financial highlights present fairly, in all material respects, the financial position of Diversified Tax Exempt Series (a series of Manning & Napier Fund, Inc., hereafter referred to as the “Series”) at December 31, 2015, the results of its operations for the year then ended, the changes in its net assets for each of the two years in the period then ended and the financial highlights for each of the five years in the period then ended, in conformity with accounting principles generally accepted in the United States of America. These financial statements and financial highlights (hereafter referred to as “financial statements”) are the responsibility of the Series’ management. Our responsibility is to express an opinion on these financial statements based on our audits. We conducted our audits of these financial statements in accordance with the standards of the Public Company Accounting Oversight Board (United States). Those standards require that we plan and perform the audit to obtain reasonable assurance about whether the financial statements are free of material misstatement. An audit includes examining, on a test basis, evidence supporting the amounts and disclosures in the financial statements, assessing the accounting principles used and significant estimates made by management, and evaluating the overall financial statement presentation. We believe that our audits, which included confirmation of securities at December 31, 2015 by correspondence with the custodian and brokers, provide a reasonable basis for our opinion.

New York, New York
February 19, 2016
31
Diversified Tax Exempt Series
Supplemental Tax Information
(unaudited)
All reportings are based on financial information available as of the date of this annual report, and accordingly are subject to change.
The Series hereby reports $3,270,501 as tax exempt dividends for the year ended December 31, 2015. It is the intention of the Series to designate the maximum allowable under tax law.
32
Diversified Tax Exempt Series
Renewal of Investment Advisory Agreement
(unaudited)
At the Manning & Napier Fund, Inc. (the “Fund”) Board of Directors’ (the “Board”) meeting, held on November 17, 2015, the Investment Advisory Agreement (the “Agreement”) between the Fund and Manning & Napier Advisors, LLC (the “Advisor”) was considered by the Board for renewal. In connection with the decision whether to renew the Agreement, a variety of material was prepared for and considered by the Board.
Representatives of the Advisor attended the meeting and presented additional oral and written information to the Board to assist the Board in its considerations. The discussion immediately below outlines the materials and information presented to the Board in connection with the Board’s 2015 Annual consideration of the Agreement and the conclusions made by the Directors when determining to continue the Agreement.
| • | The Board considered the services provided by the Advisor under the Agreement including, among others: deciding what securities to purchase and sell for each Series; arranging for the purchase and sale of such securities by placing orders with broker-dealers; administering the affairs of the Fund (including the books and records of the Fund not maintained by third party service providers such as the custodian or sub-transfer agent); arranging for the insurance coverage for the Fund; and supervising the preparation of tax returns, SEC filings (including registration statements) and reports to shareholders for the Fund. The Board also considered the nature and quality of such services provided under the Agreement in light of the Advisor’s services provided to the Fund for 29 years. The Board discussed the quality of these services with representatives from the Advisor and concluded that the Advisor was performing its services to the Fund required under the Agreement in a reasonable manner. |
| • | The Board considered the performance of each Series since its inception, as well as performance over multiple time periods. Performance for one or more of the following time periods was considered as applicable to the Series’ inception date: inception, three year, five year, ten year, and current market cycle. A market cycle includes periods of both rising and falling markets. Returns for established benchmark indices for each Series were provided. In addition, the Board considered a number of other factors relevant to performance at the meeting (and considers on a quarterly basis) including: a peer group performance analysis consisting of Morningstar universes of mutual funds with similar investment objectives, investment performance of core products, product offerings, performance on an aggregate basis vs. performance over reasonable time periods and the Advisor’s investment process. The Directors acknowledged the challenging performance and discussed the investment process of the Advisor. The Directors confirmed that qualitative factors such as the Advisor’s investment process, including recent enhancements, were an important subset to be considered as part of their consideration of performance. The Board discussed the performance with representatives from the Advisor and concluded that the investment performance of each of the Fund’s Series was reasonable based on the Series’ actual performance and comparative performance, especially for those series with performance over the current market cycle. |
| • | The Board considered the costs of the Advisor’s services and the profits of the Advisor as they relate to the Advisor’s services to the Fund under the Agreement. In reviewing the Advisor’s costs and profits, the Board discussed the Advisor’s revenues generated from the Fund (on both an actual and adjusted basis) and its expenses associated with providing the services under the Agreement. In addition, the Board reviewed the Advisor’s expenses associated with Fund activities outside of the Agreement (such as expense reimbursements pursuant to expense caps and payments made by the Advisor to third party platforms on which shares of the Fund are available for purchase). It was noted by representatives of the Advisor that 22 of the 36 active Series of the Fund are currently experiencing expenses above the capped expense ratios, and thus the Advisor is incurring those expenses over the cap. After discussing the above costs and profits, the Board concluded that the Advisor’s profitability relating to its services provided under the Agreement was reasonable. |
| • | The Board considered the fees and expenses of the various Series of the Fund. The Advisor presented the advisory fees and total expenses for each Series, including the advisory fee adjusted for any expense waivers or reimbursements (either contractual or voluntary) paid by the Advisor. The advisory fees and expense ratios of each Series were compared to an average (on both a mean and median basis) of similar funds as disclosed on the Morningstar database. Representatives of the Advisor discussed with the Board the levels of its advisory fee for each Series of the Fund and as compared to the median and mean advisory fees for similar funds as listed on Morningstar. Expense ratios for every Series, except the Tax Managed Series, Equity Income Class S, High Yield Bond Class S, Pro-Blend Series Classes C and R, and Target Series’ Classes R and K, are lower than, or substantially similar to the Morningstar mean and median reported total expense ratio. |
33
Diversified Tax Exempt Series
Renewal of Investment Advisory Agreement
(unaudited)
The higher than mean and median total expense ratios for Classes C and R reflect higher distribution, marketing and shareholder service fees payable to broker-dealers through a 100bp 12b-1 fee for Class C and a 50bp 12b-1 fee for Class R. Based on their review of the information provided, the Board concluded that the fees and expenses of each Series of the Fund were reasonable on a comparative basis. |
| • | The Board also considered the other benefits the Advisor derives from its relationship with the Fund. Such other benefits include certain research services provided by soft dollars. The Board reviewed the broker-dealers who provided research to the Advisor and the products and services paid for, in whole or in part, using soft dollar commissions. Given the level of soft dollar transactions involving the Fund, the Board concluded that these additional benefits to the Advisor were reasonable. |
| • | In addition to the factors described above, the Board considered the Advisor’s personnel, investment strategies, policies and procedures relating to compliance with personal securities transactions, reputation, expertise and resources in domestic and foreign financial markets. The Board concluded that these factors support the conclusion that the Advisor performs its services in a reasonable manner. |
| • | The Board then considered economies of scale and concluded that the current fee schedule to the advisory agreement remained reasonable given the multiple uses of the Fund (for the Advisor’s discretionary investment account clients in addition to direct investors), the current profitability of the Advisor’s services to the Fund under the Agreement, the number of newly established series of the Fund and the overall size of the Fund complex. |
Based on the Board’s deliberations and their evaluation of the information described above, the Board, including a majority of Directors that are not “interested persons” as defined in the Investment Company Act of 1940, concluded that the compensation under the Agreement was fair and reasonable in light of the services and expenses and such other matters as the Directors considered to be relevant in the exercise of their reasonable judgment. Accordingly, the Board approved the renewal of the Agreement. In the course of their deliberations, the Directors did not identify any particular information that was all important or controlling.
34
Diversified Tax Exempt Series
Directors’ and Officers’ Information
(unaudited)
The Statement of Additional Information provides additional information about the Fund’s directors and officers and can be obtained without charge by calling 1-800-466-3863, at www.manningnapieradvisors.com, or on the EDGAR Database on the SEC Internet web site (http:// www.sec.gov). The following chart shows certain information about the Fund’s officers and directors, including their principal occupations during the last five years. Unless specific dates are provided, the individuals have held the listed positions for longer than five years.
Interested Director/Officer
| ||
| Name: | James E. Mikolaichik* | |
| Address: | 290 Woodcliff Drive | |
| Fairport, NY 14450 | ||
| Age: | 44 | |
| Current Position(s) Held with Fund: | Principal Executive Officer, President, Chairman & Director | |
| Term of Office1 & Length of Time Served: | Indefinite - Chairman and Director since August 2015 | |
| Principal Occupation(s) During Past 5 Years: | Chief Financial Officer (since 2011) - Manning & Napier Advisors, LLC; Executive Vice President and Head of Strategy (2008-2011) and Chief Risk Officer (2004-2008) - Old Mutual Asset Management Holds or has held one or more of the following title for various subsidiaries and affiliates: Chief Financial Officer. | |
| Number of Portfolios Overseen within Fund Complex: | 41 | |
| Other Directorships Held Outside Fund Complex: | N/A | |
Independent Directors
| ||
| Name: | Stephen B. Ashley | |
| Address: | 290 Woodcliff Drive | |
| Fairport, NY 14450 | ||
| Age: | 75 | |
| Current Position(s) Held with Fund: | Director, Audit Committee Member, Governance & Nominating Committee Member | |
| Term of Office & Length of Time Served: | Indefinite - Since 1996 | |
| Principal Occupation(s) During Past 5 Years: | Chairman, Director, President & Chief Executive Officer (1997 to present) - The Ashley Group (property management and investment); Director (1995-2008) and Chairman (non-executive) (2004-2008) - Fannie Mae (mortgage). | |
| Number of Portfolios Overseen within Fund Complex: | 41 | |
| Other Directorships Held Outside Fund Complex: | Fannie Mae (1995-2008) | |
| The Ashley Group (1995-2008) | ||
| Genesee Corporation (1987-2007) | ||
| Name: | Paul A. Brooke | |
| Address: | 290 Woodcliff Drive | |
| Fairport, NY 14450 | ||
| Age: | 70 | |
| Current Position(s) Held with Fund: | Director, Audit Committee Member, Governance & Nominating Committee Member | |
| Term of Office & Length of Time Served: | Indefinite - Since 2007 | |
| Principal Occupation(s) During Past 5 Years: | Chairman & CEO (2005-2009) - Ithaka Acquisition Corporation (investments); Chairman (2007-2009) Alsius Corporation (investments); Managing Member, PMSV Holdings LLC (investments) since 1991; Managing Member, Venbio (investments) since 2010. | |
| Number of Portfolios Overseen within Fund Complex: | 41 | |
| Other Directorships Held Outside Fund Complex: | Incyte Corp. (2000-present) | |
| ViroPharma, Inc. (2000-2014) | ||
| HLTH Corp (WebMD) (2000-2010) | ||
| Cheyne Capital International (2000-present) | ||
| GMP Companies (2000-2011) | ||
| Cytos Biotechnology Ltd. (2012-2014) | ||
35
Diversified Tax Exempt Series
| Directors’ and Officers’ Information | ||
(unaudited)
| ||
Independent Directors (continued)
| ||
| Name: | Peter L. Faber | |
| Address: | 290 Woodcliff Drive | |
| Fairport, NY 14450 | ||
| Age: | 77 | |
| Current Position(s) Held with Fund: | Director, Governance & Nominating Committee Member | |
| Term of Office & Length of Time Served: | Indefinite - Since 1987 | |
| Principal Occupation(s) During Past 5 Years: | Senior Counsel (2006-2012), Partner (1995-2006 & 2013-present) - McDermott, Will & Emery LLP (law firm) | |
| Number of Portfolios Overseen within Fund Complex: | 41 | |
| Other Directorships Held Outside Fund Complex: | Boston Early Music Festival (non-profit)(2007-present) Amherst Early Music, Inc. (non-profit)(2009-present) Gotham Early Music Scene, Inc. (non-profit)(2009-present) Partnership for New York City, Inc. (non-profit) (1989-2010) New York Collegium (non-profit) (2004-2011) | |
| Name: | Harris H. Rusitzky | |
| Address: | 290 Woodcliff Drive | |
| Fairport, NY 14450 | ||
| Age: | 80 | |
| Current Position(s) Held with Fund: | Director, Audit Committee Member, Governance & Nominating Committee Member | |
| Term of Office & Length of Time Served: | Indefinite - Since 1985 | |
| Principal Occupation(s) During Past 5 Years: | President, The Greening Group (business consultants) since 1994; | |
| Partner, The Restaurant Group (restaurants) since 2006 | ||
| Number of Portfolios Overseen within Fund Complex: | 41 | |
| Other Directorships Held Outside Fund Complex: | Rochester Institute of Technology (university)(1972-present) Culinary Institute of America (non-profit college)(1985-present) George Eastman House (museum)(1988-present) National Restaurant Association (restaurant trade organization)(1978-present) | |
| Name: | Chester N. Watson | |
| Address: | 290 Woodcliff Drive | |
| Fairport, NY 14450 | ||
| Age: | 65 | |
| Current Position(s) Held with Fund: | Director, Audit Committee Chairman, Governance & Nominating Committee Member | |
| Term of Office & Length of Time Served: | Indefinite - Since 2012 | |
| Principal Occupation(s) During Past 5 Years: | General Auditor (2003-2011) - General Motors Company (auto manufacturer) | |
| Number of Portfolios Overseen within Fund Complex: | 41 | |
| Other Directorships Held Outside Fund Complex: | Rochester Institute of Technology (university)(2005-present) | |
Officers
| ||
| Name: | Jeffrey S. Coons, Ph.D., CFA | |
| Address: | 290 Woodcliff Drive Fairport, NY 14450 | |
| Age: | 52 | |
| Current Position(s) Held with Fund: | Vice President | |
| Term of Office1 & Length of Time Served: | Since 2004 | |
| Principal Occupation(s) During Past 5 Years: | President since 2010, Co-Director of Research (2002-2015) - Manning & Napier Advisors, LLC Holds one or more of the following titles for various subsidiaries and affiliates: President, Director, Treasurer or Senior Trust Officer. | |
| Number of Portfolios Overseen within Fund Complex: | 41 | |
| Other Directorships Held Outside Fund Complex: | N/A | |
36
Diversified Tax Exempt Series
Directors’ and Officers’ Information
(unaudited)
Officers (continued)
| Name: | Elizabeth Craig | |
| Address: | 290 Woodcliff Drive | |
| Fairport, NY 14450 | ||
| Age: | 28 | |
| Current Position(s) Held with Fund: | Assistant Corporate Secretary | |
| Term of Office1 & Length of Time Served: | Since 2011 | |
| Principal Occupation(s) During Past 5 Years: | Fund Administration Manager since 2015; Mutual Fund Compliance Specialist (2009-2015) - Manning & Napier Advisors, LLC | |
| Number of Portfolios Overseen within Fund Complex: | 41 | |
| Other Directorships Held Outside Fund Complex: | N/A | |
| Name: | Christine Glavin | |
| Address: | 290 Woodcliff Drive Fairport, NY 14450 | |
| Age: | 49 | |
| Current Position(s) Held with Fund: | Principal Financial Officer, Chief Financial Officer | |
| Term of Office1 & Length of Time Served: | Principal Financial Officer since 2002; Chief Financial Officer since 2001 | |
| Principal Occupation(s) During Past 5 Years: | Director of Fund Reporting since 2011; Fund Reporting Manager (1997-2011) - Manning & Napier Advisors, LLC; Assistant Treasurer since 2008 - Exeter Trust Company | |
| Number of Portfolios Overseen within Fund Complex: | 41 | |
| Other Directorships Held Outside Fund Complex: | N/A | |
| Name: | Jodi L. Hedberg | |
| Address: | 290 Woodcliff Drive Fairport, NY 14450 | |
| Age: | 48 | |
| Current Position(s) Held with Fund: | Corporate Secretary, Chief Compliance Officer, Anti-Money Laundering Compliance Officer | |
| Term of Office1 & Length of Time Served: | Corporate Secretary since 1997; Chief Compliance Officer since 2004; Anti-Money Laundering Compliance Officer since 2002 | |
| Principal Occupation(s) During Past 5 Years: | Director of Compliance since 2005; Compliance Manager (1995-2005) - Manning & Napier Advisors, LLC and affiliates; Corporate Secretary - Manning & Napier Investor Services, Inc. since 2006 | |
| Number of Portfolios Overseen within Fund Complex: | 41 | |
| Other Directorships Held Outside Fund Complex: | N/A | |
| Name: | Richard Yates | |
| Address: | 290 Woodcliff Drive Fairport, NY 14450 | |
| Age: | 50 | |
| Current Position(s) Held with Fund: | Chief Legal Officer | |
| Term of Office1 & Length of Time Served: | Chief Legal Officer since 2004 | |
| Principal Occupation(s) During Past 5 Years: | Counsel - Manning & Napier Advisors, LLC and affiliates since 2000; Holds one or more of the following titles for various affiliates; Director or Corporate Secretary | |
| Number of Portfolios Overseen within Fund Complex: | 41 | |
| Other Directorships Held Outside Fund Complex: | N/A | |
*Interested Director, within the meaning of the Investment Company Act of 1940 by reason of his position with the Fund’s investment advisor and distributor. Mr. Mikolaichik serves as the Chief Financial Officer for Manning & Napier Advisors, LLC.
1The term of office of all officers shall be one year and until their respective successors are chosen and qualified, or his or her earlier resignation or removal as provided in the Fund’s By-Laws.
37
Diversified Tax Exempt Series
Results of Special Meeting of Shareholders
(unaudited)
A Special Meeting of the Shareholders of the Fund was held on August 18, 2015. The number of votes necessary to conduct the meeting and approve the proposal was obtained, and the results of the vote of shareholders of all the Series of the Fund voting together in the aggregate is listed below:
PROPOSAL 1:
Election of Directors
| NUMBER OF SHARES VOTED FOR | NUMBER OF SHARES WITHELD | |||||||
Stephen B. Ashley | 883,968,395 | 8,618,094 | ||||||
Paul A. Brooke | 884,510,661 | 8,075,828 | ||||||
Peter L. Faber | 884,140,893 | 8,445,596 | ||||||
James E. Mikolaichik | 883,391,832 | 9,194,657 | ||||||
Harris H. Rusitzky | 620,022,215 | 272,564,274 | ||||||
Chester N. Watson | 884,638,809 | 7,947,680 | ||||||
38
Diversified Tax Exempt Series
Literature Requests
(unaudited)
Proxy Voting Policies and Procedures
A description of the policies and procedures that the Fund uses to determine how to vote proxies relating to portfolio securities is available, without charge, upon request:
| By phone | 1-800-466-3863 | |||
| On the Securities and Exchange | ||||
| Commission’s (SEC) web site | http://www.sec.gov |
Proxy Voting Record
Information regarding how the Fund voted proxies relating to portfolio securities during the most recent 12-month period ended June 30th is available, without charge, upon request:
| By phone | 1-800-466-3863 | |||
| On the SEC’s web site | http://www.sec.gov |
Quarterly Portfolio Holdings
The Series’ complete schedule of portfolio holdings for the 1st and 3rd quarters of each fiscal year are provided on Form N-Q, and are available, without charge, upon request:
| By phone | 1-800-466-3863 | |||
| On the SEC’s web site | http://www.sec.gov |
The Series’ Form N-Q may be reviewed and copied at the SEC’s Public Reference Room in Washington, D.C. Information on the operation of the Public Reference Room may be obtained by calling 1-800-SEC-0330.
Prospectus and Statement of Additional Information (SAI)
For more information about any of the Manning & Napier Fund, Inc. Series, you may obtain a prospectus and SAI at www.manning-napier.com or by calling (800) 466-3863. Before investing, carefully consider the objectives, risks, charges and expenses of the investment and read the prospectus carefully as it contains this and other information about the investment company. In addition, this information can be found on the SEC’s web site, http://www.sec.gov.
Additional information available at www.manning-napier.com
1. Fund Holdings - Month-End
2. Fund Holdings - Quarter-End
3. Shareholder Report - Annual
4. Shareholder Report - Semi-Annual
The Fund also offers electronic notification or “e-delivery” when certain documents are available on-line to be downloaded or reviewed. Direct shareholders can elect to receive electronic notification when shareholder reports, prospectus updates, and/or statements are available. If you do not currently have on-line access to your account, you can establish access by going to www.manning-napier.com, click on “Login” in the top corner of the page, and follow the prompts to self-enroll. Once enrolled, you can set your electronic notification preferences by clicking on the Account Options tab located within the green toolbar and then select E-Delivery Option. Should you have any questions on either how to establish on-line access or how to update your account settings, please contact Investor Services at 1-800-466-3863.
The Manning & Napier Fund, Inc. is managed by Manning & Napier Advisors, LLC. Manning & Napier Investor Services, Inc., an affiliate of Manning & Napier Advisors, LLC, is the distributor of the Fund shares.
MNDTE-12/15-AR

New York Tax Exempt Series
Management Discussion and Analysis
(unaudited)
Dear Shareholders:
Volatility defined global financial markets during the past year, largely driven by macroeconomic factors. Renewed concerns about economic growth in emerging markets — China in particular — and uncertainty about the effects of that slowdown on overall global growth triggered market gyrations. Developed economies continued to provide accommodative monetary policy to combat growth concerns, although in December the U.S. Federal Reserve raised the federal funds rate for the first time in nearly a decade. For much of the year, Europe struggled with uncertainty regarding Greece’s ability to secure bailout funding from its creditors, which negatively affected investor sentiment. China’s economy slowed, but the government continued to demonstrate a willingness to provide support through a combination of policy-easing maneuvers and targeted stimulus measures. The U.S. economy remained on a path of slow growth that nevertheless made it the best performing developed economy. Looking ahead, we expect the slow global growth environment to remain in place for the foreseeable future.
As always, we appreciate your business.
Sincerely,
Manning & Napier Advisors, LLC
1
New York Tax Exempt Series
Fund Commentary
(unaudited)
Investment Objective
To provide as high a level of current income exempt from federal income tax and New York State personal income tax as the Advisor believes is consistent with the preservation of capital. The Series invests primarily in municipal bonds that provide income exempt from federal income tax and New York State personal income tax.
Performance Commentary
Domestic fixed income markets generated modestly positive absolute returns in 2015, although performance across sectors was mixed. Municipal, mortgage-backed, and Treasury securities turned in positive performance for the year, whereas high yield and investment grade corporate bonds were negative.
During 2015, shorter-term municipal bond yields increased, while intermediate- and long-term municipal bond yields decreased. Meanwhile, the Bank of America Merrill Lynch 1-12 Year Municipal Bond Index returned 2.34%. Over the same time period, the New York Tax Exempt Series returned 1.54%, underperforming its benchmark on a relative basis. The Series’ underperformance was driven by its higher allocation to securities in the short-term range (0 to 5 years), and lower allocation to securities in the intermediate-term range (5 to 10 years) relative to the benchmark.
The Series maintains a significant overweight versus the benchmark to revenue bonds versus general obligation bonds, as well as an overweight to middle-tier (single-A and triple-B) credits within the revenue sector. In our view, revenue bonds continue to offer attractive spreads while exhibiting stable credit fundamentals, and tend to outperform in a rising rate environment as they are cyclical in nature. In addition, the revenue bond sector is generally insulated from political risk and long-term structural risks relating to pension obligations, which the general obligation sector is exposed to.
During 2016 we expect the fixed income landscape to continue to shift as the Federal Reserve considers further changes to U.S. monetary policy. Having raised the federal funds rate, we believe they now will seek to remain flexible and proceed slowly with small increases that do not follow a well-defined schedule. The diverging monetary policies of major central banks, geopolitical risks, commodity price pressures, and the potential for global growth to deviate from expectations could cause volatility in financial markets. In light of the current environment, it is important that investors remain active, flexible, and selective in their approach in order to avoid overvalued and risky areas of the market, something Manning & Napier has done for over 45 years.
Performance data quoted represents past performance and does not guarantee future results. The investment return and principal value of an investment will fluctuate, so that an investor’s shares, when redeemed, may be worth more or less than their original cost. Current performance may be higher or lower than that quoted; investors can obtain the most recent month-end performance at www.manning-napier.com or by calling (800) 466-3863.
Please see the next page for additional performance information as of December 31, 2015.
For regulatory purposes, this is not an offering in all states.
All investments involve risks, including possible loss of principal. There is an inverse relationship between bond prices and interest rates; as interest rates rise, bond prices (and therefore the value of bond funds) fall. Likewise, as interest rates fall, bond prices and the value of bond funds rise. The income earned by the Series may be subject to the Alternative Minimum Tax (AMT), depending on your tax situation.
2
New York Tax Exempt Series
Performance Update as of December 31, 2015
(unaudited)
AVERAGE ANNUAL TOTAL RETURNS AS OF DECEMBER 31, 2015 | ||||||||||||||||
| ONE YEAR1 | FIVE YEAR | TEN YEAR | SINCE INCEPTION2 | |||||||||||||
Manning & Napier Fund, Inc. - New York Tax Exempt Series3 | 1.54 | % | 2.50 | % | 2.92 | % | 3.88 | % | ||||||||
Bank of America (BofA) Merrill Lynch 1-12 Year Municipal Bond Index4 | 2.34 | % | 3.46 | % | 4.08 | % | 4.75 | % | ||||||||
The following graph compares the value of a $10,000 investment in the Manning & Napier Fund, Inc. - New York Tax Exempt Series for the ten years ended December 31, 2015 to the BofA Merrill Lynch 1-12 Year Municipal Bond Index.
1The returns shown are based on net asset values calculated for shareholder transactions and may differ from the returns shown in the financial highlights, which reflect adjustments made to the net asset values in accordance with accounting principles generally accepted in the United States of America.
2Performance numbers for the Series and Index are calculated from January 17, 1994, the Series’ inception date.
3The Series’ performance does not reflect the deduction of taxes that a shareholder would pay on fund distributions or the redemption of shares. The Series’ performance is historical and may not be indicative of future results. The performance returns shown are inclusive of the net expense ratio of the Series. For the year ended December 31, 2015, this net expense ratio was 0.60%. The gross expense ratio, which does not account for any voluntary or contractual waivers currently in effect, was 0.60% for the year ended December 31, 2015.
4The Bank of America (BofA) Merrill Lynch 1-12 Year Municipal Bond Index is a subset of the BofA Merrill Lynch U.S. Municipal Securities Index, an unmanaged, market-weighted index comprised of investment-grade, fixed rate, coupon bearing municipal bonds. The Index includes securities with maturities greater than one year but less than twelve years. The Index returns assume reinvestment of coupons and do not reflect any fees or expenses. Index returns provided by Interactive Data.
3
New York Tax Exempt Series
Shareholder Expense Example
(unaudited)
As a shareholder of the Series, you incur ongoing costs, including management fees, shareholder service fees and other Series expenses. This example is intended to help you understand your ongoing costs (in dollars) of investing in the Series and to compare these costs with the ongoing costs of investing in other mutual funds.
The example is based on an investment of $1,000 invested at the beginning of the period and held for the entire period (July 1, 2015 to December 31, 2015).
Actual Expenses
The first line of the table below provides information about actual account values and actual expenses. You may use the information in this line, together with the amount you invested, to estimate the expenses that you paid over the period. Simply divide your account value by $1,000 (for example, an $8,600 account value divided by $1,000 = 8.6), then multiply the result by the number in the first line under the heading entitled “Expenses Paid During Period” to estimate the expenses you paid on your account during this period.
Hypothetical Example for Comparison Purposes
The second line of the table below provides information about hypothetical account values and hypothetical expenses based on the Series’ actual expense ratio and an assumed rate of return of 5% per year before expenses, which is not the Series’ actual return. The hypothetical account values and expenses may not be used to estimate the actual ending account balance or expenses you paid during the period. You may use this information to compare the ongoing costs of investing in the Series and other funds. To do so, compare this 5% hypothetical example with the 5% hypothetical examples that appear in the shareholder reports of the other funds.
Please note that the expenses shown in the table are meant to highlight your ongoing costs only and do not reflect any transaction costs such as sales charges (loads), redemption fees, or exchange fees that you may incur in other mutual funds. Therefore, the second line of the table is useful in comparing ongoing costs only, and will not help you determine the relative total costs of owning different funds.
| BEGINNING ACCOUNT VALUE 7/1/15 | ENDING ACCOUNT VALUE 12/31/15 | EXPENSES PAID DURING PERIOD* 7/1/15-12/31/15 | ||||
Actual | $1,000.00 | $1,014.50 | $3.10 | |||
Hypothetical | ||||||
(5% return before expenses) | $1,000.00 | $1,022.13 | $3.11 |
*Expenses are equal to the Series’ annualized expense ratio (for the six-month period) of 0.61%, multiplied by the average account value over the period, multiplied by 184/365 (to reflect the one-half year period). Expenses are based on the most recent fiscal half year; therefore, the expense ratios stated above may differ from the expense ratios stated in the financial highlights, which is based on one-year data.
4
New York Tax Exempt Series
Portfolio Composition as of December 31, 2015
(unaudited)
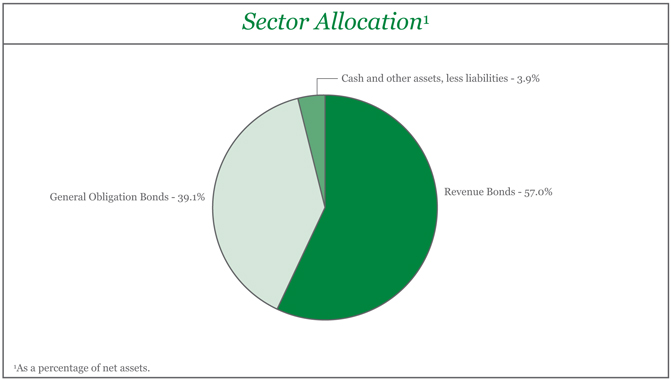
5
New York Tax Exempt Series
Investment Portfolio - December 31, 2015
| COUPON RATE | MATURITY DATE | CREDIT RATING1 (UNAUDITED) | PRINCIPAL AMOUNT | VALUE (NOTE 2) | ||||||||||||||||
NEW YORK MUNICIPAL BONDS - 96.1% | ||||||||||||||||||||
Albany City School District, G.O. Bond, BAM | 4.000% | 6/15/2017 | AA2 | $ | 200,000 | $ | 209,260 | |||||||||||||
Albany Municipal Water Finance Authority, Series A, Revenue Bond | 5.000% | 12/1/2016 | AA2 | 505,000 | 524,594 | |||||||||||||||
Albany Municipal Water Finance Authority, Series A, Revenue Bond | 5.000% | 12/1/2018 | AA2 | 1,295,000 | 1,433,448 | |||||||||||||||
Albany Municipal Water Finance Authority, Series A, Revenue Bond | 5.000% | 12/1/2019 | AA2 | 1,125,000 | 1,280,340 | |||||||||||||||
Amherst, Public Impt., G.O. Bond | 5.000% | 9/15/2018 | Aa2 | 365,000 | 403,175 | |||||||||||||||
Arlington Central School District, G.O. Bond | 4.000% | 12/15/2020 | Aa2 | 400,000 | 450,340 | |||||||||||||||
Arlington Central School District, G.O. Bond | 4.000% | 12/15/2021 | Aa2 | 300,000 | 342,672 | |||||||||||||||
Auburn City School District, G.O. Bond, BAM | 2.000% | 6/15/2018 | AA2 | 225,000 | 230,112 | |||||||||||||||
Bay Shore Union Free School District, G.O. Bond | 4.000% | 1/15/2018 | Aa3 | 1,175,000 | 1,244,795 | |||||||||||||||
Beacon, Public Impt., Series A, G.O. Bond | 3.000% | 10/1/2018 | Aa3 | 675,000 | 710,107 | |||||||||||||||
Bedford Central School District, G.O. Bond | 2.000% | 10/15/2021 | Aa2 | 500,000 | 513,835 | |||||||||||||||
Binghamton, Public Impt., G.O. Bond, MAC | 3.125% | 1/15/2017 | A2 | 400,000 | 409,912 | |||||||||||||||
Briarcliff Manor, Public Impt., Series A, G.O. Bond | 3.000% | 2/1/2020 | Aa2 | 265,000 | 284,059 | |||||||||||||||
Brookhaven, Public Impt., Series A, G.O. Bond | 2.000% | 3/15/2017 | Aa2 | 500,000 | 508,150 | |||||||||||||||
Brookhaven, Public Impt., Series A, G.O. Bond | 3.000% | 2/1/2019 | Aa2 | 1,385,000 | 1,465,912 | |||||||||||||||
Buffalo Fiscal Stability Authority, Sales Tax & State Aid, Series B, Revenue Bond, NATL | 5.000% | 9/1/2016 | Aa1 | 265,000 | 266,012 | |||||||||||||||
Buffalo Municipal Water Finance Authority, Series A, Revenue Bond | 4.000% | 7/1/2022 | A2 | 300,000 | 337,092 | |||||||||||||||
Buffalo Municipal Water Finance Authority, Series A, Revenue Bond | 5.000% | 7/1/2023 | A2 | 300,000 | 358,479 | |||||||||||||||
Cattaraugus County, Highway Impt., G.O. Bond | 2.000% | 4/15/2019 | Aa3 | 405,000 | 412,460 | |||||||||||||||
Chenango Valley Central School District, G.O. Bond, AGM | 2.125% | 6/15/2021 | A2 | 500,000 | 501,985 | |||||||||||||||
Clarence Central School District, G.O. Bond | 4.000% | 5/15/2021 | Aa2 | 250,000 | 283,880 | |||||||||||||||
Clarkstown Central School District, G.O. Bond | 4.000% | 10/15/2021 | Aa2 | 500,000 | 557,920 | |||||||||||||||
Clarkstown, G.O. Bond | 4.000% | 5/15/2019 | AA2 | 375,000 | 410,775 | |||||||||||||||
Cortland County, Public Impt., G.O. Bond, BAM | 2.750% | 9/1/2017 | AA2 | 265,000 | 273,072 | |||||||||||||||
Cortland County, Public Impt., G.O. Bond, BAM | 2.750% | 9/1/2019 | AA2 | 305,000 | 321,263 | |||||||||||||||
DeWitt, Public Impt., G.O. Bond | 3.000% | 5/15/2017 | AA2 | 315,000 | 324,570 | |||||||||||||||
Dutchess County, G.O. Bond | 2.125% | 12/15/2023 | AA2 | 850,000 | 872,236 | |||||||||||||||
Dutchess County, Public Impt., G.O. Bond | 5.000% | 10/1/2018 | Aa2 | 640,000 | 685,389 | |||||||||||||||
East Irondequoit Central School District, G.O. Bond | 3.000% | 6/15/2018 | Aa2 | 310,000 | 325,739 | |||||||||||||||
East Islip Union Free School District, G.O. Bond | 5.000% | 6/15/2018 | AA2 | 305,000 | 334,353 | |||||||||||||||
Erie County Fiscal Stability Authority, Public Impt., Series A, Revenue Bond | 4.000% | 3/15/2019 | Aa1 | 600,000 | 653,256 | |||||||||||||||
Erie County Fiscal Stability Authority, Series A, Revenue Bond | 4.125% | 5/15/2018 | Aa1 | 450,000 | 482,180 | |||||||||||||||
Erie County Fiscal Stability Authority, Series C, Revenue Bond | 5.000% | 3/15/2018 | Aa1 | 1,025,000 | 1,113,960 | |||||||||||||||
Erie County Water Authority, Revenue Bond | 5.000% | 12/1/2017 | Aa2 | 300,000 | 322,521 | |||||||||||||||
Essex County, Public Impt., G.O. Bond | 5.000% | 5/1/2020 | AA2 | 500,000 | 573,375 | |||||||||||||||
The accompanying notes are an integral part of the financial statements.
6
New York Tax Exempt Series
Investment Portfolio - December 31, 2015
| COUPON RATE | MATURITY DATE | CREDIT RATING1 (UNAUDITED) | PRINCIPAL AMOUNT | VALUE (NOTE 2) | ||||||||||||||||
NEW YORK MUNICIPAL BONDS (continued) | ||||||||||||||||||||
Fairport Central School District, School Impt., G.O. Bond | 2.000% | 6/15/2018 | AA2 | $ | 305,000 | $ | 313,095 | |||||||||||||
Gananda Central School District, G.O. Bond | 3.000% | 6/15/2019 | AA2 | 250,000 | 263,753 | |||||||||||||||
Gates Chili Central School District, School Impt., G.O. Bond | 2.000% | 6/15/2019 | Aa3 | 215,000 | 220,837 | |||||||||||||||
Geneva, Public Impt., G.O. Bond | 2.500% | 2/1/2017 | A2 | 870,000 | 886,147 | |||||||||||||||
Greece Central School District, G.O. Bond, AGM | 4.000% | 6/15/2019 | Aa3 | 2,675,000 | 2,786,467 | |||||||||||||||
Greece Central School District, G.O. Bond, BAM | 2.500% | 6/15/2023 | Aa3 | 620,000 | 647,106 | |||||||||||||||
Herricks Union Free School District, G.O. Bond | 2.000% | 11/1/2017 | Aa2 | 420,000 | 428,942 | |||||||||||||||
Hyde Park Central School District, G.O. Bond | 2.000% | 6/15/2018 | AA2 | 355,000 | 365,107 | |||||||||||||||
Iroquois Central School District, School Impt., G.O. Bond | 2.000% | 6/15/2021 | Aa2 | 500,000 | 511,960 | |||||||||||||||
Islip Union Free School District, School Impt., G.O. Bond | 2.250% | 3/1/2019 | Aa3 | 475,000 | 490,955 | |||||||||||||||
Jamestown City School District, G.O. Bond | 3.000% | 4/1/2019 | A2 | 200,000 | 208,216 | |||||||||||||||
Kings Park Central School District, G.O. Bond | 2.000% | 8/1/2020 | Aa2 | 500,000 | 514,170 | |||||||||||||||
Lockport City School District, G.O. Bond, AGM | 2.000% | 8/1/2019 | A1 | 450,000 | 459,662 | |||||||||||||||
Longwood Central School District, Suffolk County, School Impt., G.O. Bond | 2.250% | 6/15/2018 | AA2 | 590,000 | 608,119 | |||||||||||||||
Mamaroneck, Various Purposes, Public Impt., G.O. Bond | 2.000% | 7/15/2020 | Aa1 | 335,000 | 347,120 | |||||||||||||||
Metropolitan Transportation Authority, Series F, Revenue Bond | 5.000% | 11/15/2017 | A1 | 835,000 | 899,788 | |||||||||||||||
Metropolitan Transportation Authority, Series F, Revenue Bond | 5.000% | 11/15/2019 | A1 | 1,000,000 | 1,142,530 | |||||||||||||||
Metropolitan Transportation Authority, Series F, Revenue Bond | 5.000% | 11/15/2022 | A1 | 250,000 | 303,475 | |||||||||||||||
Metropolitan Transportation Authority, Transit Impt., Prerefunded Balance, Series A, Revenue Bond, NATL | 5.000% | 11/15/2022 | A3 | 1,545,000 | 1,606,460 | |||||||||||||||
Metropolitan Transportation Authority, Transit Impt., Prerefunded Balance, Series B, Revenue Bond, NATL | 5.000% | 11/15/2019 | A3 | 2,590,000 | 2,693,030 | |||||||||||||||
Metropolitan Transportation Authority, Transit Impt., Series 2008C, Revenue Bond | 6.500% | 11/15/2028 | A1 | 1,000,000 | 1,152,560 | |||||||||||||||
Metropolitan Transportation Authority, Transit Impt., Series A, Revenue Bond, NATL | 5.250% | 11/15/2017 | Aa2 | 1,000,000 | 1,082,230 | |||||||||||||||
Metropolitan Transportation Authority, Transit Impt., Series A, Revenue Bond, NATL | 5.250% | 11/15/2018 | Aa2 | 200,000 | 223,658 | |||||||||||||||
Metropolitan Transportation Authority, Transit Impt., Series A-2, Revenue Bond | 5.000% | 11/15/2017 | A1 | 340,000 | 366,381 | |||||||||||||||
Metropolitan Transportation Authority, Transit Impt., Series C, Revenue Bond | 5.000% | 11/15/2018 | A1 | 650,000 | 722,306 | |||||||||||||||
Metropolitan Transportation Authority, Transit Impt., Series C, Revenue Bond | 5.000% | 11/15/2019 | A1 | 500,000 | 571,265 | |||||||||||||||
The accompanying notes are an integral part of the financial statements.
7
New York Tax Exempt Series
Investment Portfolio - December 31, 2015
| COUPON RATE | MATURITY DATE | CREDIT RATING1 (UNAUDITED) | PRINCIPAL AMOUNT | VALUE (NOTE 2) | ||||||||||||||||
NEW YORK MUNICIPAL BONDS (continued) | ||||||||||||||||||||
Metropolitan Transportation Authority, Transit Impt., Series G, Revenue Bond | 5.000% | 11/15/2018 | A1 | $ | 1,000,000 | $ | 1,111,240 | |||||||||||||
Metropolitan Transportation Authority, Transit Impt., Subseries B-2, Revenue Bond | 5.000% | 11/15/2021 | A1 | 1,000,000 | 1,193,780 | |||||||||||||||
Metropolitan Transportation Authority, Transit Impt., Subseries D-2, Revenue Bond3 | 0.370% | 11/15/2044 | A1 | 600,000 | 595,644 | |||||||||||||||
Monroe County Water Authority, Water Utility Impt., Revenue Bond | 4.500% | 8/1/2016 | Aa2 | 310,000 | 317,034 | |||||||||||||||
Monroe County Water Authority, Water Utility Impt., Revenue Bond | 5.000% | 8/1/2019 | Aa2 | 455,000 | 513,518 | |||||||||||||||
Monroe County, Public Impt., G.O. Bond, BAM | 5.000% | 6/1/2018 | AA2 | 500,000 | 546,080 | |||||||||||||||
Naples Central School District, G.O. Bond, BAM | 2.500% | 6/15/2020 | AA2 | 710,000 | 745,528 | |||||||||||||||
Nassau County Interim Finance Authority, Sales Tax Secured, Series A, Revenue Bond | 4.000% | 11/15/2016 | Aa1 | 400,000 | 412,116 | |||||||||||||||
Nassau County Sewer & Storm Water Finance Authority, Multi Utility Impt., Prerefunded Balance, Series A, Revenue Bond, BHAC | 5.000% | 11/1/2018 | WR4 | 350,000 | 389,736 | |||||||||||||||
Nassau County Sewer & Storm Water Finance Authority, Series A, Revenue Bond | 5.000% | 10/1/2017 | Aa3 | 500,000 | 536,820 | |||||||||||||||
Nassau County Sewer & Storm Water Finance Authority, Series A, Revenue Bond | 5.000% | 10/1/2018 | Aa3 | 500,000 | 554,825 | |||||||||||||||
Nassau County Sewer & Storm Water Finance Authority, Series A, Revenue Bond | 5.000% | 10/1/2022 | Aa3 | 500,000 | 609,150 | |||||||||||||||
Nassau County, Public Impt., Series A, G.O. Bond | 5.000% | 4/1/2018 | A2 | 500,000 | 542,570 | |||||||||||||||
Nassau County, Public Impt., Series A, G.O. Bond | 5.000% | 4/1/2019 | A2 | 2,425,000 | 2,707,537 | |||||||||||||||
New Rochelle City School District, G.O. Bond | 5.000% | 12/15/2017 | Aa2 | 365,000 | 394,306 | |||||||||||||||
New York City Transitional Finance Authority, Building Aid, Public Impt., Series S-1, Revenue Bond | 5.000% | 7/15/2018 | Aa2 | 1,000,000 | 1,097,720 | |||||||||||||||
New York City Transitional Finance Authority, Building Aid, Public Impt., Series S-1, Revenue Bond | 5.000% | 7/15/2019 | Aa2 | 1,000,000 | 1,131,790 | |||||||||||||||
New York City Transitional Finance Authority, Building Aid, Public Impt., Series S-2, Revenue Bond | 5.000% | 7/15/2023 | Aa2 | 2,000,000 | 2,436,740 | |||||||||||||||
New York City Transitional Finance Authority, Future Tax Secured, Prerefunded Balance, Series B, Revenue Bond | 5.000% | 11/1/2021 | WR4 | 275,000 | 290,463 | |||||||||||||||
New York City Transitional Finance Authority, Future Tax Secured, Prerefunded Balance, Series B, Revenue Bond | 5.000% | 11/1/2024 | WR4 | 285,000 | 301,026 | |||||||||||||||
New York City Transitional Finance Authority, Future Tax Secured, Public Impt., Prerefunded Balance, Revenue Bond | 5.000% | 8/1/2021 | WR4 | 770,000 | 790,551 | |||||||||||||||
New York City Transitional Finance Authority, Future Tax Secured, Public Impt., Prerefunded Balance, Subseries A-1, Revenue Bond | 5.000% | 11/1/2017 | Aa1 | 1,000,000 | 1,075,640 | |||||||||||||||
The accompanying notes are an integral part of the financial statements.
8
New York Tax Exempt Series
Investment Portfolio - December 31, 2015
| COUPON RATE | MATURITY DATE | CREDIT RATING1 (UNAUDITED) | PRINCIPAL AMOUNT | VALUE (NOTE 2) | ||||||||||||||||
NEW YORK MUNICIPAL BONDS (continued) | ||||||||||||||||||||
New York City Transitional Finance Authority, Future Tax Secured, Public Impt., Series A-1, Revenue Bond | 3.250% | 8/1/2035 | Aa1 | $ | 1,000,000 | $ | 1,023,520 | |||||||||||||
New York City Transitional Finance Authority, Future Tax Secured, Public Impt., Series E-1, Revenue Bond | 5.000% | 2/1/2026 | Aa1 | 475,000 | 589,356 | |||||||||||||||
New York City Transitional Finance Authority, Future Tax Secured, Public Impt., Subseries B1, Revenue Bond | 5.000% | 11/1/2023 | Aa1 | 2,000,000 | 2,454,360 | |||||||||||||||
New York City Transitional Finance Authority, Future Tax Secured, Series B, Revenue Bond | 5.000% | 11/1/2023 | Aa1 | 2,500,000 | 3,077,450 | |||||||||||||||
New York City Transitional Finance Authority, Future Tax Secured, Series C, Revenue Bond | 5.000% | 11/1/2025 | Aa1 | 750,000 | 937,523 | |||||||||||||||
New York City Water & Sewer System, Prerefunded Balance, Revenue Bond | 5.000% | 6/15/2021 | WR4 | 315,000 | 346,588 | |||||||||||||||
New York City Water & Sewer System, Series AA, Prerefunded Balance, Revenue Bond | 5.000% | 6/15/2020 | Aa1 | 950,000 | 1,045,266 | |||||||||||||||
New York City Water & Sewer System, Series BB, Revenue Bond | 5.000% | 6/15/2020 | Aa1 | 500,000 | 564,750 | |||||||||||||||
New York City Water & Sewer System, Series GG, Revenue Bond | 4.000% | 6/15/2020 | Aa1 | 700,000 | 779,478 | |||||||||||||||
New York City Water & Sewer System, Series HH, Revenue Bond | 5.000% | 6/15/2025 | Aa1 | 3,000,000 | 3,773,220 | |||||||||||||||
New York City Water & Sewer System, Unrefunded Balance, Revenue Bond | 5.000% | 6/15/2021 | Aa1 | 1,590,000 | 1,747,187 | |||||||||||||||
New York City Water & Sewer System, Water Utility Impt., Prerefunded Balance, Series EE, Revenue Bond | 5.000% | 6/15/2017 | Aa1 | 450,000 | 477,783 | |||||||||||||||
New York City Water & Sewer System, Water Utility Impt., Prerefunded Balance, Series EE, Revenue Bond | 5.000% | 6/15/2018 | Aa1 | 175,000 | 192,549 | |||||||||||||||
New York City, Series 1, G.O. Bond | 5.000% | 8/1/2023 | Aa2 | 2,700,000 | 3,308,634 | |||||||||||||||
New York City, Series C, G.O. Bond | 5.000% | 8/1/2024 | Aa2 | 4,865,000 | 6,026,276 | |||||||||||||||
New York Local Government Assistance Corp., Subseries A-5/6, Revenue Bond | 5.500% | 4/1/2019 | Aa1 | 445,000 | 508,257 | |||||||||||||||
New York Municipal Bond Bank Agency, Revenue Bond | 4.000% | 12/1/2017 | AA2 | 2,000,000 | 2,118,580 | |||||||||||||||
The New York Power Authority, Series A, Revenue Bond | 4.000% | 11/15/2018 | Aa1 | 220,000 | 238,460 | |||||||||||||||
The New York Power Authority, Series C, Revenue Bond, NATL | 5.000% | 11/15/2017 | Aa1 | 500,000 | 538,600 | |||||||||||||||
New York State Dormitory Authority, Consolidated Service Contract, Revenue Bond | 5.000% | 7/1/2019 | Aa2 | 750,000 | 846,023 | |||||||||||||||
New York State Dormitory Authority, Income Tax Revenue, Series E, Revenue Bond | 3.500% | 3/15/2037 | Aa1 | 850,000 | 868,964 | |||||||||||||||
The accompanying notes are an integral part of the financial statements.
9
New York Tax Exempt Series
Investment Portfolio - December 31, 2015
| COUPON RATE | MATURITY DATE | CREDIT RATING1 (UNAUDITED) | PRINCIPAL AMOUNT | VALUE (NOTE 2) | ||||||||||||||||
NEW YORK MUNICIPAL BONDS (continued) | ||||||||||||||||||||
New York State Dormitory Authority, Public Impt., Series E, Revenue Bond | 5.000% | 8/15/2017 | Aa1 | $ | 3,000,000 | $ | 3,201,900 | |||||||||||||
New York State Dormitory Authority, Rochester Institute of Technology, Revenue Bond | 4.000% | 7/1/2017 | A1 | 300,000 | 314,286 | |||||||||||||||
New York State Dormitory Authority, Rochester Institute of Technology, University & College Impt., Prerefunded Balance, Series A, Revenue Bond | 5.750% | 7/1/2025 | A1 | 500,000 | 558,230 | |||||||||||||||
New York State Dormitory Authority, School Impt., Series A, Revenue Bond, AGM | 3.000% | 10/1/2017 | A2 | 750,000 | 776,745 | |||||||||||||||
New York State Dormitory Authority, Series B, Revenue Bond, AGM | 4.000% | 10/1/2018 | AA2 | 250,000 | 268,558 | |||||||||||||||
New York State Dormitory Authority, Series B, Revenue Bond, AGM | 5.000% | 4/1/2019 | AA2 | 1,265,000 | 1,411,955 | |||||||||||||||
New York State Dormitory Authority, Series F, Revenue Bond, AGM | 5.000% | 10/1/2017 | A2 | 2,750,000 | 2,949,265 | |||||||||||||||
New York State Dormitory Authority, Series F, Revenue Bond, AGM | 5.000% | 10/1/2018 | A2 | 500,000 | 552,740 | |||||||||||||||
New York State Dormitory Authority, University & College Impt., Series A, Revenue Bond | 5.000% | 3/15/2017 | Aa1 | 500,000 | 526,070 | |||||||||||||||
New York State Dormitory Authority, University & College Impt., Series A, Revenue Bond | 5.000% | 7/1/2020 | Aa3 | 225,000 | 254,468 | |||||||||||||||
New York State Environmental Facilities Corp., Revenue Bond | 5.000% | 6/15/2017 | Aaa | 1,000,000 | 1,061,760 | |||||||||||||||
New York State Environmental Facilities Corp., Revenue Bond | 5.000% | 6/15/2025 | Aaa | 1,000,000 | 1,185,870 | |||||||||||||||
New York State Environmental Facilities Corp., Subseries A, Revenue Bond | 5.000% | 6/15/2020 | Aaa | 1,250,000 | 1,453,438 | |||||||||||||||
New York State Thruway Authority Highway & Bridge Trust Fund, Highway Impt., Series B, Revenue Bond | 5.000% | 4/1/2019 | AA2 | 350,000 | 387,117 | |||||||||||||||
New York State Thruway Authority Highway & Bridge Trust Fund, Series B, Revenue Bond | 5.000% | 4/1/2018 | AA2 | 225,000 | 245,182 | |||||||||||||||
New York State Thruway Authority, Highway Impt., Revenue Bond | 5.000% | 4/1/2018 | AA2 | 2,025,000 | 2,206,642 | |||||||||||||||
New York State Thruway Authority, Highway Impt., Series A, Revenue Bond | 5.000% | 3/15/2017 | Aa1 | 470,000 | 494,210 | |||||||||||||||
New York State Thruway Authority, Highway Impt., Series A, Revenue Bond | 5.000% | 3/15/2020 | Aa1 | 550,000 | 634,128 | |||||||||||||||
New York State Thruway Authority, Highway Impt., Series I, Revenue Bond | 5.000% | 1/1/2018 | A2 | 590,000 | 636,250 | |||||||||||||||
New York State Thruway Authority, Highway Impt., Series I, Revenue Bond | 4.000% | 1/1/2019 | A2 | 525,000 | 566,412 | |||||||||||||||
New York State Urban Development Corp., Public Impt., Series A, Revenue Bond | 5.000% | 3/15/2023 | Aa1 | 1,285,000 | 1,506,136 | |||||||||||||||
New York State Urban Development Corp., Public Impt., Series A, Revenue Bond | 5.000% | 3/15/2025 | Aa1 | 1,170,000 | 1,438,340 | |||||||||||||||
The accompanying notes are an integral part of the financial statements.
10
New York Tax Exempt Series
Investment Portfolio - December 31, 2015
| COUPON RATE | MATURITY DATE | CREDIT RATING1 (UNAUDITED) | PRINCIPAL AMOUNT | VALUE (NOTE 2) | ||||||||||||||||
NEW YORK MUNICIPAL BONDS (continued) | ||||||||||||||||||||
New York State Urban Development Corp., Public Impt., Series A-2, Revenue Bond, AMBAC | 5.500% | 3/15/2017 | Aa1 | $ | 505,000 | $ | 534,042 | |||||||||||||
New York State Urban Development Corp., Public Impt., Series B, Revenue Bond | 5.000% | 3/15/2017 | Aa1 | 675,000 | 709,769 | |||||||||||||||
New York State Urban Development Corp., Service Contract, Series D, Revenue Bond | 5.250% | 1/1/2017 | AA2 | 1,500,000 | 1,569,285 | |||||||||||||||
New York State, Water Utility Impt., Series A, G.O. Bond | 5.000% | 3/1/2018 | Aa1 | 3,440,000 | 3,754,175 | |||||||||||||||
New York State, Water Utility Impt., Series A, G.O. Bond | 5.000% | 3/1/2021 | Aa1 | 1,000,000 | 1,191,490 | |||||||||||||||
New York State, Water Utility Impt., Series E, G.O. Bond | 5.000% | 12/15/2019 | Aa1 | 565,000 | 652,360 | |||||||||||||||
Niagara County, Water Utility Impt., G.O. Bond | 2.000% | 2/1/2020 | Aa3 | 500,000 | 513,870 | |||||||||||||||
Niagara-Wheatfield Central School District, Prerefunded Balance, G.O. Bond, NATL | 4.125% | 2/15/2019 | A2 | 610,000 | 633,820 | |||||||||||||||
Niagara-Wheatfield Central School District, Prerefunded Balance, G.O. Bond, NATL | 4.125% | 2/15/2020 | A2 | 850,000 | 883,192 | |||||||||||||||
Niskayuna Central School District, G.O. Bond | 3.000% | 4/15/2018 | AA2 | 360,000 | 376,355 | |||||||||||||||
North Colonie Central School District, G.O. Bond | 4.000% | 7/15/2020 | AA2 | 400,000 | 446,432 | |||||||||||||||
Oneida County, Public Impt., G.O. Bond, AGM | 2.500% | 5/15/2019 | A1 | 500,000 | 521,975 | |||||||||||||||
Oneida County, Public Impt., G.O. Bond, AGM | 3.000% | 5/1/2020 | A1 | 400,000 | 417,752 | |||||||||||||||
Onondaga County Water Authority, Water Utility Impt., Series A, Revenue Bond | 3.000% | 9/15/2017 | Aa3 | 195,000 | 202,141 | |||||||||||||||
Onondaga County Water Authority, Water Utility Impt., Series A, Revenue Bond, BAM | 3.000% | 9/15/2018 | Aa3 | 200,000 | 210,582 | |||||||||||||||
Onondaga County, Public Impt., G.O. Bond | 4.000% | 5/1/2017 | Aa2 | 500,000 | 522,135 | |||||||||||||||
Onondaga County, Public Impt., G.O. Bond | 4.000% | 5/1/2018 | Aa2 | 1,400,000 | 1,499,764 | |||||||||||||||
Onondaga County, Public Impt., G.O. Bond | 5.000% | 5/1/2020 | Aa2 | 250,000 | 289,767 | |||||||||||||||
Onondaga County, Public Impt., G.O. Bond | 5.000% | 5/15/2022 | Aa2 | 1,000,000 | 1,211,150 | |||||||||||||||
Onondaga County, Public Impt., G.O. Bond | 5.000% | 5/15/2023 | Aa2 | 1,000,000 | 1,234,130 | |||||||||||||||
Onondaga County, Public Impt., Series A, G.O. Bond | 5.000% | 3/1/2017 | Aa2 | 220,000 | 231,211 | |||||||||||||||
Orange County, Public Impt., G.O. Bond, AGM | 2.000% | 8/15/2017 | Aa3 | 260,000 | 264,532 | |||||||||||||||
Orange County, Series A, G.O. Bond | 5.000% | 7/15/2017 | Aa3 | 550,000 | 584,402 | |||||||||||||||
Orange County, Various Purposes Impt., Series A, G.O. Bond, AGM | 5.000% | 3/1/2023 | Aa3 | 520,000 | 625,160 | |||||||||||||||
Ossining Union Free School District, School Impt., G.O. Bond | 2.250% | 9/1/2016 | Aa2 | 730,000 | 738,760 | |||||||||||||||
Pittsford Central School District, G.O. Bond | 4.000% | 10/1/2021 | Aa1 | 350,000 | 398,233 | |||||||||||||||
Port Authority of New York & New Jersey, Airport & Marina Impt., Consolidated Series 189, Revenue Bond | 5.000% | 5/1/2024 | Aa3 | 800,000 | 984,288 | |||||||||||||||
Port Authority of New York & New Jersey, Airport & Marina Impt., Series 179, Revenue Bond | 5.000% | 12/1/2016 | Aa3 | 460,000 | 478,883 | |||||||||||||||
Port Authority of New York & New Jersey, Airport & Marina Impt., Series 179, Revenue Bond | 5.000% | 12/1/2018 | Aa3 | 400,000 | 444,916 | |||||||||||||||
The accompanying notes are an integral part of the financial statements.
11
New York Tax Exempt Series
Investment Portfolio - December 31, 2015
| COUPON RATE | MATURITY DATE | CREDIT RATING1 (UNAUDITED) | PRINCIPAL AMOUNT | VALUE (NOTE 2) | ||||||||||||||||
NEW YORK MUNICIPAL BONDS (continued) | ||||||||||||||||||||
Port Authority of New York & New Jersey, Airport & Marina Impt., Series 179, Revenue Bond | 5.000% | 12/1/2024 | Aa3 | $ | 765,000 | $ | 937,683 | |||||||||||||
Port Authority of New York & New Jersey, Consolidated Series 184, Revenue Bond | 5.000% | 9/1/2025 | Aa3 | 2,500,000 | 3,085,775 | |||||||||||||||
Port Authority of New York & New Jersey, Series 180, Revenue Bond | 4.000% | 6/1/2016 | Aa3 | 400,000 | 406,100 | |||||||||||||||
Port Authority of New York & New Jersey, Series 180, Revenue Bond | 4.000% | 6/1/2019 | Aa3 | 200,000 | 218,842 | |||||||||||||||
Port Washington Union Free School District, G.O. Bond | 4.000% | 7/1/2017 | Aa2 | 300,000 | 314,469 | |||||||||||||||
Putnam County, Parking Facility Impt., G.O. Bond | 2.000% | 11/15/2018 | Aa2 | 300,000 | 307,977 | |||||||||||||||
Rensselaer County, Nursing Homes, Public Impt., G.O. Bond | 2.000% | 7/15/2020 | AA2 | 930,000 | 948,079 | |||||||||||||||
Rochester, School Impt., Series A, G.O. Bond, AMBAC | 5.000% | 8/15/2022 | Aa3 | 95,000 | 114,956 | |||||||||||||||
Rochester, School Impt., Series II, G.O. Bond | 5.000% | 2/1/2019 | Aa3 | 1,625,000 | 1,812,996 | |||||||||||||||
Roslyn Union Free School District, G.O. Bond | 5.000% | 10/15/2020 | Aa1 | 215,000 | 252,943 | |||||||||||||||
Sachem Central School District, G.O. Bond, NATL | 5.250% | 10/15/2017 | A3 | 225,000 | 242,084 | |||||||||||||||
Scarsdale Union Free School District, G.O. Bond | 5.000% | 2/1/2017 | Aaa | 320,000 | 334,976 | |||||||||||||||
Shenendehowa Central School District, G.O. Bond | 4.000% | 7/15/2020 | AA2 | 475,000 | 532,584 | �� | ||||||||||||||
South Glens Falls Central School District, School Impt., Unrefunded Balance, G.O. Bond, NATL | 5.375% | 6/15/2018 | A1 | 95,000 | 97,185 | |||||||||||||||
South Jefferson Central School District, G.O. Bond, BAM | 2.000% | 6/15/2019 | AA2 | 710,000 | 725,876 | |||||||||||||||
Suffolk County Water Authority, Revenue Bond | 5.000% | 6/1/2021 | AA2 | 1,225,000 | 1,454,271 | |||||||||||||||
Suffolk County Water Authority, Revenue Bond | 4.000% | 6/1/2022 | AA2 | 200,000 | 226,652 | |||||||||||||||
Suffolk County Water Authority, Water Utility Impt., Revenue Bond | 5.000% | 6/1/2018 | AA2 | 2,000,000 | 2,190,860 | |||||||||||||||
Suffolk County Water Authority, Water Utility Impt., | ||||||||||||||||||||
Revenue Bond | 5.000% | 6/1/2019 | AA2 | 775,000 | 875,471 | |||||||||||||||
Suffolk County Water Authority, Water Utility Impt., Series A, Revenue Bond | 5.000% | 6/1/2018 | AA2 | 200,000 | 219,086 | |||||||||||||||
Suffolk County, G.O. Bond, AGM | 5.000% | 2/1/2018 | A2 | 500,000 | 541,465 | |||||||||||||||
Suffolk County, Series B, G.O. Bond, AGM | 5.000% | 10/1/2019 | AA2 | 1,000,000 | 1,131,430 | |||||||||||||||
Sullivan County, Public Impt., G.O. Bond | 2.000% | 6/1/2019 | AA2 | 1,015,000 | 1,043,075 | |||||||||||||||
Syracuse, Public Impt., Series A, G.O. Bond, AGM | 4.000% | 6/1/2018 | A1 | 545,000 | 582,294 | |||||||||||||||
Tonawanda, Public Impt., G.O. Bond | 2.000% | 6/1/2017 | AA2 | 260,000 | 264,342 | |||||||||||||||
Tonawanda, Public Impt., G.O. Bond | 2.000% | 6/1/2018 | AA2 | 365,000 | 373,603 | |||||||||||||||
Tonawanda, Public Impt., G.O. Bond | 2.000% | 6/1/2019 | AA2 | 355,000 | 364,095 | |||||||||||||||
Triborough Bridge & Tunnel Authority, Highway Impt., Prerefunded Balance, Series A, Revenue Bond | 5.000% | 11/15/2020 | Aa3 | 530,000 | 580,663 | |||||||||||||||
Triborough Bridge & Tunnel Authority, Highway Impt., Prerefunded Balance, Series A, Revenue Bond, NATL | 4.750% | 1/1/2019 | AA2 | 245,000 | 245,000 | |||||||||||||||
Triborough Bridge & Tunnel Authority, Highway Impt., Series A, Revenue Bond | 5.000% | 11/15/2018 | Aa3 | 890,000 | 989,004 | |||||||||||||||
The accompanying notes are an integral part of the financial statements.
12
New York Tax Exempt Series
Investment Portfolio - December 31, 2015
| COUPON RATE | MATURITY DATE | CREDIT RATING1 (UNAUDITED) | PRINCIPAL AMOUNT | VALUE (NOTE 2) | ||||||||||||||||
NEW YORK MUNICIPAL BONDS (continued) | ||||||||||||||||||||
Triborough Bridge & Tunnel Authority, Highway Impt., Series A, Revenue Bond | 5.000% | 11/15/2019 | Aa3 | $ | 1,075,000 | $ | 1,232,617 | |||||||||||||
Triborough Bridge & Tunnel Authority, Highway Impt., Series A, Revenue Bond | 5.000% | 11/15/2023 | Aa3 | 350,000 | 433,492 | |||||||||||||||
Triborough Bridge & Tunnel Authority, Prerefunded Balance, Series C, Revenue Bond | 5.000% | 11/15/2021 | WR4 | 305,000 | 339,593 | |||||||||||||||
Triborough Bridge & Tunnel Authority, Prerefunded Balance, Subseries D, Revenue Bond | 5.000% | 11/15/2022 | WR4 | 310,000 | 345,253 | |||||||||||||||
Triborough Bridge & Tunnel Authority, Series A, Revenue Bond | 4.000% | 11/15/2017 | A1 | 430,000 | 454,153 | |||||||||||||||
Triborough Bridge & Tunnel Authority, Series B, Revenue Bond | 5.000% | 11/15/2017 | Aa3 | 350,000 | 376,817 | |||||||||||||||
Triborough Bridge & Tunnel Authority, Series B, Revenue Bond | 4.000% | 11/15/2018 | Aa3 | 250,000 | 271,125 | |||||||||||||||
Triborough Bridge & Tunnel Authority, Series B, Revenue Bond | 5.000% | 11/15/2019 | Aa3 | 820,000 | 940,228 | |||||||||||||||
Triborough Bridge & Tunnel Authority, Series B, Revenue Bond | 5.000% | 11/15/2022 | Aa3 | 1,000,000 | 1,221,700 | |||||||||||||||
Triborough Bridge & Tunnel Authority, Series B, Revenue Bond | 5.000% | 11/15/2024 | Aa3 | 1,000,000 | 1,220,060 | |||||||||||||||
Triborough Bridge & Tunnel Authority, Series C, Revenue Bond | 5.000% | 11/15/2018 | Aa3 | 500,000 | 556,370 | |||||||||||||||
Ulster County, Public Impt., G.O. Bond | 4.000% | 11/15/2019 | AA2 | 510,000 | 562,647 | |||||||||||||||
Union Endicott Central School District, G.O. Bond, BAM | 2.125% | 6/15/2019 | AA2 | 580,000 | 596,600 | |||||||||||||||
Voorheesville Central School District, G.O. Bond | 5.000% | 6/15/2021 | AA2 | 500,000 | 586,840 | |||||||||||||||
Warren County, Public Impt., G.O. Bond, AGM | 4.000% | 7/15/2020 | AA2 | 500,000 | 548,425 | |||||||||||||||
Wayne County, Public Impt., G.O. Bond | 3.000% | 6/1/2021 | Aa2 | 295,000 | 318,420 | |||||||||||||||
Webster Central School District, G.O. Bond | 4.000% | 10/1/2018 | AA2 | 375,000 | 404,107 | |||||||||||||||
Westchester County, Prerefunded Balance, Series A, G.O. Bond | 3.000% | 10/15/2017 | WR4 | 5,000 | 5,196 | |||||||||||||||
Westchester County, Unrefunded Balance, Series A, G.O. Bond | 3.000% | 10/15/2017 | Aa1 | 410,000 | 426,675 | |||||||||||||||
Westchester County, Unrefunded Balance, Series C, G.O. Bond | 5.000% | 11/1/2017 | Aa1 | 495,000 | 533,541 | |||||||||||||||
Wilson Central School District, G.O. Bond | 3.000% | 6/15/2018 | Aa3 | 420,000 | 440,122 | |||||||||||||||
Yonkers, Public Impt., Series C, G.O. Bond, AGM | 2.000% | 10/15/2017 | A2 | 500,000 | 509,510 | |||||||||||||||
Yonkers, Public Impt., Series C, G.O., AGM | 4.000% | 8/15/2020 | A2 | 350,000 | 389,183 | |||||||||||||||
|
| |||||||||||||||||||
TOTAL MUNICIPAL BONDS | 167,873,988 | |||||||||||||||||||
|
| |||||||||||||||||||
The accompanying notes are an integral part of the financial statements.
13
New York Tax Exempt Series
Investment Portfolio - December 31, 2015
VALUE (NOTE 2) | ||||
TOTAL INVESTMENTS - 96.1% | $ | 167,873,988 | ||
OTHER ASSETS, LESS LIABILITIES - 3.9% | 6,729,117 | |||
|
| |||
NET ASSETS - 100% | $ | 174,603,105 | ||
|
| |||
KEY:
G.O. Bond - General Obligation Bond
Impt. - Improvement
Scheduled principal and interest payments are guaranteed by:
AGM (Assurance Guaranty Municipal Corp.)
AMBAC (AMBAC Assurance Corp.)
BAM (Build America Mutual Assurance Co.)
BHAC (Berkshire Hathaway Assurance Corp.)
MAC (Municipal Assurance Corp.)
NATL (National Public Finance Guarantee Corp.)
The insurance does not guarantee the market value of the municipal bonds.
1 Credit ratings from Moody’s (unaudited).
2 Credit ratings from S&P (unaudited).
3 The coupon rate is floating and is the effective rate as of December 31, 2015.
4 Credit rating has been withdrawn. As of December 31, 2015, there is no rating available (unaudited).
The accompanying notes are an integral part of the financial statements.
14
New York Tax Exempt Series
Statement of Assets and Liabilities
December 31, 2015
ASSETS: | ||||
Investments, at value (identified cost $165,698,953) (Note 2) | $ | 167,873,988 | ||
Cash | 5,302,407 | |||
Interest receivable | 1,585,332 | |||
Receivable for fund shares sold | 318,993 | |||
|
| |||
TOTAL ASSETS | 175,080,720 | |||
|
| |||
LIABILITIES: | ||||
Accrued management fees (Note 3) | 74,943 | |||
Accrued fund accounting and administration fees (Note 3) | 27,059 | |||
Accrued transfer agent fees (Note 3) | 1,246 | |||
Accrued Chief Compliance Officer service fees (Note 3) | 429 | |||
Payable for fund shares repurchased | 357,741 | |||
Other payables and accrued expenses | 16,197 | |||
|
| |||
TOTAL LIABILITIES | 477,615 | |||
|
| |||
TOTAL NET ASSETS | $ | 174,603,105 | ||
|
| |||
NET ASSETS CONSIST OF: | ||||
Capital stock | $ | 166,341 | ||
Additional paid-in-capital | 172,073,982 | |||
Undistributed net investment income | 195,063 | |||
Accumulated net realized loss on investments | (7,316 | ) | ||
Net unrealized appreciation on investments | 2,175,035 | |||
|
| |||
TOTAL NET ASSETS | $ | 174,603,105 | ||
|
| |||
NET ASSET VALUE, OFFERING PRICE AND REDEMPTION PRICE PER SHARE - Class A | $ | 10.50 | ||
|
| |||
The accompanying notes are an integral part of the financial statements.
15
New York Tax Exempt Series
Statement of Operations
For the Year Ended December 31, 2015
INVESTMENT INCOME: | ||||
Interest | $ | 2,434,847 | ||
Dividends | 404 | |||
|
| |||
Total Investment Income | 2,435,251 | |||
|
| |||
EXPENSES: | ||||
Management fees (Note 3) | 911,489 | |||
Fund accounting and administration fees (Note 3) | 85,965 | |||
Directors’ fees (Note 3) | 7,043 | |||
Transfer agent fees (Note 3) | 3,417 | |||
Chief Compliance Officer service fees (Note 3) | 2,541 | |||
Custodian fees | 7,555 | |||
Miscellaneous | 69,667 | |||
|
| |||
Total Expenses | 1,087,677 | |||
|
| |||
NET INVESTMENT INCOME | 1,347,574 | |||
|
| |||
REALIZED AND UNREALIZED GAIN (LOSS) ON INVESTMENTS: | ||||
Net realized loss on investments | (10,276 | ) | ||
Net change in unrealized appreciation on investments | 1,237,092 | |||
|
| |||
NET REALIZED AND UNREALIZED GAIN (LOSS) ON INVESTMENTS | 1,226,816 | |||
|
| |||
NET INCREASE IN NET ASSETS RESULTING FROM OPERATIONS | $ | 2,574,390 | ||
|
| |||
The accompanying notes are an integral part of the financial statements.
16
New York Tax Exempt Series
Statements of Changes in Net Assets
| FOR THE YEAR ENDED 12/31/15 | FOR THE YEAR ENDED 12/31/14 | |||||||
INCREASE IN NET ASSETS: | ||||||||
OPERATIONS: | ||||||||
Net investment income | $ | 1,347,574 | $ | 1,160,455 | ||||
Net realized gain (loss) on investments | (10,276 | ) | 515,310 | |||||
Net change in unrealized appreciation on investments | 1,237,092 | 560,816 | ||||||
|
|
|
| |||||
Net increase from operations | 2,574,390 | 2,236,581 | ||||||
|
|
|
| |||||
DISTRIBUTIONS TO SHAREHOLDERS (Note 8): | ||||||||
From net investment income | (1,375,350 | ) | (1,062,965 | ) | ||||
From net realized gain on investments | — | (789,676 | ) | |||||
|
|
|
| |||||
Total distributions to shareholders | (1,375,350 | ) | (1,852,641 | ) | ||||
|
|
|
| |||||
CAPITAL STOCK ISSUED AND REPURCHASED: | ||||||||
Net increase (decrease) from capital share transactions (Note 5) | (7,325,193 | ) | 16,509,561 | |||||
|
|
|
| |||||
Net increase (decrease) in net assets | (6,126,153 | ) | 16,893,501 | |||||
NET ASSETS: | ||||||||
Beginning of year | 180,729,258 | 163,835,757 | ||||||
|
|
|
| |||||
End of year (including undistributed net investment income of $195,063 and $225,799,respectively) | $ | 174,603,105 | $ | 180,729,258 | ||||
|
|
|
| |||||
The accompanying notes are an integral part of the financial statements.
17
New York Tax Exempt Series
Financial Highlights
| FOR THE YEARS ENDED | ||||||||||||||||||||
| 12/31/15 | 12/31/14 | 12/31/13 | 12/31/12 | 12/31/11 | ||||||||||||||||
Per share data (for a share outstanding throughout each year): | ||||||||||||||||||||
Net asset value - Beginning of year | $ | 10.42 | $ | 10.40 | $ | 10.78 | $ | 10.63 | $ | 10.19 | ||||||||||
|
|
|
|
|
|
|
|
|
| |||||||||||
Income (loss) from investment operations: | ||||||||||||||||||||
Net investment income1 | 0.08 | 0.07 | 0.17 | 0.19 | 0.28 | |||||||||||||||
Net realized and unrealized gain (loss) on investments | 0.08 | 0.07 | (0.36 | ) | 0.16 | 0.56 | ||||||||||||||
|
|
|
|
|
|
|
|
|
| |||||||||||
Total from investment operations | 0.16 | 0.14 | (0.19 | ) | 0.35 | 0.84 | ||||||||||||||
|
|
|
|
|
|
|
|
|
| |||||||||||
Less distributions to shareholders: | ||||||||||||||||||||
From net investment income | (0.08 | ) | (0.07 | ) | (0.16 | ) | (0.20 | ) | (0.27 | ) | ||||||||||
From net realized gain on investments | — | (0.05 | ) | (0.03 | ) | — | 2 | (0.13 | ) | |||||||||||
|
|
|
|
|
|
|
|
|
| |||||||||||
Total distributions to shareholders | (0.08 | ) | (0.12 | ) | (0.19 | ) | (0.20 | ) | (0.40 | ) | ||||||||||
|
|
|
|
|
|
|
|
|
| |||||||||||
Net asset value - End of year | $ | 10.50 | $ | 10.42 | $ | 10.40 | $ | 10.78 | $ | 10.63 | ||||||||||
|
|
|
|
|
|
|
|
|
| |||||||||||
Net assets - End of year (000’s omitted) | $ | 174,603 | $ | 180,729 | $ | 163,836 | $ | 162,785 | $ | 158,092 | ||||||||||
|
|
|
|
|
|
|
|
|
| |||||||||||
Total return3 | 1.54 | % | 1.28 | % | (1.72 | %) | 3.31 | % | 8.37 | % | ||||||||||
Ratios (to average net assets)/Supplemental Data: | ||||||||||||||||||||
Expenses | 0.60 | % | 0.58 | % | 0.60 | % | 0.60 | % | 0.61 | % | ||||||||||
Net investment income | 0.74 | % | 0.68 | % | 1.57 | % | 1.72 | % | 2.66 | % | ||||||||||
Portfolio turnover | 35 | % | 43 | % | 33 | % | 7 | % | 48 | % | ||||||||||
1Calculated based on average shares outstanding during the years.
2Less than $0.01 per share.
3Represents aggregate total return for the years indicated, and assumes reinvestment of all distributions.
The accompanying notes are an integral part of the financial statements.
18
New York Tax Exempt Series
Notes to Financial Statements
| 1. | Organization |
New York Tax Exempt Series (the “Series”) is a no-load diversified series of Manning & Napier Fund, Inc. (the “Fund”). The Fund is organized in Maryland and is registered under the Investment Company Act of 1940, as amended, as an open-end management investment company.
The Series’ investment objective is to provide as high a level of current income exempt from federal income tax and New York State personal income tax as the Advisor believes is consistent with the preservation of capital.
The Fund’s advisor is Manning & Napier Advisors, LLC (the “Advisor”). Shares of the Series are offered to investors, clients and employees of the Advisor and its affiliates. The total authorized capital stock of the Fund consists of 15 billion shares of common stock each having a par value of $0.01. As of December 31, 2015, 10.7 billion shares have been designated in total among 41 series, of which 100 million have been designated as New York Tax Exempt Series Class A common stock.
| 2. | Significant Accounting Policies |
The following is a summary of significant accounting policies followed by the Series. The Series is an investment company and, accordingly, follows the investment company accounting and reporting guidance of the Financial Accounting Standards Board Accounting Standards Codification Topic 946 - Investment Companies, which is part of accounting principles generally accepted in the United States of America (“GAAP”).
Security Valuation
Municipal securities will normally be valued on the basis of market valuations provided by an independent pricing service (the “Service”). The Service utilizes the latest price quotations and a matrix system (which considers such factors as security prices of similar securities, yields, maturities and ratings). The Service has been approved by the Fund’s Board of Directors (the “Board”).
Short-term investments that mature in sixty days or less may be valued at amortized cost, which approximates fair value. Investments in open-end investment companies are valued at their net asset value per share on valuation date.
Volume and level of activity in established markets for an asset or liability are evaluated to determine whether recent transactions and quoted prices are determinative of fair value. Where there have been significant decreases in volume and level of activity, further analysis and adjustment may be necessary to estimate fair value. The Series measures fair value in these instances by the use of inputs and valuation techniques which may be based upon current market prices of securities that are comparable in coupon, rating, maturity and industry and/or expectation of future cash flows. As a result of trading in relatively thin markets and/or markets that experience significant volatility, the prices used by the Series to value these securities may differ from the value that would be realized if these securities were sold, and the differences could be material.
Securities for which representative valuations or prices are not available from the Series’ pricing service may be valued at fair value as determined in good faith by the Advisor under procedures approved by and under the general supervision and responsibility of the Board. Due to the inherent uncertainty of valuations of such securities, the fair value may differ significantly from the values that would have been used had a ready market for such securities existed. If trading or events occurring after the close of the principal market in which securities are traded are expected to materially affect the value of those securities, then they may be valued at their fair value, taking this trading or these events into account.
Various inputs are used in determining the value of the Series’ assets or liabilities carried at fair value. These inputs are summarized in three broad levels. Level 1 includes quoted prices in active markets for identical assets and liabilities. Level 2 includes other significant observable inputs (including quoted prices for similar securities, interest rates, prepayment speeds, credit risk, etc.). Level 3 includes significant unobservable inputs (including the Series’ own assumptions in determining the fair value of investments). A financial instrument’s level within the fair value hierarchy is based on the lowest level of any input both individually and in aggregate that is significant to the fair value measurement. The inputs or methodology used for valuing securities are not necessarily an indication of the risk associated with investing in those securities.
19
New York Tax Exempt Series
Notes to Financial Statements (continued)
| 2. | Significant Accounting Policies (continued) |
Security Valuation (continued)
The following is a summary of the valuation levels used for major security types as of December 31, 2015 in valuing the Series’ assets or liabilities carried at fair value:
| DESCRIPTION | TOTAL | LEVEL 1 | LEVEL 2 | LEVEL 3 | ||||||||||||
Assets: | ||||||||||||||||
Debt securities: | ||||||||||||||||
States and political subdivisions (municipals) | $ | 167,873,988 | $ | — | $ | 167,873,988 | $ | — | ||||||||
|
|
|
|
|
|
|
| |||||||||
Total assets | $ | 167,873,988 | $ | — | $ | 167,873,988 | $ | — | ||||||||
|
|
|
|
|
|
|
| |||||||||
There were no Level 3 securities held by the Series as of December 31, 2014 or December 31, 2015.
The Fund’s policy is to recognize transfers in and transfers out of the valuation levels as of the beginning of the reporting period. There were no transfers between Level 1 and Level 2 during the year ended December 31, 2015.
Security Transactions, Investment Income and Expenses
Security transactions are accounted for on trade date. Dividend income is recorded on the ex-dividend date, except that if the ex-dividend date has passed, certain dividends from foreign securities are recorded as soon as the Series is informed of the ex-dividend date. Non-cash dividends, if any, are recorded at the fair value of the securities received. Interest income, including amortization of premium and accretion of discounts using the effective interest method, is earned from settlement date and accrued daily.
Expenses are recorded on an accrual basis. Most expenses of the Fund can be attributed to a specific series. Expenses which cannot be directly attributed are apportioned among the series in the Fund in such a manner as deemed equitable by the Fund’s Board, taking into consideration, among other things, the nature and type of expense.
The Series uses the identified cost method for determining realized gain or loss on investments for both financial statement and federal income tax reporting purposes.
Federal Taxes
The Series’ policy is to comply with the provisions of the Internal Revenue Code applicable to regulated investment companies. The Series is not subject to federal income tax or excise tax to the extent that the Series distributes to shareholders each year its taxable income, including any net realized gains on investments, in accordance with requirements of the Internal Revenue Code. Accordingly, no provision for federal income tax or excise tax has been made in the financial statements.
Management evaluates its tax positions to determine if the tax positions taken meet the minimum recognition threshold in connection with accounting for uncertainties in income tax positions taken or expected to be taken for the purposes of measuring and recognizing tax liabilities in the financial statements. Recognition of tax benefits of an uncertain tax position is required only when the position is “more likely than not” to be sustained assuming examination by taxing authorities. At December 31, 2015, the Series has recorded no liability for net unrecognized tax benefits relating to uncertain income tax positions taken or expected to be taken in future tax returns.
The Series files income tax returns in the U.S. federal jurisdiction and various states, as required. No income tax returns are currently under investigation. The statute of limitations on the Series’ tax returns remains open for the years ended December 31, 2012 through December 31, 2015. The Series is not aware of any tax positions for which it is reasonably possible that the total amounts of unrecognized tax benefits will significantly change in the next twelve months.
Distributions of Income and Gains
Distributions to shareholders of net investment income are made quarterly. Distributions of net realized gains are made annually. An additional distribution may be necessary to avoid taxation of the Series. Distributions are recorded on the ex-dividend date.
20
New York Tax Exempt Series
Notes to Financial Statements (continued)
| 2. | Significant Accounting Policies (continued) |
Indemnifications
The Fund’s organizational documents provide former and current directors and officers with a limited indemnification against liabilities arising in connection with the performance of their duties to the Fund. In the normal course of business, the Fund may also enter into contracts that provide general indemnifications. The Fund’s maximum exposure under these arrangements is unknown as this would be dependent on future claims that may be made against the Fund. The risk of material loss from such claims is considered remote.
Other
The preparation of financial statements in conformity with GAAP requires management to make estimates and assumptions that affect the reported amounts of assets and liabilities and the disclosure of contingent assets and liabilities at the date of the financial statements and the reported amounts of income and expenses during the reporting period. Actual results could differ from those estimates.
| 3. | Transactions with Affiliates |
The Fund has an Investment Advisory Agreement (the “Agreement”) with the Advisor, for which the Series pays a fee, computed daily and payable monthly, at an annual rate of 0.50% of the Series’ average daily net assets.
Under the Agreement, personnel of the Advisor provide the Series with advice and assistance in the choice of investments and the execution of securities transactions, and otherwise maintain the Series’ organization. The Advisor also provides the Fund with necessary office space and fund administration and support services. The salaries of all officers of the Fund (except a percentage of the Fund’s Chief Compliance Officer’s salary, which is paid by the Fund), and of all Directors who are “affiliated persons” of the Fund, or of the Advisor, and all personnel of the Fund, or of the Advisor, performing services relating to research, statistical and investment activities, are paid by the Advisor. Each “non-affiliated” Director receives an annual stipend, which is allocated among all the active series of the Fund. In addition, these Directors also receive a fee per Board meeting attended plus a fee for each committee meeting attended and are reimbursed for travel and other out-of-pocket expenses incurred by them in connection with attending such meetings. The Fund also has an Audit Committee Chair, who receives an additional annual stipend for this role.
The Advisor has contractually agreed, until at least April 30, 2016, to waive its management fee and, if necessary, pay other operating expenses of the Series in order to maintain total direct annual fund operating expenses for the Series at no more than 0.85% of average daily net assets each year. The Advisor did not waive any fees for the year ended December 31, 2015. The Advisor is not eligible to recoup any expenses that have been waived or reimbursed in prior years.
Manning & Napier Investor Services, Inc., a registered broker-dealer affiliate of the Advisor, acts as distributor for the Fund’s shares. The services of Manning & Napier Investor Services, Inc. are provided at no additional cost to the Series.
Pursuant to a master services agreement dated November 1, 2014, the Fund pays the Advisor an annual fee related to fund accounting and administration of 0.0085% on the first $25 billion of average daily net assets (excluding Target Series and Strategic Income Series); 0.0075% on the next $15 billion of average daily net assets (excluding Target Series and Strategic Income Series); and 0.0065% of the average daily net assets in excess of $40 billion (excluding Target Series and Strategic Income Series); plus a base fee of $30,400 per series. Transfer agent fees are charged to the Fund on a per account basis. Additionally, certain transaction and out-of-pocket expenses, including charges for reporting relating to the Fund’s compliance program, are charged. The Advisor has agreements with BNY Mellon Investment Servicing (U.S.) Inc. (“BNY”) under which BNY serves as sub-accountant services agent and sub-transfer agent.
Expenses not directly attributable to a series are allocated based on each series’ relative net assets or number of accounts, depending on the expense.
21
New York Tax Exempt Series
Notes to Financial Statements (continued)
| 4. | Purchases and Sales Securities |
For the year ended December 31, 2015, purchases and sales of securities, other than U.S. Government securities and short-term securities, were $62,119,666 and $61,573,390, respectively. There were no purchases or sales of U.S. Government securities.
| 5. | Capital Stock Transactions |
Transactions in shares of New York Tax Exempt Series were:
FOR THE YEAR ENDED 12/31/15 | FOR THE YEAR ENDED 12/31/14 | |||||||||||||||
| SHARES | AMOUNT | SHARES | AMOUNT | |||||||||||||
Sold | 2,127,692 | $ | 22,249,004 | 2,760,068 | $ | 28,891,095 | ||||||||||
Reinvested | 123,356 | 1,285,190 | 169,423 | 1,771,520 | ||||||||||||
Repurchased | (2,953,966 | ) | (30,859,387 | ) | (1,350,557 | ) | (14,153,054 | ) | ||||||||
|
|
|
|
|
|
|
| |||||||||
Total | (702,918 | ) | $ | (7,325,193 | ) | 1,578,934 | $ | 16,509,561 | ||||||||
|
|
|
|
|
|
|
| |||||||||
Over 90% of the shares outstanding are held by fiduciary accounts where the Advisor has sole investment discretion.
| 6. | Financial Instruments |
The Series may trade in instruments including written and purchased options, forward foreign currency exchange contracts and futures contracts and other derivatives in the normal course of investing activities to assist in managing exposure to various market risks. The Series may be subject to various elements of risk, which may involve, to a varying degree, elements of risk in excess of the amounts recognized for financial statement purposes. These risks include: the risk that changes in the value of a derivative may not correlate perfectly with the underlying asset, rate or index; counterparty credit risk related to over the counter derivative counterparties’ failure to perform under contract terms; liquidity risk related to the lack of a liquid market for these contracts allowing the fund to close out its position(s); and documentation risk relating to disagreement over contract terms. No such investments were held by the Series as of December 31, 2015.
| 7. | Concentration of Credit |
The Series primarily invests in debt obligations issued by the State of New York and its political subdivisions, agencies and public authorities to obtain funds for various public purposes. The Series is more susceptible to factors adversely affecting issues of New York municipal securities than is a municipal bond fund that is not concentrated in these issues to the same extent.
| 8. | Federal Income Tax Information |
The amount and characterization of certain income and capital gains to be distributed are determined in accordance with federal income tax regulations, which may differ from GAAP. These differences are primarily due to differing book and tax treatments in the timing and/or treatment of the recognition of net investment income or gains and losses, including market discount on investments. The Series may periodically make reclassifications among its capital accounts to reflect income and gains available for distribution (or available capital loss carryovers) under income tax regulations without impacting the Series’ net asset value. For the fiscal year ended December 31, 2015, $2,960 was reclassified within the capital accounts from Undistributed Net Investment Income to Accumulated Net Realized Loss on Investments. Any such reclassifications are not reflected in the financial highlights.
22
New York Tax Exempt Series
Notes to Financial Statements (continued)
| 8. | Federal Income Tax Information (continued) |
The tax character of distributions paid were as follows:
| FOR THE YEAR ENDED 12/31/15 | FOR THE YEAR ENDED 12/31/14 | |||||||
Tax exempt income | $ | 1,375,350 | $ | 1,063,499 | ||||
Long-term capital gains | — | 789,142 | ||||||
At December 31, 2015, the tax basis of components of distributable earnings and the net unrealized appreciation based on identified cost for federal income tax purposes were as follows:
Cost for federal income tax purposes | $ | 165,680,018 | ||
Unrealized appreciation | 2,324,279 | |||
Unrealized depreciation | (130,309 | ) | ||
|
| |||
Net unrealized appreciation | $ | 2,193,970 | ||
|
| |||
Undistributed tax exempt income | $ | 176,128 | ||
Capital Loss Carryforwards | $ | (7,316 | ) |
At December 31, 2015, the Series had net short-term capital loss carryforwards of $7,316, which may be carried forward indefinitely.
23
New York Tax Exempt Series
Report of Independent Registered Public Accounting Firm
To the Board of Directors of Manning & Napier Fund, Inc. and Shareholders of New York Tax Exempt Series:
In our opinion, the accompanying statement of assets and liabilities, including the investment portfolio, and the related statements of operations and of changes in net assets and the financial highlights present fairly, in all material respects, the financial position of New York Tax Exempt Series (a series of Manning & Napier Fund, Inc., hereafter referred to as the “Series”) at December 31, 2015, the results of its operations for the year then ended, the changes in its net assets for each of the two years in the period then ended and the financial highlights for each of the five years in the period then ended, in conformity with accounting principles generally accepted in the United States of America. These financial statements and financial highlights (hereafter referred to as “financial statements”) are the responsibility of the Series’ management. Our responsibility is to express an opinion on these financial statements based on our audits. We conducted our audits of these financial statements in accordance with the standards of the Public Company Accounting Oversight Board (United States). Those standards require that we plan and perform the audit to obtain reasonable assurance about whether the financial statements are free of material misstatement. An audit includes examining, on a test basis, evidence supporting the amounts and disclosures in the financial statements, assessing the accounting principles used and significant estimates made by management, and evaluating the overall financial statement presentation. We believe that our audits, which included confirmation of securities at December 31, 2015 by correspondence with the custodian and brokers, provide a reasonable basis for our opinion.

New York, New York
February 19, 2016
24
New York Tax Exempt Series
Supplemental Tax Information
(unaudited)
All reportings are based on financial information available as of the date of this annual report and, accordingly are subject to change.
The Series hereby reports $1,375,350 as tax exempt dividends for the year ended December 31, 2015. It is the intention of the Series to designate the maximum allowable under tax law.
25
New York Tax Exempt Series
Renewal of Investment Advisory Agreement
(unaudited)
At the Manning & Napier Fund, Inc. (the “Fund”) Board of Directors’ (the “Board”) meeting, held on November 17, 2015, the Investment Advisory Agreement (the “Agreement”) between the Fund and Manning & Napier Advisors, LLC (the “Advisor”) was considered by the Board for renewal. In connection with the decision whether to renew the Agreement, a variety of material was prepared for and considered by the Board.
Representatives of the Advisor attended the meeting and presented additional oral and written information to the Board to assist the Board in its considerations. The discussion immediately below outlines the materials and information presented to the Board in connection with the Board’s 2015 Annual consideration of the Agreement and the conclusions made by the Directors when determining to continue the Agreement.
| • | The Board considered the services provided by the Advisor under the Agreement including, among others: deciding what securities to purchase and sell for each Series; arranging for the purchase and sale of such securities by placing orders with broker-dealers; administering the affairs of the Fund (including the books and records of the Fund not maintained by third party service providers such as the custodian or sub-transfer agent); arranging for the insurance coverage for the Fund; and supervising the preparation of tax returns, SEC filings (including registration statements) and reports to shareholders for the Fund. The Board also considered the nature and quality of such services provided under the Agreement in light of the Advisor’s services provided to the Fund for 29 years. The Board discussed the quality of these services with representatives from the Advisor and concluded that the Advisor was performing its services to the Fund required under the Agreement in a reasonable manner. |
| • | The Board considered the performance of each Series since its inception, as well as performance over multiple time periods. Performance for one or more of the following time periods was considered as applicable to the Series’ inception date: inception, three year, five year, ten year, and current market cycle. A market cycle includes periods of both rising and falling markets. Returns for established benchmark indices for each Series were provided. In addition, the Board considered a number of other factors relevant to performance at the meeting (and considers on a quarterly basis) including: a peer group performance analysis consisting of Morningstar universes of mutual funds with similar investment objectives, investment performance of core products, product offerings, performance on an aggregate basis vs. performance over reasonable time periods and the Advisor’s investment process. The Directors acknowledged the challenging performance and discussed the investment process of the Advisor. The Directors confirmed that qualitative factors such as the Advisor’s investment process, including recent enhancements, were an important subset to be considered as part of their consideration of performance. The Board discussed the performance with representatives from the Advisor and concluded that the investment performance of each of the Fund’s Series was reasonable based on the Series’ actual performance and comparative performance, especially for those series with performance over the current market cycle. |
| • | The Board considered the costs of the Advisor’s services and the profits of the Advisor as they relate to the Advisor’s services to the Fund under the Agreement. In reviewing the Advisor’s costs and profits, the Board discussed the Advisor’s revenues generated from the Fund (on both an actual and adjusted basis) and its expenses associated with providing the services under the Agreement. In addition, the Board reviewed the Advisor’s expenses associated with Fund activities outside of the Agreement (such as expense reimbursements pursuant to expense caps and payments made by the Advisor to third party platforms on which shares of the Fund are available for purchase). It was noted by representatives of the Advisor that 22 of the 36 active Series of the Fund are currently experiencing expenses above the capped expense ratios, and thus the Advisor is incurring those expenses over the cap. After discussing the above costs and profits, the Board concluded that the Advisor’s profitability relating to its services provided under the Agreement was reasonable. |
| • | The Board considered the fees and expenses of the various Series of the Fund. The Advisor presented the advisory fees and total expenses for each Series, including the advisory fee adjusted for any expense waivers or reimbursements (either contractual or voluntary) paid by the Advisor. The advisory fees and expense ratios of each Series were compared to an average (on both a mean and median basis) of similar funds as disclosed on the Morningstar database. Representatives of the Advisor discussed with the Board the levels of its advisory fee for each Series of the Fund and as compared to the median and mean advisory fees for similar funds as listed on Morningstar. Expense ratios for every Series, except the Tax Managed Series, Equity Income Class S, High Yield Bond Class S, Pro-Blend Series Classes C and R, and Target Series’ Classes R and K, are lower than, or substantially similar to the Morningstar mean and median reported total expense ratio. |
26
New York Tax Exempt Series
Renewal of Investment Advisory Agreement
(unaudited)
The higher than mean and median total expense ratios for Classes C and R reflect higher distribution, marketing and shareholder service fees payable to broker-dealers through a 100bp 12b-1 fee for Class C and a 50bp 12b-1 fee for Class R. Based on their review of the information provided, the Board concluded that the fees and expenses of each Series of the Fund were reasonable on a comparative basis. |
| • | The Board also considered the other benefits the Advisor derives from its relationship with the Fund. Such other benefits include certain research services provided by soft dollars. The Board reviewed the broker-dealers who provided research to the Advisor and the products and services paid for, in whole or in part, using soft dollar commissions. Given the level of soft dollar transactions involving the Fund, the Board concluded that these additional benefits to the Advisor were reasonable. |
| • | In addition to the factors described above, the Board considered the Advisor’s personnel, investment strategies, policies and procedures relating to compliance with personal securities transactions, reputation, expertise and resources in domestic and foreign financial markets. The Board concluded that these factors support the conclusion that the Advisor performs its services in a reasonable manner. |
| • | The Board then considered economies of scale and concluded that the current fee schedule to the advisory agreement remained reasonable given the multiple uses of the Fund (for the Advisor’s discretionary investment account clients in addition to direct investors), the current profitability of the Advisor’s services to the Fund under the Agreement, the number of newly established series of the Fund and the overall size of the Fund complex. |
Based on the Board’s deliberations and their evaluation of the information described above, the Board, including a majority of Directors that are not “interested persons” as defined in the Investment Company Act of 1940, concluded that the compensation under the Agreement was fair and reasonable in light of the services and expenses and such other matters as the Directors considered to be relevant in the exercise of their reasonable judgment. Accordingly, the Board approved the renewal of the Agreement. In the course of their deliberations, the Directors did not identify any particular information that was all important or controlling.
27
New York Tax Exempt Series
Directors’ and Officers’ Information
(unaudited)
The Statement of Additional Information provides additional information about the Fund’s directors and officers and can be obtained without charge by calling 1-800-466-3863, at www.manningnapieradvisors.com, or on the EDGAR Database on the SEC Internet web site (http:// www.sec.gov). The following chart shows certain information about the Fund’s officers and directors, including their principal occupations during the last five years. Unless specific dates are provided, the individuals have held the listed positions for longer than five years.
Interested Director/Officer
| Name: | James E. Mikolaichik* | |
| Address: | 290 Woodcliff Drive | |
| Fairport, NY 14450 | ||
| Age: | 44 | |
| Current Position(s) Held with Fund: | Principal Executive Officer, President, Chairman & Director | |
| Term of Office1 & Length of Time Served: | Indefinite - Chairman and Director since August 2015 | |
| Principal Occupation(s) During Past 5 Years: | Chief Financial Officer (since 2011) - Manning & Napier Advisors, LLC; Executive Vice President and Head of Strategy (2008-2011) and Chief Risk Officer (2004-2008) - Old Mutual Asset Management Holds or has held one or more of the following title for various subsidiaries and affiliates: Chief Financial Officer. | |
| Number of Portfolios Overseen within Fund Complex: | 41 | |
| Other Directorships Held Outside Fund Complex: | N/A | |
| Independent Directors | ||
| Name: | Stephen B. Ashley | |
| Address: | 290 Woodcliff Drive | |
| Fairport, NY 14450 | ||
| Age: | 75 | |
| Current Position(s) Held with Fund: | Director, Audit Committee Member, Governance & Nominating Committee Member | |
| Term of Office & Length of Time Served: | Indefinite - Since 1996 | |
| Principal Occupation(s) During Past 5 Years: | Chairman, Director, President & Chief Executive Officer (1997 to present) - The Ashley Group (property management and investment); Director (1995-2008) and Chairman (non-executive) (2004-2008) - Fannie Mae (mortgage). | |
| Number of Portfolios Overseen within Fund Complex: | 41 | |
| Other Directorships Held Outside Fund Complex: | Fannie Mae (1995-2008) | |
The Ashley Group (1995-2008) Genesee Corporation (1987-2007) | ||
| Name: | Paul A. Brooke | |
| Address: | 290 Woodcliff Drive | |
| Fairport, NY 14450 | ||
| Age: | 70 | |
| Current Position(s) Held with Fund: | Director, Audit Committee Member, Governance & Nominating Committee Member | |
| Term of Office & Length of Time Served: | Indefinite - Since 2007 | |
| Principal Occupation(s) During Past 5 Years: | Chairman & CEO (2005-2009) - Ithaka Acquisition Corporation (investments); Chairman (2007-2009) Alsius Corporation (investments); Managing Member, PMSV Holdings LLC (investments) since 1991; Managing Member, Venbio (investments) since 2010. | |
| Number of Portfolios Overseen within Fund Complex: | 41 | |
| Other Directorships Held Outside Fund Complex: | Incyte Corp. (2000-present) ViroPharma, Inc. (2000-2014) HLTH Corp (WebMD) (2000-2010) Cheyne Capital International (2000-present) GMP Companies (2000-2011) Cytos Biotechnology Ltd. (2012-2014)
| |
28
New York Tax Exempt Series
Directors’ and Officers’ Information
(unaudited)
Independent Directors (continued)
| Name: | Peter L. Faber | |
| Address: | 290 Woodcliff Drive | |
| Fairport, NY 14450 | ||
| Age: | 77 | |
| Current Position(s) Held with Fund: | Director, Governance & Nominating Committee Member | |
| Term of Office & Length of Time Served: | Indefinite - Since 1987 | |
| Principal Occupation(s) During Past 5 Years: | Senior Counsel (2006-2012), Partner (1995-2006 & 2013-present) - McDermott, Will & Emery LLP (law firm) | |
| Number of Portfolios Overseen within Fund Complex: | 41 | |
| Other Directorships Held Outside Fund Complex: | Boston Early Music Festival (non-profit)(2007-present) | |
| Amherst Early Music, Inc. (non-profit)(2009-present) | ||
| Gotham Early Music Scene, Inc. (non-profit)(2009-present) | ||
| Partnership for New York City, Inc. (non-profit) (1989-2010) | ||
New York Collegium (non-profit) (2004-2011)
| ||
| Name: | Harris H. Rusitzky | |
| Address: | 290 Woodcliff Drive | |
| Fairport, NY 14450 | ||
| Age: | 80 | |
| Current Position(s) Held with Fund: | Director, Audit Committee Member, Governance & Nominating Committee Member | |
| Term of Office & Length of Time Served: | Indefinite - Since 1985 | |
| Principal Occupation(s) During Past 5 Years: | President, The Greening Group (business consultants) since 1994; | |
| Partner, The Restaurant Group (restaurants) since 2006 | ||
| Number of Portfolios Overseen within Fund Complex: | 41 | |
| Other Directorships Held Outside Fund Complex: | Rochester Institute of Technology (university)(1972-present) | |
| Culinary Institute of America (non-profit college)(1985-present) | ||
| George Eastman House (museum)(1988-present) | ||
National Restaurant Association (restaurant trade organization)(1978-present)
| ||
| Name: | Chester N. Watson | |
| Address: | 290 Woodcliff Drive | |
| Fairport, NY 14450 | ||
| Age: | 65 | |
| Current Position(s) Held with Fund: | Director, Audit Committee Chairman, Governance & Nominating Committee Member | |
| Term of Office & Length of Time Served: | Indefinite - Since 2012 | |
| Principal Occupation(s) During Past 5 Years: | General Auditor (2003-2011) - General Motors Company (auto manufacturer) | |
| Number of Portfolios Overseen within Fund Complex: | 41 | |
| Other Directorships Held Outside Fund Complex: | Rochester Institute of Technology (university)(2005-present)
| |
| Officers | ||
| Name: | Jeffrey S. Coons, Ph.D., CFA | |
| Address: | 290 Woodcliff Drive | |
| Fairport, NY 14450 | ||
| Age: | 52 | |
| Current Position(s) Held with Fund: | Vice President | |
| Term of Office1 & Length of Time Served: | Since 2004 | |
| Principal Occupation(s) During Past 5 Years: | President since 2010, Co-Director of Research (2002-2015) - Manning & Napier Advisors, LLC Holds one or more of the following titles for various subsidiaries and affiliates: President, Director, Treasurer or Senior Trust Officer. | |
| Number of Portfolios Overseen within Fund Complex: | 41 | |
| Other Directorships Held Outside Fund Complex: | N/A
| |
29
New York Tax Exempt Series
Directors’ and Officers’ Information
(unaudited)
Officers (continued)
| Name: | Elizabeth Craig | |
| Address: | 290 Woodcliff Drive | |
| Fairport, NY 14450 | ||
| Age: | 28 | |
| Current Position(s) Held with Fund: | Assistant Corporate Secretary | |
| Term of Office1 & Length of Time Served: | Since 2011 | |
| Principal Occupation(s) During Past 5 Years: | Fund Administration Manager since 2015; Mutual Fund Compliance Specialist (2009-2015) - Manning & Napier Advisors, LLC | |
| Number of Portfolios Overseen within Fund Complex: | 41 | |
| Other Directorships Held Outside Fund Complex: | N/A
| |
| Name: | Christine Glavin | |
| Address: | 290 Woodcliff Drive Fairport, NY 14450 | |
| Age: | 49 | |
| Current Position(s) Held with Fund: | Principal Financial Officer, Chief Financial Officer | |
| Term of Office1 & Length of Time Served: | Principal Financial Officer since 2002; Chief Financial Officer since 2001 | |
| Principal Occupation(s) During Past 5 Years: | Director of Fund Reporting since 2011; Fund Reporting Manager (1997-2011) - Manning & Napier Advisors, LLC; Assistant Treasurer since 2008 - Exeter Trust Company | |
| Number of Portfolios Overseen within Fund Complex: | 41 | |
| Other Directorships Held Outside Fund Complex: | N/A | |
| Name: | Jodi L. Hedberg | |
| Address: | 290 Woodcliff Drive Fairport, NY 14450 | |
| Age: | 48 | |
| Current Position(s) Held with Fund: | Corporate Secretary, Chief Compliance Officer, Anti-Money Laundering Compliance Officer | |
| Term of Office1 & Length of Time Served: | Corporate Secretary since 1997; Chief Compliance Officer since 2004; Anti-Money Laundering Compliance Officer since 2002 | |
| Principal Occupation(s) During Past 5 Years: | Director of Compliance since 2005; Compliance Manager (1995-2005) - Manning & Napier Advisors, LLC and affiliates; Corporate Secretary - Manning & Napier Investor Services, Inc. since 2006 | |
| Number of Portfolios Overseen within Fund Complex: | 41 | |
| Other Directorships Held Outside Fund Complex: | N/A | |
| Name: | Richard Yates | |
| Address: | 290 Woodcliff Drive Fairport, NY 14450 | |
| Age: | 50 | |
| Current Position(s) Held with Fund: | Chief Legal Officer | |
| Term of Office1 & Length of Time Served: | Chief Legal Officer since 2004 | |
| Principal Occupation(s) During Past 5 Years: | Counsel - Manning & Napier Advisors, LLC and affiliates since 2000; Holds one or more of the following titles for various affiliates; Director or Corporate Secretary | |
| Number of Portfolios Overseen within Fund Complex: | 41 | |
| Other Directorships Held Outside Fund Complex: | N/A | |
*Interested Director, within the meaning of the Investment Company Act of 1940 by reason of his position with the Fund’s investment advisor and distributor. Mr. Mikolaichik serves as the Chief Financial Officer for Manning & Napier Advisors, LLC.
1The term of office of all officers shall be one year and until their respective successors are chosen and qualified, or his or her earlier resignation or removal as provided in the Fund’s By-Laws.
30
New York Tax Exempt Series
Results of Special Meeting of Shareholders
(unaudited)
A Special Meeting of the Shareholders of the Fund was held on August 18, 2015. The number of votes necessary to conduct the meeting and approve the proposal was obtained, and the results of the vote of shareholders of all the Series of the Fund voting together in the aggregate is listed below:
PROPOSAL 1:
Election of Directors
NUMBER OF SHARES VOTED FOR | NUMBER OF SHARES WITHELD | |||||||
Stephen B. Ashley | 883,968,395 | 8,618,094 | ||||||
Paul A. Brooke | 884,510,661 | 8,075,828 | ||||||
Peter L. Faber | 884,140,893 | 8,445,596 | ||||||
James E. Mikolaichik | 883,391,832 | 9,194,657 | ||||||
Harris H. Rusitzky | 620,022,215 | 272,564,274 | ||||||
Chester N. Watson | 884,638,809 | 7,947,680 | ||||||
31
New York Tax Exempt Series
Literature Requests
(unaudited)
Proxy Voting Policies and Procedures
A description of the policies and procedures that the Fund uses to determine how to vote proxies relating to portfolio securities is available, without charge, upon request:
| By phone | 1-800-466-3863 | |||
| On the Securities and Exchange | ||||
| Commission’s (SEC) web site | http://www.sec.gov |
Proxy Voting Record
Information regarding how the Fund voted proxies relating to portfolio securities during the most recent 12-month period ended June 30th is available, without charge, upon request:
| By phone | 1-800-466-3863 | |||
| On the SEC’s web site | http://www.sec.gov |
Quarterly Portfolio Holdings
The Series’ complete schedule of portfolio holdings for the 1st and 3rd quarters of each fiscal year are provided on Form N-Q, and are available, without charge, upon request:
| By phone | 1-800-466-3863 | |||
| On the SEC’s web site | http://www.sec.gov |
The Series’ Form N-Q may be reviewed and copied at the SEC’s Public Reference Room in Washington, D.C. Information on the operation of the Public Reference Room may be obtained by calling 1-800-SEC-0330.
Prospectus and Statement of Additional Information (SAI)
For more information about any of the Manning & Napier Fund, Inc. Series, you may obtain a prospectus and SAI at www.manning-napier.com or by calling (800) 466-3863. Before investing, carefully consider the objectives, risks, charges and expenses of the investment and read the prospectus carefully as it contains this and other information about the investment company. In addition, this information can be found on the SEC’s web site, http://www.sec.gov.
Additional information available at www.manning-napier.com
1. Fund Holdings - Month-End
2. Fund Holdings - Quarter-End
3. Shareholder Report - Annual
4. Shareholder Report - Semi-Annual
The Fund also offers electronic notification or “e-delivery” when certain documents are available on-line to be downloaded or reviewed. Direct shareholders can elect to receive electronic notification when shareholder reports, prospectus updates, and/or statements are available. If you do not currently have on-line access to your account, you can establish access by going to www.manning-napier.com, click on “Login” in the top corner of the page, and follow the prompts to self-enroll. Once enrolled, you can set your electronic notification preferences by clicking on the Account Options tab located within the green toolbar and then select E-Delivery Option. Should you have any questions on either how to establish on-line access or how to update your account settings, please contact Investor Services at 1-800-466-3863.
The Manning & Napier Fund, Inc. is managed by Manning & Napier Advisors, LLC. Manning & Napier Investor Services, Inc., an affiliate of Manning & Napier Advisors, LLC, is the distributor of the Fund shares.
MNNYT-12/15-AR
Core Bond Series
Management Discussion and Analysis
(unaudited)
Dear Shareholders:
Volatility defined global financial markets during the past year, largely driven by macroeconomic factors. Renewed concerns about economic growth in emerging markets — China in particular — and uncertainty about the effects of that slowdown on overall global growth triggered market gyrations. Developed economies continued to provide accommodative monetary policy to combat growth concerns, although in December the U.S. Federal Reserve raised the federal funds rate for the first time in nearly a decade. For much of the year, Europe struggled with uncertainty regarding Greece’s ability to secure bailout funding from its creditors, which negatively affected investor sentiment. China’s economy slowed, but the government continued to demonstrate a willingness to provide support through a combination of policy-easing maneuvers and targeted stimulus measures. The U.S. economy remained on a path of slow growth that nevertheless made it the best performing developed economy. Looking ahead, we expect the slow global growth environment to remain in place for the foreseeable future.
As always, we appreciate your business.
Sincerely,
Manning & Napier Advisors, LLC
1
Core Bond Series
Fund Commentary
(unaudited)
Investment Objective
To provide long-term total return by investing primarily in fixed income securities. Under normal circumstances, at least 80% of the Series’ assets will be invested in investment-grade bonds and other financial instruments with economic characteristics similar to bonds. Holdings will consist of U.S. dollar denominated securities. The Series is not subject to maturity or duration restrictions.
Performance Commentary
Domestic fixed income markets generated modestly positive absolute returns in 2015, although performance across sectors was mixed. Municipal, mortgage-backed, and Treasury securities turned in positive performance for the year, whereas high yield and investment grade corporate bonds were negative. Meanwhile, performance across international fixed income markets was exceptionally challenging.
The Barclays U.S. Aggregate Bond Index returned 0.55% during 2015 as income offset price declines from rising yields and widening spreads. The Core Bond Series returned 0.44%, trailing the benchmark on a relative basis. Contributing to the relative performance shortfall during 2015 was the Series’ allocation to investment grade corporate bonds. Offsetting a portion of the relative performance weakness was strong security selection and the Series’ limited exposure to long-term Treasuries, which aided relative returns.
Regarding sector and quality characteristics, the Series is notably tilted toward corporate bonds, investment-grade securities in particular, and is significantly overweight in the sector relative to the benchmark. This sector has been a primary focus area for us over the past few years, and we believe it remains an attractive option for many fixed income investors in 2016 as businesses continue to experience the benefits of a slowly improving U.S. economy. With the backdrop of continued slow growth and relatively cheap credit valuations, we view the Series’ current overweight position as appropriate, but it is likely that we will look to reduce exposure to the corporate sector as we get later in the credit cycle. The Series also contains a meaningful allocation to securitized credit, U.S. agency securities, and mortgage-backed securities. Regarding U.S. Treasuries, the Series is significantly underweight relative to the benchmark as we do not believe yields in that sector offer investors sufficient compensation for interest rate risk in the current environment.
We also continue to believe that interest rates do not adequately compensate investors to take on additional duration risk. Therefore, the Series retains a relatively modest duration. We would look to increase the Series’ duration through the purchase of longer maturity Treasuries or agencies if interest rates increase to more attractive levels.
During 2016 we expect the fixed income landscape to continue to shift as the Federal Reserve considers further changes to U.S. monetary policy. Having raised the federal funds rate, we believe they now will seek to remain flexible and proceed slowly with small increases that do not follow a well-defined schedule. The diverging monetary policies of major central banks, geopolitical risks, commodity price pressures, and the potential for global growth to deviate from expectations could cause volatility in financial markets. In light of the current environment, it is important that investors remain active, flexible, and selective in their approach in order to avoid overvalued and risky areas of the market, something Manning & Napier has done for over 45 years.
Performance data quoted represents past performance and does not guarantee future results. The investment return and principal value of an investment will fluctuate, so that an investor’s shares, when redeemed, may be worth more or less than their original cost. Current performance may be higher or lower than that quoted; investors can obtain the most recent month-end performance at www.manning-napier.com or by calling (800) 593-4353. Performance for the Core Bond Series Class S shares is provided above. Performance for the Class I shares will be higher based on the Class’ lower expenses.
Please see the next page for additional performance information as of December 31, 2015.
All investments involve risks, including possible loss of principal. There is an inverse relationship between bond prices and interest rates; as interest rates rise, bond prices (and therefore the value of bond funds) fall. Likewise, as interest rates fall, bond prices and the value of bond funds rise. Duration is defined as the average time it takes to collect a bond’s interest and principal repayment. It is a measure of the sensitivity of the price (the value of principal) of a fixed income investment to a change in interest rates.
2
Core Bond Series
Performance Update as of December 31, 2015
(unaudited)
| AVERAGE ANNUAL TOTAL RETURNS AS OF DECEMBER 31, 2015 | ||||||||||||||||
ONE YEAR1 | FIVE YEAR | TEN YEAR | SINCE INCEPTION2 | |||||||||||||
Manning & Napier Fund, Inc. - Core Bond Series - Class S3 | 0.44 | % | 3.67 | % | 5.02 | % | 4.78 | % | ||||||||
Manning & Napier Fund, Inc. - Core Bond Series - Class I3,4 | 0.61 | % | 3.70 | % | 5.03 | % | 4.79 | % | ||||||||
Barclays U.S. Aggregate Index5,6 | 0.55 | % | 3.25 | % | 4.51 | % | 4.38 | % | ||||||||
Bank of America (BofA) Merrill Lynch U.S. Corporate, Government & Mortgage Index7 | 0.59 | % | 3.32 | % | 4.58 | % | 4.44 | % | ||||||||
The following graph compares the value of a $10,000 investment in the Manning & Napier Fund, Inc. - Core Bond Series - Class S for the ten years ended December 31, 2015 to the Bank of America (BofA) Merrill Lynch U.S. Corporate, Government & Mortgage Index and the Barclays U.S. Aggregate Index.
1The returns shown are based on net asset values calculated for shareholder transactions and may differ from the returns shown in the financial highlights, which reflect adjustments made to the net asset values in accordance with accounting principles generally accepted in the United States of America.
2Performance numbers for the Series and the Bank of America (BofA) Merrill Lynch U.S. Corporate, Government & Mortgage Index are calculated from April 21, 2005, the Series’ inception date. The Barclays U.S. Aggregate Bond Index performance numbers are calculated from April 30, 2005.
3The Series’ performance does not reflect the deduction of taxes that a shareholder would pay on fund distributions or the redemption of shares. The Series’ performance is historical and may not be indicative of future results. The performance returns shown are inclusive of the net expense ratio of the Series. For the year ended December 31, 2015, this net expense ratio was 0.69% for Class S and 0.46% for Class I (annualized). The gross expense ratio, which does not account for any voluntary or contractual waivers currently in effect, was 0.72% for Class S and 0.52% for Class I (annualized) for the year ended December 31, 2015.
4For periods prior to the inception of Class I on August 3, 2015, the performance figures are hypothetical and reflect the performance of the Manning & Napier Fund, Inc. - Core Bond Series - Class S.
5The Series’ primary index has changed from the Bank of America Merrill Lynch U.S. Corporate, Government & Mortgage Index to the Barclays U.S. Aggregate Bond Index because the market representation of the Barclays U.S. Aggregate Bond Index better represents the principal investment strategies of the Series.
6The Barclays U.S. Aggregate Bond Index is an unmanaged, market-value weighted index of U.S. domestic investment-grade debt issues, including government, corporate, asset backed, and mortgage-backed securities, with maturities of one year or more. Index returns do not reflect any fees or expenses. Index returns provided by Interactive Data.
3
Core Bond Series
Performance Update as of December 31, 2015
(unaudited)
7The unmanaged Bank of America (BofA) Merrill Lynch U.S. Corporate, Government & Mortgage Index is a market value weighted measure that represents U.S. government, corporate, and pass-through securities issued by entities within the United States, by supranational entities, or by entities headquartered outside of the United States but who have issued dollar-denominated securities within the United States. The Index only includes investment-grade securities with maturities of greater than one year. Index returns assume reinvestment of coupons and do not reflect any fees or expenses. Index returns provided by Bloomberg.
4
Core Bond Series
Shareholder Expense Example
(unaudited)
As a shareholder of the Series, you incur ongoing costs, including management fees, shareholder service fees and other Series expenses. This example is intended to help you understand your ongoing costs (in dollars) of investing in the Series and to compare these costs with the ongoing costs of investing in other mutual funds.
The example is based on an investment of $1,000 invested at the beginning of the period and held for the entire period (July 1, 2015 to December 31, 2015).
Actual Expenses
The first line of the table below provides information about actual account values and actual expenses. You may use the information in this line, together with the amount you invested, to estimate the expenses that you paid over the period. Simply divide your account value by $1,000 (for example, an $8,600 account value divided by $1,000 = 8.6), then multiply the result by the number in the first line under the heading entitled “Expenses Paid During Period” to estimate the expenses you paid on your account during this period.
Hypothetical Example for Comparison Purposes
The second line of the table below provides information about hypothetical account values and hypothetical expenses based on the Series’ actual expense ratio and an assumed rate of return of 5% per year before expenses, which is not the Series’ actual return. The hypothetical account values and expenses may not be used to estimate the actual ending account balance or expenses you paid during the period. You may use this information to compare the ongoing costs of investing in the Series and other funds. To do so, compare this 5% hypothetical example with the 5% hypothetical examples that appear in the shareholder reports of the other funds.
Please note that the expenses shown in the table are meant to highlight your ongoing costs only and do not reflect any transaction costs such as sales charges (loads), redemption fees, or exchange fees that you may incur in other mutual funds. Therefore, the second line of the table is useful in comparing ongoing costs only, and will not help you determine the relative total costs of owning different funds.
| BEGINNING ACCOUNT VALUE 7/1/15* | ENDING ACCOUNT VALUE 12/31/15 | EXPENSES PAID DURING PERIOD** 7/1/15-12/31/15 | ANNUALIZED EXPENSE RATIO | |||||
Class S | ||||||||
Actual | $1,000.00 | $998.70 | $3.48 | 0.69% | ||||
Hypothetical | ||||||||
(5% return before expenses) | $1,000.00 | $1,021.73 | $3.52 | 0.69% | ||||
Class I | ||||||||
Actual | $1,000.00 | $994.90 | $1.89 | 0.46% | ||||
Hypothetical | ||||||||
(5% return before expenses) | $1,000.00 | $1,022.89 | $2.35 | 0.46% |
*Class I inception date was August 3, 2015.
**Expenses are equal to the Class’ annualized expense ratio (for the six-month period), multiplied by the average account value over the period, multiplied by 184/365 to reflect the one-half year period (except for the Series’ Class I Actual return information, which reflects the 150 day period ended December 31, 2015 due to its inception date of August 3, 2015). Expenses are based on the most recent fiscal half year; therefore, the expense ratios stated above may differ from the expense ratios stated in the financial highlights, which is based on one-year data. The Class’ total return would have been lower had certain expenses not been waived during the period.
5
Core Bond Series
Portfolio Composition as of December 31, 2015
(unaudited)
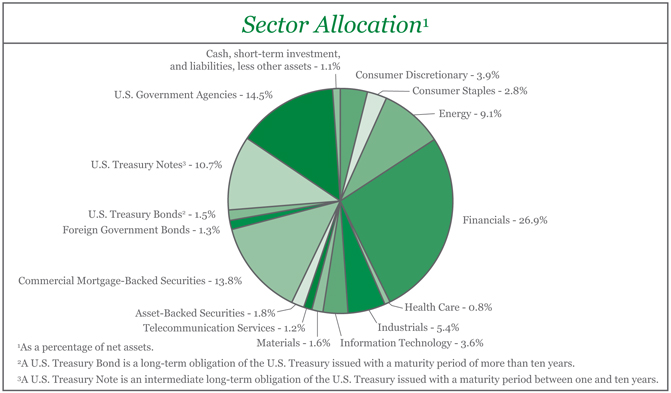
6
Core Bond Series
Investment Portfolio - December 31, 2015
| CREDIT RATING1 (UNAUDITED) | PRINCIPAL AMOUNT | VALUE (NOTE 2) | ||||||||||||
CORPORATE BONDS - 55.3% | ||||||||||||||
Non-Convertible Corporate Bonds - 55.3% | ||||||||||||||
Consumer Discretionary - 3.9% | ||||||||||||||
Auto Components - 0.5% | ||||||||||||||
Magna International, Inc. (Canada), 4.15%, 10/1/2025 | Baa1 | $ | 1,185,000 | $ | 1,206,383 | |||||||||
|
| |||||||||||||
Automobiles - 0.5% | ||||||||||||||
Ford Motor Credit Co. LLC, 8.125%, 1/15/2020 | Baa3 | 1,000,000 | 1,177,782 | |||||||||||
|
| |||||||||||||
Household Durables - 0.8% | ||||||||||||||
NVR, Inc., 3.95%, 9/15/2022 | Baa2 | 1,775,000 | 1,790,407 | |||||||||||
|
| |||||||||||||
Media - 1.6% | ||||||||||||||
DIRECTV Holdings LLC - DIRECTV Financing Co., Inc., | Baa2 | 1,280,000 | 1,386,249 | |||||||||||
Time Warner Entertainment Co. LP, 8.375%, 7/15/2033 | Baa2 | 1,800,000 | 2,123,476 | |||||||||||
|
| |||||||||||||
| 3,509,725 | ||||||||||||||
|
| |||||||||||||
Multiline Retail - 0.5% | ||||||||||||||
Dollar General Corp., 3.25%, 4/15/2023 | Baa3 | 1,200,000 | 1,142,797 | |||||||||||
|
| |||||||||||||
Total Consumer Discretionary | 8,827,094 | |||||||||||||
|
| |||||||||||||
Consumer Staples - 2.8% | ||||||||||||||
Beverages - 2.3% | ||||||||||||||
Anheuser-Busch InBev Worldwide, Inc. (Belgium), 7.75%, 1/15/2019 | A2 | 350,000 | 404,577 | |||||||||||
Anheuser-Busch InBev Worldwide, Inc. (Belgium), 8.20%, 1/15/2039 | A2 | 1,650,000 | 2,378,396 | |||||||||||
PepsiCo, Inc., 3.10%, 7/17/2022 | A1 | 2,400,000 | 2,463,389 | |||||||||||
|
| |||||||||||||
Food & Staples Retailing - 0.5% | ||||||||||||||
CVS Health Corp., 3.50%, 7/20/2022 | Baa1 | 1,200,000 | 1,221,067 | |||||||||||
|
| |||||||||||||
Total Consumer Staples | 6,467,429 | |||||||||||||
|
| |||||||||||||
Energy - 9.1% | ||||||||||||||
Energy Equipment & Services - 2.4% | ||||||||||||||
Baker Hughes, Inc., 7.50%, 11/15/2018 | A2 | 885,000 | 999,185 | |||||||||||
Ensco plc, 4.70%, 3/15/2021 | Baa2 | 1,750,000 | 1,409,063 | |||||||||||
Ensco plc, 5.20%, 3/15/2025 | Baa2 | 1,135,000 | 807,747 | |||||||||||
Schlumberger Holdings Corp.2, 3.625%, 12/21/2022 | A2 | 2,300,000 | 2,271,993 | |||||||||||
|
| |||||||||||||
| 5,487,988 | ||||||||||||||
|
| |||||||||||||
Oil, Gas & Consumable Fuels - 6.7% | ||||||||||||||
BP Capital Markets plc (United Kingdom), 3.535%, 11/4/2024 | A2 | 750,000 | 729,472 | |||||||||||
Chevron Corp., 1.79%, 11/16/2018 | Aa1 | 1,160,000 | 1,149,502 | |||||||||||
Columbia Pipeline Group, Inc.2, 2.45%, 6/1/2018 | Baa2 | 1,200,000 | 1,173,262 | |||||||||||
Columbia Pipeline Group, Inc.2, 4.50%, 6/1/2025 | Baa2 | 1,200,000 | 1,087,488 | |||||||||||
ConocoPhillips Co., 3.35%, 5/15/2025 | A2 | 1,100,000 | 994,051 | |||||||||||
El Paso Natural Gas Co. LLC, 8.625%, 1/15/2022 | Baa3 | 180,000 | 195,487 | |||||||||||
Hiland Partners LP - Hiland Partners Finance Corp.2, 7.25%, 10/1/2020 | Baa3 | 1,700,000 | 1,717,000 | |||||||||||
Kinder Morgan Energy Partners LP, 4.30%, 5/1/2024 | Baa3 | 2,500,000 | 2,149,530 | |||||||||||
Kinder Morgan, Inc.2, 5.625%, 11/15/2023 | Baa3 | 1,650,000 | 1,508,310 | |||||||||||
The accompanying notes are an integral part of the financial statements.
7
Core Bond Series
Investment Portfolio - December 31, 2015
| CREDIT RATING1 (UNAUDITED) | PRINCIPAL AMOUNT | VALUE (NOTE 2) | ||||||||||||
CORPORATE BONDS (continued) | ||||||||||||||
Non-Convertible Corporate Bonds (continued) | ||||||||||||||
Energy (continued) | ||||||||||||||
Oil, Gas & Consumable Fuels (continued) | ||||||||||||||
Petrobras Global Finance B.V. (Brazil)3, 1.99%, 5/20/2016 | Ba3 | $ | 1,200,000 | $ | 1,170,000 | |||||||||
Petroleos Mexicanos (Mexico), 5.75%, 3/1/2018 | Baa1 | 680,000 | 707,880 | |||||||||||
Petroleos Mexicanos (Mexico)2, 4.50%, 1/23/2026 | Baa1 | 1,150,000 | 1,010,275 | |||||||||||
Talisman Energy, Inc. (Canada), 3.75%, 2/1/2021 | Baa3 | 780,000 | 707,220 | |||||||||||
TransCanada PipeLines Ltd. (Canada), 1.625%, 11/9/2017 | A3 | 750,000 | 743,842 | |||||||||||
|
| |||||||||||||
| 15,043,319 | ||||||||||||||
|
| |||||||||||||
Total Energy | 20,531,307 | |||||||||||||
|
| |||||||||||||
Financials - 26.9% | ||||||||||||||
Banks - 9.1% | ||||||||||||||
Bank of America Corp., 5.42%, 3/15/2017 | Baa3 | 1,193,000 | 1,241,785 | |||||||||||
Bank of America Corp., 5.70%, 5/2/2017 | Baa3 | 1,100,000 | 1,147,164 | |||||||||||
Bank of America Corp., 4.00%, 1/22/2025 | Baa3 | 625,000 | 611,830 | |||||||||||
Barclays Bank plc (United Kingdom)2, 6.05%, 12/4/2017 | Baa3 | 555,000 | 592,000 | |||||||||||
Barclays Bank plc (United Kingdom)2, 10.179%, 6/12/2021 | Baa3 | 1,750,000 | 2,266,943 | |||||||||||
BBVA Bancomer S.A. (Mexico)2, 6.75%, 9/30/2022 | Baa2 | 1,185,000 | 1,303,500 | |||||||||||
Citigroup, Inc., 3.875%, 3/26/2025 | Baa3 | 765,000 | 744,565 | |||||||||||
Citigroup, Inc.3, 0.943%, 8/25/2036 | Baa3 | 1,000,000 | 759,328 | |||||||||||
Cooperatieve Centrale Raiffeisen-Boerenleenbank B.A. | WR | 6 | 1,150,000 | 1,181,620 | ||||||||||
Intesa Sanpaolo S.p.A. (Italy), 2.375%, 1/13/2017 | Baa1 | 770,000 | 772,504 | |||||||||||
Intesa Sanpaolo S.p.A. (Italy), 3.875%, 1/15/2019 | Baa1 | 800,000 | 823,701 | |||||||||||
Intesa Sanpaolo S.p.A. (Italy)2, 6.50%, 2/24/2021 | Baa1 | 800,000 | 907,434 | |||||||||||
JPMorgan Chase & Co., 4.95%, 3/25/2020 | A3 | 1,500,000 | 1,626,489 | |||||||||||
Lloyds Banking Group plc (United Kingdom)2, 4.582%, 12/10/2025 | Baa2 | 4,378,000 | 4,388,665 | |||||||||||
Santander Bank N.A., 8.75%, 5/30/2018 | Baa2 | 650,000 | 733,619 | |||||||||||
Santander Holdings USA, Inc., 2.65%, 4/17/2020 | Baa2 | 750,000 | 735,801 | |||||||||||
Santander Issuances S.A.U. (Spain)2, 5.911%, 6/20/2016 | Baa2 | 750,000 | 761,896 | |||||||||||
|
| |||||||||||||
| 20,598,844 | ||||||||||||||
|
| |||||||||||||
Capital Markets - 5.1% | ||||||||||||||
The Goldman Sachs Group, Inc., 5.625%, 1/15/2017 | Baa2 | 1,000,000 | 1,038,675 | |||||||||||
The Goldman Sachs Group, Inc., 7.50%, 2/15/2019 | A3 | 1,100,000 | 1,258,687 | |||||||||||
The Goldman Sachs Group, Inc.3, 2.012%, 11/29/2023 | A3 | 755,000 | 761,701 | |||||||||||
The Goldman Sachs Group, Inc., 4.25%, 10/21/2025 | Baa2 | 1,130,000 | 1,121,363 | |||||||||||
Morgan Stanley, 5.95%, 12/28/2017 | A3 | 1,500,000 | 1,612,991 | |||||||||||
Morgan Stanley, 2.125%, 4/25/2018 | A3 | 1,400,000 | 1,401,869 | |||||||||||
Morgan Stanley, 5.00%, 11/24/2025 | Baa2 | 950,000 | 1,008,471 | |||||||||||
TD Ameritrade Holding Corp., 2.95%, 4/1/2022 | A3 | 1,000,000 | 990,541 | |||||||||||
UBS AG (Switzerland)3, 7.25%, 2/22/2022 | BBB | 7 | 475,000 | 495,564 | ||||||||||
UBS AG (Switzerland), 7.625%, 8/17/2022 | BBB | 7 | 435,000 | 495,900 | ||||||||||
The accompanying notes are an integral part of the financial statements.
8
Core Bond Series
Investment Portfolio - December 31, 2015
| CREDIT RATING1 (UNAUDITED) | PRINCIPAL AMOUNT | VALUE (NOTE 2) | ||||||||||||
CORPORATE BONDS (continued) | ||||||||||||||
Non-Convertible Corporate Bonds (continued) | ||||||||||||||
Financials (continued) | ||||||||||||||
Capital Markets (continued) | ||||||||||||||
UBS AG (Switzerland)3, 4.75%, 5/22/2023 | BBB | 7 | $ | 1,285,000 | $ | 1,304,682 | ||||||||
|
| |||||||||||||
| 11,490,444 | ||||||||||||||
|
| |||||||||||||
Diversified Financial Services - 2.7% | ||||||||||||||
General Electric Capital Corp.3, 0.714%, 5/5/2026 | A1 | 1,270,000 | 1,177,508 | |||||||||||
ING Bank N.V. (Netherlands)2, 5.80%, 9/25/2023 | Baa2 | 735,000 | 798,555 | |||||||||||
ING Bank N.V. (Netherlands)3, 4.125%, 11/21/2023 | Baa2 | 1,590,000 | 1,619,434 | |||||||||||
Peachtree Corners Funding Trust2, 3.976%, 2/15/2025 | Baa2 | 1,350,000 | 1,340,252 | |||||||||||
Voya Financial, Inc., 2.90%, 2/15/2018 | Baa2 | 1,150,000 | 1,162,431 | |||||||||||
|
| |||||||||||||
| 6,098,180 | ||||||||||||||
|
| |||||||||||||
Insurance - 6.0% | ||||||||||||||
Aegon N.V. (Netherlands)3,4, 2.142% | Baa1 | 875,000 | 691,963 | |||||||||||
American International Group, Inc., 4.875%, 6/1/2022 | Baa1 | 2,450,000 | 2,645,853 | |||||||||||
American International Group, Inc., 4.125%, 2/15/2024 | Baa1 | 1,700,000 | 1,745,749 | |||||||||||
Assured Guaranty US Holdings, Inc., 5.00%, 7/1/2024 | Baa2 | 4,750,000 | 4,934,751 | |||||||||||
AXA S.A. (France)3,4, 2.312% | A3 | 1,725,000 | 1,406,315 | |||||||||||
First American Financial Corp., 4.30%, 2/1/2023 | Baa3 | 915,000 | 908,479 | |||||||||||
Prudential Financial, Inc.4,8, 5.875% | Baa2 | 1,130,000 | 1,174,635 | |||||||||||
|
| |||||||||||||
| 13,507,745 | ||||||||||||||
|
| |||||||||||||
Real Estate Investment Trusts (REITS) - 4.0% | ||||||||||||||
American Tower Corp., 2.80%, 6/1/2020 | Baa3 | 1,300,000 | 1,285,038 | |||||||||||
AvalonBay Communities, Inc., 6.10%, 3/15/2020 | Baa1 | 850,000 | 964,671 | |||||||||||
Crown Castle Towers LLC2, 6.113%, 1/15/2020 | A2 | 745,000 | 812,538 | |||||||||||
Crown Castle Towers LLC2, 4.883%, 8/15/2020 | A2 | 250,000 | 267,255 | |||||||||||
Crown Castle Towers LLC2, 3.222%, 5/15/2022 | A2 | 400,000 | 394,664 | |||||||||||
Digital Delta Holdings LLC2, 3.40%, 10/1/2020 | Baa2 | 450,000 | 450,493 | |||||||||||
Digital Realty Trust LP, 5.875%, 2/1/2020 | Baa2 | 650,000 | 716,599 | |||||||||||
GTP Acquisition Partners I LLC2, 2.35%, 6/15/2020 | Aaa | 450,000 | 436,383 | |||||||||||
HCP, Inc., 4.00%, 6/1/2025 | Baa1 | 1,200,000 | 1,171,696 | |||||||||||
Ventas Realty LP, 4.125%, 1/15/2026 | Baa1 | 500,000 | 498,417 | |||||||||||
Ventas Realty LP - Ventas Capital Corp., 4.75%, 6/1/2021 | Baa1 | 300,000 | 319,503 | |||||||||||
Welltower, Inc., 4.95%, 1/15/2021 | Baa2 | 990,000 | 1,061,444 | |||||||||||
Welltower, Inc., 4.00%, 6/1/2025 | Baa2 | 800,000 | 786,933 | |||||||||||
|
| |||||||||||||
| 9,165,634 | ||||||||||||||
|
| |||||||||||||
Total Financials | 60,860,847 | |||||||||||||
|
| |||||||||||||
Health Care - 0.8% | ||||||||||||||
Biotechnology - 0.5% | ||||||||||||||
AbbVie, Inc., 1.80%, 5/14/2018 | Baa1 | 1,000,000 | 995,396 | |||||||||||
|
| |||||||||||||
The accompanying notes are an integral part of the financial statements.
9
Core Bond Series
Investment Portfolio - December 31, 2015
| CREDIT RATING1 (UNAUDITED) | PRINCIPAL AMOUNT | VALUE (NOTE 2) | ||||||||||||
CORPORATE BONDS (continued) | ||||||||||||||
Non-Convertible Corporate Bonds (continued) | ||||||||||||||
Health Care (continued) | ||||||||||||||
Health Care Providers & Services - 0.3% | ||||||||||||||
Aetna, Inc., 3.50%, 11/15/2024 | Baa1 | $ | 765,000 | $ | 763,622 | |||||||||
|
| |||||||||||||
Total Health Care | 1,759,018 | |||||||||||||
|
| |||||||||||||
Industrials - 5.4% | ||||||||||||||
Airlines - 0.9% | ||||||||||||||
American Airlines Pass-Through Trust, Series 2013-2, Class A, 4.95%, 1/15/2023 | A | 7 | 750,673 | 791,960 | ||||||||||
Southwest Airlines Co., 2.75%, 11/6/2019 | Baa1 | 765,000 | 770,930 | |||||||||||
Southwest Airlines Co., 2.65%, 11/5/2020 | Baa1 | 400,000 | 397,967 | |||||||||||
|
| |||||||||||||
| 1,960,857 | ||||||||||||||
|
| |||||||||||||
Construction & Engineering - 0.4% | ||||||||||||||
Fluor Corp., 3.50%, 12/15/2024 | A3 | 800,000 | 799,336 | |||||||||||
|
| |||||||||||||
Industrial Conglomerates - 1.4% | ||||||||||||||
Danaher Corp., 1.65%, 9/15/2018 | A2 | 1,225,000 | 1,224,359 | |||||||||||
Siemens Financieringsmaatschappij N.V. (Germany)2, 2.90%, 5/27/2022 | A1 | 2,000,000 | 1,999,204 | |||||||||||
|
| |||||||||||||
| 3,223,563 | ||||||||||||||
|
| |||||||||||||
Machinery - 0.5% | ||||||||||||||
Stanley Black & Decker, Inc., 2.451%, 11/17/2018 | Baa2 | 1,200,000 | 1,204,682 | |||||||||||
|
| |||||||||||||
Trading Companies & Distributors - 2.2% | ||||||||||||||
Air Lease Corp., 2.625%, 9/4/2018 | BBB | 7 | 2,425,000 | 2,397,018 | ||||||||||
Air Lease Corp., 3.375%, 1/15/2019 | BBB | 7 | 185,000 | 185,925 | ||||||||||
Aviation Capital Group Corp.2, 2.875%, 9/17/2018 | BBB | 7 | 2,500,000 | 2,485,655 | ||||||||||
|
| |||||||||||||
| 5,068,598 | ||||||||||||||
|
| |||||||||||||
Total Industrials | 12,257,036 | |||||||||||||
|
| |||||||||||||
Information Technology - 3.6% | ||||||||||||||
Communications Equipment - 0.8% | ||||||||||||||
QUALCOMM, Inc., 3.00%, 5/20/2022 | A1 | 600,000 | 593,987 | |||||||||||
QUALCOMM, Inc., 3.45%, 5/20/2025 | A1 | 1,200,000 | 1,150,991 | |||||||||||
|
| |||||||||||||
| 1,744,978 | ||||||||||||||
|
| |||||||||||||
Internet Software & Services - 0.7% | ||||||||||||||
Baidu, Inc. (China), 2.75%, 6/9/2019 | A3 | 800,000 | 793,038 | |||||||||||
Tencent Holdings Ltd. (China)2, 3.375%, 5/2/2019 | A2 | 825,000 | 838,899 | |||||||||||
|
| |||||||||||||
| 1,631,937 | ||||||||||||||
|
| |||||||||||||
IT Services - 1.1% | ||||||||||||||
Automatic Data Processing, Inc., 2.25%, 9/15/2020 | Aa3 | 1,200,000 | 1,204,544 | |||||||||||
Visa, Inc., 2.80%, 12/14/2022 | A1 | 1,140,000 | 1,144,712 | |||||||||||
|
| |||||||||||||
| 2,349,256 | ||||||||||||||
|
| |||||||||||||
The accompanying notes are an integral part of the financial statements.
10
Core Bond Series
Investment Portfolio - December 31, 2015
| CREDIT RATING1 (UNAUDITED) | PRINCIPAL AMOUNT | VALUE (NOTE 2) | ||||||||||||
CORPORATE BONDS (continued) | ||||||||||||||
Non-Convertible Corporate Bonds (continued) | ||||||||||||||
Information Technology (continued) | ||||||||||||||
Semiconductors & Semiconductor Equipment - 0.5% | ||||||||||||||
Intel Corp., 2.45%, 7/29/2020 | A1 | $ | 1,200,000 | $ | 1,213,726 | |||||||||
|
| |||||||||||||
Technology Hardware, Storage & Peripherals - 0.5% | ||||||||||||||
Hewlett Packard Enterprise Co.2, 2.45%, 10/5/2017 | Baa2 | 1,165,000 | 1,164,012 | |||||||||||
|
| |||||||||||||
Total Information Technology | 8,103,909 | |||||||||||||
|
| |||||||||||||
Materials - 1.6% | ||||||||||||||
Chemicals - 1.0% | ||||||||||||||
The Dow Chemical Co., 8.55%, 5/15/2019 | Baa2 | 965,000 | 1,137,396 | |||||||||||
Solvay Finance America LLC (Belgium)2, 3.40%, 12/3/2020 | Baa2 | 1,200,000 | 1,190,356 | |||||||||||
|
| |||||||||||||
| 2,327,752 | ||||||||||||||
|
| |||||||||||||
Metals & Mining - 0.3% | ||||||||||||||
Rio Tinto Finance USA Ltd. (United Kingdom), 3.75%, 9/20/2021 | A3 | 625,000 | 607,521 | |||||||||||
|
| |||||||||||||
Paper & Forest Products - 0.3% | ||||||||||||||
Domtar Corp., 4.40%, 4/1/2022 | Baa3 | 735,000 | 747,369 | |||||||||||
|
| |||||||||||||
Total Materials | 3,682,642 | |||||||||||||
|
| |||||||||||||
Telecommunication Services - 1.2% | ||||||||||||||
Diversified Telecommunication Services - 1.0% | ||||||||||||||
Verizon Communications, Inc., 6.35%, 4/1/2019 | Baa1 | 1,000,000 | 1,125,034 | |||||||||||
Verizon Communications, Inc., 5.15%, 9/15/2023 | Baa1 | 1,040,000 | 1,143,299 | |||||||||||
|
| |||||||||||||
| 2,268,333 | ||||||||||||||
|
| |||||||||||||
Wireless Telecommunication Services - 0.2% | ||||||||||||||
SBA Tower Trust2, 3.598%, 4/15/2018 | Baa3 | 465,000 | 463,328 | |||||||||||
|
| |||||||||||||
Total Telecommunication Services | 2,731,661 | |||||||||||||
|
| |||||||||||||
TOTAL CORPORATE BONDS | ||||||||||||||
(Identified Cost $127,340,505) | 125,220,943 | |||||||||||||
|
| |||||||||||||
ASSET-BACKED SECURITIES - 1.8% | ||||||||||||||
Alterna Funding I LLC, Series 2014-1A, Class NOTE2, 1.639%, 2/15/2021 | WR | 6 | 185,733 | 184,659 | ||||||||||
Cazenovia Creek Funding I LLC, Series 2015-1A, Class A2, 2.00%, 12/10/2023 | WR | 6 | 529,329 | 529,822 | ||||||||||
Colony American Homes, Series 2015-1A, Class A2,3, 1.551%, 7/17/2032 | Aaa | 574,265 | 561,023 | |||||||||||
Enterprise Fleet Financing LLC, Series 2015-2, Class A22, 1.59%, 2/22/2021 | AAA | 7 | 725,000 | 720,240 | ||||||||||
FDIC Trust, Series 2011-R1, Class A2, 2.672%, 7/25/2026 | WR | 6 | 84,355 | 85,680 | ||||||||||
FNA Trust, Series 2014-1A, Class A2, 1.296%, 12/10/2022 | WR | 6 | 157,130 | 156,859 | ||||||||||
Hertz Vehicle Financing LLC, Series 2010-1A, Class A22, 3.74%, 2/25/2017 | Aaa | 198,333 | 198,953 | |||||||||||
The accompanying notes are an integral part of the financial statements.
11
Core Bond Series
Investment Portfolio - December 31, 2015
| CREDIT RATING1 (UNAUDITED) | PRINCIPAL AMOUNT | VALUE (NOTE 2) | ||||||||||||
ASSET-BACKED SECURITIES (continued) | ||||||||||||||
Invitation Homes Trust, Series 2015-SFR3, Class A2,3, 1.651%, 8/17/2032 | Aaa | $ | 596,362 | $ | 585,015 | |||||||||
NextGear Floorplan Master Owner Trust, Series 2014-1A, Class A2, 1.92%, 10/15/2019 | Aaa | 390,000 | 386,602 | |||||||||||
SpringCastle America Funding LLC, Series 2014-AA, Class A2, 2.70%, 5/25/2023 | WR | 6 | 221,578 | 221,089 | ||||||||||
Starwood Retail Property Trust, Series 2014-STAR, Class A2,3, 1.551%, 11/15/2027 | AAA | 7 | 410,000 | 408,064 | ||||||||||
|
| |||||||||||||
TOTAL ASSET-BACKED SECURITIES | ||||||||||||||
(Identified Cost $4,071,716) | 4,038,006 | |||||||||||||
|
| |||||||||||||
COMMERCIAL MORTGAGE-BACKED SECURITIES - 13.8% | ||||||||||||||
Americold LLC Trust, Series 2010-ARTA, Class A12, 3.847%, 1/14/2029 | AAA | 7 | 56,978 | 58,841 | ||||||||||
Banc of America Commercial Mortgage Trust, Series 2006-4, Class A4, 5.634%, 7/10/2046 | Aaa | 80,188 | 80,839 | |||||||||||
Bear Stearns Commercial Mortgage Securities Trust, Series 2006-PW12, Class A1A3, 5.906%, 9/11/2038 | Aaa | 653,897 | 656,377 | |||||||||||
Bear Stearns Commercial Mortgage Securities Trust, Series 2006-PW13, Class A4, 5.54%, 9/11/2041 | AAA | 7 | 658,103 | 664,334 | ||||||||||
Bear Stearns Commercial Mortgage Securities Trust, Series 2006-T24, Class AM3, 5.568%, 10/12/2041 | A3 | 200,000 | 204,064 | |||||||||||
BWAY Mortgage Trust, Series 2015-1740, Class A2, 2.917%, 1/13/2035 | AAA | 7 | 400,000 | 379,086 | ||||||||||
CFCRE Commercial Mortgage Trust, Series 2011-C1, Class A22, 3.759%, 4/15/2044 | Aaa | 17,958 | 17,994 | |||||||||||
Citigroup Commercial Mortgage Trust, Series 2006-C4, Class A33, 6.033%, 3/15/2049 | Aaa | 249,211 | 249,737 | |||||||||||
COBALT CMBS Commercial Mortgage Trust, Series 2006-C1, Class A4, 5.223%, 8/15/2048 | AAA | 7 | 644,188 | 654,458 | ||||||||||
Commercial Mortgage Pass-Through Certificates, Series 2006-GG7, Class A43, 6.048%, 7/10/2038 | Aaa | 297,681 | 299,050 | |||||||||||
Commercial Mortgage Pass-Through Certificates, Series 2015-3BP, Class A2, 3.178%, 2/10/2035 | WR | 6 | 400,000 | 391,978 | ||||||||||
Commercial Mortgage Pass-Through Certificates, Series 2015-LC19, Class A4, 3.183%, 2/10/2048 | Aaa | 1,100,000 | 1,078,586 | |||||||||||
Commercial Mortgage Pass-Through Certificates, Series 2015-PC1, Class A5, 3.902%, 7/10/2050 | Aaa | 700,000 | 720,703 | |||||||||||
Credit Suisse Commercial Mortgage Trust, Series 2006-C5, Class A1A, 5.297%, 12/15/2039 | Aaa | 948,373 | 969,729 | |||||||||||
Credit Suisse Mortgage Capital Trust, Series 2013-IVR3, Class A12,3, 2.50%, 5/25/2043 | AAA | 7 | 366,772 | 349,078 | ||||||||||
Credit Suisse Mortgage Capital Trust, Series 2013-TH1, Class A12,3, 2.13%, 2/25/2043 | AAA | 7 | 311,646 | 290,349 | ||||||||||
Extended Stay America Trust, Series 2013-ESH7, Class A272, 2.958%, 12/5/2031 | Aaa | 455,000 | 455,402 | |||||||||||
The accompanying notes are an integral part of the financial statements.
12
Core Bond Series
Investment Portfolio - December 31, 2015
| CREDIT RATING1 (UNAUDITED) | PRINCIPAL AMOUNT | VALUE (NOTE 2) | ||||||||||||
COMMERCIAL MORTGAGE-BACKED SECURITIES (continued) | ||||||||||||||
Fannie Mae Multifamily REMIC Trust, Series 2012-M13, Class ASQ2, 1.246%, 8/25/2017 | Aaa | $ | 253,762 | $ | 253,701 | |||||||||
Freddie Mac Multifamily Structured Pass-Through Certificates, Series K014, Class X1 (IO)3, 1.391%, 4/25/2021 | Aaa | 7,636,833 | 414,910 | |||||||||||
Freddie Mac Multifamily Structured Pass-Through Certificates, Series K016, Class X1 (IO)3, 1.708%, 10/25/2021 | Aaa | 1,193,422 | 87,646 | |||||||||||
Freddie Mac Multifamily Structured Pass-Through Certificates, Series K021, Class X1 (IO)3, 1.625%, 6/25/2022 | Aaa | 9,661,678 | 731,300 | |||||||||||
Freddie Mac Multifamily Structured Pass-Through Certificates, Series K030, Class X1 (IO)3, 0.333%, 4/25/2023 | Aaa | 14,390,916 | 195,372 | |||||||||||
Freddie Mac Multifamily Structured Pass-Through Certificates, Series K032, Class X1 (IO)3, 0.234%, 5/25/2023 | Aaa | 8,491,627 | 67,274 | |||||||||||
Freddie Mac Multifamily Structured Pass-Through Certificates, Series K706, Class X1 (IO)3, 1.706%, 10/25/2018 | Aaa | 1,645,316 | 62,365 | |||||||||||
Freddie Mac Multifamily Structured Pass-Through Certificates, Series K-P01, Class A2, 1.72%, 1/25/2019 | Aaa | 420,000 | 420,289 | |||||||||||
FREMF Mortgage Trust, Series 2011-K15, Class B2,3, 5.116%, 8/25/2044 | WR | 6 | 170,000 | 182,686 | ||||||||||
FREMF Mortgage Trust, Series 2011-K701, Class B2,3, 4.436%, 7/25/2048 | A | 7 | 160,000 | 163,715 | ||||||||||
FREMF Mortgage Trust, Series 2013-K712, Class B2,3, 3.484%, 5/25/2045 | A | 7 | 360,000 | 361,134 | ||||||||||
FREMF Mortgage Trust, Series 2015-K42, Class B2,3, 3.985%, 12/25/2024 | A | 3 | 380,000 | 363,140 | ||||||||||
FREMF Mortgage Trust, Series 2015-K43, Class B2,3, 3.863%, 2/25/2048 | WR | 6 | 400,000 | 365,770 | ||||||||||
FREMF Mortgage Trust, Series 2015-K720, Class B2,3, 3.506%, 7/25/2022 | Baa2 | 340,000 | 297,569 | |||||||||||
GAHR Commercial Mortgage Trust, Series 2015-NRF, Class BFX2,3, 3.495%, 12/15/2019 | AA | 7 | 400,000 | 399,037 | ||||||||||
GAHR Commercial Mortgage Trust, Series 2015-NRF, Class DFX2,3, 3.495%, 12/15/2019 | BBB | 7 | 220,000 | 211,612 | ||||||||||
JP Morgan Chase Commercial Mortgage Securities Trust, Series 2006-LDP7, Class A43, 6.106%, 4/15/2045 | Aaa | 300,642 | 301,605 | |||||||||||
JP Morgan Chase Commercial Mortgage Securities Trust, Series 2010-C2, Class A32, 4.07%, 11/15/2043 | AAA | 7 | 200,000 | 210,146 | ||||||||||
JP Morgan Mortgage Trust, Series 2013-1, Class 1A22,3, 3.00%, 3/25/2043 | WR | 6 | 241,332 | 235,975 | ||||||||||
JP Morgan Mortgage Trust, Series 2013-2, Class A22,3, 3.50%, 5/25/2043 | AAA | 7 | 274,904 | 276,665 | ||||||||||
JP Morgan Mortgage Trust, Series 2014-2, Class 1A12,3, 3.00%, 6/25/2029 | AAA | 7 | 308,371 | 311,503 | ||||||||||
LB-UBS Commercial Mortgage Trust, Series 2006-C7, Class A1A, 5.335%, 11/15/2038 | AAA | 7 | 813,801 | 830,134 | ||||||||||
LSTAR Commercial Mortgage Trust, Series 2014-2, Class A22, 2.767%, 1/20/2041 | Aaa | 317,115 | 315,294 | |||||||||||
The accompanying notes are an integral part of the financial statements.
13
Core Bond Series
Investment Portfolio - December 31, 2015
| CREDIT RATING1 (UNAUDITED) | PRINCIPAL AMOUNT | VALUE (NOTE 2) | ||||||||||||
COMMERCIAL MORTGAGE-BACKED SECURITIES (continued) | ||||||||||||||
Merrill Lynch Mortgage Trust, Series 2006-C2, Class A43, 5.742%, 8/12/2043 | Aaa | $ | 1,092,710 | $ | 1,103,913 | |||||||||
ML-CFC Commercial Mortgage Trust, Series 2006-4, Class A3, 5.172%, 12/12/2049 | Aaa | 1,060,578 | 1,077,695 | |||||||||||
Morgan Stanley Bank of America Merrill Lynch Trust, Series 2014-C15, Class A4, 4.051%, 4/15/2047 | Aaa | 1,100,000 | 1,158,908 | |||||||||||
Morgan Stanley Capital I Trust, Series 2006-IQ12, Class A4, 5.332%, 12/15/2043 | AAA | 7 | 2,136,971 | 2,174,891 | ||||||||||
Motel 6 Trust, Series 2015-MTL6, Class B2, 3.298%, 2/5/2030 | WR | 6 | 350,000 | 346,216 | ||||||||||
New Residential Mortgage Loan Trust, Series 2014-3A, Class AFX32,3, 3.75%, 11/25/2054 | AAA | 7 | 318,499 | 323,612 | ||||||||||
New Residential Mortgage Loan Trust, Series 2015-2A, Class A13, 3.75%, 8/25/2055 | Aaa | 589,483 | 598,043 | |||||||||||
OBP Depositor LLC Trust, Series 2010-OBP, Class A2, 4.646%, 7/15/2045 | AAA | 7 | 100,000 | 107,742 | ||||||||||
SBA Small Business Investment Companies, Series 2015-10B, Class 1, 2.829%, 9/10/2025 | Aaa | 1,655,000 | 1,677,677 | |||||||||||
SCG Trust, Series 2013-SRP1, Class AJ2,3, 2.281%, 11/15/2026 | AAA | 7 | 450,000 | 447,283 | ||||||||||
Sequoia Mortgage Trust, Series 2012-2, Class A23, 3.50%, 4/25/2042 | WR | 6 | 135,327 | 136,307 | ||||||||||
Sequoia Mortgage Trust, Series 2013-7, Class A23, 3.00%, 6/25/2043 | AAA | 7 | 223,555 | 218,455 | ||||||||||
Sequoia Mortgage Trust, Series 2013-8, Class A13, 3.00%, 6/25/2043 | Aaa | 300,218 | 290,649 | |||||||||||
U.S. Small Business Administration, Series 2015-10A, Class 1, 2.517%, 3/10/2025 | Aaa | 624,812 | 631,778 | |||||||||||
UBS-Barclays Commercial Mortgage Trust, Series 2013-C5, Class A4, 3.185%, 3/10/2046 | Aaa | 800,000 | 802,926 | |||||||||||
Vornado DP LLC Trust, Series 2010-VNO, Class A2FX2, 4.004%, 9/13/2028 | AAA | 7 | 245,000 | 258,398 | ||||||||||
Wachovia Bank Commercial Mortgage Trust, Series 2006-C26, Class A33, 6.011%, 6/15/2045 | Aaa | 985,050 | 989,850 | |||||||||||
Wells Fargo Commercial Mortgage Trust, Series 2010-C1, Class A22, 4.393%, 11/15/2043 | Aaa | 275,000 | 293,405 | |||||||||||
Wells Fargo Commercial Mortgage Trust, Series 2015-C30 - Class A4, 3.664%, 9/15/2058 | Aaa | 550,000 | 557,304 | |||||||||||
WF-RBS Commercial Mortgage Trust, Series 2011-C2, Class A42,3, 4.869%, 2/15/2044 | Aaa | 810,000 | 884,552 | |||||||||||
WF-RBS Commercial Mortgage Trust, Series 2014-C19, Class A5, 4.101%, 3/15/2047 | Aaa | 700,000 | 739,460 | |||||||||||
WF-RBS Commercial Mortgage Trust, Series 2014-C20, Class A5, 3.995%, 5/15/2047 | Aaa | 1,100,000 | 1,152,824 | |||||||||||
WinWater Mortgage Loan Trust, Series 2015-1, Class A12,3, 3.50%, 1/20/2045 | WR | 6 | 312,249 | 315,079 | ||||||||||
WinWater Mortgage Loan Trust, Series 2015-3, Class A52,3, 3.50%, 3/20/2045 | Aaa | 377,401 | 382,676 | |||||||||||
|
| |||||||||||||
TOTAL COMMERCIAL MORTGAGE-BACKED SECURITIES | ||||||||||||||
(Identified Cost $31,863,899) | 31,249,090 | |||||||||||||
|
| |||||||||||||
The accompanying notes are an integral part of the financial statements.
14
Core Bond Series
Investment Portfolio - December 31, 2015
| CREDIT RATING1 (UNAUDITED) | PRINCIPAL AMOUNT | VALUE (NOTE 2) | ||||||||||||
FOREIGN GOVERNMENT BONDS - 1.3% | ||||||||||||||
Brazilian Government International Bond (Brazil), 8.875%, 10/14/2019 | Baa3 | $ | 300,000 | $ | 335,250 | |||||||||
Export-Import Bank of Korea (South Korea), 2.625%, 12/30/2020 | Aa2 | 2,500,000 | 2,496,883 | |||||||||||
|
| |||||||||||||
TOTAL FOREIGN GOVERNMENT BONDS | ||||||||||||||
(Identified Cost $2,856,768) | 2,832,133 | |||||||||||||
|
| |||||||||||||
U.S. TREASURY SECURITIES - 12.2% | ||||||||||||||
U.S. Treasury Bonds - 1.5% | ||||||||||||||
U.S. Treasury Inflation Indexed Bonds, 0.75%, 2/15/2042 (Identified Cost $3,628,891) | 3,973,414 | 3,490,708 | ||||||||||||
|
| |||||||||||||
U.S. Treasury Notes - 10.7% | ||||||||||||||
U.S. Treasury Inflation Indexed Notes, 0.125%, 4/15/2017 | 17,313,727 | 17,279,238 | ||||||||||||
U.S. Treasury Inflation Indexed Notes, 0.125%, 4/15/2020 | 4,648,188 | 4,588,938 | ||||||||||||
U.S. Treasury Inflation Indexed Notes, 0.125%, 1/15/2022 | 2,361,087 | 2,288,009 | ||||||||||||
|
| |||||||||||||
Total U.S. Treasury Notes | ||||||||||||||
(Identified Cost $24,225,264) | 24,156,185 | |||||||||||||
|
| |||||||||||||
TOTAL U.S. TREASURY SECURITIES | ||||||||||||||
(Identified Cost $27,854,155) | 27,646,893 | |||||||||||||
|
| |||||||||||||
U.S. GOVERNMENT AGENCIES - 14.5% | ||||||||||||||
Mortgage-Backed Securities - 6.4% | ||||||||||||||
Fannie Mae, Pool #888468, 5.50%, 9/1/2021 | 319,366 | 342,745 | ||||||||||||
Fannie Mae, Pool #995233, 5.50%, 10/1/2021 | 24,045 | 25,589 | ||||||||||||
Fannie Mae, Pool #888017, 6.00%, 11/1/2021 | 31,434 | 34,091 | ||||||||||||
Fannie Mae, Pool #995329, 5.50%, 12/1/2021 | 218,336 | 233,983 | ||||||||||||
Fannie Mae, Pool #888136, 6.00%, 12/1/2021 | 39,409 | 42,797 | ||||||||||||
Fannie Mae, Pool #888810, 5.50%, 11/1/2022 | 381,058 | 407,666 | ||||||||||||
Fannie Mae, Pool #AD0462, 5.50%, 10/1/2024 | 24,469 | 26,713 | ||||||||||||
Fannie Mae, Pool #AL5861, 4.50%, 1/1/2031 | 596,713 | 647,725 | ||||||||||||
Fannie Mae, Pool #MA1834, 4.50%, 2/1/2034 | 148,620 | 161,400 | ||||||||||||
Fannie Mae, Pool #MA1890, 4.00%, 5/1/2034 | 284,578 | 304,519 | ||||||||||||
Fannie Mae, Pool #MA2177, 4.00%, 2/1/2035 | 270,214 | 288,836 | ||||||||||||
Fannie Mae, Pool #MA2198, 3.50%, 3/1/2035 | 928,306 | 969,756 | ||||||||||||
Fannie Mae, Pool #828377, 5.50%, 6/1/2035 | 606,861 | 681,143 | ||||||||||||
Fannie Mae, Pool #889494, 5.50%, 1/1/2037 | 644,641 | 724,897 | ||||||||||||
Fannie Mae, Pool #933731, 5.50%, 4/1/2038 | 83,581 | 93,138 | ||||||||||||
Fannie Mae, Pool #889624, 5.50%, 5/1/2038 | 103,452 | 115,599 | ||||||||||||
Fannie Mae, Pool #995876, 6.00%, 11/1/2038 | 284,581 | 321,634 | ||||||||||||
Fannie Mae, Pool #AD0307, 5.50%, 1/1/2039 | 103,392 | 115,577 | ||||||||||||
Fannie Mae, Pool #AL6294, 4.50%, 11/1/2044 | 823,285 | 892,753 | ||||||||||||
Freddie Mac, Pool #G11850, 5.50%, 7/1/2020 | 111,862 | 118,165 | ||||||||||||
Freddie Mac, Pool #G12610, 6.00%, 3/1/2022 | 38,647 | 42,075 | ||||||||||||
The accompanying notes are an integral part of the financial statements.
15
Core Bond Series
Investment Portfolio - December 31, 2015
| PRINCIPAL AMOUNT/ SHARES | VALUE (NOTE 2) | |||||||||
U.S. GOVERNMENT AGENCIES (continued) | ||||||||||
Mortgage-Backed Securities (continued) | ||||||||||
Freddie Mac, Pool #G12655, 6.00%, 5/1/2022 | $ | 27,782 | $ | 30,229 | ||||||
Freddie Mac, Pool #G12988, 6.00%, 1/1/2023 | 21,166 | 22,970 | ||||||||
Freddie Mac, Pool #G13078, 6.00%, 3/1/2023 | 38,058 | 41,405 | ||||||||
Freddie Mac, Pool #D98711, 4.50%, 7/1/2031 | 216,598 | 235,301 | ||||||||
Freddie Mac, Pool #C91746, 4.50%, 12/1/2033 | 224,633 | 243,956 | ||||||||
Freddie Mac, Pool #C91754, 4.50%, 3/1/2034 | 211,559 | 229,530 | ||||||||
Freddie Mac, Pool #C91766, 4.50%, 5/1/2034 | 209,857 | 228,711 | ||||||||
Freddie Mac, Pool #C91771, 4.50%, 6/1/2034 | 213,128 | 232,587 | ||||||||
Freddie Mac, Pool #C91780, 4.50%, 7/1/2034 | 218,621 | 237,392 | ||||||||
Freddie Mac, Pool #C91832, 3.50%, 6/1/2035 | 1,052,854 | 1,098,198 | ||||||||
Freddie Mac, Pool #C91854, 4.00%, 10/1/2035 | 795,451 | 849,617 | ||||||||
Freddie Mac, Pool #G07655, 5.50%, 12/1/2035 | 200,159 | 222,358 | ||||||||
Freddie Mac, Pool #G05956, 5.50%, 7/1/2038 | 89,941 | 100,064 | ||||||||
Freddie Mac, Pool #G05671, 5.50%, 8/1/2038 | 22,925 | 25,497 | ||||||||
Freddie Mac, Pool #G08331, 4.50%, 2/1/2039 | 791,101 | 853,257 | ||||||||
Freddie Mac, Pool #G05275, 5.50%, 2/1/2039 | 617,815 | 688,637 | ||||||||
Freddie Mac, Pool #G05900, 6.00%, 3/1/2040 | 174,848 | 197,476 | ||||||||
Freddie Mac, Pool #G60071, 4.50%, 7/1/2042 | 667,204 | 718,782 | ||||||||
Freddie Mac, Pool #Q17513, 3.50%, 4/1/2043 | 276,290 | 284,760 | ||||||||
Freddie Mac, Pool #C09068, 3.50%, 11/1/2044 | 196,293 | 202,226 | ||||||||
Freddie Mac, Pool #G08672, 4.00%, 10/1/2045 | 1,192,883 | 1,261,148 | ||||||||
|
| |||||||||
Total Mortgage-Backed Securities | ||||||||||
(Identified Cost $14,564,103) | 14,594,902 | |||||||||
|
| |||||||||
Other Agencies - 8.1% | ||||||||||
Fannie Mae, 0.875%, 5/21/2018 | 16,150,000 | 15,998,610 | ||||||||
Fannie Mae, 2.625%, 9/6/2024 | 2,300,000 | 2,324,286 | ||||||||
|
| |||||||||
Total Other Agencies | ||||||||||
(Identified Cost $18,421,014) | 18,322,896 | |||||||||
|
| |||||||||
TOTAL U.S. GOVERNMENT AGENCIES | ||||||||||
(Identified Cost $32,985,117) | 32,917,798 | |||||||||
|
| |||||||||
SHORT-TERM INVESTMENT - 2.4% | ||||||||||
Dreyfus Cash Management, Inc. - Institutional Shares9, 0.23%, (Identified Cost $5,504,201) | 5,504,201 | 5,504,201 | ||||||||
|
| |||||||||
TOTAL INVESTMENTS - 101.3% | ||||||||||
(Identified Cost $232,476,361) | 229,409,064 | |||||||||
LIABILITIES, LESS OTHER ASSETS - (1.3%) | (3,032,007 | ) | ||||||||
|
| |||||||||
NET ASSETS - 100% | $ | 226,377,057 | ||||||||
|
| |||||||||
The accompanying notes are an integral part of the financial statements.
16
Core Bond Series
Investment Portfolio - December 31, 2015
KEY:
IO - Interest only
1Credit ratings from Moody’s (unaudited).
2Restricted securities - Investment in securities that are restricted as to public resale under the Securities Act of 1933, as amended. These securities have been sold under rule 144A and have been determined to be liquid under guidelines established by the Board of Directors. These securities amount to $44,664,303 or 19.7%, of the Series’ net assets as of December 31, 2015 (see Note 2 to the financial statements).
3The coupon rate is floating and is the effective rate as of December 31, 2015.
4Security is perpetual in nature and has no stated maturity date.
5The rate shown is a fixed rate as of December 31, 2015; the rate becomes floating, based on U.S. Treasury Note (5 Year) in July 2016.
6Credit rating has been withdrawn. As of December 31, 2015, there is no rating available (unaudited).
7Credit ratings from S&P (unaudited).
8The rate shown is a fixed rate as of December 31, 2015; the rate becomes floating, based on LIBOR plus a spread, in September 2022.
9Rate shown is the current yield as of December 31, 2015.
The Global Industry Classification Standard (GICS) was developed by and is the exclusive property and a service mark of MSCI Inc. (MSCI) and Standard & Poor’s, a division of The McGraw-Hill Companies, Inc. (S&P), and is licensed for use by Manning & Napier when referencing GICS sectors. Neither MSCI, S&P, nor any third party involved in making or compiling the GICS or any GICS classifications makes any express or implied warranties or representations with respect to such standard or classification, nor shall any such party have any liability therefrom.
The accompanying notes are an integral part of the financial statements.
17
Core Bond Series
Statement of Assets and Liabilities
December 31, 2015
ASSETS: | ||||
Investments, at value (identified cost $232,476,361) (Note 2) | $ | 229,409,064 | ||
Interest receivable | 1,658,076 | |||
Receivable for fund shares sold | 219,692 | |||
|
| |||
TOTAL ASSETS | 231,286,832 | |||
|
| |||
LIABILITIES: | ||||
Accrued management fees (Note 3) | 62,843 | |||
Accrued shareholder services fees (Class S) (Note 3) | 31,178 | |||
Accrued fund accounting and administration fees (Note 3) | 26,938 | |||
Accrued transfer agent fees (Note 3) | 968 | |||
Accrued Chief Compliance Officer service fees (Note 3) | 429 | |||
Payable for fund shares repurchased | 4,770,447 | |||
Other payables and accrued expenses | 16,972 | |||
|
| |||
TOTAL LIABILITIES | 4,909,775 | |||
|
| |||
TOTAL NET ASSETS | $ | 226,377,057 | ||
|
| |||
NET ASSETS CONSIST OF: | ||||
Capital stock | $ | 221,637 | ||
Additional paid-in-capital | 229,122,532 | |||
Undistributed net investment income | 75,848 | |||
Accumulated net realized gain on investments | 24,337 | |||
Net unrealized depreciation on investments | (3,067,297 | ) | ||
|
| |||
TOTAL NET ASSETS | $ | 226,377,057 | ||
|
| |||
NET ASSET VALUE, OFFERING PRICE AND REDEMPTION PRICE PER SHARE - Class S | $ | 10.48 | ||
|
| |||
NET ASSET VALUE, OFFERING PRICE AND REDEMPTION PRICE PER SHARE - Class I | $ | 9.75 | ||
|
| |||
The accompanying notes are an integral part of the financial statements.
18
Core Bond Series
Statement of Operations
For the Year Ended December 31, 2015
INVESTMENT INCOME: | ||||
Interest | $ | 5,633,612 | ||
Dividends | 40,997 | |||
|
| |||
Total Investment Income | 5,674,609 | |||
|
| |||
EXPENSES: | ||||
Management fees (Note 3) | 1,042,546 | |||
Shareholder services fees (Class S) (Note 3) | 176,700 | |||
Fund accounting and administration fees (Note 3) | 82,292 | |||
Directors’ fees (Note 3) | 7,731 | |||
Transfer agent fees (Note 3) | 2,639 | |||
Chief Compliance Officer service fees (Note 3) | 2,541 | |||
Custodian fees | 15,136 | |||
Miscellaneous | 94,953 | |||
|
| |||
Total Expenses | 1,424,538 | |||
Less reduction of expenses (Note 3) | (58,978 | ) | ||
|
| |||
Net Expenses | 1,365,560 | |||
|
| |||
NET INVESTMENT INCOME | 4,309,049 | |||
|
| |||
REALIZED AND UNREALIZED GAIN (LOSS) ON INVESTMENTS: | ||||
Net realized gain on investments | 1,262,615 | |||
Net change in unrealized appreciation (depreciation) on investments | (5,326,325 | ) | ||
|
| |||
NET REALIZED AND UNREALIZED GAIN (LOSS) ON INVESTMENTS | (4,063,710 | ) | ||
|
| |||
NET INCREASE IN NET ASSETS RESULTING FROM OPERATIONS | $ | 245,339 | ||
|
| |||
The accompanying notes are an integral part of the financial statements.
19
Core Bond Series
Statements of Changes in Net Assets
| FOR THE YEAR ENDED 12/31/15 | FOR THE YEAR ENDED 12/31/14 | |||||||
INCREASE (DECREASE) IN NET ASSETS: | ||||||||
OPERATIONS: | ||||||||
Net investment income | $ | 4,309,049 | $ | 4,492,307 | ||||
Net realized gain on investments | 1,262,615 | 2,116,134 | ||||||
Net change in unrealized appreciation (depreciation) on investments | (5,326,325 | ) | (962,167 | ) | ||||
|
|
|
| |||||
Net increase from operations | 245,339 | 5,646,274 | ||||||
|
|
|
| |||||
DISTRIBUTIONS TO SHAREHOLDERS (Note 8): | ||||||||
From net investment income (Class S) | (3,237,173 | ) | (4,503,109 | ) | ||||
From net investment income (Class I) | (996,028 | ) | — | |||||
From net realized gain on investments (Class S) | (788,319 | ) | (1,691,493 | ) | ||||
From net realized gain on investments (Class I) | (472,098 | ) | — | |||||
|
|
|
| |||||
Total distributions to shareholders | (5,493,618 | ) | (6,194,602 | ) | ||||
|
|
|
| |||||
CAPITAL STOCK ISSUED AND REPURCHASED: | ||||||||
Net increase from capital share transactions (Note 5) | 78,606,983 | 457,670 | ||||||
|
|
|
| |||||
Net increase (decrease) in net assets | 73,358,704 | (90,658 | ) | |||||
NET ASSETS: | ||||||||
Beginning of year | 153,018,353 | 153,109,011 | ||||||
|
|
|
| |||||
End of year (including undistributed net investment income of $75,848 and $0, respectively) | $ | 226,377,057 | $ | 153,018,353 | ||||
|
|
|
| |||||
The accompanying notes are an integral part of the financial statements.
20
Core Bond Series
Financial Highlights - Class S*
| FOR THE YEARS ENDED | ||||||||||||||||||||
| 12/31/15 | 12/31/14 | 12/31/13 | 12/31/12 | 12/31/11 | ||||||||||||||||
Per share data (for a share outstanding throughout each year): | ||||||||||||||||||||
Net asset value - Beginning of year | $ | 10.69 | $ | 10.74 | $ | 11.56 | $ | 11.05 | $ | 10.94 | ||||||||||
|
|
|
|
|
|
|
|
|
| |||||||||||
Income (loss) from investment operations: | ||||||||||||||||||||
Net investment income1 | 0.22 | 0.31 | 0.35 | 0.41 | 0.44 | |||||||||||||||
Net realized and unrealized gain (loss) on investments | (0.17 | ) | 0.08 | (0.44 | ) | 0.66 | 0.18 | |||||||||||||
|
|
|
|
|
|
|
|
|
| |||||||||||
Total from investment operations | 0.05 | 0.39 | (0.09 | ) | 1.07 | 0.62 | ||||||||||||||
|
|
|
|
|
|
|
|
|
| |||||||||||
Less distributions to shareholders: | ||||||||||||||||||||
From net investment income | (0.20 | ) | (0.32 | ) | (0.36 | ) | (0.41 | ) | (0.44 | ) | ||||||||||
From net realized gain on investments | (0.06 | ) | (0.12 | ) | (0.37 | ) | (0.15 | ) | (0.07 | ) | ||||||||||
|
|
|
|
|
|
|
|
|
| |||||||||||
Total distributions to shareholders | (0.26 | ) | (0.44 | ) | (0.73 | ) | (0.56 | ) | (0.51 | ) | ||||||||||
|
|
|
|
|
|
|
|
|
| |||||||||||
Net asset value - End of year | $ | 10.48 | $ | 10.69 | $ | 10.74 | $ | 11.56 | $ | 11.05 | ||||||||||
|
|
|
|
|
|
|
|
|
| |||||||||||
Net assets - End of year (000’s omitted) | $ | 147,074 | $ | 153,018 | $ | 153,109 | $ | 189,616 | $ | 164,086 | ||||||||||
|
|
|
|
|
|
|
|
|
| |||||||||||
Total return2 | 0.44 | % | 3.62 | % | (0.79 | %) | 9.74 | % | 5.68 | % | ||||||||||
Ratios (to average net assets)/Supplemental Data: | ||||||||||||||||||||
Expenses** | 0.69 | % | 0.70 | % | 0.70 | % | 0.70 | % | 0.71 | % | ||||||||||
Net investment income | 2.09 | % | 2.86 | % | 3.09 | % | 3.55 | % | 3.91 | % | ||||||||||
Portfolio turnover | 88 | % | 57 | % | 56 | % | 31 | % | 18 | % | ||||||||||
| *Effective August 3, 2015, the shares of the Series have been designated as Class S. | ||||||||||||||||||||
| **The investment advisor did not impose all or a portion of its management and/or other fees, and in some years may have paid a portion of the Series’ expenses. If these expenses had been incurred by the Series, the expense ratio (to average net assets) would have increased by the following amounts: | ||||||||||||||||||||
| 0.03 | % | N/A | N/A | N/A | N/A | |||||||||||||||
1Calculated based on average shares outstanding during the years.
2Represents aggregate total return for the years indicated, and assumes reinvestment of all distributions.
The accompanying notes are an integral part of the financial statements.
21
Core Bond Series
Financial Highlights - Class I
FOR THE PERIOD 8/3/151 TO | ||||
Per share data (for a share outstanding throughout each period): | ||||
Net asset value - Beginning of period | $ | 10.00 | ||
|
| |||
Income (loss) from investment operations: | ||||
Net investment income2 | 0.08 | |||
Net realized and unrealized loss on investments | (0.13 | ) | ||
|
| |||
Total from investment operations | (0.05 | ) | ||
|
| |||
Less distributions to shareholders: | ||||
From net investment income | (0.14 | ) | ||
From net realized gain on investments | (0.06 | ) | ||
|
| |||
Total distributions to shareholders | (0.20 | ) | ||
|
| |||
Net asset value - End of period | $ | 9.75 | ||
|
| |||
Net assets - End of period (000’s omitted) | $ | 79,303 | ||
|
| |||
Total return3 | (0.51 | %) | ||
Ratios (to average net assets)/Supplemental Data: | ||||
Expenses* | 0.46 | %4 | ||
Net investment income | 2.03 | %4 | ||
Portfolio turnover | 88 | % | ||
| * The investment advisor did not impose all or a portion of its management and/or other fees, and in some years may have paid a portion of the Series’ expenses. If these expenses had been incurred by the Series, the expense ratio (to average net assets) would have increased by the following amount: | ||||
| 0.06 | %4 | |||
1Commencement of operations.
2Calculated based on average shares outstanding during the periods.
3Represents aggregate total return for the periods indicated, and assumes reinvestment of all distributions. Total return would have been lower had certain expenses not been waived during certain periods. Periods less than one year are not annualized.
4Annualized.
The accompanying notes are an integral part of the financial statements.
22
Core Bond Series
Notes to Financial Statements
| 1. | Organization |
Core Bond Series (the “Series”) is a no-load diversified series of Manning & Napier Fund, Inc. (the “Fund”). The Fund is organized in Maryland and is registered under the Investment Company Act of 1940, as amended, as an open-end management investment company.
The Series’ investment objective is to provide long-term total return by investing primarily in fixed income securities.
The Fund’s advisor is Manning & Napier Advisors, LLC (the “Advisor”). Shares of the Series are offered to investors, clients and employees of the Advisor and its affiliates. Effective August 1, 2015, the Class A shares of the Series have been redesignated Class S and the Series issued Class I shares on August 1, 2015. Each class of shares is substantially the same except the Class S shares bear shareholder services fees. The total authorized capital stock of the Fund consists of 15 billion shares of common stock each having a par value of $0.01. As of December 31, 2015, 10.7 billion shares have been designated in total among 41 series, of which 125 million have been designated as Core Bond Series Class S common stock and 100 million have been designated as Core Bond Series Class I common stock.
| 2. | Significant Accounting Policies |
The following is a summary of significant accounting policies followed by the Series. The Series is an investment company and, accordingly, follows the investment company accounting and reporting guidance of the Financial Accounting Standards Board Accounting Standards Codification Topic 946 - Investment Companies, which is part of accounting principles generally accepted in the United States of America (“GAAP”).
Security Valuation
Portfolio securities, including domestic equities, foreign equities, warrants and options, listed on an exchange other than the NASDAQ Stock Market are valued at the latest quoted sales price of the exchange on which the security is primarily traded. Securities not traded on valuation date or securities not listed on an exchange are valued at the latest quoted bid price provided by the Fund’s pricing service. Securities listed on the NASDAQ Stock Market are valued in accordance with the NASDAQ Official Closing Price.
Debt securities, including government bonds, foreign bonds, asset-backed securities, structured notes, supranational obligations, sovereign bonds, corporate bonds and mortgage-backed securities will normally be valued on the basis of evaluated bid prices provided directly by an independent pricing service. The pricing services use multiple valuation techniques to determine fair value. In instances where sufficient market activity exists, the pricing services may utilize a market-based approach through which quotes from market makers are used to determine fair value. In instances where sufficient market activity may not exist or is limited, the pricing services also utilize proprietary valuation models which may consider market characteristics such as benchmark yield curves, option-adjusted spreads, credit spreads, estimated default rates, coupon rates, anticipated timing of principal repayments, underlying collateral, and other unique security features in order to estimate the relevant cash flows, which are then discounted to calculate the fair value. Certain investments in securities held by the Series may be valued on a basis of a price provided directly by a principal market maker. These prices may differ from the value that would have been used had a broader market for securities existed.
Municipal securities will normally be valued on the basis of market valuations provided by an independent pricing service (the “Service”). The Service utilizes the latest price quotations and a matrix system (which considers such factors as security prices of similar securities, yields, maturities and ratings). The Service has been approved by the Fund’s Board of Directors (the “Board”).
Short-term investments that mature in sixty days or less may be valued at amortized cost, which approximates fair value. Investments in open-end investment companies are valued at their net asset value per share on valuation date.
Volume and level of activity in established markets for an asset or liability are evaluated to determine whether recent transactions and quoted prices are determinative of fair value. Where there have been significant decreases in volume and level of activity, further analysis and adjustment may be necessary to estimate fair value. The Series measures fair value in these
23
Core Bond Series
Notes to Financial Statements (continued)
| 2. | Significant Accounting Policies (continued) |
Security Valuation (continued)
instances by the use of inputs and valuation techniques which may be based upon current market prices of securities that are comparable in coupon, rating, maturity and industry and/or expectation of future cash flows. As a result of trading in relatively thin markets and/or markets that experience significant volatility, the prices used by the Series to value these securities may differ from the value that would be realized if these securities were sold, and the differences could be material.
Securities for which representative valuations or prices are not available from the Series’ pricing service may be valued at fair value as determined in good faith by the Advisor under procedures approved by and under the general supervision and responsibility of the Fund’s Board of Directors (the “Board”). Due to the inherent uncertainty of valuations of such securities, the fair value may differ significantly from the values that would have been used had a ready market for such securities existed. If trading or events occurring after the close of the principal market in which securities are traded are expected to materially affect the value of those securities, then they may be valued at their fair value, taking this trading or these events into account.
Various inputs are used in determining the value of the Series’ assets or liabilities carried at fair value. These inputs are summarized in three broad levels. Level 1 includes quoted prices in active markets for identical assets and liabilities. Level 2 includes other significant observable inputs (including quoted prices for similar securities, interest rates, prepayment speeds, credit risk, etc.). Level 3 includes significant unobservable inputs (including the Series’ own assumptions in determining the fair value of investments). A financial instrument’s level within the fair value hierarchy is based on the lowest level of any input both individually and in aggregate that is significant to the fair value measurement. The inputs or methodology used for valuing securities are not necessarily an indication of the risk associated with investing in those securities.
The following is a summary of the valuation levels used for major security types as of December 31, 2015 in valuing the Series’ assets or liabilities carried at fair value:
| DESCRIPTION | TOTAL | LEVEL 1 | LEVEL 2 | LEVEL 3 | ||||||||||||
Debt securities: | ||||||||||||||||
U.S. Treasury and other U.S. | ||||||||||||||||
Government agencies | 60,564,691 | — | 60,564,691 | — | ||||||||||||
Corporate debt: | ||||||||||||||||
Consumer Discretionary | 8,827,094 | — | 8,827,094 | — | ||||||||||||
Consumer Staples | 6,467,429 | — | 6,467,429 | — | ||||||||||||
Energy | 20,531,307 | — | 20,531,307 | — | ||||||||||||
Financials | 60,860,847 | — | 60,860,847 | — | ||||||||||||
Health Care | 1,759,018 | — | 1,759,018 | — | ||||||||||||
Industrials | 12,257,036 | — | 12,257,036 | — | ||||||||||||
Information Technology | 8,103,909 | — | 8,103,909 | — | ||||||||||||
Materials | 3,682,642 | — | 3,682,642 | — | ||||||||||||
Telecommunication Services | 2,731,661 | — | 2,731,661 | — | ||||||||||||
Asset-backed securities | 4,038,006 | — | 4,038,006 | — | ||||||||||||
Commercial mortgage-backed securities | 31,249,090 | — | 31,249,090 | — | ||||||||||||
Foreign government bonds | 2,832,133 | — | 2,832,133 | — | ||||||||||||
Mutual fund | 5,504,201 | 5,504,201 | — | — | ||||||||||||
|
|
|
|
|
|
|
| |||||||||
Total assets | $ | 229,409,064 | $ | 5,504,201 | $ | 223,904,863 | $ | — | ||||||||
|
|
|
|
|
|
|
| |||||||||
There were no Level 3 securities held by the Series as of December 31, 2014 or December 31, 2015.
The Fund’s policy is to recognize transfers in and transfers out of the valuation levels as of the beginning of the reporting period. There were no transfers between Level 1 and Level 2 during the year ended December 31, 2015.
24
Core Bond Series
Notes to Financial Statements (continued)
| 2. | Significant Accounting Policies (continued) |
Security Transactions, Investment Income and Expenses
Security transactions are accounted for on trade date. Dividend income is recorded on the ex-dividend date, except that if the ex-dividend date has passed, certain dividends from foreign securities are recorded as soon as the Series is informed of the ex-dividend date. Non-cash dividends, if any, are recorded at the fair value of the securities received. Interest income, including amortization of premium and accretion of discounts using the effective interest method, is earned from settlement date and accrued daily.
Expenses are recorded on an accrual basis. Most expenses of the Fund can be attributed to a specific series. Expenses which cannot be directly attributed are apportioned among the series in the Fund in such a manner as deemed equitable by the Fund’s Board, taking into consideration, among other things, the nature and type of expense. Income, expenses (other than shareholder services fees), and realized and unrealized gains and losses are prorated among the classes based on the relative net assets of each class. Class specific expenses are directly charged to that class.
The Series uses the identified cost method for determining realized gain or loss on investments for both financial statement and federal income tax reporting purposes.
Foreign Currency Translation
The books and records of the Series are maintained in U.S. dollars. Foreign currencies, investments and other assets and liabilities are translated into U.S. dollars at the current exchange rates. Purchases and sales of investment securities and income and expenses are translated on the respective dates of such transactions. The Series does not isolate realized and unrealized gains and losses attributable to changes in the exchange rates from gains and losses that arise from changes in the fair value of investments. Such fluctuations are included with net realized and unrealized gain or loss on investments. Net realized foreign currency gains and losses represent foreign currency gains and losses between trade date and settlement date on securities transactions, gains and losses on disposition of foreign currencies and the difference between the amount of income and foreign withholding taxes recorded on the books of the Series and the amounts actually received or paid.
Inflation-Indexed Bonds
Each Series may invest in inflation-indexed bonds. Inflation-indexed bonds are fixed income securities whose principal value is periodically adjusted according to the rate of inflation. If the index measuring inflation rises or falls, the principal value of inflation-indexed bonds will be adjusted upward or downward, and consequently the interest payable on these securities (calculated with respect to a larger or smaller principal amount) will be increased or reduced, respectively. Any upward or downward adjustment in the principal amount of an inflation-indexed bond will be included as interest income in the Statement of Operations, even though investors do not receive their principal until maturity. Repayment of the original bond principal upon maturity (as adjusted for inflation) is guaranteed in the case of U.S. Treasury inflation-indexed bonds. For bonds that do not provide a similar guarantee, the adjusted principal value of the bond repaid at maturity may be less than the original principal.
Securities Purchased on a When-Issued Basis or Forward Commitment
The Series may purchase securities on a when-issued basis or forward commitment. These transactions involve a commitment by the Series to purchase securities for a predetermined price with payment and delivery taking place beyond the customary settlement period. When such purchases are outstanding, the Series will designate liquid assets in an amount sufficient to meet the purchase price. When purchasing a security on a delayed delivery basis, the Series assumes the rights and risks of ownership of the security, including the risk of price and yield fluctuations, and takes such fluctuations into account when determining its net asset value. The Series may sell the when-issued securities before they are delivered, which may result in a capital gain or loss. No such investments were held by the Series on December 31, 2015.
In connection with its ability to purchase or sell securities on a forward commitment basis, the Series may enter into forward roll transactions principally using To Be Announced (TBA) securities. Forward roll transactions require the sale of securities for delivery in the current month, and a simultaneous agreement to repurchase substantially similar (same type, coupon and maturity) securities on a specified future date. Risks of entering into forward roll transactions include the potential inability of the counterparty to meet the terms of the agreement; the potential of the Series to receive inferior securities at redelivery as compared to the securities sold to the counterparty; counterparty credit risk; and the potential pay down speed variance
25
Core Bond Series
Notes to Financial Statements (continued)
| 2. | Significant Accounting Policies (continued) |
Securities Purchased on a When-Issued Basis or Forward Commitment (continued)
between the mortgage-backed pools. During the roll period, the Series forgoes principal and interest paid on the securities. The Series accounts for such dollar rolls as purchases and sales. Information regarding securities purchased on a when-issued basis is included in the Series’ Investment Portfolio. No such investments were held by the Series on December 31, 2015.
Restricted Securities
Restricted securities are purchased in private placement transactions, are not registered under the Securities Act of 1933, as amended, and may have contractual restrictions on resale. Information regarding restricted securities is included at the end of the Series’ Investment Portfolio.
Illiquid Securities
A security may be considered illiquid if so deemed in good faith by the Advisor under procedures approved by and under the general supervision and responsibility of the Fund’s Board. Securities that are illiquid are marked with the applicable footnote on the Investment Portfolio. No such investments were held by the Series on December 31, 2015.
Federal Taxes
The Series’ policy is to comply with the provisions of the Internal Revenue Code applicable to regulated investment companies. The Series is not subject to federal income tax or excise tax to the extent that the Series distributes to shareholders each year its taxable income, including any net realized gains on investments, in accordance with requirements of the Internal Revenue Code. Accordingly, no provision for federal income tax or excise tax has been made in the financial statements.
Management evaluates its tax positions to determine if the tax positions taken meet the minimum recognition threshold in connection with accounting for uncertainties in income tax positions taken or expected to be taken for the purposes of measuring and recognizing tax liabilities in the financial statements. Recognition of tax benefits of an uncertain tax position is required only when the position is “more likely than not” to be sustained assuming examination by taxing authorities. At December 31, 2015, the Series has recorded no liability for net unrecognized tax benefits relating to uncertain income tax positions taken or expected to be taken in future tax returns.
The Series files income tax returns in the U.S. federal jurisdiction, various states and foreign jurisdictions, as required. No income tax returns are currently under investigation. The statute of limitations on the Series’ tax returns remains open for the years ended December 31, 2012 through December 31, 2015. The Series is not aware of any tax positions for which it is reasonably possible that the total amounts of unrecognized tax benefits will significantly change in the next twelve months.
Foreign Taxes
Based on the Series’ understanding of the tax rules and rates related to income, gains and currency purchase/repatriation transactions for foreign jurisdictions in which it invests, the Series will provide for foreign taxes, and where appropriate, deferred foreign tax.
Distributions of Income and Gains
Distributions to shareholders of net investment income are made quarterly. Distributions of net realized gains are made annually. An additional distribution may be necessary to avoid taxation of the Series. Distributions are recorded on the ex-dividend date.
Indemnifications
The Fund’s organizational documents provide former and current directors and officers with a limited indemnification against liabilities arising in connection with the performance of their duties to the Fund. In the normal course of business, the Fund may also enter into contracts that provide general indemnifications. The Fund’s maximum exposure under these arrangements is unknown as this would be dependent on future claims that may be made against the Fund. The risk of material loss from such claims is considered remote.
Other
The preparation of financial statements in conformity with GAAP requires management to make estimates and assumptions that affect the reported amounts of assets and liabilities and the disclosure of contingent assets and liabilities at the date of the
26
Core Bond Series
Notes to Financial Statements (continued)
| 2. | Significant Accounting Policies (continued) |
Other (continued)
financial statements and the reported amounts of income and expenses during the reporting period. Actual results could differ from those estimates.
| 3. | Transactions with Affiliates |
The Fund has an Investment Advisory Agreement (the “Agreement”) with the Advisor, for which the Series pays a fee, computed daily and payable monthly. Effective August 1, 2015, the annual rate is 0.40% of the Series’ average daily net assets. Prior to August 1, 2015, the rate was 0.60% of the Series’ average daily net assets.
Under the Agreement, personnel of the Advisor provide the Series with advice and assistance in the choice of investments and the execution of securities transactions, and otherwise maintain the Series’ organization. The Advisor also provides the Fund with necessary office space and fund administration and support services. The salaries of all officers of the Fund (except a percentage of the Fund’s Chief Compliance Officer’s salary, which is paid by the Fund), and of all Directors who are “affiliated persons” of the Fund, or of the Advisor, and all personnel of the Fund, or of the Advisor, performing services relating to research, statistical and investment activities, are paid by the Advisor. Each “non-affiliated” Director receives an annual stipend, which is allocated among all the active series of the Fund. In addition, these Directors also receive a fee per Board meeting attended plus a fee for each committee meeting attended and are reimbursed for travel and other out-of-pocket expenses incurred by them in connection with attending such meetings. The Fund also has an Audit Committee Chair, who receives an additional annual stipend for this role.
The Class S shares of the Series are subject to a shareholder services fee in accordance with a shareholder services plan adopted by the Fund’s Board. The shareholder services fee is intended to compensate financial intermediaries, including affiliates of the Fund, in connection with the provision of direct client service, personal services, maintenance of shareholder accounts and reporting services. For these services, Class S of the Series pays a fee, computed daily and payable monthly, at an annual rate of 0.25% of the average daily net assets of Class S. The Fund has a Shareholder Services Agreement with the Advisor, for which the Advisor receives the shareholder services fee as stated above.
The Advisor has contractually agreed, until at least April 30, 2017, to waive its fee and, if necessary, pay other operating expenses of the Series in order to maintain total direct annual fund operating expenses for the Series exclusive of each share class’ shareholder services fee, at no more than 0.45% of average daily net assets. Prior to August 1, 2015, the Advisor had contractually agreed to waive its fee and, if necessary, pay other operating expenses of the Series in order to maintain total direct annual fund operating expenses for the Series exclusive of each share class’ shareholder services fee, at no more than 0.80% of average daily net assets. The Advisor waived fees of $58,978 for the year ended December 31, 2015. The Advisor is not eligible to recoup any expenses that have been waived or reimbursed in prior years.
Manning & Napier Investor Services, Inc., a registered broker-dealer affiliate of the Advisor, acts as distributor for the Fund’s shares. The services of Manning & Napier Investor Services, Inc. are provided at no additional cost to the Series.
Pursuant to a master services agreement dated November 1, 2014, the Fund pays the Advisor an annual fee related to fund accounting and administration of 0.0085% on the first $25 billion of average daily net assets (excluding Target Series and Strategic Income Series); 0.0075% on the next $15 billion of average daily net assets (excluding Target Series and Strategic Income Series); and 0.0065% of the average daily net assets in excess of $40 billion (excluding Target Series and Strategic Income Series); plus a base fee of $30,400 per series. Transfer agent fees are charged to the Fund on a per account basis. Additionally, certain transaction and out-of-pocket expenses, including charges for reporting relating to the Fund’s compliance program, are charged. The Advisor has agreements with BNY Mellon Investment Servicing (U.S.) Inc. (“BNY”) under which BNY serves as sub-accountant services agent and sub-transfer agent.
Expenses not directly attributable to a series are allocated based on each series’ relative net assets or number of accounts, depending on the expense.
27
Core Bond Series
Notes to Financial Statements (continued)
| 4. | Purchases and Sales of Securities |
For the year ended December 31, 2015, purchases and sales of securities, other than U.S. Government securities and short-term securities, were $128,207,564 and $96,765,258, respectively. Purchases and sales of U.S. Government securities, other than short-term securities, were $136,541,466 and $79,054,701, respectively.
| 5. | Capital Stock Transactions |
Transactions in shares of Core Bond Series were:
| CLASS S: | FOR THE YEAR ENDED 12/31/15 | FOR THE YEAR ENDED 12/31/14 | ||||||||||||||
| SHARES | AMOUNT | SHARES | AMOUNT | |||||||||||||
Sold | 11,494,848 | $ | 123,693,225 | 1,832,616 | $ | 19,938,196 | ||||||||||
Reinvested | 370,052 | 3,916,056 | 570,845 | 6,171,326 | ||||||||||||
Repurchased | (12,151,897 | ) | (130,150,134 | ) | (2,340,559 | ) | (25,651,852 | ) | ||||||||
|
|
|
|
|
|
|
| |||||||||
Total | (286,997 | ) | $ | (2,540,853 | ) | 62,902 | $ | 457,670 | ||||||||
|
|
|
|
|
|
|
| |||||||||
| CLASS I: | FOR THE PERIOD 8/3/15 (COMMENCEMENT OF OPERATIONS) TO 12/31/15 | |||||||
| SHARES | AMOUNT | |||||||
Sold | 9,647,103 | $ | 96,094,301 | |||||
Reinvested | 118,983 | 1,162,715 | ||||||
Repurchased | (1,631,206 | ) | (16,109,180 | ) | ||||
|
|
|
| |||||
Total | 8,134,880 | $ | 81,147,836 | |||||
|
|
|
| |||||
Over 90% of the shares outstanding are held by fiduciary accounts where the Advisor has sole investment discretion.
| 6. | Financial Instruments |
The Series may trade in instruments including written and purchased options, forward foreign currency exchange contracts and futures contracts and other derivatives in the normal course of investing activities to assist in managing exposure to various market risks. The Series may be subject to various elements of risk, which may involve, to a varying degree, elements of risk in excess of the amounts recognized for financial statement purposes. These risks include: the risk that changes in the value of a derivative may not correlate perfectly with the underlying asset, rate or index; counterparty credit risk related to over the counter derivative counterparties’ failure to perform under contract terms; liquidity risk related to the lack of a liquid market for these contracts allowing the fund to close out its position(s); and documentation risk relating to disagreement over contract terms. No such investments were held by the Series as of December 31, 2015.
| 7. | Foreign Securities |
Investing in securities of foreign companies and foreign governments involves special risks and considerations not typically associated with investing in securities of domestic companies and the U.S. Government. These risks include revaluation of currencies and future adverse political and economic developments. Moreover, securities of foreign companies and foreign governments and their markets may be less liquid and their prices more volatile than those of comparable domestic companies and the U.S. Government.
| 8. | Federal Income Tax Information |
The amount and characterization of certain income and capital gains to be distributed are determined in accordance with federal income tax regulations, which may differ from GAAP. These differences are primarily due to differing book and tax treatments in the timing and/or treatment of the recognition of net investment income or gains and losses including wash sales and investments in Treasury Inflation Protected securities. The Series may periodically make reclassifications among its capital
28
Core Bond Series
Notes to Financial Statements (continued)
| 8. | Federal Income Tax Information (continued) |
accounts to reflect income and gains available for distribution (or available capital loss carryovers) under income tax regulations without impacting the Series’ net asset value.
The tax character of distributions paid were as follows:
FOR THE YEAR ENDED 12/31/15 | FOR THE YEAR ENDED 12/31/14 | |||||||
Ordinary income | $ | 4,233,201 | $ | 4,492,307 | ||||
Long-term capital gains | 1,260,417 | 1,702,295 | ||||||
At December 31, 2015, the tax basis of components of distributable earnings and the net unrealized depreciation based on identified cost for federal income tax purposes were as follows:
Cost for federal income tax purposes | $ | 232,554,010 | ||
Unrealized appreciation | 976,484 | |||
Unrealized depreciation | (4,121,430 | ) | ||
|
| |||
Net unrealized depreciation | $ | (3,144,946 | ) | |
|
| |||
Undistributed ordinary income | $ | 91,123 | ||
Undistributed long-term capital gains | $ | 86,711 |
29
Core Bond Series
Report of Independent Registered Public Accounting Firm
To the Board of Directors of Manning & Napier Fund, Inc. and Shareholders of Core Bond Series:
In our opinion, the accompanying statement of assets and liabilities, including the investment portfolio, and the related statements of operations and of changes in net assets and the financial highlights present fairly, in all material respects, the financial position of Core Bond Series (a series of Manning & Napier Fund, Inc., hereafter referred to as the “Series”) at December 31, 2015, the results of its operations for the year then ended, the changes in its net assets for each of the two years in the period then ended and the financial highlights for each of the periods presented, in conformity with accounting principles generally accepted in the United States of America. These financial statements and financial highlights (hereafter referred to as “financial statements”) are the responsibility of the Series’ management. Our responsibility is to express an opinion on these financial statements based on our audits. We conducted our audits of these financial statements in accordance with the standards of the Public Company Accounting Oversight Board (United States). Those standards require that we plan and perform the audit to obtain reasonable assurance about whether the financial statements are free of material misstatement. An audit includes examining, on a test basis, evidence supporting the amounts and disclosures in the financial statements, assessing the accounting principles used and significant estimates made by management, and evaluating the overall financial statement presentation. We believe that our audits, which included confirmation of securities at December 31, 2015 by correspondence with the custodian and brokers, provide a reasonable basis for our opinion.

New York, New York
February 19, 2016
30
Core Bond Series
Supplemental Tax Information
(unaudited)
All reportings are based on financial information available as of the date of this annual report and, accordingly are subject to change.
For federal income tax purposes, the Series reports for the current fiscal year $26,650 or, if different, the maximum amount allowable under the tax law as qualified dividend income.
The Series designates $1,391,238 as Long-Term Capital Gain dividends pursuant to Section 852(b)(3) of the Internal Revenue Code for the fiscal year ended December 31, 2015.
31
Core Bond Series
Renewal of Investment Advisory Agreement
(unaudited)
At the Manning & Napier Fund, Inc. (the “Fund”) Board of Directors’ (the “Board”) meeting, held on November 17, 2015, the Investment Advisory Agreement (the “Agreement”) between the Fund and Manning & Napier Advisors, LLC (the “Advisor”) was considered by the Board for renewal. In connection with the decision whether to renew the Agreement, a variety of material was prepared for and considered by the Board.
Representatives of the Advisor attended the meeting and presented additional oral and written information to the Board to assist the Board in its considerations. The discussion immediately below outlines the materials and information presented to the Board in connection with the Board’s 2015 Annual consideration of the Agreement and the conclusions made by the Directors when determining to continue the Agreement.
| • | The Board considered the services provided by the Advisor under the Agreement including, among others: deciding what securities to purchase and sell for each Series; arranging for the purchase and sale of such securities by placing orders with broker-dealers; administering the affairs of the Fund (including the books and records of the Fund not maintained by third party service providers such as the custodian or sub-transfer agent); arranging for the insurance coverage for the Fund; and supervising the preparation of tax returns, SEC filings (including registration statements) and reports to shareholders for the Fund. The Board also considered the nature and quality of such services provided under the Agreement in light of the Advisor’s services provided to the Fund for 29 years. The Board discussed the quality of these services with representatives from the Advisor and concluded that the Advisor was performing its services to the Fund required under the Agreement in a reasonable manner. |
| • | The Board considered the performance of each Series since its inception, as well as performance over multiple time periods. Performance for one or more of the following time periods was considered as applicable to the Series’ inception date: inception, three year, five year, ten year, and current market cycle. A market cycle includes periods of both rising and falling markets. Returns for established benchmark indices for each Series were provided. In addition, the Board considered a number of other factors relevant to performance at the meeting (and considers on a quarterly basis) including: a peer group performance analysis consisting of Morningstar universes of mutual funds with similar investment objectives, investment performance of core products, product offerings, performance on an aggregate basis vs. performance over reasonable time periods and the Advisor’s investment process. The Directors acknowledged the challenging performance and discussed the investment process of the Advisor. The Directors confirmed that qualitative factors such as the Advisor’s investment process, including recent enhancements, were an important subset to be considered as part of their consideration of performance. The Board discussed the performance with representatives from the Advisor and concluded that the investment performance of each of the Fund’s Series was reasonable based on the Series’ actual performance and comparative performance, especially for those series with performance over the current market cycle. |
| • | The Board considered the costs of the Advisor’s services and the profits of the Advisor as they relate to the Advisor’s services to the Fund under the Agreement. In reviewing the Advisor’s costs and profits, the Board discussed the Advisor’s revenues generated from the Fund (on both an actual and adjusted basis) and its expenses associated with providing the services under the Agreement. In addition, the Board reviewed the Advisor’s expenses associated with Fund activities outside of the Agreement (such as expense reimbursements pursuant to expense caps and payments made by the Advisor to third party platforms on which shares of the Fund are available for purchase). It was noted by representatives of the Advisor that 22 of the 36 active Series of the Fund are currently experiencing expenses above the capped expense ratios, and thus the Advisor is incurring those expenses over the cap. After discussing the above costs and profits, the Board concluded that the Advisor’s profitability relating to its services provided under the Agreement was reasonable. |
| • | The Board considered the fees and expenses of the various Series of the Fund. The Advisor presented the advisory fees and total expenses for each Series, including the advisory fee adjusted for any expense waivers or reimbursements (either contractual or voluntary) paid by the Advisor. The advisory fees and expense ratios of each Series were compared to an average (on both a mean and median basis) of similar funds as disclosed on the Morningstar database. Representatives of the Advisor discussed with the Board the levels of its advisory fee for each Series of the Fund and as compared to the median and mean advisory fees for similar funds as listed on Morningstar. Expense ratios for every Series, except the Tax Managed Series, Equity Income Class S, High Yield Bond Class S, Pro-Blend Series Classes C and R, and Target Series’ Classes R and K, are lower than, or substantially similar to the Morningstar mean and median reported total expense ratio. |
32
Core Bond Series
Renewal of Investment Advisory Agreement
(unaudited)
The higher than mean and median total expense ratios for Classes C and R reflect higher distribution, marketing and shareholder service fees payable to broker-dealers through a 100bp 12b-1 fee for Class C and a 50bp 12b-1 fee for Class R. Based on their review of the information provided, the Board concluded that the fees and expenses of each Series of the Fund were reasonable on a comparative basis.
| • | The Board also considered the other benefits the Advisor derives from its relationship with the Fund. Such other benefits include certain research services provided by soft dollars. The Board reviewed the broker-dealers who provided research to the Advisor and the products and services paid for, in whole or in part, using soft dollar commissions. Given the level of soft dollar transactions involving the Fund, the Board concluded that these additional benefits to the Advisor were reasonable. |
| • | In addition to the factors described above, the Board considered the Advisor’s personnel, investment strategies, policies and procedures relating to compliance with personal securities transactions, reputation, expertise and resources in domestic and foreign financial markets. The Board concluded that these factors support the conclusion that the Advisor performs its services in a reasonable manner. |
| • | The Board then considered economies of scale and concluded that the current fee schedule to the advisory agreement remained reasonable given the multiple uses of the Fund (for the Advisor’s discretionary investment account clients in addition to direct investors), the current profitability of the Advisor’s services to the Fund under the Agreement, the number of newly established series of the Fund and the overall size of the Fund complex. |
Based on the Board’s deliberations and their evaluation of the information described above, the Board, including a majority of Directors that are not “interested persons” as defined in the Investment Company Act of 1940, concluded that the compensation under the Agreement was fair and reasonable in light of the services and expenses and such other matters as the Directors considered to be relevant in the exercise of their reasonable judgment. Accordingly, the Board approved the renewal of the Agreement. In the course of their deliberations, the Directors did not identify any particular information that was all important or controlling.
33
Core Bond Series
Directors’ and Officers’ Information
(unaudited)
The Statement of Additional Information provides additional information about the Fund’s directors and officers and can be obtained without charge by calling 1-800-466-3863, at www.manningnapieradvisors.com, or on the EDGAR Database on the SEC Internet web site (http:// www.sec.gov). The following chart shows certain information about the Fund’s officers and directors, including their principal occupations during the last five years. Unless specific dates are provided, the individuals have held the listed positions for longer than five years.
| Interested Director/Officer | ||
| Name: | James E. Mikolaichik* | |
| Address: | 290 Woodcliff Drive | |
| Fairport, NY 14450 | ||
| Age: | 44 | |
| Current Position(s) Held with Fund: | Principal Executive Officer, President, Chairman & Director | |
| Term of Office1 & Length of Time Served: | Indefinite - Chairman and Director since August 2015 | |
| Principal Occupation(s) During Past 5 Years: | Chief Financial Officer (since 2011) - Manning & Napier Advisors, LLC; Executive Vice President and Head of Strategy (2008-2011) and Chief Risk Officer (2004-2008) - Old Mutual Asset Management Holds or has held one or more of the following title for various subsidiaries and affiliates: Chief Financial Officer. | |
| Number of Portfolios Overseen within Fund Complex: | 41 | |
| Other Directorships Held Outside Fund Complex: | N/A | |
| Independent Directors | ||
| Name: | Stephen B. Ashley | |
| Address: | 290 Woodcliff Drive | |
| Fairport, NY 14450 | ||
| Age: | 75 | |
| Current Position(s) Held with Fund: | Director, Audit Committee Member, Governance & Nominating Committee Member | |
| Term of Office & Length of Time Served: | Indefinite - Since 1996 | |
| Principal Occupation(s) During Past 5 Years: | Chairman, Director, President & Chief Executive Officer (1997 to present) - The Ashley Group (property management and investment); Director (1995-2008) and Chairman (non-executive) (2004-2008) - Fannie Mae (mortgage). | |
| Number of Portfolios Overseen within Fund Complex: | 41 | |
| Other Directorships Held Outside Fund Complex: | Fannie Mae (1995-2008) | |
The Ashley Group (1995-2008) | ||
| Genesee Corporation (1987-2007) | ||
| Name: | Paul A. Brooke | |
| Address: | 290 Woodcliff Drive | |
| Fairport, NY 14450 | ||
| Age: | 70 | |
| Current Position(s) Held with Fund: | Director, Audit Committee Member, Governance & Nominating Committee Member | |
| Term of Office & Length of Time Served: | Indefinite - Since 2007 | |
| Principal Occupation(s) During Past 5 Years: | Chairman & CEO (2005-2009) - Ithaka Acquisition Corporation (investments); Chairman (2007-2009) Alsius Corporation (investments); Managing Member, PMSV Holdings LLC (investments) since 1991; Managing Member, Venbio (investments) since 2010. | |
| Number of Portfolios Overseen within Fund Complex: | 41 | |
| Other Directorships Held Outside Fund Complex: | Incyte Corp. (2000-present) | |
| ViroPharma, Inc. (2000-2014) | ||
| HLTH Corp (WebMD) (2000-2010) | ||
| Cheyne Capital International (2000-present) | ||
| GMP Companies (2000-2011) | ||
| Cytos Biotechnology Ltd. (2012-2014) | ||
34
Core Bond Series
Directors’ and Officers’ Information
(unaudited)
Independent Directors (continued)
| Name: | Peter L. Faber | |
| Address: | 290 Woodcliff Drive | |
| Fairport, NY 14450 | ||
| Age: | 77 | |
| Current Position(s) Held with Fund: | Director, Governance & Nominating Committee Member | |
| Term of Office & Length of Time Served: | Indefinite - Since 1987 | |
| Principal Occupation(s) During Past 5 Years: | Senior Counsel (2006-2012), Partner (1995-2006 & 2013-present) - McDermott, Will & Emery LLP (law firm) | |
| Number of Portfolios Overseen within Fund Complex: | 41 | |
| Other Directorships Held Outside Fund Complex: | Boston Early Music Festival (non-profit)(2007-present) | |
| Amherst Early Music, Inc. (non-profit)(2009-present) | ||
| Gotham Early Music Scene, Inc. (non-profit)(2009-present) | ||
| Partnership for New York City, Inc. (non-profit) (1989-2010) | ||
| New York Collegium (non-profit) (2004-2011) | ||
| Name: | Harris H. Rusitzky | |
| Address: | 290 Woodcliff Drive | |
| Fairport, NY 14450 | ||
| Age: | 80 | |
| Current Position(s) Held with Fund: | Director, Audit Committee Member, Governance & Nominating Committee Member | |
| Term of Office & Length of Time Served: | Indefinite - Since 1985 | |
| Principal Occupation(s) During Past 5 Years: | President, The Greening Group (business consultants) since 1994; | |
| Partner, The Restaurant Group (restaurants) since 2006 | ||
| Number of Portfolios Overseen within Fund Complex: | 41 | |
| Other Directorships Held Outside Fund Complex: | Rochester Institute of Technology (university)(1972-present) | |
| Culinary Institute of America (non-profit college)(1985-present) | ||
| George Eastman House (museum)(1988-present) | ||
| National Restaurant Association (restaurant trade organization)(1978- present) | ||
| Name: | Chester N. Watson | |
| Address: | 290 Woodcliff Drive | |
| Fairport, NY 14450 | ||
| Age: | 65 | |
| Current Position(s) Held with Fund: | Director, Audit Committee Chairman, Governance & Nominating Committee Member | |
| Term of Office & Length of Time Served: | Indefinite - Since 2012 | |
| Principal Occupation(s) During Past 5 Years: | General Auditor (2003-2011) - General Motors Company (auto | |
| manufacturer) | ||
| Number of Portfolios Overseen within Fund Complex: | 41 | |
| Other Directorships Held Outside Fund Complex: | Rochester Institute of Technology (university)(2005-present) | |
Officers | ||
| Name: | Jeffrey S. Coons, Ph.D., CFA | |
| Address: | 290 Woodcliff Drive | |
| Fairport, NY 14450 | ||
| Age: | 52 | |
| Current Position(s) Held with Fund: | Vice President | |
| Term of Office1 & Length of Time Served: | Since 2004 | |
| Principal Occupation(s) During Past 5 Years: | President since 2010, Co-Director of Research (2002-2015) - Manning & | |
| Napier Advisors, LLC | ||
| Holds one or more of the following titles for various subsidiaries and affiliates: President, Director, Treasurer or Senior Trust Officer. | ||
| Number of Portfolios Overseen within Fund Complex: | 41 | |
| Other Directorships Held Outside Fund Complex: | N/A | |
35
Core Bond Series
Directors’ and Officers’ Information
(unaudited)
Officers (continued)
| Name: | Elizabeth Craig | |
| Address: | 290 Woodcliff Drive | |
| Fairport, NY 14450 | ||
| Age: | 28 | |
| Current Position(s) Held with Fund: | Assistant Corporate Secretary | |
| Term of Office1 & Length of Time Served: | Since 2011 | |
| Principal Occupation(s) During Past 5 Years: | Fund Administration Manager since 2015; Mutual Fund Compliance Specialist (2009-2015) - Manning & Napier Advisors, LLC | |
| Number of Portfolios Overseen within Fund Complex: | 41 | |
| Other Directorships Held Outside Fund Complex: | N/A | |
| Name: | Christine Glavin | |
| Address: | 290 Woodcliff Drive | |
| Fairport, NY 14450 | ||
| Age: | 49 | |
| Current Position(s) Held with Fund: | Principal Financial Officer, Chief Financial Officer | |
| Term of Office1 & Length of Time Served: | Principal Financial Officer since 2002; Chief Financial Officer since 2001 | |
| Principal Occupation(s) During Past 5 Years: | Director of Fund Reporting since 2011; Fund Reporting Manager (1997-2011) - Manning & Napier Advisors, LLC; Assistant Treasurer since 2008 - Exeter Trust Company | |
| Number of Portfolios Overseen within Fund Complex: | 41 | |
| Other Directorships Held Outside Fund Complex: | N/A | |
| Name: | Jodi L. Hedberg | |
| Address: | 290 Woodcliff Drive | |
| Fairport, NY 14450 | ||
| Age: | 48 | |
| Current Position(s) Held with Fund: | Corporate Secretary, Chief Compliance Officer, Anti-Money Laundering Compliance Officer | |
| Term of Office1 & Length of Time Served: | Corporate Secretary since 1997; Chief Compliance Officer since 2004; | |
| Anti-Money Laundering Compliance Officer since 2002 | ||
| Principal Occupation(s) During Past 5 Years: | Director of Compliance since 2005; Compliance Manager (1995-2005) - Manning & Napier Advisors, LLC and affiliates; Corporate Secretary - Manning & Napier Investor Services, Inc. since 2006 | |
| Number of Portfolios Overseen within Fund Complex: | 41 | |
| Other Directorships Held Outside Fund Complex: | N/A | |
| Name: | Richard Yates | |
| Address: | 290 Woodcliff Drive | |
| Fairport, NY 14450 | ||
| Age: | 50 | |
| Current Position(s) Held with Fund: | Chief Legal Officer | |
| Term of Office1 & Length of Time Served: | Chief Legal Officer since 2004 | |
| Principal Occupation(s) During Past 5 Years: | Counsel - Manning & Napier Advisors, LLC and affiliates since 2000; Holds one or more of the following titles for various affiliates; Director or Corporate Secretary | |
| Number of Portfolios Overseen within Fund Complex: | 41 | |
| Other Directorships Held Outside Fund Complex: | N/A | |
*Interested Director, within the meaning of the Investment Company Act of 1940 by reason of his position with the Fund’s investment advisor and distributor. Mr. Mikolaichik serves as the Chief Financial Officer for Manning & Napier Advisors, LLC.
1The term of office of all officers shall be one year and until their respective successors are chosen and qualified, or his or her earlier resignation or removal as provided in the Fund’s By-Laws.
36
Core Bond Series
Results of Special Meeting of Shareholders
(unaudited)
A Special Meeting of the Shareholders of the Fund was held on August 18, 2015. The number of votes necessary to conduct the meeting and approve the proposal was obtained, and the results of the vote of shareholders of all the Series of the Fund voting together in the aggregate is listed below:
PROPOSAL 1:
Election of Directors
NUMBER OF SHARES VOTED FOR | NUMBER OF SHARES WITHELD | |||||||
Stephen B. Ashley | 883,968,395 | 8,618,094 | ||||||
Paul A. Brooke | 884,510,661 | 8,075,828 | ||||||
Peter L. Faber | 884,140,893 | 8,445,596 | ||||||
James E. Mikolaichik | 883,391,832 | 9,194,657 | ||||||
Harris H. Rusitzky | 620,022,215 | 272,564,274 | ||||||
Chester N. Watson | 884,638,809 | 7,947,680 | ||||||
37
Core Bond Series
Literature Requests
(unaudited)
Proxy Voting Policies and Procedures
A description of the policies and procedures that the Fund uses to determine how to vote proxies relating to portfolio securities is available, without charge, upon request:
| By phone | 1-800-466-3863 | |||
| On the Securities and Exchange | ||||
| Commission’s (SEC) web site | http://www.sec.gov |
Proxy Voting Record
Information regarding how the Fund voted proxies relating to portfolio securities during the most recent 12-month period ended June 30th is available, without charge, upon request:
| By phone | 1-800-466-3863 | |||
| On the SEC’s web site | http://www.sec.gov |
Quarterly Portfolio Holdings
The Series’ complete schedule of portfolio holdings for the 1st and 3rd quarters of each fiscal year are provided on Form N-Q, and are available, without charge, upon request:
| By phone | 1-800-466-3863 | |||
| On the SEC’s web site | http://www.sec.gov |
The Series’ Form N-Q may be reviewed and copied at the SEC’s Public Reference Room in Washington, D.C. Information on the operation of the Public Reference Room may be obtained by calling 1-800-SEC-0330.
Prospectus and Statement of Additional Information (SAI)
For more information about any of the Manning & Napier Fund, Inc. Series, you may obtain a prospectus and SAI at www.manning-napier.com or by calling (800) 466-3863. Before investing, carefully consider the objectives, risks, charges and expenses of the investment and read the prospectus carefully as it contains this and other information about the investment company. In addition, this information can be found on the SEC’s web site, http://www.sec.gov.
Additional information available at www.manning-napier.com
1. Fund Holdings - Month-End
2. Fund Holdings - Quarter-End
3. Shareholder Report - Annual
4. Shareholder Report - Semi-Annual
The Fund also offers electronic notification or “e-delivery” when certain documents are available on-line to be downloaded or reviewed. Direct shareholders can elect to receive electronic notification when shareholder reports, prospectus updates, and/or statements are available. If you do not currently have on-line access to your account, you can establish access by going to www.manning-napier.com, click on “Login” in the top corner of the page, and follow the prompts to self-enroll. Once enrolled, you can set your electronic notification preferences by clicking on the Account Options tab located within the green toolbar and then select E-Delivery Option. Should you have any questions on either how to establish on-line access or how to update your account settings, please contact Investor Services at 1-800-466-3863.
The Manning & Napier Fund, Inc. is managed by Manning & Napier Advisors, LLC. Manning & Napier Investor Services, Inc., an affiliate of Manning & Napier Advisors, LLC, is the distributor of the Fund shares.
MNCOB-12/15-AR

High Yield Bond Series
Management Discussion and Analysis
(unaudited)
Dear Shareholders:
Volatility defined global financial markets during the past year, largely driven by macroeconomic factors. Renewed concerns about economic growth in emerging markets — China in particular — and uncertainty about the effects of that slowdown on overall global growth triggered market gyrations. Developed economies continued to provide accommodative monetary policy to combat growth concerns, although in December the U.S. Federal Reserve raised the federal funds rate for the first time in nearly a decade. For much of the year, Europe struggled with uncertainty regarding Greece’s ability to secure bailout funding from its creditors, which negatively affected investor sentiment. China’s economy slowed, but the government continued to demonstrate a willingness to provide support through a combination of policy-easing maneuvers and targeted stimulus measures. The U.S. economy remained on a path of slow growth that nevertheless made it the best performing developed economy. Looking ahead, we expect the slow global growth environment to remain in place for the foreseeable future.
As always, we appreciate your business.
Sincerely,
Manning & Napier Advisors, LLC
1
High Yield Bond Series
Fund Commentary
(unaudited)
Investment Objective
To provide a high level of long-term total return, which is a combination of income and capital appreciation. Under normal circumstances, the Series will invest at least 80% of its assets in bonds that are rated below investment-grade (junk bonds) and those securities, principally exchange-traded funds, which are designed to track the performance of non-investment grade securities.
Performance Commentary
Domestic fixed income markets generated modestly positive absolute returns in 2015, although performance across sectors was mixed. Municipal, mortgage-backed, and Treasury securities turned in positive performance for the year, whereas corporate bonds were negative. Meanwhile, performance across international fixed income markets was exceptionally challenging.
High yield was one of the weakest performing fixed income asset classes during 2015. The Bank of America Merrill Lynch U.S. High Yield, Cash Pay, BB-B Rated Index experienced a return of -2.89%. The High Yield Bond Series experienced negative absolute returns as well, returning -3.28%, slightly trailing the benchmark.
The high yield sector was negatively affected by widening credit spreads and large outflows. Additionally, several parts of the high yield market experienced notable weakness. The commodity and energy sectors, for example, continued to show a high level of stress/distress.
During 2016 the fixed income landscape should continue to shift as the Federal Reserve considers further changes to U.S. monetary policy. Having raised the federal funds rate, we believe they now will seek to remain flexible and proceed slowly with small increases that do not follow a well-defined schedule. The diverging monetary policies of major central banks, geopolitical risks, commodity price pressures, and the potential for global growth to deviate from expectations could cause volatility in financial markets. In light of the current environment, it is important that investors remain active, flexible, and selective in their approach in order to avoid overvalued and risky areas of the market, something Manning & Napier has done for over 45 years.
Performance data quoted represents past performance and does not guarantee future results. The investment return and principal value of an investment will fluctuate, so that an investor’s shares, when redeemed, may be worth more or less than their original cost. Current performance may be higher or lower than that quoted; investors can obtain the most recent month-end performance at www.manning-napier.com or by calling (800) 466-3863. Performance for the High Yield Bond Series Class S shares is provided above. Performance for the Class I shares will be higher based on the Class’ lower expenses.
Please see the next page for additional performance information as of December 31, 2015.
There is an inverse relationship between bond prices and interest rates; as interest rates rise, bond prices (and therefore the value of bond funds) fall. Likewise, as interest rates fall, bond prices and the value of bond funds rise. Investments in higher-yielding, lower-rated securities involve additional risks, including a higher risk of default and loss of principal.
2
High Yield Bond Series
Performance Update as of December 31, 2015
(unaudited)
| AVERAGE ANNUAL TOTAL RETURNS AS OF DECEMBER 31, 2015 | ||||||||||||
ONE YEAR1 | FIVE YEAR | SINCE INCEPTION2 | ||||||||||
Manning & Napier Fund, Inc. - High Yield Bond Series - Class S3 | -3.28 | % | 4.89 | % | 6.78 | % | ||||||
Manning & Napier Fund, Inc. - High Yield Bond Series - Class I3,4 | -2.93 | % | 5.09 | % | 6.94 | % | ||||||
Bank of America (BofA) Merrill Lynch U.S. High Yield Cash Pay BB-B Rated Index5 | -2.89 | % | 5.26 | % | 7.64 | % | ||||||
The following graph compares the value of a $10,000 investment in the Manning & Napier Fund, Inc. - High Yield Bond Series Class S from its inception (9/14/09) to present (12/31/15) to the BofA Merrill Lynch U.S. High Yield Cash Pay BB-B Rated Index.
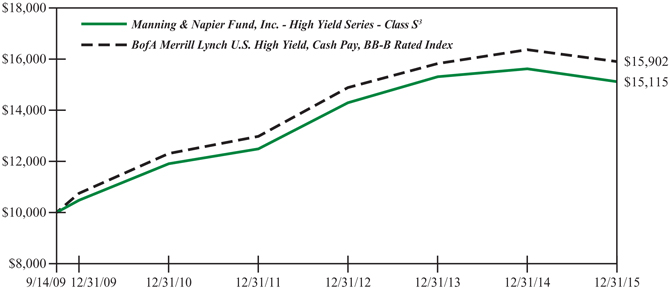
1The returns shown are based on net asset values calculated for shareholder transactions and may differ from the returns shown in the financial highlights, which reflect adjustments made to the net asset values in accordance with accounting principles generally accepted in the United States of America.
2Performance numbers for the Series and Index are calculated from September 14, 2009, the Class S inception date.
3The Series’ performance does not reflect the deduction of taxes that a shareholder would pay on fund distributions or the redemption of shares. The Series’ performance is historical and may not be indicative of future results. The performance returns shown are inclusive of the net expense ratio of the Series. For the year ended December 31, 2015, this net expense ratio was 1.11% for Class S and 0.87% for Class I. The gross expense ratio, which does not account for any voluntary or contractual waivers currently in effect, was 1.11% for Class S and 0.87% for Class I for the year ended December 31, 2015.
4For periods prior to the inception of Class I on August 1, 2012, the performance figures are hypothetical and reflect the performance of the Manning & Napier Fund, Inc. High Yield Bond Series Class S.
5The unmanaged Bank of America (BofA) Merrill Lynch U.S. High Yield Cash Pay BB-B Rated Index is a market value-weighted measure of BB and B rated corporate bonds with maturities of at least one year. The Index returns assume reinvestment of coupons and do not reflect any fees or expenses. Index returns provided by Bloomberg.
3
High Yield Bond Series
Shareholder Expense Example
(unaudited)
As a shareholder of the Series, you incur ongoing costs, including management fees, shareholder service fees and other Series expenses. This example is intended to help you understand your ongoing costs (in dollars) of investing in the Series and to compare these costs with the ongoing costs of investing in other mutual funds.
The example is based on an investment of $1,000 invested in each class at the beginning of the period and held for the entire period (July 1, 2015 to December 31, 2015).
Actual Expenses
The Actual lines of the table below provide information about actual account values and actual expenses. You may use the information in this line, together with the amount you invested, to estimate the expenses that you paid over the period. Simply divide your account value by $1,000 (for example, an $8,600 account value divided by $1,000 = 8.6), then multiply the result by the number in the Actual line for the Class in which you have invested under the heading entitled “Expenses Paid During Period” to estimate the expenses you paid on your account during this period.
Hypothetical Example for Comparison Purposes
The Hypothetical lines of each Class in the table below provide information about hypothetical account values and hypothetical expenses based on the Class’ actual expense ratio and an assumed rate of return of 5% per year before expenses, which is not the Class’ actual return. The hypothetical account values and expenses may not be used to estimate the actual ending account balance or expenses you paid during the period. You may use this information to compare the ongoing costs of investing in the Series and other funds. To do so, compare this 5% hypothetical example with the 5% hypothetical examples that appear in the shareholder reports of the other funds.
Please note that the expenses shown in the table are meant to highlight your ongoing costs only and do not reflect any transaction costs, such as sales charges (loads), redemptions fees, or exchange fees that you may incur in other mutual funds. Therefore, the second line of the table is useful in comparing ongoing costs only, and will not help you determine the relative total costs of owning different funds.
BEGINNING ACCOUNT VALUE 7/1/15 | ENDING ACCOUNT VALUE 12/31/15 | EXPENSES PAID DURING PERIOD* 7/1/15-12/31/15 | ANNUALIZED EXPENSE RATIO | |||||
Class S | ||||||||
Actual | $1,000.00 | $ 938.10 | $5.62 | 1.15% | ||||
Hypothetical | ||||||||
(5% return before expenses) | $1,000.00 | $1,019.41 | $5.85 | 1.15% | ||||
Class I | ||||||||
Actual | $1,000.00 | $ 940.10 | $4.45 | 0.91% | ||||
Hypothetical | ||||||||
(5% return before expenses) | $1,000.00 | $1,020.62 | $4.63 | 0.91% |
*Expenses are equal to the Class’ annualized expense ratio (for the six-month period), multiplied by the average account value over the period, multiplied by 184/365 (to reflect the one-half year period). Expenses are based on the most recent fiscal half year; therefore, the expense ratios stated above may differ from the expense ratios stated in the financial highlights, which are based on one-year data.
4
High Yield Bond Series
Portfolio Composition as of December 31, 2015
(unaudited)
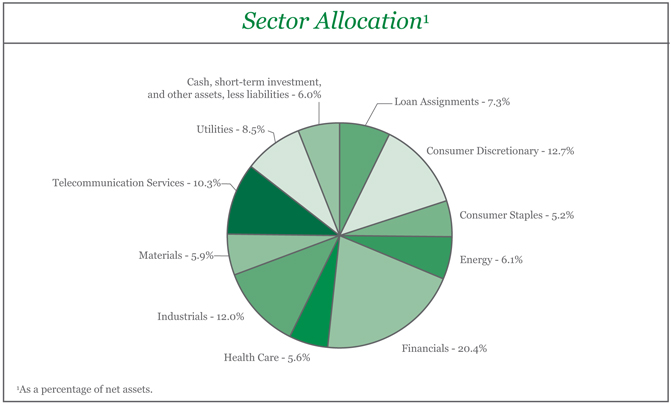
5
High Yield Bond Series
Investment Portfolio - December 31, 2015
| CREDIT RATING1 | PRINCIPAL AMOUNT | VALUE (NOTE 2) | ||||||||||
LOAN ASSIGNMENTS - 7.3% | ||||||||||||
Berry Plastics Group, Inc., Term Loan D2, 3.50%, 2/8/2020 | Ba3 | $ | 2,250,000 | $ | 2,203,470 | |||||||
Charter Communications Operating LLC, Term Loan E2, 3.00%, 7/1/2020 | Baa3 | 2,992,327 | 2,933,109 | |||||||||
CHS - Community Health Systems, Inc., Term Loan G2, 3.75%, 12/31/2019 | Ba2 | 1,492,500 | 1,452,397 | |||||||||
Hilton Worldwide Finance LLC, Term Loan B2, 3.50%, 10/25/2020 | Ba2 | 2,250,000 | 2,243,677 | |||||||||
Valeant Pharmaceuticals International, Inc., Series D-2, Term Loan B2, 3.50%, 2/13/2019 | Ba1 | 3,000,000 | 2,887,500 | |||||||||
|
| |||||||||||
TOTAL LOAN ASSIGNMENTS | 11,720,153 | |||||||||||
|
| |||||||||||
CORPORATE BONDS - 86.7% | ||||||||||||
Non-Convertible Corporate Bonds - 86.7% | ||||||||||||
Consumer Discretionary - 12.7% | ||||||||||||
Auto Components - 0.8% | ||||||||||||
Techniplas LLC3, 10.00%, 5/1/2020 | Caa1 | 1,805,000 | 1,281,550 | |||||||||
|
| |||||||||||
Household Durables - 6.4% | ||||||||||||
Brookfield Residential Properties, Inc. - Brookfield Residential US Corp. (Canada)3, 6.125%, 7/1/2022 | B1 | 3,710,000 | 3,431,750 | |||||||||
Meritage Homes Corp., 7.15%, 4/15/2020 | Ba3 | 1,515,000 | 1,594,537 | |||||||||
Meritage Homes Corp., 7.00%, 4/1/2022 | Ba3 | 1,523,000 | 1,595,342 | |||||||||
TRI Pointe Holdings, Inc. - TRI Pointe Group, Inc., 4.375%, 6/15/2019 | B1 | 1,820,000 | 1,779,050 | |||||||||
Weekley Homes LLC - Weekley Finance Corp., 6.00%, 2/1/2023 | B2 | 1,930,000 | 1,814,200 | |||||||||
|
| |||||||||||
| 10,214,879 | ||||||||||||
|
| |||||||||||
Media - 5.5% | ||||||||||||
Columbus International, Inc. (Barbados)3, 7.375%, 3/30/2021 | Ba3 | 2,475,000 | 2,450,250 | |||||||||
Sinclair Television Group, Inc.3, 5.625%, 8/1/2024 | B1 | 2,158,000 | 2,098,655 | |||||||||
Sirius XM Radio, Inc.3, 5.375%, 4/15/2025 | Ba3 | 1,670,000 | 1,680,437 | |||||||||
VTR Finance B.V. (Chile)3, 6.875%, 1/15/2024 | B1 | 2,935,000 | 2,700,200 | |||||||||
|
| |||||||||||
| 8,929,542 | ||||||||||||
|
| |||||||||||
Total Consumer Discretionary | 20,425,971 | |||||||||||
|
| |||||||||||
Consumer Staples - 5.2% | ||||||||||||
Food & Staples Retailing - 1.3% | ||||||||||||
C&S Group Enterprises LLC3, 5.375%, 7/15/2022 | B1 | 2,220,000 | 1,998,000 | |||||||||
|
| |||||||||||
Food Products - 2.4% | ||||||||||||
Kraft Heinz Foods Co., 6.75%, 3/15/2032 | Baa3 | 1,601,000 | 1,852,815 | |||||||||
Pinnacle Operating Corp.3, 9.00%, 11/15/2020 | Caa1 | 2,185,000 | 2,053,900 | |||||||||
|
| |||||||||||
| 3,906,715 | ||||||||||||
|
| |||||||||||
Household Products - 1.5% | ||||||||||||
HRG Group, Inc., 7.75%, 1/15/2022 | Caa1 | 2,450,000 | 2,401,000 | |||||||||
|
| |||||||||||
Total Consumer Staples | 8,305,715 | |||||||||||
|
| |||||||||||
The accompanying notes are an integral part of the financial statements.
6
High Yield Bond Series
Investment Portfolio - December 31, 2015
| CREDIT RATING1 | PRINCIPAL AMOUNT | VALUE (NOTE 2) | ||||||||||
CORPORATE BONDS (continued) | ||||||||||||
Non-Convertible Corporate Bonds (continued) | ||||||||||||
Energy - 6.1% | ||||||||||||
Energy Equipment & Services - 0.3% | ||||||||||||
FTS International, Inc., 6.25%, 5/1/2022 | Caa2 | $ | 1,470,000 | $ | 411,600 | |||||||
|
| |||||||||||
Oil, Gas & Consumable Fuels - 5.8% | ||||||||||||
Antero Resources Corp., 5.125%, 12/1/2022 | Ba3 | 760,000 | 577,600 | |||||||||
Crestwood Midstream Partners LP - Crestwood Midstream Finance Corp., 6.125%, 3/1/2022 | B1 | 2,515,000 | 1,747,925 | |||||||||
PBF Holding Co. LLC - PBF Finance Corp.3, 7.00%, 11/15/2023 | B1 | 1,535,000 | 1,496,625 | |||||||||
Sabine Pass Liquefaction LLC, 5.625%, 2/1/2021 | Ba3 | 4,355,000 | 4,006,600 | |||||||||
WPX Energy, Inc., 6.00%, 1/15/2022 | Ba1 | 2,250,000 | 1,575,000 | |||||||||
|
| |||||||||||
| 9,403,750 | ||||||||||||
|
| |||||||||||
Total Energy | 9,815,350 | |||||||||||
|
| |||||||||||
Financials - 20.4% | ||||||||||||
Banks - 4.4% | ||||||||||||
CIT Group, Inc., 5.00%, 5/15/2017 | B1 | 1,500,000 | 1,545,000 | |||||||||
Lloyds Bank plc (United Kingdom)3,4,5, 12.00% | BB6 | 1,650,000 | 2,337,720 | |||||||||
Popular, Inc., 7.00%, 7/1/2019 | B2 | 3,420,000 | 3,197,700 | |||||||||
|
| |||||||||||
| 7,080,420 | ||||||||||||
|
| |||||||||||
Capital Markets - 1.3% | ||||||||||||
Drawbridge Special Opportunities Fund LP - Drawbridge Special Opportunities Finance3, 5.00%, 8/1/2021 | BBB6 | 2,225,000 | 2,158,250 | |||||||||
|
| |||||||||||
Consumer Finance - 3.9% | ||||||||||||
Ally Financial, Inc., 2.75%, 1/30/2017 | Ba3 | 3,500,000 | 3,491,250 | |||||||||
Navient Corp., 6.125%, 3/25/2024 | Ba3 | 3,495,000 | 2,848,425 | |||||||||
|
| |||||||||||
| 6,339,675 | ||||||||||||
|
| |||||||||||
Diversified Financial Services - 1.7% | ||||||||||||
Jefferies Finance LLC - JFIN Co-Issuer Corp.3, 7.375%, 4/1/2020 | B1 | 1,470,000 | 1,304,625 | |||||||||
Jefferies Finance LLC - JFIN Co-Issuer Corp.3, 6.875%, 4/15/2022 | B1 | 1,705,000 | 1,432,200 | |||||||||
|
| |||||||||||
| 2,736,825 | ||||||||||||
|
| |||||||||||
Real Estate Investment Trusts (REITS) - 3.5% | ||||||||||||
DuPont Fabros Technology LP, 5.875%, 9/15/2021 | Ba1 | 1,595,000 | 1,658,800 | |||||||||
Qualitytech LP - QTS Finance Corp., 5.875%, 8/1/2022 | B2 | 1,437,000 | 1,465,740 | |||||||||
Rialto Holdings LLC - Rialto Corp.3, 7.00%, 12/1/2018 | B2 | 2,415,000 | 2,451,225 | |||||||||
|
| |||||||||||
| 5,575,765 | ||||||||||||
|
| |||||||||||
Real Estate Management & Development - 2.3% | ||||||||||||
Forestar USA Real Estate Group, Inc.3, 8.50%, 6/1/2022 | B3 | 1,850,000 | 1,803,750 | |||||||||
Greystar Real Estate Partners LLC3, 8.25%, 12/1/2022 | B2 | 1,750,000 | 1,815,625 | |||||||||
|
| |||||||||||
| 3,619,375 | ||||||||||||
|
| |||||||||||
The accompanying notes are an integral part of the financial statements.
7
High Yield Bond Series
Investment Portfolio - December 31, 2015
| CREDIT RATING1 | PRINCIPAL AMOUNT | VALUE (NOTE 2) | ||||||||||
CORPORATE BONDS (continued) | ||||||||||||
Non-Convertible Corporate Bonds (continued) | ||||||||||||
Financials (continued) | ||||||||||||
Thrifts & Mortgage Finance - 3.3% | ||||||||||||
Ladder Capital Finance Holdings LLLP - Ladder Capital Finance Corp., 7.375%, 10/1/2017 | Ba3 | $ | 1,625,000 | $ | 1,618,906 | |||||||
Ladder Capital Finance Holdings LLLP - Ladder Capital Finance Corp.3, 5.875%, 8/1/2021 | Ba3 | 2,655,000 | 2,416,050 | |||||||||
Prospect Holding Co. LLC - Prospect Holding Finance Co.3, 10.25%, 10/1/2018 | B2 | 2,470,000 | 1,191,775 | |||||||||
|
| |||||||||||
| 5,226,731 | ||||||||||||
|
| |||||||||||
Total Financials | 32,737,041 | |||||||||||
|
| |||||||||||
Health Care - 5.6% | ||||||||||||
Biotechnology - 1.3% | ||||||||||||
AMAG Pharmaceuticals, Inc.3, 7.875%, 9/1/2023 | B3 | 2,370,000 | 2,085,600 | |||||||||
|
| |||||||||||
Health Care Providers & Services - 2.0% | ||||||||||||
Tenet Healthcare Corp.2,3, 4.012%, 6/15/2020 | Ba2 | 1,680,000 | 1,638,000 | |||||||||
Tenet Healthcare Corp., 8.125%, 4/1/2022 | B3 | 1,535,000 | 1,531,163 | |||||||||
|
| |||||||||||
| 3,169,163 | ||||||||||||
|
| |||||||||||
Pharmaceuticals - 2.3% | ||||||||||||
Concordia Healthcare Corp. (Canada)3, 7.00%, 4/15/2023 | Caa2 | 2,535,000 | 2,199,113 | |||||||||
Mallinckrodt International Finance S.A. - Mallinckrodt CB LLC3, 5.625%, 10/15/2023 | B1 | 1,625,000 | 1,543,750 | |||||||||
|
| |||||||||||
| 3,742,863 | ||||||||||||
|
| |||||||||||
Total Health Care | 8,997,626 | |||||||||||
|
| |||||||||||
Industrials - 12.0% | ||||||||||||
Aerospace & Defense - 1.8% | ||||||||||||
DigitalGlobe, Inc.3, 5.25%, 2/1/2021 | B1 | 3,489,000 | 2,930,760 | |||||||||
|
| |||||||||||
Air Freight & Logistics - 0.9% | ||||||||||||
Neovia Logistics Intermediate Holdings LLC - Logistics Intermediate Finance Corp.3,7, 10.00%, 2/15/2018 | Caa3 | 1,485,000 | 1,425,600 | |||||||||
|
| |||||||||||
Airlines - 1.5% | ||||||||||||
Allegiant Travel Co., 5.50%, 7/15/2019 | B1 | 2,435,000 | 2,465,438 | |||||||||
|
| |||||||||||
Commercial Services & Supplies - 1.2% | ||||||||||||
Constellis Holdings LLC - Constellis Finance Corp.3, 9.75%, 5/15/2020 | B3 | 1,590,000 | 1,303,800 | |||||||||
Modular Space Corp.3, 10.25%, 1/31/2019 | B3 | 1,640,000 | 656,000 | |||||||||
|
| |||||||||||
| 1,959,800 | ||||||||||||
|
| |||||||||||
Construction & Engineering - 0.2% | ||||||||||||
Abengoa Finance S.A.U. (Spain)*3,8, 7.75%, 2/1/2020 | Caa3 | 1,620,000 | 224,775 | |||||||||
|
| |||||||||||
Machinery - 2.8% | ||||||||||||
Case New Holland Industrial, Inc. (United Kingdom), 7.875%, 12/1/2017 | Ba1 | 2,500,000 | 2,643,750 | |||||||||
The accompanying notes are an integral part of the financial statements.
8
High Yield Bond Series
Investment Portfolio - December 31, 2015
| CREDIT RATING1 | PRINCIPAL AMOUNT | VALUE (NOTE 2) | ||||||||||
CORPORATE BONDS (continued) | ||||||||||||
Non-Convertible Corporate Bonds (continued) | ||||||||||||
Industrials (continued) | ||||||||||||
Machinery (continued) | ||||||||||||
Waterjet Holdings, Inc.3, 7.625%, 2/1/2020 | B2 | $ | 1,925,000 | $ | 1,910,562 | |||||||
|
| |||||||||||
| 4,554,312 | ||||||||||||
|
| |||||||||||
Trading Companies & Distributors - 3.6% | ||||||||||||
Aviation Capital Group Corp.3, 3.875%, 9/27/2016 | BBB6 | 1,645,000 | 1,657,338 | |||||||||
Fly Leasing Ltd. (Ireland), 6.75%, 12/15/2020 | B2 | 1,235,000 | 1,265,690 | |||||||||
Fly Leasing Ltd. (Ireland), 6.375%, 10/15/2021 | B2 | 2,850,000 | 2,835,750 | |||||||||
|
| |||||||||||
| 5,758,778 | ||||||||||||
|
| |||||||||||
Total Industrials | 19,319,463 | |||||||||||
|
| |||||||||||
Materials - 5.9% | ||||||||||||
Chemicals - 1.5% | ||||||||||||
Consolidated Energy Finance S.A. (Trinidad-Tobago)3, 6.75%, 10/15/2019 | B2 | 2,450,000 | 2,342,077 | |||||||||
|
| |||||||||||
Containers & Packaging - 1.8% | ||||||||||||
Ardagh Packaging Finance plc - Ardagh Holdings USA, Inc. (Ireland)2,3, 3.512%, 12/15/2019 | Ba3 | 2,980,000 | 2,912,950 | |||||||||
|
| |||||||||||
Metals & Mining - 2.6% | ||||||||||||
Alcoa, Inc., 5.87%, 2/23/2022 | Ba1 | 1,660,000 | 1,618,500 | |||||||||
Steel Dynamics, Inc., 5.125%, 10/1/2021 | Ba2 | 1,530,000 | 1,415,250 | |||||||||
SunCoke Energy Partners LP - SunCoke Energy Partners Finance Corp.3, 7.375%, 2/1/2020 | B1 | 1,960,000 | 1,215,200 | |||||||||
|
| |||||||||||
| 4,248,950 | ||||||||||||
|
| |||||||||||
Total Materials | 9,503,977 | |||||||||||
|
| |||||||||||
Telecommunication Services - 10.3% | ||||||||||||
Diversified Telecommunication Services - 4.8% | ||||||||||||
CenturyLink, Inc., 5.80%, 3/15/2022 | Ba2 | 2,705,000 | 2,479,133 | |||||||||
Frontier Communications Corp.3, 11.00%, 9/15/2025 | Ba3 | 3,960,000 | 3,920,400 | |||||||||
Windstream Services LLC, 7.875%, 11/1/2017 | B2 | 1,275,000 | 1,304,338 | |||||||||
|
| |||||||||||
| 7,703,871 | ||||||||||||
|
| |||||||||||
Wireless Telecommunication Services - 5.5% | ||||||||||||
Altice Financing S.A. (Luxembourg)3, 6.50%, 1/15/2022 | B1 | 3,165,000 | 3,133,350 | |||||||||
Altice Financing S.A. (Luxembourg)3, 6.625%, 2/15/2023 | B1 | 870,000 | 859,125 | |||||||||
Sixsigma Networks Mexico S.A. de C.V. (Mexico)3, 8.25%, 11/7/2021 | B2 | 2,440,000 | 2,330,200 | |||||||||
T-Mobile USA, Inc., 6.836%, 4/28/2023 | Ba3 | 2,365,000 | 2,447,775 | |||||||||
|
| |||||||||||
| 8,770,450 | ||||||||||||
|
| |||||||||||
Total Telecommunication Services | 16,474,321 | |||||||||||
|
| |||||||||||
Utilities - 8.5% | ||||||||||||
Independent Power and Renewable Electricity Producers - 8.5% | ||||||||||||
Abengoa Yield plc (Spain)3, 7.00%, 11/15/2019 | B2 | 3,095,000 | 2,723,600 | |||||||||
The accompanying notes are an integral part of the financial statements.
9
High Yield Bond Series
Investment Portfolio - December 31, 2015
| CREDIT RATING1 | PRINCIPAL AMOUNT/ SHARES | VALUE (NOTE 2) | ||||||||||
CORPORATE BONDS (continued) | ||||||||||||
Non-Convertible Corporate Bonds (continued) | ||||||||||||
Utilities (continued) | ||||||||||||
Independent Power and Renewable Electricity Producers (continued) | ||||||||||||
ContourGlobal Power Holdings S.A. (France)3, 7.125%, 6/1/2019 | B3 | $ | 2,560,000 | $ | 2,432,000 | |||||||
NRG Energy, Inc., 6.25%, 7/15/2022 | B1 | 1,805,000 | 1,537,860 | |||||||||
Talen Energy Supply LLC3, 4.625%, 7/15/2019 | Ba3 | 3,550,000 | 2,662,500 | |||||||||
TerraForm Global Operating LLC3, 9.75%, 8/15/2022 | B3 | 2,570,000 | 2,049,575 | |||||||||
TerraForm Power Operating LLC3, 6.125%, 6/15/2025 | B3 | 2,715,000 | 2,185,575 | |||||||||
|
| |||||||||||
Total Utilities | 13,591,110 | |||||||||||
|
| |||||||||||
Total Non-Convertible Corporate Bonds | ||||||||||||
(Identified Cost $153,308,485) | 139,170,574 | |||||||||||
|
| |||||||||||
SHORT-TERM INVESTMENT - 1.6% | ||||||||||||
Dreyfus Cash Management, Inc. - Institutional Shares9, 0.23%, | ||||||||||||
(Identified Cost $2,604,104) | 2,604,104 | 2,604,104 | ||||||||||
|
| |||||||||||
TOTAL INVESTMENTS - 95.6% | ||||||||||||
(Identified Cost $167,820,726) | 153,494,831 | |||||||||||
OTHER ASSETS, LESS LIABILITIES - 4.4% | 7,090,213 | |||||||||||
|
| |||||||||||
NET ASSETS - 100% | $ | 160,585,044 | ||||||||||
|
| |||||||||||
*Non-income producing security.
1Credit ratings from Moody’s (unaudited).
2The coupon rate is floating and is the effective rate as of December 31, 2015.
3Restricted securities - Investment in securities that are restricted as to public resale under the Securities Act of 1933, as amended. These securities have been sold under rule 144A and have been determined to be liquid under guidelines established by the Board of Directors. These securities amount to $82,444,437 or 51.3% of the Series’ net assets as of December 31, 2015 (see Note 2 to the financial statements).
4Security is perpetual in nature and has no stated maturity date.
5The rate shown is a fixed rate as of December 31, 2015; the rate becomes floating, based on LIBOR plus a spread, in December 2024.
6Credit ratings from S&P (unaudited).
7Represents a Payment-In-Kind bond.
8Issuer filed for bankruptcy and/or is in default of interest payments.
9Rate shown is the current yield as of December 31, 2015.
The Global Industry Classification Standard (GICS) was developed by and is the exclusive property and a service mark of MSCI Inc. (MSCI) and Standard & Poor’s, a division of The McGraw-Hill Companies, Inc. (S&P), and is licensed for use by Manning & Napier when referencing GICS sectors. Neither MSCI, S&P, nor any third party involved in making or compiling the GICS or any GICS classifications makes any express or implied warranties or representations with respect to such standard or classification, nor shall any such party have any liability therefrom.
The accompanying notes are an integral part of the financial statements.
10
High Yield Bond Series
Statement of Assets and Liabilities
December 31, 2015
ASSETS: | ||||
Investments, at value (identified cost $167,820,726) (Note 2) | $ | 153,494,831 | ||
Cash | 15,983 | |||
Receivable for securities sold | 6,670,694 | |||
Interest receivable | 3,027,409 | |||
Receivable for fund shares sold | 104,843 | |||
|
| |||
TOTAL ASSETS | 163,313,760 | |||
|
| |||
LIABILITIES: | ||||
Accrued management fees (Note 3) | 102,795 | |||
Accrued shareholder services fees (Class S) (Note 3) | 23,329 | |||
Accrued fund accounting and administration fees (Note 3) | 19,519 | |||
Accrued transfer agent fees (Note 3) | 8,711 | |||
Accrued Chief Compliance Officer service fees (Note 3) | 429 | |||
Payable for securities purchased | 2,216,250 | |||
Payable for fund shares repurchased | 322,624 | |||
Other payables and accrued expenses | 35,059 | |||
|
| |||
TOTAL LIABILITIES | 2,728,716 | |||
|
| |||
TOTAL NET ASSETS | $ | 160,585,044 | ||
|
| |||
NET ASSETS CONSIST OF: | ||||
Capital stock | $ | 181,508 | ||
Additional paid-in-capital | 181,530,897 | |||
Undistributed net investment income | 139,386 | |||
Accumulated net realized loss on investments | (6,940,852 | ) | ||
Net unrealized depreciation on investments | (14,325,895 | ) | ||
|
| |||
TOTAL NET ASSETS | $ | 160,585,044 | ||
|
| |||
NET ASSET VALUE, OFFERING PRICE AND REDEMPTION PRICE PER SHARE - Class S | ||||
($108,202,164/11,743,604 shares) | $ | 9.21 | ||
|
| |||
NET ASSET VALUE, OFFERING PRICE AND REDEMPTION PRICE PER SHARE - Class I | ||||
($52,382,880/6,407,174 shares) | $ | 8.18 | ||
|
| |||
The accompanying notes are an integral part of the financial statements.
11
High Yield Bond Series
Statement of Operations
For the Year Ended December 31, 2015
INVESTMENT INCOME: | ||||
Interest | $ | 12,886,432 | ||
Dividends | 257,131 | |||
|
| |||
Total Investment Income | 13,143,563 | |||
|
| |||
EXPENSES: | ||||
Management fees (Note 3) | 1,599,122 | |||
Shareholder services fees (Class S) (Note 3) | 409,193 | |||
Fund accounting and administration fees (Note 3) | 66,250 | |||
Transfer agent fees (Note 3) | 24,244 | |||
Directors’ fees (Note 3) | 8,291 | |||
Chief Compliance Officer service fees (Note 3) | 2,541 | |||
Custodian fees | 12,570 | |||
Miscellaneous | 121,118 | |||
|
| |||
Total Expenses | 2,243,329 | |||
|
| |||
NET INVESTMENT INCOME | 10,900,234 | |||
|
| |||
REALIZED AND UNREALIZED LOSS ON INVESTMENTS: | ||||
Net realized loss on investments | (6,514,003 | ) | ||
Net change in unrealized appreciation (depreciation) on investments | (5,981,699 | ) | ||
|
| |||
NET REALIZED AND UNREALIZED LOSS ON INVESTMENTS | (12,495,702 | ) | ||
|
| |||
NET DECREASE IN NET ASSETS RESULTING FROM OPERATIONS | $ | (1,595,468 | ) | |
|
| |||
The accompanying notes are an integral part of the financial statements.
12
High Yield Bond Series
Statements of Changes in Net Assets
FOR THE YEAR ENDED 12/31/15 | FOR THE YEAR ENDED 12/31/14 | |||||||
INCREASE (DECREASE) IN NET ASSETS: | ||||||||
OPERATIONS: | ||||||||
Net investment income | $ | 10,900,234 | $ | 11,718,547 | ||||
Net realized gain (loss) on investments | (6,514,003 | ) | 5,867,932 | |||||
Net change in unrealized appreciation (depreciation) on investments | (5,981,699 | ) | (12,738,672 | ) | ||||
|
|
|
| |||||
Net increase (decrease) from operations | (1,595,468 | ) | 4,847,807 | |||||
|
|
|
| |||||
DISTRIBUTIONS TO SHAREHOLDERS (Note 8): | ||||||||
From net investment income (Class S) | (7,702,934 | ) | (9,427,102 | ) | ||||
From net investment income (Class I) | (3,207,079 | ) | (2,140,735 | ) | ||||
From net realized gain on investments (Class S) | — | (6,037,874 | ) | |||||
From net realized gain on investments (Class I) | — | (1,355,223 | ) | |||||
|
|
|
| |||||
Total distributions to shareholders | (10,910,013 | ) | (18,960,934 | ) | ||||
|
|
|
| |||||
CAPITAL STOCK ISSUED AND REPURCHASED: | ||||||||
Net increase (decrease) from capital share transactions (Note 5) | (71,267,243 | ) | 42,249,663 | |||||
|
|
|
| |||||
Net increase (decrease) in net assets | (83,772,724 | ) | 28,136,536 | |||||
NET ASSETS: | ||||||||
Beginning of year | 244,357,768 | 216,221,232 | ||||||
|
|
|
| |||||
End of year (including undistributed net investment income of $139,386 and $149,165, respectively) | $ | 160,585,044 | $ | 244,357,768 | ||||
|
|
|
| |||||
The accompanying notes are an integral part of the financial statements.
13
High Yield Bond Series
Financial Highlights - Class S*
| FOR THE YEARS ENDED | ||||||||||||||||||||
| 12/31/15 | 12/31/14 | 12/31/13 | 12/31/12 | 12/31/11 | ||||||||||||||||
Per share data (for a share outstanding throughout each year): | ||||||||||||||||||||
Net asset value - Beginning of year | $ | 10.04 | $ | 10.64 | $ | 10.75 | $ | 10.30 | $ | 10.75 | ||||||||||
|
|
|
|
|
|
|
|
|
| |||||||||||
Income (loss) from investment operations: | ||||||||||||||||||||
Net investment income1 | 0.51 | 0.52 | 0.54 | 0.63 | 0.69 | |||||||||||||||
Net realized and unrealized gain (loss) on investments | (0.82 | ) | (0.30 | ) | 0.21 | 0.83 | (0.17 | ) | ||||||||||||
|
|
|
|
|
|
|
|
|
| |||||||||||
Total from investment operations | (0.31 | ) | 0.22 | 0.75 | 1.46 | 0.52 | ||||||||||||||
|
|
|
|
|
|
|
|
|
| |||||||||||
Less distributions to shareholders: | ||||||||||||||||||||
From net investment income | (0.52 | ) | (0.50 | ) | (0.53 | ) | (0.64 | ) | (0.67 | ) | ||||||||||
From net realized gain on investments | — | (0.32 | ) | (0.33 | ) | (0.37 | ) | (0.29 | ) | |||||||||||
|
|
|
|
|
|
|
|
|
| |||||||||||
Total distributions to shareholders | (0.52 | ) | (0.82 | ) | (0.86 | ) | (1.01 | ) | (0.96 | ) | ||||||||||
|
|
|
|
|
|
|
|
|
| |||||||||||
Net asset value - End of year | $ | 9.21 | $ | 10.04 | $ | 10.64 | $ | 10.75 | $ | 10.31 | ||||||||||
|
|
|
|
|
|
|
|
|
| |||||||||||
Net assets - End of year (000’s omitted) | $ | 108,202 | $ | 202,772 | $ | 191,922 | $ | 179,187 | $ | 175,350 | ||||||||||
|
|
|
|
|
|
|
|
|
| |||||||||||
Total return2 | (3.28 | %) | 2.04 | % | 7.17 | % | 14.46 | % | 4.87 | % | ||||||||||
Ratios (to average net assets)/Supplemental Data: | ||||||||||||||||||||
Expenses | 1.11 | % | 1.11 | % | 1.12 | % | 1.10 | % | 1.12 | % | ||||||||||
Net investment income | 5.04 | % | 4.78 | % | 4.99 | % | 5.83 | % | 6.26 | % | ||||||||||
Portfolio turnover | 109 | % | 104 | % | 93 | % | 91 | % | 63 | % | ||||||||||
*Effective August 1, 2012, the shares of the Series have been designated as Class S.
1Calculated based on average shares outstanding during the years.
2Represents aggregate total return for the years indicated, and assumes reinvestment of all distributions. Total return would have been lower had certain expenses not been waived or reimbursed during certain years.
The accompanying notes are an integral part of the financial statements.
14
High Yield Bond Series
Financial Highlights - Class I
| FOR THE YEARS ENDED | FOR THE PERIOD | |||||||||||||||
| 8/1/121 TO | ||||||||||||||||
| 12/31/15 | 12/31/14 | 12/31/13 | 12/31/12 | |||||||||||||
Per share data (for a share outstanding throughout each period): | ||||||||||||||||
Net asset value - Beginning of period | $ | 8.97 | $ | 9.59 | $ | 9.78 | $ | 10.00 | ||||||||
|
|
|
|
|
|
|
| |||||||||
Income (loss) from investment operations: | ||||||||||||||||
Net investment income2 | 0.47 | 0.49 | 0.52 | 0.25 | ||||||||||||
Net realized and unrealized gain (loss) on investments | (0.72 | ) | (0.26 | ) | 0.18 | 0.30 | ||||||||||
|
|
|
|
|
|
|
| |||||||||
Total from investment operations | (0.25 | ) | 0.23 | 0.70 | 0.55 | |||||||||||
|
|
|
|
|
|
|
| |||||||||
Less distributions to shareholders: | ||||||||||||||||
From net investment income | (0.54 | ) | (0.53 | ) | (0.56 | ) | (0.40 | ) | ||||||||
From net realized gain on investments | — | (0.32 | ) | (0.33 | ) | (0.37 | ) | |||||||||
|
|
|
|
|
|
|
| |||||||||
Total distributions to shareholders | (0.54 | ) | (0.85 | ) | (0.89 | ) | (0.77 | ) | ||||||||
|
|
|
|
|
|
|
| |||||||||
Net asset value - End of period | $ | 8.18 | $ | 8.97 | $ | 9.59 | $ | 9.78 | ||||||||
|
|
|
|
|
|
|
| |||||||||
Net assets - End of period (000’s omitted) | $ | 52,383 | $ | 41,586 | $ | 24,299 | $ | 14,002 | ||||||||
|
|
|
|
|
|
|
| |||||||||
Total return3 | (2.93 | %) | 2.33 | % | 7.35 | % | 5.59 | % | ||||||||
Ratios (to average net assets)/Supplemental Data: | ||||||||||||||||
Expenses | 0.87 | % | 0.86 | % | 0.87 | % | 0.87 | %4 | ||||||||
Net investment income | 5.34 | % | 5.05 | % | 5.24 | % | 5.90 | %4 | ||||||||
Portfolio turnover | 109 | % | 104 | % | 93 | % | 91 | % | ||||||||
1Commencement of operations.
2Calculated based on average shares outstanding during the periods.
3Represents aggregate total return for the periods indicated, and assumes reinvestment of all distributions. Periods less than one year are not annualized.
4Annualized.
The accompanying notes are an integral part of the financial statements.
15
High Yield Bond Series
Notes to Financial Statements
| 1. | Organization |
High Yield Bond Series (the “Series”) is a no-load diversified series of Manning & Napier Fund, Inc. (the “Fund”). The Fund is organized in Maryland and is registered under the Investment Company Act of 1940, as amended, as an open-end management investment company.
The Series’ investment objective is to provide a high level of long-term total return by investing principally in non-investment grade fixed income securities that are issued by government and corporate entities.
The Fund’s advisor is Manning & Napier Advisors, LLC (the “Advisor”). Shares of the Series are offered to investors, clients and employees of the Advisor and its affiliates. The series is authorized to issue two classes of shares (Class S & Class I). Each class of shares is substantially the same, except that Class S shares bear shareholder services fees. The total authorized capital stock of the Fund consists of 15 billion shares of common stock each having a par value of $0.01. As of December 31, 2015, 10.7 billion shares have been designated in total among 41 series, of which 125 million have been designated as High Yield Bond Series Class S common stock and 100 million have been designated as High Yield Bond Series Class I common stock.
| 2. | Significant Accounting Policies |
The following is a summary of significant accounting policies followed by the Series. The Series is an investment company and, accordingly, follows the investment company accounting and reporting guidance of the Financial Accounting Standards Board Accounting Standards Codification Topic 946 - Investment Companies, which is part of accounting principles generally accepted in the United States of America (“GAAP”).
Security Valuation
Portfolio securities, including domestic equities, foreign equities, warrants and options, listed on an exchange other than the NASDAQ Stock Market are valued at the latest quoted sales price of the exchange on which the security is primarily traded. Securities not traded on valuation date or securities not listed on an exchange are valued at the latest quoted bid price provided by the Fund’s pricing service. Securities listed on the NASDAQ Stock Market are valued in accordance with the NASDAQ Official Closing Price.
Debt securities, including government bonds, foreign bonds, asset-backed securities, structured notes, supranational obligations, sovereign bonds, corporate bonds, loan assignments, and mortgage-backed securities will normally be valued on the basis of evaluated bid prices provided directly by an independent pricing service. The pricing services use multiple valuation techniques to determine fair value. In instances where sufficient market activity exists, the pricing services may utilize a market-based approach through which quotes from market makers are used to determine fair value. In instances where sufficient market activity may not exist or is limited, the pricing services also utilize proprietary valuation models which may consider market characteristics such as benchmark yield curves, option-adjusted spreads, credit spreads, estimated default rates, coupon rates, anticipated timing of principal repayments, underlying collateral, and other unique security features in order to estimate the relevant cash flows, which are then discounted to calculate the fair value. Certain investments in securities held by the Series may be valued on a basis of a price provided directly by a principal market maker. These prices may differ from the value that would have been used had a broader market for securities existed.
The fair value of loan assignments is estimated using recently executed transactions, market price quotations, credit/market events, and cross-asset pricing. Inputs are generally observable market inputs obtained from independent sources. Loan assignments are generally categorized in Level 2 of the fair value hierarchy, unless key inputs are unobservable, in which case they would be categorized in Level 3.
Short-term investments that mature in sixty days or less may be valued at amortized cost, which approximates fair value. Investments in open-end investment companies are valued at their net asset value per share on valuation date.
Volume and level of activity in established markets for an asset or liability are evaluated to determine whether recent transactions and quoted prices are determinative of fair value. Where there have been significant decreases in volume and level
16
High Yield Bond Series
Notes to Financial Statements (continued)
| 2. | Significant Accounting Policies (continued) |
Security Valuation (continued)
of activity, further analysis and adjustment may be necessary to estimate fair value. The Series measures fair value in these instances by the use of inputs and valuation techniques which may be based upon current market prices of securities that are comparable in coupon, rating, maturity and industry and/or expectation of future cash flows. As a result of trading in relatively thin markets and/or markets that experience significant volatility, the prices used by the Series to value these securities may differ from the value that would be realized if these securities were sold, and the differences could be material.
Securities for which representative valuations or prices are not available from the Series’ pricing service may be valued at fair value as determined in good faith by the Advisor under procedures approved by and under the general supervision and responsibility of the Fund’s Board of Directors (the “Board”). Due to the inherent uncertainty of valuations of such securities, the fair value may differ significantly from the values that would have been used had a ready market for such securities existed. If trading or events occurring after the close of the principal market in which securities are traded are expected to materially affect the value of those securities, then they may be valued at their fair value, taking this trading or these events into account.
Various inputs are used in determining the value of the Series’ assets or liabilities carried at fair value. These inputs are summarized in three broad levels. Level 1 includes quoted prices in active markets for identical assets and liabilities. Level 2 includes other significant observable inputs (including quoted prices for similar securities, interest rates, prepayment speeds, credit risk, etc.). Level 3 includes significant unobservable inputs (including the Series’ own assumptions in determining the fair value of investments). A financial instrument’s level within the fair value hierarchy is based on the lowest level of any input both individually and in aggregate that is significant to the fair value measurement. The inputs or methodology used for valuing securities are not necessarily an indication of the risk associated with investing in those securities.
The following is a summary of the valuation levels used for major security types as of December 31, 2015 in valuing the Series’ assets or liabilities carried at fair value:
| DESCRIPTION | TOTAL | LEVEL 1 | LEVEL 2 | LEVEL 3 | ||||||||||||
Assets: | ||||||||||||||||
Debt securities: | ||||||||||||||||
Loan assignments | $ | 11,720,153 | $ | — | $ | 11,720,153 | $ | — | ||||||||
Corporate debt: | ||||||||||||||||
Consumer Discretionary | 20,425,971 | — | 20,425,971 | — | ||||||||||||
Consumer Staples | 8,305,715 | — | 8,305,715 | — | ||||||||||||
Energy | 9,815,350 | — | 9,815,350 | — | ||||||||||||
Financials | 32,737,041 | — | 32,737,041 | — | ||||||||||||
Health Care | 8,997,626 | — | 8,997,626 | — | ||||||||||||
Industrials | 19,319,463 | — | 19,319,463 | — | ||||||||||||
Materials | 9,503,977 | — | 9,503,977 | — | ||||||||||||
Telecommunication Services | 16,474,321 | — | 16,474,321 | — | ||||||||||||
Utilities | 13,591,110 | — | 13,591,110 | — | ||||||||||||
Mutual funds | 2,604,104 | 2,604,104 | — | — | ||||||||||||
|
|
|
|
|
|
|
| |||||||||
Total assets | $ | 153,494,831 | $ | 2,604,104 | $ | 150,890,727 | $ | — | ||||||||
|
|
|
|
|
|
|
| |||||||||
There were no Level 3 securities held by the Series as of December 31, 2014 or December 31, 2015.
The Fund’s policy is to recognize transfers in and transfers out of the valuation levels as of the beginning of the reporting period. There were no transfers between Level 1 and Level 2 during the year ended December 31, 2015.
Security Transactions, Investment Income and Expenses
Security transactions are accounted for on trade date. Dividend income is recorded on the ex-dividend date, except that if the ex-dividend date has passed, certain dividends from foreign securities are recorded as soon as the Series is informed of the
17
High Yield Bond Series
Notes to Financial Statements (continued)
| 2. | Significant Accounting Policies (continued) |
Security Transactions, Investment Income and Expenses (continued)
ex-dividend date. Non-cash dividends, if any, are recorded at the fair value of the securities received. Interest income, including amortization of premium and accretion of discounts using the effective interest method, is earned from settlement date and accrued daily.
Expenses are recorded on an accrual basis. Most expenses of the Fund can be attributed to a specific series. Expenses which cannot be directly attributed are apportioned among the series in the Fund in such a manner as deemed equitable by the Fund’s Board, taking into consideration, among other things, the nature and type of expense. Income, expenses (other than shareholder services fees), and realized and unrealized gains and losses are prorated among the classes based on the relative net assets of each class. Class specific expenses are directly charged to that class.
The Series uses the identified cost method for determining realized gain or loss on investments for both financial statement and federal income tax reporting purposes.
Foreign Currency Translation
The books and records of the Series are maintained in U.S. dollars. Foreign currencies, investments and other assets and liabilities are translated into U.S. dollars at the current exchange rates. Purchases and sales of investment securities and income and expenses are translated on the respective dates of such transactions. The Series does not isolate realized and unrealized gains and losses attributable to changes in the exchange rates from gains and losses that arise from changes in the fair value of investments. Such fluctuations are included with net realized and unrealized gain or loss on investments. Net realized foreign currency gains and losses represent foreign currency gains and losses between trade date and settlement date on securities transactions, gains and losses on disposition of foreign currencies and the difference between the amount of income and foreign withholding taxes recorded on the books of the Series and the amounts actually received or paid.
Securities Purchased on a When-Issued Basis or Forward Commitment
The Series may purchase securities on a when-issued basis or forward commitment. These transactions involve a commitment by the Series to purchase securities for a predetermined price with payment and delivery taking place beyond the customary settlement period. When such purchases are outstanding, the Series will designate liquid assets in an amount sufficient to meet the purchase price. When purchasing a security on a delayed delivery basis, the Series assumes the rights and risks of ownership of the security, including the risk of price and yield fluctuations, and takes such fluctuations into account when determining its net asset value. The Series may sell the when-issued securities before they are delivered, which may result in a capital gain or loss. No such investments were held by the Series on December 31, 2015.
In connection with its ability to purchase or sell securities on a forward commitment basis, the Series may enter into forward roll transactions principally using To Be Announced (TBA) securities. Forward roll transactions require the sale of securities for delivery in the current month, and a simultaneous agreement to repurchase substantially similar (same type, coupon and maturity) securities on a specified future date. Risks of entering into forward roll transactions include the potential inability of the counterparty to meet the terms of the agreement; the potential of the Series to receive inferior securities at redelivery as compared to the securities sold to the counterparty; counterparty credit risk; and the potential pay down speed variance between the mortgage-backed pools. During the roll period, the Series forgoes principal and interest paid on the securities. The Series accounts for such dollar rolls as purchases and sales. Information regarding securities purchased on a when-issued basis is included in the Series’ Investment Portfolio. No such investments were held by the Series on December 31, 2015.
Restricted Securities
Restricted securities are purchased in private placement transactions, are not registered under the Securities Act of 1933, as amended, and may have contractual restrictions on resale. Information regarding restricted securities is included at the end of the Series’ Investment Portfolio.
18
High Yield Bond Series
Notes to Financial Statements (continued)
| 2. | Significant Accounting Policies (continued) |
Illiquid Securities
A security may be considered illiquid if so deemed in good faith by the Advisor under procedures approved by and under the general supervision and responsibility of the Fund’s Board. Securities that are illiquid are marked with the applicable footnote on the Investment Portfolio. No such investments were held by the Series on December 31, 2015.
Federal Taxes
The Series’ policy is to comply with the provisions of the Internal Revenue Code applicable to regulated investment companies. The Series is not subject to federal income tax or excise tax to the extent that the Series distributes to shareholders each year its taxable income, including any net realized gains on investments, in accordance with requirements of the Internal Revenue Code. Accordingly, no provision for federal income tax or excise tax has been made in the financial statements.
Management evaluates its tax positions to determine if the tax positions taken meet the minimum recognition threshold in connection with accounting for uncertainties in income tax positions taken or expected to be taken for the purposes of measuring and recognizing tax liabilities in the financial statements. Recognition of tax benefits of an uncertain tax position is required only when the position is “more likely than not” to be sustained assuming examination by taxing authorities. At December 31, 2015, the Series has recorded no liability for net unrecognized tax benefits relating to uncertain income tax positions taken or expected to be taken in future tax returns.
The Series files income tax returns in the U.S. federal jurisdiction, various states and foreign jurisdictions, as required. No income tax returns are currently under investigation. The statute of limitations on the Series’ tax returns remains open for the years ended December 31, 2012 through December 31, 2015. The Series is not aware of any tax positions for which it is reasonably possible that the total amounts of unrecognized tax benefits will significantly change in the next twelve months.
Foreign Taxes
Based on the Series’ understanding of the tax rules and rates related to income, gains and currency purchase/repatriation transactions for foreign jurisdictions in which it invests, the Series will provide for foreign taxes, and where appropriate, deferred foreign tax.
Distributions of Income and Gains
Distributions to shareholders of net investment income are made quarterly. Distributions of net realized gains are made annually. An additional distribution may be necessary to avoid taxation of the Series. Distributions are recorded on the ex-dividend date.
Indemnifications
The Fund’s organizational documents provide former and current directors and officers with a limited indemnification against liabilities arising in connection with the performance of their duties to the Fund. In the normal course of business, the Fund may also enter into contracts that provide general indemnifications. The Fund’s maximum exposure under these arrangements is unknown as this would be dependent on future claims that may be made against the Fund. The risk of material loss from such claims is considered remote.
Other
The preparation of financial statements in conformity with GAAP requires management to make estimates and assumptions that affect the reported amounts of assets and liabilities and the disclosure of contingent assets and liabilities at the date of the financial statements and the reported amounts of income and expenses during the reporting period. Actual results could differ from those estimates.
| 3. | Transactions with Affiliates |
The Fund has an Investment Advisory Agreement (the “Agreement”) with the Advisor, for which the Series pays a fee, computed daily and payable monthly, at an annual rate of 0.75% of the Series’ average daily net assets.
19
High Yield Bond Series
Notes to Financial Statements (continued)
| 3. | Transactions with Affiliates (continued) |
Under the Agreement, personnel of the Advisor provide the Series with advice and assistance in the choice of investments and the execution of securities transactions, and otherwise maintain the Series’ organization. The Advisor also provides the Fund with necessary office space and fund administration and support services. The salaries of all officers of the Fund (except a percentage of the Fund’s Chief Compliance Officer’s salary, which is paid by the Fund), and of all Directors who are “affiliated persons” of the Fund, or of the Advisor, and all personnel of the Fund, or of the Advisor, performing services relating to research, statistical and investment activities, are paid by the Advisor. Each “non-affiliated” Director receives an annual stipend, which is allocated among all the active series of the Fund. In addition, these Directors also receive a fee per Board meeting attended plus a fee for each committee meeting attended and are reimbursed for travel and other out-of-pocket expenses incurred by them in connection with attending such meetings. The Fund also has an Audit Committee Chair, who receives an additional annual stipend for this role.
The Class S shares of the Series are subject to a shareholder services fee in accordance with a shareholder services plan adopted by the Board. The shareholder services fee is intended to compensate financial intermediaries, including affiliates of the Fund, in connection with the provision of direct client service, personal services, maintenance of shareholder accounts and reporting services. For these services, Class S of the Series pays a fee, computed daily and payable monthly, at an annual rate of 0.25% of the average daily net assets of Class S. The Fund has a Shareholder Services Agreement with the Advisor, for which the Advisor receives the shareholder services fee as stated above.
The Advisor has contractually agreed, until at least April 30, 2016, to waive its management fee and, if necessary, pay other operating expenses of the Series in order to maintain total direct annual fund operating expenses for the Series, exclusive of each share class’ shareholder services fee, at no more than 0.95% of average daily net assets. The Advisor did not waive any fees for the year ended December 31, 2015. The Advisor is not eligible to recoup any expenses that have been waived or reimbursed in prior years.
Manning & Napier Investor Services, Inc., a registered broker-dealer affiliate of the Advisor, acts as distributor for the Fund’s shares. The services of Manning & Napier Investor Services, Inc. are provided at no additional cost to the Series.
Pursuant to a master services agreement dated November 1, 2014, the Fund pays the Advisor an annual fee related to fund accounting and administration of 0.0085% on the first $25 billion of average daily net assets (excluding Target Series and Strategic Income Series); 0.0075% on the next $15 billion of average daily net assets (excluding Target Series and Strategic Income Series); and 0.0065% of the average daily net assets in excess of $40 billion (excluding Target Series and Strategic Income Series); plus a base fee of $30,400 per series. Transfer agent fees are charged to the Fund on a per account basis. Additionally, certain transaction and out-of-pocket expenses, including charges for reporting relating to the Fund’s compliance program, are charged. The Advisor has agreements with BNY Mellon Investment Servicing (U.S.) Inc. (“BNY”) under which BNY serves as sub-accountant services agent and sub-transfer agent.
Expenses not directly attributable to a series are allocated based on each series’ relative net assets or number of accounts, depending on the expense.
| 4. | Purchases and Sales of Securities |
For the year ended December 31, 2015, purchases and sales of securities, other than U.S. Government securities and short-term securities, were $216,457,617 and $287,783,673, respectively. There were no purchases or sales of U.S. Government securities.
20
High Yield Bond Series
Notes to Financial Statements (continued)
| 5. | Capital Stock Transactions |
Transactions in shares of Class S and Class I shares of High Yield Bond Series were:
| CLASS S | FOR THE YEAR ENDED 12/31/15 | FOR THE YEAR ENDED 12/31/14 | ||||||||||||||
| SHARES | AMOUNT | SHARES | AMOUNT | |||||||||||||
Sold | 6,115,394 | $ | 61,024,825 | 3,953,447 | $ | 42,414,464 | ||||||||||
Reinvested | 743,760 | 7,278,399 | 1,452,659 | 14,913,394 | ||||||||||||
Repurchased | (15,305,758 | ) | (154,819,412 | ) | (3,259,439 | ) | (35,201,730 | ) | ||||||||
|
|
|
|
|
|
|
| |||||||||
Total | (8,446,604 | ) | $ | (86,516,188 | ) | 2,146,667 | $ | 22,126,128 | ||||||||
|
|
|
|
|
|
|
| |||||||||
| CLASS I | FOR THE YEAR ENDED 12/31/15 | FOR THE YEAR ENDED 12/31/14 | ||||||||||||||
| SHARES | AMOUNT | SHARES | AMOUNT | |||||||||||||
Sold | 3,961,209 | $ | 35,034,607 | 2,472,698 | $ | 23,897,041 | ||||||||||
Reinvested | 339,048 | 2,915,191 | 360,518 | 3,313,848 | ||||||||||||
Repurchased | (2,526,749 | ) | (22,700,853 | ) | (732,438 | ) | (7,087,354 | ) | ||||||||
|
|
|
|
|
|
|
| |||||||||
Total | 1,773,508 | $ | 15,248,945 | 2,100,778 | $ | 20,123,535 | ||||||||||
|
|
|
|
|
|
|
| |||||||||
Over 90% of the shares outstanding are fiduciary accounts where the Advisor has sole investment discretion.
| 6. | Financial Instruments and Loan Assignments |
The Series may trade in instruments including written and purchased options, forward foreign currency exchange contracts and futures contracts and other derivatives in the normal course of investing activities to assist in managing exposure to various market risks. The Series may be subject to various elements of risk, which may involve, to a varying degree, elements of risk in excess of the amounts recognized for financial statement purposes. These risks include: the risk that changes in the value of a derivative may not correlate perfectly with the underlying asset, rate or index; counterparty credit risk related to over the counter derivative counterparties’ failure to perform under contract terms; liquidity risk related to the lack of a liquid market for these contracts allowing the fund to close out its position(s); and documentation risk relating to disagreement over contract terms. No such investments were held by the Series as of December 31, 2015.
The Series may invest in a loan assignment of all or a portion of the loans. The Series has direct rights against the borrower on a loan when it purchases an assignment; however, the Series’ rights may be more limited than the lender from which it acquired the assignment and the Series may be able to enforce its rights only through an administrative agent. Loan assignments are vulnerable to market conditions and may become illiquid due to economic conditions or other events may reduce the demand for loan assignments and certain loan assignments which were liquid when purchased may become illiquid. Loan assignment investments held by the Series as of December 31, 2015 are disclosed in the Investment Portfolio.
| 7. | Foreign Securities |
Investing in securities of foreign companies and foreign governments involves special risks and considerations not typically associated with investing in securities of domestic companies and the U.S. Government. These risks include revaluation of currencies and future adverse political and economic developments. Moreover, securities of foreign companies and foreign governments and their markets may be less liquid and their prices more volatile than those of comparable domestic companies and the U.S. Government.
| 8. | Federal Income Tax Information |
The amount and characterization of certain income and capital gains to be distributed are determined in accordance with federal income tax regulations, which may differ from GAAP. These differences are primarily due to differing book and tax treatments in the timing and/or treatment of the recognition of net investment income or gains and losses, including qualified late-year losses
21
High Yield Bond Series
Notes to Financial Statements (continued)
| 8. | Federal Income Tax Information (continued) |
and losses deferred due to wash sales. The Series may periodically make reclassifications among its capital accounts to reflect income and gains available for distribution (or available capital loss carryovers) under income tax regulations without impacting the Series’ net asset value.
The tax character of distributions paid were as follows:
| FOR THE YEAR ENDED 12/31/15 | FOR THE YEAR ENDED 12/31/14 | |||||||
Ordinary income | $ | 10,910,013 | $ | 15,057,497 | ||||
Long-term capital gains | — | 3,903,437 | ||||||
At December 31, 2015, the identified cost for federal income tax purposes, the resulting gross unrealized appreciation and depreciation, and the net unrealized depreciation were as follows:
Cost for federal income tax purposes | $ | 167,927,034 | ||
Unrealized appreciation | 362,688 | |||
Unrealized depreciation | (14,794,891 | ) | ||
|
| |||
Net unrealized depreciation | $ | (14,432,203 | ) | |
|
| |||
Undistributed ordinary income | $ | 164,538 | ||
Capital loss carryforwards | $ | (6,859,696 | ) |
As of December 31, 2015, the Series had net short-term capital loss carryforwards of $2,001,987 and net long-term capital loss carryforwards of $4,857,709, which may be carried forward indefinitely.
| 9. | Subsequent Events |
As disclosed in Note 3, the Series pays a monthly management fee to the Advisor of 0.75% of average daily net assets, and the Advisor has contractually agreed to waive its management fee and pay other operating expenses of the Series in order to maintain total direct annual operating expenses for the Series, exclusive of each share class’ shareholder service fee, at no more than 0.95% of average daily net assets. On February 17th, 2016, the Board approved a change in Series’ management fee from 0.75% of the Series’ average daily net assets to 0.55% of the Series’ average daily net assets and to change the waiver amount from 0.95% of average daily net assets to 0.65% of average daily net assets. The changes will be effective on February 22, 2016.
22
High Yield Bond Series
Report of Independent Registered Public Accounting Firm
To the Board of Directors of Manning & Napier Fund, Inc. and Shareholders of High Yield Bond Series:
In our opinion, the accompanying statement of assets and liabilities, including the investment portfolio, and the related statements of operations and of changes in net assets and the financial highlights present fairly, in all material respects, the financial position of High Yield Bond Series (a series of Manning & Napier Fund, Inc., hereafter referred to as the “Series”) at December 31, 2015, the results of its operations for the year then ended, the changes in its net assets for each of the two years in the period then ended and the financial highlights for each of the periods presented, in conformity with accounting principles generally accepted in the United States of America. These financial statements and financial highlights (hereafter referred to as “financial statements”) are the responsibility of the Series’ management. Our responsibility is to express an opinion on these financial statements based on our audits. We conducted our audits of these financial statements in accordance with the standards of the Public Company Accounting Oversight Board (United States). Those standards require that we plan and perform the audit to obtain reasonable assurance about whether the financial statements are free of material misstatement. An audit includes examining, on a test basis, evidence supporting the amounts and disclosures in the financial statements, assessing the accounting principles used and significant estimates made by management, and evaluating the overall financial statement presentation. We believe that our audits, which included confirmation of securities at December 31, 2015 by correspondence with the custodian and brokers, provide a reasonable basis for our opinion.

New York, New York
February 19, 2016
23
High Yield Bond Series
Supplemental Tax Information
(unaudited)
All reportings are based on financial information available as of the date of this annual report and, accordingly are subject to change.
For federal income tax purposes, the Series reports for the current fiscal year $66,842 or, if different, the maximum amount allowable under the tax law as qualified dividend income.
24
High Yield Bond Series
Renewal of Investment Advisory Agreement
(unaudited)
At the Manning & Napier Fund, Inc. (the “Fund”) Board of Directors’ (the “Board”) meeting, held on November 17, 2015, the Investment Advisory Agreement (the “Agreement”) between the Fund and Manning & Napier Advisors, LLC (the “Advisor”) was considered by the Board for renewal. In connection with the decision whether to renew the Agreement, a variety of material was prepared for and considered by the Board.
Representatives of the Advisor attended the meeting and presented additional oral and written information to the Board to assist the Board in its considerations. The discussion immediately below outlines the materials and information presented to the Board in connection with the Board’s 2015 Annual consideration of the Agreement and the conclusions made by the Directors when determining to continue the Agreement.
| • | The Board considered the services provided by the Advisor under the Agreement including, among others: deciding what securities to purchase and sell for each Series; arranging for the purchase and sale of such securities by placing orders with broker-dealers; administering the affairs of the Fund (including the books and records of the Fund not maintained by third party service providers such as the custodian or sub-transfer agent); arranging for the insurance coverage for the Fund; and supervising the preparation of tax returns, SEC filings (including registration statements) and reports to shareholders for the Fund. The Board also considered the nature and quality of such services provided under the Agreement in light of the Advisor’s services provided to the Fund for 29 years. The Board discussed the quality of these services with representatives from the Advisor and concluded that the Advisor was performing its services to the Fund required under the Agreement in a reasonable manner. |
| • | The Board considered the performance of each Series since its inception, as well as performance over multiple time periods. Performance for one or more of the following time periods was considered as applicable to the Series’ inception date: inception, three year, five year, ten year, and current market cycle. A market cycle includes periods of both rising and falling markets. Returns for established benchmark indices for each Series were provided. In addition, the Board considered a number of other factors relevant to performance at the meeting (and considers on a quarterly basis) including: a peer group performance analysis consisting of Morningstar universes of mutual funds with similar investment objectives, investment performance of core products, product offerings, performance on an aggregate basis vs. performance over reasonable time periods and the Advisor’s investment process. The Directors acknowledged the challenging performance and discussed the investment process of the Advisor. The Directors confirmed that qualitative factors such as the Advisor’s investment process, including recent enhancements, were an important subset to be considered as part of their consideration of performance. The Board discussed the performance with representatives from the Advisor and concluded that the investment performance of each of the Fund’s Series was reasonable based on the Series’ actual performance and comparative performance, especially for those series with performance over the current market cycle. |
| • | The Board considered the costs of the Advisor’s services and the profits of the Advisor as they relate to the Advisor’s services to the Fund under the Agreement. In reviewing the Advisor’s costs and profits, the Board discussed the Advisor’s revenues generated from the Fund (on both an actual and adjusted basis) and its expenses associated with providing the services under the Agreement. In addition, the Board reviewed the Advisor’s expenses associated with Fund activities outside of the Agreement (such as expense reimbursements pursuant to expense caps and payments made by the Advisor to third party platforms on which shares of the Fund are available for purchase). It was noted by representatives of the Advisor that 22 of the 36 active Series of the Fund are currently experiencing expenses above the capped expense ratios, and thus the Advisor is incurring those expenses over the cap. After discussing the above costs and profits, the Board concluded that the Advisor’s profitability relating to its services provided under the Agreement was reasonable. |
| • | The Board considered the fees and expenses of the various Series of the Fund. The Advisor presented the advisory fees and total expenses for each Series, including the advisory fee adjusted for any expense waivers or reimbursements (either contractual or voluntary) paid by the Advisor. The advisory fees and expense ratios of each Series were compared to an average (on both a mean and median basis) of similar funds as disclosed on the Morningstar database. Representatives of the Advisor discussed with the Board the levels of its advisory fee for each Series of the Fund and as compared to the median and mean advisory fees for similar funds as listed on Morningstar. Expense ratios for every Series, except the Tax Managed Series, Equity Income Class S, High Yield Bond Class S, Pro-Blend Series Classes C and R, and Target Series’ Classes R and K, are lower than, or substantially similar to the Morningstar mean and median reported total expense ratio. |
25
High Yield Bond Series
Renewal of Investment Advisory Agreement
(unaudited)
The higher than mean and median total expense ratios for Classes C and R reflect higher distribution, marketing and shareholder service fees payable to broker-dealers through a 100bp 12b-1 fee for Class C and a 50bp 12b-1 fee for Class R. Based on their review of the information provided, the Board concluded that the fees and expenses of each Series of the Fund were reasonable on a comparative basis.
| • | The Board also considered the other benefits the Advisor derives from its relationship with the Fund. Such other benefits include certain research services provided by soft dollars. The Board reviewed the broker-dealers who provided research to the Advisor and the products and services paid for, in whole or in part, using soft dollar commissions. Given the level of soft dollar transactions involving the Fund, the Board concluded that these additional benefits to the Advisor were reasonable. |
| • | In addition to the factors described above, the Board considered the Advisor’s personnel, investment strategies, policies and procedures relating to compliance with personal securities transactions, reputation, expertise and resources in domestic and foreign financial markets. The Board concluded that these factors support the conclusion that the Advisor performs its services in a reasonable manner. |
| • | The Board then considered economies of scale and concluded that the current fee schedule to the advisory agreement remained reasonable given the multiple uses of the Fund (for the Advisor’s discretionary investment account clients in addition to direct investors), the current profitability of the Advisor’s services to the Fund under the Agreement, the number of newly established series of the Fund and the overall size of the Fund complex. |
Based on the Board’s deliberations and their evaluation of the information described above, the Board, including a majority of Directors that are not “interested persons” as defined in the Investment Company Act of 1940, concluded that the compensation under the Agreement was fair and reasonable in light of the services and expenses and such other matters as the Directors considered to be relevant in the exercise of their reasonable judgment. Accordingly, the Board approved the renewal of the Agreement. In the course of their deliberations, the Directors did not identify any particular information that was all important or controlling.
26
High Yield Bond Series
Directors’ and Officers’ Information
(unaudited)
The Statement of Additional Information provides additional information about the Fund’s directors and officers and can be obtained without charge by calling 1-800-466-3863, at www.manningnapieradvisors.com, or on the EDGAR Database on the SEC Internet web site (http:// www.sec.gov). The following chart shows certain information about the Fund’s officers and directors, including their principal occupations during the last five years. Unless specific dates are provided, the individuals have held the listed positions for longer than five years.
| Interested | Director/Officer |
| Name: | James E. Mikolaichik* | |
| Address: | 290 Woodcliff Drive | |
| Fairport, NY 14450 | ||
| Age: | 44 | |
| Current Position(s) Held with Fund: | Principal Executive Officer, President, Chairman & Director | |
| Term of Office1 & Length of Time Served: | Indefinite - Chairman and Director since August 2015 | |
| Principal Occupation(s) During Past 5 Years: | Chief Financial Officer (since 2011) - Manning & Napier Advisors, LLC; Executive Vice President and Head of Strategy (2008-2011) and Chief Risk Officer (2004-2008) - Old Mutual Asset Management Holds or has held one or more of the following title for various subsidiaries and affiliates: Chief Financial Officer. | |
| Number of Portfolios Overseen within Fund Complex: | 41 | |
| Other Directorships Held Outside Fund Complex: | N/A | |
| Independent Directors | ||
| Name: | Stephen B. Ashley | |
| Address: | 290 Woodcliff Drive | |
| Fairport, NY 14450 | ||
| Age: | 75 | |
| Current Position(s) Held with Fund: | Director, Audit Committee Member, Governance & Nominating Committee Member | |
| Term of Office & Length of Time Served: | Indefinite - Since 1996 | |
| Principal Occupation(s) During Past 5 Years: | Chairman, Director, President & Chief Executive Officer (1997 to present) - The Ashley Group (property management and investment); Director (1995-2008) and Chairman (non-executive) (2004-2008) - Fannie Mae (mortgage). | |
| Number of Portfolios Overseen within Fund Complex: | 41 | |
| Other Directorships Held Outside Fund Complex: | Fannie Mae (1995-2008) | |
| The Ashley Group (1995-2008) | ||
| Genesee Corporation (1987-2007) | ||
| Name: | Paul A. Brooke | |
| Address: | 290 Woodcliff Drive | |
| Fairport, NY 14450 | ||
| Age: | 70 | |
| Current Position(s) Held with Fund: | Director, Audit Committee Member, Governance & Nominating Committee Member | |
| Term of Office & Length of Time Served: | Indefinite - Since 2007 | |
| Principal Occupation(s) During Past 5 Years: | Chairman & CEO (2005-2009) - Ithaka Acquisition Corporation (investments); Chairman (2007-2009) Alsius Corporation (investments); Managing Member, PMSV Holdings LLC (investments) since 1991; Managing Member, Venbio (investments) since 2010. | |
| Number of Portfolios Overseen within Fund Complex: | 41 | |
| Other Directorships Held Outside Fund Complex: | Incyte Corp. (2000-present) | |
| ViroPharma, Inc. (2000-2014) | ||
| HLTH Corp (WebMD) (2000-2010) | ||
| Cheyne Capital International (2000-present) | ||
| GMP Companies (2000-2011) | ||
| Cytos Biotechnology Ltd. (2012-2014) | ||
27
High Yield Bond Series
Directors’ and Officers’ Information
(unaudited)
Independent Directors (continued)
| Name: | Peter L. Faber | |
| Address: | 290 Woodcliff Drive | |
| Fairport, NY 14450 | ||
| Age: | 77 | |
| Current Position(s) Held with Fund: | Director, Governance & Nominating Committee Member | |
| Term of Office & Length of Time Served: | Indefinite - Since 1987 | |
| Principal Occupation(s) During Past 5 Years: | Senior Counsel (2006-2012), Partner (1995-2006 & 2013-present) - McDermott, Will & Emery LLP (law firm) | |
| Number of Portfolios Overseen within Fund Complex: | 41 | |
| Other Directorships Held Outside Fund Complex: | Boston Early Music Festival (non-profit)(2007-present) | |
| Amherst Early Music, Inc. (non-profit)(2009-present) | ||
| Gotham Early Music Scene, Inc. (non-profit)(2009-present) | ||
| Partnership for New York City, Inc. (non-profit) (1989-2010) | ||
| New York Collegium (non-profit) (2004-2011) | ||
| Name: | Harris H. Rusitzky | |
| Address: | 290 Woodcliff Drive | |
| Fairport, NY 14450 | ||
| Age: | 80 | |
| Current Position(s) Held with Fund: | Director, Audit Committee Member, Governance & Nominating Committee Member | |
| Term of Office & Length of Time Served: | Indefinite - Since 1985 | |
| Principal Occupation(s) During Past 5 Years: | President, The Greening Group (business consultants) since 1994; | |
| Partner, The Restaurant Group (restaurants) since 2006 | ||
| Number of Portfolios Overseen within Fund Complex: | 41 | |
| Other Directorships Held Outside Fund Complex: | Rochester Institute of Technology (university)(1972-present) | |
| Culinary Institute of America (non-profit college)(1985-present) | ||
| George Eastman House (museum)(1988-present) | ||
| National Restaurant Association (restaurant trade organization)(1978- present) | ||
| Name: | Chester N. Watson | |
| Address: | 290 Woodcliff Drive | |
| Fairport, NY 14450 | ||
| Age: | 65 | |
| Current Position(s) Held with Fund: | Director, Audit Committee Chairman, Governance & Nominating Committee Member | |
| Term of Office & Length of Time Served: | Indefinite - Since 2012 | |
| Principal Occupation(s) During Past 5 Years: | General Auditor (2003-2011) - General Motors Company (auto manufacturer) | |
| Number of Portfolios Overseen within Fund Complex: | 41 | |
| Other Directorships Held Outside Fund Complex: | Rochester Institute of Technology (university)(2005-present) | |
Officers
| Name: | Jeffrey S. Coons, Ph.D., CFA | |
| Address: | 290 Woodcliff Drive | |
| Fairport, NY 14450 | ||
| Age: | 52 | |
| Current Position(s) Held with Fund: | Vice President | |
| Term of Office1 & Length of Time Served: | Since 2004 | |
| Principal Occupation(s) During Past 5 Years: | President since 2010, Co-Director of Research (2002-2015) - Manning & Napier Advisors, LLC | |
| Holds one or more of the following titles for various subsidiaries and affiliates: President, Director, Treasurer or Senior Trust Officer. | ||
| Number of Portfolios Overseen within Fund Complex: | 41 | |
| Other Directorships Held Outside Fund Complex: | N/A |
28
High Yield Bond Series
| Directors’ and Officers’ Information | ||
| (unaudited) | ||
| Officers (continued) | ||
| Name: | Elizabeth Craig | |
| Address: | 290 Woodcliff Drive | |
| Fairport, NY 14450 | ||
| Age: | 28 | |
| Current Position(s) Held with Fund: | Assistant Corporate Secretary | |
| Term of Office1 & Length of Time Served: | Since 2011 | |
| Principal Occupation(s) During Past 5 Years: | Fund Administration Manager since 2015; Mutual Fund Compliance Specialist (2009-2015) - Manning & Napier Advisors, LLC | |
| Number of Portfolios Overseen within Fund Complex: | 41 | |
| Other Directorships Held Outside Fund Complex: | N/A | |
| Name: | Christine Glavin | |
| Address: | 290 Woodcliff Drive | |
| Fairport, NY 14450 | ||
| Age: | 49 | |
| Current Position(s) Held with Fund: | Principal Financial Officer, Chief Financial Officer | |
| Term of Office1 & Length of Time Served: | Principal Financial Officer since 2002; Chief Financial Officer since 2001 | |
| Principal Occupation(s) During Past 5 Years: | Director of Fund Reporting since 2011; Fund Reporting Manager (1997-2011) - Manning & Napier Advisors, LLC; Assistant Treasurer since 2008 - Exeter Trust Company | |
| Number of Portfolios Overseen within Fund Complex: | 41 | |
| Other Directorships Held Outside Fund Complex: | N/A | |
| Name: | Jodi L. Hedberg | |
| Address: | 290 Woodcliff Drive | |
| Fairport, NY 14450 | ||
| Age: | 48 | |
| Current Position(s) Held with Fund: | Corporate Secretary, Chief Compliance Officer, Anti-Money Laundering Compliance Officer | |
| Term of Office1 & Length of Time Served: | Corporate Secretary since 1997; Chief Compliance Officer since 2004; Anti-Money Laundering Compliance Officer since 2002 | |
| Principal Occupation(s) During Past 5 Years: | Director of Compliance since 2005; Compliance Manager (1995-2005) - Manning & Napier Advisors, LLC and affiliates; Corporate Secretary - Manning & Napier Investor Services, Inc. since 2006 | |
| Number of Portfolios Overseen within Fund Complex: | 41 | |
| Other Directorships Held Outside Fund Complex: | N/A | |
| Name: | Richard Yates | |
| Address: | 290 Woodcliff Drive | |
| Fairport, NY 14450 | ||
| Age: | 50 | |
| Current Position(s) Held with Fund: | Chief Legal Officer | |
| Term of Office1 & Length of Time Served: | Chief Legal Officer since 2004 | |
| Principal Occupation(s) During Past 5 Years: | Counsel - Manning & Napier Advisors, LLC and affiliates since 2000; Holds one or more of the following titles for various affiliates; Director or Corporate Secretary | |
| Number of Portfolios Overseen within Fund Complex: | 41 | |
| Other Directorships Held Outside Fund Complex: | N/A | |
*Interested Director, within the meaning of the Investment Company Act of 1940 by reason of his position with the Fund’s investment advisor and distributor. Mr. Mikolaichik serves as the Chief Financial Officer for Manning & Napier Advisors, LLC.
1The term of office of all officers shall be one year and until their respective successors are chosen and qualified, or his or her earlier resignation or removal as provided in the Fund’s By-Laws.
29
High Yield Bond Series
Results of Special Meeting of Shareholders
(unaudited)
A Special Meeting of the Shareholders of the Fund was held on August 18, 2015. The number of votes necessary to conduct the meeting and approve the proposal was obtained, and the results of the vote of shareholders of all the Series of the Fund voting together in the aggregate is listed below:
PROPOSAL 1:
Election of Directors
| NUMBER OF SHARES VOTED FOR | NUMBER OF SHARES WITHELD | |||||||
Stephen B. Ashley | 883,968,395 | 8,618,094 | ||||||
Paul A. Brooke | 884,510,661 | 8,075,828 | ||||||
Peter L. Faber | 884,140,893 | 8,445,596 | ||||||
James E. Mikolaichik | 883,391,832 | 9,194,657 | ||||||
Harris H. Rusitzky | 620,022,215 | 272,564,274 | ||||||
Chester N. Watson | 884,638,809 | 7,947,680 | ||||||
30
High Yield Bond Series
Literature Requests
(unaudited)
Proxy Voting Policies and Procedures
A description of the policies and procedures that the Fund uses to determine how to vote proxies relating to portfolio securities is available, without charge, upon request:
| By phone | 1-800-466-3863 | |||
| On the Securities and Exchange | ||||
| Commission’s (SEC) web site | http://www.sec.gov |
Proxy Voting Record
Information regarding how the Fund voted proxies relating to portfolio securities during the most recent 12-month period ended June 30th is available, without charge, upon request:
| By phone | 1-800-466-3863 | |||
| On the SEC’s web site | http://www.sec.gov |
Quarterly Portfolio Holdings
The Series’ complete schedule of portfolio holdings for the 1st and 3rd quarters of each fiscal year are provided on Form N-Q, and are available, without charge, upon request:
| By phone | 1-800-466-3863 | |||
| On the SEC’s web site | http://www.sec.gov |
The Series’ Form N-Q may be reviewed and copied at the SEC’s Public Reference Room in Washington, D.C. Information on the operation of the Public Reference Room may be obtained by calling 1-800-SEC-0330.
Prospectus and Statement of Additional Information (SAI)
For more information about any of the Manning & Napier Fund, Inc. Series, you may obtain a prospectus and SAI at www.manning-napier.com or by calling (800) 466-3863. Before investing, carefully consider the objectives, risks, charges and expenses of the investment and read the prospectus carefully as it contains this and other information about the investment company. In addition, this information can be found on the SEC’s web site, http://www.sec.gov.
Additional information available at www.manning-napier.com
1. Fund Holdings - Month-End
2. Fund Holdings - Quarter-End
3. Shareholder Report - Annual
4. Shareholder Report - Semi-Annual
The Fund also offers electronic notification or “e-delivery” when certain documents are available on-line to be downloaded or reviewed. Direct shareholders can elect to receive electronic notification when shareholder reports, prospectus updates, and/or statements are available. If you do not currently have on-line access to your account, you can establish access by going to www.manning-napier.com, click on “Login” in the top corner of the page, and follow the prompts to self-enroll. Once enrolled, you can set your electronic notification preferences by clicking on the Account Options tab located within the green toolbar and then select E-Delivery Option. Should you have any questions on either how to establish on-line access or how to update your account settings, please contact Investor Services at 1-800-466-3863.
The Manning & Napier Fund, Inc. is managed by Manning & Napier Advisors, LLC. Manning & Napier Investor Services, Inc., an affiliate of Manning & Napier Advisors, LLC, is the distributor of the Fund shares.
MNHYB-12/15-AR
Emerging Markets Series
Management Discussion and Analysis
(unaudited)
Dear Shareholders:
Volatility defined global equity markets during the past year, largely driven by macroeconomic factors. Markets around the world experienced a correction in late August amidst a broad selloff triggered by renewed concerns about economic growth in emerging markets — China in particular — and uncertainty about the effects of that slowdown on overall global growth. Developed economies continued to provide accommodative monetary policy to combat growth concerns, although in December the U.S. Federal Reserve raised the federal funds rate for the first time in nearly a decade. For much of the year, Europe struggled with uncertainty regarding Greece’s ability to secure bailout funding from its creditors, which negatively affected investor sentiment. China’s economy slowed, but the government continued to demonstrate a willingness to provide support through a combination of policy-easing maneuvers and targeted stimulus measures. The U.S. economy remained on a path of slow growth that nevertheless made it the best performing developed economy. U.S. stocks were largely flat for the year, whereas global equity markets moderately declined. Looking ahead, we expect the slow global growth environment to remain in place for the foreseeable future.
As always, we appreciate your business.
Sincerely,
Manning & Napier Advisors, LLC
1
Emerging Markets Series
Fund Commentary
(unaudited)
Investment Objective
To provide long-term growth.
Performance Commentary
Emerging market equities struggled during 2015, as weakening prices for oil and other commodities weighed on the asset class. U.S. dollar strength and emerging market currency weakness also pressured emerging market returns, especially for U.S.-dollar-based investors. The MSCI Emerging Markets Index experienced a return of -14.92%. The Emerging Market Series held up better than its benchmark, but experienced negative absolute returns as well, returning -10.18%.
The Series’ outperformance relative to the Emerging Markets Index during the year was driven by sector positioning. Stock selection also aided relative returns. Regarding major contributors to relative performance, stock selection in Health Care and Telecommunication Services aided relative returns. An overweight to Health Care and an underweight to Financials relative to the benchmark aided relative returns as well. From a country positioning and selection perspective, stock selection in China, India, Taiwan, and South Korea aided relative returns. The Series’ overweight to India relative to the benchmark also aided relative returns.
Offsetting a portion of the relative performance tailwind experienced by the Series during 2015 was stock selection in Industrials, Consumer Discretionary, Financials, and Energy, which detracted from relative returns. At a country level, the Series’ overweight to Brazil, underweight to South Korea relative to the benchmark, and lack of exposure to Russia detracted from relative performance. Stock selection in Brazil and Hong Kong also challenged relative returns.
Regarding current portfolio positioning, the Series’ investments reflect an emphasis on sectors and industries we expect to benefit over the long-term from an expanding Emerging Market middle class. Specifically, we see a long runway for growth in a variety of businesses that operate in the Health Care and Consumer sectors as medical care and consumption are two of the first areas in which individuals tend to increase spending as incomes grow. With wages and salaries expected to continue to rise in Emerging Markets, consumers are slowly gaining access to services and products that were once out of reach, and we believe this trend will create myriad investment opportunities for years to come.
During 2016 we believe investors should expect further gyrations in equity markets due to catalysts such as geopolitical risks, the diverging monetary policies of major central banks, commodity price pressures, and the potential for global growth to deviate from expectations. With the Federal Reserve having raised the federal funds rate, we think they now will seek to remain flexible and proceed slowly with small increases that do not follow a well-defined schedule. Broadly speaking, valuations in the developed world remain neutral at best, whereas valuations in select emerging markets are relatively more attractive. Shareholders should expect us to view volatility as a buying opportunity given that our indicators do not suggest capital risk is a significant near-term concern. In light of the current environment, it is important that investors remain active, flexible, and selective in their approach in order to avoid overvalued areas of the market, something Manning & Napier has done for over 45 years as an active investment manager.
Performance data quoted represents past performance and does not guarantee future results. The investment return and principal value of an investment will fluctuate, so that an investor’s shares, when redeemed, may be worth more or less than their original cost. Current performance may be higher or lower than that quoted; investors can obtain the most recent month-end performance at www.manning-napier.com or by calling (800) 466-3863. Performance for the Emerging Market Series Class S shares is provided above. Performance for the Class I shares will be higher based on the Class’ lower expenses.
Please see the next page for additional performance information as of December 31, 2015.
All investments involve risks, including possible loss of principal. Funds whose investments are concentrated in foreign countries may be subject to fluctuating currency values, different accounting standards, and economic and political instability. The value of the Series may be affected by changes in exchange rates between foreign currencies and the U.S. dollar. Investments in emerging markets may be more volatile than investments in more developed markets.
2
Emerging Markets Series
Performance Update as of December 31, 2015
(unaudited)
| AVERAGE ANNUAL TOTAL RETURNS AS OF DECEMBER 31, 2015 | ||||||||
ONE YEAR1 | TOTAL RETURN SINCE INCEPTION2 | |||||||
Manning & Napier Fund, Inc. - Emerging Markets Series - Class S3 | -10.18 | % | 0.95 | % | ||||
Manning & Napier Fund, Inc. - Emerging Markets Series - Class I3,4 | -10.07 | % | 1.05 | % | ||||
MSCI Emerging Markets Index5 | -14.92 | % | -2.11 | % | ||||
The following graph compares the value of a $10,000 investment in the Manning & Napier Fund, Inc. - Emerging Markets Series Class S from its inception2 (November 16, 2011) to present (December 31, 2015) to the MSCI Emerging Markets Index.
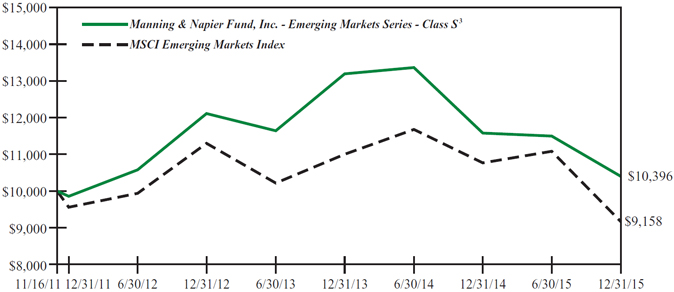
1The returns shown are based on net asset values calculated for shareholder transactions and may differ from the returns shown in the financial highlights, which reflect adjustments made to the net asset values in accordance with accounting principles generally accepted in the United States of America.
2Performance numbers for the Series and the Index are calculated from November 16, 2011, the Class S inception date.
3The Series’ performance does not reflect the deduction of taxes that a shareholder would pay on fund distributions or the redemption of shares. The Series’ performance is historical and may not be indicative of future results. The performance returns shown are inclusive of the net expense ratio of the Series. For the year ended December 31, 2015, this net expense ratio was 1.15% for Class S and 0.90% for Class I. The gross expense ratio, which does not account for any voluntary or contractual waivers currently in effect, was 1.26% for Class S and 1.00% for Class I for the year ended December 31, 2015.
4For periods prior to the inception of Class I on December 18, 2013, the performance figures are hypothetical and reflect the performance of the Manning & Napier Fund, Inc. - Emerging Markets Series - Class S.
5The MSCI Emerging Markets Index is a free float-adjusted market capitalization index that is designed to measure equity market performance of emerging markets and consists of 21 emerging market country indices outside the U.S. The Index returns do not reflect any fees or expenses. The Index returns are net of withholding taxes. They assume daily reinvestment of net dividends thus accounting for any applicable dividend taxation. The Index is denominated in U.S. dollars. Index returns provided by Bloomberg.
3
Emerging Markets Series
Shareholder Expense Example
(unaudited)
As a shareholder of the Series, you incur ongoing costs, including management fees, shareholder service fees and other Series expenses. This example is intended to help you understand your ongoing costs (in dollars) of investing in the Series and to compare these costs with the ongoing costs of investing in other mutual funds.
The example is based on an investment of $1,000 invested at the beginning of the period and held for the entire period (July 1, 2015 to December 31, 2015).
Actual Expenses
The Actual lines of the table below provide information about actual account values and actual expenses. You may use the information in this line, together with the amount you invested, to estimate the expenses that you paid over the period. Simply divide your account value by $1,000 (for example, an $8,600 account value divided by $1,000 = 8.6), then multiply the result by the number in the Actual line for the Class in which you have invested under the heading entitled “Expenses Paid During Period” to estimate the expenses you paid on your account during this period.
Hypothetical Example for Comparison Purposes
The Hypothetical lines of each Class in the table below provide information about hypothetical account values and hypothetical expenses based on the Class’ actual expense ratio and an assumed rate of return of 5% per year before expenses, which is not the Class’ actual return. The hypothetical account values and expenses may not be used to estimate the actual ending account balance or expenses you paid during the period. You may use this information to compare the ongoing costs of investing in the Series and other funds. To do so, compare this 5% hypothetical example for the class in which you have invested with the 5% hypothetical examples that appear in the shareholder reports of the other funds.
Please note that the expenses shown in the table are meant to highlight your ongoing costs only and do not reflect any transaction costs, such as sales charges (loads), redemption fees, or exchange fees that you may incur in other mutual funds. Therefore, the Hypothetical lines for each Class in the table are useful in comparing ongoing costs only, and will not help you determine the relative total costs of owning different funds.
| BEGINNING ACCOUNT VALUE 7/1/15 | ENDING ACCOUNT VALUE 12/31/15 | EXPENSES PAID DURING PERIOD* 7/1/15-12/31/15 | ANNUALIZED EXPENSE RATIO | |||||
Class S | ||||||||
Actual | $1,000.00 | $ 904.10 | $5.52 | 1.15% | ||||
Hypothetical | ||||||||
(5% return before expenses) | $1,000.00 | $1,019.41 | $5.85 | 1.15% | ||||
Class I | ||||||||
Actual | $1,000.00 | $ 905.10 | $4.32 | 0.90% | ||||
Hypothetical | ||||||||
(5% return before expenses) | $1,000.00 | $1,020.67 | $4.58 | 0.90% |
*Expenses are equal to each Class’ annualized expense ratio (for the six-month period), multiplied by the average account value over the period, multiplied by 184/365 (to reflect the one-half year period). Expenses are based on the most recent fiscal half year; therefore, the expense ratios stated above may differ from the expense ratios stated in the financial highlights, which are based on one-year data. The Class’ total return would have been lower had certain expenses not been waived during the period.
4
Emerging Markets Series
Portfolio Composition as of December 31, 2015
(unaudited)
5
Emerging Markets Series
Investment Portfolio - December 31, 2015
| SHARES | VALUE (NOTE 2) | |||||||
COMMON STOCKS - 94.9% | ||||||||
Consumer Discretionary - 8.9% | ||||||||
Diversified Consumer Services - 7.2% | ||||||||
Fu Shou Yuan International Group Ltd. (China)1 | 4,414,000 | $ | 3,423,246 | |||||
Kroton Educacional S.A. (Brazil) | 1,223,050 | 2,946,140 | ||||||
|
| |||||||
| 6,369,386 | ||||||||
|
| |||||||
Media - 1.7% | ||||||||
Global Mediacom Tbk PT (Indonesia)1 | 19,040,380 | 1,507,134 | ||||||
|
| |||||||
Total Consumer Discretionary | 7,876,520 | |||||||
|
| |||||||
Consumer Staples - 16.0% | ||||||||
Beverages - 5.9% | ||||||||
AMBEV S.A. - ADR (Brazil) | 476,690 | 2,126,037 | ||||||
Cia Cervecerias Unidas S.A. - ADR (Chile) | 143,960 | 3,118,174 | ||||||
|
| |||||||
| 5,244,211 | ||||||||
|
| |||||||
Food Products - 6.8% | ||||||||
M Dias Branco S.A. (Brazil) | 81,000 | 1,361,517 | ||||||
Sao Martinho S.A. (Brazil) | 254,900 | 2,950,236 | ||||||
Tiger Brands Ltd. (South Africa)1 | 84,740 | 1,735,750 | ||||||
|
| |||||||
| 6,047,503 | ||||||||
|
| |||||||
Tobacco - 3.3% | ||||||||
Gudang Garam Tbk PT (Indonesia)1 | 733,140 | 2,909,773 | ||||||
|
| |||||||
Total Consumer Staples | 14,201,487 | |||||||
|
| |||||||
Energy - 2.0% | ||||||||
Oil, Gas & Consumable Fuels - 2.0% | ||||||||
Cosan S.A. Industria e Comercio (Brazil) | 274,220 | 1,746,690 | ||||||
|
| |||||||
Financials - 5.6% | ||||||||
Banks - 2.3% | ||||||||
ICICI Bank Ltd. - ADR (India) | 161,450 | 1,264,154 | ||||||
IDFC Bank Ltd. (India)*1 | 880,050 | 809,463 | ||||||
|
| |||||||
| 2,073,617 | ||||||||
|
| |||||||
Diversified Financial Services - 3.3% | ||||||||
IDFC Ltd. (India)1 | 880,050 | 639,389 | ||||||
JSE Ltd. (South Africa)1 | 271,000 | 2,237,641 | ||||||
|
| |||||||
| 2,877,030 | ||||||||
|
| |||||||
Total Financials | 4,950,647 | |||||||
|
| |||||||
Health Care - 28.4% | ||||||||
Biotechnology - 1.9% | ||||||||
Green Cross Corp. (South Korea)1 | 11,030 | 1,706,336 | ||||||
|
| |||||||
Health Care Equipment & Supplies - 11.9% | ||||||||
Ginko International Co. Ltd. (Taiwan)1 | 262,030 | 3,452,339 | ||||||
The accompanying notes are an integral part of the financial statements.
6
Emerging Markets Series
Investment Portfolio - December 31, 2015
| SHARES | VALUE (NOTE 2) | |||||||
COMMON STOCKS (continued) | ||||||||
Health Care (continued) | ||||||||
Health Care Equipment & Supplies (continued) | ||||||||
Shandong Weigao Group Medical Polymer Co. Ltd. - Class H (China)1 | 5,178,000 | $ | 3,540,603 | |||||
St. Shine Optical Co. Ltd. (Taiwan)1 | 176,360 | 3,529,709 | ||||||
|
| |||||||
| 10,522,651 | ||||||||
|
| |||||||
Health Care Providers & Services - 12.6% | ||||||||
Apollo Hospitals Enterprise Ltd. (India)1 | 105,674 | 2,336,342 | ||||||
Fortis Healthcare Ltd. (India)*1 | 1,354,220 | 3,670,757 | ||||||
KPJ Healthcare Berhad (Malaysia)1 | 2,657,640 | 2,612,144 | ||||||
Siloam International Hospitals Tbk PT (Indonesia)1 | 3,564,600 | 2,525,302 | ||||||
|
| |||||||
| 11,144,545 | ||||||||
|
| |||||||
Pharmaceuticals - 2.0% | ||||||||
Genomma Lab Internacional S.A.B. de C.V. - Class B (Mexico)* | 2,212,620 | 1,783,242 | ||||||
|
| |||||||
Total Health Care | 25,156,774 | |||||||
|
| |||||||
Industrials - 3.6% | ||||||||
Commercial Services & Supplies - 1.2% | ||||||||
MiX Telematics Ltd. - ADR (South Africa) | 254,040 | 1,072,049 | ||||||
|
| |||||||
Electrical Equipment - 1.8% | ||||||||
Teco Electric and Machinery Co. Ltd. (Taiwan)1 | 2,052,000 | 1,635,097 | ||||||
|
| |||||||
Marine - 0.6% | ||||||||
Sinotrans Shipping Ltd. - Class H (China)1 | 2,604,000 | 510,849 | ||||||
|
| |||||||
Total Industrials | 3,217,995 | |||||||
|
| |||||||
Information Technology - 20.6% | ||||||||
Electronic Equipment, Instruments & Components - 3.0% | ||||||||
PAX Global Technology Ltd. (Hong Kong)1 | 2,587,000 | 2,654,182 | ||||||
|
| |||||||
Internet Software & Services - 10.5% | ||||||||
Alibaba Group Holding Ltd. - ADR (China)* | 40,870 | 3,321,505 | ||||||
Baidu, Inc. - ADR (China)* | 16,740 | 3,164,530 | ||||||
Tencent Holdings Ltd. - Class H (China)1 | 144,900 | 2,837,140 | ||||||
|
| |||||||
| 9,323,175 | ||||||||
|
| |||||||
Semiconductors & Semiconductor Equipment - 2.3% | ||||||||
MediaTek, Inc. (Taiwan)1 | 270,000 | 2,042,145 | ||||||
|
| |||||||
Software - 1.7% | ||||||||
TOTVS S.A. (Brazil) | 194,410 | 1,524,813 | ||||||
|
| |||||||
Technology Hardware, Storage & Peripherals - 3.1% | ||||||||
Samsung Electronics Co. Ltd. (South Korea)1 | 2,550 | 2,719,785 | ||||||
|
| |||||||
Total Information Technology | 18,264,100 | |||||||
|
| |||||||
Materials - 1.9% | ||||||||
Chemicals - 1.9% | ||||||||
Sociedad Quimica y Minera de Chile S.A. - ADR (Chile) | 89,010 | 1,692,080 | ||||||
|
| |||||||
The accompanying notes are an integral part of the financial statements.
7
Emerging Markets Series
Investment Portfolio - December 31, 2015
| VALUE | ||||||||
| SHARES | (NOTE 2) | |||||||
COMMON STOCKS (continued) | ||||||||
Telecommunication Services - 7.9% | ||||||||
Wireless Telecommunication Services - 7.9% | ||||||||
America Movil S.A.B. de C.V. - Class L - ADR (Mexico) | 184,820 | $ | 2,598,569 | |||||
Bharti Infratel Ltd. (India)1 | 390,390 | 2,518,760 | ||||||
China Mobile Ltd. - Class H (China)1 | 160,430 | 1,805,817 | ||||||
Telesites S.A.B. de C.V. (Mexico)* | 184,820 | 120,536 | ||||||
|
| |||||||
Total Telecommunication Services | 7,043,682 | |||||||
|
| |||||||
TOTAL COMMON STOCKS | ||||||||
(Identified Cost $93,518,189) | 84,149,975 | |||||||
|
| |||||||
MUTUAL FUND - 2.0% | ||||||||
iShares MSCI India ETF | ||||||||
(Identified Cost $1,785,881) | 64,780 | 1,784,041 | ||||||
|
| |||||||
SHORT-TERM INVESTMENT - 4.3% | ||||||||
Dreyfus Cash Management, Inc. - Institutional Shares2 , 0.23%, | ||||||||
(Identified Cost $3,794,965) | 3,794,965 | 3,794,965 | ||||||
|
| |||||||
TOTAL INVESTMENTS - 101.2% | ||||||||
(Identified Cost $99,099,035) | 89,728,981 | |||||||
LIABILITIES, LESS OTHER ASSETS - (1.2%) | (1,021,186 | ) | ||||||
|
| |||||||
NET ASSETS - 100% | $ | 88,707,795 | ||||||
|
| |||||||
ADR - American Depositary Receipt
*Non-income producing security.
1A factor from a third party vendor was applied to determine the security’s fair value following the close of local trading.
2Rate shown is the current yield as of December 31, 2015.
The Series’ portfolio holds, as a percentage of net assets, greater than 10% in the following countries:
China - 21.0%; Brazil - 14.3%; India - 12.7%; Taiwan - 12.0%.
The Global Industry Classification Standard (GICS) was developed by and is the exclusive property and a service mark of MSCI Inc. (MSCI) and Standard & Poor’s, a division of The McGraw-Hill Companies, Inc. (S&P), and is licensed for use by Manning & Napier when referencing GICS sectors. Neither MSCI, S&P, nor any third party involved in making or compiling the GICS or any GICS classifications makes any express or implied warranties or representations with respect to such standard or classification, nor shall any such party have any liability therefrom.
The accompanying notes are an integral part of the financial statements.
8
Emerging Markets Series
Statement of Assets & Liabilities
December 31, 2015
| ASSETS: | ||||
Investments, at value (identified cost $99,099,035) (Note 2) | $ | 89,728,981 | ||
Dividends receivable | 106,373 | |||
Receivable for fund shares sold | 77,271 | |||
Prepaid expenses | 93 | |||
|
| |||
TOTAL ASSETS | 89,912,718 | |||
|
| |||
LIABILITIES: | ||||
Due to Custodian | 415 | |||
Accrued management fees (Note 3) | 41,039 | |||
Accrued shareholder services fees (Class S) (Note 3) | 17,575 | |||
Accrued fund accounting and administration fees (Note 3) | 12,938 | |||
Accrued transfer agent fees (Note 3) | 6,888 | |||
Accrued Chief Compliance Officer service fees (Note 3) | 429 | |||
Accrued foreign capital gains tax (Note 2) | 76,321 | |||
Payable for securities purchased | 916,983 | |||
Payable for fund shares repurchased | 57,683 | |||
Other payables and accrued expenses | 74,652 | |||
|
| |||
TOTAL LIABILITIES | 1,204,923 | |||
|
| |||
TOTAL NET ASSETS | $ | 88,707,795 | ||
|
| |||
NET ASSETS CONSIST OF: | ||||
Capital stock | $ | 107,401 | ||
Additional paid-in-capital | 112,068,767 | |||
Undistributed net investment income | 178,252 | |||
Accumulated net realized loss on investments, foreign currency and translation of other assets and liabilities | (14,199,829 | ) | ||
Net unrealized depreciation on investments (net of foreign capital gains tax of $76,321), foreign currency and translation of other assets and liabilities | (9,446,796 | ) | ||
|
| |||
TOTAL NET ASSETS | $ | 88,707,795 | ||
|
| |||
NET ASSET VALUE, OFFERING PRICE AND REDEMPTION PRICE PER SHARE - Class S ($82,689,322/ 10,012,667 shares) | $ | 8.26 | ||
|
| |||
NET ASSET VALUE, OFFERING PRICE AND REDEMPTION PRICE PER SHARE - Class I ($6,018,473/ 727,426 shares) | $ | 8.27 | ||
|
| |||
The accompanying notes are an integral part of the financial statements.
9
Emerging Markets Series
Statement of Operations
For the Year Ended December 31, 2015
INVESTMENT INCOME: | ||||
Dividends (net of foreign taxes withheld, $187,436) | $ | 1,581,330 | ||
|
| |||
EXPENSES: | ||||
Management fees (Note 3) | 702,555 | |||
Shareholder services fees (Class S)(Note 3) | 220,889 | |||
Fund accounting and administration fees (Note 3) | 50,886 | |||
Transfer agent fees (Note 3) | 19,640 | |||
Directors’ fees (Note 3) | 3,918 | |||
Chief Compliance Officer service fees (Note 3) | 2,541 | |||
Custodian fees | 98,844 | |||
Audit fees | 64,157 | |||
Miscellaneous | 66,391 | |||
|
| |||
Total Expenses | 1,229,821 | |||
Less reduction of expenses (Note 3) | (105,647 | ) | ||
|
| |||
Net Expenses | 1,124,174 | |||
|
| |||
NET INVESTMENT INCOME | 457,156 | |||
|
| |||
REALIZED AND UNREALIZED GAIN (LOSS) ON INVESTMENTS AND FOREIGN CURRENCY: | ||||
Net realized loss on- | (14,164,997 | ) | ||
Foreign currency and translation of other assets and liabilities | (182,227 | ) | ||
|
| |||
| (14,347,224 | ) | |||
|
| |||
Net change in unrealized appreciation (depreciation) on- | 2,929,464 | |||
Foreign currency and translation of other assets and liabilities | (223 | ) | ||
|
| |||
| 2,929,241 | ||||
|
| |||
NET REALIZED AND UNREALIZED GAIN (LOSS) ON INVESTMENTS AND FOREIGN CURRENCY | (11,417,983 | ) | ||
|
| |||
NET DECREASE IN NET ASSETS RESULTING FROM OPERATIONS | $ | (10,960,827 | ) | |
|
| |||
The accompanying notes are an integral part of the financial statements.
10
Emerging Markets Series
Statements of Changes in Net Assets
FOR THE YEAR ENDED | FOR THE YEAR ENDED | |||||||
INCREASE (DECREASE) IN NET ASSETS: | ||||||||
OPERATIONS: | ||||||||
Net investment income | $ | 457,156 | $ | 3,019,367 | ||||
Net realized gain (loss) on investments and foreign currency | (14,347,224 | ) | 4,130,363 | |||||
Net change in unrealized appreciation (depreciation) on investments and foreign currency | 2,929,241 | (22,080,769 | ) | |||||
|
|
|
| |||||
Net decrease from operations | (10,960,827 | ) | (14,931,039 | ) | ||||
|
|
|
| |||||
DISTRIBUTIONS TO SHAREHOLDERS (Note 8): | ||||||||
From net investment income (Class S) | — | (2,682,683 | ) | |||||
From net investment income (Class I) | — | (550,665 | ) | |||||
From net realized gain on investments (Class S) | (363,326 | ) | (4,420,831 | ) | ||||
From net realized gain on investments (Class I) | (34,060 | ) | (784,320 | ) | ||||
|
|
|
| |||||
Total distributions to shareholders | (397,386 | ) | (8,438,499 | ) | ||||
|
|
|
| |||||
CAPITAL STOCK ISSUED AND REPURCHASED: | ||||||||
Net increase (decrease) from capital share transactions (Note 5) | (8,085,153 | ) | 25,548,419 | |||||
|
|
|
| |||||
Net increase (decrease) in net assets | (19,443,366 | ) | 2,178,881 | |||||
NET ASSETS: | ||||||||
Beginning of year | 108,151,161 | 105,972,280 | ||||||
|
|
|
| |||||
End of year (including undistributed net investment income of $178,252 and distributions in excess of net investment income of $95,978, respectively) | $ | 88,707,795 | $ | 108,151,161 | ||||
|
|
|
| |||||
The accompanying notes are an integral part of the financial statements.
11
Emerging Markets Series
Financial Highlights - Class S*
| FOR THE YEARS ENDED | FOR THE PERIOD 12/31/11 | |||||||||||||||||||
| 12/31/15 | 12/31/14 | 12/31/13 | 12/31/12 | |||||||||||||||||
Per share data (for a share outstanding throughout each period): | ||||||||||||||||||||
Net asset value - Beginning of period | $ | 9.24 | $ | 11.40 | $ | 11.64 | $ | 9.85 | $ | 10.00 | ||||||||||
|
|
|
|
|
|
|
|
|
| |||||||||||
|
| |||||||||||||||||||
Income (loss) from investment operations: | ||||||||||||||||||||
Net investment income2 | 0.04 | 0.28 | 3 | 0.06 | 0.04 | 0.01 | ||||||||||||||
Net realized and unrealized gain (loss) on investments | (0.98 | ) | (1.67 | ) | 0.95 | 2.20 | (0.15 | ) | ||||||||||||
|
|
|
|
|
|
|
|
|
| |||||||||||
Total from investment operations | (0.94 | ) | (1.39 | ) | 1.01 | 2.24 | (0.14 | ) | ||||||||||||
|
|
|
|
|
|
|
|
|
| |||||||||||
Less distributions to shareholders: | ||||||||||||||||||||
From net investment income | — | (0.29 | ) | (0.02 | ) | (0.03 | ) | (0.01 | ) | |||||||||||
From net realized gain on investments | (0.04 | ) | (0.48 | ) | (1.23 | ) | (0.42 | ) | — | |||||||||||
|
|
|
|
|
|
|
|
|
| |||||||||||
Total distributions to shareholders | (0.04 | ) | (0.77 | ) | (1.25 | ) | (0.45 | ) | (0.01 | ) | ||||||||||
|
|
|
|
|
|
|
|
|
| |||||||||||
Net asset value - End of period | $ | 8.26 | $ | 9.24 | $ | 11.40 | $ | 11.64 | $ | 9.85 | ||||||||||
|
|
|
|
|
|
|
|
|
| |||||||||||
Net assets - End of period (000’s omitted) | $ | 82,689 | $ | 91,178 | $ | 104,884 | $ | 95,253 | $ | 78,114 | ||||||||||
|
|
|
|
|
|
|
|
|
| |||||||||||
Total return4 | (10.18 | %) | (12.24 | %) | 8.91 | % | 22.77 | % | (1.37 | %) | ||||||||||
Ratios (to average net assets)/Supplemental Data: | ||||||||||||||||||||
Expenses** | 1.15 | % | 1.15 | % | 1.20 | % | 1.20 | % | 1.20 | %5 | ||||||||||
Net investment income | 0.46 | % | 2.54 | %3 | 0.54 | % | 0.39 | % | 0.86 | %5 | ||||||||||
Portfolio turnover | 61 | % | 26 | % | 44 | % | 40 | % | 0 | % | ||||||||||
| *Effective December 18, 2013, the shares of the Series have been designated as Class S. | ||||||||||||||||||||
**The investment advisor did not impose all or a portion of its management and/or other fees, and in some periods may have paid a portion of the Series’ expenses. If these expenses had been incurred by the Series, the expense ratio (to average net assets) would have increased by the following amounts:
|
| |||||||||||||||||||
| 0.11 | % | 0.11 | % | 0.09 | % | N/A | N/A | |||||||||||||
1Commencement of operations.
2Calculated based on average shares outstanding during the periods.
3Reflects a special dividend paid out during the period by one of the Series’ holdings. Had the Series not received the special dividend, the net investment income per share would have been $0.05 and the net investment income ratio would have been 0.48%.
4Represents aggregate total return for the periods indicated, and assumes reinvestment of all distributions. Total return would have been lower had certain expenses not been waived or reimbursed during certain periods. Periods less than one year are not annualized.
5Annualized.
The accompanying notes are an integral part of the financial statements.
12
Emerging Markets Series
Financial Highlights - Class I
| FOR THE YEAR ENDED | FOR THE PERIOD 12/18/131 TO 12/31/13 | |||||||||||
| 12/31/15 | 12/31/14 | |||||||||||
Per share data (for a share outstanding throughout each period): | ||||||||||||
Net asset value - Beginning of period | $ | 9.24 | $ | 11.40 | $ | 11.18 | ||||||
|
|
|
|
|
| |||||||
Income (loss) from investment operations: | ||||||||||||
Net investment income2 | 0.04 | 0.43 | 3 | 0.01 | ||||||||
Net realized and unrealized gain (loss) on investments | (0.97 | ) | (1.79 | ) | 0.21 | |||||||
|
|
|
|
|
| |||||||
Total from investment operations | (0.93 | ) | (1.36 | ) | 0.22 | |||||||
|
|
|
|
|
| |||||||
Less distributions to shareholders: | ||||||||||||
From net investment income | — | (0.32 | ) | — | ||||||||
From net realized gain on investments | (0.04 | ) | (0.48 | ) | — | |||||||
|
|
|
|
|
| |||||||
Total distributions to shareholders | (0.04 | ) | (0.80 | ) | — | |||||||
|
|
|
|
|
| |||||||
Net asset value - End of period | $ | 8.27 | $ | 9.24 | $ | 11.40 | ||||||
|
|
|
|
|
| |||||||
Net assets - End of period (000’s omitted) | $ | 6,018 | $ | 16,973 | $ | 1,088 | ||||||
|
|
|
|
|
| |||||||
Total return4 | (10.07 | %) | (11.98 | %) | 1.97 | % | ||||||
Ratios (to average net assets)/Supplemental Data: | ||||||||||||
Expenses* | 0.90 | % | 0.90 | % | 1.89 | %5 | ||||||
Net investment income | 0.44 | % | 3.93 | %3 | 4.91 | %5,6 | ||||||
Portfolio turnover | 61 | % | 26 | % | 44 | % | ||||||
*The investment advisor did not impose all or a portion of its management and/or other fees, and in some periods may have paid a portion of the Series’ expenses. If these expenses had been incurred by the Series, the expense ratio (to average net assets) would have increased by the following amounts:
|
| |||||||||||
| 0.10 | % | 0.14 | % | N/A | ||||||||
1Commencement of operations.
2Calculated based on average shares outstanding during the periods.
3Reflects a special dividend paid out during the period by one of the Series’ holdings. Had the Series not received the special dividend, the net investment income per share would have been $0.08 and the net investment income ratio would have been 0.72%.
4Represents aggregate total return for the periods indicated, and assumes reinvestment of all distributions. Total return would have been lower had certain expenses not been waived during certain periods. Periods less than one year are not annualized.
5Annualized.
6The annualized net investment income ratio may not be indicative of operating results for a full year.
The accompanying notes are an integral part of the financial statements.
13
Emerging Markets Series
Notes to Financial Statements
| 1. | Organization |
Emerging Markets Series (the “Series”) is a no-load diversified series of Manning & Napier Fund, Inc. (the “Fund”). The Fund is organized in Maryland and is registered under the Investment Company Act of 1940, as amended, as an open-end management investment company.
The Series’ investment objective is to provide long-term growth.
The Fund’s advisor is Manning & Napier Advisors, LLC (the “Advisor”). Shares of the Series are offered to investors, clients and employees of the Advisor and its affiliates. The Series is authorized to issue two classes of shares (Class S and Class I). Each class of shares is substantially the same, except that Class S shares bear shareholder services fees. The total authorized capital stock of the Fund consists of 15 billion shares of common stock each having a par value of $0.01. As of December 31, 2015, 10.7 billion shares have been designated in total among 41 series, of which 100 million have been designated as Emerging Markets Series Class S common stock, and 100 million have been designated as Emerging Markets Series Class I common stock.
| 2. | Significant Accounting Policies |
The following is a summary of significant accounting policies followed by the Series. The Series is an investment company and, accordingly, follows the investment company accounting and reporting guidance of the Financial Accounting Standards Board Accounting Standards Codification Topic 946 - Investment Companies, which is part of accounting principles generally accepted in the United States of America (“GAAP”).
Security Valuation
Portfolio securities, including domestic equities, foreign equities, warrants and options, listed on an exchange other than the NASDAQ Stock Market are valued at the latest quoted sales price of the exchange on which the security is primarily traded. Securities not traded on valuation date or securities not listed on an exchange are valued at the latest quoted bid price provided by the Fund’s pricing service. Securities listed on the NASDAQ Stock Market are valued in accordance with the NASDAQ Official Closing Price.
Short-term investments that mature in sixty days or less may be valued at amortized cost, which approximates fair value. Investments in open-end investment companies are valued at their net asset value per share on valuation date.
Volume and level of activity in established markets for an asset or liability are evaluated to determine whether recent transactions and quoted prices are determinative of fair value. Where there have been significant decreases in volume and level of activity, further analysis and adjustment may be necessary to estimate fair value. The Series measures fair value in these instances by the use of inputs and valuation techniques which may be based upon current market prices of securities that are comparable in coupon, rating, maturity and industry and/or expectation of future cash flows. As a result of trading in relatively thin markets and/or markets that experience significant volatility, the prices used by the Series to value these securities may differ from the value that would be realized if these securities were sold, and the differences could be material.
Securities for which representative valuations or prices are not available from the Series’ pricing service may be valued at fair value as determined in good faith by the Advisor under procedures approved by and under the general supervision and responsibility of the Fund’s Board of Directors (the “Board”). Due to the inherent uncertainty of valuations of such securities, the fair value may differ significantly from the values that would have been used had a ready market for such securities existed. If trading or events occurring after the close of the principal market in which securities are traded are expected to materially affect the value of those securities, then they may be valued at their fair value, taking this trading or these events into account. In accordance with the procedures approved by the Board, the values of certain securities trading outside the U.S. were adjusted following the close of local trading using a factor from a third party vendor. The third party vendor uses statistical analyses and quantitative models, which consider among other things subsequent movement and changes in the prices of indices, securities and exchange rates in other markets, to determine the factors which are used to adjust local market prices. The value of
14
Emerging Markets Series
Notes to Financial Statements (continued)
| 2. | Significant Accounting Policies (continued) |
Security Valuation (continued)
securities used for net asset value calculation under these procedures may differ from published prices for the same securities. It is the Fund’s policy to classify each foreign equity security where a factor from a third party vendor is provided as a Level 2 security.
Various inputs are used in determining the value of the Series’ assets or liabilities carried at fair value. These inputs are summarized in three broad levels. Level 1 includes quoted prices in active markets for identical assets and liabilities. Level 2 includes other significant observable inputs (including quoted prices for similar securities, interest rates, prepayment speeds, credit risk, etc.). Level 3 includes significant unobservable inputs (including the Series’ own assumptions in determining the fair value of investments). A financial instrument’s level within the fair value hierarchy is based on the lowest level of any input both individually and in aggregate that is significant to the fair value measurement. The inputs or methodology used for valuing securities are not necessarily an indication of the risk associated with investing in those securities.
The following is a summary of the valuation levels used for major security types as of December 31, 2015 in valuing the Series’ assets or liabilities carried at fair value:
| DESCRIPTION | TOTAL | LEVEL 1 | LEVEL 2 | LEVEL 3 | ||||||||||||
Assets: | ||||||||||||||||
Equity securities: | ||||||||||||||||
Consumer Discretionary | $ | 7,876,520 | $ | 2,946,140 | $ | 4,930,380 | $ | — | ||||||||
Consumer Staples | 14,201,487 | 9,555,964 | 4,645,523 | — | ||||||||||||
Energy | 1,746,690 | 1,746,690 | — | — | ||||||||||||
Financials | 4,950,647 | 1,264,154 | 3,686,493 | — | ||||||||||||
Health Care | 25,156,774 | 1,783,242 | 23,373,532 | — | ||||||||||||
Industrials | 3,217,995 | 1,072,049 | 2,145,946 | — | ||||||||||||
Information Technology | 18,264,100 | 8,010,848 | 10,253,252 | — | ||||||||||||
Materials | 1,692,080 | 1,692,080 | — | — | ||||||||||||
Telecommunication Services | 7,043,682 | 2,719,105 | 4,324,577 | — | ||||||||||||
Mutual funds | 5,579,006 | 5,579,006 | — | — | ||||||||||||
|
|
|
|
|
|
|
| |||||||||
Total assets | $ | 89,728,981 | $ | 36,369,278 | $ | 53,359,703 | $ | — | ||||||||
|
|
|
|
|
|
|
| |||||||||
Please see the Investment Portfolio for foreign securities where a factor from a third party vendor was applied to determine the securities’ fair value following the close of local trading. Such securities are included in Level 2 in the table above.
There were no Level 3 securities held by the Series as of December 31, 2014 or December 31, 2015.
The Fund’s policy is to recognize transfers in and transfers out of the valuation levels as of the beginning of the reporting period. There were no transfers between Level 1 and Level 2 during the year ended December 31, 2015.
Security Transactions, Investment Income and Expenses
Security transactions are accounted for on trade date. Dividend income is recorded on the ex-dividend date, except that if the ex-dividend date has passed, certain dividends from foreign securities are recorded as soon as the Series is informed of the ex-dividend date. Non-cash dividends, if any, are recorded at the fair value of the securities received. Interest income, including amortization of premium and accretion of discounts using the effective interest method, is earned from settlement date and accrued daily.
Expenses are recorded on an accrual basis. Most expenses of the Fund can be attributed to a specific series. Expenses which cannot be directly attributed are apportioned among the series in the Fund in such a manner as deemed equitable by the Fund’s Board, taking into consideration, among other things, the nature and type of expense. Income, expenses (other than shareholder services fees), and realized and unrealized gains and losses are prorated among the classes based on the relative net assets of each class. Class specific expenses are directly charged to that class.
15
Emerging Markets Series
Notes to Financial Statements (continued)
| 2. | Significant Accounting Policies (continued) |
Security Transactions, Investment Income and Expenses (continued)
The Series uses the identified cost method for determining realized gain or loss on investments for both financial statement and federal income tax reporting purposes.
Foreign Currency Translation
The books and records of the Series are maintained in U.S. dollars. Foreign currencies, investments and other assets and liabilities are translated into U.S. dollars at the current exchange rates. Purchases and sales of investment securities and income and expenses are translated on the respective dates of such transactions. The Series does not isolate realized and unrealized gains and losses attributable to changes in the exchange rates from gains and losses that arise from changes in the fair value of investments. Such fluctuations are included with net realized and unrealized gain or loss on investments. Net realized foreign currency gains and losses represent foreign currency gains and losses between trade date and settlement date on securities transactions, gains and losses on disposition of foreign currencies and the difference between the amount of income and foreign withholding taxes recorded on the books of the Series and the amounts actually received or paid.
Forward Foreign Currency Exchange Contracts
The Series may purchase or sell forward foreign currency exchange contracts in order to hedge a portfolio position or specific transaction. Risks may arise if the counterparties to a contract are unable to meet the terms of the contract or if the value of the foreign currency moves unfavorably.
All forward foreign currency exchange contracts are adjusted daily by the exchange rate of the underlying currency and, for financial statement purposes, any gain or loss is recorded as unrealized gain or loss until a contract has been closed.
The Series may regularly trade forward foreign currency exchange contracts with off-balance sheet risk in the normal course of its investing activities to assist in managing exposure to changes in foreign currency exchange rates.
The notional or contractual amount of these instruments represents the investment the Series has in forward foreign currency exchange contracts and does not necessarily represent the amounts potentially at risk. The measurement of the risks associated with forward foreign currency exchange contracts is meaningful only when all related and offsetting transactions are considered. As of December 31, 2015, no investments in forward foreign currency exchange contracts were held by the Series.
Federal Taxes
The Series’ policy is to comply with the provisions of the Internal Revenue Code applicable to regulated investment companies. The Series is not subject to federal income tax or excise tax to the extent that the Series distributes to shareholders each year its taxable income, including any net realized gains on investments, in accordance with requirements of the Internal Revenue Code. Accordingly, no provision for federal income tax or excise tax has been made in the financial statements.
Management evaluates its tax positions to determine if the tax positions taken meet the minimum recognition threshold in connection with accounting for uncertainties in income tax positions taken or expected to be taken for the purposes of measuring and recognizing tax liabilities in the financial statements. Recognition of tax benefits of an uncertain tax position is required only when the position is “more likely than not” to be sustained assuming examination by taxing authorities. At December 31, 2015, the Series has recorded no liability for net unrecognized tax benefits relating to uncertain income tax positions taken or expected to be taken in future tax returns.
The Series files income tax returns in the U.S. federal jurisdiction, various states and foreign jurisdictions, as required. No income tax returns are currently under investigation. The statute of limitations on the Series’ tax returns remains open for the years ended December 31, 2012 through December 31, 2015. The Series is not aware of any tax positions for which it is reasonably possible that the total amounts of unrecognized tax benefits will significantly change in the next twelve months.
Foreign Taxes
Based on the Series’ understanding of the tax rules and rates related to income, gains and currency purchase/repatriation transactions for foreign jurisdictions in which it invests, the Series will provide for foreign taxes, and where appropriate, deferred
16
Emerging Markets Series
Notes to Financial Statements (continued)
| 2. | Significant Accounting Policies (continued) |
Foreign Taxes (continued)
foreign tax. The Series is subject to a tax imposed on short term capital gains on securities of issuers domiciled in India. The Series records an estimated deferred tax liability for securities that have been held for less than a year at the end of the reporting period, assuming those positions were disposed of at the end of the period. This amount is reported in Accrued foreign capital gains tax in the accompanying Statement of Assets and Liabilities. Realized losses on the sale of securities of issuers domiciled in India can be carried forward for eight years to offset potential future short term realized capital gains.
Distributions of Income and Gains
Distributions to shareholders of net investment income and net realized gains are made annually. An additional distribution may be necessary to avoid taxation of the Series. Distributions are recorded on the ex-dividend date.
Indemnifications
The Fund’s organizational documents provide former and current directors and officers with a limited indemnification against liabilities arising in connection with the performance of their duties to the Fund. In the normal course of business, the Fund may also enter into contracts that provide general indemnifications. The Fund’s maximum exposure under these arrangements is unknown as this would be dependent on future claims that may be made against the Fund. The risk of material loss from such claims is considered remote.
Other
The preparation of financial statements in conformity with GAAP requires management to make estimates and assumptions that affect the reported amounts of assets and liabilities and the disclosure of contingent assets and liabilities at the date of the financial statements and the reported amounts of income and expenses during the reporting period. Actual results could differ from those estimates.
| 3. | Transactions with Affiliates |
The Fund has an Investment Advisory Agreement (the “Agreement”) with the Advisor for which the Series pays a fee, computed daily and payable monthly, at an annual rate of 0.70% of the Series’ average daily net assets.
Under the Agreement, personnel of the Advisor provide the Series with advice and assistance in the choice of investments and the execution of securities transactions, and otherwise maintain the Series’ organization. The Advisor also provides the Fund with necessary office space and fund administration and support services. The salaries of all officers of the Fund (except a percentage of the Fund’s Chief Compliance Officer’s salary, which is paid by the Fund), and of all Directors who are “affiliated persons” of the Fund, or of the Advisor, and all personnel of the Fund, or of the Advisor, performing services relating to research, statistical and investment activities, are paid by the Advisor. Each “non-affiliated” Director receives an annual stipend, which is allocated among all the active series of the Fund. In addition, these Directors also receive a fee per Board meeting attended plus a fee for each committee meeting attended and are reimbursed for travel and other out-of-pocket expenses incurred by them in connection with attending such meetings. The Fund also has an Audit Committee Chair, who receives an additional annual stipend for this role.
The Class S shares of the Series are subject to a shareholder services fee in accordance with a shareholder services plan adopted by the Fund’s Board. The shareholder services fee is intended to compensate financial intermediaries, including affiliates of the Fund, in connection with the provision of direct client service, personal services, maintenance of shareholder accounts and reporting services. For these services, Class S of the Series pays a fee, computed daily and payable monthly, at an annual rate of 0.25% of the average daily net assets of Class S. The Fund has a Shareholder Services Agreement with the Advisor, for which the Advisor receives the shareholder services fee as stated above.
The Advisor has contractually agreed, until at least April 30, 2016, to waive its fee and, if necessary, pay other operating expenses of the Series in order to maintain total direct annual fund operating expenses for the Series, exclusive of each share class’ shareholder services fee, at no more than 0.90% of average daily net assets each year. Accordingly, the Advisor waived fees of $105,647 for the year ended December 31, 2015, which is included as a reduction of expenses on the statement of operations. The Advisor is not eligible to recoup any expenses that have been waived or reimbursed.
17
Emerging Markets Series
Notes to Financial Statements (continued)
| 3. | Transactions with Affiliates (continued) |
Manning & Napier Investor Services, Inc., a registered broker-dealer affiliate of the Advisor, acts as distributor for the Fund’s shares. The services of Manning & Napier Investor Services, Inc. are provided at no additional cost to the Series.
Pursuant to a master services agreement dated November 1, 2014, the Fund pays the Advisor an annual fee related to fund accounting and administration of 0.0085% on the first $25 billion of average daily net assets (excluding Target Series and Strategic Income Series); 0.0075% on the next $15 billion of average daily net assets (excluding Target Series and Strategic Income Series); and 0.0065% of the average daily net assets in excess of $40 billion (excluding Target Series and Strategic Income Series); plus a base fee of $30,400 per series. Transfer agent fees are charged to the Fund on a per account basis. Additionally, certain transaction and out-of-pocket expenses, including charges for reporting relating to the Fund’s compliance program, are charged. The Advisor has agreements with BNY Mellon Investment Servicing (U.S.) Inc. (“BNY”) under which BNY serves as sub-accountant services agent and sub-transfer agent.
Expenses not directly attributable to a series are allocated based on each series’ relative net assets or number of accounts, depending on the expense.
| 4. | Purchases and Sales of Securities |
For the year ended December 31, 2015, purchases and sales of securities, other than U.S. Government securities and short-term securities, were $57,623,710 and $64,129,984, respectively. There were no purchases or sales of U.S. Government securities.
| 5. | Capital Stock Transactions |
Transactions in shares of Class S and Class I of Emerging Markets Series were:
| CLASS S: | FOR THE YEAR ENDED 12/31/15 | FOR THE YEAR ENDED 12/31/14 | ||||||||||||||
| SHARES | AMOUNT | SHARES | AMOUNT | |||||||||||||
Sold | 1,504,854 | $ | 13,012,457 | 1,309,793 | $ | 14,270,807 | ||||||||||
Reinvested | 47,302 | 358,638 | 738,209 | 6,947,173 | ||||||||||||
Repurchased | (1,405,668 | ) | (11,918,951 | ) | (1,379,719 | ) | (15,094,248 | ) | ||||||||
|
|
|
|
|
|
|
| |||||||||
Total | 146,488 | $ | 1,452,144 | 668,283 | $ | 6,123,732 | ||||||||||
|
|
|
|
|
|
|
| |||||||||
| CLASS I: | FOR THE YEAR ENDED 12/31/15 | FOR THE YEAR ENDED 12/31/14 | ||||||||||||||
| SHARES | AMOUNT | SHARES | AMOUNT | |||||||||||||
Sold | 841,435 | $ | 7,078,222 | 1,672,858 | $ | 18,862,196 | ||||||||||
Reinvested | 3,319 | 25,225 | 124,690 | 1,163,812 | ||||||||||||
Repurchased | (1,954,570 | ) | (16,640,744 | ) | (55,732 | ) | (601,321 | ) | ||||||||
|
|
|
|
|
|
|
| |||||||||
Total | (1,109,816 | ) | $ | (9,537,297 | ) | 1,741,816 | $ | 19,424,687 | ||||||||
|
|
|
|
|
|
|
| |||||||||
Over 90% of the shares outstanding are held by fiduciary accounts where the Advisor has sole investment discretion.
| 6. | Financial Instruments |
The Series may trade in instruments including written and purchased options, forward foreign currency exchange contracts and futures contracts and other derivatives in the normal course of investing activities to assist in managing exposure to various market risks. The Series may be subject to various elements of risk, which may involve, to a varying degree, elements of risk in excess of the amounts recognized for financial statement purposes. These risks include: the risk that changes in the value of a derivative may not correlate perfectly with the underlying asset, rate or index; counterparty credit risk related to over the counter derivative counterparties’ failure to perform under contract terms; liquidity risk related to the lack of a liquid market for these contracts allowing the fund to close out its position(s); and documentation risk relating to disagreement over contract terms. No such investments were held by the Series as of December 31, 2015.
18
Emerging Markets Series
Notes to Financial Statements (continued)
| 7. | Foreign Securities |
Investing in securities of foreign companies and foreign governments involves special risks and considerations not typically associated with investing in securities of domestic companies and the U.S. Government. These risks include revaluation of currencies and future adverse political and economic developments. Moreover, securities of foreign companies and foreign governments and their markets may be less liquid and their prices more volatile than those of comparable domestic companies and the U.S. Government.
| 8. | Federal Income Tax Information |
The amount and characterization of certain income and capital gains to be distributed are determined in accordance with federal income tax regulations, which may differ from GAAP. These differences are primarily due to differing book and tax treatments in the timing and/or treatment of the recognition of net investment income or gain and losses, including foreign currency gains and losses, qualified late-year losses. The Series may periodically make reclassifications among its capital accounts to reflect income and gains available for distribution (or available capital loss carryovers) under income tax regulations without impacting the Series’ net asset value. For the fiscal year ended December 31, 2015, $182,926 was reclassified within the capital accounts to Accumulated Net Realized Loss on Investments from Undistributed Net Investment Income. Any such reclassifications are not reflected in the financial highlights.
The tax character of distributions paid were as follows:
| FOR THE YEAR ENDED 12/31/15 | FOR THE YEAR ENDED 12/31/14 | |||||||
Ordinary income | $ | 699 | $ | 5,643,207 | ||||
Long-term capital gains | 396,687 | 2,795,292 | ||||||
At December 31, 2015, the tax basis of components of distributable earnings and the net unrealized depreciation based on the identified cost for federal income tax purposes were as follows:
Cost for federal income tax purposes | $ | 99,099,035 | ||
Unrealized appreciation | 7,541,626 | |||
Unrealized depreciation | (16,911,680 | ) | ||
|
| |||
Net unrealized depreciation | $ | (9,370,054 | ) | |
|
| |||
Undistributed ordinary income | $ | 178,252 | ||
Capital loss carryforward | $ | (14,199,829 | ) |
At December 31, 2015, the Series had net short-term capital loss carryforwards of $5,019,864 and net long-term capital loss carryforwards of $9,179,965, which may be carried forward indefinitely.
19
Emerging Markets Series
Report of Independent Registered Public Accounting Firm
To the Board of Directors of Manning & Napier Fund, Inc. and Shareholders of Emerging Markets Series:
In our opinion, the accompanying statement of assets and liabilities, including the investment portfolio, and the related statements of operations and of changes in net assets and the financial highlights present fairly, in all material respects, the financial position of Emerging Markets Series (a series of Manning & Napier Fund, Inc., hereafter referred to as the “Series”) at December 31, 2015, the results of its operations for the year then ended, the changes in its net assets for each of the two years in the period then ended and the financial highlights for each of the periods presented, in conformity with accounting principles generally accepted in the United States of America. These financial statements and financial highlights (hereafter referred to as “financial statements”) are the responsibility of the Series’ management. Our responsibility is to express an opinion on these financial statements based on our audits. We conducted our audits of these financial statements in accordance with the standards of the Public Company Accounting Oversight Board (United States). Those standards require that we plan and perform the audit to obtain reasonable assurance about whether the financial statements are free of material misstatement. An audit includes examining, on a test basis, evidence supporting the amounts and disclosures in the financial statements, assessing the accounting principles used and significant estimates made by management, and evaluating the overall financial statement presentation. We believe that our audits, which included confirmation of securities at December 31, 2015 by correspondence with the custodian and brokers, provide a reasonable basis for our opinion.

New York, New York
February 19, 2016
20
Emerging Markets Series
Supplemental Tax Information
(unaudited)
All reportings are based on financial information available as of the date of this annual report and, accordingly are subject to change.
For federal income tax purposes, the Series reports for the current fiscal year $817,876 or, if different, the maximum amount allowable under the tax law as qualified dividend income.
21
Emerging Markets Series
Renewal of Investment Advisory Agreement
(unaudited)
At the Manning & Napier Fund, Inc. (the “Fund”) Board of Directors’ (the “Board”) meeting, held on November 17, 2015, the Investment Advisory Agreement (the “Agreement”) between the Fund and Manning & Napier Advisors, LLC (the “Advisor”) was considered by the Board for renewal. In connection with the decision whether to renew the Agreement, a variety of material was prepared for and considered by the Board.
Representatives of the Advisor attended the meeting and presented additional oral and written information to the Board to assist the Board in its considerations. The discussion immediately below outlines the materials and information presented to the Board in connection with the Board’s 2015 Annual consideration of the Agreement and the conclusions made by the Directors when determining to continue the Agreement.
| • | The Board considered the services provided by the Advisor under the Agreement including, among others: deciding what securities to purchase and sell for each Series; arranging for the purchase and sale of such securities by placing orders with broker-dealers; administering the affairs of the Fund (including the books and records of the Fund not maintained by third party service providers such as the custodian or sub-transfer agent); arranging for the insurance coverage for the Fund; and supervising the preparation of tax returns, SEC filings (including registration statements) and reports to shareholders for the Fund. The Board also considered the nature and quality of such services provided under the Agreement in light of the Advisor’s services provided to the Fund for 29 years. The Board discussed the quality of these services with representatives from the Advisor and concluded that the Advisor was performing its services to the Fund required under the Agreement in a reasonable manner. |
| • | The Board considered the performance of each Series since its inception, as well as performance over multiple time periods. Performance for one or more of the following time periods was considered as applicable to the Series’ inception date: inception, three year, five year, ten year, and current market cycle. A market cycle includes periods of both rising and falling markets. Returns for established benchmark indices for each Series were provided. In addition, the Board considered a number of other factors relevant to performance at the meeting (and considers on a quarterly basis) including: a peer group performance analysis consisting of Morningstar universes of mutual funds with similar investment objectives, investment performance of core products, product offerings, performance on an aggregate basis vs. performance over reasonable time periods and the Advisor’s investment process. The Directors acknowledged the challenging performance and discussed the investment process of the Advisor. The Directors confirmed that qualitative factors such as the Advisor’s investment process, including recent enhancements, were an important subset to be considered as part of their consideration of performance. The Board discussed the performance with representatives from the Advisor and concluded that the investment performance of each of the Fund’s Series was reasonable based on the Series’ actual performance and comparative performance, especially for those series with performance over the current market cycle. |
| • | The Board considered the costs of the Advisor’s services and the profits of the Advisor as they relate to the Advisor’s services to the Fund under the Agreement. In reviewing the Advisor’s costs and profits, the Board discussed the Advisor’s revenues generated from the Fund (on both an actual and adjusted basis) and its expenses associated with providing the services under the Agreement. In addition, the Board reviewed the Advisor’s expenses associated with Fund activities outside of the Agreement (such as expense reimbursements pursuant to expense caps and payments made by the Advisor to third party platforms on which shares of the Fund are available for purchase). It was noted by representatives of the Advisor that 22 of the 36 active Series of the Fund are currently experiencing expenses above the capped expense ratios, and thus the Advisor is incurring those expenses over the cap. After discussing the above costs and profits, the Board concluded that the Advisor’s profitability relating to its services provided under the Agreement was reasonable. |
| • | The Board considered the fees and expenses of the various Series of the Fund. The Advisor presented the advisory fees and total expenses for each Series, including the advisory fee adjusted for any expense waivers or reimbursements (either contractual or voluntary) paid by the Advisor. The advisory fees and expense ratios of each Series were compared to an average (on both a mean and median basis) of similar funds as disclosed on the Morningstar database. Representatives of the Advisor discussed with the Board the levels of its advisory fee for each Series of the Fund and as compared to the median and mean advisory fees for similar funds as listed on Morningstar. Expense ratios for every Series, except the Tax Managed Series, Equity Income Class S, High Yield Bond Class S, Pro-Blend Series Classes C and R, and Target Series’ Classes R and K, are lower than, or substantially similar to the Morningstar mean and median reported total expense ratio. |
22
Emerging Markets Series
Renewal of Investment Advisory Agreement
(unaudited)
The higher than mean and median total expense ratios for Classes C and R reflect higher distribution, marketing and shareholder service fees payable to broker-dealers through a 100bp 12b-1 fee for Class C and a 50bp 12b-1 fee for Class R. Based on their review of the information provided, the Board concluded that the fees and expenses of each Series of the Fund were reasonable on a comparative basis.
| • | The Board also considered the other benefits the Advisor derives from its relationship with the Fund. Such other benefits include certain research services provided by soft dollars. The Board reviewed the broker-dealers who provided research to the Advisor and the products and services paid for, in whole or in part, using soft dollar commissions. Given the level of soft dollar transactions involving the Fund, the Board concluded that these additional benefits to the Advisor were reasonable. |
| • | In addition to the factors described above, the Board considered the Advisor’s personnel, investment strategies, policies and procedures relating to compliance with personal securities transactions, reputation, expertise and resources in domestic and foreign financial markets. The Board concluded that these factors support the conclusion that the Advisor performs its services in a reasonable manner. |
| • | The Board then considered economies of scale and concluded that the current fee schedule to the advisory agreement remained reasonable given the multiple uses of the Fund (for the Advisor’s discretionary investment account clients in addition to direct investors), the current profitability of the Advisor’s services to the Fund under the Agreement, the number of newly established series of the Fund and the overall size of the Fund complex. |
Based on the Board’s deliberations and their evaluation of the information described above, the Board, including a majority of Directors that are not “interested persons” as defined in the Investment Company Act of 1940, concluded that the compensation under the Agreement was fair and reasonable in light of the services and expenses and such other matters as the Directors considered to be relevant in the exercise of their reasonable judgment. Accordingly, the Board approved the renewal of the Agreement. In the course of their deliberations, the Directors did not identify any particular information that was all important or controlling.
23
Emerging Markets Series
Directors’ and Officers’ Information
(unaudited)
The Statement of Additional Information provides additional information about the Fund’s directors and officers and can be obtained without charge by calling 1-800-466-3863, at www.manningnapieradvisors.com, or on the EDGAR Database on the SEC Internet web site (http:// www.sec.gov). The following chart shows certain information about the Fund’s officers and directors, including their principal occupations during the last five years. Unless specific dates are provided, the individuals have held the listed positions for longer than five years.
| Interested Director/Officer | ||
| Name: | James E. Mikolaichik* | |
| Address: | 290 Woodcliff Drive | |
| Fairport, NY 14450 | ||
| Age: | 44 | |
| Current Position(s) Held with Fund: | Principal Executive Officer, President, Chairman & Director | |
| Term of Office1 & Length of Time Served: | Indefinite - Chairman and Director since August 2015 | |
| Principal Occupation(s) During Past 5 Years: | Chief Financial Officer (since 2011) - Manning & Napier Advisors, LLC; Executive Vice President and Head of Strategy (2008-2011) and Chief Risk Officer (2004-2008) - Old Mutual Asset Management Holds or has held one or more of the following title for various subsidiaries and affiliates: Chief Financial Officer. | |
| Number of Portfolios Overseen within Fund Complex: | 41 | |
| Other Directorships Held Outside Fund Complex: | N/A | |
| Independent Directors | ||
| Name: | Stephen B. Ashley | |
| Address: | 290 Woodcliff Drive | |
| Fairport, NY 14450 | ||
| Age: | 75 | |
| Current Position(s) Held with Fund: | Director, Audit Committee Member, Governance & Nominating Committee Member | |
| Term of Office & Length of Time Served: | Indefinite - Since 1996 | |
| Principal Occupation(s) During Past 5 Years: | Chairman, Director, President & Chief Executive Officer (1997 to present) - The Ashley Group (property management and investment); Director (1995-2008) and Chairman (non-executive) (2004-2008) - Fannie Mae (mortgage). | |
| Number of Portfolios Overseen within Fund Complex: | 41 | |
| Other Directorships Held Outside Fund Complex: | Fannie Mae (1995-2008) | |
| The Ashley Group (1995-2008) | ||
| Genesee Corporation (1987-2007) | ||
| Name: | Paul A. Brooke | |
| Address: | 290 Woodcliff Drive | |
| Fairport, NY 14450 | ||
| Age: | 70 | |
| Current Position(s) Held with Fund: | Director, Audit Committee Member, Governance & Nominating Committee Member | |
| Term of Office & Length of Time Served: | Indefinite - Since 2007 | |
| Principal Occupation(s) During Past 5 Years: | Chairman & CEO (2005-2009) - Ithaka Acquisition Corporation (investments); Chairman (2007-2009) Alsius Corporation (investments); Managing Member, PMSV Holdings LLC (investments) since 1991; Managing Member, Venbio (investments) since 2010. | |
| Number of Portfolios Overseen within Fund Complex: | 41 | |
| Other Directorships Held Outside Fund Complex: | Incyte Corp. (2000-present) | |
| ViroPharma, Inc. (2000-2014) | ||
| HLTH Corp (WebMD) (2000-2010) | ||
| Cheyne Capital International (2000-present) | ||
| GMP Companies (2000-2011) | ||
| Cytos Biotechnology Ltd. (2012-2014) | ||
24
Emerging Markets Series
| Directors’ and Officers’ Information | ||
(unaudited)
| ||
| Independent Directors (continued) | ||
| Name: | Peter L. Faber | |
| Address: | 290 Woodcliff Drive | |
| Fairport, NY 14450 | ||
| Age: | 77 | |
| Current Position(s) Held with Fund: | Director, Governance & Nominating Committee Member | |
| Term of Office & Length of Time Served: | Indefinite - Since 1987 | |
| Principal Occupation(s) During Past 5 Years: | Senior Counsel (2006-2012), Partner (1995-2006 & 2013-present) - McDermott, Will & Emery LLP (law firm) | |
| Number of Portfolios Overseen within Fund Complex: | 41 | |
| Other Directorships Held Outside Fund Complex: | Boston Early Music Festival (non-profit)(2007-present) | |
| Amherst Early Music, Inc. (non-profit)(2009-present) | ||
| Gotham Early Music Scene, Inc. (non-profit)(2009-present) | ||
| Partnership for New York City, Inc. (non-profit) (1989-2010) | ||
| New York Collegium (non-profit) (2004-2011) | ||
| Name: | Harris H. Rusitzky | |
| Address: | 290 Woodcliff Drive | |
| Fairport, NY 14450 | ||
| Age: | 80 | |
| Current Position(s) Held with Fund: | Director, Audit Committee Member, Governance & Nominating Committee Member | |
| Term of Office & Length of Time Served: | Indefinite - Since 1985 | |
| Principal Occupation(s) During Past 5 Years: | President, The Greening Group (business consultants) since 1994; Partner, The Restaurant Group (restaurants) since 2006 | |
| Number of Portfolios Overseen within Fund Complex: | 41 | |
| Other Directorships Held Outside Fund Complex: | Rochester Institute of Technology (university)(1972-present) | |
| Culinary Institute of America (non-profit college)(1985-present) | ||
| George Eastman House (museum)(1988-present) | ||
| National Restaurant Association (restaurant trade organization)(1978-present) | ||
| Name: | Chester N. Watson | |
| Address: | 290 Woodcliff Drive | |
| Fairport, NY 14450 | ||
| Age: | 65 | |
| Current Position(s) Held with Fund: | Director, Audit Committee Chairman, Governance & Nominating Committee Member | |
| Term of Office & Length of Time Served: | Indefinite - Since 2012 | |
| Principal Occupation(s) During Past 5 Years: | General Auditor (2003-2011) - General Motors Company (auto manufacturer) | |
| Number of Portfolios Overseen within Fund Complex: | 41 | |
| Other Directorships Held Outside Fund Complex: | Rochester Institute of Technology (university)(2005-present) | |
Officers | ||
| Name: | Jeffrey S. Coons, Ph.D., CFA | |
| Address: | 290 Woodcliff Drive | |
| Fairport, NY 14450 | ||
| Age: | 52 | |
| Current Position(s) Held with Fund: | Vice President | |
| Term of Office1 & Length of Time Served: | Since 2004 | |
| Principal Occupation(s) During Past 5 Years: | President since 2010, Co-Director of Research (2002-2015) - Manning & Napier Advisors, LLC Holds one or more of the following titles for various subsidiaries and affiliates: President, Director, Treasurer or Senior Trust Officer. | |
| Number of Portfolios Overseen within Fund Complex: | 41 | |
| Other Directorships Held Outside Fund Complex: | N/A | |
25
Emerging Markets Series
| Directors’ and Officers’ Information | ||
(unaudited)
| ||
| Officers (continued) | ||
| Name: | Elizabeth Craig | |
| Address: | 290 Woodcliff Drive | |
| Fairport, NY 14450 | ||
| Age: | 28 | |
| Current Position(s) Held with Fund: | Assistant Corporate Secretary | |
| Term of Office1 & Length of Time Served: | Since 2011 | |
| Principal Occupation(s) During Past 5 Years: | Fund Administration Manager since 2015; Mutual Fund Compliance Specialist (2009-2015) - Manning & Napier Advisors, LLC | |
| Number of Portfolios Overseen within Fund Complex: | 41 | |
| Other Directorships Held Outside Fund Complex: | N/A | |
| Name: | Christine Glavin | |
| Address: | 290 Woodcliff Drive | |
| Fairport, NY 14450 | ||
| Age: | 49 | |
| Current Position(s) Held with Fund: | Principal Financial Officer, Chief Financial Officer | |
| Term of Office1 & Length of Time Served: | Principal Financial Officer since 2002; Chief Financial Officer since 2001 | |
| Principal Occupation(s) During Past 5 Years: | Director of Fund Reporting since 2011; Fund Reporting Manager (1997-2011) - Manning & Napier Advisors, LLC; Assistant Treasurer since 2008 - Exeter Trust Company | |
| Number of Portfolios Overseen within Fund Complex: | 41 | |
| Other Directorships Held Outside Fund Complex: | N/A | |
| Name: | Jodi L. Hedberg | |
| Address: | 290 Woodcliff Drive | |
| Fairport, NY 14450 | ||
| Age: | 48 | |
| Current Position(s) Held with Fund: | Corporate Secretary, Chief Compliance Officer, Anti-Money Laundering Compliance Officer | |
| Term of Office1 & Length of Time Served: | Corporate Secretary since 1997; Chief Compliance Officer since 2004; Anti-Money Laundering Compliance Officer since 2002 | |
| Principal Occupation(s) During Past 5 Years: | Director of Compliance since 2005; Compliance Manager (1995-2005) - Manning & Napier Advisors, LLC and affiliates; Corporate Secretary - Manning & Napier Investor Services, Inc. since 2006 | |
| Number of Portfolios Overseen within Fund Complex: | 41 | |
| Other Directorships Held Outside Fund Complex: | N/A | |
| Name: | Richard Yates | |
| Address: | 290 Woodcliff Drive | |
| Fairport, NY 14450 | ||
| Age: | 50 | |
| Current Position(s) Held with Fund: | Chief Legal Officer | |
| Term of Office1 & Length of Time Served: | Chief Legal Officer since 2004 | |
| Principal Occupation(s) During Past 5 Years: | Counsel - Manning & Napier Advisors, LLC and affiliates since 2000; Holds one or more of the following titles for various affiliates; Director or Corporate Secretary | |
| Number of Portfolios Overseen within Fund Complex: | 41 | |
| Other Directorships Held Outside Fund Complex: | N/A | |
*Interested Director, within the meaning of the Investment Company Act of 1940 by reason of his position with the Fund’s investment advisor and distributor. Mr. Mikolaichik serves as the Chief Financial Officer for Manning & Napier Advisors, LLC.
1The term of office of all officers shall be one year and until their respective successors are chosen and qualified, or his or her earlier resignation or removal as provided in the Fund’s By-Laws.
26
Emerging Markets Series
Results of Special Meeting of Shareholders
(unaudited)
A Special Meeting of the Shareholders of the Fund was held on August 18, 2015. The number of votes necessary to conduct the meeting and approve the proposal was obtained, and the results of the vote of shareholders of all the Series of the Fund voting together in the aggregate is listed below:
PROPOSAL 1:
Election of Directors
NUMBER OF SHARES VOTED FOR | NUMBER OF SHARES WITHELD | |||||||
Stephen B. Ashley | 883,968,395 | 8,618,094 | ||||||
Paul A. Brooke | 884,510,661 | 8,075,828 | ||||||
Peter L. Faber | 884,140,893 | 8,445,596 | ||||||
James E. Mikolaichik | 883,391,832 | 9,194,657 | ||||||
Harris H. Rusitzky | 620,022,215 | 272,564,274 | ||||||
Chester N. Watson | 884,638,809 | 7,947,680 | ||||||
27
Emerging Markets Series
Literature Requests
(unaudited)
Proxy Voting Policies and Procedures
A description of the policies and procedures that the Fund uses to determine how to vote proxies relating to portfolio securities is available, without charge, upon request:
| By phone | 1-800-466-3863 | |||
| On the Securities and Exchange | ||||
| Commission’s (SEC) web site | http://www.sec.gov |
Proxy Voting Record
Information regarding how the Fund voted proxies relating to portfolio securities during the most recent 12-month period ended June 30th is available, without charge, upon request:
| By phone | 1-800-466-3863 | |||
| On the SEC’s web site | http://www.sec.gov |
Quarterly Portfolio Holdings
The Series’ complete schedule of portfolio holdings for the 1st and 3rd quarters of each fiscal year are provided on Form N-Q, and are available, without charge, upon request:
| By phone | 1-800-466-3863 | |||
| On the SEC’s web site | http://www.sec.gov |
The Series’ Form N-Q may be reviewed and copied at the SEC’s Public Reference Room in Washington, D.C. Information on the operation of the Public Reference Room may be obtained by calling 1-800-SEC-0330.
Prospectus and Statement of Additional Information (SAI)
For more information about any of the Manning & Napier Fund, Inc. Series, you may obtain a prospectus and SAI at www.manning-napier.com or by calling (800) 466-3863. Before investing, carefully consider the objectives, risks, charges and expenses of the investment and read the prospectus carefully as it contains this and other information about the investment company. In addition, this information can be found on the SEC’s web site, http://www.sec.gov.
Additional information available at www.manning-napier.com
1. Fund Holdings - Month-End
2. Fund Holdings - Quarter-End
3. Shareholder Report - Annual
4. Shareholder Report - Semi-Annual
The Fund also offers electronic notification or “e-delivery” when certain documents are available on-line to be downloaded or reviewed. Direct shareholders can elect to receive electronic notification when shareholder reports, prospectus updates, and/or statements are available. If you do not currently have on-line access to your account, you can establish access by going to www.manning-napier.com, click on “Login” in the top corner of the page, and follow the prompts to self-enroll. Once enrolled, you can set your electronic notification preferences by clicking on the Account Options tab located within the green toolbar and then select E-Delivery Option. Should you have any questions on either how to establish on-line access or how to update your account settings, please contact Investor Services at 1-800-466-3863.
The Manning & Napier Fund, Inc. is managed by Manning & Napier Advisors, LLC. Manning & Napier Investor Services, Inc., an affiliate of Manning & Napier Advisors, LLC, is the distributor of the Fund shares.
MNEMS-12/15-AR
Management Discussion and Analysis
(unaudited)
Dear Shareholders:
Volatility defined global financial markets during the past year, largely driven by macroeconomic factors. Markets around the world experienced a correction in late August amidst a broad selloff triggered by renewed concerns about economic growth in emerging markets — China in particular — and uncertainty about the effects of that slowdown on overall global growth. Developed economies continued to provide accommodative monetary policy to combat growth concerns, although in December the U.S. Federal Reserve raised the federal funds rate for the first time in nearly a decade. For much of the year, Europe struggled with uncertainty regarding Greece’s ability to secure bailout funding from its creditors, which negatively affected investor sentiment. China’s economy slowed, but the government continued to demonstrate a willingness to provide support through a combination of policy-easing maneuvers and targeted stimulus measures. The U.S. economy remained on a path of slow growth that nevertheless made it the best performing developed economy. U.S. stocks were largely flat for the year, whereas global equity markets moderately declined. Looking ahead, we expect the slow global growth environment to remain in place for the foreseeable future.
As always, we appreciate your business.
Sincerely,
Manning & Napier Advisors, LLC
1
Fund Commentary
(unaudited)
Investment Objective
Strategic Income Conservative Series: Primarily to manage against capital risk and generate income, with the pursuit of long-term capital growth as a secondary objective. Strategic Income Moderate Series: To manage against capital risk while generating income and pursuing long-term capital growth.
Performance Commentary
Domestic fixed income markets generated modestly positive absolute returns in 2015, although performance across sectors was mixed. Municipal, mortgage-backed, and Treasury securities turned in positive performance for the year, whereas high yield and investment grade corporate bonds were negative. Meanwhile, performance across international fixed income markets was exceptionally challenging. Looking ahead, we expect the slow global growth environment to remain in place for the foreseeable future.
The Strategic Income Conservative Series delivered modestly positive absolute returns during 2015, returning 0.08% and outperforming its blended benchmark, which returned -0.18%. The Strategic Income Moderate Series experienced a return of -1.01%, but held up slightly better than its blended benchmark, which returned -1.10%.
Regarding relative performance, stock selection drove each Series’ outperformance relative to its blended benchmarks during the year. Conversely, fixed income selection challenged relative returns. Equity sector positioning challenged relative returns of the Strategic Income Conservative Series but aided relative returns of the Strategic Income Moderate Series.
More specifically, stock selection in Materials, Financials, and Information Technology aided relative performance. The Series’ underweight relative to the blended benchmarks to Energy also aided relative returns, as Energy was the weakest performing sector within the benchmarks during the year amid significant declines in global oil prices.
Offsetting a portion of the relative performance tailwind was equity selection in Industrials and Health Care. The Series’ overweight relative to the blended benchmarks to Materials and underweight to Financials also challenged relative returns.
Regarding fixed income positioning, each Series is notably tilted toward corporate bonds, investment-grade securities in particular. We also continue to pursue select opportunities in the below investment-grade space. Corporate bonds have been a primary focus area for us over the past few years, and we believe they remain an attractive option in 2016 as businesses continue to experience the benefits of a slowly improving U.S. economy. With the backdrop of continued slow growth and relatively cheap credit valuations, we view each Series’ current positioning as appropriate, but it is likely that we will look to reduce exposure to the corporate sector as we get later in the credit cycle and the availability of funds contracts. Each Series also contains meaningful exposure to securitized credit, largely commercial mortgage-backed securities. Their exposure to U.S. Treasuries is limited as we do not believe yields in that sector offer investors sufficient compensation for interest rate risk in the current environment.
Within the equity portion of each Series, we are looking for securities of dividend-paying companies that we select based on free cash flow generation and earnings power, a minimum dividend yield, dividend sustainability, and financial health. This approach may be particularly attractive to investors looking to generate income. Historically, over a full market cycle, companies with high free cash flow yields and high dividends provide good upside capture while limiting downside capture. Additionally, we believe equity investment opportunities in the Real Estate sector can provide attractive yield and capital appreciation potential in the current environment.
During 2016 we believe investors should expect further gyrations in financial markets due to catalysts such as geopolitical risks, the diverging monetary policies of major central banks, commodity price pressures, and the potential for global growth to deviate from expectations. With the Federal Reserve having raised the federal funds rate, we think they now will seek to remain flexible and proceed slowly with small increases that do not follow a well-defined schedule. Broadly speaking, valuations in the developed world remain neutral at best, whereas valuations in select emerging markets are relatively more attractive. Shareholders should expect us to view volatility as a buying opportunity given that our indicators do not suggest capital risk is a significant near-term concern. In light
2
Fund Commentary
(unaudited)
Performance Commentary (continued)
of the current environment, it is important that investors remain active, flexible, and selective in their approach in order to avoid overvalued areas of the market, something Manning & Napier has done for over 45 years as an active investment manager.
Performance data quoted represents past performance and does not guarantee future results. The investment return and principal value of an investment will fluctuate, so that an investor’s shares, when redeemed, may be worth more or less than their original cost. Current performance may be higher or lower than that quoted; investors can obtain the most recent month-end performance at www.manning-napier.com or by calling (800) 466-3863. Performance for the Series’ Class S shares is provided above. Performance for the Series’ Class I shares will be higher based on the Class’ lower expenses.
Please see the next page for additional performance information as of December 31, 2015.
All investments involve risks, including possible loss of principal. An investment in the Series will fluctuate in response to stock market movements and changes in interest rates. Because the Series invests in a combination of other affiliated funds, it is subject to asset allocation risk as well as the risks associated with each underlying fund’s investment portfolio. These may include the risk that dividends may be discontinued or decreased; small-cap/mid-cap risk, including the risk that stocks of small- and mid-cap companies may be subject to more abrupt or erratic market movements than the stocks of larger companies and may be less marketable than the stocks of larger companies; risks related to investments in options, which, like all derivatives, can be highly volatile and involve risks in addition to the risks of the underlying instrument on which the derivative is based, such as counterparty, correlation and liquidity risk; risks related to the direct ownership of real estate (including REITs) such as interest rate risk, liquidity risk, and changes in property value, among others; foreign investment risk, including fluctuating currency values, different accounting standards, and economic and political instability, as well as the risk that investments in emerging markets may be more volatile than investments in developed markets; issuer-specific risk; and the increased default risk associated with higher-yielding, lower-rated securities. There is an inverse relationship between bond prices and interest rates; as interest rates rise, bond prices (and therefore the value of bond funds) fall. Likewise, as interest rates fall, bond prices and the value of bond funds rise. Additionally, a portion of the Series’ underlying holdings may be invested in business development companies (BDCs) or master limited partnerships (MLPs). BDCs are subject to additional risks, as they generally invest in less mature private companies or thinly traded U.S. public companies which involve greater risk than well-established publicly-traded companies. MLPs are subject to additional risks, including, risks associated with the specific industry or industries in which the partnership invests, such as the risks of investing in real estate, or oil and gas industries or other natural resources. Moreover, the potential tax benefits from investing in MLPs depend on their continued treatment as partnerships for federal income tax purposes.
3
Performance Update - Strategic Income Conservative Series
(unaudited)
| AVERAGE ANNUAL TOTAL RETURNS AS OF DECEMBER 31, 2015 | ||||
ONE YEAR1 | TOTAL RETURN SINCE INCEPTION2 | |||
Manning & Napier Fund, Inc. - Strategic Income Conservative Series - Class S3 | 0.08% | 4.21% | ||
Manning & Napier Fund, Inc. - Strategic Income Conservative Series - Class I3 | 0.34% | 4.44% | ||
Barclays U.S. Intermediate Aggregate Bond Index4 | 1.21% | 1.42% | ||
15/5/10/70 Blended Index5,6 | -0.18% | 4.15% | ||
The following graph compares the value of a $10,000 investment in the Manning & Napier Fund, Inc. - Strategic Income Conservative Series - Class S from its inception2 (8/1/12) to present (12/31/14) to the Barclays U.S. Intermediate Aggregate Bond Index and the 15/5/10/70 Blended Index.
1The returns shown are based on net asset values calculated for shareholder transactions and may differ from the returns shown in the financial highlights, which reflect adjustments made to the net asset values in accordance with accounting principles generally accepted in the United States of America.
2Performance numbers for the Series are calculated from August 1, 2012, the Series’ inception date. The Barclays U.S. Intermediate Aggregate Bond Index, a component of the Strategic Income Conservative Series Blended Index, only publishes month-end numbers; therefore, performance numbers for the Index are calculated from July 31, 2012.
3The Series’ performance does not reflect the deduction of taxes that a shareholder would pay on fund distributions or the redemption of shares. The Series’ performance is historical and may not be indicative of future results. The performance returns shown are inclusive of the net expense ratio of the Series. For the year ended December 31, 2015, this net expense ratio was 0.30% for Class S and 0.05% for Class I. The gross expense ratio, which does not account for any voluntary or contractual waivers currently in effect, was 0.76% for Class S and 0.51% for Class I for the year ended December 31, 2015.
4The Barclays U.S Intermediate Aggregate Bond Index is an unmanaged, market-value weighted index of U.S. domestic investment-grade debt issues, including government, corporate, asset-backed and mortgage-backed securities, with maturities greater than one year but less than ten years. Index returns do not reflect any fees or expenses. Index returns provided by Interactive Data.
5The Series’ secondary benchmark was changed from 20/10/70 Blended Index to the 15/5/10/70 Blended Index because the 15/5/10/70 Blended Index better represents the overall objectives of the Series.
6The 15/5/10/70 Blended Index is represented by 15% Russell 3000®; Value Index (Russell 3000 Value), 5% MSCI ACWI ex USA Index (ACWIxUS), 10% MSCI U.S. Real Estate Investment Trust (REIT) Index, and 70% Barclays U.S. Aggregate Bond Index (BAB). Russell 3000 Value Index is an unmanaged, market capitalization-weighted index consisting of those Russell 3000®; Index companies with lower price-to-book ratios and lower forecasted growth values. The Index returns are based on a market capitalization-weighted average of relative price changes of the component stocks plus dividends whose reinvestments are compounded daily. The Index returns do not reflect any fees or expenses. Index returns provided by Bloomberg. ACWIxUS is a free float-adjusted market capitalization index that is designed to measure equity market performance in the global developed and emerging markets and consists of 45 developed and emerging market country indices outside the U.S. The Index is denominated in U.S. dollars. The Index returns are net of withholding taxes. They assume daily reinvestment of net dividends thus accounting for any applicable dividend taxation. Index returns provided by Bloomberg. The MSCI U.S. REIT Index is a free float-adjusted, market capitalization-weighted index that is comprised of equity REITs that are included in the MSCI U.S. Investment Market 2500 Index, with
4
Performance Update - Strategic Income Conservative Series
(unaudited)
the exception of specialty equity REITs that do not generate a majority of their revenue and income from real estate rental and leasing operations. The Index represents approximately 85% of the U.S. REIT universe. The Index returns are net of withholding taxes. They assume daily reinvestment of net dividends thus accounting for any applicable dividend taxation. Index returns provided by Bloomberg. BAB is an unmanaged index that represents the U.S. domestic investment-grade bond market. It is a market value-weighted index of investment-grade debt issues, including government, corporate, asset-backed and mortgage-backed securities, with maturities of one year or more. Index returns provided by Interactive Data. The returns of the indices do not reflect any fees or expenses. Returns provided are calculated monthly using a blended allocation. Because the fund’s asset allocation will vary over time, the composition of the fund’s portfolio may not match the composition of the comparative Indices.
5
Performance Update - Strategic Income Moderate Series
(unaudited)
| AVERAGE ANNUAL TOTAL RETURNS AS OF DECEMBER 31, 2015 | ||||
ONE YEAR1 | TOTAL RETURN SINCE INCEPTION2 | |||
Manning & Napier Fund, Inc. - Strategic Income Moderate Series - Class S3 | -1.01% | 5.87% | ||
Manning & Napier Fund, Inc. - Strategic Income Moderate Series - Class I3 | -0.76% | 6.10% | ||
Barclays U.S. Aggregate Bond Index4 | 0.55% | 1.39% | ||
32/8/10/50 Blended Index5 | -1.10% | 6.31% | ||
The following graph compares the value of a $10,000 investment in the Manning & Napier Fund, Inc. - Strategic Income Moderate Series - Class S from its inception2 (8/1/12) to present (12/31/14) to the Barclays U.S. Aggregate Bond Index and the 38/8/10/50 Blended Index.
1The returns shown are based on net asset values calculated for shareholder transactions and may differ from the returns shown in the financial highlights, which reflect adjustments made to the net asset values in accordance with accounting principles generally accepted in the United States of America.
2Performance numbers for the Series are calculated from August 1, 2012, the Series’ inception date. The Barclays U.S. Aggregate Bond Index, a component of the Strategic Income Moderate Series Blended Index, only publishes month-end numbers; therefore, performance numbers for the Index are calculated from July 31, 2012.
3The Series’ performance does not reflect the deduction of taxes that a shareholder would pay on fund distributions or the redemption of shares. The Series’ performance is historical and may not be indicative of future results. The performance returns shown are inclusive of the net expense ratio of the Series. For the year ended December 31, 2015, this net expense ratio was 0.30% for Class S and 0.05% for Class I. The gross expense ratio, which does not account for any voluntary or contractual waivers currently in effect, was 0.87% for Class S and 0.72% for Class I for the year ended December 31, 2015.
4The Barclays U.S. Aggregate Bond Index is an unmanaged, market-value weighted index of U.S. domestic investment-grade debt issues, including government, corporate, asset-backed, and mortgage-backed securities, with maturities of one year or more. Index returns do not reflect any fees or expenses. Index returns provided by Interactive Data.
5The Strategic Income Moderate Benchmark was 40/10/10/40 Blended Index from 05/01/2012 - 09/30/2013. Since 10/01/2013, the benchmark has been the 32/8/10/50 Blended Index. The 40/10/10/40 Blended Index was represented by 40% Russell 3000® Value Index (Russell 3000 Value), 10% MSCI ACWI ex USA Index (ACWIxUS), 10% MSCI U.S. Real Estate Investment Trust (REIT) Index, and 40% Barclays U.S. Aggregate Bond Index (BAB). The 32/8/10/50 Blended Index is represented by 32% Russell 3000 Value, 8% ACWIxUS, 10% REIT Index, and 50% BAB. Russell 3000 Value Index is an unmanaged, market capitalization-weighted index consisting of those Russell 3000® Index companies with lower price-to-book ratios and lower forecasted growth values. The Index returns are based on a market capitalization-weighted average of relative price changes of the component stocks plus dividends whose reinvestments are compounded daily. The Index returns do not reflect any fees or expenses. Index returns provided by Bloomberg. ACWIxUS is a free float-adjusted market capitalization index that is designed to measure equity market performance in the global developed and emerging markets and consists of 45 developed and emerging market country indices outside the U.S. The Index is denominated in U.S. dollars. The Index returns are net of withholding taxes. They assume daily reinvestment of net dividends thus accounting for any applicable dividend taxation. Index returns provided by Bloomberg. The MSCI U.S. REIT Index is a free float-adjusted, market capitalization-weighted index that is comprised of equity REITs that are included in the MSCI U.S. Investment Market 2500 Index, with the exception of specialty equity REITs that do not generate a majority of their revenue and income from real estate rental and leasing operations. The Index represents approximately 85% of the U.S. REIT
6
Performance Update - Strategic Income Moderate Series
(unaudited)
universe. The Index returns are net of withholding taxes. They assume daily reinvestment of net dividends thus accounting for any applicable dividend taxation. Index returns provided by Bloomberg. BAB is an unmanaged index that represents the U.S. domestic investment-grade bond market. It is a market value-weighted index of investment-grade debt issues, including government, corporate, asset-backed and mortgage-backed securities, with maturities of one year or more. Index returns provided by Interactive Data. The returns of the indices do not reflect any fees or expenses. Returns provided are calculated monthly using a blended allocation.
7
Shareholder Expense Example
(unaudited)
As a shareholder of the Series, you incur ongoing costs, including management fees, shareholder service fees and other Series expenses. This example is intended to help you understand your ongoing costs (in dollars) of investing in the Series and to compare these costs with the ongoing costs of investing in other mutual funds.
The example is based on an investment of $1,000 invested at the beginning of the period and held for the entire period (July 1, 2015 to December 31, 2015).
Actual Expenses
The Actual lines of the tables below provide information about actual account values and actual expenses. You may use the information in these lines, together with the amount you invested, to estimate the expenses that you paid over the period. Simply divide your account value by $1,000 (for example, an $8,600 account value divided by $1,000 = 8.6), then multiply the result by the number in the Actual line for the Series and Class in which you have invested under the heading entitled “Expenses Paid During Period” to estimate the expenses you paid on your account during this period.
Hypothetical Example for Comparison Purposes
The Hypothetical lines of the tables below provide information about hypothetical account values and hypothetical expenses based on the Class’ actual expense ratio and an assumed rate of return of 5% per year before expenses, which is not the Class’ actual return. The hypothetical account values and expenses may not be used to estimate the actual ending account balance or expenses you paid during the period. You may use this information to compare the ongoing costs of investing in a Class of the Series and other funds. To do so, compare this 5% hypothetical example for the Series and Class in which you have invested with the 5% hypothetical examples that appear in the shareholder reports of the other funds.
Please note that the expenses shown in the tables are meant to highlight your ongoing costs only and do not reflect any transaction costs, such as sales charges (loads), redemption fees, or exchange fees that you may incur in other mutual funds. Therefore, the Hypothetical lines of the tables are useful in comparing ongoing costs only, and will not help you determine the relative total costs of owning different funds.
| BEGINNING ACCOUNT VALUE 7/1/15 | ENDING ACCOUNT VALUE 12/31/15 | EXPENSES PAID DURING PERIOD* 7/1/15-12/31/15 | ANNUALIZED EXPENSE RATIO1,2 | |||||
Strategic Income Conservative Series | ||||||||
Actual (Class S) | $1,000.00 | $999.30 | $1.51 | 0.30% | ||||
Hypothetical (5% return before expenses) | $1,000.00 | $1,023.69 | $1.53 | 0.30% | ||||
Actual (Class I) | $1,000.00 | $1,000.80 | $0.25 | 0.05% | ||||
Hypothetical (5% return before expenses) | $1,000.00 | $1,024.95 | $0.26 | 0.05% | ||||
| BEGINNING ACCOUNT VALUE 7/1/15 | ENDING ACCOUNT VALUE 12/31/15 | EXPENSES PAID DURING PERIOD* 7/1/15-12/31/15 | ANNUALIZED EXPENSE RATIO1,2 | |||||
Strategic Income Moderate Series | ||||||||
Actual (Class S) | $1,000.00 | $990.90 | $1.51 | 0.30% | ||||
Hypothetical (5% return before expenses) | $1,000.00 | $1,023.69 | $1.53 | 0.30% | ||||
Actual (Class I) | $1,000.00 | $992.20 | $0.25 | 0.05% | ||||
Hypothetical (5% return before expenses) | $1,000.00 | $1,024.95 | $0.26 | 0.05% | ||||
1Expense ratios of the Class do not include fees and expenses indirectly incurred by the underlying funds. If these expenses were included, the expense ratios would have been higher.
2Expenses are equal to each Class’ annualized expense ratio (for the six month period), multiplied by the average account value over the period, multiplied by 184/365 (to reflect the one-half year period). Expenses are based on the most recent fiscal half year; therefore, the expense ratios stated above may differ from the expense ratios stated in the financial highlights, which are based on one-year data. The Class’ total returns would have been lower had certain expenses not been reimbursed during the period.
8
Portfolio Composition as of December 31, 2015 - Asset Allocation1
(unaudited)
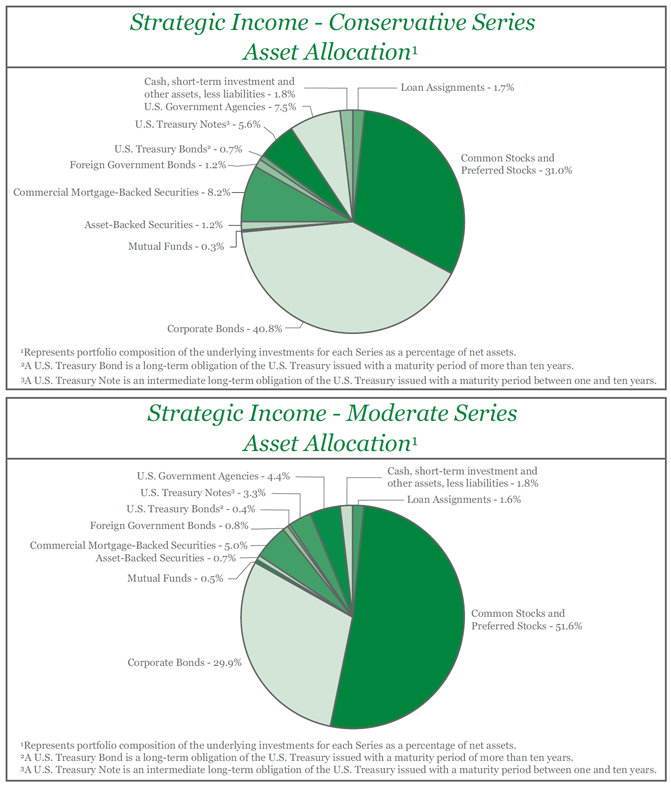
9
Investment Portfolios - December 31, 2015
| STRATEGIC INCOME CONSERVATIVE SERIES | SHARES | VALUE (NOTE 2) | ||||||||
AFFILIATED INVESTMENT COMPANIES - 100.0% | ||||||||||
Manning & Napier Fund, Inc. - Core Bond Series, Class I | 999,200 | $ | 9,742,198 | |||||||
Manning & Napier Fund, Inc. - Disciplined Value Series, Class I | 168,029 | 2,281,832 | ||||||||
Manning & Napier Fund, Inc. - Equity Income Series, Class I | 272,150 | 2,756,878 | ||||||||
Manning & Napier Fund, Inc. - High Yield Bond Series, Class I | 46,544 | 380,733 | ||||||||
Manning & Napier Fund, Inc. - Real Estate Series, Class I | 176,784 | 1,283,449 | ||||||||
Manning & Napier Fund, Inc. - Unconstrained Bond Series, Class I | 396,200 | 3,613,339 | ||||||||
|
| |||||||||
TOTAL AFFILIATED INVESTMENT COMPANIES | ||||||||||
(Identified Cost $21,258,738) |
| 20,058,429 | ||||||||
LIABILITIES, LESS OTHER ASSETS - (0.0)%# |
| (7,117 | ) | |||||||
|
| |||||||||
NET ASSETS - 100% | $ | 20,051,312 | ||||||||
|
| |||||||||
| STRATEGIC INCOME MODERATE SERIES | SHARES | VALUE (NOTE 2) | ||||||||
AFFILIATED INVESTMENT COMPANIES - 100.0% | ||||||||||
Manning & Napier Fund, Inc. - Core Bond Series, Class I | 584,624 | $ | 5,700,085 | |||||||
Manning & Napier Fund, Inc. - Disciplined Value Series, Class I | 323,075 | 4,387,361 | ||||||||
Manning & Napier Fund, Inc. - Equity Income Series, Class I | 478,380 | 4,845,989 | ||||||||
Manning & Napier Fund, Inc. - High Yield Bond Series, Class I | 165,133 | 1,350,787 | ||||||||
Manning & Napier Fund, Inc. - Real Estate Series, Class I | 177,784 | 1,290,709 | ||||||||
Manning & Napier Fund, Inc. - Unconstrained Bond Series, Class I | 265,420 | 2,420,629 | ||||||||
|
| |||||||||
TOTAL AFFILIATED INVESTMENT COMPANIES | ||||||||||
(Identified Cost $21,538,253) |
| 19,995,560 | ||||||||
LIABILITIES, LESS OTHER ASSETS - (0.0)%# |
| (7,071 | ) | |||||||
|
| |||||||||
NET ASSETS - 100% |
| $ | 19,988,489 | |||||||
|
| |||||||||
#Less than 0.1%.
The accompanying notes are an integral part of the financial statements.
10
Statements of Assets and Liabilities
December 31, 2015
| STRATEGIC INCOME CONSERVATIVE SERIES | STRATEGIC INCOME MODERATE SERIES | |||||||
ASSETS: | ||||||||
Total investments in Underlying Series: | ||||||||
At value* (Note 2) | $ | 20,058,429 | $ | 19,995,560 | ||||
Receivable from Advisor (Note 3) | 23,293 | 24,003 | ||||||
Receivable for shares of Underlying Series sold | — | 13,475 | ||||||
Receivable for fund shares sold | — | 20 | ||||||
|
|
|
| |||||
TOTAL ASSETS | 20,081,722 | 20,033,058 | ||||||
|
|
|
| |||||
LIABILITIES: | ||||||||
Accrued fund accounting and administration fees (Note 3) | 17,956 | 13,390 | ||||||
Accrued shareholder services fees (Class S) (Note 3) | 2,942 | 3,264 | ||||||
Accrued transfer agent fees (Note 3) | 931 | 982 | ||||||
Accrued Chief Compliance Officer service fees (Note 3) | 429 | 429 | ||||||
Payable for fund shares repurchased | — | 13,495 | ||||||
Audit fees payable | 3,449 | 3,441 | ||||||
Accrued custodian fees | — | 5,543 | ||||||
Printing fees payable | 2,045 | 1,563 | ||||||
Other payables and accrued expenses | 2,658 | 2,462 | ||||||
|
|
|
| |||||
TOTAL LIABILITIES | 30,410 | 44,569 | ||||||
|
|
|
| |||||
TOTAL NET ASSETS | $ | 20,051,312 | $ | 19,988,489 | ||||
|
|
|
| |||||
NET ASSETS CONSIST OF: | ||||||||
Capital stock | 20,317 | 19,383 | ||||||
Additional paid-in-capital | 21,165,113 | 21,038,900 | ||||||
Undistributed net investment income | 88,535 | 97,437 | ||||||
Accumulated net realized gain (loss) on Underlying Series | (22,344 | ) | 375,462 | |||||
Net unrealized depreciation on Underlying Series | (1,200,309 | ) | (1,542,693 | ) | ||||
|
|
|
| |||||
TOTAL NET ASSETS | $ | 20,051,312 | $ | 19,988,489 | ||||
|
|
|
| |||||
Class S | ||||||||
Net Assets | $ | 13,419,715 | $ | 16,040,055 | ||||
Shares Outstanding | 1,359,745 | 1,555,460 | ||||||
Net Asset Value, Offering Price, and Redemption Price per share | $ | 9.87 | $ | 10.31 | ||||
Class I | ||||||||
Net Assets | $ | 6,631,597 | $ | 3,948,434 | ||||
Shares Outstanding | 671,908 | 382,889 | ||||||
Net Asset Value, Offering Price, and Redemption Price per share | $ | 9.87 | $ | 10.31 | ||||
*At identified cost | $ | 21,258,738 | $ | 21,538,253 | ||||
|
|
|
| |||||
The accompanying notes are an integral part of the financial statements.
11
Statements of Operations
For the Year Ended December 31, 2015
| STRATEGIC INCOME CONSERVATIVE SERIES | STRATEGIC INCOME MODERATE SERIES | |||||||
INVESTMENT INCOME: | ||||||||
Income distributions from Underlying Series | $ | 606,035 | $ | 532,062 | ||||
|
|
|
| |||||
EXPENSES: | ||||||||
Fund accounting and administration fees (Note 3) | 48,716 | 48,822 | ||||||
Shareholder services fees (Class S)(Note 3) | 36,906 | 41,206 | ||||||
Transfer agent fees (Note 3) | 2,653 | 2,785 | ||||||
Chief Compliance Officer service fees (Note 3) | 2,541 | 2,541 | ||||||
Directors’ fees (Note 3) | 977 | 775 | ||||||
Registration and filing fees | 28,518 | 27,020 | ||||||
Audit fees | 22,506 | 22,473 | ||||||
Custodian fees | 9,558 | 11,900 | ||||||
Printing fees | 8,714 | 8,714 | ||||||
Miscellaneous | 5,959 | 3,975 | ||||||
|
|
|
| |||||
Total Expenses | 167,048 | 170,211 | ||||||
Less reduction of expenses (Note 3) | (117,464 | ) | (118,882 | ) | ||||
|
|
|
| |||||
Net Expenses | 49,584 | 51,329 | ||||||
|
|
|
| |||||
NET INVESTMENT INCOME | 556,451 | 480,733 | ||||||
|
|
|
| |||||
REALIZED AND UNREALIZED GAIN (LOSS) ON UNDERLYING SERIES: | ||||||||
Net realized loss on Underlying Series | (606,567 | ) | (404,744 | ) | ||||
Distributions of realized gains from Underlying Series | 678,793 | 874,553 | ||||||
Net change in unrealized appreciation (depreciation) on Underlying Series | (555,558 | ) | (1,181,351 | ) | ||||
|
|
|
| |||||
NET REALIZED AND UNREALIZED LOSS ON UNDERLYING SERIES | (483,332 | ) | (711,542 | ) | ||||
|
|
|
| |||||
NET INCREASE (DECREASE) IN NET ASSETS RESULTING FROM OPERATIONS | $ | 73,119 | $ | (230,809 | ) | |||
|
|
|
| |||||
The accompanying notes are an integral part of the financial statements.
12
Statements of Changes in Net Assets
| STRATEGIC INCOME CONSERVATIVE SERIES | STRATEGIC INCOME MODERATE SERIES | |||||||||||||||
| FOR THE YEAR ENDED 12/31/15 | FOR THE YEAR ENDED 12/31/14 | FOR THE YEAR ENDED 12/31/15 | FOR THE YEAR ENDED 12/31/14 | |||||||||||||
INCREASE (DECREASE) IN NET ASSETS: | ||||||||||||||||
OPERATIONS: | ||||||||||||||||
Net investment income | $ | 556,451 | $ | 781,081 | $ | 480,733 | $ | 432,182 | ||||||||
Net realized gain (loss) on Underlying Series | (606,567 | ) | 223,007 | (404,744 | ) | 125,386 | ||||||||||
Distributions of realized gains from Underlying Series | 678,793 | 621,734 | 874,553 | 459,349 | ||||||||||||
Net change in unrealized appreciation (depreciation) on underlying series | (555,558 | ) | (467,958 | ) | (1,181,351 | ) | (334,320 | ) | ||||||||
|
|
|
|
|
|
|
| |||||||||
Net increase (decrease) from operations | 73,119 | 1,157,864 | (230,809 | ) | 682,597 | |||||||||||
|
|
|
|
|
|
|
| |||||||||
DISTRIBUTIONS TO SHAREHOLDERS (Note 8): | ||||||||||||||||
From net investment income (Class S) | (270,369 | ) | (447,032 | ) | (305,331 | ) | (447,885 | ) | ||||||||
From net investment income (Class I) | (196,856 | ) | (397,266 | ) | (82,328 | ) | (72,798 | ) | ||||||||
From net realized gain on investments (Class S) | (382,143 | ) | (267,079 | ) | (324,852 | ) | (370,111 | ) | ||||||||
From net realized gain on investments (Class I) | (248,743 | ) | (239,700 | ) | (84,241 | ) | (57,935 | ) | ||||||||
|
|
|
|
|
|
|
| |||||||||
Total distributions to shareholders | (1,098,111 | ) | (1,351,077 | ) | (796,752 | ) | (948,729 | ) | ||||||||
|
|
|
|
|
|
|
| |||||||||
CAPITAL STOCK ISSUED AND REPURCHASED: | ||||||||||||||||
Net increase (decrease) from capital share transactions (Note 6) | (6,584,717 | ) | 14,914,530 | 3,128,900 | 10,057,780 | |||||||||||
|
|
|
|
|
|
|
| |||||||||
Net increase (decrease) in net assets | (7,609,709 | ) | 14,721,317 | 2,101,339 | 9,791,648 | |||||||||||
NET ASSETS: | ||||||||||||||||
Beginning of year | 27,661,021 | 12,939,704 | 17,887,150 | 8,095,502 | ||||||||||||
|
|
|
|
|
|
|
| |||||||||
End of year (including undistributed net investment income of $88,535, $0, $97,437 and $0, respectively) | $ | 20,051,312 | $ | 27,661,021 | $ | 19,988,489 | $ | 17,887,150 | ||||||||
|
|
|
|
|
|
|
| |||||||||
The accompanying notes are an integral part of the financial statements.
13
Financial Highlights
| FOR THE YEARS ENDED | FOR THE PERIOD | |||||||||||||||
| STRATEGIC INCOME CONSERVATIVE SERIES CLASS S | 12/31/15 | 12/31/14 | 12/31/13 | 8/1/121 TO 12/31/12 | ||||||||||||
Per share data (for a share outstanding throughout each period): | ||||||||||||||||
Net asset value - Beginning of period | $ | 10.33 | $ | 10.24 | $ | 10.07 | $ | 10.00 | ||||||||
|
|
|
|
|
|
|
| |||||||||
Income (loss) from investment operations: | ||||||||||||||||
Net investment income2,3 | 0.23 | 0.37 | 0.39 | 0.30 | ||||||||||||
Net realized and unrealized gain (loss) on investments | (0.23 | ) | 0.28 | 0.10 | 0.01 | |||||||||||
|
|
|
|
|
|
|
| |||||||||
Total from investment operations | — | 0.65 | 0.49 | 0.31 | ||||||||||||
|
|
|
|
|
|
|
| |||||||||
Less distributions to shareholders: | ||||||||||||||||
From net investment income | (0.19 | ) | (0.35 | ) | (0.30 | ) | (0.24 | ) | ||||||||
From net realized gain on investments | (0.27 | ) | (0.21 | ) | (0.02 | ) | (0.00 | )4 | ||||||||
|
|
|
|
|
|
|
| |||||||||
Total distributions to shareholders | (0.46 | ) | (0.56 | ) | (0.32 | ) | (0.24 | ) | ||||||||
|
|
|
|
|
|
|
| |||||||||
Net asset value - End of period | $ | 9.87 | $ | 10.33 | $ | 10.24 | $ | 10.07 | ||||||||
|
|
|
|
|
|
|
| |||||||||
Net assets - End of period (000’s omitted) | $ | 13,420 | $ | 15,394 | $ | 8,927 | $ | 2,115 | ||||||||
|
|
|
|
|
|
|
| |||||||||
Total return5 | 0.08 | % | 6.30 | % | 4.96 | % | 3.12 | % | ||||||||
Ratios (to average net assets)/Supplemental Data: | ||||||||||||||||
Expenses* | 0.30 | %6 | 0.30 | %7 | 0.30 | %8 | 0.30 | %9,10 | ||||||||
Net investment income2 | 2.28 | % | 3.50 | % | 3.84 | % | 2.95 | % | ||||||||
Series portfolio turnover11 | 90 | % | 39 | % | 116 | % | 5 | % | ||||||||
| *The investment advisor paid a portion of the Series’ expenses. If these expenses had been incurred by the Series, the expense ratios (to average net assets) would have been increased by the following amounts: | ||||||||||||||||
|
| 0.46
| %6
|
| 0.43
| %7
|
| 1.23
| %8
|
| 10.89
| %9,10,12
| |||||
| FOR THE YEARS ENDED | FOR THE PERIOD | |||||||||||||||
| STRATEGIC INCOME CONSERVATIVE SERIES CLASS I | 12/31/15 | 12/31/14 | 12/31/13 | 8/1/121 TO 12/31/12 | ||||||||||||
Per share data (for a share outstanding throughout each period): | ||||||||||||||||
Net asset value - Beginning of period | $ | 10.33 | $ | 10.24 | $ | 10.06 | $ | 10.00 | ||||||||
|
|
|
|
|
|
|
| |||||||||
Income (loss) from investment operations: | ||||||||||||||||
Net investment income2,3 | 0.21 | 0.41 | 0.43 | 0.22 | ||||||||||||
Net realized and unrealized gain (loss) on investments | (0.18 | ) | 0.26 | 0.09 | 0.08 | |||||||||||
|
|
|
|
|
|
|
| |||||||||
Total from investment operations | 0.03 | 0.67 | 0.52 | 0.30 | ||||||||||||
|
|
|
|
|
|
|
| |||||||||
Less distributions to shareholders: | ||||||||||||||||
From net investment income | (0.22 | ) | (0.37 | ) | (0.32 | ) | (0.24 | ) | ||||||||
From net realized gain on investments | (0.27 | ) | (0.21 | ) | (0.02 | ) | (0.00 | )4 | ||||||||
|
|
|
|
|
|
|
| |||||||||
Total distributions to shareholders | (0.49 | ) | (0.58 | ) | (0.34 | ) | (0.24 | ) | ||||||||
|
|
|
|
|
|
|
| |||||||||
Net asset value - End of period | $ | 9.87 | $ | 10.33 | $ | 10.24 | $ | 10.06 | ||||||||
|
|
|
|
|
|
|
| |||||||||
Net assets - End of period (000’s omitted) | $ | 6,632 | $ | 12,267 | $ | 4,013 | $ | 52 | ||||||||
|
|
|
|
|
|
|
| |||||||||
Total return5 | 0.34 | % | 6.55 | % | 5.28 | % | 3.08 | % | ||||||||
Ratios (to average net assets)/Supplemental Data: | ||||||||||||||||
Expenses* | 0.05 | %6 | 0.05 | %7 | 0.05 | %8 | 0.05 | %9,10 | ||||||||
Net investment income2 | 2.08 | % | 3.92 | % | 4.19 | % | 2.15 | % | ||||||||
Series portfolio turnover11 | 90 | % | 39 | % | 116 | % | 5 | % | ||||||||
| * The investment advisor paid a portion of the Series’ expenses. If these expenses had been incurred by the Series, the expense ratios (to average net assets) would have been increased by the following amounts: | ||||||||||||||||
| 0.46 | %6 | 0.41 | %7 | 1.23 | %8 | 27.14 | %9,10,12 | |||||||||
1Commencement of operations.
2Net investment income is affected by the timing of distributions from the Underlying Series in which the Series invest. The ratios do not include net investment income of the Underlying Series in which the Series invests.
3Calculated based on average shares outstanding during the periods.
4Less than ($0.01) per share.
5Represents aggregate total return for the periods indicated. Total return would have been lower had certain expenses not been reimbursed during the periods. Periods less than one year are not annualized.
6Expense ratios do not include expenses of the Underlying Series in which the Series invests. The average expense ratio of the Underlying Series was 0.50%.
7Expense ratios do not include expenses of the Underlying Series in which the Series invests. The average expense ratio of the Underlying Series was 0.48%.
8Expense ratios do not include expenses of the Underlying Series in which the Series invests. The average expense ratio of the Underlying Series was 0.64%.
9Annualized.
10Expense ratios do not include expenses of the Underlying Series in which the Series invests. The average expense ratio of the Underlying Series was 0.71%.
11Reflects activity of the Series and does not include the activity of the Underlying Series.
12The increase to the expense ratios (to average net assets) is largely due to the small net assets in each class.
The accompanying notes are an integral part of the financial statements.
14
Financial Highlights
| FOR THE YEARS ENDED | FOR THE PERIOD | |||||||||||||||
| STRATEGIC INCOME MODERATE SERIES CLASS S | 12/31/15 | 12/31/14 | 12/31/13 | 8/1/121 TO 12/31/12 | ||||||||||||
Per share data (for a share outstanding throughout each period): | ||||||||||||||||
Net asset value - Beginning of period | $ | 10.84 | $ | 10.80 | $ | 10.07 | $ | 10.00 | ||||||||
|
|
|
|
|
|
|
| |||||||||
Income (loss) from investment operations: | ||||||||||||||||
Net investment income2,3 | 0.25 | 0.38 | 0.32 | 0.30 | ||||||||||||
Net realized and unrealized gain (loss) on investments | (0.36 | ) | 0.34 | 0.82 | 0.02 | |||||||||||
|
|
|
|
|
|
|
| |||||||||
Total from investment operations | (0.11 | ) | 0.72 | 1.14 | 0.32 | |||||||||||
|
|
|
|
|
|
|
| |||||||||
Less distributions to shareholders: | ||||||||||||||||
From net investment income | (0.20 | ) | (0.37 | ) | (0.30 | ) | (0.25 | ) | ||||||||
From net realized gain on investments | (0.22 | ) | (0.31 | ) | (0.11 | ) | (0.00 | )4 | ||||||||
|
|
|
|
|
|
|
| |||||||||
Total distributions to shareholders | (0.42 | ) | (0.68 | ) | (0.41 | ) | (0.25 | ) | ||||||||
|
|
|
|
|
|
|
| |||||||||
Net asset value - End of period | $ | 10.31 | $ | 10.84 | $ | 10.80 | $ | 10.07 | ||||||||
|
|
|
|
|
|
|
| |||||||||
Net assets - End of period (000’s omitted) | $ | 16,040 | $ | 15,751 | $ | 6,722 | $ | 2,019 | ||||||||
|
|
|
|
|
|
|
| |||||||||
Total return5 | (1.01 | %) | 6.66 | % | 11.49 | % | 3.23 | % | ||||||||
Ratios (to average net assets)/Supplemental Data: | ||||||||||||||||
Expenses* | 0.30 | %6 | 0.30 | %7 | 0.30 | %8 | 0.30 | %9,10 | ||||||||
Net investment income2 | 2.29 | % | 3.37 | % | 2.99 | % | 2.92 | % | ||||||||
Series portfolio turnover11 | 74 | % | 35 | % | 78 | % | 7 | % | ||||||||
| *The investment advisor paid a portion of the Series’ expenses. If these expenses had been incurred by the Series, the expense ratios (to average net assets) would have been increased by the following amounts: | ||||||||||||||||
|
| 0.57
| %6
|
| 0.73
| %7
|
| 1.82
| %8
|
| 10.28
| %9,10,12
| |||||
| FOR THE YEARS ENDED | FOR THE PERIOD | |||||||||||||||
| STRATEGIC INCOME MODERATE SERIES CLASS I | 12/31/15 | 12/31/14 | 12/31/13 | 8/1/121 TO 12/31/12 | ||||||||||||
Per share data (for a share outstanding throughout each period): | ||||||||||||||||
Net asset value - Beginning of period | $ | 10.84 | $ | 10.80 | $ | 10.07 | $ | 10.00 | ||||||||
|
|
|
|
|
|
|
| |||||||||
Income (loss) from investment operations: | ||||||||||||||||
Net investment income2,3 | 0.30 | 0.41 | 0.55 | 0.22 | ||||||||||||
Net realized and unrealized gain (loss) on investments | (0.39 | ) | 0.34 | 0.62 | 0.10 | |||||||||||
|
|
|
|
|
|
|
| |||||||||
Total from investment operations | (0.09 | ) | 0.75 | 1.17 | 0.32 | |||||||||||
|
|
|
|
|
|
|
| |||||||||
Less distributions to shareholders: | ||||||||||||||||
From net investment income | (0.22 | ) | (0.40 | ) | (0.33 | ) | (0.25 | ) | ||||||||
From net realized gain on investments | (0.22 | ) | (0.31 | ) | (0.11 | ) | (0.00 | )4 | ||||||||
|
|
|
|
|
|
|
| |||||||||
Total distributions to shareholders | (0.44 | ) | (0.71 | ) | (0.44 | ) | (0.25 | ) | ||||||||
|
|
|
|
|
|
|
| |||||||||
Net asset value - End of period | $ | 10.31 | $ | 10.84 | $ | 10.80 | $ | 10.07 | ||||||||
|
|
|
|
|
|
|
| |||||||||
Net assets - End of period (000’s omitted) | $ | 3,948 | $ | 2,136 | $ | 1,373 | $ | 53 | ||||||||
|
|
|
|
|
|
|
| |||||||||
Total return5 | (0.76 | %) | 6.90 | % | 11.73 | % | 3.29 | % | ||||||||
Ratios (to average net assets)/Supplemental Data: | ||||||||||||||||
Expenses* | 0.05 | %6 | 0.05 | %7 | 0.05 | %8 | 0.05 | %9,10 | ||||||||
Net investment income2 | 2.76 | % | 3.65 | % | 5.17 | % | 2.16 | % | ||||||||
Series portfolio turnover11 | 74 | % | 35 | % | 78 | % | 7 | % | ||||||||
| * The investment advisor paid a portion of the Series’ expenses. If these expenses had been incurred by the Series, the expense ratios (to average net assets) would have been increased by the following amounts: | ||||||||||||||||
| 0.67 | %6 | 0.73 | %7 | 1.82 | %8 | 27.25 | %9,10,12 | |||||||||
1Commencement of operations.
2Net investment income is affected by the timing of distributions from the Underlying Series in which the Series invest. The ratios do not include net investment income of the Underlying Series in which the Series invests.
3Calculated based on average shares outstanding during the periods.
4Less than ($0.01) per share.
5Represents aggregate total return for the periods indicated. Total return would have been lower had certain expenses not been reimbursed during the periods. Periods less than one year are not annualized.
6Expense ratios do not include expenses of the Underlying Series in which the Series invests. The average expense ratio of the Underlying Series was 0.57%.
7Expense ratios do not include expenses of the Underlying Series in which the Series invests. The average expense ratio of the Underlying Series was 0.49%.
8Expense ratios do not include expenses of the Underlying Series in which the Series invests. The average expense ratio of the Underlying Series was 0.65%.
9Annualized.
10Expense ratios do not include expenses of the Underlying Series in which the Series invests. The average expense ratio of the Underlying Series was 0.70%.
11Reflects activity of the Series and does not include the activity of the Underlying Series.
12The increase to the expense ratios (to average net assets) is largely due to the small net assets in each class.
The accompanying notes are an integral part of the financial statements.
15
Notes to Financial Statements
| 1. | Organization |
Strategic Income Conservative Series and Strategic Income Moderate Series (each the “Series”) are no-load diversified series of Manning & Napier Fund, Inc. (the “Fund”). The Fund is organized in Maryland and is registered under the Investment Company Act of 1940 (the “1940 Act”), as amended, as an open-end management investment company.
Strategic Income Conservative Series’ investment objective is to manage against capital risk and generate income with a secondary goal of pursuing long-term capital growth. Strategic Income Moderate Series’ investment objective is to manage against capital risk while generating income and pursuing long-term capital growth.
Each Series seeks to achieve its investment objective by investing in a combination of other Manning & Napier mutual funds (the “Underlying Series”). As of December 31, 2015, the Underlying Series include the Core Bond Series, Unconstrained Bond Series (formerly Core Plus Bond Series), Disciplined Value Series, High Yield Bond Series, Real Estate Series and Equity Income Series of the Fund for Strategic Income Conservative Series and Strategic Income Moderate Series. The financial statements of the Underlying Series, which are available at www.manning-napier.com, should be read in conjunction with the Series’ financial statements.
Each Series is authorized to issue two classes of shares (Class S and I). Each class of shares is substantially the same, except that Class S shares bear a shareholder services fee.
The Fund’s advisor is Manning & Napier Advisors, LLC (the “Advisor”). Shares of each Series are offered to investors and employees of the Advisor and its affiliates. The total authorized capital stock of the Fund consists of 15 billion shares of common stock each having a par value of $0.01. As of December 31, 2015, 10.7 billion shares have been designated in total among 41 series, of which 100 million have been designated in each of the Series for Class S common stock and 100 million have been designated in each of the Series for Class I common stock.
| 2. | Significant Accounting Policies |
The following is a summary of significant accounting policies followed by the Series. Each Series is an investment company and, accordingly, follows the investment company accounting and reporting guidance of the Financial Accounting Standards Board Accounting Standards Codification Topic 946 - Investment Companies, which is part of accounting principles generally accepted in the United States of America (“GAAP”).
Security Valuation
Investments in the Underlying Series are valued at their net asset value per share on valuation date. In the absence of the availability of a net asset value per share on the Underlying Series, security valuations may be determined in good faith by the Advisor under procedures approved by and under the general supervision and responsibility of the Fund’s Board of Directors (the “Board”).
Volume and level of activity in established markets for an asset or liability are evaluated to determine whether recent transactions and quoted prices are determinative of fair value. Where there have been significant decreases in volume and level of activity, further analysis and adjustment may be necessary to estimate fair value. The Series measure fair value in these instances by the use of inputs and valuation techniques which may be based upon current market prices of securities that are comparable in coupon, rating, maturity and industry and/or expectation of future cash flows. As a result of trading in relatively thin markets and/or markets that experience significant volatility, the prices used by the Series to value these securities may differ from the value that would be realized if these securities were sold, and the differences could be material.
Securities for which representative valuations or prices are not available from the Series’ pricing service may be valued at fair value as determined in good faith by the Advisor under procedures approved by and under the general supervision and responsibility of the Board. Due to the inherent uncertainty of valuations of such securities, the fair value may differ significantly from the values that would have been used had a ready market for such securities existed. If trading or events occurring after the close of the principal market in which securities are traded are expected to materially affect the value of those securities, then they may be valued at their fair value, taking this trading or these events into account.
16
Notes to Financial Statements (continued)
| 2. | Significant Accounting Policies (continued) |
Security Valuation (continued)
Various inputs are used in determining the value of the Series’ assets or liabilities carried at fair value. These inputs are summarized in three broad levels. Level 1 includes quoted prices in active markets for identical assets and liabilities. Level 2 includes other significant observable inputs (including quoted prices for similar securities, interest rates, prepayment speeds, credit risk, etc.). Level 3 includes significant unobservable inputs (including the Series’ own assumptions in determining the fair value of investments). A financial instrument’s level within the fair value hierarchy is based on the lowest level on any input both individually and in aggregate that is significant to the fair value measurement. The inputs or methodology used for valuing securities are not necessarily an indication of the risk associated with investing in those securities.
The following is a summary of the valuation levels used for major security types as of December 31, 2015 in valuing the Series’ assets or liabilities carried at fair value:
| STRATEGIC INCOME CONSERVATIVE SERIES | ||||||||||||||||
| DESCRIPTION | TOTAL | LEVEL 1 | LEVEL 2 | LEVEL 3 | ||||||||||||
Assets: | ||||||||||||||||
Mutual funds | $ | 20,058,429 | $ | 20,058,429 | $ | — | $ | — | ||||||||
|
|
|
|
|
|
|
| |||||||||
Total assets: | $ | 20,058,429 | $ | 20,058,429 | $ | — | $ | — | ||||||||
|
|
|
|
|
|
|
| |||||||||
| STRATEGIC INCOME MODERATE SERIES | ||||||||||||||||
| DESCRIPTION | TOTAL | LEVEL 1 | LEVEL 2 | LEVEL 3 | ||||||||||||
Assets: | ||||||||||||||||
Mutual funds | $ | 19,995,560 | $ | 19,995,560 | $ | — | $ | — | ||||||||
|
|
|
|
|
|
|
| |||||||||
Total assets: | $ | 19,995,560 | $ | 19,995,560 | $ | — | $ | — | ||||||||
|
|
|
|
|
|
|
| |||||||||
There were no Level 2 or Level 3 securities held by either of the Series as of December 31, 2014 or December 31, 2015.
The Fund’s policy is to recognize transfers in and transfers out of the valuation levels as of the beginning of the reporting period. There were no transfers between Level 1 and Level 2 during the year ended December 31, 2015.
Security Transactions, Investment Income and Expenses
Security transactions are accounted for on trade date. Dividend income is recorded on the ex-dividend date. Non-cash dividends, if any, are recorded at the fair value of the securities received. Income and capital gains distributions from the Underlying Series, if any, are recorded on the ex-dividend date.
Expenses are recorded on an accrual basis. Most expenses of the Fund can be attributed to a specific series. Expenses which cannot be directly attributed are apportioned among the series in the Fund in such a manner as deemed equitable by the Fund’s Board, taking into consideration, among other things, the nature and type of expense. Income, expenses (other than shareholder services fees), and realized and unrealized gains and losses are prorated among the classes based on the relative net assets of each class. Class specific expenses are directly charged to that class. Expenses included in the accompanying Statements of Operations do not include any expense of the Underlying Series.
The Series use the identified cost method for determining realized gain or loss on investments for both financial statement and federal income tax reporting purposes.
Federal Taxes
Each Series’ policy is to comply with the provisions of the Internal Revenue Code applicable to regulated investment companies. The Series are not subject to federal income tax or excise tax to the extent that each Series distributes to shareholders each year its taxable income, including any net realized gains on investments, in accordance with requirements of the Internal Revenue Code. Accordingly, no provision for federal income tax or excise tax has been made in the financial statements.
17
��
Notes to Financial Statements (continued)
| 2. | Significant Accounting Policies (continued) |
Federal Taxes (continued)
Management evaluates its tax positions to determine if the tax positions taken meet the minimum recognition threshold in connection with accounting for uncertainties in income tax positions taken or expected to be taken for the purposes of measuring and recognizing tax liabilities in the financial statements. Recognition of tax benefits of an uncertain tax position is required only when the position is “more likely than not” to be sustained assuming examination by taxing authorities. At December 31, 2015, the Series have recorded no liability for net unrecognized tax benefits relating to uncertain income tax positions taken or expected to be taken in future tax returns.
The Series file income tax returns in the U.S. federal jurisdiction, various states and foreign jurisdictions, as required. No income tax returns are currently under investigation. As the commencement of operations of the Series was August 1, 2012, the statute of limitations remains open for the period ended December 31, 2012 and the years ended December 31, 2013, December 31, 2014 and December 31, 2015. The Series are not aware of any tax positions for which it is reasonably possible that the total amounts of unrecognized tax benefits will significantly change in the next twelve months.
Foreign Taxes
Based on the Series’ understanding of the tax rules and rates related to income, gains and currency purchase/ repatriation transactions for foreign jurisdictions in which they invest, the Series will provide for foreign taxes, and where appropriate, deferred foreign tax.
Distributions of Income and Gains
Distributions to shareholders of net investment income are made quarterly. Distributions of net realized gains are made annually. An additional distribution may be necessary to avoid taxation of a Series. Distributions are recorded on the ex-dividend date.
Indemnifications
The Fund’s organizational documents provide former and current directors and officers with a limited indemnification against liabilities arising in connection with the performance of their duties to the Fund. In the normal course of business, the Fund may also enter into contracts that provide general indemnifications. The Fund’s maximum exposure under these arrangements is unknown as this would be dependent on future claims that may be made against the Fund. The risk of material loss from such claims is considered remote.
Other
The preparation of financial statements in conformity with GAAP requires management to make estimates and assumptions that affect the reported amounts of assets and liabilities and the disclosure of contingent assets and liabilities at the date of the financial statements and the reported amounts of income and expenses during the reporting period. Actual results could differ from those estimates.
| 3. | Transactions with Affiliates |
The Fund has an Investment Advisory Agreement (the “Agreement”) with the Advisor, for which the Advisor does not receive an advisory fee for the services it performs for the Series. However, the Advisor is entitled to receive an advisory fee from each of the Underlying Series in which the Series invest.
Under the Agreement, personnel of the Advisor provide the Series with advice and assistance in the choice of investments and the execution of securities transactions, and otherwise maintain the Series’ organization. The Advisor also provides the Fund with necessary office space and fund administration and support services. The salaries of all officers of the Fund (except a percentage of the Fund’s Chief Compliance Officer’s salary, which is paid by the Fund), and of all Directors who are “affiliated persons” of the Fund, or of the Advisor, and all personnel of the Fund, or of the Advisor, performing services relating to research, statistical and investment activities, are paid by the Advisor. Each “non-affiliated” Director receives an annual stipend, which is allocated among all the active series of the Fund. In addition, these Directors also receive a fee per Board meeting attended plus a fee for each committee meeting attended and are reimbursed for travel and other out-of-pocket expenses incurred by them in connection with attending such meetings. The Fund also has an Audit Committee Chair, who receives an additional annual stipend for this role.
18
Notes to Financial Statements (continued)
| 3. | Transactions with Affiliates (continued) |
The Class S shares of the Series are subject to a shareholder services fee in accordance with a shareholder service plan adopted by the Board. The shareholder services fee is intended to compensate financial intermediaries, including affiliates of the Fund, in connection with the provision of direct client services, personal services, maintenance of shareholder accounts and reporting services. For these services, Class S of the Series pays a fee, computed daily and payable monthly, at an annual rate of 0.25% of the average daily net assets of Class S. The Fund has a Shareholder Services Agreement with the Advisor, for which the Advisor receives the shareholder services fee as stated above.
Manning & Napier Investor Services, Inc., a registered broker-dealer affiliate of the Advisor, acts as distributor for the Fund’s shares. The services of Manning & Napier Investor Services, Inc. are provided at no additional cost to the Series.
The Advisor has contractually agreed, until at least April 30, 2016, to limit each class’ total direct annual fund operating expenses for the Series at no more than 0.05% for each class, exclusive of each class’ shareholder services fee, of average daily net assets each year. The Advisor’s agreement to limit each class’ operating expenses is limited to direct operating expenses and, therefore, does not apply to the indirect expenses incurred by the Series through their investments in the Underlying Series. For the year ended December 31, 2015, the Advisor reimbursed expenses of $117,464 for Strategic Income Conservative Series and $118,882 for Strategic Income Moderate Series, which is included as a reduction of expenses on the Statements of Operations. The Advisor is not eligible to recoup any expenses that have been waived or reimbursed in prior years.
Pursuant to a master services agreement dated November 1, 2014, the Fund pays the Advisor an annual fee related to fund accounting and administration of 0.00225% of average daily net assets with an annual base fee of $45,400 per Strategic Income Series. Transfer agent fees are charged to the Fund on a per account basis. Additionally, certain transaction and out-of-pocket expenses, including charges for reporting relating to the Fund’s compliance program, are charged. The Advisor has agreements with BNY Mellon Investment Servicing (U.S.) Inc. (“BNY”) under which BNY serves as sub-accountant services agent and sub-transfer agent.
Expenses not directly attributable to a series are allocated based on each series’ relative net assets or number of accounts, depending on the expense.
| 4. | Purchases and Sales of Securities |
For the year ended December 31, 2015, purchases and sales of Underlying Series were as follows:
| SERIES | PURCHASES | SALES | ||||||
Strategic Income Conservative Series | $ | 22,832,379 | $ | 29,310,808 | ||||
Strategic Income Moderate Series | $ | 18,943,754 | $ | 14,989,400 | ||||
19
Notes to Financial Statements (continued)
| 5. | Investments in Affiliated Issuers |
A summary of the Series’ transactions in the shares of affiliated issuers during the year ended December 31, 2015 is set forth below:
| STRATEGIC INCOME CONSERVATIVE SERIES | VALUE AT 12/31/14 | PURCHASE COST | SALES PROCEEDS | VALUE AT 12/31/15 | SHARES HELD AT 12/31/15 | DIVIDEND INCOME 1/1/15 THROUGH 12/31/15 | DISTRIBUTIONS AND NET REALIZED GAIN/(LOSS) 1/1/15 THROUGH 12/31/15 | |||||||||||||||||||||
Manning & Napier Core Bond Series - Class A | $ | — | $ | 2,310,162 | $ | 2,294,586 | $ | — | — | $ | 38,994 | $ | (15,576 | ) | ||||||||||||||
Manning & Napier Core Bond Series - Class I | — | 14,682,567 | 4,670,602 | 9,742,198 | 999,200 | 145,436 | 13,003 | |||||||||||||||||||||
Manning & Napier Disciplined Value Series - Class I | 3,268,770 | 1,092,464 | 1,696,655 | 2,281,832 | 168,029 | 69,725 | 326,327 | |||||||||||||||||||||
Manning & Napier Equity Income Series - Class I | 2,814,926 | 1,653,816 | 1,598,873 | 2,756,878 | 272,150 | 61,504 | 79,344 | |||||||||||||||||||||
Manning & Napier High Yield Bond Series - Class I | 549,158 | 144,331 | 275,252 | 380,733 | 46,544 | 28,324 | (30,855 | ) | ||||||||||||||||||||
Manning & Napier Real Estate Series - Class I | 1,517,163 | 915,407 | 877,942 | 1,283,449 | 176,784 | 46,546 | 268,004 | |||||||||||||||||||||
Manning & Napier Unconstrained Bond Series - Class I | 19,548,965 | 2,033,632 | 17,896,898 | 3,613,339 | 396,200 | 215,506 | (568,021 | ) | ||||||||||||||||||||
|
|
|
|
|
|
|
|
|
|
|
|
|
| |||||||||||||||
| $ | 27,698,982 | $ | 22,832,379 | $ | 29,310,808 | $ | 20,058,429 | $ | 606,035 | $ | 72,226 | |||||||||||||||||
|
|
|
|
|
|
|
|
|
|
|
| |||||||||||||||||
20
Notes to Financial Statements (continued)
| 5. | Investments in Affiliated Issuers (continued) |
| STRATEGIC INCOME MODERATE SERIES | VALUE AT 12/31/14 | PURCHASE COST | SALES PROCEEDS | VALUE AT 12/31/15 | SHARES HELD AT 12/31/15 | DIVIDEND 1/1/15 THROUGH 12/31/15 | DISTRIBUTIONS AND NET REALIZED GAIN/(LOSS) 1/1/15 THROUGH 12/31/15 | |||||||||||||||||||||
Manning & Napier Core Bond Series - Class A | $ | — | $ | 582,160 | $ | 578,869 | $ | — | — | $ | 21,142 | $ | (3,291 | ) | ||||||||||||||
Manning & Napier Core Bond Series - Class I | — | 8,000,111 | 2,155,081 | 5,700,085 | 584,624 | 75,359 | 19,912 | |||||||||||||||||||||
Manning & Napier Disciplined Value Series - Class I | 3,302,958 | 2,727,609 | 998,975 | 4,387,361 | 323,075 | 102,224 | 578,899 | |||||||||||||||||||||
Manning & Napier Emerging Markets Series - Class I | 512,070 | 202,543 | 605,615 | — | — | — | (206,802 | ) | ||||||||||||||||||||
Manning & Napier Equity Income Series - Class I | 3,229,332 | 2,811,732 | 954,621 | 4,845,989 | 478,380 | 101,295 | 103,142 | |||||||||||||||||||||
Manning & Napier High Yield Bond Series - Class I | 876,712 | 853,865 | 265,359 | 1,350,787 | 165,133 | 74,053 | (30,729 | ) | ||||||||||||||||||||
Manning & Napier Inflation Focus Equity Series - Class I | 359,224 | 97,697 | 447,682 | — | — | — | (38,572 | ) | ||||||||||||||||||||
Manning & Napier Real Estate Series - Class I | 972,253 | 865,475 | 288,939 | 1,290,709 | 177,784 | 43,381 | 268,263 | |||||||||||||||||||||
Manning & Napier Unconstrained Bond Series - Class I | 8,374,752 | 2,802,562 | 8,694,259 | 2,420,629 | 265,420 | 114,608 | (221,013 | ) | ||||||||||||||||||||
|
|
|
|
|
|
|
|
|
|
|
|
|
| |||||||||||||||
| $ | 17,627,301 | $ | 18,943,754 | $ | 14,989,400 | $ | 19,995,560 | $ | 532,062 | $ | 469,809 | |||||||||||||||||
|
|
|
|
|
|
|
|
|
|
|
| |||||||||||||||||
21
Notes to Financial Statements (continued)
| 6. | Capital Stock Transactions |
Transactions in shares of Class S and Class I shares were:
| STRATEGIC INCOME CONSERVATIVE SERIES: | FOR THE YEAR ENDED 12/31/15 | FOR THE YEAR ENDED 12/31/14 | FOR THE YEAR ENDED 12/31/15 | FOR THE YEAR ENDED 12/31/14 | ||||||||||||||||||||||||||||
| CLASS S SHARES | AMOUNTS | CLASS S SHARES | AMOUNTS | CLASS I SHARES | AMOUNTS | CLASS I SHARES | AMOUNTS | |||||||||||||||||||||||||
Sold | 266,210 | $ | 2,734,472 | 885,964 | $ | 9,376,736 | 289,666 | $ | 2,913,017 | 957,307 | $ | 10,081,880 | ||||||||||||||||||||
Reinvested | 64,309 | 638,146 | 66,223 | 692,406 | 44,539 | 443,269 | 60,899 | 636,966 | ||||||||||||||||||||||||
Repurchased | (460,916 | ) | (4,710,298 | ) | (333,539 | ) | (3,524,134 | ) | (849,941 | ) | (8,603,323 | ) | (222,407 | ) | (2,349,324 | ) | ||||||||||||||||
|
|
|
|
|
|
|
|
|
|
|
|
|
|
|
| |||||||||||||||||
Total | (130,397 | ) | $ | (1,337,680 | ) | 618,648 | $ | 6,545,008 | (515,736 | ) | $ | (5,247,037 | ) | 795,799 | $ | 8,369,522 | ||||||||||||||||
|
|
|
|
|
|
|
|
|
|
|
|
|
|
|
| |||||||||||||||||
| STRATEGIC INCOME MODERATE SERIES: | FOR THE YEAR ENDED 12/31/15 | FOR THE YEAR ENDED 12/31/14 | FOR THE YEAR ENDED 12/31/15 | FOR THE YEAR ENDED 12/31/14 | ||||||||||||||||||||||||||||
| CLASS S SHARES | AMOUNTS | CLASS S SHARES | AMOUNTS | CLASS I SHARES | AMOUNTS | CLASS I SHARES | AMOUNTS | |||||||||||||||||||||||||
Sold | 448,047 | $ | 4,804,825 | 931,070 | $ | 10,351,280 | 188,772 | $ | 2,061,891 | 87,965 | $ | 1,001,032 | ||||||||||||||||||||
Reinvested | 56,914 | 586,644 | 70,763 | 779,436 | 15,953 | 164,451 | 11,850 | 130,733 | ||||||||||||||||||||||||
Repurchased | (403,170 | ) | (4,289,911 | ) | (170,855 | ) | (1,879,607 | ) | (18,900 | ) | (199,000 | ) | (29,935 | ) | (325,094 | ) | ||||||||||||||||
|
|
|
|
|
|
|
|
|
|
|
|
|
|
|
| |||||||||||||||||
Total | 101,791 | $ | 1,101,558 | 830,978 | $ | 9,251,109 | 185,825 | $ | 2,027,342 | 69,880 | $ | 806,671 | ||||||||||||||||||||
|
|
|
|
|
|
|
|
|
|
|
|
|
|
|
| |||||||||||||||||
At December 31, 2015, one shareholder account owned 213,578 shares of the Strategic Income Conservative Series (approximately 10.51% of the shares outstanding) valued at $2,108,018. Approximately 5% of the shares outstanding of the Strategic Income Moderate Series are fiduciary accounts where the Advisor has sole investment discretion.
| 7. | Financial Instruments |
The Underlying Series may trade in instruments including written and purchased options, forward foreign currency exchange contracts and futures contracts and other derivatives in the normal course of investing activities to assist in managing exposure to various market risks. The Underlying Series may be subject to various elements of risk which may involve, to a varying degree, elements of risk in excess of the amounts recognized for financial statement purposes. These risks include: the risk that changes in the value of a derivative may not correlate perfectly with the underlying asset, rate or index; counterparty credit risk related to over the counter derivative counterparties’ failure to perform under contract terms; liquidity risk related to the lack of a liquid market for these contracts allowing the Underlying Series to close out their position(s); and documentation risk relating to disagreement over contract terms. No such investments were held by the Underlying Series as of December 31, 2015.
| 8. | Federal Income Tax Information |
The amount and characterization of certain income and capital gains to be distributed are determined in accordance with federal income tax regulations, which may differ from GAAP. These differences are primarily due to differing book and tax treatments in the timing and/or treatment of the recognition of net investment income or gains and losses, including losses deferred due to wash sales and distributions from the Underlying Series. Each Series may periodically make reclassifications among its capital accounts to reflect income and gains available for distribution (or available capital loss carryovers) under income tax regulations without impacting the Series’ net asset value. For the fiscal year ended December 31, 2015, $691 was reclassified within Strategic Income Conservative Series capital accounts from Undistributed Net Investment Income to Accumulated Net Realized Loss on Investments. For the fiscal year ended December 31, 2015, $4,363 was reclassified within Strategic Income Moderate Series capital accounts to Undistributed Net Investment Income from Accumulated Net Realized Gain on Investments. Any such reclassifications are not reflected in the financial highlights.
22
Notes to Financial Statements (continued)
| 8. | Federal Income Tax Information (continued) |
The tax character of distributions paid were as follows:
| STRATEGIC INCOME CONSERVATIVE SERIES | STRATEGIC INCOME MODERATE SERIES | |||||||
Ordinary income (2015) | $ | 553,066 | $ | 440,620 | ||||
Ordinary income (2014) | $ | 970,832 | $ | 672,445 | ||||
Long-term capital gain (2015) | $ | 545,045 | $ | 356,132 | ||||
Long-term capital gain (2014) | $ | 380,245 | $ | 276,284 | ||||
At December 31, 2015, the tax basis of components of distributable earnings and the net unrealized depreciation based on the identified cost for federal income tax purposes were as follows:
| STRATEGIC INCOME CONSERVATIVE SERIES | STRATEGIC INCOME MODERATE SERIES | |||||||
Cost for federal income tax purposes | $ | 21,507,366 | $ | 21,655,166 | ||||
Unrealized appreciation | 2,090 | 1,411 | ||||||
Unrealized depreciation | (1,451,027 | ) | (1,661,017 | ) | ||||
|
|
|
| |||||
Net unrealized depreciation | $ | (1,448,937 | ) | $ | (1,659,606 | ) | ||
|
|
|
| |||||
Undistributed ordinary income | $ | 88,535 | $ | 97,437 | ||||
Undistributed long-term capital gains | $ | 226,284 | $ | 492,375 | ||||
23
Report of Independent Registered Public Accounting Firm
To the Board of Directors of Manning & Napier Fund, Inc. and Shareholders of –Strategic Income Conservative Series and Strategic Income Moderate Series:
In our opinion, the accompanying statements of assets and liabilities and the related statements of operations and of changes in net assets and the financial highlights present fairly, in all material respects, the financial position of Strategic Income Conservative Series and Strategic Income Moderate Series (each a series of Manning & Napier Fund, Inc. hereafter collectively referred to as the “Series”) at December 31, 2015, the results of each of their operations for the year then ended, the changes in each of their net assets for each of the two years in the period then ended and the financial highlights for each of the periods presented, in conformity with accounting principles generally accepted in the United States of America. These financial statements and financial highlights (hereafter referred to as “financial statements”) are the responsibility of the Series’ management. Our responsibility is to express an opinion on these financial statements based on our audits. We conducted our audits of these financial statements in accordance with the standards of the Public Company Accounting Oversight Board (United States). Those standards require that we plan and perform the audit to obtain reasonable assurance about whether the financial statements are free of material misstatement. An audit includes examining, on a test basis, evidence supporting the amounts and disclosures in the financial statements, assessing the accounting principles used and significant estimates made by management, and evaluating the overall financial statement presentation. We believe that our audits, which included confirmation of securities at December 31, 2015 by correspondence with the transfer agent, custodian and brokers, provide a reasonable basis for our opinion.

New York, New York
February 19, 2016
24
Supplemental Tax Information
(unaudited)
All reportings are based on financial information available as of the date of this annual report and, accordingly, are subject to change.
For federal income tax purposes, each of the Series reports for the current fiscal year the amount disclosed below or, if different, the maximum amount allowable under the tax law, as qualified dividend income (“QDI”).
| Series | QDI | |||
Strategic Income Conservative Series | $ | 144,067 | ||
Strategic Income Moderate Series | $ | 215,948 | ||
For corporate shareholders, the percentage of investment income (dividend income plus short-term gain, if any) that qualifies for the dividends received deduction (DRD) for the current fiscal year is as follows:
| Series | DRD% | |||
Strategic Income Conservative Series | 19.83 | % | ||
Strategic Income Moderate Series | 34.13 | % | ||
The Series designates Long-Term Capital Gain dividends pursuant to Section 852(b) of the Internal Revenue Code for the fiscal year ended December 31, 2015 as follows:
| Series | Long-Term Cap Gain Designation | |||
Strategic Income Conservative Series | $ | 237,781 | ||
Strategic Income Moderate Series | $ | 517,358 | ||
25
Renewal of Investment Advisory Agreement
(unaudited)
At the Manning & Napier Fund, Inc. (the “Fund”) Board of Directors’ (the “Board”) meeting, held on November 17, 2015, the Investment Advisory Agreement (the “Agreement”) between the Fund and Manning & Napier Advisors, LLC (the “Advisor”) was considered by the Board for renewal. In connection with the decision whether to renew the Agreement, a variety of material was prepared for and considered by the Board.
Representatives of the Advisor attended the meeting and presented additional oral and written information to the Board to assist the Board in its considerations. The discussion immediately below outlines the materials and information presented to the Board in connection with the Board’s 2015 Annual consideration of the Agreement and the conclusions made by the Directors when determining to continue the Agreement.
| • | The Board considered the services provided by the Advisor under the Agreement including, among others: deciding what securities to purchase and sell for each Series; arranging for the purchase and sale of such securities by placing orders with broker-dealers; administering the affairs of the Fund (including the books and records of the Fund not maintained by third party service providers such as the custodian or sub-transfer agent); arranging for the insurance coverage for the Fund; and supervising the preparation of tax returns, SEC filings (including registration statements) and reports to shareholders for the Fund. The Board also considered the nature and quality of such services provided under the Agreement in light of the Advisor’s services provided to the Fund for 29 years. The Board discussed the quality of these services with representatives from the Advisor and concluded that the Advisor was performing its services to the Fund required under the Agreement in a reasonable manner. |
| • | The Board considered the performance of each Series since its inception, as well as performance over multiple time periods. Performance for one or more of the following time periods was considered as applicable to the Series’ inception date: inception, three year, five year, ten year, and current market cycle. A market cycle includes periods of both rising and falling markets. Returns for established benchmark indices for each Series were provided. In addition, the Board considered a number of other factors relevant to performance at the meeting (and considers on a quarterly basis) including: a peer group performance analysis consisting of Morningstar universes of mutual funds with similar investment objectives, investment performance of core products, product offerings, performance on an aggregate basis vs. performance over reasonable time periods and the Advisor’s investment process. The Directors acknowledged the challenging performance and discussed the investment process of the Advisor. The Directors confirmed that qualitative factors such as the Advisor’s investment process, including recent enhancements, were an important subset to be considered as part of their consideration of performance. The Board discussed the performance with representatives from the Advisor and concluded that the investment performance of each of the Fund’s Series was reasonable based on the Series’ actual performance and comparative performance, especially for those series with performance over the current market cycle. |
| • | The Board considered the costs of the Advisor’s services and the profits of the Advisor as they relate to the Advisor’s services to the Fund under the Agreement. In reviewing the Advisor’s costs and profits, the Board discussed the Advisor’s revenues generated from the Fund (on both an actual and adjusted basis) and its expenses associated with providing the services under the Agreement. In addition, the Board reviewed the Advisor’s expenses associated with Fund activities outside of the Agreement (such as expense reimbursements pursuant to expense caps and payments made by the Advisor to third party platforms on which shares of the Fund are available for purchase). It was noted by representatives of the Advisor that 22 of the 36 active Series of the Fund are currently experiencing expenses above the capped expense ratios, and thus the Advisor is incurring those expenses over the cap. After discussing the above costs and profits, the Board concluded that the Advisor’s profitability relating to its services provided under the Agreement was reasonable. |
| • | The Board considered the fees and expenses of the various Series of the Fund. The Advisor presented the advisory fees and total expenses for each Series, including the advisory fee adjusted for any expense waivers or reimbursements (either contractual or voluntary) paid by the Advisor. The advisory fees and expense ratios of each Series were compared to an average (on both a mean and median basis) of similar funds as disclosed on the Morningstar database. Representatives of the Advisor discussed with the Board the levels of its advisory fee for each Series of the Fund and as compared to the median and mean advisory fees for similar funds as listed on Morningstar. Expense ratios for every Series, except the Tax Managed Series, Equity Income Class S, High Yield Bond Class S, Pro-Blend Series Classes C and R, and Target Series’ Classes R and K, are lower than, or substantially similar to the Morningstar mean and median reported total expense ratio. |
26
Renewal of Investment Advisory Agreement
(unaudited)
The higher than mean and median total expense ratios for Classes C and R reflect higher distribution, marketing and shareholder service fees payable to broker-dealers through a 100bp 12b-1 fee for Class C and a 50bp 12b-1 fee for Class R. Based on their review of the information provided, the Board concluded that the fees and expenses of each Series of the Fund were reasonable on a comparative basis.
| • | The Board also considered the other benefits the Advisor derives from its relationship with the Fund. Such other benefits include certain research services provided by soft dollars. The Board reviewed the broker-dealers who provided research to the Advisor and the products and services paid for, in whole or in part, using soft dollar commissions. Given the level of soft dollar transactions involving the Fund, the Board concluded that these additional benefits to the Advisor were reasonable. |
| • | In addition to the factors described above, the Board considered the Advisor’s personnel, investment strategies, policies and procedures relating to compliance with personal securities transactions, reputation, expertise and resources in domestic and foreign financial markets. The Board concluded that these factors support the conclusion that the Advisor performs its services in a reasonable manner. |
| • | The Board then considered economies of scale and concluded that the current fee schedule to the advisory agreement remained reasonable given the multiple uses of the Fund (for the Advisor’s discretionary investment account clients in addition to direct investors), the current profitability of the Advisor’s services to the Fund under the Agreement, the number of newly established series of the Fund and the overall size of the Fund complex. |
Based on the Board’s deliberations and their evaluation of the information described above, the Board, including a majority of Directors that are not “interested persons” as defined in the Investment Company Act of 1940, concluded that the compensation under the Agreement was fair and reasonable in light of the services and expenses and such other matters as the Directors considered to be relevant in the exercise of their reasonable judgment. Accordingly, the Board approved the renewal of the Agreement. In the course of their deliberations, the Directors did not identify any particular information that was all important or controlling.
27
Directors’ and Officers’ Information
(unaudited)
The Statement of Additional Information provides additional information about the Fund’s directors and officers and can be obtained without charge by calling 1-800-466-3863, at www.manningnapieradvisors.com, or on the EDGAR Database on the SEC Internet web site (http:// www.sec.gov). The following chart shows certain information about the Fund’s officers and directors, including their principal occupations during the last five years. Unless specific dates are provided, the individuals have held the listed positions for longer than five years.
| Interested Director/Officer | ||
| Name: | James E. Mikolaichik* | |
| Address: | 290 Woodcliff Drive | |
| Fairport, NY 14450 | ||
| Age: | 44 | |
| Current Position(s) Held with Fund: | Principal Executive Officer, President, Chairman & Director | |
| Term of Office1 & Length of Time Served: | Indefinite – Chairman and Director since August 2015 | |
| Principal Occupation(s) During Past 5 Years: | Chief Financial Officer (since 2011) - Manning & Napier Advisors, LLC; Executive Vice President and Head of Strategy (2008-2011) and Chief Risk Officer (2004-2008) - Old Mutual Asset Management Holds or has held one or more of the following title for various subsidiaries and affiliates: Chief Financial Officer. | |
| Number of Portfolios Overseen within Fund Complex: | 41 | |
| Other Directorships Held Outside Fund Complex: | N/A | |
| Independent Directors | ||
| Name: | Stephen B. Ashley | |
| Address: | 290 Woodcliff Drive | |
| Fairport, NY 14450 | ||
| Age: | 75 | |
| Current Position(s) Held with Fund: | Director, Audit Committee Member, Governance & Nominating Committee Member | |
| Term of Office & Length of Time Served: | Indefinite - Since 1996 | |
| Principal Occupation(s) During Past 5 Years: | Chairman, Director, President & Chief Executive Officer (1997 to present) - The Ashley Group (property management and investment); Director (1995-2008) and Chairman (non-executive) (2004-2008) - Fannie Mae (mortgage). | |
| Number of Portfolios Overseen within Fund Complex: | 41 | |
| Other Directorships Held Outside Fund Complex: | Fannie Mae (1995-2008) The Ashley Group (1995-2008) Genesee Corporation (1987-2007) | |
| Name: | Paul A. Brooke | |
| Address: | 290 Woodcliff Drive | |
| Fairport, NY 14450 | ||
| Age: | 70 | |
| Current Position(s) Held with Fund: | Director, Audit Committee Member, Governance & Nominating Committee | |
| Member | ||
| Term of Office & Length of Time Served: | Indefinite - Since 2007 | |
| Principal Occupation(s) During Past 5 Years: | Chairman & CEO (2005-2009) - Ithaka Acquisition Corporation (investments); Chairman (2007-2009) Alsius Corporation (investments); | |
| Managing Member, PMSV Holdings LLC (investments) since 1991; | ||
| Managing Member, Venbio (investments) since 2010. | ||
| Number of Portfolios Overseen within Fund Complex: | 41 | |
| Other Directorships Held Outside Fund Complex: | Incyte Corp. (2000-present) | |
| ViroPharma, Inc. (2000-2014) | ||
| HLTH Corp (WebMD) (2000-2010) | ||
| Cheyne Capital International (2000-present) | ||
| GMP Companies (2000-2011) | ||
| Cytos Biotechnology Ltd. (2012-2014) | ||
28
Directors’ and Officers’ Information (unaudited)
| ||
| Independent Directors (continued) | ||
| Name: | Peter L. Faber | |
| Address: | 290 Woodcliff Drive | |
| Fairport, NY 14450 | ||
| Age: | 77 | |
| Current Position(s) Held with Fund: | Director, Governance & Nominating Committee Member | |
| Term of Office & Length of Time Served: | Indefinite - Since 1987 | |
| Principal Occupation(s) During Past 5 Years: | Senior Counsel (2006-2012), Partner (1995-2006 & 2013-present) - McDermott, Will & Emery LLP (law firm) | |
| Number of Portfolios Overseen within Fund Complex: | 41 | |
| Other Directorships Held Outside Fund Complex: | Boston Early Music Festival (non-profit)(2007-present) | |
| Amherst Early Music, Inc. (non-profit)(2009-present) | ||
| Gotham Early Music Scene, Inc. (non-profit)(2009-present) | ||
| Partnership for New York City, Inc. (non-profit) (1989-2010) | ||
| New York Collegium (non-profit) (2004-2011) | ||
| Name: | Harris H. Rusitzky | |
| Address: | 290 Woodcliff Drive | |
| Fairport, NY 14450 | ||
| Age: | 80 | |
| Current Position(s) Held with Fund: | Director, Audit Committee Member, Governance & Nominating Committee Member | |
| Term of Office & Length of Time Served: | Indefinite - Since 1985 | |
| Principal Occupation(s) During Past 5 Years: | President, The Greening Group (business consultants) since 1994; Partner, The Restaurant Group (restaurants) since 2006 | |
| Number of Portfolios Overseen within Fund Complex: | 41 | |
| Other Directorships Held Outside Fund Complex: | Rochester Institute of Technology (university)(1972-present) | |
| Culinary Institute of America (non-profit college)(1985-present) | ||
| George Eastman House (museum)(1988-present) | ||
| National Restaurant Association (restaurant trade organization)(1978-present) | ||
| Name: | Chester N. Watson | |
| Address: | 290 Woodcliff Drive | |
| Fairport, NY 14450 | ||
| Age: | 65 | |
| Current Position(s) Held with Fund: | Director, Audit Committee Chairman, Governance & Nominating Committee Member | |
| Term of Office & Length of Time Served: | Indefinite - Since 2012 | |
| Principal Occupation(s) During Past 5 Years: | General Auditor (2003-2011) - General Motors Company (auto manufacturer) | |
| Number of Portfolios Overseen within Fund Complex: | 41 | |
| Other Directorships Held Outside Fund Complex: | Rochester Institute of Technology (university)(2005-present) | |
| Officers | ||
| Name: | Jeffrey S. Coons, Ph.D., CFA | |
| Address: | 290 Woodcliff Drive | |
| Fairport, NY 14450 | ||
| Age: | 52 | |
| Current Position(s) Held with Fund: | Vice President | |
| Term of Office1 & Length of Time Served: | Since 2004 | |
| Principal Occupation(s) During Past 5 Years: | President since 2010, Co-Director of Research (2002-2015) - Manning & Napier Advisors, LLC | |
| Holds one or more of the following titles for various subsidiaries and affiliates: President, Director, Treasurer or Senior Trust Officer. | ||
| Number of Portfolios Overseen within Fund Complex: | 41 | |
| Other Directorships Held Outside Fund Complex: | N/A | |
29
Directors’ and Officers’ Information (unaudited)
| ||
| Officers (continued) | ||
| Name: | Elizabeth Craig | |
| Address: | 290 Woodcliff Drive | |
| Fairport, NY 14450 | ||
| Age: | 28 | |
| Current Position(s) Held with Fund: | Assistant Corporate Secretary | |
| Term of Office1 & Length of Time Served: | Since 2011 | |
| Principal Occupation(s) During Past 5 Years: | Fund Administration Manager since 2015; Mutual Fund Compliance Specialist (2009-2015) – Manning & Napier Advisors, LLC | |
| Number of Portfolios Overseen within Fund Complex: | 41 | |
| Other Directorships Held Outside Fund Complex: | N/A | |
| Name: | Christine Glavin | |
| Address: | 290 Woodcliff Drive | |
| Fairport, NY 14450 | ||
| Age: | 49 | |
| Current Position(s) Held with Fund: | Principal Financial Officer, Chief Financial Officer | |
| Term of Office1 & Length of Time Served: | Principal Financial Officer since 2002; Chief Financial Officer since 2001 | |
| Principal Occupation(s) During Past 5 Years: | Director of Fund Reporting since 2011; Fund Reporting Manager (1997-2011) - Manning & Napier Advisors, LLC; Assistant Treasurer since 2008 - Exeter Trust Company | |
| Number of Portfolios Overseen within Fund Complex: | 41 | |
| Other Directorships Held Outside Fund Complex: | N/A | |
| Name: | Jodi L. Hedberg | |
| Address: | 290 Woodcliff Drive | |
| Fairport, NY 14450 | ||
| Age: | 48 | |
| Current Position(s) Held with Fund: | Corporate Secretary, Chief Compliance Officer, Anti-Money Laundering Compliance Officer | |
| Term of Office1 & Length of Time Served: | Corporate Secretary since 1997; Chief Compliance Officer since 2004; Anti-Money Laundering Compliance Officer since 2002 | |
| Principal Occupation(s) During Past 5 Years: | Director of Compliance since 2005; Compliance Manager (1995-2005) - Manning & Napier Advisors, LLC and affiliates; Corporate Secretary - Manning & Napier Investor Services, Inc. since 2006 | |
| Number of Portfolios Overseen within Fund Complex: | 41 | |
| Other Directorships Held Outside Fund Complex: | N/A | |
| Name: | Richard Yates | |
| Address: | 290 Woodcliff Drive | |
| Fairport, NY 14450 | ||
| Age: | 50 | |
| Current Position(s) Held with Fund: | Chief Legal Officer | |
| Term of Office1 & Length of Time Served: | Chief Legal Officer since 2004 | |
| Principal Occupation(s) During Past 5 Years: | Counsel - Manning & Napier Advisors, LLC and affiliates since 2000; Holds one or more of the following titles for various affiliates; Director or Corporate Secretary | |
| Number of Portfolios Overseen within Fund Complex: | 41 | |
| Other Directorships Held Outside Fund Complex: | N/A | |
*Interested Director, within the meaning of the Investment Company Act of 1940 by reason of his position with the Fund’s investment advisor and distributor. Mr. Mikolaichik serves as the Chief Financial Officer for Manning & Napier Advisors, LLC.
1The term of office of all officers shall be one year and until their respective successors are chosen and qualified, or his or her earlier resignation or removal as provided in the Fund’s By-Laws.
30
Results of Special Meeting of Shareholders
(unaudited)
A Special Meeting of the Shareholders of the Fund was held on August 18, 2015. The number of votes necessary to conduct the meeting and approve the proposal was obtained, and the results of the vote of shareholders of all the Series of the Fund voting together in the aggregate is listed below:
PROPOSAL 1:
Election of Directors
| NUMBER OF SHARES VOTED FOR | NUMBER OF SHARES WITHELD | |||||||
Stephen B. Ashley | 883,968,395 | 8,618,094 | ||||||
Paul A. Brooke | 884,510,661 | 8,075,828 | ||||||
Peter L. Faber | 884,140,893 | 8,445,596 | ||||||
James E. Mikolaichik | 883,391,832 | 9,194,657 | ||||||
Harris H. Rusitzky | 620,022,215 | 272,564,274 | ||||||
Chester N. Watson | 884,638,809 | 7,947,680 | ||||||
31
Literature Requests
(unaudited)
Proxy Voting Policies and Procedures
A description of the policies and procedures that the Fund uses to determine how to vote proxies relating to portfolio securities is available, without charge, upon request:
| By phone | 1-800-466-3863 | |||
| On the Securities and Exchange | ||||
| Commission’s (SEC) web site | http://www.sec.gov |
Proxy Voting Record
Information regarding how the Fund voted proxies relating to portfolio securities during the most recent 12-month period ended June 30th is available, without charge, upon request:
| By phone | 1-800-466-3863 | |||
| On the SEC’s web site | http://www.sec.gov |
Quarterly Portfolio Holdings
The Series’ complete schedule of portfolio holdings for the 1st and 3rd quarters of each fiscal year are provided on Form N-Q, and are available, without charge, upon request:
| By phone | 1-800-466-3863 | |||
| On the SEC’s web site | http://www.sec.gov |
The Series’ Form N-Q may be reviewed and copied at the SEC’s Public Reference Room in Washington, D.C. Information on the operation of the Public Reference Room may be obtained by calling 1-800-SEC-0330.
Prospectus and Statement of Additional Information (SAI)
For more information about any of the Manning & Napier Fund, Inc. Series, you may obtain a prospectus and SAI at www.manning-napier.com or by calling (800) 466-3863. Before investing, carefully consider the objectives, risks, charges and expenses of the investment and read the prospectus carefully as it contains this and other information about the investment company. In addition, this information can be found on the SEC’s web site, http://www.sec.gov.
Additional information available at www.manning-napier.com
1. Fund Holdings - Month-End
2. Fund Holdings - Quarter-End
3. Shareholder Report - Annual
4. Shareholder Report - Semi-Annual
The Fund also offers electronic notification or “e-delivery” when certain documents are available on-line to be downloaded or reviewed. Direct shareholders can elect to receive electronic notification when shareholder reports, prospectus updates, and/or statements are available. If you do not currently have on-line access to your account, you can establish access by going to www.manning-napier.com, click on “Login” in the top corner of the page, and follow the prompts to self-enroll. Once enrolled, you can set your electronic notification preferences by clicking on the Account Options tab located within the green toolbar and then select E-Delivery Option. Should you have any questions on either how to establish on-line access or how to update your account settings, please contact Investor Services at 1-800-466-3863.
The Manning & Napier Fund, Inc. is managed by Manning & Napier Advisors, LLC. Manning & Napier Investor Services, Inc., an affiliate of Manning & Napier Advisors, LLC, is the distributor of the Fund shares.
MNSTI-12/15-AR

Global Fixed Income Series
Management Discussion and Analysis
(unaudited)
Dear Shareholders:
Volatility defined global financial markets during the past year, largely driven by macroeconomic factors. Renewed concerns about economic growth in emerging markets — China in particular — and uncertainty about the effects of that slowdown on overall global growth triggered market gyrations. Developed economies continued to provide accommodative monetary policy to combat growth concerns, although in December the U.S. Federal Reserve raised the federal funds rate for the first time in nearly a decade. For much of the year, Europe struggled with uncertainty regarding Greece’s ability to secure bailout funding from its creditors, which negatively affected investor sentiment. China’s economy slowed, but the government continued to demonstrate a willingness to provide support through a combination of policy-easing maneuvers and targeted stimulus measures. The U.S. economy remained on a path of slow growth that nevertheless made it the best performing developed economy. Looking ahead, we expect the slow global growth environment to remain in place for the foreseeable future.
As always, we appreciate your business.
Sincerely,
Manning & Napier Advisors, LLC
1
Global Fixed Income Series
Fund Commentary
(unaudited)
Investment Objective
To provide long-term total return by investing principally in fixed income securities of issuers located anywhere in the world. This Series provides access to a diversified portfolio of developed and emerging market bonds primarily consisting of government debt and investment grade corporate debt, bank debt, securitized/collateralized instruments, and money market securities. A substantial portion of its assets may be in high-yield, high-risk bonds. At least 40% of the portfolio will be invested in non-U.S. securities.
Performance Commentary
Domestic fixed income markets generated modestly positive absolute returns in 2015, although performance across sectors was mixed. Municipal, mortgage-backed, and Treasury securities turned in positive performance for the year, whereas high yield and investment grade corporate bonds were negative. Meanwhile, performance across international fixed income markets was exceptionally challenging.
The Bank of America Merrill Lynch Global Broad Market Index experienced a return of -2.75% during 2015. This equated to the worst year for global bond markets since 2005, as a strengthening U.S. dollar and selloff in emerging markets negatively impacted returns. The Global Fixed Income Series experienced negative absolute returns as well, returning -5.68% and underperforming the benchmark on a relative basis.
Contributing to the relative performance shortfall during 2015 was the Series’ overweight relative to the benchmark in select emerging market bonds. The Series’ underweight to Japanese government bonds also challenged relative returns.
The Series continues to hold a short duration position given negative real yields throughout the developed world. The selloff in emerging markets during the year was broad, with the market paying little regard to fundamentals. We found the broad selloff to be an opportunity to add to select emerging market holdings we feel have strong fundamentals and are embarking on structural reform efforts given attractive valuations.
Within Europe, we find valuations and fundamentals unattractive in some core European countries as nominal yields are negative up to five years out on the curve. We hold an overweight position in Italy and Spain relative to the benchmark, with Spain being attractive from a fundamental and valuation perspective despite increasing political risks after the general election in December. We recently increased our euro exposure given an improving growth outlook. Within Japan, we find little reason to hold Japanese government bonds given the country’s precarious fiscal position and continued monetization of debt by the central bank.
During 2016 we expect the fixed income landscape to continue to shift as the Federal Reserve considers further changes to U.S. monetary policy. Having raised the federal funds rate, we believe they now will seek to remain flexible and proceed slowly with small increases that do not follow a well-defined schedule. The diverging monetary policies of major central banks, geopolitical risks, commodity price pressures, and the potential for global growth to deviate from expectations could cause volatility in financial markets. In light of the current environment, it is important that investors remain active, flexible, and selective in their approach in order to avoid overvalued and risky areas of the market, something Manning & Napier has done for over 45 years.
Performance data quoted represents past performance and does not guarantee future results. The investment return and principal value of an investment will fluctuate, so that an investor’s shares, when redeemed, may be worth more or less than their original cost. Current performance may be higher or lower than that quoted; investors can obtain the most recent month-end performance at www.manning-napier.com or by calling (800) 466-3863. Performance for the Global Fixed Income Series Class S shares is provided above. Performance for the Class I shares will be higher based on the Class’ lower expenses.
Please see the next page for additional performance information as of December 31, 2015.
There is an inverse relationship between bond prices and interest rates; as interest rates rise, bond prices (and therefore the value of bond funds) fall. Likewise, as interest rates fall, bond prices and the value of bond funds rise. Investments in higher-yielding, lower-rated securities involve additional risks, including a higher risk of default and loss of principal. Additionally, funds whose investments are concentrated in foreign countries may be subject to fluctuating currency values, different accounting standards, and economic and political instability.
2
Global Fixed Income Series
Performance Update as of December 31, 2015
(unaudited)
| AVERAGE ANNUAL TOTAL RETURNS AS OF DECEMBER 31, 2015 | ||||||||
| ONE YEAR1 | SINCE INCEPTION2 | |||||||
Manning & Napier Fund, Inc. - Global Fixed Income Series - Class S3,4 | -5.68 | % | -1.49 | % | ||||
Manning & Napier Fund, Inc. - Global Fixed Income Series - Class I3 | -5.45 | % | -1.35 | % | ||||
Bank of America (BofA) Merrill Lynch Global Broad Market Index5 | -2.75 | % | 1.43 | % | ||||
The following graph compares the value of a $10,000 investment in the Manning & Napier Fund, Inc. - Global Fixed Income Series -Class I from its inception2 (October 1, 2012) to present (December 31, 2015) to the BofA Merrill Lynch Global Broad Market Index.
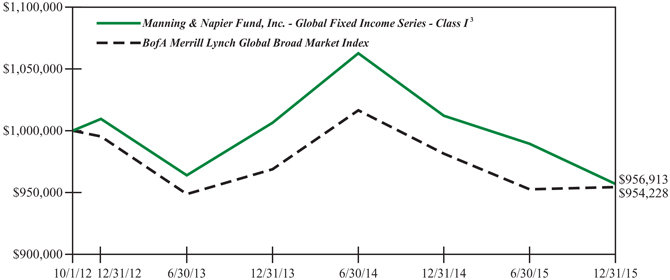
1The returns shown are based on net asset values calculated for shareholder transactions and may differ from the returns shown in the financial highlights, which reflect adjustments made to the net asset values in accordance with accounting principles generally accepted in the United States of America.
2Performance numbers for the Series and Index are calculated from October 1, 2012, the Class I inception date.
3The Series’ performance does not reflect the deduction of taxes that a shareholder would pay on fund distributions or the redemption of shares. The Series’ performance is historical and may not be indicative of future results. The performance returns shown are inclusive of the net expense ratio of the Series. For the year ended December 31, 2015, this net expense ratio was 0.85% for Class S and 0.70% for Class I. The gross expense ratio, which does not account for any voluntary or contractual waivers currently in effect, was 0.87% for Class S and 0.72% for Class I for the year ended December 31, 2015.
4For periods prior to April 1, 2013 (the inception date of Class S shares), performance for the Class S shares is hypothetical and is based on the historical performance of the Class I shares adjusted for the Class S shares charges and expenses.
5The Bank of America (BofA) Merrill Lynch Global Broad Market Index is a capitalization-weighted index that tracks the performance of publicly issued debt in the major domestic and eurobond markets, including sovereign, quasi-government, corporate, securitized and collateralized securities. The Index is rebalanced on the last calendar day of each month and only includes investment-grade securities with maturities of at least one year and a fixed coupon schedule. Index returns do not reflect any fees or expenses. Index returns provided by Bloomberg.
3
Global Fixed Income Series
Shareholder Expense Example
(unaudited)
As a shareholder of the Series, you incur ongoing costs, including management fees, shareholder service fees and other Series expenses. This example is intended to help you understand your ongoing costs (in dollars) of investing in the Series and to compare these costs with the ongoing costs of investing in other mutual funds.
The example is based on an investment of $1,000 invested in each class at the beginning of the period and held for the entire period (July 1, 2015 to December 31, 2015).
Actual Expenses
The Actual lines of the table below provide information about actual account values and actual expenses. You may use the information in this line, together with the amount you invested, to estimate the expenses that you paid over the period. Simply divide your account value by $1,000 (for example, an $8,600 account value divided by $1,000 = 8.6), then multiply the result by the number in the Actual line for the class in which you have invested under the heading entitled “Expenses Paid During Period” to estimate the expenses you paid on your account during this period.
Hypothetical Example for Comparison Purposes
The Hypothetical lines of the table below provide information about hypothetical account values and hypothetical expenses based on the Class’ actual expense ratio and an assumed rate of return of 5% per year before expenses, which is not the Class’ actual return. The hypothetical account values and expenses may not be used to estimate the actual ending account balance or expenses you paid during the period. You may use this information to compare the ongoing costs of investing in a class of the Series and other funds. To do so, compare this 5% hypothetical example for the class in which you have invested with the 5% hypothetical examples that appear in the shareholder reports of the other funds.
Please note that the expenses shown in the table are meant to highlight your ongoing costs only and do not reflect any transaction costs, such as sales charges (loads), redemptions fees, or exchange fees that you may incur in other mutual funds. Therefore, the second line of the table is useful in comparing ongoing costs only, and will not help you determine the relative total costs of owning different funds.
| BEGINNING ACCOUNT VALUE 7/1/15 | ENDING ACCOUNT VALUE 12/31/15 | EXPENSES PAID DURING PERIOD* 7/1/15-12/31/15 | ANNUALIZED EXPENSE RATIO | |||||
Class S | ||||||||
Actual | $1,000.00 | $966.10 | $4.21 | 0.85% | ||||
Hypothetical (5% return before expenses) | $1,000.00 | $1,020.92 | $4.33 | 0.85% | ||||
Class I | ||||||||
Actual | $1,000.00 | $983.47 | $3.50 | 0.70% | ||||
Hypothetical (5% return before expenses) | $1,000.00 | $1,021.68 | $3.57 | 0.70% |
*Expenses are equal to the Class’ annualized expense ratio (for the six-month period), multiplied by the average account value over the period, multiplied by 184/365 (to reflect the one-half year period). Expenses are based on the most recent fiscal half year; therefore, the expense ratios stated above may differ from the expense ratios stated in the financial highlights, which are based on one-year data. The Class’ total return would have been lower had certain expenses not been waived during the period.
4
Global Fixed Income Series
Portfolio Composition as of December 31, 2015
(unaudited)
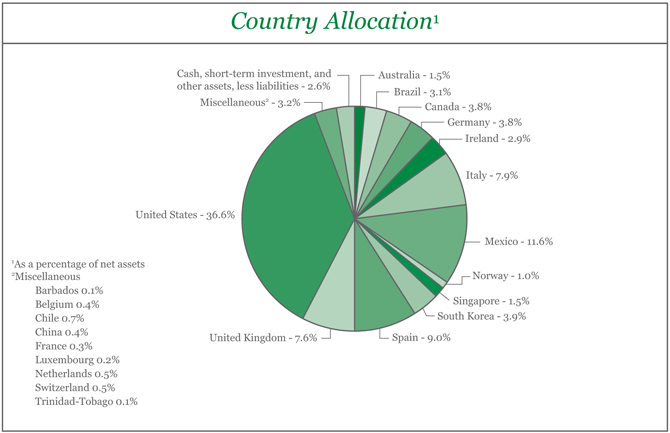
5
Global Fixed Income Series
Investment Portfolio - December 31, 2015
| CREDIT RATING1 | PRINCIPAL AMOUNT 2 | VALUE (NOTE 2) | ||||||||||
CORPORATE BONDS - 39.9% | ||||||||||||
Non-Convertible Corporate Bonds - 39.9% | ||||||||||||
Consumer Discretionary - 3.6% | ||||||||||||
Auto Components - 0.3% | ||||||||||||
Magna International, Inc. (Canada), 4.15%, 10/1/2025 | Baa1 | 500,000 | $ | 509,023 | ||||||||
Techniplas LLC3, 10.00%, 5/1/2020 | Caa1 | 310,000 | 220,100 | |||||||||
|
| |||||||||||
| 729,123 | ||||||||||||
|
| |||||||||||
Automobiles - 0.2% | ||||||||||||
Ford Motor Credit Co. LLC, 8.125%, 1/15/2020 | Baa3 | 275,000 | 323,890 | |||||||||
|
| |||||||||||
Household Durables - 1.4% | ||||||||||||
Brookfield Residential Properties, Inc. - Brookfield Residential US Corp. (Canada)3, 6.125%, 7/1/2022 | B1 | 590,000 | 545,750 | |||||||||
Meritage Homes Corp., 7.15%, 4/15/2020 | Ba3 | 245,000 | 257,863 | |||||||||
Meritage Homes Corp., 7.00%, 4/1/2022 | Ba3 | 250,000 | 261,875 | |||||||||
NVR, Inc., 3.95%, 9/15/2022 | Baa2 | 1,280,000 | 1,291,110 | |||||||||
TRI Pointe Holdings, Inc. - TRI Pointe Group, Inc., 4.375%, 6/15/2019 | B1 | 390,000 | 381,225 | |||||||||
Weekley Homes LLC - Weekley Finance Corp., 6.00%, 2/1/2023 | B2 | 345,000 | 324,300 | |||||||||
|
| |||||||||||
| 3,062,123 | ||||||||||||
|
| |||||||||||
Media - 1.5% | ||||||||||||
Columbus International, Inc. (Barbados)3, 7.375%, 3/30/2021 | Ba3 | 250,000 | 247,500 | |||||||||
DIRECTV Holdings LLC - DIRECTV Financing Co., Inc., 5.20%, 3/15/2020 | Baa2 | 835,000 | 904,311 | |||||||||
DIRECTV Holdings LLC - DIRECTV Financing Co., Inc., 4.45%, 4/1/2024 | Baa2 | 320,000 | 328,669 | |||||||||
Sinclair Television Group, Inc.3, 5.625%, 8/1/2024 | B1 | 365,000 | 354,963 | |||||||||
Sirius XM Radio, Inc.3, 5.375%, 4/15/2025 | Ba3 | 280,000 | 281,750 | |||||||||
Time Warner Entertainment Co. LP, 8.375%, 7/15/2033 | Baa2 | 500,000 | 589,855 | |||||||||
VTR Finance B.V. (Chile)3, 6.875%, 1/15/2024 | B1 | 495,000 | 455,400 | |||||||||
|
| |||||||||||
| 3,162,448 | ||||||||||||
|
| |||||||||||
Multiline Retail - 0.2% | ||||||||||||
Dollar General Corp., 3.25%, 4/15/2023 | Baa3 | 500,000 | 476,165 | |||||||||
|
| |||||||||||
Total Consumer Discretionary | 7,753,749 | |||||||||||
|
| |||||||||||
Consumer Staples - 1.4% | ||||||||||||
Beverages - 0.5% | ||||||||||||
Anheuser-Busch InBev Worldwide, Inc. (Belgium), 7.75%, 1/15/2019 | A2 | 350,000 | 404,577 | |||||||||
PepsiCo, Inc., 3.10%, 7/17/2022 | A1 | 750,000 | 769,809 | |||||||||
|
| |||||||||||
| 1,174,386 | ||||||||||||
|
| |||||||||||
Food & Staples Retailing - 0.4% | ||||||||||||
C&S Group Enterprises LLC3, 5.375%, 7/15/2022 | B1 | 400,000 | 360,000 | |||||||||
CVS Health Corp., 3.50%, 7/20/2022 | Baa1 | 400,000 | 407,022 | |||||||||
|
| |||||||||||
| 767,022 | ||||||||||||
|
| |||||||||||
The accompanying notes are an integral part of the financial statements.
6
Global Fixed Income Series
Investment Portfolio - December 31, 2015
| CREDIT RATING1 | PRINCIPAL AMOUNT 2 | VALUE (NOTE 2) | ||||||||||
CORPORATE BONDS (continued) | ||||||||||||
Non-Convertible Corporate Bonds (continued) | ||||||||||||
Consumer Staples (continued) | ||||||||||||
Food Products - 0.3% | ||||||||||||
Kraft Heinz Foods Co., 6.75%, 3/15/2032 | Baa3 | 250,000 | $ | 289,321 | ||||||||
Pinnacle Operating Corp.3, 9.00%, 11/15/2020 | Caa1 | 380,000 | 357,200 | |||||||||
|
| |||||||||||
| 646,521 | ||||||||||||
|
| |||||||||||
Household Products - 0.2% | ||||||||||||
HRG Group, Inc., 7.75%, 1/15/2022 | Caa1 | 395,000 | 387,100 | |||||||||
|
| |||||||||||
Total Consumer Staples | 2,975,029 | |||||||||||
|
| |||||||||||
Energy - 5.5% | ||||||||||||
Energy Equipment & Services - 1.2% | ||||||||||||
Baker Hughes, Inc., 7.50%, 11/15/2018 | A2 | 575,000 | 649,188 | |||||||||
Ensco plc, 4.70%, 3/15/2021 | Baa2 | 800,000 | 644,143 | |||||||||
Ensco plc, 5.20%, 3/15/2025 | Baa2 | 750,000 | 533,753 | |||||||||
Schlumberger Holdings Corp.3, 3.625%, 12/21/2022 | A2 | 750,000 | 740,867 | |||||||||
|
| |||||||||||
| 2,567,951 | ||||||||||||
|
| |||||||||||
Oil, Gas & Consumable Fuels - 4.3% | ||||||||||||
Antero Resources Corp., 5.125%, 12/1/2022 | Ba3 | 130,000 | 98,800 | |||||||||
Chevron Corp., 1.79%, 11/16/2018 | Aa1 | 500,000 | 495,475 | |||||||||
CNOOC Nexen Finance 2014 ULC (China), 1.625%, 4/30/2017 | Aa3 | 400,000 | 397,686 | |||||||||
Columbia Pipeline Group, Inc.3, 2.45%, 6/1/2018 | Baa2 | 400,000 | 391,087 | |||||||||
Columbia Pipeline Group, Inc.3, 4.50%, 6/1/2025 | Baa2 | 400,000 | 362,496 | |||||||||
Crestwood Midstream Partners LP - Crestwood Midstream Finance Corp., 6.125%, 3/1/2022 | B1 | 430,000 | 298,850 | |||||||||
El Paso Natural Gas Co. LLC, 8.625%, 1/15/2022 | Baa3 | 100,000 | 108,604 | |||||||||
Hiland Partners LP - Hiland Partners Finance Corp.3, 7.25%, 10/1/2020 | Baa3 | 1,100,000 | 1,111,000 | |||||||||
Kinder Morgan, Inc.3, 5.625%, 11/15/2023 | Baa3 | 1,500,000 | 1,371,190 | |||||||||
PBF Holding Co. LLC - PBF Finance Corp.3, 7.00%, 11/15/2023 | B1 | 255,000 | 248,625 | |||||||||
Petrobras Global Finance B.V. (Brazil)4, 1.99%, 5/20/2016 | Ba3 | 1,400,000 | 1,365,000 | |||||||||
Petroleos Mexicanos (Mexico), 5.75%, 3/1/2018 | Baa1 | 350,000 | 364,350 | |||||||||
Petroleos Mexicanos (Mexico)3, 4.50%, 1/23/2026 | Baa1 | 950,000 | 834,575 | |||||||||
Sabine Pass Liquefaction LLC, 5.625%, 2/1/2021 | Ba3 | 725,000 | 667,000 | |||||||||
Talisman Energy, Inc. (Canada), 3.75%, 2/1/2021 | Baa3 | 600,000 | 544,015 | |||||||||
Targa Resources Partners LP - Targa Resources Partners Finance Corp.3, 6.75%, 3/15/2024 | Ba2 | 275,000 | 234,438 | |||||||||
TransCanada PipeLines Ltd. (Canada), 1.625%, 11/9/2017 | A3 | 250,000 | 247,948 | |||||||||
WPX Energy, Inc., 6.00%, 1/15/2022 | Ba1 | 320,000 | 224,000 | |||||||||
|
| |||||||||||
| 9,365,139 | ||||||||||||
|
| |||||||||||
Total Energy | 11,933,090 | |||||||||||
|
| |||||||||||
Financials - 18.4% | ||||||||||||
Banks - 7.5% | ||||||||||||
Banco Santander S.A. (Spain), 4.00%, 4/7/2020 | Aa2 | EUR | 100,000 | 124,655 | ||||||||
The accompanying notes are an integral part of the financial statements.
7
Global Fixed Income Series
Investment Portfolio - December 31, 2015
| CREDIT RATING1 | PRINCIPAL AMOUNT 2 | VALUE (NOTE 2) | ||||||||||
CORPORATE BONDS (continued) | ||||||||||||
Non-Convertible Corporate Bonds (continued) | ||||||||||||
Financials (continued) | ||||||||||||
Banks (continued) | ||||||||||||
Bank of America Corp., 5.42%, 3/15/2017 | Baa3 | 1,500,000 | $ | 1,561,340 | ||||||||
Bank of America Corp., 6.875%, 4/25/2018 | Baa1 | 480,000 | 529,563 | |||||||||
Bank of America Corp., 4.00%, 1/22/2025 | Baa3 | 375,000 | 367,098 | |||||||||
Barclays Bank plc (United Kingdom)3, 10.179%, 6/12/2021 | Baa3 | 300,000 | 388,619 | |||||||||
BBVA Bancomer S.A. (Mexico)3, 6.75%, 9/30/2022 | Baa2 | 845,000 | 929,500 | |||||||||
BNP Paribas Home Loan Covered Bonds S.A. (France), 3.75%, 4/20/2020 | AAA | 5 | EUR | 50,000 | 62,619 | |||||||
Citigroup, Inc., 3.875%, 3/26/2025 | Baa3 | 1,000,000 | 973,288 | |||||||||
Commonwealth Bank of Australia (Australia), 5.75%, 1/25/2017 | Aaa | AUD | 1,680,000 | 1,263,292 | ||||||||
Cooperatieve Centrale Raiffeisen-Boerenleenbank B.A. (Netherlands)6,7, 8.40% | WR | 8 | 100,000 | 107,437 | ||||||||
ING Bank N.V. (Netherlands)3, 1.80%, 3/16/2018 | A1 | 150,000 | 149,620 | |||||||||
Intesa Sanpaolo S.p.A. (Italy), 3.875%, 1/15/2019 | Baa1 | 790,000 | 813,404 | |||||||||
Intesa Sanpaolo S.p.A. (Italy)3, 6.50%, 2/24/2021 | Baa1 | 350,000 | 397,002 | |||||||||
JPMorgan Chase & Co., 6.30%, 4/23/2019 | A3 | 820,000 | 919,467 | |||||||||
Lloyds Bank plc (United Kingdom)3,6,9, 12.00% | BB | 5 | 240,000 | 340,032 | ||||||||
Lloyds Banking Group plc (United Kingdom)3, 4.582%, 12/10/2025 | Baa2 | 1,847,000 | 1,851,499 | |||||||||
Popular, Inc., 7.00%, 7/1/2019 | B2 | 570,000 | 532,950 | |||||||||
Royal Bank of Canada (Canada), 3.77%, 3/30/2018 | Aaa | CAD | 1,995,000 | 1,518,937 | ||||||||
Royal Bank of Scotland Group plc (United Kingdom), 5.125%, 5/28/2024 | Ba2 | 1,000,000 | 1,013,155 | |||||||||
Santander Bank N.A., 8.75%, 5/30/2018 | Baa2 | 300,000 | 338,594 | |||||||||
Santander Holdings USA, Inc., 2.65%, 4/17/2020 | Baa2 | 500,000 | 490,534 | |||||||||
Westpac Banking Corp. (Australia), 5.75%, 2/6/2017 | Aaa | AUD | 2,100,000 | 1,580,286 | ||||||||
|
| |||||||||||
| 16,252,891 | ||||||||||||
|
| |||||||||||
Capital Markets - 3.1% | ||||||||||||
The Goldman Sachs Group, Inc., 2.375%, 1/22/2018 | A3 | 330,000 | 332,851 | |||||||||
The Goldman Sachs Group, Inc., 6.15%, 4/1/2018 | A3 | 1,790,000 | 1,943,790 | |||||||||
The Goldman Sachs Group, Inc.4, 2.012%, 11/29/2023 | A3 | 350,000 | 353,106 | |||||||||
The Goldman Sachs Group, Inc., 4.25%, 10/21/2025 | Baa2 | 500,000 | 496,178 | |||||||||
Morgan Stanley, 5.75%, 1/25/2021 | A3 | 1,515,000 | 1,700,968 | |||||||||
Morgan Stanley, 5.00%, 11/24/2025 | Baa2 | 800,000 | 849,238 | |||||||||
UBS AG (Switzerland)4, 7.25%, 2/22/2022 | BBB | 5 | 400,000 | 417,317 | ||||||||
UBS AG (Switzerland), 7.625%, 8/17/2022 | BBB | 5 | 250,000 | 285,000 | ||||||||
UBS AG (Switzerland)4, 4.75%, 5/22/2023 | BBB | 5 | 400,000 | 406,127 | ||||||||
|
| |||||||||||
| 6,784,575 | ||||||||||||
|
| |||||||||||
Consumer Finance - 0.2% | ||||||||||||
Navient Corp., 6.125%, 3/25/2024 | Ba3 | 605,000 | 493,075 | |||||||||
|
| |||||||||||
Diversified Financial Services - 1.2% | ||||||||||||
General Electric Capital Corp.4, 0.714%, 5/5/2026 | A1 | 855,000 | 792,732 | |||||||||
The accompanying notes are an integral part of the financial statements.
8
Global Fixed Income Series
Investment Portfolio - December 31, 2015
| CREDIT RATING1 | PRINCIPAL AMOUNT 2 | VALUE (NOTE 2) | ||||||||||
CORPORATE BONDS (continued) | ||||||||||||
Non-Convertible Corporate Bonds (continued) | ||||||||||||
Financials (continued) | ||||||||||||
Diversified Financial Services (continued) | ||||||||||||
ING Bank N.V. (Netherlands)3, 5.80%, 9/25/2023 | Baa2 | 350,000 | $ | 380,264 | ||||||||
Jefferies Finance LLC - JFIN Co-Issuer Corp.3, 7.375%, 4/1/2020 | B1 | 500,000 | 443,750 | |||||||||
Jefferies Finance LLC - JFIN Co-Issuer Corp.3, 6.875%, 4/15/2022 | B1 | 300,000 | 252,000 | |||||||||
Peachtree Corners Funding Trust3, 3.976%, 2/15/2025 | Baa2 | 100,000 | 99,278 | |||||||||
Voya Financial, Inc., 2.90%, 2/15/2018 | Baa2 | 370,000 | 374,000 | |||||||||
Voya Financial, Inc., 5.50%, 7/15/2022 | Baa2 | 270,000 | 302,126 | |||||||||
|
| |||||||||||
| 2,644,150 | ||||||||||||
|
| |||||||||||
Insurance - 3.2% | ||||||||||||
Aegon N.V. (Netherlands)4,6, 2.142% | Baa1 | 435,000 | 344,004 | |||||||||
American International Group, Inc., 4.875%, 6/1/2022 | Baa1 | 1,875,000 | 2,024,887 | |||||||||
Assured Guaranty US Holdings, Inc., 5.00%, 7/1/2024 | Baa2 | 2,600,000 | 2,701,127 | |||||||||
AXA S.A. (France)4,6, 2.312% | A3 | 425,000 | 346,483 | |||||||||
First American Financial Corp., 4.30%, 2/1/2023 | Baa3 | 565,000 | 560,973 | |||||||||
Prudential Financial, Inc.6,10, 5.875% | Baa2 | 800,000 | 831,600 | |||||||||
|
| |||||||||||
| 6,809,074 | ||||||||||||
|
| |||||||||||
Real Estate Investment Trusts (REITS) - 2.4% | ||||||||||||
American Tower Corp., 2.80%, 6/1/2020 | Baa3 | 500,000 | 494,245 | |||||||||
AvalonBay Communities, Inc., 4.20%, 12/15/2023 | Baa1 | 500,000 | 520,953 | |||||||||
Digital Realty Trust LP, 5.875%, 2/1/2020 | Baa2 | 1,110,000 | 1,223,731 | |||||||||
DuPont Fabros Technology LP, 5.875%, 9/15/2021 | Ba1 | 265,000 | 275,600 | |||||||||
HCP, Inc., 6.70%, 1/30/2018 | Baa1 | 865,000 | 940,574 | |||||||||
HCP, Inc., 4.00%, 6/1/2025 | Baa1 | 400,000 | 390,565 | |||||||||
Rialto Holdings LLC - Rialto Corp.3, 7.00%, 12/1/2018 | B2 | 415,000 | 421,225 | |||||||||
Welltower, Inc., 4.95%, 1/15/2021 | Baa2 | 635,000 | 680,825 | |||||||||
Welltower, Inc., 4.00%, 6/1/2025 | Baa2 | 300,000 | 295,100 | |||||||||
|
| |||||||||||
| 5,242,818 | ||||||||||||
|
| |||||||||||
Real Estate Management & Development - 0.3% | ||||||||||||
Forestar USA Real Estate Group, Inc.3, 8.50%, 6/1/2022 | B3 | 250,000 | 243,750 | |||||||||
Greystar Real Estate Partners LLC3, 8.25%, 12/1/2022 | B2 | 284,000 | 294,650 | |||||||||
|
| |||||||||||
| 538,400 | ||||||||||||
|
| |||||||||||
Thrifts & Mortgage Finance - 0.5% | ||||||||||||
Ladder Capital Finance Holdings LLLP - Ladder Capital Finance Corp., 7.375%, 10/1/2017 | Ba3 | 575,000 | 572,844 | |||||||||
Ladder Capital Finance Holdings LLLP - Ladder Capital Finance Corp.3, 5.875%, 8/1/2021 | Ba3 | 430,000 | 391,300 | |||||||||
Prospect Holding Co. LLC - Prospect Holding Finance Co.3, 10.25%, 10/1/2018 | B2 | 295,000 | 142,338 | |||||||||
|
| |||||||||||
| 1,106,482 | ||||||||||||
|
| |||||||||||
Total Financials | 39,871,465 | |||||||||||
|
| |||||||||||
The accompanying notes are an integral part of the financial statements.
9
Global Fixed Income Series
Investment Portfolio - December 31, 2015
| CREDIT RATING1 | PRINCIPAL AMOUNT 2 | VALUE (NOTE 2) | ||||||||||
CORPORATE BONDS (continued) | ||||||||||||
Non-Convertible Corporate Bonds (continued) | ||||||||||||
Health Care - 1.6% | ||||||||||||
Biotechnology - 0.2% | ||||||||||||
AMAG Pharmaceuticals, Inc.3, 7.875%, 9/1/2023 | B3 | 400,000 | $ | 352,000 | ||||||||
|
| |||||||||||
Health Care Providers & Services - 1.1% | ||||||||||||
FMC Finance VIII S.A. (Germany)3, 6.50%, 9/15/2018 | Ba2 | EUR | 1,540,000 | 1,917,967 | ||||||||
Tenet Healthcare Corp.3,4, 4.012%, 6/15/2020 | Ba2 | 280,000 | 273,000 | |||||||||
Tenet Healthcare Corp., 8.125%, 4/1/2022 | B3 | 255,000 | 254,363 | |||||||||
|
| |||||||||||
| 2,445,330 | ||||||||||||
|
| |||||||||||
Pharmaceuticals - 0.3% | ||||||||||||
Concordia Healthcare Corp. (Canada)3, 7.00%, 4/15/2023 | Caa2 | 425,000 | 368,687 | |||||||||
Mallinckrodt International Finance S.A. - Mallinckrodt CB LLC3, 5.625%, 10/15/2023 | B1 | 275,000 | 261,250 | |||||||||
|
| |||||||||||
| 629,937 | ||||||||||||
|
| |||||||||||
Total Health Care | 3,427,267 | |||||||||||
|
| |||||||||||
Industrials - 4.4% | ||||||||||||
Aerospace & Defense - 0.2% | ||||||||||||
DigitalGlobe, Inc.3, 5.25%, 2/1/2021 | B1 | 590,000 | 495,600 | |||||||||
|
| |||||||||||
Airlines - 0.7% | ||||||||||||
Allegiant Travel Co., 5.50%, 7/15/2019 | B1 | 390,000 | 394,875 | |||||||||
Delta Air Lines Pass-Through Trust, Series 2010-1, Class B3, 6.375%, 1/2/2016 | Baa3 | 625,000 | 627,344 | |||||||||
Southwest Airlines Co., 2.75%, 11/6/2019 | Baa1 | 400,000 | 403,101 | |||||||||
|
| |||||||||||
| 1,425,320 | ||||||||||||
|
| |||||||||||
Commercial Services & Supplies - 0.1% | ||||||||||||
Constellis Holdings LLC - Constellis Finance Corp.3, 9.75%, 5/15/2020 | B3 | 265,000 | 217,300 | |||||||||
Modular Space Corp.3, 10.25%, 1/31/2019 | B3 | 275,000 | 110,000 | |||||||||
|
| |||||||||||
| 327,300 | ||||||||||||
|
| |||||||||||
Construction & Engineering - 0.0%## | ||||||||||||
Abengoa Finance S.A.U. (Spain)*3,11, 7.75%, 2/1/2020 | Caa3 | 300,000 | 41,625 | |||||||||
|
| |||||||||||
Industrial Conglomerates - 0.5% | ||||||||||||
GE Capital International Funding Co.3, 0.964%, 4/15/2016 | A1 | 557,000 | 557,251 | |||||||||
Siemens Financieringsmaatschappij N.V. (Germany)3, 2.90%, 5/27/2022 | A1 | 500,000 | 499,801 | |||||||||
|
| |||||||||||
| 1,057,052 | ||||||||||||
|
| |||||||||||
Machinery - 0.4% | ||||||||||||
Stanley Black & Decker, Inc., 2.451%, 11/17/2018 | Baa2 | 500,000 | 501,951 | |||||||||
Waterjet Holdings, Inc.3, 7.625%, 2/1/2020 | B2 | 325,000 | 322,563 | |||||||||
|
| |||||||||||
| 824,514 | ||||||||||||
|
| |||||||||||
Trading Companies & Distributors - 2.5% | ||||||||||||
Air Lease Corp., 2.625%, 9/4/2018 | BBB | 5 | 1,000,000 | 988,461 | ||||||||
The accompanying notes are an integral part of the financial statements.
10
Global Fixed Income Series
Investment Portfolio - December 31, 2015
| CREDIT RATING1 | PRINCIPAL AMOUNT 2 | VALUE (NOTE 2) | ||||||||||
CORPORATE BONDS (continued) | ||||||||||||
Non-Convertible Corporate Bonds (continued) | ||||||||||||
Industrials (continued) | ||||||||||||
Trading Companies & Distributors (continued) | ||||||||||||
Air Lease Corp., 3.375%, 1/15/2019 | BBB | 5 | 1,150,000 | $ | 1,155,750 | |||||||
Aviation Capital Group Corp.3, 2.875%, 9/17/2018 | BBB | 5 | 1,250,000 | 1,242,828 | ||||||||
Fly Leasing Ltd. (Ireland), 6.75%, 12/15/2020 | B2 | 435,000 | 445,810 | |||||||||
Fly Leasing Ltd. (Ireland), 6.375%, 10/15/2021 | B2 | 240,000 | 238,800 | |||||||||
International Lease Finance Corp., 5.75%, 5/15/2016 | Ba2 | 250,000 | 253,437 | |||||||||
International Lease Finance Corp.4, 2.462%, 6/15/2016 | Ba2 | 750,000 | 748,125 | |||||||||
International Lease Finance Corp., 8.75%, 3/15/2017 | Ba2 | 380,000 | 404,700 | |||||||||
|
| |||||||||||
| 5,477,911 | ||||||||||||
|
| |||||||||||
Total Industrials | 9,649,322 | |||||||||||
|
| |||||||||||
Information Technology - 1.0% | ||||||||||||
Communications Equipment - 0.2% | ||||||||||||
QUALCOMM, Inc., 3.45%, 5/20/2025 | A1 | 500,000 | 479,580 | |||||||||
|
| |||||||||||
Internet Software & Services - 0.2% | ||||||||||||
Tencent Holdings Ltd. (China)3, 3.375%, 5/2/2019 | A2 | 400,000 | 406,739 | |||||||||
|
| |||||||||||
IT Services - 0.4% | ||||||||||||
Automatic Data Processing, Inc., 2.25%, 9/15/2020 | Aa3 | 400,000 | 401,515 | |||||||||
Visa, Inc., 2.80%, 12/14/2022 | A1 | 435,000 | 436,798 | |||||||||
|
| |||||||||||
| 838,313 | ||||||||||||
|
| |||||||||||
Technology Hardware, Storage & Peripherals - 0.2% | ||||||||||||
Hewlett Packard Enterprise Co.3, 2.45%, 10/5/2017 | Baa2 | 500,000 | 499,576 | |||||||||
|
| |||||||||||
Total Information Technology | 2,224,208 | |||||||||||
|
| |||||||||||
Materials - 1.7% | ||||||||||||
Chemicals - 0.7% | ||||||||||||
Consolidated Energy Finance S.A. (Trinidad-Tobago)3, 6.75%, 10/15/2019 | B2 | 235,000 | 224,648 | |||||||||
The Dow Chemical Co., 8.55%, 5/15/2019 | Baa2 | 700,000 | 825,054 | |||||||||
Solvay Finance America LLC (Belgium)3, 3.40%, 12/3/2020 | Baa2 | 500,000 | 495,982 | |||||||||
|
| |||||||||||
| 1,545,684 | ||||||||||||
|
| |||||||||||
Containers & Packaging - 0.2% | ||||||||||||
Ardagh Packaging Finance plc - Ardagh Holdings USA, Inc. (Ireland)3,4, 3.512%, 12/15/2019 | Ba3 | 500,000 | 488,750 | |||||||||
|
| |||||||||||
Metals & Mining - 0.5% | ||||||||||||
Alcoa, Inc., 5.87%, 2/23/2022 | Ba1 | 270,000 | 263,250 | |||||||||
Rio Tinto Finance USA Ltd. (United Kingdom), 3.75%, 9/20/2021 | A3 | 360,000 | 349,932 | |||||||||
Steel Dynamics, Inc., 5.125%, 10/1/2021 | Ba2 | 270,000 | 249,750 | |||||||||
SunCoke Energy Partners LP - SunCoke Energy Partners Finance Corp.3, 7.375%, 2/1/2020 | B1 | 310,000 | 192,200 | |||||||||
|
| |||||||||||
| 1,055,132 | ||||||||||||
|
| |||||||||||
The accompanying notes are an integral part of the financial statements.
11
Global Fixed Income Series
Investment Portfolio - December 31, 2015
| CREDIT RATING1 | PRINCIPAL AMOUNT 2 | VALUE (NOTE 2) | ||||||||||
CORPORATE BONDS (continued) | ||||||||||||
Non-Convertible Corporate Bonds (continued) | ||||||||||||
Materials (continued) | ||||||||||||
Paper & Forest Products - 0.3% | ||||||||||||
Domtar Corp., 4.40%, 4/1/2022 | Baa3 | 500,000 | $ | 508,414 | ||||||||
|
| |||||||||||
Total Materials | 3,597,980 | |||||||||||
|
| |||||||||||
Telecommunication Services - 1.4% | ||||||||||||
Diversified Telecommunication Services - 0.6% | ||||||||||||
CenturyLink, Inc., 5.80%, 3/15/2022 | Ba2 | 440,000 | 403,260 | |||||||||
Frontier Communications Corp., 7.625%, 4/15/2024 | Ba3 | 645,000 | 541,800 | |||||||||
Windstream Services LLC, 7.875%, 11/1/2017 | B2 | 235,000 | 240,407 | |||||||||
|
| |||||||||||
| 1,185,467 | ||||||||||||
|
| |||||||||||
Wireless Telecommunication Services - 0.8% | ||||||||||||
Altice Financing S.A. (Luxembourg)3, 6.50%, 1/15/2022 | B1 | 535,000 | 529,650 | |||||||||
SBA Tower Trust3, 3.598%, 4/15/2018 | Baa3 | 500,000 | 498,202 | |||||||||
Sixsigma Networks Mexico S.A. de C.V. (Mexico)3, 8.25%, 11/7/2021 | B2 | 340,000 | 324,700 | |||||||||
T-Mobile USA, Inc., 6.836%, 4/28/2023 | Ba3 | 385,000 | 398,475 | |||||||||
|
| |||||||||||
| 1,751,027 | ||||||||||||
|
| |||||||||||
Total Telecommunication Services | 2,936,494 | |||||||||||
|
| |||||||||||
Utilities - 0.9% | ||||||||||||
Independent Power and Renewable Electricity Producers - 0.9% | ||||||||||||
Abengoa Yield plc (Spain)3, 7.00%, 11/15/2019 | B2 | 400,000 | 352,000 | |||||||||
ContourGlobal Power Holdings S.A. (France)3, 7.125%, 6/1/2019 | B3 | 250,000 | 237,500 | |||||||||
NRG Energy, Inc., 6.25%, 7/15/2022 | B1 | 295,000 | 251,340 | |||||||||
Talen Energy Supply LLC3, 4.625%, 7/15/2019 | Ba3 | 580,000 | 435,000 | |||||||||
TerraForm Global Operating LLC3, 9.75%, 8/15/2022 | B3 | 465,000 | 370,838 | |||||||||
TerraForm Power Operating LLC3, 6.125%, 6/15/2025 | B3 | 445,000 | 358,225 | |||||||||
|
| |||||||||||
Total Utilities | 2,004,903 | |||||||||||
|
| |||||||||||
TOTAL CORPORATE BONDS | ||||||||||||
(Identified Cost $91,804,059) | 86,373,507 | |||||||||||
|
| |||||||||||
COMMERCIAL MORTGAGE-BACKED SECURITIES - 4.1% | ||||||||||||
Citigroup Commercial Mortgage Trust, Series 2006-C4, Class A34, 6.033%, 3/15/2049 | Aaa | 685,329 | 686,776 | |||||||||
COBALT CMBS Commercial Mortgage Trust, Series 2006-C1, Class A4, 5.223%, 8/15/2048 | AAA | 5 | 1,164,195 | 1,182,755 | ||||||||
Commercial Mortgage Pass-Through Certificates, Series 2015-LC19, Class A4, 3.183%, 2/10/2048 | Aaa | 1,250,000 | 1,225,666 | |||||||||
Freddie Mac Multifamily Structured Pass-Through Certificates, Series K016, Class X1 (IO)4, 1.708%, 10/25/2021 | Aaa | 4,069,592 | 298,873 | |||||||||
Freddie Mac Multifamily Structured Pass-Through Certificates, Series K030, Class X1 (IO)4, 0.333%, 4/25/2023 | Aaa | 23,352,739 | 317,039 | |||||||||
The accompanying notes are an integral part of the financial statements.
12
Global Fixed Income Series
Investment Portfolio - December 31, 2015
| CREDIT RATING1 | PRINCIPAL AMOUNT 2 | VALUE (NOTE 2) | ||||||||||
COMMERCIAL MORTGAGE-BACKED SECURITIES (continued) | ||||||||||||
Freddie Mac Multifamily Structured Pass-Through Certificates, Series K706, Class X1 (IO)4, 1.706%, 10/25/2018 | Aaa | 5,990,275 | $ | 227,060 | ||||||||
GS Mortgage Securities Trust, Series 2006-GG8, Class A4, 5.56%, 11/10/2039 | Aaa | 419,446 | 418,725 | |||||||||
LB-UBS Commercial Mortgage Trust, Series 2006-C6, Class A4, 5.372%, 9/15/2039 | Aaa | 494,482 | 501,644 | |||||||||
LB-UBS Commercial Mortgage Trust, Series 2006-C7, Class A1A, 5.335%, 11/15/2038 | AAA | 5 | 1,220,701 | 1,245,201 | ||||||||
Morgan Stanley Capital I Trust, Series 2006-IQ12, Class A4, 5.332%, 12/15/2043 | AAA | 5 | 1,151,348 | 1,171,778 | ||||||||
New Residential Mortgage Loan Trust, Series 2015-2A, Class A14, 3.75%, 8/25/2055 | Aaa | 245,618 | 249,185 | |||||||||
U.S. Small Business Administration, Series 2015-10A, Class 1, 2.517%, 3/10/2025 | Aaa | 247,941 | 250,705 | |||||||||
WF-RBS Commercial Mortgage Trust, Series 2014-C19, Class A5, 4.101%, 3/15/2047 | Aaa | 1,100,000 | 1,162,009 | |||||||||
|
| |||||||||||
TOTAL COMMERCIAL MORTGAGE-BACKED SECURITIES | ||||||||||||
(Identified Cost $9,175,047) | 8,937,416 | |||||||||||
|
| |||||||||||
FOREIGN GOVERNMENT BONDS - 49.2% | ||||||||||||
Australia Government Bond (Australia), 4.50%, 4/15/2020 | Aaa | AUD | 600,000 | 479,151 | ||||||||
Brazil Notas do Tesouro Nacional (Brazil), 10.00%, 1/1/2025 | Baa3 | BRL | 19,060,000 | 3,445,725 | ||||||||
Brazilian Government International Bond (Brazil), 8.875%, 10/14/2019 | Baa3 | 400,000 | 447,000 | |||||||||
Brazilian Government International Bond (Brazil), 4.25%, 1/7/2025 | Baa3 | 1,900,000 | 1,529,500 | |||||||||
Bundesrepublik Deutschland (Germany), 1.50% | Aaa | EUR | 2,500,000 | 2,956,263 | ||||||||
Bundesrepublik Deutschland (Germany), 1.00% | Aaa | EUR | 2,500,000 | 2,838,258 | ||||||||
Canada Housing Trust No. 1 (Canada)3, 4.10%, 12/15/2018 | Aaa | CAD | 2,485,000 | 1,963,199 | ||||||||
Canadian Government Bond (Canada), 1.50%, 9/1/2017 | Aaa | CAD | 800,000 | 587,902 | ||||||||
Canadian Government Bond (Canada), 2.75%, 6/1/2022 | Aaa | CAD | 2,500,000 | 1,999,079 | ||||||||
Chile Government (Chile), 5.50%, 8/5/2020 | Aa3 | CLP | 700,000,000 | 1,016,569 | ||||||||
Export-Import Bank of Korea (South Korea), 2.625%, 12/30/2020 | Aa2 | 1,500,000 | 1,498,129 | |||||||||
Ireland Government Bond (Ireland), 5.00%, 10/18/2020 | Baa1 | EUR | 1,340,000 | 1,787,754 | ||||||||
Ireland Government Bond (Ireland), 0.80%, 3/15/2022 | Baa1 | EUR | 2,000,000 | 2,218,777 | ||||||||
Ireland Government Bond (Ireland), 3.90%, 3/20/2023 | Baa1 | EUR | 750,000 | 996,126 | ||||||||
Italy Buoni Poliennali Del Tesoro (Italy), 1.45% | Baa2 | EUR | 500,000 | 557,723 | ||||||||
Italy Buoni Poliennali Del Tesoro (Italy), 5.50%, 9/1/2022 | Baa2 | EUR | 2,835,000 | 3,962,376 | ||||||||
Italy Buoni Poliennali Del Tesoro (Italy), 5.50%, 11/1/2022 | Baa2 | EUR | 4,410,000 | 6,176,152 | ||||||||
Italy Buoni Poliennali Del Tesoro (Italy), 1.50%, 6/1/2025 | Baa2 | EUR | 5,200,000 | 5,654,916 | ||||||||
Korea Treasury Bond (South Korea), 2.75%, 6/10/2016 | Aa2 | KRW | 2,400,000,000 | 2,057,020 | ||||||||
Korea Treasury Bond (South Korea), 2.00%, 12/10/2017 | WR | 8 | KRW | 5,700,000,000 | 4,893,279 | |||||||
Mexican Government Bond (Mexico), 6.25%, 6/16/2016 | A3 | MXN | 15,000,000 | 880,361 | ||||||||
Mexican Government Bond (Mexico), 7.25%, 12/15/2016 | A3 | MXN | 33,570,000 | 2,011,748 | ||||||||
Mexican Government Bond (Mexico), 5.00%, 6/15/2017 | A3 | MXN | 51,500,000 | 3,030,998 | ||||||||
Mexican Government Bond (Mexico), 7.75%, 12/14/2017 | A3 | MXN | 78,000,000 | 4,838,367 | ||||||||
The accompanying notes are an integral part of the financial statements.
13
Global Fixed Income Series
Investment Portfolio - December 31, 2015
| CREDIT RATING | PRINCIPAL AMOUNT 2 | VALUE (NOTE 2) | ||||||||||
FOREIGN GOVERNMENT BONDS (continued) | ||||||||||||
Mexican Government Bond (Mexico), 8.00%, 6/11/2020 | A3 | MXN | 57,500,000 | $ | 3,671,542 | |||||||
Mexican Government Bond (Mexico), 6.50%, 6/10/2021 | A3 | MXN | 46,000,000 | 2,761,212 | ||||||||
Mexican Government Bond (Mexico), 6.50%, 6/9/2022 | A3 | MXN | 84,000,000 | 5,015,187 | ||||||||
Mexican Government Bond (Mexico), 7.75%, 5/29/2031 | A3 | MXN | 6,500,000 | 413,653 | ||||||||
Norway Government Bond (Norway)3, 4.25%, 5/19/2017 | Aaa | NOK | 17,800,000 | 2,108,857 | ||||||||
Singapore Government Bond (Singapore), 2.50%, 6/1/2019 | Aaa | SGD | 4,515,000 | 3,286,184 | ||||||||
Spain Government Bond (Spain), 4.50%, 1/31/2018 | Baa2 | EUR | 1,415,000 | 1,677,526 | ||||||||
Spain Government Bond (Spain)3, 4.00%, 4/30/2020 | Baa2 | EUR | 2,740,000 | 3,405,310 | ||||||||
Spain Government Bond (Spain)3, 5.40%, 1/31/2023 | Baa2 | EUR | 6,505,000 | 9,048,367 | ||||||||
Spain Government Bond (Spain)3, 1.60%, 4/30/2025 | Baa2 | EUR | 4,500,000 | 4,861,097 | ||||||||
United Kingdom Gilt (United Kingdom), 2.00%, 1/22/2016 | Aa1 | GBP | 3,250,000 | 4,794,820 | ||||||||
United Kingdom Gilt (United Kingdom), 1.00%, 9/7/2017 | Aa1 | GBP | 2,435,000 | 3,611,735 | ||||||||
United Kingdom Gilt (United Kingdom), 5.00%, 3/7/2018 | Aa1 | GBP | 2,610,000 | 4,209,113 | ||||||||
|
| |||||||||||
TOTAL FOREIGN GOVERNMENT BONDS | ||||||||||||
(Identified Cost $118,090,202) | 106,690,975 | |||||||||||
|
| |||||||||||
U.S. TREASURY SECURITIES - 0.8% | ||||||||||||
U.S. Treasury Bonds - 0.8% | ||||||||||||
U.S. Treasury Inflation Indexed Bonds, 0.75%, 2/15/2042 | ||||||||||||
(Identified Cost $1,797,623) | 1,968,287 | 1,729,172 | ||||||||||
|
| |||||||||||
U.S. GOVERNMENT AGENCIES - 3.4% | ||||||||||||
Mortgage-Backed Securities - 3.4% | ||||||||||||
Fannie Mae, Pool #MA1890, 4.00%, 5/1/2034 | 846,042 | 905,327 | ||||||||||
Fannie Mae, Pool #735500, 5.50%, 5/1/2035 | 1,042,193 | 1,173,193 | ||||||||||
Freddie Mac, Pool #Z50018, 3.50%, 7/1/2026 | 1,412,069 | 1,480,200 | ||||||||||
Freddie Mac, Pool #K92054, 4.00%, 10/1/2034 | 864,297 | 924,688 | ||||||||||
Freddie Mac, Pool #C91832, 3.50%, 6/1/2035 | 1,148,568 | 1,198,034 | ||||||||||
Freddie Mac, Pool #G08273, 5.50%, 6/1/2038 | 1,479,575 | 1,643,125 | ||||||||||
|
| |||||||||||
TOTAL U.S. GOVERNMENT AGENCIES | ||||||||||||
(Identified Cost $7,216,105) | 7,324,567 | |||||||||||
|
| |||||||||||
The accompanying notes are an integral part of the financial statements.
14
Global Fixed Income Series
Investment Portfolio - December 31, 2015
| SHARES | VALUE (NOTE 2) | |||||||
SHORT-TERM INVESTMENT - 1.6% | ||||||||
Dreyfus Cash Management, Inc. - Institutional Shares12, 0.23%, | ||||||||
(Identified Cost $ 3,390,122) | 3,390,122 | $ | 3,390,122 | |||||
|
| |||||||
TOTAL INVESTMENTS - 99.0% | ||||||||
(Identified Cost $ 231,473,158) | 214,445,759 | |||||||
OTHER ASSETS, LESS LIABILITIES - 1.0% | 2,159,687 | |||||||
|
| |||||||
NET ASSETS - 100% | $ | 216,605,446 | ||||||
|
| |||||||
AUD - Australian Dollar
BRL - Brazilian Real
CAD - Canadian Dollar
CLP - Chilean Peso
EUR - Euro
GBP - British Pound
IO - Interest only
KRW - South Korean Won
MXN - Mexican Peso
NOK - Norwegian Krone
SGD - Singapore Dollar
##Less than 0.1%.
*Non-income producing security.
1Credit ratings from Moody’s (unaudited).
2Amount is stated in USD unless otherwise noted.
3Restricted securities - Investment in securities that are restricted as to public resale under the Securities Act of 1933, as amended. These securities have been sold under rule 144A and have been determined to be liquid under guidelines established by the Board of Directors. These securities amount to $48,929,823 or 22.6% of the Series’ net assets as of December 31, 2015 (see Note 2 to the financial statements).
4The coupon rate is floating and is the effective rate as of December 31, 2015.
5Credit ratings from S&P (unaudited).
6Security is perpetual in nature and has no stated maturity date.
7The rate shown is a fixed rate as of December 31, 2015; the rate becomes floating, based on U.S. Treasury Yield Curve Rate Treasury Note Constant Maturity 5 Year in June 2017.
8Credit rating has been withdrawn. As of December 31, 2015, there is no rating available (unaudited).
9The rate shown is a fixed rate as of December 31, 2015; the rate becomes floating, based on LIBOR plus a spread, in December 2024.
10The rate shown is a fixed rate as of December 31, 2015; the rate becomes floating, based on LIBOR plus a spread, in September 2022.
11Issuer filed for bankruptcy and/or is in default of interest payments.
12Rate shown is the current yield as of December 31, 2015.
The Series’ portfolio holds, as a percentage of net assets, greater than 10% in the following countries: United States 36.6%; Mexico 11.6%.
The Global Industry Classification Standard (GICS) was developed by and is the exclusive property and a service mark of MSCI Inc. (MSCI) and Standard & Poor’s, a division of The McGraw-Hill Companies, Inc. (S&P), and is licensed for use by Manning & Napier when referencing GICS sectors. Neither MSCI, S&P, nor any third party involved in making or compiling the GICS or any GICS classifications makes any express or implied warranties or representations with respect to such standard or classification, nor shall any such party have any liability therefrom.
The accompanying notes are an integral part of the financial statements.
15
Global Fixed Income Series
Statement of Assets and Liabilities
December 31, 2015
ASSETS: | ||||
Investments, at value (identified cost $231,473,158) (Note 2) | $ | 214,445,759 | ||
Foreign currency (identified cost $9,934) | 9,992 | |||
Interest receivable | 2,438,019 | |||
Receivable for fund shares sold | 107,605 | |||
|
| |||
TOTAL ASSETS | 217,001,375 | |||
|
| |||
LIABILITIES: | ||||
Accrued management fees (Note 3) | 105,400 | |||
Accrued fund accounting and administration fees (Note 3) | 24,647 | |||
Accrued shareholder services fees (Class S) (Note 3) | 18,639 | |||
Accrued foreign capital gains tax (Note 2) | 4,921 | |||
Accrued transfer agent fees (Note 3) | 3,810 | |||
Accrued Chief Compliance Officer service fees (Note 3) | 429 | |||
Payable for fund shares repurchased | 187,126 | |||
Accrued custodian fees | 22,438 | |||
Other payables and accrued expenses | 28,519 | |||
|
| |||
TOTAL LIABILITIES | 395,929 | |||
|
| |||
TOTAL NET ASSETS | $ | 216,605,446 | ||
|
| |||
NET ASSETS CONSIST OF: | ||||
Capital stock | $ | 237,604 | ||
Additional paid-in-capital | 238,496,306 | |||
Distributions in excess of net investment income | (3,065,487 | ) | ||
Accumulated net realized loss on investments, foreign currency and translation of other assets and liabilities | (2,012,291 | ) | ||
Net unrealized appreciation (depreciation) on investments (net of foreign capital gains tax of $4,921), foreign currency and translation of other assets and liabilities | (17,050,686 | ) | ||
|
| |||
TOTAL NET ASSETS | $ | 216,605,446 | ||
|
| |||
NET ASSET VALUE, OFFERING PRICE AND REDEMPTION PRICE PER SHARE - Class S ($144,233,026/15,832,502 shares) | $ | 9.11 | ||
|
| |||
NET ASSET VALUE, OFFERING PRICE AND REDEMPTION PRICE PER SHARE - Class I ($72,372,420/7,927,924 shares) | $ | 9.13 | ||
|
| |||
The accompanying notes are an integral part of the financial statements.
16
Global Fixed Income Series
Statement of Operations
For the Year Ended December 31, 2015
INVESTMENT INCOME: | ||||
Interest | $ | 8,108,023 | ||
Dividends | 2,894 | |||
|
| |||
Total Investment Income | 8,110,917 | |||
|
| |||
EXPENSES: | ||||
Management fees (Note 3) | 1,486,894 | |||
Shareholder services fees (Class S) (Note 3) | 275,250 | |||
Fund accounting and administration fees (Note 3) | 97,526 | |||
Transfer agent fees (Note 3) | 11,731 | |||
Directors’ fees (Note 3) | 9,710 | |||
Chief Compliance Officer service fees (Note 3) | 2,541 | |||
Custodian fees | 48,069 | |||
Miscellaneous | 125,904 | |||
|
| |||
Total Expenses | 2,057,625 | |||
Less reduction of expenses (Note 3) | (49,461 | ) | ||
|
| |||
Net Expenses | 2,008,164 | |||
|
| |||
NET INVESTMENT INCOME | 6,102,753 | |||
|
| |||
REALIZED AND UNREALIZED GAIN (LOSS) ON INVESTMENTS AND FOREIGN CURRENCY: | ||||
Net realized loss on- | ||||
Investments | (1,625,843 | ) | ||
Foreign currency and translation of other assets and liabilities | (9,025,849 | ) | ||
|
| |||
| (10,651,692 | ) | |||
|
| |||
Net change in unrealized appreciation (depreciation) on- | ||||
Investments (net of decrease in accrued foreign capital gains tax of $ 3,002) | (9,527,973 | ) | ||
Foreign currency and translation of other assets and liabilities | 50,099 | |||
|
| |||
| (9,477,874 | ) | |||
|
| |||
NET REALIZED AND UNREALIZED GAIN (LOSS) ON INVESTMENTS AND FOREIGN CURRENCY | (20,129,566 | ) | ||
|
| |||
NET DECREASE IN NET ASSETS RESULTING FROM OPERATIONS | $ | (14,026,813 | ) | |
|
| |||
The accompanying notes are an integral part of the financial statements.
17
Global Fixed Income Series
Statements of Changes in Net Assets
| FOR THE YEAR ENDED 12/31/15 | FOR THE YEAR ENDED 12/31/14 | |||||||
INCREASE (DECREASE) IN NET ASSETS: | ||||||||
OPERATIONS: | ||||||||
Net investment income | $ | 6,102,753 | $ | 5,581,029 | ||||
Net realized gain (loss) on investments and foreign currency | (10,651,692 | ) | 3,413,776 | |||||
Net change in unrealized appreciation (depreciation) on investments and foreign currency | (9,477,874 | ) | (8,078,036 | ) | ||||
|
|
|
| |||||
Net increase (decrease) from operations | (14,026,813 | ) | 916,769 | |||||
|
|
|
| |||||
DISTRIBUTIONS TO SHAREHOLDERS (Note 8): | ||||||||
From net investment income (Class S) | (88,284 | ) | (5,045,777 | ) | ||||
From net investment income (Class I) | (23,667 | ) | (1,197,071 | ) | ||||
From net realized gain on investments (Class S) | — | (928,775 | ) | |||||
From net realized gain on investments (Class I) | — | (209,576 | ) | |||||
From return of capital (Class S) | (579,353 | ) | — | |||||
From return of capital (Class I) | (155,311 | ) | — | |||||
|
|
|
| |||||
Total distributions to shareholders | (846,615 | ) | (7,381,199 | ) | ||||
|
|
|
| |||||
CAPITAL STOCK ISSUED AND REPURCHASED: | ||||||||
Net increase (decrease) from capital share transactions (Note 5) | (24,237,624 | ) | 30,131,263 | |||||
|
|
|
| |||||
Net increase (decrease) in net assets | (39,111,052 | ) | 23,666,833 | |||||
NET ASSETS: | ||||||||
Beginning of year | 255,716,498 | 232,049,665 | ||||||
|
|
|
| |||||
End of year (including distributions in excess of net investment income of $3,065,487 and $135,001, respectively) | $ | 216,605,446 | $ | 255,716,498 | ||||
|
|
|
| |||||
The accompanying notes are an integral part of the financial statements.
18
Global Fixed Income Series
Financial Highlights - Class S
| FOR THE YEARS ENDED | FOR THE PERIOD 4/1/131 TO 12/31/13 | |||||||||||
| 12/31/15 | 12/31/14 | |||||||||||
Per share data (for a share outstanding throughout each period): | ||||||||||||
Net asset value - Beginning of period | $ | 9.68 | $ | 9.92 | $ | 10.00 | ||||||
|
|
|
|
|
| |||||||
Income (loss) from investment operations: | ||||||||||||
Net investment income2 | 0.23 | 0.22 | 0.16 | |||||||||
Net realized and unrealized loss on investments | (0.77 | ) | (0.18 | ) | (0.16 | ) | ||||||
|
|
|
|
|
| |||||||
Total from investment operations | (0.54 | ) | 0.04 | 0.00 | ||||||||
|
|
|
|
|
| |||||||
Less distributions to shareholders: | ||||||||||||
From net investment income | — | 3 | (0.24 | ) | (0.08 | ) | ||||||
From net realized gain on investments | — | (0.04 | ) | — | 3 | |||||||
From return of capital | (0.03 | ) | — | — | ||||||||
|
|
|
|
|
| |||||||
Total distributions to shareholders | (0.03 | ) | (0.28 | ) | (0.08 | ) | ||||||
|
|
|
|
|
| |||||||
Net asset value - End of period | $ | 9.11 | $ | 9.68 | $ | 9.92 | ||||||
|
|
|
|
|
| |||||||
Net assets - End of period (000’s omitted) | $ | 144,233 | $ | 208,842 | $ | 196,860 | ||||||
|
|
|
|
|
| |||||||
Total return4 | (5.68 | %) | 0.42 | % | 0.07 | % | ||||||
Ratios (to average net assets)/Supplemental Data: | ||||||||||||
Expenses* | 0.85 | % | 0.85 | % | 0.85 | %5 | ||||||
Net investment income | 2.43 | % | 2.16 | % | 2.16 | %5 | ||||||
Portfolio turnover | 54 | % | 40 | % | 51 | % | ||||||
| *The investment advisor did not impose all or a portion of its management and/or other fees, and in some periods may have paid a portion of the Series’ expenses. If these expenses had been incurred by the Class, the expense ratio (to average net assets) would have increased by the following amounts: | ||||||||||||
| 0.02 | % | 0.01 | % | 0.00 | %5,6 | |||||||
1Commencement of operations.
2Calculated based on average shares outstanding during the periods.
3Less than $0.01.
4Represents aggregate total return for the periods indicated, and assumes reinvestment of all distributions. Total return would have been lower had certain expenses not been waived during the periods. Periods less than one year are not annualized.
5Annualized.
6Less than 0.01%.
The accompanying notes are an integral part of the financial statements.
19
Global Fixed Income Series
Financial Highlights - Class I
| FOR THE YEARS ENDED | FOR THE PERIOD | |||||||||||||||
| 12/31/15 | 12/31/14 | 12/31/13 | 10/1/121 TO 12/31/12 | |||||||||||||
Per share data (for a share outstanding throughout each period): | ||||||||||||||||
Net asset value - Beginning of period | $ | 9.69 | $ | 9.93 | $ | 10.09 | $ | 10.00 | ||||||||
|
|
|
|
|
|
|
| |||||||||
Income (loss) from investment operations: | ||||||||||||||||
Net investment income2 | 0.24 | 0.23 | 0.23 | 0.04 | ||||||||||||
Net realized and unrealized gain (loss) on investments | (0.77 | ) | (0.17 | ) | (0.26 | ) | 0.05 | |||||||||
|
|
|
|
|
|
|
| |||||||||
Total from investment operations | (0.53 | ) | 0.06 | (0.03 | ) | 0.09 | ||||||||||
|
|
|
|
|
|
|
| |||||||||
Less distributions to shareholders: | ||||||||||||||||
From net investment income | — | 3 | (0.26 | ) | (0.13 | ) | — | 3 | ||||||||
From net realized gain on investments | — | (0.04 | ) | — | 3 | — | 3 | |||||||||
From return of capital | (0.03 | ) | — | — | — | |||||||||||
|
|
|
|
|
|
|
| |||||||||
Total distributions to shareholders | (0.03 | ) | (0.30 | ) | (0.13 | ) | — | 3 | ||||||||
|
|
|
|
|
|
|
| |||||||||
Net asset value - End of period | $ | 9.13 | $ | 9.69 | $ | 9.93 | $ | 10.09 | ||||||||
|
|
|
|
|
|
|
| |||||||||
Net assets - End of period (000’s omitted) | $ | 72,372 | $ | 46,875 | $ | 35,190 | $ | 5,106 | ||||||||
|
|
|
|
|
|
|
| |||||||||
Total return4 | (5.45 | %) | 0.57 | % | (0.32 | %) | 0.95 | % | ||||||||
Ratios (to average net assets)/Supplemental Data: | ||||||||||||||||
Expenses* | 0.70 | % | 0.70 | % | 0.70 | % | 0.70 | %5 | ||||||||
Net investment income | 2.56 | % | 2.31 | % | 2.32 | % | 1.60 | %5 | ||||||||
Portfolio turnover | 54 | % | 40 | % | 51 | % | 4 | % | ||||||||
| *The investment advisor did not impose all or a portion of its management and/or other fees, and in some periods may have paid a portion of the Series’ expenses. If these expenses had been incurred by the Class, the expense ratio (to average net assets) would have increased by the following amounts: | ||||||||||||||||
| 0.02 | % | 0.02 | % | 0.11 | % | 4.08 | %5 | |||||||||
1Commencement of operations.
2Calculated based on average shares outstanding during the periods.
3Less than $0.01.
4Represents aggregate total return for the periods indicated, and assumes reinvestment of all distributions. Total return would have been lower had certain expenses not been waived during the periods. Periods less than one year are not annualized.
5Annualized.
The accompanying notes are an integral part of the financial statements.
20
Global Fixed Income Series
Notes to Financial Statements
| 1. | Organization |
Global Fixed Income Series (the “Series”) is a no-load non-diversified series of Manning & Napier Fund, Inc. (the “Fund”). The Fund is organized in Maryland and is registered under the Investment Company Act of 1940, as amended, as an open-end management investment company.
The Series’ investment objective is to provide long-term total return by investing principally in fixed income securities of issuers located anywhere in the world.
The Fund’s advisor is Manning & Napier Advisors, LLC (the “Advisor”). Shares of the Series are offered to investors, clients and employees of the Advisor and its affiliates. The Series is authorized to issue two classes of shares (Class S and Class I). Each class of shares is substantially the same except the Class S shares bear shareholder services fees. The total authorized capital stock of the Fund consists of 15 billion shares of common stock each having a par value of $0.01. As of December 31, 2015, 10.7 billion shares have been designated in total among 41 series, of which 100 million have been designated as Global Fixed Income Series Class S common stock, and 100 million designated as Global Fixed Income Series Class I common stock.
| 2. | Significant Accounting Policies |
The following is a summary of significant accounting policies followed by the Series. The Series is an investment company and, accordingly, follows the investment company accounting and reporting guidance of the Financial Accounting Standards Board Accounting Standards Codification Topic 946 - Investment Companies, which is part of accounting principles generally accepted in the United States of America (“GAAP”).
Security Valuation
Portfolio securities, including domestic equities, foreign equities, warrants and options, listed on an exchange other than the NASDAQ Stock Market are valued at the latest quoted sales price of the exchange on which the security is primarily traded. Securities not traded on valuation date or securities not listed on an exchange are valued at the latest quoted bid price provided by the Fund’s pricing service. Securities listed on the NASDAQ Stock Market are valued in accordance with the NASDAQ Official Closing Price.
Debt securities, including government bonds, foreign bonds, asset-backed securities, structured notes, supranational obligations, sovereign bonds, corporate bonds and mortgage-backed securities will normally be valued on the basis of evaluated bid prices provided directly by an independent pricing service. The pricing services use multiple valuation techniques to determine fair value. In instances where sufficient market activity exists, the pricing services may utilize a market-based approach through which quotes from market makers are used to determine fair value. In instances where sufficient market activity may not exist or is limited, the pricing services also utilize proprietary valuation models which may consider market characteristics such as benchmark yield curves, option-adjusted spreads, credit spreads, estimated default rates, coupon rates, anticipated timing of principal repayments, underlying collateral, and other unique security features in order to estimate the relevant cash flows, which are then discounted to calculate the fair value. Certain investments in securities held by the Series may be valued on a basis of a price provided directly by a principal market maker. These prices may differ from the value that would have been used had a broader market for securities existed.
Municipal securities will normally be valued on the basis of market valuations provided by an independent pricing service (the “Service”). The Service utilizes the latest price quotations and a matrix system (which considers such factors as security prices of similar securities, yields, maturities and ratings). The Service has been approved by the Fund’s Board of Directors (the “Board”).
Short-term investments that mature in sixty days or less may be valued at amortized cost, which approximates fair value. Investments in open-end investment companies are valued at their net asset value per share on valuation date.
Volume and level of activity in established markets for an asset or liability are evaluated to determine whether recent transactions and quoted prices are determinative of fair value. Where there have been significant decreases in volume and level of activity, further analysis and adjustment may be necessary to estimate fair value. The Series measures fair value in these
21
Global Fixed Income Series
Notes to Financial Statements (continued)
| 2. | Significant Accounting Policies (continued) |
Security Valuation (continued)
instances by the use of inputs and valuation techniques which may be based upon current market prices of securities that are comparable in coupon, rating, maturity and industry and/or expectation of future cash flows. As a result of trading in relatively thin markets and/or markets that experience significant volatility, the prices used by the Series to value these securities may differ from the value that would be realized if these securities were sold, and the differences could be material.
Securities for which representative valuations or prices are not available from the Series’ pricing service may be valued at fair value as determined in good faith by the Advisor under procedures approved by and under the general supervision and responsibility of the Fund’s Board of Directors (the “Board”). Due to the inherent uncertainty of valuations of such securities, the fair value may differ significantly from the values that would have been used had a ready market for such securities existed. If trading or events occurring after the close of the principal market in which securities are traded are expected to materially affect the value of those securities, then they may be valued at their fair value, taking this trading or these events into account.
Various inputs are used in determining the value of the Series’ assets or liabilities carried at fair value. These inputs are summarized in three broad levels. Level 1 includes quoted prices in active markets for identical assets and liabilities. Level 2 includes other significant observable inputs (including quoted prices for similar securities, interest rates, prepayment speeds, credit risk, etc.). Level 3 includes significant unobservable inputs (including the Series’ own assumptions in determining the fair value of investments). A financial instrument’s level within the fair value hierarchy is based on the lowest level of any input both individually and in aggregate that is significant to the fair value measurement. The inputs or methodology used for valuing securities are not necessarily an indication of the risk associated with investing in those securities.
The following is a summary of the valuation levels used for major security types as of December 31, 2015 in valuing the Series’ assets or liabilities carried at fair value:
| DESCRIPTION | TOTAL | LEVEL 1 | LEVEL 2 | LEVEL 3 | ||||||||||||
Assets: | ||||||||||||||||
Debt securities: | ||||||||||||||||
Debt securities: | ||||||||||||||||
U.S. Treasury and other U.S. | ||||||||||||||||
Government agencies | $ | 9,053,739 | $ | — | $ | 9,053,739 | $ | — | ||||||||
Corporate debt: | ||||||||||||||||
Consumer Discretionary | 7,753,749 | — | 7,753,749 | — | ||||||||||||
Consumer Staples | 2,975,029 | — | 2,975,029 | — | ||||||||||||
Energy | 11,933,090 | — | 11,933,090 | — | ||||||||||||
Financials | 39,871,465 | — | 39,871,465 | — | ||||||||||||
Health Care | 3,427,267 | — | 3,427,267 | — | ||||||||||||
Industrials | 9,649,322 | — | 9,649,322 | — | ||||||||||||
Information Technology | 2,224,208 | — | 2,224,208 | — | ||||||||||||
Materials | 3,597,980 | — | 3,597,980 | — | ||||||||||||
Telecommunication Services | 2,936,494 | — | 2,936,494 | — | ||||||||||||
Utilities | 2,004,903 | — | 2,004,903 | — | ||||||||||||
Commercial mortgage-backed securities | 8,937,416 | — | 8,937,416 | — | ||||||||||||
Foreign government bonds | 106,690,975 | — | 106,690,975 | — | ||||||||||||
Mutual funds | 3,390,122 | 3,390,122 | — | — | ||||||||||||
|
|
|
|
|
|
|
| |||||||||
Total assets | $ | 214,445,759 | $ | 3,390,122 | $ | 211,055,637 | $ | — | ||||||||
|
|
|
|
|
|
|
| |||||||||
There were no Level 3 securities held by the Series as of December 31, 2014 or December 31, 2015.
The Fund’s policy is to recognize transfers in and transfers out of the valuation levels as of the beginning of the reporting period. There were no transfers between Level 1 and Level 2 during the year ended December 31, 2015.
22
Global Fixed Income Series
Notes to Financial Statements (continued)
| 2. | Significant Accounting Policies (continued) |
Security Transactions, Investment Income and Expenses
Security transactions are accounted for on trade date. Dividend income is recorded on the ex-dividend date, except that if the ex-dividend date has passed, certain dividends from foreign securities are recorded as soon as the Series is informed of the ex-dividend date. Non-cash dividends, if any, are recorded at the fair value of the securities received. Interest income, including amortization of premium and accretion of discounts using the effective interest method, is earned from settlement date and accrued daily.
Expenses are recorded on an accrual basis. Most expenses of the Fund can be attributed to a specific series. Expenses which cannot be directly attributed are apportioned among the series in the Fund in such a manner as deemed equitable by the Fund’s Board, taking into consideration, among other things, the nature and type of expense. Income, expenses (other than shareholder services fees), and realized and unrealized gains and losses are prorated among the classes based on the relative net assets of each class. Class specific expenses are directly charged to that class.
The Series uses the identified cost method for determining realized gain or loss on investments for both financial statement and federal income tax reporting purposes.
Foreign Currency Translation
The books and records of the Series are maintained in U.S. dollars. Foreign currencies, investments and other assets and liabilities are translated into U.S. dollars at the current exchange rates. Purchases and sales of investment securities and income and expenses are translated on the respective dates of such transactions. The Series does not isolate realized and unrealized gains and losses attributable to changes in the exchange rates from gains and losses that arise from changes in the fair value of investments. Such fluctuations are included with net realized and unrealized gain or loss on investments. Net realized foreign currency gains and losses represent foreign currency gains and losses between trade date and settlement date on securities transactions, gains and losses on disposition of foreign currencies and the difference between the amount of income and foreign withholding taxes recorded on the books of the Series and the amounts actually received or paid.
Inflation-Indexed Bonds
Each Series may invest in inflation-indexed bonds. Inflation-indexed bonds are fixed income securities whose principal value is periodically adjusted according to the rate of inflation. If the index measuring inflation rises or falls, the principal value of inflation-indexed bonds will be adjusted upward or downward, and consequently the interest payable on these securities (calculated with respect to a larger or smaller principal amount) will be increased or reduced, respectively. Any upward or downward adjustment in the principal amount of an inflation-indexed bond will be included as interest income in the Statement of Operations, even though investors do not receive their principal until maturity. Repayment of the original bond principal upon maturity (as adjusted for inflation) is guaranteed in the case of U.S. Treasury inflation-indexed bonds. For bonds that do not provide a similar guarantee, the adjusted principal value of the bond repaid at maturity may be less than the original principal.
Securities Purchased on a When-Issued Basis or Forward Commitment
The Series may purchase securities on a when-issued basis or forward commitment. These transactions involve a commitment by the Series to purchase securities for a predetermined price with payment and delivery taking place beyond the customary settlement period. When such purchases are outstanding, the Series will designate liquid assets in an amount sufficient to meet the purchase price. When purchasing a security on a delayed delivery basis, the Series assumes the rights and risks of ownership of the security, including the risk of price and yield fluctuations, and takes such fluctuations into account when determining its net asset value. The Series may sell the when-issued securities before they are delivered, which may result in a capital gain or loss. No such investments were held by the Series on December 31, 2015.
In connection with its ability to purchase or sell securities on a forward commitment basis, the Series may enter into forward roll transactions principally using To Be Announced (TBA) securities. Forward roll transactions require the sale of securities for delivery in the current month, and a simultaneous agreement to repurchase substantially similar (same type, coupon and maturity) securities on a specified future date. Risks of entering into forward roll transactions include the potential inability of the counterparty to meet the terms of the agreement; the potential of the Series to receive inferior securities at redelivery as compared to the securities sold to the counterparty; counterparty credit risk; and the potential pay down speed variance
23
Global Fixed Income Series
Notes to Financial Statements (continued)
| 2. | Significant Accounting Policies (continued) |
Securities Purchased on a When-Issued Basis or Forward Commitment (continued)
between the mortgage-backed pools. During the roll period, the Series forgoes principal and interest paid on the securities. The Series accounts for such dollar rolls as purchases and sales. Information regarding securities purchased on a when-issued basis is included in the Series’ Investment Portfolio. No such investments were held by the Series on December 31, 2015.
Restricted Securities
Restricted securities are purchased in private placement transactions, are not registered under the Securities Act of 1933, as amended, and may have contractual restrictions on resale. Information regarding restricted securities is included at the end of the Series’ Investment Portfolio.
Illiquid Securities
A security may be considered illiquid if so deemed in good faith by the Advisor under procedures approved by and under the general supervision and responsibility of the Fund’s Board. Securities that are illiquid are marked with the applicable footnote on the Investment Portfolio. No such investments were held by the Series at December 31, 2015.
Federal Taxes
The Series’ policy is to comply with the provisions of the Internal Revenue Code applicable to regulated investment companies. The Series is not subject to federal income tax or excise tax to the extent that the Series distributes to shareholders each year its taxable income, including any net realized gains on investments, in accordance with requirements of the Internal Revenue Code. Accordingly, no provision for federal income tax or excise tax has been made in the financial statements.
Management evaluates its tax positions to determine if the tax positions taken meet the minimum recognition threshold in connection with accounting for uncertainties in income tax positions taken or expected to be taken for the purposes of measuring and recognizing tax liabilities in the financial statements. Recognition of tax benefits of an uncertain tax position is required only when the position is “more likely than not” to be sustained assuming examination by taxing authorities. At December 31, 2015, the Series has recorded no liability for net unrecognized tax benefits relating to uncertain income tax positions taken or expected to be taken in future tax returns.
The Series files income tax returns in the U.S. federal jurisdiction, various states and foreign jurisdictions, as required. No income tax returns are currently under investigation. The statute of limitations on the Series’ tax returns remains open for the period ended December 31, 2012 and the years ended December 31, 2013 through December 31, 2015. The Series is not aware of any tax positions for which it is reasonably possible that the total amounts of unrecognized tax benefits will significantly change in the next twelve months.
Foreign Taxes
Based on the Series’ understanding of the tax rules and rates related to income, gains and currency purchase/repatriation transactions for foreign jurisdictions in which it invests, the Series will provide for foreign taxes, and where appropriate, deferred foreign tax. The Series is subject to a tax imposed on short term capital gains on securities of issuers domiciled in India. The Series records an estimated deferred tax liability for securities that have been held for less than a year at the end of the reporting period, assuming those positions were disposed of at the end of the period. This amount is reported in Accrued foreign capital gains tax in the accompanying Statement of Assets and Liabilities. Realized losses on the sale of securities of issuers domiciled in India can be carried forward for eight years to offset potential future short term realized capital gains.
Distributions of Income and Gains
Distributions to shareholders of net investment income are made quarterly. Distributions of net realized gains are made annually. An additional distribution may be necessary to avoid taxation of the Series. Distributions are recorded on the ex-dividend date.
Indemnifications
The Fund’s organizational documents provide former and current directors and officers with a limited indemnification against liabilities arising in connection with the performance of their duties to the Fund. In the normal course of business, the Fund may also enter into contracts that provide general indemnifications. The Fund’s maximum exposure under these arrangements is
24
Global Fixed Income Series
Notes to Financial Statements (continued)
| 2. | Significant Accounting Policies (continued) |
Indemnifications (continued)
unknown as this would be dependent on future claims that may be made against the Fund. The risk of material loss from such claims is considered remote.
Other
The preparation of financial statements in conformity with GAAP requires management to make estimates and assumptions that affect the reported amounts of assets and liabilities and the disclosure of contingent assets and liabilities at the date of the financial statements and the reported amounts of income and expenses during the reporting period. Actual results could differ from those estimates.
| 3. | Transactions with Affiliates |
The Fund has an Investment Advisory Agreement (the “Agreement”) with the Advisor, for which the Series pays a fee, computed daily and payable monthly, at an annual rate of 0.60% of the Series’ average daily net assets.
Under the Agreement, personnel of the Advisor provide the Series with advice and assistance in the choice of investments and the execution of securities transactions, and otherwise maintain the Series’ organization. The Advisor also provides the Fund with necessary office space and fund administration and support services. The salaries of all officers of the Fund (except a percentage of the Fund’s Chief Compliance Officer’s salary, which is paid by the Fund), and of all Directors who are “affiliated persons” of the Fund, or of the Advisor, and all personnel of the Fund, or of the Advisor, performing services relating to research, statistical and investment activities, are paid by the Advisor. Each “non-affiliated” Director receives an annual stipend, which is allocated among all the active series of the Fund. In addition, these Directors also receive a fee per Board meeting attended plus a fee for each committee meeting attended and are reimbursed for travel and other out-of-pocket expenses incurred by them in connection with attending such meetings. The Fund also has an Audit Committee Chair, who receives an additional annual stipend for this role.
The Class S shares of the Series are subject to a shareholder services fee in accordance with a shareholder services plan adopted by the Board. The shareholder services fee is intended to compensate financial intermediaries, including affiliates of the Fund, in connection with the provision of direct client service, personal services, maintenance of shareholder accounts and reporting services. For these services, Class S of the Series pays a fee, computed daily and payable monthly, at an annual rate of 0.15% of the average daily net assets of Class S. The Fund has a Shareholder Services Agreement with the Advisor, for which the Advisor receives the shareholder services fee as stated above.
The Advisor has contractually agreed, until at least April 30, 2016, to waive its fee and, if necessary, pay other operating expenses of the Series in order to maintain total direct annual fund operating expenses for the Series, exclusive of Class S’s shareholder services fee, at no more than 0.70% of average daily net assets each year. For the year ended December 31, 2015, the Advisor waived fees of $49,461, which is included as a reduction of expenses on the Statement of Operations. The Advisor is not eligible to recoup any expenses that have been waived or reimbursed in prior years.
Manning & Napier Investor Services, Inc., a registered broker-dealer affiliate of the Advisor, acts as distributor for the Fund’s shares. The services of Manning & Napier Investor Services, Inc. are provided at no additional cost to the Series.
Pursuant to a master services agreement dated November 1, 2014, the Fund pays the Advisor an annual fee related to fund accounting and administration of 0.0085% on the first $25 billion of average daily net assets (excluding Target Series and Strategic Income Series); 0.0075% on the next $15 billion of average daily net assets (excluding Target Series and Strategic Income Series); and 0.0065% of the average daily net assets in excess of $40 billion (excluding Target Series and Strategic Income Series); plus a base fee of $30,400 per series. Transfer agent fees are charged to the Fund on a per account basis. Additionally, certain transaction and out-of-pocket expenses, including charges for reporting relating to the Fund’s compliance program, are charged. The Advisor has agreements with BNY Mellon Investment Servicing (U.S.) Inc. (“BNY”) under which BNY serves as sub-accountant services agent and sub-transfer agent.
25
Global Fixed Income Series
Notes to Financial Statements (continued)
| 3. | Transactions with Affiliates (continued) |
Expenses not directly attributable to a series are allocated based on each series’ relative net assets or number of accounts, depending on the expense.
| 4. | Purchases and Sales of Securities |
For the year ended December 31, 2015, purchases and sales of securities, other than U.S. Government securities and short-term securities, were $107,180,994 and $114,289,411, respectively. Purchases and sales of U.S. Government securities, other than short-term securities, were $19,257,501 and $16,712,444, respectively.
| 5. | Capital Stock Transactions |
Transactions in shares of Class S and I shares of Global Fixed Income Series were:
| CLASS S | FOR THE YEAR ENDED 12/31/15 | FOR THE YEAR ENDED 12/31/14 | ||||||||||||||
| SHARES | AMOUNT | SHARES | AMOUNT | |||||||||||||
Sold | 9,851,643 | $ | 92,527,482 | 2,714,749 | $ | 27,373,610 | ||||||||||
Reinvested | 67,747 | 636,827 | 576,221 | 5,722,647 | ||||||||||||
Repurchased | (15,650,497 | ) | (146,692,206 | ) | (1,580,241 | ) | (15,952,388 | ) | ||||||||
|
|
|
|
|
|
|
| |||||||||
Total | (5,731,107 | ) | $ | (53,527,897 | ) | 1,710,729 | $ | 17,143,869 | ||||||||
|
|
|
|
|
|
|
| |||||||||
| CLASS I | FOR THE YEAR ENDED 12/31/15 | FOR THE YEAR ENDED 12/31/14 | ||||||||||||||
| SHARES | AMOUNT | SHARES | AMOUNT | |||||||||||||
Sold | 5,316,074 | $ | 49,991,905 | 1,341,255 | $ | 13,538,946 | ||||||||||
Reinvested | 19,020 | 178,978 | 141,458 | 1,406,647 | ||||||||||||
Repurchased | (2,242,139 | ) | (20,880,610 | ) | (193,197 | ) | (1,958,199 | ) | ||||||||
|
|
|
|
|
|
|
| |||||||||
Total | 3,092,955 | $ | 29,290,273 | 1,289,516 | $ | 12,987,394 | ||||||||||
|
|
|
|
|
|
|
| |||||||||
Over 90% of the shares outstanding are held by fiduciary accounts where the Advisor has sole investment discretion.
| 6. | Financial Instruments |
The Series may trade in instruments including written and purchased options, forward foreign currency exchange contracts and futures contracts and other derivatives in the normal course of investing activities to assist in managing exposure to various market risks. The Series may be subject to various elements of risk, which may involve, to a varying degree, elements of risk in excess of the amounts recognized for financial statement purposes. These risks include: the risk that changes in the value of a derivative may not correlate perfectly with the underlying asset, rate or index; counterparty credit risk related to over the counter derivative counterparties’ failure to perform under contract terms; liquidity risk related to the lack of a liquid market for these contracts allowing the fund to close out its position(s); and documentation risk relating to disagreement over contract terms. No such investments were held by the Series as of December 31, 2015.
| 7. | Foreign Securities |
Investing in securities of foreign companies and foreign governments involves special risks and considerations not typically associated with investing in securities of domestic companies and the U.S. Government. These risks include revaluation of currencies and future adverse political and economic developments. Moreover, securities of foreign companies and foreign governments and their markets may be less liquid and their prices more volatile than those of comparable domestic companies and the U.S. Government.
26
Global Fixed Income Series
Notes to Financial Statements (continued)
| 8. | Federal Income Tax Information |
The amount and characterization of certain income and capital gains to be distributed are determined in accordance with federal income tax regulations, which may differ from GAAP. These differences are primarily due to differing book and tax treatments in the timing and/or treatment of the recognition of net investment income or gains and losses, including foreign currency gains and losses and qualified late-year losses. The Series may periodically make reclassifications among its capital accounts to reflect income and gains available for distribution (or available capital loss carryovers) under income tax regulations without impacting the Series’ net asset value. For the year ended December 31, 2015, $8,921,288 was reclassified within the capital accounts from Distribution in Excess of Net Investment Income to Accumulated Net Realized Loss on Investments.
The tax character of distributions paid were as follows:
| FOR THE YEAR | FOR THE YEAR | |||||||
| ENDED 12/31/15 | ENDED 12/31/14 | |||||||
Ordinary income | $ | 111,951 | $ | 6,243,524 | ||||
Long-term capital gains | — | 1,137,675 | ||||||
Return of capital | 734,664 | — | ||||||
At December 31, 2015, the tax basis of components of distributable earnings and the net unrealized depreciation based on identified cost for federal income tax purposes were as follows:
Cost for federal income tax purposes | $ | 231,476,670 | ||
Unrealized appreciation | 656,648 | |||
Unrealized depreciation | (17,687,559 | ) | ||
|
| |||
Net unrealized depreciation | $ | (17,030,911 | ) | |
|
| |||
Capital loss carryforward | $ | (2,012,291 | ) | |
Qualified late-year losses1 | $ | 3,061,975 |
1The Series has elected to defer certain qualified late-year losses and recognize such losses in the year ending December 31, 2016.
As of December 31, 2015, the Series had net short-term capital loss carryforwards of $843,287 and net long-term capital loss carryforwards of $1,169,004, which may be carried forward indefinitely.
27
Global Fixed Income Series
Report of Independent Registered Public Accounting Firm
To the Board of Directors of Manning & Napier Fund, Inc. and Shareholders of Global Fixed Income Series:
In our opinion, the accompanying statement of assets and liabilities, including the investment portfolio, and the related statements of operations and of changes in net assets and the financial highlights present fairly, in all material respects, the financial position of Global Fixed Income Series (a series of Manning & Napier Fund, Inc., hereafter referred to as the “Series”) at December 31, 2015, the results of its operations for the year then ended, the changes in its net assets for each of the two years in the period then ended and the financial highlights for each of the periods presented, in conformity with accounting principles generally accepted in the United States of America. These financial statements and financial highlights (hereafter referred to as “financial statements”) are the responsibility of the Series’ management. Our responsibility is to express an opinion on these financial statements based on our audits. We conducted our audits of these financial statements in accordance with the standards of the Public Company Accounting Oversight Board (United States). Those standards require that we plan and perform the audit to obtain reasonable assurance about whether the financial statements are free of material misstatement. An audit includes examining, on a test basis, evidence supporting the amounts and disclosures in the financial statements, assessing the accounting principles used and significant estimates made by management, and evaluating the overall financial statement presentation. We believe that our audits, which included confirmation of securities at December 31, 2015 by correspondence with the custodian and brokers, provide a reasonable basis for our opinion.

New York, New York
February 19, 2016
28
Global Fixed Income Series
Supplemental Tax Information
(unaudited)
All reportings are based on financial information available as of the date of this annual report and, accordingly are subject to change.
The Series has elected to pass through to its shareholders the foreign taxes paid for the year ended December 31, 2015. The Series had $4,887,991 in foreign source income and paid foreign taxes of $55,984.
For federal income tax purposes, the Series reports for the current fiscal year $2,782 or, if different, the maximum amount allowable under the tax law as qualified dividend income.
29
Global Fixed Income Series
Renewal of Investment Advisory Agreement
(unaudited)
At the Manning & Napier Fund, Inc. (the “Fund”) Board of Directors’ (the “Board”) meeting, held on November 17, 2015, the Investment Advisory Agreement (the “Agreement”) between the Fund and Manning & Napier Advisors, LLC (the “Advisor”) was considered by the Board for renewal. In connection with the decision whether to renew the Agreement, a variety of material was prepared for and considered by the Board.
Representatives of the Advisor attended the meeting and presented additional oral and written information to the Board to assist the Board in its considerations. The discussion immediately below outlines the materials and information presented to the Board in connection with the Board’s 2015 Annual consideration of the Agreement and the conclusions made by the Directors when determining to continue the Agreement.
| • | The Board considered the services provided by the Advisor under the Agreement including, among others: deciding what securities to purchase and sell for each Series; arranging for the purchase and sale of such securities by placing orders with broker-dealers; administering the affairs of the Fund (including the books and records of the Fund not maintained by third party service providers such as the custodian or sub-transfer agent); arranging for the insurance coverage for the Fund; and supervising the preparation of tax returns, SEC filings (including registration statements) and reports to shareholders for the Fund. The Board also considered the nature and quality of such services provided under the Agreement in light of the Advisor’s services provided to the Fund for 29 years. The Board discussed the quality of these services with representatives from the Advisor and concluded that the Advisor was performing its services to the Fund required under the Agreement in a reasonable manner. |
| • | The Board considered the performance of each Series since its inception, as well as performance over multiple time periods. Performance for one or more of the following time periods was considered as applicable to the Series’ inception date: inception, three year, five year, ten year, and current market cycle. A market cycle includes periods of both rising and falling markets. Returns for established benchmark indices for each Series were provided. In addition, the Board considered a number of other factors relevant to performance at the meeting (and considers on a quarterly basis) including: a peer group performance analysis consisting of Morningstar universes of mutual funds with similar investment objectives, investment performance of core products, product offerings, performance on an aggregate basis vs. performance over reasonable time periods and the Advisor’s investment process. The Directors acknowledged the challenging performance and discussed the investment process of the Advisor. The Directors confirmed that qualitative factors such as the Advisor’s investment process, including recent enhancements, were an important subset to be considered as part of their consideration of performance. The Board discussed the performance with representatives from the Advisor and concluded that the investment performance of each of the Fund’s Series was reasonable based on the Series’ actual performance and comparative performance, especially for those series with performance over the current market cycle. |
| • | The Board considered the costs of the Advisor’s services and the profits of the Advisor as they relate to the Advisor’s services to the Fund under the Agreement. In reviewing the Advisor’s costs and profits, the Board discussed the Advisor’s revenues generated from the Fund (on both an actual and adjusted basis) and its expenses associated with providing the services under the Agreement. In addition, the Board reviewed the Advisor’s expenses associated with Fund activities outside of the Agreement (such as expense reimbursements pursuant to expense caps and payments made by the Advisor to third party platforms on which shares of the Fund are available for purchase). It was noted by representatives of the Advisor that 22 of the 36 active Series of the Fund are currently experiencing expenses above the capped expense ratios, and thus the Advisor is incurring those expenses over the cap. After discussing the above costs and profits, the Board concluded that the Advisor’s profitability relating to its services provided under the Agreement was reasonable. |
| • | The Board considered the fees and expenses of the various Series of the Fund. The Advisor presented the advisory fees and total expenses for each Series, including the advisory fee adjusted for any expense waivers or reimbursements (either contractual or voluntary) paid by the Advisor. The advisory fees and expense ratios of each Series were compared to an average (on both a mean and median basis) of similar funds as disclosed on the Morningstar database. Representatives of the Advisor discussed with the Board the levels of its advisory fee for each Series of the Fund and as compared to the median and mean advisory fees for similar funds as listed on Morningstar. Expense ratios for every Series, except the Tax Managed Series, Equity Income Class S, High Yield Bond Class S, Pro-Blend Series Classes C and R, and Target Series’ Classes R and K, are lower than, or substantially similar to the Morningstar mean and median reported total expense ratio. |
30
Global Fixed Income Series
Renewal of Investment Advisory Agreement
(unaudited)
The higher than mean and median total expense ratios for Classes C and R reflect higher distribution, marketing and shareholder service fees payable to broker-dealers through a 100bp 12b-1 fee for Class C and a 50bp 12b-1 fee for Class R. Based on their review of the information provided, the Board concluded that the fees and expenses of each Series of the Fund were reasonable on a comparative basis.
| • | The Board also considered the other benefits the Advisor derives from its relationship with the Fund. Such other benefits include certain research services provided by soft dollars. The Board reviewed the broker-dealers who provided research to the Advisor and the products and services paid for, in whole or in part, using soft dollar commissions. Given the level of soft dollar transactions involving the Fund, the Board concluded that these additional benefits to the Advisor were reasonable. |
| • | In addition to the factors described above, the Board considered the Advisor’s personnel, investment strategies, policies and procedures relating to compliance with personal securities transactions, reputation, expertise and resources in domestic and foreign financial markets. The Board concluded that these factors support the conclusion that the Advisor performs its services in a reasonable manner. |
| • | The Board then considered economies of scale and concluded that the current fee schedule to the advisory agreement remained reasonable given the multiple uses of the Fund (for the Advisor’s discretionary investment account clients in addition to direct investors), the current profitability of the Advisor’s services to the Fund under the Agreement, the number of newly established series of the Fund and the overall size of the Fund complex. |
Based on the Board’s deliberations and their evaluation of the information described above, the Board, including a majority of Directors that are not “interested persons” as defined in the Investment Company Act of 1940, concluded that the compensation under the Agreement was fair and reasonable in light of the services and expenses and such other matters as the Directors considered to be relevant in the exercise of their reasonable judgment. Accordingly, the Board approved the renewal of the Agreement. In the course of their deliberations, the Directors did not identify any particular information that was all important or controlling.
31
Global Fixed Income Series
Directors’ and Officers’ Information
(unaudited)
The Statement of Additional Information provides additional information about the Fund’s directors and officers and can be obtained without charge by calling 1-800-466-3863, at www.manningnapieradvisors.com, or on the EDGAR Database on the SEC Internet web site (http:// www.sec.gov). The following chart shows certain information about the Fund’s officers and directors, including their principal occupations during the last five years. Unless specific dates are provided, the individuals have held the listed positions for longer than five years.
| Interested Director/Officer | ||
| Name: | James E. Mikolaichik* | |
| Address: | 290 Woodcliff Drive | |
| Fairport, NY 14450 | ||
| Age: | 44 | |
| Current Position(s) Held with Fund: | Principal Executive Officer, President, Chairman & Director | |
| Term of Office1 & Length of Time Served: | Indefinite - Chairman and Director since August 2015 | |
| Principal Occupation(s) During Past 5 Years: | Chief Financial Officer (since 2011) - Manning & Napier Advisors, LLC; Executive Vice President and Head of Strategy (2008-2011) and Chief Risk Officer (2004-2008) - Old Mutual Asset Management Holds or has held one or more of the following title for various subsidiaries and affiliates: Chief Financial Officer. | |
| Number of Portfolios Overseen within Fund Complex: | 41 | |
| Other Directorships Held Outside Fund Complex: | N/A | |
| Independent Directors | ||
| Name: | Stephen B. Ashley | |
| Address: | 290 Woodcliff Drive | |
| Fairport, NY 14450 | ||
| Age: | 75 | |
| Current Position(s) Held with Fund: | Director, Audit Committee Member, Governance & Nominating Committee Member | |
| Term of Office & Length of Time Served: | Indefinite - Since 1996 | |
| Principal Occupation(s) During Past 5 Years: | Chairman, Director, President & Chief Executive Officer (1997 to present) - The Ashley Group (property management and investment); Director (1995-2008) and Chairman (non-executive) (2004-2008) - Fannie Mae (mortgage). | |
| Number of Portfolios Overseen within Fund Complex: | 41 | |
| Other Directorships Held Outside Fund Complex: | Fannie Mae (1995-2008) | |
| The Ashley Group (1995-2008) | ||
| Genesee Corporation (1987-2007) | ||
| Name: | Paul A. Brooke | |
| Address: | 290 Woodcliff Drive | |
| Fairport, NY 14450 | ||
| Age: | 70 | |
| Current Position(s) Held with Fund: | Director, Audit Committee Member, Governance & Nominating Committee Member | |
| Term of Office & Length of Time Served: | Indefinite - Since 2007 | |
| Principal Occupation(s) During Past 5 Years: | Chairman & CEO (2005-2009) - Ithaka Acquisition Corporation (investments); Chairman (2007-2009) Alsius Corporation (investments); Managing Member, PMSV Holdings LLC (investments) since 1991; Managing Member, Venbio (investments) since 2010. | |
| Number of Portfolios Overseen within Fund Complex: | 41 | |
| Other Directorships Held Outside Fund Complex: | Incyte Corp. (2000-present) | |
| ViroPharma, Inc. (2000-2014) | ||
| HLTH Corp (WebMD) (2000-2010) | ||
| Cheyne Capital International (2000-present) | ||
| GMP Companies (2000-2011) | ||
| Cytos Biotechnology Ltd. (2012-2014) | ||
32
Global Fixed Income Series
| Directors’ and Officers’ Information | ||
(unaudited)
| ||
| Independent Directors (continued) | ||
| Name: | Peter L. Faber | |
| Address: | 290 Woodcliff Drive | |
| Fairport, NY 14450 | ||
| Age: | 77 | |
| Current Position(s) Held with Fund: | Director, Governance & Nominating Committee Member | |
| Term of Office & Length of Time Served: | Indefinite - Since 1987 | |
| Principal Occupation(s) During Past 5 Years: | Senior Counsel (2006-2012), Partner (1995-2006 & 2013-present) - McDermott, Will & Emery LLP (law firm) | |
| Number of Portfolios Overseen within Fund Complex: | 41 | |
| Other Directorships Held Outside Fund Complex: | Boston Early Music Festival (non-profit)(2007-present) | |
| Amherst Early Music, Inc. (non-profit)(2009-present) | ||
| Gotham Early Music Scene, Inc. (non-profit)(2009-present) | ||
| Partnership for New York City, Inc. (non-profit) (1989-2010) | ||
| New York Collegium (non-profit) (2004-2011) | ||
| Name: | Harris H. Rusitzky | |
| Address: | 290 Woodcliff Drive | |
| Fairport, NY 14450 | ||
| Age: | 80 | |
| Current Position(s) Held with Fund: | Director, Audit Committee Member, Governance & Nominating Committee Member | |
| Term of Office & Length of Time Served: | Indefinite - Since 1985 | |
| Principal Occupation(s) During Past 5 Years: | President, The Greening Group (business consultants) since 1994; | |
| Partner, The Restaurant Group (restaurants) since 2006 | ||
| Number of Portfolios Overseen within Fund Complex: | 41 | |
| Other Directorships Held Outside Fund Complex: | Rochester Institute of Technology (university)(1972-present) | |
| Culinary Institute of America (non-profit college)(1985-present) | ||
| George Eastman House (museum)(1988-present) | ||
| National Restaurant Association (restaurant trade organization)(1978-present) | ||
| Name: | Chester N. Watson | |
| Address: | 290 Woodcliff Drive | |
| Fairport, NY 14450 | ||
| Age: | 65 | |
| Current Position(s) Held with Fund: | Director, Audit Committee Chairman, Governance & Nominating Committee Member | |
| Term of Office & Length of Time Served: | Indefinite - Since 2012 | |
| Principal Occupation(s) During Past 5 Years: | General Auditor (2003-2011) - General Motors Company (auto manufacturer) | |
| Number of Portfolios Overseen within Fund Complex: | 41 | |
| Other Directorships Held Outside Fund Complex: | Rochester Institute of Technology (university)(2005-present) | |
Officers | ||
| Name: | Jeffrey S. Coons, Ph.D., CFA | |
| Address: | 290 Woodcliff Drive | |
| Fairport, NY 14450 | ||
| Age: | 52 | |
| Current Position(s) Held with Fund: | Vice President | |
| Term of Office1 & Length of Time Served: | Since 2004 | |
| Principal Occupation(s) During Past 5 Years: | President since 2010, Co-Director of Research (2002-2015) - Manning & Napier Advisors, LLC | |
| Holds one or more of the following titles for various subsidiaries and affiliates: President, Director, Treasurer or Senior Trust Officer. | ||
| Number of Portfolios Overseen within Fund Complex: | 41 | |
| Other Directorships Held Outside Fund Complex: | N/A | |
33
Global Fixed Income Series
Directors’ and Officers’ Information (unaudited) | ||
| Officers (continued) | ||
| Name: | Elizabeth Craig | |
| Address: | 290 Woodcliff Drive | |
| Fairport, NY 14450 | ||
| Age: | 28 | |
| Current Position(s) Held with Fund: | Assistant Corporate Secretary | |
| Term of Office1 & Length of Time Served: | Since 2011 | |
| Principal Occupation(s) During Past 5 Years: | Fund Administration Manager since 2015; Mutual Fund Compliance Specialist (2009-2015) - Manning & Napier Advisors, LLC | |
| Number of Portfolios Overseen within Fund Complex: | 41 | |
| Other Directorships Held Outside Fund Complex: | N/A | |
| Name: | Christine Glavin | |
| Address: | 290 Woodcliff Drive | |
| Fairport, NY 14450 | ||
| Age: | 49 | |
| Current Position(s) Held with Fund: | Principal Financial Officer, Chief Financial Officer | |
| Term of Office1 & Length of Time Served: | Principal Financial Officer since 2002; Chief Financial Officer since 2001 | |
| Principal Occupation(s) During Past 5 Years: | Director of Fund Reporting since 2011; Fund Reporting Manager (1997-2011) - Manning & Napier Advisors, LLC; Assistant Treasurer since 2008 - Exeter Trust Company | |
| Number of Portfolios Overseen within Fund Complex: | 41 | |
| Other Directorships Held Outside Fund Complex: | N/A | |
| Name: | Jodi L. Hedberg | |
| Address: | 290 Woodcliff Drive | |
| Fairport, NY 14450 | ||
| Age: | 48 | |
| Current Position(s) Held with Fund: | Corporate Secretary, Chief Compliance Officer, Anti-Money Laundering Compliance Officer | |
| Term of Office1 & Length of Time Served: | Corporate Secretary since 1997; Chief Compliance Officer since 2004; | |
| Anti-Money Laundering Compliance Officer since 2002 | ||
| Principal Occupation(s) During Past 5 Years: | Director of Compliance since 2005; Compliance Manager (1995-2005) - Manning & Napier Advisors, LLC and affiliates; Corporate Secretary - Manning & Napier Investor Services, Inc. since 2006 | |
| Number of Portfolios Overseen within Fund Complex: | 41 | |
| Other Directorships Held Outside Fund Complex: | N/A | |
| Name: | Richard Yates | |
| Address: | 290 Woodcliff Drive | |
| Fairport, NY 14450 | ||
| Age: | 50 | |
| Current Position(s) Held with Fund: | Chief Legal Officer | |
| Term of Office1 & Length of Time Served: | Chief Legal Officer since 2004 | |
| Principal Occupation(s) During Past 5 Years: | Counsel - Manning & Napier Advisors, LLC and affiliates since 2000; | |
| Holds one or more of the following titles for various affiliates; Director or | ||
| Corporate Secretary | ||
| Number of Portfolios Overseen within Fund Complex: | 41 | |
| Other Directorships Held Outside Fund Complex: | N/A | |
*Interested Director, within the meaning of the Investment Company Act of 1940 by reason of his position with the Fund’s investment advisor and distributor. Mr. Mikolaichik serves as the Chief Financial Officer for Manning & Napier Advisors, LLC.
1The term of office of all officers shall be one year and until their respective successors are chosen and qualified, or his or her earlier resignation or removal as provided in the Fund’s By-Laws.
34
Global Fixed Income Series
Results of Special Meeting of Shareholders
(unaudited)
A Special Meeting of the Shareholders of the Fund was held on August 18, 2015. The number of votes necessary to conduct the meeting and approve the proposal was obtained, and the results of the vote of shareholders of all the Series of the Fund voting together in the aggregate is listed below:
PROPOSAL 1:
Election of Directors
| NUMBER OF SHARES VOTED FOR | NUMBER OF SHARES WITHELD | |||||||
Stephen B. Ashley | 883,968,395 | 8,618,094 | ||||||
Paul A. Brooke | 884,510,661 | 8,075,828 | ||||||
Peter L. Faber | 884,140,893 | 8,445,596 | ||||||
James E. Mikolaichik | 883,391,832 | 9,194,657 | ||||||
Harris H. Rusitzky | �� | 620,022,215 | 272,564,274 | |||||
Chester N. Watson | 884,638,809 | 7,947,680 | ||||||
35
Global Fixed Income Series
Literature Requests
(unaudited)
Proxy Voting Policies and Procedures
A description of the policies and procedures that the Fund uses to determine how to vote proxies relating to portfolio securities is available, without charge, upon request:
| By phone | 1-800-466-3863 | |||
| On the Securities and Exchange | ||||
| Commission’s (SEC) web site | http://www.sec.gov |
Proxy Voting Record
Information regarding how the Fund voted proxies relating to portfolio securities during the most recent 12-month period ended June 30th is available, without charge, upon request:
| By phone | 1-800-466-3863 | |||
| On the SEC’s web site | http://www.sec.gov |
Quarterly Portfolio Holdings
The Series’ complete schedule of portfolio holdings for the 1st and 3rd quarters of each fiscal year are provided on Form N-Q, and are available, without charge, upon request:
| By phone | 1-800-466-3863 | |||
| On the SEC’s web site | http://www.sec.gov |
The Series’ Form N-Q may be reviewed and copied at the SEC’s Public Reference Room in Washington, D.C. Information on the operation of the Public Reference Room may be obtained by calling 1-800-SEC-0330.
Prospectus and Statement of Additional Information (SAI)
For more information about any of the Manning & Napier Fund, Inc. Series, you may obtain a prospectus and SAI at www.manning-napier.com or by calling (800) 466-3863. Before investing, carefully consider the objectives, risks, charges and expenses of the investment and read the prospectus carefully as it contains this and other information about the investment company. In addition, this information can be found on the SEC’s web site, http://www.sec.gov.
Additional information available at www.manning-napier.com
1. Fund Holdings - Month-End
2. Fund Holdings - Quarter-End
3. Shareholder Report - Annual
4. Shareholder Report - Semi-Annual
The Fund also offers electronic notification or “e-delivery” when certain documents are available on-line to be downloaded or reviewed. Direct shareholders can elect to receive electronic notification when shareholder reports, prospectus updates, and/or statements are available. If you do not currently have on-line access to your account, you can establish access by going to www.manning-napier.com, click on “Login” in the top corner of the page, and follow the prompts to self-enroll. Once enrolled, you can set your electronic notification preferences by clicking on the Account Options tab located within the green toolbar and then select E-Delivery Option. Should you have any questions on either how to establish on-line access or how to update your account settings, please contact Investor Services at 1-800-466-3863.
The Manning & Napier Fund, Inc. is managed by Manning & Napier Advisors, LLC. Manning & Napier Investor Services, Inc., an affiliate of Manning & Napier Advisors, LLC, is the distributor of the Fund shares.
MNGFI-12/15-AR
Dynamic Opportunities Series
Management Discussion and Analysis
(unaudited)
Dear Shareholders:
Volatility defined global equity markets during the past year, largely driven by macroeconomic factors. Markets around the world experienced a correction in late August amidst a broad selloff triggered by renewed concerns about economic growth in emerging markets — China in particular — and uncertainty about the effects of that slowdown on overall global growth. Developed economies continued to provide accommodative monetary policy to combat growth concerns, although in December the U.S. Federal Reserve raised the federal funds rate for the first time in nearly a decade. For much of the year, Europe struggled with uncertainty regarding Greece’s ability to secure bailout funding from its creditors, which negatively affected investor sentiment. China’s economy slowed, but the government continued to demonstrate a willingness to provide support through a combination of policy-easing maneuvers and targeted stimulus measures. The U.S. economy remained on a path of slow growth that nevertheless made it the best performing developed economy. U.S. stocks were largely flat for the year, whereas global equity markets moderately declined. Looking ahead, we expect the slow global growth environment to remain in place for the foreseeable future.
As always, we appreciate your business.
Sincerely,
Manning & Napier Advisors, LLC
1
Dynamic Opportunities Series
Fund Commentary
(unaudited)
Investment Objective
To provide long-term growth.
Performance Commentary
The Russell Midcap® Growth Index (Russell Midcap Growth) experienced a return of -0.20% during 2015. The Dynamic Opportunities Series experienced negative absolute returns as well, returning -3.13% and underperforming the benchmark on a relative basis.
The Series’ underperformance relative to the Russell Midcap Growth during the year was driven by stock selection. In contrast, the aggregate impact of sector positioning contributed positively to relative returns. Regarding major detractors from relative performance, stock selection in Industrials, Information Technology, and Financials challenged relative returns.
Offsetting a portion of the relative performance weakness were positive contributions to relative returns from stock selection in Health Care and Consumer Staples. The Series’ underweight to Industrials relative to the benchmark also aided relative returns.
Regarding current portfolio positioning, the Series’ investments are concentrated in fundamentally strong businesses that are not heavily reliant upon macroeconomic growth to drive sales and earnings. More specifically, we see value in businesses that we believe have control of their destiny and are taking share in large established markets or are creating new markets on their own. The goal is to identify companies trading at attractive valuations relative to their growth potential.
During 2016 we believe investors should expect further gyrations in equity markets due to catalysts such as geopolitical risks, the diverging monetary policies of major central banks, commodity price pressures, and the potential for global growth to deviate from expectations. With the Federal Reserve having raised the federal funds rate, we think they now will seek to remain flexible and proceed slowly with small increases that do not follow a well-defined schedule. Broadly speaking, valuations in the developed world remain neutral at best, whereas valuations in select emerging markets are relatively more attractive. Shareholders should expect us to view volatility as a buying opportunity given that our indicators do not suggest capital risk is a significant near-term concern. In light of the current environment, it is important that investors remain active, flexible, and selective in their approach in order to avoid overvalued areas of the market, something Manning & Napier has done for over 45 years as an active investment manager.
Performance data quoted represents past performance and does not guarantee future results. The investment return and principal value of an investment will fluctuate, so that an investor’s shares, when redeemed, may be worth more or less than their original cost. Current performance may be higher or lower than that quoted; investors can obtain the most recent month-end performance at www.manning-napier.com or by calling (800) 466-3863. Performance for the Dynamic Opportunities Series Class S shares is provided above. Performance for the Class I shares will be higher based on the Class’ lower expenses.
Please see the next page for additional performance information as of December 31, 2015.
All investments involve risks, including possible loss of principal. As with any stock fund, the value of your investment will fluctuate in response to stock market movements. Investing in the Series will also involve a number of other risks, including issuer-specific risk, small-cap/mid-cap risk, foreign investment risk, and the risk that the investment approach may not be successful. Stocks of small- and mid-cap companies may be subject to more abrupt or erratic market movements than the stocks of larger companies and may be less marketable than the stocks of larger companies. In addition, they may have limited product lines, markets, or financial resources, and they may depend on a small management group. As a result, they fail more often than larger companies. Funds that invest in foreign countries may be subject to the risks of adverse changes in foreign economic, political, regulatory and other conditions as well as risks related to the use of different financial standards. Investments in emerging markets may be more volatile than investments in more developed markets.
2
Dynamic Opportunities Series
Performance Update as of December 31, 2015
(unaudited)
| AGGREGATE TOTAL RETURNS AS OF DECEMBER 31, 2015 | ||||||||
| ONE YEAR1 | TOTAL RETURN SINCE INCEPTION2 | |||||||
Manning & Napier Fund, Inc. - Dynamic Opportunities Series - Class S3 | -3.13 | % | -0.63 | % | ||||
Manning & Napier Fund, Inc. - Dynamic Opportunities Series - Class I3 | -2.92 | % | -0.43 | % | ||||
Russell Midcap Growth Index4 | -0.20 | % | 5.68 | % | ||||
Russell 2500 Growth Index5 | -0.19 | % | 3.37 | % | ||||
The following graph compares the value of a $10,000 investment in the Manning & Napier Fund, Inc. - Dynamic Opportunities Series Class S from its inception2 (December 31, 2013) to present (December 31, 2015) to the Russell Mid Cap Growth Index and the Russell 2500 Growth Index.
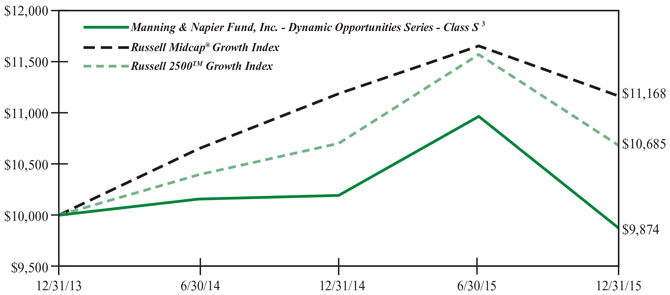
1The returns shown are based on net asset values calculated for shareholder transactions and may differ from the returns shown in the financial highlights, which reflect adjustments made to the net asset values in accordance with accounting principles generally accepted in the United States of America.
2Performance numbers for the Series and the Indices are calculated from December 31, 2013, the Series inception date.
3The Series’ performance does not reflect the deduction of taxes that a shareholder would pay on fund distributions or the redemption of shares. The Series’ performance is historical and may not be indicative of future results. The performance returns shown are inclusive of the net expense ratio of the Series. For the year ended December 31, 2015, this net expense ratio was 1.07% for Class S and 0.87% for Class I. The gross expense ratio, which does not account for any voluntary or contractual waivers currently in effect, was 1.07% for Class S and 0.87% for Class I for the year ended December 31, 2015.
4The Russell Midcap Growth Index measures the performance of the mid-cap growth segment of the U.S. equity universe. It includes those Russell Midcap Index companies with higher price-to-book ratios and higher forecasted growth values. The Index returns do not reflect any fees or expenses. The Index returns are net of withholding taxes. They assume daily reinvestment of net dividends thus accounting for any applicable dividend taxation. The Index is denominated in U.S. dollars. Index returns provided by Bloomberg.
5The Russell 2500 Growth Index measures the performance of the small to mid-cap growth segment of the U.S. equity universe. It includes those Russell 2500 companies with higher growth earning potential as defined by Russell’s leading style methodology. The Index returns do not reflect any fees or expenses. The Index returns are net of withholding taxes. They assume daily reinvestment of net dividends thus accounting for any applicable dividend taxation. The Index is denominated in U.S. dollars. Index returns provided by Bloomberg.
3
Dynamic Opportunities Series
Shareholder Expense Example
(unaudited)
As a shareholder of the Series, you incur ongoing costs, including management fees, shareholder service fees and other Series expenses. This example is intended to help you understand your ongoing costs (in dollars) of investing in the Series and to compare these costs with the ongoing costs of investing in other mutual funds.
The example is based on an investment of $1,000 invested at the beginning of the period and held for the entire period (July 1, 2015 to December 31, 2015).
Actual Expenses
The Actual lines of the table below provide information about actual account values and actual expenses. You may use the information in this line, together with the amount you invested, to estimate the expenses that you paid over the period. Simply divide your account value by $1,000 (for example, an $8,600 account value divided by $1,000 = 8.6), then multiply the result by the number in the Actual line for the Class in which you have invested under the heading entitled “Expenses Paid During Period” to estimate the expenses you paid on your account during this period.
Hypothetical Example for Comparison Purposes
The Hypothetical lines of each Class in the table below provide information about hypothetical account values and hypothetical expenses based on the Class’ actual expense ratio and an assumed rate of return of 5% per year before expenses, which is not the Class’ actual return. The hypothetical account values and expenses may not be used to estimate the actual ending account balance or expenses you paid during the period. You may use this information to compare the ongoing costs of investing in the Series and other funds. To do so, compare this 5% hypothetical example for the class in which you have invested with the 5% hypothetical examples that appear in the shareholder reports of the other funds.
Please note that the expenses shown in the table are meant to highlight your ongoing costs only and do not reflect any transaction costs, such as sales charges (loads), redemption fees, or exchange fees that you may incur in other mutual funds. Therefore, the Hypothetical lines for each Class in the table are useful in comparing ongoing costs only, and will not help you determine the relative total costs of owning different funds.
| BEGINNING ACCOUNT VALUE 7/1/15 | ENDING ACCOUNT VALUE 12/31/15 | EXPENSES PAID DURING PERIOD* 7/1/15-12/31/15 | ANNUALIZED EXPENSE RATIO | |||||
Class S | ||||||||
Actual | $1,000.00 | $900.30 | $5.22 | 1.09% | ||||
Hypothetical | ||||||||
(5% return before expenses) | $1,000.00 | $1,019.71 | $5.55 | 1.09% | ||||
Class I | ||||||||
Actual | $1,000.00 | $901.60 | $4.27 | 0.89% | ||||
Hypothetical | ||||||||
(5% return before expenses) | $1,000.00 | $1,020.72 | $4.53 | 0.89% |
*Expenses are equal to each Class’ annualized expense ratio (for the six-month period), multiplied by the average account value over the period, multiplied by 184/365 (to reflect the one-half year period). Expenses are based on the most recent fiscal half year; therefore, the expense ratios stated above may differ from the expense ratios stated in the financial highlights, which are based on one-year data.
4
Dynamic Opportunities Series
Portfolio Composition as of December 31, 2015
(unaudited)
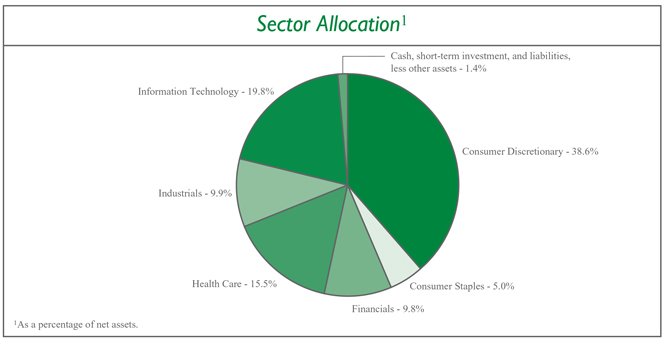
5
Dynamic Opportunities Series
Investment Portfolio - December 31, 2015
| DYNAMIC OPPORTUNITIES SERIES | SHARES | VALUE (NOTE 2) | ||||||
COMMON STOCKS - 98.6% | ||||||||
Consumer Discretionary - 38.6% | ||||||||
Diversified Consumer Services - 3.6% | ||||||||
Houghton Mifflin Harcourt Co.* | 443,310 | $ | 9,655,292 | |||||
|
| |||||||
Hotels, Restaurants & Leisure - 3.1% | ||||||||
Dunkin’ Brands Group, Inc. | 196,000 | 8,347,640 | ||||||
|
| |||||||
Internet & Catalog Retail - 3.1% | ||||||||
TripAdvisor, Inc.* | 98,540 | 8,400,535 | ||||||
|
| |||||||
Media - 9.4% | ||||||||
AMC Networks, Inc. - Class A* | 138,250 | 10,324,510 | ||||||
Discovery Communications, Inc. - Class A* | 559,500 | 14,927,460 | ||||||
|
| |||||||
| 25,251,970 | ||||||||
|
| |||||||
Specialty Retail - 8.0% | ||||||||
Advance Auto Parts, Inc. | 108,460 | 16,324,315 | ||||||
Dick’s Sporting Goods, Inc. | 148,870 | 5,262,555 | ||||||
|
| |||||||
| 21,586,870 | ||||||||
|
| |||||||
Textiles, Apparel & Luxury Goods - 11.4% | ||||||||
Carter’s, Inc. | 60,330 | 5,371,180 | ||||||
Gildan Activewear, Inc. (Canada) | 279,920 | 7,955,326 | ||||||
lululemon athletica, Inc.* | 328,350 | 17,228,524 | ||||||
|
| |||||||
| 30,555,030 | ||||||||
|
| |||||||
Total Consumer Discretionary | 103,797,337 | |||||||
|
| |||||||
Consumer Staples - 5.0% | ||||||||
Food & Staples Retailing - 5.0% | ||||||||
Sprouts Farmers Market, Inc.* | 506,480 | 13,467,303 | ||||||
|
| |||||||
Financials - 9.8% | ||||||||
Capital Markets - 2.0% | ||||||||
Financial Engines, Inc. | 158,320 | 5,330,634 | ||||||
|
| |||||||
Consumer Finance - 4.4% | ||||||||
SLM Corp.* | 1,831,540 | 11,941,641 | ||||||
|
| |||||||
Diversified Financial Services - 3.4% | ||||||||
Morningstar, Inc. | 112,290 | 9,029,239 | ||||||
|
| |||||||
Total Financials | 26,301,514 | |||||||
|
| |||||||
Health Care - 15.5% | ||||||||
Biotechnology - 6.4% | ||||||||
Cepheid, Inc.* | 236,940 | 8,655,418 | ||||||
Seattle Genetics, Inc.* | 192,410 | 8,635,361 | ||||||
|
| |||||||
| 17,290,779 | ||||||||
|
| |||||||
Health Care Equipment & Supplies - 2.2% | ||||||||
LDR Holding Corp.* | 233,660 | 5,867,203 | ||||||
|
| |||||||
The accompanying notes are an integral part of the financial statements.
6
Dynamic Opportunities Series
Investment Portfolio - December 31, 2015
| DYNAMIC OPPORTUNITIES SERIES | SHARES | VALUE (NOTE 2) | ||||||
COMMON STOCKS (continued) | ||||||||
Health Care (continued) | ||||||||
Health Care Providers & Services - 6.9% | ||||||||
Acadia Healthcare Co., Inc.* | 86,780 | $ | 5,420,279 | |||||
DaVita HealthCare Partners, Inc.* | 189,830 | 13,233,049 | ||||||
|
| |||||||
| 18,653,328 | ||||||||
|
| |||||||
Total Health Care | 41,811,310 | |||||||
|
| |||||||
Industrials - 9.9% | ||||||||
Commercial Services & Supplies - 4.0% | ||||||||
Stericycle, Inc.* | 90,120 | 10,868,472 | ||||||
|
| |||||||
Road & Rail - 5.9% | ||||||||
Genesee & Wyoming, Inc. - Class A* | 189,050 | 10,150,095 | ||||||
Kansas City Southern | 77,240 | 5,767,511 | ||||||
|
| |||||||
| 15,917,606 | ||||||||
|
| |||||||
Total Industrials | 26,786,078 | |||||||
|
| |||||||
Information Technology - 19.8% | ||||||||
Communications Equipment - 1.8% | ||||||||
Ixia* | 397,120 | 4,936,202 | ||||||
|
| |||||||
Electronic Equipment, Instruments & Components - 5.8% | ||||||||
FLIR Systems, Inc. | 151,490 | 4,252,324 | ||||||
Trimble Navigation Ltd.* | 527,660 | 11,318,307 | ||||||
|
| |||||||
| 15,570,631 | ||||||||
|
| |||||||
Internet Software & Services - 9.7% | ||||||||
Envestnet, Inc.* | 297,920 | 8,892,912 | ||||||
Match Group, Inc.* | 394,140 | 5,340,597 | ||||||
MercadoLibre, Inc. (Argentina) | 69,610 | 7,959,207 | ||||||
Q2 Holdings, Inc.* | 148,630 | 3,919,373 | ||||||
|
| |||||||
| 26,112,089 | ||||||||
|
| |||||||
IT Services - 2.5% | ||||||||
EVERTEC, Inc. | 394,210 | 6,599,075 | ||||||
|
| |||||||
Total Information Technology | 53,217,997 | |||||||
|
| |||||||
TOTAL COMMON STOCKS | ||||||||
(Identified Cost $287,701,991) | 265,381,539 | |||||||
|
| |||||||
The accompanying notes are an integral part of the financial statements.
7
Dynamic Opportunities Series
Investment Portfolio - December 31, 2015
| VALUE | ||||||||
| DYNAMIC OPPORTUNITIES SERIES | SHARES | (NOTE 2) | ||||||
SHORT-TERM INVESTMENT - 2.5% | ||||||||
Dreyfus Cash Management, Inc. - Institutional Shares1, 0.23% | ||||||||
(Identified Cost $6,721,642) | 6,721,642 | $ | 6,721,642 | |||||
|
| |||||||
TOTAL INVESTMENTS - 101.1% | ||||||||
(Identified Cost $294,423,633) | 272,103,181 | |||||||
LIABILITIES, LESS OTHER ASSETS - (1.1%) | (2,870,723 | ) | ||||||
|
| |||||||
NET ASSETS - 100% | $ | 269,232,458 | ||||||
|
| |||||||
ADR - American Depositary Receipt
*Non-income producing security.
1Rate shown is the current yield as of December 31, 2015.
The Global Industry Classification Standard (GICS) was developed by and is the exclusive property and a service mark of MSCI Inc. (MSCI) and Standard & Poor’s, a division of The McGraw-Hill Companies, Inc. (S&P), and is licensed for use by Manning & Napier when referencing GICS sectors. Neither MSCI, S&P, nor any third party involved in making or compiling the GICS or any GICS classifications makes any express or implied warranties or representations with respect to such standard or classification, nor shall any such party have any liability therefrom.
The accompanying notes are an integral part of the financial statements.
8
Dynamic Opportunities Series
Statement of Assets & Liabilities
December 31, 2015
ASSETS: | ||||
Investments, at value (identified cost $294,423,633) (Note 2) | $ | 272,103,181 | ||
Dividends receivable | 50,242 | |||
Receivable for fund shares sold | 167,757 | |||
Foreign tax reclaims receivable | 3,132 | |||
Prepaid expenses | 1,955 | |||
|
| |||
TOTAL ASSETS | 272,326,267 | |||
|
| |||
LIABILITIES: | ||||
Due to Custodian | 367 | |||
Accrued management fees (Note 3) | 184,848 | |||
Accrued shareholder services fees (Class S) (Note 3) | 37,208 | |||
Accrued fund accounting and administration fees (Note 3) | 11,575 | |||
Accrued transfer agent fees (Note 3) | 5,740 | |||
Accrued Chief Compliance Officer service fees (Note 3) | 429 | |||
Payable for securities purchased | 2,614,294 | |||
Payable for fund shares repurchased | 221,911 | |||
Other payables and accrued expenses | 17,437 | |||
|
| |||
TOTAL LIABILITIES | 3,093,809 | |||
|
| |||
TOTAL NET ASSETS | $ | 269,232,458 | ||
|
| |||
NET ASSETS CONSIST OF: | ||||
Capital stock | $ | 301,189 | ||
Additional paid-in-capital | 290,676,413 | |||
Accumulated net realized gain on investments, foreign currency and translation of other assets and liabilities | 575,308 | |||
Net unrealized depreciation on investments | (22,320,452 | ) | ||
|
| |||
TOTAL NET ASSETS | $ | 269,232,458 | ||
|
| |||
NET ASSET VALUE, OFFERING PRICE AND REDEMPTION PRICE PER SHARE - Class S ($218,126,311/ 24,421,510 shares) | $ | 8.93 | ||
|
| |||
NET ASSET VALUE, OFFERING PRICE AND REDEMPTION PRICE PER SHARE - Class I ($51,106,147/ 5,697,366 shares) | $ | 8.97 | ||
|
| |||
The accompanying notes are an integral part of the financial statements.
9
Dynamic Opportunities Series
Statement of Operations
For the Year Ended December 31, 2015
INVESTMENT INCOME: | ||||
Dividends (net of foreign taxes withheld, $22,941) | $ | 930,132 | ||
|
| |||
EXPENSES: | ||||
Management fees (Note 3) | 2,446,671 | |||
Shareholder services fees (Class S)(Note 3) | 492,146 | |||
Fund accounting and administration fees (Note 3) | 65,553 | |||
Transfer agent fees (Note 3) | 16,071 | |||
Directors’ fees (Note 3) | 11,644 | |||
Chief Compliance Officer service fees (Note 3) | 2,541 | |||
Custodian fees | 15,232 | |||
Miscellaneous | 111,775 | |||
|
| |||
Total Expenses | 3,161,633 | |||
|
| |||
NET INVESTMENT LOSS | (2,231,501 | ) | ||
|
| |||
REALIZED AND UNREALIZED GAIN (LOSS) ON INVESTMENTS AND FOREIGN CURRENCY: | ||||
Net realized gain (loss) on- | ||||
Investments | 27,252,718 | |||
Foreign currency and translation of other assets and liabilities | (1,272 | ) | ||
|
| |||
| 27,251,446 | ||||
|
| |||
Net change in unrealized appreciation (depreciation) on- | ||||
Investments | (32,566,505 | ) | ||
Foreign currency and translation of other assets and liabilities | 229 | |||
|
| |||
| (32,566,276 | ) | |||
|
| |||
NET REALIZED AND UNREALIZED LOSS ON INVESTMENTS AND FOREIGN CURRENCY | (5,314,830 | ) | ||
|
| |||
NET DECREASE IN NET ASSETS RESULTING FROM OPERATIONS | $ | (7,546,331 | ) | |
|
| |||
The accompanying notes are an integral part of the financial statements.
10
Dynamic Opportunities Series
Statements of Changes in Net Assets
| FOR THE YEAR ENDED 12/31/15 | FOR THE YEAR ENDED 12/31/14* | |||||||
INCREASE (DECREASE) IN NET ASSETS: | ||||||||
OPERATIONS: | ||||||||
Net investment loss | $ | (2,231,501 | ) | $ | (1,700,667 | ) | ||
Net realized gain on investments and foreign currency | 27,251,446 | 4,176,461 | ||||||
Net change in unrealized appreciation (depreciation) on investments and foreign currency | (32,566,276 | ) | 10,245,824 | |||||
|
|
|
| |||||
Net increase (decrease) from operations | (7,546,331 | ) | 12,721,618 | |||||
|
|
|
| |||||
DISTRIBUTIONS TO SHAREHOLDERS (Note 8): | ||||||||
From net realized gain on investments (Class S) | (14,655,376 | ) | (7,357,799 | ) | ||||
From net realized gain on investments (Class I) | (3,395,394 | ) | (1,602,675 | ) | ||||
|
|
|
| |||||
Total distributions to shareholders | (18,050,770 | ) | (8,960,474 | ) | ||||
|
|
|
| |||||
CAPITAL STOCK ISSUED AND REPURCHASED: | ||||||||
Net increase (decrease) from capital share transactions (Note 5) | (10,391,541 | ) | 300,959,956 | |||||
|
|
|
| |||||
Net increase (decrease) in net assets | (35,988,642 | ) | 304,721,100 | |||||
NET ASSETS: | ||||||||
Beginning of year | 305,221,100 | 500,000 | ||||||
|
|
|
| |||||
End of year (including undistributed net investment income of $0 and $0, respectively) | $ | 269,232,458 | $ | 305,221,100 | ||||
|
|
|
| |||||
* Commencement of operations was December 31, 2013.
The accompanying notes are an integral part of the financial statements.
11
Dynamic Opportunities Series
Financial Highlights - Class S
| FOR THE YEAR ENDED 12/31/15 | FOR THE YEAR ENDED 12/31/14* | |||||||
Per share data (for a share outstanding throughout each year): | ||||||||
Net asset value - Beginning of year | $ | 9.88 | $ | 10.00 | ||||
|
|
|
| |||||
Income (loss) from investment operations: | ||||||||
Net investment loss1 | (0.08 | ) | (0.07 | ) | ||||
Net realized and unrealized gain (loss) on investments | (0.23 | ) | 0.25 | |||||
|
|
|
| |||||
Total from investment operations | (0.31 | ) | 0.18 | |||||
|
|
|
| |||||
Less distributions to shareholders: | ||||||||
From net realized gain on investments | (0.64 | ) | (0.30 | ) | ||||
|
|
|
| |||||
Net asset value - End of year | $ | 8.93 | $ | 9.88 | ||||
|
|
|
| |||||
Net assets - End of year (000’s omitted) | $ | 218,126 | $ | 250,573 | ||||
|
|
|
| |||||
Total return2 | (3.13 | %) | 1.93 | % | ||||
Ratios (to average net assets)/Supplemental Data: | ||||||||
Expenses | 1.07 | % | 1.07 | % | ||||
Net investment loss | (0.77 | %) | (0.71 | %) | ||||
Portfolio turnover | 85 | % | 68 | % | ||||
*Commencement of operations was December 31, 2013.
1Calculated based on average shares outstanding during the years.
2Represents aggregate total return for the years indicated, and assumes reinvestment of all distributions.
The accompanying notes are an integral part of the financial statements.
12
Dynamic Opportunities Series
Financial Highlights - Class I
| FOR THE YEAR ENDED 12/31/15 | FOR THE YEAR ENDED 12/31/14* | |||||||
Per share data (for a share outstanding throughout each year): | ||||||||
Net asset value - Beginning of year | $ | 9.90 | $ | 10.00 | ||||
|
|
|
| |||||
Income (loss) from investment operations: | ||||||||
Net investment loss1 | (0.06 | ) | (0.05 | ) | ||||
Net realized and unrealized gain (loss) on investments | (0.23 | ) | 0.25 | |||||
|
|
|
| |||||
Total from investment operations | (0.29 | ) | 0.20 | |||||
|
|
|
| |||||
Less distributions to shareholders: | ||||||||
From net realized gain on investments | (0.64 | ) | (0.30 | ) | ||||
|
|
|
| |||||
Net asset value - End of year | $ | 8.97 | $ | 9.90 | ||||
|
|
|
| |||||
Net assets - End of year (000’s omitted) | $ | 51,106 | $ | 54,648 | ||||
|
|
|
| |||||
Total return2 | (2.92 | %) | 2.13 | % | ||||
Ratios (to average net assets)/Supplemental Data: | ||||||||
Expenses | 0.87 | % | 0.88 | % | ||||
Net investment loss | (0.56 | %) | (0.51 | %) | ||||
Portfolio turnover | 85 | % | 68 | % | ||||
*Commencement of operations was December 31, 2013.
1Calculated based on average shares outstanding during the years.
2Represents aggregate total return for the years indicated, and assumes reinvestment of all distributions.
The accompanying notes are an integral part of the financial statements.
13
Dynamic Opportunities Series
Notes to Financial Statements
| 1. | Organization |
Dynamic Opportunities Series (the “Series”) is a no-load diversified series of Manning & Napier Fund, Inc. (the “Fund”). The Fund is organized in Maryland and is registered under the Investment Company Act of 1940, as amended, as an open-end management investment company.
The Series’ investment objective is to provide long-term growth.
The Fund’s advisor is Manning & Napier Advisors, LLC (the “Advisor”). Shares of the Series are offered to investors, clients and employees of the Advisor and its affiliates. The Series is authorized to issue two classes of shares (Class S and Class I). Each class of shares is substantially the same, except that Class S shares bear shareholder services fees. The total authorized capital stock of the Fund consists of 15 billion shares of common stock each having a par value of $0.01. As of December 31, 2015, 10.7 billion shares have been designated in total among 41 series, of which 100 million have been designated as Dynamic Opportunities Series Class S common stock, and 100 million have been designated as Dynamic Opportunities Series Class I common stock.
| 2. | Significant Accounting Policies |
The following is a summary of significant accounting policies followed by the Series. The Series is an investment company and, accordingly, follows the investment company accounting and reporting guidance of the Financial Accounting Standards Board Accounting Standards Codification Topic 946 - Investment Companies, which is part of accounting principles generally accepted in the United States of America (“GAAP”).
Security Valuation
Portfolio securities, including domestic equities, foreign equities, warrants and options, listed on an exchange other than the NASDAQ Stock Market are valued at the latest quoted sales price of the exchange on which the security is primarily traded. Securities not traded on valuation date or securities not listed on an exchange are valued at the latest quoted bid price provided by the Fund’s pricing service. Securities listed on the NASDAQ Stock Market are valued in accordance with the NASDAQ Official Closing Price.
Short-term investments that mature in sixty days or less may be valued at amortized cost, which approximates fair value. Investments in open-end investment companies are valued at their net asset value per share on valuation date.
Volume and level of activity in established markets for an asset or liability are evaluated to determine whether recent transactions and quoted prices are determinative of fair value. Where there have been significant decreases in volume and level of activity, further analysis and adjustment may be necessary to estimate fair value. The Series measures fair value in these instances by the use of inputs and valuation techniques which may be based upon current market prices of securities that are comparable in coupon, rating, maturity and industry and/or expectation of future cash flows. As a result of trading in relatively thin markets and/or markets that experience significant volatility, the prices used by the Series to value these securities may differ from the value that would be realized if these securities were sold, and the differences could be material.
Securities for which representative valuations or prices are not available from the Series’ pricing service may be valued at fair value as determined in good faith by the Advisor under procedures approved by and under the general supervision and responsibility of the Fund’s Board of Directors (the “Board”). Due to the inherent uncertainty of valuations of such securities, the fair value may differ significantly from the values that would have been used had a ready market for such securities existed. If trading or events occurring after the close of the principal market in which securities are traded are expected to materially affect the value of those securities, then they may be valued at their fair value, taking this trading or these events into account. In accordance with the procedures approved by the Board, the values of certain securities trading outside the U.S. were adjusted following the close of local trading using a factor from a third party vendor. The third party vendor uses statistical analyses and quantitative models, which consider among other things subsequent movement and changes in the prices of indices, securities and exchange rates in other markets, to determine the factors which are used to adjust local market prices. The value of
14
Dynamic Opportunities Series
Notes to Financial Statements (continued)
| 2. | Significant Accounting Policies (continued) |
Security Valuation (continued)
securities used for net asset value calculation under these procedures may differ from published prices for the same securities. It is the Fund’s policy to classify each foreign equity security where a factor from a third party vendor is provided as a Level 2 security.
Various inputs are used in determining the value of the Series’ assets or liabilities carried at fair value. These inputs are summarized in three broad levels. Level 1 includes quoted prices in active markets for identical assets and liabilities. Level 2 includes other significant observable inputs (including quoted prices for similar securities, interest rates, prepayment speeds, credit risk, etc.). Level 3 includes significant unobservable inputs (including the Series’ own assumptions in determining the fair value of investments). A financial instrument’s level within the fair value hierarchy is based on the lowest level of any input both individually and in aggregate that is significant to the fair value measurement. The inputs or methodology used for valuing securities are not necessarily an indication of the risk associated with investing in those securities.
The following is a summary of the valuation levels used for major security types as of December 31, 2015 in valuing the Series’ assets or liabilities carried at fair value:
| DESCRIPTION | TOTAL | LEVEL 1 | LEVEL 2 | LEVEL 3 | ||||||||||||
Assets: | ||||||||||||||||
Equity securities: | ||||||||||||||||
Consumer Discretionary | $ | 103,797,337 | $ | 103,797,337 | $ | — | $ | — | ||||||||
Consumer Staples | 13,467,303 | 13,467,303 | — | — | ||||||||||||
Financials | 26,301,514 | 26,301,514 | — | — | ||||||||||||
Health Care | 41,811,310 | 41,811,310 | — | — | ||||||||||||
Industrials | 26,786,078 | 26,786,078 | — | — | ||||||||||||
Information Technology | 53,217,997 | 53,217,997 | — | — | ||||||||||||
Mutual fund | 6,721,642 | 6,721,642 | — | — | ||||||||||||
|
|
|
|
|
|
|
| |||||||||
Total assets | $ | 272,103,181 | $ | 272,103,181 | $ | — | $ | — | ||||||||
|
|
|
|
|
|
|
| |||||||||
There were no Level 2 or Level 3 securities held by the Series as of December 31, 2014 or December 31, 2015.
The Fund’s policy is to recognize transfers in and transfers out of the valuation levels as of the beginning of the reporting period. There were no transfers between Level 1 and Level 2 during the year ended December 31, 2015.
Security Transactions, Investment Income and Expenses
Security transactions are accounted for on trade date. Dividend income is recorded on the ex-dividend date, except that if the ex-dividend date has passed, certain dividends from foreign securities are recorded as soon as the Series is informed of the ex-dividend date. Non-cash dividends, if any, are recorded at the fair value of the securities received. Interest income, including amortization of premium and accretion of discounts using the effective interest method, is earned from settlement date and accrued daily.
Expenses are recorded on an accrual basis. Most expenses of the Fund can be attributed to a specific series. Expenses which cannot be directly attributed are apportioned among the series in the Fund in such a manner as deemed equitable by the Fund’s Board, taking into consideration, among other things, the nature and type of expense. Income, expenses (other than shareholder services fees), and realized and unrealized gains and losses are prorated among the classes based on the relative net assets of each class. Class specific expenses are directly charged to that class.
The Series uses the identified cost method for determining realized gain or loss on investments for both financial statement and federal income tax reporting purposes.
Federal Taxes
The Series’ policy is to comply with the provisions of the Internal Revenue Code applicable to regulated investment companies. The Series is not subject to federal income tax or excise tax to the extent that the Series distributes to shareholders each year
15
Dynamic Opportunities Series
Notes to Financial Statements (continued)
| 2. | Significant Accounting Policies (continued) |
Federal Taxes (continued)
its taxable income, including any net realized gains on investments, in accordance with requirements of the Internal Revenue Code. Accordingly, no provision for federal income tax or excise tax has been made in the financial statements.
Management evaluates its tax positions to determine if the tax positions taken meet the minimum recognition threshold in connection with accounting for uncertainties in income tax positions taken or expected to be taken for the purposes of measuring and recognizing tax liabilities in the financial statements. Recognition of tax benefits of an uncertain tax position is required only when the position is “more likely than not” to be sustained assuming examination by taxing authorities. At December 31, 2015, the Series has recorded no liability for net unrecognized tax benefits relating to uncertain income tax positions taken or expected to be taken in future tax returns.
The Series files income tax returns in the U.S. federal jurisdiction, various states and foreign jurisdictions, as required. No income tax returns are currently under investigation. The statute of limitations on the Series’ tax returns remains open for the period ended December 31, 2013, and the years ended December 31, 2014 and December 31, 2015. The Series is not aware of any tax positions for which it is reasonably possible that the total amounts of unrecognized tax benefits will significantly change in the next twelve months.
Foreign Taxes
Based on the Series’ understanding of the tax rules and rates related to income, gains and currency purchase/repatriation transactions for foreign jurisdictions in which it invests, the Series will provide for foreign taxes, and where appropriate, deferred foreign tax.
Distributions of Income and Gains
Distributions to shareholders of net investment income and net realized gains are made annually. An additional distribution may be necessary to avoid taxation of the Series. Distributions are recorded on the ex-dividend date.
Indemnifications
The Fund’s organizational documents provide former and current directors and officers with a limited indemnification against liabilities arising in connection with the performance of their duties to the Fund. In the normal course of business, the Fund may also enter into contracts that provide general indemnifications. The Fund’s maximum exposure under these arrangements is unknown as this would be dependent on future claims that may be made against the Fund. The risk of material loss from such claims is considered remote.
Other
The preparation of financial statements in conformity with GAAP requires management to make estimates and assumptions that affect the reported amounts of assets and liabilities and the disclosure of contingent assets and liabilities at the date of the financial statements and the reported amounts of income and expenses during the reporting period. Actual results could differ from those estimates.
| 3. | Transactions with Affiliates |
The Fund has an Investment Advisory Agreement (the “Agreement”) with the Advisor for which the Series pays a fee, computed daily and payable monthly, at an annual rate of 0.80% of the Series’ average daily net assets.
Under the Agreement, personnel of the Advisor provide the Series with advice and assistance in the choice of investments and the execution of securities transactions, and otherwise maintain the Series’ organization. The Advisor also provides the Fund with necessary office space and fund administration and support services. The salaries of all officers of the Fund (except a percentage of the Fund’s Chief Compliance Officer’s salary, which is paid by the Fund), and of all Directors who are “affiliated persons” of the Fund, or of the Advisor, and all personnel of the Fund, or of the Advisor, performing services relating to research, statistical and investment activities, are paid by the Advisor. Each “non-affiliated” Director receives an annual stipend, which is allocated among all the active series of the Fund. In addition, these Directors also receive a fee per Board meeting attended plus a fee for each committee meeting attended and are reimbursed for travel and other out-of-pocket expenses
16
Dynamic Opportunities Series
Notes to Financial Statements (continued)
| 3. | Transactions with Affiliates (continued) |
incurred by them in connection with attending such meetings. The Fund also has an Audit Committee Chair, who receives an additional annual stipend for this role.
The Class S shares of the Series are subject to a shareholder services fee in accordance with a shareholder services plan adopted by the Fund’s Board. The shareholder services fee is intended to compensate financial intermediaries, including affiliates of the Fund, in connection with the provision of direct client service, personal services, maintenance of shareholder accounts and reporting services. For these services, Class S of the Series pays a fee, computed daily and payable monthly, at an annual rate of 0.20% of the average daily net assets of Class S. The Fund has a Shareholder Services Agreement with the Advisor, for which the Advisor receives the shareholder services fee as stated above.
The Advisor has contractually agreed, until at least April 30, 2016, to waive its fee and, if necessary, pay other operating expenses of the Series in order to maintain total direct annual fund operating expenses for the Series exclusive of each share class’ shareholder services fee, at no more than 0.90% of average daily net assets. The Advisor did not waive any fees for the year ended December 31, 2015. The Advisor is not eligible to recoup any expenses that have been waived or reimbursed.
Manning & Napier Investor Services, Inc., a registered broker-dealer affiliate of the Advisor, acts as distributor for the Fund’s shares. The services of Manning & Napier Investor Services, Inc. are provided at no additional cost to the Series.
Pursuant to a master services agreement dated November 1, 2014, the Fund pays the Advisor an annual fee related to fund accounting and administration of 0.0085% on the first $25 billion of average daily net assets (excluding Target Series and Strategic Income Series); 0.0075% on the next $15 billion of average daily net assets (excluding Target Series and Strategic Income Series); and 0.0065% of the average daily net assets in excess of $40 billion (excluding Target Series and Strategic Income Series); plus a base fee of $30,400 per series. Transfer agent fees are charged to the Fund on a per account basis. Additionally, certain transaction and out-of-pocket expenses, including charges for reporting relating to the Fund’s compliance program, are charged. The Advisor has agreements with BNY Mellon Investment Servicing (U.S.) Inc. (“BNY”) under which BNY serves as sub-accountant services agent and sub-transfer agent.
Expenses not directly attributable to a series are allocated based on each series’ relative net assets or number of accounts, depending on the expense.
| 4. | Purchases and Sales of Securities |
For the year ended December 31, 2015, purchases and sales of securities, other than U.S. Government securities and short-term securities, were $250,741,371 and $281,000,523, respectively. There were no purchases or sales of U.S. Government securities.
| 5. | Capital Stock Transactions |
Transactions in shares of Class S and Class I of Dynamic Opportunities Series were:
| CLASS S: | FOR THE YEAR ENDED 12/31/15 | FOR THE YEAR ENDED 12/31/14* | ||||||||||||||
| SHARES | AMOUNT | SHARES | AMOUNT | |||||||||||||
Sold | 1,599,516 | $ | 16,219,917 | 27,589,735 | $ | 269,742,077 | ||||||||||
Reinvested | 1,627,207 | 14,464,330 | 768,470 | 7,262,041 | ||||||||||||
Repurchased | (4,177,567 | ) | (42,807,621 | ) | (3,010,851 | ) | (29,848,786 | ) | ||||||||
|
|
|
|
|
|
|
| |||||||||
Total | (950,844 | ) | $ | (12,123,374 | ) | 25,347,354 | $ | 247,155,332 | ||||||||
|
|
|
|
|
|
|
| |||||||||
17
Dynamic Opportunities Series
Notes to Financial Statements (continued)
| 5. | Capital Stock Transactions (continued) |
| CLASS I: | FOR THE YEAR ENDED 12/31/15 | FOR THE YEAR ENDED 12/31/14* | ||||||||||||||
| SHARES | AMOUNT | SHARES | AMOUNT | |||||||||||||
Sold | 951,442 | $ | 9,885,996 | 5,588,004 | $ | 54,821,921 | ||||||||||
Reinvested | 372,929 | 3,330,260 | 166,010 | 1,572,115 | ||||||||||||
Repurchased | (1,149,548 | ) | (11,484,423 | ) | (256,471 | ) | (2,589,412 | ) | ||||||||
|
|
|
|
|
|
|
| |||||||||
Total | 174,823 | $ | 1,731,833 | 5,497,543 | $ | 53,804,624 | ||||||||||
|
|
|
|
|
|
|
| |||||||||
* Commencement of operations was December 31, 2013.
Over 90% of the shares outstanding are held by fiduciary accounts where the Advisor has sole investment discretion.
| 6. | Financial Instruments |
The Series may trade in instruments including written and purchased options, forward foreign currency exchange contracts and futures contracts and other derivatives in the normal course of investing activities to assist in managing exposure to various market risks. The Series may be subject to various elements of risk, which may involve, to a varying degree, elements of risk in excess of the amounts recognized for financial statement purposes. These risks include: the risk that changes in the value of a derivative may not correlate perfectly with the underlying asset, rate or index; counterparty credit risk related to over the counter derivative counterparties’ failure to perform under contract terms; liquidity risk related to the lack of a liquid market for these contracts allowing the fund to close out its position(s); and documentation risk relating to disagreement over contract terms. No such investments were held by the Series as of December 31, 2015.
| 7. | Foreign Securities |
Investing in securities of foreign companies and foreign governments involves special risks and considerations not typically associated with investing in securities of domestic companies and the U.S. Government. These risks include revaluation of currencies and future adverse political and economic developments. Moreover, securities of foreign companies and foreign governments and their markets may be less liquid and their prices more volatile than those of comparable domestic companies and the U.S. Government.
| 8. | Federal Income Tax Information |
The amount and characterization of certain income and capital gains to be distributed are determined in accordance with federal income tax regulations, which may differ from GAAP. These differences are primarily due to differing book and tax treatments in the timing and/or treatment of the recognition of net investment income or gains and losses, including foreign currency gains and losses, net operating losses, qualified late-year losses and losses deferred due to wash sales. The Series may periodically make reclassifications among its capital accounts to reflect income and gains available for distribution (or available capital loss carryovers) under income tax regulations without impacting the Series’ net asset value. For the year ended December 31, 2015, $2,231,501 was reclassified within the capital accounts from Accumulated Net Realized Gain on Investments to Undistributed Net Investment Income. Any such reclassifications are not reflected in the financial highlights.
18
Dynamic Opportunities Series
Notes to Financial Statements (continued)
| 8. | Federal Income Tax Information (continued) |
The tax character of distributions paid were as follows:
| FOR THE YEAR ENDED 12/31/15 | FOR THE YEAR ENDED 12/31/14 | |||||||
Ordinary income | $ | 3,115,117 | $ | 8,960,474 | ||||
Long-term capital gains | $ | 14,935,653 | — | |||||
At December 31, 2015, the tax basis of components of distributable earnings and the net unrealized depreciation based on the identified cost of investments for federal income tax purposes were as follows:
Cost for federal income tax purposes | $ | 294,579,229 | ||
Unrealized appreciation | 12,326,574 | |||
Unrealized depreciation | (34,802,622 | ) | ||
|
| |||
Net unrealized depreciation | $ | (22,476,048 | ) | |
|
| |||
Undistributed ordinary income | $ | 1,484,855 | ||
Qualified late-year losses1 | $ | 753,951 |
1The Series has elected to defer certain qualified late-year losses and recognize such losses in the year ending December 31, 2016.
19
Dynamic Opportunities Series
Report of Independent Registered Public Accounting Firm
To the Board of Directors of Manning & Napier Fund, Inc. and Shareholders of Dynamic Opportunities Series:
In our opinion, the accompanying statement of assets and liabilities, including the investment portfolio, and the related statements of operations and of changes in net assets and the financial highlights present fairly, in all material respects, the financial position of Dynamic Opportunities Series (a series of Manning & Napier Fund, Inc., hereafter referred to as the “Series”) at December 31, 2015, the results of its operations for the year then ended, and the changes in its net assets and the financial highlights for the two years in the period then ended, in conformity with accounting principles generally accepted in the United States of America. These financial statements and financial highlights (hereafter referred to as “financial statements”) are the responsibility of the Series’ management. Our responsibility is to express an opinion on these financial statements based on our audit. We conducted our audit of these financial statements in accordance with the standards of the Public Company Accounting Oversight Board (United States). Those standards require that we plan and perform the audit to obtain reasonable assurance about whether the financial statements are free of material misstatement. An audit includes examining, on a test basis, evidence supporting the amounts and disclosures in the financial statements, assessing the accounting principles used and significant estimates made by management, and evaluating the overall financial statement presentation. We believe that our audits, which included confirmation of securities at December 31, 2015 by correspondence with the custodian and brokers, provide a reasonable basis for our opinion.

New York, New York
February 19, 2016
20
Dynamic Opportunities Series
Supplemental Tax Information
(unaudited)
All reportings are based on financial information available as of the date of this annual report and, accordingly are subject to change.
For federal income tax purposes, the Series reports for the current fiscal year $1,168,297 or, if different, the maximum amount allowable under the tax law as qualified dividend income.
The Series designates $15,682,436 as Long-Term Capital Gain dividends pursuant to Section 852(b)(3) of the Internal Revenue Code for the fiscal year ended December 31, 2015.
For corporate shareholders, the percentage of investment income (dividend income plus short-term gains, if any) that qualifies for the dividends received deduction for the current fiscal year is 17.76%, or if different, the maximum allowable under tax law.
21
Dynamic Opportunities Series
Renewal of Investment Advisory Agreement
(unaudited)
At the Manning & Napier Fund, Inc. (the “Fund”) Board of Directors’ (the “Board”) meeting, held on November 17, 2015, the Investment Advisory Agreement (the “Agreement”) between the Fund and Manning & Napier Advisors, LLC (the “Advisor”) was considered by the Board for renewal. In connection with the decision whether to renew the Agreement, a variety of material was prepared for and considered by the Board.
Representatives of the Advisor attended the meeting and presented additional oral and written information to the Board to assist the Board in its considerations. The discussion immediately below outlines the materials and information presented to the Board in connection with the Board’s 2015 Annual consideration of the Agreement and the conclusions made by the Directors when determining to continue the Agreement.
| • | The Board considered the services provided by the Advisor under the Agreement including, among others: deciding what securities to purchase and sell for each Series; arranging for the purchase and sale of such securities by placing orders with broker-dealers; administering the affairs of the Fund (including the books and records of the Fund not maintained by third party service providers such as the custodian or sub-transfer agent); arranging for the insurance coverage for the Fund; and supervising the preparation of tax returns, SEC filings (including registration statements) and reports to shareholders for the Fund. The Board also considered the nature and quality of such services provided under the Agreement in light of the Advisor’s services provided to the Fund for 29 years. The Board discussed the quality of these services with representatives from the Advisor and concluded that the Advisor was performing its services to the Fund required under the Agreement in a reasonable manner. |
| • | The Board considered the performance of each Series since its inception, as well as performance over multiple time periods. Performance for one or more of the following time periods was considered as applicable to the Series’ inception date: inception, three year, five year, ten year, and current market cycle. A market cycle includes periods of both rising and falling markets. Returns for established benchmark indices for each Series were provided. In addition, the Board considered a number of other factors relevant to performance at the meeting (and considers on a quarterly basis) including: a peer group performance analysis consisting of Morningstar universes of mutual funds with similar investment objectives, investment performance of core products, product offerings, performance on an aggregate basis vs. performance over reasonable time periods and the Advisor’s investment process. The Directors acknowledged the challenging performance and discussed the investment process of the Advisor. The Directors confirmed that qualitative factors such as the Advisor’s investment process, including recent enhancements, were an important subset to be considered as part of their consideration of performance. The Board discussed the performance with representatives from the Advisor and concluded that the investment performance of each of the Fund’s Series was reasonable based on the Series’ actual performance and comparative performance, especially for those series with performance over the current market cycle. |
| • | The Board considered the costs of the Advisor’s services and the profits of the Advisor as they relate to the Advisor’s services to the Fund under the Agreement. In reviewing the Advisor’s costs and profits, the Board discussed the Advisor’s revenues generated from the Fund (on both an actual and adjusted basis) and its expenses associated with providing the services under the Agreement. In addition, the Board reviewed the Advisor’s expenses associated with Fund activities outside of the Agreement (such as expense reimbursements pursuant to expense caps and payments made by the Advisor to third party platforms on which shares of the Fund are available for purchase). It was noted by representatives of the Advisor that 22 of the 36 active Series of the Fund are currently experiencing expenses above the capped expense ratios, and thus the Advisor is incurring those expenses over the cap. After discussing the above costs and profits, the Board concluded that the Advisor’s profitability relating to its services provided under the Agreement was reasonable. |
| • | The Board considered the fees and expenses of the various Series of the Fund. The Advisor presented the advisory fees and total expenses for each Series, including the advisory fee adjusted for any expense waivers or reimbursements (either contractual or voluntary) paid by the Advisor. The advisory fees and expense ratios of each Series were compared to an average (on both a mean and median basis) of similar funds as disclosed on the Morningstar database. Representatives of the Advisor discussed with the Board the levels of its advisory fee for each Series of the Fund and as compared to the median and mean advisory fees for similar funds as listed on Morningstar. Expense ratios for every Series, except the Tax Managed Series, Equity Income Class S, High Yield Bond Class S, Pro-Blend Series Classes C and R, and Target Series’ Classes R and K, are lower than, or substantially similar to the Morningstar mean and median reported total expense ratio. |
22
Dynamic Opportunities Series
Renewal of Investment Advisory Agreement
(unaudited)
The higher than mean and median total expense ratios for Classes C and R reflect higher distribution, marketing and shareholder service fees payable to broker-dealers through a 100bp 12b-1 fee for Class C and a 50bp 12b-1 fee for Class R. Based on their review of the information provided, the Board concluded that the fees and expenses of each Series of the Fund were reasonable on a comparative basis. |
| • | The Board also considered the other benefits the Advisor derives from its relationship with the Fund. Such other benefits include certain research services provided by soft dollars. The Board reviewed the broker-dealers who provided research to the Advisor and the products and services paid for, in whole or in part, using soft dollar commissions. Given the level of soft dollar transactions involving the Fund, the Board concluded that these additional benefits to the Advisor were reasonable. |
| • | In addition to the factors described above, the Board considered the Advisor’s personnel, investment strategies, policies and procedures relating to compliance with personal securities transactions, reputation, expertise and resources in domestic and foreign financial markets. The Board concluded that these factors support the conclusion that the Advisor performs its services in a reasonable manner. |
| • | The Board then considered economies of scale and concluded that the current fee schedule to the advisory agreement remained reasonable given the multiple uses of the Fund (for the Advisor’s discretionary investment account clients in addition to direct investors), the current profitability of the Advisor’s services to the Fund under the Agreement, the number of newly established series of the Fund and the overall size of the Fund complex. |
Based on the Board’s deliberations and their evaluation of the information described above, the Board, including a majority of Directors that are not “interested persons” as defined in the Investment Company Act of 1940, concluded that the compensation under the Agreement was fair and reasonable in light of the services and expenses and such other matters as the Directors considered to be relevant in the exercise of their reasonable judgment. Accordingly, the Board approved the renewal of the Agreement. In the course of their deliberations, the Directors did not identify any particular information that was all important or controlling.
23
Dynamic Opportunities Series
Directors’ and Officers’ Information
(unaudited)
The Statement of Additional Information provides additional information about the Fund’s directors and officers and can be obtained without charge by calling 1-800-466-3863, at www.manningnapieradvisors.com, or on the EDGAR Database on the SEC Internet web site (http:// www.sec.gov). The following chart shows certain information about the Fund’s officers and directors, including their principal occupations during the last five years. Unless specific dates are provided, the individuals have held the listed positions for longer than five years.
| Interested Director/Officer | ||
| Name: | James E. Mikolaichik* | |
| Address: | 290 Woodcliff Drive | |
| Fairport, NY 14450 | ||
| Age: | 44 | |
| Current Position(s) Held with Fund: | Principal Executive Officer, President, Chairman & Director | |
| Term of Office1 & Length of Time Served: | Indefinite - Chairman and Director since August 2015 | |
| Principal Occupation(s) During Past 5 Years: | Chief Financial Officer (since 2011) - Manning & Napier Advisors, LLC; Executive Vice President and Head of Strategy (2008-2011) and Chief Risk Officer (2004-2008) - Old Mutual Asset Management Holds or has held one or more of the following title for various subsidiaries and affiliates: Chief Financial Officer. | |
| Number of Portfolios Overseen within Fund Complex: | 41 | |
| Other Directorships Held Outside Fund Complex: | N/A | |
| Independent Directors | ||
| Name: | Stephen B. Ashley | |
| Address: | 290 Woodcliff Drive | |
| Fairport, NY 14450 | ||
| Age: | 75 | |
| Current Position(s) Held with Fund: | Director, Audit Committee Member, Governance & Nominating Committee Member | |
| Term of Office & Length of Time Served: | Indefinite - Since 1996 | |
| Principal Occupation(s) During Past 5 Years: | Chairman, Director, President & Chief Executive Officer (1997 to present) - The Ashley Group (property management and investment); Director (1995-2008) and Chairman (non-executive) (2004-2008) - Fannie Mae (mortgage). | |
| Number of Portfolios Overseen within Fund Complex: | 41 | |
| Other Directorships Held Outside Fund Complex: | Fannie Mae (1995-2008) The Ashley Group (1995-2008) Genesee Corporation (1987-2007) | |
| Name: | Paul A. Brooke | |
| Address: | 290 Woodcliff Drive | |
| Fairport, NY 14450 | ||
| Age: | 70 | |
| Current Position(s) Held with Fund: | Director, Audit Committee Member, Governance & Nominating Committee Member | |
| Term of Office & Length of Time Served: | Indefinite - Since 2007 | |
| Principal Occupation(s) During Past 5 Years: | Chairman & CEO (2005-2009) - Ithaka Acquisition Corporation (investments); | |
| Chairman (2007-2009) Alsius Corporation (investments); | ||
| Managing Member, PMSV Holdings LLC (investments) since 1991; | ||
| Managing Member, Venbio (investments) since 2010. | ||
| Number of Portfolios Overseen within Fund Complex: | 41 | |
| Other Directorships Held Outside Fund Complex: | Incyte Corp. (2000-present) | |
| ViroPharma, Inc. (2000-2014) | ||
| HLTH Corp (WebMD) (2000-2010) | ||
| Cheyne Capital International (2000-present) | ||
| GMP Companies (2000-2011) | ||
| Cytos Biotechnology Ltd. (2012-2014) | ||
24
Dynamic Opportunities Series
Directors’ and Officers’ Information (unaudited)
| ||
| Independent Directors (continued) | ||
| Name: | Peter L. Faber | |
| Address: | 290 Woodcliff Drive | |
| Fairport, NY 14450 | ||
| Age: | 77 | |
| Current Position(s) Held with Fund: | Director, Governance & Nominating Committee Member | |
| Term of Office & Length of Time Served: | Indefinite - Since 1987 | |
| Principal Occupation(s) During Past 5 Years: | Senior Counsel (2006-2012), Partner (1995-2006 & 2013-present) - McDermott, Will & Emery LLP (law firm) | |
| Number of Portfolios Overseen within Fund Complex: | 41 | |
| Other Directorships Held Outside Fund Complex: | Boston Early Music Festival (non-profit) (2007-present) | |
| Amherst Early Music, Inc. (non-profit) (2009-present) | ||
| Gotham Early Music Scene, Inc. (non-profit) (2009-present) | ||
| Partnership for New York City, Inc. (non-profit) (1989-2010) | ||
| New York Collegium (non-profit) (2004-2011) | ||
| Name: | Harris H. Rusitzky | |
| Address: | 290 Woodcliff Drive | |
| Fairport, NY 14450 | ||
| Age: | 80 | |
| Current Position(s) Held with Fund: | Director, Audit Committee Member, Governance & Nominating Committee Member | |
| Term of Office & Length of Time Served: | Indefinite - Since 1985 | |
| Principal Occupation(s) During Past 5 Years: | President, The Greening Group (business consultants) since 1994; Partner, The Restaurant Group (restaurants) since 2006 | |
| Number of Portfolios Overseen within Fund Complex: | 41 | |
| Other Directorships Held Outside Fund Complex: | Rochester Institute of Technology (university) (1972-present) | |
| Culinary Institute of America (non-profit college) (1985-present) | ||
| George Eastman House (museum) (1988-present) | ||
| National Restaurant Association (restaurant trade organization) (1978-present) | ||
| Name: | Chester N. Watson | |
| Address: | 290 Woodcliff Drive | |
| Fairport, NY 14450 | ||
| Age: | 65 | |
| Current Position(s) Held with Fund: | Director, Audit Committee Chairman, Governance & Nominating Committee Member | |
| Term of Office & Length of Time Served: | Indefinite - Since 2012 | |
| Principal Occupation(s) During Past 5 Years: | General Auditor (2003-2011) - General Motors Company (auto manufacturer) | |
| Number of Portfolios Overseen within Fund Complex: | 41 | |
| Other Directorships Held Outside Fund Complex: | Rochester Institute of Technology (university) (2005-present) | |
| Officers | ||
| Name: | Jeffrey S. Coons, Ph.D., CFA | |
| Address: | 290 Woodcliff Drive | |
| Fairport, NY 14450 | ||
| Age: | 52 | |
| Current Position(s) Held with Fund: | Vice President | |
| Term of Office1 & Length of Time Served: | Since 2004 | |
| Principal Occupation(s) During Past 5 Years: | President since 2010, Co-Director of Research (2002-2015) - Manning & Napier Advisors, LLC Holds one or more of the following titles for various subsidiaries and affiliates: President, Director, Treasurer or Senior Trust Officer. | |
| Number of Portfolios Overseen within Fund Complex: | 41 | |
| Other Directorships Held Outside Fund Complex: | N/A | |
25
Dynamic Opportunities Series
Directors’ and Officers’ Information (unaudited)
| ||
| Officers (continued) | ||
| Name: | Elizabeth Craig | |
| Address: | 290 Woodcliff Drive | |
| Fairport, NY 14450 | ||
| Age: | 28 | |
| Current Position(s) Held with Fund: | Assistant Corporate Secretary | |
| Term of Office1 & Length of Time Served: | Since 2011 | |
| Principal Occupation(s) During Past 5 Years: | Fund Administration Manager since 2015; Mutual Fund Compliance Specialist (2009-2015) - Manning & Napier Advisors, LLC | |
| Number of Portfolios Overseen within Fund Complex: | 41 | |
| Other Directorships Held Outside Fund Complex: | N/A | |
| Name: | Christine Glavin | |
| Address: | 290 Woodcliff Drive | |
| Fairport, NY 14450 | ||
| Age: | 49 | |
| Current Position(s) Held with Fund: | Principal Financial Officer, Chief Financial Officer | |
| Term of Office1 & Length of Time Served: | Principal Financial Officer since 2002; Chief Financial Officer since 2001 | |
| Principal Occupation(s) During Past 5 Years: | Director of Fund Reporting since 2011; Fund Reporting Manager (1997-2011) - Manning & Napier Advisors, LLC; Assistant Treasurer since 2008 - Exeter Trust Company | |
| Number of Portfolios Overseen within Fund Complex: | 41 | |
| Other Directorships Held Outside Fund Complex: | N/A | |
| Name: | Jodi L. Hedberg | |
| Address: | 290 Woodcliff Drive | |
| Fairport, NY 14450 | ||
| Age: | 48 | |
| Current Position(s) Held with Fund: | Corporate Secretary, Chief Compliance Officer, Anti-Money Laundering Compliance Officer | |
| Term of Office1 & Length of Time Served: | Corporate Secretary since 1997; Chief Compliance Officer since 2004; Anti-Money Laundering Compliance Officer since 2002 | |
| Principal Occupation(s) During Past 5 Years: | Director of Compliance since 2005; Compliance Manager (1995-2005) - Manning & Napier Advisors, LLC and affiliates; Corporate Secretary - | |
| Manning & Napier Investor Services, Inc. since 2006 | ||
| Number of Portfolios Overseen within Fund Complex: | 41 | |
| Other Directorships Held Outside Fund Complex: | N/A | |
| Name: | Richard Yates | |
| Address: | 290 Woodcliff Drive | |
| Fairport, NY 14450 | ||
| Age: | 50 | |
| Current Position(s) Held with Fund: | Chief Legal Officer | |
| Term of Office1 & Length of Time Served: | Chief Legal Officer since 2004 | |
| Principal Occupation(s) During Past 5 Years: | Counsel - Manning & Napier Advisors, LLC and affiliates since 2000; Holds one or more of the following titles for various affiliates; Director or Corporate Secretary | |
| Number of Portfolios Overseen within Fund Complex: | 41 | |
| Other Directorships Held Outside Fund Complex: | N/A | |
*Interested Director, within the meaning of the Investment Company Act of 1940 by reason of his position with the Fund’s investment advisor and distributor. Mr. Mikolaichik serves as the Chief Financial Officer for Manning & Napier Advisors, LLC.
1The term of office of all officers shall be one year and until their respective successors are chosen and qualified, or his or her earlier resignation or removal as provided in the Fund’s By-Laws.
26
Dynamic Opportunities Series
Results of Special Meeting of Shareholders
(unaudited)
A Special Meeting of the Shareholders of the Fund was held on August 18, 2015. The number of votes necessary to conduct the meeting and approve the proposal was obtained, and the results of the vote of shareholders of all the Series of the Fund voting together in the aggregate is listed below:
PROPOSAL 1:
Election of Directors
| NUMBER OF SHARES VOTED FOR | NUMBER OF SHARES WITHELD | |||||||
Stephen B. Ashley | 883,968,395 | 8,618,094 | ||||||
Paul A. Brooke | 884,510,661 | 8,075,828 | ||||||
Peter L. Faber | 884,140,893 | 8,445,596 | ||||||
James E. Mikolaichik | 883,391,832 | 9,194,657 | ||||||
Harris H. Rusitzky | 620,022,215 | 272,564,274 | ||||||
Chester N. Watson | 884,638,809 | 7,947,680 | ||||||
27
Dynamic Opportunities Series
Literature Requests
(unaudited)
Proxy Voting Policies and Procedures
A description of the policies and procedures that the Fund uses to determine how to vote proxies relating to portfolio securities is available, without charge, upon request:
| By phone | 1-800-466-3863 | |||
| On the Securities and Exchange | ||||
| Commission’s (SEC) web site | http://www.sec.gov |
Proxy Voting Record
Information regarding how the Fund voted proxies relating to portfolio securities during the most recent 12-month period ended June 30th is available, without charge, upon request:
| By phone | 1-800-466-3863 | |||
| On the SEC’s web site | http://www.sec.gov |
Quarterly Portfolio Holdings
The Series’ complete schedule of portfolio holdings for the 1st and 3rd quarters of each fiscal year are provided on Form N-Q, and are available, without charge, upon request:
| By phone | 1-800-466-3863 | |||
| On the SEC’s web site | http://www.sec.gov |
The Series’ Form N-Q may be reviewed and copied at the SEC’s Public Reference Room in Washington, D.C. Information on the operation of the Public Reference Room may be obtained by calling 1-800-SEC-0330.
Prospectus and Statement of Additional Information (SAI)
For more information about any of the Manning & Napier Fund, Inc. Series, you may obtain a prospectus and SAI at www.manning-napier.com or by calling (800) 466-3863. Before investing, carefully consider the objectives, risks, charges and expenses of the investment and read the prospectus carefully as it contains this and other information about the investment company. In addition, this information can be found on the SEC’s web site, http://www.sec.gov.
Additional information available at www.manning-napier.com
1. Fund Holdings - Month-End
2. Fund Holdings - Quarter-End
3. Shareholder Report - Annual
4. Shareholder Report - Semi-Annual
The Fund also offers electronic notification or “e-delivery” when certain documents are available on-line to be downloaded or reviewed. Direct shareholders can elect to receive electronic notification when shareholder reports, prospectus updates, and/or statements are available. If you do not currently have on-line access to your account, you can establish access by going to www.manning-napier.com, click on “Login” in the top corner of the page, and follow the prompts to self-enroll. Once enrolled, you can set your electronic notification preferences by clicking on the Account Options tab located within the green toolbar and then select E-Delivery Option. Should you have any questions on either how to establish on-line access or how to update your account settings, please contact Investor Services at 1-800-466-3863.
The Manning & Napier Fund, Inc. is managed by Manning & Napier Advisors, LLC. Manning & Napier Investor Services, Inc., an affiliate of Manning & Napier Advisors, LLC, is the distributor of the Fund shares.
MNDYN-12/15-AR

Equity Income Series
Management Discussion and Analysis
(unaudited)
Dear Shareholders:
Volatility defined global equity markets during the past year, largely driven by macroeconomic factors. Markets around the world experienced a correction in late August amidst a broad selloff triggered by renewed concerns about economic growth in emerging markets — China in particular — and uncertainty about the effects of that slowdown on overall global growth. Developed economies continued to provide accommodative monetary policy to combat growth concerns, although in December the U.S. Federal Reserve raised the federal funds rate for the first time in nearly a decade. For much of the year, Europe struggled with uncertainty regarding Greece’s ability to secure bailout funding from its creditors, which negatively affected investor sentiment. China’s economy slowed, but the government continued to demonstrate a willingness to provide support through a combination of policy-easing maneuvers and targeted stimulus measures. The U.S. economy remained on a path of slow growth that nevertheless made it the best performing developed economy. U.S. stocks were largely flat for the year, whereas global equity markets moderately declined. Looking ahead, we expect the slow global growth environment to remain in place for the foreseeable future.
As always, we appreciate your business.
Sincerely,
Manning & Napier Advisors, LLC
1
Equity Income Series
Fund Commentary
(unaudited)
Investment Objective
Primarily to provide current income and income growth, with a secondary objective of providing long-term capital appreciation.
Performance Commentary
The Russell 1000® Value Index experienced a return of -3.83% during 2015. The Equity Income Series held up better than its benchmark, but experienced negative absolute returns as well, returning -3.20%.
The Series’ outperformance relative to the Russell 1000® Value Index during the year was driven by stock selection. Conversely, sector positioning challenged relative returns. Regarding major contributors to relative performance, stock selection in Materials, Consumer Staples, and Information Technology aided relative returns. The Series’ underweight to Energy as compared to the benchmark also aided relative performance, as Energy was the weakest performing sector within the benchmark during the year amid significant declines in global oil prices.
Offsetting a portion of the relative performance tailwind experienced by the Series during 2015 was stock selection in Industrials and Consumer Discretionary, which detracted from relative returns. The Series’ underweight to Health Care as compared to the benchmark also challenged relative returns, as Health Care was the strongest performing sector within the benchmark during the year.
During 2016 we believe investors should expect further gyrations in equity markets due to catalysts such as geopolitical risks, the diverging monetary policies of major central banks, commodity price pressures, and the potential for global growth to deviate from expectations. With the Federal Reserve having raised the federal funds rate, we think they now will seek to remain flexible and proceed slowly with small increases that do not follow a well-defined schedule. Broadly speaking, valuations in the developed world remain neutral at best, whereas valuations in select emerging markets are relatively more attractive. Shareholders should expect us to view volatility as a buying opportunity given that our indicators do not suggest capital risk is a significant near-term concern. In light of the current environment, it is important that investors remain active, flexible, and selective in their approach in order to avoid overvalued areas of the market, something Manning & Napier has done for over 45 years as an active investment manager.
Performance data quoted represents past performance and does not guarantee future results. The investment return and principal value of an investment will fluctuate, so that an investor’s shares, when redeemed, may be worth more or less than their original cost. Current performance may be higher or lower than that quoted; investors can obtain the most recent month-end performance at www.manning-napier.com or by calling (800) 466-3863. Performance for the Equity Income Series Class S shares is provided above. Performance for the Class I shares will be higher based on the Class’ lower expenses.
Please see the next page for additional performance information as of December 31, 2015.
All investments involve risks, including possible loss of principal. As with any stock fund, the value of your investment will fluctuate in response to stock market movements. Investing in the Series will also involve a number of other risks, including issuer-specific risk, small-cap/mid-cap risk, foreign investment risk, and the risk that the investment approach may not be successful. Additionally, like all derivatives, investments in options can be highly volatile and involve risks in addition to the risks of the underlying instrument on which the derivative is based, such as counterparty, correlation and liquidity risk. Stocks of small- and mid-cap companies may be subject to more abrupt or erratic market movements than the stocks of larger companies and may be less marketable than the stocks of larger companies. In addition, they may have limited product lines, markets, or financial resources, and they may depend on a small management group. As a result, they fail more often than larger companies. Funds that invest in foreign countries may be subject to the risks of adverse changes in foreign economic, political, regulatory and other conditions as well as risks related to the use of different financial standards. Investments in emerging markets may be more volatile than investments in more developed markets. The Equity Income Series invests primarily in income-producing equity securities. There is no assurance or guarantee that companies which issue dividends will declare, continue to pay, or increase dividends. Additionally, the Series may invest a portion of its assets in real estate investment trusts (REITs). Investments in real estate, including REITs, are subject to risks associated with the direct ownership of real estate: interest rate risk, liquidity risk, and changes in property value, among others. The Equity Income Series may also invest a portion of its assets in business development companies (BDCs) or master limited partnerships (MLPs). BDCs are subject to additional risks, as they generally invest in less mature private companies or thinly traded U.S. public companies which involve greater risk than well-established publicly-traded companies. MLPs are subject to additional risks, including risks associated with the specific industry or industries in which the partnership invests, such as the risks of investing in real estate, or oil and gas industries or other natural resources. To the extent that an MLP’s interests are all in a particular industry, the MLP will be negatively impacted by economic events adversely impacting that industry. Additionally, the potential tax benefits from investing in MLPs depend on their continued treatment as partnerships for federal income tax purposes.
2
Equity Income Series
Performance Update as of December 31, 2015
(unaudited)
| AGGREGATE TOTAL RETURNS AS OF DECEMBER 31, 2015 | ||||||||
| | ONE YEAR1 | | | TOTAL RETURN SINCE INCEPTION2 | | |||
Manning & Napier Fund, Inc. - Equity Income Series - Class S3 | -3.20 | % | 3.95 | % | ||||
Manning & Napier Fund, Inc. - Equity Income Series - Class I3 | -3.00 | % | 4.13 | % | ||||
Russell 1000® Value Index4,5 | -3.83 | % | 4.46 | % | ||||
Standard & Poor’s (S&P) 500 Total Return Index6 | 1.38 | % | 7.35 | % | ||||
The following graph compares the value of a $10,000 investment in the Manning & Napier Fund, Inc. - Equity Income Series - Class S from its inception2 (December 31, 2013) to present (December 31, 2015) to the Russell 1000® Value Index and the S&P 500 Total Return Index.
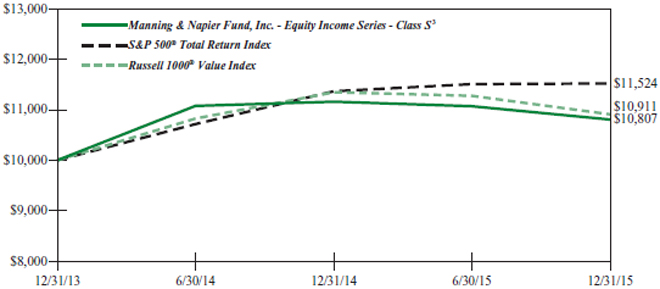
1The returns shown are based on net asset values calculated for shareholder transactions and may differ from the returns shown in the financial highlights, which reflect adjustments made to the net asset values in accordance with accounting principles generally accepted in the United States of America.
2Performance numbers for the Series and the Index are calculated from December 31, 2013, the Class S inception date.
3The Series’ performance does not reflect the deduction of taxes that a shareholder would pay on fund distributions or the redemption of shares. The Series’ performance is historical and may not be indicative of future results. The performance returns shown are inclusive of the net expense ratio of the Series. For the year ended December 31, 2015, this net expense ratio was 0.95% for Class S and 0.75% for Class I. The gross expense ratio, which does not account for any voluntary or contractual waivers currently in effect, was 1.07% for Class S and 0.86% for Class I for the year ended December 31, 2015.
4The Series’ benchmark has been changed from the S&P 500 Index to the Russell 1000® Value Index because the Russell 1000® Value Index better represents the Series’ investment strategy and the type of securities in which it may invest.
5The Russell 1000® Value Index is an unmanaged, market capitalization-weighted index consisting of those Russell 1000® companies with lower price-to-book ratios and lower forecasted growth values. The Index returns are based on a market capitalization-weighted average of relative price changes of the component stocks plus dividends whose reinvestments are compounded daily. The Index returns do not reflect any fees or expenses. Index returns provided by Bloomberg.
6The S&P 500 Total Return Index is an unmanaged, capitalization-weighted measure of 500 widely held common stocks listed on the New York Stock Exchange, American Stock Exchange, and the Over-the-Counter market. The Index returns assume daily reinvestment of dividends and do not reflect any fees or expenses. Index returns provided by Bloomberg.
3
Equity Income Series
Shareholder Expense Example
(unaudited)
As a shareholder of the Series, you incur ongoing costs, including management fees, shareholder service fees and other Series expenses. This example is intended to help you understand your ongoing costs (in dollars) of investing in the Series and to compare these costs with the ongoing costs of investing in other mutual funds.
The example is based on an investment of $1,000 invested at the beginning of the period and held for the entire period (July 1, 2015 to December 31, 2015).
Actual Expenses
The Actual lines of the table below provide information about actual account values and actual expenses. You may use the information in this line, together with the amount you invested, to estimate the expenses that you paid over the period. Simply divide your account value by $1,000 (for example, an $8,600 account value divided by $1,000 = 8.6), then multiply the result by the number in the Actual line for the Class in which you have invested under the heading entitled “Expenses Paid During Period” to estimate the expenses you paid on your account during this period.
Hypothetical Example for Comparison Purposes
The Hypothetical lines of each Class in the table below provide information about hypothetical account values and hypothetical expenses based on the Class’ actual expense ratio and an assumed rate of return of 5% per year before expenses, which is not the Class’ actual return. The hypothetical account values and expenses may not be used to estimate the actual ending account balance or expenses you paid during the period. You may use this information to compare the ongoing costs of investing in the Series and other funds. To do so, compare this 5% hypothetical example for the class in which you have invested with the 5% hypothetical examples that appear in the shareholder reports of the other funds.
Please note that the expenses shown in the table are meant to highlight your ongoing costs only and do not reflect any transaction costs, such as sales charges (loads), redemptions fees, or exchange fees that you may incur in other mutual funds. Therefore, the second line of the table is useful in comparing ongoing costs only, and will not help you determine the relative total costs of owning different funds.
| BEGINNING ACCOUNT VALUE 7/1/15 | ENDING ACCOUNT VALUE 12/31/15 | EXPENSES PAID DURING PERIOD* 7/1/15-12/31/15 | ANNUALIZED EXPENSE RATIO | |||||
Class S | ||||||||
Actual | $1,000.00 | $976.20 | $4.73 | 0.95% | ||||
Hypothetical | ||||||||
(5% return before expenses) | $1,000.00 | $1,020.42 | $4.84 | 0.95% | ||||
Class I | ||||||||
Actual | $1,000.00 | $977.30 | $3.74 | 0.75% | ||||
Hypothetical | ||||||||
(5% return before expenses) | $1,000.00 | $1,021.42 | $3.82 | 0.75% |
*Expenses are equal to the Class’ annualized expense ratio (for the six-month period), multiplied by the average account value over the period, multiplied by 184/365 (to reflect the one-half year period). Expenses are based on the most recent fiscal half year; therefore, the expense ratios stated above may differ from the expense ratios stated in the financial highlights, which is based on one-year data. The Class’ total return would have been lower had certain expenses not been waived during the period.
4
Equity Income Series
Portfolio Composition as of December 31, 2015
(unaudited)
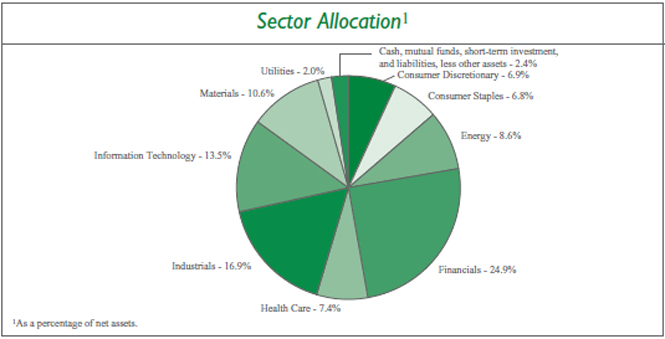
5
Equity Income Series
Investment Portfolio - December 31, 2015
| SHARES | VALUE (NOTE 2) | |||||||
COMMON STOCKS - 97.6% | ||||||||
Consumer Discretionary - 6.9% | ||||||||
Hotels, Restaurants & Leisure - 0.9% | ||||||||
SeaWorld Entertainment, Inc. | 34,730 | $ | 683,834 | |||||
|
| |||||||
Multiline Retail - 1.5% | ||||||||
Dollar General Corp. | 15,510 | 1,114,704 | ||||||
|
| |||||||
Specialty Retail - 4.5% | ||||||||
DSW, Inc. - Class A | 55,200 | 1,317,072 | ||||||
Staples, Inc. | 156,150 | 1,478,741 | ||||||
Williams-Sonoma, Inc. | 11,530 | 673,467 | ||||||
|
| |||||||
| 3,469,280 | ||||||||
|
| |||||||
Total Consumer Discretionary | 5,267,818 | |||||||
|
| |||||||
Consumer Staples - 6.8% | ||||||||
Beverages - 4.0% | ||||||||
The Coca-Cola Co. | 19,880 | 854,045 | ||||||
Diageo plc (United Kingdom)1 | 50,190 | 1,370,585 | ||||||
PepsiCo, Inc.2 | 8,360 | 835,331 | ||||||
|
| |||||||
| 3,059,961 | ||||||||
|
| |||||||
Household Products - 1.1% | ||||||||
The Procter & Gamble Co. | 11,100 | 881,451 | ||||||
|
| |||||||
Tobacco - 1.7% | ||||||||
Philip Morris International, Inc.2 | 14,480 | 1,272,937 | ||||||
|
| |||||||
Total Consumer Staples | 5,214,349 | |||||||
|
| |||||||
Energy - 8.6% | ||||||||
Oil, Gas & Consumable Fuels - 8.6% | ||||||||
BP plc - ADR (United Kingdom)2 | 23,250 | 726,795 | ||||||
Chevron Corp.2 | 16,860 | 1,516,726 | ||||||
Exxon Mobil Corp.2 | 30,850 | 2,404,758 | ||||||
Occidental Petroleum Corp. | 16,950 | 1,145,989 | ||||||
Total S.A. (France)1 | 18,050 | 809,211 | ||||||
|
| |||||||
Total Energy | 6,603,479 | |||||||
|
| |||||||
Financials - 24.9% | ||||||||
Banks - 8.4% | ||||||||
Citigroup, Inc.2 | 35,820 | 1,853,685 | ||||||
JPMorgan Chase & Co. | 22,580 | 1,490,957 | ||||||
KeyCorp.2 | 30,700 | 404,933 | ||||||
The PNC Financial Services Group, Inc. | 4,570 | 435,567 | ||||||
U.S. Bancorp | 18,640 | 795,369 | ||||||
Wells Fargo & Co. | 26,380 | 1,434,017 | ||||||
|
| |||||||
| 6,414,528 | ||||||||
|
| |||||||
Capital Markets - 2.3% | ||||||||
American Capital Ltd.* | 20,980 | 289,314 | ||||||
The accompanying notes are an integral part of the financial statements.
6
Equity Income Series
Investment Portfolio - December 31, 2015
| VALUE | ||||||||
| SHARES | (NOTE 2) | |||||||
COMMON STOCKS (continued) | ||||||||
Financials (continued) | ||||||||
Capital Markets (continued) | ||||||||
Apollo Investment Corp. | 40,390 | $ | 210,836 | |||||
Ares Capital Corp. | 17,580 | 250,515 | ||||||
Fifth Street Finance Corp. | 43,240 | 275,871 | ||||||
Medley Capital Corp. | 31,730 | 238,610 | ||||||
PennantPark Investment Corp. | 31,590 | 195,226 | ||||||
Prospect Capital Corp. | 39,135 | 273,162 | ||||||
|
| |||||||
| 1,733,534 | ||||||||
|
| |||||||
Insurance - 2.6% | ||||||||
Admiral Group plc (United Kingdom)1 | 30,880 | 754,576 | ||||||
Principal Financial Group, Inc. | 27,730 | 1,247,295 | ||||||
|
| |||||||
| 2,001,871 | ||||||||
|
| |||||||
Real Estate Investment Trusts (REITS) - 11.6% | ||||||||
American Capital Agency Corp. | 18,350 | 318,189 | ||||||
Annaly Capital Management, Inc. | 36,610 | 343,402 | ||||||
CatchMark Timber Trust, Inc. - Class A | 75,720 | 856,393 | ||||||
Community Healthcare Trust, Inc. | 19,550 | 360,307 | ||||||
Crown Castle International Corp. | 13,270 | 1,147,191 | ||||||
DDR Corp. | 21,620 | 364,081 | ||||||
Healthcare Trust of America, Inc. - Class A | 16,340 | 440,690 | ||||||
Lamar Advertising Co. - Class A | 12,360 | 741,353 | ||||||
Outfront Media, Inc. | 55,634 | 1,214,490 | ||||||
Paramount Group, Inc. | 19,730 | 357,113 | ||||||
Retail Opportunity Investments Corp. | 22,970 | 411,163 | ||||||
Weyerhaeuser Co. | 76,640 | 2,297,667 | ||||||
|
| |||||||
| 8,852,039 | ||||||||
|
| |||||||
Total Financials | 19,001,972 | |||||||
|
| |||||||
Health Care - 7.4% | ||||||||
Pharmaceuticals - 7.4% | ||||||||
Eli Lilly & Co.2 | 10,200 | 859,452 | ||||||
Johnson & Johnson | 18,120 | 1,861,286 | ||||||
Merck & Co., Inc. | 19,300 | 1,019,426 | ||||||
Roche Holding AG (Switzerland)1 | 3,760 | 1,041,928 | ||||||
Sanofi (France)1 | 10,580 | 901,651 | ||||||
|
| |||||||
Total Health Care | 5,683,743 | |||||||
|
| |||||||
Industrials - 16.9% | ||||||||
Aerospace & Defense - 1.6% | ||||||||
Honeywell International, Inc. | 11,560 | 1,197,269 | ||||||
|
| |||||||
Air Freight & Logistics - 1.3% | ||||||||
United Parcel Service, Inc. - Class B | 10,290 | 990,207 | ||||||
|
| |||||||
The accompanying notes are an integral part of the financial statements.
7
Equity Income Series
Investment Portfolio - December 31, 2015
| SHARES | VALUE (NOTE 2) | |||||||
COMMON STOCKS (continued) | ||||||||
Industrials (continued) | ||||||||
Commercial Services & Supplies - 3.4% | ||||||||
Pitney Bowes, Inc. | 45,850 | $ | 946,802 | |||||
Waste Management, Inc. | 30,390 | 1,621,914 | ||||||
|
| |||||||
| 2,568,716 | ||||||||
|
| |||||||
Electrical Equipment - 1.1% | ||||||||
Rockwell Automation, Inc. | 7,920 | 812,671 | ||||||
|
| |||||||
Industrial Conglomerates - 4.2% | ||||||||
3M Co. | 7,090 | 1,068,038 | ||||||
General Electric Co. | 69,060 | 2,151,219 | ||||||
|
| |||||||
| 3,219,257 | ||||||||
|
| |||||||
Machinery - 1.7% | ||||||||
Flowserve Corp. | 17,920 | 754,074 | ||||||
Pentair plc (United Kingdom) | 10,600 | 525,018 | ||||||
|
| |||||||
| 1,279,092 | ||||||||
|
| |||||||
Professional Services - 1.5% | ||||||||
Nielsen Holdings plc | 25,600 | 1,192,960 | ||||||
|
| |||||||
Road & Rail - 2.1% | ||||||||
Kansas City Southern2 | 14,720 | 1,099,142 | ||||||
Union Pacific Corp.2 | 6,830 | 534,106 | ||||||
|
| |||||||
| 1,633,248 | ||||||||
|
| |||||||
Total Industrials | 12,893,420 | |||||||
|
| |||||||
Information Technology - 13.5% | ||||||||
Communications Equipment - 4.1% | ||||||||
Cisco Systems, Inc. | 23,250 | 631,354 | ||||||
Juniper Networks, Inc. | 40,250 | 1,110,900 | ||||||
Qualcomm, Inc. | 27,020 | 1,350,595 | ||||||
|
| |||||||
| 3,092,849 | ||||||||
|
| |||||||
IT Services - 3.1% | ||||||||
Broadridge Financial Solutions, Inc. | 19,040 | 1,023,019 | ||||||
Xerox Corp.2 | 128,260 | 1,363,404 | ||||||
|
| |||||||
| 2,386,423 | ||||||||
|
| |||||||
Software - 2.3% | ||||||||
Microsoft Corp. | 32,160 | 1,784,237 | ||||||
|
| |||||||
Technology Hardware, Storage & Peripherals - 4.0% | ||||||||
Apple, Inc.2 | 14,600 | 1,536,796 | ||||||
EMC Corp. | 58,000 | 1,489,440 | ||||||
|
| |||||||
| 3,026,236 | ||||||||
|
| |||||||
Total Information Technology | 10,289,745 | |||||||
|
| |||||||
The accompanying notes are an integral part of the financial statements.
8
Equity Income Series
Investment Portfolio - December 31, 2015
| SHARES | VALUE (NOTE 2) | |||||||
COMMON STOCKS (continued) | ||||||||
Materials - 10.6% | ||||||||
Chemicals - 5.4% | ||||||||
Ashland, Inc. | 14,570 | $ | 1,496,339 | |||||
The Dow Chemical Co.2 | 35,260 | 1,815,185 | ||||||
E.I. du Pont de Nemours & Co. | 11,770 | 783,882 | ||||||
|
| |||||||
| 4,095,406 | ||||||||
|
| |||||||
Containers & Packaging - 5.2% | ||||||||
Avery Dennison Corp. | 12,120 | 759,439 | ||||||
Bemis Co., Inc.2 | 16,090 | 719,062 | ||||||
Graphic Packaging Holding Co. | 48,140 | 617,636 | ||||||
Packaging Corp. of America | 16,010 | 1,009,430 | ||||||
Sonoco Products Co. | 21,930 | 896,279 | ||||||
|
| |||||||
| 4,001,846 | ||||||||
|
| |||||||
Total Materials | 8,097,252 | |||||||
|
| |||||||
Utilities - 2.0% | ||||||||
Electric Utilities - 1.2% | ||||||||
Eversource Energy | 11,050 | 564,324 | ||||||
Exelon Corp.2 | 11,800 | 327,686 | ||||||
|
| |||||||
| 892,010 | ||||||||
|
| |||||||
Multi-Utilities - 0.8% | ||||||||
CMS Energy Corp.2 | 16,780 | 605,422 | ||||||
|
| |||||||
Total Utilities | 1,497,432 | |||||||
|
| |||||||
TOTAL COMMON STOCKS | ||||||||
(Identified Cost $76,567,632) | 74,549,210 | |||||||
|
| |||||||
MUTUAL FUNDS - 2.2% | ||||||||
Adams Natural Resources Fund, Inc. | 20,950 | 371,653 | ||||||
Gabelli Dividend & Income Trust | 21,140 | 390,244 | ||||||
Tri-Continental Corp. | 45,920 | 919,318 | ||||||
|
| |||||||
TOTAL MUTUAL FUNDS | ||||||||
(Identified Cost $1,716,202) | 1,681,215 | |||||||
|
| |||||||
The accompanying notes are an integral part of the financial statements.
9
Equity Income Series
Investment Portfolio - December 31, 2015
| SHARES/ | VALUE | |||||||
| CONTRACTS | (NOTE 2) | |||||||
SHORT-TERM INVESTMENT - 1.8% | ||||||||
Dreyfus Cash Management, Inc. - Institutional Shares3, 0.23% | ||||||||
(Identified Cost $1,346,605) | 1,346,605 | $ | 1,346,605 | |||||
|
| |||||||
TOTAL INVESTMENTS - 101.6% | ||||||||
(Identified Cost $79,630,439) | 77,577,030 | |||||||
LIABILITIES, LESS OTHER ASSETS - (1.6%) | (1,230,219 | ) | ||||||
|
| |||||||
NET ASSETS - 100% | $ | 76,346,811 | ||||||
|
| |||||||
CALL OPTIONS WRITTEN - 0.0%# | ||||||||
Apple, Inc., Strike Price $118.00, Expiring January 15, 2016 | 50 | $ | (300 | ) | ||||
BP plc - ADR (United Kingdom), Strike Price $36.00, Expiring January 15, 2016 | 80 | (80 | ) | |||||
EMC Corp., Strike Price $28.00, Expiring January 15, 2016 | 200 | (400 | ) | |||||
Eversource Energy, Strike Price $55.00, Expiring January 15, 2016 | 40 | (200 | ) | |||||
Exelon Corp., Strike Price $28.00, Expiring January 15, 2016 | 40 | (1,560 | ) | |||||
Honeywell International, Inc., Strike Price $110.00, Expiring January 15, 2016 | 40 | (240 | ) | |||||
Nielsen Holdings plc, Strike Price $50.00, Expiring January 15, 2016 | 90 | (450 | ) | |||||
Packaging Corp. of America, Strike Price $70.00, Expiring January 15, 2016 | 55 | (275 | ) | |||||
Pentair plc (United Kingdom), Strike Price $60.00, Expiring January 15, 2016 | 35 | (175 | ) | |||||
Principal Financial Group, Inc., Strike Price $50.00, Expiring January 15, 2016 | 90 | (900 | ) | |||||
Qualcomm, Inc., Strike Price $55.00, Expiring January 15, 2016 | 90 | (540 | ) | |||||
Rockwell Automation, Inc., Strike Price $115.00, Expiring January 15, 2016 | 30 | (330 | ) | |||||
Staples, Inc., Strike Price $16.00, Expiring January 15, 2016 | 390 | (780 | ) | |||||
United Parcel Service, Inc. - Class B, Strike Price $105.00, Expiring January 15, 2016 | 35 | (70 | ) | |||||
Williams-Sonoma, Inc., Strike Price $67.50, Expiring January 15, 2016 | 40 | (1,000 | ) | |||||
|
| |||||||
TOTAL CALL OPTIONS WRITTEN | ||||||||
(Premiums Received $17,383) | $ | (7,300 | ) | |||||
|
| |||||||
ADR - American Depositary Receipt
ETF - Exchange-Traded Fund
*Non-income producing security.
#Less than 0.1%.
1A factor from a third party vendor was applied to determine the security’s fair value following the close of local trading.
2A portion of this security is deposited with the broker as collateral for options contracts written. As of December 31, 2015, the total value of such securities was $6,220,120.
3Rate shown is the current yield as of December 31, 2015.
The Global Industry Classification Standard (GICS) was developed by and is the exclusive property and a service mark of MSCI Inc. (MSCI) and Standard & Poor’s, a division of The McGraw-Hill Companies, Inc. (S&P), and is licensed for use by Manning & Napier when referencing GICS sectors. Neither MSCI, S&P, nor any third party involved in making or compiling the GICS or any GICS classifications makes any express or implied warranties or representations with respect to such standard or classification, nor shall any such party have any liability therefrom.
The accompanying notes are an integral part of the financial statements.
10
Equity Income Series
Statement of Assets & Liabilities
December 31, 2015
ASSETS: | ||||
Investments, at value (identified cost $79,630,439) (Note 2) | $ | 77,577,030 | ||
Dividends receivable | 193,466 | |||
Foreign tax reclaims receivable | 6,756 | |||
Receivable for fund shares sold | 20 | |||
|
| |||
TOTAL ASSETS | 77,777,272 | |||
|
| |||
LIABILITIES: | ||||
Accrued management fees (Note 3) | 49,007 | |||
Accrued fund accounting and administration fees (Note 3) | 15,612 | |||
Accrued shareholder services fees (Class S) (Note 3) | 4,225 | |||
Accrued transfer agent fees (Note 3) | 683 | |||
Accrued Chief Compliance Officer service fees (Note 3) | 429 | |||
Options written, at value (premiums received $17,383) (Note 2) | 7,300 | |||
Payable for fund shares repurchased | 1,334,669 | |||
Other payables and accrued expenses | 18,536 | |||
|
| |||
TOTAL LIABILITIES | 1,430,461 | |||
|
| |||
TOTAL NET ASSETS | $ | 76,346,811 | ||
|
| |||
NET ASSETS CONSIST OF: | ||||
Capital stock | $ | 75,340 | ||
Additional paid-in-capital | 77,506,451 | |||
Undistributed net investment income | 1,058 | |||
Accumulated net realized gain on investments, foreign currency and translation of other assets and liabilities | 807,545 | |||
Net unrealized depreciation on investments, foreign currency and translation of other assets and liabilities | (2,043,583 | ) | ||
|
| |||
TOTAL NET ASSETS | $ | 76,346,811 | ||
|
| |||
NET ASSET VALUE, OFFERING PRICE AND REDEMPTION PRICE PER SHARE - Class S | ||||
($24,584,142/2,426,155 shares) | $ | 10.13 | ||
|
| |||
NET ASSET VALUE, OFFERING PRICE AND REDEMPTION PRICE PER SHARE - Class I | ||||
($51,762,669/5,107,865 shares) | $ | 10.13 | ||
|
| |||
The accompanying notes are an integral part of the financial statements.
11
Equity Income Series
Statement of Operations
For the Year Ended December 31, 2015
INVESTMENT INCOME: | ||||
Dividends (net of foreign taxes withheld, $12,951) | $ | 2,069,712 | ||
|
| |||
EXPENSES: | ||||
Management fees (Note 3) | 464,087 | |||
Shareholder services fees (Class S)(Note 3) | 49,861 | |||
Fund accounting and administration fees (Note 3) | 47,626 | |||
Transfer agent fees (Note 3) | 1,651 | |||
Chief Compliance Officer service fees (Note 3) | 2,541 | |||
Directors’ fees (Note 3) | 2,673 | |||
Custodian fees | 4,413 | |||
Miscellaneous | 93,849 | |||
|
| |||
Total Expenses | 666,701 | |||
Less reduction of expenses (Note 3) | (81,356 | ) | ||
|
| |||
Net Expenses | 585,345 | |||
|
| |||
NET INVESTMENT INCOME | 1,484,367 | |||
|
| |||
REALIZED AND UNREALIZED GAIN (LOSS) ON INVESTMENTS AND FOREIGN CURRENCY: | ||||
Net realized gain (loss) on- | ||||
Investments | 1,670,670 | |||
Options written | 144,347 | |||
Foreign currency and translation of other assets and liabilities | (1,251 | ) | ||
|
| |||
| 1,813,766 | ||||
|
| |||
Net change in unrealized appreciation (depreciation) on- | ||||
Investments | (5,030,097 | ) | ||
Options written | 7,233 | |||
Foreign currency and translation of other assets and liabilities | 249 | |||
|
| |||
| (5,022,615 | ) | |||
|
| |||
NET REALIZED AND UNREALIZED GAIN (LOSS) ON INVESTMENTS AND FOREIGN CURRENCY | (3,208,849 | ) | ||
|
| |||
NET DECREASE IN NET ASSETS RESULTING FROM OPERATIONS | $ | (1,724,482 | ) | |
|
| |||
The accompanying notes are an integral part of the financial statements.
12
Equity Income Series
Statements of Changes in Net Assets
| FOR THE YEAR ENDED 12/31/15 | FOR THE YEAR ENDED 12/31/14* | |||||||
INCREASE IN NET ASSETS: | ||||||||
OPERATIONS: | ||||||||
Net investment income | $ | 1,484,367 | $ | 1,131,262 | ||||
Net realized gain on investments and foreign currency | 1,813,766 | 644,732 | ||||||
Net change in unrealized appreciation (depreciation) on investments and foreign currency | (5,022,615 | ) | 2,979,032 | |||||
|
|
|
| |||||
Net increase (decrease) from operations | (1,724,482 | ) | 4,755,026 | |||||
|
|
|
| |||||
DISTRIBUTIONS TO SHAREHOLDERS (Note 8): | ||||||||
From net investment income (Class S) | (514,963 | ) | (386,141 | ) | ||||
From net investment income (Class I) | (1,184,529 | ) | (844,207 | ) | ||||
From net realized gain on investments (Class S) | (205,407 | ) | (228,447 | ) | ||||
From net realized gain on investments (Class I) | (432,451 | ) | (469,233 | ) | ||||
|
|
|
| |||||
Total distributions to shareholders | (2,337,350 | ) | (1,928,028 | ) | ||||
|
|
|
| |||||
CAPITAL STOCK ISSUED AND REPURCHASED: | ||||||||
Net increase from capital share transactions (Note 5) | 17,724,722 | 59,356,923 | ||||||
|
|
|
| |||||
Net increase in net assets | 13,662,890 | 62,183,921 | ||||||
NET ASSETS: | ||||||||
Beginning of year | 62,683,921 | 500,000 | ||||||
|
|
|
| |||||
End of year (including undistributed net investment income of $1,058 and $0, respectively) | $ | 76,346,811 | $ | 62,683,921 | ||||
|
|
|
| |||||
* Commencement of operations was December 31, 2013.
The accompanying notes are an integral part of the financial statements.
13
Equity Income Series
Financial Highlights - Class S*
| FOR THE YEAR ENDED 12/31/15 | FOR THE YEAR ENDED 12/31/14* | |||||||
Per share data (for a share outstanding throughout the year): | ||||||||
Net asset value - Beginning of year | $ | 10.78 | $ | 10.00 | ||||
|
|
|
| |||||
Income (loss) from investment operations: | ||||||||
Net investment income1 | 0.20 | 0.29 | 2 | |||||
Net realized and unrealized gain (loss) on investments | (0.54 | ) | 0.86 | |||||
|
|
|
| |||||
Total from investment operations | (0.34 | ) | 1.15 | |||||
|
|
|
| |||||
Less distributions to shareholders: | ||||||||
From net investment income | (0.22 | ) | (0.23 | ) | ||||
From net realized gain on investments | (0.09 | ) | (0.14 | ) | ||||
|
|
|
| |||||
Total distributions to shareholders | (0.31 | ) | (0.37 | ) | ||||
|
|
|
| |||||
Net asset value - End of year | $ | 10.13 | $ | 10.78 | ||||
|
|
|
| |||||
Net assets - End of year (000’s omitted) | $ | 24,584 | $ | 24,178 | ||||
|
|
|
| |||||
Total return3 | (3.20 | %) | 11.63 | % | ||||
Ratios (to average net assets)/Supplemental Data: | ||||||||
Expenses** | 0.95 | % | 0.95 | % | ||||
Net investment income | 1.92 | % | 2.68 | %2 | ||||
Portfolio turnover | 58 | % | 55 | % | ||||
| **The investment advisor did not impose all or a portion of its management and/or other fees, and in some periods may have paid a portion of the Series’ expenses. If these expenses had been incurred by the Class, the expense ratio (to average net assets) would have increased by the following amount: | ||||||||
| 0.12 | % | 0.33 | % | |||||
*Commencement of operations was December 31, 2013.
1Calculated based on average shares outstanding during the year.
2Reflects a special dividend paid out during the period by two of the Series’ holdings. Had the Series not received the special dividends, the net investment income per share would have been $0.22 and the net investment income ratio would have been 2.07%.
3Represents aggregate total return for the years indicated, and assumes reinvestment of all distributions. Total return would have been lower had certain expenses not been waived or reimbursed during certain years.
The accompanying notes are an integral part of the financial statements.
14
Equity Income Series
Financial Highlights - Class I*
| FOR THE YEAR ENDED 12/31/15 | FOR THE YEAR ENDED 12/31/14* | |||||||
Per share data (for a share outstanding throughout the year): | ||||||||
Net asset value - Beginning of year | $ | 10.78 | $ | 10.00 | ||||
|
|
|
| |||||
Income (loss) from investment operations: | ||||||||
Net investment income1 | 0.23 | 0.30 | 2 | |||||
Net realized and unrealized gain (loss) on investments | (0.55 | ) | 0.87 | |||||
|
|
|
| |||||
Total from investment operations | (0.32 | ) | 1.17 | |||||
|
|
|
| |||||
Less distributions to shareholders: | ||||||||
From net investment income | (0.24 | ) | (0.25 | ) | ||||
From net realized gain on investments | (0.09 | ) | (0.14 | ) | ||||
|
|
|
| |||||
Total distributions to shareholders | (0.33 | ) | (0.39 | ) | ||||
|
|
|
| |||||
Net asset value - End of year | $ | 10.13 | $ | 10.78 | ||||
|
|
|
| |||||
Net assets - End of year (000’s omitted) | $ | 51,763 | $ | 38,506 | ||||
|
|
|
| |||||
Total return3 | (3.00 | %) | 11.79 | % | ||||
Ratios (to average net assets)/Supplemental Data: | ||||||||
Expenses** | 0.75 | % | 0.75 | % | ||||
Net investment income | 2.16 | % | 2.82 | %2 | ||||
Portfolio turnover | 58 | % | 55 | % | ||||
| **The investment advisor did not impose all or a portion of its management and/or other fees, and in some periods may have paid a portion of the Series’ expenses. If these expenses had been incurred by the Class, the expense ratio (to average net assets) would have increased by the following amount: | ||||||||
| 0.11 | % | 0.30 | % | |||||
*Commencement of operations was December 31, 2013.
1Calculated based on average shares outstanding during the years.
2Reflects a special dividend paid out during the period by two of the Series’ holdings. Had the Series not received the special dividends, the net investment income per share would have been $0.24 and the net investment income ratio would have been 2.19%.
3Represents aggregate total return for the years indicated, and assumes reinvestment of all distributions. Total return would have been lower had certain expenses not been waived or reimbursed during certain years.
The accompanying notes are an integral part of the financial statements.
15
Equity Income Series
Notes to Financial Statements
| 1. | Organization |
Equity Income Series (the “Series”) is a no-load diversified series of Manning & Napier Fund, Inc. (the “Fund”). The Fund is organized in Maryland and is registered under the Investment Company Act of 1940, as amended, as an open-end management investment company.
The Series’ primary investment objectives are to provide current income and income growth, and it has a secondary goal of providing long-term capital appreciation.
The Fund’s advisor is Manning & Napier Advisors, LLC (the “Advisor”). Shares of the Series are offered to investors, clients and employees of the Advisor and its affiliates. The Series is authorized to issue two classes of shares (Class S and Class I). Each class of shares is substantially the same, except that Class S shares bear shareholder services fees. The total authorized capital stock of the Fund consists of 15 billion shares of common stock each having a par value of $0.01. As of December 31, 2015, 10.7 billion shares have been designated in total among 41 series, of which 100 million have been designated as Equity Income Series Class S common stock, and 100 million have been designated as Equity Income Series Class I common stock.
| 2. | Significant Accounting Policies |
The following is a summary of significant accounting policies followed by the Series. The Series is an investment company and, accordingly, follows the investment company accounting and reporting guidance of the Financial Accounting Standards Board Accounting Standards Codification Topic 946 - Investment Companies, which is part of accounting principles generally accepted in the United States of America (“GAAP”).
Security Valuation
Portfolio securities, including domestic equities, foreign equities, warrants and options, listed on an exchange other than the NASDAQ Stock Market are valued at the latest quoted sales price of the exchange on which the security is primarily traded. Securities not traded on valuation date or securities not listed on an exchange are valued at the latest quoted bid price provided by the Fund’s pricing service. Securities listed on the NASDAQ Stock Market are valued in accordance with the NASDAQ Official Closing Price.
Short-term investments that mature in sixty days or less may be valued at amortized cost, which approximates fair value. Investments in open-end investment companies are valued at their net asset value per share on valuation date.
Volume and level of activity in established markets for an asset or liability are evaluated to determine whether recent transactions and quoted prices are determinative of fair value. Where there have been significant decreases in volume and level of activity, further analysis and adjustment may be necessary to estimate fair value. The Series measures fair value in these instances by the use of inputs and valuation techniques which may be based upon current market prices of securities that are comparable in coupon, rating, maturity and industry and/or expectation of future cash flows. As a result of trading in relatively thin markets and/or markets that experience significant volatility, the prices used by the Series to value these securities may differ from the value that would be realized if these securities were sold, and the differences could be material.
Securities for which representative valuations or prices are not available from the Series’ pricing service may be valued at fair value as determined in good faith by the Advisor under procedures approved by and under the general supervision and responsibility of the Fund’s Board of Directors (the “Board”). Due to the inherent uncertainty of valuations of such securities, the fair value may differ significantly from the values that would have been used had a ready market for such securities existed. If trading or events occurring after the close of the principal market in which securities are traded are expected to materially affect the value of those securities, then they may be valued at their fair value, taking this trading or these events into account. In accordance with the procedures approved by the Board, the values of certain securities trading outside the U.S. were adjusted following the close of local trading using a factor from a third party vendor. The third party vendor uses statistical analyses and quantitative models, which consider among other things subsequent movement and changes in the prices of indices, securities and exchange rates in other markets, to determine the factors which are used to adjust local market prices. The value of
16
Equity Income Series
Notes to Financial Statements (continued)
| 2. | Significant Accounting Policies (continued) |
Security Valuation (continued)
securities used for net asset value calculation under these procedures may differ from published prices for the same securities. It is the Fund’s policy to classify each foreign equity security where a factor from a third party vendor is provided as a Level 2 security.
Various inputs are used in determining the value of the Series’ assets or liabilities carried at fair value. These inputs are summarized in three broad levels. Level 1 includes quoted prices in active markets for identical assets and liabilities. Level 2 includes other significant observable inputs (including quoted prices for similar securities, interest rates, prepayment speeds, credit risk, etc.). Level 3 includes significant unobservable inputs (including the Series’ own assumptions in determining the fair value of investments). A financial instrument’s level within the fair value hierarchy is based on the lowest level of any input both individually and in aggregate that is significant to the fair value measurement. The inputs or methodology used for valuing securities are not necessarily an indication of the risk associated with investing in those securities.
The following is a summary of the valuation levels used for major security types as of December 31, 2015 in valuing the Series’ assets or liabilities carried at fair value:
| DESCRIPTION | TOTAL | LEVEL 1 | LEVEL 2 | LEVEL 3 | ||||||||||||
Assets: | ||||||||||||||||
Equity securities: | ||||||||||||||||
Consumer Discretionary | $ | 5,267,818 | $ | 5,267,818 | $ | — | $ | — | ||||||||
Consumer Staples | 5,214,349 | 3,843,764 | 1,370,585 | — | ||||||||||||
Energy | 6,603,479 | 5,794,268 | 809,211 | — | ||||||||||||
Financials | 19,001,972 | 18,247,396 | 754,576 | — | ||||||||||||
Health Care | 5,683,743 | 3,740,164 | 1,943,579 | — | ||||||||||||
Industrials | 12,893,420 | 12,893,420 | — | — | ||||||||||||
Information Technology | 10,289,745 | 10,289,745 | — | — | ||||||||||||
Materials | 8,097,252 | 8,097,252 | — | — | ||||||||||||
Utilities | 1,497,432 | 1,497,432 | — | — | ||||||||||||
Mutual funds | 3,027,820 | 3,027,820 | — | — | ||||||||||||
|
|
|
|
|
|
|
| |||||||||
Total assets | 77,577,030 | 72,699,079 | 4,877,951 | — | ||||||||||||
|
|
|
|
|
|
|
| |||||||||
Liabilities: | ||||||||||||||||
Other financial instruments* | ||||||||||||||||
Equity contracts | (7,300 | ) | (7,300 | ) | — | — | ||||||||||
|
|
|
|
|
|
|
| |||||||||
Total liabilities | (7,300 | ) | (7,300 | ) | — | — | ||||||||||
|
|
|
|
|
|
|
| |||||||||
Total | $ | 77,569,730 | $ | 72,691,779 | $ | 4,877,951 | $ | — | ||||||||
|
|
|
|
|
|
|
| |||||||||
Please see the Investment Portfolio for foreign securities where a factor from a third party vendor was applied to determine the securities’ fair value following the close of local trading. Such securities are included in Level 2 in the table above.
There were no Level 3 securities held by the Series as of December 31, 2014 or December 31, 2015.
*Other financial instruments are exchange traded options (Level 1).
The Fund’s policy is to recognize transfers in and transfers out of the valuation levels as of the beginning of the reporting period. There were no transfers between Level 1 and Level 2 during the year ended December 31, 2015.
Security Transactions, Investment Income and Expenses
Security transactions are accounted for on trade date. Dividend income is recorded on the ex-dividend date, except that if the ex-dividend date has passed, certain dividends from foreign securities are recorded as soon as the Series is informed of the
17
Equity Income Series
Notes to Financial Statements (continued)
| 2. | Significant Accounting Policies (continued) |
Security Transactions, Investment Income and Expenses (continued)
ex-dividend date. Non-cash dividends, if any, are recorded at the fair value of the securities received. Interest income, including amortization of premium and accretion of discounts using the effective interest method, is earned from settlement date and accrued daily.
Expenses are recorded on an accrual basis. Most expenses of the Fund can be attributed to a specific series. Expenses which cannot be directly attributed are apportioned among the series in the Fund in such a manner as deemed equitable by the Fund’s Board, taking into consideration, among other things, the nature and type of expense. Income, expenses (other than shareholder services fees), and realized and unrealized gains and losses are prorated among the classes based on the relative net assets of each class. Class specific expenses are directly charged to that class.
The Series uses the identified cost method for determining realized gain or loss on investments for both financial statement and federal income tax reporting purposes.
Option Contracts
The Series may write (sell) or buy call or put options on securities and other financial instruments. When the Series writes a call, the Series gives the purchaser the right to buy the underlying security from the Series at the price specified in the option contract (the “exercise price”) at any time during the option period. When the Series writes a put option, the Series gives the purchaser the right to sell to the Series the underlying security at the exercise price at any time during the option period. The Series will only write options on a “covered basis.” This means that the Series will own the underlying security when the Series writes a call or the Series will put aside cash, U.S. Government securities, or other liquid assets in an amount not less than the exercise price at all times the put option is outstanding.
When the Series writes an option, an amount equal to the premium received is reflected as a liability and is subsequently marked-to-market to reflect the current market value of the option. The Series, as a writer of an option, has no control over whether the underlying security or financial instrument may be sold (call) or purchased (put) and, as a result, bears the market risk of an unfavorable change in the price of the security or financial instrument underlying the written option. There is a risk that the Series may not be able to enter into a closing transaction because of an illiquid market.
The Series may also purchase options in an attempt to hedge against fluctuations in the value of its portfolio and to protect against declines in the value of the securities. The premium paid by the Series for the purchase of an option is reflected as an investment and subsequently marked-to-market to reflect the current market value of the option. The risk associated with purchasing options is limited to the premium paid.
When a security is purchased or sold through an exercise of an option, the related premium paid (or received) is added to (or deducted from) the basis of the security acquired or deducted from (or added to) the proceeds of the security sold. When an option expires (or the Series enters into a closing transaction), the Series realizes a gain or loss on the option to the extent of the premium received or paid (or gain or loss to the extent the cost of the closing transaction exceeds the premium paid or received).
The measurement of the risks associated with option contracts is meaningful only when all related and offsetting transactions are considered. The counterparty for the Series’ written options contracts outstanding during the year ended December 31, 2015 is Pershing LLC, a BNY Mellon Company.
18
Equity Income Series
Notes to Financial Statements (continued)
| 2. | Significant Accounting Policies (continued) |
The following table presents the present value of derivatives held during the year ended December 31, 2015 as reflected on the Statement of Assets and Liabilities, and the effect of the derivative instruments on the Statement of Operations:
| STATEMENT OF ASSETS AND LIABILITIES | ||||||
Derivative | Liabilities Location | |||||
Equity contracts | Options written, at value | $ | 7,300 | |||
| STATEMENT OF OPERATIONS | ||||||
Derivative | Location of Gain or (Loss) on Derivatives | | Realized Gain (Loss) on Derivatives | | ||
Equity contracts | Net realized gain (loss) on options written | $ | 144,347 | |||
Derivative | Location of Appreciation (Depreciation) on Derivatives | | Unrealized Appreciation (Depreciation) on Derivatives | | ||
Equity contracts | Net change in unrealized appreciation (depreciation) on options written | $ | 7,233 | |||
The average month-end balances for the year ended December 31, 2015 of outstanding derivative financial instruments were as follows:
Options: | ||||
Average number of option contracts written | 773 | |||
Average notional value of option contracts written | $ | 3,642,844 | ||
Written Option Rollforward
Transactions in options written for the year ended December 31, 2015, were as follows:
| CALLS | ||||||||
| CONTRACTS | PREMIUMS RECEIVED | |||||||
Outstanding options, beginning of year | 240 | $ | 19,140 | |||||
Options written | 6,758 | 266,774 | ||||||
Options exercised | (966 | ) | (63,053 | ) | ||||
Options expired | (2,365 | ) | (83,964 | ) | ||||
Options closed | (2,362 | ) | (121,514 | ) | ||||
|
|
|
| |||||
Outstanding options, end of year | 1,305 | $ | 17,383 | |||||
|
|
|
| |||||
Federal Taxes
The Series’ policy is to comply with the provisions of the Internal Revenue Code applicable to regulated investment companies. The Series is not subject to federal income tax or excise tax to the extent that the Series distributes to shareholders each year its taxable income, including any net realized gains on investments, in accordance with requirements of the Internal Revenue Code. Accordingly, no provision for federal income tax or excise tax has been made in the financial statements.
Management evaluates its tax positions to determine if the tax positions taken meet the minimum recognition threshold in connection with accounting for uncertainties in income tax positions taken or expected to be taken for the purposes of measuring and recognizing tax liabilities in the financial statements. Recognition of tax benefits of an uncertain tax position is required only when the position is “more likely than not” to be sustained assuming examination by taxing authorities. At
19
Equity Income Series
Notes to Financial Statements (continued)
| 2. | Significant Accounting Policies (continued) |
Federal Taxes (continued)
December 31, 2015, the Series has recorded no liability for net unrecognized tax benefits relating to uncertain income tax positions taken or expected to be taken in future tax returns.
The Series files income tax returns in the U.S. federal jurisdiction, various states and foreign jurisdictions, as required. No income tax returns are currently under investigation. The statute of limitations on the Series’ tax returns remains open for the period ended December 31, 2013 and the years ended December 31, 2014 and December 31, 2015. The Series is not aware of any tax positions for which it is reasonably possible that the total amounts of unrecognized tax benefits will significantly change in the next twelve months.
Foreign Taxes
Based on the Series’ understanding of the tax rules and rates related to income, gains and currency purchase/repatriation transactions for foreign jurisdictions in which it invests, the Series will provide for foreign taxes, and where appropriate, deferred foreign tax.
Distributions of Income and Gains
Distributions to shareholders of net investment income and net realized gains are made annually. An additional distribution may be necessary to avoid taxation of the Series. Distributions are recorded on the ex-dividend date.
Indemnifications
The Fund’s organizational documents provide former and current directors and officers with a limited indemnification against liabilities arising in connection with the performance of their duties to the Fund. In the normal course of business, the Fund may also enter into contracts that provide general indemnifications. The Fund’s maximum exposure under these arrangements is unknown as this would be dependent on future claims that may be made against the Fund. The risk of material loss from such claims is considered remote.
Other
The preparation of financial statements in conformity with GAAP requires management to make estimates and assumptions that affect the reported amounts of assets and liabilities and the disclosure of contingent assets and liabilities at the date of the financial statements and the reported amounts of income and expenses during the reporting period. Actual results could differ from those estimates.
| 3. | Transactions with Affiliates |
The Fund has an Investment Advisory Agreement (the “Agreement”) with the Advisor for which the Series pays a fee, computed daily and payable monthly, at an annual rate of 0.65% of the Series’ average daily net assets.
Under the Agreement, personnel of the Advisor provide the Series with advice and assistance in the choice of investments and the execution of securities transactions, and otherwise maintain the Series’ organization. The Advisor also provides the Fund with necessary office space and fund administration and support services. The salaries of all officers of the Fund (except a percentage of the Fund’s Chief Compliance Officer’s salary, which is paid by the Fund), and of all Directors who are “affiliated persons” of the Fund, or of the Advisor, and all personnel of the Fund, or of the Advisor, performing services relating to research, statistical and investment activities, are paid by the Advisor. Each “non-affiliated” Director receives an annual stipend, which is allocated among all the active series of the Fund. In addition, these Directors also receive a fee per Board meeting attended plus a fee for each committee meeting attended and are reimbursed for travel and other out-of-pocket expenses incurred by them in connection with attending such meetings. The Fund also has an Audit Committee Chair, who receives an additional annual stipend for this role.
The Class S shares of the Series are subject to a shareholder services fee in accordance with a shareholder services plan adopted by the Fund’s Board. The shareholder services fee is intended to compensate financial intermediaries, including affiliates of the Fund, in connection with the provision of direct client service, personal services, maintenance of shareholder accounts and reporting services. For these services, Class S of the Series pays a fee, computed daily and payable monthly, at
20
Equity Income Series
Notes to Financial Statements (continued)
| 3. | Transactions with Affiliates (continued) |
an annual rate of 0.20% of the average daily net assets of Class S. The Fund has a Shareholder Services Agreement with the Advisor, for which the Advisor receives the shareholder services fee as stated above.
The Advisor has contractually agreed, until at least April 30, 2016, to waive its fee and, if necessary, pay other operating expenses of the Series in order to maintain total direct annual fund operating expenses for the Series exclusive of each share class’ shareholder services fee, at no more than 0.75% of average daily net assets. Accordingly, the Advisor waived fees of $81,356 for the year ended December 31, 2015, which is included as a reduction of expenses on the Statement of Operations. The Advisor is not eligible to recoup any expenses that have been waived or reimbursed.
Manning & Napier Investor Services, Inc., a registered broker-dealer affiliate of the Advisor, acts as distributor for the Fund’s shares. The services of Manning & Napier Investor Services, Inc. are provided at no additional cost to the Series.
Pursuant to a master services agreement dated November 1, 2014, the Fund pays the Advisor an annual fee related to fund accounting and administration of 0.0085% on the first $25 billion of average daily net assets (excluding Target Series and Strategic Income Series); 0.0075% on the next $15 billion of average daily net assets (excluding Target Series and Strategic Income Series); and 0.0065% of the average daily net assets in excess of $40 billion (excluding Target Series and Strategic Income Series); plus a base fee of $30,400 per series. Transfer agent fees are charged to the Fund on a per account basis. Additionally, certain transaction and out-of-pocket expenses, including charges for reporting relating to the Fund’s compliance program, are charged. The Advisor has agreements with BNY Mellon Investment Servicing (U.S.) Inc. (“BNY”) under which BNY serves as sub-accountant services agent and sub-transfer agent.
Expenses not directly attributable to a series are allocated based on each series’ relative net assets or number of accounts, depending on the expense.
| 4. | Purchases and Sales of Securities |
For the year ended December 31, 2015, purchases and sales of securities, other than U.S. Government securities and short-term securities, were $60,020,359 and $40,275,685, respectively. There were no purchases or sales of U.S. Government securities.
| 5. | Capital Stock Transactions |
Transactions in shares of Class S and Class I of Equity Income Series were:
| CLASS S | FOR THE YEAR ENDED 12/31/15 | FOR THE YEAR ENDED 12/31/14 | ||||||||||||||
| SHARES | AMOUNT | SHARES | AMOUNT | |||||||||||||
Sold | 474,641 | $ | 4,989,203 | 3,008,903 | $ | 31,008,333 | ||||||||||
Reinvested | 69,717 | 702,742 | 58,238 | 603,342 | ||||||||||||
Repurchased | (361,815 | ) | (3,823,197 | ) | (848,529 | ) | (8,732,959 | ) | ||||||||
|
|
|
|
|
|
|
| |||||||||
Total | 182,543 | $ | 1,868,748 | 2,218,612 | $ | 22,878,716 | ||||||||||
|
|
|
|
|
|
|
| |||||||||
| CLASS I | FOR THE YEAR ENDED 12/31/15 | FOR THE YEAR ENDED 12/31/14 | ||||||||||||||
| SHARES | AMOUNT | SHARES | AMOUNT | |||||||||||||
Sold | 2,457,926 | $ | 25,674,089 | 4,040,328 | $ | 41,909,297 | ||||||||||
Reinvested | 126,652 | 1,277,899 | 100,751 | 1,043,774 | ||||||||||||
Repurchased | (1,048,909 | ) | (11,096,014 | ) | (593,883 | ) | (6,474,864 | ) | ||||||||
|
|
|
|
|
|
|
| |||||||||
Total | 1,535,669 | $ | 15,855,974 | 3,547,196 | $ | 36,478,207 | ||||||||||
|
|
|
|
|
|
|
| |||||||||
Approximately 90% of the shares outstanding are held by fiduciary accounts where the Advisor has sole investment discretion.
| 6. | Financial Instruments |
The Series may trade in instruments including written and purchased options, forward foreign currency exchange contracts and futures contracts and other derivatives in the normal course of investing activities to assist in managing exposure to various
21
Equity Income Series
Notes to Financial Statements (continued)
| 6. | Financial Instruments (continued) |
market risks. The Series may be subject to various elements of risk, which may involve, to a varying degree, elements of risk in excess of the amounts recognized for financial statement purposes. These risks include: the risk that changes in the value of a derivative may not correlate perfectly with the underlying asset, rate or index; counterparty credit risk related to over the counter derivative counterparties’ failure to perform under contract terms; liquidity risk related to the lack of a liquid market for these contracts allowing the fund to close out its position(s); and documentation risk relating to disagreement over contract terms.
| 7. | Foreign Securities |
Investing in securities of foreign companies and foreign governments involves special risks and considerations not typically associated with investing in securities of domestic companies and the U.S. Government. These risks include revaluation of currencies and future adverse political and economic developments. Moreover, securities of foreign companies and foreign governments and their markets may be less liquid and their prices more volatile than those of comparable domestic companies and the U.S. Government.
| 8. | Federal Income Tax Information |
The amount and characterization of certain income and capital gains to be distributed are determined in accordance with federal income tax regulations, which may differ from GAAP. These differences are primarily due to differing book and tax treatments in the timing and/or treatment of the recognition of net investment income or gains and losses, including foreign currency gains and losses, qualified late-year losses, losses deferred due to wash sales, equalization and investments in options. The Series may periodically make reclassifications among its capital accounts to reflect income and gains available for distribution (or available capital loss carryovers) under income tax regulations without impacting the Series’ net asset value. For the fiscal year ended December 31, 2015, $216,183 was reclassified to Undistributed Net Investment Income, $216,329 was reclassified from Accumulated Net Realized Gain on Investments and $146 was reclassified to Additional paid-in-capital. Any such reclassifications are not reflected in the financial highlights.
The tax character of distributions paid for the year ended December 31, 2015 were as follows:
| FOR THE YEAR ENDED 12/31/15 | FOR THE YEAR ENDED 12/31/14 | |||||||
Ordinary income | $ | 1,753,009 | $ | 1,906,025 | ||||
Long-term capital gains | 584,341 | 22,003 | ||||||
At December 31, 2015, the tax basis of components of distributable earnings and the net unrealized depreciation based on the identified cost of investments for federal income tax purposes were as follows:
Cost for federal income tax purposes | $ | 80,210,601 | ||
Unrealized appreciation | 3,491,644 | |||
Unrealized depreciation | (6,125,215 | ) | ||
|
| |||
Net unrealized depreciation | $ | (2,633,571 | ) | |
|
| |||
Undistributed ordinary income | $ | 253,240 | ||
Undistributed long-term gains | $ | 1,135,525 |
22
Equity Income Series
Report of Independent Registered Public Accounting Firm
To the Board of Directors of Manning & Napier Fund, Inc. and Shareholders of Equity Income Series:
In our opinion, the accompanying statement of assets and liabilities, including the investment portfolio, and the related statements of operations and of changes in net assets and the financial highlights present fairly, in all material respects, the financial position of Equity Income Series (a series of Manning & Napier Fund, Inc., hereafter referred to as the “Series”) at December 31, 2015, the results of its operations for the year then ended, and the changes in its net assets and the financial highlights for the two years in the period then ended, in conformity with accounting principles generally accepted in the United States of America. These financial statements and financial highlights (hereafter referred to as “financial statements”) are the responsibility of the Series’ management. Our responsibility is to express an opinion on these financial statements based on our audit. We conducted our audit of these financial statements in accordance with the standards of the Public Company Accounting Oversight Board (United States). Those standards require that we plan and perform the audit to obtain reasonable assurance about whether the financial statements are free of material misstatement. An audit includes examining, on a test basis, evidence supporting the amounts and disclosures in the financial statements, assessing the accounting principles used and significant estimates made by management, and evaluating the overall financial statement presentation. We believe that our audits, which included confirmation of securities at December 31, 2015 by correspondence with the custodian and brokers, provide a reasonable basis for our opinion.

New York, New York
February 19, 2016
23
Equity Income Series
Supplemental Tax Information
(unaudited)
All reportings are based on financial information available as of the date of this annual report and, accordingly are subject to change.
For federal income tax purposes, the Series reports for the current fiscal year $1,754,419 or, if different, the maximum amount allowable under the tax law as qualified dividend income.
The Series designates $1,765,011 as Long-Term Capital Gain dividends pursuant to Section 852(b) of the Internal Revenue Code for the fiscal year ended December 31, 2015.
For corporate shareholders, the percentage of investment income (dividend income plus short-term gains, if any) that qualifies for the dividends received deduction for the current fiscal year is 75.18%, or if different, the maximum allowable under tax law.
24
Equity Income Series
Renewal of Investment Advisory Agreement
(unaudited)
At the Manning & Napier Fund, Inc. (the “Fund”) Board of Directors’ (the “Board”) meeting, held on November 17, 2015, the Investment Advisory Agreement (the “Agreement”) between the Fund and Manning & Napier Advisors, LLC (the “Advisor”) was considered by the Board for renewal. In connection with the decision whether to renew the Agreement, a variety of material was prepared for and considered by the Board.
Representatives of the Advisor attended the meeting and presented additional oral and written information to the Board to assist the Board in its considerations. The discussion immediately below outlines the materials and information presented to the Board in connection with the Board’s 2015 Annual consideration of the Agreement and the conclusions made by the Directors when determining to continue the Agreement.
| • | The Board considered the services provided by the Advisor under the Agreement including, among others: deciding what securities to purchase and sell for each Series; arranging for the purchase and sale of such securities by placing orders with broker-dealers; administering the affairs of the Fund (including the books and records of the Fund not maintained by third party service providers such as the custodian or sub-transfer agent); arranging for the insurance coverage for the Fund; and supervising the preparation of tax returns, SEC filings (including registration statements) and reports to shareholders for the Fund. The Board also considered the nature and quality of such services provided under the Agreement in light of the Advisor’s services provided to the Fund for 29 years. The Board discussed the quality of these services with representatives from the Advisor and concluded that the Advisor was performing its services to the Fund required under the Agreement in a reasonable manner. |
| • | The Board considered the performance of each Series since its inception, as well as performance over multiple time periods. Performance for one or more of the following time periods was considered as applicable to the Series’ inception date: inception, three year, five year, ten year, and current market cycle. A market cycle includes periods of both rising and falling markets. Returns for established benchmark indices for each Series were provided. In addition, the Board considered a number of other factors relevant to performance at the meeting (and considers on a quarterly basis) including: a peer group performance analysis consisting of Morningstar universes of mutual funds with similar investment objectives, investment performance of core products, product offerings, performance on an aggregate basis vs. performance over reasonable time periods and the Advisor’s investment process. The Directors acknowledged the challenging performance and discussed the investment process of the Advisor. The Directors confirmed that qualitative factors such as the Advisor’s investment process, including recent enhancements, were an important subset to be considered as part of their consideration of performance. The Board discussed the performance with representatives from the Advisor and concluded that the investment performance of each of the Fund’s Series was reasonable based on the Series’ actual performance and comparative performance, especially for those series with performance over the current market cycle. |
| • | The Board considered the costs of the Advisor’s services and the profits of the Advisor as they relate to the Advisor’s services to the Fund under the Agreement. In reviewing the Advisor’s costs and profits, the Board discussed the Advisor’s revenues generated from the Fund (on both an actual and adjusted basis) and its expenses associated with providing the services under the Agreement. In addition, the Board reviewed the Advisor’s expenses associated with Fund activities outside of the Agreement (such as expense reimbursements pursuant to expense caps and payments made by the Advisor to third party platforms on which shares of the Fund are available for purchase). It was noted by representatives of the Advisor that 22 of the 36 active Series of the Fund are currently experiencing expenses above the capped expense ratios, and thus the Advisor is incurring those expenses over the cap. After discussing the above costs and profits, the Board concluded that the Advisor’s profitability relating to its services provided under the Agreement was reasonable. |
| • | The Board considered the fees and expenses of the various Series of the Fund. The Advisor presented the advisory fees and total expenses for each Series, including the advisory fee adjusted for any expense waivers or reimbursements (either contractual or voluntary) paid by the Advisor. The advisory fees and expense ratios of each Series were compared to an average (on both a mean and median basis) of similar funds as disclosed on the Morningstar database. Representatives of the Advisor discussed with the Board the levels of its advisory fee for each Series of the Fund and as compared to the median and mean advisory fees for similar funds as listed on Morningstar. Expense ratios for every Series, except the Tax Managed Series, Equity Income Class S, High Yield Bond Class S, Pro-Blend Series Classes C and R, and Target Series’ Classes R and K, are lower than, or substantially similar to the Morningstar mean and median reported total expense ratio. |
25
Equity Income Series
Renewal of Investment Advisory Agreement
(unaudited)
The higher than mean and median total expense ratios for Classes C and R reflect higher distribution, marketing and shareholder service fees payable to broker-dealers through a 100bp 12b-1 fee for Class C and a 50bp 12b-1 fee for Class R. Based on their review of the information provided, the Board concluded that the fees and expenses of each Series of the Fund were reasonable on a comparative basis. |
| • | The Board also considered the other benefits the Advisor derives from its relationship with the Fund. Such other benefits include certain research services provided by soft dollars. The Board reviewed the broker-dealers who provided research to the Advisor and the products and services paid for, in whole or in part, using soft dollar commissions. Given the level of soft dollar transactions involving the Fund, the Board concluded that these additional benefits to the Advisor were reasonable. |
| • | In addition to the factors described above, the Board considered the Advisor’s personnel, investment strategies, policies and procedures relating to compliance with personal securities transactions, reputation, expertise and resources in domestic and foreign financial markets. The Board concluded that these factors support the conclusion that the Advisor performs its services in a reasonable manner. |
| • | The Board then considered economies of scale and concluded that the current fee schedule to the advisory agreement remained reasonable given the multiple uses of the Fund (for the Advisor’s discretionary investment account clients in addition to direct investors), the current profitability of the Advisor’s services to the Fund under the Agreement, the number of newly established series of the Fund and the overall size of the Fund complex. |
Based on the Board’s deliberations and their evaluation of the information described above, the Board, including a majority of Directors that are not “interested persons” as defined in the Investment Company Act of 1940, concluded that the compensation under the Agreement was fair and reasonable in light of the services and expenses and such other matters as the Directors considered to be relevant in the exercise of their reasonable judgment. Accordingly, the Board approved the renewal of the Agreement. In the course of their deliberations, the Directors did not identify any particular information that was all important or controlling.
26
Equity Income Series
Directors’ and Officers’ Information
(unaudited)
The Statement of Additional Information provides additional information about the Fund’s directors and officers and can be obtained without charge by calling 1-800-466-3863, at www.manningnapieradvisors.com, or on the EDGAR Database on the SEC Internet web site (http:// www.sec.gov). The following chart shows certain information about the Fund’s officers and directors, including their principal occupations during the last five years. Unless specific dates are provided, the individuals have held the listed positions for longer than five years.
| Interested Director/Officer | ||
| Name: | James E. Mikolaichik* | |
| Address: | 290 Woodcliff Drive Fairport, NY 14450 | |
| Age: | 44 | |
| Current Position(s) Held with Fund: | Principal Executive Officer, President, Chairman & Director | |
| Term of Office1 & Length of Time Served: | Indefinite - Chairman and Director since August 2015 | |
| Principal Occupation(s) During Past 5 Years: | Chief Financial Officer (since 2011) - Manning & Napier Advisors, LLC; Executive Vice President and Head of Strategy (2008-2011) and Chief Risk Officer (2004-2008) - Old Mutual Asset Management Holds or has held one or more of the following title for various subsidiaries and affiliates: Chief Financial Officer. | |
| Number of Portfolios Overseen within Fund Complex: | 41 | |
| Other Directorships Held Outside Fund Complex: | N/A | |
| Independent Directors | ||
| Name: | Stephen B. Ashley | |
| Address: | 290 Woodcliff Drive Fairport, NY 14450 | |
| Age: | 75 | |
| Current Position(s) Held with Fund: | Director, Audit Committee Member, Governance & Nominating Committee Member | |
| Term of Office & Length of Time Served: | Indefinite - Since 1996 | |
| Principal Occupation(s) During Past 5 Years: | Chairman, Director, President & Chief Executive Officer (1997 to present) - The Ashley Group (property management and investment); Director (1995-2008) and Chairman (non-executive) (2004-2008) - Fannie Mae (mortgage). | |
| Number of Portfolios Overseen within Fund Complex: | 41 | |
| Other Directorships Held Outside Fund Complex: | Fannie Mae (1995-2008) The Ashley Group (1995-2008) Genesee Corporation (1987-2007) | |
| Name: | Paul A. Brooke | |
| Address: | 290 Woodcliff Drive Fairport, NY 14450 | |
| Age: | 70 | |
| Current Position(s) Held with Fund: | Director, Audit Committee Member, Governance & Nominating Committee Member | |
| Term of Office & Length of Time Served: | Indefinite - Since 2007 | |
| Principal Occupation(s) During Past 5 Years: | Chairman & CEO (2005-2009) - Ithaka Acquisition Corporation (investments); Chairman (2007-2009) Alsius Corporation (investments); Managing Member, PMSV Holdings LLC (investments) since 1991; Managing Member, Venbio (investments) since 2010. | |
| Number of Portfolios Overseen within Fund Complex: | 41 | |
| Other Directorships Held Outside Fund Complex: | Incyte Corp. (2000-present) ViroPharma, Inc. (2000-2014) HLTH Corp (WebMD) (2000-2010) Cheyne Capital International (2000-present) GMP Companies (2000-2011) Cytos Biotechnology Ltd. (2012-2014) | |
27
Equity Income Series
| Directors’ and Officers’ Information | ||
(unaudited)
| ||
| Independent Directors (continued) | ||
| Name: | Peter L. Faber | |
| Address: | 290 Woodcliff Drive | |
| Fairport, NY 14450 | ||
| Age: | 77 | |
| Current Position(s) Held with Fund: | Director, Governance & Nominating Committee Member | |
| Term of Office & Length of Time Served: | Indefinite - Since 1987 | |
| Principal Occupation(s) During Past 5 Years: | Senior Counsel (2006-2012), Partner (1995-2006 & 2013-present) - McDermott, Will & Emery LLP (law firm) | |
| Number of Portfolios Overseen within Fund Complex: | 41 | |
| Other Directorships Held Outside Fund Complex: | Boston Early Music Festival (non-profit) (2007-present) | |
| Amherst Early Music, Inc. (non-profit) (2009-present) | ||
| Gotham Early Music Scene, Inc. (non-profit) (2009-present) | ||
| Partnership for New York City, Inc. (non-profit) (1989-2010) | ||
| New York Collegium (non-profit) (2004-2011) | ||
| Name: | Harris H. Rusitzky | |
| Address: | 290 Woodcliff Drive | |
| Fairport, NY 14450 | ||
| Age: | 80 | |
| Current Position(s) Held with Fund: | Director, Audit Committee Member, Governance & Nominating Committee Member | |
| Term of Office & Length of Time Served: | Indefinite - Since 1985 | |
| Principal Occupation(s) During Past 5 Years: | President, The Greening Group (business consultants) since 1994; Partner, The Restaurant Group (restaurants) since 2006 | |
| Number of Portfolios Overseen within Fund Complex: | 41 | |
| Other Directorships Held Outside Fund Complex: | Rochester Institute of Technology (university) (1972-present) | |
| Culinary Institute of America (non-profit college) (1985-present) | ||
| George Eastman House (museum) (1988-present) | ||
| National Restaurant Association (restaurant trade organization) (1978- present) | ||
| Name: | Chester N. Watson | |
| Address: | 290 Woodcliff Drive | |
| Fairport, NY 14450 | ||
| Age: | 65 | |
| Current Position(s) Held with Fund: | Director, Audit Committee Chairman, Governance & Nominating Committee Member | |
| Term of Office & Length of Time Served: | Indefinite - Since 2012 | |
| Principal Occupation(s) During Past 5 Years: | General Auditor (2003-2011) - General Motors Company (auto manufacturer) | |
| Number of Portfolios Overseen within Fund Complex: | 41 | |
| Other Directorships Held Outside Fund Complex: | Rochester Institute of Technology (university) (2005-present) | |
Officers | ||
| Name: | Jeffrey S. Coons, Ph.D., CFA | |
| Address: | 290 Woodcliff Drive | |
| Fairport, NY 14450 | ||
| Age: | 52 | |
| Current Position(s) Held with Fund: | Vice President | |
| Term of Office1 & Length of Time Served: | Since 2004 | |
| Principal Occupation(s) During Past 5 Years: | President since 2010, Co-Director of Research (2002-2015) - Manning & Napier Advisors, LLC Holds one or more of the following titles for various subsidiaries and affiliates: President, Director, Treasurer or Senior Trust Officer. | |
| Number of Portfolios Overseen within Fund Complex: | 41 | |
| Other Directorships Held Outside Fund Complex: | N/A | |
28
Equity Income Series
| Directors’ and Officers’ Information | ||
| (unaudited) | ||
| Officers (continued) | ||
| Name: | Elizabeth Craig | |
| Address: | 290 Woodcliff Drive | |
| Fairport, NY 14450 | ||
| Age: | 28 | |
| Current Position(s) Held with Fund: | Assistant Corporate Secretary | |
| Term of Office1 & Length of Time Served: | Since 2011 | |
| Principal Occupation(s) During Past 5 Years: | Fund Administration Manager since 2015; Mutual Fund Compliance Specialist (2009-2015) - Manning & Napier Advisors, LLC | |
| Number of Portfolios Overseen within Fund Complex: | 41 | |
| Other Directorships Held Outside Fund Complex: | N/A | |
| Name: | Christine Glavin | |
| Address: | 290 Woodcliff Drive | |
| Fairport, NY 14450 | ||
| Age: | 49 | |
| Current Position(s) Held with Fund: | Principal Financial Officer, Chief Financial Officer | |
| Term of Office1 & Length of Time Served: | Principal Financial Officer since 2002; Chief Financial Officer since 2001 | |
| Principal Occupation(s) During Past 5 Years: | Director of Fund Reporting since 2011; Fund Reporting Manager (1997-2011) - Manning & Napier Advisors, LLC; Assistant Treasurer since 2008 - Exeter Trust Company | |
| Number of Portfolios Overseen within Fund Complex: | 41 | |
| Other Directorships Held Outside Fund Complex: | N/A | |
| Name: | Jodi L. Hedberg | |
| Address: | 290 Woodcliff Drive | |
| Fairport, NY 14450 | ||
| Age: | 48 | |
| Current Position(s) Held with Fund: | Corporate Secretary, Chief Compliance Officer, Anti-Money Laundering Compliance Officer | |
| Term of Office1 & Length of Time Served: | Corporate Secretary since 1997; Chief Compliance Officer since 2004; Anti-Money Laundering Compliance Officer since 2002 | |
| Principal Occupation(s) During Past 5 Years: | Director of Compliance since 2005; Compliance Manager (1995-2005) - Manning & Napier Advisors, LLC and affiliates; Corporate Secretary - Manning & Napier Investor Services, Inc. since 2006 | |
| Number of Portfolios Overseen within Fund Complex: | 41 | |
| Other Directorships Held Outside Fund Complex: | N/A | |
| Name: | Richard Yates | |
| Address: | 290 Woodcliff Drive | |
| Fairport, NY 14450 | ||
| Age: | 50 | |
| Current Position(s) Held with Fund: | Chief Legal Officer | |
| Term of Office1 & Length of Time Served: | Chief Legal Officer since 2004 | |
| Principal Occupation(s) During Past 5 Years: | Counsel - Manning & Napier Advisors, LLC and affiliates since 2000; Holds one or more of the following titles for various affiliates; Director or Corporate Secretary | |
| Number of Portfolios Overseen within Fund Complex: | 41 | |
| Other Directorships Held Outside Fund Complex: | N/A | |
*Interested Director, within the meaning of the Investment Company Act of 1940 by reason of his position with the Fund’s investment advisor and distributor. Mr. Mikolaichik serves as the Chief Financial Officer for Manning & Napier Advisors, LLC.
1The term of office of all officers shall be one year and until their respective successors are chosen and qualified, or his or her earlier resignation or removal as provided in the Fund’s By-Laws.
29
Equity Income Series
Results of Special Meeting of Shareholders
(unaudited)
A Special Meeting of the Shareholders of the Fund was held on August 18, 2015. The number of votes necessary to conduct the meeting and approve the proposal was obtained, and the results of the vote of shareholders of all the Series of the Fund voting together in the aggregate is listed below:
PROPOSAL 1:
Election of Directors
| NUMBER OF SHARES VOTED FOR | NUMBER OF SHARES WITHELD | |||||||
Stephen B. Ashley | 883,968,395 | 8,618,094 | ||||||
Paul A. Brooke | 884,510,661 | 8,075,828 | ||||||
Peter L. Faber | 884,140,893 | 8,445,596 | ||||||
James E. Mikolaichik | 883,391,832 | 9,194,657 | ||||||
Harris H. Rusitzky | 620,022,215 | 272,564,274 | ||||||
Chester N. Watson | 884,638,809 | 7,947,680 | ||||||
30
Equity Income Series
Literature Requests
(unaudited)
Proxy Voting Policies and Procedures
A description of the policies and procedures that the Fund uses to determine how to vote proxies relating to portfolio securities is available, without charge, upon request:
| By phone | 1-800-466-3863 | |||
| On the Securities and Exchange | ||||
| Commission’s (SEC) web site | http://www.sec.gov |
Proxy Voting Record
Information regarding how the Fund voted proxies relating to portfolio securities during the most recent 12-month period ended June 30th is available, without charge, upon request:
| By phone | 1-800-466-3863 | |||
| On the SEC’s web site | http://www.sec.gov |
Quarterly Portfolio Holdings
The Series’ complete schedule of portfolio holdings for the 1st and 3rd quarters of each fiscal year are provided on Form N-Q, and are available, without charge, upon request:
| By phone | 1-800-466-3863 | |||
| On the SEC’s web site | http://www.sec.gov |
The Series’ Form N-Q may be reviewed and copied at the SEC’s Public Reference Room in Washington, D.C. Information on the operation of the Public Reference Room may be obtained by calling 1-800-SEC-0330.
Prospectus and Statement of Additional Information (SAI)
For more information about any of the Manning & Napier Fund, Inc. Series, you may obtain a prospectus and SAI at www.manning-napier.com or by calling (800) 466-3863. Before investing, carefully consider the objectives, risks, charges and expenses of the investment and read the prospectus carefully as it contains this and other information about the investment company. In addition, this information can be found on the SEC’s web site, http://www.sec.gov.
Additional information available at www.manning-napier.com
1. Fund Holdings - Month-End
2. Fund Holdings - Quarter-End
3. Shareholder Report - Annual
4. Shareholder Report - Semi-Annual
The Fund also offers electronic notification or “e-delivery” when certain documents are available on-line to be downloaded or reviewed. Direct shareholders can elect to receive electronic notification when shareholder reports, prospectus updates, and/or statements are available. If you do not currently have on-line access to your account, you can establish access by going to www.manning-napier.com, click on “Login” in the top corner of the page, and follow the prompts to self-enroll. Once enrolled, you can set your electronic notification preferences by clicking on the Account Options tab located within the green toolbar and then select E-Delivery Option. Should you have any questions on either how to establish on-line access or how to update your account settings, please contact Investor Services at 1-800-466-3863.
The Manning & Napier Fund, Inc. is managed by Manning & Napier Advisors, LLC. Manning & Napier Investor Services, Inc., an affiliate of Manning & Napier Advisors, LLC, is the distributor of the Fund shares.
MNEIN-12/15-AR
Focused Opportunities Series
Management Discussion and Analysis
(unaudited)
Dear Shareholders:
Volatility defined global equity markets during the past year, largely driven by macroeconomic factors. Markets around the world experienced a correction in late August amidst a broad selloff triggered by renewed concerns about economic growth in emerging markets — China in particular — and uncertainty about the effects of that slowdown on overall global growth. Developed economies continued to provide accommodative monetary policy to combat growth concerns, although in December the U.S. Federal Reserve raised the federal funds rate for the first time in nearly a decade. For much of the year, Europe struggled with uncertainty regarding Greece’s ability to secure bailout funding from its creditors, which negatively affected investor sentiment. China’s economy slowed, but the government continued to demonstrate a willingness to provide support through a combination of policy-easing maneuvers and targeted stimulus measures. The U.S. economy remained on a path of slow growth that nevertheless made it the best performing developed economy. U.S. stocks were largely flat for the year, whereas global equity markets moderately declined. Looking ahead, we expect the slow global growth environment to remain in place for the foreseeable future.
Sincerely,
Manning & Napier Advisors, LLC
1
Focused Opportunities Series
Fund Commentary
(unaudited)
Investment Objective
To provide long-term capital appreciation.
Performance Commentary
The Russell Midcap® Value Index (Russell Midcap Value) experienced a return of -4.78% during 2015. The Focused Opportunities Series experienced negative absolute returns as well, returning -21.27%, trailing its benchmark on a relative basis.
The Series’ underperformance relative to the Russell Midcap Value during the year was driven by stock selection. Conversely, sector positioning aided relative returns. Regarding major detractors from relative performance, stock selection in Industrials, Financials, Materials, and Consumer Discretionary challenged relative returns. The Series’ underweight to Financials relative to the benchmark also challenged relative performance.
Following the close of the Series’ fiscal year, the Fund’s Board of Directors voted to close the Series and liquidate all outstanding shares. The final liquidation took place on January 25, 2016 and the proceeds were distributed to the Series’ shareholders (subject to maintenance of appropriate reserves for liquidation and other expenses).
Performance data quoted represents past performance and does not guarantee future results. The investment return and principal value of an investment will fluctuate, so that an investor’s shares, when redeemed, may be worth more or less than their original cost. Current performance may be higher or lower than that quoted; investors can obtain the most recent month-end performance at www.manning-napier.com or by calling (800) 466-3863. Performance for the Focused Opportunities Series Class S shares is provided above. Performance for the Class I shares will be higher based on the Class’ lower expenses.
Please see the next page for additional performance information as of December 31, 2015.
All investments involve risks, including possible loss of principal. As with any stock fund, the value of your investment will fluctuate in response to stock market movements. Investing in the Series will also involve a number of other risks, including issuer-specific risk, small-cap/mid-cap risk, foreign investment risk, and the risk that the investment approach may not be successful. Stocks of small- and mid-cap companies may be subject to more abrupt or erratic market movements than the stocks of larger companies and may be less marketable than the stocks of larger companies. In addition, they may have limited product lines, markets, or financial resources, and they may depend on a small management group. As a result, they fail more often than larger companies. Funds that invest in foreign countries may be subject to the risks of adverse changes in foreign economic, political, regulatory and other conditions as well as risks related to the use of different financial standards. Investments in emerging markets may be more volatile than investments in more developed markets. Additionally, the Series may invest a portion of its assets in real estate investment trusts (REITs). Investments in real estate, including REITs, are subject to risks associated with the direct ownership of real estate: interest rate risk, liquidity risk, and changes in property value, among others.
2
Focused Opportunities Series
Performance Update as of December 31, 2015
(unaudited)
| AGGREGATE TOTAL RETURNS AS OF DECEMBER 31, 2015 | ||||||||
ONE YEAR1 | TOTAL RETURN SINCE INCEPTION2 | |||||||
Manning & Napier Fund, Inc. - Focused Opportunities Series - Class S3 | -21.27 | % | -7.42 | % | ||||
Manning & Napier Fund, Inc. - Focused Opportunities Series - Class I3 | -21.17 | % | -7.28 | % | ||||
Russell Midcap Value Index4 | -4.78 | % | 4.53 | % | ||||
Russell 2500 Value Index5 | -5.49 | % | 0.61 | % | ||||
The following graph compares the value of a $10,000 investment in the Manning & Napier Fund, Inc. - Focused Opportunities Series Class S from its inception2 (December 31, 2013) to present (December 31, 2015) to the Russell Midcap Value Index and the Russell 2500 Value Index.
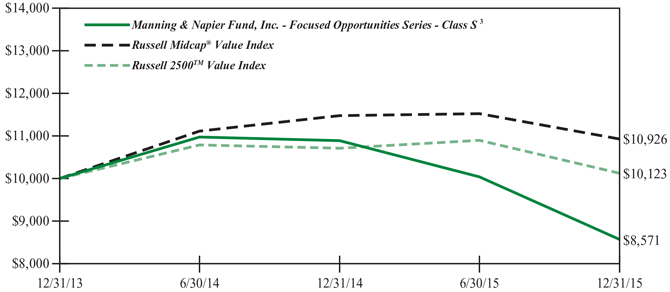
1The returns shown are based on net asset values calculated for shareholder transactions and may differ from the returns shown in the financial highlights, which reflect adjustments made to the net asset values in accordance with accounting principles generally accepted in the United States of America.
2Performance numbers for the Series and the Indices are calculated from December 31, 2013, the Series’ inception date.
3The Series’ performance does not reflect the deduction of taxes that a shareholder would pay on fund distributions or the redemption of shares. The Series’ performance is historical and may not be indicative of future results. The performance returns shown are inclusive of the net expense ratio of the Series. For the year ended December 31, 2015, this net expense ratio was 0.98% for Class S and 0.78% for Class I. The gross expense ratio, which does not account for any voluntary or contractual waivers currently in effect, was 1.00% for Class S and 0.80% for Class I for the year ended December 31, 2015.
4The Russell Midcap Value Index measures the performance of the mid-cap value segment of the U.S. equity universe. It includes those Russell Midcap Index companies with lower price-to-book ratios and lower forecasted growth values. The Index returns do not reflect any fees or expenses. The Index returns are net of withholding taxes. They assume daily reinvestment of net dividends thus accounting for any applicable dividend taxation. The Index is denominated in U.S. dollars. Index returns provided by Bloomberg.
5The Russell 2500 Value Index measures the performance of the small to mid-cap value segment of the U.S. equity universe. It includes those Russell 2500 companies that are considered more value oriented relative to the overall market as defined by Russell’s leading style methodology. The Index returns do not reflect any fees or expenses. The Index returns are net of withholding taxes. They assume daily reinvestment of net dividends thus accounting for any applicable dividend taxation. The Index is denominated in U.S. dollars. Index returns provided by Bloomberg.
3
Focused Opportunities Series
Shareholder Expense Example
(unaudited)
As a shareholder of the Series, you incur ongoing costs, including management fees, shareholder service fees and other Series expenses. This example is intended to help you understand your ongoing costs (in dollars) of investing in the Series and to compare these costs with the ongoing costs of investing in other mutual funds.
The example is based on an investment of $1,000 invested at the beginning of the period and held for the entire period (July 1, 2015 to December 31, 2015).
Actual Expenses
The Actual lines of the table below provide information about actual account values and actual expenses. You may use the information in this line, together with the amount you invested, to estimate the expenses that you paid over the period. Simply divide your account value by $1,000 (for example, an $8,600 account value divided by $1,000 = 8.6), then multiply the result by the number in the Actual line for the Class in which you have invested under the heading entitled “Expenses Paid During Period” to estimate the expenses you paid on your account during this period.
Hypothetical Example for Comparison Purposes
The Hypothetical lines of each Class in the table below provide information about hypothetical account values and hypothetical expenses based on the Class’ actual expense ratio and an assumed rate of return of 5% per year before expenses, which is not the Class’ actual return. The hypothetical account values and expenses may not be used to estimate the actual ending account balance or expenses you paid during the period. You may use this information to compare the ongoing costs of investing in the Series and other funds. To do so, compare this 5% hypothetical example for the class in which you have invested with the 5% hypothetical examples that appear in the shareholder reports of the other funds.
Please note that the expenses shown in the table are meant to highlight your ongoing costs only and do not reflect any transaction costs, such as sales charges (loads), redemption fees, or exchange fees that you may incur in other mutual funds. Therefore, the Hypothetical lines for each Class in the table are useful in comparing ongoing costs only, and will not help you determine the relative total costs of owning different funds.
| BEGINNING ACCOUNT VALUE 7/1/15 | ENDING ACCOUNT VALUE 12/31/15 | EXPENSES PAID DURING PERIOD* 7/1/15-12/31/15 | ANNUALIZED EXPENSE RATIO | |||||
Class S | ||||||||
Actual | $1,000.00 | $853.70 | $4.63 | 0.99% | ||||
Hypothetical | ||||||||
(5% return before expenses) | $1,000.00 | $1,020.21 | $5.04 | 0.99% | ||||
Class I | ||||||||
Actual | $1,000.00 | $854.70 | $3.69 | 0.79% | ||||
Hypothetical | ||||||||
(5% return before expenses) | $1,000.00 | $1,021.22 | $4.02 | 0.79% |
*Expenses are equal to each Class’ annualized expense ratio (for the six-month period), multiplied by the average account value over the period, multiplied by 184/365 (to reflect the one-half year period). Expenses are based on the most recent fiscal half year; therefore, the expense ratios stated above may differ from the expense ratios stated in the financial highlights, which are based on one-year data. The Class’ total return would have been lower had certain expenses not been waived during the period.
4
Focused Opportunities Series
Portfolio Composition as of December 31, 2015
(unaudited)
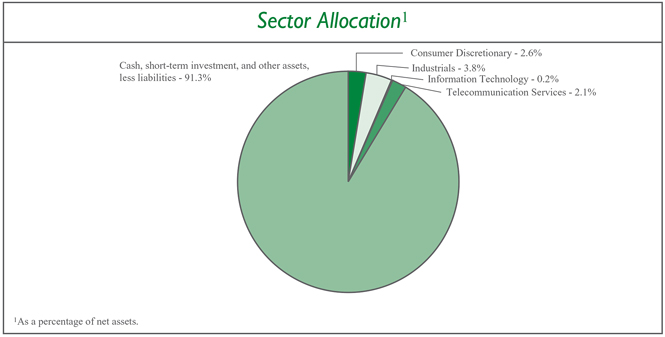
5
Focused Opportunities Series
Investment Portfolio - December 31, 2015
| FOCUSED OPPORTUNITIES SERIES | SHARES | VALUE (NOTE 2) | ||||||
COMMON STOCKS - 8.7% | ||||||||
Consumer Discretionary - 2.6% | ||||||||
Media - 2.6% | ||||||||
Cogeco Cable, Inc. (Canada) | 29,390 | $ | 1,312,004 | |||||
Tribune Media Co. - Class A | 134,339 | 4,542,002 | ||||||
|
| |||||||
Total Consumer Discretionary | 5,854,006 | |||||||
|
| |||||||
Industrials - 3.8% | ||||||||
Aerospace & Defense - 0.5% | ||||||||
KLX, Inc.* | 39,580 | 1,218,668 | ||||||
|
| |||||||
Airlines - 3.3% | ||||||||
Republic Airways Holdings, Inc.* | 1,907,461 | 7,496,322 | ||||||
|
| |||||||
Total Industrials | 8,714,990 | |||||||
|
| |||||||
Information Technology - 0.2% | ||||||||
Communications Equipment - 0.2% | ||||||||
Viavi Solutions, Inc.* | 83,523 | 508,655 | ||||||
|
| |||||||
Telecommunication Services - 2.1% | ||||||||
Wireless Telecommunication Services - 2.1% | ||||||||
Telephone & Data Systems, Inc. | 182,694 | 4,729,948 | ||||||
|
| |||||||
TOTAL COMMON STOCKS | ||||||||
(Identified Cost $24,171,897) | 19,807,599 | |||||||
|
| |||||||
SHORT-TERM INVESTMENT - 81.8% | ||||||||
Dreyfus Cash Management, Inc. - Institutional Shares1, 0.23% | ||||||||
(Identified Cost $186,682,768) | 186,682,768 | 186,682,768 | ||||||
|
| |||||||
TOTAL INVESTMENTS - 90.5% | ||||||||
(Identified Cost $210,854,665) | 206,490,367 | |||||||
OTHER ASSETS, LESS LIABILITIES - 9.5% | 21,664,238 | |||||||
|
| |||||||
NET ASSETS - 100% | $ | 228,154,605 | ||||||
|
| |||||||
ADR - American Depositary Receipt
*Non-income producing security.
1Rate shown is the current yield as of December 31, 2015.
The Global Industry Classification Standard (GICS) was developed by and is the exclusive property and a service mark of MSCI Inc. (MSCI) and Standard & Poor’s, a division of The McGraw-Hill Companies, Inc. (S&P), and is licensed for use by Manning & Napier when referencing GICS sectors. Neither MSCI, S&P, nor any third party involved in making or compiling the GICS or any GICS classifications makes any express or implied warranties or representations with respect to such standard or classification, nor shall any such party have any liability therefrom.
The accompanying notes are an integral part of the financial statements.
6
Focused Opportunities Series
Statement of Assets & Liabilities
December 31, 2015
ASSETS: | ||||
Investments, at value (identified cost $210,854,665) (Note 2) | $ | 206,490,367 | ||
Receivable for securities sold | 22,019,720 | |||
Dividends receivable | 94,810 | |||
Foreign tax reclaims receivable | 4,762 | |||
Prepaid expenses | 180 | |||
|
| |||
TOTAL ASSETS | 228,609,839 | |||
|
| |||
LIABILITIES: | ||||
Accrued management fees (Note 3) | 91,060 | |||
Accrued shareholder services fees (Class S) (Note 3) | 32,505 | |||
Accrued fund accounting and administration fees (Note 3) | 18,597 | |||
Accrued transfer agent fees (Note 3) | 5,773 | |||
Accrued Chief Compliance Officer service fees (Note 3) | 429 | |||
Payable for fund shares repurchased | 234,855 | |||
Other payables and accrued expenses | 72,015 | |||
|
| |||
TOTAL LIABILITIES | 455,234 | |||
|
| |||
TOTAL NET ASSETS | $ | 228,154,605 | ||
|
| |||
NET ASSETS CONSIST OF: | ||||
Capital stock | $ | 290,955 | ||
Additional paid-in-capital | 268,142,490 | |||
Undistributed net investment income | 606,072 | |||
Accumulated net realized loss on investments, foreign currency and translation of other assets and liabilities | (36,520,614 | ) | ||
Net unrealized depreciation on investments | (4,364,298 | ) | ||
|
| |||
TOTAL NET ASSETS | $ | 228,154,605 | ||
|
| |||
NET ASSET VALUE, OFFERING PRICE AND REDEMPTION PRICE PER SHARE - Class S ($185,841,646/ 23,706,621 shares) | $ | 7.84 | ||
|
| |||
NET ASSET VALUE, OFFERING PRICE AND REDEMPTION PRICE PER SHARE - Class I ($42,312,959/ 5,388,864 shares) | $ | 7.85 | ||
|
| |||
The accompanying notes are an integral part of the financial statements.
7
Focused Opportunities Series
Statement of Operations
For the Year Ended December 31, 2015
INVESTMENT INCOME: | ||||
Dividends (net of foreign taxes withheld, $13,538) | $ | 3,207,349 | ||
|
| |||
EXPENSES: | ||||
Management fees (Note 3) | 1,927,043 | |||
Shareholder services fees (Class S)(Note 3) | 442,728 | |||
Fund accounting and administration fees (Note 3) | 62,945 | |||
Transfer agent fees (Note 3) | 16,238 | |||
Directors’ fees (Note 3) | 10,575 | |||
Chief Compliance Officer service fees (Note 3) | 2,541 | |||
Custodian fees | 13,449 | |||
Miscellaneous | 166,997 | |||
|
| |||
Total Expenses | 2,642,516 | |||
Less reduction of expenses (Note 3) | (53,286 | ) | ||
|
| |||
Net Expenses | 2,589,230 | |||
|
| |||
NET INVESTMENT INCOME | 618,119 | |||
|
| |||
REALIZED AND UNREALIZED GAIN (LOSS) ON INVESTMENTS AND FOREIGN CURRENCY: | ||||
Net realized gain (loss) on- | ||||
Investments | (49,875,989 | ) | ||
Foreign currency and translation of other assets and liabilities | 765 | |||
|
| |||
| (49,875,224 | ) | |||
|
| |||
Net change in unrealized depreciation on investments | (14,624,917 | ) | ||
|
| |||
NET REALIZED AND UNREALIZED LOSS ON INVESTMENTS AND FOREIGN CURRENCY | (64,500,141 | ) | ||
|
| |||
NET DECREASE IN NET ASSETS RESULTING FROM OPERATIONS | $ | (63,882,022 | ) | |
|
| |||
The accompanying notes are an integral part of the financial statements.
8
Focused Opportunities Series
Statements of Changes in Net Assets
FOR THE YEAR ENDED | FOR THE YEAR ENDED | |||||||
INCREASE (DECREASE) IN NET ASSETS: | ||||||||
OPERATIONS: | ||||||||
Net investment income | $ | 618,119 | $ | 2,083,448 | ||||
Net realized gain (loss) on investments and foreign currency | (49,875,224 | ) | 21,283,534 | |||||
Net change in unrealized appreciation (depreciation) on investments and foreign currency | (14,624,917 | ) | 10,260,619 | |||||
|
|
|
| |||||
Net increase (decrease) from operations | (63,882,022 | ) | 33,627,601 | |||||
|
|
|
| |||||
DISTRIBUTIONS TO SHAREHOLDERS (Note 8): | ||||||||
From net investment income (Class S) | — | (1,727,793 | ) | |||||
From net investment income (Class I) | — | (533,842 | ) | |||||
From net realized gain on investments (Class S) | (1,442,984 | ) | (16,346,540 | ) | ||||
From net realized gain on investments (Class I) | (348,209 | ) | (4,027,927 | ) | ||||
|
|
|
| |||||
Total distributions to shareholders | (1,791,193 | ) | (22,636,102 | ) | ||||
|
|
|
| |||||
CAPITAL STOCK ISSUED AND REPURCHASED: | ||||||||
Net increase (decrease) from capital share transactions (Note 5) | (10,927,602 | ) | 293,263,923 | |||||
|
|
|
| |||||
Net increase (decrease) in net assets | (76,600,817 | ) | 304,255,422 | |||||
NET ASSETS: | ||||||||
Beginning of year | 304,755,422 | 500,000 | ||||||
|
|
|
| |||||
End of year (including undistributed net investment income of $606,072 and $0, respectively) | $ | 228,154,605 | $ | 304,755,422 | ||||
|
|
|
| |||||
* Commencement of operations was December 31, 2013.
The accompanying notes are an integral part of the financial statements.
9
Focused Opportunities Series
Financial Highlights - Class S
| FOR THE YEARS ENDED | ||||||||
| 12/31/15 | 12/31/14* | |||||||
Per share data (for a share outstanding throughout each year): | ||||||||
Net asset value - Beginning of year | $ | 10.03 | $ | 10.00 | ||||
|
|
|
| |||||
Income from investment operations: | ||||||||
Net investment income1 | 0.02 | 0.082 | ||||||
Net realized and unrealized gain (loss) on investments | (2.15 | ) | 0.76 | |||||
|
|
|
| |||||
Total from investment operations | (2.13 | ) | 0.84 | |||||
|
|
|
| |||||
Less distributions to shareholders: | ||||||||
From net investment income | — | (0.08 | ) | |||||
From net realized gain on investments | (0.06 | ) | (0.73 | ) | ||||
|
|
|
| |||||
Total distributions to shareholders | (0.06 | ) | (0.81 | ) | ||||
|
|
|
| |||||
Net asset value - End of year | $ | 7.84 | $ | 10.03 | ||||
|
|
|
| |||||
Net assets - End of year (000’s omitted) | $ | 185,842 | $ | 244,388 | ||||
|
|
|
| |||||
Total return3 | (21.27 | %) | 8.86 | % | ||||
Ratios (to average net assets)/Supplemental Data: | ||||||||
Expenses** | 0.98 | % | 0.96 | % | ||||
Net investment income | 0.19 | % | 0.73 | %2 | ||||
Portfolio turnover | 97 | % | 75 | % | ||||
| **The investment advisor did not impose all or a portion of its management and/or other fees, and in some periods may have paid a portion of the Series’ expenses. If these expenses had been incurred by the Series, the expense ratio (to average net assets) would have increased by the following amount: | ||||||||
| 0.02 | % | N/A | ||||||
*Commencement of operations was December 31, 2013.
1Calculated based on average shares outstanding during the years.
2Reflects a special dividend paid out during the period by one of the Series’ holdings. Had the Series not received the special dividend, the net investment income per share would have been $0.03 and the net investment income ratio would have been 0.27%.
3Represents aggregate total return for the years indicated, and assumes reinvestment of all distributions. Total return would have been lower had certain expenses not been waived or reimbursed during certain years.
The accompanying notes are an integral part of the financial statements.
10
Focused Opportunities Series
Financial Highlights - Class I
| FOR THE YEARS ENDED | ||||||||
| 12/31/15 | 12/31/14* | |||||||
Per share data (for a share outstanding throughout each year): | ||||||||
Net asset value - Beginning of year | $ | 10.03 | $ | 10.00 | ||||
|
|
|
| |||||
Income from investment operations: | ||||||||
Net investment income1 | 0.03 | 0.092 | ||||||
Net realized and unrealized gain (loss) on investments | (2.15 | ) | 0.77 | |||||
|
|
|
| |||||
Total from investment operations | (2.12 | ) | 0.86 | |||||
|
|
|
| |||||
Less distributions to shareholders: | ||||||||
From net investment income | — | (0.10 | ) | |||||
From net realized gain on investments | (0.06 | ) | (0.73 | ) | ||||
|
|
|
| |||||
Total distributions to shareholders | (0.06 | ) | (0.83 | ) | ||||
|
|
|
| |||||
Net asset value - End of year | $ | 7.85 | $ | 10.03 | ||||
|
|
|
| |||||
Net assets - End of year (000’s omitted) | $ | 42,313 | $ | 60,367 | ||||
|
|
|
| |||||
Total return3 | (21.17 | %) | 9.07 | % | ||||
Ratios (to average net assets)/Supplemental Data: | ||||||||
Expenses** | 0.78 | % | 0.80 | % | ||||
Net investment income | 0.38 | % | 0.90 | %2 | ||||
Portfolio turnover | 97 | % | 75 | % | ||||
| **The investment advisor did not impose all or a portion of its management and/or other fees, and in some periods may have paid a portion of the Series’ expenses. If these expenses had been incurred by the Series, the expense ratio (to average net assets) would have increased by the following amount: | ||||||||
| 0.02 | % | N/A | ||||||
*Commencement of operations was December 31, 2013.
1Calculated based on average shares outstanding during the years.
2Reflects a special dividend paid out during the period by one of the Series’ holdings. Had the Series not received the special dividend, the net investment income per share would have been $0.05 and the net investment income ratio would have been 0.43%.
3Represents aggregate total return for the years indicated, and assumes reinvestment of all distributions. Total return would have been lower had certain expenses not been waived or reimbursed during certain years.
The accompanying notes are an integral part of the financial statements.
11
Focused Opportunities Series
Notes to Financial Statements
| 1. | Organization |
Focused Opportunities Series (the “Series”) is a no-load diversified series of Manning & Napier Fund, Inc. (the “Fund”). The Fund is organized in Maryland and is registered under the Investment Company Act of 1940, as amended, as an open-end management investment company.
The Series’ investment objective is to provide long-term capital appreciation.
The Board of Directors (the “Board”) approved the liquidation of the Series, which is expected to occur once the Series is able to sell its securities in an orderly fashion. Effective December 12, 2015, the Series was closed to any new investors and to additional investments from existing discretionary investment clients of Manning & Napier Advisors, LLC and its affiliates. Effective December 22, 2015, the Series stopped selling shares to existing shareholders and no longer accepted automatic investments from existing shareholders. The Series was liquidated on January 25, 2016.
The Fund’s advisor is Manning & Napier Advisors, LLC (the “Advisor”). Shares of the Series are offered to investors, clients and employees of the Advisor and its affiliates. The Series is authorized to issue two classes of shares (Class S and Class I). Each class of shares is substantially the same, except that Class S shares bear shareholder services fees. The total authorized capital stock of the Fund consists of 15 billion shares of common stock each having a par value of $0.01. As of December 31, 2015, 10.7 billion shares have been designated in total among 41 series, of which 100 million have been designated as Focused Opportunities Series Class S common stock, and 100 million have been designated as Focused Opportunities Series Class I common stock.
| 2. | Significant Accounting Policies |
The following is a summary of significant accounting policies followed by the Series. The Series is an investment company and, accordingly, follows the investment company accounting and reporting guidance of the Financial Accounting Standards Board Accounting Standards Codification Topic 946 - Investment Companies, which is part of accounting principles generally accepted in the United States of America (“GAAP”).
Security Valuation
Portfolio securities, including domestic equities, foreign equities, warrants and options, listed on an exchange other than the NASDAQ Stock Market are valued at the latest quoted sales price of the exchange on which the security is primarily traded. Securities not traded on valuation date or securities not listed on an exchange are valued at the latest quoted bid price provided by the Fund’s pricing service. Securities listed on the NASDAQ Stock Market are valued in accordance with the NASDAQ Official Closing Price.
Short-term investments that mature in sixty days or less may be valued at amortized cost, which approximates fair value. Investments in open-end investment companies are valued at their net asset value per share on valuation date.
Volume and level of activity in established markets for an asset or liability are evaluated to determine whether recent transactions and quoted prices are determinative of fair value. Where there have been significant decreases in volume and level of activity, further analysis and adjustment may be necessary to estimate fair value. The Series measures fair value in these instances by the use of inputs and valuation techniques which may be based upon current market prices of securities that are comparable in coupon, rating, maturity and industry and/or expectation of future cash flows. As a result of trading in relatively thin markets and/or markets that experience significant volatility, the prices used by the Series to value these securities may differ from the value that would be realized if these securities were sold, and the differences could be material.
Securities for which representative valuations or prices are not available from the Series’ pricing service may be valued at fair value as determined in good faith by the Advisor under procedures approved by and under the general supervision and responsibility of the Fund’s Board of Directors (the “Board”). Due to the inherent uncertainty of valuations of such securities, the fair value may differ significantly from the values that would have been used had a ready market for such securities existed. If trading or events occurring after the close of the principal market in which securities are traded are expected to materially affect the value of those securities, then they may be valued at their fair value, taking this trading or these events into account. In
12
Focused Opportunities Series
Notes to Financial Statements (continued)
| 2. | Significant Accounting Policies (continued) |
Security Valuation (continued)
accordance with the procedures approved by the Board, the values of certain securities trading outside the U.S. were adjusted following the close of local trading using a factor from a third party vendor. The third party vendor uses statistical analyses and quantitative models, which consider among other things subsequent movement and changes in the prices of indices, securities and exchange rates in other markets, to determine the factors which are used to adjust local market prices. The value of securities used for net asset value calculation under these procedures may differ from published prices for the same securities. It is the Fund’s policy to classify each foreign equity security where a factor from a third party vendor is provided as a Level 2 security.
Various inputs are used in determining the value of the Series’ assets or liabilities carried at fair value. These inputs are summarized in three broad levels. Level 1 includes quoted prices in active markets for identical assets and liabilities. Level 2 includes other significant observable inputs (including quoted prices for similar securities, interest rates, prepayment speeds, credit risk, etc.). Level 3 includes significant unobservable inputs (including the Series’ own assumptions in determining the fair value of investments). A financial instrument’s level within the fair value hierarchy is based on the lowest level of any input both individually and in aggregate that is significant to the fair value measurement. The inputs or methodology used for valuing securities are not necessarily an indication of the risk associated with investing in those securities.
The following is a summary of the valuation levels used for major security types as of December 31, 2015 in valuing the Series’ assets or liabilities carried at fair value:
| DESCRIPTION | TOTAL | LEVEL 1 | LEVEL 2 | LEVEL 3 | ||||||||||||
Assets: | ||||||||||||||||
Equity securities: | ||||||||||||||||
Consumer Discretionary | $ | 5,854,006 | $ | 5,854,006 | $ | — | $ | — | ||||||||
Industrials | 8,714,990 | 8,714,990 | — | — | ||||||||||||
Information Technology | 508,655 | 508,655 | — | — | ||||||||||||
Telecommunication Services | 4,729,948 | 4,729,948 | — | — | ||||||||||||
Mutual fund | 186,682,768 | 186,682,768 | — | — | ||||||||||||
|
|
|
|
|
|
|
| |||||||||
Total assets | $ | 206,490,367 | $ | 206,490,367 | $ | — | $ | — | ||||||||
|
|
|
|
|
|
|
| |||||||||
There were no Level 3 securities held by the Series as of December 31, 2014 or December 31, 2015.
The Fund’s policy is to recognize transfers in and transfers out of the valuation levels as of the beginning of the reporting period. There were no transfers between Level 1 and Level 2 during the year ended December 31, 2015.
Security Transactions, Investment Income and Expenses
Security transactions are accounted for on trade date. Dividend income is recorded on the ex-dividend date, except that if the ex-dividend date has passed, certain dividends from foreign securities are recorded as soon as the Series is informed of the ex-dividend date. Non-cash dividends, if any, are recorded at the fair value of the securities received. Interest income, including amortization of premium and accretion of discounts using the effective interest method, is earned from settlement date and accrued daily.
Expenses are recorded on an accrual basis. Most expenses of the Fund can be attributed to a specific series. Expenses which cannot be directly attributed are apportioned among the series in the Fund in such a manner as deemed equitable by the Fund’s Board, taking into consideration, among other things, the nature and type of expense. Income, expenses (other than shareholder services fees), and realized and unrealized gains and losses are prorated among the classes based on the relative net assets of each class. Class specific expenses are directly charged to that class.
The Series uses the identified cost method for determining realized gain or loss on investments for both financial statement and federal income tax reporting purposes.
13
Focused Opportunities Series
Notes to Financial Statements (continued)
| 2. | Significant Accounting Policies (continued) |
Affiliated Companies
The 1940 Act defines “affiliated companies” to include securities in which a series owns 5% or more of the outstanding voting securities of the issuer. The following transactions were effected in securities of affiliated companies for the year ended December 31, 2015:
| NAME OF ISSUER | VALUE AT 12/31/14 | PURCHASE COST | SALES PROCEEDS | VALUE AT 12/31/15 | SHARES HELD AT 12/31/15 | DIVIDEND INCOME 1/1/15 THROUGH 12/31/15 | NET REALIZED GAIN (LOSS) 1/1/15 THROUGH 12/31/15 | |||||||||||||||||||||
Republic Airways Holdings, Inc.* | $ | 15,185,710 | $ | 14,774,810 | $ | 6,808,501 | $ | 7,496,322 | 1,907,461 | $ | — | $ | (10,142,876 | ) | ||||||||||||||
*Security was an affiliated company for the period August 7, 2015 to September 22, 2015 and then from November 16, 2015 to December 21, 2015. Amounts in the table include the entire year ended December 31, 2015.
Federal Taxes
The Series’ policy is to comply with the provisions of the Internal Revenue Code applicable to regulated investment companies. The Series is not subject to federal income tax or excise tax to the extent that the Series distributes to shareholders each year its taxable income, including any net realized gains on investments, in accordance with requirements of the Internal Revenue Code. Accordingly, no provision for federal income tax or excise tax has been made in the financial statements.
Management evaluates its tax positions to determine if the tax positions taken meet the minimum recognition threshold in connection with accounting for uncertainties in income tax positions taken or expected to be taken for the purposes of measuring and recognizing tax liabilities in the financial statements. Recognition of tax benefits of an uncertain tax position is required only when the position is “more likely than not” to be sustained assuming examination by taxing authorities. At December 31, 2015, the Series has recorded no liability for net unrecognized tax benefits relating to uncertain income tax positions taken or expected to be taken in future tax returns.
The Series files income tax returns in the U.S. federal jurisdiction, various states and foreign jurisdictions, as required. No income tax returns are currently under investigation. The statute of limitations on the Series’ tax returns remains open for the period ended December 31, 2013 and the years ended December 31, 2014 and December 31, 2015. The Series is not aware of any tax positions for which it is reasonably possible that the total amounts of unrecognized tax benefits will significantly change in the next twelve months.
Foreign Taxes
Based on the Series’ understanding of the tax rules and rates related to income, gains and currency purchase/repatriation transactions for foreign jurisdictions in which it invests, the Series will provide for foreign taxes, and where appropriate, deferred foreign tax.
Distributions of Income and Gains
Distributions to shareholders of net investment income and net realized gains are made annually. An additional distribution may be necessary to avoid taxation of the Series. Distributions are recorded on the ex-dividend date.
Indemnifications
The Fund’s organizational documents provide former and current directors and officers with a limited indemnification against liabilities arising in connection with the performance of their duties to the Fund. In the normal course of business, the Fund may also enter into contracts that provide general indemnifications. The Fund’s maximum exposure under these arrangements is unknown as this would be dependent on future claims that may be made against the Fund. The risk of material loss from such claims is considered remote.
Other
The preparation of financial statements in conformity with GAAP requires management to make estimates and assumptions that affect the reported amounts of assets and liabilities and the disclosure of contingent assets and liabilities at the date of the
14
Focused Opportunities Series
Notes to Financial Statements (continued)
| 2. | Significant Accounting Policies (continued) |
Other (continued)
financial statements and the reported amounts of income and expenses during the reporting period. Actual results could differ from those estimates.
| 3. | Transactions with Affiliates |
The Fund has an Investment Advisory Agreement (the “Agreement”) with the Advisor for which the Series pays a fee, computed daily and payable monthly, at an annual rate of 0.70% of the Series’ average daily net assets.
Under the Agreement, personnel of the Advisor provide the Series with advice and assistance in the choice of investments and the execution of securities transactions, and otherwise maintain the Series’ organization. The Advisor also provides the Fund with necessary office space and fund administration and support services. The salaries of all officers of the Fund (except a percentage of the Fund’s Chief Compliance Officer’s salary, which is paid by the Fund), and of all Directors who are “affiliated persons” of the Fund, or of the Advisor, and all personnel of the Fund, or of the Advisor, performing services relating to research, statistical and investment activities, are paid by the Advisor. Each “non-affiliated” Director receives an annual stipend, which is allocated among all the active series of the Fund. In addition, these Directors also receive a fee per Board meeting attended plus a fee for each committee meeting attended and are reimbursed for travel and other out-of-pocket expenses incurred by them in connection with attending such meetings. The Fund also has an Audit Committee Chair, who receives an additional annual stipend for this role.
The Class S shares of the Series are subject to a shareholder services fee in accordance with a shareholder services plan adopted by the Fund’s Board. The shareholder services fee is intended to compensate financial intermediaries, including affiliates of the Fund, in connection with the provision of direct client service, personal services, maintenance of shareholder accounts and reporting services. For these services, Class S of the Series pays a fee, computed daily and payable monthly, at an annual rate of 0.20% of the average daily net assets of Class S. The Fund has a Shareholder Services Agreement with the Advisor, for which the Advisor receives the shareholder services fee as stated above.
The Advisor has contractually agreed, until at least April 30, 2016, to waive its fee and, if necessary, pay other operating expenses of the Series in order to maintain total direct annual fund operating expenses for the Series exclusive of each share class’ shareholder services fee, at no more than 0.80% of average daily net assets. In addition, effective December 22, 2015, the Advisor began waiving its management fees. Accordingly, under the contractual waiver and the voluntary waiver, the Advisor waived fees of $53,286 for the year ended December 31, 2015, which is included as a reduction of expenses on the Statement of Operations. The Advisor is not eligible to recoup any expenses that have been waived or reimbursed in prior years.
Manning & Napier Investor Services, Inc., a registered broker-dealer affiliate of the Advisor, acts as distributor for the Fund’s shares. The services of Manning & Napier Investor Services, Inc. are provided at no additional cost to the Series.
Pursuant to a master services agreement dated November 1, 2014, the Fund pays the Advisor an annual fee related to fund accounting and administration of 0.0085% on the first $25 billion of average daily net assets (excluding Target Series and Strategic Income Series); 0.0075% on the next $15 billion of average daily net assets (excluding Target Series and Strategic Income Series); and 0.0065% of the average daily net assets in excess of $40 billion (excluding Target Series and Strategic Income Series); plus a base fee of $30,400 per series. Transfer agent fees are charged to the Fund on a per account basis. Additionally, certain transaction and out-of-pocket expenses, including charges for reporting relating to the Fund’s compliance program, are charged. The Advisor has agreements with BNY Mellon Investment Servicing (U.S.) Inc. (“BNY”) under which BNY serves as sub-accountant services agent and sub-transfer agent.
15
Focused Opportunities Series
Notes to Financial Statements (continued)
| 3. | Transactions with Affiliates (continued) |
Expenses not directly attributable to a series are allocated based on each series’ relative net assets or number of accounts, depending on the expense.
| 4. | Purchases and Sales of Securities |
For the year ended December 31, 2015, purchases and sales of securities, other than U.S. Government securities and short-term securities, were $241,774,991 and $449,243,593, respectively. There were no purchases or sales of U.S. Government securities.
| 5. | Capital Stock Transactions |
Transactions in shares of Class S and Class I of Focused Opportunities Series were:
| CLASS S: | FOR THE YEAR ENDED 12/31/15 | FOR THE YEAR ENDED 12/31/14* | ||||||||||||||
| SHARES | AMOUNT | SHARES | AMOUNT | |||||||||||||
Sold | 2,077,040 | $ | 19,154,214 | 24,938,373 | $ | 243,255,184 | ||||||||||
Reinvested | 170,833 | 1,425,398 | 1,889,989 | 17,784,799 | ||||||||||||
Repurchased | (2,901,836 | ) | (26,145,316 | ) | (2,492,778 | ) | (26,102,926 | ) | ||||||||
|
|
|
|
|
|
|
| |||||||||
Total | (653,963 | ) | $ | (5,565,704 | ) | 24,335,584 | $ | 234,937,057 | ||||||||
|
|
|
|
|
|
|
| |||||||||
| CLASS I: | FOR THE YEAR ENDED 12/31/15 | FOR THE YEAR ENDED 12/31/14* | ||||||||||||||
| SHARES | AMOUNT | SHARES | AMOUNT | |||||||||||||
Sold | 445,585 | $ | 4,045,483 | 5,926,576 | $ | 58,130,793 | ||||||||||
Reinvested | 40,988 | 342,654 | 476,683 | 4,485,588 | ||||||||||||
Repurchased | (1,117,919 | ) | (9,750,035 | ) | (408,049 | ) | (4,289,515 | ) | ||||||||
|
|
|
|
|
|
|
| |||||||||
Total | (631,346 | ) | $ | (5,361,898 | ) | 5,995,210 | $ | 58,326,866 | ||||||||
|
|
|
|
|
|
|
| |||||||||
* Commencement of operations was December 31, 2013.
Over 90% of the shares outstanding are held by fiduciary accounts where the Advisor has sole investment discretion.
| 6. | Financial Instruments |
The Series may trade in instruments including written and purchased options, forward foreign currency exchange contracts and futures contracts and other derivatives in the normal course of investing activities to assist in managing exposure to various market risks. The Series may be subject to various elements of risk, which may involve, to a varying degree, elements of risk in excess of the amounts recognized for financial statement purposes. These risks include: the risk that changes in the value of a derivative may not correlate perfectly with the underlying asset, rate or index; counterparty credit risk related to over the counter derivative counterparties’ failure to perform under contract terms; liquidity risk related to the lack of a liquid market for these contracts allowing the fund to close out its position(s); and documentation risk relating to disagreement over contract terms. No such investments were held by the Series as of December 31, 2015.
| 7. | Foreign Securities |
Investing in securities of foreign companies and foreign governments involves special risks and considerations not typically associated with investing in securities of domestic companies and the U.S. Government. These risks include revaluation of currencies and future adverse political and economic developments. Moreover, securities of foreign companies and foreign governments and their markets may be less liquid and their prices more volatile than those of comparable domestic companies and the U.S. Government.
16
Focused Opportunities Series
Notes to Financial Statements (continued)
| 8. | Federal Income Tax Information |
The amount and characterization of certain income and capital gains to be distributed are determined in accordance with federal income tax regulations, which may differ from GAAP. These differences are primarily due to differing book and tax treatments in the timing and/or treatment of the recognition of net investment income or gains and losses, including foreign currency gains and losses, losses deferred due to wash sales, real estate investment trusts, recognition of Realized Built in Losses and Equalization. The Series may periodically make reclassifications among its capital accounts to reflect income and gains available for distribution (or available capital loss carryovers) under income tax regulations without impacting the Series’ net asset value. For the fiscal year ended December 31, 2015, amounts were reclassified within the capital accounts to increase Accumulated Net Realized Gain on Investments by $14,414,923, decrease Undistributed Net Investment Income by $12,047 and decrease Additional Paid in Capital by $14,402,876. Any such reclassifications are not reflected in the financial highlights.
The tax character of distributions paid were as follows:
FOR THE YEAR ENDED 12/31/15 | FOR THE YEAR ENDED 12/31/14 | |||||||
Ordinary income | $ | 1,791,193 | $ | 22,636,102 | ||||
At December 31, 2015, the tax basis of components of distributable earnings and the net unrealized depreciation based on the identified cost of investments for federal income tax purposes were as follows:
Cost for federal income tax purposes | $ | 210,841,853 | ||
Unrealized appreciation | 178,038 | |||
Unrealized depreciation | (4,529,524 | ) | ||
|
| |||
Net unrealized depreciation | $ | (4,351,486 | ) | |
|
| |||
Capital loss carryforwards | $ | (38,656,418 | ) | |
Undistributed ordinary income | $ | 606,072 |
As of December 31, 2015, the Series had a net short-term capital loss carryforward of $22,211,431 and long-term capital loss carryforward of $16,444,987, which may be carried forward indefinitely.
| 9. | Subsequent Events |
As discussed in Note 1, the Board approved the liquidation of the Series, which occurred on January 25, 2016.
17
Focused Opportunities Series
Report of Independent Registered Public Accounting Firm
To the Board of Directors of Manning & Napier Fund, Inc. and Shareholders of Focused Opportunities Series:
In our opinion, the accompanying statement of assets and liabilities, including the investment portfolio, and the related statements of operations and of changes in net assets and the financial highlights present fairly, in all material respects, the financial position of Focused Opportunities Series (a series of Manning & Napier Fund, Inc., hereafter referred to as the “Series”) at December 31, 2015, the results of its operations for the year then ended, and the changes in its net assets and the financial highlights for the two years in the period then ended, in conformity with accounting principles generally accepted in the United States of America. These financial statements and financial highlights (hereafter referred to as “financial statements”) are the responsibility of the Series’ management. Our responsibility is to express an opinion on these financial statements based on our audit. We conducted our audit of these financial statements in accordance with the standards of the Public Company Accounting Oversight Board (United States). Those standards require that we plan and perform the audit to obtain reasonable assurance about whether the financial statements are free of material misstatement. An audit includes examining, on a test basis, evidence supporting the amounts and disclosures in the financial statements, assessing the accounting principles used and significant estimates made by management, and evaluating the overall financial statement presentation. We believe that our audits, which included confirmation of securities at December 31, 2015 by correspondence with the custodian and brokers, provide a reasonable basis for our opinion.
As disclosed in Note 1 to the financial statements, the Board of Directors of Manning & Napier Fund, Inc., approved the liquidation of Focused Opportunities Series. The Series was liquidated on January 25, 2016.

New York, New York
February 19, 2016
18
Focused Opportunities Series
Supplemental Tax Information
(unaudited)
All reportings are based on financial information available as of the date of this annual report and, accordingly are subject to change.
For federal income tax purposes, the Series reports for the current fiscal year $3,034,695 or, if different, the maximum amount allowable under the tax law as qualified dividend income.
For corporate shareholders, the percentage of investment income (dividend income plus short-term gain, if any) that qualifies for the dividends received deduction for the current fiscal year is 6.25%, or if different, the maximum allowable under tax law.
19
Focused Opportunities Series
Renewal of Investment Advisory Agreement
(unaudited)
At the Manning & Napier Fund, Inc. (the “Fund”) Board of Directors’ (the “Board”) meeting, held on November 17, 2015, the Investment Advisory Agreement (the “Agreement”) between the Fund and Manning & Napier Advisors, LLC (the “Advisor”) was considered by the Board for renewal. In connection with the decision whether to renew the Agreement, a variety of material was prepared for and considered by the Board.
Representatives of the Advisor attended the meeting and presented additional oral and written information to the Board to assist the Board in its considerations. The discussion immediately below outlines the materials and information presented to the Board in connection with the Board’s 2015 Annual consideration of the Agreement and the conclusions made by the Directors when determining to continue the Agreement.
| • | The Board considered the services provided by the Advisor under the Agreement including, among others: deciding what securities to purchase and sell for each Series; arranging for the purchase and sale of such securities by placing orders with broker-dealers; administering the affairs of the Fund (including the books and records of the Fund not maintained by third party service providers such as the custodian or sub-transfer agent); arranging for the insurance coverage for the Fund; and supervising the preparation of tax returns, SEC filings (including registration statements) and reports to shareholders for the Fund. The Board also considered the nature and quality of such services provided under the Agreement in light of the Advisor’s services provided to the Fund for 29 years. The Board discussed the quality of these services with representatives from the Advisor and concluded that the Advisor was performing its services to the Fund required under the Agreement in a reasonable manner. |
| • | The Board considered the performance of each Series since its inception, as well as performance over multiple time periods. Performance for one or more of the following time periods was considered as applicable to the Series’ inception date: inception, three year, five year, ten year, and current market cycle. A market cycle includes periods of both rising and falling markets. Returns for established benchmark indices for each Series were provided. In addition, the Board considered a number of other factors relevant to performance at the meeting (and considers on a quarterly basis) including: a peer group performance analysis consisting of Morningstar universes of mutual funds with similar investment objectives, investment performance of core products, product offerings, performance on an aggregate basis vs. performance over reasonable time periods and the Advisor’s investment process. The Directors acknowledged the challenging performance and discussed the investment process of the Advisor. The Directors confirmed that qualitative factors such as the Advisor’s investment process, including recent enhancements, were an important subset to be considered as part of their consideration of performance. The Board discussed the performance with representatives from the Advisor and concluded that the investment performance of each of the Fund’s Series was reasonable based on the Series’ actual performance and comparative performance, especially for those series with performance over the current market cycle. |
| • | The Board considered the costs of the Advisor’s services and the profits of the Advisor as they relate to the Advisor’s services to the Fund under the Agreement. In reviewing the Advisor’s costs and profits, the Board discussed the Advisor’s revenues generated from the Fund (on both an actual and adjusted basis) and its expenses associated with providing the services under the Agreement. In addition, the Board reviewed the Advisor’s expenses associated with Fund activities outside of the Agreement (such as expense reimbursements pursuant to expense caps and payments made by the Advisor to third party platforms on which shares of the Fund are available for purchase). It was noted by representatives of the Advisor that 22 of the 36 active Series of the Fund are currently experiencing expenses above the capped expense ratios, and thus the Advisor is incurring those expenses over the cap. After discussing the above costs and profits, the Board concluded that the Advisor’s profitability relating to its services provided under the Agreement was reasonable. |
| • | The Board considered the fees and expenses of the various Series of the Fund. The Advisor presented the advisory fees and total expenses for each Series, including the advisory fee adjusted for any expense waivers or reimbursements (either contractual or voluntary) paid by the Advisor. The advisory fees and expense ratios of each Series were compared to an average (on both a mean and median basis) of similar funds as disclosed on the Morningstar database. Representatives of the Advisor discussed with the Board the levels of its advisory fee for each Series of the Fund and as compared to the median and mean advisory fees for similar funds as listed on Morningstar. Expense ratios for every Series, except the Tax Managed Series, Equity Income Class S, High Yield Bond Class S, Pro-Blend Series Classes C and R, and Target Series’ Classes R and K, are lower than, or substantially similar to the Morningstar mean and median reported total expense ratio. |
20
Focused Opportunities Series
Renewal of Investment Advisory Agreement
(unaudited)
The higher than mean and median total expense ratios for Classes C and R reflect higher distribution, marketing and shareholder service fees payable to broker-dealers through a 100bp 12b-1 fee for Class C and a 50bp 12b-1 fee for Class R. Based on their review of the information provided, the Board concluded that the fees and expenses of each Series of the Fund were reasonable on a comparative basis. |
| • | The Board also considered the other benefits the Advisor derives from its relationship with the Fund. Such other benefits include certain research services provided by soft dollars. The Board reviewed the broker-dealers who provided research to the Advisor and the products and services paid for, in whole or in part, using soft dollar commissions. Given the level of soft dollar transactions involving the Fund, the Board concluded that these additional benefits to the Advisor were reasonable. |
| • | In addition to the factors described above, the Board considered the Advisor’s personnel, investment strategies, policies and procedures relating to compliance with personal securities transactions, reputation, expertise and resources in domestic and foreign financial markets. The Board concluded that these factors support the conclusion that the Advisor performs its services in a reasonable manner. |
| • | The Board then considered economies of scale and concluded that the current fee schedule to the advisory agreement remained reasonable given the multiple uses of the Fund (for the Advisor’s discretionary investment account clients in addition to direct investors), the current profitability of the Advisor’s services to the Fund under the Agreement, the number of newly established series of the Fund and the overall size of the Fund complex. |
Based on the Board’s deliberations and their evaluation of the information described above, the Board, including a majority of Directors that are not “interested persons” as defined in the Investment Company Act of 1940, concluded that the compensation under the Agreement was fair and reasonable in light of the services and expenses and such other matters as the Directors considered to be relevant in the exercise of their reasonable judgment. Accordingly, the Board approved the renewal of the Agreement. In the course of their deliberations, the Directors did not identify any particular information that was all important or controlling.
21
Focused Opportunities Series
Directors’ and Officers’ Information
(unaudited)
The Statement of Additional Information provides additional information about the Fund’s directors and officers and can be obtained without charge by calling 1-800-466-3863, at www.manningnapieradvisors.com, or on the EDGAR Database on the SEC Internet web site (http:// www.sec.gov). The following chart shows certain information about the Fund’s officers and directors, including their principal occupations during the last five years. Unless specific dates are provided, the individuals have held the listed positions for longer than five years.
| Interested Director/Officer | ||
| Name: | James E. Mikolaichik* | |
| Address: | 290 Woodcliff Drive | |
| Fairport, NY 14450 | ||
| Age: | 44 | |
| Current Position(s) Held with Fund: | Principal Executive Officer, President, Chairman & Director | |
| Term of Office1 & Length of Time Served: | Indefinite - Chairman and Director since August 2015 | |
| Principal Occupation(s) During Past 5 Years: | Chief Financial Officer (since 2011) - Manning & Napier Advisors, LLC; Executive Vice President and Head of Strategy (2008-2011) and Chief Risk Officer (2004-2008) - Old Mutual Asset Management | |
| Holds or has held one or more of the following title for various subsidiaries and affiliates: Chief Financial Officer. | ||
| Number of Portfolios Overseen within Fund Complex: | 41 | |
| Other Directorships Held Outside Fund Complex: | N/A | |
| Independent Directors | ||
| Name: | Stephen B. Ashley | |
| Address: | 290 Woodcliff Drive | |
| Fairport, NY 14450 | ||
| Age: | 75 | |
| Current Position(s) Held with Fund: | Director, Audit Committee Member, Governance & Nominating Committee Member | |
| Term of Office & Length of Time Served: | Indefinite - Since 1996 | |
| Principal Occupation(s) During Past 5 Years: | Chairman, Director, President & Chief Executive Officer (1997 to present) - The Ashley Group (property management and investment); Director (1995-2008) and Chairman (non-executive) (2004-2008) - Fannie Mae (mortgage). | |
| Number of Portfolios Overseen within Fund Complex: | 41 | |
| Other Directorships Held Outside Fund Complex: | Fannie Mae (1995-2008) | |
| The Ashley Group (1995-2008) | ||
| Genesee Corporation (1987-2007) | ||
| Name: | Paul A. Brooke | |
| Address: | 290 Woodcliff Drive | |
| Fairport, NY 14450 | ||
| Age: | 70 | |
| Current Position(s) Held with Fund: | Director, Audit Committee Member, Governance & Nominating Committee Member | |
| Term of Office & Length of Time Served: | Indefinite - Since 2007 | |
| Principal Occupation(s) During Past 5 Years: | Chairman & CEO (2005-2009) - Ithaka Acquisition Corporation (investments); Chairman (2007-2009) Alsius Corporation (investments); | |
| Managing Member, PMSV Holdings LLC (investments) since 1991; | ||
| Managing Member, Venbio (investments) since 2010. | ||
| Number of Portfolios Overseen within Fund Complex: | 41 | |
| Other Directorships Held Outside Fund Complex: | Incyte Corp. (2000-present) | |
| ViroPharma, Inc. (2000-2014) | ||
| HLTH Corp (WebMD) (2000-2010) | ||
| Cheyne Capital International (2000-present) | ||
| GMP Companies (2000-2011) | ||
| Cytos Biotechnology Ltd. (2012-2014) | ||
22
Focused Opportunities Series
Directors’ and Officers’ Information
(unaudited)
| Independent Directors (continued) | ||
| Name: | Peter L. Faber | |
| Address: | 290 Woodcliff Drive | |
| Fairport, NY 14450 | ||
| Age: | 77 | |
| Current Position(s) Held with Fund: | Director, Governance & Nominating Committee Member | |
| Term of Office & Length of Time Served: | Indefinite - Since 1987 | |
| Principal Occupation(s) During Past 5 Years: | Senior Counsel (2006-2012), Partner (1995-2006 & 2013-present) - McDermott, Will & Emery LLP (law firm) | |
| Number of Portfolios Overseen within Fund Complex: | 41 | |
| Other Directorships Held Outside Fund Complex: | Boston Early Music Festival (non-profit) (2007-present) | |
| Amherst Early Music, Inc. (non-profit) (2009-present) | ||
| Gotham Early Music Scene, Inc. (non-profit) (2009-present) | ||
| Partnership for New York City, Inc. (non-profit) (1989-2010) | ||
| New York Collegium (non-profit) (2004-2011) | ||
| Name: | Harris H. Rusitzky | |
| Address: | 290 Woodcliff Drive | |
| Fairport, NY 14450 | ||
| Age: | 80 | |
| Current Position(s) Held with Fund: | Director, Audit Committee Member, Governance & Nominating Committee Member | |
| Term of Office & Length of Time Served: | Indefinite - Since 1985 | |
| Principal Occupation(s) During Past 5 Years: | President, The Greening Group (business consultants) since 1994; | |
| Partner, The Restaurant Group (restaurants) since 2006 | ||
| Number of Portfolios Overseen within Fund Complex: | 41 | |
| Other Directorships Held Outside Fund Complex: | Rochester Institute of Technology (university) (1972-present) | |
| Culinary Institute of America (non-profit college) (1985-present) | ||
| George Eastman House (museum) (1988-present) | ||
| National Restaurant Association (restaurant trade organization)(1978- present) | ||
| Name: | Chester N. Watson | |
| Address: | 290 Woodcliff Drive | |
| Fairport, NY 14450 | ||
| Age: | 65 | |
| Current Position(s) Held with Fund: | Director, Audit Committee Chairman, Governance & Nominating Committee Member | |
| Term of Office & Length of Time Served: | Indefinite - Since 2012 | |
| Principal Occupation(s) During Past 5 Years: | General Auditor (2003-2011) - General Motors Company (auto manufacturer) | |
| Number of Portfolios Overseen within Fund Complex: | 41 | |
| Other Directorships Held Outside Fund Complex: | Rochester Institute of Technology (university) (2005-present) | |
Officers | ||
| Name: | Jeffrey S. Coons, Ph.D., CFA | |
| Address: | 290 Woodcliff Drive | |
| Fairport, NY 14450 | ||
| Age: | 52 | |
| Current Position(s) Held with Fund: | Vice President | |
| Term of Office1 & Length of Time Served: | Since 2004 | |
| Principal Occupation(s) During Past 5 Years: | President since 2010, Co-Director of Research (2002-2015) - Manning & Napier Advisors, LLC | |
| Holds one or more of the following titles for various subsidiaries and affiliates: President, Director, Treasurer or Senior Trust Officer. | ||
| Number of Portfolios Overseen within Fund Complex: | 41 | |
| Other Directorships Held Outside Fund Complex: | N/A | |
23
Focused Opportunities Series
Directors’ and Officers’ Information
(unaudited)
| Officers (continued) | ||
| Name: | Elizabeth Craig | |
| Address: | 290 Woodcliff Drive | |
| Fairport, NY 14450 | ||
| Age: | 28 | |
| Current Position(s) Held with Fund: | Assistant Corporate Secretary | |
| Term of Office1 & Length of Time Served: | Since 2011 | |
| Principal Occupation(s) During Past 5 Years: | Fund Administration Manager since 2015; Mutual Fund Compliance Specialist (2009-2015) – Manning & Napier Advisors, LLC | |
| Number of Portfolios Overseen within Fund Complex: | 41 | |
| Other Directorships Held Outside Fund Complex: | N/A | |
| Name: | Christine Glavin | |
| Address: | 290 Woodcliff Drive | |
| Fairport, NY 14450 | ||
| Age: | 49 | |
| Current Position(s) Held with Fund: | Principal Financial Officer, Chief Financial Officer | |
| Term of Office1 & Length of Time Served: | Principal Financial Officer since 2002; Chief Financial Officer since 2001 | |
| Principal Occupation(s) During Past 5 Years: | Director of Fund Reporting since 2011; Fund Reporting Manager (1997-2011) - Manning & Napier Advisors, LLC; Assistant Treasurer since 2008 - Exeter Trust Company | |
| Number of Portfolios Overseen within Fund Complex: | 41 | |
| Other Directorships Held Outside Fund Complex: | N/A | |
| Name: | Jodi L. Hedberg | |
| Address: | 290 Woodcliff Drive | |
| Fairport, NY 14450 | ||
| Age: | 48 | |
| Current Position(s) Held with Fund: | Corporate Secretary, Chief Compliance Officer, Anti-Money Laundering Compliance Officer | |
| Term of Office1 & Length of Time Served: | Corporate Secretary since 1997; Chief Compliance Officer since 2004; | |
| Anti-Money Laundering Compliance Officer since 2002 | ||
| Principal Occupation(s) During Past 5 Years: | Director of Compliance since 2005; Compliance Manager (1995-2005) - Manning & Napier Advisors, LLC and affiliates; Corporate Secretary - Manning & Napier Investor Services, Inc. since 2006 | |
| Number of Portfolios Overseen within Fund Complex: | 41 | |
| Other Directorships Held Outside Fund Complex: | N/A | |
| Name: | Richard Yates | |
| Address: | 290 Woodcliff Drive | |
| Fairport, NY 14450 | ||
| Age: | 50 | |
| Current Position(s) Held with Fund: | Chief Legal Officer | |
| Term of Office1 & Length of Time Served: | Chief Legal Officer since 2004 | |
| Principal Occupation(s) During Past 5 Years: | Counsel - Manning & Napier Advisors, LLC and affiliates since 2000; Holds one or more of the following titles for various affiliates; Director or Corporate Secretary | |
| Number of Portfolios Overseen within Fund Complex: | 41 | |
| Other Directorships Held Outside Fund Complex: | N/A | |
*Interested Director, within the meaning of the Investment Company Act of 1940 by reason of his position with the Fund’s investment advisor and distributor. Mr. Mikolaichik serves as the Chief Financial Officer for Manning & Napier Advisors, LLC.
1The term of office of all officers shall be one year and until their respective successors are chosen and qualified, or his or her earlier resignation or removal as provided in the Fund’s By-Laws.
24
Focused Opportunities Series
Results of Special Meeting of Shareholders
(unaudited)
A Special Meeting of the Shareholders of the Fund was held on August 18, 2015. The number of votes necessary to conduct the meeting and approve the proposal was obtained, and the results of the vote of shareholders of all the Series of the Fund voting together in the aggregate is listed below:
PROPOSAL 1:
Election of Directors
| NUMBER OF SHARES VOTED FOR | NUMBER OF SHARES WITHELD | |||||||
Stephen B. Ashley | 883,968,395 | 8,618,094 | ||||||
Paul A. Brooke | 884,510,661 | 8,075,828 | ||||||
Peter L. Faber | 884,140,893 | 8,445,596 | ||||||
James E. Mikolaichik | 883,391,832 | 9,194,657 | ||||||
Harris H. Rusitzky | 620,022,215 | 272,564,274 | ||||||
Chester N. Watson | 884,638,809 | 7,947,680 | ||||||
25
Focused Opportunities Series
Literature Requests
(unaudited)
Proxy Voting Policies and Procedures
A description of the policies and procedures that the Fund uses to determine how to vote proxies relating to portfolio securities is available, without charge, upon request:
| By phone | 1-800-466-3863 | |||
| On the Securities and Exchange | ||||
| Commission’s (SEC) web site | http://www.sec.gov |
Proxy Voting Record
Information regarding how the Fund voted proxies relating to portfolio securities during the most recent 12-month period ended June 30th is available, without charge, upon request:
| By phone | 1-800-466-3863 | |||
| On the SEC’s web site | http://www.sec.gov |
Quarterly Portfolio Holdings
The Series’ complete schedule of portfolio holdings for the 1st and 3rd quarters of each fiscal year are provided on Form N-Q, and are available, without charge, upon request:
| By phone | 1-800-466-3863 | |||
| On the SEC’s web site | http://www.sec.gov |
The Series’ Form N-Q may be reviewed and copied at the SEC’s Public Reference Room in Washington, D.C. Information on the operation of the Public Reference Room may be obtained by calling 1-800-SEC-0330.
Prospectus and Statement of Additional Information (SAI)
For more information about any of the Manning & Napier Fund, Inc. Series, you may obtain a prospectus and SAI at www.manning-napier.com or by calling (800) 466-3863. Before investing, carefully consider the objectives, risks, charges and expenses of the investment and read the prospectus carefully as it contains this and other information about the investment company. In addition, this information can be found on the SEC’s web site, http://www.sec.gov.
Additional information available at www.manning-napier.com
1. Fund Holdings - Month-End
2. Fund Holdings - Quarter-End
3. Shareholder Report - Annual
4. Shareholder Report - Semi-Annual
The Fund also offers electronic notification or “e-delivery” when certain documents are available on-line to be downloaded or reviewed. Direct shareholders can elect to receive electronic notification when shareholder reports, prospectus updates, and/or statements are available. If you do not currently have on-line access to your account, you can establish access by going to www.manning-napier.com, click on “Login” in the top corner of the page, and follow the prompts to self-enroll. Once enrolled, you can set your electronic notification preferences by clicking on the Account Options tab located within the green toolbar and then select E-Delivery Option. Should you have any questions on either how to establish on-line access or how to update your account settings, please contact Investor Services at 1-800-466-3863.
The Manning & Napier Fund, Inc. is managed by Manning & Napier Advisors, LLC. Manning & Napier Investor Services, Inc., an affiliate of Manning & Napier Advisors, LLC, is the distributor of the Fund shares.
MNFOC-12/15-AR

Unconstrained Bond Series
Management Discussion and Analysis
(unaudited)
Dear Shareholders:
Volatility defined global financial markets during the past year, largely driven by macroeconomic factors. Renewed concerns about economic growth in emerging markets — China in particular — and uncertainty about the effects of that slowdown on overall global growth triggered market gyrations. Developed economies continued to provide accommodative monetary policy to combat growth concerns, although in December the U.S. Federal Reserve raised the federal funds rate for the first time in nearly a decade. For much of the year, Europe struggled with uncertainty regarding Greece’s ability to secure bailout funding from its creditors, which negatively affected investor sentiment. China’s economy slowed, but the government continued to demonstrate a willingness to provide support through a combination of policy-easing maneuvers and targeted stimulus measures. The U.S. economy remained on a path of slow growth that nevertheless made it the best performing developed economy. Looking ahead, we expect the slow global growth environment to remain in place for the foreseeable future.
As always, we appreciate your business.
Sincerely,
Manning & Napier Advisors, LLC
1
Unconstrained Bond Series
Fund Commentary
(unaudited)
Investment Objective
Primarily to provide long-term total return, with a secondary objective of providing preservation of capital. Under normal circumstances, at least 80% of the Series’ assets will be invested in bonds and other financial instruments with economic characteristics similar to bonds. Up to 50% of the Series may be invested in below investment-grade securities and up to 50% may be invested in non-U.S. dollar denominated securities, including securities issued by companies located in emerging markets. Derivatives such as futures, options, swaps, and forwards may be used to manage interest rate exposure, enhance duration management, or hedge currency exposure, for example.
Performance Commentary
Domestic fixed income markets generated modestly positive absolute returns in 2015, although performance across sectors was mixed. Municipal, mortgage-backed, and Treasury securities turned in positive performance for the year, whereas high yield and investment grade corporate bonds were negative. Meanwhile, performance across international fixed income markets was exceptionally challenging.
The Citigroup 3-Month T-Bill Index returned 0.03% during 2015. The Unconstrained Bond Series returned -0.88%, trailing the benchmark on a relative basis. Contributing to the relative performance shortfall during 2015 was the Series’ significant allocation to credit securities, corporate bonds in particular. The Series’ returns were negatively impacted by the increasing yield spread between credit securities and similar maturity Treasuries, as the Series has a modest duration but significant exposure to credit.
Regarding sector and quality characteristics, the Series is notably tilted toward corporate bonds and is significantly overweight that sector relative to the benchmark. This sector has been a primary focus area for us over the past few years, and we believe it remains an attractive option for many fixed income investors in 2016 as businesses continue to experience the benefits of a slowly improving U.S. economy. The majority of the Series’ holdings are considered investment-grade; however, approximately 35% of the portfolio is invested in high yield securities. With the backdrop of continued slow growth and relatively cheap credit valuations, we view the Series’ current overweight position as appropriate, but it is likely that we will look to reduce exposure to the corporate sector as we get later in the credit cycle. The Series also contains a meaningful allocation to securitized and non-U.S. credit. Regarding U.S. Treasuries, the Series is significantly underweight relative to the benchmark as we do not believe yields in that sector offer investors sufficient compensation for interest rate risk in the current environment.
We also continue to believe that interest rates do not adequately compensate investors to take on additional duration risk. Therefore, the Series retains a relatively modest duration. We would look to increase the Series’ duration through the purchase of longer maturity Treasuries or agencies if interest rates increase to more attractive levels.
During 2016 we expect the fixed income landscape to continue to shift as the Federal Reserve considers further changes to U.S. monetary policy. Having raised the federal funds rate, we believe they now will seek to remain flexible and proceed slowly with small increases that do not follow a well-defined schedule. The diverging monetary policies of major central banks, geopolitical risks, commodity price pressures, and the potential for global growth to deviate from expectations could cause volatility in financial markets. In light of the current environment, it is important that investors remain active, flexible, and selective in their approach in order to avoid overvalued and risky areas of the market, something Manning & Napier has done for over 45 years.
Performance data quoted represents past performance and does not guarantee future results. The investment return and principal value of an investment will fluctuate, so that an investor’s shares, when redeemed, may be worth more or less than their original cost. Current performance may be higher or lower than that quoted; investors can obtain the most recent month-end performance at www.manning-napier.com or by calling (800) 466-3863. Performance for the Unconstrained Bond Series Class S shares is provided above. Performance for the Class I shares will be higher based on the Class’ lower expenses.
2
Unconstrained Bond Series
Fund Commentary
(unaudited)
Performance Commentary (continued)
Please see the next page for additional performance information as of December 31, 2015.
Prior to 05/01/2015, the Unconstrained Bond Series was the Core Plus Bond Series, which had an investment objective of “providing long-term total return by investing primarily in fixed income securities” and did not use derivatives.
Duration is a measure of the expected life of a fixed income security that is used to determine the sensitivity of a security’s price to changes in interest rates. The prices of fixed income securities with shorter durations generally will be less affected by changes in interest rates than the prices of fixed income securities with longer durations. For example, a 10 year duration means the fixed income security will decrease in value by 10% if interest rates rise 1% and increase in value by 10% if interest rates fall 1%. There is an inverse relationship between bond prices and interest rates; as interest rates rise, bond prices (and therefore the value of bond funds) fall. Likewise, as interest rates fall, bond prices and the value of bond funds rise. Investments in higher-yielding, lower-rated securities involve additional risks, including a higher risk of default and loss of principal. Funds that invest in foreign countries may be subject to the risks of adverse changes in foreign economic, political, regulatory and other conditions as well as risks related to the use of different financial standards. Investments in emerging markets may be more volatile than investments in more developed markets.
Investments in derivatives can be highly volatile and involve risks in addition to the risks of the underlying instrument on which the derivative is based, such as counterparty, correlation and liquidity risk. Also, the use of leverage increases exposure to the market and may magnify potential losses.
3
Unconstrained Bond Series
Performance Update as of December 31, 2015
(unaudited)
AVERAGE ANNUAL TOTAL RETURNS AS OF DECEMBER 31, 2015 | ||||||||||||||||
ONE YEAR1 | FIVE YEAR | TEN YEAR | SINCE INCEPTION2 | |||||||||||||
Manning & Napier Fund, Inc. - Unconstrained Bond Series - Class S3 | -0.88 | % | 3.54 | % | 5.18 | % | 4.93 | % | ||||||||
Manning & Napier Fund, Inc. - Unconstrained Bond Series - Class I3,4 | -0.59 | % | 3.65 | % | 5.23 | % | 4.99 | % | ||||||||
Citigroup 3-Month T-Bill Index5,6 | 0.03 | % | 0.05 | % | 1.17 | % | 1.30 | % | ||||||||
Bank of America (BofA) Merrill Lynch U.S. Corporate, Government & Mortgage Index7 | 0.59 | % | 3.32 | % | 4.58 | % | 4.44 | % | ||||||||
The following graph compares the value of a $10,000 investment in the Manning & Napier Fund, Inc. - Unconstrained Bond Series - Class S for the ten years ended December 31, 2015 to the Bank of America (BofA) Merrill Lynch U.S. Corporate, Government & Mortgage Index and the Citigroup 3-Month T-Bill Index.
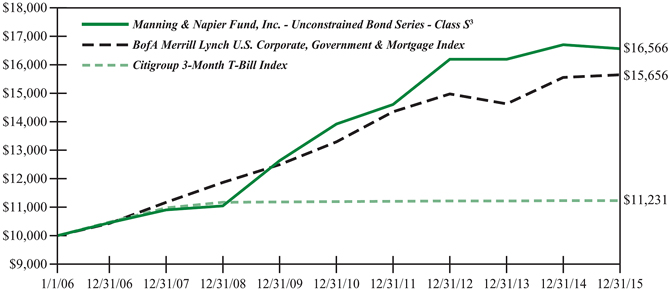
1The returns shown are based on net asset values calculated for shareholder transactions and may differ from the returns shown in the financial highlights, which reflect adjustments made to the net asset values in accordance with accounting principles generally accepted in the United States of America.
2Performance numbers for the Series and the Bank of America (BofA) Merrill Lynch U.S. Corporate, Government & Mortgage Index are calculated from April 21, 2005, the Class S inception date. The Citigroup 3-Month T-Bill Index performance numbers are calculated from April 30, 2005.
3The Series’ performance does not reflect the deduction of taxes that a shareholder would pay on fund distributions or the redemption of shares. The Series’ performance is historical and may not be indicative of future results. The performance returns shown are inclusive of the net expense ratio of the Series. For the year ended December 31, 2015, this net expense ratio was 0.75% for Class S and 0.50% for Class I. The gross expense ratio, which does not account for any voluntary or contractual waivers currently in effect, was 0.75% for Class S and 0.50% for Class I for the year ended December 31, 2015.
4For periods prior to the inception of Class I on August 1, 2013, the performance figures are hypothetical and reflect the performance of the Manning & Napier Fund, Inc. -Unconstrained Bond Series - Class S.
5The Series’ index has changed from the Bank of America Merrill Lynch U.S. Corporate, Government & Mortgage Index to the Citigroup 3-Month T-Bill Index in connection with a change in the Series’ investment goal and principal investment strategies.
4
Unconstrained Bond Series
Performance Update as of December 31, 2015
(unaudited)
6The Citigroup 3-Month Treasury Bill Index is an unmanaged index based on 3-Month U.S. treasury bills. The Index measures the monthly return equivalents of yield averages that are not marked to market. The Index returns do not reflect any fees or expenses. Index returns provided by Interactive Data.
7The unmanaged Bank of America (BofA) Merrill Lynch U.S. Corporate, Government & Mortgage Index is a market value weighted measure that represents U.S. government, corporate, and pass-through securities issued by entities within the United States, by supranational entities, or by entities headquartered outside of the United States but who have issued dollar-denominated securities within the United States. The Index only includes investment-grade securities with maturities of greater than one year. Index returns assume reinvestment of coupons and do not reflect any fees or expenses. Index returns provided by Bloomberg.
5
Unconstrained Bond Series
Shareholder Expense Example
(unaudited)
As a shareholder of the Series, you incur ongoing costs, including management fees, shareholder service fees and other Series expenses. This example is intended to help you understand your ongoing costs (in dollars) of investing in the Series and to compare these costs with the ongoing costs of investing in other mutual funds.
The example is based on an investment of $1,000 invested in each class at the beginning of the period and held for the entire period (July 1, 2015 to December 31, 2015).
Actual Expenses
The Actual lines of the table below provide information about actual account values and actual expenses. You may use the information in this line, together with the amount you invested, to estimate the expenses that you paid over the period. Simply divide your account value by $1,000 (for example, an $8,600 account value divided by $1,000 = 8.6), then multiply the result by the number in the Actual line for the Class in which you have invested under the heading entitled “Expenses Paid During Period” to estimate the expenses you paid on your account during this period.
Hypothetical Example for Comparison Purposes
The Hypothetical lines of each Class in the table below provide information about hypothetical account values and hypothetical expenses based on the Class’ actual expense ratio and an assumed rate of return of 5% per year before expenses, which is not the Class’ actual return. The hypothetical account values and expenses may not be used to estimate the actual ending account balance or expenses you paid during the period. You may use this information to compare the ongoing costs of investing in the Series and other funds. To do so, compare this 5% hypothetical example for the class in which you have invested with the 5% hypothetical examples that appear in the shareholder reports of the other funds.
Please note that the expenses shown in the table are meant to highlight your ongoing costs only and do not reflect any transaction costs such as sales charges (loads), redemption fees, or exchange fees that you may incur in other mutual funds. Therefore, the second line of the table is useful in comparing ongoing costs only, and will not help you determine the relative total costs of owning different funds.
BEGINNING ACCOUNT VALUE 7/1/15 | ENDING ACCOUNT VALUE | EXPENSES PAID DURING PERIOD* 7/1/15-12/31/15 | ANNUALIZED EXPENSE RATIO | |||||
Class S | ||||||||
Actual | $1,000.00 | $985.60 | $3.75 | 0.75% | ||||
Hypothetical | ||||||||
(5% return before expenses) | $1,000.00 | $1,021.42 | $3.82 | 0.75% | ||||
Class I | ||||||||
Actual | $1,000.00 | $986.70 | $2.50 | 0.50% | ||||
Hypothetical | ||||||||
(5% return before expenses) | $1,000.00 | $1,022.68 | $2.55 | 0.50% |
*Expenses are equal to each Class’ annualized expense ratio (for the six-month period), multiplied by the average account value over the period, multiplied by 184/365 (to reflect the one-half year period). Expenses are based on the most recent fiscal half year; therefore, the expense ratios stated above may differ from the expense ratios stated in the financial highlights, which is based on one-year data.
6
Unconstrained Bond Series
Portfolio Composition as of December 31, 2015
(unaudited)
7
Unconstrained Bond Series
Investment Portfolio - December 31, 2015
| CREDIT RATING1 (UNAUDITED) | PRINCIPAL AMOUNT 2 | VALUE (NOTE 2) | ||||||||||
LOAN ASSIGNMENTS - 8.9% | ||||||||||||
Berry Plastics Group, Inc., Term Loan D3, 3.50%, 2/8/2020 | Ba3 | 8,852,593 | $ | 8,669,521 | ||||||||
Charter Communications Operating LLC, Term Loan E3, 3.00%, 7/1/2020 | Baa3 | 8,933,829 | 8,757,029 | |||||||||
CHS - Community Health Systems, Inc., Term Loan G3, 3.75%, 12/31/2019 | Ba2 | 8,422,675 | 8,196,358 | |||||||||
Crown Castle Operating Co., 1st Lien Term Loan B23, 3.00%, 1/31/2021 | Ba1 | 8,934,164 | 8,883,954 | |||||||||
Hilton Worldwide Finance LLC, Term Loan B3, 3.50%, 9/23/2020 | Ba3 | 8,791,908 | 8,767,202 | |||||||||
Mallinckrodt International Finance S.A., Term B13, 3.50%, 3/19/2021 | Ba1 | 8,969,735 | 8,745,492 | |||||||||
Outfront Media Capital LLC, Term B3, 3.00%, 1/31/2021 | Ba1 | 8,437,500 | 8,324,100 | |||||||||
SBA Senior Finance II LLC, Term B3, 3.25%, 3/24/2021 | B1 | 8,939,508 | 8,738,369 | |||||||||
Valeant Pharmaceuticals International, Inc., Series D-2, Term Loan B3, 3.50%, 2/13/2019 | Ba1 | 9,000,000 | 8,662,500 | |||||||||
|
| |||||||||||
TOTAL LOAN ASSIGNMENTS | ||||||||||||
(Identified Cost $79,115,487) | 77,744,525 | |||||||||||
|
| |||||||||||
CORPORATE BONDS - 68.3% | ||||||||||||
Non-Convertible Corporate Bonds - 68.3% | ||||||||||||
Consumer Discretionary - 9.0% | ||||||||||||
Auto Components - 0.1% | ||||||||||||
Techniplas LLC4, 10.00%, 5/1/2020 | Caa1 | 1,180,000 | 837,800 | |||||||||
|
| |||||||||||
Automobiles - 1.0% | ||||||||||||
Ford Motor Credit Co. LLC3, 1.264%, 11/4/2019 | Baa3 | 9,000,000 | 8,741,466 | |||||||||
|
| |||||||||||
Diversified Consumer Services - 0.2% | ||||||||||||
Service Corp. International, 7.00%, 6/15/2017 | Ba3 | 2,000,000 | 2,135,000 | |||||||||
|
| |||||||||||
Hotels, Restaurants & Leisure - 1.0% | ||||||||||||
MGM Resorts International, 10.00%, 11/1/2016 | B3 | 8,250,000 | 8,720,910 | |||||||||
|
| |||||||||||
Household Durables - 4.6% | ||||||||||||
Brookfield Residential Properties, Inc. - Brookfield Residential US Corp. (Canada)4, 6.125%, 7/1/2022 | B1 | 2,200,000 | 2,035,000 | |||||||||
Centex LLC, 6.50%, 5/1/2016 | Ba1 | 2,000,000 | 2,020,000 | |||||||||
DR Horton, Inc., 5.625%, 1/15/2016 | Ba1 | 8,085,000 | 8,085,000 | |||||||||
Jarden Corp., 7.50%, 5/1/2017 | B1 | 7,000,000 | 7,157,500 | |||||||||
Lennar Corp., 12.25%, 6/1/2017 | Ba2 | 7,737,000 | 8,771,824 | |||||||||
Meritage Homes Corp., 7.15%, 4/15/2020 | Ba3 | 945,000 | 994,612 | |||||||||
Meritage Homes Corp., 7.00%, 4/1/2022 | Ba3 | 970,000 | 1,016,075 | |||||||||
NVR, Inc., 3.95%, 9/15/2022 | Baa2 | 6,225,000 | 6,279,033 | |||||||||
TRI Pointe Holdings, Inc. - TRI Pointe Group, Inc., 4.375%, 6/15/2019 | B1 | 1,180,000 | 1,153,450 | |||||||||
Weekley Homes LLC - Weekley Finance Corp., 6.00%, 2/1/2023 | B2 | 1,010,000 | 949,400 | |||||||||
Whirlpool Corp., 2.40%, 3/1/2019 | Baa2 | 1,615,000 | 1,608,575 | |||||||||
|
| |||||||||||
| 40,070,469 | ||||||||||||
|
| |||||||||||
Media - 2.1% | ||||||||||||
Columbus International, Inc. (Barbados)4, 7.375%, 3/30/2021 | Ba3 | 1,550,000 | 1,534,500 | |||||||||
The accompanying notes are an integral part of the financial statements.
8
Unconstrained Bond Series
Investment Portfolio - December 31, 2015
| CREDIT RATING1 (UNAUDITED) | PRINCIPAL AMOUNT 2 | VALUE (NOTE 2) | ||||||||||
CORPORATE BONDS (continued) | ||||||||||||
Non-Convertible Corporate Bonds (continued) | ||||||||||||
Consumer Discretionary (continued) | ||||||||||||
Media (continued) | ||||||||||||
DIRECTV Holdings LLC - DIRECTV Financing Co., Inc., 4.45%, 4/1/2024 | Baa2 | 3,620,000 | $ | 3,718,073 | ||||||||
DISH DBS Corp., 7.125%, 2/1/2016 | Ba3 | 4,000,000 | 4,012,500 | |||||||||
DISH DBS Corp., 4.625%, 7/15/2017 | Ba3 | 4,500,000 | 4,590,000 | |||||||||
Sinclair Television Group, Inc.4, 5.625%, 8/1/2024 | B1 | 1,378,000 | 1,340,105 | |||||||||
Sirius XM Radio, Inc.4, 5.375%, 4/15/2025 | Ba3 | 1,045,000 | 1,051,531 | |||||||||
VTR Finance B.V. (Chile)4, 6.875%, 1/15/2024 | B1 | 1,955,000 | 1,798,600 | |||||||||
|
| |||||||||||
| 18,045,309 | ||||||||||||
|
| |||||||||||
Total Consumer Discretionary | 78,550,954 | |||||||||||
|
| |||||||||||
Consumer Staples - 1.0% | ||||||||||||
Beverages - 0.5% | ||||||||||||
Anheuser-Busch InBev Worldwide, Inc. (Belgium), 7.75%, 1/15/2019 | A2 | 1,600,000 | 1,849,496 | |||||||||
Constellation Brands, Inc., 7.25%, 5/15/2017 | Ba1 | 2,000,000 | 2,130,000 | |||||||||
|
| |||||||||||
| 3,979,496 | ||||||||||||
|
| |||||||||||
Food & Staples Retailing - 0.1% | ||||||||||||
C&S Group Enterprises LLC4, 5.375%, 7/15/2022 | B1 | 1,115,000 | 1,003,500 | |||||||||
|
| |||||||||||
Food Products - 0.2% | ||||||||||||
Kraft Heinz Foods Co., 6.75%, 3/15/2032 | Baa3 | 795,000 | 920,042 | |||||||||
Pinnacle Operating Corp.4, 9.00%, 11/15/2020 | Caa1 | 1,095,000 | 1,029,300 | |||||||||
|
| |||||||||||
| 1,949,342 | ||||||||||||
|
| |||||||||||
Household Products - 0.2% | ||||||||||||
HRG Group, Inc., 7.75%, 1/15/2022 | Caa1 | 1,550,000 | 1,519,000 | |||||||||
|
| |||||||||||
Total Consumer Staples | 8,451,338 | |||||||||||
|
| |||||||||||
Energy - 6.6% | ||||||||||||
Energy Equipment & Services - 0.4% | ||||||||||||
Ensco plc, 5.20%, 3/15/2025 | Baa2 | 3,900,000 | 2,775,517 | |||||||||
FTS International, Inc., 6.25%, 5/1/2022 | Caa2 | 900,000 | 252,000 | |||||||||
|
| |||||||||||
| 3,027,517 | ||||||||||||
|
| |||||||||||
Oil, Gas & Consumable Fuels - 6.2% | ||||||||||||
Antero Resources Corp., 5.125%, 12/1/2022 | Ba3 | 505,000 | 383,800 | |||||||||
Columbia Pipeline Group, Inc.4, 2.45%, 6/1/2018 | Baa2 | 3,500,000 | 3,422,013 | |||||||||
Columbia Pipeline Group, Inc.4, 4.50%, 6/1/2025 | Baa2 | 1,750,000 | 1,585,920 | |||||||||
ConocoPhillips Co.3, 1.262%, 5/15/2022 | A2 | 7,000,000 | 6,896,330 | |||||||||
Crestwood Midstream Partners LP - Crestwood Midstream Finance Corp., 6.125%, 3/1/2022 | B1 | 1,645,000 | 1,143,275 | |||||||||
Hiland Partners LP - Hiland Partners Finance Corp.4, 7.25%, 10/1/2020 | Baa3 | 3,400,000 | 3,434,000 | |||||||||
Kinder Morgan, Inc., 7.25%, 6/1/2018 | Baa3 | 9,000,000 | 9,345,393 | |||||||||
Kinder Morgan, Inc.4, 5.625%, 11/15/2023 | Baa3 | 6,500,000 | 5,941,825 | |||||||||
The accompanying notes are an integral part of the financial statements.
9
Unconstrained Bond Series
Investment Portfolio - December 31, 2015
| CREDIT RATING1 (UNAUDITED) | PRINCIPAL AMOUNT 2 | VALUE (NOTE 2) | ||||||||||
CORPORATE BONDS (continued) | ||||||||||||
Non-Convertible Corporate Bonds (continued) | ||||||||||||
Energy (continued) | ||||||||||||
Oil, Gas & Consumable Fuels (continued) | ||||||||||||
PBF Holding Co. LLC - PBF Finance Corp.4, 7.00%, 11/15/2023 | B1 | 1,010,000 | $ | 984,750 | ||||||||
Petrobras Global Finance B.V. (Brazil)3, 1.99%, 5/20/2016 | Ba3 | 5,225,000 | 5,094,375 | |||||||||
Petroleos Mexicanos (Mexico), 5.75%, 3/1/2018 | Baa1 | 3,330,000 | 3,466,530 | |||||||||
Petroleos Mexicanos (Mexico)4, 4.50%, 1/23/2026 | Baa1 | 4,500,000 | 3,953,250 | |||||||||
Sabine Pass Liquefaction LLC, 5.625%, 2/1/2021 | Ba3 | 2,735,000 | 2,516,200 | |||||||||
Talisman Energy, Inc. (Canada), 3.75%, 2/1/2021 | Baa3 | 3,785,000 | 3,431,829 | |||||||||
TransCanada PipeLines Ltd. (Canada), 1.625%, 11/9/2017 | A3 | 2,000,000 | 1,983,580 | |||||||||
WPX Energy, Inc., 6.00%, 1/15/2022 | Ba1 | 1,335,000 | 934,500 | |||||||||
|
| |||||||||||
| 54,517,570 | ||||||||||||
|
| |||||||||||
Total Energy | 57,545,087 | |||||||||||
|
| |||||||||||
Financials - 30.3% | ||||||||||||
Banks - 13.5% | ||||||||||||
Bank of America Corp.3, 1.272%, 9/15/2026 | Baa3 | 7,811,000 | 6,718,350 | |||||||||
The Bank of Nova Scotia (Canada), 1.85%, 4/14/2020 | Aaa | 9,035,000 | 8,851,373 | |||||||||
Bank of Scotland plc (United Kingdom)4, 5.25%, 2/21/2017 | Aaa | 8,000,000 | 8,340,504 | |||||||||
Barclays Bank plc (United Kingdom)4, 6.05%, 12/4/2017 | Baa3 | 8,250,000 | 8,799,995 | |||||||||
Barclays Bank plc (United Kingdom)4, 10.179%, 6/12/2021 | Baa3 | 2,540,000 | 3,290,306 | |||||||||
BBVA Bancomer S.A. (Mexico)4, 6.75%, 9/30/2022 | Baa2 | 2,000,000 | 2,200,000 | |||||||||
CIT Group, Inc., 5.00%, 5/15/2017 | B1 | 4,500,000 | 4,635,000 | |||||||||
CIT Group, Inc., 4.25%, 8/15/2017 | B1 | 4,500,000 | 4,601,250 | |||||||||
Citigroup, Inc.3, 0.943%, 8/25/2036 | Baa3 | 6,330,000 | 4,806,546 | |||||||||
Cooperatieve Centrale Raiffeisen-Boerenleenbank B.A. (Netherlands)5,6, 8.40% | WR | 7 | 2,980,000 | 3,201,623 | ||||||||
Intesa Sanpaolo S.p.A. (Italy), 3.875%, 1/15/2019 | Baa1 | 3,200,000 | 3,294,803 | |||||||||
Intesa Sanpaolo S.p.A. (Italy)4, 6.50%, 2/24/2021 | Baa1 | 2,800,000 | 3,176,018 | |||||||||
JPMorgan Chase & Co.3, 1.271%, 1/23/2020 | A3 | 4,093,000 | 4,096,295 | |||||||||
JPMorgan Chase & Co., 4.95%, 3/25/2020 | A3 | 4,000,000 | 4,337,304 | |||||||||
Lloyds Bank plc (United Kingdom)4,5,8, 12.00% | BB | 9 | 1,095,000 | 1,551,396 | ||||||||
Lloyds Banking Group plc (United Kingdom)4, 4.582%, 12/10/2025 | Baa2 | 7,516,000 | 7,534,309 | |||||||||
National Australia Bank Ltd. (Australia)4, 2.00%, 2/22/2019 | Aaa | 9,000,000 | 8,978,256 | |||||||||
National Bank of Canada (Canada)4, 1.40%, 4/20/2018 | Aaa | 9,000,000 | 8,936,856 | |||||||||
Popular, Inc., 7.00%, 7/1/2019 | B2 | 2,205,000 | 2,061,675 | |||||||||
Royal Bank of Scotland Group plc (United Kingdom), 5.125%, 5/28/2024 | Ba2 | 3,730,000 | 3,779,068 | |||||||||
Royal Bank of Scotland N.V. (Netherlands), 4.65%, 6/4/2018 | Ba2 | 2,000,000 | 2,062,126 | |||||||||
Santander Holdings USA, Inc., 2.65%, 4/17/2020 | Baa2 | 3,750,000 | 3,679,005 | |||||||||
The Toronto-Dominion Bank (Canada)4, 1.625%, 9/14/2016 | Aaa | 8,836,000 | 8,870,027 | |||||||||
|
| |||||||||||
| 117,802,085 | ||||||||||||
|
| |||||||||||
Capital Markets - 3.7% | ||||||||||||
The Goldman Sachs Group, Inc., 5.375%, 3/15/2020 | A3 | 3,000,000 | 3,295,629 | |||||||||
The accompanying notes are an integral part of the financial statements.
10
Unconstrained Bond Series
Investment Portfolio - December 31, 2015
| CREDIT RATING1 (UNAUDITED) | PRINCIPAL AMOUNT 2 | VALUE (NOTE 2) | ||||||||||
CORPORATE BONDS (continued) | ||||||||||||
Non-Convertible Corporate Bonds (continued) | ||||||||||||
Financials (continued) | ||||||||||||
Capital Markets (continued) | ||||||||||||
The Goldman Sachs Group, Inc.3, 2.012%, 11/29/2023 | A3 | 8,305,000 | $ | 8,378,707 | ||||||||
Morgan Stanley3, 1.463%, 1/27/2020 | A3 | 8,750,000 | 8,768,699 | |||||||||
Morgan Stanley, 5.75%, 1/25/2021 | A3 | 3,940,000 | 4,423,639 | |||||||||
UBS AG (Switzerland)3, 1.264%, 6/1/2020 | A2 | 8,000,000 | 7,969,288 | |||||||||
|
| |||||||||||
| 32,835,962 | ||||||||||||
|
| |||||||||||
Consumer Finance - 2.5% | ||||||||||||
Ally Financial, Inc., 3.50%, 7/18/2016 | Ba3 | 2,277,000 | 2,282,693 | |||||||||
Ally Financial, Inc., 2.75%, 1/30/2017 | Ba3 | 6,500,000 | 6,483,750 | |||||||||
American Express Credit Corp.3, 1.137%, 5/26/2020 | A2 | 7,500,000 | 7,426,583 | |||||||||
Navient Corp., 6.00%, 1/25/2017 | Ba3 | 3,500,000 | 3,587,500 | |||||||||
Navient Corp., 6.125%, 3/25/2024 | Ba3 | 2,360,000 | 1,923,400 | |||||||||
|
| |||||||||||
| 21,703,926 | ||||||||||||
|
| |||||||||||
Diversified Financial Services - 1.7% | ||||||||||||
General Electric Capital Corp.3, 0.714%, 5/5/2026 | A1 | 8,800,000 | 8,159,114 | |||||||||
ING Bank N.V. (Netherlands)3, 4.125%, 11/21/2023 | Baa2 | 3,465,000 | 3,529,144 | |||||||||
Jefferies Finance LLC - JFIN Co-Issuer Corp.4, 7.375%, 4/1/2020 | B1 | 575,000 | 510,312 | |||||||||
Jefferies Finance LLC - JFIN Co-Issuer Corp.4, 6.875%, 4/15/2022 | B1 | 1,140,000 | 957,600 | |||||||||
Peachtree Corners Funding Trust4, 3.976%, 2/15/2025 | Baa2 | 1,750,000 | 1,737,363 | |||||||||
|
| |||||||||||
| 14,893,533 | ||||||||||||
|
| |||||||||||
Insurance - 4.4% | ||||||||||||
Aegon N.V. (Netherlands)3,5, 2.142% | Baa1 | 3,866,000 | 3,057,291 | |||||||||
American International Group, Inc., 4.875%, 6/1/2022 | Baa1 | 4,260,000 | 4,600,544 | |||||||||
Assured Guaranty US Holdings, Inc., 5.00%, 7/1/2024 | Baa2 | 10,700,000 | 11,116,177 | |||||||||
AXA S.A. (France)3,5, 2.312% | A3 | 7,199,000 | 5,869,021 | |||||||||
AXA S.A. (France)3,5, 2.35% | A3 | 1,239,000 | 1,022,051 | |||||||||
Fidelity National Financial, Inc., 6.60%, 5/15/2017 | Baa3 | 3,045,000 | 3,212,880 | |||||||||
First American Financial Corp., 4.30%, 2/1/2023 | Baa3 | 3,160,000 | 3,137,479 | |||||||||
The Hartford Financial Services Group, Inc., 5.125%, 4/15/2022 | Baa2 | 3,415,000 | 3,750,401 | |||||||||
Prudential Financial, Inc.5,10, 5.875% | Baa2 | 2,460,000 | 2,557,170 | |||||||||
|
| |||||||||||
| 38,323,014 | ||||||||||||
|
| |||||||||||
Real Estate Investment Trusts (REITS) - 3.0% | ||||||||||||
American Tower Corp., 2.80%, 6/1/2020 | Baa3 | 4,000,000 | 3,953,964 | |||||||||
American Tower Trust I4, 1.551%, 3/15/2018 | Aaa | 1,625,000 | 1,586,858 | |||||||||
AvalonBay Communities, Inc., 4.20%, 12/15/2023 | Baa1 | 3,000,000 | 3,125,721 | |||||||||
Crown Castle Towers LLC4, 6.113%, 1/15/2020 | A2 | 4,070,000 | 4,438,965 | |||||||||
Crown Castle Towers LLC4, 4.883%, 8/15/2020 | A2 | 610,000 | 652,103 | |||||||||
Digital Realty Trust LP, 5.25%, 3/15/2021 | Baa2 | 4,180,000 | 4,513,568 | |||||||||
DuPont Fabros Technology LP, 5.875%, 9/15/2021 | Ba1 | 1,020,000 | 1,060,800 | |||||||||
Qualitytech LP - QTS Finance Corp., 5.875%, 8/1/2022 | B2 | 450,000 | 459,000 | |||||||||
The accompanying notes are an integral part of the financial statements.
11
Unconstrained Bond Series
Investment Portfolio - December 31, 2015
| CREDIT RATING1 (UNAUDITED) | PRINCIPAL AMOUNT 2 | VALUE (NOTE 2) | ||||||||||
CORPORATE BONDS (continued) | ||||||||||||
Non-Convertible Corporate Bonds (continued) | ||||||||||||
Financials (continued) | ||||||||||||
Real Estate Investment Trusts (REITS) (continued) | ||||||||||||
Rialto Holdings LLC - Rialto Corp.4, 7.00%, 12/1/2018 | B2 | 1,585,000 | $ | 1,608,775 | ||||||||
Ventas Realty LP - Ventas Capital Corp., 4.75%, 6/1/2021 | Baa1 | 1,400,000 | 1,491,015 | |||||||||
Welltower, Inc., 4.95%, 1/15/2021 | Baa2 | 3,450,000 | 3,698,973 | |||||||||
|
| |||||||||||
| 26,589,742 | ||||||||||||
|
| |||||||||||
Real Estate Management & Development - 0.2% | ||||||||||||
Forestar USA Real Estate Group, Inc.4, 8.50%, 6/1/2022 | B3 | 735,000 | 716,625 | |||||||||
Greystar Real Estate Partners LLC4, 8.25%, 12/1/2022 | B2 | 1,030,000 | 1,068,625 | |||||||||
|
| |||||||||||
| 1,785,250 | ||||||||||||
|
| |||||||||||
Thrifts & Mortgage Finance - 1.3% | ||||||||||||
Ladder Capital Finance Holdings LLLP - Ladder Capital Finance Corp., 7.375%, 10/1/2017 | Ba3 | 9,005,000 | 8,971,231 | |||||||||
Ladder Capital Finance Holdings LLLP - Ladder Capital Finance Corp.4, 5.875%, 8/1/2021 | Ba3 | 1,720,000 | 1,565,200 | |||||||||
Prospect Holding Co. LLC - Prospect Holding Finance Co.4, 10.25%, 10/1/2018 | B2 | 1,090,000 | 525,925 | |||||||||
|
| |||||||||||
| 11,062,356 | ||||||||||||
|
| |||||||||||
Total Financials | 264,995,868 | |||||||||||
|
| |||||||||||
Health Care - 1.9% | ||||||||||||
Biotechnology - 0.8% | ||||||||||||
AbbVie, Inc., 2.50%, 5/14/2020 | Baa1 | 3,000,000 | 2,969,838 | |||||||||
AMAG Pharmaceuticals, Inc.4, 7.875%, 9/1/2023 | B3 | 1,585,000 | 1,394,800 | |||||||||
Amgen, Inc., 2.70%, 5/1/2022 | Baa1 | 2,495,000 | 2,421,145 | |||||||||
|
| |||||||||||
| 6,785,783 | ||||||||||||
|
| |||||||||||
Health Care Providers & Services - 0.8% | ||||||||||||
Express Scripts Holding Co., 4.75%, 11/15/2021 | Baa2 | 2,885,000 | 3,093,470 | |||||||||
Fresenius Medical Care US Finance, Inc. (Germany), 6.875%, 7/15/2017 | Ba2 | 1,750,000 | 1,868,125 | |||||||||
Tenet Healthcare Corp.3,4, 4.012%, 6/15/2020 | Ba2 | 1,085,000 | 1,057,875 | |||||||||
Tenet Healthcare Corp., 8.125%, 4/1/2022 | B3 | 980,000 | 977,550 | |||||||||
|
| |||||||||||
| 6,997,020 | ||||||||||||
|
| |||||||||||
Pharmaceuticals - 0.3% | ||||||||||||
Concordia Healthcare Corp. (Canada)4, 7.00%, 4/15/2023 | Caa2 | 1,595,000 | 1,383,663 | |||||||||
Mallinckrodt International Finance S.A. - Mallinckrodt CB LLC4, 5.625%, 10/15/2023 | B1 | 1,040,000 | 988,000 | |||||||||
|
| |||||||||||
| 2,371,663 | ||||||||||||
|
| |||||||||||
Total Health Care | 16,154,466 | |||||||||||
|
| |||||||||||
The accompanying notes are an integral part of the financial statements.
12
Unconstrained Bond Series
Investment Portfolio - December 31, 2015
| CREDIT RATING1 (UNAUDITED) | PRINCIPAL AMOUNT 2 | VALUE (NOTE 2) | ||||||||||
CORPORATE BONDS (continued) | ||||||||||||
Non-Convertible Corporate Bonds (continued) | ||||||||||||
Industrials - 8.3% | ||||||||||||
Aerospace & Defense - 0.2% | ||||||||||||
DigitalGlobe, Inc.4, 5.25%, 2/1/2021 | B1 | 2,263,000 | $ | 1,900,920 | ||||||||
|
| |||||||||||
Air Freight & Logistics - 0.1% | ||||||||||||
Neovia Logistics Intermediate Holdings LLC - Logistics Intermediate Finance Corp.4,11, 10.00%, 2/15/2018 | Caa3 | 915,000 | 878,400 | |||||||||
|
| |||||||||||
Airlines - 1.1% | ||||||||||||
Allegiant Travel Co., 5.50%, 7/15/2019 | B1 | 1,525,000 | 1,544,063 | |||||||||
American Airlines Pass-Through Trust, Series 2013-2, Class A, 4.95%, 1/15/2023 | A | 9 | 2,777,055 | 2,929,793 | ||||||||
Delta Air Lines Pass-Through Trust, Series 2010-1, Class B4, 6.375%, 1/2/2016 | Baa3 | 1,220,000 | 1,224,575 | |||||||||
Southwest Airlines Co., 2.75%, 11/6/2019 | Baa1 | 3,715,000 | 3,743,799 | |||||||||
|
| |||||||||||
| 9,442,230 | ||||||||||||
|
| |||||||||||
Building Products - 0.1% | ||||||||||||
Masco Corp., 6.125%, 10/3/2016 | Ba2 | 500,000 | 514,990 | |||||||||
|
| |||||||||||
Commercial Services & Supplies - 0.1% | ||||||||||||
Constellis Holdings LLC - Constellis Finance Corp.4, 9.75%, 5/15/2020 | B3 | 800,000 | 656,000 | |||||||||
Modular Space Corp.4, 10.25%, 1/31/2019 | B3 | 1,025,000 | 410,000 | |||||||||
|
| |||||||||||
| 1,066,000 | ||||||||||||
|
| |||||||||||
Construction & Engineering - 0.0%## | ||||||||||||
Abengoa Finance S.A.U. (Spain)*4,12, 7.75%, 2/1/2020 | Caa3 | 990,000 | 137,363 | |||||||||
|
| |||||||||||
Industrial Conglomerates - 1.4% | ||||||||||||
Icahn Enterprises LP - Icahn Enterprises Finance Corp., 3.50%, 3/15/2017 | Ba3 | 9,000,000 | 9,045,000 | |||||||||
Siemens Financieringsmaatschappij N.V. (Germany)4, 2.15%, 5/27/2020 | A1 | 3,000,000 | 2,971,443 | |||||||||
|
| |||||||||||
| 12,016,443 | ||||||||||||
|
| |||||||||||
Machinery - 1.1% | ||||||||||||
Case New Holland Industrial, Inc. (United Kingdom), 7.875%, 12/1/2017 | Ba1 | 1,200,000 | 1,269,000 | |||||||||
CNH Industrial Capital LLC, 6.25%, 11/1/2016 | Ba1 | 2,491,000 | 2,537,706 | |||||||||
Stanley Black & Decker, Inc., 2.451%, 11/17/2018 | Baa2 | 4,500,000 | 4,517,559 | |||||||||
Waterjet Holdings, Inc.4, 7.625%, 2/1/2020 | B2 | 1,275,000 | 1,265,438 | |||||||||
|
| |||||||||||
| 9,589,703 | ||||||||||||
|
| |||||||||||
Trading Companies & Distributors - 4.2% | ||||||||||||
AerCap Ireland Capital Ltd. - AerCap Global Aviation Trust (Netherlands), 2.75%, 5/15/2017 | Ba2 | 2,250,000 | 2,235,938 | |||||||||
Air Lease Corp., 5.625%, 4/1/2017 | BBB | 9 | 5,595,000 | 5,804,813 | ||||||||
Air Lease Corp., 2.625%, 9/4/2018 | BBB | 9 | 2,220,000 | 2,194,383 | ||||||||
Aircastle Ltd., 6.75%, 4/15/2017 | Ba2 | 8,500,000 | 8,866,605 | |||||||||
Aviation Capital Group Corp.4, 3.875%, 9/27/2016 | BBB | 9 | 7,020,000 | 7,072,650 | ||||||||
Aviation Capital Group Corp.4, 2.875%, 9/17/2018 | BBB | 9 | 1,700,000 | 1,690,245 | ||||||||
The accompanying notes are an integral part of the financial statements.
13
Unconstrained Bond Series
Investment Portfolio - December 31, 2015
| CREDIT RATING1 (UNAUDITED) | PRINCIPAL AMOUNT 2 | VALUE (NOTE 2) | ||||||||||
CORPORATE BONDS (continued) | ||||||||||||
Non-Convertible Corporate Bonds (continued) | ||||||||||||
Industrials (continued) | ||||||||||||
Trading Companies & Distributors (continued) | ||||||||||||
Fly Leasing Ltd. (Ireland), 6.75%, 12/15/2020 | B2 | 1,350,000 | $ | 1,383,548 | ||||||||
Fly Leasing Ltd. (Ireland), 6.375%, 10/15/2021 | B2 | 1,200,000 | 1,194,000 | |||||||||
International Lease Finance Corp., 5.75%, 5/15/2016 | Ba2 | 540,000 | 547,425 | |||||||||
International Lease Finance Corp.3, 2.462%, 6/15/2016 | Ba2 | 3,793,000 | 3,783,518 | |||||||||
International Lease Finance Corp., 8.75%, 3/15/2017 | Ba2 | 1,830,000 | 1,948,950 | |||||||||
|
| |||||||||||
| 36,722,075 | ||||||||||||
|
| |||||||||||
Total Industrials | 72,268,124 | |||||||||||
|
| |||||||||||
Information Technology - 1.7% | ||||||||||||
Communications Equipment - 0.3% | ||||||||||||
QUALCOMM, Inc., 3.00%, 5/20/2022 | A1 | 2,400,000 | 2,375,947 | |||||||||
|
| |||||||||||
Internet Software & Services - 1.3% | ||||||||||||
Alibaba Group Holding Ltd. (China), 2.50%, 11/28/2019 | A1 | 3,900,000 | 3,810,136 | |||||||||
Baidu, Inc. (China), 2.75%, 6/9/2019 | A3 | 4,000,000 | 3,965,192 | |||||||||
Tencent Holdings Ltd. (China)4, 3.375%, 5/2/2019 | A2 | 3,455,000 | 3,513,206 | |||||||||
|
| |||||||||||
| 11,288,534 | ||||||||||||
|
| |||||||||||
IT Services - 0.1% | ||||||||||||
Automatic Data Processing, Inc., 2.25%, 9/15/2020 | Aa3 | 1,000,000 | 1,003,787 | |||||||||
|
| |||||||||||
Total Information Technology | 14,668,268 | |||||||||||
|
| |||||||||||
Materials - 3.7% | ||||||||||||
Chemicals - 0.8% | ||||||||||||
Consolidated Energy Finance S.A. (Trinidad-Tobago)4, 6.75%, 10/15/2019 | B2 | 1,470,000 | 1,405,246 | |||||||||
The Dow Chemical Co., 8.55%, 5/15/2019 | Baa2 | 4,760,000 | 5,610,369 | |||||||||
|
| |||||||||||
| 7,015,615 | ||||||||||||
|
| |||||||||||
Containers & Packaging - 0.5% | ||||||||||||
Ardagh Packaging Finance plc - Ardagh Holdings USA, Inc. (Ireland)3,4, 3.512%, 12/15/2019 | Ba3 | 4,120,000 | 4,027,300 | |||||||||
|
| |||||||||||
Metals & Mining - 2.0% | ||||||||||||
Alcoa, Inc., 5.55%, 2/1/2017 | Ba1 | 2,600,000 | 2,665,000 | |||||||||
Alcoa, Inc., 5.87%, 2/23/2022 | Ba1 | 1,050,000 | 1,023,750 | |||||||||
ArcelorMittal (Luxembourg), 5.50%, 2/25/2017 | Ba2 | 9,000,000 | 8,693,100 | |||||||||
Rio Tinto Finance USA Ltd. (United Kingdom), 3.75%, 9/20/2021 | A3 | 4,000,000 | 3,888,132 | |||||||||
Steel Dynamics, Inc., 5.125%, 10/1/2021 | Ba2 | 1,025,000 | 948,125 | |||||||||
SunCoke Energy Partners LP - SunCoke Energy Partners Finance Corp.4, 7.375%, 2/1/2020 | B1 | 1,135,000 | 703,700 | |||||||||
|
| |||||||||||
| 17,921,807 | ||||||||||||
|
| |||||||||||
The accompanying notes are an integral part of the financial statements.
14
Unconstrained Bond Series
Investment Portfolio - December 31, 2015
| CREDIT RATING1 (UNAUDITED) | PRINCIPAL AMOUNT 2 | VALUE (NOTE 2) | ||||||||||
CORPORATE BONDS (continued) | ||||||||||||
Non-Convertible Corporate Bonds (continued) | ||||||||||||
Materials (continued) | ||||||||||||
Paper & Forest Products - 0.4% | ||||||||||||
Domtar Corp., 4.40%, 4/1/2022 | Baa3 | 3,565,000 | $ | 3,624,992 | ||||||||
|
| |||||||||||
Total Materials | 32,589,714 | |||||||||||
|
| |||||||||||
Telecommunication Services - 3.5% | ||||||||||||
Diversified Telecommunication Services - 2.3% | ||||||||||||
AT&T, Inc.3, 1.533%, 6/30/2020 | Baa1 | 8,000,000 | 7,942,800 | |||||||||
CenturyLink, Inc., 5.80%, 3/15/2022 | Ba2 | 3,900,000 | 3,574,350 | |||||||||
Embarq Corp., 7.082%, 6/1/2016 | Baa3 | 3,004,000 | 3,050,862 | |||||||||
Frontier Communications Corp., 7.625%, 4/15/2024 | Ba3 | 3,055,000 | 2,566,200 | |||||||||
Frontier Communications Corp.4, 11.00%, 9/15/2025 | Ba3 | 2,040,000 | 2,019,600 | |||||||||
Windstream Services LLC, 7.875%, 11/1/2017 | B2 | 685,000 | 700,762 | |||||||||
|
| |||||||||||
| 19,854,574 | ||||||||||||
|
| |||||||||||
Wireless Telecommunication Services - 1.2% | ||||||||||||
Altice Financing S.A. (Luxembourg)4, 6.50%, 1/15/2022 | B1 | 2,165,000 | 2,143,350 | |||||||||
Altice Financing S.A. (Luxembourg)4, 6.625%, 2/15/2023 | B1 | 530,000 | 523,375 | |||||||||
SBA Tower Trust4, 5.101%, 4/17/2017 | A2 | 2,095,000 | 2,120,940 | |||||||||
SBA Tower Trust4, 2.933%, 12/15/2017 | A2 | 1,515,000 | 1,532,916 | |||||||||
SBA Tower Trust4, 3.598%, 4/15/2018 | Baa3 | 1,640,000 | 1,634,102 | |||||||||
Sixsigma Networks Mexico S.A. de C.V. (Mexico)4, 8.25%, 11/7/2021 | B2 | 1,650,000 | 1,575,750 | |||||||||
T-Mobile USA, Inc., 6.836%, 4/28/2023 | Ba3 | 1,465,000 | 1,516,275 | |||||||||
|
| |||||||||||
| 11,046,708 | ||||||||||||
|
| |||||||||||
Total Telecommunication Services | 30,901,282 | |||||||||||
|
| |||||||||||
Utilities - 2.3% | ||||||||||||
Gas Utilities - 0.2% | ||||||||||||
National Fuel Gas Co., 3.75%, 3/1/2023 | Baa2 | 2,000,000 | 1,852,346 | |||||||||
|
| |||||||||||
Independent Power and Renewable Electricity Producers - 2.1% | ||||||||||||
Abengoa Yield plc (Spain)4, 7.00%, 11/15/2019 | B2 | 1,140,000 | 1,003,200 | |||||||||
ContourGlobal Power Holdings S.A. (France)4, 7.125%, 6/1/2019 | B3 | 1,095,000 | 1,040,250 | |||||||||
NRG Energy, Inc., 7.625%, 1/15/2018 | B1 | 8,750,000 | 9,121,875 | |||||||||
NRG Energy, Inc., 6.25%, 7/15/2022 | B1 | 1,120,000 | 954,240 | |||||||||
Talen Energy Supply LLC4, 4.625%, 7/15/2019 | Ba3 | 4,690,000 | 3,517,500 | |||||||||
TerraForm Global Operating LLC4, 9.75%, 8/15/2022 | B3 | 1,750,000 | 1,395,625 | |||||||||
TerraForm Power Operating LLC4, 6.125%, 6/15/2025 | B3 | 1,715,000 | 1,380,575 | |||||||||
|
| |||||||||||
| 18,413,265 | ||||||||||||
|
| |||||||||||
Total Utilities | 20,265,611 | |||||||||||
|
| |||||||||||
TOTAL CORPORATE BONDS | ||||||||||||
(Identified Cost $612,909,713) | 596,390,712 | |||||||||||
|
| |||||||||||
The accompanying notes are an integral part of the financial statements.
15
Unconstrained Bond Series
Investment Portfolio - December 31, 2015
| CREDIT RATING1 (UNAUDITED) | PRINCIPAL AMOUNT 2 | VALUE (NOTE 2) | ||||||||||
ASSET-BACKED SECURITIES - 1.8% | ||||||||||||
Alterna Funding I LLC, Series 2014-1A, Class NOTE4, 1.639%, 2/15/2021 | WR | 7 | 928,667 | $ | 923,297 | |||||||
Cazenovia Creek Funding I LLC, Series 2015-1A, Class A4, 2.00%, 12/10/2023 | WR | 7 | 1,545,642 | 1,547,079 | ||||||||
Colony American Homes, Series 2015-1A, Class A3,4, 1.551%, 7/17/2032 | Aaa | 1,847,637 | 1,805,032 | |||||||||
Enterprise Fleet Financing LLC, Series 2015-2, Class A24, 1.59%, 2/22/2021 | AAA | 9 | 2,700,000 | 2,682,271 | ||||||||
FDIC Trust, Series 2011-R1, Class A4, 2.672%, 7/25/2026 | WR | 7 | 423,326 | 429,974 | ||||||||
FNA Trust, Series 2014-1A, Class A4, 1.296%, 12/10/2022 | WR | 7 | 785,648 | 784,297 | ||||||||
Hertz Vehicle Financing LLC, Series 2010-1A, Class A24, 3.74%, 2/25/2017 | Aaa | 786,667 | 789,124 | |||||||||
Invitation Homes Trust, Series 2015-SFR3, Class A3,4, 1.651%, 8/17/2032 | Aaa | 1,813,935 | 1,779,422 | �� | ||||||||
NextGear Floorplan Master Owner Trust, Series 2014-1A, Class A4, 1.92%, 10/15/2019 | Aaa | 1,900,000 | 1,883,444 | |||||||||
SpringCastle America Funding LLC, Series 2014-AA, Class A4, 2.70%, 5/25/2023 | WR | 7 | 1,107,891 | 1,105,443 | ||||||||
Starwood Retail Property Trust, Series 2014-STAR, Class A3,4, 1.551%, 11/15/2027 | AAA | 9 | 2,005,000 | 1,995,533 | ||||||||
|
| |||||||||||
TOTAL ASSET-BACKED SECURITIES | ||||||||||||
(Identified Cost $15,843,051) | 15,724,916 | |||||||||||
|
| |||||||||||
COMMERCIAL MORTGAGE-BACKED SECURITIES - 8.5% | ||||||||||||
Americold LLC Trust, Series 2010-ARTA, Class A14, 3.847%, 1/14/2029 | AAA | 9 | 247,853 | 255,956 | ||||||||
Banc of America Commercial Mortgage Trust, Series 2006-2, Class A43, 6.02%, 5/10/2045 | AAA | 9 | 553,698 | 554,423 | ||||||||
Banc of America Commercial Mortgage Trust, Series 2006-4, Class A4, 5.634%, 7/10/2046 | Aaa | 1,792,199 | 1,806,754 | |||||||||
Bear Stearns Commercial Mortgage Securities Trust, Series 2006-PW13, Class A4, 5.54%, 9/11/2041 | AAA | 9 | 2,652,541 | 2,677,655 | ||||||||
Bear Stearns Commercial Mortgage Securities Trust, Series 2006-T24, Class AM3, 5.568%, 10/12/2041 | A3 | 800,000 | 816,256 | |||||||||
CFCRE Commercial Mortgage Trust, Series 2011-C1, Class A24, 3.759%, 4/15/2044 | Aaa | 71,832 | 71,976 | |||||||||
COBALT CMBS Commercial Mortgage Trust, Series 2006-C1, Class A4, 5.223%, 8/15/2048 | AAA | 9 | 2,716,456 | 2,759,761 | ||||||||
Commercial Mortgage Pass-Through Certificates, Series 2006-GG7, Class A43, 6.048%, 7/10/2038 | Aaa | 1,215,830 | 1,221,421 | |||||||||
Commercial Mortgage Pass-Through Certificates, Series 2013-CR6, Class A4, 3.101%, 3/1/2046 | Aaa | 2,570,000 | 2,569,072 | |||||||||
Credit Suisse Commercial Mortgage Trust, Series 2006-C3, Class A33, 6.007%, 6/15/2038 | Aaa | 2,893,736 | 2,899,227 | |||||||||
Credit Suisse Mortgage Capital Trust, Series 2013-TH1, Class A13,4, 2.13%, 2/25/2043 | AAA | 9 | 1,085,624 | 1,011,436 | ||||||||
The accompanying notes are an integral part of the financial statements.
16
Unconstrained Bond Series
Investment Portfolio - December 31, 2015
| CREDIT RATING1 (UNAUDITED) | PRINCIPAL AMOUNT 2 | VALUE (NOTE 2) | ||||||||||
COMMERCIAL MORTGAGE-BACKED SECURITIES (continued) | ||||||||||||
Extended Stay America Trust, Series 2013-ESH7, Class A274, 2.958%, 12/5/2031 | Aaa | 1,500,000 | $ | 1,501,326 | ||||||||
Fannie Mae Multifamily REMIC Trust, Series 2012-M13, Class ASQ2, 1.246%, 8/25/2017 | Aaa | 884,828 | 884,616 | |||||||||
Freddie Mac Multifamily Structured Pass-Through Certificates, Series K005, Class AX (IO)3, 1.554%, 11/25/2019 | Aaa | 7,533,337 | 342,796 | |||||||||
Freddie Mac Multifamily Structured Pass-Through Certificates, Series K009, Class X1 (IO)3, 1.609%, 8/25/2020 | Aaa | 10,736,353 | 536,477 | |||||||||
Freddie Mac Multifamily Structured Pass-Through Certificates, Series K014, Class X1 (IO)3, 1.391%, 4/25/2021 | Aaa | 7,726,118 | 419,761 | |||||||||
Freddie Mac Multifamily Structured Pass-Through Certificates, Series K016, Class X1 (IO)3, 1.708%, 10/25/2021 | Aaa | 5,030,427 | 369,437 | |||||||||
Freddie Mac Multifamily Structured Pass-Through Certificates, Series K017, Class X1 (IO)3, 1.565%, 12/25/2021 | Aaa | 37,096,717 | 2,465,459 | |||||||||
Freddie Mac Multifamily Structured Pass-Through Certificates, Series K021, Class X1 (IO)3, 1.625%, 6/25/2022 | Aaa | 18,048,639 | 1,366,116 | |||||||||
Freddie Mac Multifamily Structured Pass-Through Certificates, Series K030, Class X1 (IO)3, 0.333%, 4/25/2023 | Aaa | 60,659,551 | 823,520 | |||||||||
Freddie Mac Multifamily Structured Pass-Through Certificates, Series K032, Class X1 (IO)3, 0.234%, 5/25/2023 | Aaa | 35,793,296 | 283,569 | |||||||||
Freddie Mac Multifamily Structured Pass-Through Certificates, Series K706, Class X1 (IO)3, 1.706%, 10/25/2018 | Aaa | 8,080,016 | 306,271 | |||||||||
Freddie Mac Multifamily Structured Pass-Through Certificates, Series K-P01, Class A2, 1.72%, 1/25/2019 | Aaa | 1,480,000 | 1,481,019 | |||||||||
FREMF Mortgage Trust, Series 2011-K701, Class B3,4, 4.436%, 7/25/2048 | A | 9 | 950,000 | 972,061 | ||||||||
FREMF Mortgage Trust, Series 2011-K702, Class B3,4, 4.931%, 4/25/2044 | A3 | 230,000 | 239,235 | |||||||||
FREMF Mortgage Trust, Series 2013-K28, Class X2A (IO)4, 0.10%, 6/25/2046 | WR | 7 | 94,549,722 | 531,559 | ||||||||
FREMF Mortgage Trust, Series 2013-K712, Class B3,4, 3.484%, 5/25/2045 | A | 9 | 1,300,000 | 1,304,095 | ||||||||
FREMF Mortgage Trust, Series 2014-K716, Class B3,4, 4.085%, 8/25/2047 | A2 | 2,550,000 | 2,613,719 | |||||||||
FREMF Mortgage Trust, Series 2015-K42, Class B3,4, 3.985%, 12/25/2024 | A3 | 1,900,000 | 1,815,701 | |||||||||
FREMF Mortgage Trust, Series 2015-K43, Class B3,4, 3.863%, 2/25/2048 | WR | 7 | 1,500,000 | 1,371,638 | ||||||||
GAHR Commercial Mortgage Trust, Series 2015-NRF, Class BFX3,4, 3.495%, 12/15/2019 | AA | 9 | 2,000,000 | 1,995,185 | ||||||||
GAHR Commercial Mortgage Trust, Series 2015-NRF, Class DFX3,4, 3.495%, 12/15/2019 | BBB | 9 | 1,150,000 | 1,106,156 | ||||||||
JP Morgan Chase Commercial Mortgage Securities Trust, Series 2006-CB16, Class A4, 5.552%, 5/12/2045 | Aaa | 2,165,626 | 2,191,040 | |||||||||
JP Morgan Chase Commercial Mortgage Securities Trust, Series 2006-LDP7, Class A43, 6.106%, 4/15/2045 | Aaa | 742,966 | 745,345 | |||||||||
The accompanying notes are an integral part of the financial statements.
17
Unconstrained Bond Series
Investment Portfolio - December 31, 2015
| CREDIT RATING1 (UNAUDITED) | PRINCIPAL AMOUNT 2 | VALUE (NOTE 2) | ||||||||||
COMMERCIAL MORTGAGE-BACKED SECURITIES (continued) | ||||||||||||
JP Morgan Chase Commercial Mortgage Securities Trust, Series 2010-C2, Class A34, 4.07%, 11/15/2043 | AAA | 9 | 750,000 | $ | 788,047 | |||||||
JP Morgan Chase Commercial Mortgage Securities Trust, Series 2011-C4, Class A34, 4.106%, 7/1/2046 | AAA | 9 | 3,790,000 | 3,931,559 | ||||||||
JP Morgan Mortgage Trust, Series 2013-1, Class 1A23,4, 3.00%, 3/25/2043 | WR | 7 | 840,685 | 822,022 | ||||||||
JP Morgan Mortgage Trust, Series 2013-2, Class A23,4, 3.50%, 5/25/2043 | AAA | 9 | 1,011,798 | 1,018,281 | ||||||||
JP Morgan Mortgage Trust, Series 2014-2, Class 1A13,4, 3.00%, 6/25/2029 | AAA | 9 | 1,387,670 | 1,401,763 | ||||||||
LSTAR Commercial Mortgage Trust, Series 2014-2, Class A24, 2.767%, 1/20/2041 | Aaa | 1,369,362 | 1,361,496 | |||||||||
Morgan Stanley Capital I Trust, Series 2006-HQ10, Class A4, 5.328%, 11/12/2041 | Aaa | 1,623,446 | 1,636,248 | |||||||||
Morgan Stanley Capital I Trust, Series 2011-C1, Class A24, 3.884%, 9/15/2047 | AAA | 9 | 30,895 | 30,892 | ||||||||
Motel 6 Trust, Series 2015-MTL6, Class B4, 3.298%, 2/5/2030 | WR | 7 | 1,900,000 | 1,879,460 | ||||||||
New Residential Mortgage Loan Trust, Series 2014-3A, Class AFX33,4, 3.75%, 11/25/2054 | AAA | 9 | 1,583,670 | 1,609,092 | ||||||||
New Residential Mortgage Loan Trust, Series 2015-2A, Class A13, 3.75%, 8/25/2055 | Aaa | 2,161,437 | 2,192,825 | |||||||||
OBP Depositor LLC Trust, Series 2010-OBP, Class A4, 4.646%, 7/15/2045 | AAA | 9 | 420,000 | 452,517 | ||||||||
SCG Trust, Series 2013-SRP1, Class AJ3,4, 2.281%, 11/15/2026 | AAA | 9 | 2,000,000 | 1,987,922 | ||||||||
Sequoia Mortgage Trust, Series 2012-2, Class A23, 3.50%, 4/25/2042 | WR | 7 | 594,651 | 598,958 | ||||||||
Sequoia Mortgage Trust, Series 2013-2, Class A3, 1.874%, 2/25/2043 | AAA | 9 | 1,032,735 | 943,218 | ||||||||
Sequoia Mortgage Trust, Series 2013-7, Class A23, 3.00%, 6/25/2043 | AAA | 9 | 822,364 | 803,603 | ||||||||
Sequoia Mortgage Trust, Series 2013-8, Class A13, 3.00%, 6/25/2043 | Aaa | 1,110,418 | 1,075,023 | |||||||||
Vornado DP LLC Trust, Series 2010-VNO, Class A2FX4, 4.004%, 9/13/2028 | AAA | 9 | 1,195,000 | 1,260,349 | ||||||||
Wachovia Bank Commercial Mortgage Trust, Series 2006-C26, Class A33, 6.011%, 6/15/2045 | Aaa | 1,166,758 | 1,172,443 | |||||||||
Wells Fargo Commercial Mortgage Trust, Series 2010-C1, Class A24, 4.393%, 11/15/2043 | Aaa | 1,350,000 | 1,440,353 | |||||||||
WF-RBS Commercial Mortgage Trust, Series 2011-C2, Class A43,4, 4.869%, 2/15/2044 | Aaa | 1,550,000 | 1,692,662 | |||||||||
WinWater Mortgage Loan Trust, Series 2015-1, Class A13,4, 3.50%, 1/20/2045 | WR | 7 | 1,561,243 | 1,575,393 | ||||||||
WinWater Mortgage Loan Trust, Series 2015-3, Class A53,4, 3.50%, 3/20/2045 | Aaa | 1,887,004 | 1,913,378 | |||||||||
|
| |||||||||||
TOTAL COMMERCIAL MORTGAGE-BACKED SECURITIES | ||||||||||||
(Identified Cost $75,080,574) | 73,897,542 | |||||||||||
|
| |||||||||||
FOREIGN GOVERNMENT BONDS - 3.1% | ||||||||||||
Brazilian Government International Bond (Brazil), 8.875%, 10/14/2019 | Baa3 | 1,300,000 | 1,452,750 | |||||||||
The accompanying notes are an integral part of the financial statements.
18
Unconstrained Bond Series
Investment Portfolio - December 31, 2015
| CREDIT RATING1 (UNAUDITED) | PRINCIPAL AMOUNT 2 | VALUE (NOTE 2) | ||||||||||
FOREIGN GOVERNMENT BONDS (continued) | ||||||||||||
Brazilian Government International Bond (Brazil), 4.25%, 1/7/2025 | Baa3 | 4,400,000 | $ | 3,542,000 | ||||||||
Chile Government (Chile), 5.50%, 8/5/2020 | Aa3 | CLP | 1,800,000,000 | 2,614,034 | ||||||||
Korea Treasury Bond (South Korea), 2.00%, 12/10/2017 | WR | 7 | KRW | 5,000,000,000 | 4,292,350 | |||||||
Malaysia Government Bond (Malaysia), 4.262%, 9/15/2016 | A3 | MYR | 8,905,000 | 2,103,159 | ||||||||
Mexican Government Bond (Mexico), 5.00%, 6/15/2017 | A3 | MXN | 64,000,000 | 3,766,677 | ||||||||
Mexican Government Bond (Mexico), 8.00%, 6/11/2020 | A3 | MXN | 35,000,000 | 2,234,852 | ||||||||
Mexican Government Bond (Mexico), 6.50%, 6/9/2022 | A3 | MXN | 126,000,000 | 7,522,780 | ||||||||
|
| |||||||||||
TOTAL FOREIGN GOVERNMENT BONDS | ||||||||||||
(Identified Cost $33,535,571) | 27,528,602 | |||||||||||
|
| |||||||||||
U.S. TREASURY SECURITIES - 2.0% | ||||||||||||
U.S. Treasury Notes - 2.0% | ||||||||||||
U.S. Treasury Inflation Indexed Notes, 0.125%, 4/15/2020 | ||||||||||||
(Identified Cost $17,955,762) | 18,128,817 | 17,897,729 | ||||||||||
|
| |||||||||||
U.S. GOVERNMENT AGENCIES - 2.2% | ||||||||||||
Mortgage-Backed Securities - 2.2% | ||||||||||||
Fannie Mae, Pool #888468, 5.50%, 9/1/2021 | 774,604 | 831,308 | ||||||||||
Fannie Mae, Pool #995233, 5.50%, 10/1/2021 | 62,926 | 66,965 | ||||||||||
Fannie Mae, Pool #888017, 6.00%, 11/1/2021 | 76,399 | 82,856 | ||||||||||
Fannie Mae, Pool #995329, 5.50%, 12/1/2021 | 530,831 | 568,872 | ||||||||||
Fannie Mae, Pool #888136, 6.00%, 12/1/2021 | 95,444 | 103,649 | ||||||||||
Fannie Mae, Pool #888810, 5.50%, 11/1/2022 | 924,486 | 989,041 | ||||||||||
Fannie Mae, Pool #AD0462, 5.50%, 10/1/2024 | 59,431 | 64,882 | ||||||||||
Fannie Mae, Pool #MA0115, 4.50%, 7/1/2029 | 169,037 | 183,418 | ||||||||||
Fannie Mae, Pool #MA1834, 4.50%, 2/1/2034 | 575,594 | 625,091 | ||||||||||
Fannie Mae, Pool #MA1890, 4.00%, 5/1/2034 | 1,230,606 | 1,316,840 | ||||||||||
Fannie Mae, Pool #918516, 5.50%, 6/1/2037 | 285,956 | 319,478 | ||||||||||
Fannie Mae, Pool #933731, 5.50%, 4/1/2038 | 323,700 | 360,716 | ||||||||||
Fannie Mae, Pool #889624, 5.50%, 5/1/2038 | 400,660 | 447,704 | ||||||||||
Fannie Mae, Pool #995876, 6.00%, 11/1/2038 | 1,002,259 | 1,132,752 | ||||||||||
Fannie Mae, Pool #AD0307, 5.50%, 1/1/2039 | 400,429 | 447,618 | ||||||||||
Freddie Mac, Pool #G11850, 5.50%, 7/1/2020 | 271,932 | 287,255 | ||||||||||
Freddie Mac, Pool #G12610, 6.00%, 3/1/2022 | 93,785 | 102,104 | ||||||||||
Freddie Mac, Pool #G12655, 6.00%, 5/1/2022 | 67,482 | 73,427 | ||||||||||
Freddie Mac, Pool #G12988, 6.00%, 1/1/2023 | 51,458 | 55,843 | ||||||||||
Freddie Mac, Pool #G13078, 6.00%, 3/1/2023 | 92,251 | 100,363 | ||||||||||
Freddie Mac, Pool #G13331, 5.50%, 10/1/2023 | 40,066 | 43,328 | ||||||||||
Freddie Mac, Pool #C91359, 4.50%, 2/1/2031 | 392,418 | 426,251 | ||||||||||
Freddie Mac, Pool #D98711, 4.50%, 7/1/2031 | 986,724 | 1,071,925 | ||||||||||
Freddie Mac, Pool #C91746, 4.50%, 12/1/2033 | 994,265 | 1,079,794 | ||||||||||
Freddie Mac, Pool #C91754, 4.50%, 3/1/2034 | 287,116 | 311,506 | ||||||||||
Freddie Mac, Pool #K92054, 4.00%, 10/1/2034 | 1,291,799 | 1,382,061 | ||||||||||
The accompanying notes are an integral part of the financial statements.
19
Unconstrained Bond Series
Investment Portfolio - December 31, 2015
| PRINCIPAL AMOUNT 2/ SHARES | VALUE (NOTE 2) | |||||||
U.S. GOVERNMENT AGENCIES (continued) | ||||||||
Mortgage-Backed Securities (continued) | ||||||||
Freddie Mac, Pool #C91811, 4.00%, 1/1/2035 | 1,941,624 | $ | 2,075,010 | |||||
Freddie Mac, Pool #G07655, 5.50%, 12/1/2035 | 1,013,228 | 1,125,601 | ||||||
Freddie Mac, Pool #G04176, 5.50%, 5/1/2038 | 432,702 | 481,435 | ||||||
Freddie Mac, Pool #A78227, 5.50%, 6/1/2038 | 510,464 | 565,060 | ||||||
Freddie Mac, Pool #G05956, 5.50%, 7/1/2038 | 348,331 | 387,537 | ||||||
Freddie Mac, Pool #G05671, 5.50%, 8/1/2038 | 38,254 | 42,547 | ||||||
Freddie Mac, Pool #G05900, 6.00%, 3/1/2040 | 336,201 | 379,711 | ||||||
Freddie Mac, Pool #G07589, 5.50%, 6/1/2041 | 1,180,646 | 1,313,489 | ||||||
|
| |||||||
TOTAL U.S. GOVERNMENT AGENCIES | ||||||||
(Identified Cost $18,469,176) | 18,845,437 | |||||||
|
| |||||||
SHORT-TERM INVESTMENT - 3.5% | ||||||||
Dreyfus Cash Management, Inc. - Institutional Shares13, 0.23%, | ||||||||
(Identified Cost $30,743,561) | 30,743,561 | 30,743,561 | ||||||
|
| |||||||
TOTAL INVESTMENTS - 98.3% | ||||||||
(Identified Cost $883,652,895) | 858,773,024 | |||||||
OTHER ASSETS, LESS LIABILITIES - 1.7% | 14,586,218 | |||||||
|
| |||||||
NET ASSETS - 100% | $ | 873,359,242 | ||||||
|
| |||||||
| FUTURES CONTRACTS: LONG POSITIONS OPEN AT DECEMBER 31, 2015: | ||||||||||||||
CONTRACTS PURCHASED | ISSUE | EXCHANGE | EXPIRATION | NOTIONAL VALUE2 | UNREALIZED (DEPRECIATION) | |||||||||
53 | Euro-Bund | Eurex | March 2016 | 9,095,884 | $ | (17,415 | ) | |||||||
| ||||||||||||||
| FUTURES CONTRACTS: SHORT POSITIONS OPEN AT DECEMBER 31, 2015: | ||||||||||||||
CONTRACTS SOLD | ISSUE | EXCHANGE | EXPIRATION | NOTIONAL VALUE2 | UNREALIZED APPRECIATION/ (DEPRECIATION) | |||||||||
59 | Euro-OAT | Eurex | March 2016 | 9,620,994 | $ | 43,939 | ||||||||
7 | Japanese Government Bonds (10 Year) | Osaka | March 2016 | 8,679,895 | (23,332 | ) | ||||||||
152 | U.S. Treasury Notes (5 Year) | CBOT | March 2016 | 17,984,686 | 31,878 | |||||||||
|
| |||||||||||||
Total | 52,485 | |||||||||||||
|
| |||||||||||||
The accompanying notes are an integral part of the financial statements.
20
Unconstrained Bond Series
Investment Portfolio - December 31, 2015
CBOT - Chicago Board of Trade
CLP - Chilean Peso
IO - Interest only
MXN - Mexican Peso
MYR - Malaysian Ringgit
##Less than 0.1%.
*Non-income producing security.
1Credit ratings from Moody’s (unaudited).
2Amount is stated in USD unless otherwise noted.
3The coupon rate is floating and is the effective rate as of December 31, 2015.
4Restricted securities - Investment in securities that are restricted as to public resale under the Securities Act of 1933, as amended. These securities have been sold under rule 144A and have been determined to be liquid under guidelines established by the Board of Directors. These securities amount to $213,246,264 or 24.4%, of the Series’ net assets as of December 31, 2015 (see Note 2 to the financial statements).
5Security is perpetual in nature and has no stated maturity date.
6The rate shown is a fixed rate as of December 31, 2015; the rate becomes floating, based on U.S. Treasury Yield Curve Rate Treasury Note Constant Maturity 5 Year in June 2017.
7Credit rating has been withdrawn. As of December 31, 2015, there is no rating available (unaudited).
8The rate shown is a fixed rate as of December 31, 2015; the rate becomes floating, based on LIBOR plus a spread, in December 2024.
9Credit ratings from S&P (unaudited).
10The rate shown is a fixed rate as of December 31, 2015; the rate becomes floating, based on LIBOR plus a spread, in September 2022.
11Represents a Payment-In-Kind bond.
12Issuer filed for bankruptcy and/or is in default of interest payments.
13Rate shown is the current yield as of December 31, 2015.
The Global Industry Classification Standard (GICS) was developed by and is the exclusive property and a service mark of MSCI Inc. (MSCI) and Standard & Poor’s, a division of The McGraw-Hill Companies, Inc. (S&P), and is licensed for use by Manning & Napier when referencing GICS sectors. Neither MSCI, S&P, nor any third party involved in making or compiling the GICS or any GICS classifications makes any express or implied warranties or representations with respect to such standard or classification, nor shall any such party have any liability therefrom.
The accompanying notes are an integral part of the financial statements.
21
Unconstrained Bond Series
Statement of Assets and Liabilities
December 31, 2015
ASSETS: | ||||
Investments, at value (identified cost $883,652,895) (Note 2) | $ | 858,773,024 | ||
Cash | 81,730 | |||
Foreign currency (identified cost $4,934) | 4,963 | |||
Deposits at broker for futures contracts | 1,004,019 | |||
Receivable for securities sold | 8,607,288 | |||
Interest receivable | 7,809,556 | |||
Receivable for fund shares sold | 530,234 | |||
Prepaid and other expenses | 1,053 | |||
|
| |||
TOTAL ASSETS | 876,811,867 | |||
|
| |||
LIABILITIES: | ||||
Accrued management fees (Note 3) | 347,369 | |||
Accrued shareholder services fees (Class S) (Note 3) | 178,348 | |||
Accrued fund accounting and administration fees (Note 3) | 52,218 | |||
Accrued transfer agent fees (Note 3) | 4,928 | |||
Accrued Chief Compliance Officer service fees (Note 3) | 429 | |||
Variation margin payable on futures contracts | 21,375 | |||
Payable for fund shares repurchased | 2,799,622 | |||
Other payables and accrued expenses | 48,336 | |||
|
| |||
TOTAL LIABILITIES | 3,452,625 | |||
|
| |||
TOTAL NET ASSETS | $ | 873,359,242 | ||
|
| |||
NET ASSETS CONSIST OF: | ||||
Capital stock | $ | 867,370 | ||
Additional paid-in-capital | 899,260,882 | |||
Distributions in excess of net investment income | (1,031,069 | ) | ||
Accumulated net realized loss on investments, foreign currency and translation of other assets and liabilities | (891,985 | ) | ||
Net unrealized depreciation on investments, foreign currency and translation of other assets and liabilities | (24,845,956 | ) | ||
|
| |||
TOTAL NET ASSETS | $ | 873,359,242 | ||
|
| |||
NET ASSET VALUE, OFFERING PRICE AND REDEMPTION PRICE PER SHARE - Class S | ||||
($835,610,257/82,597,418 shares) | $ | 10.12 | ||
|
| |||
NET ASSET VALUE, OFFERING PRICE AND REDEMPTION PRICE PER SHARE - Class I | ||||
($37,748,985/4,139,558 shares) | $ | 9.12 | ||
|
| |||
The accompanying notes are an integral part of the financial statements.
22
Unconstrained Bond Series
Statement of Operations
For the Year Ended December 31, 2015
INVESTMENT INCOME: | ||||
Interest | $ | 26,629,159 | ||
Dividends | 707,263 | |||
|
| |||
Total Investment Income | 27,336,422 | |||
|
| |||
EXPENSES: | ||||
Management fees (Note 3) | 3,687,737 | |||
Shareholder services fees (Class S) (Note 3) | 1,911,182 | |||
Fund accounting and administration fees (Note 3) | 153,905 | |||
Directors’ fees (Note 3) | 31,299 | |||
Transfer agent fees (Note 3) | 14,105 | |||
Chief Compliance Officer service fees (Note 3) | 2,541 | |||
Custodian fees | 40,944 | |||
Miscellaneous | 142,671 | |||
|
| |||
Total Expenses | 5,984,384 | |||
|
| |||
NET INVESTMENT INCOME | 21,352,038 | |||
|
| |||
REALIZED AND UNREALIZED GAIN (LOSS) ON INVESTMENTS AND FOREIGN CURRENCY: | ||||
Net realized gain (loss) on- | ||||
Investments | 2,403,235 | |||
Futures Contracts | (51,906 | ) | ||
Foreign currency transactions and translation of other assets and liabilities | (1,236,371 | ) | ||
|
| |||
| 1,114,958 | ||||
|
| |||
Net change in unrealized appreciation (depreciation) on- | ||||
Investments | (30,795,340 | ) | ||
Futures Contracts | 35,070 | |||
Foreign currency and translation of other assets and liabilities | 1,982 | |||
|
| |||
| (30,758,288 | ) | |||
|
| |||
NET REALIZED AND UNREALIZED GAIN (LOSS) ON INVESTMENTS AND FOREIGN CURRENCY | (29,643,330 | ) | ||
|
| |||
NET DECREASE IN NET ASSETS RESULTING FROM OPERATIONS | $ | (8,291,292 | ) | |
|
| |||
The accompanying notes are an integral part of the financial statements.
23
Unconstrained Bond Series
Statements of Changes in Net Assets
| FOR THE YEAR ENDED 12/31/15 | FOR THE YEAR ENDED 12/31/14 | |||||||
INCREASE IN NET ASSETS: | ||||||||
OPERATIONS: | ||||||||
Net investment income | $ | 21,352,038 | $ | 23,039,953 | ||||
Net realized gain on investments and foreign currency | 1,114,958 | 12,001,464 | ||||||
Net change in unrealized appreciation (depreciation) on investments and foreign currency | (30,758,288 | ) | (13,554,963 | ) | ||||
|
|
|
| |||||
Net increase (decrease) from operations | (8,291,292 | ) | 21,486,454 | |||||
|
|
|
| |||||
DISTRIBUTIONS TO SHAREHOLDERS (Note 8): | ||||||||
From net investment income (Class S) | (19,694,013 | ) | (20,951,102 | ) | ||||
From net investment income (Class I) | (1,451,018 | ) | (2,159,679 | ) | ||||
From net realized gain on investments (Class S) | (4,059,004 | ) | (7,741,329 | ) | ||||
From net realized gain on investments (Class I) | (210,806 | ) | (979,791 | ) | ||||
From return of capital (Class S) | (443,735 | ) | — | |||||
From return of capital (Class I) | (32,692 | ) | — | |||||
|
|
|
| |||||
Total distributions to shareholders | (25,891,268 | ) | (31,831,901 | ) | ||||
|
|
|
| |||||
CAPITAL STOCK ISSUED AND REPURCHASED: | ||||||||
Net increase from capital share transactions (Note 5) | 148,033,400 | 96,977,718 | ||||||
|
|
|
| |||||
Net increase in net assets | 113,850,840 | 86,632,271 | ||||||
NET ASSETS: | ||||||||
Beginning of year | 759,508,402 | 672,876,131 | ||||||
|
|
|
| |||||
End of year (including distributions in excess of net investment income $1,031,069 and undistributed net investment income of $0, respectively) | $ | 873,359,242 | $ | 759,508,402 | ||||
|
|
|
| |||||
The accompanying notes are an integral part of the financial statements.
24
Unconstrained Bond Series
Financial Highlights - Class S*
| FOR THE YEARS ENDED | ||||||||||||||||||||
| 12/31/15 | 12/31/14 | 12/31/13 | 12/31/12 | 12/31/11 | ||||||||||||||||
Per share data (for a share outstanding throughout each year): | ||||||||||||||||||||
Net asset value - Beginning of year | $ | 10.53 | $ | 10.65 | $ | 11.27 | $ | 10.67 | $ | 10.96 | ||||||||||
|
|
|
|
|
|
|
|
|
| |||||||||||
Income (loss) from investment operations: | ||||||||||||||||||||
Net investment income1 | 0.27 | 0.34 | 0.37 | 0.45 | 0.51 | |||||||||||||||
Net realized and unrealized gain (loss) on investments | (0.36 | ) | (0.00 | )2 | (0.38 | ) | 0.70 | 0.03 | ||||||||||||
|
|
|
|
|
|
|
|
|
| |||||||||||
Total from investment operations | (0.09 | ) | 0.34 | (0.01 | ) | 1.15 | 0.54 | |||||||||||||
|
|
|
|
|
|
|
|
|
| |||||||||||
Less distributions to shareholders: | ||||||||||||||||||||
From net investment income | (0.26 | ) | (0.34 | ) | (0.37 | ) | (0.45 | ) | (0.51 | ) | ||||||||||
From net realized gain on investments | (0.05 | ) | (0.12 | ) | (0.24 | ) | (0.10 | ) | (0.32 | ) | ||||||||||
From return of capital | (0.01 | ) | — | — | — | — | ||||||||||||||
|
|
|
|
|
|
|
|
|
| |||||||||||
Total distributions to shareholders | (0.32 | ) | (0.46 | ) | (0.61 | ) | (0.55 | ) | (0.83 | ) | ||||||||||
|
|
|
|
|
|
|
|
|
| |||||||||||
Net asset value - End of year | $ | 10.12 | $ | 10.53 | $ | 10.65 | $ | 11.27 | $ | 10.67 | ||||||||||
|
|
|
|
|
|
|
|
|
| |||||||||||
Net assets - End of year (000’s omitted) | $ | 835,610 | $ | 680,719 | $ | 653,668 | $ | 631,082 | $ | 569,583 | ||||||||||
|
|
|
|
|
|
|
|
|
| |||||||||||
Total return3 | (0.88 | %) | 3.18 | % | (0.02 | %) | 10.94 | % | 4.91 | % | ||||||||||
Ratios (to average net assets)/Supplemental Data: | ||||||||||||||||||||
Expenses** | 0.75 | % | 0.75 | % | 0.75 | % | 0.75 | % | 0.75 | % | ||||||||||
Net investment income | 2.58 | % | 3.16 | % | 3.35 | % | 4.01 | % | 4.56 | % | ||||||||||
Portfolio turnover | 81 | % | 53 | % | 49 | % | 41 | % | 35 | % | ||||||||||
*Effective August 1, 2013, the shares of the Series have been designated as Class S. **The investment advisor did not impose all or a portion of its management and/or other fees, and in some periods may have paid a portion of the Series’ expenses. If these expenses had been incurred by the Series, the expense ratio (to average net assets) would have increased by the following amounts: |
| |||||||||||||||||||
| N/A | N/A | 0.00 | %4 | N/A | N/A | |||||||||||||||
1Calculated based on average shares outstanding during the years.
2Less than $(0.01).
3Represents aggregate total return for the years indicated, and assumes reinvestment of all distributions. Total return would have been lower had certain expenses not been waived or reimbursed during certain years.
4Less than 0.01%.
The accompanying notes are an integral part of the financial statements.
25
Unconstrained Bond Series
Financial Highlights - Class I
| FOR THE YEARS ENDED | FOR THE PERIOD 8/1/131 TO | |||||||||||
| 12/31/15 | 12/31/14 | 12/31/13 | ||||||||||
Per share data (for a share outstanding throughout each period): | ||||||||||||
Net asset value - Beginning of period | $ | 9.52 | $ | 9.68 | $ | 10.00 | ||||||
|
|
|
|
|
| |||||||
Income (loss) from investment operations: | ||||||||||||
Net investment income2 | 0.29 | 0.34 | 0.15 | |||||||||
Net realized and unrealized gain (loss) on investments | (0.34 | ) | (0.02 | ) | 0.00 | 3 | ||||||
|
|
|
|
|
| |||||||
Total from investment operations | (0.05 | ) | 0.32 | 0.15 | ||||||||
|
|
|
|
|
| |||||||
Less distributions to shareholders: | ||||||||||||
From net investment income | (0.29 | ) | (0.36 | ) | (0.23 | ) | ||||||
From net realized gain on investments | (0.05 | ) | (0.12 | ) | (0.24 | ) | ||||||
From return of capital | (0.01 | ) | — | — | ||||||||
|
|
|
|
|
| |||||||
Total distributions to shareholders | (0.35 | ) | (0.48 | ) | (0.47 | ) | ||||||
|
|
|
|
|
| |||||||
Net asset value - End of period | $ | 9.12 | $ | 9.52 | $ | 9.68 | ||||||
|
|
|
|
|
| |||||||
Net assets - End of period (000’s omitted) | $ | 37,749 | $ | 78,789 | $ | 19,209 | ||||||
|
|
|
|
|
| |||||||
Total return4 | (0.59 | %) | 3.36 | % | 1.60 | % | ||||||
Ratios (to average net assets)/Supplemental Data: | ||||||||||||
Expenses* | 0.50 | % | 0.50 | % | 0.50 | %5 | ||||||
Net investment income | 3.00 | % | 3.42 | % | 3.55 | %5 | ||||||
Portfolio turnover | 81 | % | 53 | % | 49 | % | ||||||
| *The investment advisor did not impose all or a portion of its management and/or other fees, and in some periods may have paid a portion of the Series’ expenses. If these expenses had been incurred by the Series, the expense ratio (to average net assets) would have increased by the following amounts: | ||||||||||||
| N/A | N/A | 0.00 | %5,6 | |||||||||
1Commencement of operations.
2Calculated based on average shares outstanding during the periods.
3Less than $0.01 per share.
4Represents aggregate total return for the periods indicated, and assumes reinvestment of all distributions. Total return would have been lower had certain expenses not been waived during certain periods. Periods less than one year are not annualized.
5Annualized.
6Less than 0.01%.
The accompanying notes are an integral part of the financial statements.
26
Unconstrained Bond Series
Notes to Financial Statements
| 1. | Organization |
Unconstrained Bond Series, formerly known as Core Plus Bond Series, (the “Series”) is a no-load diversified series of Manning & Napier Fund, Inc. (the “Fund”). The Fund is organized in Maryland and is registered under the Investment Company Act of 1940, as amended, as an open-end management investment company.
The Series’ primary investment objective is to provide long-term total return, and its secondary objective is to provide preservation of capital.
The Fund’s advisor is Manning & Napier Advisors, LLC (the “Advisor”). Shares of the Series are offered to investors, clients and employees of the Advisor and its affiliates. The Series is authorized to issue two classes of shares (Class S and Class I). Each class of shares is substantially the same except the Class S shares bear shareholder services fees. The total authorized capital stock of the Fund consists of 15 billion shares of common stock each having a par value of $0.01. As of December 31, 2015, 10.7 billion shares have been designated in total among 41 series, of which 125 million have been designated as Unconstrained Bond Series Class S common stock and 100 million have been designated as Unconstrained Bond Series Class I common stock.
| 2. | Significant Accounting Policies |
The following is a summary of significant accounting policies followed by the Series. The Series is an investment company and, accordingly, follows the investment company accounting and reporting guidance of the Financial Accounting Standards Board Accounting Standards Codification Topic 946 - Investment Companies, which is part of accounting principles generally accepted in the United States of America (“GAAP”).
Security Valuation
Portfolio securities, including domestic equities, foreign equities, warrants and options, listed on an exchange other than the NASDAQ Stock Market are valued at the latest quoted sales price of the exchange on which the security is primarily traded. Securities not traded on valuation date or securities not listed on an exchange are valued at the latest quoted bid price provided by the Fund’s pricing service. Securities listed on the NASDAQ Stock Market are valued in accordance with the NASDAQ Official Closing Price.
Debt securities, including government bonds, foreign bonds, asset-backed securities, structured notes, supranational obligations, sovereign bonds, corporate bonds, loan assignments, and mortgage-backed securities will normally be valued on the basis of evaluated bid prices provided directly by an independent pricing service. The pricing services use multiple valuation techniques to determine fair value. In instances where sufficient market activity exists, the pricing services may utilize a market-based approach through which quotes from market makers are used to determine fair value. In instances where sufficient market activity may not exist or is limited, the pricing services also utilize proprietary valuation models which may consider market characteristics such as benchmark yield curves, option-adjusted spreads, credit spreads, estimated default rates, coupon rates, anticipated timing of principal repayments, underlying collateral, and other unique security features in order to estimate the relevant cash flows, which are then discounted to calculate the fair value. Certain investments in securities held by the Series may be valued on a basis of a price provided directly by a principal market maker. These prices may differ from the value that would have been used had a broader market for securities existed.
The fair value of loan assignments is estimated using recently executed transactions, market price quotations, credit/market events, and cross-asset pricing. Inputs are generally observable market inputs obtained from independent sources. Loan assignments are generally categorized in Level 2 of the fair value hierarchy, unless key inputs are unobservable, in which case they would be categorized in Level 3.
Municipal securities will normally be valued on the basis of market valuations provided by an independent pricing service (the “Service”). The Service utilizes the latest price quotations and a matrix system (which considers such factors as security prices of similar securities, yields, maturities and ratings). The Service has been approved by the Fund’s Board of Directors (the “Board”).
27
Unconstrained Bond Series
Notes to Financial Statements (continued)
| 2. | Significant Accounting Policies (continued) |
Security Valuation (continued)
Short-term investments that mature in sixty days or less may be valued at amortized cost, which approximates fair value. Investments in open-end investment companies are valued at their net asset value per share on valuation date.
Volume and level of activity in established markets for an asset or liability are evaluated to determine whether recent transactions and quoted prices are determinative of fair value. Where there have been significant decreases in volume and level of activity, further analysis and adjustment may be necessary to estimate fair value. The Series measures fair value in these instances by the use of inputs and valuation techniques which may be based upon current market prices of securities that are comparable in coupon, rating, maturity and industry and/or expectation of future cash flows. As a result of trading in relatively thin markets and/or markets that experience significant volatility, the prices used by the Series to value these securities may differ from the value that would be realized if these securities were sold, and the differences could be material.
Securities for which representative valuations or prices are not available from the Series’ pricing service may be valued at fair value as determined in good faith by the Advisor under procedures approved by and under the general supervision and responsibility of the Fund’s Board of Directors (the “Board”). Due to the inherent uncertainty of valuations of such securities, the fair value may differ significantly from the values that would have been used had a ready market for such securities existed. If trading or events occurring after the close of the principal market in which securities are traded are expected to materially affect the value of those securities, then they may be valued at their fair value, taking this trading or these events into account.
Various inputs are used in determining the value of the Series’ assets or liabilities carried at fair value. These inputs are summarized in three broad levels. Level 1 includes quoted prices in active markets for identical assets and liabilities. Level 2 includes other significant observable inputs (including quoted prices for similar securities, interest rates, prepayment speeds, credit risk, etc.). Level 3 includes significant unobservable inputs (including the Series’ own assumptions in determining the fair value of investments). A financial instrument’s level within the fair value hierarchy is based on the lowest level of any input both individually and in aggregate that is significant to the fair value measurement. The inputs or methodology used for valuing securities are not necessarily an indication of the risk associated with investing in those securities.
The following is a summary of the valuation levels used for major security types as of December 31, 2015 in valuing the Series’ assets or liabilities carried at fair value:
| DESCRIPTION | TOTAL | LEVEL 1 | LEVEL 2 | LEVEL 3 | ||||||||||||
Assets: | ||||||||||||||||
Debt securities: | ||||||||||||||||
Loan assignments | $ | 77,744,525 | $ | — | $ | 77,744,525 | $ | — | ||||||||
U.S. Treasury and other U.S. Government agencies | 36,743,166 | — | 36,743,166 | — | ||||||||||||
Corporate debt: | ||||||||||||||||
Consumer Discretionary | 78,550,954 | — | 78,550,954 | — | ||||||||||||
Consumer Staples | 8,451,338 | — | 8,451,338 | — | ||||||||||||
Energy | 57,545,087 | — | 57,545,087 | — | ||||||||||||
Financials | 264,995,868 | — | 264,995,868 | — | ||||||||||||
Health Care | 16,154,466 | — | 16,154,466 | — | ||||||||||||
Industrials | 72,268,124 | — | 72,268,124 | — | ||||||||||||
Information Technology | 14,668,268 | — | 14,668,268 | — | ||||||||||||
Materials | 32,589,714 | — | 32,589,714 | — | ||||||||||||
Telecommunication Services | 30,901,282 | — | 30,901,282 | — | ||||||||||||
Utilities | 20,265,611 | — | 20,265,611 | — | ||||||||||||
Asset-backed securities | 15,724,916 | — | 15,724,916 | — | ||||||||||||
Commercial mortgage-backed securities | 73,897,542 | — | 73,897,542 | — | ||||||||||||
28
Unconstrained Bond Series
Notes to Financial Statements (continued)
| 2. | Significant Accounting Policies (continued) |
Security Valuation (continued)
| DESCRIPTION | TOTAL | LEVEL 1 | LEVEL 2 | LEVEL 3 | ||||||||||||
Foreign government bonds | 27,528,602 | — | 27,528,602 | — | ||||||||||||
Mutual fund | $ | 30,743,561 | $ | 30,743,561 | $ | — | $ | — | ||||||||
|
|
|
|
|
|
|
| |||||||||
Other financial instruments*: | ||||||||||||||||
Interest rate contracts | 75,817 | 75,817 | — | — | ||||||||||||
|
|
|
|
|
|
|
| |||||||||
Total assets | 858,848,841 | 30,819,378 | 828,029,463 | — | ||||||||||||
|
|
|
|
|
|
|
| |||||||||
Liabilities: | ||||||||||||||||
Other financial instruments*: | ||||||||||||||||
Interest rate contracts | (40,747 | ) | (40,747 | ) | — | — | ||||||||||
|
|
|
|
|
|
|
| |||||||||
Total liabilities | (40,747 | ) | (40,747 | ) | — | — | ||||||||||
|
|
|
|
|
|
|
| |||||||||
Total | $ | 858,808,094 | $ | 30,778,631 | $ | 828,029,463 | $ | — | ||||||||
|
|
|
|
|
|
|
| |||||||||
There were no Level 3 securities held by the Series as of December 31, 2014 or December 31, 2015.
*Other financial instruments are futures (Level 1). Futures are valued at the unrealized appreciation/depreciation on the instrument.
The Fund’s policy is to recognize transfers in and transfers out of the valuation levels as of the beginning of the reporting period. There were no transfers between Level 1 and Level 2 during the year ended December 31, 2015.
Security Transactions, Investment Income and Expenses
Security transactions are accounted for on trade date. Dividend income is recorded on the ex-dividend date, except that if the ex-dividend date has passed, certain dividends from foreign securities are recorded as soon as the Series is informed of the ex-dividend date. Non-cash dividends, if any, are recorded at the fair value of the securities received. Interest income, including amortization of premium and accretion of discounts using the effective interest method, is earned from settlement date and accrued daily.
Expenses are recorded on an accrual basis. Most expenses of the Fund can be attributed to a specific series. Expenses which cannot be directly attributed are apportioned among the series in the Fund in such a manner as deemed equitable by the Fund’s Board, taking into consideration, among other things, the nature and type of expense. Income, expenses (other than shareholder services fees), and realized and unrealized gains and losses are prorated among the classes based on the relative net assets of each class. Class specific examples are directly charged to that class.
The Series uses the identified cost method for determining realized gain or loss on investments for both financial statement and federal income tax reporting purposes.
Foreign Currency Translation
The books and records of the Series are maintained in U.S. dollars. Foreign currencies, investments and other assets and liabilities are translated into U.S. dollars at the current exchange rates. Purchases and sales of investment securities and income and expenses are translated on the respective dates of such transactions. The Series does not isolate realized and unrealized gains and losses attributable to changes in the exchange rates from gains and losses that arise from changes in the fair value of investments. Such fluctuations are included with net realized and unrealized gain or loss on investments. Net realized foreign currency gains and losses represent foreign currency gains and losses between trade date and settlement date on securities transactions, gains and losses on disposition of foreign currencies and the difference between the amount of income and foreign withholding taxes recorded on the books of the Series and the amounts actually received or paid.
Inflation-Indexed Bonds
Each Series may invest in inflation-indexed bonds. Inflation-indexed bonds are fixed income securities whose principal value is periodically adjusted according to the rate of inflation. If the index measuring inflation rises or falls, the principal value of
29
Unconstrained Bond Series
Notes to Financial Statements (continued)
| 2. | Significant Accounting Policies (continued) |
Inflation-Indexed Bonds (continued)
inflation-indexed bonds will be adjusted upward or downward, and consequently the interest payable on these securities (calculated with respect to a larger or smaller principal amount) will be increased or reduced, respectively. Any upward or downward adjustment in the principal amount of an inflation-indexed bond will be included as interest income in the Statement of Operations, even though investors do not receive their principal until maturity. Repayment of the original bond principal upon maturity (as adjusted for inflation) is guaranteed in the case of U.S. Treasury inflation-indexed bonds. For bonds that do not provide a similar guarantee, the adjusted principal value of the bond repaid at maturity may be less than the original principal.
Forward Foreign Currency Exchange Contracts
The Series may purchase or sell forward foreign currency exchange contracts in order to hedge a portfolio position or specific transaction. Risks may arise if the counterparties to a contract are unable to meet the terms of the contract or if the value of the foreign currency moves unfavorably.
All forward foreign currency exchange contracts are adjusted daily by the exchange rate of the underlying currency and, for financial statement purposes, any gain or loss is recorded as unrealized gain or loss until a contract has been closed.
The Series may regularly trade forward foreign currency exchange contracts with off-balance sheet risk in the normal course of its investing activities to assist in managing exposure to changes in foreign currency exchange rates.
The notional or contractual amount of these instruments represents the investment the Series has in forward foreign currency exchange contracts and does not necessarily represent the amounts potentially at risk. The measurement of the risks associated with forward foreign currency exchange contracts is meaningful only when all related and offsetting transactions are considered. The Series did not hold any forward foreign currency exchange contracts during the year ended December 31, 2015.
Futures
Each Series may purchase or sell exchange-traded futures contracts, which are contracts that obligate the Series to make or take delivery of a financial instrument or the cash value of a security index at a specified future date at a specified price. The Series may use futures contracts to manage exposure to the bond market or changes in interest rates and currency values, or for gaining exposure to markets. Risks of entering into futures contracts include the possibility that there may be an illiquid market at the time the Adviser to the Series may be attempting to sell some or all the Series holdings or that a change in the value of the contract may not correlate with changes in the value of the underlying securities. Upon entering into a futures contract, a Series is required to deposit either cash or securities (initial margin). Subsequent payments (variation margin) are made or received by the Series, generally on a daily basis. The variation margin payments are equal to the daily changes in the contract value and are recorded as unrealized gains or losses. The Series recognize a realized gain or loss when the contract is closed or expires.
Futures transactions involve minimal counterparty risk since futures contracts are guaranteed against default by the exchange on which they trade. The Series’ futures contracts are not subject to master netting arrangements (the right to close out all transactions traded with a counterparty, and net amounts owed or due across transactions).
The following table presents the present value of derivatives held at December 31, 2015 as reflected on the Statement of Assets and Liabilities, and the effect of derivative instruments on the Statement of Operations:
| STATEMENT OF ASSETS AND LIABILITIES | ||||||
Derivative | Assets Location | |||||
Interest rate contracts | Net unrealized appreciation1 | $ | 75,817 | |||
30
Unconstrained Bond Series
Notes to Financial Statements (continued)
| 2. | Significant Accounting Policies (continued) |
| STATEMENT OF ASSETS AND LIABILITIES | ||||||
Derivative | Liabilities Location | |||||
Interest rate contracts | Net unrealized depreciation1 | $ | (40,747 | ) | ||
| STATEMENT OF OPERATIONS | ||||||
Derivative | Location of Gain or (Loss) on Derivatives | | Realized Gain (Loss) on Derivatives | | ||
Interest rate contracts | Net realized loss on futures contracts | $ | (51,906 | ) | ||
Derivative | Location of Appreciation (Depreciation) on Derivatives | | Unrealized Appreciation (Depreciation) on Derivatives | | ||
Interest rate contracts | Net change in unrealized appreciation on futures contracts | $ | 35,070 | |||
1Includes cumulative appreciation/depreciation on futures contracts as reported in the Investment Portfolios, and is included within Net Assets as the components of capital are not required to be presented separately on the Statements of Assets and Liabilities. Only the current day’s variation margin is reported within the Statements of Assets and Liabilities.
The average month-end balances for the year ended December 31, 2015, the period in which such derivatives were outstanding, were as follows:
| UNCONSTRAINED BOND SERIES | ||||
Futures Contracts: | ||||
Average number of contracts purchased | 52 | |||
Average number of contracts sold | 99 | |||
Average notional value of contracts purchased | $ | 8,972,495 | ||
Average notional value of contracts sold | $ | 20,110,900 | ||
Securities Purchased on a When-Issued Basis or Forward Commitment
The Series may purchase securities on a when-issued basis or forward commitment. These transactions involve a commitment by the Series to purchase securities for a predetermined price with payment and delivery taking place beyond the customary settlement period. When such purchases are outstanding, the Series will designate liquid assets in an amount sufficient to meet the purchase price. When purchasing a security on a delayed delivery basis, the Series assumes the rights and risks of ownership of the security, including the risk of price and yield fluctuations, and takes such fluctuations into account when determining its net asset value. The Series may sell the when-issued securities before they are delivered, which may result in a capital gain or loss. No such investments were held by the Series on December 31, 2015.
In connection with its ability to purchase or sell securities on a forward commitment basis, the Series may enter into forward roll transactions principally using To Be Announced (TBA) securities. Forward roll transactions require the sale of securities for delivery in the current month, and a simultaneous agreement to repurchase substantially similar (same type, coupon and maturity) securities on a specified future date. Risks of entering into forward roll transactions include the potential inability of the counterparty to meet the terms of the agreement; the potential of the Series to receive inferior securities at redelivery as compared to the securities sold to the counterparty; counterparty credit risk; and the potential pay down speed variance between the mortgage-backed pools. During the roll period, the Series forgoes principal and interest paid on the securities. The Series accounts for such dollar rolls as purchases and sales. Information regarding securities purchased on a when-issued basis is included in the Series’ Investment Portfolio. No such investments were held by the Series on December 31, 2015.
31
Unconstrained Bond Series
Notes to Financial Statements (continued)
| 2. | Significant Accounting Policies (continued) |
Restricted Securities
Restricted securities are purchased in private placement transactions, are not registered under the Securities Act of 1933, as amended, and may have contractual restrictions on resale. Information regarding restricted securities is included at the end of the Series’ Investment Portfolio.
Illiquid Securities
A security may be considered illiquid if so deemed in good faith by the Advisor under procedures approved by and under the general supervision and responsibility of the Fund’s Board. Securities that are illiquid are marked with the applicable footnote on the Investment Portfolio. No such investments were held by the Series on December 31, 2015.
Federal Taxes
The Series’ policy is to comply with the provisions of the Internal Revenue Code applicable to regulated investment companies. The Series is not subject to federal income tax or excise tax to the extent that the Series distributes to shareholders each year its taxable income, including any net realized gains on investments, in accordance with requirements of the Internal Revenue Code. Accordingly, no provision for federal income tax or excise tax has been made in the financial statements.
Management evaluates its tax positions to determine if the tax positions taken meet the minimum recognition threshold in connection with accounting for uncertainties in income tax positions taken or expected to be taken for the purposes of measuring and recognizing tax liabilities in the financial statements. Recognition of tax benefits of an uncertain tax position is required only when the position is “more likely than not” to be sustained assuming examination by taxing authorities.
At December 31, 2015, the Series has recorded no liability for net unrecognized tax benefits relating to uncertain income tax positions taken or expected to be taken in future tax returns.
The Series files income tax returns in the U.S. federal jurisdiction, various states and foreign jurisdictions, as required. No income tax returns are currently under investigation. The statute of limitations on the Series’ tax returns remains open for the years ended December 31, 2012 through December 31, 2015. The Series is not aware of any tax positions for which it is reasonably possible that the total amounts of unrecognized tax benefits will significantly change in the next twelve months.
Foreign Taxes
Based on the Series’ understanding of the tax rules and rates related to income, gains and currency purchase/repatriation transactions for foreign jurisdictions in which it invests, the Series will provide for foreign taxes, and where appropriate, deferred foreign tax.
Distributions of Income and Gains
Distributions to shareholders of net investment income are made quarterly. Distributions of net realized gains are made annually. An additional distribution may be necessary to avoid taxation of the Series. Distributions are recorded on the ex-dividend date.
Indemnifications
The Fund’s organizational documents provide former and current directors and officers with a limited indemnification against liabilities arising in connection with the performance of their duties to the Fund. In the normal course of business, the Fund may also enter into contracts that provide general indemnifications. The Fund’s maximum exposure under these arrangements is unknown as this would be dependent on future claims that may be made against the Fund. The risk of material loss from such claims is considered remote.
Other
The preparation of financial statements in conformity with GAAP requires management to make estimates and assumptions that affect the reported amounts of assets and liabilities and the disclosure of contingent assets and liabilities at the date of the financial statements and the reported amounts of income and expenses during the reporting period. Actual results could differ from those estimates.
32
Unconstrained Bond Series
Notes to Financial Statements (continued)
| 3. | Transactions with Affiliates |
The Fund has an Investment Advisory Agreement (the “Agreement”) with the Advisor, for which the Series pays a fee, computed daily and payable monthly, at an annual rate of 0.45% of the Series’ average daily net assets.
Under the Agreement, personnel of the Advisor provide the Series with advice and assistance in the choice of investments and the execution of securities transactions, and otherwise maintain the Series’ organization. The Advisor also provides the Fund with necessary office space and fund administration and support services. The salaries of all officers of the Fund (except a percentage of the Fund’s Chief Compliance Officer’s salary, which is paid by the Fund), and of all Directors who are “affiliated persons” of the Fund, or of the Advisor, and all personnel of the Fund, or of the Advisor, performing services relating to research, statistical and investment activities, are paid by the Advisor. Each “non-affiliated” Director receives an annual stipend, which is allocated among all the active series of the Fund. In addition, these Directors also receive a fee per Board meeting attended plus a fee for each committee meeting attended and are reimbursed for travel and other out-of-pocket expenses incurred by them in connection with attending such meetings. The Fund also has an Audit Committee Chair, who receives an additional annual stipend for this role.
The Class S shares of the Series are subject to a shareholder services fee in accordance with a shareholder services plan adopted by the Fund’s Board. The shareholder services fee is intended to compensate financial intermediaries, including affiliates of the Fund, in connection with the provision of direct client service, personal services, maintenance of shareholder accounts and reporting services. For these services, Class S of the Series pays a fee, computed daily and payable monthly, at an annual rate of 0.25% of the average daily net assets of Class S. The Fund has a Shareholder Services Agreement with the Advisor, for which the Advisor receives the shareholder services fee as stated above.
The Advisor has contractually agreed, until at least April 30, 2016, to waive its fee and, if necessary, pay other operating expenses of the Series in order to maintain total direct annual fund operating expenses for the Series, exclusive of each share class’ shareholder services fee, at no more than 0.50% of average daily net assets each year. For the year ended December 31, 2015, the Advisor did not waive fees or reimburse expenses for the Series. The Advisor is not eligible to recoup any expenses that have been waived or reimbursed in prior years.
Manning & Napier Investor Services, Inc., a registered broker-dealer affiliate of the Advisor, acts as distributor for the Fund’s shares. The services of Manning & Napier Investor Services, Inc. are provided at no additional cost to the Series.
Pursuant to a master services agreement dated November 1, 2014, the Fund pays the Advisor an annual fee related to fund accounting and administration of 0.0085% on the first $25 billion of average daily net assets (excluding Target Series and Strategic Income Series); 0.0075% on the next $15 billion of average daily net assets (excluding Target Series and Strategic Income Series); and 0.0065% of the average daily net assets in excess of $40 billion (excluding Target Series and Strategic Income Series); plus a base fee of $30,400 per series. Transfer agent fees are charged to the Fund on a per account basis. Additionally, certain transaction and out-of-pocket expenses, including charges for reporting relating to the Fund’s compliance program, are charged. The Advisor has agreements with BNY Mellon Investment Servicing (U.S.) Inc. (“BNY”) under which BNY serves as sub-accountant services agent and sub-transfer agent.
Expenses not directly attributable to a series are allocated based on each Series’ relative net assets or number of accounts, depending on the expense.
| 4. | Purchases and Sales of Securities |
For the year ended December 31, 2015, purchases and sales of securities, other than U.S. Government securities and short-term securities, were $669,396,309 and $524,674,437, respectively. Purchases and sales of U.S. Government securities, other than short-term securities, were $123,403,517 and $107,939,933, respectively.
33
Unconstrained Bond Series
Notes to Financial Statements (continued)
| 5. | Capital Stock Transactions |
Transactions in shares of Class S and Class I of Unconstrained Bond Series were:
| CLASS S: | FOR THE YEAR ENDED 12/31/15 | FOR THE YEAR ENDED 12/31/14 | ||||||||||||||
| SHARES | AMOUNT | SHARES | AMOUNT | |||||||||||||
Sold | 26,221,830 | $ | 274,826,042 | 9,467,982 | $ | 102,470,115 | ||||||||||
Reinvested | 2,299,283 | 23,649,755 | 2,604,702 | 27,789,942 | ||||||||||||
Repurchased | (10,588,506 | ) | (110,904,010 | ) | (8,805,748 | ) | (95,274,990 | ) | ||||||||
|
|
|
|
|
|
|
| |||||||||
Total | 17,932,607 | $ | 187,571,787 | 3,266,936 | $ | 34,985,067 | ||||||||||
|
|
|
|
|
|
|
| |||||||||
| CLASS I: | FOR THE YEAR ENDED 12/31/15 | FOR THE YEAR ENDED 12/31/14 | ||||||||||||||
| SHARES | AMOUNT | SHARES | AMOUNT | |||||||||||||
Sold | 2,240,234 | $ | 21,384,669 | 6,679,760 | $ | 65,876,921 | ||||||||||
Reinvested | 143,067 | 1,332,244 | 205,053 | 1,971,555 | ||||||||||||
Repurchased | (6,517,164 | ) | (62,255,300 | ) | (596,521 | ) | (5,855,825 | ) | ||||||||
|
|
|
|
|
|
|
| |||||||||
Total | (4,133,863 | ) | $ | (39,538,387 | ) | 6,288,292 | $ | 61,992,651 | ||||||||
|
|
|
|
|
|
|
| |||||||||
Over 90% of the shares outstanding are held by fiduciary accounts where the Advisor has sole investment discretion.
| 6. | Financial Instruments and Loan Assignments |
The Series may trade in instruments including written and purchased options, forward foreign currency exchange contracts and futures contracts and other derivatives in the normal course of investing activities to assist in managing exposure to various market risks. The Series may be subject to various elements of risk, which may involve, to a varying degree, elements of risk in excess of the amounts recognized for financial statement purposes. These risks include: the risk that changes in the value of a derivative may not correlate perfectly with the underlying asset, rate or index; counterparty credit risk related to over the counter derivative counterparties’ failure to perform under contract terms; liquidity risk related to the lack of a liquid market for these contracts allowing the fund to close out its position(s); and documentation risk relating to disagreement over contract terms. At December 31, 2015, the Series invested in futures contracts (interest rate risk).
The Series may invest in a loan assignment of all or a portion of the loans. The Series has direct rights against the borrower on a loan when it purchases an assignment; however, the Series’ rights may be more limited than the lender from which it acquired the assignment and the Series may be able to enforce its rights only through an administrative agent. Loan assignments are vulnerable to market conditions and may become illiquid due to economic conditions or other events may reduce the demand for loan assignments and certain loan assignments which were liquid when purchased may become illiquid. Loan assignment investments held by the Series as of December 31, 2015 are disclosed in the Investment Portfolio.
| 7. | Foreign Securities |
Investing in securities of foreign companies and foreign governments involves special risks and considerations not typically associated with investing in securities of domestic companies and the U.S. Government. These risks include revaluation of currencies and future adverse political and economic developments. Moreover, securities of foreign companies and foreign governments and their markets may be less liquid and their prices more volatile than those of comparable domestic companies and the U.S. Government.
| 8. | Federal Income Tax Information |
The amount and characterization of certain income and capital gains to be distributed are determined in accordance with federal income tax regulations, which may differ from GAAP. These differences are primarily due to differing book and tax treatments in the timing and/or treatment of the recognition of net investment income or gains and losses, including wash sales and investments in Treasury Inflation Protected securities, foreign currency gains and losses, redesignation of distributions paid and
34
Unconstrained Bond Series
Notes to Financial Statements (continued)
| 8. | Federal Income Tax Information (continued) |
the realization for tax purposes of unrealized gains/losses on certain futures. The Series may periodically make reclassifications among its capital accounts to reflect income and gains available for distribution (or available capital loss carryovers) under income tax regulations without impacting the Series’ net asset value. For the year ended December 31, 2015, $1,238,076 was reclassified within the capital accounts from Distributions in Excess of Net Investment Income to Accumulated Net Realized Loss on Investments. Any such reclassifications are not reflected in the financial highlights.
The tax character of distributions paid were as follows:
| FOR THE YEAR ENDED 12/31/15 | FOR THE YEAR ENDED 12/31/14 | |||||||
Ordinary income | $ | 21,145,858 | $ | 23,011,079 | ||||
Long-term capital gains | 4,268,983 | 8,820,822 | ||||||
Return of capital | 476,427 | — | ||||||
At December 31, 2015, the tax basis of components of distributable earnings and the net unrealized depreciation based on identified cost for federal income tax purposes were as follows:
Cost for federal income tax purposes | $ | 883,664,829 | ||
Unrealized appreciation | 3,591,176 | |||
Unrealized depreciation | (28,482,981 | ) | ||
|
| |||
Net unrealized depreciation | $ | (24,891,805 | ) | |
|
| |||
Qualified late-year losses1 | $ | 1,852,718 |
1The Series has elected to defer certain qualified late-year losses and recognize such losses in the year ending December 31, 2016.
35
Unconstrained Bond Series
Report of Independent Registered Public Accounting Firm
To the Board of Directors of Manning & Napier Fund, Inc. and Shareholders of Unconstrained Bond Series:
In our opinion, the accompanying statement of assets and liabilities, including the investment portfolio, and the related statements of operations and of changes in net assets and the financial highlights present fairly, in all material respects, the financial position of Unconstrained Bond Series (a series of Manning & Napier Fund, Inc., hereafter referred to as the “Series”) at December 31, 2015, the results of its operations for the year then ended, the changes in its net assets for each of the two years in the period then ended and the financial highlights for each of the periods presented, in conformity with accounting principles generally accepted in the United States of America. These financial statements and financial highlights (hereafter referred to as “financial statements”) are the responsibility of the Series’ management. Our responsibility is to express an opinion on these financial statements based on our audits. We conducted our audits of these financial statements in accordance with the standards of the Public Company Accounting Oversight Board (United States). Those standards require that we plan and perform the audit to obtain reasonable assurance about whether the financial statements are free of material misstatement. An audit includes examining, on a test basis, evidence supporting the amounts and disclosures in the financial statements, assessing the accounting principles used and significant estimates made by management, and evaluating the overall financial statement presentation. We believe that our audits, which included confirmation of securities at December 31, 2015 by correspondence with the custodian and brokers, provide a reasonable basis for our opinion.

New York, New York
February 19, 2016
36
Unconstrained Bond Series
Supplemental Tax Information
(unaudited)
All reportings are based on financial information available as of the date of this annual report and, accordingly are subject to change.
For federal income tax purposes, the Series reports for the current fiscal year $646,513 or, if different, the maximum amount allowable under the tax law as qualified dividend income.
The Series designates $3,406,402 as Long-Term Capital Gain dividends pursuant to Section 852(b)(3) of the Internal Revenue Code for the fiscal year ended December 31, 2015.
For corporate shareholders, the percentage of investment income (dividend income plus short-term gains, if any) that qualifies for the dividends received deduction for the current fiscal year is 3.06%, or if different, the maximum allowable under tax law.
37
Unconstrained Bond Series
Renewal of Investment Advisory Agreement
(unaudited)
At the Manning & Napier Fund, Inc. (the “Fund”) Board of Directors’ (the “Board”) meeting, held on November 17, 2015, the Investment Advisory Agreement (the “Agreement”) between the Fund and Manning & Napier Advisors, LLC (the “Advisor”) was considered by the Board for renewal. In connection with the decision whether to renew the Agreement, a variety of material was prepared for and considered by the Board.
Representatives of the Advisor attended the meeting and presented additional oral and written information to the Board to assist the Board in its considerations. The discussion immediately below outlines the materials and information presented to the Board in connection with the Board’s 2015 Annual consideration of the Agreement and the conclusions made by the Directors when determining to continue the Agreement.
| • | The Board considered the services provided by the Advisor under the Agreement including, among others: deciding what securities to purchase and sell for each Series; arranging for the purchase and sale of such securities by placing orders with broker-dealers; administering the affairs of the Fund (including the books and records of the Fund not maintained by third party service providers such as the custodian or sub-transfer agent); arranging for the insurance coverage for the Fund; and supervising the preparation of tax returns, SEC filings (including registration statements) and reports to shareholders for the Fund. The Board also considered the nature and quality of such services provided under the Agreement in light of the Advisor’s services provided to the Fund for 29 years. The Board discussed the quality of these services with representatives from the Advisor and concluded that the Advisor was performing its services to the Fund required under the Agreement in a reasonable manner. |
| • | The Board considered the performance of each Series since its inception, as well as performance over multiple time periods. Performance for one or more of the following time periods was considered as applicable to the Series’ inception date: inception, three year, five year, ten year, and current market cycle. A market cycle includes periods of both rising and falling markets. Returns for established benchmark indices for each Series were provided. In addition, the Board considered a number of other factors relevant to performance at the meeting (and considers on a quarterly basis) including: a peer group performance analysis consisting of Morningstar universes of mutual funds with similar investment objectives, investment performance of core products, product offerings, performance on an aggregate basis vs. performance over reasonable time periods and the Advisor’s investment process. The Directors acknowledged the challenging performance and discussed the investment process of the Advisor. The Directors confirmed that qualitative factors such as the Advisor’s investment process, including recent enhancements, were an important subset to be considered as part of their consideration of performance. The Board discussed the performance with representatives from the Advisor and concluded that the investment performance of each of the Fund’s Series was reasonable based on the Series’ actual performance and comparative performance, especially for those series with performance over the current market cycle. |
| • | The Board considered the costs of the Advisor’s services and the profits of the Advisor as they relate to the Advisor’s services to the Fund under the Agreement. In reviewing the Advisor’s costs and profits, the Board discussed the Advisor’s revenues generated from the Fund (on both an actual and adjusted basis) and its expenses associated with providing the services under the Agreement. In addition, the Board reviewed the Advisor’s expenses associated with Fund activities outside of the Agreement (such as expense reimbursements pursuant to expense caps and payments made by the Advisor to third party platforms on which shares of the Fund are available for purchase). It was noted by representatives of the Advisor that 22 of the 36 active Series of the Fund are currently experiencing expenses above the capped expense ratios, and thus the Advisor is incurring those expenses over the cap. After discussing the above costs and profits, the Board concluded that the Advisor’s profitability relating to its services provided under the Agreement was reasonable. |
| • | The Board considered the fees and expenses of the various Series of the Fund. The Advisor presented the advisory fees and total expenses for each Series, including the advisory fee adjusted for any expense waivers or reimbursements (either contractual or voluntary) paid by the Advisor. The advisory fees and expense ratios of each Series were compared to an average (on both a mean and median basis) of similar funds as disclosed on the Morningstar database. Representatives of the Advisor discussed with the Board the levels of its advisory fee for each Series of the Fund and as compared to the median and mean advisory fees for similar funds as listed on Morningstar. Expense ratios for every Series, except the Tax Managed Series, Equity Income Class S, High Yield Bond Class S, Pro-Blend Series Classes C and R, and Target Series’ Classes R and K, are lower than, or substantially similar to the Morningstar mean and median reported total expense ratio. |
38
Unconstrained Bond Series
Renewal of Investment Advisory Agreement
(unaudited)
The higher than mean and median total expense ratios for Classes C and R reflect higher distribution, marketing and shareholder service fees payable to broker-dealers through a 100bp 12b-1 fee for Class C and a 50bp 12b-1 fee for Class R. Based on their review of the information provided, the Board concluded that the fees and expenses of each Series of the Fund were reasonable on a comparative basis. |
| • | The Board also considered the other benefits the Advisor derives from its relationship with the Fund. Such other benefits include certain research services provided by soft dollars. The Board reviewed the broker-dealers who provided research to the Advisor and the products and services paid for, in whole or in part, using soft dollar commissions. Given the level of soft dollar transactions involving the Fund, the Board concluded that these additional benefits to the Advisor were reasonable. |
| • | In addition to the factors described above, the Board considered the Advisor’s personnel, investment strategies, policies and procedures relating to compliance with personal securities transactions, reputation, expertise and resources in domestic and foreign financial markets. The Board concluded that these factors support the conclusion that the Advisor performs its services in a reasonable manner. |
| • | The Board then considered economies of scale and concluded that the current fee schedule to the advisory agreement remained reasonable given the multiple uses of the Fund (for the Advisor’s discretionary investment account clients in addition to direct investors), the current profitability of the Advisor’s services to the Fund under the Agreement, the number of newly established series of the Fund and the overall size of the Fund complex. |
Based on the Board’s deliberations and their evaluation of the information described above, the Board, including a majority of Directors that are not “interested persons” as defined in the Investment Company Act of 1940, concluded that the compensation under the Agreement was fair and reasonable in light of the services and expenses and such other matters as the Directors considered to be relevant in the exercise of their reasonable judgment. Accordingly, the Board approved the renewal of the Agreement. In the course of their deliberations, the Directors did not identify any particular information that was all important or controlling.
39
Unconstrained Bond Series
Directors’ and Officers’ Information
(unaudited)
The Statement of Additional Information provides additional information about the Fund’s directors and officers and can be obtained without charge by calling 1-800-466-3863, at www.manningnapieradvisors.com, or on the EDGAR Database on the SEC Internet web site (http:// www.sec.gov). The following chart shows certain information about the Fund’s officers and directors, including their principal occupations during the last five years. Unless specific dates are provided, the individuals have held the listed positions for longer than five years.
| Interested Director/Officer | ||
| Name: | James E. Mikolaichik* | |
| Address: | 290 Woodcliff Drive Fairport, NY 14450 | |
| Age: | 44 | |
| Current Position(s) Held with Fund: | Principal Executive Officer, President, Chairman & Director | |
| Term of Office1 & Length of Time Served: | Indefinite - Chairman and Director since August 2015 | |
| Principal Occupation(s) During Past 5 Years: | Chief Financial Officer (since 2011) - Manning & Napier Advisors, LLC; Executive Vice President and Head of Strategy (2008-2011) and Chief Risk Officer (2004-2008) - Old Mutual Asset Management Holds or has held one or more of the following title for various subsidiaries and affiliates: Chief Financial Officer. | |
| Number of Portfolios Overseen within Fund Complex: | 41 | |
| Other Directorships Held Outside Fund Complex: | N/A | |
| Independent Directors | ||
| Name: | Stephen B. Ashley | |
| Address: | 290 Woodcliff Drive Fairport, NY 14450 | |
| Age: | 75 | |
| Current Position(s) Held with Fund: | Director, Audit Committee Member, Governance & Nominating Committee Member | |
| Term of Office & Length of Time Served: | Indefinite - Since 1996 | |
| Principal Occupation(s) During Past 5 Years: | Chairman, Director, President & Chief Executive Officer (1997 to present) - The Ashley Group (property management and investment); Director (1995-2008) and Chairman (non-executive) (2004-2008) - Fannie Mae (mortgage). | |
| Number of Portfolios Overseen within Fund Complex: | 41 | |
| Other Directorships Held Outside Fund Complex: | Fannie Mae (1995-2008) The Ashley Group (1995-2008) Genesee Corporation (1987-2007) | |
| Name: | Paul A. Brooke | |
| Address: | 290 Woodcliff Drive Fairport, NY 14450 | |
| Age: | 70 | |
| Current Position(s) Held with Fund: | Director, Audit Committee Member, Governance & Nominating Committee Member | |
| Term of Office & Length of Time Served: | Indefinite - Since 2007 | |
| Principal Occupation(s) During Past 5 Years: | Chairman & CEO (2005-2009) - Ithaka Acquisition Corporation (investments); Chairman (2007-2009) Alsius Corporation (investments); Managing Member, PMSV Holdings LLC (investments) since 1991; Managing Member, Venbio (investments) since 2010. | |
| Number of Portfolios Overseen within Fund Complex: | 41 | |
| Other Directorships Held Outside Fund Complex: | Incyte Corp. (2000-present) ViroPharma, Inc. (2000-2014) HLTH Corp (WebMD) (2000-2010) Cheyne Capital International (2000-present) GMP Companies (2000-2011) Cytos Biotechnology Ltd. (2012-2014) | |
40
Unconstrained Bond Series
Directors’ and Officers’ Information
(unaudited)
Independent Directors (continued)
| Name: | Peter L. Faber | |
| Address: | 290 Woodcliff Drive Fairport, NY 14450 | |
| Age: | 77 | |
| Current Position(s) Held with Fund: | Director, Governance & Nominating Committee Member | |
| Term of Office & Length of Time Served: | Indefinite - Since 1987 | |
| Principal Occupation(s) During Past 5 Years: | Senior Counsel (2006-2012), Partner (1995-2006 & 2013-present) - McDermott, Will & Emery LLP (law firm) | |
| Number of Portfolios Overseen within Fund Complex: | 41 | |
| Other Directorships Held Outside Fund Complex: | Boston Early Music Festival (non-profit) (2007-present) Amherst Early Music, Inc. (non-profit) (2009-present) Gotham Early Music Scene, Inc. (non-profit) (2009-present) Partnership for New York City, Inc. (non-profit) (1989-2010) New York Collegium (non-profit) (2004-2011) | |
| Name: | Harris H. Rusitzky | |
| Address: | 290 Woodcliff Drive Fairport, NY 14450 | |
| Age: | 80 | |
| Current Position(s) Held with Fund: | Director, Audit Committee Member, Governance & Nominating Committee Member | |
| Term of Office & Length of Time Served: | Indefinite - Since 1985 | |
| Principal Occupation(s) During Past 5 Years: | President, The Greening Group (business consultants) since 1994; Partner, The Restaurant Group (restaurants) since 2006 | |
| Number of Portfolios Overseen within Fund Complex: | 41 | |
| Other Directorships Held Outside Fund Complex: | Rochester Institute of Technology (university) (1972-present) Culinary Institute of America (non-profit college) (1985-present) George Eastman House (museum) (1988-present) National Restaurant Association (restaurant trade organization) (1978- present) | |
| Name: | Chester N. Watson | |
| Address: | 290 Woodcliff Drive Fairport, NY 14450 | |
| Age: | 65 | |
| Current Position(s) Held with Fund: | Director, Audit Committee Chairman, Governance & Nominating Committee Member | |
| Term of Office & Length of Time Served: | Indefinite - Since 2012 | |
| Principal Occupation(s) During Past 5 Years: | General Auditor (2003-2011) - General Motors Company (auto manufacturer) | |
| Number of Portfolios Overseen within Fund Complex: | 41 | |
| Other Directorships Held Outside Fund Complex: | Rochester Institute of Technology (university) (2005-present) | |
Officers
| ||
| Name: | Jeffrey S. Coons, Ph.D., CFA | |
| Address: | 290 Woodcliff Drive Fairport, NY 14450 | |
| Age: | 52 | |
| Current Position(s) Held with Fund: | Vice President | |
| Term of Office1 & Length of Time Served: | Since 2004 | |
| Principal Occupation(s) During Past 5 Years: | President since 2010, Co-Director of Research (2002-2015) - Manning & Napier Advisors, LLC Holds one or more of the following titles for various subsidiaries and affiliates: President, Director, Treasurer or Senior Trust Officer. | |
| Number of Portfolios Overseen within Fund Complex: | 41 | |
| Other Directorships Held Outside Fund Complex: | N/A | |
41
Unconstrained Bond Series
Directors’ and Officers’ Information
(unaudited)
Officers (continued)
| Name: | Elizabeth Craig | |
| Address: | 290 Woodcliff Drive Fairport, NY 14450 | |
| Age: | 28 | |
| Current Position(s) Held with Fund: | Assistant Corporate Secretary | |
| Term of Office1 & Length of Time Served: | Since 2011 | |
| Principal Occupation(s) During Past 5 Years: | Fund Administration Manager since 2015; Mutual Fund Compliance Specialist (2009-2015) - Manning & Napier Advisors, LLC | |
| Number of Portfolios Overseen within Fund Complex: | 41 | |
| Other Directorships Held Outside Fund Complex: | N/A | |
| Name: | Christine Glavin | |
| Address: | 290 Woodcliff Drive Fairport, NY 14450 | |
| Age: | 49 | |
| Current Position(s) Held with Fund: | Principal Financial Officer, Chief Financial Officer | |
| Term of Office1 & Length of Time Served: | Principal Financial Officer since 2002; Chief Financial Officer since 2001 | |
| Principal Occupation(s) During Past 5 Years: | Director of Fund Reporting since 2011; Fund Reporting Manager (1997-2011) - Manning & Napier Advisors, LLC; Assistant Treasurer since 2008 - Exeter Trust Company | |
| Number of Portfolios Overseen within Fund Complex: | 41 | |
| Other Directorships Held Outside Fund Complex: | N/A | |
| Name: | Jodi L. Hedberg | |
| Address: | 290 Woodcliff Drive Fairport, NY 14450 | |
| Age: | 48 | |
| Current Position(s) Held with Fund: | Corporate Secretary, Chief Compliance Officer, Anti-Money Laundering Compliance Officer | |
| Term of Office1 & Length of Time Served: | Corporate Secretary since 1997; Chief Compliance Officer since 2004; Anti-Money Laundering Compliance Officer since 2002 | |
| Principal Occupation(s) During Past 5 Years: | Director of Compliance since 2005; Compliance Manager (1995-2005) - Manning & Napier Advisors, LLC and affiliates; Corporate Secretary - Manning & Napier Investor Services, Inc. since 2006 | |
| Number of Portfolios Overseen within Fund Complex: | 41 | |
| Other Directorships Held Outside Fund Complex: | N/A | |
| Name: | Richard Yates | |
| Address: | 290 Woodcliff Drive Fairport, NY 14450 | |
| Age: | 50 | |
| Current Position(s) Held with Fund: | Chief Legal Officer | |
| Term of Office1 & Length of Time Served: | Chief Legal Officer since 2004 | |
| Principal Occupation(s) During Past 5 Years: | Counsel - Manning & Napier Advisors, LLC and affiliates since 2000; Holds one or more of the following titles for various affiliates; Director or Corporate Secretary | |
| Number of Portfolios Overseen within Fund Complex: | 41 | |
| Other Directorships Held Outside Fund Complex: | N/A | |
*Interested Director, within the meaning of the Investment Company Act of 1940 by reason of his position with the Fund’s investment advisor and distributor. Mr. Mikolaichik serves as the Chief Financial Officer for Manning & Napier Advisors, LLC.
1The term of office of all officers shall be one year and until their respective successors are chosen and qualified, or his or her earlier resignation or removal as provided in the Fund’s By-Laws.
42
Unconstrained Bond Series
Results of Special Meeting of Shareholders
(unaudited)
A Special Meeting of the Shareholders of the Fund was held on August 18, 2015. The number of votes necessary to conduct the meeting and approve the proposal was obtained, and the results of the vote of shareholders of all the Series of the Fund voting together in the aggregate is listed below:
PROPOSAL 1:
Election of Directors
| NUMBER OF SHARES VOTED FOR | NUMBER OF SHARES WITHELD | |||||||
Stephen B. Ashley | 883,968,395 | 8,618,094 | ||||||
Paul A. Brooke | 884,510,661 | 8,075,828 | ||||||
Peter L. Faber | 884,140,893 | 8,445,596 | ||||||
James E. Mikolaichik | 883,391,832 | 9,194,657 | ||||||
Harris H. Rusitzky | 620,022,215 | 272,564,274 | ||||||
Chester N. Watson | 884,638,809 | 7,947,680 | ||||||
43
Unconstrained Bond Series
Literature Requests
(unaudited)
Proxy Voting Policies and Procedures
A description of the policies and procedures that the Fund uses to determine how to vote proxies relating to portfolio securities is available, without charge, upon request:
| By phone | 1-800-466-3863 | |||
| On the Securities and Exchange | ||||
| Commission’s (SEC) web site | http://www.sec.gov |
Proxy Voting Record
Information regarding how the Fund voted proxies relating to portfolio securities during the most recent 12-month period ended June 30th is available, without charge, upon request:
| By phone | 1-800-466-3863 | |||
| On the SEC’s web site | http://www.sec.gov |
Quarterly Portfolio Holdings
The Series’ complete schedule of portfolio holdings for the 1st and 3rd quarters of each fiscal year are provided on Form N-Q, and are available, without charge, upon request:
| By phone | 1-800-466-3863 | |||
| On the SEC’s web site | http://www.sec.gov |
The Series’ Form N-Q may be reviewed and copied at the SEC’s Public Reference Room in Washington, D.C. Information on the operation of the Public Reference Room may be obtained by calling 1-800-SEC-0330.
Prospectus and Statement of Additional Information (SAI)
For more information about any of the Manning & Napier Fund, Inc. Series, you may obtain a prospectus and SAI at www.manning-napier.com or by calling (800) 466-3863. Before investing, carefully consider the objectives, risks, charges and expenses of the investment and read the prospectus carefully as it contains this and other information about the investment company. In addition, this information can be found on the SEC’s web site, http://www.sec.gov.
Additional information available at www.manning-napier.com
1. Fund Holdings - Month-End
2. Fund Holdings - Quarter-End
3. Shareholder Report - Annual
4. Shareholder Report - Semi-Annual
The Fund also offers electronic notification or “e-delivery” when certain documents are available on-line to be downloaded or reviewed. Direct shareholders can elect to receive electronic notification when shareholder reports, prospectus updates, and/or statements are available. If you do not currently have on-line access to your account, you can establish access by going to www.manning-napier.com, click on “Login” in the top corner of the page, and follow the prompts to self-enroll. Once enrolled, you can set your electronic notification preferences by clicking on the Account Options tab located within the green toolbar and then select E-Delivery Option. Should you have any questions on either how to establish on-line access or how to update your account settings, please contact Investor Services at 1-800-466-3863.
The Manning & Napier Fund, Inc. is managed by Manning & Napier Advisors, LLC. Manning & Napier Investor Services, Inc., an affiliate of Manning & Napier Advisors, LLC, is the distributor of the Fund shares.
MNCPB-12/15-AR
ITEM 2: CODE OF ETHICS
(a) The registrant has adopted a code of ethics that applies to its principal executive officer, principal financial officer and principal accounting officer. A copy of the registrant’s code of ethics is filed herewith as Exhibit 12(a)(1).
(b) During the period covered by this report, no amendments were made to the provisions of the code of ethics adopted in 2 (a) above.
(c) During the period covered by this report, no implicit or explicit waivers to the provisions of the code of ethics adopted in 2 (a) above were granted.
(d) Not applicable to the registrant due to the response given in 2 (c) above.
ITEM 3: AUDIT COMMITTEE FINANCIAL EXPERT
All of the members of the Audit committee have been determined by the Registrant’s Board of Directors to be Audit Committee Financial Experts as defined in this item. The current members of the Audit Committee are: Stephen B. Ashley, Paul A. Brooke, Harris H. Rusitzky, and Chester N. Watson. All Audit Committee members are independent under applicable rules. This designation will not increase the designee’s duties, obligations or liability as compared to their duties, obligations and liability as a member of the Audit Committee and of the Board.
ITEM 4: PRINCIPAL ACCOUNTANT FEES AND SERVICES
Principal Accountant Fees and Services
Aggregate fees for professional services rendered for the Manning & Napier Fund, Inc. Real Estate Series, International Series, World Opportunities Series, Core Bond Series, Unconstrained Bond Series, High Yield Bond Series, Ohio Tax Exempt Series, Diversified Tax Exempt Series, New York Tax Exempt Series, Emerging Markets Series, Global Fixed Income Series, Strategic Income Moderate Series, Strategic Income Conservative Series, Dynamic Opportunities Series, Equity Income Series, and Focused Opportunities Series, (collectively the “Fund”) by PricewaterhouseCoopers LLP (“PwC”) as of and for the years ended December 31, 2015 and 2014 were:
| 2015 | 2014 | |||||||||
|
| |||||||||
Audit Fees (a) | 483,916 | 497,710 | ||||||||
Audit Related Fees (b) | 0 | 0 | ||||||||
Tax Fees (c) | 112,630 | 126,590 | ||||||||
All Other Fees (d) | 0 | 0 | ||||||||
|
| |||||||||
| 596,546 | 624,300 | |||||||||
|
| |||||||||
| (a) | Audit Fees |
These fees relate to professional services rendered by PwC for the audit of the Fund’s annual financial statements or services normally provided by the accountant in connection with statutory and regulatory filing or engagements. These services include the audits of the financial statements of the Fund, issuance of consents, income tax provision procedures and assistance with review of documents filed with the SEC.
| (b) | Audit-Related Fees |
These fees relate to assurance and related services by PwC that are reasonably related to the performance of the audit of the Fund’s financial statements and are not reported under “Audit Fees” above.
| (c) | Tax Fees |
These fees relate to professional services rendered by PwC for tax compliance, tax advice and tax planning. The tax services provided by PwC related to the review of the Fund’s federal and state income tax returns, excise tax calculations and returns, a review of the Fund’s calculations of capital gain and income distributions, and additional tax research for compliance purposes.
| (d) | All Other Fees |
These fees relate to products and services provided by PwC other than those reported above under “Audit Fees,” “Audit-Related Fees,” and “Tax Fees” above.
There were no amounts that were approved by the Audit Committee pursuant to the de minimus exception (Rule 2-01(c)(7) of Regulation S-X) for the fiscal years ended December 31, 2015 and 2014.
Non-Audit Services to the Fund’s Service Affiliates that were Pre-Approved by the Fund’s Audit Committee
The Fund’s Audit Committee is required to pre-approve non-audit services which meet both the following criteria:
| i) | Directly relate to the Fund’s operations and financial reporting; and |
| ii) | Rendered by PwC to the Fund’s advisor, Manning & Napier Advisors, LLC, and entities in a control relationship with the advisor (“service affiliate”) that provides ongoing services to the Fund. For purposes of disclosure, Manning & Napier Investor Services, Inc. is considered to be a service affiliate. |
| 2015 | 2014 | |||||||||
|
| |||||||||
Audit Related Fees | 1,944 | 1,944 | ||||||||
Tax Fees | 0 | 0 | ||||||||
|
| |||||||||
| 1,944 | 1,944 | |||||||||
|
| |||||||||
The Audit Related fees for the years ended December 31, 2015 and 2014 were for a license for proprietary authoritative financial reporting and assurance literature library software.
There were no amounts that were approved by the Audit Committee pursuant to the de minimus exception (Rule 2-01(c)(7) of Regulation S-X) for the fiscal years ended December 31, 2015 and 2014.
Aggregate Fees
Aggregate fees billed to the Fund for non-audit services for 2015 and 2014 were $112,630 and $126,590, respectively. Aggregate fees billed to the Fund’s advisor and service affiliates for non-audit services were $1,944 and $1,944, respectively. These amounts include fees for non-audit services required to be pre-approved and fees for non-audit services that did not require pre-approval since they did not relate to the Fund’s operations and financial reporting.
The Fund’s Audit Committee has considered whether the provisions for non-audit services to the Fund’s advisor and service affiliates, which did not require pre-approval, are compatible with maintaining PwC’s independence.
ITEM 5: AUDIT COMMITTEE OF LISTED REGISTRANTS
Not applicable.
ITEM 6: INVESTMENTS
| (a) | See Investment Portfolios under Item 1 on this Form N-CSR. |
| (b) | Not applicable. |
| ITEM 7: | DISCLOSURE OF PROXY VOTING POLICIES AND PROCEDURES FOR CLOSED-END MANAGEMENT INVESTMENT COMPANIES |
Not applicable.
ITEM 8: PORTFOLIO MANAGERS OF CLOSED-END MANAGEMENT INVESTMENT COMPANIES
Not applicable.
| ITEM 9: | PURCHASES OF EQUITY SECURITIES BY CLOSED-END MANAGEMENT INVESTMENT COMPANY AND AFFILIATED PURCHASERS |
Not applicable.
ITEM 10: SUBMISSION OF MATTERS TO A VOTE OF SECURITY HOLDERS
There have been no material changes to the procedure by which shareholders may recommend nominees to the registrant’s board of directors.
ITEM 11: CONTROLS AND PROCEDURES
(a) Based on their evaluation of the Funds’ disclosure controls and procedures, as of a date within 90 days of the filing date, the Funds’ Principal Executive Officer and Principal Financial Officer have concluded that the Funds’ disclosure controls and procedures are: (i) reasonably designed to ensure that information required to be disclosed in this report is appropriately communicated to the Funds’ officers to allow timely decisions regarding disclosures required in this report; (ii) reasonably designed to ensure that information required to be disclosed in this report is recorded, processed, summarized and reported in a timely manner; and (iii) are effective in achieving the goals described in (i) and (ii) above.
(b) During the second fiscal quarter of the period covered by this report, there have been no changes in the Funds’ internal control over financial reporting that the above officers believe to have materially affected, or to be reasonably likely to materially affect, the Funds’ internal control over financial reporting.
ITEM 12: EXHIBITS
(a)(1) | Code of ethics that is subject to the disclosure of Item 2 above. | |
(a)(2) | Separate certifications for the Registrant’s principal executive officer and principal financial officer, as required by Section 302 of the Sarbanes-Oxley Act of 2002 and Rule 30a-2(a) under the Investment Company Act of 1940, are attached as EX-99.CERT. | |
(a)(3) | Not applicable. | |
(b) | A certification of the Registrant’s principal executive officer and principal financial officer, as required by 18 U.S.C Section 1350, as adopted pursuant to Section 906 of the Sarbanes-Oxley Act of 2002, and Rule 30a-2(b) under the Investment Company Act of 1940, is attached as EX- 99.906CERT. The certification furnished pursuant to this paragraph is not deemed to be “filed” for purposes of Section 18 of the Securities Exchange Act of 1934, or otherwise subject to the liability of that section. Such certification is not deemed to be incorporated by reference into any filing under the Securities Act of 1933 or the Securities Exchange Act of 1934, except to the extent that the Registrant specifically incorporates them by reference. | |
(12.other) | Not applicable. | |
SIGNATURES
Pursuant to the requirements of the Securities Exchange Act of 1934 and the Investment Company Act of 1940, the registrant has duly caused this report to be signed on its behalf by the undersigned, thereunto duly authorized.
Manning & Napier Fund, Inc. |
/s/ James Mikolaichik |
James Mikolaichik |
President & Principal Executive Officer of Manning & Napier Fund, Inc. |
Date: 2/11/16 |
Pursuant to the requirements of the Securities Exchange Act of 1934 and the Investment Company Act of 1940, this report has been signed below by the following persons on behalf of the registrant and in the capacities and on the dates indicated.
/s/ James Mikolaichik |
James Mikolaichik |
President & Principal Executive Officer of Manning & Napier Fund, Inc. |
Date: 2/11/16 |
/s/ Christine Glavin |
Christine Glavin |
Chief Financial Officer & Principal Financial Officer of Manning & Napier Fund, Inc. |
Date: 2/11/16 |