UNITED STATES
SECURITIES AND EXCHANGE COMMISSION
Washington, D.C. 20549
FORM N-CSR
CERTIFIED SHAREHOLDER REPORT OF REGISTERED MANAGEMENT INVESTMENT COMPANIES
Investment Company Act file number 811-04087
Manning & Napier Fund, Inc.
(Exact name of registrant as specified in charter)
290 Woodcliff Drive, Fairport, NY 14450
(Address of principal executive offices)(Zip Code)
Michele T. Mosca 290 Woodcliff Drive, Fairport, NY 14450
(Name and address of agent for service)
Registrant’s telephone number, including area code: 585-325-6880
Date of fiscal year end: October 31
Date of reporting period: November 1, 2015 through October 31, 2016
Form N-CSR is to be used by management investment companies to file reports with the Commission not later than 10 days after the transmission to stockholders of any report that is required to be transmitted to stockholders under Rule 30e-1 under the Investment Company Act of 1940 (17 CFR 270.30e-1). The Commission may use the information provided on Form N-CSR in its regulatory, disclosure review, inspection, and policymaking roles.
A registrant is required to disclose the information specified by Form N-CSR, and the Commission will make this information public. A registrant is not required to respond to the collection of information contained in Form N-CSR unless the Form displays a currently valid Office of Management and Budget (“OMB”) control number. Please direct comments concerning the accuracy of the information collection burden estimate and any suggestions for reducing the burden to Secretary, Securities and Exchange Commission, 450 Fifth Street, NW, Washington, DC 20549-0609. The OMB has reviewed this collection of information under the clearance requirements of 44 U.S.C. § 3507.
ITEM 1: REPORTS TO STOCKHOLDERS.

Equity Series
Management Discussion and Analysis
(unaudited)
Dear Shareholders:
U.S. and international equity markets delivered positive returns during the past year. Emerging market equities were the notable outperformers, driven by investors’ search for yield and their increased appetite for riskier assets. Abating unease related to Chinese growth, a relatively stable U.S. dollar, the year-to-date upturn in commodity prices, and increased liquidity amid generally easy policy across the globe also provided tailwinds for emerging market assets. Defensive sectors outperformed cyclicals for most of the period, since defensive securities tend to benefit from low interest rate environments and yield is a big component of total return. But the trend reversed amid a mid-year rotation away from crowded defensive sectors into cyclical stocks, and investors have since shown a preference for growth over yield.
Meanwhile, U.S. and global economic growth continued at a slow pace. Although various asset classes performed positively, the year was punctuated by bouts of market volatility. Ongoing concern regarding the price of oil and other commodities, speculation surrounding the trajectory of global economic growth and central bank policy, and political uncertainty — including the unexpected Brexit vote — fueled investor unease and served as volatility catalysts. Going forward, we anticipate an increased likelihood of further gyrations in financial markets as U.S. and global economic growth continues at a muted pace.
Enclosed, we highlight how we are positioned amid the current economic environment, and provide our outlook of what to expect in financial markets. We hope that you find this information to be helpful.
As always, we appreciate your business.
Sincerely,
Manning & Napier Advisors, LLC
1
Equity Series
Fund Commentary
(unaudited)
Investment Objective
To provide long-term growth of capital by investing primarily in common stocks. The Series may invest in large, mid, and small size companies within the U.S.
Performance Commentary
U.S. equity markets generally delivered positive absolute returns for the twelve-month period ended October 31, 2016. The S&P 500 Index gained 4.48% while the Russell 3000 Index earned 4.24%. The Equity Series delivered positive absolute returns of 6.16%, outperforming the broad market on a relative basis. The Equity Series also continues to provide competitive absolute and relative returns over the current U.S. stock market cycle. The cycle includes a prolonged bear market from April 2000 to February 2009, a recovery, and the current bull market. Since the cycle began, the Equity Series has an annualized return of 6.92%, outpacing the Russell 3000’s annualized return of 4.45% and the S&P 500’s 4.14% annualized return.
The Series’ outperformance relative to the Russell 3000 Index during the year was driven by stock selection. Conversely, sector positioning challenged relative returns. Regarding major contributors to relative performance, stock selection in Health Care, Consumer Discretionary, and Information Technology aided relative returns. The Series’ overweight to Information Technology compared to the benchmark also aided relative returns.
Health Care companies that are exposed to markets growing faster than the overall economy, taking market share, and/or exposed to secular (i.e., long-term) growth trends such as more efficient delivery of health care services have performed well in the Series. Similarly, we are finding a relatively large number of Information Technology companies that meet our strategy and valuation disciplines that are exposed to secular growth trends such as cloud computing and online advertising/consumption. These companies have also performed well.
Offsetting a portion of the relative performance tailwind was stock selection in Real Estate, which detracted from relative returns. The Series’ overweights to Consumer Discretionary and Health Care compared to the benchmark, as well as lack of exposure to Utilities, also challenged relative returns.
In regard to the Series’ current positioning, we are focused on finding U.S.-based companies with growth drivers that are not tied to the broad economy. We believe the key to generating attractive returns in the prevailing environment is the ability to identify individual businesses that can innovate and disrupt their competitive landscape. We are looking for businesses that are generating growth by creating new markets, expanding existing markets, or simply taking market share from their rivals. The goal is to identify companies trading at attractive valuations relative to their growth potential.
As we look toward 2017, we expect U.S. economic growth to persist at a slow pace. Broadly speaking, valuations in the U.S. stock market are somewhat elevated. This backdrop suggests muted long-term returns going forward, so we are targeting companies exposed to secular growth trends in an effort to generate above market returns. We continue to anticipate gyrations in equity markets due to catalysts such as the potential for global growth to deviate from expectations, diverging central bank policies, commodity price pressures, and geopolitical risks. However, our indicators point to volatility still being a buying opportunity and do not suggest capital risk is a significant near-term concern. In this environment, an active, flexible, and selective approach can help avoid overvalued areas of the market, tactics that Manning & Napier has employed for over 45 years as an active investment manager.
Please see the next page for additional performance information as of October 31, 2016.
Performance data quoted represents past performance and does not guarantee future results. The investment return and principal value of an investment will fluctuate, so that an investor’s shares, when redeemed, may be worth more or less than their original cost. Current performance may be higher or lower than that quoted; investors can obtain the most recent month-end performance at www.manning-napier.com or by calling (800) 466-3863.
All investments involve risks, including possible loss of principal. As with any stock fund, the value of your investment will fluctuate in response to stock market movements. Investing in the Series will also involve a number of other risks, including issuer-specific risk, small-cap/mid-cap risk, and interest rate risk.
2
Equity Series
Performance Update as of October 31, 2016
(unaudited)
| AVERAGE ANNUAL TOTAL RETURNS AS OF OCTOBER 31, 2016 | ||||||||||||||||
| ONE YEAR1 | FIVE YEAR | TEN YEAR | SINCE INCEPTION2 | |||||||||||||
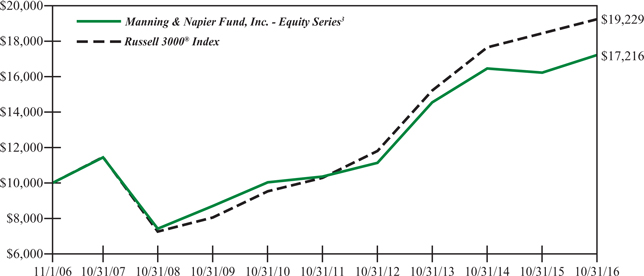
Manning & Napier Fund, Inc. - Equity Series3,4 | 6.16 | % | 10.68 | % | 5.58 | % | 7.44 | % | ||||||||
Russell 3000® Index5 | 4.24 | % | 13.35 | % | 6.76 | % | 5.75 | % | ||||||||
The following graph compares the value of a $10,000 investment in the Manning & Napier Fund, Inc. - Equity Series for the ten years ended October 31, 2016 to the Russell 3000® Index.
1 The returns shown are based on net asset values calculated for shareholder transactions and may differ from the returns shown in the financial highlights, which reflect adjustments made to the net asset values in accordance with accounting principles generally accepted in the United States of America.
2 Performance numbers for the Series and Index are calculated from May 1, 1998, the Collective’s inception date (see Note 4 below).
3 The Series’ performance does not reflect the deduction of taxes that a shareholder would pay on fund distributions or the redemption of shares. The Series’ performance is historical and may not be indicative of future results. The performance returns shown are inclusive of the net expense ratio of the Series. For the year ended October 31, 2016, this net expense ratio was 1.05%. The gross expense ratio, which does not account for any voluntary or contractual waivers currently in effect, was 1.14% for the year ended October 31, 2016.
4 Prior to July 10, 2002, all performance figures reflect the performance of the Exeter Trust Company Group Trust for Employee Benefit Plans: All-Equity Collective Investment Trust (the “Collective”), which was managed by Manning & Napier Advisors, Inc. (predecessor to Manning & Napier Advisors, LLC), an affiliate of the distributor, and reorganized into the Manning & Napier Fund, Inc. Equity Series on July 10, 2002. The Collective was not open to the public generally or registered under the Investment Company Act of 1940 and the fees of the Collective were lower than the Series’ fees. Therefore, historical performance of the Collective would have been lower if the Collective had been subject to the same fees as the Series.
5 The Russell 3000® Index is an unmanaged index that consists of 3,000 of the largest U.S. companies based on total market capitalization. The Index returns are based on a market capitalization-weighted average of relative price changes of the component stocks plus dividends whose reinvestments are compounded daily. The Index returns do not reflect any fees or expenses. Index returns provided by Bloomberg.
3
Equity Series
Shareholder Expense Example
(unaudited)
As a shareholder of the Series, you incur ongoing costs, including management fees, shareholder service fees and other Series expenses. This example is intended to help you understand your ongoing costs (in dollars) of investing in the Series and to compare these costs with the ongoing costs of investing in other mutual funds.
The example is based on an investment of $1,000 invested at the beginning of the period and held for the entire period (May 1, 2016 to October 31, 2016).
Actual Expenses
The first line of the table below provides information about actual account values and actual expenses. You may use the information in this line, together with the amount you invested, to estimate the expenses that you paid over the period. Simply divide your account value by $1,000 (for example, an $8,600 account value divided by $1,000 = 8.6), then multiply the result by the number in the first line under the heading entitled “Expenses Paid During Period” to estimate the expenses you paid on your account during this period.
Hypothetical Example for Comparison Purposes
The second line of the table below provides information about hypothetical account values and hypothetical expenses based on the Series’ actual expense ratio and an assumed rate of return of 5% per year before expenses, which is not the Series’ actual return. The hypothetical account values and expenses may not be used to estimate the actual ending account balance or expenses you paid during the period. You may use this information to compare the ongoing costs of investing in the Series and other funds. To do so, compare this 5% hypothetical example with the 5% hypothetical examples that appear in the shareholder reports of the other funds.
Please note that the expenses shown in the table are meant to highlight your ongoing costs only and do not reflect any transaction costs, such as sales charges (loads), redemptions fees, or exchange fees that you may incur in other mutual funds. Therefore, the second line of the table is useful in comparing ongoing costs only, and will not help you determine the relative total costs of owning different funds.
| BEGINNING ACCOUNT VALUE 5/1/16 | ENDING ACCOUNT VALUE 10/31/16 | EXPENSES PAID DURING PERIOD* 5/1/16-10/31/16 | ||||
Actual | $1,000.00 | $1,031.30 | $5.36 | |||
Hypothetical | ||||||
(5% return before expenses) | $1,000.00 | $1,019.86 | $5.33 |
*Expenses are equal to the Series’ annualized expense ratio (for the six-month period) of 1.05%, multiplied by the average account value over the period, multiplied by 184/366 (to reflect the one-half year period). Expenses are based on the most recent fiscal half year; therefore, the expense ratios stated above may differ from the expense ratios stated in the financial highlights, which are based on one-year data. The Series’ total return would have been lower had certain expenses not been waived during the period.
4
Equity Series
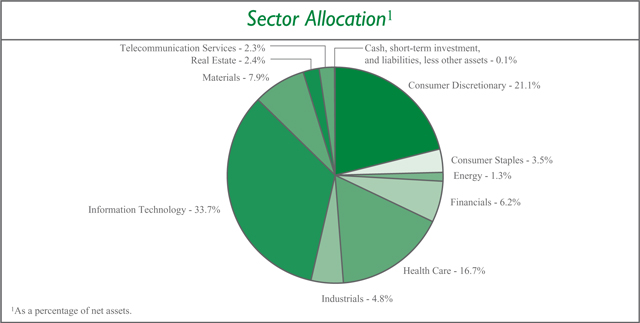
Portfolio Composition as of October 31, 2016
(unaudited)
5
Equity Series
Investment Portfolio - October 31, 2016
| SHARES | VALUE (NOTE 2) | |||||||
COMMON STOCKS - 99.9% | ||||||||
Consumer Discretionary - 21.1% | ||||||||
Diversified Consumer Services - 1.5% | ||||||||
Houghton Mifflin Harcourt Co.* | 115,080 | $ | 1,455,762 | |||||
|
| |||||||
Hotels, Restaurants & Leisure - 3.5% | ||||||||
Jack in the Box, Inc. | 10,740 | 1,006,660 | ||||||
Yum! Brands, Inc. | 28,480 | 2,457,254 | ||||||
|
| |||||||
| 3,463,914 | ||||||||
|
| |||||||
Internet & Direct Marketing Retail - 8.2% | ||||||||
Amazon.com, Inc.* | 4,190 | 3,309,346 | ||||||
The Priceline Group, Inc.* | 2,280 | 3,361,244 | ||||||
TripAdvisor, Inc.* | 22,710 | 1,464,341 | ||||||
|
| |||||||
| 8,134,931 | ||||||||
|
| |||||||
Media - 6.3% | ||||||||
Time Warner, Inc. | 21,160 | 1,883,028 | ||||||
Tribune Media Co. - Class A | 55,230 | 1,800,498 | ||||||
Twenty-First Century Fox, Inc. - Class A | 95,640 | 2,512,463 | ||||||
|
| |||||||
| 6,195,989 | ||||||||
|
| |||||||
Specialty Retail - 1.6% | ||||||||
L Brands, Inc. | 21,430 | 1,547,032 | ||||||
|
| |||||||
Total Consumer Discretionary | 20,797,628 | |||||||
|
| |||||||
Consumer Staples - 3.5% | ||||||||
Beverages - 2.0% | ||||||||
The Coca-Cola Co. | 47,890 | 2,030,536 | ||||||
|
| |||||||
Food & Staples Retailing - 1.5% | ||||||||
CVS Health Corp. | 17,290 | 1,454,089 | ||||||
|
| |||||||
Total Consumer Staples | 3,484,625 | |||||||
|
| |||||||
Energy - 1.3% | ||||||||
Oil, Gas & Consumable Fuels - 1.3% | ||||||||
Range Resources Corp. | 38,540 | 1,302,267 | ||||||
|
| |||||||
Financials - 6.2% | ||||||||
Capital Markets - 2.6% | ||||||||
BlackRock, Inc. | 7,500 | 2,559,300 | ||||||
|
| |||||||
Consumer Finance - 3.6% | ||||||||
SLM Corp.* | 218,240 | 1,538,592 | ||||||
Synchrony Financial | 71,070 | 2,031,891 | ||||||
|
| |||||||
| 3,570,483 | ||||||||
|
| |||||||
Total Financials | 6,129,783 | |||||||
|
| |||||||
Health Care - 16.7% | ||||||||
Biotechnology - 0.3% | ||||||||
Vertex Pharmaceuticals, Inc.* | 3,970 | 301,164 | ||||||
|
| |||||||
The accompanying notes are an integral part of the financial statements.
6
Equity Series
Investment Portfolio - October 31, 2016
| VALUE | ||||||||
| SHARES | (NOTE 2) | |||||||
COMMON STOCKS (continued) | ||||||||
Health Care (continued) | ||||||||
Health Care Equipment & Supplies - 4.0% | ||||||||
The Cooper Companies, Inc. | 8,760 | $ | 1,542,110 | |||||
Intuitive Surgical, Inc.* | 3,530 | 2,372,442 | ||||||
|
| |||||||
| 3,914,552 | ||||||||
|
| |||||||
Health Care Providers & Services - 4.5% | ||||||||
DaVita, Inc.* | 38,890 | 2,279,732 | ||||||
Express Scripts Holding Co.* | 32,130 | 2,165,562 | ||||||
|
| |||||||
| 4,445,294 | ||||||||
|
| |||||||
Health Care Technology - 3.8% | ||||||||
Cerner Corp.* | 63,420 | 3,715,144 | ||||||
|
| |||||||
Life Sciences Tools & Services - 1.5% | ||||||||
Thermo Fisher Scientific, Inc. | 10,220 | 1,502,647 | ||||||
|
| |||||||
Pharmaceuticals - 2.6% | ||||||||
Johnson & Johnson | 22,060 | 2,558,739 | ||||||
|
| |||||||
Total Health Care | 16,437,540 | |||||||
|
| |||||||
Industrials - 4.8% | ||||||||
Building Products - 1.0% | ||||||||
Masco Corp. | 30,250 | 934,120 | ||||||
|
| |||||||
Machinery - 1.8% | ||||||||
Flowserve Corp. | 42,930 | 1,818,086 | ||||||
|
| |||||||
Professional Services - 2.0% | ||||||||
Nielsen Holdings plc | 23,840 | 1,073,277 | ||||||
TriNet Group, Inc.* | 49,570 | 930,429 | ||||||
|
| |||||||
| 2,003,706 | ||||||||
|
| |||||||
Total Industrials | 4,755,912 | |||||||
|
| |||||||
Information Technology - 33.7% | ||||||||
Electronic Equipment, Instruments & Components - 2.0% | ||||||||
FLIR Systems, Inc. | 58,130 | 1,913,640 | ||||||
|
| |||||||
Internet Software & Services - 6.6% | ||||||||
Alphabet, Inc. - Class A* | 1,980 | 1,603,602 | ||||||
Alphabet, Inc. - Class C* | 2,060 | 1,616,152 | ||||||
Facebook, Inc. - Class A* | 25,190 | 3,299,638 | ||||||
|
| |||||||
| 6,519,392 | ||||||||
|
| |||||||
IT Services - 8.6% | ||||||||
EVERTEC, Inc. | 97,930 | 1,483,640 | ||||||
MasterCard, Inc. - Class A | 27,400 | 2,932,348 | ||||||
PayPal Holdings, Inc.* | 37,770 | 1,573,498 | ||||||
Visa, Inc. - Class A | 29,560 | 2,438,996 | ||||||
|
| |||||||
| 8,428,482 | ||||||||
|
| |||||||
The accompanying notes are an integral part of the financial statements.
7
Equity Series
Investment Portfolio - October 31, 2016
| VALUE | ||||||||
| SHARES | (NOTE 2) | |||||||
COMMON STOCKS (continued) | ||||||||
Information Technology (continued) | ||||||||
Semiconductors & Semiconductor Equipment - 4.8% | ||||||||
QUALCOMM, Inc. | 32,530 | $ | 2,235,462 | |||||
Skyworks Solutions, Inc. | 31,910 | 2,455,155 | ||||||
|
| |||||||
| 4,690,617 | ||||||||
|
| |||||||
Software - 8.7% | ||||||||
Aspen Technology, Inc.* | 34,760 | 1,711,582 | ||||||
Electronic Arts, Inc.* | 24,200 | 1,900,184 | ||||||
Microsoft Corp | 36,040 | 2,159,517 | ||||||
ServiceNow, Inc.* | 31,950 | 2,808,724 | ||||||
|
| |||||||
| 8,580,007 | ||||||||
|
| |||||||
Technology Hardware, Storage & Peripherals - 3.0% | ||||||||
Apple, Inc. | 26,370 | 2,994,050 | ||||||
|
| |||||||
Total Information Technology | 33,126,188 | |||||||
|
| |||||||
Materials - 7.9% | ||||||||
Chemicals - 5.9% | ||||||||
Ashland Global Holdings, Inc. | 29,440 | 3,289,331 | ||||||
Monsanto Co. | 24,690 | 2,488,011 | ||||||
|
| |||||||
| 5,777,342 | ||||||||
|
| |||||||
Metals & Mining - 2.0% | ||||||||
Arconic, Inc. | 68,106 | 1,956,004 | ||||||
|
| |||||||
Total Materials | 7,733,346 | |||||||
|
| |||||||
Real Estate - 2.4% | ||||||||
Equity Real Estate Investment Trusts (REITS) - 1.0% | ||||||||
Weyerhaeuser Co. | 32,940 | 985,894 | ||||||
|
| |||||||
Real Estate Management & Development - 1.4% | ||||||||
Realogy Holdings Corp. | 59,390 | 1,359,437 | ||||||
|
| |||||||
Total Real Estate | 2,345,331 | |||||||
|
| |||||||
Telecommunication Services - 2.3% | ||||||||
Diversified Telecommunication Services - 2.3% | ||||||||
Level 3 Communications, Inc.* | 20,790 | 1,167,359 | ||||||
Zayo Group Holdings, Inc.* | 35,020 | 1,126,944 | ||||||
|
| |||||||
Total Telecommunication Services | 2,294,303 | |||||||
|
| |||||||
TOTAL COMMON STOCKS | ||||||||
(Identified Cost $94,332,275) | 98,406,923 | |||||||
|
| |||||||
The accompanying notes are an integral part of the financial statements.
8
Equity Series
Investment Portfolio - October 31, 2016
| VALUE | ||||||||
| SHARES | (NOTE 2) | |||||||
SHORT-TERM INVESTMENT - 1.0% | ||||||||
Dreyfus Government Cash Management1, 0.28% | ||||||||
(Identified Cost $963,998) | 963,998 | $ | 963,998 | |||||
|
| |||||||
TOTAL INVESTMENTS - 100.9% | ||||||||
(Identified Cost $95,296,273) | 99,370,921 | |||||||
LIABILITIES, LESS OTHER ASSETS - (0.9%) | (900,647 | ) | ||||||
|
| |||||||
NET ASSETS - 100% | $ | 98,470,274 | ||||||
|
| |||||||
* Non-income producing security.
1 Rate shown is the current yield as of October 31, 2016.
The Global Industry Classification Standard (GICS) was developed by and is the exclusive property and a service mark of MSCI Inc. (MSCI) and Standard & Poor’s, a division of The McGraw-Hill Companies, Inc. (S&P), and is licensed for use by Manning & Napier when referencing GICS sectors. Neither MSCI, S&P, nor any third party involved in making or compiling the GICS or any GICS classifications makes any express or implied warranties or representations with respect to such standard or classification, nor shall any such party have any liability therefrom.
The accompanying notes are an integral part of the financial statements.
9
Equity Series
Statement of Assets and Liabilities
October 31, 2016
ASSETS: | ||||
Investments, at value (identified cost $95,296,273) (Note 2) | $ | 99,370,921 | ||
Receivable for fund shares sold | 3,898 | |||
Dividends receivable | 33,533 | |||
Prepaid expenses | 7,606 | |||
|
| |||
TOTAL ASSETS | 99,415,958 | |||
|
| |||
LIABILITIES: | ||||
Accrued management fees (Note 3) | 200,054 | |||
Accrued transfer agent fees (Note 3) | 8,377 | |||
Accrued fund accounting and administration fees (Note 3) | 6,913 | |||
Accrued Chief Compliance Officer service fees (Note 3) | 353 | |||
Payable for fund shares repurchased | 337,149 | |||
Payable for securities purchased | 312,383 | |||
Other payables and accrued expenses | 80,455 | |||
|
| |||
TOTAL LIABILITIES | 945,684 | |||
|
| |||
TOTAL NET ASSETS | $ | 98,470,274 | ||
|
| |||
NET ASSETS CONSIST OF: | ||||
Capital stock | $ | 80,739 | ||
Additional paid-in-capital | 91,995,558 | |||
Undistributed net investment loss | (326,267 | ) | ||
Accumulated net realized gain on investments | 2,645,596 | |||
Net unrealized appreciation (depreciation) on investments | 4,074,648 | |||
|
| |||
TOTAL NET ASSETS | $ | 98,470,274 | ||
|
| |||
NET ASSET VALUE, OFFERING PRICE AND REDEMPTION PRICE PER SHARE - Class A | ||||
($98,470,274/8,073,853 shares) | $ | 12.20 | ||
|
| |||
The accompanying notes are an integral part of the financial statements.
10
Equity Series
Statement of Operations
For the Year Ended October 31, 2016
INVESTMENT INCOME: | ||||
Dividends | $ | 710,661 | ||
|
| |||
EXPENSES: | ||||
Management fees (Note 3) | 1,423,617 | |||
Fund accounting and administration fees (Note 3) | 53,163 | |||
Transfer agent fees (Note 3) | 52,156 | |||
Directors’ fees (Note 3) | 12,434 | |||
Chief Compliance Officer service fees (Note 3) | 3,727 | |||
Custodian fees | 1,062 | |||
Miscellaneous | 70,198 | |||
|
| |||
Total Expenses | 1,616,357 | |||
Less reduction of expenses (Note 3) | (121,559 | ) | ||
|
| |||
Net Expenses | 1,494,798 | |||
|
| |||
NET INVESTMENT LOSS | (784,137 | ) | ||
|
| |||
REALIZED AND UNREALIZED GAIN (LOSS) ON INVESTMENTS: | ||||
Net realized gain on investments | 13,723,248 | |||
Net change in unrealized appreciation (depreciation) on investments | (15,730,651 | ) | ||
|
| |||
NET REALIZED AND UNREALIZED GAIN (LOSS) ON INVESTMENTS | (2,007,403 | ) | ||
|
| |||
NET DECREASE IN NET ASSETS RESULTING FROM OPERATIONS | $ | (2,791,540 | ) | |
|
| |||
The accompanying notes are an integral part of the financial statements.
11
Equity Series
Statements of Changes in Net Assets
FOR THE YEAR ENDED | FOR THE YEAR ENDED | |||||||
INCREASE (DECREASE) IN NET ASSETS: | ||||||||
OPERATIONS: | ||||||||
Net investment income (loss) | $ | (784,137 | ) | $ | 343,865 | |||
Net realized gain on investments | 13,723,248 | 108,788,624 | ||||||
Net change in unrealized appreciation (depreciation) on investments | (15,730,651 | ) | (104,920,453 | ) | ||||
|
|
|
| |||||
Net increase (decrease) from operations | (2,791,540 | ) | 4,212,036 | |||||
|
|
|
| |||||
DISTRIBUTIONS TO SHAREHOLDERS (Note 8): | ||||||||
From net investment income | (42,667 | ) | (246,854 | ) | ||||
From net realized gain on investments | (57,461,992 | ) | (202,981,217 | ) | ||||
|
|
|
| |||||
Total distributions to shareholders | (57,504,659 | ) | (203,228,071 | ) | ||||
|
|
|
| |||||
CAPITAL STOCK ISSUED AND REPURCHASED: | ||||||||
Net decrease from capital share transactions (Note 5) | (342,179,746 | ) | (590,372,793 | ) | ||||
|
|
|
| |||||
Net decrease in net assets | (402,475,945 | ) | (789,388,828 | ) | ||||
NET ASSETS: | ||||||||
Beginning of year | 500,946,219 | 1,290,335,047 | ||||||
|
|
|
| |||||
End of year (including undistributed net investment loss of $326,267 and undistributed net investment income $22,314, respectively) | $ | 98,470,274 | $ | 500,946,219 | ||||
|
|
|
| |||||
The accompanying notes are an integral part of the financial statements.
12
Equity Series
Financial Highlights
| FOR THE YEARS ENDED | ||||||||||||||||||||
| 10/31/16 | 10/31/15 | 10/31/14 | 10/31/13 | 10/31/12 | ||||||||||||||||
Per share data (for a share outstanding throughout each year): | ||||||||||||||||||||
Net asset value - Beginning of year | $ | 16.62 | $ | 21.15 | $ | 21.60 | $ | 19.03 | $ | 18.45 | ||||||||||
|
|
|
|
|
|
|
|
|
| |||||||||||
Income (loss) from investment operations: | ||||||||||||||||||||
Net investment income (loss)1 | (0.07 | ) | 0.01 | (0.00 | )2 | 0.01 | 0.01 | |||||||||||||
Net realized and unrealized gain (loss) on investments | 0.64 | (0.42 | ) | 2.51 | 5.14 | �� | 1.26 | |||||||||||||
|
|
|
|
|
|
|
|
|
| |||||||||||
Total from investment operations | 0.57 | (0.41 | ) | 2.51 | 5.15 | 1.27 | ||||||||||||||
|
|
|
|
|
|
|
|
|
| |||||||||||
Less distributions to shareholders: | ||||||||||||||||||||
From net investment income | (0.00 | )2 | (0.00 | )2 | (0.01 | ) | (0.03 | ) | (0.04 | ) | ||||||||||
From net realized gain on investments | (4.99 | ) | (4.12 | ) | (2.95 | ) | (2.55 | ) | (0.65 | ) | ||||||||||
|
|
|
|
|
|
|
|
|
| |||||||||||
Total distributions to shareholders | (4.99 | ) | (4.12 | ) | (2.96 | ) | (2.58 | ) | (0.69 | ) | ||||||||||
|
|
|
|
|
|
|
|
|
| |||||||||||
Net asset value - End of year | $ | 12.20 | $ | 16.62 | $ | 21.15 | $ | 21.60 | $ | 19.03 | ||||||||||
|
|
|
|
|
|
|
|
|
| |||||||||||
Net assets - End of year (000’s omitted) | $ | 98,470 | $ | 500,946 | $ | 1,290,335 | $ | 1,237,520 | $ | 1,418,468 | ||||||||||
|
|
|
|
|
|
|
|
|
| |||||||||||
Total return3 | 6.16 | % | (1.46 | %) | 13.23 | % | 30.61 | % | 7.37 | % | ||||||||||
Ratios (to average net assets)/Supplemental Data: | ||||||||||||||||||||
Expenses* | 1.05 | % | 1.05 | % | 1.05 | % | 1.05 | % | 1.05 | % | ||||||||||
Net investment income (loss) | (0.55 | %) | 0.04 | % | (0.01 | %) | 0.06 | % | 0.06 | % | ||||||||||
Portfolio turnover | 40 | % | 62 | % | 61 | % | 52 | % | 63 | % | ||||||||||
| *The investment advisor did not impose all or a portion of its management and/or other fees, and in some years may have paid a portion of the Series’ expenses. If these expenses had been incurred by the Series, the expense ratio (to average net assets) would have increased by the following amounts: | ||||||||||||||||||||
| 0.09 | % | 0.03 | % | 0.02 | % | 0.06 | % | 0.05 | % | |||||||||||
1 Calculated based on average shares outstanding during the years.
2 Less than $(0.01).
3 Represents aggregate total return for the years indicated, and assumes reinvestment of all distributions. Total return would have been lower had certain expenses not been waived or reimbursed.
The accompanying notes are an integral part of the financial statements.
13
Equity Series
Notes to Financial Statements
| 1. | Organization |
Equity Series (the “Series”) is a no-load diversified series of Manning & Napier Fund, Inc. (the “Fund”). The Fund is organized in Maryland and is registered under the Investment Company Act of 1940, as amended, as an open-end management investment company.
The Series’ investment objective is to provide long-term growth of capital.
The Fund’s Advisor is Manning & Napier Advisors, LLC (the “Advisor”). Shares of the Series are offered to investors, clients and employees of the Advisor and its affiliates. The total authorized capital stock of the Fund consists of 15 billion shares of common stock each having a par value of $0.01. As of October 31, 2016, 10.5 billion shares have been designated in total among 40 series, of which 200 million have been designated as Equity Series Class A common stock.
| 2. | Significant Accounting Policies |
The following is a summary of significant accounting policies followed by the Series. The Series is an investment company and, accordingly, follows the investment company accounting and reporting guidance of the Financial Accounting Standards Board Accounting Standards Codification Topic 946 - Investment Companies, which is part of accounting principles generally accepted in the United States of America (“GAAP”).
Security Valuation
Portfolio securities, including domestic equities, listed on an exchange other than the NASDAQ Stock Market are valued at the latest quoted sales price of the exchange on which the security is primarily traded. Securities not traded on valuation date or securities not listed on an exchange are valued at the latest quoted bid price provided by the Fund’s pricing service. Securities listed on the NASDAQ Stock Market are valued in accordance with the NASDAQ Official Closing Price.
Short-term investments that mature in sixty days or less may be valued at amortized cost, which approximates fair value. Investments in open-end investment companies are valued at their net asset value per share on valuation date.
Volume and level of activity in established markets for an asset or liability are evaluated to determine whether recent transactions and quoted prices are determinative of fair value. Where there have been significant decreases in volume and level of activity, further analysis and adjustment may be necessary to estimate fair value. The Series measures fair value in these instances by the use of inputs and valuation techniques which may be based upon current market prices of securities that are comparable in coupon, rating, maturity and industry and/or expectation of future cash flows. As a result of trading in relatively thin markets and/or markets that experience significant volatility, the prices used by the Series to value these securities may differ from the value that would be realized if these securities were sold, and the differences could be material.
Securities for which representative valuations or prices are not available from the Series’ pricing service may be valued at fair value as determined in good faith by the Advisor under procedures approved by and under the general supervision and responsibility of the Fund’s Board of Directors (the “Board”). Due to the inherent uncertainty of valuations of such securities, the fair value may differ significantly from the values that would have been used had a ready market for such securities existed. If trading or events occurring after the close of the principal market in which securities are traded are expected to materially affect the value of those securities, then they may be valued at their fair value, taking this trading or these events into account.
Various inputs are used in determining the value of the Series’ assets or liabilities carried at fair value. These inputs are summarized in three broad levels. Level 1 includes quoted prices in active markets for identical assets and liabilities. Level 2 includes other significant observable inputs (including quoted prices for similar securities, interest rates, prepayment speeds, credit risk, etc.). Level 3 includes significant unobservable inputs (including the Series’ own assumptions in determining the fair value of investments). A financial instrument’s level within the fair value hierarchy is based on the lowest level of any input both individually and in aggregate that is significant to the fair value measurement. The inputs or methodology used for valuing securities are not necessarily an indication of the risk associated with investing in those securities.
14
Equity Series
Notes to Financial Statements (continued)
| 2. | Significant Accounting Policies (continued) |
Security Valuation (continued)
The following is a summary of the valuation levels used for major security types as of October 31, 2016 in valuing the Series’ assets or liabilities carried at fair value:
| DESCRIPTION | TOTAL | LEVEL 1 | LEVEL 2 | LEVEL 3 | ||||||||||||
Assets: | ||||||||||||||||
Equity securities: | ||||||||||||||||
Consumer Discretionary | $ | 20,797,628 | $ | 20,797,628 | $ | — | $ | — | ||||||||
Consumer Staples | 3,484,625 | 3,484,625 | — | — | ||||||||||||
Energy | 1,302,267 | 1,302,267 | — | — | ||||||||||||
Financials | 6,129,783 | 6,129,783 | — | — | ||||||||||||
Health Care | 16,437,540 | 16,437,540 | — | — | ||||||||||||
Industrials | 4,755,912 | 4,755,912 | — | — | ||||||||||||
Information Technology | 33,126,188 | 33,126,188 | — | — | ||||||||||||
Materials | 7,733,346 | 7,733,346 | — | — | ||||||||||||
Real Estate | 2,345,331 | 2,345,331 | — | — | ||||||||||||
Telecommunication Services | 2,294,303 | 2,294,303 | — | — | ||||||||||||
Mutual Fund | 963,998 | 963,998 | — | — | ||||||||||||
|
|
|
|
|
|
|
| |||||||||
Total assets | $ | 99,370,921 | $ | 99,370,921 | $ | — | $ | — | ||||||||
|
|
|
|
|
|
|
| |||||||||
There were no Level 2 or Level 3 securities held by the Series as of October 31, 2015 or October 31, 2016.
The Fund’s policy is to recognize transfers in and transfers out of the valuation levels as of the beginning of the reporting period. There were no transfers between Level 1 and Level 2 during the year ended October 31, 2016.
New Accounting Guidance
In October 2016, the Securities and Exchange Commission (SEC) issued a new rule, Investment Company Reporting Modernization, which, among other provisions, amends Regulation S-X to require standardized, enhanced disclosures, particularly related to derivatives, in investment company financial statements. Compliance with the guidance is required for financial statements filed with the SEC on or after August 1, 2017; adoption will have no effect on the Fund’s net assets or results of operations.
Security Transactions, Investment Income and Expenses
Security transactions are accounted for on trade date. Dividend income is recorded on the ex-dividend date, except that if the ex-dividend date has passed, certain dividends from foreign securities are recorded as soon as the Series is informed of the ex-dividend date. Non-cash dividends, if any, are recorded at the fair value of the securities received. Interest income, including amortization of premium and accretion of discounts using the effective interest method, is earned from settlement date and accrued daily.
Expenses are recorded on an accrual basis. Most expenses of the Fund can be attributed to a specific series. Expenses which cannot be directly attributed are apportioned among the series in the Fund in such a manner as deemed equitable by the Fund’s Board, taking into consideration, among other things, the nature and type of expense.
The Series uses the identified cost method for determining realized gain or loss on investments for both financial statement and federal income tax reporting purposes.
Federal Taxes
The Series’ policy is to comply with the provisions of the Internal Revenue Code applicable to regulated investment companies. The Series is not subject to federal income tax or excise tax to the extent that the Series distributes to shareholders each year its taxable income, including any net realized gains on investments, in accordance with requirements of the Internal Revenue Code. Accordingly, no provision for federal income tax or excise tax has been made in the financial statements.
15
Equity Series
Notes to Financial Statements (continued)
| 2. | Significant Accounting Policies (continued) |
Federal Taxes (continued)
Management evaluates its tax positions to determine if the tax positions taken meet the minimum recognition threshold in connection with accounting for uncertainties in income tax positions taken or expected to be taken for the purposes of measuring and recognizing tax liabilities in the financial statements. Recognition of tax benefits of an uncertain tax position is required only when the position is “more likely than not” to be sustained assuming examination by taxing authorities. At October 31, 2016, the Series has recorded no liability for net unrecognized tax benefits relating to uncertain income tax positions taken or expected to be taken in future tax returns.
The Series files income tax returns in the U.S. federal jurisdiction, various states and foreign jurisdictions, as required. No income tax returns are currently under investigation. The statute of limitations on the Series’ tax returns remains open for the years ended October 31, 2013 through October 31, 2016. The Series is not aware of any tax positions for which it is reasonably possible that the total amounts of unrecognized tax benefits will significantly change in the next twelve months.
Foreign Taxes
Based on the Series’ understanding of the tax rules and rates related to income, gains and currency purchase/repatriation transactions for foreign jurisdictions in which it invests, the Series will provide for foreign taxes, and where appropriate, deferred foreign tax.
Distributions of Income and Gains
Distributions to shareholders of net investment income and net realized gains are made annually. An additional distribution may be necessary to avoid taxation of the Series. Distributions are recorded on the ex-dividend date.
Indemnifications
The Fund’s organizational documents provide former and current directors and officers with a limited indemnification against liabilities arising in connection with the performance of their duties to the Fund. In the normal course of business, the Fund may also enter into contracts that provide general indemnifications. The Fund’s maximum exposure under these arrangements is unknown as this would be dependent on future claims that may be made against the Fund. The risk of material loss from such claims is considered remote.
Other
The preparation of financial statements in conformity with GAAP requires management to make estimates and assumptions that affect the reported amounts of assets and liabilities and the disclosure of contingent assets and liabilities at the date of the financial statements and the reported amounts of income and expenses during the reporting period. Actual results could differ from those estimates.
| 3. | Transactions with Affiliates |
The Fund has an Investment Advisory Agreement (the “Agreement”) with the Advisor, for which the Series pays a fee, computed daily and payable monthly, at an annual rate of 1.00% of the Series’ average daily net assets.
Under the Agreement, personnel of the Advisor provide the Series with advice and assistance in the choice of investments and the execution of securities transactions, and otherwise maintain the Series’ organization. The Advisor also provides the Fund with necessary office space and fund administration and support services. The salaries of all officers of the Fund (except a percentage of the Fund’s Chief Compliance Officer’s salary, which is paid by the Fund), and of all Directors who are “affiliated persons” of the Fund, or of the Advisor, and all personnel of the Fund, or of the Advisor, performing services relating to research, statistical and investment activities, are paid by the Advisor. Each “non-affiliated” Director receives an annual stipend, which is allocated among all the active series of the Fund. In addition, these Directors also receive a fee per Board meeting attended plus a fee for each committee meeting attended and are reimbursed for travel and other out-of-pocket expenses incurred by them in connection with attending such meetings. The Fund also has an Audit Committee Chair, who receives an additional annual stipend for this role.
16
Equity Series
Notes to Financial Statements (continued)
| 3. | Transactions with Affiliates (continued) |
The Advisor has contractually agreed, until at least February 28, 2017, to waive its management fee and, if necessary, pay other operating expenses of the Series in order to maintain total direct annual fund operating expenses for the Series at no more than 1.05% of average daily net assets each year. Accordingly, the Advisor waived fees of $121,559 for the year ended October 31, 2016, which is included as a reduction of expenses on the Statement of Operations. The Advisor is not eligible to recoup any expenses that have been waived or reimbursed in prior years.
Manning & Napier Investor Services, Inc., a registered broker-dealer affiliate of the Advisor, acts as distributor for the Fund’s shares. The services of Manning & Napier Investor Services, Inc. are provided at no additional cost to the Series.
Pursuant to a master services agreement dated November 1, 2014, the Fund pays the Advisor an annual fee related to fund accounting and administration of 0.0085% on the first $25 billion of average daily net assets (excluding Target Series and Strategic Income Series); 0.0075% on the next $15 billion of average daily net assets (excluding Target Series and Strategic Income Series); and 0.0065% of the average daily net assets in excess of $40 billion (excluding Target Series and Strategic Income Series); plus a base fee of $30,400 per series. Transfer agent fees are charged to the Fund on a per account basis. Additionally, certain transaction and out-of-pocket expenses, including charges for reporting relating to the Fund’s compliance program, are charged. The Advisor has agreements with BNY Mellon Investment Servicing (U.S.) Inc. (“BNY”) under which BNY serves as sub-accountant services agent and sub-transfer agent.
Expenses not directly attributable to a series are allocated based on each series’ relative net assets or number of accounts, depending on the expense.
| 4. | Purchases and Sales of Securities |
For the year ended October 31, 2016, purchases and sales of securities, other than U.S. Government securities and short-term securities, were $59,087,862 and $444,209,500 respectively. There were no purchases or sales of U.S. Government securities.
| 5. | Capital Stock Transactions |
Transactions in shares of Equity Series were:
FOR THE YEAR ENDED 10/31/16 | FOR THE YEAR ENDED 10/31/15 | |||||||||||||||
| SHARES | AMOUNT | SHARES | AMOUNT | |||||||||||||
Sold | 1,404,275 | $ | 17,324,767 | 7,560,319 | $ | 132,732,396 | ||||||||||
Reinvested | 4,999,943 | 55,867,602 | 12,219,383 | 198,472,048 | ||||||||||||
Repurchased | (28,465,188 | ) | (415,372,115 | ) | (50,651,323 | ) | (921,577,237 | ) | ||||||||
|
|
|
|
|
|
|
| |||||||||
Total | (22,060,970 | ) | $ | (342,179,746 | ) | (30,871,621 | ) | $ | (590,372,793 | ) | ||||||
|
|
|
|
|
|
|
| |||||||||
At October 31, 2016, the Advisor and its affiliates owned 5.3% of the Series.
| 6. | Financial Instruments |
The Series may trade in instruments including written and purchased options, forward foreign currency exchange contracts and futures contracts and other derivatives in the normal course of investing activities to assist in managing exposure to various market risks. The Series may be subject to various elements of risk, which may involve, to a varying degree, elements of risk in excess of the amounts recognized for financial statement purposes. These risks include: the risk that changes in the value of a derivative may not correlate perfectly with the underlying asset, rate or index; counterparty credit risk related to over the counter derivative counterparties’ failure to perform under contract terms; liquidity risk related to the lack of a liquid market for these contracts allowing the fund to close out its position(s); and documentation risk relating to disagreement over contract terms. No such investments were held by the Series as of October 31, 2016.
17
Equity Series
Notes to Financial Statements (continued)
| 7. | Foreign Securities |
Investing in securities of foreign companies and foreign governments involves special risks and considerations not typically associated with investing in securities of domestic companies and the U.S. Government. These risks include revaluation of currencies and future adverse political and economic developments. Moreover, securities of foreign companies and foreign governments and their markets may be less liquid and their prices more volatile than those of comparable domestic companies and the U.S. Government.
| 8. | Federal Income Tax Information |
The amount and characterization of certain income and capital gains to be distributed are determined in accordance with federal income tax regulations, which may differ from GAAP. These differences are primarily due to differing book and tax treatments in the timing of the recognition of net investment income or gains and losses, including losses deferred due to wash sales. The Series may periodically make reclassifications among its capital accounts to reflect income and gains available for distribution (or available capital loss carryovers) under income tax regulations, without impacting the Series’ net asset value. For the year ended October 31, 2016, amounts were reclassified within the capital accounts to increase Additional Paid in Capital by $6,274,990, decrease Undistributed Net Investment Loss by $478,223 and decrease Accumulated Net Realized Gain on Investments by $6,753,213. Any such reclassifications are not reflected in the financial highlights.
The tax character of distributions paid were as follows:
| FOR THE YEAR ENDED 10/31/16 | FOR THE YEAR ENDED 10/31/15 | |||||||
Ordinary income | $ | 5,545,610 | $ | 49,123,867 | ||||
Long-term capital gains | 51,959,049 | 154,104,204 | ||||||
At October 31, 2016, the tax basis of components of distributable earnings and the net unrealized appreciation based on identified cost of investments for federal income tax purpose were as follows:
Cost for federal income tax purposes | $ | 96,895,056 | ||
Unrealized appreciation | 10,758,066 | |||
Unrealized depreciation | (8,282,201 | ) | ||
|
| |||
Net unrealized appreciation | $ | 2,475,865 | ||
|
| |||
Undistributed long-term capital gains | $ | 4,244,379 | ||
Qualified late-year losses1 | $ | 326,267 |
1 The Series has elected to defer certain qualified late-year losses and recognize such losses in the year ending October 31, 2017.
18
Equity Series
Report of Independent Registered Public Accounting Firm
To the Board of Directors of Manning & Napier Fund, Inc. and Shareholders of Equity Series:
In our opinion, the accompanying statement of assets and liabilities, including the investment portfolio, and the related statements of operations and of changes in net assets and the financial highlights present fairly, in all material respects, the financial position of the Equity Series (a series of Manning & Napier Fund, Inc., hereafter referred to as the “Series”) as of October 31, 2016, the results of its operations for the year then ended, the changes in its net assets for each of the two years in the period then ended and the financial highlights for each of the five years in the period then ended, in conformity with accounting principles generally accepted in the United States of America. These financial statements and financial highlights (hereafter referred to as “financial statements”) are the responsibility of the Series’ management. Our responsibility is to express an opinion on these financial statements based on our audits. We conducted our audits of these financial statements in accordance with the standards of the Public Company Accounting Oversight Board (United States). Those standards require that we plan and perform the audit to obtain reasonable assurance about whether the financial statements are free of material misstatement. An audit includes examining, on a test basis, evidence supporting the amounts and disclosures in the financial statements, assessing the accounting principles used and significant estimates made by management, and evaluating the overall financial statement presentation. We believe that our audits, which included confirmation of securities as of October 31, 2016 by correspondence with the custodian and brokers, provide a reasonable basis for our opinion.

New York, New York
December 16, 2016
19
Equity Series
Supplemental Tax Information
(unaudited)
All reportings are based on financial information available as of the date of this annual report and, accordingly, are subject to change.
For federal income tax purposes, the Series reports for the current fiscal year $1,272,046 or, if different, the maximum amount allowable under the tax law, as qualified dividend income.
For corporate shareholders, the percentage of investment income (dividend income plus short-term gains, if any) that qualifies for the dividends received deduction for the current fiscal year is 70.12%.
The Series designates $11,062,571 as Long-Term Capital Gain dividends pursuant to Section 852(b) of the Code for the fiscal year ended October 31, 2016.
20
Equity Series
Directors’ and Officers’ Information
(unaudited)
The Statement of Additional Information provides additional information about the Fund’s directors and officers and can be obtained without charge by calling 1-800-466-3863, at www.manningnapieradvisors.com, or on the EDGAR Database on the SEC Internet web site (http:// www.sec.gov). The following chart shows certain information about the Fund’s officers and directors, including their principal occupations during the last five years. Unless specific dates are provided, the individuals have held the listed positions for longer than five years.
| Interested Director/Officer | ||
| Name: | Michele T. Mosca* | |
| Address: | 290 Woodcliff Drive | |
| Fairport, NY 14450 | ||
| Age: | 44 | |
| Current Position(s) Held with Fund: | Principal Executive Officer, President, Chairman & Director | |
| Term of Office1 & Length of Time Served: | Indefinite - Chairman and Director since August 2016 | |
| Principal Occupation(s) During Past 5 Years: | Managing Director, Funds Group (2009-present)-Manning & Napier Advisors, LLC; President, Director (2015-present) - Manning & Napier Investor Services, Inc.; Chief Executive Officer, President (2016-present) - Rainier Investment Management Mutual Funds | |
| Holds or has held one or more of the following titles for various subsidiaries and affiliates: President, Director | ||
| Number of Portfolios Overseen within Fund Complex: | 40 | |
| Other Directorships Held Outside Fund Complex: | Trustee - Rainier Investment Management Mutual Funds (six portfolios) (2016-present) | |
| ||
| Independent Directors | ||
| Name: | Stephen B. Ashley | |
| Address: | 290 Woodcliff Drive | |
| Fairport, NY 14450 | ||
| Age: | 76 | |
| Current Position(s) Held with Fund: | Director, Audit Committee Member, Governance & Nominating Committee Member | |
| Term of Office & Length of Time Served: | Indefinite - Since 1996 | |
| Principal Occupation(s) During Past 5 Years: | Chairman, Director & Chief Executive Officer (1997 to present) - The Ashley Group (property management and investment). Director (1995-2008) and Chairman (non-executive)(2004-2008) - Fannie Mae (mortgage) | |
| Number of Portfolios Overseen within Fund Complex: | 40 | |
| Other Directorships Held Outside Fund Complex: | Fannie Mae (mortgage)(1995-2008) | |
| The Ashley Group (property management and investment)(1995-2008) | ||
| Genesee Corporation (holding company)(1987-2007) | ||
| ||
| Name: | Paul A. Brooke | |
| Address: | 290 Woodcliff Drive | |
| Fairport, NY 14450 | ||
| Age: | 70 | |
| Current Position(s) Held with Fund: | Director, Audit Committee Member, Governance & Nominating Committee Member | |
| Term of Office & Length of Time Served: | Indefinite - Since 2007 | |
| Principal Occupation(s) During Past 5 Years: | Chairman & CEO (2005-2009)- Ithaka Acquisition Corporation | |
| (investments); Chairman (2007-2009)- Alsius Corporation (investments); | ||
| Managing Member (1991-present)- PMSV Holdings LLC(investments); | ||
| Managing Member (2010-present)- Venbio (investments). | ||
| Number of Portfolios Overseen within Fund Complex: | 40 | |
| Other Directorships Held Outside Fund Complex: | Incyte Corp. (biotech)(2000-present) | |
| ViroPharma, Inc. (speciality pharmaceuticals)(2000-2014) | ||
| HLTH Corp (WebMD)(information)(2000-2010) | ||
| Cheyne Capital International (investment)(2000-present) | ||
| GMP Companies (investment)(2000-2011) | ||
| Cytos Biotechnology Ltd (biotechnology)(2012-present) | ||
| ||
21
Equity Series
| Directors’ and Officers’ Information | ||
(unaudited)
| ||
| Independent Directors (continued) | ||
| Name: | Peter L. Faber | |
| Address: | 290 Woodcliff Drive | |
| Fairport, NY 14450 | ||
| Age: | 78 | |
| Current Position(s) Held with Fund: | Director, Governance & Nominating Committee Member | |
| Term of Office & Length of Time Served: | Indefinite - Since 1987 | |
| Principal Occupation(s) During Past 5 Years: | Senior Counsel (2006-2012), Partner (1995-2006 & 2013-present)- McDermott, Will & Emery LLP (law firm) | |
| Number of Portfolios Overseen within Fund Complex: | 40 | |
| Other Directorships Held Outside Fund Complex: | Boston Early Music Festival (non-profit) (2007-present) | |
| Amherst Early Music, Inc. (non-profit)(2009-present) | ||
| Gotham Early Music Scene, Inc. (non-profit)(2009-present) | ||
| Partnership for New York City, Inc. (non-profit) (1989-2010) | ||
| New York Collegium (non-profit) (2004-2011) | ||
| ||
| Name: | Harris H. Rusitzky | |
| Address: | 290 Woodcliff Drive | |
| Fairport, NY 14450 | ||
| Age: | 81 | |
| Current Position(s) Held with Fund: | Director, Audit Committee Member, Governance & Nominating Committee Member | |
| Term of Office & Length of Time Served: | Indefinite - Since 1985 | |
| Principal Occupation(s) During Past 5 Years: | President (1994-present)- The Greening Group (business consultants); | |
| Partner (2006-present)- The Restaurant Group (restaurants) | ||
| Number of Portfolios Overseen within Fund Complex: | 40 | |
| Other Directorships Held Outside Fund Complex: | Rochester Institute of Technology (university) (1972-present) | |
| Culinary Institute of America (non-profit college) (1985-present) | ||
| George Eastman House (museum) (1988-present) | ||
| National Restaurant Association (restaurant trade organization) | ||
| (1978-present) | ||
| ||
| Name: | Chester N. Watson | |
| Address: | 290 Woodcliff Drive | |
| Fairport, NY 14450 | ||
| Age: | 66 | |
| Current Position(s) Held with Fund: | Director, Audit Committee Chairman, Governance & Nominating Committee Member | |
| Term of Office & Length of Time Served: | Indefinite - Since 2012 | |
| Principal Occupation(s) During Past 5 Years: | General Auditor (2003-2011)- General Motors Company (auto manufacturer) | |
| Number of Portfolios Overseen within Fund Complex: | 40 | |
| Other Directorships Held Outside Fund Complex: | Rochester Institute of Technology (university) (2005-present) | |
Officers | ||
| Name: | Jeffrey S. Coons, Ph.D., CFA® | |
| Address: | 290 Woodcliff Drive | |
| Fairport, NY 14450 | ||
| Age: | 53 | |
| Current Position(s) Held with Fund: | Vice President | |
| Term of Office1 & Length of Time Served: | Since 2004 | |
| Principal Occupation(s) During Past 5 Years: | President since 2010, Co-Director of Research (2002-2015) - Manning & Napier Advisors, LLC | |
| Holds one or more of the following titles for various subsidiaries and affiliates: President, Director, Treasurer or Senior Trust Officer. | ||
| Number of Portfolios Overseen within Fund Complex: | 40 | |
| Other Directorships Held Outside Fund Complex: | N/A | |
| ||
22
Equity Series
| Directors’ and Officers’ Information | ||
(unaudited)
| ||
| Officers (continued) | ||
| Name: | Elizabeth Craig | |
| Address: | 290 Woodcliff Drive | |
| Fairport, NY 14450 | ||
| Age: | 29 | |
| Current Position(s) Held with Fund: | Corporate Secretary | |
| Term of Office1 & Length of Time Served: | Since 2016 | |
| Principal Occupation(s) During Past 5 Years: | Fund Administration Manager since 2015; Mutual Fund Compliance | |
| Specialist (2009-2015) - Manning & Napier Advisors, LLC; Assistant | ||
| Corporate Secretary (2011-2016)- Manning & Napier Fund, Inc. | ||
| Number of Portfolios Overseen within Fund Complex: | 40 | |
| Other Directorships Held Outside Fund Complex: | N/A | |
| ||
| Name: | Christine Glavin | |
| Address: | 290 Woodcliff Drive | |
| Fairport, NY 14450 | ||
| Age: | 50 | |
| Current Position(s) Held with Fund: | Principal Financial Officer, Chief Financial Officer | |
| Term of Office1 & Length of Time Served: | Principal Financial Officer (2002-present); Chief Financial Officer (2001-present) | |
| Principal Occupation(s) During Past 5 Years: | Director of Fund Reporting (2011-present); Fund Reporting Manager (1997-2011)- Manning & Napier Advisors, LLC; Assistant Treasurer (2008-present)- Exeter Trust Company | |
| Number of Portfolios Overseen within Fund Complex: | 40 | |
| Other Directorships Held Outside Fund Complex: | N/A | |
| ||
| Name: | Jodi L. Hedberg | |
| Address: | 290 Woodcliff Drive | |
| Fairport, NY 14450 | ||
| Age: | 48 | |
| Current Position(s) Held with Fund: | Chief Compliance Officer, Anti-Money Laundering Compliance Officer | |
| Term of Office1 & Length of Time Served: | Chief Compliance Officer (2004-present); Anti-Money Laundering | |
| Compliance Officer (2002-present); Corporate Secretary (1997-2016) | ||
| Principal Occupation(s) During Past 5 Years: | Director of Compliance (2005-present); Compliance Manager (1995-2005) - Manning & Napier Advisors, LLC and affiliates; Corporate Secretary- Manning & Napier Investor Services, Inc. since 2006 | |
| Number of Portfolios Overseen within Fund Complex: | 40 | |
| Other Directorships Held Outside Fund Complex: | N/A | |
| ||
| Name: | Amy Williams | |
| Address: | 290 Woodcliff Drive | |
| Fairport, NY 14450 | ||
| Age: | 54 | |
| Current Position(s) Held with Fund: | Assistant Corporate Secretary | |
| Term of Office1 & Length of Time Served: | Since 2016 | |
| Principal Occupation(s) During Past 5 Years: | Director of Fund Documentation (1992-present) - Manning & Napier Advisors, LLC Holds one or more of the following titles for various affiliates; Director | |
| Number of Portfolios Overseen within Fund Complex: | 40 | |
| Other Directorships Held Outside Fund Complex: | N/A | |
| ||
| Name: | Richard Yates | |
| Address: | 290 Woodcliff Drive | |
| Fairport, NY 14450 | ||
| Age: | 51 | |
| Current Position(s) Held with Fund: | Chief Legal Officer | |
| Term of Office1 & Length of Time Served: | Chief Legal Officer since 2004 | |
| Principal Occupation(s) During Past 5 Years: | Counsel- Manning & Napier Advisors, LLC and affiliates (2000-present); | |
| Holds one or more of the following titles for various affiliates; Director or Corporate Secretary | ||
| Number of Portfolios Overseen within Fund Complex: | 40 | |
| Other Directorships Held Outside Fund Complex: | N/A | |
| ||
* Interested Director, within the meaning of the Investment Company Act of 1940 by reason of her position with the Fund’s investment advisor. Ms. Mosca serves as the Managing Director of the Funds Group for Manning & Napier Advisors, LLC.
1 The term of office of all officers shall be one year and until their respective successors are chosen and qualified, or his or her earlier resignation or removal as provided in the Fund’s By-Laws.
23
{This page intentionally left blank}
24
{This page intentionally left blank}
25
Equity Series
Literature Requests
Proxy Voting Policies and Procedures
A description of the policies and procedures that the Fund uses to determine how to vote proxies relating to portfolio securities is available, without charge, upon request:
| By phone | 1-800-466-3863 | |||
| On the Securities and Exchange | ||||
| Commission’s (SEC) web site | http://www.sec.gov |
Proxy Voting Record
Information regarding how the Fund voted proxies relating to portfolio securities during the most recent 12-month period ended June 30th is available, without charge, upon request:
| By phone | 1-800-466-3863 | |||
| On the SEC’s web site | http://www.sec.gov |
Quarterly Portfolio Holdings
The Series’ complete schedule of portfolio holdings for the 1st and 3rd quarters of each fiscal year are provided on Form N-Q, and are available, without charge, upon request:
| By phone | 1-800-466-3863 | |||
| On the SEC’s web site | http://www.sec.gov |
The Series’ Form N-Q may be reviewed and copied at the SEC’s Public Reference Room in Washington, D.C. Information on the operation of the Public Reference Room may be obtained by calling 1-800-SEC-0330.
Prospectus and Statement of Additional Information (SAI)
For more information about any of the Manning & Napier Fund, Inc. Series, you may obtain a prospectus and SAI at www.manning-napier.com or by calling (800) 466-3863. Before investing, carefully consider the objectives, risks, charges and expenses of the investment and read the prospectus carefully as it contains this and other information about the investment company. In addition, this information can be found on the SEC’s web site, http://www.sec.gov.
Additional information available at www.manning-napier.com
1. Fund Holdings - Month-End
2. Fund Holdings - Quarter-End
3. Shareholder Report - Annual
4. Shareholder Report - Semi-Annual
The Fund also offers electronic notification or “e-delivery” when certain documents are available on-line to be downloaded or reviewed. Direct shareholders can elect to receive electronic notification when shareholder reports, prospectus updates, and/or statements are available. If you do not currently have on-line access to your account, you can establish access by going to www.manning-napier.com, click on “Login” in the top corner of the page, and follow the prompts to self-enroll. Once enrolled, you can set your electronic notification preferences by clicking on the Account Options tab located within the green toolbar and then select E-Delivery Option. Should you have any questions on either how to establish on-line access or how to update your account settings, please contact Investor Services at 1-800-466-3863.
The Manning & Napier Fund, Inc. is managed by Manning & Napier Advisors, LLC. Manning & Napier Investor Services, Inc., an affiliate of Manning & Napier Advisors, LLC, is the distributor of the Fund shares.
MNEQY-10/16-AR

Tax Managed Series
Management Discussion and Analysis
(unaudited)
Dear Shareholders:
U.S. and international equity markets delivered positive returns during the past year. Emerging market equities were the notable outperformers, driven by investors’ search for yield and their increased appetite for riskier assets. Abating unease related to Chinese growth, a relatively stable U.S. dollar, the year-to-date upturn in commodity prices, and increased liquidity amid generally easy policy across the globe also provided tailwinds for emerging market assets. Defensive sectors outperformed cyclicals for most of the period, since defensive securities tend to benefit from low interest rate environments and yield is a big component of total return. But the trend reversed amid a mid-year rotation away from crowded defensive sectors into cyclical stocks, and investors have since shown a preference for growth over yield.
Meanwhile, U.S. and global economic growth continued at a slow pace. Although various asset classes performed positively, the year was punctuated by bouts of market volatility. Ongoing concern regarding the price of oil and other commodities, speculation surrounding the trajectory of global economic growth and central bank policy, and political uncertainty — including the unexpected Brexit vote — fueled investor unease and served as volatility catalysts. Going forward, we anticipate an increased likelihood of further gyrations in financial markets as U.S. and global economic growth continues at a muted pace.
Enclosed, we highlight how we are positioned amid the current economic environment, and provide our outlook of what to expect in financial markets. We hope that you find this information to be helpful.
As always, we appreciate your business.
Sincerely,
Manning & Napier Advisors, LLC
1
Tax Managed Series
Fund Commentary
(unaudited)
Investment Objective
To maximize long-term growth while attempting to minimize the impact of taxes on the total return earned by shareholders. The Series invests in equity securities and is designed for those investors who are conscious of tax implications in their portfolios.
Performance Commentary
U.S. equity markets generally delivered positive absolute returns for the twelve-month period ended October 31, 2016. The S&P 500 Index gained 4.48% while the Russell 3000 Index earned 4.24%. International equity markets generally delivered modestly positive absolute returns, with the broad MSCI All Country World ex U.S. Index (ACWIxUS) returning 0.22%. For the recent fiscal year, the Tax Managed Series delivered positive absolute returns of 4.32%, slightly outperforming its Russell 3000 Index on a relative basis. The Tax Managed Series also continues to provide competitive absolute and relative returns over the current U.S. stock market cycle. The cycle includes a prolonged bear market from April 2000 to February 2009, a recovery, and the current bull market. Since the cycle began, the Tax Managed Series has returned 6.18% annualized, outpacing the Russell 3000’s annualized return of 4.45%.
The Series’ outperformance relative to the Russell 3000 Index during the year was driven by stock selection. Conversely, sector positioning challenged relative returns. Regarding major contributors to relative performance, stock selection in Health Care, Information Technology, and Consumer Discretionary aided relative returns. The Series’ overweight to Information Technology compared to the benchmark also aided relative returns.
Offsetting a portion of the relative performance tailwind was stock selection in Consumer Staples, which detracted from relative returns. The Series’ overweights to Health Care and Consumer Discretionary compared to the benchmark, as well as lack of exposure to Utilities, also challenged relative returns.
Following the close of the Series’ fiscal year, the Fund’s Board of Directors voted to close the Series and liquidate all outstanding shares. The closure of the Series to new investors and to additional investments from existing shareholders was described in the November 17, 2016 supplement to the Prospectus. The Series will redeem all of its outstanding shares on or about February 1, 2017 and distribute the proceeds to the Series’ shareholders (subject to maintenance of appropriate reserves for liquidation and other expenses).
Please see the next page for additional performance information as of October 31, 2016.
Performance data quoted represents past performance and does not guarantee future results. The investment return and principal value of an investment will fluctuate, so that an investor’s shares, when redeemed, may be worth more or less than their original cost. Current performance may be higher or lower than that quoted; investors can obtain the most recent month-end performance at www.manning-napier.com or by calling (800) 466-3863.
All investments involve risks, including possible loss of principal. As with any stock fund, the value of your investment will fluctuate in response to stock market movements. Investing in the Series will also involve a number of other risks, including issuer-specific risk, small-cap/mid-cap risk, and interest rate risk.
2
Tax Managed Series
Performance Update as of October 31, 2016
(unaudited)
| AVERAGE ANNUAL TOTAL RETURNS AS OF OCTOBER 31, 2016 | ||||||||||||||||
| ONE YEAR1 | FIVE YEAR | TEN YEAR | SINCE INCEPTION2 | |||||||||||||
Manning & Napier Fund, Inc. - Tax Managed Series | ||||||||||||||||
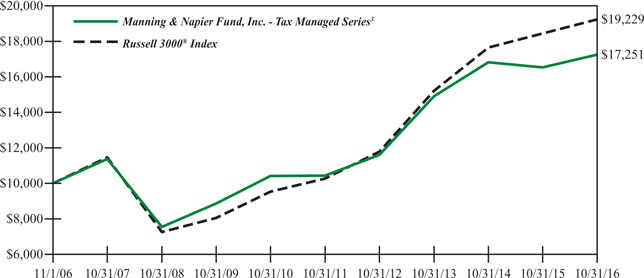
Returns Before Taxes3,5 | 4.32 | % | 10.59 | % | 5.60 | % | 8.86 | % | ||||||||
Returns After Taxes on Distributions4,5 | 0.69 | % | 7.93 | % | 4.14 | % | 7.92 | % | ||||||||
Returns After Taxes on Distributions and Sale of Series | ||||||||||||||||
Shares4,5 | 5.13 | % | 8.29 | % | 4.44 | % | 7.60 | % | ||||||||
Russell 3000® Index6 | 4.24 | % | 13.35 | % | 6.76 | % | 8.44 | % | ||||||||
The following graph compares the value of a $10,000 investment in the Manning & Napier Fund, Inc. - Tax Managed Series (returns before taxes) for the ten years ended October 31, 2016 to the Russell 3000® Index.
1The returns shown are based on net asset values calculated for shareholder transactions and may differ from the returns shown in the financial highlights, which reflect adjustments made to the net asset values in accordance with accounting principles generally accepted in the United States of America.
2Performance numbers for the Series and Index are calculated from November 1, 1995, the Series’ inception date.
3Returns before taxes do not reflect the deduction of taxes that a shareholder would pay on fund distributions or the redemption of shares. The performance returns shown are inclusive of the net expense ratio of the Series. For the year ended October 31, 2016, this net expense ratio was 1.20%. The gross expense ratio, which does not account for any voluntary or contractual waivers currently in effect, was 1.70% for the year ended October 31, 2016.
4Returns after taxes on distributions assume that an investor owned the Series during the entire period and paid taxes on the Series’ distributions. Returns after taxes on distributions and sale of Series shares assume that an investor paid taxes on the Series’ distributions and sold all shares at the end of each period. After-tax returns reflect the historical highest individual federal marginal income tax rates and do not reflect state and local taxes. Actual after-tax returns depend on an investor’s tax situation and may differ from those shown. After-tax returns reflect past tax effects and are not indicative of future tax effects. After-tax returns are not relevant to those investing through 401(k) plans, IRAs or other tax-deferred arrangements.
5The Series’ performance is historical and may not be indicative of future results.
6The Russell 3000® Index is an unmanaged index that consists of 3,000 of the largest U.S. companies based on total market capitalization. The Index returns are based on a market capitalization-weighted average of relative price changes of the component stocks plus dividends whose reinvestments are compounded daily. The Index returns do not reflect any fees or expenses. Index returns provided by Bloomberg.
3
Tax Managed Series
Shareholder Expense Example
(unaudited)
As a shareholder of the Series, you incur ongoing costs, including management fees, shareholder service fees and other Series expenses. This example is intended to help you understand your ongoing costs (in dollars) of investing in the Series and to compare these costs with the ongoing costs of investing in other mutual funds.
The example is based on an investment of $1,000 invested at the beginning of the period and held for the entire period (May 1, 2016 to October 31, 2016).
Actual Expenses
The first line of the table below provides information about actual account values and actual expenses. You may use the information in this line, together with the amount you invested, to estimate the expenses that you paid over the period. Simply divide your account value by $1,000 (for example, an $8,600 account value divided by $1,000 = 8.6), then multiply the result by the number in the first line under the heading entitled “Expenses Paid During Period” to estimate the expenses you paid on your account during this period.
Hypothetical Example for Comparison Purposes
The second line of the table below provides information about hypothetical account values and hypothetical expenses based on the Series’ actual expense ratio and an assumed rate of return of 5% per year before expenses, which is not the Series’ actual return. The hypothetical account values and expenses may not be used to estimate the actual ending account balance or expenses you paid during the period. You may use this information to compare the ongoing costs of investing in the Series and other funds. To do so, compare this 5% hypothetical example with the 5% hypothetical examples that appear in the shareholder reports of the other funds.
Please note that the expenses shown in the table are meant to highlight your ongoing costs only and do not reflect any transaction costs, such as sales charges (loads), redemptions fees, or exchange fees that you may incur in other mutual funds. Therefore, the second line of the table is useful in comparing ongoing costs only, and will not help you determine the relative total costs of owning different funds.
| BEGINNING ACCOUNT VALUE 5/1/16 | ENDING ACCOUNT VALUE 10/31/16 | EXPENSES PAID DURING PERIOD* 5/1/16-10/31/16 | ||||
Actual | $1,000.00 | $1,029.80 | $6.12 | |||
Hypothetical | ||||||
(5% return before expenses) | $1,000.00 | $1,019.10 | $6.09 |
*Expenses are equal to the Series’ annualized expense ratio (for the six-month period) of 1.20%, multiplied by the average account value over the period, multiplied by 184/366 (to reflect the one-half year period). Expenses are based on the most recent fiscal half year; therefore, the expense ratios stated above may differ from the expense ratios stated in the financial highlights, which are based on one-year data. The Series’ total return would have been lower had certain expenses not been waived during the period.
4
Tax Managed Series
Portfolio Composition as of October 31, 2016
(unaudited)
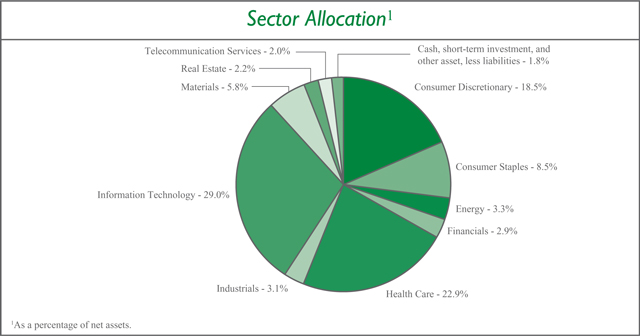
5
Tax Managed Series
Investment Portfolio - October 31, 2016
| SHARES | VALUE (NOTE 2) | |||||||
COMMON STOCKS - 98.2% | ||||||||
Consumer Discretionary - 18.5% | ||||||||
Diversified Consumer Services - 0.5% | ||||||||
Houghton Mifflin Harcourt Co.* | 6,410 | $ | 81,086 | |||||
|
| |||||||
Hotels, Restaurants & Leisure - 1.1% | ||||||||
Yum! Brands, Inc. | 1,910 | 164,795 | ||||||
|
| |||||||
Internet & Direct Marketing Retail - 6.6% | ||||||||
Amazon.com, Inc.* | 490 | 387,012 | ||||||
The Priceline Group, Inc.* | 290 | 427,527 | ||||||
TripAdvisor, Inc.* | 2,420 | 156,042 | ||||||
|
| |||||||
| 970,581 | ||||||||
|
| |||||||
Media - 7.7% | ||||||||
ITV plc (United Kingdom)1 | 45,600 | 95,065 | ||||||
Liberty Global plc - Class A - ADR (United Kingdom)* | 4,990 | 162,674 | ||||||
Time Warner, Inc. | 2,610 | 232,264 | ||||||
Tribune Media Co. - Class A | 9,990 | 325,674 | ||||||
Twenty-First Century Fox, Inc. - Class A | 12,340 | 324,172 | ||||||
|
| |||||||
| 1,139,849 | ||||||||
|
| |||||||
Specialty Retail - 1.2% | ||||||||
Kingfisher plc (United Kingdom)1 | 38,900 | 171,838 | ||||||
|
| |||||||
Textiles, Apparel & Luxury Goods - 1.4% | 3,660 | 209,535 | ||||||
|
| |||||||
lululemon athletica, Inc.* | ||||||||
Total Consumer Discretionary | 2,737,684 | |||||||
|
| |||||||
Consumer Staples - 8.5% | ||||||||
Beverages - 4.4% | ||||||||
Anheuser-Busch InBev S.A./N.V. (Belgium)1 | 2,090 | 239,870 | ||||||
The Coca-Cola Co. | 4,280 | 181,472 | ||||||
Diageo plc (United Kingdom)1 | 8,980 | 239,017 | ||||||
|
| |||||||
| 660,359 | ||||||||
|
| |||||||
Food & Staples Retailing - 0.9% | ||||||||
Sprouts Farmers Market, Inc.* | 5,820 | 128,913 | ||||||
|
| |||||||
Food Products - 1.1% | ||||||||
Nestle S.A. (Switzerland)1 | 2,270 | 164,607 | ||||||
|
| |||||||
Personal Products - 2.1% | ||||||||
Beiersdorf AG (Germany)1 | 1,810 | 159,570 | ||||||
Unilever plc - ADR (United Kingdom) | 3,560 | 148,345 | ||||||
|
| |||||||
| 307,915 | ||||||||
|
| |||||||
Total Consumer Staples | 1,261,794 | |||||||
|
| |||||||
Energy - 3.3% | ||||||||
Energy Equipment & Services - 2.2% | ||||||||
Schlumberger Ltd. | 4,260 | 333,260 | ||||||
|
| |||||||
The accompanying notes are an integral part of the financial statements.
6
Tax Managed Series
Investment Portfolio - October 31, 2016
| VALUE | ||||||||
| SHARES | (NOTE 2) | |||||||
COMMON STOCKS (continued) | ||||||||
Energy (continued) | ||||||||
Oil, Gas & Consumable Fuels - 1.1% | ||||||||
Range Resources Corp. | 4,680 | $ | 158,137 | |||||
|
| |||||||
Total Energy | 491,397 | |||||||
|
| |||||||
Financials - 2.9% | ||||||||
Capital Markets - 1.0% | ||||||||
BlackRock, Inc. | 430 | 146,733 | ||||||
|
| |||||||
Consumer Finance - 1.9% | ||||||||
SLM Corp.* | 20,440 | 144,102 | ||||||
Synchrony Financial | 4,960 | 141,806 | ||||||
|
| |||||||
| 285,908 | ||||||||
|
| |||||||
Total Financials | 432,641 | |||||||
|
| |||||||
Health Care - 22.9% | ||||||||
Biotechnology - 0.6% | ||||||||
Vertex Pharmaceuticals, Inc.* | 1,200 | 91,032 | ||||||
|
| |||||||
Health Care Equipment & Supplies - 8.5% | ||||||||
The Cooper Companies, Inc. | 2,030 | 357,361 | ||||||
Intuitive Surgical, Inc.* | 790 | 530,943 | ||||||
Medtronic plc | 4,490 | 368,270 | ||||||
|
| |||||||
| 1,256,574 | ||||||||
|
| |||||||
Health Care Providers & Services - 3.2% | ||||||||
Express Scripts Holding Co.* | 4,530 | 305,322 | ||||||
Fresenius Medical Care AG & Co. KGaA (Germany)1 | 2,050 | 166,982 | ||||||
|
| |||||||
| 472,304 | ||||||||
|
| |||||||
Health Care Technology - 3.0% | ||||||||
Cerner Corp.* | 7,570 | 443,451 | ||||||
|
| |||||||
Life Sciences Tools & Services - 2.5% | ||||||||
QIAGEN N.V.* | 7,730 | 188,457 | ||||||
Thermo Fisher Scientific, Inc. | 1,230 | 180,847 | ||||||
|
| |||||||
| 369,304 | ||||||||
|
| |||||||
Pharmaceuticals - 5.1% | ||||||||
Bristol-Myers Squibb Co. | 1,760 | 89,602 | ||||||
Johnson & Johnson | 3,320 | 385,087 | ||||||
Novartis AG - ADR (Switzerland) | 2,320 | 164,766 | ||||||
Perrigo Co. plc | 1,340 | 111,475 | ||||||
|
| |||||||
| 750,930 | ||||||||
|
| |||||||
Total Health Care | 3,383,595 | |||||||
|
| |||||||
Industrials - 3.1% | ||||||||
Aerospace & Defense - 1.1% | ||||||||
Safran S.A. (France)1 | 2,320 | 159,643 | ||||||
|
| |||||||
The accompanying notes are an integral part of the financial statements.
7
Tax Managed Series
Investment Portfolio - October 31, 2016
| VALUE | ||||||||
| SHARES | (NOTE 2) | |||||||
COMMON STOCKS (continued) | ||||||||
Industrials (continued) | ||||||||
Building Products - 0.9% | ||||||||
Masco Corp. | 4,250 | $ | 131,240 | |||||
|
| |||||||
Professional Services - 1.1% | ||||||||
Nielsen Holdings plc | 3,630 | 163,423 | ||||||
|
| |||||||
Total Industrials | 454,306 | |||||||
|
| |||||||
Information Technology - 29.0% | ||||||||
Electronic Equipment, Instruments & Components - 1.5% | ||||||||
FLIR Systems, Inc. | 6,710 | 220,893 | ||||||
|
| |||||||
Internet Software & Services - 7.6% | ||||||||
Alphabet, Inc. - Class A* | 260 | 210,574 | ||||||
Alphabet, Inc. - Class C* | 290 | 227,517 | ||||||
Facebook, Inc. - Class A* | 3,350 | 438,816 | ||||||
Tencent Holdings Ltd. - Class H (China)1 | 9,200 | 243,822 | ||||||
|
| |||||||
| 1,120,729 | ||||||||
|
| |||||||
IT Services - 7.9% | ||||||||
Amdocs Ltd. - ADR | 3,150 | 184,117 | ||||||
MasterCard, Inc. - Class A | 4,150 | 444,133 | ||||||
PayPal Holdings, Inc.* | 8,280 | 344,945 | ||||||
Visa, Inc. - Class A | 2,390 | 197,199 | ||||||
|
| |||||||
| 1,170,394 | ||||||||
|
| |||||||
Semiconductors & Semiconductor Equipment - 3.7% | ||||||||
QUALCOMM, Inc. | 4,040 | 277,629 | ||||||
Skyworks Solutions, Inc. | 3,440 | 264,674 | ||||||
|
| |||||||
| 542,303 | ||||||||
|
| |||||||
Software - 5.5% | ||||||||
Aspen Technology, Inc.* | 2,160 | 106,358 | ||||||
Electronic Arts, Inc.* | 2,280 | 179,026 | ||||||
Microsoft Corp. | 3,340 | 200,133 | ||||||
ServiceNow, Inc.* | 3,700 | 325,267 | ||||||
|
| |||||||
| 810,784 | ||||||||
|
| |||||||
Technology Hardware, Storage & Peripherals - 2.8% | ||||||||
Apple, Inc. | 3,650 | 414,421 | ||||||
|
| |||||||
Total Information Technology | 4,279,524 | |||||||
|
| |||||||
Materials - 5.8% | ||||||||
Chemicals - 4.0% | ||||||||
Ashland Global Holdings, Inc. | 1,910 | 213,404 | ||||||
Monsanto Co. | 3,770 | 379,903 | ||||||
|
| |||||||
| 593,307 | ||||||||
|
| |||||||
The accompanying notes are an integral part of the financial statements.
8
Tax Managed Series
Investment Portfolio - October 31, 2016
| VALUE | ||||||||
| SHARES | (NOTE 2) | |||||||
COMMON STOCKS (continued) | ||||||||
Materials (continued) | ||||||||
Metals & Mining - 1.8% | ||||||||
Arconic, Inc. | 9,236 | $ | 265,258 | |||||
|
| |||||||
Total Materials | 858,565 | |||||||
|
| |||||||
Real Estate - 2.2% | ||||||||
Equity Real Estate Investment Trusts (REITS) - 2.0% | ||||||||
Weyerhaeuser Co. | 9,880 | 295,708 | ||||||
|
| |||||||
Real Estate Management & Development - 0.2% | ||||||||
Realogy Holdings Corp. | 1,090 | 24,950 | ||||||
|
| |||||||
Total Real Estate | 320,658 | |||||||
|
| |||||||
Telecommunication Services - 2.0% | ||||||||
Diversified Telecommunication Services - 2.0% | ||||||||
Level 3 Communications, Inc.* | 2,610 | 146,551 | ||||||
Zayo Group Holdings, Inc.* | 4,440 | 142,879 | ||||||
|
| |||||||
Total Telecommunication Services | 289,430 | |||||||
|
| |||||||
TOTAL COMMON STOCKS | ||||||||
(Identified Cost $12,061,365) | 14,509,594 | |||||||
|
| |||||||
SHORT-TERM INVESTMENT - 1.5% | ||||||||
Dreyfus Government Cash Management2, 0.28% | ||||||||
(Identified Cost $218,723) | 218,723 | 218,723 | ||||||
|
| |||||||
TOTAL INVESTMENTS - 99.7% | ||||||||
(Identified Cost $12,280,088) | 14,728,317 | |||||||
OTHER ASSETS, LESS LIABILITIES - 0.3% | 50,341 | |||||||
|
| |||||||
NET ASSETS - 100% | $ | 14,778,658 | ||||||
|
| |||||||
ADR - American Depositary Receipt
*Non-income producing security.
1A factor from a third party vendor was applied to determine the security’s fair value following the close of local trading.
2Rate shown is the current yield as of October 31, 2016.
The Global Industry Classification Standard (GICS) was developed by and is the exclusive property and a service mark of MSCI Inc. (MSCI) and Standard & Poor’s, a division of The McGraw-Hill Companies, Inc. (S&P), and is licensed for use by Manning & Napier when referencing GICS sectors. Neither MSCI, S&P, nor any third party involved in making or compiling the GICS or any GICS classifications makes any express or implied warranties or representations with respect to such standard or classification, nor shall any such party have any liability therefrom.
The accompanying notes are an integral part of the financial statements.
9
Tax Managed Series
Statement of Assets and Liabilities
October 31, 2016
ASSETS: | ||||
Investments, at value (identified cost $12,280,088) (Note 2) | $ | 14,728,317 | ||
Receivable for securities sold | 254,763 | |||
Foreign tax reclaims receivable | 11,023 | |||
Dividends receivable | 9,400 | |||
Prepaid expenses | 3,925 | |||
|
| |||
TOTAL ASSETS | 15,007,428 | |||
|
| |||
LIABILITIES: | ||||
Accrued management fees (Note 3) | 8,065 | |||
Accrued fund accounting and administration fees (Note 3) | 6,277 | |||
Accrued transfer agent fees (Note 3) | 967 | |||
Accrued Chief Compliance Officer service fees (Note 3) | 353 | |||
Accrued Directors’ fees (Note 3) | 8 | |||
Payable for securities purchased | 182,186 | |||
Audit fees payable | 24,527 | |||
Other payables and accrued expenses | 6,387 | |||
|
| |||
TOTAL LIABILITIES | 228,770 | |||
|
| |||
TOTAL NET ASSETS | $ | 14,778,658 | ||
|
| |||
NET ASSETS CONSIST OF: | ||||
Capital stock | $ | 6,285 | ||
Additional paid-in-capital | 10,894,891 | |||
Undistributed net investment loss | (23,937 | ) | ||
Accumulated net realized gain (loss) on investments, foreign currency and translation of other assets and liabilities | 1,454,037 | |||
Net unrealized appreciation (depreciation) on investments, foreign currency and translation of other assets and liabilities | 2,447,382 | |||
|
| |||
TOTAL NET ASSETS | $ | 14,778,658 | ||
|
| |||
NET ASSET VALUE, OFFERING PRICE AND REDEMPTION PRICE PER SHARE - Class A | $ | 23.51 | ||
|
| |||
The accompanying notes are an integral part of the financial statements.
10
Tax Managed Series
Statement of Operations
For the Year Ended October 31, 2016
INVESTMENT INCOME: | ||||
Dividends (net of foreign taxes withheld, $4,038) | $ | 167,032 | ||
|
| |||
EXPENSES: | ||||
Management fees (Note 3) | 165,827 | |||
Fund accounting and administration fees (Note 3) | 43,827 | |||
Transfer agent fees (Note 3) | 6,272 | |||
Chief Compliance Officer service fees (Note 3) | 3,727 | |||
Directors’ fees (Note 3) | 1,533 | |||
Audit fees | 31,288 | |||
Custodian fees | 1,723 | |||
Miscellaneous | 27,747 | |||
|
| |||
Total Expenses | 281,944 | |||
Less reduction of expenses (Note 3) | (82,951 | ) | ||
|
| |||
Net Expenses | 198,993 | |||
|
| |||
NET INVESTMENT LOSS | (31,961 | ) | ||
|
| |||
REALIZED AND UNREALIZED GAIN (LOSS) ON INVESTMENTS AND FOREIGN CURRENCY: | ||||
Net realized gain (loss) on- | ||||
Investments | 1,755,806 | |||
Foreign currency and translation of other assets and liabilities | (1,271 | ) | ||
|
| |||
| 1,754,535 | ||||
|
| |||
Net change in unrealized appreciation (depreciation) on- | ||||
Investments | (1,114,349 | ) | ||
Foreign currency and translation of other assets and liabilities | 1,034 | |||
|
| |||
| (1,113,315 | ) | |||
|
| |||
NET REALIZED AND UNREALIZED GAIN (LOSS) ON INVESTMENTS AND FOREIGN CURRENCY | 641,220 | |||
|
| |||
NET INCREASE IN NET ASSETS RESULTING FROM OPERATIONS | $ | 609,259 | ||
|
| |||
The accompanying notes are an integral part of the financial statements.
11
Tax Managed Series
Statements of Changes in Net Assets
| FOR THE YEAR ENDED 10/31/16 | FOR THE YEAR ENDED 10/31/15 | |||||||
INCREASE (DECREASE) IN NET ASSETS: | ||||||||
OPERATIONS: | ||||||||
Net investment income (loss) | $ | (31,961 | ) | $ | 35,073 | |||
Net realized gain on investments and foreign currency | 1,754,535 | 2,702,559 | ||||||
Net change in unrealized appreciation (depreciation) on investments and foreign currency | (1,113,315 | ) | (3,184,140 | ) | ||||
|
|
|
| |||||
Net increase (decrease) from operations | 609,259 | (446,508 | ) | |||||
|
|
|
| |||||
DISTRIBUTIONS TO SHAREHOLDERS (Note 8): | ||||||||
From net investment income | (22,080 | ) | (35,591 | ) | ||||
From net realized gain on investments | (2,657,130 | ) | (5,685,380 | ) | ||||
|
|
|
| |||||
Total distributions to shareholders | (2,679,210 | ) | (5,720,971 | ) | ||||
|
|
|
| |||||
CAPITAL STOCK ISSUED AND REPURCHASED: | ||||||||
Net decrease from capital share transactions (Note 5) | (5,382,570 | ) | (5,783,374 | ) | ||||
|
|
|
| |||||
Net decrease in net assets | (7,452,521 | ) | (11,950,853 | ) | ||||
NET ASSETS: | ||||||||
Beginning of year | 22,231,179 | 34,182,032 | ||||||
|
|
|
| |||||
End of year (including undistributed net investment loss of $23,937 and undistributed net investment income of $21,987, respectively) | $ | 14,778,658 | $ | 22,231,179 | ||||
|
|
|
| |||||
The accompanying notes are an integral part of the financial statements.
12
Tax Managed Series
Financial Highlights
| FOR THE YEARS ENDED | ||||||||||||||||||||
| 10/31/16 | 10/31/15 | 10/31/14 | 10/31/13 | 10/31/12 | ||||||||||||||||
Per share data (for a share outstanding throughout each year): | ||||||||||||||||||||
Net asset value - Beginning of year | $ | 26.41 | $ | 33.05 | $ | 33.95 | $ | 27.69 | $ | 24.96 | ||||||||||
|
|
|
|
|
|
|
|
|
| |||||||||||
Income (loss) from investment operations: | ||||||||||||||||||||
Net investment income (loss)1 | (0.04 | ) | 0.04 | 0.04 | 0.04 | 0.03 | ||||||||||||||
Net realized and unrealized gain (loss) on investments | 0.92 | (0.70 | ) | 3.73 | 7.52 | 2.77 | ||||||||||||||
|
|
|
|
|
|
|
|
|
| |||||||||||
Total from investment operations | 0.88 | (0.66 | ) | 3.77 | 7.56 | 2.80 | ||||||||||||||
|
|
|
|
|
|
|
|
|
| |||||||||||
Less distributions to shareholders: | ||||||||||||||||||||
From net investment income | (0.03 | ) | (0.04 | ) | (0.01 | ) | (0.06 | ) | (0.07 | ) | ||||||||||
From net realized gain on investments | (3.75 | ) | (5.94 | ) | (4.66 | ) | (1.24 | ) | — | |||||||||||
|
|
|
|
|
|
|
|
|
| |||||||||||
Total distributions to shareholders | (3.78 | ) | (5.98 | ) | (4.67 | ) | (1.30 | ) | (0.07 | ) | ||||||||||
|
|
|
|
|
|
|
|
|
| |||||||||||
Net asset value - End of year | $ | 23.51 | $ | 26.41 | $ | 33.05 | $ | 33.95 | $ | 27.69 | ||||||||||
|
|
|
|
|
|
|
|
|
| |||||||||||
Net assets - End of year (000’s omitted) | $ | 14,779 | $ | 22,231 | $ | 34,182 | $ | 33,669 | $ | 29,776 | ||||||||||
|
|
|
|
|
|
|
|
|
| |||||||||||
Total return2 | 4.27 | % | (1.67 | %) | 12.82 | % | 28.41 | % | 11.28 | % | ||||||||||
Ratios (to average net assets)/Supplemental Data: | ||||||||||||||||||||
Expenses* | 1.20 | % | 1.20 | % | 1.20 | % | 1.20 | % | 1.20 | % | ||||||||||
Net investment income (loss) | (0.19 | %) | 0.13 | % | 0.11 | % | 0.13 | % | 0.12 | % | ||||||||||
Portfolio turnover | 43 | % | 60 | % | 47 | % | 56 | % | 47 | % | ||||||||||
| *The investment advisor did not impose all or a portion of its management and/or other fees, and in some periods may have paid a portion of the Series’ expenses. If these expenses had been incurred by the Series, the expense ratio (to average net assets) would have increased by the following amounts: | ||||||||||||||||||||
| 0.50 | % | 0.23 | % | 0.13 | % | 0.15 | % | 0.10 | % | |||||||||||
1Calculated based on average shares outstanding during the years.
2Represents aggregate total return for the years indicated, and assumes reinvestment of all distributions. Total return would have been lower had certain expenses not been waived or reimbursed during certain years.
The accompanying notes are an integral part of the financial statements.
13
Tax Managed Series
Notes to Financial Statements
| 1. | Organization |
Tax Managed Series (the “Series”) is a no-load diversified series of Manning & Napier Fund, Inc. (the “Fund”). The Fund is organized in Maryland and is registered under the Investment Company Act of 1940, as amended, as an open-end management investment company.
The Series’ investment objective is to maximize long-term growth while attempting to minimize the impact of taxes on the total return earned by shareholders.
The Fund’s Advisor is Manning & Napier Advisors, LLC (the “Advisor”). Shares of the Series are offered to investors, clients and employees of the Advisor and its affiliates. The total authorized capital stock of the Fund consists of 15 billion shares of common stock each having a par value of $0.01. As of October 31, 2016, 10.5 billion shares have been designated in total among 40 series, of which 87.5 million have been designated as Tax Managed Series Class A common stock.
| 2. | Significant Accounting Policies |
The following is a summary of significant accounting policies followed by the Series. The Series is an investment company and, accordingly, follows the investment company accounting and reporting guidance of the Financial Accounting Standards Board Accounting Standards Codification Topic 946 - Investment Companies, which is part of accounting principles generally accepted in the United States of America (“GAAP”).
Security Valuation
Portfolio securities, including domestic equities, foreign equities, warrants and options, listed on an exchange other than the NASDAQ Stock Market are valued at the latest quoted sales price of the exchange on which the security is primarily traded. Securities not traded on valuation date or securities not listed on an exchange are valued at the latest quoted bid price provided by the Fund’s pricing service. Securities listed on the NASDAQ Stock Market are valued in accordance with the NASDAQ Official Closing Price.
Short-term investments that mature in sixty days or less may be valued at amortized cost, which approximates fair value. Investments in open-end investment companies are valued at their net asset value per share on valuation date.
Volume and level of activity in established markets for an asset or liability are evaluated to determine whether recent transactions and quoted prices are determinative of fair value. Where there have been significant decreases in volume and level of activity, further analysis and adjustment may be necessary to estimate fair value. The Series measures fair value in these instances by the use of inputs and valuation techniques which may be based upon current market prices of securities that are comparable in coupon, rating, maturity and industry and/or expectation of future cash flows. As a result of trading in relatively thin markets and/or markets that experience significant volatility, the prices used by the Series to value these securities may differ from the value that would be realized if these securities were sold, and the differences could be material.
Securities for which representative valuations or prices are not available from the Series’ pricing service may be valued at fair value as determined in good faith by the Advisor under procedures approved by and under the general supervision and responsibility of the Fund’s Board of Directors (the “Board”). Due to the inherent uncertainty of valuations of such securities, the fair value may differ significantly from the values that would have been used had a ready market for such securities existed. If trading or events occurring after the close of the principal market in which securities are traded are expected to materially affect the value of those securities, then they may be valued at their fair value, taking this trading or these events into account. In accordance with the procedures approved by the Board, the values of certain securities trading outside the U.S. were adjusted following the close of local trading using a factor from a third party vendor. The third party vendor uses statistical analyses and quantitative models, which consider among other things subsequent movement and changes in the prices of indices, securities and exchange rates in other markets, to determine the factors which are used to adjust local market prices. The value of securities used for net asset value calculation under these procedures may differ from published prices for the same securities. It is the Fund’s policy to classify each foreign equity security where a factor from a third party vendor is provided as a Level 2 security.
14
Tax Managed Series
Notes to Financial Statements (continued)
| 2. | Significant Accounting Policies (continued) |
Security Valuation (continued)
Various inputs are used in determining the value of the Series’ assets or liabilities carried at fair value. These inputs are summarized in three broad levels. Level 1 includes quoted prices in active markets for identical assets and liabilities. Level 2 includes other significant observable inputs (including quoted prices for similar securities, interest rates, prepayment speeds, credit risk, etc.). Level 3 includes significant unobservable inputs (including the Series’ own assumptions in determining the fair value of investments). A financial instrument’s level within the fair value hierarchy is based on the lowest level of any input both individually and in aggregate that is significant to the fair value measurement. The inputs or methodology used for valuing securities are not necessarily an indication of the risk associated with investing in those securities.
The following is a summary of the valuation levels used for major security types as of October 31, 2016 in valuing the Series’ assets or liabilities carried at fair value:
| DESCRIPTION | TOTAL | LEVEL 1 | LEVEL 2 | LEVEL 3 | ||||||||||||
Assets: | ||||||||||||||||
Equity securities: | ||||||||||||||||
Consumer Discretionary | $ | 2,737,684 | $ | 2,470,781 | $ | 266,903 | $ | — | ||||||||
Consumer Staples | 1,261,794 | 458,730 | 803,064 | — | ||||||||||||
Energy | 491,397 | 491,397 | — | — | ||||||||||||
Financials | 432,641 | 432,641 | — | — | ||||||||||||
Health Care | 3,383,595 | 3,216,613 | 166,982 | — | ||||||||||||
Industrials | 454,306 | 294,663 | 159,643 | — | ||||||||||||
Information Technology | 4,279,524 | 4,035,702 | 243,822 | — | ||||||||||||
Materials | 858,565 | 858,565 | — | — | ||||||||||||
Real Estate | 320,658 | 320,658 | — | — | ||||||||||||
Telecommunication Services | 289,430 | 289,430 | — | — | ||||||||||||
Mutual Fund | 218,723 | 218,723 | — | — | ||||||||||||
|
|
|
|
|
|
|
| |||||||||
Total assets | $ | 14,728,317 | $ | 13,087,903 | $ | 1,640,414 | $ | — | ||||||||
|
|
|
|
|
|
|
| |||||||||
Please see the Investment Portfolio for foreign securities where a factor from a third party vendor was applied to determine the security’s fair value following the close of local trading. Such securities are included in Level 2 in the table above.
There were no Level 3 securities held by the Series as of October 31, 2015 or October 31, 2016.
The Fund’s policy is to recognize transfers in and transfers out of the valuation levels as of the beginning of the reporting period. There were no transfers between Level 1 and Level 2 during the year ended October 31, 2016.
New Accounting Guidance
In October 2016, the Securities and Exchange Commission (SEC) issued a new rule, Investment Company Reporting Modernization, which, among other provisions, amends Regulation S-X to require standardized, enhanced disclosures, particularly related to derivatives, in investment company financial statements. Compliance with the guidance is required for financial statements filed with the SEC on or after August 1, 2017; adoption will have no effect on the Fund’s net assets or results of operations.
Security Transactions, Investment Income and Expenses
Security transactions are accounted for on trade date. Dividend income is recorded on the ex-dividend date, except that if the ex-dividend date has passed, certain dividends from foreign securities are recorded as soon as the Series is informed of the ex-dividend date. Non-cash dividends, if any, are recorded at the fair value of the securities received. Interest income, including amortization of premium and accretion of discounts using the effective interest method, is earned from settlement date and accrued daily.
15
Tax Managed Series
Notes to Financial Statements (continued)
| 2. | Significant Accounting Policies (continued) |
Security Transactions, Investment Income and Expenses (continued)
Expenses are recorded on an accrual basis. Most expenses of the Fund can be attributed to a specific series. Expenses which cannot be directly attributed are apportioned among the series in the Fund in such a manner as deemed equitable by the Fund’s Board, taking into consideration, among other things, the nature and type of expense.
The Series uses the identified cost method for determining realized gain or loss on investments for both financial statement and federal income tax reporting purposes.
Foreign Currency Translation
The books and records of the Series are maintained in U.S. dollars. Foreign currencies, investments and other assets and liabilities are translated into U.S. dollars at the current exchange rates. Purchases and sales of investment securities and income and expenses are translated on the respective dates of such transactions. The Series does not isolate realized and unrealized gains and losses attributable to changes in the exchange rates from gains and losses that arise from changes in the fair value of investments. Such fluctuations are included with net realized and unrealized gain or loss on investments. Net realized foreign currency gains and losses represent foreign currency gains and losses between trade date and settlement date on securities transactions, gains and losses on disposition of foreign currencies and the difference between the amount of income and foreign withholding taxes recorded on the books of the Series and the amounts actually received or paid.
Federal Taxes
The Series’ policy is to comply with the provisions of the Internal Revenue Code applicable to regulated investment companies. The Series is not subject to federal income tax or excise tax to the extent that the Series distributes to shareholders each year its taxable income, including any net realized gains on investments, in accordance with requirements of the Internal Revenue Code. Accordingly, no provision for federal income tax or excise tax has been made in the financial statements.
Management evaluates its tax positions to determine if the tax positions taken meet the minimum recognition threshold in connection with accounting for uncertainties in income tax positions taken or expected to be taken for the purposes of measuring and recognizing tax liabilities in the financial statements. Recognition of tax benefits of an uncertain tax position is required only when the position is “more likely than not” to be sustained assuming examination by taxing authorities. At October 31, 2016, the Series has recorded no liability for net unrecognized tax benefits relating to uncertain income tax positions taken or expected to be taken in future tax returns.
The Series files income tax returns in the U.S. federal jurisdiction, various states and foreign jurisdictions, as required. No income tax returns are currently under investigation. The statute of limitations on the Series’ tax returns remains open for the years ended October 31, 2013 through October 31, 2016. The Series is not aware of any tax positions for which it is reasonably possible that the total amounts of unrecognized tax benefits will significantly change in the next twelve months.
Foreign Taxes
Based on the Series’ understanding of the tax rules and rates related to income, gains and currency purchase/repatriation transactions for foreign jurisdictions in which it invests, the Series will provide for foreign taxes, and where appropriate, deferred foreign tax.
Distributions of Income and Gains
Distributions to shareholders of net investment income and net realized gains are made annually. An additional distribution may be necessary to avoid taxation of the Series. Distributions are recorded on the ex-dividend date.
Indemnifications
The Fund’s organizational documents provide former and current directors and officers with a limited indemnification against liabilities arising in connection with the performance of their duties to the Fund. In the normal course of business, the Fund may also enter into contracts that provide general indemnifications. The Fund’s maximum exposure under these arrangements is unknown as this would be dependent on future claims that may be made against the Fund. The risk of material loss from such claims is considered remote.
16
Tax Managed Series
Notes to Financial Statements (continued)
| 2. | Significant Accounting Policies (continued) |
Other
The preparation of financial statements in conformity with GAAP requires management to make estimates and assumptions that affect the reported amounts of assets and liabilities and the disclosure of contingent assets and liabilities at the date of the financial statements and the reported amounts of income and expenses during the reporting period. Actual results could differ from those estimates.
| 3. | Transactions with Affiliates |
The Fund has an Investment Advisory Agreement (the “Agreement”) with the Advisor, for which the Series pays a fee, computed daily and payable monthly, at an annual rate of 1.00% of the Series’ average daily net assets.
Under the Agreement, personnel of the Advisor provide the Series with advice and assistance in the choice of investments and the execution of securities transactions, and otherwise maintain the Series’ organization. The Advisor also provides the Fund with necessary office space and fund administration and support services. The salaries of all officers of the Fund (except a percentage of the Fund’s Chief Compliance Officer’s salary, which is paid by the Fund), and of all Directors who are “affiliated persons” of the Fund, or of the Advisor, and all personnel of the Fund, or of the Advisor, performing services relating to research, statistical and investment activities, are paid by the Advisor. Each “non-affiliated” Director receives an annual stipend, which is allocated among all the active series of the Fund. In addition, these Directors also receive a fee per Board meeting attended plus a fee for each committee meeting attended and are reimbursed for travel and other out-of-pocket expenses incurred by them in connection with attending such meetings. The Fund also has an Audit Committee Chair, who receives an additional annual stipend for this role.
The Advisor has contractually agreed, until at least February 28, 2017, to waive its management fee and, if necessary, pay other operating expenses of the Series in order to maintain total direct annual fund operating expenses for the Series at no more than 1.20% of average daily net assets each year. Accordingly, the Advisor waived fees of $82,951 for the year ended October 31, 2016, which is included as a reduction of expenses on the Statement of Operations. The Advisor is not eligible to recoup any expenses that have been waived or reimbursed in prior years.
Manning & Napier Investor Services, Inc., a registered broker-dealer affiliate of the Advisor, acts as distributor for the Fund’s shares. The services of Manning & Napier Investor Services, Inc. are provided at no additional cost to the Series.
Pursuant to a master services agreement dated November 1, 2014, the Fund pays the Advisor an annual fee related to fund accounting and administration of 0.0085% on the first $25 billion of average daily net assets (excluding Target Series and Strategic Income Series); 0.0075% on the next $15 billion of average daily net assets (excluding Target Series and Strategic Income Series); and 0.0065% of the average daily net assets in excess of $40 billion (excluding Target Series and Strategic Income Series); plus a base fee of $30,400 per series. Transfer agent fees are charged to the Fund on a per account basis. Additionally, certain transaction and out-of-pocket expenses, including charges for reporting relating to the Fund’s compliance program, are charged. The Advisor has agreements with BNY Mellon Investment Servicing (U.S.) Inc. (“BNY”) under which BNY serves as sub-accountant services agent and sub-transfer agent.
Expenses not directly attributable to a series are allocated based on each series’ relative net assets or number of accounts, depending on the expense.
| 4. | Purchases and Sales of Securities |
For the year ended October 31, 2016, purchases and sales of securities, other than U.S. Government securities and short-term securities, were $7,087,446 and $14,834,532, respectively. There were no purchases or sales of U.S. Government securities.
17
Tax Managed Series
Notes to Financial Statements (continued)
| 5. | Capital Stock Transactions |
Transactions in shares of Tax Managed Series were:
| FOR THE YEAR ENDED 10/31/16 | FOR THE YEAR ENDED 10/31/15 | |||||||||||||||
| SHARES | AMOUNT | SHARES | AMOUNT | |||||||||||||
Sold | 20,056 | $ | 475,378 | 87,223 | $ | 2,406,990 | ||||||||||
Reinvested | 118,732 | 2,622,782 | 212,488 | 5,512,395 | ||||||||||||
Repurchased | (351,982 | ) | (8,480,730 | ) | (492,364 | ) | (13,702,759 | ) | ||||||||
|
|
|
|
|
|
|
| |||||||||
Total | (213,194 | ) | $ | (5,382,570 | ) | (192,653 | ) | $ | (5,783,374 | ) | ||||||
|
|
|
|
|
|
|
| |||||||||
| 6. | Financial Instruments |
The Series may trade in instruments including written and purchased options, forward foreign currency exchange contracts and futures contracts and other derivatives in the normal course of investing activities to assist in managing exposure to various market risks. The Series may be subject to various elements of risk, which may involve, to a varying degree, elements of risk in excess of the amounts recognized for financial statement purposes. These risks include: the risk that changes in the value of a derivative may not correlate perfectly with the underlying asset, rate or index; counterparty credit risk related to over the counter derivative counterparties’ failure to perform under contract terms; liquidity risk related to the lack of a liquid market for these contracts allowing the fund to close out its position(s); and documentation risk relating to disagreement over contract terms. No such investments were held by the Series as of October 31, 2016.
| 7. | Foreign Securities |
Investing in securities of foreign companies and foreign governments involves special risks and considerations not typically associated with investing in securities of domestic companies and the U.S. Government. These risks include revaluation of currencies and future adverse political and economic developments. Moreover, securities of foreign companies and foreign governments and their markets may be less liquid and their prices more volatile than those of comparable domestic companies and the U.S. Government.
| 8. | Federal Income Tax Information |
The amount and characterization of certain income and capital gains to be distributed are determined in accordance with federal income tax regulations, which may differ from GAAP. These differences are primarily due to differing book and tax treatments in the timing of the recognition of net investment income or gains and losses, investments in real estate investment trusts, including losses deferred due to wash sales and foreign currency gains and losses. The Series may periodically make reclassifications among its capital accounts to reflect income and gains available for distribution (or available capital loss carryovers) under income tax regulations, without impacting the Series’ net asset value. For the year ended October 31, 2016, amounts were reclassified within the capital accounts to increase Additional Paid in Capital by $292,365, decrease Undistributed Net Investment Loss by $8,117, and decrease Accumulated Net Realized Gain on Investments by $300,482. Any such reclassifications are not reflected in the financial highlights.
The tax character of distributions paid were as follows:
| FOR THE YEAR ENDED 10/31/16 | FOR THE YEAR ENDED 10/31/15 | |||||||
Ordinary income | $ | 2,847 | $ | 35,591 | ||||
Long-term capital gains | 2,676,363 | 5,685,380 | ||||||
18
Tax Managed Series
Notes to Financial Statements (continued)
| 8. | Federal Income Tax Information (continued) |
At October 31, 2016, the tax basis of components of distributable earnings and the net unrealized appreciation based on identified cost of investments for federal income tax purposes were as follows:
Cost for federal income tax purposes | $ | 12,279,068 | ||
Unrealized appreciation | 2,710,476 | |||
Unrealized depreciation | (261,227 | ) | ||
|
| |||
Net unrealized appreciation | $2,449,249 | |||
|
| |||
Undistributed long-term capital gains | $ | 1,453,017 | ||
Qualified late-year losses1 | $ | 23,937 |
1The Series has elected to defer certain qualified late-year losses and recognize such losses in the year ending October 31, 2017.
| 9. | Subsequent Events |
The Board approved the liquidation of the Series, which is expected to occur on or about February 1, 2017. Effective November 18, 2016, the Series was closed to any new investors. Effective December 12, 2016, the Series stopped selling shares to existing shareholders and no longer accepted automatic investments from existing shareholders. Effective, November 22, 2016, the Advisor voluntarily began waiving its management fees.
19
Tax Managed Series
Report of Independent Registered Public Accounting Firm
To the Board of Directors of Manning & Napier Fund, Inc. and Shareholders of Tax Managed Series:
In our opinion, the accompanying statement of assets and liabilities, including the investment portfolio, and the related statements of operations and of changes in net assets and the financial highlights present fairly, in all material respects, the financial position of the Tax Managed Series (a series of Manning & Napier Fund, Inc., hereafter referred to as the “Series”) as of October 31, 2016, the results of its operations for the year then ended, the changes in its net assets for each of the two years in the period then ended and the financial highlights for each of the five years in the period then ended, in conformity with accounting principles generally accepted in the United States of America. These financial statements and financial highlights (hereafter referred to as “financial statements”) are the responsibility of the Series’ management. Our responsibility is to express an opinion on these financial statements based on our audits. We conducted our audits of these financial statements in accordance with the standards of the Public Company Accounting Oversight Board (United States). Those standards require that we plan and perform the audit to obtain reasonable assurance about whether the financial statements are free of material misstatement. An audit includes examining, on a test basis, evidence supporting the amounts and disclosures in the financial statements, assessing the accounting principles used and significant estimates made by management, and evaluating the overall financial statement presentation. We believe that our audits, which included confirmation of securities as of October 31, 2016 by correspondence with the custodian and brokers, provide a reasonable basis for our opinion.
As discussed in Note 9 to the financial statements, the Board of Directors has approved a plan of liquidation to close the Series.

New York, New York
December 16, 2016
20
Tax Managed Series
Supplemental Tax Information
(unaudited)
All reportings are based on financial information available as of the date of this annual report and, accordingly, are subject to change.
For federal income tax purposes, the Series reports for the current fiscal year $178,338 or, if different, the maximum amount allowable under the tax law, as qualified dividend income.
For corporate shareholders, the percentage of investment income (dividend income plus short-term gains, if any) that qualifies for the dividends received deduction for the current fiscal year is 100%.
The Series designates $1,837,848 as Long-Term Capital Gain dividends pursuant to Section 852(b) of the Code for the fiscal year ended October 31, 2016.
21
Tax Managed Series
Directors’ and Officers’ Information
(unaudited)
The Statement of Additional Information provides additional information about the Fund’s directors and officers and can be obtained without charge by calling 1-800-466-3863, at www.manningnapieradvisors.com, or on the EDGAR Database on the SEC Internet web site (http:// www.sec.gov). The following chart shows certain information about the Fund’s officers and directors, including their principal occupations during the last five years. Unless specific dates are provided, the individuals have held the listed positions for longer than five years.
| Interested Director/Officer | ||
| Name: | Michele T. Mosca* | |
| Address: | 290 Woodcliff Drive | |
| Fairport, NY 14450 | ||
| Age: | 44 | |
| Current Position(s) Held with Fund: | Principal Executive Officer, President, Chairman & Director | |
| Term of Office1 & Length of Time Served: | Indefinite - Chairman and Director since August 2016 | |
| Principal Occupation(s) During Past 5 Years: | Managing Director, Funds Group (2009-present)- Manning & Napier Advisors, LLC; President, Director (2015-present) - Manning & Napier Investor Services, Inc.; Chief Executive Officer, President (2016-present) - Rainier Investment Management Mutual Funds Holds or has held one or more of the following titles for various subsidiaries and affiliates: President, Director | |
| Number of Portfolios Overseen within Fund Complex: | 40 | |
| Other Directorships Held Outside Fund Complex: | Trustee - Rainier Investment Management Mutual Funds (six portfolios) (2016- present) | |
| ||
| Independent Directors | ||
| Name: | Stephen B. Ashley | |
| Address: | 290 Woodcliff Drive | |
| Fairport, NY 14450 | ||
| Age: | 76 | |
| Current Position(s) Held with Fund: | Director, Audit Committee Member, Governance & Nominating Committee Member | |
| Term of Office & Length of Time Served: | Indefinite - Since 1996 | |
| Principal Occupation(s) During Past 5 Years: | Chairman, Director & Chief Executive Officer (1997 to present)- The Ashley Group (property management and investment). Director (1995-2008) and Chairman (non-executive)(2004-2008) - Fannie Mae (mortgage) | |
| Number of Portfolios Overseen within Fund Complex: | 40 | |
| Other Directorships Held Outside Fund Complex: | Fannie Mae (mortgage)(1995-2008) | |
| The Ashley Group (property management and investment)(1995-2008) | ||
| Genesee Corporation (holding company)(1987-2007) | ||
| ||
| Name: | Paul A. Brooke | |
| Address: | 290 Woodcliff Drive | |
| Fairport, NY 14450 | ||
| Age: | 70 | |
| Current Position(s) Held with Fund: | Director, Audit Committee Member, Governance & Nominating Committee Member | |
| Term of Office & Length of Time Served: | Indefinite - Since 2007 | |
| Principal Occupation(s) During Past 5 Years: | Chairman & CEO (2005-2009)- Ithaka Acquisition Corporation (investments); Chairman (2007-2009)- Alsius Corporation (investments); Managing Member (1991-present)- PMSV Holdings LLC(investments); Managing Member (2010-present)- Venbio (investments). | |
| Number of Portfolios Overseen within Fund Complex: | 40 | |
| Other Directorships Held Outside Fund Complex: | Incyte Corp. (biotech)(2000-present) | |
ViroPharma, Inc. (speciality pharmaceuticals)(2000-2014) HLTH Corp (WebMD)(information)(2000-2010) Cheyne Capital International (investment)(2000-present) GMP Companies (investment)(2000-2011) Cytos Biotechnology Ltd (biotechnology)(2012-present) | ||
| ||
22
Tax Managed Series
Directors’ and Officers’ Information
(unaudited)
Independent Directors (continued)
| Name: | Peter L. Faber | |
| Address: | 290 Woodcliff Drive | |
| Fairport, NY 14450 | ||
| Age: | 78 | |
| Current Position(s) Held with Fund: | Director, Governance & Nominating Committee Member | |
| Term of Office & Length of Time Served: | Indefinite - Since 1987 | |
| Principal Occupation(s) During Past 5 Years: | Senior Counsel (2006-2012), Partner (1995-2006 & 2013-present)-McDermott, Will & Emery LLP (law firm) | |
| Number of Portfolios Overseen within Fund Complex: | 40 | |
| Other Directorships Held Outside Fund Complex: | Boston Early Music Festival (non-profit) (2007-present) | |
| Amherst Early Music, Inc. (non-profit)(2009-present) | ||
| Gotham Early Music Scene, Inc. (non-profit)(2009-present) | ||
| Partnership for New York City, Inc. (non-profit) (1989-2010) | ||
| New York Collegium (non-profit) (2004-2011) | ||
| ||
| Name: | Harris H. Rusitzky | |
| Address: | 290 Woodcliff Drive | |
| Fairport, NY 14450 | ||
| Age: | 81 | |
| Current Position(s) Held with Fund: | Director, Audit Committee Member, Governance & Nominating Committee Member | |
| Term of Office & Length of Time Served: | Indefinite - Since 1985 | |
| Principal Occupation(s) During Past 5 Years: | President (1994-present) - The Greening Group (business consultants); | |
| Partner (2006-present) - The Restaurant Group (restaurants) | ||
| Number of Portfolios Overseen within Fund Complex: | 40 | |
| Other Directorships Held Outside Fund Complex: | Rochester Institute of Technology (university) (1972-present) | |
| Culinary Institute of America (non-profit college) (1985-present) | ||
| George Eastman House (museum) (1988-present) | ||
| National Restaurant Association (restaurant trade organization) | ||
| (1978-present) | ||
| ||
| Name: | Chester N. Watson | |
| Address: | 290 Woodcliff Drive | |
| Fairport, NY 14450 | ||
| Age: | 66 | |
| Current Position(s) Held with Fund: | Director, Audit Committee Chairman, Governance & Nominating Committee Member | |
| Term of Office & Length of Time Served: | Indefinite - Since 2012 | |
| Principal Occupation(s) During Past 5 Years: | General Auditor (2003-2011)- General Motors Company (auto manufacturer) | |
| Number of Portfolios Overseen within Fund Complex: | 40 | |
| Other Directorships Held Outside Fund Complex: | Rochester Institute of Technology (university) (2005-present) | |
| Officers | ||
| Name: | Jeffrey S. Coons, Ph.D., CFA® | |
| Address: | 290 Woodcliff Drive | |
| Fairport, NY 14450 | ||
| Age: | 53 | |
| Current Position(s) Held with Fund: | Vice President | |
| Term of Office1 & Length of Time Served: | Since 2004 | |
| Principal Occupation(s) During Past 5 Years: | President since 2010, Co-Director of Research (2002-2015) - Manning & Napier Advisors, LLC Holds one or more of the following titles for various subsidiaries and affiliates: President, Director, Treasurer or Senior Trust Officer. | |
| Number of Portfolios Overseen within Fund Complex: | 40 | |
| Other Directorships Held Outside Fund Complex: | N/A | |
| ||
23
Tax Managed Series
Directors’ and Officers’ Information
(unaudited)
Officers (continued)
| Name: | Elizabeth Craig | |
| Address: | 290 Woodcliff Drive | |
| Fairport, NY 14450 | ||
| Age: | 29 | |
| Current Position(s) Held with Fund: | Corporate Secretary | |
| Term of Office1 & Length of Time Served: | Since 2016 | |
| Principal Occupation(s) During Past 5 Years: | Fund Administration Manager since 2015; Mutual Fund Compliance | |
| Specialist (2009-2015) - Manning & Napier Advisors, LLC; Assistant Corporate Secretary (2011-2016)- Manning & Napier Fund, Inc. | ||
| Number of Portfolios Overseen within Fund Complex: | 40 | |
| Other Directorships Held Outside Fund Complex: | N/A | |
| ||
| Name: | Christine Glavin | |
| Address: | 290 Woodcliff Drive | |
| Fairport, NY 14450 | ||
| Age: | 50 | |
| Current Position(s) Held with Fund: | Principal Financial Officer, Chief Financial Officer | |
| Term of Office1 & Length of Time Served: | Principal Financial Officer (2002-present); Chief Financial Officer (2001-present) | |
| Principal Occupation(s) During Past 5 Years: | Director of Fund Reporting (2011-present); Fund Reporting Manager | |
| (1997-2011)- Manning & Napier Advisors, LLC; Assistant Treasurer (2008-present)- Exeter Trust Company | ||
| Number of Portfolios Overseen within Fund Complex: | 40 | |
| Other Directorships Held Outside Fund Complex: | N/A | |
| ||
| Name: | Jodi L. Hedberg | |
| Address: | 290 Woodcliff Drive | |
| Fairport, NY 14450 | ||
| Age: | 48 | |
| Current Position(s) Held with Fund: Term of Office1 & Length of Time Served: | Chief Compliance Officer, Anti-Money Laundering Compliance Officer Chief Compliance Officer (2004-present); Anti-Money Laundering Compliance Officer (2002-present); Corporate Secretary (1997-2016) | |
| Principal Occupation(s) During Past 5 Years: | Director of Compliance (2005-present); Compliance Manager (1995-2005) - Manning & Napier Advisors, LLC and affiliates; Corporate Secretary-Manning & Napier Investor Services, Inc. since 2006 | |
| Number of Portfolios Overseen within Fund Complex: | 40 | |
| Other Directorships Held Outside Fund Complex: | N/A | |
| ||
| Name: | Amy Williams | |
| Address: | 290 Woodcliff Drive | |
| Fairport, NY 14450 | ||
| Age: | 54 | |
| Current Position(s) Held with Fund: | Assistant Corporate Secretary | |
| Term of Office1 & Length of Time Served: | Since 2016 | |
| Principal Occupation(s) During Past 5 Years: | Director of Fund Documentation (1992-present) – Manning & Napier Advisors, LLC | |
| Holds one or more of the following titles for various affiliates; Director | ||
| Number of Portfolios Overseen within Fund Complex: | 40 | |
| Other Directorships Held Outside Fund Complex: | N/A | |
| ||
| Name: | Richard Yates | |
| Address: | 290 Woodcliff Drive | |
| Fairport, NY 14450 | ||
| Age: | 51 | |
| Current Position(s) Held with Fund: | Chief Legal Officer | |
| Term of Office1 & Length of Time Served: | Chief Legal Officer since 2004 | |
| Principal Occupation(s) During Past 5 Years: | Counsel- Manning & Napier Advisors, LLC and affiliates (2000-present); | |
| Holds one or more of the following titles for various affiliates; Director or | ||
| Corporate Secretary | ||
| Number of Portfolios Overseen within Fund Complex: | 40 | |
| Other Directorships Held Outside Fund Complex: | N/A | |
| ||
*Interested Director, within the meaning of the Investment Company Act of 1940 by reason of her position with the Fund’s investment advisor. Ms. Mosca serves as the Managing Director of the Funds Group for Manning & Napier Advisors, LLC.
1 The term of office of all officers shall be one year and until their respective successors are chosen and qualified, or his or her earlier resignation or removal as provided in the Fund’s By-Laws.
24
{This page intentionally left blank}
25
Tax Managed Series
Literature Requests
(unaudited)
Proxy Voting Policies and Procedures
A description of the policies and procedures that the Fund uses to determine how to vote proxies relating to portfolio securities is available, without charge, upon request:
| By phone | 1-800-466-3863 | |||
| On the Securities and Exchange | ||||
| Commission’s (SEC) web site | http://www.sec.gov |
Proxy Voting Record
Information regarding how the Fund voted proxies relating to portfolio securities during the most recent 12-month period ended June 30th is available, without charge, upon request:
| By phone | 1-800-466-3863 | |||
| On the SEC’s web site | http://www.sec.gov |
Quarterly Portfolio Holdings
The Series’ complete schedule of portfolio holdings for the 1st and 3rd quarters of each fiscal year are provided on Form N-Q, and are available, without charge, upon request:
| By phone | 1-800-466-3863 | |||
| On the SEC’s web site | http://www.sec.gov |
The Series’ Form N-Q may be reviewed and copied at the SEC’s Public Reference Room in Washington, D.C. Information on the operation of the Public Reference Room may be obtained by calling 1-800-SEC-0330.
Prospectus and Statement of Additional Information (SAI)
For more information about any of the Manning & Napier Fund, Inc. Series, you may obtain a prospectus and SAI at www.manning-napier.com or by calling (800) 466-3863. Before investing, carefully consider the objectives, risks, charges and expenses of the investment and read the prospectus carefully as it contains this and other information about the investment company. In addition, this information can be found on the SEC’s web site, http://www.sec.gov.
Additional information available at www.manning-napier.com
1. Fund Holdings - Month-End
2. Fund Holdings - Quarter-End
3. Shareholder Report - Annual
4. Shareholder Report - Semi-Annual
The Fund also offers electronic notification or “e-delivery” when certain documents are available on-line to be downloaded or reviewed. Direct shareholders can elect to receive electronic notification when shareholder reports, prospectus updates, and/or statements are available. If you do not currently have on-line access to your account, you can establish access by going to www.manning-napier.com, click on “Login” in the top corner of the page, and follow the prompts to self-enroll. Once enrolled, you can set your electronic notification preferences by clicking on the Account Options tab located within the green toolbar and then select E-Delivery Option. Should you have any questions on either how to establish on-line access or how to update your account settings, please contact Investor Services at 1-800-466-3863.
The Manning & Napier Fund, Inc. is managed by Manning & Napier Advisors, LLC. Manning & Napier Investor Services, Inc., an affiliate of Manning & Napier Advisors, LLC, is the distributor of the Fund shares.
MNTAX-10/16-AR

Management Discussion and Analysis
(unaudited)
Dear Shareholders:
U.S. and international equity markets delivered positive returns during the past year. Emerging market equities were the notable outperformers, driven by investors’ search for yield and their increased appetite for riskier assets. Abating unease related to Chinese growth, a relatively stable U.S. dollar, the year-to-date upturn in commodity prices, and increased liquidity amid generally easy policy across the globe also provided tailwinds for emerging market assets. Defensive sectors outperformed cyclicals for most of the period, since defensive securities tend to benefit from low interest rate environments and yield is a big component of total return. But the trend reversed amid a mid-year rotation away from crowded defensive sectors into cyclical stocks, and investors have since shown a preference for growth over yield.
Meanwhile, U.S. and global economic growth continued at a slow pace. Although various asset classes performed positively, the year was punctuated by bouts of market volatility. Ongoing concern regarding the price of oil and other commodities, speculation surrounding the trajectory of global economic growth and central bank policy, and political uncertainty — including the unexpected Brexit vote — fueled investor unease and served as volatility catalysts. Going forward, we anticipate an increased likelihood of further gyrations in financial markets as U.S. and global economic growth continues at a muted pace.
Enclosed, we highlight how we are positioned amid the current economic environment, and provide our outlook of what to expect in financial markets. We hope that you find this information to be helpful.
As always, we appreciate your business.
Sincerely,
Manning & Napier Advisors, LLC
1
Fund Commentary
(unaudited)
Investment Objective
To provide capital growth and manage risk for investors planning to retire (or meet another investment goal) in or around the year indicated in the fund’s name.
The Target Series include eleven distinct mutual funds, each of which is managed to a designated target date. Each Series is strategically allocated to become increasingly conservative as the specified target date approaches. The Target 2050, 2040, 2030, 2020, and Target Income Series were launched on March 28, 2008; the Target 2055, 2045, 2035, 2025 and Target 2015 Series were launched on June 25, 2012; and the Target 2060 Series was launched on September 21, 2015.
Performance Commentary
U.S. equity markets generally delivered positive absolute returns for the twelve-month period ended October 31, 2016. The S&P 500 Index gained 4.48% while the Russell 3000 Index earned 4.24%. International equity markets generally delivered modestly positive absolute returns, with the broad MSCI All Country World ex U.S. Index (ACWIxUS) returning 0.22%. Meanwhile, bond markets as represented by the Bloomberg Barclays U.S. Aggregate Bond Index were positive, returning 4.37%. Each of the Target Series delivered positive absolute returns during the one-year period. Though most of the Series underperformed their respective blended benchmarks on a relative basis, the Target 2045 Series Class I as well as the Class I and K of the Target 2050, 2055, and 2060 Series each outperformed relative to their blended benchmarks.
During the past year, each Series’ underweight to longer-dated nominal (i.e., not adjusted for inflation) Treasuries compared to the blended benchmark was a headwind to relative performance. Each Series’ shorter fixed income duration compared to the blended benchmark also challenged relative returns, as U.S. interest rates generally declined, which benefitted longer-duration fixed income securities. Additionally, the Series’ allocation to managed futures provided a headwind to relative performance in each Series that contained exposure to the managed futures strategy (managed futures were removed from each applicable Series during the first quarter of 2016). Stock selection in Materials and Real Estate also challenged relative returns.
Offsetting a portion of the relative performance headwind was the aggregate effect of stock selection, which aided relative returns. This was primarily driven by strong stock selection in Health Care. Each Series’ overweight to Information Technology compared to the blended benchmark aided relative returns as well.
In regard to current portfolio positioning, the equity portion of the Series is concentrated in companies with growth drivers that are not tied to the broad economy. We believe the key to generating attractive returns in the prevailing environment is the ability to identify individual businesses that can innovate and disrupt their competitive landscape. We are looking for businesses that are generating growth by creating new markets, expanding existing markets, or simply taking market share from their rivals. The goal is to identify companies trading at attractive valuations relative to their growth potential.
With regard to fixed income, we continue to maintain a sizeable allocation to corporate bonds but remain mindful that we are in the seventh year of economic expansion and valuations are not as compelling as they were previously. High yield bond spreads have tightened since we increased exposure to the sector in August 2015 (narrowing spreads indicate improved confidence in creditworthiness). As a result, we capitalized on market strength and trimmed high yield bond exposure during the third quarter of 2016, using the proceeds to increase our holdings of short- and intermediate-term nominal Treasuries. We also sold some AAA-rated commercial mortgage-backed securities during the third quarter, as valuations had become expensive. The proceeds were used to purchase comparable-duration Agency securities. The portfolios continue to have a notable allocation to Treasury Inflation-Protected Securities (TIPS) as well.
As we look toward 2017, we expect global economic growth to persist at a slow pace. Broadly speaking, valuations in the developed world are on the expensive side of neutral, whereas valuations in select emerging markets are relatively more attractive. The current backdrop suggests muted long-term returns going forward, so we are targeting companies exposed to secular (i.e., long-term) growth trends in an effort to generate above market returns. We continue to anticipate gyrations in equity markets due to catalysts such as the potential for global growth to deviate from expectations, diverging central bank policies, commodity price pressures, and geopolitical risks. However, our indicators point to volatility still being a buying opportunity and do not suggest capital risk is a significant near-term concern. In this environment, an active, flexible, and selective approach can help avoid overvalued areas of the market, tactics that Manning & Napier has employed for over 45 years as an active investment manager.
2
Fund Commentary
(unaudited)
| Performance | Commentary (continued) |
Performance data quoted represents past performance and does not guarantee future results. The investment return and principal value of an investment will fluctuate, so that an investor’s shares, when redeemed, may be worth more or less than their original cost. Current performance may be higher or lower than that quoted; investors can obtain the most recent month-end performance at www.manning-napier.com or by calling (800) 466-3863.
Each Manning & Napier Fund, Inc. Target Series is invested in one or two of four proprietary lifestyle funds, the Manning & Napier Fund, Inc. Pro-Blend® Series, based on the Target Series becoming increasingly conservative over time. Because the underlying funds invest in both stocks and bonds, the value of your investment will fluctuate in response to stock market movements and changes in interest rates. Investing in target date funds will also involve a number of other risks, including issuer-specific risk, foreign investment risk, and small-cap/mid-cap risk, as the underlying investments change over time. Investments in options and futures, like all derivatives, can be highly volatile and involve risks in addition to the risks of the underlying instrument on which the derivative is based, such as counterparty, correlation and liquidity risk. Also, the use of leverage increases exposure to the market and may magnify potential losses. Principal value is not guaranteed at any time, including at the target date (the approximate year when an investor plans to stop contributions and start periodic withdrawals).
3
Performance Update as of October 31, 2016 - Target Income Series
(unaudited)
| AVERAGE ANNUAL TOTAL RETURNS AS OF OCTOBER 31, 2016 | ||||||||||||
| ONE YEAR1 | FIVE YEAR | SINCE INCEPTION2 | ||||||||||
Manning & Napier Fund, Inc. - Target Income Series - Class K3 | 2.97 | % | 4.30 | % | 4.56 | % | ||||||
Manning & Napier Fund, Inc. - Target Income Series - Class R3 | 2.69 | % | 4.00 | % | 4.27 | % | ||||||
Manning & Napier Fund, Inc. - Target Income Series - Class I3 | 3.20 | % | 4.55 | % | 4.81 | % | ||||||
Standard & Poor’s (S&P) Target Date Retirement Income Index4 | 3.83 | % | 4.92 | % | 4.34 | % | ||||||
Income Composite Benchmark5 | 3.36 | % | 4.93 | % | 4.94 | % | ||||||
The following graph compares the value of a $10,000 investment in the Manning & Napier Fund, Inc. - Target Income Series - Class K from its inception2 (3/28/08) to present (10/31/16) to the S&P Target Date Retirement Income Index and the Income Composite Benchmark.
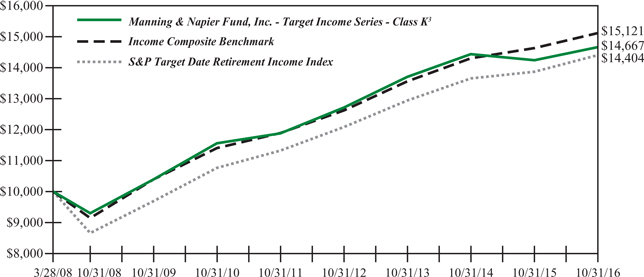
1The returns shown are based on net asset values calculated for shareholder transactions and may differ from the returns shown in the financial highlights, which reflect adjustments made to the net asset values in accordance with accounting principles generally accepted in the United States of America.
2Performance numbers for the Series and the S&P Target Date Index are calculated from March 28, 2008, the Series’ inception date. Performance numbers for the Target Composite Benchmark are calculated from April 1, 2008.
3The Series’ performance does not reflect the deduction of taxes that a shareholder would pay on fund distributions or the redemption of shares. The Series’ performance is historical and may not be indicative of future results. The performance returns shown are inclusive of the net expense ratio of the Series. For the year ended October 31, 2016, this net expense ratio was 0.30% for Class K, 0.55% for Class R and 0.05% for Class I. The gross expense ratio, which does not account for any voluntary or contractual waivers currently in effect, was 0.42% for Class K, 0.67% for Class R and 0.17% for Class I for the year ended October 31, 2016.
4The S&P Target Date Index Series is a series of unmanaged indices that reflect the market consensus for asset allocations for different target date horizons. The asset class exposure for each index is represented by exchange traded funds (ETFs). Asset class weights are established annually and rebalanced monthly. Prior to 02/26/2010, the indices were rebalanced annually. The Index returns shown are the Gross Return series, which provide benchmarks free of underlying ETF expenses by adjusting the Total Return series (which assume the reinvestment of dividends) by an assumed weighted average ETF expense ratio. Index returns provided by Bloomberg. S&P Dow Jones Indices LLC, a subsidiary of the McGraw Hill Financial, Inc., is the publisher of various index based data products and services and has licensed certain of its products and services for use by Manning & Napier. Copyright © 2016 by S&P Dow Jones Indices LLC and/or its affiliates. All rights reserved. Neither S&P Dow Jones Indices LLC, Dow Jones Trademark Holdings LLC, their affiliates nor their third party licensors make any representation or warranty, express or implied, as to the ability of any index to accurately represent the asset class or market sector that it purports to represent and none of these parties shall have any liability for any errors, omissions, or interruptions of any index or the data included therein.
5The Target Composite Benchmark represents the performance of the target date fund’s asset classes according to their respective weightings, as adjusted over time to reflect the target date fund’s increasingly conservative asset allocations. The following indices are used to calculate the Target Composite Benchmarks: Russell 3000® Index (Russell 3000), MSCI ACWI ex USA Index (ACWIxUS), and Bloomberg Barclays U.S. Aggregate Bond Index (BAB) and/or Bloomberg Barclays U.S. Intermediate Aggregate Bond Index (BIAB). Russell 3000 is an unmanaged index that consists of 3,000 of the largest U.S. companies based on total market capitalization. Index returns are based on a market capitalization-weighted average of relative price changes of the component stocks plus dividends whose reinvestments are compounded daily. Index returns provided by Bloomberg. ACWIxUS is a free float-adjusted market capitalization index that is designed to measure equity market performance in the global developed and emerging markets and consists of 45 developed and emerging market country indices outside the U.S. The Index is denominated in U.S. dollars. The Index returns are net of withholding taxes. They assume daily
4
Performance Update as of October 31, 2016 - Target Income Series
(unaudited)
reinvestment of net dividends thus accounting for any applicable dividend taxation. Index returns provided by Bloomberg. BAB and BIAB are both unmanaged, market value-weighted indices of U.S. domestic investment-grade debt issues, including government, corporate, asset-backed and mortgage-backed securities. BAB includes maturities of one year or more; BIAB includes maturities of greater than one year but less than ten years. BAB and BIAB returns provided by Interactive Data. Indices returns do not reflect any fees or expenses. Returns provided are calculated monthly using a blended allocation. Because the target date fund’s asset allocation will vary over time, the composition of the target date portfolio may not match the composition of the comparative Target Composite Benchmark. Mid-month performance is not available for the benchmark. Performance shown is from the first of the month following the corresponding Series’ inception date.
5
Performance Update as of October 31, 2016 - Target 2015 Series
(unaudited)
| AVERAGE ANNUAL TOTAL RETURNS AS OF OCTOBER 31, 2016 | ||||||||
ONE YEAR1 | SINCE INCEPTION2 | |||||||
Manning & Napier Fund, Inc. - Target 2015 - Class K3 | 2.58 | % | 5.70 | % | ||||
Manning & Napier Fund, Inc. - Target 2015 - Class R3 | 2.34 | % | 5.49 | % | ||||
Manning & Napier Fund, Inc. - Target 2015 - Class I3 | 2.85 | % | 5.99 | % | ||||
S&P Target Date 2015 Index4 | 3.78 | % | 7.17 | % | ||||
2015 Composite Benchmark5 | 3.90 | % | 6.17 | % | ||||
The following graph compares the value of a $10,000 investment in the Manning & Napier Fund, Inc. - Target 2015 Series - Class K from its inception2 (6/25/12) to present (10/31/16) to the S&P Target Date 2015 Index and the 2015 Composite Benchmark.
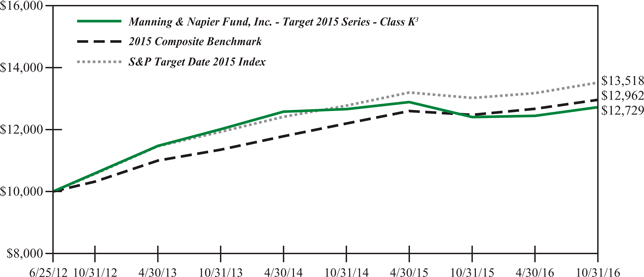
1The returns shown are based on net asset values calculated for shareholder transactions and may differ from the returns shown in the financial highlights, which reflect adjustments made to the net asset values in accordance with accounting principles generally accepted in the United States of America.
2Performance numbers for the Series and the S&P Target Date Index are calculated from June 25, 2012, the Series’ inception date. Performance numbers for the Target Composite Benchmark are calculated from July 1, 2012.
3The Series’ performance does not reflect the deduction of taxes that a shareholder would pay on fund distributions or the redemption of shares. The Series’ performance is historical and may not be indicative of future results. The performance returns shown are inclusive of the net expense ratio of the Series. For the year ended October 31, 2016, this net expense ratio was 0.30% for Class K, 0.55% for Class R and 0.05% for Class I. The gross expense ratio, which does not account for any voluntary or contractual waivers currently in effect, was 1.81% for Class K, 2.06% for Class R and 1.56% for Class I for the year ended October 31, 2016.
4The S&P Target Date Index Series is a series of unmanaged indices that reflect the market consensus for asset allocations for different target date horizons. The asset class exposure for each index is represented by exchange traded funds (ETFs). Asset class weights are established annually and rebalanced monthly. Prior to 02/26/2010, the indices were rebalanced annually. The Index returns shown are the Gross Return series, which provide benchmarks free of underlying ETF expenses by adjusting the Total Return series (which assume the reinvestment of dividends) by an assumed weighted average ETF expense ratio. Index returns provided by Bloomberg. S&P Dow Jones Indices LLC, a subsidiary of the McGraw Hill Financial, Inc., is the publisher of various index based data products and services and has licensed certain of its products and services for use by Manning & Napier. Copyright © 2016 by S&P Dow Jones Indices LLC and/or its affiliates. All rights reserved. Neither S&P Dow Jones Indices LLC, Dow Jones Trademark Holdings LLC, their affiliates nor their third party licensors make any representation or warranty, express or implied, as to the ability of any index to accurately represent the asset class or market sector that it purports to represent and none of these parties shall have any liability for any errors, omissions, or interruptions of any index or the data included therein.
5The Target Composite Benchmark represents the performance of the target date fund’s asset classes according to their respective weightings, as adjusted over time to reflect the target date fund’s increasingly conservative asset allocations. The following indices are used to calculate the Target Composite Benchmarks: Russell 3000® Index (Russell 3000), MSCI ACWI ex USA Index (ACWIxUS), and Bloomberg Barclays U.S. Aggregate Bond Index (BAB) and/or Bloomberg Barclays U.S. Intermediate Aggregate Bond Index (BIAB). Russell 3000 is an unmanaged index that consists of 3,000 of the largest U.S. companies based on total market capitalization. Index returns are based on a market capitalization-weighted average of relative price changes of the component stocks plus dividends whose reinvestments are compounded daily. Index returns provided by Bloomberg. ACWIxUS is a free float-adjusted market capitalization index that is designed to measure equity market performance in the global developed and emerging markets and consists of 45
6
Performance Update as of October 31, 2016 - Target 2015 Series
(unaudited)
developed and emerging market country indices outside the U.S. The Index is denominated in U.S. dollars. The Index returns are net of withholding taxes. They assume daily reinvestment of net dividends thus accounting for any applicable dividend taxation. Index returns provided by Bloomberg. BAB and BIAB are both unmanaged, market value-weighted indices of U.S. domestic investment-grade debt issues, including government, corporate, asset-backed and mortgage-backed securities. BAB includes maturities of one year or more; BIAB includes maturities of greater than one year but less than ten years. BAB and BIAB returns provided by Interactive Data. Indices returns do not reflect any fees or expenses. Returns provided are calculated monthly using a blended allocation. Because the target date fund’s asset allocation will vary over time, the composition of the target date portfolio may not match the composition of the comparative Target Composite Benchmark. Mid-month performance is not available for the benchmark. Performance shown is from the first of the month following the corresponding Series’ inception date.
7
Performance Update as of October 31, 2016 - Target 2020 Series
(unaudited)
| AVERAGE ANNUAL TOTAL RETURNS AS OF OCTOBER 31, 2016 | ||||||||||||
| ONE YEAR1 | FIVE YEAR | SINCE INCEPTION2 | ||||||||||
Manning & Napier Fund, Inc. - Target 2020 Series - Class K3 | 2.83 | % | 5.89 | % | 4.73 | % | ||||||
Manning & Napier Fund, Inc. - Target 2020 Series - Class R3 | 2.56 | % | 5.62 | % | 4.44 | % | ||||||
Manning & Napier Fund, Inc. - Target 2020 Series - Class I3 | 2.97 | % | 6.14 | % | 4.98 | % | ||||||
S&P Target Date 2020 Index4 | 3.74 | % | 7.42 | % | 5.42 | % | ||||||
2020 Composite Benchmark5 | 4.02 | % | 6.73 | % | 5.35 | % | ||||||
The following graph compares the value of a $10,000 investment in the Manning & Napier Fund, Inc. - Target 2020 Series - Class K from its inception2 (3/28/08) to present (10/31/16) to the S&P Target Date 2020 Index and the 2020 Composite Benchmark.
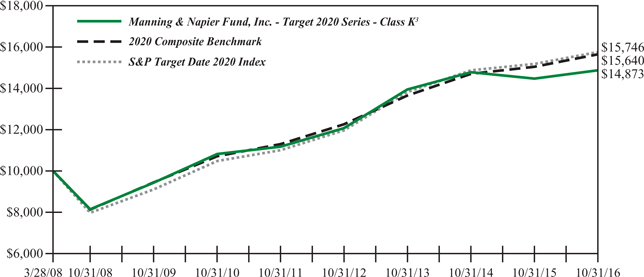
1The returns shown are based on net asset values calculated for shareholder transactions and may differ from the returns shown in the financial highlights, which reflect adjustments made to the net asset values in accordance with accounting principles generally accepted in the United States of America.
2Performance numbers for the Series and the S&P Target Date Index are calculated from March 28, 2008, the Series’ inception date. Performance numbers for the Target Composite Benchmark are calculated from April 1, 2008.
3The Series’ performance does not reflect the deduction of taxes that a shareholder would pay on fund distributions or the redemption of shares. The Series’ performance is historical and may not be indicative of future results. The performance returns shown are inclusive of the net expense ratio of the Series. For the year ended October 31, 2016, this net expense ratio was 0.30% for Class K, 0.55% for Class R and 0.05% for Class I. The gross expense ratio, which does not account for any voluntary or contractual waivers currently in effect, was 0.36% for Class K, 0.61% for Class R and 0.11% for Class I for the year ended October 31, 2016.
4The S&P Target Date Index Series is a series of unmanaged indices that reflect the market consensus for asset allocations for different target date horizons. The asset class exposure for each index is represented by exchange traded funds (ETFs). Asset class weights are established annually and rebalanced monthly. Prior to 02/26/2010, the indices were rebalanced annually. The Index returns shown are the Gross Return series, which provide benchmarks free of underlying ETF expenses by adjusting the Total Return series (which assume the reinvestment of dividends) by an assumed weighted average ETF expense ratio. Index returns provided by Bloomberg. S&P Dow Jones Indices LLC, a subsidiary of the McGraw Hill Financial, Inc., is the publisher of various index based data products and services and has licensed certain of its products and services for use by Manning & Napier. Copyright © 2016 by S&P Dow Jones Indices LLC and/or its affiliates. All rights reserved. Neither S&P Dow Jones Indices LLC, Dow Jones Trademark Holdings LLC, their affiliates nor their third party licensors make any representation or warranty, express or implied, as to the ability of any index to accurately represent the asset class or market sector that it purports to represent and none of these parties shall have any liability for any errors, omissions, or interruptions of any index or the data included therein.
5The Target Composite Benchmark represents the performance of the target date fund’s asset classes according to their respective weightings, as adjusted over time to reflect the target date fund’s increasingly conservative asset allocations. The following indices are used to calculate the Target Composite Benchmarks: Russell 3000® Index (Russell 3000), MSCI ACWI ex USA Index (ACWIxUS), and Bloomberg Barclays U.S. Aggregate Bond Index (BAB) and/or Bloomberg Barclays U.S. Intermediate Aggregate Bond Index (BIAB). Russell 3000 is an unmanaged index that consists of 3,000 of the largest U.S. companies based on total market capitalization. Index returns are based on a market capitalization-weighted average of relative price changes of the component stocks plus dividends whose reinvestments are compounded daily. Index returns provided by Bloomberg. ACWIxUS is a free float-adjusted market capitalization index that is designed to measure equity market performance in the global developed and emerging markets and consists of 45 developed and emerging market country indices outside the U.S. The Index is denominated in U.S. dollars. The Index returns are net of withholding taxes. They assume daily
8
Performance Update as of October 31, 2016 - Target 2020 Series
(unaudited)
reinvestment of net dividends thus accounting for any applicable dividend taxation. Index returns provided by Bloomberg. BAB and BIAB are both unmanaged, market value-weighted indices of U.S. domestic investment-grade debt issues, including government, corporate, asset-backed and mortgage-backed securities. BAB includes maturities of one year or more; BIAB includes maturities of greater than one year but less than ten years. BAB and BIAB returns provided by Interactive Data. Indices returns do not reflect any fees or expenses. Returns provided are calculated monthly using a blended allocation. Because the target date fund’s asset allocation will vary over time, the composition of the target date portfolio may not match the composition of the comparative Target Composite Benchmark. Mid-month performance is not available for the benchmark. Performance shown is from the first of the month following the corresponding Series’ inception date.
9
Performance Update as of October 31, 2016 - Target 2025 Series
(unaudited)
| AVERAGE ANNUAL TOTAL RETURNS AS OF OCTOBER 31, 2016 | ||||||||
ONE YEAR1 | SINCE INCEPTION2 | |||||||
Manning & Napier Fund, Inc. - Target 2025 Series - Class K3 | 2.86 | % | 7.57 | % | ||||
Manning & Napier Fund, Inc. - Target 2025 Series - Class R3 | 2.50 | % | 7.38 | % | ||||
Manning & Napier Fund, Inc. - Target 2025 Series - Class I3 | 3.04 | % | 7.73 | % | ||||
S&P Target Date 2025 Index4 | 3.70 | % | 8.74 | % | ||||
2025 Composite Benchmark5 | 3.95 | % | 7.23 | % | ||||
The following graph compares the value of a $10,000 investment in the Manning & Napier Fund, Inc. - Target 2025 Series - Class K from its inception2 (6/25/12) to present (10/31/16) to the 2025 Composite Benchmark, and S&P Target Date 2025 Index.
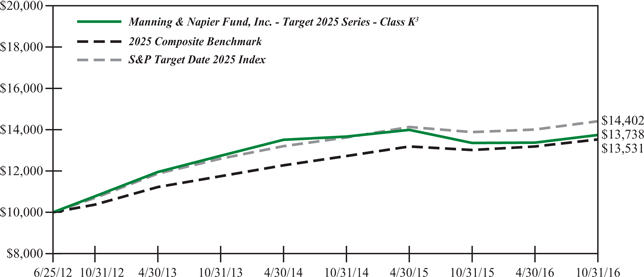
1The returns shown are based on net asset values calculated for shareholder transactions and may differ from the returns shown in the financial highlights, which reflect adjustments made to the net asset values in accordance with accounting principles generally accepted in the United States of America.
2Performance numbers for the Series and the S&P Target Date Index are calculated from June 25, 2012, the Series’ inception date. Performance numbers for the Target Composite Benchmark are calculated from July 1, 2012.
3The Series’ performance does not reflect the deduction of taxes that a shareholder would pay on fund distributions or the redemption of shares. The Series’ performance is historical and may not be indicative of future results. The performance returns shown are inclusive of the net expense ratio of the Series. For the year ended October 31, 2016, this net expense ratio was 0.30% for Class K, 0.55% for Class R and 0.05% for Class I. The gross expense ratio, which does not account for any voluntary or contractual waivers currently in effect, was 0.63% for Class K, 0.88% for Class R and 0.38% for Class I for the year ended October 31, 2016.
4The S&P Target Date Index Series is a series of unmanaged indices that reflect the market consensus for asset allocations for different target date horizons. The asset class exposure for each index is represented by exchange traded funds (ETFs). Asset class weights are established annually and rebalanced monthly. Prior to 02/26/2010, the indices were rebalanced annually. The Index returns shown are the Gross Return series, which provide benchmarks free of underlying ETF expenses by adjusting the Total Return series (which assume the reinvestment of dividends) by an assumed weighted average ETF expense ratio. Index returns provided by Bloomberg. S&P Dow Jones Indices LLC, a subsidiary of the McGraw Hill Financial, Inc., is the publisher of various index based data products and services and has licensed certain of its products and services for use by Manning & Napier. Copyright © 2016 by S&P Dow Jones Indices LLC and/or its affiliates. All rights reserved. Neither S&P Dow Jones Indices LLC, Dow Jones Trademark Holdings LLC, their affiliates nor their third party licensors make any representation or warranty, express or implied, as to the ability of any index to accurately represent the asset class or market sector that it purports to represent and none of these parties shall have any liability for any errors, omissions, or interruptions of any index or the data included therein.
5The Target Composite Benchmark represents the performance of the target date fund’s asset classes according to their respective weightings, as adjusted over time to reflect the target date fund’s increasingly conservative asset allocations. The following indices are used to calculate the Target Composite Benchmarks: Russell 3000® Index (Russell 3000), MSCI ACWI ex USA Index (ACWIxUS), and Bloomberg Barclays U.S. Aggregate Bond Index (BAB) and/or Bloomberg Barclays U.S. Intermediate Aggregate Bond Index (BIAB). Russell 3000 is an unmanaged index that consists of 3,000 of the largest U.S. companies based on total market capitalization. Index returns are based on a market capitalization-weighted average of relative price changes of the component stocks plus dividends whose reinvestments are compounded daily. Index returns provided by Bloomberg. ACWIxUS is a free float-adjusted market capitalization index that is designed to measure equity market performance in the global developed and emerging markets and consists of 45 developed and emerging market country indices outside the U.S. The Index is denominated in U.S. dollars. The Index returns are net of withholding taxes. They assume daily
10
Performance Update as of October 31, 2016 - Target 2025 Series
(unaudited)
reinvestment of net dividends thus accounting for any applicable dividend taxation. Index returns provided by Bloomberg. BAB and BIAB are both unmanaged, market value-weighted indices of U.S. domestic investment-grade debt issues, including government, corporate, asset-backed and mortgage-backed securities. BAB includes maturities of one year or more; BIAB includes maturities of greater than one year but less than ten years. BAB and BIAB returns provided by Interactive Data. Indices returns do not reflect any fees or expenses. Returns provided are calculated monthly using a blended allocation. Because the target date fund’s asset allocation will vary over time, the composition of the target date portfolio may not match the composition of the comparative Target Composite Benchmark. Mid-month performance is not available for the benchmark. Performance shown is from the first of the month following the corresponding Series’ inception date.
11
Performance Update as of October 31, 2016 - Target 2030 Series
(unaudited)
| AVERAGE ANNUAL TOTAL RETURNS AS OF OCTOBER 31, 2016 | ||||||||||||
| ONE YEAR1 | FIVE YEAR | SINCE INCEPTION2 | ||||||||||
Manning & Napier Fund, Inc. - Target 2030 Series - Class K3 | 3.12 | % | 7.36 | % | 5.26 | % | ||||||
Manning & Napier Fund, Inc. - Target 2030 Series - Class R3 | 2.97 | % | 7.11 | % | 5.02 | % | ||||||
Manning & Napier Fund, Inc. - Target 2030 Series - Class I3 | 3.38 | % | 7.63 | % | 5.55 | % | ||||||
S&P Target Date 2030 Index4 | 3.65 | % | 8.54 | % | 5.69 | % | ||||||
2030 Composite Benchmark5 | 3.82 | % | 8.04 | % | 5.55 | % | ||||||
The following graph compares the value of a $10,000 investment in the Manning & Napier Fund, Inc. - Target 2030 Series -Class K from its inception2 (3/28/08) to present (10/31/16) to the 2030 Composite Benchmark and S&P Target Date 2030 Index.
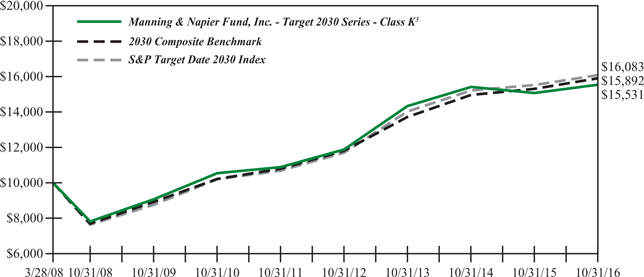
1The returns shown are based on net asset values calculated for shareholder transactions and may differ from the returns shown in the financial highlights, which reflect adjustments made to the net asset values in accordance with accounting principles generally accepted in the United States of America.
2Performance numbers for the Series and the S&P Target Date Index are calculated from March 28, 2008, the Series’ inception date. Performance numbers for the Target Composite Benchmark are calculated from April 1, 2008.
3The Series’ performance does not reflect the deduction of taxes that a shareholder would pay on fund distributions or the redemption of shares. The Series’ performance is historical and may not be indicative of future results. The performance returns shown are inclusive of the net expense ratio of the Series. For the year ended October 31, 2016, this net expense ratio was 0.30% for Class K, 0.55% for Class R and 0.05% for Class I. The gross expense ratio, which does not account for any voluntary or contractual waivers currently in effect, was 0.36% for Class K, 0.61% for Class R and 0.11% for Class I for the year ended October 31, 2016.
4The S&P Target Date Index Series is a series of unmanaged indices that reflect the market consensus for asset allocations for different target date horizons. The asset class exposure for each index is represented by exchange traded funds (ETFs). Asset class weights are established annually and rebalanced monthly. Prior to 02/26/2010, the indices were rebalanced annually. The Index returns shown are the Gross Return series, which provide benchmarks free of underlying ETF expenses by adjusting the Total Return series (which assume the reinvestment of dividends) by an assumed weighted average ETF expense ratio. Index returns provided by Bloomberg. S&P Dow Jones Indices LLC, a subsidiary of the McGraw Hill Financial, Inc., is the publisher of various index based data products and services and has licensed certain of its products and services for use by Manning & Napier. Copyright © 2016 by S&P Dow Jones Indices LLC and/or its affiliates. All rights reserved. Neither S&P Dow Jones Indices LLC, Dow Jones Trademark Holdings LLC, their affiliates nor their third party licensors make any representation or warranty, express or implied, as to the ability of any index to accurately represent the asset class or market sector that it purports to represent and none of these parties shall have any liability for any errors, omissions, or interruptions of any index or the data included therein.
5The Target Composite Benchmark represents the performance of the target date fund’s asset classes according to their respective weightings, as adjusted over time to reflect the target date fund’s increasingly conservative asset allocations. The following indices are used to calculate the Target Composite Benchmarks: Russell 3000® Index (Russell 3000), MSCI ACWI ex USA Index (ACWIxUS), and Bloomberg Barclays U.S. Aggregate Bond Index (BAB) and/or Bloomberg Barclays U.S. Intermediate Aggregate Bond Index (BIAB). Russell 3000 is an unmanaged index that consists of 3,000 of the largest U.S. companies based on total market capitalization. Index returns are based on a market capitalization-weighted average of relative price changes of the component stocks plus dividends whose reinvestments are compounded daily. Index returns provided by Bloomberg. ACWIxUS is a free float-adjusted market capitalization index that is designed to measure equity market performance in the global developed and emerging markets and consists of 45 developed and emerging market country indices outside the U.S. The Index is denominated in U.S. dollars. The Index returns are net of withholding taxes. They assume daily
12
Performance Update as of October 31, 2016 - Target 2030 Series
(unaudited)
reinvestment of net dividends thus accounting for any applicable dividend taxation. Index returns provided by Bloomberg. BAB and BIAB are both unmanaged, market value-weighted indices of U.S. domestic investment-grade debt issues, including government, corporate, asset-backed and mortgage-backed securities. BAB includes maturities of one year or more; BIAB includes maturities of greater than one year but less than ten years. BAB and BIAB returns provided by Interactive Data. Indices returns do not reflect any fees or expenses. Returns provided are calculated monthly using a blended allocation. Because the target date fund’s asset allocation will vary over time, the composition of the target date portfolio may not match the composition of the comparative Target Composite Benchmark. Mid-month performance is not available for the benchmark. Performance shown is from the first of the month following the corresponding Series’ inception date.
13
Performance Update as of October 31, 2016 - Target 2035 Series
(unaudited)
| AVERAGE ANNUAL TOTAL RETURNS AS OF OCTOBER 31, 2016 | ||||||||
| ONE YEAR1 | SINCE INCEPTION2 | |||||||
Manning & Napier Fund, Inc. - Target 2035 Series - Class K3 | 3.22 | % | 9.08 | % | ||||
Manning & Napier Fund, Inc. - Target 2035 Series - Class R3 | 3.01 | % | 8.88 | % | ||||
Manning & Napier Fund, Inc. - Target 2035 Series - Class I3 | 3.45 | % | 9.34 | % | ||||
S&P Target Date 2035 Index4 | 3.59 | % | 9.94 | % | ||||
2035 Composite Benchmark5 | 3.70 | % | 8.84 | % | ||||
The following graph compares the value of a $10,000 investment in the Manning & Napier Fund, Inc. - Target 2035 Series - Class K from its inception2 (6/25/12) to present (10/31/16) to the 2035 Composite Benchmark and S&P Target Date 2035 Index.
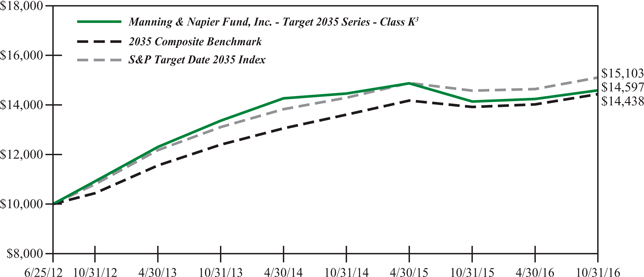
1The returns shown are based on net asset values calculated for shareholder transactions and may differ from the returns shown in the financial highlights, which reflect adjustments made to the net asset values in accordance with accounting principles generally accepted in the United States of America. Performance numbers for the S&P Target Date Index and Target Composite Benchmark are calculated from July 1, 2012.
2Performance numbers for the Series and the S&P Target Date Index are calculated from June 25, 2012, the Series’ inception date. Performance numbers for the Target Composite Benchmark are calculated from July 1, 2012.
3The Series’ performance does not reflect the deduction of taxes that a shareholder would pay on fund distributions or the redemption of shares. The Series’ performance is historical and may not be indicative of future results. The performance returns shown are inclusive of the net expense ratio of the Series. For the year ended October 31, 2016, this net expense ratio was 0.30% for Class K, 0.55% for Class R and 0.05% for Class I. The gross expense ratio, which does not account for any voluntary or contractual waivers currently in effect, was 0.73% for Class K, 0.98% for Class R and 0.48% for Class I for the year ended October 31, 2016.
4The S&P Target Date Index Series is a series of unmanaged indices that reflect the market consensus for asset allocations for different target date horizons. The asset class exposure for each index is represented by exchange traded funds (ETFs). Asset class weights are established annually and rebalanced monthly. Prior to 02/26/2010, the indices were rebalanced annually. The Index returns shown are the Gross Return series, which provide benchmarks free of underlying ETF expenses by adjusting the Total Return series (which assume the reinvestment of dividends) by an assumed weighted average ETF expense ratio. Index returns provided by Bloomberg. S&P Dow Jones Indices LLC, a subsidiary of the McGraw Hill Financial, Inc., is the publisher of various index based data products and services and has licensed certain of its products and services for use by Manning & Napier. Copyright © 2016 by S&P Dow Jones Indices LLC and/or its affiliates. All rights reserved. Neither S&P Dow Jones Indices LLC, Dow Jones Trademark Holdings LLC, their affiliates nor their third party licensors make any representation or warranty, express or implied, as to the ability of any index to accurately represent the asset class or market sector that it purports to represent and none of these parties shall have any liability for any errors, omissions, or interruptions of any index or the data included therein.
5The Target Composite Benchmark represents the performance of the target date fund’s asset classes according to their respective weightings, as adjusted over time to reflect the target date fund’s increasingly conservative asset allocations. The following indices are used to calculate the Target Composite Benchmarks: Russell 3000® Index (Russell 3000), MSCI ACWI ex USA Index (ACWIxUS), and Bloomberg Barclays U.S. Aggregate Bond Index (BAB) and/or Bloomberg Barclays U.S. Intermediate Aggregate Bond Index (BIAB). Russell 3000 is an unmanaged index that consists of 3,000 of the largest U.S. companies based on total market capitalization. Index returns are based on a market capitalization-weighted average of relative price changes of the component stocks plus dividends whose reinvestments are compounded daily. Index returns provided by Bloomberg. ACWIxUS is a free float-adjusted market capitalization index that is designed to measure equity market performance in the global developed and emerging markets and consists of 45 developed and emerging market country indices outside the U.S. The Index is denominated in U.S. dollars. The Index returns are net of withholding taxes. They assume daily
14
Performance Update as of October 31, 2016 - Target 2035 Series
(unaudited)
reinvestment of net dividends thus accounting for any applicable dividend taxation. Index returns provided by Bloomberg. BAB and BIAB are both unmanaged, market value-weighted indices of U.S. domestic investment-grade debt issues, including government, corporate, asset-backed and mortgage-backed securities. BAB includes maturities of one year or more; BIAB includes maturities of greater than one year but less than ten years. BAB and BIAB returns provided by Interactive Data. Indices returns do not reflect any fees or expenses. Returns provided are calculated monthly using a blended allocation. Because the target date fund’s asset allocation will vary over time, the composition of the target date portfolio may not match the composition of the comparative Target Composite Benchmark. Mid-month performance is not available for the benchmark. Performance shown is from the first of the month following the corresponding Series’ inception date.
15
Performance Update as of October 31, 2016 - Target 2040 Series
(unaudited)
| AVERAGE ANNUAL TOTAL RETURNS AS OF OCTOBER 31, 2016 | ||||||||||||
| ONE YEAR1 | FIVE YEAR | SINCE INCEPTION2 | ||||||||||
Manning & Napier Fund, Inc. - Target 2040 - Class K3 | 3.24 | % | 8.30 | % | 5.46 | % | ||||||
Manning & Napier Fund, Inc. - Target 2040 - Class R3 | 3.06 | % | 8.03 | % | 5.22 | % | ||||||
Manning & Napier Fund, Inc. - Target 2040 - Class I3 | 3.60 | % | 8.58 | % | 5.75 | % | ||||||
S&P Target Date 2040 Index4 | 3.56 | % | 9.29 | % | 5.82 | % | ||||||
2040 Composite Benchmark5 | 3.63 | % | 9.35 | % | 5.92 | % | ||||||
The following graph compares the value of a $10,000 investment in the Manning & Napier Fund, Inc. - Target 2040 Series - Class K from its inception2 (3/28/08) to present (10/31/16) to the S&P Target Date 2040 Index and the 2040 Composite Benchmark.
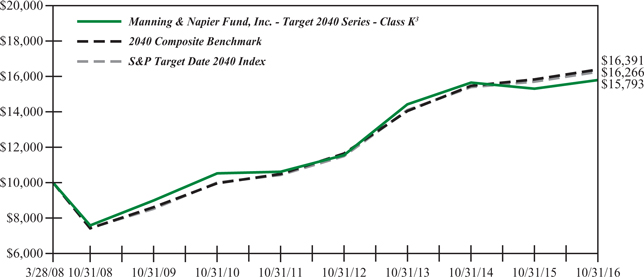
1The returns shown are based on net asset values calculated for shareholder transactions and may differ from the returns shown in the financial highlights, which reflect adjustments made to the net asset values in accordance with accounting principles generally accepted in the United States of America.
2Performance numbers for the Series and the S&P Target Date Index are calculated from March 28, 2008, the Series’ inception date. Performance numbers for the Target Composite Benchmark are calculated from April 1, 2008.
3The Series’ performance does not reflect the deduction of taxes that a shareholder would pay on fund distributions or the redemption of shares. The Series’ performance is historical and may not be indicative of future results. The performance returns shown are inclusive of the net expense ratio of the Series. For the year ended October 31, 2016, this net expense ratio was 0.30% for Class K, 0.55% for Class R and 0.05% for Class I. The gross expense ratio, which does not account for any voluntary or contractual waivers currently in effect, was 0.40% for Class K, 0.65% for Class R and 0.15% for Class I for the year ended October 31, 2016.
4The S&P Target Date Index Series is a series of unmanaged indices that reflect the market consensus for asset allocations for different target date horizons. The asset class exposure for each index is represented by exchange traded funds (ETFs). Asset class weights are established annually and rebalanced monthly. Prior to 02/26/2010, the indices were rebalanced annually. The Index returns shown are the Gross Return series, which provide benchmarks free of underlying ETF expenses by adjusting the Total Return series (which assume the reinvestment of dividends) by an assumed weighted average ETF expense ratio. Index returns provided by Bloomberg. S&P Dow Jones Indices LLC, a subsidiary of the McGraw Hill Financial, Inc., is the publisher of various index based data products and services and has licensed certain of its products and services for use by Manning & Napier. Copyright © 2016 by S&P Dow Jones Indices LLC and/or its affiliates. All rights reserved. Neither S&P Dow Jones Indices LLC, Dow Jones Trademark Holdings LLC, their affiliates nor their third party licensors make any representation or warranty, express or implied, as to the ability of any index to accurately represent the asset class or market sector that it purports to represent and none of these parties shall have any liability for any errors, omissions, or interruptions of any index or the data included therein.
5The Target Composite Benchmark represents the performance of the target date fund’s asset classes according to their respective weightings, as adjusted over time to reflect the target date fund’s increasingly conservative asset allocations. The following indices are used to calculate the Target Composite Benchmarks: Russell 3000® Index (Russell 3000), MSCI ACWI ex USA Index (ACWIxUS), and Bloomberg Barclays U.S. Aggregate Bond Index (BAB) and/or Bloomberg Barclays U.S. Intermediate Aggregate Bond Index (BIAB). Russell 3000 is an unmanaged index that consists of 3,000 of the largest U.S. companies based on total market capitalization. Index returns are based on a market capitalization-weighted average of relative price changes of the component stocks plus dividends whose reinvestments are compounded daily. Index returns provided by Bloomberg. ACWIxUS is a free float-adjusted market capitalization index that is designed to measure equity market performance in the global developed and emerging markets and consists of 45 developed and emerging market country indices outside the U.S. The Index is denominated in U.S. dollars. The Index returns are net of withholding taxes. They assume daily
16
Performance Update as of October 31, 2016 - Target 2040 Series
(unaudited)
reinvestment of net dividends thus accounting for any applicable dividend taxation. Index returns provided by Bloomberg. BAB and BIAB are both unmanaged, market value-weighted indices of U.S. domestic investment-grade debt issues, including government, corporate, asset-backed and mortgage-backed securities. BAB includes maturities of one year or more; BIAB includes maturities of greater than one year but less than ten years. BAB and BIAB returns provided by Interactive Data. Indices returns do not reflect any fees or expenses. Returns provided are calculated monthly using a blended allocation. Because the target date fund’s asset allocation will vary over time, the composition of the target date portfolio may not match the composition of the comparative Target Composite Benchmark. Mid-month performance is not available for the benchmark. Performance shown is from the first of the month following the corresponding Series’ inception date.
17
Performance Update as of October 31, 2016 - Target 2045 Series
(unaudited)
| AVERAGE ANNUAL TOTAL RETURNS AS OF OCTOBER 31, 2016 | ||||||||
ONE YEAR1 | SINCE INCEPTION2 | |||||||
Manning & Napier Fund, Inc. - Target 2045 - Class K3 | 3.35 | % | 10.09 | % | ||||
Manning & Napier Fund, Inc. - Target 2045 - Class R3 | 3.13 | % | 9.79 | % | ||||
Manning & Napier Fund, Inc. - Target 2045 - Class I3 | 3.67 | % | 10.34 | % | ||||
S&P Target Date 2045 Index4 | 3.52 | % | 10.64 | % | ||||
2045 Composite Benchmark5 | 3.52 | % | 9.64 | % | ||||
The following graph compares the value of a $10,000 investment in the Manning & Napier Fund, Inc. - Target 2045 Series - Class K from its inception2 (6/25/12) to present (10/31/16) to the S&P Target Date 2045 Index and the 2045 Composite Benchmark.
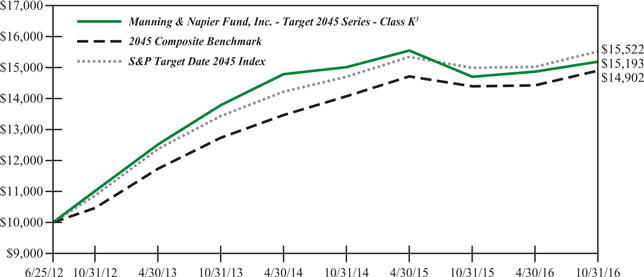
1The returns shown are based on net asset values calculated for shareholder transactions and may differ from the returns shown in the financial highlights, which reflect adjustments made to the net asset values in accordance with accounting principles generally accepted in the United States of America.
2Performance numbers for the Series and the S&P Target Date Index are calculated from June 25, 2012, the Series’ inception date. Performance numbers for the Target Composite Benchmark are calculated from July 1, 2012.
3The Series’ performance does not reflect the deduction of taxes that a shareholder would pay on fund distributions or the redemption of shares. The Series’ performance is historical and may not be indicative of future results. The performance returns shown are inclusive of the net expense ratio of the Series. For the year ended October 31, 2016, this net expense ratio was 0.30% for Class K, 0.55% for Class R and 0.05% for Class I. The gross expense ratio, which does not account for any voluntary or contractual waivers currently in effect, was 1.19% for Class K 1.44% for Class R and 0.94% for Class I for the year ended October 31, 2016.
4The S&P Target Date Index Series is a series of unmanaged indices that reflect the market consensus for asset allocations for different target date horizons. The asset class exposure for each index is represented by exchange traded funds (ETFs). Asset class weights are established annually and rebalanced monthly. Prior to 02/26/2010, the indices were rebalanced annually. The Index returns shown are the Gross Return series, which provide benchmarks free of underlying ETF expenses by adjusting the Total Return series (which assume the reinvestment of dividends) by an assumed weighted average ETF expense ratio. Index returns provided by Bloomberg. S&P Dow Jones Indices LLC, a subsidiary of the McGraw Hill Financial, Inc., is the publisher of various index based data products and services and has licensed certain of its products and services for use by Manning & Napier. Copyright © 2016 by S&P Dow Jones Indices LLC and/or its affiliates. All rights reserved. Neither S&P Dow Jones Indices LLC, Dow Jones Trademark Holdings LLC, their affiliates nor their third party licensors make any representation or warranty, express or implied, as to the ability of any index to accurately represent the asset class or market sector that it purports to represent and none of these parties shall have any liability for any errors, omissions, or interruptions of any index or the data included therein.
5The Target Composite Benchmark represents the performance of the target date fund’s asset classes according to their respective weightings, as adjusted over time to reflect the target date fund’s increasingly conservative asset allocations. The following indices are used to calculate the Target Composite Benchmarks: Russell 3000® Index (Russell 3000), MSCI ACWI ex USA Index (ACWIxUS), and Bloomberg Barclays U.S. Aggregate Bond Index (BAB) and/or Bloomberg Barclays U.S. Intermediate Aggregate Bond Index (BIAB). Russell 3000 is an unmanaged index that consists of 3,000 of the largest U.S. companies based on total market capitalization. Index returns are based on a market capitalization-weighted average of relative price changes of the component stocks plus dividends whose reinvestments are compounded daily. Index returns provided by Bloomberg. ACWIxUS is a free float-adjusted market capitalization index that is designed to measure equity market performance in the global developed and emerging markets and consists of 45
18
Performance Update as of October 31, 2016 - Target 2045 Series
(unaudited)
developed and emerging market country indices outside the U.S. The Index is denominated in U.S. dollars. The Index returns are net of withholding taxes. They assume daily reinvestment of net dividends thus accounting for any applicable dividend taxation. Index returns provided by Bloomberg. BAB and BIAB are both unmanaged, market value-weighted indices of U.S. domestic investment-grade debt issues, including government, corporate, asset-backed and mortgage-backed securities. BAB includes maturities of one year or more; BIAB includes maturities of greater than one year but less than ten years. BAB and BIAB returns provided by Interactive Data. Indices returns do not reflect any fees or expenses. Returns provided are calculated monthly using a blended allocation. Because the target date fund’s asset allocation will vary over time, the composition of the target date portfolio may not match the composition of the comparative Target Composite Benchmark. Mid-month performance is not available for the benchmark. Performance shown is from the first of the month following the corresponding Series’ inception date.
19
Performance Update as of October 31, 2016 - Target 2050 Series
(unaudited)
| AVERAGE ANNUAL TOTAL RETURNS AS OF OCTOBER 31, 2016 | ||||||||||||
| ONE YEAR1 | FIVE YEAR | SINCE INCEPTION2 | ||||||||||
Manning & Napier Fund, Inc. - Target 2050 - Class K3 | 3.54 | % | 8.66 | % | 5.90 | % | ||||||
Manning & Napier Fund, Inc. - Target 2050 - Class R3 | 3.20 | % | 8.36 | % | 5.63 | % | ||||||
Manning & Napier Fund, Inc. - Target 2050 - Class I3 | 3.71 | % | 8.93 | % | 6.17 | % | ||||||
S&P Target Date 2050 Index4 | 3.44 | % | 9.75 | % | 5.89 | % | ||||||
2050 Composite Benchmark5 | 3.52 | % | 9.63 | % | 6.08 | % | ||||||
The following graph compares the value of a $10,000 investment in the Manning & Napier Fund, Inc. - Target 2050 Series - Class K from its inception2 (3/28/08) to present (10/31/16) to the S&P Target Date 2050 Index and the 2050 Composite Benchmark.
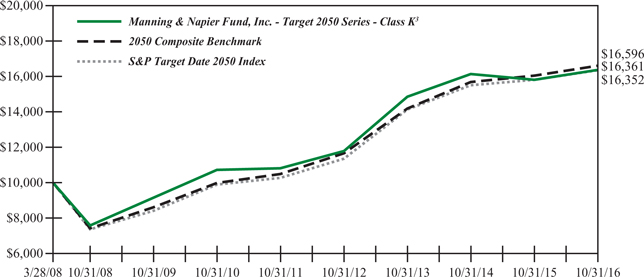
1The returns shown are based on net asset values calculated for shareholder transactions and may differ from the returns shown in the financial highlights, which reflect adjustments made to the net asset values in accordance with accounting principles generally accepted in the United States of America.
2Performance numbers for the Series and the S&P Target Date Index are calculated from March 28, 2008, the Series’ inception date. Performance numbers for the Target Composite Benchmark are calculated from April 1, 2008.
3The Series’ performance does not reflect the deduction of taxes that a shareholder would pay on fund distributions or the redemption of shares. The Series’ performance is historical and may not be indicative of future results. The performance returns shown are inclusive of the net expense ratio of the Series. For the year ended October 31, 2016, this net expense ratio was 0.30% for Class K, 0.55% for Class R and 0.05% for Class I. The gross expense ratio, which does not account for any voluntary or contractual waivers currently in effect, was 0.67% for Class K, 0.92% for Class R and 0.42% for Class I for the year ended October 31, 2016.
4The S&P Target Date Index Series is a series of unmanaged indices that reflect the market consensus for asset allocations for different target date horizons. The asset class exposure for each index is represented by exchange traded funds (ETFs). Asset class weights are established annually and rebalanced monthly. Prior to February 26, 2010, the indices were rebalanced annually. Historical returns for the S&P Target Date 2050 Index prior to May 31, 2011 (the index launch date) are identical to the returns of the S&P Target Date 2045 Index, the closest dated target date index as of the launch date. The Index returns shown are the Gross Return series, which provide benchmarks free of underlying ETF expenses by adjusting the Total Return series (which assume the reinvestment of dividends) by an assumed weighted average ETF expense ratio. Index returns provided by Bloomberg. S&P Dow Jones Indices LLC, a subsidiary of the McGraw Hill Financial, Inc., is the publisher of various index based data products and services and has licensed certain of its products and services for use by Manning & Napier. Copyright © 2016 by S&P Dow Jones Indices LLC and/or its affiliates. All rights reserved. Neither S&P Dow Jones Indices LLC, Dow Jones Trademark Holdings LLC, their affiliates nor their third party licensors make any representation or warranty, express or implied, as to the ability of any index to accurately represent the asset class or market sector that it purports to represent and none of these parties shall have any liability for any errors, omissions, or interruptions of any index or the data included therein.
5The Target Composite Benchmark represents the performance of the target date fund’s asset classes according to their respective weightings, as adjusted over time to reflect the target date fund’s increasingly conservative asset allocations. The following indices are used to calculate the Target Composite Benchmarks: Russell 3000® Index (Russell 3000), MSCI ACWI ex USA Index (ACWIxUS), and Bloomberg Barclays U.S. Aggregate Bond Index (BAB) and/or Bloomberg Barclays U.S. Intermediate Aggregate Bond Index (BIAB). Russell 3000 is an unmanaged index that consists of 3,000 of the largest U.S. companies based on total market capitalization. Index returns are based on a market capitalization-weighted average of relative price changes of the component stocks plus dividends whose reinvestments are compounded daily. Index returns provided by Bloomberg. ACWIxUS is a free float-adjusted market capitalization index that is designed to measure equity market performance in the global developed and emerging markets and consists of 45 developed and emerging market country indices outside the U.S. The Index is denominated in U.S. dollars. The Index returns are net of withholding taxes. They assume daily
20
Performance Update as of October 31, 2016 - Target 2050 Series
(unaudited)
reinvestment of net dividends thus accounting for any applicable dividend taxation. Index returns provided by Bloomberg. BAB and BIAB are both unmanaged, market value-weighted indices of U.S. domestic investment-grade debt issues, including government, corporate, asset-backed and mortgage-backed securities. BAB includes maturities of one year or more; BIAB includes maturities of greater than one year but less than ten years. BAB and BIAB returns provided by Interactive Data. Indices returns do not reflect any fees or expenses. Returns provided are calculated monthly using a blended allocation. Because the target date fund’s asset allocation will vary over time, the composition of the target date portfolio may not match the composition of the comparative Target Composite Benchmark. Mid-month performance is not available for the benchmark. Performance shown is from the first of the month following the corresponding Series’ inception date.
21
Performance Update as of October 31, 2016 - Target 2055 Series
(unaudited)
| AVERAGE ANNUAL TOTAL RETURNS AS OF OCTOBER 31, 2016 | ||||||||
ONE YEAR1 | SINCE INCEPTION2 | |||||||
Manning & Napier Fund, Inc. - Target 2055 - Class K3 | 3.56 | % | 10.24 | % | ||||
Manning & Napier Fund, Inc. - Target 2055 - Class R3 | 3.27 | % | 9.85 | % | ||||
Manning & Napier Fund, Inc. - Target 2055 - Class I3 | 3.78 | % | 10.61 | % | ||||
S&P Target Date 2055 Index4 | 3.40 | % | 11.13 | % | ||||
2055 Composite Benchmark5 | 3.52 | % | 9.64 | % | ||||
The following graph compares the value of a $10,000 investment in the Manning & Napier Fund, Inc. - Target 2055 Series - Class K from its inception2 (6/25/12) to present (10/31/16) to the S&P Target Date 2055 Index and the 2055 Composite Benchmark.
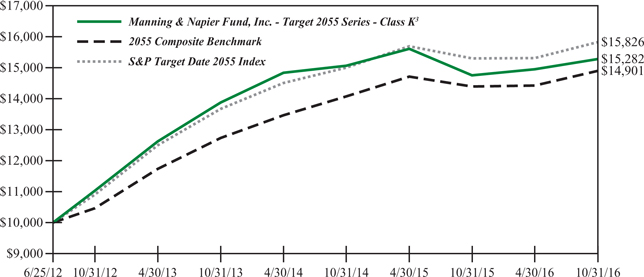
1The returns shown are based on net asset values calculated for shareholder transactions and may differ from the returns shown in the financial highlights, which reflect adjustments made to the net asset values in accordance with accounting principles generally accepted in the United States of America.
2Performance numbers for the Series and the S&P Target Date Index are calculated from June 25, 2012, the Series’ inception date. Performance numbers for the Target Composite Benchmark are calculated from July 1, 2012.
3The Series’ performance does not reflect the deduction of taxes that a shareholder would pay on fund distributions or the redemption of shares. The Series’ performance is historical and may not be indicative of future results. The performance returns shown are inclusive of the net expense ratio of the Series. For the year ended October 31, 2016, this net expense ratio was 0.30% for Class K, 0.55% for Class R and 0.05% for Class I. The gross expense ratio, which does not account for any voluntary or contractual waivers currently in effect, was 2.74% for Class K, 2.99% for Class R and 2.49% for Class I for the year ended October 31, 2016.
4The S&P Target Date Index Series is a series of unmanaged indices that reflect the market consensus for asset allocations for different target date horizons. The asset class exposure for each index is represented by exchange traded funds (ETFs). Asset class weights are established annually and rebalanced monthly. Prior to 02/26/2010, the indices were rebalanced annually. The Index returns shown are the Gross Return series, which provide benchmarks free of underlying ETF expenses by adjusting the Total Return series (which assume the reinvestment of dividends) by an assumed weighted average ETF expense ratio. Index returns provided by Bloomberg. S&P Dow Jones Indices LLC, a subsidiary of the McGraw Hill Financial, Inc., is the publisher of various index based data products and services and has licensed certain of its products and services for use by Manning & Napier. Copyright © 2016 by S&P Dow Jones Indices LLC and/or its affiliates. All rights reserved. Neither S&P Dow Jones Indices LLC, Dow Jones Trademark Holdings LLC, their affiliates nor their third party licensors make any representation or warranty, express or implied, as to the ability of any index to accurately represent the asset class or market sector that it purports to represent and none of these parties shall have any liability for any errors, omissions, or interruptions of any index or the data included therein.
5The Target Composite Benchmark represents the performance of the target date fund’s asset classes according to their respective weightings, as adjusted over time to reflect the target date fund’s increasingly conservative asset allocations. The following indices are used to calculate the Target Composite Benchmarks: Russell 3000® Index (Russell 3000), MSCI ACWI ex USA Index (ACWIxUS), and Bloomberg Barclays U.S. Aggregate Bond Index (BAB) and/or Bloomberg Barclays U.S. Intermediate Aggregate Bond Index (BIAB). Russell 3000 is an unmanaged index that consists of 3,000 of the largest U.S. companies based on total market capitalization. Index returns are based on a market capitalization-weighted average of relative price changes of the component stocks plus dividends whose reinvestments are compounded daily. Index returns provided by Bloomberg. ACWIxUS is a free float-adjusted market capitalization index that is designed to measure equity market performance in the global developed and emerging markets and consists of 45
22
Performance Update as of October 31, 2016 - Target 2055 Series
(unaudited)
developed and emerging market country indices outside the U.S. The Index is denominated in U.S. dollars. The Index returns are net of withholding taxes. They assume daily reinvestment of net dividends thus accounting for any applicable dividend taxation. Index returns provided by Bloomberg. BAB and BIAB are both unmanaged, market value-weighted indices of U.S. domestic investment-grade debt issues, including government, corporate, asset-backed and mortgage-backed securities. BAB includes maturities of one year or more; BIAB includes maturities of greater than one year but less than ten years. BAB and BIAB returns provided by Interactive Data. Indices returns do not reflect any fees or expenses. Returns provided are calculated monthly using a blended allocation. Because the target date fund’s asset allocation will vary over time, the composition of the target date portfolio may not match the composition of the comparative Target Composite Benchmark. Mid-month performance is not available for the benchmark. Performance shown is from the first of the month following the corresponding Series’ inception date.
23
Performance Update as of October 31, 2016 - Target 2060 Series
(unaudited)
| AVERAGE ANNUAL TOTAL RETURNS AS OF OCTOBER 31, 2016 | ||||||||
ONE YEAR1 | SINCE INCEPTION2 | |||||||
Manning & Napier Fund, Inc. - Target 2060 - Class K3 | 3.54 | % | 6.53 | % | ||||
Manning & Napier Fund, Inc. - Target 2060 - Class R3 | 3.26 | % | 6.26 | % | ||||
Manning & Napier Fund, Inc. - Target 2060 - Class I3 | 3.81 | % | 6.77 | % | ||||
S&P Target Date 2055+ Index4 | 3.40 | % | 6.85 | % | ||||
2060 Composite Benchmark5 | 3.52 | % | 9.39 | % | ||||
The following graph compares the value of a $10,000 investment in the Manning & Napier Fund, Inc. - Target 2060 Series - Class K from its inception2 (9/21/15) to present (10/31/16) to the S&P Target Date 2055+ Index and the 2060 Composite Benchmark.
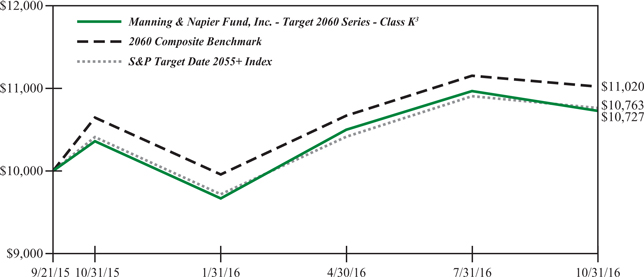
1The returns shown are based on net asset values calculated for shareholder transactions and may differ from the returns shown in the financial highlights, which reflect adjustments made to the net asset values in accordance with accounting principles generally accepted in the United States of America.
2Performance numbers for the Series and the S&P Target Date Index are calculated from September 21, 2015, the Series’ inception date. Performance numbers for the Target Composite Benchmark are calculated from October 1, 2015.
3The Series’ performance does not reflect the deduction of taxes that a shareholder would pay on fund distributions or the redemption of shares. The Series’ performance is historical and may not be indicative of future results. The performance returns shown are inclusive of the net expense ratio of the Series. For the year ended October 31, 2016, this annualized net expense ratio was 0.30% for Class K, 0.55% for Class R and 0.05% for Class I. The annualized gross expense ratio, which does not account for any voluntary or contractual waivers currently in effect, was 9.67% for Class K, 9.92% for Class R and 9.42% for Class I for the year ended October 31, 2016.
4The S&P Target Date Index Series is a series of unmanaged indices that reflect the market consensus for asset allocations for different target date horizons. The asset class exposure for each index is represented by exchange traded funds (ETFs). Asset class weights are established annually and rebalanced monthly. Prior to 02/26/2010, the indices were rebalanced annually. The Index returns shown are the Gross Return series, which provide benchmarks free of underlying ETF expenses by adjusting the Total Return series (which assume the reinvestment of dividends) by an assumed weighted average ETF expense ratio. Index returns provided by Bloomberg. S&P Dow Jones Indices LLC, a subsidiary of the McGraw Hill Financial, Inc., is the publisher of various index based data products and services and has licensed certain of its products and services for use by Manning & Napier. Copyright © 2016 by S&P Dow Jones Indices LLC and/or its affiliates. All rights reserved. Neither S&P Dow Jones Indices LLC, Dow Jones Trademark Holdings LLC, their affiliates nor their third party licensors make any representation or warranty, express or implied, as to the ability of any index to accurately represent the asset class or market sector that it purports to represent and none of these parties shall have any liability for any errors, omissions, or interruptions of any index or the data included therein.
5The Target Composite Benchmark represents the performance of the target date fund’s asset classes according to their respective weightings, as adjusted over time to reflect the target date fund’s increasingly conservative asset allocations. The following indices are used to calculate the Target Composite Benchmarks: Russell 3000® Index (Russell 3000), MSCI ACWI ex USA Index (ACWIxUS), and Bloomberg Barclays U.S. Aggregate Bond Index (BAB) and/or Bloomberg Barclays U.S. Intermediate Aggregate Bond Index (BIAB). Russell 3000 is an unmanaged index that consists of 3,000 of the largest U.S. companies based on total market capitalization. Index returns are based on a market capitalization-weighted average of relative price changes of the component stocks plus dividends whose reinvestments are compounded daily. Index returns provided by Bloomberg. ACWIxUS is a free float-adjusted market capitalization index that is designed to measure equity market performance in the global developed and emerging markets and consists of 45
24
Performance Update as of October 31, 2016 - Target 2060 Series
(unaudited)
developed and emerging market country indices outside the U.S. The Index is denominated in U.S. dollars. The Index returns are net of withholding taxes. They assume daily reinvestment of net dividends thus accounting for any applicable dividend taxation. Index returns provided by Bloomberg. BAB and BIAB are both unmanaged, market value-weighted indices of U.S. domestic investment-grade debt issues, including government, corporate, asset-backed and mortgage-backed securities. BAB includes maturities of one year or more; BIAB includes maturities of greater than one year but less than ten years. BAB and BIAB returns provided by Interactive Data. Indices returns do not reflect any fees or expenses. Returns provided are calculated monthly using a blended allocation. Because the target date fund’s asset allocation will vary over time, the composition of the target date portfolio may not match the composition of the comparative Target Composite Benchmark. Mid-month performance is not available for the benchmark. Performance shown is from the first of the month following the corresponding Series’ inception date.
25
Shareholder Expense Example
(unaudited)
As a shareholder of the Series, you incur ongoing costs, including management fees, shareholder service fees and other Series expenses. This example is intended to help you understand your ongoing costs (in dollars) of investing in the Series and to compare these costs with the ongoing costs of investing in other mutual funds.
The example is based on an investment of $1,000 invested at the beginning of the period and held for the entire period (May 1, 2016 to October 31, 2016).
Actual Expenses
The Actual lines of the tables below provide information about actual account values and actual expenses. You may use the information in these lines, together with the amount you invested, to estimate the expenses that you paid over the period. Simply divide your account value by $1,000 (for example, an $8,600 account value divided by $1,000 = 8.6), then multiply the result by the number in the Actual line for the Series and Class in which you have invested under the heading entitled “Expenses Paid During Period” to estimate the expenses you paid on your account during this period.
Hypothetical Example for Comparison Purposes
The Hypothetical lines of the tables below provide information about hypothetical account values and hypothetical expenses based on the Class’ actual expense ratio and an assumed rate of return of 5% per year before expenses, which is not the Class’ actual return. The hypothetical account values and expenses may not be used to estimate the actual ending account balance or expenses you paid during the period. You may use this information to compare the ongoing costs of investing in a Class of the Series and other funds. To do so, compare this 5% hypothetical example for the Series and Class in which you have invested with the 5% hypothetical examples that appear in the shareholder reports of the other funds.
Please note that the expenses shown in the tables are meant to highlight your ongoing costs only and do not reflect any transaction costs, such as sales charges (loads), redemption fees, or exchange fees that you may incur in other mutual funds. Therefore, the Hypothetical lines of the tables are useful in comparing ongoing costs only, and will not help you determine the relative total costs of owning different funds.
| BEGINNING ACCOUNT VALUE 5/1/16 | ENDING ACCOUNT VALUE 10/31/16 | EXPENSES PAID DURING PERIOD 5/1/16-10/31/161 | ANNUALIZED EXPENSE RATIO2 | |||||
Target Income | ||||||||
Actual (Class K) | $1,000.00 | $1,021.00 | $1.52 | 0.30% | ||||
Hypothetical3 | $1,000.00 | $1,023.63 | $1.53 | 0.30% | ||||
Actual (Class R) | $1,000.00 | $1,018.60 | $2.79 | 0.55% | ||||
Hypothetical3 | $1,000.00 | $1,022.37 | $2.80 | 0.55% | ||||
Actual (Class I) | $1,000.00 | $1,020.90 | $0.25 | 0.05% | ||||
Hypothetical3 | $1,000.00 | $1,024.89 | $0.25 | 0.05% | ||||
| BEGINNING ACCOUNT VALUE 5/1/16 | ENDING ACCOUNT VALUE 10/31/16 | EXPENSES PAID DURING PERIOD 5/1/16-10/31/161 | ANNUALIZED EXPENSE RATIO2 | |||||
Target 2015 | ||||||||
Actual (Class K) | $1,000.00 | $1,022.80 | $1.53 | 0.30% | ||||
Hypothetical3 | $1,000.00 | $1,023.63 | $1.53 | 0.30% | ||||
Actual (Class R) | $1,000.00 | $1,021.60 | $2.79 | 0.55% | ||||
Hypothetical3 | $1,000.00 | $1,022.37 | $2.80 | 0.55% | ||||
Actual (Class I) | $1,000.00 | $1,024.80 | $0.25 | 0.05% | ||||
Hypothetical3 | $1,000.00 | $1,024.89 | $0.25 | 0.05% | ||||
26
Shareholder Expense Example
(unaudited)
| BEGINNING ACCOUNT VALUE 5/1/16 | ENDING ACCOUNT VALUE 10/31/16 | EXPENSES PAID DURING PERIOD 5/1/16-10/31/161 | ANNUALIZED EXPENSE RATIO2 | |||||
Target 2020 | ||||||||
Actual (Class K) | $1,000.00 | $1,024.30 | $1.53 | 0.30% | ||||
Hypothetical3 | $1,000.00 | $1,023.63 | $1.53 | 0.30% | ||||
Actual (Class R) | $1,000.00 | $1,023.30 | $2.80 | 0.55% | ||||
Hypothetical3 | $1,000.00 | $1,022.37 | $2.80 | 0.55% | ||||
Actual (Class I) | $1,000.00 | $1,025.30 | $0.25 | 0.05% | ||||
Hypothetical3 | $1,000.00 | $1,024.89 | $0.25 | 0.05% | ||||
| BEGINNING ACCOUNT VALUE 5/1/16 | ENDING ACCOUNT VALUE 10/31/16 | EXPENSES PAID DURING PERIOD 5/1/16-10/31/161 | ANNUALIZED EXPENSE RATIO2 | |||||
Target 2025 | ||||||||
Actual (Class K) | $1,000.00 | $1,027.30 | $1.53 | 0.30% | ||||
Hypothetical3 | $1,000.00 | $1,023.63 | $1.53 | 0.30% | ||||
Actual (Class R) | $1,000.00 | $1,026.10 | $2.80 | 0.55% | ||||
Hypothetical3 | $1,000.00 | $1,022.37 | $2.80 | 0.55% | ||||
Actual (Class I) | $1,000.00 | $1,028.40 | $0.25 | 0.05% | ||||
Hypothetical3 | $1,000.00 | $1,024.89 | $0.25 | 0.05% | ||||
| BEGINNING ACCOUNT VALUE 5/1/16 | ENDING ACCOUNT VALUE 10/31/16 | EXPENSES PAID DURING PERIOD 5/1/16-10/31/161 | ANNUALIZED EXPENSE RATIO2 | |||||
Target 2030 | ||||||||
Actual (Class K) | $1,000.00 | $1,026.90 | $1.53 | 0.30% | ||||
Hypothetical3 | $1,000.00 | $1,023.63 | $1.53 | 0.30% | ||||
Actual (Class R) | $1,000.00 | $1,024.70 | $2.80 | 0.55% | ||||
Hypothetical3 | $1,000.00 | $1,022.37 | $2.80 | 0.55% | ||||
Actual (Class I) | $1,000.00 | $1,027.70 | $0.25 | 0.05% | ||||
Hypothetical3 | $1,000.00 | $1,024.89 | $0.25 | 0.05% | ||||
27
Shareholder Expense Example
(unaudited)
| BEGINNING ACCOUNT VALUE 5/1/16 | ENDING ACCOUNT VALUE 10/31/16 | EXPENSES PAID DURING PERIOD 5/1/16-10/31/161 | ANNUALIZED EXPENSE RATIO2 | |||||
Target 2035 | ||||||||
Actual (Class K) | $1,000.00 | $1,024.10 | $1.53 | 0.30% | ||||
Hypothetical3 | $1,000.00 | $1,023.63 | $1.53 | 0.30% | ||||
Actual (Class R) | $1,000.00 | $1,023.80 | $2.80 | 0.55% | ||||
Hypothetical3 | $1,000.00 | $1,022.37 | $2.80 | 0.55% | ||||
Actual (Class I) | $1,000.00 | $1,026.00 | $0.25 | 0.05% | ||||
Hypothetical3 | $1,000.00 | $1,024.89 | $0.25 | 0.05% | ||||
| BEGINNING ACCOUNT VALUE 5/1/16 | ENDING ACCOUNT VALUE 10/31/16 | EXPENSES PAID DURING PERIOD 5/1/16-10/31/161 | ANNUALIZED EXPENSE RATIO2 | |||||
Target 2040 | ||||||||
Actual (Class K) | $1,000.00 | $1,023.30 | $1.53 | 0.30% | ||||
Hypothetical3 | $1,000.00 | $1,023.63 | $1.53 | 0.30% | ||||
Actual (Class R) | $1,000.00 | $1,021.20 | $2.79 | 0.55% | ||||
Hypothetical3 | $1,000.00 | $1,022.37 | $2.80 | 0.55% | ||||
Actual (Class I) | $1,000.00 | $1,025.40 | $0.25 | 0.05% | ||||
Hypothetical3 | $1,000.00 | $1,024.89 | $0.25 | 0.05% | ||||
| BEGINNING ACCOUNT VALUE 5/1/16 | ENDING ACCOUNT VALUE 10/31/16 | EXPENSES PAID DURING PERIOD 5/1/16-10/31/161 | ANNUALIZED EXPENSE RATIO2 | |||||
Target 2045 | ||||||||
Actual (Class K) | $1,000.00 | $1,020.90 | $1.52 | 0.30% | ||||
Hypothetical3 | $1,000.00 | $1,023.63 | $1.53 | 0.30% | ||||
Actual (Class R) | $1,000.00 | $1,020.20 | $2.79 | 0.55% | ||||
Hypothetical3 | $1,000.00 | $1,022.37 | $2.80 | 0.55% | ||||
Actual (Class I) | $1,000.00 | $1,021.70 | $0.25 | 0.05% | ||||
Hypothetical3 | $1,000.00 | $1,024.89 | $0.25 | 0.05% | ||||
28
Shareholder Expense Example
(unaudited)
| BEGINNING ACCOUNT VALUE 5/1/16 | ENDING ACCOUNT VALUE 10/31/16 | EXPENSES PAID DURING PERIOD 5/1/16-10/31/161 | ANNUALIZED EXPENSE RATIO2 | |||||
Target 2050 | ||||||||
Actual (Class K) | $1,000.00 | $1,021.30 | $1.52 | 0.30% | ||||
Hypothetical3 | $1,000.00 | $1,023.63 | $1.53 | 0.30% | ||||
Actual (Class R) | $1,000.00 | $1,018.60 | $2.79 | 0.55% | ||||
Hypothetical3 | $1,000.00 | $1,022.37 | $2.80 | 0.55% | ||||
Actual (Class I) | $1,000.00 | $1,022.30 | $0.25 | 0.05% | ||||
Hypothetical3 | $1,000.00 | $1,024.89 | $0.25 | 0.05% | ||||
| BEGINNING ACCOUNT VALUE 5/1/16 | ENDING ACCOUNT VALUE 10/31/16 | EXPENSES PAID DURING PERIOD 5/1/16-10/31/161 | ANNUALIZED EXPENSE RATIO2 | |||||
Target 2055 | ||||||||
Actual (Class K) | $1,000.00 | $1,020.00 | $1.52 | 0.30% | ||||
Hypothetical3 | $1,000.00 | $1,023.63 | $1.53 | 0.30% | ||||
Actual (Class R) | $1,000.00 | $1,019.40 | $2.79 | 0.55% | ||||
Hypothetical3 | $1,000.00 | $1,022.37 | $2.80 | 0.55% | ||||
Actual (Class I) | $1,000.00 | $1,021.60 | $0.25 | 0.05% | ||||
Hypothetical3 | $1,000.00 | $1,024.89 | $0.25 | 0.05% | ||||
| BEGINNING ACCOUNT VALUE 5/1/16 | ENDING ACCOUNT VALUE 10/31/16 | EXPENSES PAID DURING PERIOD 5/1/16-10/31/161 | ANNUALIZED EXPENSE RATIO2 | |||||
Target 2060 | ||||||||
Actual (Class K) | $1,000.00 | $1,020.70 | $1.52 | 0.30% | ||||
Hypothetical3 | $1,000.00 | $1,023.63 | $1.53 | 0.30% | ||||
Actual (Class R) | $1,000.00 | $1,019.40 | $2.79 | 0.55% | ||||
Hypothetical3 | $1,000.00 | $1,022.37 | $2.80 | 0.55% | ||||
Actual (Class I) | $1,000.00 | $1,022.50 | $0.25 | 0.05% | ||||
Hypothetical3 | $1,000.00 | $1,024.89 | $0.25 | 0.05% | ||||
1Expenses are equal to the Class’ annualized expense ratio (for the six-month period), multiplied by the average account value over the period, multiplied by 184/366 (to reflect the one-half year period). Expenses are based on the most recent fiscal half year; therefore, the expense ratios stated above may differ from the expense ratios stated in the financial highlights, which are based on one-year data. The Class’ total returns would have been lower had certain expenses not been reimbursed during the period.
2Expense ratios of the Class do not include fees and expenses indirectly incurred by the underlying funds. If these expenses were included, the expense ratios would have been higher.
3Assumes 5% annual return before expenses.
29
Portfolio Composition as of October 31, 2016 - Asset Allocation1
(unaudited)
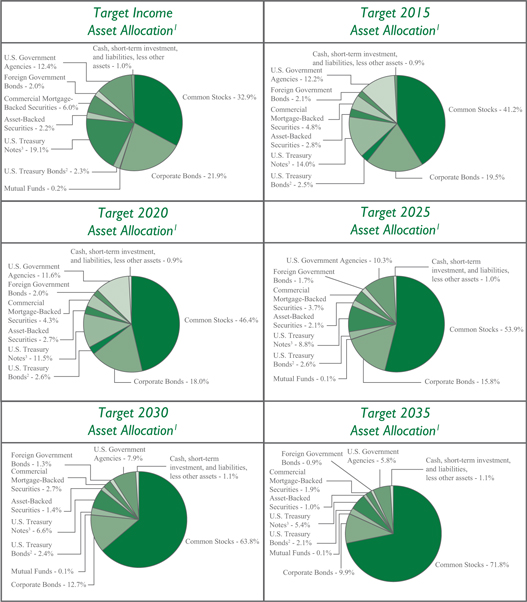
1 Represents portfolio composition of the underlying investment(s) for each Series as a percentage of net assets.
2 A U.S. Treasury Bond is a long-term obligation of the U.S. Treasury issued with a maturity period of more than ten years.
3 A U.S. Treasury Note is an intermediate-term obligation of the U.S. Treasury issued with a maturity period between one and ten years.
30
Portfolio Composition as of October 31, 2016 - Asset Allocation1
(unaudited)
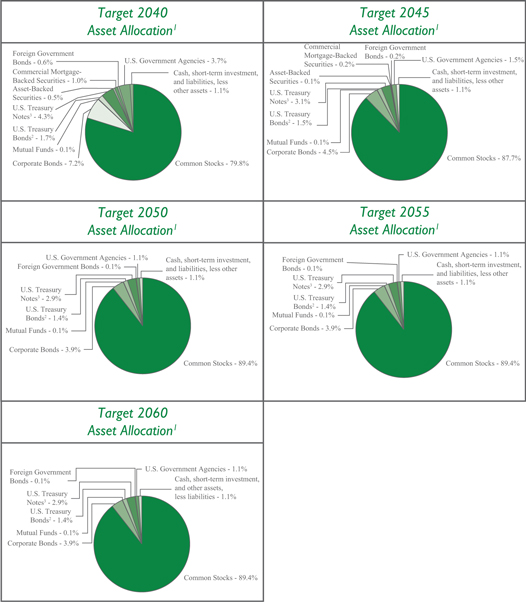
1 Represents portfolio composition of the underlying investment(s) for each Series as a percentage of net assets.
2 A U.S. Treasury Bond is a long-term obligation of the U.S. Treasury issued with a maturity period of more than ten years.
3 A U.S. Treasury Note is an intermediate-term obligation of the U.S. Treasury issued with a maturity period between one and ten years.
31
Investment Portfolios - October 31, 2016
| TARGET INCOME SERIES | SHARES | VALUE (NOTE 2) | ||||||||||
AFFILIATED INVESTMENT COMPANIES - 100.0% | ||||||||||||
Manning & Napier Pro-Blend® Conservative Term Series - Class I | 7,537,283 | $ | 77,860,136 | |||||||||
|
| |||||||||||
TOTAL AFFILIATED INVESTMENT COMPANIES | ||||||||||||
(Identified Cost $80,606,324) | 77,860,136 | |||||||||||
LIABILITIES, LESS OTHER ASSETS - 0.0%* | (34,492 | ) | ||||||||||
|
| |||||||||||
NET ASSETS - 100% | $ | 77,825,644 | ||||||||||
|
| |||||||||||
*Less than (0.1%) | ||||||||||||
| TARGET 2015 SERIES | SHARES | VALUE (NOTE 2) | ||||||||||
AFFILIATED INVESTMENT COMPANIES - 100.2% | ||||||||||||
Manning & Napier Pro-Blend® Conservative Term Series - Class I | 144,444 | $ | 1,492,103 | |||||||||
Manning & Napier Pro-Blend® Moderate Term Series - Class I | 515,055 | 5,253,558 | ||||||||||
|
| |||||||||||
TOTAL AFFILIATED INVESTMENT COMPANIES | ||||||||||||
(Identified Cost $6,641,936) | 6,745,661 | |||||||||||
LIABILITIES, LESS OTHER ASSETS - (0.2%) | (12,547 | ) | ||||||||||
|
| |||||||||||
NET ASSETS - 100% | $ | 6,733,114 | ||||||||||
|
| |||||||||||
| TARGET 2020 SERIES | SHARES | VALUE (NOTE 2) | ||||||||||
AFFILIATED INVESTMENT COMPANIES - 100.0% | ||||||||||||
Manning & Napier Pro-Blend® Extended Term Series - Class I | 2,717,295 | $25,895,822 | ||||||||||
Manning & Napier Pro-Blend® Moderate Term Series - Class I | 10,209,906 | 104,141,036 | ||||||||||
|
| |||||||||||
TOTAL AFFILIATED INVESTMENT COMPANIES | ||||||||||||
(Identified Cost $133,543,318) | 130,036,858 | |||||||||||
LIABILITIES, LESS OTHER ASSETS - 0.0%* | (54,044 | ) | ||||||||||
|
| |||||||||||
NET ASSETS - 100% | $ | 129,982,814 | ||||||||||
|
| |||||||||||
*Less than (0.1%) | ||||||||||||
The accompanying notes are an integral part of the financial statements.
32
Investment Portfolios - October 31, 2016
| TARGET 2025 SERIES | SHARES | VALUE (NOTE 2) | ||||||
AFFILIATED INVESTMENT COMPANIES - 100.1% | ||||||||
Manning & Napier Pro-Blend® Extended Term Series - Class I | 2,367,550 | $ | 22,562,748 | |||||
Manning & Napier Pro-Blend® Moderate Term Series - Class I | 773,846 | 7,893,230 | ||||||
|
| |||||||
TOTAL AFFILIATED INVESTMENT COMPANIES | ||||||||
(Identified Cost $30,030,823) | 30,455,978 | |||||||
LIABILITIES, LESS OTHER ASSETS - (0.1%) | (20,845 | ) | ||||||
|
| |||||||
NET ASSETS - 100% | $ | 30,435,133 | ||||||
|
| |||||||
| TARGET 2030 SERIES | SHARES | VALUE (NOTE 2) | ||||||
AFFILIATED INVESTMENT COMPANIES - 100.0% | ||||||||
Manning & Napier Pro-Blend® Extended Term Series - Class I | 11,875,160 | $ | 113,170,271 | |||||
Manning & Napier Pro-Blend® Maximum Term Series - Class I | 2,727,985 | 27,798,164 | ||||||
|
| |||||||
TOTAL AFFILIATED INVESTMENT COMPANIES | ||||||||
(Identified Cost $147,947,137) | 140,968,435 | |||||||
LIABILITIES, LESS OTHER ASSETS - 0.0%* | (58,377 | ) | ||||||
|
| |||||||
NET ASSETS - 100% | $ | 140,910,058 | ||||||
|
| |||||||
*Less than (0.1%). | ||||||||
| TARGET 2035 SERIES | SHARES | VALUE (NOTE 2) | ||||||
AFFILIATED INVESTMENT COMPANIES - 100.1% | ||||||||
Manning & Napier Pro-Blend® Extended Term Series - Class I | 1,463,934 | $ | 13,951,289 | |||||
Manning & Napier Pro-Blend® Maximum Term Series - Class I | 1,111,608 | 11,327,290 | ||||||
|
| |||||||
TOTAL AFFILIATED INVESTMENT COMPANIES | ||||||||
(Identified Cost $26,479,452) | 25,278,579 | |||||||
LIABILITIES, LESS OTHER ASSETS - (0.1%) | (21,900 | ) | ||||||
|
| |||||||
NET ASSETS - 100% | $ | 25,256,679 | ||||||
|
| |||||||
The accompanying notes are an integral part of the financial statements.
33
Investment Portfolios - October 31, 2016
| TARGET 2040 SERIES | SHARES | VALUE (NOTE 2) | ||||||
AFFILIATED INVESTMENT COMPANIES - 100.0% | ||||||||
Manning & Napier Pro-Blend® Extended Term Series - Class I | 2,804,358 | $ | 26,725,527 | |||||
Manning & Napier Pro-Blend® Maximum Term Series - Class I | 6,063,335 | 61,785,384 | ||||||
|
| |||||||
TOTAL AFFILIATED INVESTMENT COMPANIES | ||||||||
(Identified Cost $91,126,618) | 88,510,911 | |||||||
LIABILITIES, LESS OTHER ASSETS - 0.0%* | (42,735 | ) | ||||||
|
| |||||||
NET ASSETS - 100% | $ | 88,468,176 | ||||||
|
| |||||||
*Less than (0.1%). | ||||||||
| TARGET 2045 SERIES | SHARES | VALUE (NOTE 2) | ||||||
AFFILIATED INVESTMENT COMPANIES - 100.1% | ||||||||
Manning & Napier Pro-Blend® Extended Term Series - Class I | 75,928 | $ | 723,592 | |||||
Manning & Napier Pro-Blend® Maximum Term Series - Class I | 1,311,801 | 13,367,251 | ||||||
|
| |||||||
TOTAL AFFILIATED INVESTMENT COMPANIES | ||||||||
(Identified Cost $14,200,764) | 14,090,843 | |||||||
LIABILITIES, LESS OTHER ASSETS - (0.1%) | (18,512 | ) | ||||||
|
| |||||||
NET ASSETS - 100% | $ | 14,072,331 | ||||||
|
| |||||||
| TARGET 2050 SERIES | SHARES | VALUE (NOTE 2) | ||||||
AFFILIATED INVESTMENT COMPANIES - 100.1% | ||||||||
Manning & Napier Pro-Blend® Maximum Term Series - Class I | 2,969,672 | $ | 30,260,955 | |||||
|
| |||||||
TOTAL AFFILIATED INVESTMENT COMPANIES | ||||||||
(Identified Cost $29,875,492) | 30,260,955 | |||||||
LIABILITIES, LESS OTHER ASSETS - (0.1%) | (26,311 | ) | ||||||
|
| |||||||
NET ASSETS - 100% | $ | 30,234,644 | ||||||
|
| |||||||
The accompanying notes are an integral part of the financial statements.
34
Investment Portfolios - October 31, 2016
| TARGET 2055 SERIES | SHARES | VALUE (NOTE 2) | ||||||
AFFILIATED INVESTMENT COMPANIES - 100.3% | ||||||||
Manning & Napier Pro-Blend® Maximum Term Series - Class I | 559,224 | $ | 5,698,492 | |||||
|
| |||||||
TOTAL AFFILIATED INVESTMENT COMPANIES | ||||||||
(Identified Cost $5,630,152) | 5,698,492 | |||||||
LIABILITIES, LESS OTHER ASSETS - (0.3%) | (16,975 | ) | ||||||
|
| |||||||
NET ASSETS - 100% | $ | 5,681,517 | ||||||
|
| |||||||
| TARGET 2060 SERIES | SHARES | VALUE (NOTE 2) | ||||||
AFFILIATED INVESTMENT COMPANIES - 99.4% | ||||||||
Manning & Napier Pro-Blend® Maximum Term Series - Class I | 160,382 | $ | 1,634,290 | |||||
|
| |||||||
TOTAL AFFILIATED INVESTMENT COMPANIES | ||||||||
(Identified Cost $1,512,183) | 1,634,290 | |||||||
OTHER ASSETS, LESS LIABILITIES - 0.6% | 10,017 | |||||||
|
| |||||||
NET ASSETS - 100% | $ | 1,644,307 | ||||||
|
| |||||||
The accompanying notes are an integral part of the financial statements.
35
Statements of Assets and Liabilities
October 31, 2016
| TARGET INCOME | TARGET 2015 | TARGET 2020 | TARGET 2025 | TARGET 2030 | ||||||||||||||||
ASSETS: | ||||||||||||||||||||
Total investments in Underlying Series: | ||||||||||||||||||||
At value* | $ | 77,860,136 | $ | 6,745,661 | $ | 130,036,858 | $ | 30,455,978 | $ | 140,968,435 | ||||||||||
Receivable from Advisor (Note 3) | 499 | 1,601 | — | — | — | |||||||||||||||
Receivable for shares of Underlying Series sold | 9,771 | 294,454 | 3,130 | 4,714 | — | |||||||||||||||
Receivable for fund shares sold | 1,829 | 8,931 | 61,757 | 1,663 | 45,571 | |||||||||||||||
Prepaid expenses | 9,142 | 14,543 | 9,218 | 14,736 | 9,247 | |||||||||||||||
|
|
|
|
|
|
|
|
|
| |||||||||||
TOTAL ASSETS | 77,881,377 | 7,065,190 | 130,110,963 | 30,477,091 | 141,023,253 | |||||||||||||||
|
|
|
|
|
|
|
|
|
| |||||||||||
LIABILITIES: | ||||||||||||||||||||
Accrued distribution and service (Rule 12b-1) fees (Note 3) | 14,192 | 1,061 | 19,030 | 3,719 | 20,338 | |||||||||||||||
Accrued management fees (Note 3) | — | — | 11,588 | 3,892 | 11,657 | |||||||||||||||
Accrued fund accounting and administration fees (Note 3) | 8,481 | 8,372 | 8,317 | 8,340 | 8,390 | |||||||||||||||
Accrued transfer agent fees (Note 3) | 717 | 234 | 738 | 337 | 1,480 | |||||||||||||||
Accrued Chief Compliance Officer service fees (Note 3) | 353 | 353 | 353 | 353 | 353 | |||||||||||||||
Accrued Directors’ fees (Note 3) | 37 | 5 | 55 | 14 | 57 | |||||||||||||||
Audit fees payable | 15,860 | 15,794 | 15,802 | 15,795 | 15,802 | |||||||||||||||
Payable for fund shares repurchased | 11,600 | 303,337 | 64,386 | 5,849 | 841 | |||||||||||||||
Custodian fees payable | 2,273 | 2,134 | 4,105 | 2,512 | 4,175 | |||||||||||||||
Payable for shares of Underlying Series purchased | — | — | — | — | 43,656 | |||||||||||||||
Accrued printing and postage | 1,998 | 566 | 3,561 | 941 | 6,233 | |||||||||||||||
Other payables and accrued expenses | 222 | 220 | 214 | 206 | 213 | |||||||||||||||
|
|
|
|
|
|
|
|
|
| |||||||||||
TOTAL LIABILITIES | 55,733 | 332,076 | 128,149 | 41,958 | 113,195 | |||||||||||||||
|
|
|
|
|
|
|
|
|
| |||||||||||
TOTAL NET ASSETS | $ | 77,825,644 | $ | 6,733,114 | $ | 129,982,814 | $ | 30,435,133 | $ | 140,910,058 | ||||||||||
|
|
|
|
|
|
|
|
|
| |||||||||||
NET ASSETS CONSIST OF: | ||||||||||||||||||||
Capital stock | 82,884 | 6,409 | 148,327 | 27,648 | 163,420 | |||||||||||||||
Additional paid-in-capital | 82,563,969 | 7,502,609 | 141,484,611 | 33,101,423 | 156,785,453 | |||||||||||||||
Undistributed net investment income | 76,451 | 4,188 | 97,424 | 19,131 | 93,068 | |||||||||||||||
Accumulated net realized loss on Underlying Series | (2,151,472 | ) | (883,817 | ) | (8,241,088 | ) | (3,138,224 | ) | (9,153,181 | ) | ||||||||||
Net unrealized appreciation (depreciation) on Underlying Series | (2,746,188 | ) | 103,725 | (3,506,460 | ) | 425,155 | (6,978,702 | ) | ||||||||||||
|
|
|
|
|
|
|
|
|
| |||||||||||
TOTAL NET ASSETS | $ | 77,825,644 | $ | 6,733,114 | $ | 129,982,814 | $ | 30,435,133 | $ | 140,910,058 | ||||||||||
|
|
|
|
|
|
|
|
|
| |||||||||||
Class K | ||||||||||||||||||||
Net Assets | $ | 64,297,462 | $ | 3,273,564 | $ | 79,236,233 | $ | 13,380,634 | $ | 79,526,816 | ||||||||||
Shares Outstanding | 6,850,696 | 312,124 | 9,053,266 | 1,214,030 | 9,254,568 | |||||||||||||||
Net Asset Value, Offering Price, and Redemption Price per share | $ | 9.39 | $ | 10.49 | $ | 8.75 | $ | 11.02 | $ | 8.59 | ||||||||||
Class R | ||||||||||||||||||||
Net Assets | $ | 1,148,315 | $ | 802,225 | $ | 4,552,541 | $ | 1,670,983 | $ | 7,832,080 | ||||||||||
Shares Outstanding | 123,706 | 76,330 | 526,905 | 151,194 | 919,889 | |||||||||||||||
Net Asset Value, Offering Price, and Redemption Price per share | $ | 9.28 | $ | 10.51 | $ | 8.64 | $ | 11.05 | $ | 8.51 | ||||||||||
Class I | ||||||||||||||||||||
Net Assets | $ | 12,379,867 | $ | 2,657,325 | $ | 46,194,040 | $ | 15,383,516 | $ | 53,551,162 | ||||||||||
Shares Outstanding | 1,313,957 | 252,456 | 5,252,533 | 1,399,531 | 6,167,521 | |||||||||||||||
Net Asset Value, Offering Price, and Redemption Price per share | $ | 9.42 | $ | 10.53 | $ | 8.79 | $ | 10.99 | $ | 8.68 | ||||||||||
*At identified cost | $ | 80,606,324 | $ | 6,641,936 | $ | 133,543,318 | $ | 30,030,823 | $ | 147,947,137 | ||||||||||
|
|
|
|
|
|
|
|
|
| |||||||||||
The accompanying notes are an integral part of the financial statements.
36
Statements of Assets and Liabilities
October 31, 2016
TARGET 2035 | TARGET 2040 | TARGET 2045 | TARGET 2050 | TARGET 2055 | TARGET 2060 | |||||||||||||||||||
ASSETS: | ||||||||||||||||||||||||
Total investments in Underlying Series: | ||||||||||||||||||||||||
At value* | $ | 25,278,579 | $ | 88,510,911 | $ | 14,090,843 | $ | 30,260,955 | $ | 5,698,492 | $ | 1,634,290 | ||||||||||||
Receivable from Advisor (Note 3) | — | — | — | 313 | — | 15,788 | ||||||||||||||||||
Receivable for shares of Underlying Series sold | — | — | 2,406 | — | 127,607 | — | ||||||||||||||||||
Receivable for fund shares sold | 4,917 | 173,386 | 1,936 | 21,199 | 433 | 8,099 | ||||||||||||||||||
Prepaid expenses | 14,378 | 9,478 | 14,377 | 9,634 | 14,377 | 19,586 | ||||||||||||||||||
|
|
|
|
|
|
|
|
|
|
|
| |||||||||||||
TOTAL ASSETS | 25,297,874 | 88,693,775 | 14,109,562 | 30,292,101 | 5,840,909 | 1,677,763 | ||||||||||||||||||
|
|
|
|
|
|
|
|
|
|
|
| |||||||||||||
LIABILITIES: | ||||||||||||||||||||||||
Accrued fund accounting and administration fees (Note 3) | 8,305 | 8,333 | 8,257 | 8,343 | 8,217 | 8,307 | ||||||||||||||||||
Accrued management fees (Note 3) | 4,430 | 5,408 | 2,504 | — | 3,562 | — | ||||||||||||||||||
Accrued distribution and service (Rule 12b-1) fees (Note 3) | 3,513 | 13,952 | 2,221 | 4,208 | 752 | 367 | ||||||||||||||||||
Accrued Chief Compliance Officer service fees (Note 3) . | 353 | 353 | 353 | 352 | 353 | 361 | ||||||||||||||||||
Accrued transfer agent fees (Note 3) | 322 | 848 | 368 | 1,105 | 353 | 64 | ||||||||||||||||||
Accrued Directors’ fees (Note 3) | 12 | 36 | 7 | 13 | 4 | 5 | ||||||||||||||||||
Audit fees payable | 15,795 | 15,799 | 15,794 | 15,809 | 15,794 | 15,851 | ||||||||||||||||||
Payable for fund shares repurchased | 4,492 | 103,119 | 4,246 | 9,884 | 128,041 | 1,385 | ||||||||||||||||||
Custodian fees payable | 2,534 | 3,260 | 2,359 | 1,400 | 1,243 | 39 | ||||||||||||||||||
Accrued printing and postage | 805 | 4,338 | 904 | 5,192 | 849 | 114 | ||||||||||||||||||
Payable for shares of Underlying Series purchased | 426 | 69,940 | — | 10,940 | — | 6,714 | ||||||||||||||||||
Other payables and accrued expenses | 208 | 213 | 218 | 211 | 224 | 249 | ||||||||||||||||||
|
|
|
|
|
|
|
|
|
|
|
| |||||||||||||
TOTAL LIABILITIES | 41,195 | 225,599 | 37,231 | 57,457 | 159,392 | 33,456 | ||||||||||||||||||
|
|
|
|
|
|
|
|
|
|
|
| |||||||||||||
TOTAL NET ASSETS | $ | 25,256,679 | $ | 88,468,176 | $ | 14,072,331 | $ | 30,234,644 | $ | 5,681,517 | $ | 1,644,307 | ||||||||||||
|
|
|
|
|
|
|
|
|
|
|
| |||||||||||||
NET ASSETS CONSIST OF: | ||||||||||||||||||||||||
Capital stock | 22,298 | 101,118 | 12,039 | 32,058 | 4,837 | 1,541 | ||||||||||||||||||
Additional paid-in-capital | 27,874,056 | 98,950,376 | 15,222,712 | 32,904,103 | 6,054,446 | 1,512,864 | ||||||||||||||||||
Undistributed net investment income | 9,712 | 42,048 | 2,372 | 17,881 | 686 | — | ||||||||||||||||||
Accumulated net realized gain (loss) on Underlying | ||||||||||||||||||||||||
Series | (1,448,514 | ) | (8,009,659 | ) | (1,054,871 | ) | (3,104,861 | ) | (446,792 | ) | 7,795 | |||||||||||||
Net unrealized appreciation (depreciation) on Underlying | ||||||||||||||||||||||||
Series | (1,200,873 | ) | (2,615,707 | ) | (109,921 | ) | 385,463 | 68,340 | 122,107 | |||||||||||||||
|
|
|
|
|
|
|
|
|
|
|
| |||||||||||||
TOTAL NET ASSETS | $ | 25,256,679 | $ | 88,468,176 | $ | 14,072,331 | $ | 30,234,644 | $ | 5,681,517 | $ | 1,644,307 | ||||||||||||
|
|
|
|
|
|
|
|
|
|
|
| |||||||||||||
Class K | ||||||||||||||||||||||||
Net Assets | $ | 11,744,793 | $ | 55,919,725 | $ | 6,792,881 | $ | 14,873,790 | $ | 2,379,592 | $ | 1,406,550 | ||||||||||||
Shares Outstanding | 1,038,956 | 6,406,802 | 581,266 | 1,580,782 | 203,312 | 131,812 | ||||||||||||||||||
Net Asset Value, Offering Price, and Redemption Price per share | $ | 11.30 | $ | 8.73 | $ | 11.69 | $ | 9.41 | $ | 11.70 | $ | 10.67 | ||||||||||||
Class R | ||||||||||||||||||||||||
Net Assets | $ | 2,057,314 | $ | 4,653,159 | $ | 1,731,107 | $ | 2,432,820 | $ | 519,181 | $ | 181,619 | ||||||||||||
Shares Outstanding | 181,558 | 537,027 | 149,022 | 261,484 | 44,791 | 17,056 | ||||||||||||||||||
Net Asset Value, Offering Price, and Redemption Price per share | $ | 11.33 | $ | 8.66 | $ | 11.62 | $ | 9.30 | $ | 11.59 | $ | 10.65 | ||||||||||||
Class I | ||||||||||||||||||||||||
Net Assets | $ | 11,454,572 | $ | 27,895,292 | $ | 5,548,343 | $ | 12,928,034 | $ | 2,782,744 | $ | 56,138 | ||||||||||||
Shares Outstanding | 1,009,327 | 3,167,925 | 473,634 | 1,363,503 | 235,626 | 5,257 | ||||||||||||||||||
Net Asset Value, Offering Price, and Redemption Price per share | $ | 11.35 | $ | 8.81 | $ | 11.71 | $ | 9.48 | $ | 11.81 | $ | 10.68 | ||||||||||||
*At identified cost | $ | 26,479,452 | $ | 91,126,618 | $ | 14,200,764 | $ | 29,875,492 | $ | 5,630,152 | $ | 1,512,183 | ||||||||||||
|
|
|
|
|
|
|
|
|
|
|
| |||||||||||||
The accompanying notes are an integral part of the financial statements.
37
Statements of Operations
For the Year Ended October 31, 2016
| TARGET INCOME | TARGET 2015 | TARGET 2020 | TARGET 2025 | TARGET 2030 | ||||||||||||||||
INVESTMENT INCOME: | ||||||||||||||||||||
Income distributions from Underlying Series | $ | 1,882,510 | $ | 106,619 | $ | 2,160,363 | $ | 418,011 | $ | 2,043,892 | ||||||||||
|
|
|
|
|
|
|
|
|
| |||||||||||
EXPENSES: | ||||||||||||||||||||
Distribution and services (Rule 12b-1) fees (Class K) (Note 3) | 162,292 | 8,257 | 195,835 | 30,756 | 195,387 | |||||||||||||||
Distribution and services (Rule 12b-1) fees (Class R) (Note 3) | 7,395 | 4,000 | 29,967 | 10,550 | 45,575 | |||||||||||||||
Fund accounting and administration fees (Note 3) | 50,694 | 51,464 | 58,272 | 47,987 | 58,948 | |||||||||||||||
Directors’ fees (Note 3) | 5,983 | 887 | 10,059 | 2,279 | 10,484 | |||||||||||||||
Chief Compliance Officer service fees (Note 3) | 3,727 | 3,727 | 3,727 | 3,727 | 3,727 | |||||||||||||||
Transfer agent fees (Note 3) | 4,211 | 1,607 | 4,834 | 2,348 | 9,820 | |||||||||||||||
Registration and filing fees | 32,907 | 24,024 | 30,358 | 23,296 | 28,994 | |||||||||||||||
Audit fees | 25,585 | 19,503 | 19,924 | 19,567 | 19,919 | |||||||||||||||
Custodian fees | 5,296 | 4,249 | 9,717 | 5,195 | 9,841 | |||||||||||||||
Printing and postage fees | 2,097 | 2,342 | 12,409 | 4,390 | 22,550 | |||||||||||||||
Miscellaneous | 7,882 | 4,767 | 7,569 | 4,724 | 7,606 | |||||||||||||||
|
|
|
|
|
|
|
|
|
| |||||||||||
Total Expenses | 308,069 | 124,827 | 382,671 | 154,819 | 412,851 | |||||||||||||||
Less reduction of expenses (Note 3) | (96,648 | ) | (108,953 | ) | (83,967 | ) | (98,649 | ) | (94,732 | ) | ||||||||||
|
|
|
|
|
|
|
|
|
| |||||||||||
Net Expenses | 211,421 | 15,874 | 298,704 | 56,170 | 318,119 | |||||||||||||||
|
|
|
|
|
|
|
|
|
| |||||||||||
NET INVESTMENT INCOME | 1,671,089 | 90,745 | 1,861,659 | 361,841 | 1,725,773 | |||||||||||||||
|
|
|
|
|
|
|
|
|
| |||||||||||
REALIZED AND UNREALIZED GAIN (LOSS) ON UNDERLYING SERIES: | ||||||||||||||||||||
Net realized loss on Underlying Series | (1,950,268 | ) | (702,369 | ) | (8,267,474 | ) | (3,094,830 | ) | (11,760,790 | ) | ||||||||||
Distributions of realized gains from Underlying Series | — | 29,656 | 1,398,360 | 674,326 | 3,660,337 | |||||||||||||||
Net change in unrealized appreciation (depreciation) on Underlying Series | 2,394,966 | 698,809 | 8,448,277 | 3,035,783 | 10,871,121 | |||||||||||||||
|
|
|
|
|
|
|
|
|
| |||||||||||
NET REALIZED AND UNREALIZED GAIN (LOSS) ON UNDERLYING SERIES | 444,698 | 26,096 | 1,579,163 | 615,279 | 2,770,668 | |||||||||||||||
|
|
|
|
|
|
|
|
|
| |||||||||||
NET INCREASE IN NET ASSETS RESULTING FROM OPERATIONS | $ | 2,115,787 | $ | 116,841 | $ | 3,440,822 | $ | 977,120 | $ | 4,496,441 | ||||||||||
|
|
|
|
|
|
|
|
|
| |||||||||||
The accompanying notes are an integral part of the financial statements.
38
Statements of Operations
For the Year Ended October 31, 2016
TARGET 2035 | TARGET 2040 | TARGET 2045 | TARGET 2050 | TARGET 2055 | TARGET 2060 | |||||||||||||||||||
INVESTMENT INCOME: | ||||||||||||||||||||||||
Income distributions from Underlying Series | $ | 241,734 | $ | 897,980 | $ | 77,735 | $ | 233,060 | $ | 26,576 | $ | 4,589 | ||||||||||||
|
|
|
|
|
|
|
|
|
|
|
| |||||||||||||
EXPENSES: | ||||||||||||||||||||||||
Distribution and services (Rule 12b-1) fees (Class K) (Note 3) | 25,556 | 133,071 | 13,257 | 35,693 | 3,831 | 2,164 | ||||||||||||||||||
Distribution and services (Rule 12b-1) fees (Class R) (Note 3) | 12,492 | 23,722 | 8,500 | 11,617 | 2,392 | 559 | ||||||||||||||||||
Fund accounting and administration fees (Note 3) | 47,318 | 54,037 | 46,198 | 48,832 | 45,546 | 48,994 | ||||||||||||||||||
Chief Compliance Officer service fees (Note 3) | 3,727 | 3,727 | 3,727 | 3,727 | 3,727 | 3,719 | ||||||||||||||||||
Transfer agent fees (Note 3) | 2,111 | 5,515 | 2,398 | 7,315 | 2,430 | 466 | ||||||||||||||||||
Directors’ fees (Note 3) | 1,861 | 6,592 | 1,124 | 2,461 | 655 | 471 | ||||||||||||||||||
Registration and filing fees | 23,251 | 29,147 | 23,827 | 27,682 | 24,028 | 17,550 | ||||||||||||||||||
Audit fees | 19,547 | 19,745 | 19,510 | 20,308 | 19,490 | 19,538 | ||||||||||||||||||
Custodian fees | 5,421 | 7,509 | 4,617 | 2,943 | 2,505 | — | ||||||||||||||||||
Printing and postage fees | 3,346 | 13,902 | 3,366 | 15,685 | 3,392 | 1,229 | ||||||||||||||||||
Miscellaneous | 4,859 | 6,617 | 4,903 | 5,423 | 4,938 | 5,060 | ||||||||||||||||||
|
|
|
|
|
|
|
|
|
|
|
| |||||||||||||
Total Expenses | 149,489 | 303,584 | 131,427 | 181,686 | 112,934 | 99,750 | ||||||||||||||||||
Less reduction of expenses (Note 3) | (99,785 | ) | (98,957 | ) | (103,827 | ) | (118,477 | ) | (104,572 | ) | (96,512 | ) | ||||||||||||
|
|
|
|
|
|
|
|
|
|
|
| |||||||||||||
Net Expenses | 49,704 | 204,627 | 27,600 | 63,209 | 8,362 | 3,238 | ||||||||||||||||||
|
|
|
|
|
|
|
|
|
|
|
| |||||||||||||
NET INVESTMENT INCOME | 192,030 | 693,353 | 50,135 | 169,851 | 18,214 | 1,351 | ||||||||||||||||||
|
|
|
|
|
|
|
|
|
|
|
| |||||||||||||
REALIZED AND UNREALIZED GAIN (LOSS) ON UNDERLYING SERIES: | ||||||||||||||||||||||||
Net realized gain (loss) on Underlying Series | (1,120,019 | ) | (8,297,269 | ) | (819,492 | ) | (2,957,734 | ) | (263,082 | ) | 4,565 | |||||||||||||
Distributions of realized gains from Underlying Series | 465,095 | 2,016,154 | 185,038 | 613,752 | 63,005 | 3,288 | ||||||||||||||||||
Net change in unrealized appreciation (depreciation) on Underlying Series | 1,273,030 | 8,501,568 | 1,068,995 | 3,227,687 | 360,723 | 116,616 | ||||||||||||||||||
|
|
|
|
|
|
|
|
|
|
|
| |||||||||||||
NET REALIZED AND UNREALIZED GAIN (LOSS) ON UNDERLYING SERIES | 618,106 | 2,220,453 | 434,541 | 883,705 | 160,646 | 124,469 | ||||||||||||||||||
|
|
|
|
|
|
|
|
|
|
|
| |||||||||||||
NET INCREASE IN NET ASSETS RESULTING FROM OPERATIONS | $ | 810,136 | $ | 2,913,806 | $ | 484,676 | $ | 1,053,556 | $ | 178,860 | $ | 125,820 | ||||||||||||
|
|
|
|
|
|
|
|
|
|
|
| |||||||||||||
The accompanying notes are an integral part of the financial statements.
39
Statements of Changes in Net Assets
TARGET INCOME YEAR ENDED | FOR THE YEAR ENDED 10/31/15 | TARGET 2015 FOR THE YEAR ENDED 10/31/16 | FOR THE YEAR ENDED 10/31/15 | |||||||||||||
INCREASE (DECREASE) IN NET ASSETS: | ||||||||||||||||
OPERATIONS: | ||||||||||||||||
Net investment income | $ | 1,671,089 | $ | 1,174,075 | $ | 90,745 | $ | 115,679 | ||||||||
Net realized gain (loss) on Underlying Series | (1,950,268 | ) | 327,062 | (702,369 | ) | (354,202 | ) | |||||||||
Distributions of realized gains from Underlying Series | — | 4,306,403 | 29,656 | 852,222 | ||||||||||||
Net change in unrealized appreciation (depreciation) on Underlying Series | 2,394,966 | (6,081,504 | ) | 698,809 | (763,903 | ) | ||||||||||
|
|
|
|
|
|
|
| |||||||||
Net increase (decrease) from operations | 2,115,787 | (273,964 | ) | 116,841 | (150,204 | ) | ||||||||||
|
|
|
|
|
|
|
| |||||||||
DISTRIBUTIONS TO SHAREHOLDERS (Note 8): | ||||||||||||||||
From net investment income (Class K) | (1,177,084 | ) | (1,346,562 | ) | (36,105 | ) | (74,230 | ) | ||||||||
From net investment income (Class R) | (29,658 | ) | (278,571 | ) | (7,147 | ) | (31,804 | ) | ||||||||
From net investment income (Class I) | (439,125 | ) | (368,537 | ) | (49,708 | ) | (129,353 | ) | ||||||||
From net realized gain on investments (Class K) | (2,870,405 | ) | (3,365,065 | ) | (238,125 | ) | (102,766 | ) | ||||||||
From net realized gain on investments (Class R) | (90,931 | ) | (851,245 | ) | (59,085 | ) | (52,006 | ) | ||||||||
From net realized gain on investments (Class I) | (1,015,587 | ) | (818,325 | ) | (289,064 | ) | (159,729 | ) | ||||||||
|
|
|
|
|
|
|
| |||||||||
Total distributions to shareholders | (5,622,790 | ) | (7,028,305 | ) | (679,234 | ) | (549,888 | ) | ||||||||
|
|
|
|
|
|
|
| |||||||||
CAPITAL STOCK ISSUED AND REPURCHASED: | ||||||||||||||||
Net increase (decrease) from capital share | (14,457,731 | ) | 25,635,184 | (2,171,713 | ) | 595,483 | ||||||||||
|
|
|
|
|
|
|
| |||||||||
Net increase (decrease) in net assets | (17,964,734 | ) | 18,332,915 | (2,734,106 | ) | (104,609 | ) | |||||||||
NET ASSETS: | ||||||||||||||||
Beginning of year | 95,790,378 | 77,457,463 | 9,467,220 | 9,571,829 | ||||||||||||
|
|
|
|
|
|
|
| |||||||||
End of year1 | $ | 77,825,644 | $ | 95,790,378 | $ | 6,733,114 | $ | 9,467,220 | ||||||||
|
|
|
|
|
|
|
| |||||||||
1 Including undistributed net investment income: | $ | 76,451 | $ | 51,139 | $ | 4,188 | $ | 6,457 | ||||||||
The accompanying notes are an integral part of the financial statements.
40
Statements of Changes in Net Assets
TARGET 2020 YEAR ENDED | FOR THE YEAR ENDED | TARGET 2025 FOR THE YEAR ENDED 10/31/16 | FOR THE YEAR ENDED 10/31/15 | TARGET 2030 YEAR ENDED | FOR THE YEAR ENDED | |||||||||||||||||||
INCREASE (DECREASE) IN NET ASSETS: | ||||||||||||||||||||||||
OPERATIONS: | ||||||||||||||||||||||||
Net investment income | $ | 1,861,659 | $ | 2,188,348 | $ | 361,841 | $ | 334,757 | $ | 1,725,773 | $ | 2,130,691 | ||||||||||||
Net realized loss on Underlying Series | (8,267,474 | ) | (3,111,100 | ) | (3,094,830 | ) | (973,443 | ) | (11,760,790 | ) | (461,557 | ) | ||||||||||||
Distributions of realized gains from Underlying Series | 1,398,360 | 18,962,248 | 674,326 | 3,129,155 | 3,660,337 | 28,133,734 | ||||||||||||||||||
Net change in unrealized appreciation (depreciation) on Underlying Series | 8,448,277 | (21,261,309 | ) | 3,035,783 | (3,130,833 | ) | 10,871,121 | (33,119,207 | ) | |||||||||||||||
|
|
|
|
|
|
|
|
|
|
|
| |||||||||||||
Net increase (decrease) from operations | 3,440,822 | (3,221,813 | ) | 977,120 | (640,364 | ) | 4,496,441 | (3,316,339 | ) | |||||||||||||||
|
|
|
|
|
|
|
|
|
|
|
| |||||||||||||
DISTRIBUTIONS TO SHAREHOLDERS | ||||||||||||||||||||||||
From net investment income (Class K) | (859,530 | ) | (2,505,775 | ) | (134,175 | ) | (297,449 | ) | (760,569 | ) | (4,570,890 | ) | ||||||||||||
From net investment income (Class R) | (59,142 | ) | (500,611 | ) | (18,283 | ) | (109,978 | ) | (73,121 | ) | (735,285 | ) | ||||||||||||
From net investment income (Class I) | (956,387 | ) | (2,125,424 | ) | (212,332 | ) | (477,523 | ) | (914,051 | ) | (2,871,200 | ) | ||||||||||||
From net realized gain on investments (Class K) | (6,912,732 | ) | (7,356,511 | ) | (918,204 | ) | (326,846 | ) | (10,610,704 | ) | (11,306,421 | ) | ||||||||||||
From net realized gain on investments (Class R) | (656,604 | ) | (1,722,295 | ) | (162,864 | ) | (140,351 | ) | (1,437,863 | ) | (1,986,960 | ) | ||||||||||||
From net realized gain on investments (Class I) | (6,366,878 | ) | (5,519,527 | ) | (1,221,422 | ) | (488,200 | ) | (10,036,065 | ) | (6,424,281 | ) | ||||||||||||
|
|
|
|
|
|
|
|
|
|
|
| |||||||||||||
Total distributions to shareholders | (15,811,273 | ) | (19,730,143 | ) | (2,667,280 | ) | (1,840,347 | ) | (23,832,373 | ) | (27,895,037 | ) | ||||||||||||
|
|
|
|
|
|
|
|
|
|
|
| |||||||||||||
CAPITAL STOCK ISSUED AND REPURCHASED: | ||||||||||||||||||||||||
Net increase (decrease) from capital share transactions (Note 6) | (20,792,232 | ) | 6,496,480 | 2,590,046 | 7,669,888 | (5,908,398 | ) | (391,486 | ) | |||||||||||||||
|
|
|
|
|
|
|
|
|
|
|
| |||||||||||||
Net increase (decrease) in net assets | (33,162,683 | ) | (16,455,476 | ) | 899,886 | 5,189,177 | (25,244,330 | ) | (31,602,862 | ) | ||||||||||||||
NET ASSETS: | ||||||||||||||||||||||||
Beginning of year | 163,145,497 | 179,600,973 | 29,535,247 | 24,346,070 | 166,154,388 | 197,757,250 | ||||||||||||||||||
|
|
|
|
|
|
|
|
|
|
|
| |||||||||||||
End of year1 | $ | 129,982,814 | $ | 163,145,497 | $ | 30,435,133 | $ | 29,535,247 | $ | 140,910,058 | $ | 166,154,388 | ||||||||||||
|
|
|
|
|
|
|
|
|
|
|
| |||||||||||||
1 Including undistributed net investment income: | $ | 97,424 | $ | 110,360 | $ | 19,131 | $ | 22,257 | $ | 93,068 | $ | 115,962 | ||||||||||||
The accompanying notes are an integral part of the financial statements.
41
Statements of Changes in Net Assets
| TARGET 2035 FOR THE YEAR ENDED 10/31/16 | FOR THE YEAR ENDED 10/31/15 | TARGET 2040 FOR THE YEAR ENDED 10/31/16 | FOR THE YEAR ENDED 10/31/15 | TARGET 2045 FOR THE YEAR ENDED 10/31/16 | FOR THE YEAR ENDED 10/31/15 | |||||||||||||||||||
INCREASE (DECREASE) IN NET ASSETS: | ||||||||||||||||||||||||
OPERATIONS: | ||||||||||||||||||||||||
Net investment income | $ | 192,030 | $ | 206,341 | $ | 693,353 | $ | 982,885 | $ | 50,135 | $ | 63,984 | ||||||||||||
Net realized loss on Underlying Series | (1,120,019 | ) | (805,034 | ) | (8,297,269 | ) | (1,382,593 | ) | (819,492 | ) | (377,628 | ) | ||||||||||||
Distributions of realized gains from Underlying Series | 465,095 | 2,943,470 | 2,016,154 | 20,893,461 | 185,038 | 1,408,794 | ||||||||||||||||||
Net change in unrealized appreciation (depreciation) on Underlying Series | 1,273,030 | (2,867,926 | ) | 8,501,568 | (22,351,962 | ) | 1,068,995 | (1,330,359 | ) | |||||||||||||||
|
|
|
|
|
|
|
|
|
|
|
| |||||||||||||
Net increase (decrease) from operations | 810,136 | (523,149 | ) | 2,913,806 | (1,858,209 | ) | 484,676 | (235,209 | ) | |||||||||||||||
|
|
|
|
|
|
|
|
|
|
|
| |||||||||||||
DISTRIBUTIONS TO SHAREHOLDERS | ||||||||||||||||||||||||
From net investment income (Class K) | (75,719 | ) | (329,120 | ) | (321,268 | ) | (4,088,810 | ) | (18,391 | ) | (156,127 | ) | ||||||||||||
From net investment income (Class R) | (12,767 | ) | (120,541 | ) | (16,732 | ) | (488,750 | ) | (3,973 | ) | (91,933 | ) | ||||||||||||
From net investment income (Class I) | (108,923 | ) | (472,419 | ) | (374,152 | ) | (2,080,865 | ) | (30,663 | ) | (220,609 | ) | ||||||||||||
From net realized gain on investments (Class K) | (911,580 | ) | (274,022 | ) | (8,092,254 | ) | (10,306,151 | ) | (375,447 | ) | (117,251 | ) | ||||||||||||
From net realized gain on investments (Class R) | (233,282 | ) | (108,826 | ) | (775,713 | ) | (1,318,271 | ) | (169,076 | ) | (73,722 | ) | ||||||||||||
From net realized gain on investments (Class I) | (1,053,646 | ) | (371,000 | ) | (6,693,299 | ) | (4,840,432 | ) | (455,910 | ) | (157,365 | ) | ||||||||||||
|
|
|
|
|
|
|
|
|
|
|
| |||||||||||||
Total distributions to shareholders | (2,395,917 | ) | (1,675,928 | ) | (16,273,418 | ) | (23,123,279 | ) | (1,053,460 | ) | (817,007 | ) | ||||||||||||
|
|
|
|
|
|
|
|
|
|
|
| |||||||||||||
CAPITAL STOCK ISSUED AND REPURCHASED: | ||||||||||||||||||||||||
Net increase (decrease) from capital share transactions (Note 6) | 4,533,222 | 6,731,366 | 1,118,466 | (1,385,064 | ) | 4,703,817 | 3,229,422 | |||||||||||||||||
|
|
|
|
|
|
|
|
|
|
|
| |||||||||||||
Net increase (decrease) in net assets | 2,947,441 | 4,532,289 | (12,241,146 | ) | (26,366,552 | ) | 4,135,033 | 2,177,206 | ||||||||||||||||
NET ASSETS: | ||||||||||||||||||||||||
Beginning of year | 22,309,238 | 17,776,949 | 100,709,322 | 127,075,874 | 9,937,298 | 7,760,092 | ||||||||||||||||||
|
|
|
|
|
|
|
|
|
|
|
| |||||||||||||
End of year1 | $ | 25,256,679 | $ | 22,309,238 | $ | 88,468,176 | $ | 100,709,322 | $ | 14,072,331 | $ | 9,937,298 | ||||||||||||
|
|
|
|
|
|
|
|
|
|
|
| |||||||||||||
1 Including undistributed net investment income: | $ | 9,712 | $ | 15,091 | $ | 42,048 | $ | 57,305 | $ | 2,372 | $ | 5,264 | ||||||||||||
The accompanying notes are an integral part of the financial statements.
42
Statements of Changes in Net Assets
| TARGET 2050 FOR THE YEAR ENDED 10/31/16 | FOR THE YEAR ENDED 10/31/15 | TARGET 2055 FOR THE YEAR ENDED 10/31/16 | FOR THE YEAR ENDED 10/31/15 | TARGET 2060 FOR THE YEAR ENDED 10/31/16 | FOR THE PERIOD 9/21/151 TO 10/31/15 | |||||||||||||||||||
INCREASE (DECREASE) IN NET ASSETS: | ||||||||||||||||||||||||
OPERATIONS: | ||||||||||||||||||||||||
Net investment income (loss) | $ | 169,851 | $ | 346,546 | $ | 18,214 | $ | 21,660 | $ | 1,351 | $ | (50 | ) | |||||||||||
Net realized gain (loss) on Underlying Series | (2,957,734 | ) | (2,322,553 | ) | (263,082 | ) | (295,606 | ) | 4,565 | 11 | ||||||||||||||
Distributions of realized gains from Underlying Series | 613,752 | 10,884,743 | 63,005 | 542,597 | 3,288 | — | ||||||||||||||||||
Net change in unrealized appreciation (depreciation) on Underlying Series | 3,227,687 | (9,156,768 | ) | 360,723 | (313,271 | ) | 116,616 | 5,491 | ||||||||||||||||
|
|
|
|
|
|
|
|
|
|
|
| |||||||||||||
Net increase (decrease) from operations | 1,053,556 | (248,032 | ) | 178,860 | (44,620 | ) | 125,820 | 5,452 | ||||||||||||||||
|
|
|
|
|
|
|
|
|
|
|
| |||||||||||||
DISTRIBUTIONS TO SHAREHOLDERS (Note 8): | ||||||||||||||||||||||||
From net investment income (Class K) | (59,486 | ) | (2,509,188 | ) | (5,175 | ) | (98,964 | ) | (841 | ) | — | |||||||||||||
From net investment income (Class R) | (3,714 | ) | (260,575 | ) | (988 | ) | (26,485 | ) | (231 | ) | — | |||||||||||||
From net investment income (Class I) | (108,099 | ) | (742,815 | ) | (12,933 | ) | (53,400 | ) | (303 | ) | — | |||||||||||||
From net realized gain on investments (Class K) | (2,778,003 | ) | (5,037,375 | ) | (100,952 | ) | (51,648 | ) | — | — | ||||||||||||||
From net realized gain on investments (Class R) | (407,411 | ) | (541,441 | ) | (39,465 | ) | (14,363 | ) | — | — | ||||||||||||||
From net realized gain on investments (Class I) | (2,969,532 | ) | (1,368,611 | ) | (162,891 | ) | (25,481 | ) | — | — | ||||||||||||||
|
|
|
|
|
|
|
|
|
|
|
| |||||||||||||
Total distributions to shareholders | (6,326,245 | ) | (10,460,005 | ) | (322,404 | ) | (270,341 | ) | (1,375 | ) | — | |||||||||||||
|
|
|
|
|
|
|
|
|
|
|
| |||||||||||||
CAPITAL STOCK ISSUED AND REPURCHASED: | ||||||||||||||||||||||||
Net increase (decrease) from capital share transactions (Note 6) | 2,460,812 | (20,993,216 | ) | 2,616,602 | 359,064 | 1,360,441 | 153,969 | |||||||||||||||||
|
|
|
|
|
|
|
|
|
|
|
| |||||||||||||
Net increase (decrease) in net assets | (2,811,877 | ) | (31,701,253 | ) | 2,473,058 | 44,103 | 1,484,886 | 159,421 | ||||||||||||||||
NET ASSETS: | ||||||||||||||||||||||||
Beginning of period | 33,046,521 | 64,747,774 | 3,208,459 | 3,164,356 | 159,421 | — | ||||||||||||||||||
|
|
|
|
|
|
|
|
|
|
|
| |||||||||||||
End of period2 | $ | 30,234,644 | $ | 33,046,521 | $ | 5,681,517 | $ | 3,208,459 | $ | 1,644,307 | $ | 159,421 | ||||||||||||
|
|
|
|
|
|
|
|
|
|
|
| |||||||||||||
1 Commencement of operations. | ||||||||||||||||||||||||
2 Including undistributed net investment income: | $ | 17,881 | $ | 12,013 | $ | 686 | $ | 1,561 | $ | — | $ | — | ||||||||||||
The accompanying notes are an integral part of the financial statements.
43
Financial Highlights
| TARGET INCOME SERIES CLASS K | FOR THE YEARS ENDED | |||||||||||||||||||
| 10/31/16 | 10/31/15 | 10/31/14 | 10/31/13 | 10/31/12 | ||||||||||||||||
Per share data (for a share outstanding throughout each year): | ||||||||||||||||||||
Net asset value - Beginning of year | $ | 9.72 | $ | 10.84 | $ | 11.00 | $ | 10.86 | $ | 10.86 | ||||||||||
|
|
|
|
|
|
|
|
|
| |||||||||||
Income (loss) from investment operations: | ||||||||||||||||||||
Net investment income1,2 | 0.17 | 0.15 | 0.18 | 0.18 | 0.22 | |||||||||||||||
Net realized and unrealized gain (loss) on investments | 0.09 | (0.29 | ) | 0.37 | 0.63 | 0.48 | ||||||||||||||
|
|
|
|
|
|
|
|
|
| |||||||||||
Total from investment operations | 0.26 | (0.14 | ) | 0.55 | 0.81 | 0.70 | ||||||||||||||
|
|
|
|
|
|
|
|
|
| |||||||||||
Less distributions to shareholders: | ||||||||||||||||||||
From net investment income | (0.17 | ) | (0.28 | ) | (0.29 | ) | (0.24 | ) | (0.25 | ) | ||||||||||
From net realized gain on investments | (0.42 | ) | (0.70 | ) | (0.42 | ) | (0.43 | ) | (0.45 | ) | ||||||||||
|
|
|
|
|
|
|
|
|
| |||||||||||
Total distributions to shareholders | (0.59 | ) | (0.98 | ) | (0.71 | ) | (0.67 | ) | (0.70 | ) | ||||||||||
|
|
|
|
|
|
|
|
|
| |||||||||||
Net asset value - End of year | $ | 9.39 | $ | 9.72 | $ | 10.84 | $ | 11.00 | $ | 10.86 | ||||||||||
|
|
|
|
|
|
|
|
|
| |||||||||||
Net assets - End of year (000’s omitted) | $ | 64,297 | $ | 67,322 | $ | 52,442 | $ | 47,676 | $ | 45,926 | ||||||||||
|
|
|
|
|
|
|
|
|
| |||||||||||
Total return3 | 2.97 | % | (1.38 | %) | 5.35 | % | 7.83 | % | 6.98 | % | ||||||||||
Ratios (to average net assets)/Supplemental Data: | ||||||||||||||||||||
Expenses* | 0.30 | %4 | 0.30 | %5 | 0.30 | %4 | 0.30 | %4 | 0.30 | %5 | ||||||||||
Net investment income2 | 1.84 | % | 1.54 | % | 1.63 | % | 1.69 | % | 2.07 | % | ||||||||||
Series portfolio turnover6 | 6 | % | 16 | % | 15 | % | 14 | % | 16 | % | ||||||||||
| *The investment advisor paid a portion of the Series’ expenses. If these expenses had been incurred by the Series, the expense ratios (to average net assets) would have been increased by the following amounts: | ||||||||||||||||||||
|
| 0.12%4
|
|
| 0.16
| %5
|
| 0.12
| %4
|
| 0.16
| %4
|
| 0.20
| %5
| ||||||
| TARGET INCOME SERIES CLASS R | FOR THE YEARS ENDED | |||||||||||||||||||
| 10/31/16 | 10/31/15 | 10/31/14 | 10/31/13 | 10/31/12 | ||||||||||||||||
Per share data (for a share outstanding throughout each year): Net asset value - Beginning of year | $ | 9.61 | $ | 10.71 | $ | 10.89 | $ | 10.76 | $ | 10.77 | ||||||||||
|
|
|
|
|
|
|
|
|
| |||||||||||
Income (loss) from investment operations: | ||||||||||||||||||||
Net investment income1,2 | 0.19 | 0.21 | 0.15 | 0.07 | 0.09 | |||||||||||||||
Net realized and unrealized gain (loss) on investments | 0.04 | (0.38 | ) | 0.36 | 0.70 | 0.58 | ||||||||||||||
|
|
|
|
|
|
|
|
|
| |||||||||||
Total from investment operations | 0.23 | (0.17 | ) | 0.51 | 0.77 | 0.67 | ||||||||||||||
|
|
|
|
|
|
|
|
|
| |||||||||||
Less distributions to shareholders: | ||||||||||||||||||||
From net investment income | (0.14 | ) | (0.23 | ) | (0.27 | ) | (0.21 | ) | (0.23 | ) | ||||||||||
From net realized gain on investments | (0.42 | ) | (0.70 | ) | (0.42 | ) | (0.43 | ) | (0.45 | ) | ||||||||||
|
|
|
|
|
|
|
|
|
| |||||||||||
Total distributions to shareholders | (0.56 | ) | (0.93 | ) | (0.69 | ) | (0.64 | ) | (0.68 | ) | ||||||||||
|
|
|
|
|
|
|
|
|
| |||||||||||
Net asset value - End of year | $ | 9.28 | $ | 9.61 | $ | 10.71 | $ | 10.89 | $ | 10.76 | ||||||||||
|
|
|
|
|
|
|
|
|
| |||||||||||
Net assets - End of year (000’s omitted) | $ | 1,148 | $ | 2,468 | $ | 13,406 | $ | 13,475 | $ | 3,853 | ||||||||||
|
|
|
|
|
|
|
|
|
| |||||||||||
Total return3 | 2.69 | % | (1.70 | %) | 5.00 | % | 7.52 | % | 6.77 | % | ||||||||||
Ratios (to average net assets)/Supplemental Data: | ||||||||||||||||||||
Expenses* | 0.55 | %4 | 0.55 | %5 | 0.55 | %4 | 0.55 | %4 | 0.55 | %5 | ||||||||||
Net investment income2 | 2.07 | % | 2.05 | % | 1.40 | % | 0.66 | % | 0.84 | % | ||||||||||
Series portfolio turnover6 | 6 | % | 16 | % | 15 | % | 14 | % | 16 | % | ||||||||||
| *The investment advisor paid a portion of the Series’ expenses. If these expenses had been incurred by the Series, the expense ratios (to average net assets) would have been increased by the following amounts: | ||||||||||||||||||||
| 0.12 | %4 | 0.16 | %5 | 0.12 | %4 | 0.14 | %4 | 0.20 | %5 | |||||||||||
1Calculated based on average shares outstanding during the years.
2Net investment income is affected by the timing of distributions from the Underlying Series in which the Series invest. The ratios do not include net investment income of the Underlying Series in which the Series invests.
3Represents aggregate total return for the years indicated, and assumes reinvestment of all distributions. Total return would have been lower had certain expenses not been waived or reimbursed.
4Expense ratios do not include expenses of the Underlying Series in which the Series invests. The expense ratio of the Underlying Series was 0.67%.
5Expense ratios do not include expenses of the Underlying Series in which the Series invests. The expense ratio of the Underlying Series was 0.68%.
6Reflects activity of the Series and does not include the activity of the Underlying Series.
The accompanying notes are an integral part of the financial statements.
44
Financial Highlights
| TARGET INCOME SERIES CLASS I | FOR THE YEARS ENDED | |||||||||||||||||||
| 10/31/16 | 10/31/15 | 10/31/14 | 10/31/13 | 10/31/12 | ||||||||||||||||
Per share data (for a share outstanding throughout each year): | ||||||||||||||||||||
Net asset value - Beginning of year | $ | 9.75 | $ | 10.88 | $ | 11.04 | $ | 10.90 | $ | 10.89 | ||||||||||
|
|
|
|
|
|
|
|
|
| |||||||||||
Income (loss) from investment operations: | ||||||||||||||||||||
Net investment income1,2 | 0.24 | 0.16 | 0.21 | 0.19 | 0.24 | |||||||||||||||
Net realized and unrealized gain (loss) on investments | 0.04 | (0.28 | ) | 0.37 | 0.65 | 0.50 | ||||||||||||||
|
|
|
|
|
|
|
|
|
| |||||||||||
Total from investment operations | 0.28 | (0.12 | ) | 0.58 | 0.84 | 0.74 | ||||||||||||||
|
|
|
|
|
|
|
|
|
| |||||||||||
Less distributions to shareholders: | ||||||||||||||||||||
From net investment income | (0.19 | ) | (0.31 | ) | (0.32 | ) | (0.27 | ) | (0.28 | ) | ||||||||||
From net realized gain on investments | (0.42 | ) | (0.70 | ) | (0.42 | ) | (0.43 | ) | (0.45 | ) | ||||||||||
|
|
|
|
|
|
|
|
|
| |||||||||||
Total distributions to shareholders | (0.61 | ) | (1.01 | ) | (0.74 | ) | (0.70 | ) | (0.73 | ) | ||||||||||
|
|
|
|
|
|
|
|
|
| |||||||||||
Net asset value - End of year | $ | 9.42 | $ | 9.75 | $ | 10.88 | $ | 11.04 | $ | 10.90 | ||||||||||
|
|
|
|
|
|
|
|
|
| |||||||||||
Net assets - End of year (000’s omitted) | $ | 12,380 | $ | 26,000 | $ | 11,610 | $ | 11,271 | $ | 6,300 | ||||||||||
|
|
|
|
|
|
|
|
|
| |||||||||||
Total return3 | 3.20 | % | (1.21 | %) | 5.59 | % | 8.09 | % | 7.34 | % | ||||||||||
Ratios (to average net assets)/Supplemental Data: | ||||||||||||||||||||
Expenses* | 0.05 | %4 | 0.05 | %5 | 0.05 | %4 | 0.05 | %4 | 0.05 | %5 | ||||||||||
Net investment income2 | 2.61 | % | 1.65 | % | 1.92 | % | 1.76 | % | 2.30 | % | ||||||||||
Series portfolio turnover6 | 6 | % | 16 | % | 15 | % | 14 | % | 16 | % | ||||||||||
| *The investment advisor paid a portion of the Series’ expenses. If these expenses had been incurred by the Series, the expense ratios (to average net assets) would have been increased by the following amounts: | ||||||||||||||||||||
| 0.12 | %4 | 0.16 | %5 | 0.12 | %4 | 0.16 | %4 | 0.20 | %5 | |||||||||||
1Calculated based on average shares outstanding during the years.
2Net investment income is affected by the timing of distributions from the Underlying Series in which the Series invest. The ratios do not include net investment income of the Underlying Series in which the Series invests.
3Represents aggregate total return for the years indicated, and assumes reinvestment of all distributions. Total return would have been lower had certain expenses not been waived or reimbursed.
4Expense ratios do not include expenses of the Underlying Series in which the Series invests. The expense ratio of the Underlying Series was 0.67%.
5Expense ratios do not include expenses of the Underlying Series in which the Series invests. The expense ratio of the Underlying Series was 0.68%.
6Reflects activity of the Series and does not include the activity of the Underlying Series.
The accompanying notes are an integral part of the financial statements.
45
Financial Highlights
| TARGET 2015 SERIES CLASS K | FOR THE YEARS ENDED | FOR THE PERIOD | ||||||||||||||||||
| 10/31/16 | 10/31/15 | 10/31/14 | 10/31/13 | 6/25/121 TO 10/31/12 | ||||||||||||||||
Per share data (for a share outstanding throughout each period): | ||||||||||||||||||||
Net asset value - Beginning of period | $ | 11.17 | $ | 12.07 | $ | 11.79 | $ | 10.59 | $ | 10.00 | ||||||||||
|
|
|
|
|
|
|
|
|
| |||||||||||
Income (loss) from investment operations: | ||||||||||||||||||||
Net investment income (loss)2,3 | 0.11 | 0.12 | 0.10 | 0.15 | (0.01 | ) | ||||||||||||||
Net realized and unrealized gain (loss) on investments | 0.13 | (0.35 | ) | 0.53 | 1.25 | 0.60 | ||||||||||||||
|
|
|
|
|
|
|
|
|
| |||||||||||
Total from investment operations | 0.24 | (0.23 | ) | 0.63 | 1.40 | 0.59 | ||||||||||||||
|
|
|
|
|
|
|
|
|
| |||||||||||
Less distributions to shareholders: | ||||||||||||||||||||
From net investment income | (0.12 | ) | (0.28 | ) | (0.26 | ) | (0.20 | ) | — | |||||||||||
From net realized gain on investments | (0.80 | ) | (0.39 | ) | (0.09 | ) | — | — | ||||||||||||
|
|
|
|
|
|
|
|
|
| |||||||||||
Total distributions to shareholders | (0.92 | ) | (0.67 | ) | (0.35 | ) | (0.20 | ) | — | |||||||||||
|
|
|
|
|
|
|
|
|
| |||||||||||
Net asset value - End of period | $ | 10.49 | $ | 11.17 | $ | 12.07 | $ | 11.79 | $ | 10.59 | ||||||||||
|
|
|
|
|
|
|
|
|
| |||||||||||
Net assets - End of period (000’s omitted) | $ | 3,274 | $ | 3,500 | $ | 3,200 | $ | 1,019 | $ | 1,498 | 4 | |||||||||
|
|
|
|
|
|
|
|
|
| |||||||||||
Total return5 | 2.58 | % | (2.04 | %) | 5.45 | % | 13.45 | % | 5.90 | % | ||||||||||
Ratios (to average net assets)/Supplemental Data: | ||||||||||||||||||||
Expenses* | 0.30 | %6 | 0.30 | %7 | 0.30 | %8 | 0.30 | %8 | 0.30 | %9,10 | ||||||||||
Net investment income (loss)3 | 1.09 | % | 1.01 | % | 0.80 | % | 1.34 | % | (0.30 | %)9 | ||||||||||
Series portfolio turnover11 | 49 | % | 46 | % | 46 | % | 50 | % | — | 12 | ||||||||||
| *The investment advisor paid a portion of the Series’ expenses. If these expenses had been incurred by the Series, the expense ratios (to average net assets) would have been increased by the following amounts: | ||||||||||||||||||||
|
| 1.51
| %6
|
| 1.14
| %7
|
| 1.41
| %8
|
| 6.06
| %8
|
| 9,646
| %9,10,13
| ||||||
| TARGET 2015 SERIES CLASS R | FOR THE YEARS ENDED | FOR THE PERIOD | ||||||||||||||||||
| 10/31/16 | 10/31/15 | 10/31/14 | 10/31/13 | 6/25/121 TO 10/31/12 | ||||||||||||||||
Per share data (for a share outstanding throughout each period): | ||||||||||||||||||||
Net asset value - Beginning of period | $ | 11.19 | $ | 12.09 | $ | 11.81 | $ | 10.59 | $ | 10.00 | ||||||||||
|
|
|
|
|
|
|
|
|
| |||||||||||
Income (loss) from investment operations: | ||||||||||||||||||||
Net investment income (loss)2,3 | 0.09 | 0.12 | 0.07 | 0.01 | (0.02 | ) | ||||||||||||||
Net realized and unrealized gain (loss) on investments | 0.13 | (0.39 | ) | 0.53 | 1.39 | 0.61 | ||||||||||||||
|
|
|
|
|
|
|
|
|
| |||||||||||
Total from investment operations | 0.22 | (0.27 | ) | 0.60 | 1.40 | 0.59 | ||||||||||||||
|
|
|
|
|
|
|
|
|
| |||||||||||
Less distributions to shareholders: | ||||||||||||||||||||
From net investment income | (0.10 | ) | (0.24 | ) | (0.23 | ) | (0.18 | ) | — | |||||||||||
From net realized gain on investments | (0.80 | ) | (0.39 | ) | (0.09 | ) | — | — | ||||||||||||
|
|
|
|
|
|
|
|
|
| |||||||||||
Total distributions to shareholders | (0.90 | ) | (0.63 | ) | (0.32 | ) | (0.18 | ) | — | |||||||||||
|
|
|
|
|
|
|
|
|
| |||||||||||
Net asset value - End of period | $ | 10.51 | $ | 11.19 | $ | 12.09 | $ | 11.81 | $ | 10.59 | ||||||||||
|
|
|
|
|
|
|
|
|
| |||||||||||
Net assets - End of period (000’s omitted) | $ | 802 | $ | 839 | $ | 1,587 | $ | 1,015 | $ | 106 | 4 | |||||||||
|
|
|
|
|
|
|
|
|
| |||||||||||
Total return5 | 2.34 | % | (2.37 | %) | 5.22 | % | 13.36 | % | 5.90 | % | ||||||||||
Ratios (to average net assets)/Supplemental Data: | ||||||||||||||||||||
Expenses* | 0.55 | %6 | 0.55 | %7 | 0.55 | %8 | 0.55 | %8 | 0.55 | %9,10 | ||||||||||
Net investment income (loss)3 | 0.86 | % | 1.07 | % | 0.60 | % | 0.11 | % | (0.55 | %)9 | ||||||||||
Series portfolio turnover11 | 49 | % | 46 | % | 46 | % | 50 | % | — | 12 | ||||||||||
| *The investment advisor paid a portion of the Series’ expenses. If these expenses had been incurred by the Series, the expense ratios (to average net assets) would have been increased by the following amounts: | ||||||||||||||||||||
| 1.51 | %6 | 1.14 | %7 | 1.47 | %8 | 3.45 | %8 | 10,644 | %9,10,13 | |||||||||||
1Commencement of operations.
2Calculated based on average shares outstanding during the periods.
3Net investment income is affected by the timing of distributions from the Underlying Series in which the Series invest. The ratios do not include net investment income of the Underlying Series in which the Series invests.
4Represents the whole number without rounding to the 000s.
5Represents aggregate total return for the periods indicated. Total return would have been lower had certain expenses not been reimbursed. Periods less than one year are not annualized.
6Expense ratios do not include expenses of the Underlying Series in which the Series invests. The expense ratios of the Underlying Series were 0.67% for Manning & Napier Pro-Blend® Conservative Term Series - Class I and 0.82% for Manning & Napier Pro-Blend® Moderate Term Series - Class I.
7Expense ratios do not include expenses of the Underlying Series in which the Series invests. The expense ratios of the Underlying Series were 0.81% for Manning & Napier Pro-Blend® Moderate Term Series - Class I and 0.82% for Manning & Napier Pro-Blend® Extended Term Series - Class I.
8Expense ratios do not include expenses of the Underlying Series in which the Series invests. The expense ratios of the Underlying Series were 0.81% for Manning & Napier Pro-Blend® Moderate Term Series - Class I and 0.81% for Manning & Napier Pro-Blend® Extended Term Series - Class I.
9Annualized.
10Expense ratios do not include expenses of the Underlying Series in which the Series invests. The expense ratios of the Underlying Series were 0.82% for Manning & Napier Pro-Blend® Moderate Term Series - Class I and 0.82% for Manning & Napier Pro-Blend® Extended Term Series - Class I.
11Reflects activity of the Series and does not include the activity of the Underlying Series.
12Less than 1%.
13The increase to the expense ratios (to average net assets) is largely due to the small net assets in each class.
The accompanying notes are an integral part of the financial statements.
46
Financial Highlights
| TARGET 2015 SERIES CLASS I | FOR THE YEARS ENDED | FOR THE PERIOD | ||||||||||||||||||
| 10/31/16 | 10/31/15 | 10/31/14 | 10/31/13 | 6/25/121 TO 10/31/12 | ||||||||||||||||
Per share data (for a share outstanding throughout each period): | ||||||||||||||||||||
Net asset value - Beginning of period | $ | 11.21 | $ | 12.11 | $ | 11.83 | $ | 10.61 | $ | 10.00 | ||||||||||
|
|
|
|
|
|
|
|
|
| |||||||||||
Income (loss) from investment operations: | ||||||||||||||||||||
Net investment income2,3 | 0.16 | 0.15 | 0.14 | 0.11 | — | 4 | ||||||||||||||
Net realized and unrealized gain (loss) on investments | 0.11 | (0.35 | ) | 0.51 | 1.32 | 0.61 | ||||||||||||||
|
|
|
|
|
|
|
|
|
| |||||||||||
Total from investment operations | 0.27 | (0.20 | ) | 0.65 | 1.43 | 0.61 | ||||||||||||||
|
|
|
|
|
|
|
|
|
| |||||||||||
Less distributions to shareholders: | ||||||||||||||||||||
From net investment income | (0.15 | ) | (0.31 | ) | (0.28 | ) | (0.21 | ) | — | |||||||||||
From net realized gain on investments | (0.80 | ) | (0.39 | ) | (0.09 | ) | — | — | ||||||||||||
|
|
|
|
|
|
|
|
|
| |||||||||||
Total distributions to shareholders | (0.95 | ) | (0.70 | ) | (0.37 | ) | (0.21 | ) | — | |||||||||||
|
|
|
|
|
|
|
|
|
| |||||||||||
Net asset value - End of period | $ | 10.53 | $ | 11.21 | $ | 12.11 | $ | 11.83 | $ | 10.61 | ||||||||||
|
|
|
|
|
|
|
|
|
| |||||||||||
Net assets - End of period (000’s omitted) | $ | 2,657 | $ | 5,129 | $ | 4,785 | $ | 3,619 | $ | 209 | 5 | |||||||||
|
|
|
|
|
|
|
|
|
| |||||||||||
Total return6 | 2.85 | % | (1.78 | %) | 5.67 | % | 13.71 | % | 6.10 | % | ||||||||||
Ratios (to average net assets)/Supplemental Data: | ||||||||||||||||||||
Expenses* | 0.05 | %7 | 0.05 | %8 | 0.05 | %9 | 0.05 | %9 | 0.05 | %10,11 | ||||||||||
Net investment income (loss)3 | 1.53 | % | 1.28 | % | 1.12 | % | 1.01 | % | (0.05 | %)10 | ||||||||||
Series portfolio turnover12 | 49 | % | 46 | % | 46 | % | 50 | % | — | 13 | ||||||||||
| *The investment advisor paid a portion of the Series’ expenses. If these expenses had been incurred by the Series, the expense ratios (to average net assets) would have been increased by the following amounts: | ||||||||||||||||||||
| 1.51 | %7 | 1.14 | %8 | 1.46 | %9 | 4.09 | %9 | 9,682 | %10,11,14 | |||||||||||
1Commencement of operations.
2Calculated based on average shares outstanding during the periods.
3Net investment income is affected by the timing of distributions from the Underlying Series in which the Series invest. The ratios do not include net investment income of the Underlying Series in which the Series invests.
4Less than $0.01.
5Represents the whole number without rounding to the 000s.
6Represents aggregate total return for the periods indicated. Total return would have been lower had certain expenses not been reimbursed. Periods less than one year are not annualized.
7Expense ratios do not include expenses of the Underlying Series in which the Series invests. The expense ratios of the Underlying Series were 0.67% for Manning & Napier Pro-Blend® Conservative Term Series - Class I and 0.82% for Manning & Napier Pro-Blend® Moderate Term Series - Class I.
8Expense ratios do not include expenses of the Underlying Series in which the Series invests. The expense ratios of the Underlying Series were 0.81% for Manning & Napier Pro-Blend® Moderate Term Series - Class I and 0.82% for Manning & Napier Pro-Blend® Extended Term Series - Class I.
9Expense ratios do not include expenses of the Underlying Series in which the Series invests. The expense ratios of the Underlying Series were 0.81% for Manning & Napier Pro-Blend® Moderate Term Series - Class I and 0.81% for Manning & Napier Pro-Blend® Extended Term Series - Class I.
10Annualized.
11Expense ratios do not include expenses of the Underlying Series in which the Series invests. The expense ratios of the Underlying Series were 0.82% for Manning & Napier Pro-Blend® Moderate Term Series - Class I and 0.82% for Manning & Napier Pro-Blend® Extended Term Series - Class I.
12Reflects activity of the Series and does not include the activity of the Underlying Series.
13Less than 1%.
14The increase to the expense ratios (to average net assets) is largely due to the small net assets in each class.
The accompanying notes are an integral part of the financial statements.
47
Financial Highlights
| TARGET 2020 SERIES CLASS K | FOR THE YEARS ENDED | |||||||||||||||||||
| 10/31/16 | 10/31/15 | 10/31/14 | 10/31/13 | 10/31/12 | ||||||||||||||||
Per share data (for a share outstanding throughout each year): | ||||||||||||||||||||
Net asset value - Beginning of year | $ | 9.45 | $ | 10.77 | $ | 10.79 | $ | 9.89 | $ | 10.12 | ||||||||||
|
|
|
|
|
|
|
|
|
| |||||||||||
Income (loss) from investment operations: | ||||||||||||||||||||
Net investment income1,2 | 0.09 | 0.11 | 0.11 | 0.12 | 0.17 | |||||||||||||||
Net realized and unrealized gain (loss) on investments | 0.12 | (0.33 | ) | 0.51 | 1.33 | 0.54 | ||||||||||||||
|
|
|
|
|
|
|
|
|
| |||||||||||
Total from investment operations | 0.21 | (0.22 | ) | 0.62 | 1.45 | 0.71 | ||||||||||||||
|
|
|
|
|
|
|
|
|
| |||||||||||
Less distributions to shareholders: | ||||||||||||||||||||
From net investment income | (0.10 | ) | (0.28 | ) | (0.25 | ) | (0.20 | ) | (0.21 | ) | ||||||||||
From net realized gain on investments | (0.81 | ) | (0.82 | ) | (0.39 | ) | (0.35 | ) | (0.73 | ) | ||||||||||
|
|
|
|
|
|
|
|
|
| |||||||||||
Total distributions to shareholders | (0.91 | ) | (1.10 | ) | (0.64 | ) | (0.55 | ) | (0.94 | ) | ||||||||||
|
|
|
|
|
|
|
|
|
| |||||||||||
Net asset value - End of year | $ | 8.75 | $ | 9.45 | $ | 10.77 | $ | 10.79 | $ | 9.89 | ||||||||||
|
|
|
|
|
|
|
|
|
| |||||||||||
Net assets - End of year (000’s omitted) | $ | 79,236 | $ | 80,006 | $ | 95,364 | $ | 82,841 | $ | 67,039 | ||||||||||
|
|
|
|
|
|
|
|
|
| |||||||||||
Total return3 | 2.83 | % | (2.24 | %) | 6.14 | % | 15.43 | % | 8.08 | % | ||||||||||
Ratios (to average net assets)/Supplemental Data: | ||||||||||||||||||||
Expenses* | 0.30 | %4 | 0.30 | %5 | 0.30 | %6 | 0.30 | %6 | 0.30 | %4 | ||||||||||
Net investment income2 | 1.08 | % | 1.17 | % | 1.06 | % | 1.20 | % | 1.72 | % | ||||||||||
Series portfolio turnover7 | 16 | % | 42 | % | 37 | % | 19 | % | 24 | % | ||||||||||
| *The investment advisor paid a portion of the Series’ expenses. If these expenses had been incurred by the Series, the expense ratios (to average net assets) would have been increased by the following amounts: | ||||||||||||||||||||
|
| 0.06
| %4
|
| 0.04
| %5
|
| 0.03
| % 6
|
| 0.05
| %6
|
| 0.08
| %4
| ||||||
| TARGET 2020 SERIES CLASS R | FOR THE YEARS ENDED | |||||||||||||||||||
| 10/31/16 | 10/31/15 | 10/31/14 | 10/31/13 | 10/31/12 | ||||||||||||||||
Per share data (for a share outstanding throughout each year): | ||||||||||||||||||||
Net asset value - Beginning of year | $ | 9.34 | $ | 10.60 | $ | 10.66 | $ | 9.78 | $ | 10.02 | ||||||||||
|
|
|
|
|
|
|
|
|
| |||||||||||
Income (loss) from investment operations: | ||||||||||||||||||||
Net investment income1,2 | 0.09 | 0.12 | 0.09 | 0.09 | 0.14 | |||||||||||||||
Net realized and unrealized gain (loss) on investments | 0.09 | (0.32 | ) | 0.47 | 1.32 | 0.54 | ||||||||||||||
|
|
|
|
|
|
|
|
|
| |||||||||||
Total from investment operations | 0.18 | (0.20 | ) | 0.56 | 1.41 | 0.68 | ||||||||||||||
|
|
|
|
|
|
|
|
|
| |||||||||||
Less distributions to shareholders: | ||||||||||||||||||||
From net investment income | (0.07 | ) | (0.24 | ) | (0.23 | ) | (0.18 | ) | (0.19 | ) | ||||||||||
From net realized gain on investments | (0.81 | ) | (0.82 | ) | (0.39 | ) | (0.35 | ) | (0.73 | ) | ||||||||||
|
|
|
|
|
|
|
|
|
| |||||||||||
Total distributions to shareholders | (0.88 | ) | (1.06 | ) | (0.62 | ) | (0.53 | ) | (0.92 | ) | ||||||||||
|
|
|
|
|
|
|
|
|
| |||||||||||
Net asset value - End of year | $ | 8.64 | $ | 9.34 | $ | 10.60 | $ | 10.66 | $ | 9.78 | ||||||||||
|
|
|
|
|
|
|
|
|
| |||||||||||
Net assets - End of year (000’s omitted) | $ | 4,553 | $ | 8,193 | $ | 22,564 | $ | 30,393 | $ | 19,150 | ||||||||||
|
|
|
|
|
|
|
|
|
| |||||||||||
Total return3 | 2.56 | % | (2.13 | %) | 5.55 | % | 15.07 | % | 7.82 | % | ||||||||||
Ratios (to average net assets)/Supplemental Data: | ||||||||||||||||||||
Expenses* | 0.55 | %4 | 0.55 | %5 | 0.55 | %6 | 0.55 | %6 | 0.55 | %4 | ||||||||||
Net investment income2 | 1.04 | % | 1.24 | % | 0.83 | % | 0.85 | % | 1.47 | % | ||||||||||
Series portfolio turnover7 | 16 | % | 42 | % | 37 | % | 19 | % | 24 | % | ||||||||||
| *The investment advisor paid a portion of the Series’ expenses. If these expenses had been incurred by the Series, the expense ratios (to average net assets) would have been increased by the following amounts: | ||||||||||||||||||||
| 0.06 | %4 | 0.04 | %5 | 0.03 | %6 | 0.05 | %6 | 0.08 | %4 | |||||||||||
1Calculated based on average shares outstanding during the years.
2Net investment income is affected by the timing of distributions from the Underlying Series in which the Series invest. The ratios do not include net investment income of the Underlying Series in which the Series invests.
3Represents aggregate total return for the years indicated, and assumes reinvestment of all distributions. Total return would have been lower had certain expenses not been waived or reimbursed.
4Expense ratios do not include expenses of the Underlying Series in which the Series invests. The expense ratios of the Underlying Series were 0.82% for Manning & Napier Pro-Blend® Moderate Term Series - Class I and 0.82% for Manning & Napier Pro-Blend® Extended Term Series - Class I.
5Expense ratios do not include expenses of the Underlying Series in which the Series invests. The expense ratios of the Underlying Series were 0.81% for Manning & Napier Pro-Blend® Moderate Term Series - Class I and 0.82% for Manning & Napier Pro-Blend® Extended Term Series - Class I.
6Expense ratios do not include expenses of the Underlying Series in which the Series invests. The expense ratios of the Underlying Series were 0.81% for Manning & Napier Pro-Blend® Moderate Term Series - Class I and 0.81% for Manning & Napier Pro-Blend® Extended Term Series - Class I.
7Reflects activity of the Series and does not include the activity of the Underlying Series.
The accompanying notes are an integral part of the financial statements.
48
Financial Highlights
TARGET 2020 SERIES CLASS I | FOR THE YEARS ENDED | |||||||||||||||||||
| 10/31/16 | 10/31/15 | 10/31/14 | 10/31/13 | 10/31/12 | ||||||||||||||||
Per share data (for a share outstanding throughout each year): | ||||||||||||||||||||
Net asset value - Beginning of year | $ | 9.50 | $ | 10.81 | $ | 10.83 | $ | 9.93 | $ | 10.16 | ||||||||||
|
|
|
|
|
|
|
|
|
| |||||||||||
Income (loss) from investment operations: | ||||||||||||||||||||
Net investment income1,2 | 0.13 | 0.13 | 0.16 | 0.14 | 0.20 | |||||||||||||||
Net realized and unrealized gain (loss) on investments | 0.09 | (0.31 | ) | 0.49 | 1.34 | 0.54 | ||||||||||||||
|
|
|
|
|
|
|
|
|
| |||||||||||
Total from investment operations | 0.22 | (0.18 | ) | 0.65 | 1.48 | 0.74 | ||||||||||||||
|
|
|
|
|
|
|
|
|
| |||||||||||
Less distributions to shareholders: | ||||||||||||||||||||
From net investment income | (0.12 | ) | (0.31 | ) | (0.28 | ) | (0.23 | ) | (0.24 | ) | ||||||||||
From net realized gain on investments | (0.81 | ) | (0.82 | ) | (0.39 | ) | (0.35 | ) | (0.73 | ) | ||||||||||
|
|
|
|
|
|
|
|
|
| |||||||||||
Total distributions to shareholders | (0.93 | ) | (1.13 | ) | (0.67 | ) | (0.58 | ) | (0.97 | ) | ||||||||||
|
|
|
|
|
|
|
|
|
| |||||||||||
Net asset value - End of year | $ | 8.79 | $ | 9.50 | $ | 10.81 | $ | 10.83 | $ | 9.93 | ||||||||||
|
|
|
|
|
|
|
|
|
| |||||||||||
Net assets - End of year (000’s omitted) | $ | 46,194 | $ | 74,947 | $ | 61,673 | $ | 70,556 | $ | 39,523 | ||||||||||
|
|
|
|
|
|
|
|
|
| |||||||||||
Total return3 | 2.97 | % | (1.87 | %) | 6.37 | % | 15.65 | % | 8.36 | % | ||||||||||
Ratios (to average net assets)/Supplemental Data: | ||||||||||||||||||||
Expenses* | 0.05 | %4 | 0.05 | %5 | 0.05 | %6 | 0.05 | %6 | 0.05 | %4 | ||||||||||
Net investment income2 | 1.55 | % | 1.33 | % | 1.48 | % | 1.34 | % | 2.10 | % | ||||||||||
Series portfolio turnover7 | 16 | % | 42 | % | 37 | % | 19 | % | 24 | % | ||||||||||
| *The investment advisor paid a portion of the Series’ expenses. If these expenses had been incurred by the Series, the expense ratios (to average net assets) would have been increased by the following amounts: | ||||||||||||||||||||
| 0.06 | %4 | 0.04 | %5 | 0.03 | %6 | 0.05 | %6 | 0.08 | %4 | |||||||||||
1Calculated based on average shares outstanding during the years.
2Net investment income is affected by the timing of distributions from the Underlying Series in which the Series invest. The ratios do not include net investment income of the Underlying Series in which the Series invests.
3Represents aggregate total return for the years indicated, and assumes reinvestment of all distributions. Total return would have been lower had certain expenses not been waived or reimbursed.
4Expense ratios do not include expenses of the Underlying Series in which the Series invests. The expense ratios of the Underlying Series were 0.82% for Manning & Napier Pro-Blend® Moderate Term Series - Class I and 0.82% for Manning & Napier Pro-Blend® Extended Term Series - Class I.
5Expense ratios do not include expenses of the Underlying Series in which the Series invests. The expense ratios of the Underlying Series were 0.81% for Manning & Napier Pro-Blend® Moderate Term Series - Class I and 0.82% for Manning & Napier Pro-Blend® Extended Term Series - Class I.
6Expense ratios do not include expenses of the Underlying Series in which the Series invests. The expense ratios of the Underlying Series were 0.81% for Manning & Napier Pro-Blend® Moderate Term Series - Class I and 0.81% for Manning & Napier Pro-Blend® Extended Term Series - Class I.
7Reflects activity of the Series and does not include the activity of the Underlying Series.
The accompanying notes are an integral part of the financial statements.
49
Financial Highlights
TARGET 2025 SERIES CLASS K | FOR THE YEARS ENDED | FOR THE PERIOD | ||||||||||||||||||
| 10/31/16 | 10/31/15 | 10/31/14 | 10/31/13 | 6/25/121 TO 10/31/12 | ||||||||||||||||
Per share data (for a share outstanding throughout each period): | ||||||||||||||||||||
Net asset value - Beginning of period | $ | 11.82 | $ | 13.01 | $ | 12.50 | $ | 10.77 | $ | 10.00 | ||||||||||
|
|
|
|
|
|
|
|
|
| |||||||||||
Income (loss) from investment operations: | ||||||||||||||||||||
Net investment income2,3 | 0.12 | 0.12 | 0.09 | 0.09 | (0.01 | ) | ||||||||||||||
Net realized and unrealized gain (loss) on investments | 0.15 | (0.40 | ) | 0.80 | 1.85 | 0.78 | ||||||||||||||
|
|
|
|
|
|
|
|
|
| |||||||||||
Total from investment operations | 0.27 | (0.28 | ) | 0.89 | 1.94 | 0.77 | ||||||||||||||
|
|
|
|
|
|
|
|
|
| |||||||||||
Less distributions to shareholders: | ||||||||||||||||||||
From net investment income | (0.13 | ) | (0.43 | ) | (0.34 | ) | (0.21 | ) | — | |||||||||||
From net realized gain on investments | (0.94 | ) | (0.48 | ) | (0.04 | ) | — | — | ||||||||||||
|
|
|
|
|
|
|
|
|
| |||||||||||
Total distributions to shareholders | (1.07 | ) | (0.91 | ) | (0.38 | ) | (0.21 | ) | — | |||||||||||
|
|
|
|
|
|
|
|
|
| |||||||||||
Net asset value - End of period | $ | 11.02 | $ | 11.82 | $ | 13.01 | $ | 12.50 | $ | 10.77 | ||||||||||
|
|
|
|
|
|
|
|
|
| |||||||||||
Net assets - End of period (000’s omitted) | $ | 13,381 | $ | 11,896 | $ | 7,501 | $ | 710 | $ | 47,648 | 4 | |||||||||
|
|
|
|
|
|
|
|
|
| |||||||||||
Total return5 | 2.86 | % | (2.31 | %) | 7.28 | % | 18.32 | % | 7.70 | % | ||||||||||
Ratios (to average net assets)/Supplemental Data: | ||||||||||||||||||||
Expenses* | 0.30 | %6 | 0.30 | %7 | 0.30 | %8 | 0.30 | %8 | 0.30 | %9,10 | ||||||||||
Net investment income (loss)3 | 1.08 | % | 1.01 | % | 0.66 | % | 0.80 | % | (0.30 | %)9 | ||||||||||
Series portfolio turnover11 | 51 | % | 27 | % | 30 | % | 22 | % | — | 12 | ||||||||||
| *The investment advisor paid a portion of the Series’ expenses. If these expenses had been incurred by the Series, the expense ratios (to average net assets) would have been increased by the following amounts: | ||||||||||||||||||||
|
| 0.33
| %6
|
| 0.39
| %7
|
| 0.59
| %8
|
| 10.70
| %8
|
| 259
| %9,10,13
| ||||||
| TARGET 2025 SERIES CLASS R | FOR THE YEARS ENDED | FOR THE PERIOD | ||||||||||||||||||
| 10/31/16 | 10/31/15 | 10/31/14 | 10/31/13 | 6/25/121 TO 10/31/12 | ||||||||||||||||
Per share data (for a share outstanding throughout each period): | ||||||||||||||||||||
Net asset value - Beginning of period | $ | 11.86 | $ | 13.02 | $ | 12.53 | $ | 10.75 | $ | 10.00 | ||||||||||
|
|
|
|
|
|
|
|
|
| |||||||||||
Income (loss) from investment operations: | ||||||||||||||||||||
Net investment income (loss)2,3 | 0.09 | 0.13 | 0.10 | (0.01 | ) | (0.02 | ) | |||||||||||||
Net realized and unrealized gain (loss) on investments | 0.14 | (0.43 | ) | 0.75 | 1.98 | 0.77 | ||||||||||||||
|
|
|
|
|
|
|
|
|
| |||||||||||
Total from investment operations | 0.23 | (0.30 | ) | 0.85 | 1.97 | 0.75 | ||||||||||||||
|
|
|
|
|
|
|
|
|
| |||||||||||
Less distributions to shareholders: | ||||||||||||||||||||
From net investment income | (0.10 | ) | (0.38 | ) | (0.32 | ) | (0.19 | ) | — | |||||||||||
From net realized gain on investments | (0.94 | ) | (0.48 | ) | (0.04 | ) | — | — | ||||||||||||
|
|
|
|
|
|
|
|
|
| |||||||||||
Total distributions to shareholders | (1.04 | ) | (0.86 | ) | (0.36 | ) | (0.19 | ) | — | |||||||||||
|
|
|
|
|
|
|
|
|
| |||||||||||
Net asset value - End of period | $ | 11.05 | $ | 11.86 | $ | 13.02 | $ | 12.53 | $ | 10.75 | ||||||||||
|
|
|
|
|
|
|
|
|
| |||||||||||
Net assets - End of period (000’s omitted) | $ | 1,671 | $ | 2,101 | $ | 3,799 | $ | 1,540 | $ | 108 | 4 | |||||||||
|
|
|
|
|
|
|
|
|
| |||||||||||
Total return5 | 2.50 | % | (2.44 | %) | 6.93 | % | 18.61 | % | 7.50 | % | ||||||||||
Ratios (to average net assets)/Supplemental Data: | ||||||||||||||||||||
Expenses* | 0.55 | %6 | 0.55 | %7 | 0.55 | %8 | 0.55 | %8 | 0.55 | %9,10 | ||||||||||
Net investment income (loss)3 | 0.87 | % | 1.07 | % | 0.75 | % | (0.10 | %) | (0.55 | %)9 | ||||||||||
Series portfolio turnover11 | 51 | % | 27 | % | 30 | % | 22 | % | — | 12 | ||||||||||
| *The investment advisor paid a portion of the Series’ expenses. If these expenses had been incurred by the Series, the expense ratios (to average net assets) would have been increased by the following amounts: | ||||||||||||||||||||
| 0.33 | %6 | 0.39 | %7 | 0.62 | %8 | 1.75 | %8 | 3,129 | %9,10,13 | |||||||||||
1Commencement of operations.
2Calculated based on average shares outstanding during the periods.
3Net investment income is affected by the timing of distributions from the Underlying Series in which the Series invest. The ratios do not include net investment income of the Underlying Series in which the Series invests.
4Represents the whole number without rounding to the 000s.
5Represents aggregate total return for the periods indicated. Total return would have been lower had certain expenses not been reimbursed. Periods less than one year are not annualized.
6Expense ratios do not include expenses of the Underlying Series in which the Series invests. The expense ratios of the Underlying Series were 0.82% for Manning & Napier Pro-Blend® Moderate Term Series - Class I and 0.82% for Manning & Napier Pro-Blend® Extended Term Series - Class I.
7Expense ratios do not include expenses of the Underlying Series in which the Series invests. The expense ratios of the Underlying Series were 0.82% for Manning & Napier Pro-Blend® Extended Term Series - Class I and 0.83% for Manning & Napier Pro-Blend® Maximum Term Series - Class I.
8Expense ratios do not include expenses of the Underlying Series in which the Series invests. The expense ratios of the Underlying Series were 0.81% for Manning & Napier Pro-Blend® Extended Term Series - Class I and 0.82% for Manning & Napier Pro-Blend® Maximum Term Series - Class I.
9Annualized.
10Expense ratios do not include expenses of the Underlying Series in which the Series invests. The expense ratios of the Underlying Series were 0.82% for Manning & Napier Pro-Blend® Extended Term Series - Class I and 0.84% for Manning & Napier Pro-Blend® Maximum Term Series - Class I.
11Reflects activity of the Series and does not include the activity of the Underlying Series.
12Less than 1%.
13The increase to the expense ratios (to average net assets) is largely due to the small net assets in each class.
The accompanying notes are an integral part of the financial statements.
50
Financial Highlights
| TARGET 2025 SERIES CLASS I | FOR THE YEARS ENDED | FOR THE PERIOD | ||||||||||||||||||
| 10/31/16 | 10/31/15 | 10/31/14 | 10/31/13 | 6/25/121 TO 10/31/12 | ||||||||||||||||
Per share data (for a share outstanding throughout each period): | ||||||||||||||||||||
Net asset value - Beginning of period | $ | 11.80 | $ | 12.98 | $ | 12.47 | $ | 10.77 | $ | 10.00 | ||||||||||
|
|
|
|
|
|
|
|
|
| |||||||||||
Income (loss) from investment operations: | ||||||||||||||||||||
Net investment income2,3 | 0.15 | 0.16 | 0.16 | 0.12 | — | 4 | ||||||||||||||
Net realized and unrealized gain (loss) on investments | 0.14 | (0.40 | ) | 0.75 | 1.81 | 0.77 | ||||||||||||||
|
|
|
|
|
|
|
|
|
| |||||||||||
Total from investment operations | 0.29 | (0.24 | ) | 0.91 | 1.93 | 0.77 | ||||||||||||||
|
|
|
|
|
|
|
|
|
| |||||||||||
Less distributions to shareholders: | ||||||||||||||||||||
From net investment income | (0.16 | ) | (0.46 | ) | (0.36 | ) | (0.23 | ) | — | |||||||||||
From net realized gain on investments | (0.94 | ) | (0.48 | ) | (0.04 | ) | — | — | ||||||||||||
|
|
|
|
|
|
|
|
|
| |||||||||||
Total distributions to shareholders | (1.10 | ) | (0.94 | ) | (0.40 | ) | (0.23 | ) | — | |||||||||||
|
|
|
|
|
|
|
|
|
| |||||||||||
Net asset value - End of period | $ | 10.99 | $ | 11.80 | $ | 12.98 | $ | 12.47 | $ | 10.77 | ||||||||||
|
|
|
|
|
|
|
|
|
| |||||||||||
Net assets - End of period (000’s omitted) | $ | 15,384 | $ | 15,539 | $ | 13,046 | $ | 9,373 | $ | 211 | 5 | |||||||||
|
|
|
|
|
|
|
|
|
| |||||||||||
Total return6 | 3.04 | % | (2.00 | %) | 7.51 | % | 18.26 | % | 7.70 | % | ||||||||||
Ratios (to average net assets)/Supplemental Data: | ||||||||||||||||||||
Expenses* | 0.05 | %7 | 0.05 | %8 | 0.05 | %9 | 0.05 | %9 | 0.05 | %10,11 | ||||||||||
Net investment income (loss)3 | 1.38 | % | 1.29 | % | 1.22 | % | 1.03 | % | (0.05 | %)10 | ||||||||||
Series portfolio turnover12 | 51 | % | 27 | % | 30 | % | 22 | % | — | 13 | ||||||||||
| *The investment advisor paid a portion of the Series’ expenses. If these expenses had been incurred by the Series, the expense ratios (to average net assets) would have been increased by the following amounts: | ||||||||||||||||||||
| 0.33 | %7 | 0.39 | %8 | 0.64 | %9 | 1.43 | %9 | 1,967 | %10,11,14 | |||||||||||
1Commencement of operations.
2Calculated based on average shares outstanding during the periods.
3Net investment income is affected by the timing of distributions from the Underlying Series in which the Series invest. The ratios do not include net investment income of the Underlying Series in which the Series invests.
4Less than $0.01.
5Represents the whole number without rounding to the 000s.
6Represents aggregate total return for the periods indicated. Total return would have been lower had certain expenses not been reimbursed. Periods less than one year are not annualized.
7Expense ratios do not include expenses of the Underlying Series in which the Series invests. The expense ratios of the Underlying Series were 0.82% for Manning & Napier Pro-Blend® Moderate Term Series - Class I and 0.82% for Manning & Napier Pro-Blend® Extended Term Series - Class I.
8Expense ratios do not include expenses of the Underlying Series in which the Series invests. The expense ratios of the Underlying Series were 0.82% for Manning & Napier Pro-Blend® Extended Term Series - Class I and 0.83% for Manning & Napier Pro-Blend® Maximum Term Series - Class I.
9Expense ratios do not include expenses of the Underlying Series in which the Series invests. The expense ratios of the Underlying Series were 0.81% for Manning & Napier Pro-Blend® Extended Term Series - Class I and 0.82% for Manning & Napier Pro-Blend® Maximum Term Series - Class I.
10Annualized.
11Expense ratios do not include expenses of the Underlying Series in which the Series invests. The expense ratios of the Underlying Series were 0.82% for Manning & Napier Pro-Blend® Extended Term Series - Class I and 0.84% for Manning & Napier Pro-Blend® Maximum Term Series - Class I.
12Reflects activity of the Series and does not include the activity of the Underlying Series.
13Less than 1%.
14The increase to the expense ratios (to average net assets) is largely due to the small net assets in each class.
The accompanying notes are an integral part of the financial statements.
51
Financial Highlights
TARGET 2030 SERIES CLASS K | FOR THE YEARS ENDED | |||||||||||||||||||
| 10/31/16 | 10/31/15 | 10/31/14 | 10/31/13 | 10/31/12 | ||||||||||||||||
Per share data (for a share outstanding throughout each year): | ||||||||||||||||||||
Net asset value - Beginning of year | $ | 9.78 | $ | 11.52 | $ | 11.40 | $ | 9.94 | $ | 10.02 | ||||||||||
|
|
|
|
|
|
|
|
|
| |||||||||||
Income (loss) from investment operations: | ||||||||||||||||||||
Net investment income1,2 | 0.08 | 0.11 | 0.10 | 0.10 | 0.14 | |||||||||||||||
Net realized and unrealized gain (loss) on investments | 0.13 | (0.34 | ) | 0.73 | 1.86 | 0.66 | ||||||||||||||
|
|
|
|
|
|
|
|
|
| |||||||||||
Total from investment operations | 0.21 | (0.23 | ) | 0.83 | 1.96 | 0.80 | ||||||||||||||
|
|
|
|
|
|
|
|
|
| |||||||||||
Less distributions to shareholders: | ||||||||||||||||||||
From net investment income | (0.09 | ) | (0.44 | ) | (0.35 | ) | (0.15 | ) | (0.17 | ) | ||||||||||
From net realized gain on investments | (1.31 | ) | (1.07 | ) | (0.36 | ) | (0.35 | ) | (0.71 | ) | ||||||||||
|
|
|
|
|
|
|
|
|
| |||||||||||
Total distributions to shareholders | (1.40 | ) | (1.51 | ) | (0.71 | ) | (0.50 | ) | (0.88 | ) | ||||||||||
|
|
|
|
|
|
|
|
|
| |||||||||||
Net asset value - End of year | $ | 8.59 | $ | 9.78 | $ | 11.52 | $ | 11.40 | $ | 9.94 | ||||||||||
|
|
|
|
|
|
|
|
|
| |||||||||||
Net assets - End of year (000’s omitted) | $ | 79,527 | $ | 79,169 | $ | 118,788 | $ | 91,676 | $ | 67,510 | ||||||||||
|
|
|
|
|
|
|
|
|
| |||||||||||
Total return3 | 3.12 | % | (2.33 | %) | 7.67 | % | 20.56 | % | 9.12 | % | ||||||||||
Ratios (to average net assets)/Supplemental Data: | ||||||||||||||||||||
Expenses* | 0.30 | %4 | 0.30 | %4 | 0.30 | %5 | 0.30 | %5 | 0.30 | %6 | ||||||||||
Net investment income2 | 0.94 | % | 1.11 | % | 0.87 | % | 0.90 | % | 1.50 | % | ||||||||||
Series portfolio turnover7 | 22 | % | 38 | % | 27 | % | 9 | % | 62 | % | ||||||||||
| *The investment advisor paid a portion of the Series’ expenses. If these expenses had been incurred by the Series, the expense ratios (to average net assets) would have been increased by the following amounts: | ||||||||||||||||||||
|
| 0.06
| %4
|
| 0.04
| %4
|
| 0.03
| %5
|
| 0.05
| %5
|
| 0.09
| %6
| ||||||
| TARGET 2030 SERIES CLASS R | FOR THE YEARS ENDED | |||||||||||||||||||
| 10/31/16 | 10/31/15 | 10/31/14 | 10/31/13 | 10/31/12 | ||||||||||||||||
Per share data (for a share outstanding throughout each year): | ||||||||||||||||||||
Net asset value - Beginning of year | $ | 9.70 | $ | 11.37 | $ | 11.31 | $ | 9.87 | $ | 9.96 | ||||||||||
|
|
|
|
|
|
|
|
|
| |||||||||||
Income (loss) from investment operations: | ||||||||||||||||||||
Net investment income1,2 | 0.07 | 0.10 | 0.07 | 0.07 | 0.09 | |||||||||||||||
Net realized and unrealized gain (loss) on investments | 0.12 | (0.30 | ) | 0.67 | 1.85 | 0.68 | ||||||||||||||
|
|
|
|
|
|
|
|
|
| |||||||||||
Total from investment operations | 0.19 | (0.20 | ) | 0.74 | 1.92 | 0.77 | ||||||||||||||
|
|
|
|
|
|
|
|
|
| |||||||||||
Less distributions to shareholders: | ||||||||||||||||||||
From net investment income | (0.07 | ) | (0.40 | ) | (0.32 | ) | (0.13 | ) | (0.15 | ) | ||||||||||
From net realized gain on investments | (1.31 | ) | (1.07 | ) | (0.36 | ) | (0.35 | ) | (0.71 | ) | ||||||||||
|
|
|
|
|
|
|
|
|
| |||||||||||
Total distributions to shareholders | (1.38 | ) | (1.47 | ) | (0.68 | ) | (0.48 | ) | (0.86 | ) | ||||||||||
|
|
|
|
|
|
|
|
|
| |||||||||||
Net asset value - End of year | $ | 8.51 | $ | 9.70 | $ | 11.37 | $ | 11.31 | $ | 9.87 | ||||||||||
|
|
|
|
|
|
|
|
|
| |||||||||||
Net assets - End of year (000’s omitted) | $ | 7,832 | $ | 11,115 | $ | 20,894 | $ | 28,034 | $ | 18,759 | ||||||||||
|
|
|
|
|
|
|
|
|
| |||||||||||
Total return3 | 2.85 | % | (2.11 | %) | 6.90 | % | 20.19 | % | 8.84 | % | ||||||||||
Ratios (to average net assets)/Supplemental Data: | ||||||||||||||||||||
Expenses* | 0.55 | %4 | 0.55 | %4 | 0.55 | %5 | 0.55 | %5 | 0.55 | %6 | ||||||||||
Net investment income2 | 0.84 | % | 0.95 | % | 0.62 | % | 0.63 | % | 0.94 | % | ||||||||||
Series portfolio turnover7 | 22 | % | 38 | % | 27 | % | 9 | % | 62 | % | ||||||||||
| *The investment advisor paid a portion of the Series’ expenses. If these expenses had been incurred by the Series, the expense ratios (to averagenet assets) would have been increased by the following amounts: | ||||||||||||||||||||
| 0.06 | %4 | 0.04 | %4 | 0.03 | %5 | 0.05 | %5 | 0.09 | %6 | |||||||||||
1Calculated based on average shares outstanding during the years.
2Net investment income is affected by the timing of distributions from the Underlying Series in which the Series invest. The ratios do not include net investment income of the Underlying Series in which the Series invests.
3Represents aggregate total return for the years indicated, and assumes reinvestment of all distributions. Total return would have been lower had certain expenses not been waived or reimbursed.
4Expense ratios do not include expenses of the Underlying Series in which the Series invests. The expense ratios of the Underlying Series were 0.82% for Manning & Napier Pro-Blend® Extended Term Series - Class I and 0.83% for Manning & Napier Pro-Blend® Maximum Term Series - Class I.
5Expense ratios do not include expenses of the Underlying Series in which the Series invests. The expense ratios of the Underlying Series were 0.81% for Manning & Napier Pro-Blend® Extended Term Series - Class I and 0.82% for Manning & Napier Pro-Blend® Maximum Term Series - Class I.
6Expense ratios do not include expenses of the Underlying Series in which the Series invests. The expense ratios of the Underlying Series were 0.82% for Manning & Napier Pro-Blend® Extended Term Series - Class I and 0.84% for Manning & Napier Pro-Blend® Maximum Term Series - Class I.
7Reflects activity of the Series and does not include the activity of the Underlying Series.
The accompanying notes are an integral part of the financial statements.
52
Financial Highlights
| TARGET 2030 SERIES CLASS I | FOR THE YEARS ENDED | |||||||||||||||||||
| 10/31/16 | 10/31/15 | 10/31/14 | 10/31/13 | 10/31/12 | ||||||||||||||||
Per share data (for a share outstanding throughout each year): | ||||||||||||||||||||
Net asset value - Beginning of year | $ | 9.87 | $ | 11.61 | $ | 11.48 | $ | 10.01 | $ | 10.09 | ||||||||||
|
|
|
|
|
|
|
|
|
| |||||||||||
Income (loss) from investment operations: | ||||||||||||||||||||
Net investment income1,2 | 0.12 | 0.12 | 0.14 | 0.12 | 0.17 | |||||||||||||||
Net realized and unrealized gain (loss) on investments | 0.11 | (0.32 | ) | 0.73 | 1.88 | 0.65 | ||||||||||||||
|
|
|
|
|
|
|
|
|
| |||||||||||
Total from investment operations | 0.23 | (0.20 | ) | 0.87 | 2.00 | 0.82 | ||||||||||||||
|
|
|
|
|
|
|
|
|
| |||||||||||
Less distributions to shareholders: | ||||||||||||||||||||
From net investment income | (0.11 | ) | (0.47 | ) | (0.38 | ) | (0.18 | ) | (0.19 | ) | ||||||||||
From net realized gain on investments | (1.31 | ) | (1.07 | ) | (0.36 | ) | (0.35 | ) | (0.71 | ) | ||||||||||
|
|
|
|
|
|
|
|
|
| |||||||||||
Total distributions to shareholders | (1.42 | ) | (1.54 | ) | (0.74 | ) | (0.53 | ) | (0.90 | ) | ||||||||||
|
|
|
|
|
|
|
|
|
| |||||||||||
Net asset value - End of year | $ | 8.68 | $ | 9.87 | $ | 11.61 | $ | 11.48 | $ | 10.01 | ||||||||||
|
|
|
|
|
|
|
|
|
| |||||||||||
Net assets - End of year (000’s omitted) | $ | 53,551 | $ | 75,870 | $ | 58,075 | $ | 63,662 | $ | 37,832 | ||||||||||
|
|
|
|
|
|
|
|
|
| |||||||||||
Total return3 | 3.38 | % | (2.02 | %) | 7.95 | % | 20.81 | % | 9.36 | % | ||||||||||
Ratios (to average net assets)/Supplemental Data: | ||||||||||||||||||||
Expenses* | 0.05 | %4 | 0.05 | %4 | 0.05 | %5 | 0.05 | %5 | 0.05 | %6 | ||||||||||
Net investment income2 | 1.36 | % | 1.22 | % | 1.23 | % | 1.14 | % | 1.78 | % | ||||||||||
Series portfolio turnover7 | 22 | % | 38 | % | 27 | % | 9 | % | 62 | % | ||||||||||
| *The investment advisor paid a portion of the Series’ expenses. If these expenses had been incurred by the Series, the expense ratios (to average net assets) would have been increased by the following amounts: | ||||||||||||||||||||
| 0.06 | %4 | 0.04 | %4 | 0.03 | %5 | 0.05 | %5 | 0.09 | %6 | |||||||||||
1Calculated based on average shares outstanding during the years.
2Net investment income is affected by the timing of distributions from the Underlying Series in which the Series invest. The ratios do not include net investment income of the Underlying Series in which the Series invests.
3Represents aggregate total return for the years indicated, and assumes reinvestment of all distributions. Total return would have been lower had certain expenses not been waived or reimbursed.
4Expense ratios do not include expenses of the Underlying Series in which the Series invests. The expense ratios of the Underlying Series were 0.82% for Manning & Napier Pro-Blend® Extended Term Series - Class I and 0.83% for Manning & Napier Pro-Blend® Maximum Term Series - Class I.
5Expense ratios do not include expenses of the Underlying Series in which the Series invests. The expense ratios of the Underlying Series were 0.81% for Manning & Napier Pro-Blend® Extended Term Series - Class I and 0.82% for Manning & Napier Pro-Blend® Maximum Term Series - Class I.
6Expense ratios do not include expenses of the Underlying Series in which the Series invests. The expense ratios of the Underlying Series were 0.82% for Manning & Napier Pro-Blend® Extended Term Series - Class I and 0.84% for Manning & Napier Pro-Blend® Maximum Term Series - Class I.
7Reflects activity of the Series and does not include the activity of the Underlying Series.
The accompanying notes are an integral part of the financial statements.
53
Financial Highlights
| TARGET 2035 SERIES CLASS K | FOR THE YEARS ENDED | FOR THE PERIOD | ||||||||||||||||||
| 10/31/16 | 10/31/15 | 10/31/14 | 10/31/13 | 6/25/121 TO 10/31/12 | ||||||||||||||||
Per share data (for a share outstanding throughout each period): | ||||||||||||||||||||
Net asset value - Beginning of period | $ | 12.32 | $ | 13.71 | $ | 13.22 | $ | 10.92 | $ | 10.00 | ||||||||||
|
|
|
|
|
|
|
|
|
| |||||||||||
Income (loss) from investment operations: | ||||||||||||||||||||
Net investment income (loss)2,3 | 0.08 | 0.11 | 0.06 | 0.08 | (0.01 | ) | ||||||||||||||
Net realized and unrealized gain (loss) on investments | 0.21 | (0.38 | ) | 0.99 | 2.35 | 0.93 | 4 | |||||||||||||
|
|
|
|
|
|
|
|
|
| |||||||||||
Total from investment operations | 0.29 | (0.27 | ) | 1.05 | 2.43 | 0.92 | ||||||||||||||
|
|
|
|
|
|
|
|
|
| |||||||||||
Less distributions to shareholders: | ||||||||||||||||||||
From net investment income | (0.10 | ) | (0.61 | ) | (0.46 | ) | (0.13 | ) | — | |||||||||||
From net realized gain on investments | (1.21 | ) | (0.51 | ) | (0.10 | ) | — | — | ||||||||||||
|
|
|
|
|
|
|
|
|
| |||||||||||
Total distributions to shareholders | (1.31 | ) | (1.12 | ) | (0.56 | ) | (0.13 | ) | — | |||||||||||
|
|
|
|
|
|
|
|
|
| |||||||||||
Net asset value - End of period | $ | 11.30 | $ | 12.32 | $ | 13.71 | $ | 13.22 | $ | 10.92 | ||||||||||
|
|
|
|
|
|
|
|
|
| |||||||||||
Net assets - End of period (000’s omitted) | $ | 11,745 | $ | 8,979 | $ | 5,378 | $ | 465 | $ | 15,034 | 5 | |||||||||
|
|
|
|
|
|
|
|
|
| |||||||||||
Total return6 | 3.13 | % | (2.20 | %) | 8.17 | % | 22.42 | % | 9.20 | % | ||||||||||
Ratios (to average net assets)/Supplemental Data: | ||||||||||||||||||||
Expenses* | 0.30 | %7 | 0.30 | %7 | 0.30 | %8 | 0.30 | %8 | 0.30 | %9,10 | ||||||||||
Net investment income (loss)3 | 0.71 | % | 0.86 | % | 0.44 | % | 0.66 | % | (0.30 | %)9 | ||||||||||
Series portfolio turnover11 | 22 | % | 26 | % | 24 | % | 18 | % | — | 12 | ||||||||||
| *The investment advisor paid a portion of the Series’ expenses. If these expenses had been incurred by the Series, the expense ratios (to average net assets) would have been increased by the following amounts: | ||||||||||||||||||||
|
| 0.43
| %7
|
| 0.52
| %7
|
| 0.83
| %8
|
| 9.70
| %8
|
| 4,581
| %9,10,13
| ||||||
| TARGET 2035 SERIES CLASS R | FOR THE YEARS ENDED | FOR THE PERIOD | ||||||||||||||||||
| 10/31/16 | 10/31/15 | 10/31/14 | 10/31/13 | 6/25/121 TO 10/31/12 | ||||||||||||||||
Per share data (for a share outstanding throughout each period): | ||||||||||||||||||||
Net asset value - Beginning of period | $ | 12.34 | $ | 13.72 | $ | 13.25 | $ | 10.91 | $ | 10.00 | ||||||||||
|
|
|
|
|
|
|
|
|
| |||||||||||
Income (loss) from investment operations: | ||||||||||||||||||||
Net investment income (loss)2,3 | 0.06 | 0.08 | 0.07 | — | 14 | (0.02 | ) | |||||||||||||
Net realized and unrealized gain (loss) on investments | 0.21 | (0.38 | ) | 0.93 | 2.44 | 0.93 | 4 | |||||||||||||
|
|
|
|
|
|
|
|
|
| |||||||||||
Total from investment operations | 0.27 | (0.30 | ) | 1.00 | 2.44 | 0.91 | ||||||||||||||
|
|
|
|
|
|
|
|
|
| |||||||||||
Less distributions to shareholders: | ||||||||||||||||||||
From net investment income | (0.07 | ) | (0.57 | ) | (0.43 | ) | (0.10 | ) | — | |||||||||||
From net realized gain on investments | (1.21 | ) | (0.51 | ) | (0.10 | ) | — | — | ||||||||||||
|
|
|
|
|
|
|
|
|
| |||||||||||
Total distributions to shareholders | (1.28 | ) | (1.08 | ) | (0.53 | ) | (0.10 | ) | — | |||||||||||
|
|
|
|
|
|
|
|
|
| |||||||||||
Net asset value - End of period | $ | 11.33 | $ | 12.34 | $ | 13.72 | $ | 13.25 | $ | 10.91 | ||||||||||
|
|
|
|
|
|
|
|
|
| |||||||||||
Net assets - End of period (000’s omitted) | $ | 2,057 | $ | 2,337 | $ | 2,911 | $ | 1,172 | $ | 109 | 5 | |||||||||
|
|
|
|
|
|
|
|
|
| |||||||||||
Total return6 | 2.92 | % | (2.44 | %) | 7.82 | % | 22.50 | % | 9.10 | % | ||||||||||
Ratios (to average net | ||||||||||||||||||||
Expenses* | 0.55 | %7 | 0.55 | %7 | 0.55 | %8 | 0.55 | %8 | 0.55 | %9,10 | ||||||||||
Net investment income (loss)3 | 0.50 | % | 0.66 | % | 0.49 | % | 0.17 | % | (0.55 | %)9 | ||||||||||
Series portfolio turnover11 | 22 | % | 26 | % | 24 | % | 18 | % | — | 12 | ||||||||||
| *The investment advisor paid a portion of the Series’ expenses. If these expenses had been incurred by the Series, the expense ratios (to average net assets) would have been increased by the following amounts: | ||||||||||||||||||||
| 0.43 | %7 | 0.52 | %7 | 0.88 | %8 | 2.38 | %8 | 9,077 | %9,10,13 | |||||||||||
1Commencement of operations.
2Calculated based on average shares outstanding during the periods.
3Net investment income is affected by the timing of distributions from the Underlying Series in which the Series invest. The ratios do not include net investment income of the Underlying Series in which the Series invests.
4Amount does not coincide with the amount shown on the Statements of Changes in Net Assets due to the timing of capital stock transactions and when the Series experienced unrealized gains and losses during the period.
5Represents the whole number without rounding to the 000s.
6Represents aggregate total return for the periods indicated. Total return would have been lower had certain expenses not been reimbursed. Periods less than one year are not annualized.
7Expense ratios do not include expenses of the Underlying Series in which the Series invests. The expense ratios of the Underlying Series were 0.82% for Manning & Napier Pro-Blend® Extended Term Series - Class I and 0.83% for Manning & Napier Pro-Blend® Maximum Term Series - Class I.
8Expense ratios do not include expenses of the Underlying Series in which the Series invests. The expense ratios of the Underlying Series were 0.81% for Manning & Napier Pro-Blend® Extended Term Series - Class I and 0.82% for Manning & Napier Pro-Blend® Maximum Term Series - Class I.
9Annualized.
10Expense ratios do not include expenses of the Underlying Series in which the Series invests. The expense ratios of the Underlying Series were 0.82% for Manning & Napier Pro-Blend® Extended Term Series - Class I and 0.84% for Manning & Napier Pro-Blend® Maximum Term Series - Class I.
11Reflects activity of the Series and does not include the activity of the Underlying Series.
12Less than 1%.
13The increase to the expense ratios (to average net assets) is largely due to the small net assets in each class.
14Less than $0.01.
The accompanying notes are an integral part of the financial statements.
54
Financial Highlights
| TARGET 2035 SERIES CLASS I | FOR THE YEARS ENDED | FOR THE PERIOD | ||||||||||||||||||
| 10/31/16 | 10/31/15 | 10/31/14 | 10/31/13 | 6/25/121 TO 10/31/12 | ||||||||||||||||
Per share data (for a share outstanding throughout each period): | ||||||||||||||||||||
Net asset value - Beginning of period | $ | 12.36 | $ | 13.75 | $ | 13.25 | $ | 10.92 | $ | 10.00 | ||||||||||
|
|
|
|
|
|
|
|
|
| |||||||||||
Income (loss) from investment operations: | ||||||||||||||||||||
Net investment income2,3 | 0.11 | 0.14 | 0.12 | 0.09 | — | 4 | ||||||||||||||
Net realized and unrealized gain (loss) on investments | 0.21 | (0.38 | ) | 0.96 | 2.38 | 0.92 | 5 | |||||||||||||
|
|
|
|
|
|
|
|
|
| |||||||||||
Total from investment operations | 0.32 | (0.24 | ) | 1.08 | 2.47 | 0.92 | ||||||||||||||
|
|
|
|
|
|
|
|
|
| |||||||||||
Less distributions to shareholders: | ||||||||||||||||||||
From net investment income | (0.12 | ) | (0.64 | ) | (0.48 | ) | (0.14 | ) | — | |||||||||||
From net realized gain on investments | (1.21 | ) | (0.51 | ) | (0.10 | ) | — | — | ||||||||||||
|
|
|
|
|
|
|
|
|
| |||||||||||
Total distributions to shareholders | (1.33 | ) | (1.15 | ) | (0.58 | ) | (0.14 | ) | — | |||||||||||
|
|
|
|
|
|
|
|
|
| |||||||||||
Net asset value - End of period | $ | 11.35 | $ | 12.36 | $ | 13.75 | $ | 13.25 | $ | 10.92 | ||||||||||
|
|
|
|
|
|
|
|
|
| |||||||||||
Net assets - End of period (000’s omitted) | $ | 11,455 | $ | 10,993 | $ | 9,487 | $ | 6,322 | $ | 213 | 6 | |||||||||
|
|
|
|
|
|
|
|
|
| |||||||||||
Total return7 | 3.45 | % | (1.98 | %) | 8.43 | % | 22.81 | % | 9.20 | % | ||||||||||
Ratios (to average net assets)/Supplemental Data: | ||||||||||||||||||||
Expenses* | 0.05 | %8 | 0.05 | %8 | 0.05 | %9 | 0.05 | %9 | 0.05 | %10,11 | ||||||||||
Net investment income (loss)3 | 1.01 | % | 1.07 | % | 0.88 | % | 0.75 | % | (0.05 | %)10 | ||||||||||
Series portfolio turnover12 | 22 | % | 26 | % | 24 | % | 18 | % | — | 13 | ||||||||||
| *The investment advisor paid a portion of the Series’ expenses. If these expenses had been incurred by the Series, the expense ratios (to average net assets) would have been increased by the following amounts: | ||||||||||||||||||||
| 0.43 | %8 | 0.52 | %8 | 0.91 | %9 | 2.40 | %9 | 7,930 | %10,11,14 | |||||||||||
1Commencement of operations.
2Calculated based on average shares outstanding during the periods.
3Net investment income is affected by the timing of distributions from the Underlying Series in which the Series invest. The ratios do not include net investment income of the Underlying Series in which the Series invests.
4Less than $0.01.
5Amount does not coincide with the amount shown on the Statements of Changes in Net Assets due to the timing of capital stock transactions and when the Series experienced unrealized gains and losses during the period.
6Represents the whole number without rounding to the 000s.
7Represents aggregate total return for the periods indicated. Total return would have been lower had certain expenses not been reimbursed. Periods less than one year are not annualized.
8Expense ratios do not include expenses of the Underlying Series in which the Series invests. The expense ratios of the Underlying Series were 0.82% for Manning & Napier Pro-Blend® Extended Term Series - Class I and 0.83% for Manning & Napier Pro-Blend® Maximum Term Series - Class I.
9Expense ratios do not include expenses of the Underlying Series in which the Series invests. The expense ratios of the Underlying Series were 0.81% for Manning & Napier Pro-Blend® Extended Term Series - Class I and 0.82% for Manning & Napier Pro-Blend® Maximum Term Series - Class I.
10Annualized.
11Expense ratios do not include expenses of the Underlying Series in which the Series invests. The expense ratios of the Underlying Series were 0.82% for Manning & Napier Pro-Blend® Extended Term Series - Class I and 0.84% for Manning & Napier Pro-Blend® Maximum Term Series - Class I.
12Reflects activity of the Series and does not include the activity of the Underlying Series.
13Less than 1%.
14The increase to the expense ratios (to average net assets) is largely due to the small net assets in each class.
The accompanying notes are an integral part of the financial statements.
55
Financial Highlights
| TARGET 2040 SERIES CLASS K | FOR THE YEARS ENDED | |||||||||||||||||||
| 10/31/16 | 10/31/15 | 10/31/14 | 10/31/13 | 10/31/12 | ||||||||||||||||
Per share data (for a share outstanding throughout each year): | ||||||||||||||||||||
Net asset value - Beginning of year | $ | 10.13 | $ | 12.50 | $ | 12.47 | $ | 10.29 | $ | 10.10 | ||||||||||
|
|
|
|
|
|
|
|
|
| |||||||||||
Income (loss) from investment operations: | ||||||||||||||||||||
Net investment income1,2 | 0.05 | 0.09 | 0.07 | 0.06 | 0.07 | |||||||||||||||
Net realized and unrealized gain (loss) on investments | 0.16 | (0.32 | ) | 0.94 | 2.43 | 0.74 | ||||||||||||||
|
|
|
|
|
|
|
|
|
| |||||||||||
Total from investment operations | 0.21 | (0.23 | ) | 1.01 | 2.49 | 0.81 | ||||||||||||||
|
|
|
|
|
|
|
|
|
| |||||||||||
Less distributions to shareholders: | ||||||||||||||||||||
From net investment income | (0.06 | ) | (0.61 | ) | (0.48 | ) | (0.07 | ) | (0.08 | ) | ||||||||||
From net realized gain on investments | (1.55 | ) | (1.53 | ) | (0.50 | ) | (0.24 | ) | (0.54 | ) | ||||||||||
|
|
|
|
|
|
|
|
|
| |||||||||||
Total distributions to shareholders | (1.61 | ) | (2.14 | ) | (0.98 | ) | (0.31 | ) | (0.62 | ) | ||||||||||
|
|
|
|
|
|
|
|
|
| |||||||||||
Net asset value - End of year | $ | 8.73 | $ | 10.13 | $ | 12.50 | $ | 12.47 | $ | 10.29 | ||||||||||
|
|
|
|
|
|
|
|
|
| |||||||||||
Net assets - End of year (000’s omitted) | $ | 55,920 | $ | 51,931 | $ | 83,655 | $ | 67,576 | $ | 51,273 | ||||||||||
|
|
|
|
|
|
|
|
|
| |||||||||||
Total return3 | 3.24 | % | (2.30 | %) | 8.61 | % | 24.81 | % | 8.97 | % | ||||||||||
Ratios (to average net assets)/Supplemental Data: | ||||||||||||||||||||
Expenses* | 0.30 | %4 | 0.30 | %4 | 0.30 | %5 | 0.30 | %5 | 0.30 | %6 | ||||||||||
Net investment income2 | 0.57 | % | 0.80 | % | 0.54 | % | 0.49 | % | 0.70 | % | ||||||||||
Series portfolio turnover7 | 26 | % | 45 | % | 22 | % | 13 | % | 24 | % | ||||||||||
| *The investment advisor paid a portion of the Series’ expenses. If these expenses had been incurred by the Series, the expense ratios (to average net assets) would have been increased by the following amounts: | ||||||||||||||||||||
| | 0.10 | %4 | | 0.08 | %4 | | 0.06 | %5 | | 0.09 | %5 | | 0.14 | %6 | ||||||
| TARGET 2040 SERIES CLASS R | FOR THE YEARS ENDED | |||||||||||||||||||
| 10/31/16 | 10/31/15 | 10/31/14 | 10/31/13 | 10/31/12 | ||||||||||||||||
Per share data (for a share outstanding throughout each year): | ||||||||||||||||||||
Net asset value - Beginning of year | $ | 10.06 | $ | 12.33 | $ | 12.39 | $ | 10.22 | $ | 10.04 | ||||||||||
|
|
|
|
|
|
|
|
|
| |||||||||||
Income (loss) from investment operations: | ||||||||||||||||||||
Net investment income1,2 | 0.03 | 0.07 | 0.03 | 0.02 | 0.05 | |||||||||||||||
Net realized and unrealized gain (loss) on investments | 0.15 | (0.24 | ) | 0.86 | 2.42 | 0.73 | ||||||||||||||
|
|
|
|
|
|
|
|
|
| |||||||||||
Total from investment operations | 0.18 | (0.17 | ) | 0.89 | 2.44 | 0.78 | ||||||||||||||
|
|
|
|
|
|
|
|
|
| |||||||||||
Less distributions to shareholders: | ||||||||||||||||||||
From net investment income | (0.03 | ) | (0.57 | ) | (0.45 | ) | (0.03 | ) | (0.06 | ) | ||||||||||
From net realized gain on investments | (1.55 | ) | (1.53 | ) | (0.50 | ) | (0.24 | ) | (0.54 | ) | ||||||||||
|
|
|
|
|
|
|
|
|
| |||||||||||
Total distributions to shareholders | (1.58 | ) | (2.10 | ) | (0.95 | ) | (0.27 | ) | (0.60 | ) | ||||||||||
|
|
|
|
|
|
|
|
|
| |||||||||||
Net asset value - End of year | $ | 8.66 | $ | 10.06 | $ | 12.33 | $ | 12.39 | $ | 10.22 | ||||||||||
|
|
|
|
|
|
|
|
|
| |||||||||||
Net assets - End of year (000’s omitted) | $ | 4,653 | $ | 5,226 | $ | 10,469 | $ | 15,993 | $ | 11,827 | ||||||||||
|
|
|
|
|
|
|
|
|
| |||||||||||
Total return3 | 2.94 | % | (1.91 | %) | 7.60 | % | 24.50 | % | 8.67 | % | ||||||||||
Ratios (to average net assets)/Supplemental Data: | ||||||||||||||||||||
Expenses* | 0.55 | %4 | 0.55 | %4 | 0.55 | %5 | 0.55 | %5 | 0.55 | %6 | ||||||||||
Net investment income2 | 0.36 | % | 0.62 | % | 0.23 | % | 0.20 | % | 0.54 | % | ||||||||||
Series portfolio turnover7 | 26 | % | 45 | % | 22 | % | 13 | % | 24 | % | ||||||||||
| *The investment advisor paid a portion of the Series’ expenses. If these expenses had been incurred by the Series, the expense ratios (to average net assets) would have been increased by the following amounts: | ||||||||||||||||||||
| 0.10 | %4 | 0.08 | %4 | 0.06 | %5 | 0.09 | %5 | 0.14 | %6 | |||||||||||
1Calculated based on average shares outstanding during the years.
2Net investment income is affected by the timing of distributions from the Underlying Series in which the Series invest. The ratios do not include net investment income of the Underlying Series in which the Series invests.
3Represents aggregate total return for the years indicated, and assumes reinvestment of all distributions. Total return would have been lower had certain expenses not been waived or reimbursed.
4Expense ratios do not include expenses of the Underlying Series in which the Series invests. The expense ratios of the Underlying Series were 0.82% for Manning & Napier Pro-Blend® Extended Term Series - Class I and 0.83% for Manning & Napier Pro-Blend® Maximum Term Series - Class I.
5Expense ratios do not include expenses of the Underlying Series in which the Series invests. The expense ratios of the Underlying Series were 0.81% for Manning & Napier Pro-Blend® Extended Term Series - Class I and 0.82% for Manning & Napier Pro-Blend® Maximum Term Series - Class I.
6Expense ratios do not include expenses of the Underlying Series in which the Series invests. The expense ratios of the Underlying Series were 0.82% for Manning & Napier Pro-Blend® Extended Term Series - Class I and 0.84% for Manning & Napier Pro-Blend® Maximum Term Series - Class I.
7Reflects activity of the Series and does not include the activity of the Underlying Series.
The accompanying notes are an integral part of the financial statements.
56
Financial Highlights
| TARGET 2040 SERIES CLASS I | FOR THE YEARS ENDED | |||||||||||||||||||
| 10/31/16 | 10/31/15 | 10/31/14 | 10/31/13 | 10/31/12 | ||||||||||||||||
Per share data (for a share outstanding throughout each year): | ||||||||||||||||||||
Net asset value - Beginning of year | $ | 10.20 | $ | 12.58 | $ | 12.55 | $ | 10.35 | $ | 10.16 | ||||||||||
|
|
|
|
|
|
|
|
|
| |||||||||||
Income (loss) from investment operations: | ||||||||||||||||||||
Net investment income1,2 | 0.09 | 0.10 | 0.10 | 0.08 | 0.10 | |||||||||||||||
Net realized and unrealized gain (loss) on investments | 0.15 | (0.30 | ) | 0.94 | 2.45 | 0.74 | ||||||||||||||
|
|
|
|
|
|
|
|
|
| |||||||||||
Total from investment operations | 0.24 | (0.20 | ) | 1.04 | 2.53 | 0.84 | ||||||||||||||
|
|
|
|
|
|
|
|
|
| |||||||||||
Less distributions to shareholders: | ||||||||||||||||||||
From net investment income | (0.08 | ) | (0.65 | ) | (0.51 | ) | (0.09 | ) | (0.11 | ) | ||||||||||
From net realized gain on investments | (1.55 | ) | (1.53 | ) | (0.50 | ) | (0.24 | ) | (0.54 | ) | ||||||||||
|
|
|
|
|
|
|
|
|
| |||||||||||
Total distributions to shareholders | (1.63 | ) | (2.18 | ) | (1.01 | ) | (0.33 | ) | (0.65 | ) | ||||||||||
|
|
|
|
|
|
|
|
|
| |||||||||||
Net asset value - End of year | $ | 8.81 | $ | 10.20 | $ | 12.58 | $ | 12.55 | $ | 10.35 | ||||||||||
|
|
|
|
|
|
|
|
|
| |||||||||||
Net assets - End of year (000’s omitted) | $ | 27,895 | $ | 43,552 | $ | 32,952 | $ | 33,545 | $ | 20,194 | ||||||||||
|
|
|
|
|
|
|
|
|
| |||||||||||
Total return3 | 3.60 | % | (2.08 | %) | 8.81 | % | 25.16 | % | 9.23 | % | ||||||||||
Ratios (to average net assets)/Supplemental Data: | ||||||||||||||||||||
Expenses* | 0.05 | %4 | 0.05 | %4 | 0.05 | %5 | 0.05 | %5 | 0.05 | %6 | ||||||||||
Net investment income2 | 0.99 | % | 0.96 | % | 0.79 | % | 0.71 | % | 0.99 | % | ||||||||||
Series portfolio turnover7 | 26 | % | 45 | % | 22 | % | 13 | % | 24 | % | ||||||||||
| *The investment advisor paid a portion of the Series’ expenses. If these expenses had been incurred by the Series, the expense ratios (to averagenet assets) would have been increased by the following amounts: | ||||||||||||||||||||
| 0.10 | %4 | 0.08 | %4 | 0.06 | %5 | 0.09 | %5 | 0.14 | %6 | |||||||||||
1Calculated based on average shares outstanding during the years.
2Net investment income is affected by the timing of distributions from the Underlying Series in which the Series invest. The ratios do not include net investment income of the Underlying Series in which the Series invests.
3Represents aggregate total return for the years indicated, and assumes reinvestment of all distributions. Total return would have been lower had certain expenses not been waived or reimbursed.
4Expense ratios do not include expenses of the Underlying Series in which the Series invests. The expense ratios of the Underlying Series were 0.82% for Manning & Napier Pro-Blend® Extended Term Series - Class I and 0.83% for Manning & Napier Pro-Blend® Maximum Term Series - Class I.
5Expense ratios do not include expenses of the Underlying Series in which the Series invests. The expense ratios of the Underlying Series were 0.81% for Manning & Napier Pro-Blend® Extended Term Series - Class I and 0.82% for Manning & Napier Pro-Blend® Maximum Term Series - Class I.
6Expense ratios do not include expenses of the Underlying Series in which the Series invests. The expense ratios of the Underlying Series were 0.82% for Manning & Napier Pro-Blend® Extended Term Series - Class I and 0.84% for Manning & Napier Pro-Blend® Maximum Term Series - Class I.
7Reflects activity of the Series and does not include the activity of the Underlying Series.
The accompanying notes are an integral part of the financial statements.
57
Financial Highlights
| TARGET 2045 SERIES CLASS K | FOR THE YEARS ENDED | FOR THE PERIOD | ||||||||||||||||||
| 10/31/16 | 10/31/15 | 10/31/14 | 10/31/13 | 6/25/121 TO 10/31/12 | ||||||||||||||||
Per share data (for a share outstanding throughout each period): | ||||||||||||||||||||
Net asset value - Beginning of period | $ | 12.71 | $ | 14.32 | $ | 13.73 | $ | 11.01 | $ | 10.00 | ||||||||||
|
|
|
|
|
|
|
|
|
| |||||||||||
Income (loss) from investment operations: | ||||||||||||||||||||
Net investment income (loss)2,3 | 0.04 | 0.08 | 0.03 | 0.03 | (0.01 | ) | ||||||||||||||
Net realized and unrealized gain (loss) on investments | 0.28 | (0.34 | ) | 1.15 | 2.74 | 1.02 | 4 | |||||||||||||
|
|
|
|
|
|
|
|
|
| |||||||||||
Total from investment operations | 0.32 | (0.26 | ) | 1.18 | 2.77 | 1.01 | ||||||||||||||
|
|
|
|
|
|
|
|
|
| |||||||||||
Less distributions to shareholders: | ||||||||||||||||||||
From net investment income | (0.06 | ) | (0.77 | ) | (0.52 | ) | (0.05 | ) | — | |||||||||||
From net realized gain on investments | (1.28 | ) | (0.58 | ) | (0.07 | ) | — | — | ||||||||||||
|
|
|
|
|
|
|
|
|
| |||||||||||
Total distributions to shareholders | (1.34 | ) | (1.35 | ) | (0.59 | ) | (0.05 | ) | — | |||||||||||
|
|
|
|
|
|
|
|
|
| |||||||||||
Net asset value - End of period | $ | 11.69 | $ | 12.71 | $ | 14.32 | $ | 13.73 | $ | 11.01 | ||||||||||
|
|
|
|
|
|
|
|
|
| |||||||||||
Net assets - End of period (000’s omitted) | $ | 6,793 | $ | 3,812 | $ | 3,041 | $ | 234 | $ | 3,320 | 5 | |||||||||
|
|
|
|
|
|
|
|
|
| |||||||||||
Total return6 | 3.26 | % | (2.10 | %) | 8.90 | % | 25.23 | % | 10.10 | % | ||||||||||
Ratios (to average net assets)/Supplemental Data: | ||||||||||||||||||||
Expenses* | 0.30 | %7 | 0.30 | %8 | 0.30 | %9 | 0.30 | %9 | 0.30 | %10,11 | ||||||||||
Net investment income (loss)3 | 0.33 | % | 0.58 | % | 0.23 | % | 0.26 | % | (0.30 | %)10 | ||||||||||
Series portfolio turnover12 | 26 | % | 28 | % | 48 | % | 20 | % | — | 13 | ||||||||||
| *The investment advisor paid a portion of the Series’ expenses. If these expenses had been incurred by the Series, the expense ratios (to average net assets) would have been increased by the following amounts: | ||||||||||||||||||||
| 0.89 | %7 | 1.21 | %8 | 1.95 | %9 | 17.80 | %9 | 3,204 | %10,11,14 | |||||||||||
| TARGET 2045 SERIES CLASS R | FOR THE YEARS ENDED | FOR THE PERIOD | ||||||||||||||||||
| 10/31/16 | 10/31/15 | 10/31/14 | 10/31/13 | 6/25/121 TO 10/31/12 | ||||||||||||||||
Per share data (for a share outstanding throughout each period): | ||||||||||||||||||||
Net asset value - Beginning of period | $ | 12.64 | $ | 14.25 | $ | 13.66 | $ | 10.99 | $ | 10.00 | ||||||||||
|
|
|
|
|
|
|
|
|
| |||||||||||
Income (loss) from investment operations: | ||||||||||||||||||||
Net investment income (loss)2,3 | 0.02 | 0.05 | 0.02 | 0.01 | (0.02 | ) | ||||||||||||||
Net realized and unrealized gain (loss) on investments | 0.27 | (0.35 | ) | 1.13 | 2.71 | 1.01 | 4 | |||||||||||||
|
|
|
|
|
|
|
|
|
| |||||||||||
Total from investment operations | 0.29 | (0.30 | ) | 1.15 | 2.72 | 0.99 | ||||||||||||||
|
|
|
|
|
|
|
|
|
| |||||||||||
Less distributions to shareholders: | ||||||||||||||||||||
From net investment income | (0.03 | ) | (0.73 | ) | (0.49 | ) | (0.05 | ) | — | |||||||||||
From net realized gain on investments | (1.28 | ) | (0.58 | ) | (0.07 | ) | — | — | ||||||||||||
|
|
|
|
|
|
|
|
|
| |||||||||||
Total distributions to shareholders | (1.31 | ) | (1.31 | ) | (0.56 | ) | (0.05 | ) | — | |||||||||||
|
|
|
|
|
|
|
|
|
| |||||||||||
Net asset value - End of period | $ | 11.62 | $ | 12.64 | $ | 14.25 | $ | 13.66 | $ | 10.99 | ||||||||||
|
|
|
|
|
|
|
|
|
| |||||||||||
Net assets - End of period (000’s omitted) | $ | 1,731 | $ | 1,631 | $ | 1,825 | $ | 618 | $ | 110 | 5 | |||||||||
|
|
|
|
|
|
|
|
|
| |||||||||||
Total return6 | 3.04 | % | (2.41 | %) | 8.71 | % | 24.87 | % | 9.90 | % | ||||||||||
Ratios (to average net assets)/Supplemental Data: | ||||||||||||||||||||
Expenses* | 0.55 | %7 | 0.55 | %8 | 0.55 | %9 | 0.55 | %9 | 0.55 | %10,11 | ||||||||||
Net investment income (loss)3 | 0.14 | % | 0.36 | % | 0.12 | % | 0.11 | % | (0.55 | %)10 | ||||||||||
Series portfolio turnover12 | 26 | % | 28 | % | 48 | % | 20 | % | — | 13 | ||||||||||
| *The investment advisor paid a portion of the Series’ expenses. If these expenses had been incurred by the Series, the expense ratios (to average net assets) would have been increased by the following amounts: | ||||||||||||||||||||
| 0.89 | %7 | 1.21 | %8 | 2.06 | %9 | 9.07 | %9 | 8,326 | %10,11,14 | |||||||||||
1Commencement of operations.
2Calculated based on average shares outstanding during the periods.
3Net investment income is affected by the timing of distributions from the Underlying Series in which the Series invest. The ratios do not include net investment income of the Underlying Series in which the Series invests.
4Amount does not coincide with the amount shown on the Statements of Changes in Net Assets due to the timing of capital stock transactions and when the Series experienced unrealized gains and losses during the period.
5Represents the whole number without rounding to the 000s.
6Represents aggregate total return for the periods indicated. Total return would have been lower had certain expenses not been reimbursed. Periods less than one year are not annualized.
7Expense ratios do not include expenses of the Underlying Series in which the Series invests. The expense ratios of the Underlying Series were 0.82% for Manning & Napier Pro-Blend® Extended Term Series - Class I and 0.83% for Manning & Napier Pro-Blend® Maximum Term Series - Class I.
8Expense ratios do not include expenses of the Underlying Series in which the Series invests. The expense ratio of the Underlying Series was 0.83%.
9Expense ratios do not include expenses of the Underlying Series in which the Series invests. The expense ratio of the Underlying Series was 0.82%.
10Annualized.
11Expense ratios do not include expenses of the Underlying Series in which the Series invests. The expense ratio of the Underlying Series was 0.84%.
12Reflects activity of the Series and does not include the activity of the Underlying Series.
13Less than 1%.
14The increase to the expense ratios (to average net assets) is largely due to the small net assets in each class.
The accompanying notes are an integral part of the financial statements.
58
Financial Highlights
| TARGET 2045 SERIES CLASS I | FOR THE YEARS ENDED | FOR THE PERIOD | ||||||||||||||||||
| 10/31/16 | 10/31/15 | 10/31/14 | 10/31/13 | 6/25/121 TO 10/31/12 | ||||||||||||||||
Per share data (for a share outstanding throughout each period): | ||||||||||||||||||||
Net asset value - Beginning of period | $ | 12.73 | $ | 14.35 | $ | 13.75 | $ | 11.01 | $ | 10.00 | ||||||||||
|
|
|
|
|
|
|
|
|
| |||||||||||
Income (loss) from investment operations: | ||||||||||||||||||||
Net investment income2,3 | 0.07 | 0.11 | 0.08 | 0.06 | — | 4 | ||||||||||||||
Net realized and unrealized gain (loss) on investments | 0.99 | (0.35 | ) | 1.14 | 2.74 | 1.01 | 5 | |||||||||||||
|
|
|
|
|
|
|
|
|
| |||||||||||
Total from investment operations | 1.06 | (0.24 | ) | 1.22 | 2.80 | 1.01 | ||||||||||||||
|
|
|
|
|
|
|
|
|
| |||||||||||
Less distributions to shareholders: | ||||||||||||||||||||
From net investment income | (0.80 | ) | (0.80 | ) | (0.55 | ) | (0.06 | ) | — | |||||||||||
From net realized gain on investments | (1.28 | ) | (0.58 | ) | (0.07 | ) | — | — | ||||||||||||
|
|
|
|
|
|
|
|
|
| |||||||||||
Total distributions to shareholders | (2.08 | ) | (1.38 | ) | (0.62 | ) | (0.06 | ) | — | |||||||||||
|
|
|
|
|
|
|
|
|
| |||||||||||
Net asset value - End of period | $ | 11.71 | $ | 12.73 | $ | 14.35 | $ | 13.75 | $ | 11.01 | ||||||||||
|
|
|
|
|
|
|
|
|
| |||||||||||
Net assets - End of period (000’s omitted) | $ | 5,548 | $ | 4,494 | $ | 2,894 | $ | 1,983 | $ | 214 | 6 | |||||||||
|
|
|
|
|
|
|
|
|
| |||||||||||
Total return7 | 3.49 | % | (1.92 | %) | 9.15 | % | 25.58 | % | 10.10 | % | ||||||||||
Ratios (to average net assets)/Supplemental Data: | ||||||||||||||||||||
Expenses* | 0.05 | %8 | 0.05 | %9 | 0.05 | %10 | 0.05 | %10 | 0.05 | %11,12 | ||||||||||
Net investment income (loss)3 | 0.64 | % | 0.86 | % | 0.57 | % | 0.46 | % | (0.05 | %)11 | ||||||||||
Series portfolio turnover13 | 26 | % | 28 | % | 48 | % | 20 | % | — | 14 | ||||||||||
| *The investment advisor paid a portion of the Series’ expenses. If these expenses had been incurred by the Series, the expense ratios (to average net assets) would have been increased by the following amounts: | ||||||||||||||||||||
| 0.89 | %8 | 1.21 | %9 | 2.14 | %10 | 6.82 | %10 | 7,036 | %11,12,15 | |||||||||||
1Commencement of operations.
2Calculated based on average shares outstanding during the periods.
3Net investment income is affected by the timing of distributions from the Underlying Series in which the Series invest. The ratios do not include net investment income of the Underlying Series in which the Series invests.
4Less than $0.01.
5Amount does not coincide with the amount shown on the Statements of Changes in Net Assets due to the timing of capital stock transactions and when the Series experienced unrealized gains and losses during the period.
6Represents the whole number without rounding to the 000s.
7Represents aggregate total return for the periods indicated. Total return would have been lower had certain expenses not been reimbursed. Periods less than one year are not annualized.
8Expense ratios do not include expenses of the Underlying Series in which the Series invests. The expense ratios of the Underlying Series were 0.82% for Manning & Napier Pro-Blend® Extended Term Series - Class I and 0.83% for Manning & Napier Pro-Blend® Maximum Term Series - Class I.
9Expense ratios do not include expenses of the Underlying Series in which the Series invests. The expense ratio of the Underlying Series was 0.83%.
10Expense ratios do not include expenses of the Underlying Series in which the Series invests. The expense ratio of the Underlying Series was 0.82%.
11Annualized.
12Expense ratios do not include expenses of the Underlying Series in which the Series invests. The expense ratio of the Underlying Series was 0.84%.
13Reflects activity of the Series and does not include the activity of the Underlying Series.
14Less than 1%.
15The increase to the expense ratios (to average net assets) is largely due to the small net assets in each class.
The accompanying notes are an integral part of the financial statements.
59
Financial Highlights
| TARGET 2050 SERIES CLASS K | FOR THE YEARS ENDED | |||||||||||||||||||
| 10/31/16 | 10/31/15 | 10/31/14 | 10/31/13 | 10/31/12 | ||||||||||||||||
Per share data (for a share outstanding throughout each year): | ||||||||||||||||||||
Net asset value - Beginning of year | $ | 11.35 | $ | 13.73 | $ | 13.52 | $ | 10.81 | $ | 10.20 | ||||||||||
|
|
|
|
|
|
|
|
|
| |||||||||||
Income (loss) from investment operations: | ||||||||||||||||||||
Net investment income1,2 | 0.04 | 0.09 | 0.05 | 0.05 | 0.07 | |||||||||||||||
Net realized and unrealized gain (loss) on investments | 0.18 | (0.32 | ) | 1.07 | 2.74 | 0.81 | ||||||||||||||
|
|
|
|
|
|
|
|
|
| |||||||||||
Total from investment operations | 0.22 | (0.23 | ) | 1.12 | 2.79 | 0.88 | ||||||||||||||
|
|
|
|
|
|
|
|
|
| |||||||||||
Less distributions to shareholders: | ||||||||||||||||||||
From net investment income | (0.04 | ) | (0.72 | ) | (0.54 | ) | (0.05 | ) | (0.08 | ) | ||||||||||
From net realized gain on investments | (2.12 | ) | (1.43 | ) | (0.37 | ) | (0.03 | ) | (0.19 | ) | ||||||||||
|
|
|
|
|
|
|
|
|
| |||||||||||
Total distributions to shareholders | (2.16 | ) | (2.15 | ) | (0.91 | ) | (0.08 | ) | (0.27 | ) | ||||||||||
|
|
|
|
|
|
|
|
|
| |||||||||||
Net asset value - End of year | $ | 9.41 | $ | 11.35 | $ | 13.73 | $ | 13.52 | $ | 10.81 | ||||||||||
|
|
|
|
|
|
|
|
|
| |||||||||||
Net assets - End of year (000’s omitted) | $ | 14,874 | $ | 15,144 | $ | 47,531 | $ | 36,591 | $ | 24,759 | ||||||||||
|
|
|
|
|
|
|
|
|
| |||||||||||
Total return3 | 3.43 | % | (2.15 | %) | 8.80 | % | 25.99 | % | 9.07 | % | ||||||||||
Ratios (to average net assets)/Supplemental Data: | ||||||||||||||||||||
Expenses* | 0.30 | %4 | 0.30 | %4 | 0.30 | %5 | 0.30 | %5 | 0.30 | %6 | ||||||||||
Net investment income2 | 0.40 | % | 0.72 | % | 0.40 | % | 0.37 | % | 0.69 | % | ||||||||||
Series portfolio turnover7 | 31 | % | 49 | % | 13 | % | 5 | % | 5 | % | ||||||||||
| *The investment advisor paid a portion of the Series’ expenses. If these expenses had been incurred by the Series, the expense ratios (to average net assets) would have been increased by the following amounts: | ||||||||||||||||||||
|
| 0.37
| %4
|
| 0.26
| %4
|
| 0.18
| %5
|
| 0.26
| %5
|
| 0.43
| %6
| ||||||
| TARGET 2050 SERIES CLASS R | FOR THE YEARS ENDED | |||||||||||||||||||
| 10/31/16 | 10/31/15 | 10/31/14 | 10/31/13 | 10/31/12 | ||||||||||||||||
Per share data (for a share outstanding throughout each year): | ||||||||||||||||||||
Net asset value - Beginning of year | $ | 11.25 | $ | 13.60 | $ | 13.43 | $ | 10.74 | $ | 10.14 | ||||||||||
|
|
|
|
|
|
|
|
|
| |||||||||||
Income (loss) from investment operations: | ||||||||||||||||||||
Net investment income1,2 | 0.01 | 0.06 | 0.01 | 0.01 | 0.05 | |||||||||||||||
Net realized and unrealized gain (loss) on investments | 0.18 | (0.29 | ) | 1.04 | 2.73 | 0.80 | ||||||||||||||
|
|
|
|
|
|
|
|
|
| |||||||||||
Total from investment operations | 0.19 | (0.23 | ) | 1.05 | 2.74 | 0.85 | ||||||||||||||
|
|
|
|
|
|
|
|
|
| |||||||||||
Less distributions to shareholders: | ||||||||||||||||||||
From net investment income | (0.02 | ) | (0.69 | ) | (0.51 | ) | (0.02 | ) | (0.06 | ) | ||||||||||
From net realized gain on investments | (2.12 | ) | (1.43 | ) | (0.37 | ) | (0.03 | ) | (0.19 | ) | ||||||||||
|
|
|
|
|
|
|
|
|
| |||||||||||
Total distributions to shareholders | (2.14 | ) | (2.12 | ) | (0.88 | ) | (0.05 | ) | (0.25 | ) | ||||||||||
|
|
|
|
|
|
|
|
|
| |||||||||||
Net asset value - End of year | $ | 9.30 | $ | 11.25 | $ | 13.60 | $ | 13.43 | $ | 10.74 | ||||||||||
|
|
|
|
|
|
|
|
|
| |||||||||||
Net assets - End of year (000’s omitted) | $ | 2,433 | $ | 2,215 | $ | 5,140 | $ | 5,022 | $ | 3,448 | ||||||||||
|
|
|
|
|
|
|
|
|
| |||||||||||
Total return3 | 3.09 | % | (2.17 | %) | 8.28 | % | 25.69 | % | 8.75 | % | ||||||||||
Ratios (to average net assets)/Supplemental Data: | ||||||||||||||||||||
Expenses* | 0.55 | %4 | 0.55 | %4 | 0.55 | %5 | 0.55 | %5 | 0.55 | %6 | ||||||||||
Net investment income2 | 0.12 | % | 0.54 | % | 0.10 | % | 0.11 | % | 0.45 | % | ||||||||||
Series portfolio turnover7 | 31 | % | 49 | % | 13 | % | 5 | % | 5 | % | ||||||||||
| *The investment advisor paid a portion of the Series’ expenses. If these expenses had been incurred by the Series, the expense ratios (to average net assets) would have been increased by the following amounts: | ||||||||||||||||||||
| 0.37 | %4 | 0.26 | %4 | 0.18 | %5 | 0.26 | %5 | 0.43 | %6 | |||||||||||
1Calculated based on average shares outstanding during the years.
2Net investment income is affected by the timing of distributions from the Underlying Series in which the Series invest. The ratios do not include net investment income of the Underlying Series in which the Series invests.
3Represents aggregate total return for the years indicated, and assumes reinvestment of all distributions. Total return would have been lower had certain expenses not been waived or reimbursed.
4Expense ratios do not include expenses of the Underlying Series in which the Series invests. The expense ratio of the Underlying Series was 0.83%.
5Expense ratios do not include expenses of the Underlying Series in which the Series invests. The expense ratio of the Underlying Series was 0.82%.
6Expense ratios do not include expenses of the Underlying Series in which the Series invests. The expense ratio of the Underlying Series was 0.84%.
7Reflects activity of the Series and does not include the activity of the Underlying Series.
The accompanying notes are an integral part of the financial statements.
60
Financial Highlights
| TARGET 2050 SERIES CLASS I | FOR THE YEARS ENDED | |||||||||||||||||||
| 10/31/16 | 10/31/15 | 10/31/14 | 10/31/13 | 10/31/12 | ||||||||||||||||
Per share data (for a share outstanding throughout each year): | ||||||||||||||||||||
Net asset value - Beginning of year | $ | 11.43 | $ | 13.82 | $ | 13.60 | $ | 10.88 | $ | 10.26 | ||||||||||
|
|
|
|
|
|
|
|
|
| |||||||||||
Income (loss) from investment operations: | ||||||||||||||||||||
Net investment income1,2 | 0.07 | 0.10 | 0.08 | 0.07 | 0.09 | |||||||||||||||
Net realized and unrealized gain (loss) on investments | 0.17 | (0.29 | ) | 1.08 | 2.76 | 0.83 | ||||||||||||||
|
|
|
|
|
|
|
|
|
| |||||||||||
Total from investment operations | 0.24 | (0.19 | ) | 1.16 | 2.83 | 0.92 | ||||||||||||||
|
|
|
|
|
|
|
|
|
| |||||||||||
Less distributions to shareholders: | ||||||||||||||||||||
From net investment income | (0.07 | ) | (0.77 | ) | (0.57 | ) | (0.08 | ) | (0.11 | ) | ||||||||||
From net realized gain on investments | (2.12 | ) | (1.43 | ) | (0.37 | ) | (0.03 | ) | (0.19 | ) | ||||||||||
|
|
|
|
|
|
|
|
|
| |||||||||||
Total distributions to shareholders | (2.19 | ) | (2.20 | ) | (0.94 | ) | (0.11 | ) | (0.30 | ) | ||||||||||
|
|
|
|
|
|
|
|
|
| |||||||||||
Net asset value - End of year | $ | 9.48 | $ | 11.43 | $ | 13.82 | $ | 13.60 | $ | 10.88 | ||||||||||
|
|
|
|
|
|
|
|
|
| |||||||||||
Net assets - End of year (000’s omitted) | $ | 12,928 | $ | 15,688 | $ | 12,077 | $ | 9,042 | $ | 4,016 | ||||||||||
|
|
|
|
|
|
|
|
|
| |||||||||||
Total return3 | 3.61 | % | (1.82 | %) | 9.07 | % | 26.21 | % | 9.39 | % | ||||||||||
Ratios (to average net assets)/Supplemental Data: | ||||||||||||||||||||
Expenses* | 0.05 | %4 | 0.05 | %4 | 0.05 | %5 | 0.05 | %5 | 0.05 | %6 | ||||||||||
Net investment income2 | 0.73 | % | 0.84 | % | 0.62 | % | 0.57 | % | 0.89 | % | ||||||||||
Series portfolio turnover7 | 31 | % | 49 | % | 13 | % | 5 | % | 5 | % | ||||||||||
| *The investment advisor paid a portion of the Series’ expenses. If these expenses had been incurred by the Series, the expense ratios (to average net assets) would have been increased by the following amounts: | ||||||||||||||||||||
| 0.37 | %4 | 0.26 | %4 | 0.18 | %5 | 0.26 | %5 | 0.43 | %6 | |||||||||||
1Calculated based on average shares outstanding during the years.
2Net investment income is affected by the timing of distributions from the Underlying Series in which the Series invest. The ratios do not include net investment income of the Underlying Series in which the Series invests.
3Represents aggregate total return for the years indicated, and assumes reinvestment of all distributions. Total return would have been lower had certain expenses not been waived or reimbursed.
4Expense ratios do not include expenses of the Underlying Series in which the Series invests. The expense ratio of the Underlying Series was 0.83%.
5Expense ratios do not include expenses of the Underlying Series in which the Series invests. The expense ratio of the Underlying Series was 0.82%.
6Expense ratios do not include expenses of the Underlying Series in which the Series invests. The expense ratio of the Underlying Series was 0.84%.
7Reflects activity of the Series and does not include the activity of the Underlying Series.
The accompanying notes are an integral part of the financial statements.
61
Financial Highlights
| TARGET 2055 SERIES CLASS K | FOR THE YEARS ENDED | FOR THE PERIOD | ||||||||||||||||||
| 10/31/16 | 10/31/15 | 10/31/14 | 10/31/13 | 6/25/121 TO 10/31/12 | ||||||||||||||||
Per share data (for a share outstanding throughout each period): | ||||||||||||||||||||
Net asset value - Beginning of period | $ | 12.56 | $ | 13.94 | $ | 13.85 | $ | 11.04 | $ | 10.00 | ||||||||||
|
|
|
|
|
|
|
|
|
| |||||||||||
Income (loss) from investment operations: | ||||||||||||||||||||
Net investment income (loss)2,3 | 0.03 | 0.09 | 0.06 | (0.02 | ) | (0.01 | ) | |||||||||||||
Net realized and unrealized gain (loss) on investments | 0.30 | (0.35 | ) | 1.05 | 2.86 | 1.05 | ||||||||||||||
|
|
|
|
|
|
|
|
|
| |||||||||||
Total from investment operations | 0.33 | (0.26 | ) | 1.11 | 2.84 | 1.04 | ||||||||||||||
|
|
|
|
|
|
|
|
|
| |||||||||||
Less distributions to shareholders: | ||||||||||||||||||||
From net investment income | (0.05 | ) | (0.74 | ) | (0.55 | ) | (0.03 | ) | — | |||||||||||
From net realized gain on investments | (1.14 | ) | (0.38 | ) | (0.47 | ) | — | — | ||||||||||||
|
|
|
|
|
|
|
|
|
| |||||||||||
Total distributions to shareholders | (1.19 | ) | (1.12 | ) | (1.02 | ) | (0.03 | ) | — | |||||||||||
|
|
|
|
|
|
|
|
|
| |||||||||||
Net asset value - End of period | $ | 11.70 | $ | 12.56 | $ | 13.94 | $ | 13.85 | $ | 11.04 | ||||||||||
|
|
|
|
|
|
|
|
|
| |||||||||||
Net assets - End of period (000’s omitted) | $ | 2,380 | $ | 1,142 | $ | 1,777 | $ | 208 | $ | 214 | 4 | |||||||||
|
|
|
|
|
|
|
|
|
| |||||||||||
Total return5 | 3.38 | % | (2.06 | %) | 8.50 | % | 25.79 | % | 10.40 | % | ||||||||||
Ratios (to average net assets)/Supplemental Data: | ||||||||||||||||||||
Expenses* | 0.30 | %6 | 0.30 | %6 | 0.30 | %7 | 0.30 | %7 | 0.30 | %8,9 | ||||||||||
Net investment income (loss)3 | 0.30 | % | 0.68 | % | 0.43 | % | (0.17 | %) | (0.30 | %)8 | ||||||||||
Series portfolio turnover10 | 30 | % | 55 | % | 63 | % | 605 | % | — | 11 | ||||||||||
| *The investment advisor paid a portion of the Series’ expenses. If these expenses had been incurred by the Series, the expense ratios (to average net assets) would have been increased by the following amounts: | ||||||||||||||||||||
|
| 2.44
| %6
|
| 3.68
| %6
|
| 4.79
| %7
|
| 62.25
| %7
|
| 19,197
| %8,9,12
| ||||||
| TARGET 2055 SERIES CLASS R | FOR THE YEARS ENDED | FOR THE PERIOD | ||||||||||||||||||
| 10/31/16 | 10/31/15 | 10/31/14 | 10/31/13 | 6/25/121 TO 10/31/12 | ||||||||||||||||
Per share data (for a share outstanding throughout each period): | ||||||||||||||||||||
Net asset value - Beginning of period | $ | 12.45 | $ | 13.83 | $ | 13.77 | $ | 11.03 | $ | 10.00 | ||||||||||
|
|
|
|
|
|
|
|
|
| |||||||||||
Income (loss) from investment operations: | ||||||||||||||||||||
Net investment income (loss)2,3 | 0.01 | 0.05 | 0.03 | (0.01 | ) | (0.02 | ) | |||||||||||||
Net realized and unrealized gain (loss) on investments | 0.30 | (0.34 | ) | 1.04 | 2.77 | 1.05 | ||||||||||||||
|
|
|
|
|
|
|
|
|
| |||||||||||
Total from investment operations | 0.31 | (0.29 | ) | 1.07 | 2.76 | 1.03 | ||||||||||||||
|
|
|
|
|
|
|
|
|
| |||||||||||
Less distributions to shareholders: | ||||||||||||||||||||
From net investment income | (0.03 | ) | (0.71 | ) | (0.54 | ) | (0.02 | ) | — | |||||||||||
From net realized gain on investments | (1.14 | ) | (0.38 | ) | (0.47 | ) | — | — | ||||||||||||
|
|
|
|
|
|
|
|
|
| |||||||||||
Total distributions to shareholders | (1.17 | ) | (1.09 | ) | (1.01 | ) | (0.02 | ) | — | |||||||||||
|
|
|
|
|
|
|
|
|
| |||||||||||
Net asset value - End of period | $ | 11.59 | $ | 12.45 | $ | 13.83 | $ | 13.77 | $ | 11.03 | ||||||||||
|
|
|
|
|
|
|
|
|
| |||||||||||
Net assets - End of period (000’s omitted) | $ | 519 | $ | 409 | $ | 515 | $ | 51 | $ | 110 | 4 | |||||||||
|
|
|
|
|
|
|
|
|
| |||||||||||
Total return5 | 3.18 | % | (2.32 | %) | 8.21 | % | 25.01 | % | 10.30 | % | ||||||||||
Ratios (to average net assets)/Supplemental Data: | ||||||||||||||||||||
Expenses* | 0.55 | %6 | 0.55 | %6 | 0.55 | %7 | 0.55 | %7 | 0.55 | %8,9 | ||||||||||
Net investment income (loss)3 | 0.11 | % | 0.39 | % | 0.24 | % | (0.07 | %) | (0.55 | %)8 | ||||||||||
Series portfolio turnover10 | 30 | % | 55 | % | 63 | % | 605 | % | — | 11 | ||||||||||
| *The investment advisor paid a portion of the Series’ expenses. If these expenses had been incurred by the Series, the expense ratios (to average net assets) would have been increased by the following amounts: | ||||||||||||||||||||
| 2.44 | %6 | 3.68 | %6 | 5.39 | %7 | 129.56 | %7 | 19,015 | %8,9,12 | |||||||||||
1Commencement of operations.
2Calculated based on average shares outstanding during the periods.
3Net investment income is affected by the timing of distributions from the Underlying Series in which the Series invest. The ratios do not include net investment income of the Underlying Series in which the Series invests.
4Represents the whole number without rounding to the 000s.
5Represents aggregate total return for the periods indicated. Total return would have been lower had certain expenses not been reimbursed. Periods less than one year are not annualized.
6Expense ratios do not include expenses of the Underlying Series in which the Series invests. The expense ratio of the Underlying Series was 0.83%.
7Expense ratios do not include expenses of the Underlying Series in which the Series invests. The expense ratio of the Underlying Series was 0.82%.
8Annualized.
9Expense ratios do not include expenses of the Underlying Series in which the Series invests. The expense ratio of the Underlying Series was 0.84%.
10Reflects activity of the Series and does not include the activity of the Underlying Series.
11The Series had no portfolio turnover for the period.
12The increase to the expense ratios (to average net assets) is largely due to the small net assets in each class.
The accompanying notes are an integral part of the financial statements.
62
Financial Highlights
| TARGET 2055 SERIES CLASS I | FOR THE YEARS ENDED | FOR THE PERIOD | ||||||||||||||||||
| 10/31/16 | 10/31/15 | 10/31/14 | 10/31/13 | 6/25/121 TO 10/31/12 | ||||||||||||||||
Per share data (for a share outstanding throughout each period): | ||||||||||||||||||||
Net asset value - Beginning of period | $ | 12.66 | $ | 14.05 | $ | 13.94 | $ | 11.05 | $ | 10.00 | ||||||||||
|
|
|
|
|
|
|
|
|
| |||||||||||
Income (loss) from investment operations: | ||||||||||||||||||||
Net investment income2,3 | 0.07 | 0.10 | 0.08 | — | 4 | — | 4 | |||||||||||||
Net realized and unrealized gain (loss) on investments | 0.30 | (0.33 | ) | 1.07 | 2.94 | 1.05 | ||||||||||||||
|
|
|
|
|
|
|
|
|
| |||||||||||
Total from investment operations | 0.37 | (0.23 | ) | 1.15 | 2.94 | 1.05 | ||||||||||||||
|
|
|
|
|
|
|
|
|
| |||||||||||
Less distributions to shareholders: | ||||||||||||||||||||
From net investment income | (0.08 | ) | (0.78 | ) | (0.57 | ) | (0.05 | ) | — | |||||||||||
From net realized gain on investments | (1.14 | ) | (0.38 | ) | (0.47 | ) | — | — | ||||||||||||
|
|
|
|
|
|
|
|
|
| |||||||||||
Total distributions to shareholders | (1.22 | ) | (1.16 | ) | (1.04 | ) | (0.05 | ) | — | |||||||||||
|
|
|
|
|
|
|
|
|
| |||||||||||
Net asset value - End of period | $ | 11.81 | $ | 12.66 | $ | 14.05 | $ | 13.94 | $ | 11.05 | ||||||||||
|
|
|
|
|
|
|
|
|
| |||||||||||
Net assets - End of period (000’s omitted) | $ | 2,783 | $ | 1,658 | $ | 872 | $ | 366 | $ | 215 | 5 | |||||||||
|
|
|
|
|
|
|
|
|
| |||||||||||
Total return6 | 3.69 | % | (1.83 | %) | 8.75 | % | 26.67 | % | 10.50 | % | ||||||||||
Ratios (to average net assets)/Supplemental Data: | ||||||||||||||||||||
Expenses* | 0.05 | %7 | 0.05 | %7 | 0.05 | %8 | 0.05 | %8 | 0.05 | %9,10 | ||||||||||
Net investment income (loss)3 | 0.58 | % | 0.80 | % | 0.57 | % | (0.03 | %) | (0.05 | %)9 | ||||||||||
Series portfolio turnover11 | 30 | % | 55 | % | 63 | % | 605 | % | — | 12 | ||||||||||
| *The investment advisor paid a portion of the Series’ expenses. If these expenses had been incurred by the Series, the expense ratios (to average the expense ratios (to average net assets) would have been increased by the following amount: | ||||||||||||||||||||
| 2.44 | %7 | 3.68 | %7 | 7.80 | %8 | 8.21 | %8 | 19,201 | %9,10,13 | |||||||||||
1Commencement of operations.
2Calculated based on average shares outstanding during the periods.
3Net investment income is affected by the timing of distributions from the Underlying Series in which the Series invest. The ratios do not include net investment income of the Underlying Series in which the Series invests.
4Less than $0.01.
5Represents the whole number without rounding to the 000s.
6Represents aggregate total return for the periods indicated. Total return would have been lower had certain expenses not been reimbursed. Periods less than one year are not annualized.
7Expense ratios do not include expenses of the Underlying Series in which the Series invests. The expense ratio of the Underlying Series was 0.83%.
8Expense ratios do not include expenses of the Underlying Series in which the Series invests. The expense ratio of the Underlying Series was 0.82%.
9Annualized.
10Expense ratios do not include expenses of the Underlying Series in which the Series invests. The expense ratio of the Underlying Series was 0.84%.
11Reflects activity of the Series and does not include the activity of the Underlying Series.
12The Series had no portfolio turnover for the period.
13The increase to the expense ratios (to average net assets) is largely due to the small net assets in each class.
The accompanying notes are an integral part of the financial statements.
63
Financial Highlights
| TARGET 2060 SERIES CLASS K | FOR THE YEAR ENDED | FOR THE PERIOD | ||||||
| 10/31/16 | 9/21/151 TO 10/31/15 | |||||||
Per share data (for a share outstanding throughout each period): | ||||||||
Net asset value - Beginning of period | $ | 10.36 | $ | 10.00 | ||||
|
|
|
| |||||
Income (loss) from investment operations: | ||||||||
Net investment income (loss)2,3 | 0.01 | (0.00 | )4 | |||||
Net realized and unrealized gain on investments | 0.34 | 0.36 | ||||||
|
|
|
| |||||
Total from investment operations | 0.35 | 0.36 | ||||||
|
|
|
| |||||
Less distributions to shareholders: | ||||||||
From net investment income | (0.04 | ) | — | |||||
|
|
|
| |||||
Net asset value - End of period | $ | 10.67 | $ | 10.36 | ||||
|
|
|
| �� | ||||
Net assets - End of period (000’s omitted) | $ | 1,407 | $ | 52 | ||||
|
|
|
| |||||
Total return5 | 3.45 | % | 3.60 | % | ||||
Ratios (to average net assets)/Supplemental Data: | ||||||||
Expenses*6 | 0.30 | % | 0.30 | %7 | ||||
Net investment income (loss)3 | 0.10 | % | (0.30 | %)7 | ||||
Series portfolio turnover8 | 14 | % | 4 | % | ||||
| *The investment advisor paid a portion of the Series’ expenses. If these expenses had been incurred by the Series, the expense ratios (to average net assets) would have been increased by the following amounts6 : | ||||||||
|
| 9.37
| %
|
| 151.35
| %7,9
| |||
| TARGET 2060 SERIES CLASS R | FOR THE YEAR ENDED | FOR THE PERIOD | ||||||
| 10/31/16 | 9/21/151 TO 10/31/15 | |||||||
Per share data (for a share outstanding throughout each period): | ||||||||
Net asset value - Beginning of period | $ | 10.36 | $ | 10.00 | ||||
|
|
|
| |||||
Income (loss) from investment operations: | ||||||||
Net investment income (loss)2,3 | 0.01 | (0.01 | )4 | |||||
Net realized and unrealized gain on investments | 0.31 | 0.37 | ||||||
|
|
|
| |||||
Total from investment operations | 0.32 | 0.36 | ||||||
|
|
|
| |||||
Less distributions to shareholders: | ||||||||
From net investment income | (0.03 | ) | — | |||||
|
|
|
| |||||
Net asset value - End of period | $ | 10.65 | $ | 10.36 | ||||
|
|
|
| |||||
Net assets - End of period (000’s omitted) | $ | 182 | $ | 56 | ||||
|
|
|
| |||||
Total return5 | 3.16 | % | 3.60 | % | ||||
Ratios (to average net assets)/Supplemental Data: | ||||||||
Expenses*6 | 0.55 | % | 0.55 | %7 | ||||
Net investment income (loss)3 | 0.09 | % | (0.55 | %)7 | ||||
Series portfolio turnover8 | 14 | % | 4 | % | ||||
| *The investment advisor paid a portion of the Series’ expenses. If these expenses had been incurred by the Series, the expense ratios (to average net assets) would have been increased by the following amounts6 : | ||||||||
| 9.37 | % | 151.35 | %7,9 | |||||
1Commencement of operations.
2Calculated based on average shares outstanding during the periods.
3Net investment income is affected by the timing of distributions from the Underlying Series in which the Series invest. The ratios do not include net investment income of the Underlying Series in which the Series invests.
4Less than $(0.01).
5Represents aggregate total return for the periods indicated. Total return would have been lower had certain expenses not been reimbursed. Periods less than one year are not annualized.
6Expense ratios do not include expenses of the Underlying Series in which the Series invests. The expense ratio of the Underlying Series was 0.83%.
7Annualized.
8Reflects activity of the Series and does not include the activity of the Underlying Series.
9The increase to the expense ratios (to average net assets) is largely due to the small net assets in each class.
The accompanying notes are an integral part of the financial statements.
64
Financial Highlights
| TARGET 2060 SERIES CLASS I | FOR THE YEAR ENDED | FOR THE PERIOD | ||||||
| 10/31/16 | 9/21/151 TO 10/31/15 | |||||||
Per share data (for a share outstanding throughout each period): | ||||||||
Net asset value - Beginning of period | $ | 10.36 | $ | 10.00 | ||||
|
|
|
| |||||
Income (loss) from investment operations: | ||||||||
Net investment income (loss)2,3 | 0.07 | (0.00 | )4 | |||||
Net realized and unrealized gain on investments | 0.31 | 0.36 | ||||||
|
|
|
| |||||
Total from investment operations | 0.38 | 0.36 | ||||||
|
|
|
| |||||
Less distributions to shareholders: | ||||||||
From net investment income | (0.06 | ) | — | |||||
|
|
|
| |||||
Net asset value - End of period | $ | 10.68 | $ | 10.36 | ||||
|
|
|
| |||||
Net assets - End of period (000’s omitted) | $ | 56 | $ | 52 | ||||
|
|
|
| |||||
Total return5 | 3.71 | % | 3.60 | % | ||||
Ratios (to average net assets)/Supplemental Data: | ||||||||
Expenses*6 | 0.05 | % | 0.05 | %7 | ||||
Net investment income (loss)3 | 0.65 | % | (0.05 | %)7 | ||||
Series portfolio turnover8 | 14 | % | 4 | % | ||||
| *The investment advisor paid a portion of the Series’ expenses. If these expenses had been incurred by the Series, the expense ratios (to average net assets) would have been increased by the following amounts6: | ||||||||
| 9.37 | % | 151.34 | %7,9 | |||||
1Commencement of operations.
2Calculated based on average shares outstanding during the periods.
3Net investment income is affected by the timing of distributions from the Underlying Series in which the Series invest. The ratios do not include net investment income of the Underlying Series in which the Series invests.
4Less than $(0.01).
5Represents aggregate total return for the periods indicated. Total return would have been lower had certain expenses not been reimbursed. Periods less than one year are not annualized.
6Expense ratios do not include expenses of the Underlying Series in which the Series invests. The expense ratio of the Underlying Series was 0.83%.
7Annualized.
8Reflects activity of the Series and does not include the activity of the Underlying Series.
9The increase to the expense ratios (to average net assets) is largely due to the small net assets in each class.
The accompanying notes are an integral part of the financial statements.
65
Notes to Financial Statements
| 1. | Organization |
Target Income Series, Target 2015 Series, Target 2020 Series, Target 2025 Series, Target 2030 Series, Target 2035 Series, Target 2040 Series, Target 2045 Series, Target 2050 Series, Target 2055 Series and Target 2060 Series (each the “Series”) are no-load diversified series of Manning & Napier Fund, Inc. (the “Fund”). The Fund is organized in Maryland and is registered under the Investment Company Act of 1940 (the “1940 Act”), as amended, as an open-end management investment company.
Each Series seeks to achieve its investment objectives by investing in a combination of other Manning & Napier mutual funds (the “Underlying Series”) according to a target asset allocation strategy. The Series are designed to provide single investment portfolios that adjust over time to meet the changing risk and return objectives of investors over their expected investment horizon. As the target retirement date approaches, the Series’ portfolios become more conservative with a larger fixed-income investment component. The financial statements of the Underlying Series should be read in conjunction with the Series’ financial statements.
Each Series is authorized to issue three classes of shares (Class K, R and I). Each class of shares is substantially the same, except that class-specific distribution and shareholder servicing expenses are borne by the specific class of shares to which they relate.
The Fund’s Advisor is Manning & Napier Advisors, LLC (the “Advisor”). Shares of each Series are offered to investors and employees of the Advisor and its affiliates. The total authorized capital stock of the Fund consists of 15 billion shares of common stock each having a par value of $0.01. As of October 31, 2016, 10.5 billion shares have been designated in total among 40 series, of which 40 million have been designated in each of the Series for Class K and R common stock and 100 million have been designated in each of the Series for Class I common stock.
Reorganization
The Board of Directors (the “Board”) of Target Income Series and of Target 2010 Series, each a Series of the Fund, approved the reorganization of Target 2010 Series into Target Income Series pursuant to which Target Income Series acquired substantially all of the assets and assumed certain stated liabilities of Target 2010 Series in exchange for an equal aggregate value of Target Income Series shares.
Each shareholder of Target 2010 Series received shares of Target Income Series with the same class designation and an aggregate Net Asset Value of such shareholder’s Target 2010 Series shares, as determined at the close of business on September 18, 2015.
The reorganization was accomplished by a tax-free exchange of shares of Target Income Series in the following amounts and at the following conversion ratios:
TARGET 2010 | CONVERSION RATIO | SHARES OF TARGET INCOME SERIES | ||||||||||
Class K | 2,511,185 | 0.910502 | 2,286,439 | |||||||||
Class R | 81,698 | 0.914253 | 74,693 | |||||||||
Class I | 1,590,529 | 0.911450 | 1,449,688 | |||||||||
Target 2010 Series’ net assets and composition of net assets on September 18, 2015, the date of the reorganization, were as follows:
NET ASSETS | PAID-IN CAPITAL | ACCUMULATED NET INVESTMENT LOSS | ACCUMULATED NET REALIZED GAINS | NET UNREALIZED DEPRECIATION | ||||||||||||
$36,429,313 | $ | 38,765,154 | $ | (528,334 | ) | $ | 458,766 | $ | (2,266,273 | ) | ||||||
66
Notes to Financial Statements (continued)
| 1. | Organization (continued) |
Reorganization (continued)
For financial reporting purposes, assets received and shares issued by Target Income Series were recorded at fair value; however, the cost basis of the investments received from Target 2010 Series was carried forward to align ongoing reporting of Target Income Series’ realized and unrealized gains and losses with amounts distributable to shareholders for tax purposes.
The aggregate net assets of Target Income Series immediately after the acquisition amounted to $96,959,284. Target 2010 Series’ fair value and cost of investments prior to the reorganization were $36,437,090 and $38,703,363, respectively.
The purpose of the transaction was to combine two funds managed by the Advisor, the investment advisor to both Target Income Series and Target 2010 Series, with the same or substantially similar (but not identical) investment objectives, investment policies, strategies, risks and restrictions. The reorganization was effective on September 21, 2015.
Assuming the acquisition had been completed on November 1, 2014, the beginning of the annual reporting period for Target Income Series, the pro forma results of operations for the year ended October 31, 2015, are as follows:
| • | Net investment income: $1,945,513 |
| • | Net realized and change in unrealized gain/loss on investments: ($3,429,309) |
| • | Net decrease in the net assets resulting from operations: ($1,483,796) |
Because the combined investment portfolios have been managed as a single integrated portfolio since the acquisition was completed, it is not practicable to separate the amounts of revenue and earnings of Target 2010 Series that have been included in the Target Income Series’ Statement of Operations since September 21, 2015.
Reorganization costs incurred by Target Income Series in connection with the reorganization were paid by the Advisor.
| 2. | Significant Accounting Policies |
The following is a summary of significant accounting policies followed by the Series. Each Series is an investment company and, accordingly, follows the investment company accounting and reporting guidance of the Financial Accounting Standards Board Accounting Standards Codification Topic 946 - Investment Companies, which is part of accounting principles generally accepted in the United States of America (“GAAP”).
Security Valuation
Investments in the Underlying Series are valued at their net asset value per share on valuation date. In the absence of the availability of a net asset value per share on the Underlying Series, security valuations may be determined in good faith by the Advisor under procedures approved by and under the general supervision and responsibility of the Fund’s Board of Directors (the “Board”).
Volume and level of activity in established markets for an asset or liability are evaluated to determine whether recent transactions and quoted prices are determinative of fair value. Where there have been significant decreases in volume and level of activity, further analysis and adjustment may be necessary to estimate fair value. The Series measure fair value in these instances by the use of inputs and valuation techniques which may be based upon current market prices of securities that are comparable in coupon, rating, maturity and industry and/or expectation of future cash flows. As a result of trading in relatively thin markets and/or markets that experience significant volatility, the prices used by the Series to value these securities may differ from the value that would be realized if these securities were sold, and the differences could be material.
Securities for which representative valuations or prices are not available from the Series’ pricing service may be valued at fair value as determined in good faith by the Advisor under procedures approved by and under the general supervision and responsibility of the Board. Due to the inherent uncertainty of valuations of such securities, the fair value may differ significantly
67
Notes to Financial Statements (continued)
| 2. | Significant Accounting Policies (continued) |
Security Valuation (continued)
from the values that would have been used had a ready market for such securities existed. If trading or events occurring after the close of the principal market in which securities are traded are expected to materially affect the value of those securities, then they may be valued at their fair value, taking this trading or these events into account.
Various inputs are used in determining the value of the Series’ assets or liabilities carried at fair value. These inputs are summarized in three broad levels. Level 1 includes quoted prices in active markets for identical assets and liabilities. Level 2 includes other significant observable inputs (including quoted prices for similar securities, interest rates, prepayment speeds, credit risk, etc.). Level 3 includes significant unobservable inputs (including the Series’ own assumptions in determining the fair value of investments). A financial instrument’s level within the fair value hierarchy is based on the lowest level on any input both individually and in aggregate that is significant to the fair value measurement. The inputs or methodology used for valuing securities are not necessarily an indication of the risk associated with investing in those securities.
The following is a summary of the valuation levels used for major security types as of October 31, 2016 in valuing the Series’ assets or liabilities carried at fair value:
| TARGET INCOME SERIES | ||||||||||||||||
| DESCRIPTION | TOTAL | LEVEL 1 | LEVEL 2 | LEVEL 3 | ||||||||||||
Assets: | ||||||||||||||||
Mutual fund | $ | 77,860,136 | $ | 77,860,136 | $ | — | $ | — | ||||||||
|
|
|
|
|
|
|
| |||||||||
Total assets | $ | 77,860,136 | $ | 77,860,136 | $ | — | $ | — | ||||||||
|
|
|
|
|
|
|
| |||||||||
| TARGET 2015 SERIES | ||||||||||||||||
| DESCRIPTION | TOTAL | LEVEL 1 | LEVEL 2 | LEVEL 3 | ||||||||||||
Assets: | ||||||||||||||||
Mutual funds | $ | 6,745,661 | $ | 6,745,661 | $ | — | $ | — | ||||||||
|
|
|
|
|
|
|
| |||||||||
Total assets | $ | 6,745,661 | $ | 6,745,661 | $ | — | $ | — | ||||||||
|
|
|
|
|
|
|
| |||||||||
| TARGET 2020 SERIES | ||||||||||||||||
| DESCRIPTION | TOTAL | LEVEL 1 | LEVEL 2 | LEVEL 3 | ||||||||||||
Assets: | ||||||||||||||||
Mutual funds | $ | 130,036,858 | $ | 130,036,858 | $ | — | $ | — | ||||||||
|
|
|
|
|
|
|
| |||||||||
Total assets | $ | 130,036,858 | $ | 130,036,858 | $ | — | $ | — | ||||||||
|
|
|
|
|
|
|
| |||||||||
| TARGET 2025 SERIES | ||||||||||||||||
| DESCRIPTION | TOTAL | LEVEL 1 | LEVEL 2 | LEVEL 3 | ||||||||||||
Assets: | ||||||||||||||||
Mutual funds | $ | 30,455,978 | $ | 30,455,978 | $ | — | $ | — | ||||||||
|
|
|
|
|
|
|
| |||||||||
Total assets | $ | 30,455,978 | $ | 30,455,978 | $ | — | $ | — | ||||||||
|
|
|
|
|
|
|
| |||||||||
| TARGET 2030 SERIES | ||||||||||||||||
| DESCRIPTION | TOTAL | LEVEL 1 | LEVEL 2 | LEVEL 3 | ||||||||||||
Assets: | ||||||||||||||||
Mutual funds | $ | 140,968,435 | $ | 140,968,435 | $ | — | $ | — | ||||||||
|
|
|
|
|
|
|
| |||||||||
Total assets | $ | 140,968,435 | $ | 140,968,435 | $ | — | $ | — | ||||||||
|
|
|
|
|
|
|
| |||||||||
68
Notes to Financial Statements (continued)
| 2. | Significant Accounting Policies (continued) |
Security Valuation (continued)
| TARGET 2035 SERIES | ||||||||||||||||
| DESCRIPTION | TOTAL | LEVEL 1 | LEVEL 2 | LEVEL 3 | ||||||||||||
Assets: | ||||||||||||||||
Mutual funds | $ | 25,278,579 | $ | 25,278,579 | $ | — | $ | — | ||||||||
|
|
|
|
|
|
|
| |||||||||
Total assets | $ | 25,278,579 | $ | 25,278,579 | $ | — | $ | — | ||||||||
|
|
|
|
|
|
|
| |||||||||
| TARGET 2040 SERIES | ||||||||||||||||
| DESCRIPTION | TOTAL | LEVEL 1 | LEVEL 2 | LEVEL 3 | ||||||||||||
Assets: | ||||||||||||||||
Mutual funds | $ | 88,510,911 | $ | 88,510,911 | $ | — | $ | — | ||||||||
|
|
|
|
|
|
|
| |||||||||
Total assets | $ | 88,510,911 | $ | 88,510,911 | $ | — | $ | — | ||||||||
|
|
|
|
|
|
|
| |||||||||
| TARGET 2045 SERIES | ||||||||||||||||
| DESCRIPTION | TOTAL | LEVEL 1 | LEVEL 2 | LEVEL 3 | ||||||||||||
Assets: | ||||||||||||||||
Mutual funds | $ | 14,090,843 | $ | 14,090,843 | $ | — | $ | — | ||||||||
|
|
|
|
|
|
|
| |||||||||
Total assets | $ | 14,090,843 | $ | 14,090,843 | $ | — | $ | — | ||||||||
|
|
|
|
|
|
|
| |||||||||
| TARGET 2050 SERIES | ||||||||||||||||
| DESCRIPTION | TOTAL | LEVEL 1 | LEVEL 2 | LEVEL 3 | ||||||||||||
Assets: | ||||||||||||||||
Mutual fund | $ | 30,260,955 | $ | 30,260,955 | $ | — | $ | — | ||||||||
|
|
|
|
|
|
|
| |||||||||
Total assets | $ | 30,260,955 | $ | 30,260,955 | $ | — | $ | — | ||||||||
|
|
|
|
|
|
|
| |||||||||
| TARGET 2055 SERIES | ||||||||||||||||
| DESCRIPTION | TOTAL | LEVEL 1 | LEVEL 2 | LEVEL 3 | ||||||||||||
Assets: | ||||||||||||||||
Mutual fund | $ | 5,698,492 | $ | 5,698,492 | $ | — | $ | — | ||||||||
|
|
|
|
|
|
|
| |||||||||
Total assets | $ | 5,698,492 | $ | 5,698,492 | $ | — | $ | — | ||||||||
|
|
|
|
|
|
|
| |||||||||
| TARGET 2060 SERIES | ||||||||||||||||
| DESCRIPTION | TOTAL | LEVEL 1 | LEVEL 2 | LEVEL 3 | ||||||||||||
Assets: | ||||||||||||||||
Mutual fund | $ | 1,634,290 | $ | 1,634,290 | $ | — | $ | — | ||||||||
|
|
|
|
|
|
|
| |||||||||
Total assets | $ | 1,634,290 | $ | 1,634,290 | $ | — | $ | — | ||||||||
|
|
|
|
|
|
|
| |||||||||
There were no Level 2 or Level 3 securities held by any of the Series as of October 31, 2015 or October 31, 2016.
The Fund’s policy is to recognize transfers in and transfers out of the valuation levels as of the beginning of the reporting period. There were no transfers between Level 1 and Level 2 during the year ended October 31, 2016.
New Accounting Guidance
In October 2016, the Securities and Exchange Commission (SEC) issued a new rule, Investment Company Reporting Modernization, which, among other provisions, amends Regulation S-X to require standardized, enhanced disclosures, particularly related to derivatives, in investment company financial statements. Compliance with the guidance is required for financial statements filed with the SEC on or after August 1, 2017; adoption will have no effect on the Fund’s net assets or results of operations.
69
Notes to Financial Statements (continued)
| 2. | Significant Accounting Policies (continued) |
Security Transactions, Investment Income and Expenses
Security transactions are accounted for on trade date. Dividend income is recorded on the ex-dividend date. Non-cash dividends, if any, are recorded at the fair value of the securities received. Income and capital gains distributions from the Underlying Series, if any, are recorded on the ex-dividend date.
Expenses are recorded on an accrual basis. Most expenses of the Fund can be attributed to a specific series. Expenses which cannot be directly attributed are apportioned among the series in the Fund in such a manner as deemed equitable by the Fund’s Board, taking into consideration, among other things, the nature and type of expense. Expenses included in the accompanying statements of operations do not include any expense of the Underlying Series.
Income, expenses (other than class specific expenses), and realized and unrealized gains and losses are prorated among the classes based on the relative net assets of each class. Class specific expenses are directly charged to that Class.
The Series use the identified cost method for determining realized gain or loss on investments for both financial statement and federal income tax reporting purposes.
Federal Taxes
Each Series’ policy is to comply with the provisions of the Internal Revenue Code applicable to regulated investment companies. The Series are not subject to federal income tax or excise tax to the extent that each Series distributes to shareholders each year its taxable income, including any net realized gains on investments, in accordance with requirements of the Internal Revenue Code. Accordingly, no provision for federal income tax or excise tax has been made in the financial statements.
Management evaluates its tax positions to determine if the tax positions taken meet the minimum recognition threshold in connection with accounting for uncertainties in income tax positions taken or expected to be taken for the purposes of measuring and recognizing tax liabilities in the financial statements. Recognition of tax benefits of an uncertain tax position is required only when the position is “more likely than not” to be sustained assuming examination by taxing authorities. At October 31, 2016, the Series have recorded no liability for net unrecognized tax benefits relating to uncertain income tax positions taken or expected to be taken in future tax returns.
The Series file income tax returns in the U.S. federal jurisdiction, various states and foreign jurisdictions, as required. No income tax returns are currently under investigation. The statute of limitations on Target Income Series, Target 2015 Series, Target 2020 Series, Target 2025 Series, Target 2030 Series, Target 2035 Series, Target 2040 Series, Target 2045 Series, Target 2050 Series and Target 2055 Series tax returns remains open for the years ended October 31, 2013 through October 31, 2016. The statue of limitations on Target 2060 Series remains open for the period ended October 31, 2015 and the year ended October 31, 2016. The Series are not aware of any tax positions for which it is reasonably possible that the total amounts of unrecognized tax benefits will significantly change in the next twelve months.
Foreign Taxes
Based on the Series’ understanding of the tax rules and rates related to income, gains and currency purchase/ repatriation transactions for foreign jurisdictions in which they invest, the Series will provide for foreign taxes, and where appropriate, deferred foreign tax.
Distributions of Income and Gains
Distributions to shareholders of net investment income are made semi-annually. Distributions of net realized gains are made annually. An additional distribution may be necessary to avoid taxation of a Series. Distributions are recorded on the ex-dividend date.
Indemnifications
The Fund’s organizational documents provide former and current directors and officers with a limited indemnification against liabilities arising in connection with the performance of their duties to the Fund. In the normal course of business, the Fund may also enter into contracts that provide general indemnifications. The Fund’s maximum exposure under these arrangements is
70
Notes to Financial Statements (continued)
| 2. | Significant Accounting Policies (continued) |
Indemnifications (continued)
unknown as this would be dependent on future claims that may be made against the Fund. The risk of material loss from such claims is considered remote.
Other
The preparation of financial statements in conformity with GAAP requires management to make estimates and assumptions that affect the reported amounts of assets and liabilities and the disclosure of contingent assets and liabilities at the date of the financial statements and the reported amounts of income and expenses during the reporting period. Actual results could differ from those estimates.
| 3. | Transactions with Affiliates |
The Fund has an Investment Advisory Agreement (the “Agreement”) with the Advisor, for which the Advisor does not receive a fee for the services it performs for the Series. However, the Advisor is entitled to receive the management fee from each of the Underlying Series in which the Series invest.
Under the Agreement, personnel of the Advisor provide the Series with advice and assistance in the choice of investments and the execution of securities transactions, and otherwise maintain the Series’ organization. The Advisor also provides the Fund with necessary office space and fund administration and support services. The salaries of all officers of the Fund (except a percentage of the Fund’s Chief Compliance Officer’s salary, which is paid by the Fund), and of all Directors who are “affiliated persons” of the Fund, or of the Advisor, and all personnel of the Fund, or of the Advisor, performing services relating to research, statistical and investment activities, are paid by the Advisor. Each “non-affiliated” Director receives an annual stipend, which is allocated among all the active series of the Fund. In addition, these Directors also receive a fee per Board meeting attended plus a fee for each committee meeting attended and are reimbursed for travel and other out-of-pocket expenses incurred by them in connection with attending such meetings. The Fund also has an Audit Committee Chair, who receives an additional annual stipend for this role.
The Advisor has contractually agreed, until at least February 28, 2020 for Target Income Series, Target 2020 Series, Target 2030 Series, Target 2040 Series, Target 2050 Series, until at least February 28, 2023 for Target 2015 Series, Target 2025 Series, Target 2035 Series, Target 2045 Series and Target 2055 Series and until at least February 28, 2026 for Target 2060 Series, to limit each class’ total direct annual fund operating expenses for the Series at no more than 0.05% for each class, exclusive of distribution and service fees, of average daily net assets each year. The Advisor’s agreement to limit each class’ operating expenses is limited to direct operating expenses and, therefore, does not apply to the indirect expenses incurred by the Series through their investments in the Underlying Series. For the year ended October 31, 2016, the Advisor reimbursed expenses of $96,648 for Target Income Series, $108,953 for Target 2015 Series, $83,967 for Target 2020 Series, $98,649 for Target 2025 Series, $94,732 for Target 2030 Series, $99,785 for Target 2035 Series, $98,957 for Target 2040 Series, $103,827 for Target 2045 Series, $118,477 for Target 2050 Series, $104,572 for Target 2055 Series and $96,512 for Target 2060 Series, which is included as a reduction of expenses on the Statements of Operations. The Advisor is not eligible to recoup any expenses that have been reimbursed in prior years.
Manning & Napier Investor Services, Inc., a registered broker-dealer affiliate of the Advisor, acts as distributor for the Fund’s shares. Each Series compensates the distributor for distributing and servicing the Series’ Class K and Class R shares pursuant to a distribution plan adopted under Rule 12b-1 of the 1940 Act, regardless of expenses actually incurred. Under the agreement, each Series pays distribution and services fees to the distributor at an annual rate of 0.25% of average daily net assets attributable to Class K shares and 0.50% of average daily net assets attributable to Class R shares. There are no distribution and services fees on the Class I shares of each Series. The fees are accrued daily and paid monthly.
Pursuant to a master services agreement dated November 1, 2014, the Fund pays the Advisor an annual fee related to fund accounting and administration of 0.00225% of average daily net assets of the Target Series with an annual base fee of $40,000 per Target series. Transfer agent fees are charged to the Fund on a per account basis. Additionally, certain transaction and out-of-pocket expenses, including charges for reporting relating to the Fund’s compliance program, are charged. The Advisor has
71
Notes to Financial Statements (continued)
| 3. | Transactions with Affiliates (continued) |
agreements with BNY Mellon Investment Servicing (U.S.) Inc. (“BNY”) under which BNY serves as sub-accountant services agent and sub-transfer agent.
Expenses not directly attributable to a series are allocated based on each series’ relative net assets or number of accounts, depending on the expense.
| 4. | Purchases and Sales of Securities |
For the year ended October 31, 2016, purchases and sales of Underlying Series were as follows:
| SERIES | PURCHASES | SALES | ||||||
Target Income Series | $ | 4,877,897 | $ | 23,296,871 | ||||
Target 2015 Series | $ | 3,531,132 | $ | 6,216,746 | ||||
Target 2020 Series | $ | 22,983,752 | $ | 56,322,783 | ||||
Target 2025 Series | $ | 16,160,171 | $ | 15,206,129 | ||||
Target 2030 Series | $ | 34,059,324 | $ | 58,402,185 | ||||
Target 2035 Series | $ | 7,825,048 | $ | 5,034,129 | ||||
Target 2040 Series | $ | 24,659,800 | $ | 37,098,139 | ||||
Target 2045 Series | $ | 6,956,054 | $ | 3,074,228 | ||||
Target 2050 Series | $ | 9,840,124 | $ | 12,915,945 | ||||
Target 2055 Series | $ | 3,678,130 | $ | 1,307,220 | ||||
Target 2060 Series | $ | 1,505,531 | $ | 149,666 | ||||
| 5. | Investments in Affiliated Issuers |
A summary of the Series’ transactions in the shares of affiliated issuers during the year ended October 31, 2016 is set forth below:
TARGET INCOME SERIES | VALUE AT 10/31/15 | PURCHASE COST | SALES PROCEEDS | VALUE AT 10/31/16 | SHARES HELD AT 10/31/16 | DIVIDEND INCOME | NET REALIZED LOSS | |||||||||||||||||||||
Manning & Napier Pro-Blend® Conservative Term Series -Class I | $ | 95,834,412 | $ | 4,877,897 | $ | 23,296,871 | $ | 77,860,136 | 7,537,283 | $ | 1,882,510 | $ | (1,950,268 | ) | ||||||||||||||
|
|
|
|
|
|
|
|
|
|
|
|
|
| |||||||||||||||
| $ | 95,834,412 | $ | 4,877,897 | $ | 23,296,871 | $ | 77,860,136 | $ | 1,882,510 | $ | (1,950,268 | ) | ||||||||||||||||
|
|
|
|
|
|
|
|
|
|
|
| |||||||||||||||||
TARGET 2015 SERIES | VALUE AT 10/31/15 | PURCHASE COST | SALES PROCEEDS | VALUE AT 10/31/16 | SHARES HELD 10/31/16 | DIVIDEND INCOME | DISTRIBUTIONS AND NET REALIZED GAIN OR LOSS | |||||||||||||||||||||
Manning & Napier Pro-Blend® Conservative Term Series - Class I | $ | — | $ | 1,896,115 | $ | 498,458 | $ | 1,492,103 | 144,444 | $ | 10,224 | $ | 16,215 | |||||||||||||||
Manning & Napier Pro-Blend® Moderate Term Series - Class I | 9,434,835 | 1,635,017 | 5,718,288 | 5,253,558 | 515,055 | 96,395 | (688,928 | ) | ||||||||||||||||||||
|
|
|
|
|
|
|
|
|
|
|
|
|
| |||||||||||||||
| $ | 9,434,835 | $ | 3,531,132 | $ | 6,216,746 | $ | 6,745,661 | $ | 106,619 | $ | (672,713 | ) | ||||||||||||||||
|
|
|
|
|
|
|
|
|
|
|
| |||||||||||||||||
72
Notes to Financial Statements (continued)
| 5. | Investments in Affiliated Issuers (continued) |
TARGET 2020 SERIES | VALUE AT 10/31/15 | PURCHASE COST | SALES PROCEEDS | VALUE AT 10/31/16 | SHARES HELD 10/31/16 | DIVIDEND INCOME | DISTRIBUTIONS AND NET REALIZED LOSS | |||||||||||||||||||||
Manning & Napier Pro-Blend® Extended Term Series - Class I | $ | 41,033,658 | $ | 3,345,310 | $ | 17,375,175 | $ | 25,895,822 | 2,717,295 | $ | 525,702 | $ | (2,865,417 | ) | ||||||||||||||
Manning & Napier Pro-Blend® Moderate Term Series - Class I | 122,161,428 | 19,638,442 | 38,947,608 | 104,141,036 | 10,209,906 | 1,634,661 | (4,003,697 | ) | ||||||||||||||||||||
|
|
|
|
|
|
|
|
|
|
|
|
|
| |||||||||||||||
| $ | 163,195,086 | $ | 22,983,752 | $ | 56,322,783 | $ | 130,036,858 | $ | 2,160,363 | $ | (6,869,114 | ) | ||||||||||||||||
|
|
|
|
|
|
|
|
|
|
|
| |||||||||||||||||
TARGET 2025 SERIES | VALUE AT 10/31/15 | PURCHASE COST | SALES PROCEEDS | VALUE AT 10/31/16 | SHARES HELD 10/31/16 | DIVIDEND INCOME | DISTRIBUTIONS AND | |||||||||||||||||||||
Manning & Napier Pro-Blend® Extended Term Series - Class I | $ | 29,560,983 | $ | 7,230,122 | $ | 13,601,719 | $ | 22,562,748 | 2,367,550 | $ | 380,092 | $ | (2,495,368 | ) | ||||||||||||||
Manning & Napier Pro-Blend® Moderate Term Series - Class I | — | 8,930,049 | 1,604,410 | 7,893,230 | 773,846 | 37,919 | 74,864 | |||||||||||||||||||||
|
|
|
|
|
|
|
|
|
|
|
|
|
| |||||||||||||||
| $ | 29,560,983 | $ | 16,160,171 | $ | 15,206,129 | $ | 30,455,978 | $ | 418,011 | $ | (2,420,504 | ) | ||||||||||||||||
|
|
|
|
|
|
|
|
|
|
|
| |||||||||||||||||
TARGET 2030 SERIES | VALUE AT 10/31/15 | PURCHASE COST | SALES PROCEEDS | VALUE AT 10/31/16 | SHARES HELD 10/31/16 | DIVIDEND INCOME | DISTRIBUTIONS AND | |||||||||||||||||||||
Manning & Napier Pro-Blend® Extended Term Series - Class I | $ | 124,265,001 | $ | 28,615,409 | $ | 39,511,861 | $ | 113,170,271 | 11,875,160 | $ | 1,784,231 | $ | (3,688,058 | ) | ||||||||||||||
Manning & Napier Pro-Blend® Maximum Term Series - Class I | 41,935,963 | 5,443,915 | 18,890,324 | 27,798,164 | 2,727,985 | 259,661 | (4,412,395 | ) | ||||||||||||||||||||
|
|
|
|
|
|
|
|
|
|
|
|
|
| |||||||||||||||
| $ | 166,200,964 | $ | 34,059,324 | $ | 58,402,185 | $ | 140,968,435 | $ | 2,043,892 | $ | (8,100,453 | ) | ||||||||||||||||
|
|
|
|
|
|
|
|
|
|
|
| |||||||||||||||||
TARGET 2035 SERIES | VALUE AT 10/31/15 | PURCHASE COST | SALES PROCEEDS | VALUE AT 10/31/16 | SHARES HELD AT 10/31/16 | DIVIDEND INCOME | DISTRIBUTIONS AND | |||||||||||||||||||||
Manning & Napier Pro-Blend® Extended Term Series - Class I | $ | 11,121,230 | $ | 4,776,833 | $ | 2,072,660 | $ | 13,951,289 | 1,463,934 | $ | 166,195 | $ | (78,682 | ) | ||||||||||||||
Manning & Napier Pro-Blend® Maximum Term Series - Class I | 11,213,419 | 3,048,215 | 2,961,469 | 11,327,290 | 1,111,608 | 75,539 | (576,242 | ) | ||||||||||||||||||||
|
|
|
|
|
|
|
|
|
|
|
|
|
| |||||||||||||||
| $ | 22,334,649 | $ | 7,825,048 | $ | 5,034,129 | $ | 25,278,579 | $ | 241,734 | $ | (654,924 | ) | ||||||||||||||||
|
|
|
|
|
|
|
|
|
|
|
| |||||||||||||||||
73
Notes to Financial Statements (continued)
| 5. | Investments in Affiliated Issuers (continued) |
TARGET 2040 SERIES | VALUE AT 10/31/15 | PURCHASE COST | SALES PROCEEDS | VALUE AT 10/31/16 | SHARES HELD 10/31/16 | DIVIDEND INCOME | DISTRIBUTIONS AND NET REALIZED LOSS | |||||||||||||||||||||
Manning & Napier Pro-Blend® Extended Term Series - Class I | $ | 24,945,227 | $ | 10,913,891 | $ | 9,414,249 | $ | 26,725,527 | 2,804,358 | $ | 383,959 | $ | (1,156,252 | ) | ||||||||||||||
Manning & Napier Pro-Blend® Maximum Term Series - Class I | 75,799,725 | 13,745,909 | 27,683,890 | 61,785,384 | 6,063,335 | 514,021 | (5,124,863 | ) | ||||||||||||||||||||
|
|
|
|
|
|
|
|
|
|
|
|
|
| |||||||||||||||
| $ | 100,744,952 | $ | 24,659,800 | $ | 37,098,139 | $ | 88,510,911 | $ | 897,980 | $ | (6,281,115 | ) | ||||||||||||||||
|
|
|
|
|
|
|
|
|
|
|
| |||||||||||||||||
TARGET 2045 SERIES | VALUE AT 10/31/15 | PURCHASE COST | SALES PROCEEDS | VALUE AT 10/31/16 | SHARES HELD AT 10/31/16 | DIVIDEND INCOME | DISTRIBUTIONS AND | |||||||||||||||||||||
Manning & Napier Pro-Blend® Extended Term Series - Class I | $ | — | $ | 765,826 | $ | 93,759 | $ | 723,592 | 75,928 | $ | 3,090 | $ | 6,028 | |||||||||||||||
Manning & Napier Pro-Blend® Maximum Term Series - Class I | 9,959,515 | 6,190,228 | 2,980,469 | 13,367,251 | 1,311,801 | 74,645 | (640,482 | ) | ||||||||||||||||||||
|
|
|
|
|
|
|
|
|
|
|
|
|
| |||||||||||||||
| $ | 9,959,515 | $ | 6,956,054 | $ | 3,074,228 | $ | 14,090,843 | $ | 77,735 | $ | (634,454 | ) | ||||||||||||||||
|
|
|
|
|
|
|
|
|
|
|
| |||||||||||||||||
TARGET 2050 SERIES | VALUE AT 10/31/15 | PURCHASE COST | SALES PROCEEDS | VALUE AT 10/31/16 | SHARES HELD AT 10/31/16 | DIVIDEND INCOME | DISTRIBUTIONS AND | |||||||||||||||||||||
Manning & Napier Pro-Blend® Maximum Term Series - Class I | $ | 33,066,824 | $ | 9,840,124 | $ | 12,915,945 | $ | 30,260,955 | 2,969,672 | $ | 233,060 | $ | (2,343,982 | ) | ||||||||||||||
|
|
|
|
|
|
|
|
|
|
|
|
|
| |||||||||||||||
| $ | 33,066,824 | $ | 9,840,124 | $ | 12,915,945 | $ | 30,260,955 | $ | 233,060 | $ | (2,343,982 | ) | ||||||||||||||||
|
|
|
|
|
|
|
|
|
|
|
| |||||||||||||||||
TARGET 2055 SERIES | VALUE AT 10/31/15 | PURCHASE COST | SALES PROCEEDS | VALUE AT 10/31/16 | SHARES HELD AT 10/31/16 | DIVIDEND INCOME | DISTRIBUTIONS AND NET REALIZED LOSS | |||||||||||||||||||||
Manning & Napier Pro-Blend® Maximum Term Series - Class I | $ | 3,229,941 | $ | 3,678,130 | $ | 1,307,220 | $ | 5,698,492 | 559,224 | $ | 26,576 | $ | (200,077 | ) | ||||||||||||||
|
|
|
|
|
|
|
|
|
|
|
|
|
| |||||||||||||||
| $ | 3,229,941 | $ | 3,678,130 | $ | 1,307,220 | $ | 5,698,492 | $ | 26,576 | $ | (200,077 | ) | ||||||||||||||||
|
|
|
|
|
|
|
|
|
|
|
| |||||||||||||||||
TARGET 2060 SERIES | VALUE AT 10/31/15 | PURCHASE COST | SALES PROCEEDS | VALUE AT 10/31/16 | SHARES HELD 10/31/16 | DIVIDEND INCOME | DISTRIBUTIONS AND NET REALIZED GAIN | |||||||||||||||||||||
Manning & Napier Pro-Blend® Maximum Term Series - Class I | $ | 157,243 | $ | 1,505,531 | $ | 149,666 | $ | 1,634,290 | 160,382 | $ | 4,589 | $ | 7,853 | |||||||||||||||
|
|
|
|
|
|
|
|
|
|
|
|
|
| |||||||||||||||
| $ | 157,243 | $ | 1,505,531 | $ | 149,666 | $ | 1,634,290 | $ | 4,589 | $ | 7,853 | |||||||||||||||||
|
|
|
|
|
|
|
|
|
|
|
| |||||||||||||||||
74
Notes to Financial Statements (continued)
| 6. | Capital Stock Transactions |
Transactions in Class K, Class R, and Class I shares:
TARGET INCOME SERIES: | FOR THE YEAR ENDED 10/31/16 | FOR THE YEAR ENDED 10/31/15 | FOR THE YEAR ENDED 10/31/16 | FOR THE YEAR ENDED 10/31/15 | ||||||||||||||||||||||||||||
| CLASS K | CLASS K | CLASS R | CLASS R | |||||||||||||||||||||||||||||
| SHARES | AMOUNTS | SHARES | AMOUNTS | SHARES | AMOUNTS | SHARES | AMOUNTS | |||||||||||||||||||||||||
Shares Issued in Reorganization1 | — | $ | — | 2,286,439 | $ | 21,835,482 | — | $ | — | 74,693 | $ | 705,844 | ||||||||||||||||||||
Sold | 291,450 | 2,699,840 | 417,583 | 4,120,152 | 27,173 | 249,188 | 46,949 | 471,844 | ||||||||||||||||||||||||
Reinvested | 451,377 | 4,034,189 | 476,694 | 4,705,653 | 13,197 | 116,622 | 115,274 | 1,123,916 | ||||||||||||||||||||||||
Repurchased | (820,747 | ) | (7,551,216 | ) | (1,088,610 | ) | (10,723,666 | ) | (173,347 | ) | (1,566,756 | ) | (1,231,416 | ) | (12,101,840 | ) | ||||||||||||||||
|
|
|
|
|
|
|
|
|
|
|
|
|
|
|
| |||||||||||||||||
Total | (77,920 | ) | $ | (817,187 | ) | 2,092,106 | $ | 19,937,621 | (132,977 | ) | $ | (1,200,946 | ) | (994,500 | ) | $ | (9,800,236 | ) | ||||||||||||||
|
|
|
|
|
|
|
|
|
|
|
|
|
|
|
| |||||||||||||||||
TARGET INCOME SERIES: | FOR THE YEAR ENDED 10/31/16 | FOR THE YEAR ENDED 10/31/15 | ||||||||||||||||||||||||||||||
| CLASS I | CLASS I | |||||||||||||||||||||||||||||||
| SHARES | AMOUNTS | SHARES | AMOUNTS | |||||||||||||||||||||||||||||
Shares Issued in Reorganization1 | — | $ | — | 1,449,688 | $ | 13,887,987 | ||||||||||||||||||||||||||
Sold | 347,344 | 3,194,089 | 446,104 | 4,558,364 | ||||||||||||||||||||||||||||
Reinvested | 152,209 | 1,362,864 | 108,763 | 1,075,966 | ||||||||||||||||||||||||||||
Repurchased | (1,851,774 | ) | (16,996,551 | ) | (405,177 | ) | (4,024,518 | ) | ||||||||||||||||||||||||
|
|
|
|
|
|
|
| |||||||||||||||||||||||||
Total | (1,352,221 | ) | $ | (12,439,598 | ) | 1,599,378 | $ | 15,497,799 | ||||||||||||||||||||||||
|
|
|
|
|
|
|
| |||||||||||||||||||||||||
TARGET 2015 SERIES: | FOR THE YEAR ENDED 10/31/16 | FOR THE YEAR ENDED 10/31/15 | FOR THE YEAR ENDED 10/31/16 | FOR THE YEAR ENDED 10/31/15 | ||||||||||||||||||||||||||||
| CLASS K | CLASS K | CLASS R | CLASS R | |||||||||||||||||||||||||||||
| SHARES | AMOUNTS | SHARES | AMOUNTS | SHARES | AMOUNTS | SHARES | AMOUNTS | |||||||||||||||||||||||||
Sold | 62,583 | $ | 642,540 | 190,940 | $ | 2,175,614 | 18,594 | $ | 194,143 | 37,539 | $ | 426,489 | ||||||||||||||||||||
Reinvested | 27,544 | 274,036 | 15,518 | 176,996 | 6,640 | 66,231 | 7,339 | 83,810 | ||||||||||||||||||||||||
Repurchased | (91,358 | ) | (958,718 | ) | (158,103 | ) | (1,821,499 | ) | (23,850 | ) | (246,457 | ) | (101,228 | ) | (1,160,178 | ) | ||||||||||||||||
|
|
|
|
|
|
|
|
|
|
|
|
|
|
|
| |||||||||||||||||
Total | (1,231 | ) | $ | (42,142 | ) | 48,355 | $ | 531,111 | 1,384 | $ | 13,917 | (56,350 | ) | $ | (649,879 | ) | ||||||||||||||||
|
|
|
|
|
|
|
|
|
|
|
|
|
|
|
| |||||||||||||||||
TARGET 2015 SERIES: | FOR THE YEAR ENDED 10/31/16 | FOR THE YEAR ENDED 10/31/15 | ||||||||||||||||||||||||||||||
| CLASS I | CLASS I | |||||||||||||||||||||||||||||||
| SHARES | AMOUNTS | SHARES | AMOUNTS | |||||||||||||||||||||||||||||
Sold | 116,263 | $ | 1,214,003 | 182,270 | $ | 2,078,159 | ||||||||||||||||||||||||||
Reinvested | 32,415 | 323,149 | 22,934 | 262,346 | ||||||||||||||||||||||||||||
Repurchased | (353,871 | ) | (3,680,640 | ) | (142,593 | ) | (1,626,254 | ) | ||||||||||||||||||||||||
|
|
|
|
|
|
|
| |||||||||||||||||||||||||
Total | (205,193 | ) | $ | (2,143,488 | ) | 62,611 | $ | 714,251 | ||||||||||||||||||||||||
|
|
|
|
|
|
|
| |||||||||||||||||||||||||
75
Notes to Financial Statements (continued)
| 6. | Capital Stock Transactions (continued) |
TARGET 2020 SERIES: | FOR THE YEAR ENDED 10/31/16 | FOR THE YEAR ENDED 10/31/15 | FOR THE YEAR ENDED 10/31/16 | FOR THE YEAR ENDED 10/31/15 | ||||||||||||||||||||||||||||
| CLASS K | CLASS K | CLASS R | CLASS R | |||||||||||||||||||||||||||||
| SHARES | AMOUNTS | SHARES | AMOUNTS | SHARES | AMOUNTS | SHARES | AMOUNTS | |||||||||||||||||||||||||
Sold | 1,305,446 | $ | 11,225,249 | 1,820,935 | $ | 17,742,873 | 120,070 | $ | 1,035,174 | 221,254 | $ | 2,137,917 | ||||||||||||||||||||
Reinvested | 930,849 | 7,694,487 | 1,011,644 | 9,774,681 | 82,322 | 671,918 | 228,457 | 2,181,770 | ||||||||||||||||||||||||
Repurchased | (1,645,190 | ) | (13,965,905 | ) | (3,228,733 | ) | (31,463,509 | ) | (552,566 | ) | (4,681,053 | ) | (1,701,100 | ) | (16,277,608 | ) | ||||||||||||||||
|
|
|
|
|
|
|
|
|
|
|
|
|
|
|
| |||||||||||||||||
Total | 591,105 | $ | 4,953,831 | (396,154 | ) | $ | (3,945,955 | ) | (350,174 | ) | $ | (2,973,961 | ) | (1,251,389 | ) | $ | (11,957,921 | ) | ||||||||||||||
|
|
|
|
|
|
|
|
|
|
|
|
|
|
|
| |||||||||||||||||
TARGET 2020 SERIES: | FOR THE YEAR ENDED 10/31/16 | FOR THE YEAR ENDED 10/31/15 | ||||||||||||||||||||||||||||||
| CLASS I | CLASS I | |||||||||||||||||||||||||||||||
| SHARES | AMOUNTS | SHARES | AMOUNTS | |||||||||||||||||||||||||||||
Sold | 1,286,155 | $ | 11,021,607 | 2,802,754 | $ | 28,335,764 | ||||||||||||||||||||||||||
Reinvested | 844,057 | 7,001,908 | 756,165 | 7,337,982 | ||||||||||||||||||||||||||||
Repurchased | (4,770,059 | ) | (40,795,617 | ) | (1,371,700 | ) | (13,273,390 | ) | ||||||||||||||||||||||||
|
|
|
|
|
|
|
| |||||||||||||||||||||||||
Total | (2,639,847 | ) | $ | (22,772,102 | ) | 2,187,219 | $ | 22,400,356 | ||||||||||||||||||||||||
|
|
|
|
|
|
|
| |||||||||||||||||||||||||
TARGET 2025 SERIES: | FOR THE YEAR ENDED 10/31/16 | FOR THE YEAR ENDED 10/31/15 | FOR THE YEAR ENDED 10/31/16 | FOR THE YEAR ENDED 10/31/15 | ||||||||||||||||||||||||||||
| CLASS K | CLASS K | CLASS R | CLASS R | |||||||||||||||||||||||||||||
| SHARES | AMOUNTS | SHARES | AMOUNTS | SHARES | AMOUNTS | SHARES | AMOUNTS | |||||||||||||||||||||||||
Sold | 467,793 | $ | 4,994,054 | 556,093 | $ | 6,830,718 | 54,859 | $ | 593,336 | 56,808 | $ | 691,215 | ||||||||||||||||||||
Reinvested | 101,304 | 1,050,543 | 51,349 | 623,352 | 17,327 | 180,276 | 20,585 | 250,329 | ||||||||||||||||||||||||
Repurchased | (361,044 | ) | (3,915,258 | ) | (178,234 | ) | (2,168,108 | ) | (98,175 | ) | (1,083,882 | ) | (191,936 | ) | (2,352,130 | ) | ||||||||||||||||
|
|
|
|
|
|
|
|
|
|
|
|
|
|
|
| |||||||||||||||||
Total | 208,053 | $ | 2,129,339 | 429,208 | $ | 5,285,962 | (25,989 | ) | $ | (310,270 | ) | (114,543 | ) | $ | (1,410,586 | ) | ||||||||||||||||
|
|
|
|
|
|
|
|
|
|
|
|
|
|
|
| |||||||||||||||||
TARGET 2025 SERIES: | FOR THE YEAR ENDED 10/31/16 | FOR THE YEAR ENDED 10/31/15 | ||||||||||||||||||||||||||||||
| CLASS I | CLASS I | |||||||||||||||||||||||||||||||
| SHARES | AMOUNTS | SHARES | AMOUNTS | |||||||||||||||||||||||||||||
Sold | 517,067 | $ | 5,465,046 | 539,558 | $ | 6,563,102 | ||||||||||||||||||||||||||
Reinvested | 115,478 | 1,193,313 | 66,271 | 802,064 | ||||||||||||||||||||||||||||
Repurchased | (550,169 | ) | (5,887,382 | ) | (294,126 | ) | (3,570,654 | ) | ||||||||||||||||||||||||
|
|
|
|
|
|
|
| |||||||||||||||||||||||||
Total | 82,376 | $ | 770,977 | 311,703 | $ | 3,794,512 | ||||||||||||||||||||||||||
|
|
|
|
|
|
|
| |||||||||||||||||||||||||
TARGET 2030 SERIES: | FOR THE YEAR ENDED 10/31/16 | FOR THE YEAR ENDED 10/31/15 | FOR THE YEAR ENDED 10/31/16 | FOR THE YEAR ENDED 10/31/15 | ||||||||||||||||||||||||||||
| CLASS K | CLASS K | CLASS R | CLASS R | |||||||||||||||||||||||||||||
| SHARES | AMOUNTS | SHARES | AMOUNTS | SHARES | AMOUNTS | SHARES | AMOUNTS | |||||||||||||||||||||||||
Sold | 1,694,389 | $ | 14,348,192 | 1,826,124 | $ | 18,788,095 | 250,656 | $ | 2,128,933 | 295,552 | $ | 3,006,502 | ||||||||||||||||||||
Reinvested | 1,374,384 | 11,055,567 | 1,546,306 | 15,543,362 | 188,656 | 1,503,830 | 272,475 | 2,719,456 | ||||||||||||||||||||||||
Repurchased | (1,907,673 | ) | (16,100,675 | ) | (5,593,631 | ) | (56,679,063 | ) | (664,989 | ) | (5,538,279 | ) | (1,259,362 | ) | (12,487,469 | ) | ||||||||||||||||
|
|
|
|
|
|
|
|
|
|
|
|
|
|
|
| |||||||||||||||||
Total | 1,161,100 | $ | 9,303,084 | (2,221,201 | ) | $ | (22,347,606 | ) | (225,677 | ) | $ | (1,905,516 | ) | (691,335 | ) | $ | (6,761,511 | ) | ||||||||||||||
|
|
|
|
|
|
|
|
|
|
|
|
|
|
|
| |||||||||||||||||
76
Notes to Financial Statements (continued)
| 6. | Capital Stock Transactions (continued) |
TARGET 2030 SERIES: | FOR THE YEAR ENDED 10/31/16 | FOR THE YEAR ENDED 10/31/15 | ||||||||||||||||||||||||||||||
CLASS I SHARES | AMOUNTS | CLASS I SHARES | AMOUNTS | |||||||||||||||||||||||||||||
Sold | 2,094,466 | $ | 17,737,192 | 2,936,452 | $ | 31,267,444 | ||||||||||||||||||||||||||
Reinvested | 1,283,151 | 10,415,335 | 883,682 | 8,956,560 | ||||||||||||||||||||||||||||
Repurchased | (4,895,870 | ) | (41,458,493 | ) | (1,136,582 | ) | (11,506,373 | ) | ||||||||||||||||||||||||
|
|
|
|
|
|
|
| |||||||||||||||||||||||||
Total | (1,518,253 | ) | $ | (13,305,966 | ) | 2,683,552 | $ | 28,717,631 | ||||||||||||||||||||||||
|
|
|
|
|
|
|
| |||||||||||||||||||||||||
TARGET 2035 SERIES: | FOR THE YEAR ENDED 10/31/16 | FOR THE YEAR ENDED 10/31/15 | FOR THE YEAR ENDED 10/31/16 | FOR THE YEAR ENDED 10/31/15 | ||||||||||||||||||||||||||||
CLASS K SHARES | AMOUNTS | CLASS K SHARES | AMOUNTS | CLASS R SHARES | AMOUNTS | CLASS R SHARES | AMOUNTS | |||||||||||||||||||||||||
Sold | 351,735 | $ | 3,894,983 | 394,251 | $ | 5,158,839 | 59,111 | $ | 661,176 | 56,939 | $ | 727,311 | ||||||||||||||||||||
Reinvested | 93,428 | 986,375 | 47,513 | 602,819 | 23,231 | 246,041 | 18,029 | 229,367 | ||||||||||||||||||||||||
Repurchased | (135,108 | ) | (1,515,115 | ) | (105,200 | ) | (1,338,625 | ) | (90,137 | ) | (1,026,108 | ) | (97,765 | ) | (1,238,203 | ) | ||||||||||||||||
|
|
|
|
|
|
|
|
|
|
|
|
|
|
|
| |||||||||||||||||
Total | 310,055 | $ | 3,366,243 | 336,564 | $ | 4,423,033 | (7,795 | ) | $ | (118,891 | ) | (22,797 | ) | $ | (281,525 | ) | ||||||||||||||||
|
|
|
|
|
|
|
|
|
|
|
|
|
|
|
| |||||||||||||||||
TARGET 2035 SERIES: | FOR THE YEAR ENDED 10/31/16 | FOR THE YEAR ENDED 10/31/15 | ||||||||||||||||||||||||||||||
CLASS I SHARES | AMOUNTS | CLASS I SHARES | AMOUNTS | |||||||||||||||||||||||||||||
Sold | 319,194 | $ | 3,547,836 | 461,178 | $ | 5,945,774 | ||||||||||||||||||||||||||
Reinvested | 98,371 | 1,041,834 | 59,121 | 752,204 | ||||||||||||||||||||||||||||
Repurchased | (297,550 | ) | (3,303,800 | ) | (321,116 | ) | (4,108,120 | ) | ||||||||||||||||||||||||
|
|
|
|
|
|
|
| |||||||||||||||||||||||||
Total | 120,015 | $ | 1,285,870 | 199,183 | $ | 2,589,858 | ||||||||||||||||||||||||||
|
|
|
|
|
|
|
| |||||||||||||||||||||||||
TARGET 2040 SERIES: | FOR THE YEAR ENDED 10/31/16 | FOR THE YEAR ENDED 10/31/15 | FOR THE YEAR ENDED 10/31/16 | FOR THE YEAR ENDED 10/31/15 | ||||||||||||||||||||||||||||
| CLASS K SHARES | AMOUNTS | CLASS K SHARES | AMOUNTS | CLASS R SHARES | AMOUNTS | CLASS R SHARES | AMOUNTS | |||||||||||||||||||||||||
Sold | 1,554,166 | $ | 13,422,232 | 1,367,068 | $ | 14,445,258 | 153,036 | $ | 1,314,309 | 173,002 | $ | 1,823,779 | ||||||||||||||||||||
Reinvested | 988,495 | 8,039,047 | 1,345,541 | 14,049,199 | 95,772 | 773,837 | 172,074 | 1,786,156 | ||||||||||||||||||||||||
Repurchased | (1,262,302 | ) | (10,771,998 | ) | (4,280,661 | ) | (45,014,121 | ) | (231,078 | ) | (1,973,607 | ) | (675,002 | ) | (6,912,325 | ) | ||||||||||||||||
|
|
|
|
|
|
|
|
|
|
|
|
|
|
|
| |||||||||||||||||
Total | 1,280,359 | $ | 10,689,281 | (1,568,052 | ) | $ | (16,519,664 | ) | 17,730 | $ | 114,539 | (329,926 | ) | $ | (3,302,390 | ) | ||||||||||||||||
|
|
|
|
|
|
|
|
|
|
|
|
|
|
|
| |||||||||||||||||
TARGET 2040 SERIES: | FOR THE YEAR ENDED 10/31/16 | FOR THE YEAR ENDED 10/31/15 | ||||||||||||||||||||||||||||||
| CLASS I SHARES | AMOUNTS | CLASS I SHARES | AMOUNTS | |||||||||||||||||||||||||||||
Sold | 1,256,700 | $ | 10,855,100 | 1,767,484 | $ | 19,737,040 | ||||||||||||||||||||||||||
Reinvested | 837,290 | 6,857,643 | 643,884 | 6,770,341 | ||||||||||||||||||||||||||||
Repurchased | (3,193,800 | ) | (27,398,097 | ) | (763,364 | ) | (8,070,391 | ) | ||||||||||||||||||||||||
|
|
|
|
|
|
|
| |||||||||||||||||||||||||
Total | (1,099,810 | ) | $ | (9,685,354 | ) | 1,648,004 | $ | 18,436,990 | ||||||||||||||||||||||||
|
|
|
|
|
|
|
| |||||||||||||||||||||||||
77
Notes to Financial Statements (continued)
| 6. | Capital Stock Transactions (continued) |
TARGET 2045 SERIES: | FOR THE YEAR ENDED 10/31/16 | FOR THE YEAR ENDED 10/31/15 | FOR THE YEAR ENDED 10/31/16 | FOR THE YEAR ENDED 10/31/15 | ||||||||||||||||||||||||||||
| CLASS K SHARES | AMOUNTS | CLASS K SHARES | AMOUNTS | CLASS R SHARES | AMOUNTS | CLASS R SHARES | AMOUNTS | |||||||||||||||||||||||||
Sold | 359,766 | $ | 4,060,529 | 120,547 | $ | 1,575,737 | 50,566 | $ | 574,273 | 54,775 | $ | 714,708 | ||||||||||||||||||||
Reinvested | 36,161 | 392,942 | 20,811 | 273,206 | 16,008 | 173,049 | 12,683 | 165,654 | ||||||||||||||||||||||||
Repurchased | (114,721 | ) | (1,348,393 | ) | (53,667 | ) | (719,230 | ) | (46,586 | ) | (520,816 | ) | (66,537 | ) | (873,072 | ) | ||||||||||||||||
|
|
|
|
|
|
|
|
|
|
|
|
|
|
|
| |||||||||||||||||
Total | 281,206 | $ | 3,105,078 | 87,691 | $ | 1,129,713 | 19,988 | $ | 226,506 | 921 | $ | 7,290 | ||||||||||||||||||||
|
|
|
|
|
|
|
|
|
|
|
|
|
|
|
| |||||||||||||||||
TARGET 2045 SERIES: | FOR THE YEAR ENDED 10/31/16 | FOR THE YEAR ENDED 10/31/15 | ||||||||||||||||||||||||||||||
| CLASS I SHARES | AMOUNTS | CLASS I SHARES | AMOUNTS | |||||||||||||||||||||||||||||
Sold | 233,312 | $ | 2,675,671 | 277,637 | $ | 3,744,526 | ||||||||||||||||||||||||||
Reinvested | 40,647 | 442,586 | 26,079 | 342,754 | ||||||||||||||||||||||||||||
Repurchased | (153,290 | ) | (1,746,024 | ) | (152,430 | ) | (1,994,861 | ) | ||||||||||||||||||||||||
|
|
|
|
|
|
|
| |||||||||||||||||||||||||
Total | 120,669 | $ | 1,372,233 | 151,286 | $ | 2,092,419 | ||||||||||||||||||||||||||
|
|
|
|
|
|
|
| |||||||||||||||||||||||||
TARGET 2050 SERIES: | FOR THE YEAR ENDED 10/31/16 | FOR THE YEAR ENDED 10/31/15 | FOR THE YEAR ENDED 10/31/16 | FOR THE YEAR ENDED 10/31/15 | ||||||||||||||||||||||||||||
| CLASS K SHARES | AMOUNTS | CLASS K SHARES | AMOUNTS | CLASS R SHARES | AMOUNTS | CLASS R SHARES | AMOUNTS | |||||||||||||||||||||||||
Sold | 615,347 | $ | 5,742,120 | 663,894 | $ | 7,876,102 | 108,335 | $ | 1,007,919 | 111,753 | $ | 1,315,055 | ||||||||||||||||||||
Reinvested | 310,802 | 2,716,712 | 640,516 | 7,494,105 | 46,733 | 404,245 | 68,631 | 797,489 | ||||||||||||||||||||||||
Repurchased | (679,051 | ) | (6,294,490 | ) | (3,433,652 | ) | (40,344,397 | ) | (90,474 | ) | (867,198 | ) | (361,376 | ) | (4,151,305 | ) | ||||||||||||||||
|
|
|
|
|
|
|
|
|
|
|
|
|
|
|
| |||||||||||||||||
Total | 247,098 | $ | 2,164,342 | (2,129,242 | ) | $ | (24,974,190 | ) | 64,594 | $ | 544,966 | (180,992 | ) | $ | (2,038,761 | ) | ||||||||||||||||
|
|
|
|
|
|
|
|
|
|
|
|
|
|
|
| |||||||||||||||||
TARGET 2050 SERIES: | FOR THE YEAR ENDED 10/31/16 | FOR THE YEAR ENDED 10/31/15 | ||||||||||||||||||||||||||||||
| CLASS I SHARES | AMOUNTS | CLASS I SHARES | AMOUNTS | |||||||||||||||||||||||||||||
Sold | 807,462 | $ | 7,577,254 | 680,773 | $ | 8,212,637 | ||||||||||||||||||||||||||
Reinvested | 337,574 | 2,961,455 | 173,370 | 2,043,399 | ||||||||||||||||||||||||||||
Repurchased | (1,154,509 | ) | (10,787,205 | ) | (354,807 | ) | (4,236,301 | ) | ||||||||||||||||||||||||
|
|
|
|
|
|
|
| |||||||||||||||||||||||||
Total | (9,473 | ) | $ | (248,496 | ) | 499,336 | $ | 6,019,735 | ||||||||||||||||||||||||
|
|
|
|
|
|
|
| |||||||||||||||||||||||||
TARGET 2055 SERIES: | FOR THE YEAR ENDED 10/31/16 | FOR THE YEAR ENDED 10/31/15 | FOR THE YEAR ENDED 10/31/16 | FOR THE YEAR ENDED 10/31/15 | ||||||||||||||||||||||||||||
| CLASS K SHARES | AMOUNTS | CLASS K SHARES | AMOUNTS | CLASS R SHARES | AMOUNTS | CLASS R SHARES | AMOUNTS | |||||||||||||||||||||||||
Sold | 148,413 | $ | 1,727,779 | 70,074 | $ | 919,046 | 23,384 | $ | 266,230 | 20,716 | $ | 267,598 | ||||||||||||||||||||
Reinvested | 9,758 | 106,036 | 11,308 | 146,585 | 3,757 | 40,453 | 3,176 | 40,849 | ||||||||||||||||||||||||
Repurchased | (45,778 | ) | (535,658 | ) | (117,934 | ) | (1,549,911 | ) | (15,214 | ) | (174,567 | ) | (28,276 | ) | (363,445 | ) | ||||||||||||||||
|
|
|
|
|
|
|
|
|
|
|
|
|
|
|
| |||||||||||||||||
Total | 112,393 | $ | 1,298,157 | (36,552 | ) | $ | (484,280 | ) | 11,927 | $ | 132,116 | (4,384 | ) | $ | (54,998 | ) | ||||||||||||||||
|
|
|
|
|
|
|
|
|
|
|
|
|
|
|
| |||||||||||||||||
78
Notes to Financial Statements (continued)
| 6. | Capital Stock Transactions (continued) |
TARGET 2055 SERIES: | FOR THE YEAR ENDED 10/31/16 | FOR THE YEAR ENDED 10/31/15 | ||||||||||||||||||||||||||||||
| CLASS I SHARES | AMOUNTS | CLASS I SHARES | AMOUNTS | |||||||||||||||||||||||||||||
Sold | 184,679 | $ | 2,129,798 | 96,840 | $ | 1,265,526 | ||||||||||||||||||||||||||
Reinvested | 14,516 | 159,002 | 5,406 | 70,699 | ||||||||||||||||||||||||||||
Repurchased | (94,535 | ) | (1,102,471 | ) | (33,315 | ) | (437,883 | ) | ||||||||||||||||||||||||
|
|
|
|
|
|
|
| |||||||||||||||||||||||||
Total | 104,660 | $ | 1,186,329 | 68,931 | $ | 898,342 | ||||||||||||||||||||||||||
|
|
|
|
|
|
|
| |||||||||||||||||||||||||
TARGET 2060 SERIES: | FOR THE YEAR ENDED 10/31/16 | FOR THE PERIOD 9/21/15 (COMMENCEMENT OF OPERATIONS) TO 10/31/15 | FOR THE YEAR ENDED 10/31/16 | FOR THE PERIOD 9/21/15 (COMMENCEMENT OF OPERATIONS) TO 10/31/15 | ||||||||||||||||||||||||||||
| CLASS K SHARES | AMOUNTS | CLASS K SHARES | AMOUNTS | CLASS R SHARES | AMOUNTS | CLASS R SHARES | AMOUNTS | |||||||||||||||||||||||||
Sold | 129,353 | $ | 1,262,758 | 5,000 | $ | 50,000 | 13,406 | $ | 140,049 | 5,397 | $ | 54,041 | ||||||||||||||||||||
Reinvested | 82 | 841 | — | — | 23 | 231 | — | — | ||||||||||||||||||||||||
Repurchased | (2,623 | ) | (27,435 | ) | — | — | (1,763 | ) | (18,680 | ) | (7 | ) | (72 | ) | ||||||||||||||||||
|
|
|
|
|
|
|
|
|
|
|
|
|
|
|
| |||||||||||||||||
Total | 126,812 | $ | 1,236,164 | 5,000 | $ | 50,000 | 11,666 | $ | 121,600 | 5,390 | $ | 53,969 | ||||||||||||||||||||
|
|
|
|
|
|
|
|
|
|
|
|
|
|
|
| |||||||||||||||||
TARGET 2060 SERIES: | FOR THE YEAR ENDED 10/31/16 | FOR THE PERIOD 9/21/15 (COMMENCEMENT OF OPERATIONS) TO 10/31/15 | ||||||||||||||||||||||||||||||
| CLASS I SHARES | AMOUNTS | CLASS I SHARES | AMOUNTS | |||||||||||||||||||||||||||||
Sold | 494 | $ | 5,214 | 5,000 | $ | 50,000 | ||||||||||||||||||||||||||
Reinvested | 30 | 302 | — | — | ||||||||||||||||||||||||||||
Repurchased | (267 | ) | (2,839 | ) | — | — | ||||||||||||||||||||||||||
|
|
|
|
|
|
|
| |||||||||||||||||||||||||
Total | 257 | $ | 2,677 | 5,000 | $ | 50,000 | ||||||||||||||||||||||||||
|
|
|
|
|
|
|
| |||||||||||||||||||||||||
1See Note 1 regarding the reorganization.
The following table represents instances at October 31, 2016, where a shareholder account owned greater than 10% of a Series:
| SERIES | NUMBER OF ACCOUNTS OVER 10% | PERCENTAGE OF THE SERIES | ||||||
Target Income Series | 1 | 69.4 | % | |||||
Target 2015 Series | 1 | 30.4 | % | |||||
Target 2020 Series | 3 | 59.3 | % | |||||
Target 2025 Series | 1 | 30.0 | % | |||||
Target 2030 Series | 2 | 48.0 | % | |||||
Target 2035 Series | 2 | 48.7 | % | |||||
Target 2040 Series | 3 | 57.1 | % | |||||
Target 2045 Series | 2 | 40.5 | % | |||||
Target 2050 Series | 2 | 41.7 | % | |||||
Target 2055 Series | 1 | 39.8 | % | |||||
Target 2060 Series | 1 | 82.1 | % | |||||
Investment activities of these shareholders may have a material effect on the Series.
In addition, at October 31, 2016, the Advisor and affiliates owned 9.8% of the Target 2060 Series.
79
Notes to Financial Statements (continued)
| 7. | Financial Instruments |
The Underlying Series may trade in instruments including written and purchased options, forward foreign currency exchange contracts and futures contracts and other derivatives in the normal course of investing activities to assist in managing exposure to various market risks. The Underlying Series may be subject to various elements of risk which may involve, to a varying degree, elements of risk in excess of the amounts recognized for financial statement purposes. These risks include: the risk that changes in the value of a derivative may not correlate perfectly with the underlying asset, rate or index; counterparty credit risk related to over the counter derivative counterparties’ failure to perform under contract terms; liquidity risk related to the lack of a liquid market for these contracts allowing the fund to close out its position(s); and documentation risk relating to disagreement over contract terms. No such investments were directly held by the Series as of October 31, 2016.
| 8. | Federal Income Tax Information |
The amount and characterization of certain income and capital gains to be distributed are determined in accordance with federal income tax regulations, which may differ from GAAP. The differences are primarily due to differing book and tax treatment in the timing and recognition on net investment income or gains and losses, including losses deferred due to wash sales. Each Series may periodically make reclassifications among its capital accounts to reflect income and gains available for distribution (or available capital loss carryovers) under income tax regulations, without impacting the Series’ net asset value. For the fiscal year ended October 31, 2016, the reclassifications were as follows:
| SERIES | TO/(FROM) ACCUMULATED NET REALIZED GAIN (LOSS) ON INVESTMENTS | TO/(FROM) UNDISTRIBUTED NET INVESTMENT INCOME | ||
Target Income Series | (90) | 90 | ||
Target 2015 Series | 54 | (54) | ||
Target 2020 Series | (464) | 464 | ||
Target 2025 Series | 177 | (177) | ||
Target 2030 Series | 926 | (926) | ||
Target 2040 Series | (3,542) | 3,542 | ||
Target 2050 Series | (7,316) | 7,316 | ||
Target 2055 Series | (7) | 7 | ||
Target 2060 Series | (24) | 24 |
The reclassifications relate primarily to distributions from investments in the Underlying Series. Any such reclassifications are not reflected in the financial highlights.
The tax character of distributions paid were as follows:
| TARGET INCOME SERIES | TARGET 2015 SERIES | TARGET SERIES | TARGET 2025 SERIES | TARGET SERIES | ||||||||||||||||
Ordinary income (2016) | $ | 1,645,777 | $ | 93,014 | $ | 1,874,595 | $ | 364,967 | $ | 1,748,667 | ||||||||||
Ordinary income (2015) | $ | 1,993,670 | $ | 323,856 | $ | 5,131,810 | $ | 994,754 | $ | 8,177,375 | ||||||||||
Long-term capital gain (2016) | $ | 3,977,013 | $ | 586,220 | $ | 13,936,678 | $ | 2,302,313 | $ | 22,083,706 | ||||||||||
Long-term capital gain (2015) | $ | 5,034,635 | $ | 226,032 | $ | 14,598,333 | $ | 845,593 | $ | 19,717,662 | ||||||||||
| TARGET 2035 SERIES | TARGET 2040 SERIES | TARGET 2045 SERIES | TARGET 2050 SERIES | TARGET 2055 SERIES | TARGET 2060 SERIES | |||||||||||||||||||
Ordinary income (2016) | $ | 197,409 | $ | 708,610 | $ | 53,027 | $ | 163,983 | $ | 19,089 | $ | 1,375 | ||||||||||||
Ordinary income (2015) | $ | 1,009,386 | $ | 6,658,425 | $ | 575,767 | $ | 3,512,578 | $ | 202,996 | $ | — | ||||||||||||
Long-term capital gain (2016) | $ | 2,198,508 | $ | 15,564,808 | $ | 1,000,433 | $ | 6,162,262 | $ | 303,315 | $ | — | ||||||||||||
Long-term capital gain (2015) | $ | 666,542 | $ | 16,464,854 | $ | 241,240 | $ | 6,947,427 | $ | 67,345 | $ | — | ||||||||||||
80
Notes to Financial Statements (continued)
| 8. | Federal Income Tax Information (continued) |
At October 31, 2016, the tax basis of components of distributable earnings and the net unrealized appreciation (depreciation) based on the identified cost of investments for federal income tax purposes were as follows:
| TARGET INCOME SERIES | TARGET SERIES | TARGET 2020 SERIES | TARGET 2025 SERIES | TARGET 2030 SERIES | ||||||||||||||||
Cost for federal income tax purposes | $ | 81,158,489 | $ | 6,950,821 | $ | 137,923,132 | $ | 32,249,864 | $ | 152,832,289 | ||||||||||
Unrealized appreciation | — | — | — | 495,700 | — | |||||||||||||||
Unrealized depreciation | (3,298,353 | ) | (205,160 | ) | (7,886,274 | ) | (2,289,586 | ) | (11,863,854 | ) | ||||||||||
|
|
|
|
|
|
|
|
|
| |||||||||||
Net unrealized depreciation | $ | (3,298,353 | ) | $ | (205,160 | ) | $ | (7,886,274 | ) | $ | (1,793,886 | ) | $ | (11,863,854 | ) | |||||
|
|
|
|
|
|
|
|
|
| |||||||||||
Undistributed ordinary income | $ | 76,451 | $ | 4,188 | $ | 97,424 | $ | 19,131 | $ | 93,068 | ||||||||||
Capital loss carryover | $ | (1,599,307 | ) | $ | (574,932 | ) | $ | (3,861,274 | ) | $ | (919,183 | ) | $ | (4,268,029 | ) | |||||
TARGET 2035 SERIES | TARGET 2040 SERIES | TARGET 2045 SERIES | TARGET 2050 SERIES | TARGET SERIES | TARGET SERIES | |||||||||||||||||||
Cost for federal income tax purposes | $ | 28,092,223 | $ | 96,906,717 | $ | 15,438,420 | $ | 32,540,769 | $ | 6,145,536 | $ | 1,512,923 | ||||||||||||
Unrealized appreciation | — | 323,961 | 45,868 | 385,463 | 68,340 | 122,107 | ||||||||||||||||||
Unrealized depreciation | (2,813,644 | ) | (8,719,767 | ) | (1,393,445 | ) | (2,665,277 | ) | (515,384 | ) | (740 | ) | ||||||||||||
|
|
|
|
|
|
|
|
|
|
|
| |||||||||||||
Net unrealized appreciation | ||||||||||||||||||||||||
(depreciation) | $ | (2,813,644 | ) | $ | (8,395,806 | ) | $ | (1,347,577 | ) | $ | (2,279,814 | ) | $ | (447,044 | ) | $ | 121,367 | |||||||
|
|
|
|
|
|
|
|
|
|
|
| |||||||||||||
Undistributed ordinary income | $ | 9,712 | $ | 42,048 | $ | 8,133 | $ | 17,881 | $ | 686 | $ | 4,252 | ||||||||||||
Undistributed long-term capital gains | $ | 164,257 | $ | — | $ | 177,024 | $ | — | $ | 68,592 | $ | 4,283 | ||||||||||||
Capital loss carryforwards | $ | — | $ | (2,229,560 | ) | $ | — | $ | (439,584 | ) | $ | — | $ | — | ||||||||||
At October 31, 2016, Target Income Series, Target 2015 Series, Target 2020 Series, Target 2025 Series, Target 2030 Series, Target 2040 Series and Target 2050 Series had net long-term capital loss carryforwards of $1,599,307, $574,932, $3,861,274, $919,183, $4,268,029, $2,229,560, and $439,584, respectively, which may be carried forward indefinitely.
81
Report of Independent Registered Public Accounting Firm
To the Board of Directors of Manning & Napier Fund, Inc. and Shareholders of Target Income Series, Target 2015 Series, Target 2020 Series, Target 2025 Series, Target 2030 Series, Target 2035 Series, Target 2040 Series, Target 2045 Series, Target 2050 Series, Target 2055 Series and Target 2060 Series:
In our opinion, the accompanying statements of assets and liabilities, including the investment portfolios, and the related statements of operations and of changes in net assets and the financial highlights present fairly, in all material respects, the financial position of the Target Income Series, Target 2015 Series, Target 2020 Series, Target 2025 Series, Target 2030 Series, Target 2035 Series, Target 2040 Series, Target 2045 Series, Target 2050 Series, Target 2055 Series and Target 2060 Series (each a series of Manning & Napier Fund, Inc., hereafter collectively referred to as the “Series”) as of October 31, 2016, the results of each of their operations for the year then ended, the changes in each of their net assets for each of the two years in the period then ended and the financial highlights for each of the periods presented, in conformity with accounting principles generally accepted in the United States of America. These financial statements and financial highlights (hereafter referred to as “financial statements”) are the responsibility of the Series’ management. Our responsibility is to express an opinion on these financial statements based on our audits. We conducted our audits of these financial statements in accordance with the standards of the Public Company Accounting Oversight Board (United States). Those standards require that we plan and perform the audit to obtain reasonable assurance about whether the financial statements are free of material misstatement. An audit includes examining, on a test basis, evidence supporting the amounts and disclosures in the financial statements, assessing the accounting principles used and significant estimates made by management, and evaluating the overall financial statement presentation. We believe that our audits, which included confirmation of securities as of October 31, 2016 by correspondence with the transfer agent and custodian, provide a reasonable basis for our opinion.

New York, New York
December 16, 2016
82
Supplemental Tax Information
(unaudited)
All reportings are based on financial information available as of the date of this annual report and, accordingly, are subject to change.
For federal income tax purposes, each of the Series reports for the current fiscal year the amount disclosed below or, if different, the maximum amount allowable under the tax law, as qualified dividend income (“QDI”).
| Series | QDI | |||
Target Income Series | $ | 742,462 | ||
Target 2015 Series | 53,647 | |||
Target 2020 Series | 1,227,540 | |||
Target 2025 Series | 298,733 | |||
Target 2030 Series | 1,570,357 | |||
Target 2035 Series | 197,626 | |||
Target 2040 Series | 796,077 | |||
Target 2045 Series | 76,916 | |||
Target 2050 Series | 233,060 | |||
Target 2055 Series | 26,576 | |||
Target 2060 Series | 4,588 | |||
For corporate shareholders, the percentage of investment income (dividend income plus short-term gain, if any) that qualifies for the dividends received deduction (DRD) for the current fiscal year is as follows:
| Series | DRD% | |||
Target Income Series | 33.06 | % | ||
Target 2015 Series | 35.68 | % | ||
Target 2020 Series | 38.00 | % | ||
Target 2025 Series | 49.16 | % | ||
Target 2030 Series | 56.58 | % | ||
Target 2035 Series | 67.35 | % | ||
Target 2040 Series | 80.11 | % | ||
Target 2045 Series | 92.18 | % | ||
Target 2050 Series | 94.21 | % | ||
Target 2055 Series | 93.55 | % | ||
Target 2060 Series | 66.24 | % | ||
The Series designate Long-Term Capital Gain dividends pursuant to Section 852(b)(3) of the Code for the fiscal year ended October 31, 2016 as follows:
| Series | ||||
Target Income Series | $ | — | ||
Target 2015 Series | — | |||
Target 2020 Series | — | |||
Target 2025 Series | — | |||
Target 2030 Series | — | |||
Target 2035 Series | 172,566 | |||
Target 2040 Series | — | |||
Target 2045 Series | 185,935 | |||
Target 2050 Series | — | |||
Target 2055 Series | 72,022 | |||
Target 2060 Series | 4,497 | |||
83
Directors’ and Officers’ Information
(unaudited)
The Statement of Additional Information provides additional information about the Fund’s directors and officers and can be obtained without charge by calling 1-800-466-3863, at www.manningnapieradvisors.com, or on the EDGAR Database on the SEC Internet web site (http:// www.sec.gov). The following chart shows certain information about the Fund’s officers and directors, including their principal occupations during the last five years. Unless specific dates are provided, the individuals have held the listed positions for longer than five years.
Interested Director/Officer
| Name: | Michele T. Mosca* | |
| Address: | 290 Woodcliff Drive | |
| Fairport, NY 14450 | ||
| Age: | 44 | |
| Current Position(s) Held with Fund: | Principal Executive Officer, President, Chairman & Director | |
| Term of Office1 & Length of Time Served: | Indefinite - Chairman and Director since August 2016 | |
| Principal Occupation(s) During Past 5 Years: | Managing Director, Funds Group (2009-present)- Manning & Napier Advisors, LLC; President, Director (2015-present) - Manning & Napier Investor Services, Inc.; Chief Executive Officer, President (2016-present) - Rainier Investment Management Mutual Funds | |
| Holds or has held one or more of the following titles for various subsidiaries and affiliates: President, Director | ||
| Number of Portfolios Overseen within Fund Complex: | 40 | |
| Other Directorships Held Outside Fund Complex: | Trustee - Rainier Investment Management Mutual Funds (six portfolios) (2016-present) | |
| Independent Directors | ||
| Name: | Stephen B. Ashley | |
| Address: | 290 Woodcliff Drive | |
| Fairport, NY 14450 | ||
| Age: | 76 | |
| Current Position(s) Held with Fund: | Director, Audit Committee Member, Governance & Nominating Committee Member | |
| Term of Office & Length of Time Served: | Indefinite - Since 1996 | |
| Principal Occupation(s) During Past 5 Years: | Chairman, Director & Chief Executive Officer (1997 to present) - The Ashley Group (property management and investment). Director (1995-2008) and Chairman (non-executive)(2004-2008) - Fannie Mae (mortgage) | |
| Number of Portfolios Overseen within Fund Complex: | 40 | |
| Other Directorships Held Outside Fund Complex: | Fannie Mae (mortgage)(1995-2008) | |
| The Ashley Group (property management and investment)(1995-2008) | ||
| Genesee Corporation (holding company)(1987-2007) | ||
| Name: | Paul A. Brooke | |
| Address: | 290 Woodcliff Drive | |
| Fairport, NY 14450 | ||
| Age: | 70 | |
| Current Position(s) Held with Fund: | Director, Audit Committee Member, Governance & Nominating Committee Member | |
| Term of Office & Length of Time Served: | Indefinite - Since 2007 | |
| Principal Occupation(s) During Past 5 Years: | Chairman & CEO (2005-2009) - Ithaka Acquisition Corporation | |
| (investments); Chairman (2007-2009) - Alsius Corporation (investments); Managing Member (1991-present)- PMSV Holdings LLC(investments); Managing Member (2010-present) - Venbio (investments). | ||
| Number of Portfolios Overseen within Fund Complex: | 40 | |
| Other Directorships Held Outside Fund Complex: | Incyte Corp. (biotech)(2000-present) ViroPharma, Inc. (speciality pharmaceuticals)(2000-2014) HLTH Corp (WebMD)(information)(2000-2010) Cheyne Capital International (investment)(2000-present) GMP Companies (investment)(2000-2011) Cytos Biotechnology Ltd (biotechnology)(2012-present)
| |
84
Directors’ and Officers’ Information
(unaudited)
Independent Directors (continued)
| Name: | Peter L. Faber | |
| Address: | 290 Woodcliff Drive | |
| Fairport, NY 14450 | ||
| Age: | 78 | |
| Current Position(s) Held with Fund: | Director, Governance & Nominating Committee Member | |
| Term of Office & Length of Time Served: | Indefinite - Since 1987 | |
| Principal Occupation(s) During Past 5 Years: | Senior Counsel (2006-2012), Partner (1995-2006 & 2013-present) - | |
| McDermott, Will & Emery LLP (law firm) | ||
| Number of Portfolios Overseen within Fund Complex: | 40 | |
| Other Directorships Held Outside Fund Complex: | Boston Early Music Festival (non-profit) (2007-present) | |
| Amherst Early Music, Inc. (non-profit)(2009-present) | ||
| Gotham Early Music Scene, Inc. (non-profit)(2009-present) | ||
| Partnership for New York City, Inc. (non-profit) (1989-2010) | ||
| New York Collegium (non-profit) (2004-2011) | ||
| Name: | Harris H. Rusitzky | |
| Address: | 290 Woodcliff Drive | |
| Fairport, NY 14450 | ||
| Age: | 81 | |
| Current Position(s) Held with Fund: | Director, Audit Committee Member, Governance & Nominating Committee Member | |
| Term of Office & Length of Time Served: | Indefinite - Since 1985 | |
| Principal Occupation(s) During Past 5 Years: | President (1994-present) - The Greening Group (business consultants); | |
| Partner (2006-present)- The Restaurant Group (restaurants) | ||
| Number of Portfolios Overseen within Fund Complex: | 40 | |
| Other Directorships Held Outside Fund Complex: | Rochester Institute of Technology (university) (1972-present) | |
| Culinary Institute of America (non-profit college) (1985-present) | ||
| George Eastman House (museum) (1988-present) | ||
| National Restaurant Association (restaurant trade organization) | ||
| (1978-present) | ||
| Name: | Chester N. Watson | |
| Address: | 290 Woodcliff Drive | |
| Fairport, NY 14450 | ||
| Age: | 66 | |
| Current Position(s) Held with Fund: | Director, Audit Committee Chairman, Governance & Nominating | |
| Committee Member | ||
| Term of Office & Length of Time Served: | Indefinite - Since 2012 | |
| Principal Occupation(s) During Past 5 Years: | General Auditor (2003-2011) - General Motors Company (auto | |
| manufacturer) | ||
| Number of Portfolios Overseen within Fund Complex: | 40 | |
| Other Directorships Held Outside Fund Complex: | Rochester Institute of Technology (university) (2005-present) | |
| Officers | ||
| Name: | Jeffrey S. Coons, Ph.D., CFA® | |
| Address: | 290 Woodcliff Drive | |
| Fairport, NY 14450 | ||
| Age: | 53 | |
| Current Position(s) Held with Fund: | Vice President | |
| Term of Office1 & Length of Time Served: | Since 2004 | |
| Principal Occupation(s) During Past 5 Years: | President since 2010, Co-Director of Research (2002-2015) - Manning & Napier Advisors, LLC | |
| Holds one or more of the following titles for various subsidiaries and affiliates: President, Director, Treasurer or Senior Trust Officer. | ||
| Number of Portfolios Overseen within Fund Complex: | 40 | |
| Other Directorships Held Outside Fund Complex: | N/A
| |
85
Directors’ and Officers’ Information
(unaudited)
Officers (continued)
| Name: | Elizabeth Craig | |
| Address: | 290 Woodcliff Drive | |
| Fairport, NY 14450 | ||
| Age: | 29 | |
| Current Position(s) Held with Fund: | Corporate Secretary | |
| Term of Office1 & Length of Time Served: | Since 2016 | |
| Principal Occupation(s) During Past 5 Years: | Fund Administration Manager since 2015; Mutual Fund Compliance | |
| Specialist (2009-2015) - Manning & Napier Advisors, LLC; Assistant | ||
| Corporate Secretary (2011-2016)- Manning & Napier Fund, Inc. | ||
| Number of Portfolios Overseen within Fund Complex: | 40 | |
| Other Directorships Held Outside Fund Complex: | N/A | |
| Name: | Christine Glavin | |
| Address: | 290 Woodcliff Drive | |
| Fairport, NY 14450 | ||
| Age: | 50 | |
| Current Position(s) Held with Fund: | Principal Financial Officer, Chief Financial Officer | |
| Term of Office1 & Length of Time Served: | Principal Financial Officer (2002-present); Chief Financial Officer | |
| (2001-present) | ||
| Principal Occupation(s) During Past 5 Years: | Director of Fund Reporting (2011-present); Fund Reporting Manager | |
| (1997-2011)- Manning & Napier Advisors, LLC; Assistant Treasurer | ||
| (2008-present)- Exeter Trust Company | ||
| Number of Portfolios Overseen within Fund Complex: | 40 | |
| Other Directorships Held Outside Fund Complex: | N/A | |
| Name: | Jodi L. Hedberg | |
| Address: | 290 Woodcliff Drive | |
| Fairport, NY 14450 | ||
| Age: | 48 | |
| Current Position(s) Held with Fund: | Chief Compliance Officer, Anti-Money Laundering Compliance Officer | |
| Term of Office1 & Length of Time Served: | Chief Compliance Officer (2004-present); Anti-Money Laundering | |
| Compliance Officer (2002-present); Corporate Secretary (1997-2016) | ||
| Principal Occupation(s) During Past 5 Years: | Director of Compliance (2005-present); Compliance Manager (1995-2005) | |
| - Manning & Napier Advisors, LLC and affiliates; Corporate Secretary- | ||
| Manning & Napier Investor Services, Inc. since 2006 | ||
| Number of Portfolios Overseen within Fund Complex: | 40 | |
| Other Directorships Held Outside Fund Complex: | N/A | |
| Name: | Amy Williams | |
| Address: | 290 Woodcliff Drive | |
| Fairport, NY 14450 | ||
| Age: | 54 | |
| Current Position(s) Held with Fund: | Assistant Corporate Secretary | |
| Term of Office1 & Length of Time Served: | Since 2016 | |
| Principal Occupation(s) During Past 5 Years: | Director of Fund Documentation (1992-present) – Manning & Napier | |
| Advisors, LLC | ||
| Holds one or more of the following titles for various affiliates; Director | ||
| Number of Portfolios Overseen within Fund Complex: | 40 | |
| Other Directorships Held Outside Fund Complex: | N/A | |
| Name: | Richard Yates | |
| Address: | 290 Woodcliff Drive | |
| Fairport, NY 14450 | ||
| Age: | 51 | |
| Current Position(s) Held with Fund: | Chief Legal Officer | |
| Term of Office1 & Length of Time Served: | Chief Legal Officer since 2004 | |
| Principal Occupation(s) During Past 5 Years: | Counsel- Manning & Napier Advisors, LLC and affiliates (2000-present); | |
| Holds one or more of the following titles for various affiliates; Director or | ||
| Corporate Secretary | ||
| Number of Portfolios Overseen within Fund Complex: | 40 | |
| Other Directorships Held Outside Fund Complex: | N/A | |
*Interested Director, within the meaning of the Investment Company Act of 1940 by reason of her position with the Fund’s investment advisor. Ms. Mosca serves as the Managing Director of the Funds Group for Manning & Napier Advisors, LLC.
1 The term of office of all officers shall be one year and until their respective successors are chosen and qualified, or his or her earlier resignation or removal as provided in the Fund’s By-Laws.
86
Literature Requests
(unaudited)
Proxy Voting Policies and Procedures
A description of the policies and procedures that the Fund uses to determine how to vote proxies relating to portfolio securities is available, without charge, upon request:
| By phone | 1-800-466-3863 | |||
| On the Securities and Exchange | ||||
| Commission’s (SEC) web site | http://www.sec.gov |
Proxy Voting Record
Information regarding how the Fund voted proxies relating to portfolio securities during the most recent 12-month period ended June 30th is available, without charge, upon request:
| By phone | 1-800-466-3863 | |||
| On the SEC’s web site | http://www.sec.gov |
Quarterly Portfolio Holdings
The Series’ complete schedule of portfolio holdings for the 1st and 3rd quarters of each fiscal year are provided on Form N-Q, and are available, without charge, upon request:
| By phone | 1-800-466-3863 | |||
| On the SEC’s web site | http://www.sec.gov |
The Series’ Form N-Q may be reviewed and copied at the SEC’s Public Reference Room in Washington, D.C. Information on the operation of the Public Reference Room may be obtained by calling 1-800-SEC-0330.
Prospectus and Statement of Additional Information (SAI)
For more information about any of the Manning & Napier Fund, Inc. Series, you may obtain a prospectus and SAI at www.manning-napier.com or by calling (800) 466-3863. Before investing, carefully consider the objectives, risks, charges and expenses of the investment and read the prospectus carefully as it contains this and other information about the investment company. In addition, this information can be found on the SEC’s web site, http://www.sec.gov.
Additional information available at www.manning-napier.com
1. Fund Holdings - Month-End
2. Fund Holdings - Quarter-End
3. Shareholder Report - Annual
4. Shareholder Report - Semi-Annual
The Fund also offers electronic notification or “e-delivery” when certain documents are available on-line to be downloaded or reviewed. Direct shareholders can elect to receive electronic notification when shareholder reports, prospectus updates, and/or statements are available. If you do not currently have on-line access to your account, you can establish access by going to www.manning-napier.com, click on “Login” in the top corner of the page, and follow the prompts to self-enroll. Once enrolled, you can set your electronic notification preferences by clicking on the Account Options tab located within the green toolbar and then select E-Delivery Option. Should you have any questions on either how to establish on-line access or how to update your account settings, please contact Investor Services at 1-800-466-3863.
The Manning & Napier Fund, Inc. is managed by Manning & Napier Advisors, LLC. Manning & Napier Investor Services, Inc., an affiliate of Manning & Napier Advisors, LLC, is the distributor of the Fund shares.
MNTGT-10/16-AR

Disciplined Value Series
Management Discussion and Analysis
(unaudited)
Dear Shareholders:
U.S. and international equity markets delivered positive returns during the past year. Emerging market equities were the notable outperformers, driven by investors’ search for yield and their increased appetite for riskier assets. Abating unease related to Chinese growth, a relatively stable U.S. dollar, the year-to-date upturn in commodity prices, and increased liquidity amid generally easy policy across the globe also provided tailwinds for emerging market assets. Defensive sectors outperformed cyclicals for most of the period, since defensive securities tend to benefit from low interest rate environments and yield is a big component of total return. But the trend reversed amid a mid-year rotation away from crowded defensive sectors into cyclical stocks, and investors have since shown a preference for growth over yield.
Meanwhile, U.S. and global economic growth continued at a slow pace. Although various asset classes performed positively, the year was punctuated by bouts of market volatility. Ongoing concern regarding the price of oil and other commodities, speculation surrounding the trajectory of global economic growth and central bank policy, and political uncertainty — including the unexpected Brexit vote — fueled investor unease and served as volatility catalysts. Going forward, we anticipate an increased likelihood of further gyrations in financial markets as U.S. and global economic growth continues at a muted pace.
Enclosed, we highlight how we are positioned amid the current economic environment, and provide our outlook of what to expect in financial markets. We hope that you find this information to be helpful.
As always, we appreciate your business.
Sincerely,
Manning & Napier Advisors, LLC
1
Disciplined Value Series
Fund Commentary
(unaudited)
| Investment | Objective |
Through a systematic investment approach, the Series seeks to provide competitive returns consistent with the broad equity market while also providing a level of capital protection during bear markets. The Series is designed to offer a diversified portfolio of dividend-paying equity securities. In selecting securities for the Series, the Advisor uses a disciplined screening process to identify stocks of companies that it believes are undervalued in the market, based on factors such as free cash flow generation and earnings power, and that meet other investment criteria relating to minimum dividend yield, dividend sustainability, and financial health.
| Performance | Commentary |
U.S. equity markets generally delivered positive absolute returns for the twelve-month period ended October 31, 2016. The Russell 3000 Index returned 4.24%. Value stocks outperformed growth stocks during the period as the Russell 1000 Value Index returned 6.37% while the Russell 1000 Growth Index returned 2.28%. The Disciplined Value Series Class S provided positive absolute returns of 7.99%, outperforming the Russell 1000 Value Index as well as the broad market on a relative basis.
The Series’ outperformance relative to the Russell 1000 Value Index during the year was primarily driven by sector positioning. Specifically, the Series’ overweight to Consumer Staples and underweight to Financials compared to the benchmark were among the largest contributors to relative performance. The income-oriented Consumer Staples was partly supported by investors seeking yield against the backdrop of low interest rates. Conversely, persistently low interest rates weighed on Financials in the form of profit erosion and weaker net interest margins.
Offsetting a portion of the relative performance tailwind was the Series’ underweight to Utilities compared to the benchmark, which challenged relative returns. Similar to Consumer Staples, Utilities tend to trade as bond proxies and were partly supported by investors seeking yield in the low interest rate environment. Utilities also benefitted from economic growth concerns as investors sought out safe haven assets.
Within the Series, through our disciplined screening process, we pursue opportunities for shareholders to generate stable income with the potential for capital appreciation. Importantly, our approach will continue to emphasize risk management as a critical component in managing the Series. Despite today’s challenging slow economic growth environment, we believe that this approach can help our shareholders to achieve their long-term investment objectives.
As we look toward 2017, we expect global economic growth to persist at a slow pace. Broadly speaking, valuations in the developed world are on the expensive side of neutral, whereas valuations in select emerging markets are relatively more attractive. The current backdrop suggests muted long-term returns going forward, increasing the importance of selectivity. We continue to anticipate gyrations in equity markets due to catalysts such as the potential for global growth to deviate from expectations, diverging central bank policies, commodity price pressures, and geopolitical risks. However, our indicators do not suggest capital risk is a significant near-term concern. In this environment, a selective approach can help avoid overvalued areas of the market, a tactic that Manning & Napier has employed for over 45 years as an active investment manager.
Please see the next page for additional performance information as of October 31, 2016.
Performance data quoted represents past performance and does not guarantee future results. The investment return and principal value of an investment will fluctuate, so that an investor’s shares, when redeemed, may be worth more or less than their original cost. Current performance may be higher or lower than that quoted; investors can obtain the most recent month-end performance at www.manning-napier.com or by calling (800) 466-3863.
Performance for the Disciplined Value Series Class S shares is provided above. Performance for the Disciplined Value Series Class I shares may be higher or lower based on the Class’ underlying expenses
All investments involve risks, including possible loss of principal. As with any stock fund, the value of your investment will fluctuate in response to stock market movements. Investing in the Series will also involve a number of other risks, including issuer-specific risk, foreign investment risk, and mid-cap risk. In addition, because the Advisor manages the Series with a quantitative approach, the Series is subject to the additional risk that the investment approach may not be successful. Further, the Advisor does not intend to make frequent changes to the Series’ portfolio in response to market movements.
2
Disciplined Value Series
Performance Update as of October 31, 2016
(unaudited)
AVERAGE ANNUAL TOTAL RETURNS AS OF OCTOBER 31, 2016 | ||||||
| ONE YEAR1 | FIVE YEAR | SINCE INCEPTION2 | ||||
Manning & Napier Fund, Inc. - Disciplined Value Series - Class I3 | 8.24% | 11.06% | 11.72% | |||
Manning & Napier Fund, Inc. - Disciplined Value Series - Class S3,4 | 7.99% | 10.77% | 11.43% | |||
Russell 1000® Value Index5 | 6.37% | 13.31% | 12.17% | |||
75/25 Blended Index6 | 4.31% | 10.75% | 10.66% | |||
The following graph compares the value of a $1,000,000 investment in the Manning & Napier Fund, Inc. - Disciplined Value Series - Class I from its inception2 (November 7, 2008) to present (October 31, 2016) to the Russell 1000® Value Index and 75/25 Blended Index.
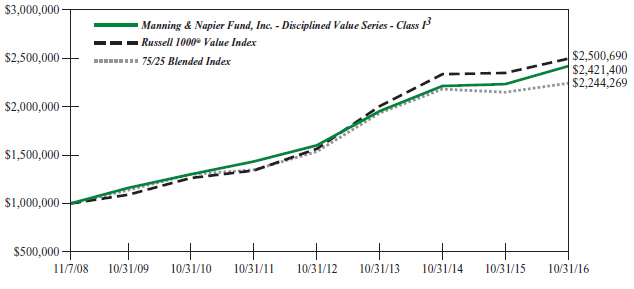
1The returns shown are based on net asset values calculated for shareholder transactions and may differ from the returns shown in the financial highlights, which reflect adjustments made to the net asset values in accordance with accounting principles generally accepted in the United States of America.
2Performance numbers for the Series and Index are calculated from November 7, 2008, the Series’ Class I inception date.
3The Series’ performance does not reflect the deduction of taxes that a shareholder would pay on fund distributions or the redemption of shares. The Series’ performance is historical and may not be indicative of future results. The performance returns shown are inclusive of the net expense ratio of the Series. For the year ended October 31, 2016, this annualized net expense ratio was 0.82% for Class S and 0.57% for Class I. The annualized gross expense ratio, which does not account for any voluntary or contractual waivers currently in effect, was 0.82% for Class S and 0.57% for Class I for the year ended October 31, 2016.
4For periods through March 1, 2012 (the inception date of the Class S shares), performance for the Class S shares is hypothetical and is based on the historical performance of the Class I shares adjusted for the Class S shares’ charges and expenses.
5The Russell 1000® Value Index is an unmanaged, market capitalization-weighted index consisting of those Russell 1000® companies with lower price-to-book ratios and lower forecasted growth values. The Index returns are based on a market capitalization-weighted average of relative price changes of the component stocks plus dividends whose reinvestments are compounded daily. The Index returns do not reflect any fees or expenses. Index returns provided by Bloomberg.
6The 75/25 Blended Index is 75% Russell 1000® Value and 25% S&P ADR Index (S&P ADR). S&P ADR is an unmanaged, capitalization-weighted measure of non-U.S. companies within the S&P Global 1200 Index which are listed as Level I or Level II ADRs, or ordinary shares in the U.S. The S&P Global 1200 Index is designed to measure the performance of the global equity market and is a composite of seven headline indices provided by S&P. The Index returns assume daily reinvestment of dividends. Index returns provided by Bloomberg. S&P Dow Jones Indices LLC, a subsidiary of the McGraw Hill Financial, Inc., is the publisher of various index based data products and services and has
3
Disciplined Value Series
Performance Update as of October 31, 2016
(unaudited)
licensed certain of its products and services for use by Manning & Napier. All such content Copyright © 2016 by S&P Dow Jones Indices LLC and/or its affiliates. All rights reserved. Neither S&P Dow Jones Indices LLC, Dow Jones Trademark Holdings LLC, their affiliates nor their third party licensors make any representation or warranty, express or implied, as to the ability of any index to accurately represent the asset class or market sector that it purports to represent and none of these parties shall have any liability for any errors, omissions, or interruptions of any index or the data included therein. The returns of the indices do not reflect any fees or expenses. Returns provided are calculated monthly using a blended allocation. Because the fund’s asset allocation will vary over time, the composition of the fund’s portfolio may not match the composition of the comparative indices.
4
Disciplined Value Series
Shareholder Expense Example
(unaudited)
As a shareholder of the Series, you incur ongoing costs, including management fees, shareholder service fees and other Series expenses. This example is intended to help you understand your ongoing costs (in dollars) of investing in the Series and to compare these costs with the ongoing costs of investing in other mutual funds.
The example is based on an investment of $1,000 invested in each class at the beginning of the period and held for the entire period (May 1, 2016 to October 31, 2016).
Actual Expenses
The Actual lines of the table below provide information about actual account values and actual expenses. You may use the information in this line, together with the amount you invested, to estimate the expenses that you paid over the period. Simply divide your account value by $1,000 (for example, an $8,600 account value divided by $1,000 = 8.6), then multiply the result by the number in the Actual line for the Class in which you have invested under the heading entitled “Expenses Paid During Period” to estimate the expenses you paid on your account during this period.
Hypothetical Example for Comparison Purposes
The Hypothetical lines of each Class in the table below provide information about hypothetical account values and hypothetical expenses based on the Class’ actual expense ratio and an assumed rate of return of 5% per year before expenses, which is not the Class’ actual return. The hypothetical account values and expenses may not be used to estimate the actual ending account balance or expenses you paid during the period. You may use this information to compare the ongoing costs of investing in a class of the Series and other funds. To do so, compare this 5% hypothetical example for the Class in which you have invested with the 5% hypothetical examples that appear in the shareholder reports of the other funds.
Please note that the expenses shown in the table are meant to highlight your ongoing costs only and do not reflect any transaction costs, such as sales charges (loads), redemptions fees, or exchange fees that you may incur in other mutual funds. Therefore, the second line of the table is useful in comparing ongoing costs only, and will not help you determine the relative total costs of owning different funds.
| BEGINNING ACCOUNT VALUE 5/1/16 | ENDING ACCOUNT VALUE 10/31/16 | EXPENSES PAID DURING PERIOD* 5/1/16-10/31/16 | ANNUALIZED EXPENSE RATIO | |||||||||||||
Class S | ||||||||||||||||
Actual | $1,000.00 | $1,047.30 | $4.27 | 0.83% | ||||||||||||
Hypothetical (5% return before expenses) | $1,000.00 | $1,020.96 | $4.22 | 0.83% | ||||||||||||
Class I | ||||||||||||||||
Actual | $1,000.00 | $1,048.30 | $2.99 | 0.58% | ||||||||||||
Hypothetical (5% return before expenses) | $1,000.00 | $1,022.22 | $2.95 | 0.58% | ||||||||||||
*Expenses are equal to each Class’ annualized expense ratio (for the six-month period), multiplied by the average account value over the period, multiplied by 184/366 to reflect the one-half year period. Expenses are based on the most recent fiscal half year: therefore, the expense ratios stated above may differ from the expense ratios stated in the financial highlights, which are based on one-year data.
5
Disciplined Value Series
Portfolio Composition as of October 31, 2016
(unaudited)
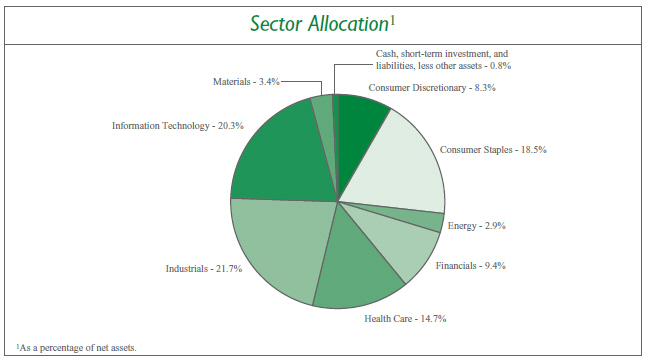
6
Disciplined Value Series
Investment Portfolio - October 31, 2016
| SHARES | VALUE (NOTE 2) | |||||||
COMMON STOCKS - 99.2% | ||||||||
Consumer Discretionary - 8.3% | ||||||||
Auto Components - 0.1% | ||||||||
Adient plc* | 3,893 | $ | 177,161 | |||||
|
| |||||||
Automobiles - 0.5% | ||||||||
Harley-Davidson, Inc. | 14,223 | 810,995 | ||||||
|
| |||||||
Distributors - 0.6% | ||||||||
Genuine Parts Co. | 10,773 | 975,926 | ||||||
|
| |||||||
Leisure Products - 0.4% | ||||||||
Hasbro, Inc. | 7,419 | 618,819 | ||||||
|
| |||||||
Media - 0.9% | ||||||||
Omnicom Group, Inc. | 11,270 | 899,571 | ||||||
Viacom, Inc. - Class B | 18,265 | 686,033 | ||||||
|
| |||||||
| 1,585,604 | ||||||||
|
| |||||||
Multiline Retail - 1.2% | ||||||||
Kohl’s Corp. | 14,733 | 644,569 | ||||||
Target Corp. | 20,740 | 1,425,460 | ||||||
|
| |||||||
| 2,070,029 | ||||||||
|
| |||||||
Specialty Retail - 4.1% | ||||||||
Best Buy Co., Inc. | 18,484 | 719,212 | ||||||
The Gap, Inc. | 30,619 | 844,778 | ||||||
The Home Depot, Inc. | 40,100 | 4,892,601 | ||||||
Staples, Inc. | 49,256 | 364,494 | ||||||
|
| |||||||
| 6,821,085 | ||||||||
|
| |||||||
Textiles, Apparel & Luxury Goods - 0.5% | ||||||||
VF Corp. | 14,574 | 790,057 | ||||||
|
| |||||||
Total Consumer Discretionary | 13,849,676 | |||||||
|
| |||||||
Consumer Staples - 18.5% | ||||||||
Beverages - 3.9% | ||||||||
Dr. Pepper Snapple Group, Inc. | 11,498 | 1,009,409 | ||||||
PepsiCo, Inc. | 50,847 | 5,450,798 | ||||||
|
| |||||||
| 6,460,207 | ||||||||
|
| |||||||
Food & Staples Retailing - 4.7% | ||||||||
Sysco Corp. | 27,747 | 1,335,186 | ||||||
Wal-Mart Stores, Inc. | 94,652 | 6,627,533 | ||||||
|
| |||||||
| 7,962,719 | ||||||||
|
| |||||||
Food Products - 2.8% | ||||||||
ConAgra Foods, Inc. | 23,994 | 1,156,031 | ||||||
General Mills, Inc. | 27,736 | 1,719,077 | ||||||
The Hershey Co. | 9,334 | 956,362 | ||||||
The accompanying notes are an integral part of the financial statements.
7
Disciplined Value Series
Investment Portfolio - October 31, 2016
| VALUE | ||||||||
| SHARES | (NOTE 2) | |||||||
COMMON STOCKS (continued) | ||||||||
Consumer Staples (continued) | ||||||||
Food Products (continued) | ||||||||
The J.M. Smucker Co. | 6,866 | $ | 901,574 | |||||
|
| |||||||
| 4,733,044 | ||||||||
|
| |||||||
Household Products - 7.1% | ||||||||
The Clorox Co. | 7,407 | 888,988 | ||||||
Colgate-Palmolive Co. | 36,643 | 2,614,844 | ||||||
Kimberly-Clark Corp. | 10,265 | 1,174,419 | ||||||
The Procter & Gamble Co. | 83,826 | 7,276,097 | ||||||
|
| |||||||
| 11,954,348 | ||||||||
|
| |||||||
Total Consumer Staples | 31,110,318 | |||||||
|
| |||||||
Energy - 2.9% | ||||||||
Energy Equipment & Services - 1.6% | ||||||||
Schlumberger Ltd. | 34,029 | 2,662,089 | ||||||
|
| |||||||
Oil, Gas & Consumable Fuels - 1.3% | ||||||||
Marathon Petroleum Corp. | 20,067 | 874,721 | ||||||
Valero Energy Corp. | 21,229 | 1,257,606 | ||||||
|
| |||||||
| 2,132,327 | ||||||||
|
| |||||||
Total Energy | 4,794,416 | |||||||
|
| |||||||
Financials - 9.4% | ||||||||
Banks - 9.4% | ||||||||
BB&T Corp. | 32,263 | 1,264,710 | ||||||
Fifth Third Bancorp. | 39,353 | 856,321 | ||||||
JPMorgan Chase & Co. | 74,112 | 5,132,997 | ||||||
The PNC Financial Services Group, Inc. | 17,466 | 1,669,750 | ||||||
U.S. Bancorp. | 50,929 | 2,279,582 | ||||||
Wells Fargo & Co. | 99,184 | 4,563,456 | ||||||
|
| |||||||
Total Financials | 15,766,816 | |||||||
|
| |||||||
Health Care - 14.7% | ||||||||
Biotechnology - 2.5% | ||||||||
AbbVie, Inc. | 34,973 | 1,950,794 | ||||||
Amgen, Inc. | 15,631 | 2,206,472 | ||||||
|
| |||||||
| 4,157,266 | ||||||||
|
| |||||||
Health Care Equipment & Supplies - 1.4% | ||||||||
Abbott Laboratories | 37,008 | 1,452,194 | ||||||
St. Jude Medical, Inc. | 11,244 | 875,233 | ||||||
|
| |||||||
| 2,327,427 | ||||||||
|
| |||||||
Health Care Providers & Services - 0.4% | ||||||||
Quest Diagnostics, Inc. | 9,164 | 746,316 | ||||||
|
| |||||||
The accompanying notes are an integral part of the financial statements.
8
Disciplined Value Series
Investment Portfolio - October 31, 2016
| VALUE | ||||||||
| SHARES | (NOTE 2) | |||||||
COMMON STOCKS (continued) | ||||||||
Health Care (continued) | ||||||||
Pharmaceuticals - 10.4% | ||||||||
Johnson & Johnson | 58,032 | $ | 6,731,132 | |||||
Merck & Co., Inc. | 93,068 | 5,464,953 | ||||||
Pfizer, Inc. | 167,125 | 5,299,534 | ||||||
|
| |||||||
| 17,495,619 | ||||||||
|
| |||||||
Total Health Care | 24,726,628 | |||||||
|
| |||||||
Industrials - 21.7% | ||||||||
Aerospace & Defense - 7.8% | ||||||||
The Boeing Co. | 24,962 | 3,555,338 | ||||||
General Dynamics Corp. | 14,363 | 2,165,079 | ||||||
Lockheed Martin Corp. | 11,303 | 2,784,833 | ||||||
Raytheon Co. | 14,811 | 2,023,331 | ||||||
United Technologies Corp. | 24,561 | 2,510,134 | ||||||
|
| |||||||
| 13,038,715 | ||||||||
|
| |||||||
Air Freight & Logistics - 1.8% | ||||||||
United Parcel Service, Inc. - Class B | 27,983 | 3,015,448 | ||||||
|
| |||||||
Building Products - 0.9% | ||||||||
Johnson Controls International plc | 38,928 | 1,569,577 | ||||||
|
| |||||||
Commercial Services & Supplies - 1.0% | ||||||||
Waste Management, Inc. | 24,711 | 1,622,524 | ||||||
|
| |||||||
Electrical Equipment - 2.1% | ||||||||
Eaton Corp. plc | 21,275 | 1,356,707 | ||||||
Emerson Electric Co. | 27,701 | 1,403,887 | ||||||
Rockwell Automation, Inc. | 6,453 | 772,553 | ||||||
|
| |||||||
| 3,533,147 | ||||||||
|
| |||||||
Industrial Conglomerates - 2.3% | ||||||||
3M Co. | 23,097 | 3,817,934 | ||||||
|
| |||||||
Machinery - 4.0% | ||||||||
Caterpillar, Inc. | 22,713 | 1,895,627 | ||||||
Cummins, Inc. | 7,565 | 966,958 | ||||||
Illinois Tool Works, Inc. | 18,584 | 2,110,585 | ||||||
Parker-Hannifin Corp. | 6,473 | 794,561 | ||||||
Stanley Black & Decker, Inc. | 8,816 | 1,003,613 | ||||||
|
| |||||||
| 6,771,344 | ||||||||
|
| |||||||
Road & Rail - 1.4% | ||||||||
Union Pacific Corp. | 26,801 | 2,363,312 | ||||||
|
| |||||||
Trading Companies & Distributors - 0.4% | ||||||||
Fastenal Co. | 16,956 | 660,945 | ||||||
|
| |||||||
Total Industrials | 36,392,946 | |||||||
|
| |||||||
The accompanying notes are an integral part of the financial statements.
9
Disciplined Value Series
Investment Portfolio - October 31, 2016
| VALUE | ||||||||
| SHARES | (NOTE 2) | |||||||
COMMON STOCKS (continued) | ||||||||
Information Technology - 20.3% | ||||||||
Communications Equipment - 3.5% | ||||||||
Cisco Systems, Inc. | 167,595 | $ | 5,141,815 | |||||
Harris Corp. | 7,744 | 690,842 | ||||||
|
| |||||||
| 5,832,657 | ||||||||
|
| |||||||
IT Services - 4.5% | ||||||||
Automatic Data Processing, Inc. | 22,896 | 1,993,326 | ||||||
International Business Machines Corp. | 25,411 | 3,905,417 | ||||||
Paychex, Inc. | 19,408 | 1,071,322 | ||||||
Xerox Corp. | 56,709 | 554,047 | ||||||
|
| |||||||
| 7,524,112 | ||||||||
|
| |||||||
Semiconductors & Semiconductor Equipment - 7.1% | ||||||||
Intel Corp. | 169,618 | 5,914,580 | ||||||
QUALCOMM, Inc. | 45,865 | 3,151,843 | ||||||
Texas Instruments, Inc. | 40,461 | 2,866,662 | ||||||
|
| |||||||
| 11,933,085 | ||||||||
|
| |||||||
Software - 4.7% | ||||||||
CA, Inc. | 27,242 | 837,419 | ||||||
Microsoft Corp. | 119,207 | 7,142,883 | ||||||
|
| |||||||
| 7,980,302 | ||||||||
|
| |||||||
Technology Hardware, Storage & Peripherals - 0.5% | ||||||||
Western Digital Corp. | 13,117 | 766,557 | ||||||
|
| |||||||
Total Information Technology | 34,036,713 | |||||||
|
| |||||||
Materials - 3.4% | ||||||||
Chemicals - 2.3% | ||||||||
LyondellBasell Industries N.V. - Class A | 15,786 | 1,255,776 | ||||||
Monsanto Co. | 13,044 | 1,314,444 | ||||||
Praxair, Inc. | 10,786 | 1,262,609 | ||||||
|
| |||||||
| 3,832,829 | ||||||||
|
| |||||||
Containers & Packaging - 0.7% | ||||||||
International Paper Co. | 24,867 | 1,119,761 | ||||||
|
| |||||||
Metals & Mining - 0.4% | ||||||||
Nucor Corp. | 15,665 | 765,235 | ||||||
|
| |||||||
Total Materials | 5,717,825 | |||||||
|
| |||||||
TOTAL COMMON STOCKS | ||||||||
(Identified Cost $146,786,282) | 166,395,338 | |||||||
|
| |||||||
The accompanying notes are an integral part of the financial statements.
10
Disciplined Value Series
Investment Portfolio - October 31, 2016
| VALUE | ||||||||
| SHARES | (NOTE 2) | |||||||
SHORT-TERM INVESTMENT - 0.8% | ||||||||
Dreyfus Government Cash Management1, 0.28% | ||||||||
(Identified Cost $1,415,938) | 1,415,938 | $ | 1,415,938 | |||||
|
| |||||||
TOTAL INVESTMENTS - 100.0% | ||||||||
(Identified Cost $148,202,220) | 167,811,276 | |||||||
LIABILITIES, LESS OTHER ASSETS - 0.0%# | (37,562 | ) | ||||||
|
| |||||||
NET ASSETS - 100% | $ | 167,773,714 | ||||||
|
| |||||||
*Non-income producing security.
#Less than 0.1%.
1Rate shown is the current yield as of October 31, 2016.
The Global Industry Classification Standard (GICS) was developed by and is the exclusive property and a service mark of MSCI Inc. (MSCI) and Standard & Poor’s, a division of The McGraw-Hill Companies, Inc. (S&P), and is licensed for use by Manning & Napier when referencing GICS sectors. Neither MSCI, S&P, nor any third party involved in making or compiling the GICS or any GICS classifications makes any express or implied warranties or representations with respect to such standard or classification, nor shall any such party have any liability therefrom.
The accompanying notes are an integral part of the financial statements.
11
Disciplined Value Series
Statement of Assets and Liabilities
October 31, 2016
| ASSETS: | ||||
Investments, at value (identified cost $148,202,220) (Note 2) | $ | 167,811,276 | ||
Dividends receivable | 178,604 | |||
Receivable for fund shares sold | 130,645 | |||
Foreign tax reclaims receivable | 93,186 | |||
Prepaid and other expenses | 12,900 | |||
|
| |||
TOTAL ASSETS | 168,226,611 | |||
|
| |||
LIABILITIES: | ||||
Accrued management fees (Note 3) | 64,724 | |||
Accrued fund accounting and administration fees (Note 3) | 9,785 | |||
Accrued shareholder services fees (Class S) (Note 3) | 3,205 | |||
Accrued transfer agent fees (Note 3) | 2,386 | |||
Accrued Chief Compliance Officer service fees (Note 3) | 353 | |||
Accrued Directors’ fees (Note 3) | 67 | |||
Payable for fund shares repurchased | 333,991 | |||
Audit fees payable | 23,843 | |||
Other payables and accrued expenses | 14,543 | |||
|
| |||
TOTAL LIABILITIES | 452,897 | |||
|
| |||
TOTAL NET ASSETS | $ | 167,773,714 | ||
|
| |||
NET ASSETS CONSIST OF: | ||||
Capital stock | $ | 119,835 | ||
Additional paid-in-capital | 142,026,046 | |||
Undistributed net investment income | 800,366 | |||
Accumulated net realized gain on investments | 5,218,411 | |||
Net unrealized appreciation on investments | 19,609,056 | |||
|
| |||
TOTAL NET ASSETS | $ | 167,773,714 | ||
|
| |||
NET ASSET VALUE, OFFERING PRICE AND REDEMPTION PRICE PER SHARE - Class S | ||||
($15,022,337/1,478,407 shares) | $ | 10.16 | ||
|
| |||
NET ASSET VALUE, OFFERING PRICE AND REDEMPTION PRICE PER SHARE - Class I | ||||
($152,751,377/10,505,075 shares) | $ | 14.54 | ||
|
| |||
The accompanying notes are an integral part of the financial statements.
12
Disciplined Value Series
Statement of Operations
For the Year Ended October 31, 2016
INVESTMENT INCOME: | ||||
Dividends (net of foreign taxes withheld, $100,986) | $ | 4,997,535 | ||
|
| |||
EXPENSES: | ||||
Management fees (Note 3) | 742,753 | |||
Fund accounting and administration fees (Note 3) | 68,930 | |||
Shareholder services fees (Class S)(Note 3) | 35,287 | |||
Transfer agent fees (Note 3) | 15,066 | |||
Directors’ fees (Note 3) | 11,261 | |||
Chief Compliance Officer service fees (Note 3) | 3,727 | |||
Custodian fees | 20,399 | |||
Miscellaneous | 76,706 | |||
|
| |||
Total Expenses | 974,129 | |||
|
| |||
NET INVESTMENT INCOME | 4,023,406 | |||
|
| |||
REALIZED AND UNREALIZED GAIN (LOSS) ON INVESTMENTS: | ||||
Net realized gain on investments | 5,452,900 | |||
Net change in unrealized appreciation (depreciation) on investments | 3,486,139 | |||
|
| |||
NET REALIZED AND UNREALIZED GAIN (LOSS) ON INVESTMENTS | 8,939,039 | |||
|
| |||
NET INCREASE IN NET ASSETS RESULTING FROM OPERATIONS | $ | 12,962,445 | ||
|
| |||
The accompanying notes are an integral part of the financial statements.
13
Disciplined Value Series
Statements of Changes in Net Assets
FOR THE YEAR ENDED | FOR THE YEAR ENDED | |||||||
INCREASE (DECREASE) IN NET ASSETS: | ||||||||
OPERATIONS: | ||||||||
Net investment income | $ | 4,023,406 | $ | 4,783,262 | ||||
Net realized gain on investments | 5,452,900 | 21,255,846 | ||||||
Net change in unrealized appreciation (depreciation) on investments | 3,486,139 | (23,865,543 | ) | |||||
|
|
|
| |||||
Net increase from operations | 12,962,445 | 2,173,565 | ||||||
|
|
|
| |||||
DISTRIBUTIONS TO SHAREHOLDERS (Note 8): | ||||||||
From net investment income (Class S) | (428,816 | ) | (445,287 | ) | ||||
From net investment income (Class I) | (3,516,142 | ) | (4,361,188 | ) | ||||
From net realized gain on investments (Class S) | (2,478,979 | ) | (940,919 | ) | ||||
From net realized gain on investments (Class I) | (18,818,161 | ) | (9,412,072 | ) | ||||
|
|
|
| |||||
Total distributions to shareholders | (25,242,098 | ) | (15,159,466 | ) | ||||
|
|
|
| |||||
CAPITAL STOCK ISSUED AND REPURCHASED: | ||||||||
Net increase (decrease) from capital share transactions (Note 5) | 3,583,814 | (15,596,999 | ) | |||||
|
|
|
| |||||
Net decrease in net assets | (8,695,839 | ) | (28,582,900 | ) | ||||
NET ASSETS: | ||||||||
Beginning of year | 176,469,553 | 205,052,453 | ||||||
|
|
|
| |||||
End of year (including undistributed net investment income of $800,366 and $570,453,respectively) | $ | 167,773,714 | $ | 176,469,553 | ||||
|
|
|
| |||||
The accompanying notes are an integral part of the financial statements.
14
Disciplined Value Series
Financial Highlights - Class S
| FOR THE YEARS ENDED | FOR THE PERIOD 3/1/121 TO 10/31/12 | |||||||||||||||||||
| 10/31/16 | 10/31/15 | 10/31/14 | 10/31/13 | |||||||||||||||||
Per share data (for a share outstanding throughout each period): | ||||||||||||||||||||
Net asset value - Beginning of period | $ | 11.64 | $ | 12.75 | $ | 11.88 | $ | 10.14 | $ | 10.00 | ||||||||||
|
|
|
|
|
|
|
|
|
| |||||||||||
Income from investment operations: | ||||||||||||||||||||
Net investment income2 | 0.22 | 0.26 | 0.26 | 0.26 | 0.12 | |||||||||||||||
Net realized and unrealized gain (loss) on investments | 0.53 | (0.21 | ) | 1.25 | 1.89 | 0.23 | ||||||||||||||
|
|
|
|
|
|
|
|
|
| |||||||||||
Total from investment operations | 0.75 | 0.05 | 1.51 | 2.15 | 0.35 | |||||||||||||||
|
|
|
|
|
|
|
|
|
| |||||||||||
Less distributions to shareholders: | ||||||||||||||||||||
From net investment income | (0.32 | ) | (0.36 | ) | (0.34 | ) | (0.35 | ) | (0.21 | ) | ||||||||||
From net realized gain on investments | (1.91 | ) | (0.80 | ) | (0.30 | ) | (0.06 | ) | — | |||||||||||
|
|
|
|
|
|
|
|
|
| |||||||||||
Total distributions to shareholders | (2.23 | ) | (1.16 | ) | (0.64 | ) | (0.41 | ) | (0.21 | ) | ||||||||||
|
|
|
|
|
|
|
|
|
| |||||||||||
Net asset value - End of period | $ | 10.16 | $ | 11.64 | $ | 12.75 | $ | 11.88 | $ | 10.14 | ||||||||||
|
|
|
|
|
|
|
|
|
| |||||||||||
Net assets - End of period (000’s omitted) | $ | 15,022 | $ | 15,471 | $ | 13,716 | $ | 10,667 | $ | 5,130 | ||||||||||
|
|
|
|
|
|
|
|
|
| |||||||||||
Total return3 | 7.99 | % | 0.63 | % | 13.12 | % | 21.70 | % | 3.59 | % | ||||||||||
Ratios (to average net assets)/Supplemental Data: | ||||||||||||||||||||
Expenses | 0.82 | % | 0.79 | % | 0.79 | % | 0.81 | % | 0.86 | %4 | ||||||||||
Net investment income | 2.19 | % | 2.14 | % | 2.11 | % | 2.31 | % | 1.76 | %4 | ||||||||||
Portfolio turnover | 39 | % | 49 | % | 23 | % | 19 | % | 16 | % | ||||||||||
1Commencement of operations.
2Calculated based on average shares outstanding during the periods.
3Represents aggregate total return for the periods indicated, and assumes reinvestment of all distributions. Periods less than one year are not annualized. 4Annualized.
The accompanying notes are an integral part of the financial statements.
15
Disciplined Value Series
Financial Highlights - Class I*
| FOR THE YEARS ENDED | ||||||||||||||||||||
| 10/31/16 | 10/31/15 | 10/31/14 | 10/31/13 | 10/31/12 | ||||||||||||||||
Per share data (for a share outstanding throughout each year): | ||||||||||||||||||||
Net asset value - Beginning of year | $ | 15.69 | $ | 16.76 | $ | 15.41 | $ | 13.03 | $ | 11.96 | ||||||||||
|
|
|
|
|
|
|
|
|
| |||||||||||
Income from investment operations: | ||||||||||||||||||||
Net investment income1 | 0.35 | 0.39 | 0.38 | 0.37 | 0.34 | |||||||||||||||
Net realized and unrealized gain (loss) on investments | 0.75 | (0.27 | ) | 1.64 | 2.45 | 1.05 | ||||||||||||||
|
|
|
|
|
|
|
|
|
| |||||||||||
Total from investment operations | 1.10 | 0.12 | 2.02 | 2.82 | 1.39 | |||||||||||||||
|
|
|
|
|
|
|
|
|
| |||||||||||
Less distributions to shareholders: | ||||||||||||||||||||
From net investment income | (0.34 | ) | (0.39 | ) | (0.37 | ) | (0.38 | ) | (0.30 | ) | ||||||||||
From net realized gain on investments | (1.91 | ) | (0.80 | ) | (0.30 | ) | (0.06 | ) | (0.02 | ) | ||||||||||
|
|
|
|
|
|
|
|
|
| |||||||||||
Total distributions to shareholders | (2.25 | ) | (1.19 | ) | (0.67 | ) | (0.44 | ) | (0.32 | ) | ||||||||||
|
|
|
|
|
|
|
|
|
| |||||||||||
Net asset value - End of year | $ | 14.54 | $ | 15.69 | $ | 16.76 | $ | 15.41 | $ | 13.03 | ||||||||||
|
|
|
|
|
|
|
|
|
| |||||||||||
Net assets - End of year (000’s omitted) | $ | 152,751 | $ | 160,999 | $ | 191,337 | $ | 158,989 | $ | 128,760 | ||||||||||
|
|
|
|
|
|
|
|
|
| |||||||||||
Total return2 | 8.24 | % | 0.91 | % | 13.44 | % | 22.02 | % | 11.77 | % | ||||||||||
Ratios (to average net assets)/Supplemental Data: | ||||||||||||||||||||
Expenses | 0.57 | % | 0.54 | % | 0.54 | % | 0.56 | % | 0.59 | % | ||||||||||
Net investment income | 2.46 | % | 2.44 | % | 2.38 | % | 2.63 | % | 2.69 | % | ||||||||||
Portfolio turnover | 39 | % | 49 | % | 23 | % | 19 | % | 16 | % | ||||||||||
*Effective March 1, 2012, the shares of the Series have been designated as Class I.
1Calculated based on average shares outstanding during the years.
2Represents aggregate total return for the years indicated, and assumes reinvestment of all distributions. Total return would have been lower had certain expenses not been waived or reimbursed during certain years.
The accompanying notes are an integral part of the financial statements.
16
Disciplined Value Series
Notes to Financial Statements
| 1. | Organization |
Disciplined Value Series (the “Series”) is a no-load diversified series of Manning & Napier Fund, Inc. (the “Fund”). The Fund is organized in Maryland and is registered under the Investment Company Act of 1940, as amended, as an open-end management investment company.
The Series’ investment objective is to provide competitive returns consistent with the broad equity market while providing a level of capital protection during market downturns.
The Fund’s Advisor is Manning & Napier Advisors, LLC (the “Advisor”). Shares of the Series are offered to investors, clients and employees of the Advisor and its affiliates. The total authorized capital stock of the Fund consists of 15 billion shares of common stock each having a par value of $0.01. As of October 31, 2016, 10.5 billion shares have been designated in total among 40 series, of which 100 million have been designated as Disciplined Value Series Class I common stock and 100 million have been designated as Disciplined Value Series Class S common stock.
| 2. | Significant Accounting Policies |
The following is a summary of significant accounting policies followed by the Series. The Series is an investment company and, accordingly, follows the investment company accounting and reporting guidance of the Financial Accounting Standards Board Accounting Standards Codification Topic 946—Investment Companies, which is part of accounting principles generally accepted in the United States of America (“GAAP”).
Security Valuation
Portfolio securities, including domestic equities, foreign equities, warrants and options, listed on an exchange other than the NASDAQ Stock Market are valued at the latest quoted sales price of the exchange on which the security is primarily traded. Securities not traded on valuation date or securities not listed on an exchange are valued at the latest quoted bid price provided by the Fund’s pricing service. Securities listed on the NASDAQ Stock Market are valued in accordance with the NASDAQ Official Closing Price.
Short-term investments that mature in sixty days or less may be valued at amortized cost, which approximates fair value. Investments in open-end investment companies are valued at their net asset value per share on valuation date.
Volume and level of activity in established markets for an asset or liability are evaluated to determine whether recent transactions and quoted prices are determinative of fair value. Where there have been significant decreases in volume and level of activity, further analysis and adjustment may be necessary to estimate fair value. The Series measures fair value in these instances by the use of inputs and valuation techniques which may be based upon current market prices of securities that are comparable in coupon, rating, maturity and industry and/or expectation of future cash flows. As a result of trading in relatively thin markets and/or markets that experience significant volatility, the prices used by the Series to value these securities may differ from the value that would be realized if these securities were sold, and the differences could be material.
Securities for which representative valuations or prices are not available from the Series’ pricing service may be valued at fair value as determined in good faith by the Advisor under procedures approved by and under the general supervision and responsibility of the Fund’s Board of Directors (the “Board”). Due to the inherent uncertainty of valuations of such securities, the fair value may differ significantly from the values that would have been used had a ready market for such securities existed. If trading or events occurring after the close of the principal market in which securities are traded are expected to materially affect the value of those securities, then they may be valued at their fair value, taking this trading or these events into account.
Various inputs are used in determining the value of the Series’ assets or liabilities carried at fair value. These inputs are summarized in three broad levels. Level 1 includes quoted prices in active markets for identical assets and liabilities. Level 2 includes other significant observable inputs (including quoted prices for similar securities, interest rates, prepayment speeds, credit risk, etc.). Level 3 includes significant unobservable inputs (including the Series’ own assumptions in determining the fair value of investments). A financial instrument’s level within the fair value hierarchy is based on the lowest level of any input both
17
Disciplined Value Series
Notes to Financial Statements (continued)
| 2. | Significant Accounting Policies (continued) |
Security Valuation (continued)
individually and in aggregate that is significant to the fair value measurement. The inputs or methodology used for valuing securities are not necessarily an indication of the risk associated with investing in those securities.
The following is a summary of the valuation levels used for major security types as of October 31, 2016 in valuing the Series’ assets or liabilities carried at fair value:
| DESCRIPTION | TOTAL | LEVEL 1 | LEVEL 2 | LEVEL 3 | ||||||||||||
Assets: | ||||||||||||||||
Equity securities: | ||||||||||||||||
Consumer Discretionary | $ | 13,849,676 | $ | 13,849,676 | $ | — | $ | — | ||||||||
Consumer Staples | 31,110,318 | 31,110,318 | — | — | ||||||||||||
Energy | 4,794,416 | 4,794,416 | — | — | ||||||||||||
Financials | 15,766,816 | 15,766,816 | — | — | ||||||||||||
Health Care | 24,726,628 | 24,726,628 | — | — | ||||||||||||
Industrials | 36,392,946 | 36,392,946 | — | — | ||||||||||||
Information Technology | 34,036,713 | 34,036,713 | — | — | ||||||||||||
Materials | 5,717,825 | 5,717,825 | — | — | ||||||||||||
Mutual Fund | 1,415,938 | 1,415,938 | — | — | ||||||||||||
|
|
|
|
|
|
|
| |||||||||
Total assets | $ | 167,811,276 | $ | 167,811,276 | $ | — | $ | — | ||||||||
|
|
|
|
|
|
|
| |||||||||
There were no Level 2 or Level 3 securities held by the Series as of October 31, 2015 or October 31, 2016.
The Fund’s policy is to recognize transfers in and transfers out of the valuation levels as of the beginning of the reporting period. There were no transfers between Level 1 and Level 2 during the year ended October 31, 2016.
New Accounting Guidance
In October 2016, the Securities and Exchange Commission (SEC) issued a new rule, Investment Company Reporting Modernization, which, among other provisions, amends Regulation S-X to require standardized, enhanced disclosures, particularly related to derivatives, in investment company financial statements. Compliance with the guidance is required for financial statements filed with the SEC on or after August 1, 2017; adoption will have no effect on the Fund’s net assets or results of operations.
Security Transactions, Investment Income and Expenses
Security transactions are accounted for on trade date. Dividend income is recorded on the ex-dividend date, except that if the ex-dividend date has passed, certain dividends from foreign securities are recorded as soon as the Series is informed of the ex-dividend date. Non-cash dividends, if any, are recorded at the fair value of the securities received. Interest income, including amortization of premium and accretion of discounts using the effective interest method, is earned from settlement date and accrued daily.
Expenses are recorded on an accrual basis. Most expenses of the Fund can be attributed to a specific series. Expenses which cannot be directly attributed are apportioned among the series in the Fund in such a manner as deemed equitable by the Fund’s Board, taking into consideration, among other things, the nature and type of expense. Income, expenses (other than class specific expenses), and realized and unrealized gains and losses are prorated among the classes based on the relative net assets of each class. Class specific expenses are directly charged to that class.
The Series uses the identified cost method for determining realized gain or loss on investments for both financial statement and federal income tax reporting purposes.
Foreign Currency Translation
The books and records of the Series are maintained in U.S. dollars. Foreign currencies, investments and other assets and liabilities are translated into U.S. dollars at the current exchange rates. Purchases and sales of investment securities and
18
Disciplined Value Series
Notes to Financial Statements (continued)
| 2. | Significant Accounting Policies (continued) |
Foreign Currency Translation (continued)
income and expenses are translated on the respective dates of such transactions. The Series does not isolate realized and unrealized gains and losses attributable to changes in the exchange rates from gains and losses that arise from changes in the fair value of investments. Such fluctuations are included with net realized and unrealized gain or loss on investments. Net realized foreign currency gains and losses represent foreign currency gains and losses between trade date and settlement date on securities transactions, gains and losses on disposition of foreign currencies and the difference between the amount of income and foreign withholding taxes recorded on the books of the Series and the amounts actually received or paid.
Federal Taxes
The Series’ policy is to comply with the provisions of the Internal Revenue Code applicable to regulated investment companies. The Series is not subject to federal income or excise tax to the extent that the Series distributes to shareholders each year its taxable income, including any net realized gains on investments, in accordance with requirements of the Internal Revenue Code. Accordingly, no provision for federal income tax or excise tax has been made in the financial statements.
Management evaluates its tax positions to determine if the tax positions taken meet the minimum recognition threshold in connection with accounting for uncertainties in income tax positions taken or expected to be taken for the purposes of measuring and recognizing tax liabilities in the financial statements. Recognition of tax benefits of an uncertain tax position is required only when the position is “more likely than not” to be sustained assuming examination by taxing authorities. At October 31, 2016, the Series has recorded no liability for net unrecognized tax benefits relating to uncertain income tax positions taken or expected to be taken in future tax returns.
The Series files income tax returns in the U.S. federal jurisdiction, various states and foreign jurisdictions, as required. No income tax returns are currently under investigation. The statute of limitations on the Series’ tax returns remains open for the years ended October 31, 2013 through October 31, 2016. The Series is not aware of any tax positions for which it is reasonably possible that the total amounts of unrecognized tax benefits will significantly change in the next twelve months.
Foreign Taxes
Based on the Series’ understanding of the tax rules and rates related to income, gains and currency purchase/repatriation transactions for foreign jurisdictions in which it invests, the Series will provide for foreign taxes, and where appropriate, deferred foreign tax.
Distributions of Income and Gains
Distributions to shareholders of net investment income are made quarterly. Distributions of net realized gains are made annually. An additional distribution may be necessary to avoid taxation of the Series. Distributions are recorded on the ex-dividend date.
Indemnifications
The Fund’s organizational documents provide former and current directors and officers with a limited indemnification against liabilities arising in connection with the performance of their duties to the Fund. In the normal course of business, the Fund may also enter into contracts that provide general indemnifications. The Fund’s maximum exposure under these arrangements is unknown as this would be dependent on future claims that may be made against the Fund. The risk of material loss from such claims is considered remote.
Other
The preparation of financial statements in conformity with GAAP requires management to make estimates and assumptions that affect the reported amounts of assets and liabilities and the disclosure of contingent assets and liabilities at the date of the financial statements and the reported amounts of income and expenses during the reporting period. Actual results could differ from those estimates.
| 3. | Transactions with Affiliates |
The Fund has an Investment Advisory Agreement (the “Agreement”) with the Advisor, for which the Series pays a fee, computed daily and payable monthly, at an annual rate of 0.45% of the Series’ average daily net assets.
19
Disciplined Value Series
Notes to Financial Statements (continued)
| 3. | Transactions with Affiliates (continued) |
Under the Agreement, personnel of the Advisor provide the Series with advice and assistance in the choice of investments and the execution of securities transactions, and otherwise maintain the Series’ organization. The Advisor also provides the Fund with necessary office space and fund administration and support services. The salaries of all officers of the Fund (except a percentage of the Fund’s Chief Compliance Officer’s salary, which is paid by the Fund), and of all Directors who are “affiliated persons” of the Fund, or of the Advisor, and all personnel of the Fund, or of the Advisor, performing services relating to research, statistical and investment activities, are paid by the Advisor. Each “non-affiliated” Director receives an annual stipend, which is allocated among all the active series of the Fund. In addition, these Directors also receive a fee per Board meeting attended plus a fee for each committee meeting attended and are reimbursed for travel and other out-of-pocket expenses incurred by them in connection with attending such meetings. The Fund also has an Audit Committee Chair, who receives an additional annual stipend for this role.
The Class S shares of the Series are subject to a shareholder services fee in accordance with a shareholder services plan adopted by the Fund’s Board. The shareholder services fee is intended to compensate financial intermediaries, including affiliates of the Fund, in connection with the provision of direct client service, personal services, maintenance of shareholder accounts and reporting services. For these services, the Class S shares of the Series pay a fee, computed daily and payable monthly, at an annual rate of 0.25% of the average daily net assets of Class S. The Fund has a Shareholder Services Agreement with the Advisor, for which the Advisor receives the shareholder services fee as stated above.
The Advisor has contractually agreed, until at least February 28, 2017, to waive its management fee and, if necessary, pay other operating expenses of the Series in order to maintain total direct annual fund operating expenses for the Series, exclusive of shareholder service fees, at no more than 0.60% of average daily net assets each year. For the year ended October 31, 2016, the Advisor did not waive fees or reimburse expenses for the Series. The Advisor is not eligible to recoup any expenses that have been waived or reimbursed in prior years.
Manning & Napier Investor Services, Inc., a registered broker-dealer affiliate of the Advisor, acts as distributor for the Fund’s shares. The services of Manning & Napier Investor Services, Inc. are provided at no additional cost to the Series.
Pursuant to a master services agreement dated November 1, 2014, the Fund pays the Advisor an annual fee related to fund accounting and administration of 0.0085% on the first $25 billion of average daily net assets (excluding Target Series and Strategic Income Series); 0.0075% on the next $15 billion of average daily net assets (excluding Target Series and Strategic Income Series); and 0.0065% of the average daily net assets in excess of $40 billion (excluding Target Series and Strategic Income Series); plus a base fee of $30,400 per series. Transfer agent fees are charged to the Fund on a per account basis. Additionally, certain transaction and out-of-pocket expenses, including charges for reporting relating to the Fund’s compliance program, are charged. The Advisor has agreements with BNY Mellon Investment Servicing (U.S.) Inc. (“BNY”) under which BNY serves as sub-accountant services agent and sub-transfer agent.
Expenses not directly attributable to a series are allocated based on each series’ relative net assets or number of accounts, depending on the expense.
| 4. | Purchases and Sales of Securities |
For the year ended October 31, 2016, purchases and sales of securities, other than U.S. Government securities and short-term securities, were $63,528,138 and $80,790,238, respectively. There were no purchases or sales of U.S. Government securities.
20
Disciplined Value Series
Notes to Financial Statements (continued)
| 5. | Capital Stock Transactions |
Transactions in Class S and I shares of Disciplined Value Series were:
| CLASS S | FOR THE YEAR ENDED 10/31/16 | FOR THE YEAR ENDED 10/31/15 | ||||||||||||||
| SHARES | AMOUNT | SHARES | AMOUNT | |||||||||||||
Sold | 506,341 | $ | 5,119,278 | 502,112 | $ | 6,090,178 | ||||||||||
Reinvested | 303,546 | 2,901,921 | 118,130 | 1,368,047 | ||||||||||||
Repurchased | (660,648 | ) | (6,498,990 | ) | (367,006 | ) | (4,408,509 | ) | ||||||||
|
|
|
|
|
|
|
| |||||||||
Total | 149,239 | $ | 1,522,209 | 253,236 | $ | 3,049,716 | ||||||||||
|
|
|
|
|
|
|
| |||||||||
| CLASS I | FOR THE YEAR ENDED 10/31/16 | FOR THE YEAR ENDED 10/31/15 | ||||||||||||||
| SHARES | AMOUNT | SHARES | AMOUNT | |||||||||||||
Sold | 1,657,230 | $ | 23,170,514 | 2,135,524 | $ | 34,619,779 | ||||||||||
Reinvested | 791,422 | 10,754,253 | 405,303 | 6,294,873 | ||||||||||||
Repurchased | (2,205,722 | ) | (31,863,162 | ) | (3,694,895 | ) | (59,561,367 | ) | ||||||||
|
|
|
|
|
|
|
| |||||||||
Total | 242,930 | $ | 2,061,605 | (1,154,068 | ) | $ | (18,646,715 | ) | ||||||||
|
|
|
|
|
|
|
| |||||||||
At October 31, 2016, one shareholder account owned 35.2% of the Series, investment activities of this shareholder may have a material effect on the Series.
| 6. | Financial Instruments |
The Series may trade in instruments including written and purchased options, forward foreign currency exchange contracts and futures contracts and other derivatives in the normal course of investing activities to assist in managing exposure to various market risks. The Series may be subject to various elements of risk which may involve, to a varying degree, elements of risk in excess of the amounts recognized for financial statement purposes. These risks include: the risk that changes in the value of a derivative may not correlate perfectly with the underlying asset, rate or index; counterparty credit risk related to over the counter derivative counterparties’ failure to perform under contract terms; liquidity risk related to the lack of a liquid market for these contracts allowing the fund to close out its position(s); and documentation risk relating to disagreement over contract terms. No such investments were held by the Series as of October 31, 2016.
| 7. | Foreign Securities |
Investing in securities of foreign companies and foreign governments involves special risks and considerations not typically associated with investing in securities of domestic companies and the U.S. Government. These risks include revaluation of currencies and future adverse political and economic developments. Moreover, securities of foreign companies and foreign governments and their markets may be less liquid and their prices more volatile than those of comparable domestic companies and the U.S. Government.
| 8. | Federal Income Tax Information |
The amount and characterization of certain income and capital gains to be distributed are determined in accordance with federal income tax regulations, which may differ from GAAP. These differences are primary due to differing book and tax treatment on losses deferred due to wash sales. The Series may periodically make reclassifications among its capital accounts to reflect income and gains available for distribution (or available capital loss carryovers) under income tax regulations, without impacting the Series’ net asset value. For the year ended October 31, 2016, amounts were reclassified within the capital accounts to increase Undistributed Net Investment Income by $151,465, decrease Additional Paid in Capital by $18,547, and decrease Accumulated Net Realized Gain on Investments by $132,918. Any such reclassifications are not reflected in the financial highlights.
21
Disciplined Value Series
Notes to Financial Statements (continued)
| 8. | Federal Income Tax Information (continued) |
The tax character of distributions paid were as follows:
| FOR THE YEAR ENDED 10/31/16 | FOR THE YEAR ENDED 10/31/15 | |||||||
Ordinary income | $ | 4,100,118 | $ | 5,052,392 | ||||
Long-term capital gains | 21,141,980 | 10,107,074 | ||||||
At October 31, 2016, the tax basis of components of distributable earnings and the net unrealized appreciation based on identified cost of investments for federal income tax purposes were as follows:
Cost for federal income tax purposes | $ | 148,469,605 | ||
Unrealized appreciation | 23,779,016 | |||
Unrealized depreciation | (4,437,345 | ) | ||
|
| |||
Net unrealized appreciation | $ | 19,341,671 | ||
|
| |||
Undistributed ordinary income | $ | 1,253,485 | ||
Undistributed long-term capital gains | $ | 5,032,677 |
22
Disciplined Value Series
Report of Independent Registered Public Accounting Firm
To the Board of Directors of Manning & Napier Fund, Inc. and Shareholders of Disciplined Value Series:
In our opinion, the accompanying statement of assets and liabilities, including the investment portfolio, and the related statements of operations and of changes in net assets and the financial highlights present fairly, in all material respects, the financial position of the Disciplined Value Series (a series of Manning & Napier Fund, Inc., hereafter referred to as the “Series”) as of October 31, 2016, the results of its operations for the year then ended, the changes in its net assets for each of the two years in the period then ended and the financial highlights for each of the periods presented, in conformity with accounting principles generally accepted in the United States of America. These financial statements and financial highlights (hereafter referred to as “financial statements”) are the responsibility of the Series’ management. Our responsibility is to express an opinion on these financial statements based on our audits. We conducted our audits of these financial statements in accordance with the standards of the Public Company Accounting Oversight Board (United States). Those standards require that we plan and perform the audit to obtain reasonable assurance about whether the financial statements are free of material misstatement. An audit includes examining, on a test basis, evidence supporting the amounts and disclosures in the financial statements, assessing the accounting principles used and significant estimates made by management, and evaluating the overall financial statement presentation. We believe that our audits, which included confirmation of securities as of October 31, 2016 by correspondence with the custodian, provide a reasonable basis for our opinion.

New York, New York
December 16, 2016
23
Disciplined Value Series
Supplemental Tax Information
(unaudited)
All reportings are based on financial information available as of the date of this annual report and, accordingly, are subject to change.
For federal income tax purposes, the Series reports for the current fiscal year $4,947,149 or, if different, the maximum amount allowable under the tax law, as qualified dividend income.
For corporate shareholders, the percentage of investment income (dividend income plus short-term gains, if any) that qualifies for the dividends received deduction for the current fiscal year is 86.42%.
The Series designates $5,284,356 as Long-Term Capital Gain dividends pursuant to Section 852(b) of the Code for the fiscal year ended October 31, 2016.
24
Disciplined Value Series
Directors’ and Officers’ Information
(unaudited)
The Statement of Additional Information provides additional information about the Fund’s directors and officers and can be obtained without charge by calling 1-800-466-3863, at www.manningnapieradvisors.com, or on the EDGAR Database on the SEC Internet web site (http:// www.sec.gov). The following chart shows certain information about the Fund’s officers and directors, including their principal occupations during the last five years. Unless specific dates are provided, the individuals have held the listed positions for longer than five years.
| Interested | Director/Officer |
Name: | Michele T. Mosca* | |
Address: | 290 Woodcliff Drive Fairport, NY 14450 | |
Age: | 44 | |
Current Position(s) Held with Fund: | Principal Executive Officer, President, Chairman & Director | |
Term of Office1 & Length of Time Served: | Indefinite - Chairman and Director since August 2016 | |
Principal Occupation(s) During Past 5 Years: | Managing Director, Funds Group (2009-present)- Manning & Napier Advisors, LLC; President, Director (2015-present) - Manning & Napier Investor Services, Inc.; Chief Executive Officer, President (2016-present) - Rainier Investment Management Mutual Funds Holds or has held one or more of the following titles for various subsidiaries and affiliates: President, Director | |
Number of Portfolios Overseen within Fund Complex: | 40 | |
Other Directorships Held Outside Fund Complex: | Trustee - Rainier Investment Management Mutual Funds (six portfolios) (2016 - present) |
| Independent | Directors |
Name: | Stephen B. Ashley | |
Address: | 290 Woodcliff Drive Fairport, NY 14450 | |
Age: | 76 | |
Current Position(s) Held with Fund: | Director, Audit Committee Member, Governance & Nominating Committee Member | |
Term of Office & Length of Time Served: | Indefinite - Since 1996 | |
Principal Occupation(s) During Past 5 Years: | Chairman, Director & Chief Executive Officer (1997 to present) - The Ashley Group (property management and investment). Director (1995-2008) and Chairman (non-executive) (2004-2008) - Fannie Mae (mortgage) | |
Number of Portfolios Overseen within Fund Complex: | 40 | |
Other Directorships Held Outside Fund Complex: | Fannie Mae (mortgage) (1995-2008) The Ashley Group (property management and investment) (1995-2008) Genesee Corporation (holding company) (1987-2007) | |
Name: | Paul A. Brooke | |
Address: | 290 Woodcliff Drive Fairport, NY 14450 | |
Age: | 70 | |
Current Position(s) Held with Fund: | Director, Audit Committee Member, Governance & Nominating Committee Member | |
Term of Office & Length of Time Served: | Indefinite - Since 2007 | |
Principal Occupation(s) During Past 5 Years: | Chairman & CEO (2005-2009) - Ithaka Acquisition Corporation (investments); Chairman (2007-2009) - Alsius Corporation (investments); Managing Member (1991-present) - PMSV Holdings LLC (investments); Managing Member (2010-present) - Venbio (investments). | |
Number of Portfolios Overseen within Fund Complex: | 40 | |
Other Directorships Held Outside Fund Complex: | Incyte Corp. (biotech) (2000-present) ViroPharma, Inc. (speciality pharmaceuticals) (2000-2014) HLTH Corp (WebMD) (information) (2000-2010) Cheyne Capital International (investment) (2000-present) GMP Companies (investment) (2000-2011) Cytos Biotechnology Ltd (biotechnology) (2012-present) | |
25
Disciplined Value Series
Directors’ and Officers’ Information
(unaudited)
| Independent | Directors (continued) |
Name: | Peter L. Faber | |
Address: | 290 Woodcliff Drive | |
| Fairport, NY 14450 | ||
Age: | 78 | |
Current Position(s) Held with Fund: | Director, Governance & Nominating Committee Member | |
Term of Office & Length of Time Served: | Indefinite - Since 1987 | |
Principal Occupation(s) During Past 5 Years: | Senior Counsel (2006-2012), Partner (1995-2006 & 2013-present) - McDermott, Will & Emery LLP (law firm) | |
Number of Portfolios Overseen within Fund Complex: | 40 | |
Other Directorships Held Outside Fund Complex: | Boston Early Music Festival (non-profit) (2007-present) | |
| Amherst Early Music, Inc. (non-profit) (2009-present) | ||
| Gotham Early Music Scene, Inc. (non-profit)(2009-present) | ||
| Partnership for New York City, Inc. (non-profit) (1989-2010) | ||
| New York Collegium (non-profit) (2004-2011) | ||
Name: | Harris H. Rusitzky | |
Address: | 290 Woodcliff Drive | |
| Fairport, NY 14450 | ||
Age: | 81 | |
Current Position(s) Held with Fund: | Director, Audit Committee Member, Governance & Nominating Committee Member | |
Term of Office & Length of Time Served: | Indefinite - Since 1985 | |
Principal Occupation(s) During Past 5 Years: | President (1994-present) - The Greening Group (business consultants); Partner (2006-present) - The Restaurant Group (restaurants) | |
Number of Portfolios Overseen within Fund Complex: | 40 | |
Other Directorships Held Outside Fund Complex: | Rochester Institute of Technology (university) (1972-present) Culinary Institute of America (non-profit college) (1985-present) George Eastman House (museum) (1988-present) National Restaurant Association (restaurant trade organization) (1978-present) | |
Name: | Chester N. Watson | |
Address: | 290 Woodcliff Drive | |
| Fairport, NY 14450 | ||
Age: | 66 | |
Current Position(s) Held with Fund: | Director, Audit Committee Chairman, Governance & Nominating Committee Member | |
Term of Office & Length of Time Served: | Indefinite - Since 2012 | |
Principal Occupation(s) During Past 5 Years: | General Auditor (2003-2011) - General Motors Company (auto manufacturer) | |
Number of Portfolios Overseen within Fund Complex: | 40 | |
Other Directorships Held Outside Fund Complex: | Rochester Institute of Technology (university) (2005-present) | |
| Officers |
Name: | Jeffrey S. Coons, Ph.D., CFA® | |
Address: | 290 Woodcliff Drive | |
| Fairport, NY 14450 | ||
Age: | 53 | |
Current Position(s) Held with Fund: | Vice President | |
Term of Office1 & Length of Time Served: | Since 2004 | |
Principal Occupation(s) During Past 5 Years: | President since 2010, Co-Director of Research (2002-2015) - Manning & Napier Advisors, LLC Holds one or more of the following titles for various subsidiaries and affiliates: President, Director, Treasurer or Senior Trust Officer. | |
Number of Portfolios Overseen within Fund Complex: | 40 | |
Other Directorships Held Outside Fund Complex: | N/A |
26
Disciplined Value Series
Directors’ and Officers’ Information
(unaudited)
| Officers | (continued) |
Name: | Elizabeth Craig | |
Address: | 290 Woodcliff Drive | |
| Fairport, NY 14450 | ||
Age: | 29 | |
Current Position(s) Held with Fund: | Corporate Secretary | |
Term of Office1 & Length of Time Served: | Since 2016 | |
Principal Occupation(s) During Past 5 Years: | Fund Administration Manager since 2015; Mutual Fund Compliance Specialist (2009-2015) - Manning & Napier Advisors, LLC; Assistant Corporate Secretary (2011-2016) - Manning & Napier Fund, Inc. | |
Number of Portfolios Overseen within Fund Complex: | 40 | |
Other Directorships Held Outside Fund Complex: | N/A | |
Name: | Christine Glavin | |
Address: | 290 Woodcliff Drive | |
| Fairport, NY 14450 | ||
Age: | 50 | |
Current Position(s) Held with Fund: | Principal Financial Officer, Chief Financial Officer | |
Term of Office1 & Length of Time Served: | Principal Financial Officer (2002-present); Chief Financial Officer (2001-present) | |
Principal Occupation(s) During Past 5 Years: | Director of Fund Reporting (2011 - present); Fund Reporting Manager (1997-2011) - Manning & Napier Advisors, LLC; Assistant Treasurer (2008-present) - Exeter Trust Company | |
Number of Portfolios Overseen within Fund Complex: | 40 | |
Other Directorships Held Outside Fund Complex: | N/A | |
Name: | Jodi L. Hedberg | |
Address: | 290 Woodcliff Drive | |
| Fairport, NY 14450 | ||
Age: | 48 | |
Current Position(s) Held with Fund: | Chief Compliance Officer, Anti-Money Laundering Compliance Officer | |
Term of Office1 & Length of Time Served: | Chief Compliance Officer (2004-present); Anti-Money Laundering Compliance Officer (2002-present); Corporate Secretary (1997-2016) | |
Principal Occupation(s) During Past 5 Years: | Director of Compliance (2005-present); Compliance Manager (1995-2005) - Manning & Napier Advisors, LLC and affiliates; Corporate Secretary- Manning & Napier Investor Services, Inc. since 2006 | |
Number of Portfolios Overseen within Fund Complex: | 40 | |
Other Directorships Held Outside Fund Complex: | N/A | |
Name: | Amy Williams | |
Address: | 290 Woodcliff Drive | |
| Fairport, NY 14450 | ||
Age: | 54 | |
Current Position(s) Held with Fund: | Assistant Corporate Secretary | |
Term of Office1 & Length of Time Served: | Since 2016 | |
Principal Occupation(s) During Past 5 Years: | Director of Fund Documentation (1992-present) - Manning & Napier Advisors, LLC Holds one or more of the following titles for various affiliates; Director | |
Number of Portfolios Overseen within Fund Complex: | 40 | |
Other Directorships Held Outside Fund Complex: | N/A | |
Name: | Richard Yates | |
Address: | 290 Woodcliff Drive | |
| Fairport, NY 14450 | ||
Age: | 51 | |
Current Position(s) Held with Fund: | Chief Legal Officer | |
Term of Office1 & Length of Time Served: | Chief Legal Officer since 2004 | |
Principal Occupation(s) During Past 5 Years: | Counsel - Manning & Napier Advisors, LLC and affiliates (2000-present); Holds one or more of the following titles for various affiliates; Director or Corporate Secretary | |
Number of Portfolios Overseen within Fund Complex: | 40 | |
Other Directorships Held Outside Fund Complex: | N/A | |
*Interested Director, within the meaning of the Investment Company Act of 1940 by reason of her position with the Fund’s investment advisor. Ms. Mosca serves as the Managing Director of the Funds Group for Manning & Napier Advisors, LLC.
1The term of office of all officers shall be one year and until their respective successors are chosen and qualified, or his or her earlier resignation or removal as provided in the Fund’s By-Laws.
27
{This page intentionally left blank}
28
{This page intentionally left blank}
29
Disciplined Value Series
Literature Requests
(unaudited)
| Proxy | Voting Policies and Procedures |
A description of the policies and procedures that the Fund uses to determine how to vote proxies relating to portfolio securities is available, without charge, upon request:
| By phone | 1-800-466-3863 | |||
| On the Securities and Exchange | ||||
| Commission’s (SEC) web site | http://www.sec.gov |
| Proxy | Voting Record |
Information regarding how the Fund voted proxies relating to portfolio securities during the most recent 12-month period ended June 30th is available, without charge, upon request:
| By phone | 1-800-466-3863 | |||
| On the SEC’s web site | http://www.sec.gov |
| Quarterly | Portfolio Holdings |
The Series’ complete schedule of portfolio holdings for the 1st and 3rd quarters of each fiscal year are provided on Form
N-Q, and are available, without charge, upon request:
| By phone | 1-800-466-3863 | |||
| On the SEC’s web site | http://www.sec.gov |
The Series’ Form N-Q may be reviewed and copied at the SEC’s Public Reference Room in Washington, D.C. Information on the operation of the Public Reference Room may be obtained by calling 1-800-SEC-0330.
| Prospectus | and Statement of Additional Information (SAI) |
For more information about any of the Manning & Napier Fund, Inc. Series, you may obtain a prospectus and SAI at www.manning-napier.com or by calling (800) 466-3863. Before investing, carefully consider the objectives, risks, charges and expenses of the investment and read the prospectus carefully as it contains this and other information about the investment company. In addition, this information can be found on the SEC’s web site, http://www.sec.gov.
| Additional | information available at www.manning-napier.com |
1. Fund Holdings - Month-End
2. Fund Holdings - Quarter-End
3. Shareholder Report - Annual
4. Shareholder Report - Semi-Annual
The Fund also offers electronic notification or “e-delivery” when certain documents are available on-line to be downloaded or reviewed. Direct shareholders can elect to receive electronic notification when shareholder reports, prospectus updates, and/or statements are available. If you do not currently have on-line access to your account, you can establish access by going to www.manning-napier.com, click on “Login” in the top corner of the page, and follow the prompts to self-enroll. Once enrolled, you can set your electronic notification preferences by clicking on the Account Options tab located within the green toolbar and then select E-Delivery Option. Should you have any questions on either how to establish on-line access or how to update your account settings, please contact Investor Services at 1-800-466-3863.
The Manning & Napier Fund, Inc. is managed by Manning & Napier Advisors, LLC. Manning & Napier Investor Services, Inc., an affiliate of Manning & Napier Advisors, LLC, is the distributor of the Fund shares.
MNDIV-10/16-AR

Overseas Series
Management Discussion and Analysis
(unaudited)
Dear Shareholders:
U.S. and international equity markets delivered positive returns during the past year. Emerging market equities were the notable outperformers, driven by investors’ search for yield and their increased appetite for riskier assets. Abating unease related to Chinese growth, a relatively stable U.S. dollar, the year-to-date upturn in commodity prices, and increased liquidity amid generally easy policy across the globe also provided tailwinds for emerging market assets. Defensive sectors outperformed cyclicals for most of the period, since defensive securities tend to benefit from low interest rate environments and yield is a big component of total return. But the trend reversed amid a mid-year rotation away from crowded defensive sectors into cyclical stocks, and investors have since shown a preference for growth over yield.
Meanwhile, U.S. and global economic growth continued at a slow pace. Although various asset classes performed positively, the year was punctuated by bouts of market volatility. Ongoing concern regarding the price of oil and other commodities, speculation surrounding the trajectory of global economic growth and central bank policy, and political uncertainty — including the unexpected Brexit vote — fueled investor unease and served as volatility catalysts. Going forward, we anticipate an increased likelihood of further gyrations in financial markets as U.S. and global economic growth continues at a muted pace.
Enclosed, we highlight how we are positioned amid the current economic environment, and provide our outlook of what to expect in financial markets. We hope that you find this information to be helpful.
As always, we appreciate your business.
Sincerely,
Manning & Napier Advisors, LLC
1
Overseas Series
Fund Commentary
(unaudited)
Investment Objective
To maximize long-term growth by investing principally in the common stocks of companies located around the world. The Series invests primarily in foreign companies, including those in developed and emerging markets.
Performance Commentary
International equity markets generally delivered modestly positive absolute returns for the twelve-month period ended October 31, 2016. The broad MSCI All Country World ex U.S. Index (ACWIxUS) returned 0.22%. The Overseas Series returned -0.35% and slightly underperformed the benchmark on a relative basis.
The Series’ underperformance relative to ACWIxUS during the year was driven by stock selection. Conversely, sector positioning aided relative returns. Regarding major detractors from relative performance, stock selection in Energy challenged relative returns. Specifically, our investment in global uranium miner Cameco (2.20%*) under our Hurdle Rate strategy was a headwind to relative performance. Through our Hurdle Rate strategy, we seek to identify the strongest competitors in cyclical industries and build positions in those companies as the cycle bottoms. These businesses tend to reap the benefits when the cycle begins anew. Though the share price of Cameco has recently been under pressure amid investor perception that the recovery in the uranium market is being pushed out, emerging economies continue to invest heavily in nuclear capacity given its attractive characteristics as a baseload, low-cost, and clean power generation source. We expect this to result in long-term uranium demand growth as more reactors are constructed and connected to the grid. Additionally, we view the near absence of nuclear power generation in Japan following the Fukushima disaster as unsustainable due to the country’s heavy reliance on imports to fuel thermal units, which is weighing on the government’s push to reaccelerate the economy. Given the lack of investment in supply and expanding underlying demand, we see a growing supply deficit on the horizon. These dynamics lead to our view that uranium prices need to move significantly higher to incentivize producers to spend on new mines to address future demand. Therefore, we maintain our conviction in the company.
Offsetting a portion of the relative performance headwind was stock selection in Information Technology and Consumer Staples, which aided relative returns. The Series’ underweight to Financials and overweight to Information Technology compared to the benchmark aided relative returns as well.
In regard to the Series’ current positioning, we are focused on finding companies with growth drivers that are not tied to the broad economy. We believe the key to generating attractive returns in the prevailing environment is the ability to identify individual businesses that can innovate and disrupt their competitive landscape. We are looking for businesses that are generating growth by creating new markets, expanding existing markets, or simply taking market share from their rivals. The goal is to identify companies trading at attractive valuations relative to their growth potential.
As we look toward 2017, we expect global economic growth to persist at a slow pace. Broadly speaking, valuations in the developed world are on the expensive side of neutral, whereas valuations in select emerging markets are relatively more attractive. The current backdrop suggests muted long-term returns going forward, so we are targeting companies exposed to secular (i.e., long-term) growth trends in an effort to generate above market returns. We continue to anticipate gyrations in equity markets due to catalysts such as the potential for global growth to deviate from expectations, diverging central bank policies, commodity price pressures, and geopolitical risks. However, our indicators point to volatility still being a buying opportunity and do not suggest capital risk is a significant near-term concern. In this environment, an active, flexible, and selective approach can help avoid overvalued areas of the market, tactics that Manning & Napier has employed for over 45 years as an active investment manager.
Please see the next page for additional performance information as of October 31, 2016.
Performance data quoted represents past performance and does not guarantee future results. The investment return and principal value of an investment will fluctuate, so that an investor’s shares, when redeemed, may be worth more or less than their original cost. Current performance may be higher or lower than that quoted; investors can obtain the most recent month-end performance at www.manning-napier.com or by calling (800) 466-3863.
*Represents the percent of the Series’ holdings as of 10/31/2016. Calculations are based on a portfolio that excludes cash. Investments will change over time.
All investments involve risks, including possible loss of principal. Funds whose investments are concentrated in foreign countries may be subject to fluctuating currency values, different accounting standards, and economic and political instability. The value of the Series may be affected by changes in exchange rates between foreign currencies and the U.S. dollar. Investments in emerging markets may be more volatile than investments in more developed markets.
2
Overseas Series
Performance Update as of October 31, 2016
(unaudited)
AVERAGE ANNUAL TOTAL RETURNS AS OF OCTOBER 31, 2016 | ||||||||||||||||
ONE YEAR1 | FIVE YEAR | TEN YEAR | SINCE INCEPTION2 | |||||||||||||
Manning & Napier Fund, Inc. - Overseas Series3,4 | -0.35 | % | 3.29 | % | 1.89 | % | 7.28 | % | ||||||||
MSCI ACWI ex USA Index5 | 0.22 | % | 3.64 | % | 1.61 | % | 5.22 | % | ||||||||
The following graph compares the value of a $1,000,000 investment in the Manning & Napier Fund, Inc. - Overseas Series for the ten years ended October 31, 2016 to the MSCI ACWI ex USA Index.
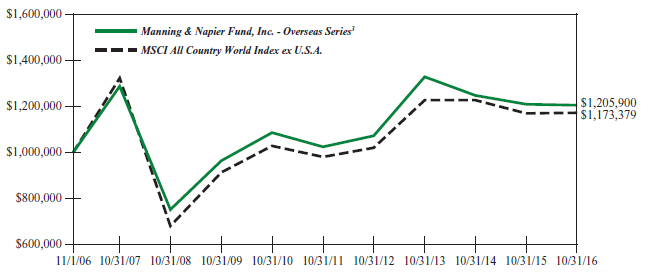
1The returns shown are based on net asset values calculated for shareholder transactions and may differ from the returns shown in the financial highlights, which reflect adjustments made to the net asset values in accordance with accounting principles generally accepted in the United States of America.
2Performance numbers for the Series are calculated from September 23, 1998, the Collective’s inception date (see Note 4 below). Prior to 2001, the MSCI ACWI ex USA only published month-end numbers; therefore, performance numbers for the Index are calculated from September 30, 1998.
3The Series’ performance does not reflect the deduction of taxes that a shareholder would pay on fund distributions or the redemption of shares. The Series’ performance is historical and may not be indicative of future results. The performance returns shown are inclusive of the net expense ratio of the Series. For the year ended October 31, 2016, this net expense ratio was 0.75%. The gross expense ratio, which does not account for any voluntary or contractual waivers currently in effect, was 0.75% for the year ended October 31, 2016.
4Prior to July 10, 2002, all performance figures reflect the performance of the Exeter Trust Company Group Trust for Employee Benefit Plans: International Collective Investment Trust (the “Collective”), which was managed by Manning & Napier Advisors, Inc. (predecessor to Manning & Napier Advisors, LLC), an affiliate of the distributor, and reorganized into the Manning & Napier Fund, Inc. Overseas Series on July 10, 2002. The Collective was not open to the public generally or registered under the Investment Company Act of 1940 and the fees of the Collective were lower than the Series’ fees. Therefore, the historical performance of the Collective would have been lower if the Collective had been subject to the same fees as the Series.
5The MSCI ACWI ex USA Index is a free float-adjusted market capitalization index that is designed to measure equity market performance in the global developed and emerging markets and consists of 45 developed and emerging market country indices outside the U.S. The Index returns do not reflect any fees or expenses. The Index is denominated in U.S. dollars. The Index returns assume daily investment of gross dividends (which do not account for applicable dividend taxation) prior to December 31, 1998, as net returns were not available. Subsequent to December 31, 1998, the Index returns are net of withholding taxes. They assume daily reinvestment of net dividends, thus accounting for any applicable dividend taxation. Index returns provided by Bloomberg.
3
Overseas Series
Shareholder Expense Example
(unaudited)
As a shareholder of the Series, you incur ongoing costs, including management fees, shareholder service fees and other Series expenses. This example is intended to help you understand your ongoing costs (in dollars) of investing in the Series and to compare these costs with the ongoing costs of investing in other mutual funds.
The example is based on an investment of $1,000 invested at the beginning of the period and held for the entire period (May 1, 2016 to October 31, 2016).
Actual Expenses
The first line of the table below provides information about actual account values and actual expenses. You may use the information in this line, together with the amount you invested, to estimate the expenses that you paid over the period. Simply divide your account value by $1,000 (for example, an $8,600 account value divided by $1,000 = 8.6), then multiply the result by the number in the first line under the heading entitled “Expenses Paid During Period” to estimate the expenses you paid on your account during this period.
Hypothetical Example for Comparison Purposes
The second line of the table below provides information about hypothetical account values and hypothetical expenses based on the Series’ actual expense ratio and an assumed rate of return of 5% per year before expenses, which is not the Series’ actual return. The hypothetical account values and expenses may not be used to estimate the actual ending account balance or expenses you paid during the period. You may use this information to compare the ongoing costs of investing in the Series and other funds. To do so, compare this 5% hypothetical example with the 5% hypothetical examples that appear in the shareholder reports of the other funds.
Please note that the expenses shown in the table are meant to highlight your ongoing costs only and do not reflect any transaction costs, such as sales charges (loads), redemptions fees, or exchange fees that you may incur in other mutual funds. Therefore, the second line of the table is useful in comparing ongoing costs only, and will not help you determine the relative total costs of owning different funds.
BEGINNING ACCOUNT VALUE 5/1/16 | ENDING ACCOUNT VALUE 10/31/16 | EXPENSES PAID DURING PERIOD* 5/1/16-10/31/16 | ||||
Actual | $1,000.00 | $991.90 | $3.71 | |||
Hypothetical | ||||||
(5% return before expenses) | $1,000.00 | $1,021.42 | $3.76 |
*Expenses are equal to the Series’ annualized expense ratio (for the six-month period) of 0.74%, multiplied by the average account value over the period, multiplied by 184/366 (to reflect the one-half year period). Expenses are based on the most recent fiscal half year; therefore, the expense ratios stated above may differ from the expense ratios stated in the financial highlights, which are based on one-year data.
4
Overseas Series
Portfolio Composition as of October 31, 2016
(unaudited)
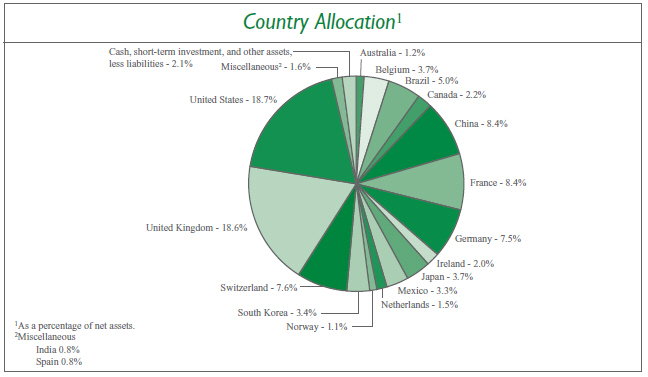
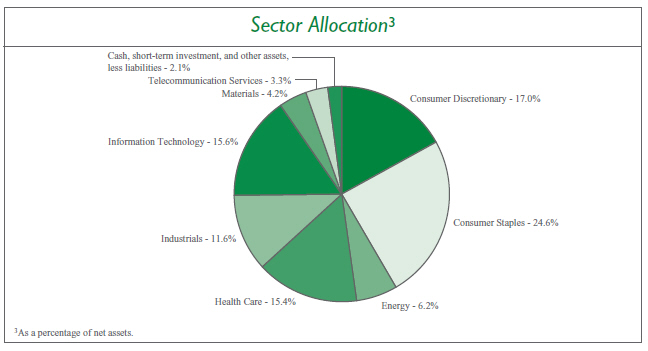
5
Overseas Series
Investment Portfolio - October 31, 2016
SHARES | VALUE | |||||||
| (NOTE 2) | ||||||||
COMMON STOCKS - 97.9% | ||||||||
Consumer Discretionary - 17.0% | ||||||||
Diversified Consumer Services - 2.0% | ||||||||
Kroton Educacional S.A. (Brazil) | 3,673,648 | $ | 18,287,678 | |||||
|
| |||||||
Hotels, Restaurants & Leisure - 3.0% | ||||||||
Accor S.A. (France)1 | 743,510 | 28,213,631 | ||||||
|
| |||||||
Internet & Direct Marketing Retail - 0.5% | ||||||||
Zalando SE (Germany)*1,2 | 107,030 | 4,706,633 | ||||||
|
| |||||||
Media - 6.3% | ||||||||
Dish TV India Ltd. (India)*1 | 5,219,820 | 7,821,654 | ||||||
ITV plc (United Kingdom)1 | 8,869,190 | 18,490,110 | ||||||
Liberty Global plc - Class A - ADR (United Kingdom)* | 1,012,430 | 33,005,218 | ||||||
|
| |||||||
| 59,316,982 | ||||||||
|
| |||||||
Specialty Retail - 2.5% | ||||||||
Kingfisher plc (United Kingdom)1 | 5,248,759 | 23,186,076 | ||||||
|
| |||||||
Textiles, Apparel & Luxury Goods - 2.7% | ||||||||
lululemon athletica, Inc. (United States)* | 437,650 | 25,055,462 | ||||||
|
| |||||||
Total Consumer Discretionary | 158,766,462 | |||||||
|
| |||||||
Consumer Staples - 24.6% | ||||||||
Beverages - 9.7% | ||||||||
Ambev S.A. - ADR (Brazil) | 4,858,645 | 28,666,006 | ||||||
Anheuser-Busch InBev S.A./N.V. (Belgium)1 | 261,430 | 30,004,398 | ||||||
Diageo plc (United Kingdom)1 | 1,205,140 | 32,076,788 | ||||||
|
| |||||||
| 90,747,192 | ||||||||
|
| |||||||
Food & Staples Retailing - 1.1% | ||||||||
Tesco plc (United Kingdom)*1 | 3,994,940 | 10,289,757 | ||||||
|
| |||||||
Food Products - 4.9% | ||||||||
Danone S.A. (France)1 | 328,350 | 22,773,909 | ||||||
Nestle S.A. (Switzerland)1 | 317,790 | 23,044,196 | ||||||
|
| |||||||
| 45,818,105 | ||||||||
|
| |||||||
Personal Products - 5.2% | ||||||||
Beiersdorf AG (Germany)1 | 114,610 | 10,104,028 | ||||||
Unilever plc - ADR (United Kingdom) | 918,170 | 38,260,144 | ||||||
|
| |||||||
| 48,364,172 | ||||||||
|
| |||||||
Tobacco - 3.7% | ||||||||
Japan Tobacco, Inc. (Japan)1 | 913,100 | 34,716,177 | ||||||
|
| |||||||
Total Consumer Staples | 229,935,403 | |||||||
|
| |||||||
Energy - 6.2% | ||||||||
Energy Equipment & Services - 3.9% | ||||||||
Schlumberger Ltd. (United States) | 469,400 | 36,721,162 | ||||||
|
| |||||||
The accompanying notes are an integral part of the financial statements.
6
Overseas Series
Investment Portfolio - October 31, 2016
| VALUE | ||||||||
| SHARES | (NOTE 2) | |||||||
COMMON STOCKS (continued) | ||||||||
Energy (continued) | ||||||||
Oil, Gas & Consumable Fuels - 2.3% | ||||||||
Cameco Corp. (Canada) | 2,724,370 | $ | 20,977,649 | |||||
|
| |||||||
Total Energy | 57,698,811 | |||||||
|
| |||||||
Health Care - 15.4% | ||||||||
Health Care Equipment & Supplies - 3.9% | ||||||||
Medtronic plc (United States) | 422,890 | 34,685,438 | ||||||
Shandong Weigao Group Medical Polymer Co. Ltd. - Class H (China)1 | 2,601,182 | 1,693,492 | ||||||
|
| |||||||
| 36,378,930 | ||||||||
|
| |||||||
Health Care Providers & Services - 2.8% | ||||||||
Fresenius Medical Care AG & Co. KGaA (Germany)1 | 326,520 | 26,596,528 | ||||||
|
| |||||||
Life Sciences Tools & Services - 2.5% | ||||||||
QIAGEN N.V. (United States)* | 546,344 | 13,319,867 | ||||||
QIAGEN N.V. (United States)*1 | 401,066 | 9,809,107 | ||||||
|
| |||||||
| 23,128,974 | ||||||||
|
| |||||||
Pharmaceuticals - 6.2% | ||||||||
Novartis AG - ADR (Switzerland) | 497,620 | 35,340,972 | ||||||
Perrigo Co. plc (United States) | 266,890 | 22,202,579 | ||||||
|
| |||||||
| 57,543,551 | ||||||||
|
| |||||||
Total Health Care | 143,647,983 | |||||||
|
| |||||||
Industrials - 11.6% | ||||||||
Aerospace & Defense - 2.9% | ||||||||
Safran S.A. (France)1 | 401,935 | 27,657,817 | ||||||
|
| |||||||
Airlines - 2.0% | ||||||||
Ryanair Holdings plc - ADR (Ireland)* | 247,287 | 18,568,781 | ||||||
|
| |||||||
Machinery - 2.4% | ||||||||
Sulzer AG (Switzerland)1 | 128,955 | 12,699,649 | ||||||
The Weir Group plc (United Kingdom)1 | 461,990 | 9,596,858 | ||||||
|
| |||||||
| 22,296,507 | ||||||||
|
| |||||||
Trading Companies & Distributors - 3.5% | ||||||||
Brenntag AG (Germany)1 | 526,879 | 28,167,174 | ||||||
Howden Joinery Group plc (United Kingdom)1 | 909,460 | 4,164,569 | ||||||
|
| |||||||
| 32,331,743 | ||||||||
|
| |||||||
Transportation Infrastructure - 0.8% | ||||||||
Aena S.A. (Spain)1,2 | 50,292 | 7,369,604 | ||||||
|
| |||||||
Total Industrials | 108,224,452 | |||||||
|
| |||||||
Information Technology - 15.6% | ||||||||
Internet Software & Services - 8.7% | ||||||||
Alibaba Group Holding Ltd. - ADR (China)* | 227,950 | 23,180,236 | ||||||
Baidu, Inc. - ADR (China)* | 103,500 | 18,305,010 | ||||||
The accompanying notes are an integral part of the financial statements.
7
Overseas Series
Investment Portfolio - October 31, 2016
| VALUE | ||||||||
| SHARES | (NOTE 2) | |||||||
COMMON STOCKS (continued) | ||||||||
Information Technology (continued) | ||||||||
Internet Software & Services (continued) | ||||||||
Just Eat plc (United Kingdom)*1 | 719,794 | $ | 4,944,512 | |||||
Tencent Holdings Ltd. - Class H (China)1 | 1,315,000 | 34,850,573 | ||||||
|
| |||||||
| 81,280,331 | ||||||||
|
| |||||||
IT Services - 3.5% | ||||||||
Amdocs Ltd. - ADR (United States) | 555,964 | 32,496,096 | ||||||
|
| |||||||
Technology Hardware, Storage & Peripherals - 3.4% | ||||||||
Samsung Electronics Co. Ltd. (South Korea)1 | 22,290 | 31,882,020 | ||||||
|
| |||||||
Total Information Technology | 145,658,447 | |||||||
|
| |||||||
Materials - 4.2% | ||||||||
Chemicals - 2.0% | ||||||||
Akzo Nobel N.V. (Netherlands)1 | 214,410 | 13,853,322 | ||||||
Solvay S.A. (Belgium)1 | 40,850 | 4,686,066 | ||||||
|
| |||||||
| 18,539,388 | ||||||||
|
| |||||||
Metals & Mining - 2.2% | ||||||||
Alumina Ltd. (Australia)1 | 9,013,518 | 10,833,130 | ||||||
Norsk Hydro ASA (Norway)1 | 2,243,124 | 10,028,425 | ||||||
|
| |||||||
| 20,861,555 | ||||||||
|
| |||||||
Total Materials | 39,400,943 | |||||||
|
| |||||||
Telecommunication Services - 3.3% | ||||||||
Wireless Telecommunication Services - 3.3% | ||||||||
America Movil S.A.B. de C.V. - Class L - ADR (Mexico) | 2,325,310 | 30,554,573 | ||||||
|
| |||||||
TOTAL COMMON STOCKS | ||||||||
(Identified Cost $941,534,140) | 913,887,074 | |||||||
|
| |||||||
SHORT-TERM INVESTMENT - 1.7% | ||||||||
Dreyfus Government Cash Management3, 0.28% | ||||||||
(Identified Cost $16,248,645) | 16,248,645 | 16,248,645 | ||||||
|
| |||||||
TOTAL INVESTMENTS - 99.6% | ||||||||
(Identified Cost $957,782,785) | 930,135,719 | |||||||
OTHER ASSETS, LESS LIABILITIES - 0.4% | 3,469,342 | |||||||
|
| |||||||
NET ASSETS - 100% | $ | 933,605,061 | ||||||
|
| |||||||
ADR - American Depositary Receipt
*Non-income producing security.
1A factor from a third party vendor was applied to determine the security’s fair value following the close of local trading.
2Restricted securities - Investment in securities that are restricted as to public resale under the Securities Act of 1933, as amended. These securities have been sold under rule 144A and have been determined to be liquid under guidelines established by the Board of Directors. These securities amount to $12,076,237 or 1.3% of the Series’ net assets as of October 31, 2016.
3Rate shown is the current yield as of October 31, 2016.
The accompanying notes are an integral part of the financial statements.
8
Overseas Series
Investment Portfolio - October 31, 2016
The Series’ portfolio holds, as a percentage of net assets, greater than 10% in the following countries: United States - 18.7%; United Kingdom - 18.6%.
The Global Industry Classification Standard (GICS) was developed by and is the exclusive property and a service mark of MSCI Inc. (MSCI) and Standard & Poor’s, a division of The McGraw-Hill Companies, Inc. (S&P), and is licensed for use by Manning & Napier when referencing GICS sectors. Neither MSCI, S&P, nor any third party involved in making or compiling the GICS or any GICS classifications makes any express or implied warranties or representations with respect to such standard or classification, nor shall any such party have any liability therefrom.
The accompanying notes are an integral part of the financial statements.
9
Overseas Series
Statement of Assets & Liabilities
October 31, 2016
ASSETS: | ||||
Investments, at value (identified cost $957,782,785) (Note 2) | $ | 930,135,719 | ||
Receivable for securities sold | 45,800,503 | |||
Foreign tax reclaims receivable | 4,507,704 | |||
Dividends receivable | 1,485,087 | |||
Receivable for fund shares sold | 11,610 | |||
|
| |||
TOTAL ASSETS | 981,940,623 | |||
|
| |||
LIABILITIES: | ||||
Accrued management fees (Note 3) | 626,210 | |||
Accrued fund accounting and administration fees (Note 3) | 22,233 | |||
Accrued transfer agent fees (Note 3) | 1,000 | |||
Accrued Chief Compliance Officer service fees (Note 3) | 353 | |||
Accrued Directors’ fees (Note 3) | 402 | |||
Accrued foreign capital gains tax (Note 2) | 1,062 | |||
Payable for securities purchased | 3,231,950 | |||
Payable for fund shares repurchased | 44,333,349 | |||
Other payables and accrued expenses | 119,003 | |||
|
| |||
TOTAL LIABILITIES | 48,335,562 | |||
|
| |||
TOTAL NET ASSETS | $ | 933,605,061 | ||
|
| |||
NET ASSETS CONSIST OF: | ||||
Capital stock | $ | 447,099 | ||
Additional paid-in-capital | 1,133,066,743 | |||
Undistributed net investment income | 14,321,898 | |||
Accumulated net realized loss on investments, foreign currency and translation of other assets and liabilities | (186,197,575 | ) | ||
Net unrealized appreciation (depreciation) on investments (net of foreign capital gain tax of | (28,033,104 | ) | ||
|
| |||
TOTAL NET ASSETS | $ | 933,605,061 | ||
|
| |||
NET ASSET VALUE, OFFERING PRICE AND REDEMPTION PRICE PER SHARE - Class A | ||||
($933,605,061/44,709,885 shares) | $ | 20.88 | ||
|
| |||
The accompanying notes are an integral part of the financial statements.
10
Overseas Series
Statement of Operations
For the Year Ended October 31, 2016
INVESTMENT INCOME: | ||||
Dividends (net of foreign taxes withheld, $2,659,473) | $ | 28,046,284 | ||
|
| |||
EXPENSES: | ||||
Management fees (Note 3) | 8,593,177 | |||
Fund accounting and administration fees (Note 3) | 154,253 | |||
Directors’ fees (Note 3) | 86,288 | |||
Transfer agent fees (Note 3) | 6,432 | |||
Chief Compliance Officer service fees (Note 3) | 3,727 | |||
Custodian fees | 140,387 | |||
Miscellaneous | 190,960 | |||
|
| |||
Total Expenses | 9,175,224 | |||
|
| |||
NET INVESTMENT INCOME | 18,871,060 | |||
|
| |||
REALIZED AND UNREALIZED GAIN (LOSS) ON INVESTMENTS AND FOREIGN CURRENCY: | ||||
Net realized loss on- | ||||
Investments | (89,943,313 | ) | ||
Foreign currency and translation of other assets and liabilities | (293,894 | ) | ||
|
| |||
| (90,237,207 | ) | |||
|
| |||
Net change in unrealized appreciation (depreciation) on- | ||||
Investments (net increase in accrued foreign capital gain tax of $1,062) | 57,128,757 | |||
Foreign currency and translation of other assets and liabilities | (49,223 | ) | ||
|
| |||
| 57,079,534 | ||||
|
| |||
NET REALIZED AND UNREALIZED GAIN (LOSS) ON INVESTMENTS AND FOREIGN CURRENCY | (33,157,673 | ) | ||
|
| |||
NET DECREASE IN NET ASSETS RESULTING FROM OPERATIONS | $ | (14,286,613 | ) | |
|
| |||
The accompanying notes are an integral part of the financial statements.
11
Overseas Series
Statements of Changes in Net Assets
FOR THE YEAR ENDED 10/31/16 | FOR THE YEAR ENDED 10/31/15 | |||||||
INCREASE (DECREASE) IN NET ASSETS: | ||||||||
OPERATIONS: | ||||||||
Net investment income | $ | 18,871,060 | $ | 31,225,146 | ||||
Net realized loss on investments and foreign currency | (90,237,207 | ) | (96,890,011 | ) | ||||
Net change in unrealized appreciation (depreciation) on investments and foreign currency | 57,079,534 | 11,166,783 | ||||||
|
|
|
| |||||
Net decrease from operations | (14,286,613 | ) | (54,498,082 | ) | ||||
|
|
|
| |||||
DISTRIBUTIONS TO SHAREHOLDERS (Note 8): | ||||||||
From net investment income | (27,334,427 | ) | (38,104,257 | ) | ||||
From net realized gain on investments | — | (188,046,421 | ) | |||||
|
|
|
| |||||
Total distributions to shareholders | (27,334,427 | ) | (226,150,678 | ) | ||||
|
|
|
| |||||
CAPITAL STOCK ISSUED AND REPURCHASED: | ||||||||
Net decrease from capital share transactions (Note 5) | (750,051,441 | ) | (646,381,264 | ) | ||||
|
|
|
| |||||
Net decrease in net assets | (791,672,481 | ) | (927,030,024 | ) | ||||
NET ASSETS: | ||||||||
Beginning of year | 1,725,277,542 | 2,652,307,566 | ||||||
|
|
|
| |||||
End of year (including undistributed net investment income of $14,321,898 and $25,786,926,respectively) | $ | 933,605,061 | $ | 1,725,277,542 | ||||
|
|
|
| |||||
The accompanying notes are an integral part of the financial statements.
12
Overseas Series
Financial Highlights
| FOR THE YEARS ENDED | ||||||||||||||||||||
10/31/16 |
10/31/15 |
10/31/14 |
10/31/13 |
10/31/12 | ||||||||||||||||
Per share data (for a share outstanding throughout each year): | ||||||||||||||||||||
Net asset value - Beginning of year | $ | 21.34 | $ | 24.31 | $ | 27.39 | $ | 22.47 | $ | 22.63 | ||||||||||
|
|
|
|
|
|
|
|
|
| |||||||||||
Income (loss) from investment operations: | ||||||||||||||||||||
Net investment income1 | 0.32 | 0.32 | 0.36 | 0.41 | 0.36 | |||||||||||||||
Net realized and unrealized gain (loss) on investments | (0.41 | ) | (1.14 | ) | (1.98 | ) | 4.88 | 0.51 | ||||||||||||
|
|
|
|
|
|
|
|
|
| |||||||||||
Total from investment operations | (0.09 | ) | (0.82 | ) | (1.62 | ) | 5.29 | 0.87 | ||||||||||||
|
|
|
|
|
|
|
|
|
| |||||||||||
Less distributions to shareholders: | ||||||||||||||||||||
From net investment income | (0.37 | ) | (0.36 | ) | (0.37 | ) | (0.37 | ) | (0.52 | ) | ||||||||||
From net realized gain on investments | — | (1.79 | ) | (1.09 | ) | — | (0.51 | ) | ||||||||||||
|
|
|
|
|
|
|
|
|
| |||||||||||
Total distributions to shareholders | (0.37 | ) | (2.15 | ) | (1.46 | ) | (0.37 | ) | (1.03 | ) | ||||||||||
|
|
|
|
|
|
|
|
|
| |||||||||||
Net asset value - End of year | $ | 20.88 | $ | 21.34 | $ | 24.31 | $ | 27.39 | $ | 22.47 | ||||||||||
|
|
|
|
|
|
|
|
|
| |||||||||||
Net assets - End of year (000’s omitted) | $ | 933,605 | $ | 1,725,278 | $ | 2,652,308 | $ | 2,661,662 | $ | 1,993,999 | ||||||||||
|
|
|
|
|
|
|
|
|
| |||||||||||
Total return2 | (0.35 | %) | (3.02 | %) | (6.13 | %) | 23.87 | % | 4.61 | % | ||||||||||
Ratios (to average net assets)/Supplemental Data: | ||||||||||||||||||||
Expenses* | 0.75 | % | 0.74 | % | 0.74 | % | 0.75 | % | 0.75 | % | ||||||||||
Net investment income | 1.54 | % | 1.41 | % | 1.37 | % | 1.65 | % | 1.68 | % | ||||||||||
Portfolio turnover | 37 | % | 59 | % | 39 | % | 43 | % | 42 | % | ||||||||||
| *The investment advisor did not impose all or a portion of its management and/or other fees, and in some years may have paid a portion of the Series’ expenses. If these expenses had been incurred by the Series, the expense ratio (to average net assets) would have increased by the following amounts: | ||||||||||||||||||||
| N/A | N/A | N/A | N/A | 0.00 | %3 | |||||||||||||||
1Calculated based on average shares outstanding during the years.
2Represents aggregate total return for the years indicated, and assumes reinvestment of all distributions. Total return would have been lower had certain expenses not been waived or reimbursed during certain years.
3Less than 0.01%.
The accompanying notes are an integral part of the financial statements.
13
Overseas Series
Notes to Financial Statements
| 1. | Organization |
Overseas Series (the “Series”) is a no-load diversified series of Manning & Napier Fund, Inc. (the “Fund”). The Fund is organized in Maryland and is registered under the Investment Company Act of 1940, as amended, as an open-end management investment company.
The Series’ investment objective is to provide long-term growth.
The Fund’s Advisor is Manning & Napier Advisors, LLC (the “Advisor”). Shares of the Series are offered to investors, clients and employees of the Advisor and its affiliates. The total authorized capital stock of the Fund consists of 15 billion shares of common stock each having a par value of $0.01. As of October 31, 2016, 10.5 billion shares have been designated in total among 40 series, of which 200 million have been designated as Overseas Series Class A common stock.
| 2. | Significant Accounting Policies |
The following is a summary of significant accounting policies followed by the Series. The Series is an investment company and, accordingly, follows the investment company accounting and reporting guidance of the Financial Accounting Standards Board Accounting Standards Codification Topic 946 - Investment Companies, which is part of accounting principles generally accepted in the United States of America (“GAAP”).
Security Valuation
Portfolio securities, including domestic equities, foreign equities, warrants and options, listed on an exchange other than the NASDAQ Stock Market are valued at the latest quoted sales price of the exchange on which the security is primarily traded. Securities not traded on valuation date or securities not listed on an exchange are valued at the latest quoted bid price provided by the Fund’s pricing service. Securities listed on the NASDAQ Stock Market are valued in accordance with the NASDAQ Official Closing Price.
Short-term investments that mature in sixty days or less may be valued at amortized cost, which approximates fair value. Investments in open-end investment companies are valued at their net asset value per share on valuation date.
Volume and level of activity in established markets for an asset or liability are evaluated to determine whether recent transactions and quoted prices are determinative of fair value. Where there have been significant decreases in volume and level of activity, further analysis and adjustment may be necessary to estimate fair value. The Series measures fair value in these instances by the use of inputs and valuation techniques which may be based upon current market prices of securities that are comparable in coupon, rating, maturity and industry and/or expectation of future cash flows. As a result of trading in relatively thin markets and/or markets that experience significant volatility, the prices used by the Series to value these securities may differ from the value that would be realized if these securities were sold, and the differences could be material.
Securities for which representative valuations or prices are not available from the Series’ pricing service may be valued at fair value as determined in good faith by the Advisor under procedures approved by and under the general supervision and responsibility of the Fund’s Board of Directors (the “Board”). Due to the inherent uncertainty of valuations of such securities, the fair value may differ significantly from the values that would have been used had a ready market for such securities existed. If trading or events occurring after the close of the principal market in which securities are traded are expected to materially affect the value of those securities, then they may be valued at their fair value, taking this trading or these events into account. In accordance with the procedures approved by the Board, the values of certain securities trading outside the U.S. were adjusted following the close of local trading using a factor from a third party vendor. The third party vendor uses statistical analyses and quantitative models, which consider among other things subsequent movement and changes in the prices of indices, securities and exchange rates in other markets, to determine the factors which are used to adjust local market prices. The value of securities used for net asset value calculation under these procedures may differ from published prices for the same securities. It is the Fund’s policy to classify each foreign equity security where a factor from a third party vendor is provided as a Level 2 security.
14
Overseas Series
Notes to Financial Statements (continued)
| 2. | Significant Accounting Policies (continued) |
Security Valuation (continued)
Various inputs are used in determining the value of the Series’ assets or liabilities carried at fair value. These inputs are summarized in three broad levels. Level 1 includes quoted prices in active markets for identical assets and liabilities. Level 2 includes other significant observable inputs (including quoted prices for similar securities, interest rates, prepayment speeds, credit risk, etc.). Level 3 includes significant unobservable inputs (including the Series’ own assumptions in determining the fair value of investments). A financial instrument’s level within the fair value hierarchy is based on the lowest level of any input both individually and in aggregate that is significant to the fair value measurement. The inputs or methodology used for valuing securities are not necessarily an indication of the risk associated with investing in those securities.
The following is a summary of the valuation levels used for major security types as of October 31, 2016 in valuing the Series’ assets or liabilities carried at fair value:
| DESCRIPTION | TOTAL | LEVEL 1 | LEVEL 2 | LEVEL 3 | ||||||||||||
Assets: | ||||||||||||||||
Equity securities: | ||||||||||||||||
Consumer Discretionary | $ | 158,766,462 | $ | 76,348,358 | $ | 82,418,104 | $ | — | ||||||||
Consumer Staples | 229,935,403 | 66,926,150 | 163,009,253 | — | ||||||||||||
Energy | 57,698,811 | 57,698,811 | — | — | ||||||||||||
Health Care | 143,647,983 | 105,548,856 | 38,099,127 | — | ||||||||||||
Industrials | 108,224,452 | 18,568,781 | 89,655,671 | — | ||||||||||||
Information Technology | 145,658,447 | 73,981,342 | 71,677,105 | — | ||||||||||||
Materials | 39,400,943 | — | 39,400,943 | — | ||||||||||||
Telecommunication Services | 30,554,573 | 30,554,573 | — | — | ||||||||||||
Mutual Fund | 16,248,645 | 16,248,645 | — | — | ||||||||||||
|
|
|
|
|
|
|
| |||||||||
Total assets | $ | 930,135,719 | $ | 445,875,516 | $ | 484,260,203 | $ | — | ||||||||
|
|
|
|
|
|
|
| |||||||||
Please see the Investment Portfolio for foreign securities where a factor from a third party vendor was applied to determine the security’s fair value following the close of local trading. Such securities are included in Level 2 in the table above.
There were no Level 3 securities held by the Series as of October 31, 2015 or October 31, 2016.
The Fund’s policy is to recognize transfers in and transfers out of the valuation levels as of the beginning of the reporting period. There were no transfers between Level 1 and Level 2 during the year ended October 31, 2016.
New Accounting Guidance
In October 2016, the Securities and Exchange Commission (SEC) issued a new rule, Investment Company Reporting Modernization, which, among other provisions, amends Regulation S-X to require standardized, enhanced disclosures, particularly related to derivatives, in investment company financial statements. Compliance with the guidance is required for financial statements filed with the SEC on or after August 1, 2017; adoption will have no effect on the Fund’s net assets or results of operations.
Security Transactions, Investment Income and Expenses
Security transactions are accounted for on trade date. Dividend income is recorded on the ex-dividend date, except that if the ex-dividend date has passed, certain dividends from foreign securities are recorded as soon as the Series is informed of the ex-dividend date. Non-cash dividends, if any, are recorded at the fair value of the securities received. Interest income, including amortization of premium and accretion of discounts using the effective interest method, is earned from settlement date and accrued daily.
Expenses are recorded on an accrual basis. Most expenses of the Fund can be attributed to a specific series. Expenses which cannot be directly attributed are apportioned among the series in the Fund in such a manner as deemed equitable by the Fund’s Board, taking into consideration, among other things, the nature and type of expense.
15
Overseas Series
Notes to Financial Statements (continued)
| 2. | Significant Accounting Policies (continued) |
Security Transactions, Investment Income and Expenses (continued)
The Series uses the identified cost method for determining realized gain or loss on investments for both financial statement and federal income tax reporting purposes.
Foreign Currency Translation
The books and records of the Series are maintained in U.S. dollars. Foreign currencies, investments and other assets and liabilities are translated into U.S. dollars at the current exchange rates. Purchases and sales of investment securities and income and expenses are translated on the respective dates of such transactions. The Series does not isolate realized and unrealized gains and losses attributable to changes in the exchange rates from gains and losses that arise from changes in the fair value of investments. Such fluctuations are included with net realized and unrealized gain or loss on investments. Net realized foreign currency gains and losses represent foreign currency gains and losses between trade date and settlement date on securities transactions, gains and losses on disposition of foreign currencies and the difference between the amount of income and foreign withholding taxes recorded on the books of the Series and the amounts actually received or paid.
Federal Taxes
The Series’ policy is to comply with the provisions of the Internal Revenue Code applicable to regulated investment companies. The Series is not subject to federal income tax or excise tax to the extent that the Series distributes to shareholders each year its taxable income, including any net realized gains on investments, in accordance with requirements of the Internal Revenue Code. Accordingly, no provision for federal income tax or excise tax has been made in the financial statements.
Management evaluates its tax positions to determine if the tax positions taken meet the minimum recognition threshold in connection with accounting for uncertainties in income tax positions taken or expected to be taken for the purposes of measuring and recognizing tax liabilities in the financial statements. Recognition of tax benefits of an uncertain tax position is required only when the position is “more likely than not” to be sustained assuming examination by taxing authorities. At October 31, 2016, the Series has recorded no liability for net unrecognized tax benefits relating to uncertain income tax positions taken or expected to be taken in future tax returns.
The Series files income tax returns in the U.S. federal jurisdiction, various states and foreign jurisdictions, as required. No income tax returns are currently under investigation. The statute of limitations on the Series’ tax returns remains open for the years ended October 31, 2013 through October 31, 2016. The Series is not aware of any tax positions for which it is reasonably possible that the total amounts of unrecognized tax benefits will significantly change in the next twelve months.
Foreign Taxes
Based on the Series’ understanding of the tax rules and rates related to income, gains and currency purchase/repatriation transactions for foreign jurisdictions in which it invests, the Series will provide for foreign taxes, and where appropriate, deferred foreign tax.
Distributions of Income and Gains
Distributions to shareholders of net investment income and net realized gains are made annually. An additional distribution may be necessary to avoid taxation of the Series. Distributions are recorded on the ex-dividend date.
Indemnifications
The Fund’s organizational documents provide former and current directors and officers with a limited indemnification against liabilities arising in connection with the performance of their duties to the Fund. In the normal course of business, the Fund may also enter into contracts that provide general indemnifications. The Fund’s maximum exposure under these arrangements is unknown as this would be dependent on future claims that may be made against the Fund. The risk of material loss from such claims is considered remote.
Other
The preparation of financial statements in conformity with GAAP requires management to make estimates and assumptions that affect the reported amounts of assets and liabilities and the disclosure of contingent assets and liabilities at the date of the
16
Overseas Series
Notes to Financial Statements (continued)
| 2. | Significant Accounting Policies (continued) |
Other (continued)
financial statements and the reported amounts of income and expenses during the reporting period. Actual results could differ from those estimates.
| 3. | Transactions with Affiliates |
The Fund has an Investment Advisory Agreement (the “Agreement”) with the Advisor, for which the Series pays a fee, computed daily and payable monthly, at an annual rate of 0.70% of the Series’ average daily net assets.
Under the Agreement, personnel of the Advisor provide the Series with advice and assistance in the choice of investments and the execution of securities transactions, and otherwise maintain the Series’ organization. The Advisor also provides the Fund with necessary office space and fund administration and support services. The salaries of all officers of the Fund (except a percentage of the Fund’s Chief Compliance Officer’s salary, which is paid by the Fund), and of all Directors who are “affiliated persons” of the Fund, or of the Advisor, and all personnel of the Fund, or of the Advisor, performing services relating to research, statistical and investment activities, are paid by the Advisor. Each “non-affiliated” Director receives an annual stipend, which is allocated among all the active series of the Fund. In addition, these Directors also receive a fee per Board meeting attended plus a fee for each committee meeting attended and are reimbursed for travel and other out-of-pocket expenses incurred by them in connection with attending such meetings. The Fund also has an Audit Committee Chair, who receives an additional annual stipend for this role.
The Advisor has contractually agreed, until at least February 28, 2017, to waive its management fee and, if necessary, pay other operating expenses of the Series in order to maintain total direct annual fund operating expenses for the Series at no more than 0.75% of average daily net assets each year. For the year ended October 31, 2016, the Advisor did not waive fees or reimburse expenses for the Series. The Advisor is not eligible to recoup any expenses that have been waived or reimbursed in prior years.
Manning & Napier Investor Services, Inc., a registered broker-dealer affiliate of the Advisor, acts as distributor for the Fund’s shares. The services of Manning & Napier Investor Services, Inc. are provided at no additional cost to the Series.
Pursuant to a master services agreement dated November 1, 2014, the Fund pays the Advisor an annual fee related to fund accounting and administration of 0.0085% on the first $25 billion of average daily net assets (excluding Target Series and Strategic Income Series); 0.0075% on the next $15 billion of average daily net assets (excluding Target Series and Strategic Income Series); and 0.0065% of the average daily net assets in excess of $40 billion (excluding Target Series and Strategic Income Series); plus a base fee of $30,400 per series. Transfer agent fees are charged to the Fund on a per account basis. Additionally, certain transaction and out-of-pocket expenses, including charges for reporting relating to the Fund’s compliance program, are charged. The Advisor has agreements with BNY Mellon Investment Servicing (U.S.) Inc. (“BNY”) under which BNY serves as sub-accountant services agent and sub-transfer agent.
Expenses not directly attributable to a series are allocated based on each series’ relative net assets or number of accounts, depending on the expense.
| 4. | Purchases and Sales of Securities |
For the year ended October 31, 2016, purchases and sales of securities, other than U.S. Government securities and short-term securities, were $445,246,454 and $1,180,828,139 respectively. There were no purchases or sales of U.S. Government securities.
17
Overseas Series
Notes to Financial Statements (continued)
| 5. | Capital Stock Transactions |
Transactions in Class A shares of Overseas Series were:
FOR THE YEAR ENDED 10/31/2016 | FOR THE YEAR ENDED 10/31/2015 | |||||||||||||||
| SHARES | AMOUNT | SHARES | AMOUNT | |||||||||||||
Sold | 5,020,767 | $ | 98,878,846 | 8,589,455 | $ | 192,939,757 | ||||||||||
Reinvested | 1,253,129 | 25,137,767 | 10,511,668 | 216,435,237 | ||||||||||||
Repurchased | (42,419,827 | ) | (874,068,054 | ) | (47,346,296 | ) | (1,055,756,258 | ) | ||||||||
|
|
|
|
|
|
|
| |||||||||
Total | (36,145,931 | ) | $ | (750,051,441 | ) | (28,245,173 | ) | $ | (646,381,264 | ) | ||||||
|
|
|
|
|
|
|
| |||||||||
| 6. | Financial Instruments |
The Series may trade in instruments including written and purchased options, forward foreign currency exchange contracts and futures contracts and other derivatives in the normal course of investing activities to assist in managing exposure to various market risks. The Series may be subject to various elements of risk, which may involve, to a varying degree, elements of risk in excess of the amounts recognized for financial statement purposes. These risks include: the risk that changes in the value of a derivative may not correlate perfectly with the underlying asset, rate or index; counterparty credit risk related to over the counter derivative counterparties’ failure to perform under contract terms; liquidity risk related to the lack of a liquid market for these contracts allowing the fund to close out its position(s); and documentation risk relating to disagreement over contract terms. No such investments were held by the Series as of October 31, 2016.
| 7. | Foreign Securities |
Investing in securities of foreign companies and foreign governments involves special risks and considerations not typically associated with investing in securities of domestic companies and the U.S. Government. These risks include revaluation of currencies and future adverse political and economic developments. Moreover, securities of foreign companies and foreign governments and their markets may be less liquid and their prices more volatile than those of comparable domestic companies and the U.S. Government.
| 8. | Federal Income Tax Information |
The amount and characterization of certain income and capital gains to be distributed are determined in accordance with federal income tax regulations, which may differ from GAAP. These differences are primarily due to differing book and tax treatments in the timing of the recognition of net investment income or gains and losses, including losses deferred due to wash sales and foreign currency gains and losses. The Series may periodically make reclassifications among its capital accounts to reflect income and gains available for distribution (or available capital loss carryovers) under income tax regulations, without impacting the Series’ net asset value. For the year ended October 31, 2016, amounts were reclassified within the capital accounts to increase Additional Paid in Capital by $2,383,690, decrease Undistributed Net Investment Income by $3,001,661, and decrease Accumulated Net Realized Loss on Investments by $617,971. Any such reclassifications are not reflected in the financial highlights.
The tax character of distributions paid were as follows:
FOR THE YEAR 10/31/16 | FOR THE YEAR 10/31/15 | |||||||
Ordinary income | $ | 27,334,427 | $ | 73,208,251 | ||||
Long-term capital gains | — | 152,942,427 | ||||||
18
Overseas Series
Notes to Financial Statements (continued)
| 8. | Federal Income Tax Information (continued) |
At October 31, 2016, the tax basis of components of distributable earnings and the net unrealized depreciation based on the identified cost for federal income tax purposes were as follows:
Cost for federal income tax purposes | $ | 995,418,621 | ||
Unrealized appreciation | 63,452,986 | |||
Unrealized depreciation | (128,735,888 | ) | ||
|
| |||
Net unrealized depreciation | $ | (65,282,902 | ) | |
|
| |||
Undistributed ordinary income | $ | 14,321,898 | ||
Capital loss carryforward | $ | (148,561,739 | ) |
At October 31, 2016, the Series had net short-term capital loss carryforwards of $35,615,095 and net long-term capital loss carryforwards of $112,946,644, which may be carried forward indefinitely.
19
Overseas Series
Report of Independent Registered Public Accounting Firm
To the Board of Directors of Manning & Napier Fund, Inc. and Shareholders of Overseas Series:
In our opinion, the accompanying statement of assets and liabilities, including the investment portfolio, and the related statements of operations and of changes in net assets and the financial highlights present fairly, in all material respects, the financial position of the Overseas Series (a series of Manning & Napier Fund, Inc., hereafter referred to as the “Series”) as of October 31, 2016, the results of its operations for the year then ended, the changes in its net assets for each of the two years in the period then ended and the financial highlights for each of the five years in the period then ended, in conformity with accounting principles generally accepted in the United States of America. These financial statements and financial highlights (hereafter referred to as “financial statements”) are the responsibility of the Series’ management. Our responsibility is to express an opinion on these financial statements based on our audits. We conducted our audits of these financial statements in accordance with the standards of the Public Company Accounting Oversight Board (United States). Those standards require that we plan and perform the audit to obtain reasonable assurance about whether the financial statements are free of material misstatement. An audit includes examining, on a test basis, evidence supporting the amounts and disclosures in the financial statements, assessing the accounting principles used and significant estimates made by management, and evaluating the overall financial statement presentation. We believe that our audits, which included confirmation of securities as of October 31, 2016 by correspondence with the custodian and brokers, provide a reasonable basis for our opinion.

New York, New York
December 16, 2016
20
Overseas Series
Supplemental Tax Information
(unaudited)
All reportings are based on financial information available as of the date of this annual report and, accordingly, are subject to change.
For federal income tax purposes, the Series reports for the current fiscal year $27,504,184 or, if different, the maximum amount allowable under the tax law, as qualified dividend income.
The Series has elected to pass through to its shareholders, foreign source income of $30,643,179 and foreign taxes paid of $2,233,908 for the year ended October 31, 2016.
21
Overseas Series
Directors’ and Officers’ Information
(unaudited)
The Statement of Additional Information provides additional information about the Fund’s directors and officers and can be obtained without charge by calling 1-800-466-3863, at www.manningnapieradvisors.com, or on the EDGAR Database on the SEC Internet web site (http:// www.sec.gov). The following chart shows certain information about the Fund’s officers and directors, including their principal occupations during the last five years. Unless specific dates are provided, the individuals have held the listed positions for longer than five years.
| Interested Director/Officer | ||
| Name: | Michele T. Mosca* | |
| Address: | 290 Woodcliff Drive | |
| Fairport, NY 14450 | ||
| Age: | 44 | |
| Current Position(s) Held with Fund: | Principal Executive Officer, President, Chairman & Director | |
| Term of Office1 & Length of Time Served: | Indefinite - Chairman and Director since August 2016 | |
| Principal Occupation(s) During Past 5 Years: | Managing Director, Funds Group (2009-present) - Manning & Napier Advisors, LLC; President, Director (2015-present) - Manning & Napier Investor Services, Inc.; Chief Executive Officer, President (2016-present) - Rainier Investment Management Mutual Funds | |
| Holds or has held one or more of the following titles for various subsidiaries and affiliates: President, Director | ||
| Number of Portfolios Overseen within Fund Complex: | 40 | |
| Other Directorships Held Outside Fund Complex: | Trustee - Rainier Investment Management Mutual Funds (six portfolios) (2016 - present) | |
| Independent Directors | ||
| Name: | Stephen B. Ashley | |
| Address: | 290 Woodcliff Drive | |
| Fairport, NY 14450 | ||
| Age: | 76 | |
| Current Position(s) Held with Fund: | Director, Audit Committee Member, Governance & Nominating Committee Member | |
| Term of Office & Length of Time Served: | Indefinite - Since 1996 | |
| Principal Occupation(s) During Past 5 Years: | Chairman, Director & Chief Executive Officer (1997 to present) - The Ashley Group (property management and investment). Director (1995-2008) and Chairman (non-executive) (2004-2008) - Fannie Mae (mortgage) | |
| Number of Portfolios Overseen within Fund Complex: | 40 | |
| Other Directorships Held Outside Fund Complex: | Fannie Mae (mortgage)(1995-2008) The Ashley Group (property management and investment) (1995-2008) Genesee Corporation (holding company) (1987-2007) | |
| Name: | Paul A. Brooke | |
| Address: | 290 Woodcliff Drive | |
| Fairport, NY 14450 | ||
| Age: | 70 | |
| Current Position(s) Held with Fund: | Director, Audit Committee Member, Governance & Nominating Committee Member | |
| Term of Office & Length of Time Served: | Indefinite - Since 2007 | |
| Principal Occupation(s) During Past 5 Years: | Chairman & CEO (2005-2009) - Ithaka Acquisition Corporation (investments); Chairman (2007-2009) - Alsius Corporation (investments); Managing Member (1991-present) - PMSV Holdings LLC (investments); Managing Member (2010-present) - Venbio (investments). | |
| Number of Portfolios Overseen within Fund Complex: | 40 | |
| Other Directorships Held Outside Fund Complex: | Incyte Corp. (biotech) (2000-present) ViroPharma, Inc. (speciality pharmaceuticals) (2000-2014) HLTH Corp (WebMD) (information) (2000-2010) Cheyne Capital International (investment) (2000-present) GMP Companies (investment) (2000-2011) Cytos Biotechnology Ltd (biotechnology) (2012-present) | |
22
Overseas Series
Directors’ and Officers’ Information
(unaudited)
| Independent Directors (continued) | ||
| Name: | Peter L. Faber | |
| Address: | 290 Woodcliff Drive | |
| Fairport, NY 14450 | ||
| Age: | 78 | |
| Current Position(s) Held with Fund: | Director, Governance & Nominating Committee Member | |
| Term of Office & Length of Time Served: | Indefinite - Since 1987 | |
| Principal Occupation(s) During Past 5 Years: | Senior Counsel (2006-2012), Partner (1995-2006 & 2013-present) - McDermott, Will & Emery LLP (law firm) | |
| Number of Portfolios Overseen within Fund Complex: | 40 | |
| Other Directorships Held Outside Fund Complex: | Boston Early Music Festival (non-profit) (2007-present) Amherst Early Music, Inc. (non-profit) (2009-present) Gotham Early Music Scene, Inc. (non-profit) (2009-present) Partnership for New York City, Inc. (non-profit) (1989-2010) New York Collegium (non-profit) (2004-2011) | |
| Name: | Harris H. Rusitzky | |
| Address: | 290 Woodcliff Drive | |
| Fairport, NY 14450 | ||
| Age: | 81 | |
| Current Position(s) Held with Fund: | Director, Audit Committee Member, Governance & Nominating Committee Member | |
| Term of Office & Length of Time Served: | Indefinite - Since 1985 | |
| Principal Occupation(s) During Past 5 Years: | President (1994-present) - The Greening Group (business consultants); Partner (2006-present) - The Restaurant Group (restaurants) | |
| Number of Portfolios Overseen within Fund Complex: | 40 | |
| Other Directorships Held Outside Fund Complex: | Rochester Institute of Technology (university) (1972-present) Culinary Institute of America (non-profit college) (1985-present) George Eastman House (museum) (1988-present) National Restaurant Association (restaurant trade organization) (1978-present) | |
| Name: | Chester N. Watson | |
| Address: | 290 Woodcliff Drive | |
| Fairport, NY 14450 | ||
| Age: | 66 | |
| Current Position(s) Held with Fund: | Director, Audit Committee Chairman, Governance & Nominating Committee Member | |
| Term of Office & Length of Time Served: | Indefinite - Since 2012 | |
| Principal Occupation(s) During Past 5 Years: | General Auditor (2003-2011) - General Motors Company (auto manufacturer) | |
| Number of Portfolios Overseen within Fund Complex: | 40 | |
| Other Directorships Held Outside Fund Complex: | Rochester Institute of Technology (university) (2005-present) | |
| Officers | ||
| Name: | Jeffrey S. Coons, Ph.D., CFA® | |
| Address: | 290 Woodcliff Drive | |
| Fairport, NY 14450 | ||
| Age: | 53 | |
| Current Position(s) Held with Fund: | Vice President | |
| Term of Office1 & Length of Time Served: | Since 2004 | |
| Principal Occupation(s) During Past 5 Years: | President since 2010, Co-Director of Research (2002-2015) - Manning & Napier Advisors, LLC Holds one or more of the following titles for various subsidiaries and affiliates: President, Director, Treasurer or Senior Trust Officer. | |
| Number of Portfolios Overseen within Fund Complex: | 40 | |
| Other Directorships Held Outside Fund Complex: | N/A | |
23
Overseas Series
Directors’ and Officers’ Information
(unaudited)
| Officers (continued) | ||
| Name: | Elizabeth Craig | |
| Address: | 290 Woodcliff Drive | |
| Fairport, NY 14450 | ||
| Age: | 29 | |
| Current Position(s) Held with Fund: | Corporate Secretary | |
| Term of Office1 & Length of Time Served: | Since 2016 | |
| Principal Occupation(s) During Past 5 Years: | Fund Administration Manager since 2015; Mutual Fund Compliance Specialist (2009-2015) - Manning & Napier Advisors, LLC; Assistant Corporate Secretary (2011-2016) - Manning & Napier Fund, Inc. | |
| Number of Portfolios Overseen within Fund Complex: | 40 | |
| Other Directorships Held Outside Fund Complex: | N/A | |
| Name: | Christine Glavin | |
| Address: | 290 Woodcliff Drive | |
| Fairport, NY 14450 | ||
| Age: | 50 | |
| Current Position(s) Held with Fund: | Principal Financial Officer, Chief Financial Officer | |
| Term of Office1 & Length of Time Served: | Principal Financial Officer (2002-present); Chief Financial Officer (2001-present) | |
| Principal Occupation(s) During Past 5 Years: | Director of Fund Reporting (2011-present); Fund Reporting Manager (1997-2011) - Manning & Napier Advisors, LLC; Assistant Treasurer (2008-present)- Exeter Trust Company | |
| Number of Portfolios Overseen within Fund Complex: | 40 | |
| Other Directorships Held Outside Fund Complex: | N/A | |
| Name: | Jodi L. Hedberg | |
| Address: | 290 Woodcliff Drive | |
| Fairport, NY 14450 | ||
| Age: | 48 | |
| Current Position(s) Held with Fund: | Chief Compliance Officer, Anti-Money Laundering Compliance Officer | |
| Term of Office1 & Length of Time Served: | Chief Compliance Officer (2004-present); Anti-Money Laundering Compliance Officer (2002-present); Corporate Secretary (1997-2016) | |
| Principal Occupation(s) During Past 5 Years: | Director of Compliance (2005-present); Compliance Manager (1995-2005) - Manning & Napier Advisors, LLC and affiliates; Corporate Secretary - Manning & Napier Investor Services, Inc. since 2006 | |
| Number of Portfolios Overseen within Fund Complex: | 40 | |
| Other Directorships Held Outside Fund Complex: | N/A | |
| Name: | Amy Williams | |
| Address: | 290 Woodcliff Drive | |
| Fairport, NY 14450 | ||
| Age: | 54 | |
| Current Position(s) Held with Fund: | Assistant Corporate Secretary | |
| Term of Office1 & Length of Time Served: | Since 2016 | |
| Principal Occupation(s) During Past 5 Years: | Director of Fund Documentation (1992-present) | |
| - Manning & Napier Advisors, LLC | ||
| Holds one or more of the following titles for various affiliates; Director | ||
| Number of Portfolios Overseen within Fund Complex: | 40 | |
| Other Directorships Held Outside Fund Complex: | N/A | |
| Name: | Richard Yates | |
| Address: | 290 Woodcliff Drive | |
| Fairport, NY 14450 | ||
| Age: | 51 | |
| Current Position(s) Held with Fund: | Chief Legal Officer | |
| Term of Office1 & Length of Time Served: | Chief Legal Officer since 2004 | |
| Principal Occupation(s) During Past 5 Years: | Counsel - Manning & Napier Advisors, LLC and affiliates (2000-present); Holds one or more of the following titles for various affiliates; Director or Corporate Secretary | |
| Number of Portfolios Overseen within Fund Complex: | 40 | |
| Other Directorships Held Outside Fund Complex: | N/A | |
*Interested Director, within the meaning of the Investment Company Act of 1940 by reason of her position with the Fund’s investment advisor. Ms. Mosca serves as the Managing Director of the Funds Group for Manning & Napier Advisors, LLC.
1The term of office of all officers shall be one year and until their respective successors are chosen and qualified, or his or her earlier resignation or removal as provided in the Fund’s By-Laws.
24
{This page intentionally left blank}
25
Overseas Series
Literature Requests
Proxy Voting Policies and Procedures
A description of the policies and procedures that the Fund uses to determine how to vote proxies relating to portfolio securities is available, without charge, upon request:
| By phone | 1-800-466-3863 | |||
| On the Securities and Exchange | ||||
| Commission’s (SEC) web site | http://www.sec.gov |
Proxy Voting Record
Information regarding how the Fund voted proxies relating to portfolio securities during the most recent 12-month period ended June 30th is available, without charge, upon request:
| By phone | 1-800-466-3863 | |||
| On the SEC’s web site | http://www.sec.gov |
Quarterly Portfolio Holdings
The Series’ complete schedule of portfolio holdings for the 1st and 3rd quarters of each fiscal year are provided on Form N-Q, and are available, without charge, upon request:
| By phone | 1-800-466-3863 | |||
| On the SEC’s web site | http://www.sec.gov |
The Series’ Form N-Q may be reviewed and copied at the SEC’s Public Reference Room in Washington, D.C. Information on the operation of the Public Reference Room may be obtained by calling 1-800-SEC-0330.
Prospectus and Statement of Additional Information (SAI)
For more information about any of the Manning & Napier Fund, Inc. Series, you may obtain a prospectus and SAI at www.manning-napier.com or by calling (800) 466-3863. Before investing, carefully consider the objectives, risks, charges and expenses of the investment and read the prospectus carefully as it contains this and other information about the investment company. In addition, this information can be found on the SEC’s web site, http://www.sec.gov.
Additional information available at www.manning-napier.com
1. Fund Holdings - Month-End
2. Fund Holdings - Quarter-End
3. Shareholder Report - Annual
4. Shareholder Report - Semi-Annual
The Fund also offers electronic notification or “e-delivery” when certain documents are available on-line to be downloaded or reviewed. Direct shareholders can elect to receive electronic notification when shareholder reports, prospectus updates, and/or statements are available. If you do not currently have on-line access to your account, you can establish access by going to www.manning-napier.com, click on “Login” in the top corner of the page, and follow the prompts to self-enroll. Once enrolled, you can set your electronic notification preferences by clicking on the Account Options tab located within the green toolbar and then select E-Delivery Option. Should you have any questions on either how to establish on-line access or how to update your account settings, please contact Investor Services at 1-800-466-3863.
The Manning & Napier Fund, Inc. is managed by Manning & Napier Advisors, LLC. Manning & Napier Investor Services, Inc., an affiliate of Manning & Napier Advisors, LLC, is the distributor of the Fund shares.
MNOVS-10/16-AR
Management Discussion and Analysis
(unaudited)
Dear Shareholders:
U.S. and international equity markets delivered positive returns during the past year. Emerging market equities were the notable outperformers, driven by investors’ search for yield and their increased appetite for riskier assets. Abating unease related to Chinese growth, a relatively stable U.S. dollar, the year-to-date upturn in commodity prices, and increased liquidity amid generally easy policy across the globe also provided tailwinds for emerging market assets. Defensive sectors outperformed cyclicals for most of the period, since defensive securities tend to benefit from low interest rate environments and yield is a big component of total return. But the trend reversed amid a mid-year rotation away from crowded defensive sectors into cyclical stocks, and investors have since shown a preference for growth over yield.
Meanwhile, U.S. and global economic growth continued at a slow pace. Although various asset classes performed positively, the year was punctuated by bouts of market volatility. Ongoing concern regarding the price of oil and other commodities, speculation surrounding the trajectory of global economic growth and central bank policy, and political uncertainty — including the unexpected Brexit vote — fueled investor unease and served as volatility catalysts. Going forward, we anticipate an increased likelihood of further gyrations in financial markets as U.S. and global economic growth continues at a muted pace.
Enclosed, we highlight how we are positioned amid the current economic environment, and provide our outlook of what to expect in financial markets. We hope that you find this information to be helpful.
As always, we appreciate your business.
Sincerely,
Manning & Napier Advisors, LLC
1
Fund Commentary
(unaudited)
Investment Objective
The Pro-Blend® Series are strategically allocated across stocks, bonds, and cash to balance growth, capital preservation, and income to fit a range of investor risk management priorities.
Performance Commentary
U.S. equity markets generally delivered positive absolute returns for the twelve-month period ended October 31, 2016. The S&P 500 Index gained 4.48% while the Russell 3000 Index earned 4.24%. International equity markets generally delivered modestly positive absolute returns, with the broad MSCI All Country World ex U.S. Index (ACWIxUS) returning 0.22%. Meanwhile, bond markets as represented by the Bloomberg Barclays U.S. Aggregate Bond Index were positive, returning 4.37%. Each of the Pro-Blend® Series — that is, the Maximum Term, Extended Term, Moderate Term, and Conservative Term — delivered positive absolute returns but underperformed its blended benchmark during the one-year period with the exception of the Pro-Blend® Maximum Term Series Class I, which outperformed its blended benchmark. Despite the near-term relative underperformance, each Pro-Blend® Series continues to provide competitive absolute and relative returns over the current U.S. stock market cycle. The cycle includes a prolonged bear market from April 2000 to February 2009, a recovery, and the current bull market. Since the cycle began, each Series has outperformed its respective blended benchmark with the exception of the Pro-Blend® Conservative and Moderate Term Series Class C.
During the past year, each Series’ underweight to longer-dated nominal (i.e., not adjusted for inflation) Treasuries compared to the blended benchmark was a headwind to relative performance. Each Series’ shorter fixed income duration compared to the blended benchmark also challenged relative returns, as U.S. interest rates generally declined, which benefitted longer-duration fixed income securities. Additionally, the Series’ allocation to managed futures provided a headwind to relative performance in each Series that contained exposure to the managed futures strategy (managed futures were removed from each applicable Series during the first quarter of 2016). Stock selection in Materials and Real Estate also challenged relative returns.
Offsetting a portion of the relative performance headwind was the aggregate effect of stock selection, which aided relative returns. This was primarily driven by strong stock selection in Health Care. Each Series’ overweight to Information Technology compared to the blended benchmark aided relative returns as well.
In regard to current portfolio positioning, the equity portion of the Series is concentrated in companies with growth drivers that are not tied to the broad economy. We believe the key to generating attractive returns in the prevailing environment is the ability to identify individual businesses that can innovate and disrupt their competitive landscape. We are looking for businesses that are generating growth by creating new markets, expanding existing markets, or simply taking market share from their rivals. The goal is to identify companies trading at attractive valuations relative to their growth potential.
With regard to fixed income, we continue to maintain a sizeable allocation to corporate bonds but remain mindful that we are in the seventh year of economic expansion and valuations are not as compelling as they were previously. High yield bond spreads have tightened since we increased exposure to the sector in August 2015 (narrowing spreads indicate improved confidence in creditworthiness). As a result, we capitalized on market strength and trimmed high yield bond exposure during the third quarter of 2016, using the proceeds to increase our holdings of short- and intermediate-term nominal Treasuries. We also sold some AAA-rated commercial mortgage-backed securities during the third quarter, as valuations had become expensive. The proceeds were used to purchase comparable-duration Agency securities. The portfolios continue to have a notable allocation to Treasury Inflation-Protected Securities (TIPS) as well.
As we look toward 2017, we expect global economic growth to persist at a slow pace. Broadly speaking, valuations in the developed world are on the expensive side of neutral, whereas valuations in select emerging markets are relatively more attractive. The current backdrop suggests muted long-term returns going forward, so we are targeting companies exposed to secular (i.e., long-term) growth trends in an effort to generate above market returns. We continue to anticipate gyrations in equity markets due to catalysts such as the potential for global growth to deviate from expectations, diverging central bank policies, commodity price pressures, and geopolitical risks. However, our indicators point to volatility still being a buying opportunity and do not suggest capital risk is a significant near-term concern. In this environment, an active, flexible, and selective approach can help avoid overvalued areas of the market, tactics that Manning & Napier has employed for over 45 years as an active investment manager.
2
Fund Commentary
(unaudited)
Performance Commentary (continued)
Performance data quoted represents past performance and does not guarantee future results. The investment return and principal value of an investment will fluctuate, so that an investor’s shares, when redeemed, may be worth more or less than their original cost. Current performance may be higher or lower than that quoted; investors can obtain the most recent month-end performance at www.manning-napier.com or by calling (800) 593-4353.
All investments involve risks, including possible loss of principal. Because the fund invests in both stocks and bonds, the value of your investment will fluctuate in response to stock market movements and changes in interest rates. Investing in the fund will also involve a number of other risks, including issuer-specific risk, foreign investment risk, and small-cap/mid-cap risk. Investments in options and futures, like all derivatives, can be highly volatile and involve risks in addition to the risks of the underlying instrument on which the derivative is based, such as counterparty, correlation and liquidity risk. Also, the use of leverage increases exposure to the market and may magnify potential losses.
3
Performance Update as of October 31, 2016 - Pro-Blend® Conservative Term Series
(unaudited)
| AVERAGE ANNUAL TOTAL RETURNS AS OF OCTOBER 31, 2016 | ||||||||
| ONE YEAR1 | FIVE YEAR | TEN YEAR | SINCE INCEPTION2 | |||||
Manning & Napier Fund, Inc. - Pro-Blend® Conservative Term | ||||||||
Series - Class S3 | 3.07% | 4.40% | 4.71% | 5.64% | ||||
Manning & Napier Fund, Inc. - Pro-Blend® Conservative Term | ||||||||
Series - Class I3,4 | 3.26% | 4.60% | 4.87% | 5.72% | ||||
Manning & Napier Fund, Inc. - Pro-Blend® Conservative Term | ||||||||
Series - Class C3,5 | 2.24% | 3.58% | 3.90% | 4.86% | ||||
Manning & Napier Fund, Inc. - Pro-Blend® Conservative Term | ||||||||
Series - Class R3,5 | 2.79% | 4.10% | 4.44% | 5.40% | ||||
Bloomberg Barclays U.S. Intermediate Aggregate Bond Index6 | 3.24% | 2.44% | 4.24% | 5.10% | ||||
Conservative Term Composite Benchmark7 | 3.36% | 5.02% | 5.14% | 6.07% | ||||
The following graph compares the value of a $10,000 investment in the Manning & Napier Fund, Inc. - Pro-Blend® Conservative Term Series - Class S for the ten years ended October 31, 2016 to the Bloomberg Barclays U.S. Intermediate Aggregate Bond Index and Conservative Term Composite Benchmark.
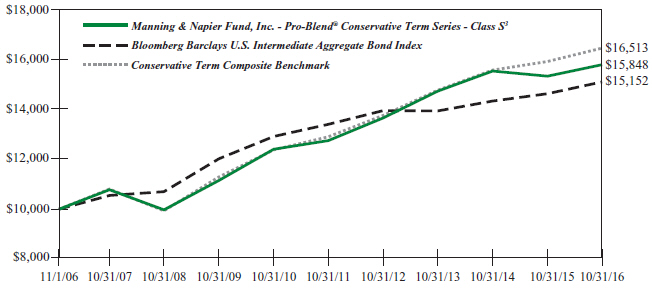
1The returns shown are based on net asset values calculated for shareholder transactions and may differ from the returns shown in the financial highlights, which reflect adjustments made to the net asset values in accordance with accounting principles generally accepted in the United States of America.
2Performance numbers for the Series and Indices are calculated from November 1, 1995, the Class S inception date.
3The Series’ performance does not reflect the deduction of taxes that a shareholder would pay on fund distributions or the redemption of shares. The Series’ performance is historical and may not be indicative of future results. The performance returns shown are inclusive of the net expense ratio of the Series. For the year ended October 31, 2016, this net expense ratio was 0.87% for Class S, 0.67% for Class I, 1.67% for Class C and 1.17% for Class R. The gross expense ratio, which does not account for any voluntary or contractual waivers currently in effect, was 0.87% for Class S, 0.67% for Class I, 1.67% for Class C and 1.17% for Class R for the year ended October 31, 2016.
4For the periods through the inception of Class I on March 28, 2008, performance is based on the hypothetical performance of Class S shares. Because Class I shares invest in the same portfolio of securities as Class S, performance will only be different to the extent that the Class S shares have a higher expense ratio.
5For periods through the inception of Class C on January 4, 2010 and Class R on June 30, 2010, the performance figures are hypothetical and reflect the performance of the Manning & Napier Fund, Inc.
- Pro-Blend® Conservative Term Series - Class S adjusted for expense differences.
4
Performance Update as of October 31, 2016 - Pro-Blend® Conservative Term Series
(unaudited)
6The Bloomberg Barclays U.S Intermediate Aggregate Bond Index is an unmanaged, market-value weighted index of U.S. domestic investment-grade debt issues, including government, corporate, asset-backed and mortgage-backed securities, with maturities greater than one year but less than ten years. Index returns do not reflect any fees or expenses. Index returns provided by Interactive Data.
7The Conservative Term Composite Benchmark is a blend of the Russell 3000® Index (Russell 3000), MSCI ACWI ex USA Index (ACWIxUS), and Bloomberg Barclays U.S. Intermediate Aggregate Bond Index (BIAB) in the following weightings: 15% Russell 3000, 5% ACWIxUS, and 80% BIAB through 05/31/2012; and 22% Russell 3000, 8% ACWIxUS, and 70% BIAB beginning 06/01/2012. Russell 3000 is an unmanaged index that consists of 3,000 of the largest U.S. companies based on total market capitalization. Index returns are based on a market capitalization-weighted average of relative price changes of the component stocks plus dividends whose reinvestments are compounded daily. Index returns provided by Bloomberg. ACWIxUS is a free float-adjusted market capitalization index that is designed to measure equity market performance in the global developed and emerging markets and consists of 45 developed and emerging market country indices outside the U.S. The Index is denominated in U.S. dollars. The Index returns assume daily investment of gross dividends (which do not account for applicable dividend taxation) prior to 12/31/1998, as net returns were not available. Subsequent to 12/31/1998, the Index returns are net of withholding taxes. They assume daily reinvestment of net dividends, thus accounting for any applicable dividend taxation. Index returns provided by Bloomberg. BIAB is an unmanaged, market value-weighted index of U.S. domestic investment-grade debt issues, including government, corporate, asset-backed, and mortgage-backed securities with maturities of greater than one year but less than ten years. Index returns provided by Interactive Data. The returns of the indices do not reflect any fees or expenses. Returns provided are calculated monthly using a blended allocation. Because the Series’ asset allocation will vary over time, the composition of the Series’ portfolio may not match the composition of the Conservative Term Composite Benchmark.
5
Shareholder Expense Example - Pro-Blend® Conservative Term Series
(unaudited)
As a shareholder of the Series, you incur ongoing costs, including management fees, shareholder service fees and other Series expenses. This example is intended to help you understand your ongoing costs (in dollars) of investing in the Series and to compare these costs with the ongoing costs of investing in other mutual funds.
The example is based on an investment of $1,000 invested in each class at the beginning of the period and held for the entire period (May 1, 2015 to October 31, 2016).
Actual Expenses
The Actual lines of the table below provide information about actual account values and actual expenses. You may use the information in these lines, together with the amount you invested, to estimate the expenses that you paid over the period. Simply divide your account value by $1,000 (for example, an $8,600 account value divided by $1,000 = 8.6), then multiply the result by the number in the Actual line for the Class in which you have invested under the heading entitled “Expenses Paid During Period” to estimate the expenses you paid on your account during this period.
Hypothetical Example for Comparison Purposes
The Hypothetical lines of each class in the table below provide information about hypothetical account values and hypothetical expenses based on the Class’ actual expense ratio and an assumed rate of return of 5% per year before expenses, which is not the Class’ actual return. The hypothetical account values and expenses may not be used to estimate the actual ending account balance or expenses you paid during the period. You may use this information to compare the ongoing costs of investing in a class of the Series and other funds. To do so, compare this 5% hypothetical example for the Class in which you have invested with the 5% hypothetical examples that appear in the shareholder reports of the other funds.
Please note that the expenses shown in the table are meant to highlight your ongoing costs only and do not reflect any transaction costs such as sales charges (loads), redemption fees, or exchange fees that you may incur in other mutual funds. Therefore, the second line of the table is useful in comparing ongoing costs only, and will not help you determine the relative total costs of owning different funds.
BEGINNING ACCOUNT VALUE 5/1/16 | ENDING ACCOUNT VALUE 10/31/16 | EXPENSES PAID DURING PERIOD 5/1/16-10/31/16* | ANNUALIZED EXPENSE RATIO | |||||
Class S | ||||||||
Actual | $1,000.00 | $1,021.20 | $4.32 | 0.85% | ||||
Hypothetical (5% return before expenses) | $1,000.00 | $1,020.86 | $4.32 | 0.85% | ||||
Class I | ||||||||
Actual | $1,000.00 | $1,021.70 | $3.30 | 0.65% | ||||
Hypothetical (5% return before expenses) | $1,000.00 | $1,021.87 | $3.30 | 0.65% | ||||
Class C | ||||||||
Actual | $1,000.00 | $1,017.10 | $8.37 | 1.65% | ||||
Hypothetical (5% return before expenses) | $1,000.00 | $1,016.84 | $8.36 | 1.65% | ||||
Class R | ||||||||
Actual | $1,000.00 | $1,019.80 | $5.79 | 1.14% | ||||
Hypothetical (5% return before expenses) | $1,000.00 | $1,019.41 | $5.79 | 1.14% |
*Expenses are equal to the Class’ annualized expense ratio (for the six-month period), multiplied by the average account value over the period, multiplied by 184/366 to reflect the one-half year period. Expenses are based on the most recent fiscal half year; therefore, the expense ratios stated above may differ from the expense ratios stated in the financial highlights, which are based on one-year data.
6
Portfolio Composition - Pro-Blend® Conservative Term Series
As of October 31, 2016 (unaudited)
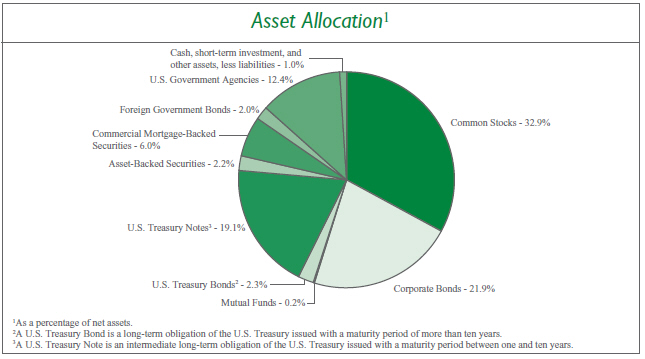
Sector Allocation4 |
| |||
Information Technology | 10.7 | % | ||
Financials | 8.6 | % | ||
Consumer Discretionary | 7.3 | % | ||
Energy | 5.1 | % | ||
Industrials | 5.1 | % | ||
Health Care | 4.4 | % | ||
Consumer Staples | 4.2 | % | ||
Real Estate | 4.1 | % | ||
Materials | 3.7 | % | ||
Telecommunication Services | 1.5 | % | ||
Utilities | 0.2 | % | ||
4Including common stocks and corporate bonds, as a percentage of total investments. | ||||
Top Five Stock Holdings5 |
| |||
Johnson & Johnson | 1.0 | % | ||
Cerner Corp. | 0.9 | % | ||
Monsanto Co. | 0.9 | % | ||
Facebook, Inc. - Class A | 0.9 | % | ||
Microsoft Corp. | 0.9 | % | ||
| 5As a percentage of total investments. | ||||
Top Five Bond Holdings6 |
| |||
U.S. Treasury Note, 0.75%, 4/15/2018 | 4.4 | % | ||
U.S. Treasury Note, 1.75%, 4/30/2022 | 4.4 | % | ||
U.S. Treasury Note, 1.375%, 04/30/2020 | 4.3 | % | ||
U.S. Treasury Inflation Indexed Note, 0.125%, 04/15/2017 | 2.0 | % | ||
U.S. Treasury Inflation Indexed Note, 0.125%, 04/15/2020 | 1.8 | % | ||
| 6As a percentage of total investments. | ||||
7
Investment Portfolio - October 31, 2016
| PRO-BLEND® CONSERVATIVE TERM SERIES | SHARES | VALUE (NOTE 2) | ||||||
COMMON STOCKS - 32.9% | ||||||||
Consumer Discretionary - 5.7% | ||||||||
Automobiles - 0.1% | ||||||||
Honda Motor Co., Ltd. - ADR (Japan) | 22,807 | $ | 680,333 | |||||
|
| |||||||
Hotels, Restaurants & Leisure - 0.5% | ||||||||
Accor S.A. (France)1 | 3,920 | 148,750 | ||||||
Yum! Brands, Inc. | 61,890 | 5,339,869 | ||||||
|
| |||||||
| 5,488,619 | ||||||||
|
| |||||||
Household Durables - 0.0%## | ||||||||
LGI Homes, Inc.* | 6,620 | 197,011 | ||||||
|
| |||||||
Internet & Direct Marketing Retail - 1.6% | ||||||||
Amazon.com, Inc.* | 10,130 | 8,000,877 | ||||||
The Priceline Group, Inc.* | 5,600 | 8,255,688 | ||||||
TripAdvisor, Inc.*2 | 35,360 | 2,280,013 | ||||||
|
| |||||||
| 18,536,578 | ||||||||
|
| |||||||
Media - 2.3% | ||||||||
Cinemark Holdings, Inc. | 25,540 | 1,016,492 | ||||||
ITV plc (United Kingdom)1 | 827,440 | 1,725,012 | ||||||
Liberty Global plc - Class A - ADR (United Kingdom)* | 167,790 | 5,469,954 | ||||||
Time Warner, Inc. | 78,950 | 7,025,760 | ||||||
Tribune Media Co. - Class A | 136,240 | 4,441,424 | ||||||
Twenty-First Century Fox, Inc. - Class A2 | 259,470 | 6,816,277 | ||||||
|
| |||||||
| 26,494,919 | ||||||||
|
| |||||||
Multiline Retail - 0.2% | ||||||||
Dollar General Corp. | 17,130 | 1,183,512 | ||||||
Macy’s, Inc. | 15,786 | 576,031 | ||||||
Target Corp. | 9,638 | 662,420 | ||||||
|
| |||||||
| 2,421,963 | ||||||||
|
| |||||||
Specialty Retail - 0.6% | ||||||||
DSW, Inc. - Class A | 28,331 | 588,435 | ||||||
The Home Depot, Inc. | 16,661 | 2,032,809 | ||||||
Kingfisher plc (United Kingdom)1 | 663,050 | 2,928,983 | ||||||
L Brands, Inc. | 8,550 | 617,224 | ||||||
Staples, Inc. | 92,130 | 681,762 | ||||||
Williams-Sonoma, Inc. | 14,758 | 682,115 | ||||||
|
| |||||||
| 7,531,328 | ||||||||
|
| |||||||
Textiles, Apparel & Luxury Goods - 0.4% | ||||||||
lululemon athletica, Inc.* | 92,120 | 5,273,870 | ||||||
|
| |||||||
Total Consumer Discretionary | 66,624,621 | |||||||
|
| |||||||
Consumer Staples - 2.7% | ||||||||
Beverages - 1.5% | ||||||||
Ambev S.A. - ADR (Brazil) | 951,830 | 5,615,797 | ||||||
Anheuser-Busch InBev S.A./N.V. (Belgium)1 | 35,020 | 4,019,256 | ||||||
Diageo plc (United Kingdom)1 | 201,586 | 5,365,544 | ||||||
PepsiCo, Inc. | 21,338 | 2,287,434 | ||||||
|
| |||||||
| 17,288,031 | ||||||||
|
| |||||||
Food & Staples Retailing - 0.2% | ||||||||
Wal-Mart Stores, Inc. | 37,667 | 2,637,443 | ||||||
|
| |||||||
Food Products - 0.1% | ||||||||
General Mills, Inc. | 11,499 | 712,708 | ||||||
J&J Snack Foods Corp. | 6,292 | 768,568 | ||||||
|
| |||||||
| 1,481,276 | ||||||||
|
| |||||||
Household Products - 0.4% | ||||||||
Colgate-Palmolive Co. | 13,840 | 987,622 | ||||||
Kimberly-Clark Corp. | 5,193 | 594,131 | ||||||
The Procter & Gamble Co. | 30,989 | 2,689,845 | ||||||
|
| |||||||
| 4,271,598 | ||||||||
|
| |||||||
Personal Products - 0.5% | ||||||||
Unilever plc - ADR (United Kingdom) | 134,577 | 5,607,824 | ||||||
|
| |||||||
Total Consumer Staples | 31,286,172 | |||||||
|
| |||||||
Energy - 1.6% | ||||||||
Energy Equipment & Services - 0.6% | ||||||||
Schlumberger Ltd. | 84,300 | 6,594,789 | ||||||
|
| |||||||
Oil, Gas & Consumable Fuels - 1.0% | ||||||||
BP plc - ADR (United Kingdom) | 42,619 | 1,515,106 | ||||||
Chevron Corp. | 14,486 | 1,517,408 | ||||||
ConocoPhillips | 11,385 | 494,678 | ||||||
Exxon Mobil Corp. | 25,903 | 2,158,238 | ||||||
Hess Corp. | 7,811 | 374,694 | ||||||
Occidental Petroleum Corp. | 14,507 | 1,057,705 | ||||||
Range Resources Corp. | 111,630 | 3,771,978 | ||||||
Royal Dutch Shell plc - Class B - ADR (Netherlands) | 12,620 | 660,152 | ||||||
TOTAL S.A. (France)1 | 9,918 | 475,123 | ||||||
|
| |||||||
| 12,025,082 | ||||||||
|
| |||||||
Total Energy | 18,619,871 | |||||||
|
| |||||||
Financials - 1.7% | ||||||||
Banks - 1.1% | ||||||||
Bank of America Corp. | 44,105 | 727,732 | ||||||
Citigroup, Inc. | 29,748 | 1,462,114 | ||||||
JPMorgan Chase & Co. | 55,201 | 3,823,221 | ||||||
KeyCorp. | 53,753 | 758,992 | ||||||
The PNC Financial Services Group, Inc. | 11,237 | 1,074,257 | ||||||
The accompanying notes are an integral part of the financial statements.
8
Investment Portfolio - October 31, 2016
| PRO-BLEND® CONSERVATIVE TERM SERIES | SHARES | VALUE (NOTE 2) | ||||||
COMMON STOCKS (continued) | ||||||||
Financials (continued) | ||||||||
Banks (continued) | ||||||||
U.S. Bancorp | 38,395 | $ | 1,718,560 | |||||
Wells Fargo & Co. | 68,469 | 3,150,259 | ||||||
|
| |||||||
| 12,715,135 | ||||||||
|
| |||||||
Capital Markets - 0.5% | ||||||||
Apollo Investment Corp. | 35,041 | 207,092 | ||||||
Ares Capital Corp. | 14,722 | 225,247 | ||||||
BlackRock, Inc. | 13,980 | 4,770,535 | ||||||
Fifth Street Finance Corp. | 36,866 | 198,708 | ||||||
Medley Capital Corp. | 27,285 | 205,729 | ||||||
PennantPark Investment Corp. | 26,404 | 198,822 | ||||||
Prospect Capital Corp. | 33,175 | 261,751 | ||||||
Thomson Reuters Corp. | 14,404 | 567,662 | ||||||
|
| |||||||
| 6,635,546 | ||||||||
|
| |||||||
Insurance - 0.1% | ||||||||
Principal Financial Group, Inc. | 17,416 | 950,914 | ||||||
|
| |||||||
Total Financials | 20,301,595 | |||||||
|
| |||||||
Health Care - 4.0% | ||||||||
Biotechnology - 0.2% | ||||||||
AbbVie, Inc. | 17,513 | 976,875 | ||||||
Amgen, Inc. | 7,556 | 1,066,605 | ||||||
|
| |||||||
| 2,043,480 | ||||||||
|
| |||||||
Health Care Equipment & Supplies - 0.7% | ||||||||
Abbott Laboratories | 18,632 | 731,121 | ||||||
Medtronic plc | 92,760 | 7,608,175 | ||||||
|
| |||||||
| 8,339,296 | ||||||||
|
| |||||||
Health Care Providers & Services - 0.3% | ||||||||
Brookdale Senior Living, Inc.* | 6,230 | 89,899 | ||||||
Express Scripts Holding Co.*2 | 53,200 | 3,585,680 | ||||||
|
| |||||||
| 3,675,579 | ||||||||
|
| |||||||
Health Care Technology - 1.0% | ||||||||
Cerner Corp.* | 185,490 | 10,866,004 | ||||||
|
| |||||||
Pharmaceuticals - 1.8% | ||||||||
Eli Lilly & Co. | 7,747 | 572,038 | ||||||
Johnson & Johnson | 100,379 | 11,642,960 | ||||||
Merck & Co., Inc. | 41,949 | 2,463,245 | ||||||
Perrigo Co. plc | 10,351 | 861,100 | ||||||
Pfizer, Inc. | 69,948 | 2,218,051 | ||||||
Roche Holding AG (Switzerland)1 | 2,652 | 609,116 | ||||||
Sanofi (France)1 | 9,203 | 716,170 | ||||||
Sanofi - ADR (France) | 32,407 | 1,260,308 | ||||||
Teva Pharmaceutical Industries Ltd. - ADR (Israel) | 14,733 | 629,688 | ||||||
|
| |||||||
| 20,972,676 | ||||||||
|
| |||||||
Total Health Care | 45,897,035 | |||||||
|
| |||||||
Industrials - 2.7% | ||||||||
Aerospace & Defense - 0.7% | ||||||||
The Boeing Co. | 9,254 | 1,318,048 | ||||||
General Dynamics Corp. | 5,408 | 815,202 | ||||||
Lockheed Martin Corp. | 4,753 | 1,171,044 | ||||||
Raytheon Co. | 5,307 | 724,989 | ||||||
Safran S.A. (France)1 | 50,610 | 3,482,558 | ||||||
United Technologies Corp. | 11,088 | 1,133,194 | ||||||
|
| |||||||
| 8,645,035 | ||||||||
|
| |||||||
Air Freight & Logistics - 0.2% | ||||||||
United Parcel Service, Inc. - Class B | 20,387 | 2,196,903 | ||||||
|
| |||||||
Commercial Services & Supplies - 0.1% | ||||||||
Covanta Holding Corp. | 42,090 | 631,350 | ||||||
Waste Management, Inc. | 10,141 | 665,858 | ||||||
|
| |||||||
| 1,297,208 | ||||||||
|
| |||||||
Electrical Equipment - 0.1% | ||||||||
ABB Ltd. (Asea Brown Boveri) - ADR (Switzerland) | 37,600 | 776,441 | ||||||
Emerson Electric Co. | 12,186 | 617,586 | ||||||
|
| |||||||
| 1,394,027 | ||||||||
|
| |||||||
Industrial Conglomerates - 0.4% | ||||||||
3M Co. | 14,694 | 2,428,918 | ||||||
General Electric Co. | 47,461 | 1,381,115 | ||||||
Honeywell International, Inc. | 5,766 | 632,415 | ||||||
|
| |||||||
| 4,442,448 | ||||||||
|
| |||||||
Machinery - 0.5% | ||||||||
Caterpillar, Inc. | 9,923 | 828,174 | ||||||
Flowserve Corp. | 79,921 | 3,384,654 | ||||||
Illinois Tool Works, Inc. | 6,483 | 736,274 | ||||||
Pentair plc (United Kingdom) | 8,872 | 489,113 | ||||||
|
| |||||||
| 5,438,215 | ||||||||
|
| |||||||
Professional Services - 0.5% | ||||||||
Nielsen Holdings plc | 129,973 | 5,851,384 | ||||||
|
| |||||||
Road & Rail - 0.2% | ||||||||
Kansas City Southern | 12,534 | 1,099,984 | ||||||
The accompanying notes are an integral part of the financial statements.
9
Investment Portfolio - October 31, 2016
| PRO-BLEND® CONSERVATIVE TERM SERIES | SHARES | VALUE (NOTE 2) | ||||||
COMMON STOCKS (continued) | ||||||||
Industrials (continued) | ||||||||
Road & Rail (continued) | ||||||||
Union Pacific Corp. | 16,675 | $ | 1,470,402 | |||||
|
| |||||||
| 2,570,386 | ||||||||
|
| |||||||
Total Industrials | 31,835,606 | |||||||
|
| |||||||
Information Technology - 8.9% | ||||||||
Communications Equipment - 0.2% | ||||||||
Cisco Systems, Inc. | 55,441 | 1,700,930 | ||||||
Telefonaktiebolaget LM Ericsson - ADR (Sweden) | 72,750 | 354,292 | ||||||
|
| |||||||
| 2,055,222 | ||||||||
|
| |||||||
Internet Software & Services - 1.6% | ||||||||
Alphabet, Inc. - Class A* | 4,690 | 3,798,431 | ||||||
Alphabet, Inc. - Class C* | 6,560 | 5,146,582 | ||||||
Facebook, Inc. - Class A* | 80,010 | 10,480,510 | ||||||
|
| |||||||
| 19,425,523 | ||||||||
|
| |||||||
IT Services - 2.0% | ||||||||
Automatic Data Processing, Inc. | 8,003 | 696,741 | ||||||
Broadridge Financial Solutions, Inc. | 8,976 | 580,388 | ||||||
International Business Machines Corp. | 10,807 | 1,660,928 | ||||||
InterXion Holding N.V. - ADR (Netherlands)* | 8,400 | 312,732 | ||||||
MasterCard, Inc. - Class A2 | 94,360 | 10,098,407 | ||||||
PayPal Holdings, Inc.* | 97,330 | 4,054,768 | ||||||
Visa, Inc. - Class A2 | 67,750 | 5,590,052 | ||||||
|
| |||||||
| 22,994,016 | ||||||||
|
| |||||||
Semiconductors & Semiconductor Equipment - 1.7% | ||||||||
Intel Corp. | 55,872 | 1,948,257 | ||||||
QUALCOMM, Inc. | 115,884 | 7,963,548 | ||||||
Skyworks Solutions, Inc. | 88,920 | 6,841,505 | ||||||
Taiwan Semiconductor Manufacturing Co. Ltd. - ADR (Taiwan) | 51,800 | 1,610,980 | ||||||
Texas Instruments, Inc. | 15,836 | 1,121,981 | ||||||
|
| |||||||
| 19,486,271 | ||||||||
|
| |||||||
Software - 2.5% | ||||||||
Electronic Arts, Inc.* | 109,610 | 8,606,577 | ||||||
Microsoft Corp. | 172,428 | 10,331,886 | ||||||
ServiceNow, Inc.* | 111,410 | 9,794,053 | ||||||
|
| |||||||
| 28,732,516 | ||||||||
|
| |||||||
Technology Hardware, Storage & Peripherals - 0.9% | ||||||||
Apple, Inc. | 87,849 | 9,974,375 | ||||||
Canon, Inc. - ADR (Japan) | 23,148 | 664,811 | ||||||
|
| |||||||
| 10,639,186 | ||||||||
|
| |||||||
Total Information Technology | 103,332,734 | |||||||
|
| |||||||
Materials - 2.7% | ||||||||
Chemicals - 1.9% | ||||||||
Akzo Nobel N.V. (Netherlands)1 | 13,430 | 867,731 | ||||||
Ashland Global Holdings, Inc. | 62,170 | 6,946,254 | ||||||
The Dow Chemical Co. | 8,823 | 474,766 | ||||||
E.I. du Pont de Nemours & Co. | 6,857 | 471,693 | ||||||
FMC Corp. | 13,450 | 630,670 | ||||||
LyondellBasell Industries N.V. - Class A | 7,323 | 582,545 | ||||||
Monsanto Co. | 104,527 | 10,533,186 | ||||||
Praxair, Inc. | 5,055 | 591,738 | ||||||
RPM International, Inc. | 19,556 | 929,692 | ||||||
|
| |||||||
| 22,028,275 | ||||||||
|
| |||||||
Containers & Packaging - 0.3% | ||||||||
Bemis Co., Inc. | 18,536 | 903,074 | ||||||
Graphic Packaging Holding Co. | 49,696 | 621,200 | ||||||
Sealed Air Corp. | 30,050 | 1,371,182 | ||||||
Sonoco Products Co. | 8,677 | 436,366 | ||||||
|
| |||||||
| 3,331,822 | ||||||||
|
| |||||||
Metals & Mining - 0.5% | ||||||||
Arconic, Inc. | 193,993 | 5,571,479 | ||||||
|
| |||||||
Total Materials | 30,931,576 | |||||||
|
| |||||||
Real Estate - 2.7% | ||||||||
Equity Real Estate Investment Trusts (REITS) - 2.5% | ||||||||
Agree Realty Corp. | 8,620 | 416,778 | ||||||
Alexandria Real Estate Equities, Inc. | 3,800 | 409,679 | ||||||
American Campus Communities, Inc. | 5,950 | 310,055 | ||||||
American Homes 4 Rent - Class A | 15,800 | 333,539 | ||||||
Apartment Investment & Management Co. - Class A | 9,020 | 397,512 | ||||||
AvalonBay Communities, Inc. | 3,090 | 528,946 | ||||||
Axiare Patrimonio SOCIMI S.A. (Spain)1 | 7,920 | 112,522 | ||||||
Boston Properties, Inc. | 2,150 | 259,032 | ||||||
Brandywine Realty Trust | 18,980 | 294,190 | ||||||
Brixmor Property Group, Inc. | 7,400 | 188,108 | ||||||
CatchMark Timber Trust, Inc. - Class A | 72,386 | 762,948 | ||||||
Chesapeake Lodging Trust | 14,270 | 309,802 | ||||||
The accompanying notes are an integral part of the financial statements.
10
Investment Portfolio - October 31, 2016
| PRO-BLEND® CONSERVATIVE TERM SERIES | SHARES | VALUE (NOTE 2) | ||||||
COMMON STOCKS (continued) | ||||||||
Real Estate (continued) | ||||||||
Equity Real Estate Investment Trusts (REITS) (continued) | ||||||||
Colony Starwood Homes | 27,610 | $ | 800,966 | |||||
Columbia Property Trust, Inc. | 7,630 | 160,840 | ||||||
Community Healthcare Trust, Inc. | 43,807 | 980,401 | ||||||
CoreSite Realty Corp. | 1,680 | 123,883 | ||||||
Crown Castle International Corp. | 8,778 | 798,710 | ||||||
CubeSmart | 29,140 | 759,680 | ||||||
DDR Corp. | 21,420 | 327,512 | ||||||
Digital Realty Trust, Inc. | 3,520 | 328,874 | ||||||
Douglas Emmett, Inc. | 10,160 | 370,840 | ||||||
Education Realty Trust, Inc. | 6,360 | 270,872 | ||||||
Equinix, Inc. | 1,400 | 500,192 | ||||||
Equity LifeStyle Properties, Inc. | 2,960 | 224,486 | ||||||
Equity One, Inc. | 10,990 | 313,215 | ||||||
Equity Residential | 7,850 | 484,737 | ||||||
Extra Space Storage, Inc. | 3,190 | 233,348 | ||||||
Fibra Shop Portafolios Inmobiliarios S.A.P.I. de C.V. (Mexico) | 132,183 | 111,895 | ||||||
Forest City Realty Trust, Inc. - Class A | 21,690 | 468,287 | ||||||
General Growth Properties, Inc. | 11,480 | 286,426 | ||||||
Global Medical REIT, Inc. | 15,480 | 150,930 | ||||||
Healthcare Trust of America, Inc. - Class A | 8,350 | 255,510 | ||||||
Host Hotels & Resorts, Inc. | 10,960 | 169,661 | ||||||
Klepierre (France)1 | 6,230 | 254,607 | ||||||
Lamar Advertising Co. - Class A | 14,340 | 909,873 | ||||||
LaSalle Hotel Properties | 7,010 | 166,488 | ||||||
Life Storage, Inc. | 7,200 | 580,680 | ||||||
Mid-America Apartment Communities, Inc. | 2,950 | 273,612 | ||||||
NorthStar Realty Finance Corp. | 18,160 | 263,683 | ||||||
Outfront Media, Inc. | 58,950 | 1,268,014 | ||||||
Pennsylvania Real Estate Investment Trust | 15,830 | 308,843 | ||||||
Physicians Realty Trust | 23,650 | 467,560 | ||||||
Potlatch Corp. | 32,690 | 1,255,296 | ||||||
Prologis, Inc. | 12,930 | 674,429 | ||||||
Public Storage | 1,600 | 341,952 | ||||||
Retail Properties of America, Inc. - Class A | 11,850 | 184,504 | ||||||
Rexford Industrial Realty, Inc. | 17,860 | 376,132 | ||||||
Senior Housing Properties Trust | 9,130 | 194,195 | ||||||
Simon Property Group, Inc. | 5,460 | 1,015,342 | ||||||
Spirit Realty Capital, Inc. | 24,950 | 297,154 | ||||||
STORE Capital Corp. | 25,592 | 698,406 | ||||||
Sun Communities, Inc. | 2,800 | 215,404 | ||||||
Tanger Factory Outlet Centers, Inc. | 8,290 | 288,492 | ||||||
Taubman Centers, Inc. | 3,360 | 243,466 | ||||||
Terreno Realty Corp. | 13,520 | 352,872 | ||||||
UDR, Inc. | 5,210 | 182,194 | ||||||
Urban Edge Properties | 10,810 | 279,006 | ||||||
Ventas, Inc. | 4,930 | 334,008 | ||||||
Vornado Realty Trust | 2,600 | 241,228 | ||||||
Welltower, Inc. | 4,430 | 303,588 | ||||||
Weyerhaeuser Co. | 161,966 | 4,847,642 | ||||||
|
| |||||||
| 29,263,046 | ||||||||
|
| |||||||
Real Estate Management & Development - 0.2% | ||||||||
CBRE Group, Inc. - Class A* | 4,090 | 105,358 | ||||||
First Capital Realty, Inc. (Canada) | 8,460 | 134,913 | ||||||
Realogy Holdings Corp. | 73,570 | 1,684,017 | ||||||
|
| |||||||
| 1,924,288 | ||||||||
|
| |||||||
Total Real Estate | 31,187,334 | |||||||
|
| |||||||
Telecommunication Services - 0.1% | ||||||||
Wireless Telecommunication Services - 0.1% | ||||||||
NTT DOCOMO, Inc. - ADR (Japan) | 53,572 | 1,346,800 | ||||||
|
| |||||||
Utilities - 0.1% | ||||||||
Electric Utilities - 0.1% | ||||||||
Eversource Energy | 9,461 | 520,923 | ||||||
Exelon Corp. | 10,185 | 347,003 | ||||||
|
| |||||||
| 867,926 | ||||||||
|
| |||||||
Multi-Utilities - 0.0%## | ||||||||
CMS Energy Corp. | 14,181 | 597,729 | ||||||
|
| |||||||
Total Utilities | 1,465,655 | |||||||
|
| |||||||
TOTAL COMMON STOCKS | ||||||||
(Identified Cost $357,163,646) | 382,828,999 | |||||||
|
| |||||||
The accompanying notes are an integral part of the financial statements.
11
Investment Portfolio - October 31, 2016
| PRO-BLEND® CONSERVATIVE TERM SERIES | PRINCIPAL AMOUNT 3 | VALUE (NOTE 2) | ||||||
CORPORATE BONDS - 21.9% | ||||||||
Non-Convertible Corporate Bonds - 21.9% | ||||||||
Consumer Discretionary - 1.5% | ||||||||
Auto Components - 0.3% | ||||||||
Dana Financing Luxembourg S.A.R.L.4, 6.50%, 6/1/2026 | 205,000 | $ | 218,069 | |||||
Magna International, Inc. (Canada), 4.15%, 10/1/2025 | 3,095,000 | 3,353,822 | ||||||
|
| |||||||
| 3,571,891 | ||||||||
|
| |||||||
Household Durables - 0.5% | ||||||||
Brookfield Residential Properties, Inc. - Brookfield Residential US Corp. (Canada)4, 6.125%, 7/1/2022 | 605,000 | 614,075 | ||||||
Lennar Corp., 12.25%, 6/1/2017 | 720,000 | 760,500 | ||||||
Meritage Homes Corp., 7.15%, 4/15/2020 | 150,000 | 166,500 | ||||||
Meritage Homes Corp., 7.00%, 4/1/2022 | 275,000 | 306,900 | ||||||
NVR, Inc., 3.95%, 9/15/2022 | 2,595,000 | 2,734,450 | ||||||
TRI Pointe Group, Inc. - TRI Pointe Homes, Inc., 4.375%, 6/15/2019 | 295,000 | 301,638 | ||||||
Weekley Homes LLC - Weekley Finance Corp., 6.00%, 2/1/2023 | 340,000 | 309,400 | ||||||
|
| |||||||
| 5,193,463 | ||||||||
|
| |||||||
Internet & Direct Marketing Retail - 0.5% | ||||||||
The Priceline Group, Inc., 3.60%, 6/1/2026 | 5,460,000 | 5,660,999 | ||||||
|
| |||||||
Media - 0.1% | ||||||||
Comcast Corp., 3.20%, 7/15/2036 | 670,000 | 638,320 | ||||||
Sirius XM Radio, Inc.4, 5.375%, 4/15/2025 | 450,000 | 458,955 | ||||||
VTR Finance B.V. (Chile)4, 6.875%, 1/15/2024 | 580,000 | 606,825 | ||||||
|
| |||||||
| 1,704,100 | ||||||||
|
| |||||||
Multiline Retail - 0.1% | ||||||||
Dollar General Corp., 3.25%, 4/15/2023 | 1,570,000 | 1,605,074 | ||||||
|
| |||||||
Total Consumer Discretionary | 17,735,527 | |||||||
|
| |||||||
Consumer Staples - 1.5% | ||||||||
Beverages - 0.7% | ||||||||
Anheuser-Busch InBev Worldwide, Inc. (Belgium), 7.75%, 1/15/2019 | 2,490,000 | 2,814,945 | ||||||
Anheuser-Busch InBev Worldwide, Inc. (Belgium), 8.20%, 1/15/2039 | 1,815,000 | 2,868,183 | ||||||
PepsiCo, Inc., 3.10%, 7/17/2022 | 2,710,000 | 2,859,833 | ||||||
|
| |||||||
| 8,542,961 | ||||||||
|
| |||||||
Food & Staples Retailing - 0.7% | ||||||||
C&S Group Enterprises LLC4, 5.375%, 7/15/2022 | 640,000 | 620,800 | ||||||
CVS Health Corp., 3.50%, 7/20/2022 | 4,060,000 | 4,289,605 | ||||||
The Kroger Co., 2.60%, 2/1/2021 | 2,805,000 | 2,858,979 | ||||||
|
| |||||||
| 7,769,384 | ||||||||
|
| |||||||
Food Products - 0.1% | ||||||||
Pinnacle Operating Corp.4, 9.00%, 11/15/2020 | 1,190,000 | 737,800 | ||||||
|
| |||||||
Household Products - 0.0%## | ||||||||
HRG Group, Inc., 7.75%, 1/15/2022 | 300,000 | 312,750 | ||||||
|
| |||||||
Total Consumer Staples | 17,362,895 | |||||||
|
| |||||||
Energy - 3.5% | ||||||||
Energy Equipment & Services - 0.8% | ||||||||
Ensco plc, 5.20%, 3/15/2025 | 1,790,000 | 1,456,058 | ||||||
McDermott International, Inc.4, 8.00%, 5/1/2021 | 560,000 | 543,200 | ||||||
Pride International, Inc., 8.50%, 6/15/2019 | 700,000 | 761,250 | ||||||
Schlumberger Holdings Corp.4, 3.625%, 12/21/2022 | 5,520,000 | 5,900,455 | ||||||
|
| |||||||
| 8,660,963 | ||||||||
|
| |||||||
Oil, Gas & Consumable Fuels - 2.7% | ||||||||
BP Capital Markets plc (United Kingdom), 3.535%, 11/4/2024 | 5,545,000 | 5,800,724 | ||||||
Cheniere Corpus Christi Holdings, LLC4, 7.00%, 6/30/2024 | 490,000 | 519,400 | ||||||
Chevron Corp., 1.79%, 11/16/2018 | 2,850,000 | 2,874,305 | ||||||
Columbia Pipeline Group, Inc., 4.50%, 6/1/2025 | 2,730,000 | 2,949,850 | ||||||
ConocoPhillips Co., 3.35%, 11/15/2024 | 2,820,000 | 2,865,261 | ||||||
ConocoPhillips Co., 3.35%, 5/15/2025 | 640,000 | 650,819 | ||||||
Crestwood Midstream Partners LP - Crestwood Midstream Finance Corp., 6.125%, 3/1/2022 | 275,000 | 281,187 | ||||||
Enviva Partners LP - Enviva Partners Finance Corp.4, 8.50%, 11/1/2021 | 455,000 | 465,237 | ||||||
Hilcorp Energy I LP - Hilcorp Finance Co.4, 5.75%, 10/1/2025 | 235,000 | 235,588 | ||||||
Kinder Morgan Energy Partners LP, 4.30%, 5/1/2024 | 5,910,000 | 6,109,250 | ||||||
Kinder Morgan, Inc.4, 5.625%, 11/15/2023 | 2,720,000 | 3,009,275 | ||||||
The accompanying notes are an integral part of the financial statements.
12
Investment Portfolio - October 31, 2016
| PRO-BLEND® CONSERVATIVE TERM SERIES | PRINCIPAL AMOUNT 3 | VALUE (NOTE 2) | ||||||||||||||
CORPORATE BONDS (continued) | ||||||||||||||||
Non-Convertible Corporate Bonds (continued) | ||||||||||||||||
Energy (continued) | ||||||||||||||||
Oil, Gas & Consumable Fuels (continued) | ||||||||||||||||
NGL Energy Partners LP - NGL Energy Finance Corp.4, 7.50%, 11/1/2023 | 295,000 | $ | 295,738 | |||||||||||||
Oasis Petroleum, Inc., 6.875%, 1/15/2023 | 75,000 | 73,500 | ||||||||||||||
PBF Holding Co. LLC - PBF Finance Corp.4, 7.00%, 11/15/2023 | 445,000 | 411,625 | ||||||||||||||
Petroleos Mexicanos (Mexico), 4.50%, 1/23/2026 | 2,900,000 | 2,801,400 | ||||||||||||||
Sabine Pass Liquefaction LLC, 5.625%, 2/1/2021 | 440,000 | 463,100 | ||||||||||||||
Tallgrass Energy Partners LP - Tallgrass Energy Finance Corp.4, 5.50%, 9/15/2024 | 450,000 | 447,750 | ||||||||||||||
TransCanada PipeLines Ltd. (Canada), 3.75%, 10/16/2023 | 1,495,000 | 1,590,321 | ||||||||||||||
|
| |||||||||||||||
| 31,844,330 | ||||||||||||||||
|
| |||||||||||||||
Total Energy | 40,505,293 | |||||||||||||||
|
| |||||||||||||||
Financials - 6.8% | ||||||||||||||||
Banks - 3.4% | ||||||||||||||||
Bank of America Corp., 5.70%, 5/2/2017 | 2,705,000 | 2,763,563 | ||||||||||||||
Bank of America Corp., 4.00%, 1/22/2025 | 4,300,000 | 4,421,230 | ||||||||||||||
Barclays Bank plc (United Kingdom)4, 10.179%, 6/12/2021 | 2,180,000 | 2,756,466 | ||||||||||||||
Citigroup, Inc., 3.875%, 3/26/2025 | 5,780,000 | 5,911,535 | ||||||||||||||
Commonwealth Bank of Australia (Australia), 5.75%, 1/25/2017 | AUD | 300,000 | 230,135 | |||||||||||||
Cooperatieve Rabobank U.A. (Netherlands)5,6, 8.40% | 850,000 | 881,620 | ||||||||||||||
Intesa Sanpaolo S.p.A. (Italy), 3.875%, 1/15/2019 | 2,675,000 | 2,752,171 | ||||||||||||||
Intesa Sanpaolo S.p.A. (Italy)4, 6.50%, 2/24/2021 | 2,535,000 | 2,843,996 | ||||||||||||||
JPMorgan Chase & Co., 4.95%, 3/25/2020 | 5,245,000 | 5,741,759 | ||||||||||||||
Lloyds Bank plc (United Kingdom)4,5,7, 12.00% | 335,000 | 455,600 | ||||||||||||||
Lloyds Banking Group plc (United Kingdom)4, 4.582%, 12/10/2025 | 5,735,000 | 5,827,695 | ||||||||||||||
Popular, Inc., 7.00%, 7/1/2019 | 670,000 | 694,288 | ||||||||||||||
Royal Bank of Canada (Canada), 3.77%, 3/30/2018 | CAD | 340,000 | 262,887 | |||||||||||||
Santander Bank N.A., 8.75%, 5/30/2018 | 1,595,000 | 1,736,504 | ||||||||||||||
Santander Holdings USA, Inc., 2.65%, 4/17/2020 | 1,815,000 | 1,813,644 | ||||||||||||||
Westpac Banking Corp. (Australia), 5.75%, 2/6/2017 | AUD | 300,000 | 230,396 | |||||||||||||
|
| |||||||||||||||
| 39,323,489 | ||||||||||||||||
|
| |||||||||||||||
Capital Markets - 1.7% | ||||||||||||||||
The Goldman Sachs Group, Inc.8, 2.429%, 11/29/2023 | 5,730,000 | 5,815,079 | ||||||||||||||
The Goldman Sachs Group, Inc., 4.25%, 10/21/2025 | 2,725,000 | 2,851,097 | ||||||||||||||
Morgan Stanley, 2.125%, 4/25/2018 | 4,295,000 | 4,326,396 | ||||||||||||||
Morgan Stanley, 5.00%, 11/24/2025 | 3,970,000 | 4,391,245 | ||||||||||||||
TD Ameritrade Holding Corp., 2.95%, 4/1/2022 | 2,690,000 | 2,780,779 | ||||||||||||||
|
| |||||||||||||||
| 20,164,596 | ||||||||||||||||
|
| |||||||||||||||
Consumer Finance - 0.1% | ||||||||||||||||
Navient Corp., 6.125%, 3/25/2024 | 1,055,000 | 965,325 | ||||||||||||||
|
| |||||||||||||||
Diversified Financial Services - 0.1% | ||||||||||||||||
Horizon Pharma, Inc., 6.625%, 5/1/2023 | 765,000 | 721,969 | ||||||||||||||
Jefferies Finance LLC - JFIN Co-Issuer Corp.4, 7.375%, 4/1/2020 | 400,000 | 397,000 | ||||||||||||||
|
| |||||||||||||||
| 1,118,969 | ||||||||||||||||
|
| |||||||||||||||
Insurance - 1.4% | ||||||||||||||||
American International Group, Inc., 4.125%, 2/15/2024 | 4,120,000 | 4,428,881 | ||||||||||||||
Assured Guaranty US Holdings, Inc., 5.00%, 7/1/2024 | 8,065,000 | 8,947,569 | ||||||||||||||
Prudential Financial, Inc.9, 5.875%, 9/15/2042 | 2,590,000 | 2,836,050 | ||||||||||||||
|
| |||||||||||||||
| 16,212,500 | ||||||||||||||||
|
| |||||||||||||||
Thrifts & Mortgage Finance - 0.1% | ||||||||||||||||
Ladder Capital Finance Holdings LLLP - Ladder Capital Finance Corp., 7.375%, 10/1/2017 | 1,050,000 | 1,064,439 | ||||||||||||||
Ladder Capital Finance Holdings LLLP - Ladder Capital Finance Corp.4, 5.875%, 8/1/2021 | 650,000 | 617,500 | ||||||||||||||
|
| |||||||||||||||
| 1,681,939 | ||||||||||||||||
|
| |||||||||||||||
Total Financials | 79,466,818 | |||||||||||||||
|
| |||||||||||||||
Health Care - 0.5% | ||||||||||||||||
Biotechnology - 0.3% | ||||||||||||||||
AbbVie, Inc., 1.80%, 5/14/2018 | 2,870,000 | 2,879,026 | ||||||||||||||
The accompanying notes are an integral part of the financial statements.
13
Investment Portfolio - October 31, 2016
| PRO-BLEND® CONSERVATIVE TERM SERIES | PRINCIPAL AMOUNT 3 | VALUE (NOTE 2) | ||||||||||
CORPORATE BONDS (continued) | ||||||||||||
Non-Convertible Corporate Bonds (continued) | ||||||||||||
Health Care (continued) | ||||||||||||
Biotechnology (continued) | ||||||||||||
AMAG Pharmaceuticals, Inc.4, 7.875%, 9/1/2023 | 585,000 | $ | 548,436 | |||||||||
|
| |||||||||||
| 3,427,462 | ||||||||||||
|
| |||||||||||
Health Care Providers & Services - 0.1% | ||||||||||||
HCA, Inc., 7.50%, 2/15/2022 | 385,000 | 438,130 | ||||||||||
LifePoint Health, Inc.4, 5.375%, 5/1/2024 | 285,000 | 283,233 | ||||||||||
Tenet Healthcare Corp., 8.125%, 4/1/2022 | 380,000 | 371,450 | ||||||||||
|
| |||||||||||
| 1,092,813 | ||||||||||||
|
| |||||||||||
Pharmaceuticals - 0.1% | ||||||||||||
Concordia International Corp. (Canada)4, 7.00%, 4/15/2023 | 580,000 | 333,500 | ||||||||||
Mallinckrodt International Finance S.A. - Mallinckrodt CB LLC4, 5.625%, 10/15/2023 | 460,000 | 432,400 | ||||||||||
|
| |||||||||||
| 765,900 | ||||||||||||
|
| |||||||||||
Total Health Care | 5,286,175 | |||||||||||
|
| |||||||||||
Industrials - 2.3% | ||||||||||||
Aerospace & Defense - 0.0%## | ||||||||||||
DigitalGlobe, Inc.4 , 5.25%, 2/1/2021 | 525,000 | 528,937 | ||||||||||
|
| |||||||||||
Air Freight & Logistics - 0.0%## | ||||||||||||
Neovia Logistics Intermediate Holdings LLC - Logistics Intermediate Finance Corp.4,10, 10.00%, 2/15/2018 | 663,862 | 406,615 | ||||||||||
|
| |||||||||||
Airlines - 0.5% | ||||||||||||
Allegiant Travel Co., 5.50%, 7/15/2019 | 440,000 | 457,050 | ||||||||||
American Airlines Pass-Through Trust, Series 2013-2, Class A, 4.95%, 1/15/2023 | 2,249,506 | 2,454,773 | ||||||||||
Southwest Airlines Co., 2.75%, 11/6/2019 | 1,930,000 | 1,987,269 | ||||||||||
Southwest Airlines Co., 2.65%, 11/5/2020 | 1,010,000 | 1,032,985 | ||||||||||
|
| |||||||||||
| 5,932,077 | ||||||||||||
|
| |||||||||||
Commercial Services & Supplies - 0.1% | ||||||||||||
Constellis Holdings LLC - Constellis Finance Corp.4, 9.75%, 5/15/2020 | 320,000 | 324,800 | ||||||||||
Herc Rentals, Inc.4, 7.50%, 6/1/2022 | 295,000 | 295,000 | ||||||||||
|
| |||||||||||
| 619,800 | ||||||||||||
|
| |||||||||||
Construction & Engineering - 0.3% | ||||||||||||
Fluor Corp., 3.50%, 12/15/2024 | 2,775,000 | 2,925,752 | ||||||||||
|
| |||||||||||
Industrial Conglomerates - 0.7% | ||||||||||||
General Electric Co.8, 1.261%, 5/5/2026 | 2,195,000 | 2,129,541 | ||||||||||
Siemens Financieringsmaatschappij N.V. (Germany)4, 2.90%, 5/27/2022 | 5,520,000 | 5,732,652 | ||||||||||
|
| |||||||||||
| 7,862,193 | ||||||||||||
|
| |||||||||||
Machinery - 0.1% | ||||||||||||
Case New Holland Industrial, Inc. (United Kingdom), 7.875%, 12/1/2017 | 351,000 | 371,621 | ||||||||||
CNH Industrial N.V. (United Kingdom), 4.50%, 8/15/2023 | 315,000 | 316,575 | ||||||||||
Shape Technologies Group, Inc.4, 7.625%, 2/1/2020 | 305,000 | 309,575 | ||||||||||
Xerium Technologies, Inc.4, 9.50%, 8/15/2021 | 295,000 | 299,425 | ||||||||||
|
| |||||||||||
| 1,297,196 | ||||||||||||
|
| |||||||||||
Trading Companies & Distributors - 0.6% | ||||||||||||
Air Lease Corp., 3.375%, 6/1/2021 | 5,743,000 | 5,908,950 | ||||||||||
Aircastle Ltd., 5.50%, 2/15/2022 | 290,000 | 311,025 | ||||||||||
Fly Leasing Ltd. (Ireland), 6.375%, 10/15/2021 | 850,000 | 869,125 | ||||||||||
International Lease Finance Corp., 6.25%, 5/15/2019 | 280,000 | 302,750 | ||||||||||
|
| |||||||||||
| 7,391,850 | ||||||||||||
|
| |||||||||||
Total Industrials | 26,964,420 | |||||||||||
|
| |||||||||||
Information Technology - 1.8% | ||||||||||||
Internet Software & Services - 0.4% eBay, Inc., 2.50%, 3/9/2018 | 4,260,000 | 4,312,794 | ||||||||||
VeriSign, Inc., 5.25%, 4/1/2025 | 220,000 | 232,100 | ||||||||||
|
| |||||||||||
| 4,544,894 | ||||||||||||
|
| |||||||||||
IT Services - 0.6% | ||||||||||||
Automatic Data Processing, Inc., 2.25%, 9/15/2020 | 2,690,000 | 2,758,474 | ||||||||||
Visa, Inc., 2.80%, 12/14/2022 | 4,150,000 | 4,315,693 | ||||||||||
|
| |||||||||||
| 7,074,167 | ||||||||||||
|
| |||||||||||
Semiconductors & Semiconductor Equipment - 0.5% | ||||||||||||
Intel Corp., 2.45%, 7/29/2020 | 2,690,000 | 2,771,607 | ||||||||||
QUALCOMM, Inc., 3.00%, 5/20/2022 | 2,670,000 | 2,782,922 | ||||||||||
|
| |||||||||||
| 5,554,529 | ||||||||||||
|
| |||||||||||
The accompanying notes are an integral part of the financial statements.
14
Investment Portfolio - October 31, 2016
| PRO-BLEND® CONSERVATIVE TERM SERIES | PRINCIPAL AMOUNT 3 | VALUE (NOTE 2) | ||||||||||
CORPORATE BONDS (continued) | ||||||||||||
Non-Convertible Corporate Bonds (continued) | ||||||||||||
Information Technology (continued) | ||||||||||||
Technology Hardware, Storage & Peripherals - 0.3% | ||||||||||||
Diebold, Inc.4, 8.50%, 4/15/2024 | 460,000 | $ | 487,485 | |||||||||
Hewlett Packard Enterprise Co.4, 2.70%, 10/5/2017 | 3,055,000 | 3,093,689 | ||||||||||
Western Digital Corp.4, 10.50%, 4/1/2024 | 280,000 | 323,400 | ||||||||||
|
| |||||||||||
| 3,904,574 | ||||||||||||
|
| |||||||||||
Total Information Technology | 21,078,164 | |||||||||||
|
| |||||||||||
Materials - 1.1% | ||||||||||||
Chemicals - 0.5% | ||||||||||||
Consolidated Energy Finance S.A. (Trinidad-Tobago)4, 6.75%, 10/15/2019 | 470,000 | 470,000 | ||||||||||
The Dow Chemical Co., 8.55%, 5/15/2019 | 2,435,000 | 2,837,235 | ||||||||||
Solvay Finance America LLC (Belgium)4, 3.40%, 12/3/2020 | 2,700,000 | 2,810,611 | ||||||||||
|
| |||||||||||
| 6,117,846 | ||||||||||||
|
| |||||||||||
Containers & Packaging - 0.1% | ||||||||||||
Ardagh Packaging Finance plc - Ardagh Holdings USA, Inc. (Ireland)4, 7.25%, 5/15/2024 | 450,000 | 474,750 | ||||||||||
|
| |||||||||||
Metals & Mining - 0.4% | ||||||||||||
Arconic, Inc., 5.87%, 2/23/2022 | 420,000 | 449,064 | ||||||||||
BHP Billiton Finance USA Ltd. (Australia), 3.85%, 9/30/2023 | 2,535,000 | 2,750,092 | ||||||||||
Kinross Gold Corp. (Canada), 5.125%, 9/1/2021 | 120,000 | 124,800 | ||||||||||
SunCoke Energy Partners LP - SunCoke Energy Partners Finance Corp.4, 7.375%, 2/1/2020 | 455,000 | 437,938 | ||||||||||
Techniplas LLC4, 10.00%, 5/1/2020 | 380,000 | 322,050 | ||||||||||
|
| |||||||||||
| 4,083,944 | ||||||||||||
|
| |||||||||||
Paper & Forest Products - 0.1% | ||||||||||||
Domtar Corp., 4.40%, 4/1/2022 | 1,379,000 | 1,445,444 | ||||||||||
|
| |||||||||||
Total Materials | 12,121,984 | |||||||||||
|
| |||||||||||
Real Estate - 1.4% | ||||||||||||
Equity Real Estate Investment Trusts (REITS) - 1.3% | ||||||||||||
American Tower Corp., 3.30%, 2/15/2021 | 5,610,000 | 5,827,124 | ||||||||||
Crown Castle Towers LLC4, 6.113%, 1/15/2020 | 1,880,000 | 2,074,191 | ||||||||||
Crown Castle Towers LLC4, 4.883%, 8/15/2020 | 514,000 | 558,640 | ||||||||||
Crown Castle Towers LLC4, 3.222%, 5/15/2022 | 1,020,000 | 1,053,813 | ||||||||||
Greystar Real Estate Partners LLC4, 8.25%, 12/1/2022 | 430,000 | 467,625 | ||||||||||
GTP Acquisition Partners I LLC4, 2.35%, 6/15/2020 | 1,140,000 | 1,135,531 | ||||||||||
MPT Operating Partnership LP - MPT Finance Corp., 5.25%, 8/1/2026 | 285,000 | 290,700 | ||||||||||
Sixsigma Networks Mexico S.A. de C.V. (Mexico)4, 8.25%, 11/7/2021 | 645,000 | 630,488 | ||||||||||
Welltower, Inc., 4.95%, 1/15/2021 | 2,645,000 | 2,911,997 | ||||||||||
|
| |||||||||||
| 14,950,109 | ||||||||||||
|
| |||||||||||
Real Estate Management & Development - 0.1% | ||||||||||||
Forestar USA Real Estate Group, Inc.4, 8.50%, 6/1/2022 | 615,000 | 635,372 | ||||||||||
Rialto Holdings LLC - Rialto Corp.4, 7.00%, 12/1/2018 | 455,000 | 460,688 | ||||||||||
|
| |||||||||||
| 1,096,060 | ||||||||||||
|
| |||||||||||
Total Real Estate | 16,046,169 | |||||||||||
|
| |||||||||||
Telecommunication Services - 1.4% | ||||||||||||
Diversified Telecommunication Services - 1.2% | ||||||||||||
AT&T, Inc., 5.20%, 3/15/2020 | 5,191,000 | 5,717,819 | ||||||||||
CenturyLink, Inc., 7.50%, 4/1/2024 | 420,000 | 437,325 | ||||||||||
Frontier Communications Corp., 11.00%, 9/15/2025 | 710,000 | 726,969 | ||||||||||
Hughes Satellite Systems Corp.4, 6.625%, 8/1/2026 | 460,000 | 455,400 | ||||||||||
Inmarsat Finance plc (United Kingdom)4, 4.875%, 5/15/2022 | 790,000 | 745,049 | ||||||||||
Qualitytech LP - QTS Finance Corp., 5.875%, 8/1/2022 | 590,000 | 606,225 | ||||||||||
Verizon Communications, Inc., 4.15%, 3/15/2024 | 5,315,000 | 5,759,238 | ||||||||||
|
| |||||||||||
| 14,448,025 | ||||||||||||
|
| |||||||||||
Wireless Telecommunication Services - 0.2% | ||||||||||||
Altice Financing S.A. (Luxembourg)4, 6.625%, 2/15/2023 | 595,000 | 612,850 | ||||||||||
SBA Tower Trust4, 3.598%, 4/15/2018 | 1,175,000 | 1,179,240 | ||||||||||
|
| |||||||||||
| 1,792,090 | ||||||||||||
|
| |||||||||||
Total Telecommunication Services | 16,240,115 | |||||||||||
|
| |||||||||||
The accompanying notes are an integral part of the financial statements.
15
Investment Portfolio - October 31, 2016
| PRO-BLEND® CONSERVATIVE TERM SERIES | PRINCIPAL AMOUNT 3/ SHARES | VALUE (NOTE 2) | ||||||||||
CORPORATE BONDS (continued) | ||||||||||||
Non-Convertible Corporate Bonds (continued) | ||||||||||||
Utilities - 0.1% | ||||||||||||
Independent Power and Renewable Electricity Producers - 0.1% | ||||||||||||
Atlantica Yield plc (Spain)4, 7.00%, 11/15/2019 | 740,000 | $ | 752,950 | |||||||||
Terraform Global Operating LLC4, 13.75%, 8/15/2022 | 455,000 | 473,200 | ||||||||||
|
| |||||||||||
Total Utilities | 1,226,150 | |||||||||||
|
| |||||||||||
TOTAL CORPORATE BONDS | 254,033,710 | |||||||||||
|
| |||||||||||
MUTUAL FUNDS - 0.2% | ||||||||||||
Schwab U.S. Dividend Equity ETF | 29,435 | 1,225,968 | ||||||||||
Tri-Continental Corp. | 38,989 | 815,650 | ||||||||||
|
| |||||||||||
TOTAL MUTUAL FUNDS | 2,041,618 | |||||||||||
|
| |||||||||||
U.S. TREASURY SECURITIES - 21.4% | ||||||||||||
U.S. Treasury Bonds - 2.3% | ||||||||||||
U.S. Treasury Bond, 4.75%, 2/15/2037 | 11,200,000 | 15,697,057 | ||||||||||
U.S. Treasury Inflation Indexed Bond, 0.75%, 2/15/2042 | 11,511,828 | 11,583,685 | ||||||||||
|
| |||||||||||
Total U.S. Treasury Bonds | ||||||||||||
(Identified Cost $26,553,280) | 27,280,742 | |||||||||||
|
| |||||||||||
U.S. Treasury Notes - 19.1% | ||||||||||||
U.S. Treasury Inflation Indexed Note, 0.125%, 4/15/2017 | 23,250,239 | 23,294,740 | ||||||||||
U.S. Treasury Inflation Indexed Note, 0.125%, 4/15/2020 | 20,885,238 | 21,282,454 | ||||||||||
U.S. Treasury Inflation Indexed Note, 0.125%, 1/15/2023 | 11,665,883 | 11,833,020 | ||||||||||
U.S. Treasury Note, 0.75%, 4/15/2018 | 50,964,000 | 50,932,148 | ||||||||||
U.S. Treasury Note, 1.375%, 4/30/2020 | 49,751,000 | 50,192,142 | ||||||||||
U.S. Treasury Note, 1.625%, 7/31/2020 | 13,377,000 | 13,600,128 | ||||||||||
U.S. Treasury Note, 1.75%, 4/30/2022 | 49,781,000 | 50,584,117 | ||||||||||
|
| |||||||||||
Total U.S. Treasury Notes | ||||||||||||
(Identified Cost $221,560,606) | 221,718,749 | |||||||||||
|
| |||||||||||
TOTAL U.S. TREASURY SECURITIES | ||||||||||||
(Identified Cost $248,113,886) | 248,999,491 | |||||||||||
|
| |||||||||||
PRINCIPAL AMOUNT 3 | VALUE (NOTE 2) | |||||||||||
ASSET-BACKED SECURITIES - 2.2% | ||||||||||||
Alterna Funding I LLC, Series 2014-1A, Class NOTE4, 1.639%, 2/15/2021 | 739,920 | 721,422 | ||||||||||
CarMax Auto Owner Trust, Series 2016-4, Class A2, 1.21%, 11/15/2019 | 3,300,000 | 3,298,737 | ||||||||||
Cazenovia Creek Funding I LLC, Series 2015-1A, Class A4, 2.00%, 12/10/2023 | 1,051,311 | 1,044,083 | ||||||||||
Colony American Homes, Series 2015-1A, Class A4,8, 1.735%, 7/17/2032 | 2,226,781 | 2,230,818 | ||||||||||
Discover Card Execution Note Trust, Series 2014-A5, Class A, 1.39%, 4/15/2020 | 3,000,000 | 3,007,219 | ||||||||||
Enterprise Fleet Financing LLC, Series 2014-2, Class A34, 1.64%, 3/20/2020 | 1,975,000 | 1,976,241 | ||||||||||
Enterprise Fleet Financing LLC, Series 2015-2, Class A24, 1.59%, 2/22/2021 | 1,773,336 | 1,775,631 | ||||||||||
Enterprise Fleet Financing LLC, Series 2016-2, Class A24, 1.74%, 2/22/2022 | 245,000 | 245,422 | ||||||||||
FDIC Trust, Series 2011-R1, Class A4, 2.672%, 7/25/2026 | 453,447 | 460,353 | ||||||||||
FNA Trust, Series 2014-1A, Class A4, 1.296%, 12/10/2022 | 307,904 | 304,825 | ||||||||||
Home Partners of America Trust, Series 2016-1, Class A4,8, 2.185%, 3/17/2033 | 1,083,145 | 1,094,872 | ||||||||||
Invitation Homes Trust, Series 2015-SFR3, Class A4,8, 1.835%, 8/17/2032 | 2,467,302 | 2,477,370 | ||||||||||
NextGear Floorplan Master Owner Trust, Series 2014-1A, Class A4, 1.92%, 10/15/2019 | 1,750,000 | 1,747,978 | ||||||||||
Starwood Retail Property Trust, Series 2014-STAR, Class A4,8, 1.744%, 11/15/2027 | 2,615,000 | 2,592,073 | ||||||||||
Tax Ease Funding LLC, Series 2016-1A, Class A4, 3.131%, 6/15/2028 | 848,801 | 846,782 | ||||||||||
Tricon American Homes Trust, Series 2016-SFR1, Class A4, 2.589%, 11/17/2033 | 2,030,000 | 2,026,577 | ||||||||||
|
| |||||||||||
TOTAL ASSET-BACKED SECURITIES | 25,850,403 | |||||||||||
|
| |||||||||||
The accompanying notes are an integral part of the financial statements.
16
Investment Portfolio - October 31, 2016
| PRO-BLEND® CONSERVATIVE TERM SERIES | PRINCIPAL AMOUNT 3 | VALUE (NOTE 2) | ||||||||||
COMMERCIAL MORTGAGE-BACKED SECURITIES - 6.0% | ||||||||||||
Americold LLC Trust, Series 2010-ARTA, Class A14, 3.847%, 1/14/2029 | 242,955 | $ | 253,206 | |||||||||
Banc of America Commercial Mortgage Trust, Series 2006-3, Class A48, 5.889%, 7/10/2044 | 42,011 | 41,949 | ||||||||||
BWAY Mortgage Trust, Series 2015-1740, Class A4, 2.917%, 1/13/2035 | 5,200,000 | 5,229,579 | ||||||||||
Commercial Mortgage Pass-Through Certificates, Series 2015-3BP, Class A4, 3.178%, 2/10/2035 | 500,000 | 518,589 | ||||||||||
Commercial Mortgage Pass-Through Certificates, Series 2015-DC1, Class A5, 3.35%, 2/10/2048 | 5,000,000 | 5,226,684 | ||||||||||
Credit Suisse Mortgage Capital Trust, Series 2013-IVR3, Class A14,8, 2.50%, 5/25/2043 | 1,804,145 | 1,775,955 | ||||||||||
Credit Suisse Mortgage Capital Trust, Series 2013-TH1, Class A14,8, 2.13%, 2/25/2043 | 1,333,526 | 1,290,708 | ||||||||||
DB-UBS Mortgage Trust, Series 2011-LC1A, Class A14, 3.742%, 11/10/2046 | 9,562 | 9,594 | ||||||||||
Fannie Mae Multifamily REMIC Trust, Series 2012-M13, Class ASQ2, 1.246%, 8/25/2017 | 687,260 | 687,133 | ||||||||||
Freddie Mac Multifamily Structured Pass-Through Certificates, Series K009, | 23,590,845 | 928,194 | ||||||||||
Freddie Mac Multifamily Structured Pass-Through Certificates, Series K014, | 2,820,870 | 129,231 | ||||||||||
Freddie Mac Multifamily Structured Pass-Through Certificates, Series K016, | 6,930,134 | 438,043 | ||||||||||
Freddie Mac Multifamily Structured Pass-Through Certificates, Series K017, | 8,572,100 | 490,971 | ||||||||||
Freddie Mac Multifamily Structured Pass-Through Certificates, Series K021, | 15,716,853 | 1,077,797 | ||||||||||
Freddie Mac Multifamily Structured Pass-Through Certificates, Series K030, | 78,937,938 | 941,153 | ||||||||||
Freddie Mac Multifamily Structured Pass-Through Certificates, Series K032, | 49,159,312 | 344,469 | ||||||||||
Freddie Mac Multifamily Structured Pass-Through Certificates, Series K706, | 10,337,743 | 264,443 | ||||||||||
FREMF Mortgage Trust, Series 2011-K701, Class B4,8, 4.435%, 7/25/2048 | 875,000 | 890,984 | ||||||||||
FREMF Mortgage Trust, Series 2011-K702, Class B4,8, 4.931%, 4/25/2044 | 1,250,000 | 1,295,518 | ||||||||||
FREMF Mortgage Trust, Series 2013-K28, Class X2A (IO)4, 0.10%, 6/25/2046 | 210,863,618 | 1,072,010 | ||||||||||
FREMF Mortgage Trust, Series 2013-K502, Class B4,8, 2.609%, 3/25/2045 | 1,725,000 | 1,727,907 | ||||||||||
FREMF Mortgage Trust, Series 2013-K712, Class B4,8, 3.48%, 5/25/2045 | 1,160,000 | 1,188,230 | ||||||||||
FREMF Mortgage Trust, Series 2014-K41, Class B4,8, 3.961%, 11/25/2047 | 2,500,000 | 2,561,656 | ||||||||||
FREMF Mortgage Trust, Series 2014-K716, Class B4,8, 4.084%, 8/25/2047 | 3,075,000 | 3,215,193 | ||||||||||
FREMF Mortgage Trust, Series 2015-K42, Class B4,8, 3.984%, 12/25/2024 | 490,000 | 502,389 | ||||||||||
FREMF Mortgage Trust, Series 2015-K43, Class B4,8, 3.863%, 2/25/2048 | 500,000 | 507,735 | ||||||||||
FREMF Mortgage Trust, Series 2015-K720, Class B4,8, 3.506%, 7/25/2022 | 270,000 | 265,472 | ||||||||||
GAHR Commercial Mortgage Trust, Series 2015-NRF, Class BFX4,8, 3.495%, 12/15/2034 | 2,800,000 | 2,872,453 | ||||||||||
GAHR Commercial Mortgage Trust, Series 2015-NRF, Class DFX4,8, 3.495%, 12/15/2034 | 1,290,000 | 1,298,396 | ||||||||||
GS Mortgage Securities Trust, Series 2010-C2, Class A14, 3.849%, 12/10/2043 | 135,872 | 141,399 | ||||||||||
JP Morgan Chase Commercial Mortgage Securities Trust, Series 2006-LDP9, Class A3, 5.336%, 5/15/2047 | 1,147,602 | 1,146,068 | ||||||||||
JP Morgan Mortgage Trust, Series 2013-1, Class 1A24,8, 3.00%, 3/25/2043 | 987,357 | 991,927 | ||||||||||
The accompanying notes are an integral part of the financial statements.
17
Investment Portfolio - October 31, 2016
| PRO-BLEND® CONSERVATIVE TERM SERIES | PRINCIPAL AMOUNT 3 | VALUE (NOTE 2) | ||||||||||||||
COMMERCIAL MORTGAGE-BACKED SECURITIES (continued) | ||||||||||||||||
JP Morgan Mortgage Trust, Series 2013-2, Class A24,8, 3.50%, 5/25/2043 | 1,208,264 | $ | 1,244,324 | |||||||||||||
JP Morgan Mortgage Trust, Series 2014-2, Class 1A14,8, 3.00%, 6/25/2029 | 1,561,035 | 1,602,377 | ||||||||||||||
LSTAR Commercial Mortgage Trust, Series 2014-2, Class A24, 2.767%, 1/20/2041 | 291,225 | 292,286 | ||||||||||||||
Motel 6 Trust, Series 2015-MTL6, Class B4, 3.298%, 2/5/2030 | 2,550,000 | 2,554,171 | ||||||||||||||
New Residential Mortgage Loan Trust, Series 2014-3A, Class AFX34,8, 3.75%, 11/25/2054 | 1,637,328 | 1,688,601 | ||||||||||||||
New Residential Mortgage Loan Trust, Series 2015-2A, Class A14,8, 3.75%, 8/25/2055 | 1,667,576 | 1,730,143 | ||||||||||||||
SBA Small Business Investment Companies, Series 2015-10A, Class 1, 2.517%, 3/10/2025 | 1,244,291 | 1,272,459 | ||||||||||||||
SBA Small Business Investment Companies, Series 2015-10B, Class 1, 2.829%, 9/10/2025 | 5,549,687 | 5,722,499 | ||||||||||||||
SCG Trust, Series 2013-SRP1, Class AJ4,8, 2.485%, 11/15/2026 | 4,050,000 | 3,949,303 | ||||||||||||||
Sequoia Mortgage Trust, Series 2013-2, Class A8, 1.874%, 2/25/2043 | 1,115,639 | 1,093,675 | ||||||||||||||
Sequoia Mortgage Trust, Series 2013-7, Class A28, 3.00%, 6/25/2043 | 1,052,185 | 1,062,844 | ||||||||||||||
Sequoia Mortgage Trust, Series 2013-8, Class A18, 3.00%, 6/25/2043 | 1,482,876 | 1,496,632 | ||||||||||||||
Vornado DP LLC Trust, Series 2010-VNO, Class A2FX4, 4.004%, 9/13/2028 | 155,000 | 165,950 | ||||||||||||||
Wachovia Bank Commercial Mortgage Trust, Series 2006-C26, Class A38, 6.011%, 6/15/2045 | 25,883 | 25,870 | ||||||||||||||
Wells Fargo Commercial Mortgage Trust, Series 2010-C1, Class A24, 4.393%, 11/15/2043 | 265,000 | 287,286 | ||||||||||||||
WF-RBS Commercial Mortgage Trust, Series 2011-C2, Class A44,8, 4.869%, 2/15/2044 | 1,225,000 | 1,362,443 | ||||||||||||||
WF-RBS Commercial Mortgage Trust, Series 2013-C11, Class A2, 2.029%, 3/15/2045 | 1,167,795 | 1,174,485 | ||||||||||||||
WinWater Mortgage Loan Trust, Series 2015-1, Class A14,8, 3.50%, 1/20/2045 | 1,795,814 | 1,835,764 | ||||||||||||||
WinWater Mortgage Loan Trust, Series 2015-3, Class A54,8, 3.50%, 3/20/2045 | 1,777,617 | 1,813,711 | ||||||||||||||
|
| |||||||||||||||
TOTAL COMMERCIAL MORTGAGE-BACKED SECURITIES | ||||||||||||||||
(Identified Cost $68,512,376) | ��69,699,858 | |||||||||||||||
|
| |||||||||||||||
FOREIGN GOVERNMENT BONDS - 2.0% | ||||||||||||||||
Bonos de la Tesoreria de la Republica en pesos (Chile), 6.00%, 1/1/2018 | CLP | 330,000,000 | 519,035 | |||||||||||||
Brazilian Government International Bond (Brazil), 8.875%, 10/14/2019 | 400,000 | 471,000 | ||||||||||||||
Canada Housing Trust No. 1 (Canada)4, 4.10%, 12/15/2018 | CAD | 295,000 | 235,430 | |||||||||||||
Canadian Government Bond (Canada), 1.50%, 9/1/2017 | CAD | 125,000 | 93,912 | |||||||||||||
Canadian Government Bond (Canada), 2.75%, 6/1/2022 | CAD | 360,000 | 297,311 | |||||||||||||
Export-Import Bank of Korea (South Korea), 2.625%, 12/30/2020 | 9,225,000 | 9,443,567 | ||||||||||||||
Korea Treasury Bond (South Korea), 2.00%, 12/10/2017 | KRW | 380,000,000 | 334,065 | |||||||||||||
Mexican Government Bond (Mexico), 7.25%, 12/15/2016 | MXN | 4,560,000 | 241,928 | |||||||||||||
Mexican Government Bond (Mexico), 5.00%, 6/15/2017 | MXN | 8,250,000 | 436,301 | |||||||||||||
Mexican Government Bond (Mexico), 8.00%, 6/11/2020 | MXN | 8,000,000 | 452,936 | |||||||||||||
Mexican Government Bond (Mexico), 6.50%, 6/10/2021 | MXN | 3,000,000 | 162,221 | |||||||||||||
Mexican Government Bond (Mexico), 6.50%, 6/9/2022 | MXN | 5,500,000 | 297,740 | |||||||||||||
Mexican Government Bond (Mexico), 7.75%, 5/29/2031 | MXN | 1,000,000 | 58,430 | |||||||||||||
Norway Government Bond (Norway)4, 4.25%, 5/19/2017 | NOK | 1,280,000 | 157,972 | |||||||||||||
Province of New Brunswick Canada (Canada), 5.20%, 2/21/2017 | 3,500,000 | 3,542,525 | ||||||||||||||
Singapore Government Bond (Singapore), 2.50%, 6/1/2019 | SGD | 650,000 | 484,960 | |||||||||||||
Svensk Exportkredit AB (Sweden), 1.125%, 8/28/2019 | 5,500,000 | 5,469,133 | ||||||||||||||
United Kingdom Gilt (United Kingdom), 1.00%, 9/7/2017 | GBP | 290,000 | 357,328 | |||||||||||||
United Kingdom Gilt (United Kingdom), 5.00%, 3/7/2018 | GBP | 365,000 | 475,433 | |||||||||||||
|
| |||||||||||||||
TOTAL FOREIGN GOVERNMENT BONDS | ||||||||||||||||
(Identified Cost $24,617,538) | 23,531,227 | |||||||||||||||
|
| |||||||||||||||
The accompanying notes are an integral part of the financial statements.
18
Investment Portfolio - October 31, 2016
| PRO-BLEND® CONSERVATIVE TERM SERIES | PRINCIPAL AMOUNT 3 | VALUE (NOTE 2) | ||||||||||||||
U.S. GOVERNMENT AGENCIES - 12.4% | ||||||||||||||||
Mortgage-Backed Securities - 11.7% | ||||||||||||||||
Fannie Mae, Pool #888468, 5.50%, 9/1/2021 | 469,235 | $ | 499,125 | |||||||||||||
Fannie Mae, Pool #995233, 5.50%, 10/1/2021 | 39,581 | 41,748 | ||||||||||||||
Fannie Mae, Pool #888017, 6.00%, 11/1/2021 | 58,535 | 62,924 | ||||||||||||||
Fannie Mae, Pool #995329, 5.50%, 12/1/2021 | 321,567 | 342,265 | ||||||||||||||
Fannie Mae, Pool #888136, 6.00%, 12/1/2021 | 73,119 | 78,723 | ||||||||||||||
Fannie Mae, Pool #888815, 4.50%, 11/1/2022 | 51,386 | 53,560 | ||||||||||||||
Fannie Mae, Pool #888810, 5.50%, 11/1/2022 | 558,635 | 594,929 | ||||||||||||||
Fannie Mae, Pool #AA1563, 4.50%, 2/1/2024 | 43,024 | 46,386 | ||||||||||||||
Fannie Mae, Pool #AC1557, 4.50%, 9/1/2024 | 113,450 | 120,878 | ||||||||||||||
Fannie Mae, Pool #AD0462, 5.50%, 10/1/2024 | 47,177 | 51,430 | ||||||||||||||
Fannie Mae, Pool #MA1834, 4.50%, 2/1/2034 | 1,162,890 | 1,280,029 | ||||||||||||||
Fannie Mae, Pool #MA1890, 4.00%, 5/1/2034 | 1,437,236 | 1,551,925 | ||||||||||||||
Fannie Mae, Pool #MA1903, 4.50%, 5/1/2034 | 1,159,564 | 1,275,731 | ||||||||||||||
Fannie Mae, Pool #AS2547, 3.50%, 6/1/2034 | 933,214 | 986,684 | ||||||||||||||
Fannie Mae, Pool #AS3677, 4.00%, 10/1/2034 | 1,563,026 | 1,672,841 | ||||||||||||||
Fannie Mae, Pool #MA2177, 4.00%, 2/1/2035 | 3,144,706 | 3,401,196 | ||||||||||||||
Fannie Mae, Pool #745147, 4.50%, 12/1/2035 | 46,553 | 51,072 | ||||||||||||||
Fannie Mae, Pool #745418, 5.50%, 4/1/2036 | 753,756 | 855,174 | ||||||||||||||
Fannie Mae, Pool #886904, 6.50%, 9/1/2036 | 63,050 | 72,507 | ||||||||||||||
Fannie Mae, Pool #888021, 6.00%, 12/1/2036 | 224,635 | 257,621 | ||||||||||||||
Fannie Mae, Pool #909786, 5.50%, 3/1/2037 | 243,281 | 274,382 | ||||||||||||||
Fannie Mae, Pool #256673, 5.50%, 4/1/2037 | 1,287,247 | 1,455,794 | ||||||||||||||
Fannie Mae, Pool #918516, 5.50%, 6/1/2037 | 114,884 | 130,073 | ||||||||||||||
Fannie Mae, Pool #995050, 6.00%, 9/1/2037 | 314,248 | 360,602 | ||||||||||||||
Fannie Mae, Pool #AB8161, 6.00%, 12/1/2037 | 1,148,006 | 1,315,193 | ||||||||||||||
Fannie Mae, Pool #933521, 5.00%, 1/1/2038 | 20,688 | 22,880 | ||||||||||||||
Fannie Mae, Pool #972107, 5.00%, 2/1/2038 | 18,954 | 20,962 | ||||||||||||||
Fannie Mae, Pool #889260, 5.00%, 4/1/2038 | 33,092 | 36,599 | ||||||||||||||
Fannie Mae, Pool #933731, 5.50%, 4/1/2038 | 552,918 | 625,117 | ||||||||||||||
Fannie Mae, Pool #889576, 6.00%, 4/1/2038 | 669,580 | 767,961 | ||||||||||||||
Fannie Mae, Pool #912948, 5.00%, 5/1/2038 | 49,552 | 54,803 | ||||||||||||||
Fannie Mae, Pool #975840, 5.00%, 5/1/2038 | 97,570 | 108,750 | ||||||||||||||
Fannie Mae, Pool #889624, 5.50%, 5/1/2038 | 691,051 | 783,147 | ||||||||||||||
Fannie Mae, Pool #889579, 6.00%, 5/1/2038 | 599,698 | 688,128 | ||||||||||||||
Fannie Mae, Pool #995196, 6.00%, 7/1/2038 | 1,037,134 | 1,190,138 | ||||||||||||||
Fannie Mae, Pool #AD0119, 6.00%, 7/1/2038 | 389,521 | 445,873 | ||||||||||||||
Fannie Mae, Pool #986458, 6.00%, 8/1/2038 | 13,015 | 14,898 | ||||||||||||||
Fannie Mae, Pool #987831, 6.00%, 9/1/2038 | 49,735 | 56,931 | ||||||||||||||
Fannie Mae, Pool #990897, 6.00%, 9/1/2038 | 102,537 | 117,372 | ||||||||||||||
Fannie Mae, Pool #AD0220, 6.00%, 10/1/2038 | 121,174 | 139,058 | ||||||||||||||
Fannie Mae, Pool #993920, 6.00%, 11/1/2038 | 87,396 | 100,040 | ||||||||||||||
Fannie Mae, Pool #257497, 6.00%, 12/1/2038 | 35,263 | 40,364 | ||||||||||||||
Fannie Mae, Pool #AA0675, 6.00%, 12/1/2038 | 23,541 | 26,947 | ||||||||||||||
Fannie Mae, Pool #971022, 5.00%, 1/1/2039 | 58,336 | 64,518 | ||||||||||||||
Fannie Mae, Pool #AA1810, 5.00%, 1/1/2039 | 94,142 | 104,118 | ||||||||||||||
Fannie Mae, Pool #890294, 5.50%, 1/1/2039 | 1,327,885 | 1,503,469 | ||||||||||||||
Fannie Mae, Pool #AD0307, 5.50%, 1/1/2039 | 707,898 | 801,225 | ||||||||||||||
Fannie Mae, Pool #983686, 5.00%, 2/1/2039 | 121,019 | 134,006 | ||||||||||||||
Fannie Mae, Pool #AD0527, 5.50%, 6/1/2039 | 268,152 | 303,208 | ||||||||||||||
Fannie Mae, Pool #AE0604, 6.00%, 7/1/2039 | 940,925 | 1,080,582 | ||||||||||||||
The accompanying notes are an integral part of the financial statements.
19
Investment Portfolio - October 31, 2016
| PRO-BLEND® CONSERVATIVE TERM SERIES | PRINCIPAL AMOUNT 3 | VALUE (NOTE 2) | ||||||||||||||
U.S. GOVERNMENT AGENCIES (continued) | ||||||||||||||||
Mortgage-Backed Securities (continued) | ||||||||||||||||
Fannie Mae, Pool #AA6788, 6.00%, 8/1/2039 | 257,958 | $ | 298,010 | |||||||||||||
Fannie Mae, Pool #AC0463, 5.00%, 11/1/2039 | 113,812 | 126,191 | ||||||||||||||
Fannie Mae, Pool #AC5111, 5.00%, 11/1/2039 | 200,196 | 221,938 | ||||||||||||||
Fannie Mae, Pool #MA0258, 4.50%, 12/1/2039 | 1,582,509 | 1,730,224 | ||||||||||||||
Fannie Mae, Pool #MA0259, 5.00%, 12/1/2039 | 87,305 | 96,828 | ||||||||||||||
Fannie Mae, Pool #AC8573, 5.00%, 1/1/2040 | 140,946 | 156,197 | ||||||||||||||
Fannie Mae, Pool #890326, 5.50%, 1/1/2040 | 1,484,961 | 1,681,739 | ||||||||||||||
Fannie Mae, Pool #AL1595, 6.00%, 1/1/2040 | 1,050,628 | 1,204,352 | ||||||||||||||
Fannie Mae, Pool #AE0061, 6.00%, 2/1/2040 | 375,447 | 430,620 | ||||||||||||||
Fannie Mae, Pool #AL0152, 6.00%, 6/1/2040 | 1,389,670 | 1,594,426 | ||||||||||||||
Fannie Mae, Pool #AL2581, 6.00%, 6/1/2040 | 901,805 | 1,033,688 | ||||||||||||||
Fannie Mae, Pool #890519, 6.00%, 10/1/2040 | 2,073,825 | 2,379,551 | ||||||||||||||
Fannie Mae, Pool #AE0951, 4.50%, 2/1/2041 | 1,004,695 | 1,099,357 | ||||||||||||||
Fannie Mae, Pool #AL0241, 4.00%, 4/1/2041 | 1,268,997 | 1,363,161 | ||||||||||||||
Fannie Mae, Pool #AH9054, 4.50%, 4/1/2041 | 434,793 | 475,557 | ||||||||||||||
Fannie Mae, Pool #AI2468, 4.50%, 5/1/2041 | 342,570 | 375,658 | ||||||||||||||
Fannie Mae, Pool #AL0160, 4.50%, 5/1/2041 | 1,032,529 | 1,131,790 | ||||||||||||||
Fannie Mae, Pool #AI5172, 4.00%, 8/1/2041 | 827,426 | 888,708 | ||||||||||||||
Fannie Mae, Pool #AJ1415, 4.50%, 9/1/2041 | 249,562 | 273,140 | ||||||||||||||
Fannie Mae, Pool #AL1410, 4.50%, 12/1/2041 | 2,028,633 | 2,224,151 | ||||||||||||||
Fannie Mae, Pool #AB4300, 3.50%, 1/1/2042 | 357,428 | 376,760 | ||||||||||||||
Fannie Mae, Pool #AK4940, 3.50%, 3/1/2042 | 1,775,733 | 1,871,121 | ||||||||||||||
Fannie Mae, Pool #AL7729, 4.00%, 6/1/2043 | 1,050,929 | 1,128,325 | ||||||||||||||
Fannie Mae, Pool #AL7767, 4.50%, 6/1/2044 | 2,613,568 | 2,856,807 | ||||||||||||||
Fannie Mae, Pool #AX5234, 4.50%, 11/1/2044 | 4,104,028 | 4,487,623 | ||||||||||||||
Fannie Mae, Pool #AS4103, 4.50%, 12/1/2044 | 1,733,100 | 1,917,934 | ||||||||||||||
Fannie Mae, Pool #AZ2001, 3.50%, 5/1/2045 | 2,923,780 | 3,086,308 | ||||||||||||||
Fannie Mae, Pool #AZ3627, 4.00%, 11/1/2045 | 448,020 | 479,779 | ||||||||||||||
Fannie Mae, Pool #BA3890, 4.00%, 11/1/2045 | 573,811 | 614,532 | ||||||||||||||
Fannie Mae, Pool #BA6762, 4.00%, 12/1/2045 | 443,996 | 475,365 | ||||||||||||||
Fannie Mae, Pool #BA6763, 4.00%, 12/1/2045 | 661,495 | 708,643 | ||||||||||||||
Fannie Mae, Pool #MA2514, 4.50%, 1/1/2046 | 171,308 | 187,712 | ||||||||||||||
Fannie Mae, Pool #BC3490, 3.50%, 2/1/2046 | 2,866,505 | 3,009,558 | ||||||||||||||
Fannie Mae, Pool #MA2569, 4.50%, 3/1/2046 | 1,598,704 | 1,749,347 | ||||||||||||||
Fannie Mae, Pool #BC6764, 3.50%, 4/1/2046 | 2,316,099 | 2,431,976 | ||||||||||||||
Fannie Mae, Pool #BD2179, 4.00%, 7/1/2046 | 298,288 | 319,608 | ||||||||||||||
Fannie Mae, Pool #AS7568, 4.50%, 7/1/2046 | 5,899,674 | 6,468,246 | ||||||||||||||
Fannie Mae, Pool #AL8674, 5.655%, 1/1/2049 | 2,154,745 | 2,441,530 | ||||||||||||||
Freddie Mac, Pool #G11850, 5.50%, 7/1/2020 | 147,575 | 154,343 | ||||||||||||||
Freddie Mac, Pool #G12610, 6.00%, 3/1/2022 | 75,069 | 81,101 | ||||||||||||||
Freddie Mac, Pool #G12655, 6.00%, 5/1/2022 | 53,462 | 57,880 | ||||||||||||||
Freddie Mac, Pool #G13078, 6.00%, 3/1/2023 | 72,009 | 77,973 | ||||||||||||||
Freddie Mac, Pool #C91746, 4.50%, 12/1/2033 | 208,951 | 229,958 | ||||||||||||||
Freddie Mac, Pool #C91754, 4.50%, 3/1/2034 | 1,411,194 | 1,553,073 | ||||||||||||||
Freddie Mac, Pool #C91762, 4.50%, 5/1/2034 | 1,848,495 | 2,032,449 | ||||||||||||||
Freddie Mac, Pool #K92054, 4.00%, 10/1/2034 | 1,361,660 | 1,473,472 | ||||||||||||||
Freddie Mac, Pool #C91850, 4.00%, 9/1/2035 | 861,640 | 930,986 | ||||||||||||||
Freddie Mac, Pool #C91854, 4.00%, 10/1/2035 | 2,665,450 | 2,886,515 | ||||||||||||||
Freddie Mac, Pool #G07655, 5.50%, 12/1/2035 | 195,806 | 222,421 | ||||||||||||||
Freddie Mac, Pool #G08216, 5.50%, 8/1/2037 | 443,731 | 502,706 | ||||||||||||||
The accompanying notes are an integral part of the financial statements.
20
Investment Portfolio - October 31, 2016
| PRO-BLEND® CONSERVATIVE TERM SERIES | PRINCIPAL AMOUNT 3 | VALUE (NOTE 2) | ||||||
U.S. GOVERNMENT AGENCIES (continued) | ||||||||
Mortgage-Backed Securities (continued) | ||||||||
Freddie Mac, Pool #G03332, 6.00%, 10/1/2037 | 49,496 | $ | 56,709 | |||||
Freddie Mac, Pool #G03696, 5.50%, 1/1/2038 | 179,260 | 203,131 | ||||||
Freddie Mac, Pool #G03926, 6.00%, 2/1/2038 | 654,666 | 749,887 | ||||||
Freddie Mac, Pool #G04264, 5.50%, 4/1/2038 | 735,805 | 829,582 | ||||||
Freddie Mac, Pool #G04731, 5.50%, 4/1/2038 | 428,942 | 486,971 | ||||||
Freddie Mac, Pool #G04176, 5.50%, 5/1/2038 | 196,444 | 223,116 | ||||||
Freddie Mac, Pool #A78227, 5.50%, 6/1/2038 | 216,781 | 245,793 | ||||||
Freddie Mac, Pool #G08273, 5.50%, 6/1/2038 | 517,816 | 586,604 | ||||||
Freddie Mac, Pool #G04471, 5.50%, 7/1/2038 | 61,037 | 69,005 | ||||||
Freddie Mac, Pool #G04776, 5.50%, 7/1/2038 | 452,931 | 513,477 | ||||||
Freddie Mac, Pool #G05956, 5.50%, 7/1/2038 | 621,052 | 703,799 | ||||||
Freddie Mac, Pool #G05671, 5.50%, 8/1/2038 | 315,892 | 357,884 | ||||||
Freddie Mac, Pool #G05196, 5.50%, 10/1/2038 | 638,810 | 723,676 | ||||||
Freddie Mac, Pool #G05409, 5.50%, 3/1/2039 | 569,833 | 645,704 | ||||||
Freddie Mac, Pool #A86522, 4.50%, 5/1/2039 | 1,321,741 | 1,446,452 | ||||||
Freddie Mac, Pool #G06021, 5.50%, 1/1/2040 | 399,140 | 452,359 | ||||||
Freddie Mac, Pool #G05923, 5.50%, 2/1/2040 | 343,118 | 389,377 | ||||||
Freddie Mac, Pool #G05900, 6.00%, 3/1/2040 | 133,201 | 152,267 | ||||||
Freddie Mac, Pool #G05906, 6.00%, 4/1/2040 | 100,415 | 115,290 | ||||||
Freddie Mac, Pool #G07104, 5.50%, 5/1/2040 | 373,282 | 424,638 | ||||||
Freddie Mac, Pool #G06789, 6.00%, 5/1/2040 | 448,937 | 515,414 | ||||||
Freddie Mac, Pool #A92889, 4.50%, 7/1/2040 | 2,243,684 | 2,455,273 | ||||||
Freddie Mac, Pool #A93451, 4.50%, 8/1/2040 | 2,071,709 | 2,268,355 | ||||||
Freddie Mac, Pool #G07589, 5.50%, 6/1/2041 | 1,559,686 | 1,766,156 | ||||||
Freddie Mac, Pool #G60334, 4.50%, 10/1/2041 | 1,938,940 | 2,122,727 | ||||||
Freddie Mac, Pool #Q17513, 3.50%, 4/1/2043 | 2,586,263 | 2,723,146 | ||||||
Freddie Mac, Pool #Q17719, 3.50%, 4/1/2043 | 1,229,718 | 1,294,716 | ||||||
Freddie Mac, Pool #Q24752, 3.50%, 2/1/2044 | 2,285,324 | 2,405,073 | ||||||
Freddie Mac, Pool #G08669, 4.00%, 9/1/2045 | 2,070,331 | 2,213,238 | ||||||
Freddie Mac, Pool #G08672, 4.00%, 10/1/2045 | 4,764,340 | 5,093,990 | ||||||
Freddie Mac, Pool #Q37174, 4.00%, 11/1/2045 | 1,016,774 | 1,087,590 | ||||||
Freddie Mac, Pool #Q37592, 4.00%, 12/1/2045 | 3,125,736 | 3,370,167 | ||||||
Freddie Mac, Pool #Q37892, 4.00%, 12/1/2045 | 1,287,799 | 1,377,361 | ||||||
Freddie Mac, Pool #G60636, 4.00%, 1/1/2046 | 2,248,659 | 2,405,939 | ||||||
Freddie Mac, Pool #Q38388, 4.00%, 1/1/2046 | 461,566 | 497,648 | ||||||
Freddie Mac, Pool #Q40264, 3.50%, 5/1/2046 | 1,428,782 | 1,500,954 | ||||||
Freddie Mac, Pool #Q42596, 3.50%, 8/1/2046 | 3,268,345 | 3,439,000 | ||||||
Ginnie Mae, Pool #671161, 5.50%, 11/15/2037 | 64,592 | 73,051 | ||||||
|
| |||||||
Total Mortgage-Backed Securities | ||||||||
(Identified Cost $132,811,718) | 135,648,742 | |||||||
|
| |||||||
Other Agencies - 0.7% | ||||||||
Fannie Mae, 2.625%, 9/6/2024 | 6,196,000 | 6,533,986 | ||||||
Freddie Mac, 2.375%, 1/13/2022 | 1,272,000 | �� | 1,328,739 | |||||
|
| |||||||
Total Other Agencies | ||||||||
(Identified Cost $7,904,535) | 7,862,725 | |||||||
|
| |||||||
TOTAL U.S. GOVERNMENT AGENCIES | ||||||||
(Identified Cost $140,716,253) | 143,511,467 | |||||||
|
| |||||||
The accompanying notes are an integral part of the financial statements.
21
Investment Portfolio - October 31, 2016
| PRO-BLEND® CONSERVATIVE TERM SERIES | SHARES/ CONTRACTS | VALUE (NOTE 2) | ||||||
SHORT-TERM INVESTMENT - 0.8% | ||||||||
Dreyfus Government Cash Management11, 0.28%, | ||||||||
(Identified Cost $ 8,680,216) | 8,680,216 | $ | 8,680,216 | |||||
|
| |||||||
TOTAL INVESTMENTS - 99.8% | ||||||||
(Identified Cost $ 1,126,577,967) | 1,159,176,989 | |||||||
OTHER ASSETS, LESS LIABILITIES - 0.2% | 2,878,760 | |||||||
|
| |||||||
NET ASSETS - 100% | $ | 1,162,055,749 | ||||||
|
| |||||||
CALL OPTIONS WRITTEN - 0.0%## | ||||||||
Liberty Global plc - Class A, Strike $ 35, Expiring November 18, 2016, | 415 | $ | (12,450 | ) | ||||
|
| |||||||
PUT OPTIONS WRITTEN - 0.0%## | ||||||||
Facebook, Inc. - Class A, Strike $ 120, Expiring November 4, 2016, | 110 | (4,400 | ) | |||||
The Priceline Group, Inc., Strike $ 1,330, Expiring November 11, 2016, | 9 | (5,940 | ) | |||||
Skyworks Solutions, Inc., Strike $70, Expiring November 4, 2016, | 190 | (8,550 | ) | |||||
|
| |||||||
TOTAL PUT OPTIONS WRITTEN | $ | (18,890 | ) | |||||
|
| |||||||
ADR - American Depositary Receipt
AUD - Australian Dollar
CAD - Canadian Dollar
CLP - Chilean Peso
ETF - Exchange-traded fund
GBP - British Pound
IO - Interest only
KRW - South Korean Won
MXN - Mexican Peso
No. - Number
NOK - Norwegian Krone
SGD - Singapore Dollar
##Less than 0.1%.
*Non-income producing security.
1A factor from a third party vendor was applied to determine the security’s fair value following the close of local trading.
2A portion of this security is designated with the broker as collateral for options contracts written. As of October 31, 2016, the total value of such securities was $13,804,076.
3Amount is stated in USD unless otherwise noted.
4Restricted securities - Investment in securities that are restricted as to public resale under the Securities Act of 1933, as amended. These securities have been sold under Rule 144A and have been determined to be liquid. These securities amount to $123,205,692 or 10.6%, of the Series’ net assets as of October 31, 2016 (see Note 2 to the financial statements).
5Security is perpetual in nature and has no stated maturity date.
6The rate shown is a fixed rate as of October 31, 2016; the rate becomes floating, based on U.S. Treasury Yield Curve Rate Treasury Note Constant Maturity 5 Year in June 2017.
7The rate shown is a fixed rate as of October 31, 2016; the rate becomes floating, based on LIBOR plus a spread, in December 2024.
8The coupon rate is floating and is the effective rate as of October 31, 2016.
9The rate shown is a fixed rate as of October 31, 2016; the rate becomes floating, based on LIBOR plus a spread, in September 2022.
10Represents a Payment-In-Kind bond.
11Rate shown is the current yield as of October 31, 2016.
The Global Industry Classification Standard (GICS) was developed by and is the exclusive property and a service mark of MSCI Inc. (MSCI) and Standard & Poor’s, a division of The McGraw-Hill Companies, Inc. (S&P), and is licensed for use by Manning & Napier when referencing GICS sectors. Neither MSCI, S&P, nor any third party involved in making or compiling the GICS or any GICS classifications makes any express or implied warranties or representations with respect to such standard or classification, nor shall any such party have any liability therefrom.
The accompanying notes are an integral part of the financial statements.
22
Statement of Assets and Liabilities - Pro-Blend® Conservative Term Series
October 31, 2016
ASSETS: | ||||
Investments, at value (identified cost $1,126,577,967) (Note 2) | $ | 1,159,176,989 | ||
Interest receivable | 4,338,412 | |||
Receivable for securities sold | 1,426,372 | |||
Receivable for fund shares sold | 401,772 | |||
Dividends receivable | 299,846 | |||
Foreign tax reclaims receivable | 162,089 | |||
Prepaid and other expenses | 20,338 | |||
|
| |||
TOTAL ASSETS | 1,165,825,818 | |||
|
| |||
LIABILITIES: | ||||
Accrued management fees (Note 3) | 601,973 | |||
Accrued shareholder services fees (Class S) (Note 3) | 125,221 | |||
Accrued distribution and service (Rule 12b-1) fees (Class C) (Class R) (Note 3) | 118,286 | |||
Accrued fund accounting and administration fees (Note 3) | 47,437 | |||
Accrued transfer agent fees (Note 3) | 33,390 | |||
Accrued Directors’ fees (Note 3) | 551 | |||
Accrued Chief Compliance Officer service fees (Note 3) | 353 | |||
Options written, at value (premiums received $57,690) (Note 2) | 31,340 | |||
Accrued foreign capital gains tax (Note 2) | 141 | |||
Payable for fund shares repurchased | 1,405,024 | |||
Payable for securities purchased | 1,302,159 | |||
Other payables and accrued expenses | 104,194 | |||
|
| |||
TOTAL LIABILITIES | 3,770,069 | |||
|
| |||
TOTAL NET ASSETS | $ | 1,162,055,749 | ||
|
| |||
NET ASSETS CONSIST OF: | ||||
Capital stock | $ | 972,086 | ||
Additional paid-in-capital | 1,120,954,687 | |||
Undistributed net investment income | 6,938,681 | |||
Accumulated net realized gain on investments, foreign currency and translation of other assets and liabilities | 585,237 | |||
Net unrealized appreciation on investments (net of foreign capital gains tax of $141), foreign currency and translation of other assets and liabilities | 32,605,058 | |||
|
| |||
TOTAL NET ASSETS | $ | 1,162,055,749 | ||
|
| |||
The accompanying notes are an integral part of the financial statements.
23
Statement of Assets and Liabilities - Pro-Blend® Conservative Term Series
October 31, 2016
NET ASSET VALUE, OFFERING PRICE AND REDEMPTION PRICE PER SHARE - Class S | $ | 13.36 | ||
|
| |||
NET ASSET VALUE, OFFERING PRICE AND REDEMPTION PRICE PER SHARE - Class I | $ | 10.33 | ||
|
| |||
NET ASSET VALUE, OFFERING PRICE AND REDEMPTION PRICE PER SHARE - Class C | $ | 9.91 | ||
|
| |||
NET ASSET VALUE, OFFERING PRICE AND REDEMPTION PRICE PER SHARE - Class R | $ | 9.92 | ||
|
|
The accompanying notes are an integral part of the financial statements.
24
Statement of Operations - Pro-Blend® Conservative Term Series
For the Year Ended October 31, 2016
INVESTMENT INCOME: | ||||
Interest | $ | 21,316,340 | ||
Dividends (net of foreign taxes withheld, $96,281) | 8,272,473 | |||
|
| |||
Total Investment Income | 29,588,813 | |||
|
| |||
EXPENSES: | ||||
Management fees (Note 3) | 7,615,613 | |||
Shareholder services fees (Class S) (Note 3) | 1,607,747 | |||
Distribution and service (Rule 12b-1) fees (Class C) (Note 3) | 1,314,820 | |||
Distribution and service (Rule 12b-1) fees (Class R) (Note 3) | 147,944 | |||
Fund accounting and administration fees (Note 3) | 261,234 | |||
Transfer agent fees (Note 3) | 219,835 | |||
Directors’ fees (Note 3) | 98,746 | |||
Chief Compliance Officer service fees (Note 3) | 3,727 | |||
Custodian fees | 61,915 | |||
Miscellaneous | 187,711 | |||
|
| |||
Total Expenses | 11,519,292 | |||
|
| |||
NET INVESTMENT INCOME | 18,069,521 | |||
|
| |||
REALIZED AND UNREALIZED GAIN (LOSS) ON INVESTMENTS AND FOREIGN CURRENCY: | ||||
Net realized gain (loss) on- | ||||
Investments | 18,596,435 | |||
Futures contracts | (10,954,642 | ) | ||
Options written | 506,836 | |||
Foreign currency and translation of other assets and liabilities | (1,344,466 | ) | ||
|
| |||
| 6,804,163 | ||||
|
| |||
Net change in unrealized appreciation (depreciation) on- | ||||
Investments (net of decrease in accrued foreign capital gains tax of $476) | 7,296,835 | |||
Futures contracts | 1,416,619 | |||
Options written | 26,350 | |||
Foreign currency and translation of other assets and liabilities | (1,711 | ) | ||
|
| |||
| 8,738,093 | ||||
|
| |||
NET REALIZED AND UNREALIZED GAIN (LOSS) ON INVESTMENTS AND FOREIGN CURRENCY | 15,542,256 | |||
|
| |||
NET INCREASE IN NET ASSETS RESULTING FROM OPERATIONS | $ | 33,611,777 | ||
|
| |||
The accompanying notes are an integral part of the financial statements.
25
Statements of Changes in Net Assets - Pro-Blend® Conservative Term Series
FOR THE 10/31/16 | FOR THE 10/31/15 | |||||||
INCREASE (DECREASE) IN NET ASSETS: | ||||||||
OPERATIONS: | ||||||||
Net investment income | $ | 18,069,521 | $ | 25,141,914 | ||||
Net realized gain (loss) on investments and foreign currency | 6,804,163 | (6,336,316 | ) | |||||
Net change in unrealized appreciation (depreciation) on investments and foreign currency | 8,738,093 | (40,113,025 | ) | |||||
|
|
|
| |||||
Net increase (decrease) from operations | 33,611,777 | (21,307,427 | ) | |||||
|
|
|
| |||||
DISTRIBUTIONS TO SHAREHOLDERS (Note 8): | ||||||||
From net investment income (Class S) | (12,113,006 | ) | (14,242,164 | ) | ||||
From net investment income (Class I) | (6,560,592 | ) | (6,793,036 | ) | ||||
From net investment income (Class C) | (1,585,137 | ) | (1,402,026 | ) | ||||
From net investment income (Class R) | (729,050 | ) | (950,123 | ) | ||||
From net realized gain on investments (Class S) | — | (50,314,602 | ) | |||||
From net realized gain on investments (Class I) | — | (19,920,640 | ) | |||||
From net realized gain on investments (Class C) | — | (8,129,404 | ) | |||||
From net realized gain on investments (Class R) | — | (3,664,976 | ) | |||||
|
|
|
| |||||
Total distributions to shareholders | (20,987,785 | ) | (105,416,971 | ) | ||||
|
|
|
| |||||
CAPITAL STOCK ISSUED AND REPURCHASED: | ||||||||
Net decrease from capital share transactions (Note 5) | (281,237,096 | ) | (119,388,459 | ) | ||||
|
|
|
| |||||
Net decrease in net assets | (268,613,104 | ) | (246,112,857 | ) | ||||
NET ASSETS: | ||||||||
Beginning of year | 1,430,668,853 | 1,676,781,710 | ||||||
|
|
|
| |||||
End of year (including undistributed net investment income of $6,938,681 and $11,381,761, respectively) | $ | 1,162,055,749 | $ | 1,430,668,853 | ||||
|
|
|
| |||||
The accompanying notes are an integral part of the financial statements.
26
Financial Highlights - Pro-Blend® Conservative Term Series - Class S
| FOR THE YEARS ENDED | ||||||||||||||||||||
| 10/31/16 | 10/31/15 | 10/31/14 | 10/31/13 | 10/31/12 | ||||||||||||||||
Per share data (for a share outstanding throughout each year): | ||||||||||||||||||||
Net asset value - Beginning of year | $ | 13.15 | $ | 14.13 | $ | 14.18 | $ | 13.62 | $ | 13.16 | ||||||||||
|
|
|
|
|
|
|
|
|
| |||||||||||
Income (loss) from investment operations: | ||||||||||||||||||||
Net investment income1 | 0.19 | 0.22 | 0.22 | 0.22 | 0.22 | |||||||||||||||
Net realized and unrealized gain (loss) on investments | 0.21 | (0.41 | ) | 0.52 | 0.83 | 0.69 | ||||||||||||||
|
|
|
|
|
|
|
|
|
| |||||||||||
Total from investment operations | 0.40 | (0.19 | ) | 0.74 | 1.05 | 0.91 | ||||||||||||||
|
|
|
|
|
|
|
|
|
| |||||||||||
Less distributions to shareholders: | ||||||||||||||||||||
From net investment income | (0.19 | ) | (0.18 | ) | (0.20 | ) | (0.20 | ) | (0.24 | ) | ||||||||||
From net realized gain on investments | — | (0.61 | ) | (0.59 | ) | (0.29 | ) | (0.21 | ) | |||||||||||
|
|
|
|
|
|
|
|
|
| |||||||||||
Total distributions to shareholders | (0.19 | ) | (0.79 | ) | (0.79 | ) | (0.49 | ) | (0.45 | ) | ||||||||||
|
|
|
|
|
|
|
|
|
| |||||||||||
Net asset value - End of year | $ | 13.36 | $ | 13.15 | $ | 14.13 | $ | 14.18 | $ | 13.62 | ||||||||||
|
|
|
|
|
|
|
|
|
| |||||||||||
Net assets - End of year (000’s omitted) | $ | 724,270 | $ | 911,956 | $ | 1,124,851 | $ | 1,027,160 | $ | 973,964 | ||||||||||
|
|
|
|
|
|
|
|
|
| |||||||||||
Total return2 | 3.07 | % | (1.33 | %) | 5.46 | % | 7.93 | % | 7.15 | % | ||||||||||
Ratios (to average net assets)/Supplemental Data: | ||||||||||||||||||||
Expenses | 0.87 | % | 0.88 | % | 0.87 | % | 0.87 | % | 0.88 | % | ||||||||||
Net investment income | 1.47 | % | 1.60 | % | 1.57 | % | 1.58 | % | 1.65 | % | ||||||||||
Series portfolio turnover | 65 | % | 51 | % | 45 | % | 54 | % | 54 | % | ||||||||||
1Calculated based on average shares outstanding during the years.
2Represents aggregate total return for the years indicated, and assumes reinvestment of all distributions.
The accompanying notes are an integral part of the financial statements.
27
Financial Highlights - Pro-Blend® Conservative Term Series - Class I
| FOR THE YEARS ENDED | ||||||||||||||||||||
| 10/31/16 | 10/31/15 | 10/31/14 | 10/31/13 | 10/31/12 | ||||||||||||||||
Per share data (for a share outstanding throughout each year): | ||||||||||||||||||||
Net asset value - Beginning of year | $ | 10.22 | $ | 11.17 | $ | 11.38 | $ | 11.03 | $ | 10.75 | ||||||||||
|
|
|
|
|
|
|
|
|
| |||||||||||
Income (loss) from investment operations: | ||||||||||||||||||||
Net investment income1 | 0.17 | 0.19 | 0.20 | 0.20 | 0.20 | |||||||||||||||
Net realized and unrealized gain (loss) on investments | 0.15 | (0.32 | ) | 0.40 | 0.66 | 0.55 | ||||||||||||||
|
|
|
|
|
|
|
|
|
| |||||||||||
Total from investment operations | 0.32 | (0.13 | ) | 0.60 | 0.86 | 0.75 | ||||||||||||||
|
|
|
|
|
|
|
|
|
| |||||||||||
Less distributions to shareholders: | ||||||||||||||||||||
From net investment income | (0.21 | ) | (0.21 | ) | (0.22 | ) | (0.22 | ) | (0.26 | ) | ||||||||||
From net realized gain on investments | — | (0.61 | ) | (0.59 | ) | (0.29 | ) | (0.21 | ) | |||||||||||
|
|
|
|
|
|
|
|
|
| |||||||||||
Total distributions to shareholders | (0.21 | ) | (0.82 | ) | (0.81 | ) | (0.51 | ) | (0.47 | ) | ||||||||||
|
|
|
|
|
|
|
|
|
| |||||||||||
Net asset value - End of year | $ | 10.33 | $ | 10.22 | $ | 11.17 | $ | 11.38 | $ | 11.03 | ||||||||||
|
|
|
|
|
|
|
|
|
| |||||||||||
Net assets - End of year (000’s omitted) | $ | 291,632 | $ | 325,700 | $ | 353,538 | $ | 318,106 | $ | 249,566 | ||||||||||
|
|
|
|
|
|
|
|
|
| |||||||||||
Total return2 | 3.26 | % | (1.15 | %) | 5.66 | % | 8.15 | % | 7.34 | % | ||||||||||
Ratios (to average net assets)/Supplemental Data: | ||||||||||||||||||||
Expenses | 0.67 | % | 0.68 | % | 0.67 | % | 0.67 | % | 0.68 | % | ||||||||||
Net investment income | 1.66 | % | 1.81 | % | 1.77 | % | 1.77 | % | 1.84 | % | ||||||||||
Series portfolio turnover | 65 | % | 51 | % | 45 | % | 54 | % | 54 | % | ||||||||||
1Calculated based on average shares outstanding during the years.
2Represents aggregate total return for the years indicated, and assumes reinvestment of all distributions.
The accompanying notes are an integral part of the financial statements.
28
Financial Highlights - Pro-Blend® Conservative Term Series - Class C
| FOR THE YEARS ENDED | ||||||||||||||||||||
| 10/31/16 | 10/31/15 | 10/31/14 | 10/31/13 | 10/31/12 | ||||||||||||||||
Per share data (for a share outstanding throughout each year): | ||||||||||||||||||||
Net asset value - Beginning of year | $ | 9.81 | $ | 10.75 | $ | 10.99 | $ | 10.68 | $ | 10.42 | ||||||||||
|
|
|
|
|
|
|
|
|
| |||||||||||
Income (loss) from investment operations: | ||||||||||||||||||||
Net investment income1 | 0.06 | 0.08 | 0.08 | 0.08 | 0.09 | |||||||||||||||
Net realized and unrealized gain (loss) on investments | 0.15 | (0.31 | ) | 0.39 | 0.65 | 0.55 | ||||||||||||||
|
|
|
|
|
|
|
|
|
| |||||||||||
Total from investment operations | 0.21 | (0.23 | ) | 0.47 | 0.73 | 0.64 | ||||||||||||||
|
|
|
|
|
|
|
|
|
| |||||||||||
Less distributions to shareholders: | ||||||||||||||||||||
From net investment income | (0.11 | ) | (0.10 | ) | (0.12 | ) | (0.13 | ) | (0.17 | ) | ||||||||||
From net realized gain on investments | — | (0.61 | ) | (0.59 | ) | (0.29 | ) | (0.21 | ) | |||||||||||
|
|
|
|
|
|
|
|
|
| |||||||||||
Total distributions to shareholders | (0.11 | ) | (0.71 | ) | (0.71 | ) | (0.42 | ) | (0.38 | ) | ||||||||||
|
|
|
|
|
|
|
|
|
| |||||||||||
Net asset value - End of year | $ | 9.91 | $ | 9.81 | $ | 10.75 | $ | 10.99 | $ | 10.68 | ||||||||||
|
|
|
|
|
|
|
|
|
| |||||||||||
Net assets - End of year (000’s omitted) | $ | 127,100 | $ | 137,697 | $ | 139,291 | $ | 102,919 | $ | 72,239 | ||||||||||
|
|
|
|
|
|
|
|
|
| |||||||||||
Total return2 | 2.24 | % | (2.10 | %) | 4.58 | % | 7.06 | % | 6.42 | % | ||||||||||
Ratios (to average net assets)/Supplemental Data: | ||||||||||||||||||||
Expenses | 1.67 | % | 1.68 | % | 1.67 | % | 1.67 | % | 1.69 | % | ||||||||||
Net investment income | 0.66 | % | 0.81 | % | 0.77 | % | 0.78 | % | 0.84 | % | ||||||||||
Series portfolio turnover | 65 | % | 51 | % | 45 | % | 54 | % | 54 | % | ||||||||||
1Calculated based on average shares outstanding during the years.
2Represents aggregate total return for the years indicated, and assumes reinvestment of all distributions.
The accompanying notes are an integral part of the financial statements.
29
Financial Highlights - Pro-Blend® Conservative Term Series - Class R
| FOR THE YEARS ENDED | ||||||||||||||||||||
| 10/31/16 | 10/31/15 | 10/31/14 | 10/31/13 | 10/31/12 | ||||||||||||||||
Per share data (for a share outstanding throughout each year): | ||||||||||||||||||||
Net asset value - Beginning of year | $ | 9.81 | $ | 10.75 | $ | 10.99 | $ | 10.67 | $ | 10.44 | ||||||||||
|
|
|
|
|
|
|
|
|
| |||||||||||
Income (loss) from investment operations: | ||||||||||||||||||||
Net investment income1 | 0.12 | 0.13 | 0.14 | 0.14 | 0.14 | |||||||||||||||
Net realized and unrealized gain (loss) on investments | 0.15 | (0.30 | ) | 0.38 | 0.64 | 0.54 | ||||||||||||||
|
|
|
|
|
|
|
|
|
| |||||||||||
Total from investment operations | 0.27 | (0.17 | ) | 0.52 | 0.78 | 0.68 | ||||||||||||||
|
|
|
|
|
|
|
|
|
| |||||||||||
Less distributions to shareholders: | ||||||||||||||||||||
From net investment income | (0.16 | ) | (0.16 | ) | (0.17 | ) | (0.17 | ) | (0.24 | ) | ||||||||||
From net realized gain on investments | — | (0.61 | ) | (0.59 | ) | (0.29 | ) | (0.21 | ) | |||||||||||
|
|
|
|
|
|
|
|
|
| |||||||||||
Total distributions to shareholders | (0.16 | ) | (0.77 | ) | (0.76 | ) | (0.46 | ) | (0.45 | ) | ||||||||||
|
|
|
|
|
|
|
|
|
| |||||||||||
Net asset value - End of year | $ | 9.92 | $ | 9.81 | $ | 10.75 | $ | 10.99 | $ | 10.67 | ||||||||||
|
|
|
|
|
|
|
|
|
| |||||||||||
Net assets - End of year (000’s omitted) | $ | 19,054 | $ | 55,315 | $ | 59,101 | $ | 48,272 | $ | 32,988 | ||||||||||
|
|
|
|
|
|
|
|
|
| |||||||||||
Total return2 | 2.79 | % | (1.60 | %) | 5.08 | % | 7.64 | % | 6.85 | % | ||||||||||
Ratios (to average net assets)/Supplemental Data: | ||||||||||||||||||||
Expenses | 1.17 | % | 1.18 | % | 1.17 | % | 1.17 | % | 1.19 | % | ||||||||||
Net investment income | 1.19 | % | 1.30 | % | 1.27 | % | 1.28 | % | 1.32 | % | ||||||||||
Series portfolio turnover | 65 | % | 51 | % | 45 | % | 54 | % | 54 | % | ||||||||||
1Calculated based on average shares outstanding during the years.
2Represents aggregate total return for the years indicated, and assumes reinvestment of all distributions.
The accompanying notes are an integral part of the financial statements.
30
Performance Update as of October 31, 2016 - Pro-Blend® Moderate Term Series
(unaudited)
| AVERAGE ANNUAL TOTAL RETURNS AS OF OCTOBER 31, 2016 | ||||||||||||||||
ONE YEAR1 | FIVE YEAR | TEN YEAR | SINCE INCEPTION2 | |||||||||||||
Manning & Napier Fund, Inc. - Pro-Blend® Moderate Term | 2.77 | % | 5.29 | % | 4.32 | % | 6.55 | % | ||||||||
Manning & Napier Fund, Inc. - Pro-Blend® Moderate Term | 3.08 | % | 5.57 | % | 4.55 | % | 6.65 | % | ||||||||
Manning & Napier Fund, Inc. - Pro-Blend® Moderate Term | 1.98 | % | 4.50 | % | 3.54 | % | 5.82 | % | ||||||||
Manning & Napier Fund, Inc. - Pro-Blend® Moderate Term | 2.55 | % | 5.03 | % | 4.04 | % | 6.34 | % | ||||||||
Bloomberg Barclays U.S. Aggregate Bond Index6 | 4.37 | % | 2.90 | % | 4.64 | % | 5.46 | % | ||||||||
30/10/60 Blended Index7 | 4.07 | % | 6.20 | % | 5.34 | % | 6.79 | % | ||||||||
The following graph compares the value of a $10,000 investment in the Manning & Napier Fund, Inc. - Pro-Blend® Moderate Term Series - Class S for the ten years ended October 31, 2016 to the Bloomberg Barclays U.S. Aggregate Bond Index and the 30/10/60 Blended Index.
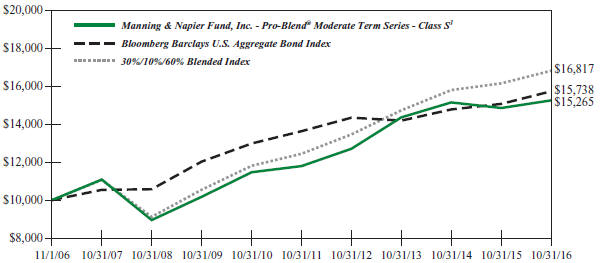
1The returns shown are based on net asset values calculated for shareholder transactions and may differ from the returns shown in the financial highlights, which reflect adjustments made to the net asset values in accordance with accounting principles generally accepted in the United States of America.
2Performance numbers for the Series are calculated from September 15, 1993, the Class S inception date. The Bloomberg Barclays U.S. Aggregate Bond Index only publishes month-end numbers; therefore, performance numbers for the Indices are calculated from September 30, 1993.
3The Series’ performance does not reflect the deduction of taxes that a shareholder would pay on fund distributions or the redemption of shares. The Series’ performance is historical and may not be indicative of future results. The performance returns shown are inclusive of the net expense ratio of the Series. For the year ended October 31, 2016, this net expense ratio was 1.07% for Class S, 0.82% for Class I, 1.82% for Class C and 1.32% for Class R. The gross expense ratio, which does not account for any voluntary or contractual waivers currently in effect, was 1.07% for Class S, 0.82% for Class I, 1.82% for Class C and 1.32% for Class R for the year ended October 31, 2016.
4For the periods through the inception of Class I on March 28, 2008, performance is based on the hypothetical performance of Class S shares. Because Class I shares invest in the same portfolio of securities as Class S, performance will only be different to the extent that the Class S shares have a higher expense ratio.
5For periods through the inception of Class C on January 4, 2010 and Class R on June 30, 2010, the performance figures are hypothetical and reflect the performance of the Manning & Napier Fund, Inc. - Pro-Blend® Moderate Term Series - Class S adjusted for expense differences.
6The Bloomberg Barclays U.S. Aggregate Bond Index is an unmanaged, market-value weighted index of U.S. domestic investment-grade debt issues, including government, corporate, asset-backed, and mortgage-backed securities, with maturities of one year or more. Index returns do not reflect any fees or expenses. Index returns provided by Interactive Data.
31
Performance Update as of October 31, 2016 - Pro-Blend® Moderate Term Series
(unaudited)
7The 30/10/60 Blended Index is 30% Russell 3000® Index (Russell 3000), 10% MSCI ACWI ex USA Index (ACWIxUS), and 60% Bloomberg Barclays U.S. Aggregate Bond Index (BAB). Russell 3000 is an unmanaged index that consists of 3,000 of the largest U.S. companies based on total market capitalization. Index returns are based on a market capitalization-weighted average of relative price changes of the component stocks plus dividends whose reinvestments are compounded daily. Index returns provided by Bloomberg. ACWIxUS is a free float-adjusted market capitalization index that is designed to measure equity market performance in the global developed and emerging markets and consists of 45 developed and emerging market country indices outside the U.S. The Index is denominated in U.S. dollars. The Index returns assume daily investment of gross dividends (which do not account for applicable dividend taxation) prior to 12/31/1998, as net returns were not available. Subsequent to 12/31/1998, the Index returns are net of withholding taxes. They assume daily reinvestment of net dividends thus accounting for any applicable dividend taxation. Index returns provided by Bloomberg. BAB is an unmanaged, market value-weighted index of U.S. domestic investment-grade debt issues, including government, corporate, asset-backed and mortgage-backed securities with maturities of one year or more. Index returns provided by Interactive Data. The returns of the indices do not reflect any fees or expenses. Returns provided are calculated monthly using a blended allocation. Because the Series’ asset allocation will vary over time, the composition of the Series’ portfolio may not match the composition of the comparative Indices. Mid-month performance may not be available for all indices within the blended index. Where applicable, performance for those indices is included from the first of the month following the corresponding Series’ inception date.
32
Shareholder Expense Example - Pro-Blend® Moderate Term Series
(unaudited)
As a shareholder of the Series, you incur ongoing costs, including management fees, shareholder service fees and other Series expenses. This example is intended to help you understand your ongoing costs (in dollars) of investing in the Series and to compare these costs with the ongoing costs of investing in other mutual funds.
The example is based on an investment of $1,000 invested in each class at the beginning of the period and held for the entire period (May 1, 2016 to October 31, 2016).
Actual Expenses
The Actual lines of the table below provide information about actual account values and actual expenses. You may use the information in these lines, together with the amount you invested, to estimate the expenses that you paid over the period. Simply divide your account value by $1,000 (for example, an $8,600 account value divided by $1,000 = 8.6), then multiply the result by the number in the Actual line for the Class in which you have invested under the heading entitled “Expenses Paid During Period” to estimate the expenses you paid on your account during this period.
Hypothetical Example for Comparison Purposes
The Hypothetical lines of each class in the table below provide information about hypothetical account values and hypothetical expenses based on the Class’ actual expense ratio and an assumed rate of return of 5% per year before expenses, which is not the Class’ actual return. The hypothetical account values and expenses may not be used to estimate the actual ending account balance or expenses you paid during the period. You may use this information to compare the ongoing costs of investing in a class of the Series and other funds. To do so, compare this 5% hypothetical example for the Class in which you have invested with the 5% hypothetical examples that appear in the shareholder reports of the other funds.
Please note that the expenses shown in the table are meant to highlight your ongoing costs only and do not reflect any transaction costs such as sales charges (loads), redemption fees, or exchange fees that you may incur in other mutual funds. Therefore, the second line of the table is useful in comparing ongoing costs only, and will not help you determine the relative total costs of owning different funds.
BEGINNING 5/1/16 | ENDING 10/31/16 | EXPENSES PAID 5/1/16-10/31/16* | ANNUALIZED EXPENSE RATIO | |||||
Class S | ||||||||
Actual | $1,000.00 | $1,023.40 | $5.49 | 1.08% | ||||
Hypothetical (5% return before expenses) | $1,000.00 | $1,019.71 | $5.48 | 1.08% | ||||
Class I | ||||||||
Actual | $1,000.00 | $1,025.20 | $4.17 | 0.82% | ||||
Hypothetical (5% return before expenses) | $1,000.00 | $1,021.01 | $4.17 | 0.82% | ||||
Class C | ||||||||
Actual | $1,000.00 | $1,019.50 | $9.29 | 1.83% | ||||
Hypothetical (5% return before expenses) | $1,000.00 | $1,015.94 | $9.27 | 1.83% | ||||
Class R | ||||||||
Actual | $1,000.00 | $1,021.60 | $6.76 | 1.33% | ||||
Hypothetical (5% return before expenses) | $1,000.00 | $1,018.45 | $6.75 | 1.33% |
* Expenses are equal to the Class’ annualized expense ratio (for the six-month period), multiplied by the average account value over the period, multiplied by 184/366 to reflect the one-half year period. Expenses are based on the most recent fiscal half year; therefore, the expense ratios stated above may differ from the expense ratios stated in the financial highlights, which are based on one-year data.
33
Portfolio Composition - Pro-Blend® Moderate Term Series
As of October 31, 2016 (unaudited)
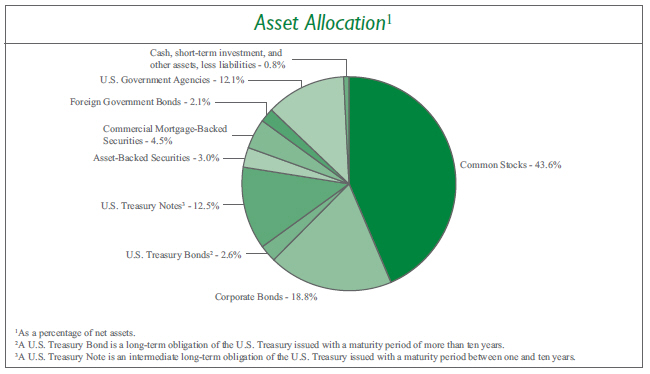
Sector Allocation4 | ||||
Information Technology | 15.0% | |||
Consumer Discretionary | 11.1% | |||
Financials | 6.6% | |||
Health Care | 5.6% | |||
Consumer Staples | 5.3% | |||
Industrials | 4.8% | |||
Energy | 4.7% | |||
Materials | 4.1% | |||
Real Estate | 3.4% | |||
Telecommunication Services | 1.6% | |||
Utilities | 0.1% | |||
| 4Including common stocks and corporate bonds, as a percentage of total investments. | ||||
Top Ten Stock Holdings5 | ||||
ServiceNow, Inc. | 1.6% | |||
Cerner Corp. | 1.6% | |||
Facebook, Inc. - Class A | 1.5% | |||
Monsanto Co. | 1.5% | |||
MasterCard, Inc. - Class A | 1.5% | |||
Apple, Inc. | 1.3% | |||
Electronic Arts, Inc. | 1.3% | |||
The Priceline Group, Inc. | 1.2% | |||
Medtronic plc | 1.2% | |||
Amazon.com, Inc. | 1.1% | |||
| 5As a percentage of total investments. | ||||
34
Investment Portfolio - October 31, 2016
| PRO-BLEND® MODERATE TERM SERIES | SHARES | VALUE (NOTE 2) | ||||||||||
COMMON STOCKS - 43.6% | ||||||||||||
Consumer Discretionary - 9.6% | ||||||||||||
Diversified Consumer Services - 0.1% | ||||||||||||
Fu Shou Yuan International Group Ltd. (China)1 | 1,362,140 | $ | 797,935 | |||||||||
Kroton Educacional S.A. (Brazil) | 61,802 | 307,655 | ||||||||||
|
| |||||||||||
| 1,105,590 | ||||||||||||
|
| |||||||||||
Hotels, Restaurants & Leisure - 0.8% | ||||||||||||
Accor S.A. (France)1 | 12,630 | 479,265 | ||||||||||
Yum! Brands, Inc. | 86,480 | 7,461,494 | ||||||||||
|
| |||||||||||
| 7,940,759 | ||||||||||||
|
| |||||||||||
Household Durables - 0.0%## | ||||||||||||
LGI Homes, Inc.* | 5,340 | 158,918 | ||||||||||
|
| |||||||||||
Internet & Direct Marketing Retail - 3.1% | ||||||||||||
Amazon.com, Inc.* | 13,970 | 11,033,785 | ||||||||||
ASOS plc (United Kingdom)*1 | 11,340 | 727,959 | ||||||||||
Expedia, Inc. | 5,950 | 768,918 | ||||||||||
The Priceline Group, Inc.* | 7,980 | 11,764,355 | ||||||||||
Rakuten, Inc. (Japan)1 | 76,860 | 886,093 | ||||||||||
TripAdvisor, Inc.*2 | 65,930 | 4,251,166 | ||||||||||
Zalando SE (Germany)*1,3 | 13,610 | 598,498 | ||||||||||
|
| |||||||||||
| 30,030,774 | ||||||||||||
|
| |||||||||||
Leisure Products - 0.1% | ||||||||||||
Shimano, Inc. (Japan)1 | 3,420 | 584,750 | ||||||||||
|
| |||||||||||
Media - 3.9% | ||||||||||||
Global Mediacom Tbk PT (Indonesia)1 . | 2,327,300 | 151,446 | ||||||||||
ITV plc (United Kingdom)1 | 1,279,780 | 2,668,031 | ||||||||||
Liberty Global plc - Class A - ADR (United Kingdom)* | 249,599 | 8,136,927 | ||||||||||
Surya Citra Media Tbk PT (Indonesia)1 | 1,719,770 | 349,269 | ||||||||||
Time Warner, Inc. | 112,930 | 10,049,641 | ||||||||||
Tribune Media Co. - Class A | 190,860 | 6,222,036 | ||||||||||
Twenty-First Century Fox, Inc. - Class A | 369,500 | 9,706,765 | ||||||||||
|
| |||||||||||
| 37,284,115 | ||||||||||||
|
| |||||||||||
Specialty Retail - 0.6% | ||||||||||||
Advance Auto Parts, Inc. | 8,290 | 1,161,263 | ||||||||||
Kingfisher plc (United Kingdom)1 | 976,740 | 4,314,690 | ||||||||||
Monro Muffler Brake, Inc. | 9,800 | 539,000 | ||||||||||
Mr Price Group Ltd. (South Africa)1 | 11,030 | 125,660 | ||||||||||
|
| |||||||||||
| 6,140,613 | ||||||||||||
|
| |||||||||||
Textiles, Apparel & Luxury Goods - 1.0% | ||||||||||||
ANTA Sports Products Ltd. (China)1 | 133,980 | 386,375 | ||||||||||
Kering (France)1 | 3,690 | 818,701 | ||||||||||
lululemon athletica, Inc.* | 148,947 | 8,527,216 | ||||||||||
|
| |||||||||||
| 9,732,292 | ||||||||||||
|
| |||||||||||
Total Consumer Discretionary | 92,977,811 | |||||||||||
|
| |||||||||||
Consumer Staples - 4.0% | ||||||||||||
Beverages - 2.4% | ||||||||||||
Ambev S.A. - ADR (Brazil) | 1,638,336 | 9,666,182 | ||||||||||
Anheuser-Busch InBev S.A./N.V. (Belgium)1 | 51,005 | 5,853,859 | ||||||||||
Cia Cervecerias Unidas S.A. - ADR (Chile) | 17,700 | 380,550 | ||||||||||
Diageo plc (United Kingdom)1 | 267,383 | 7,116,839 | ||||||||||
Fomento Economico Mexicano S.A.B.de C.V. - ADR (Mexico) | 1,870 | 178,903 | ||||||||||
Treasury Wine Estates Ltd. (Australia)1 | 37,246 | 303,643 | ||||||||||
|
| |||||||||||
| 23,499,976 | ||||||||||||
|
| |||||||||||
Food & Staples Retailing - 0.1% | ||||||||||||
Dairy Farm International Holdings Ltd. (Hong Kong)1 | 120,600 | 852,743 | ||||||||||
Tesco plc (United Kingdom)*1 | 53,095 | 136,757 | ||||||||||
|
| |||||||||||
| 989,500 | ||||||||||||
|
| |||||||||||
Food Products - 0.6% | ||||||||||||
Adecoagro S.A. (Argentina)* | 87,880 | 966,680 | ||||||||||
BRF S.A. (Brazil) | 18,140 | 303,356 | ||||||||||
BRF S.A. - ADR (Brazil) | 9,170 | 153,322 | ||||||||||
Danone S.A. (France)1 | 8,241 | 571,585 | ||||||||||
Gruma S.A.B de C.V. - Class B (Mexico) | 12,900 | 179,321 | ||||||||||
Nestle S.A. (Switzerland)1 | 11,044 | 800,844 | ||||||||||
Sao Martinho S.A. (Brazil) | 38,710 | 773,836 | ||||||||||
Suedzucker AG (Germany)1 | 11,826 | 303,368 | ||||||||||
Tiger Brands Ltd. (South Africa)1 | 10,350 | 294,731 | ||||||||||
Universal Robina Corp. (Philippines)1 | 234,500 | 881,200 | ||||||||||
|
| |||||||||||
| 5,228,243 | ||||||||||||
|
| |||||||||||
Personal Products - 0.8% | ||||||||||||
Beiersdorf AG (Germany)1 | 1,460 | 128,714 | ||||||||||
Unilever plc - ADR (United Kingdom) | 178,599 | 7,442,220 | ||||||||||
|
| |||||||||||
| 7,570,934 | ||||||||||||
|
| |||||||||||
Tobacco - 0.1% | ||||||||||||
Gudang Garam Tbk PT (Indonesia)1 | 105,100 | 546,838 | ||||||||||
Japan Tobacco, Inc. (Japan)1 | 10,000 | 380,201 | ||||||||||
KT&G Corp. (South Korea)1 | 1,800 | 177,534 | ||||||||||
|
| |||||||||||
| 1,104,573 | ||||||||||||
|
| |||||||||||
Total Consumer Staples | 38,393,226 | |||||||||||
|
| |||||||||||
Energy - 1.6% | ||||||||||||
Energy Equipment & Services - 0.8% | ||||||||||||
Schlumberger Ltd. | 101,723 | 7,957,790 | ||||||||||
|
| |||||||||||
Oil, Gas & Consumable Fuels - 0.8% | ||||||||||||
Cameco Corp. (Canada) | 32,629 | 251,243 | ||||||||||
Cosan S.A. Industria e Comercio (Brazil) | 17,490 | 234,022 | ||||||||||
The accompanying notes are an integral part of the financial statements.
35
Investment Portfolio - October 31, 2016
| PRO-BLEND® MODERATE TERM SERIES | SHARES | VALUE (NOTE 2) | ||||||||||
COMMON STOCKS (continued) | ||||||||||||
Energy (continued) | ||||||||||||
Oil, Gas & Consumable Fuels (continued) | ||||||||||||
Galp Energia SGPS S.A. (Portugal)1 | 68,640 | $ | 930,645 | |||||||||
Range Resources Corp. | 156,120 | 5,275,295 | ||||||||||
Royal Dutch Shell plc - Class B (Netherlands)1 | 5,772 | 148,875 | ||||||||||
Royal Dutch Shell plc - Class B - ADR (Netherlands) | 5,730 | 299,736 | ||||||||||
|
| |||||||||||
| 7,139,816 | ||||||||||||
|
| |||||||||||
Total Energy | 15,097,606 | |||||||||||
|
| |||||||||||
Financials - 0.8% | ||||||||||||
Banks - 0.0%## | ||||||||||||
ICICI Bank Ltd. - ADR (India) | 32,510 | 269,508 | ||||||||||
|
| |||||||||||
Capital Markets - 0.8% | ||||||||||||
BlackRock, Inc. | 20,730 | 7,073,905 | ||||||||||
JSE Ltd. (South Africa)1 | 16,500 | 192,227 | ||||||||||
|
| |||||||||||
| 7,266,132 | ||||||||||||
|
| |||||||||||
Total Financials | 7,535,640 | |||||||||||
|
| |||||||||||
Health Care - 5.2% | ||||||||||||
Biotechnology - 0.3% | ||||||||||||
Alexion Pharmaceuticals, Inc.* | 4,660 | 608,130 | ||||||||||
BioMarin Pharmaceutical, Inc.* | 6,230 | 501,640 | ||||||||||
China Biologic Products, Inc. (China)* | 3,190 | 376,771 | ||||||||||
Incyte Corp. Ltd.* | 4,880 | 424,414 | ||||||||||
Seattle Genetics, Inc.* | 9,450 | 488,565 | ||||||||||
Vertex Pharmaceuticals, Inc.* | 6,240 | 473,366 | ||||||||||
|
| |||||||||||
| 2,872,886 | ||||||||||||
|
| |||||||||||
Health Care Equipment & Supplies - 1.2% | ||||||||||||
Essilor International S.A. (France)1 | 3,650 | 410,165 | ||||||||||
Medtronic plc | 137,430 | 11,272,009 | ||||||||||
|
| |||||||||||
| 11,682,174 | ||||||||||||
|
| |||||||||||
Health Care Providers & Services - 0.8% | ||||||||||||
Acadia Healthcare Co., Inc.* | 15,850 | 569,966 | ||||||||||
Brookdale Senior Living, Inc.* | 5,050 | 72,872 | ||||||||||
DaVita, Inc.* | 12,820 | 751,508 | ||||||||||
Express Scripts Holding Co.*2 | 75,810 | 5,109,594 | ||||||||||
Fresenius Medical Care AG & Co. KGaA (Germany)1 | 3,860 | 314,414 | ||||||||||
Fresenius Medical Care AG & Co. KGaA - ADR (Germany) | 14,020 | 568,932 | ||||||||||
KPJ Healthcare Berhad (Malaysia)1 | 238,490 | 238,774 | ||||||||||
Odontoprev S.A. (Brazil) | 59,500 | 223,684 | ||||||||||
Siloam International Hospitals Tbk PT (Indonesia)*1 | 365,200 | 290,386 | ||||||||||
|
| |||||||||||
| 8,140,130 | ||||||||||||
|
| |||||||||||
Health Care Technology - 1.6% | ||||||||||||
Cerner Corp.* | 264,190 | 15,476,251 | ||||||||||
|
| |||||||||||
Life Sciences Tools & Services - 0.0%## | ||||||||||||
QIAGEN N.V.* | 6,830 | 166,515 | ||||||||||
QIAGEN N.V.*1 | 5,070 | 124,000 | ||||||||||
|
| |||||||||||
| 290,515 | ||||||||||||
|
| |||||||||||
Pharmaceuticals - 1.3% | ||||||||||||
AstraZeneca plc - ADR (United Kingdom) | 20,640 | 584,525 | ||||||||||
Genomma Lab Internacional S.A.B. de C.V. - Class B (Mexico)* | 118,860 | 142,624 | ||||||||||
GlaxoSmithKline plc (United Kingdom)1 | 11,020 | 217,694 | ||||||||||
Johnson & Johnson | 89,400 | 10,369,506 | ||||||||||
Novartis AG - ADR (Switzerland) | 8,880 | 630,658 | ||||||||||
Perrigo Co. plc | 2,550 | 212,134 | ||||||||||
|
| |||||||||||
| 12,157,141 | ||||||||||||
|
| |||||||||||
Total Health Care | 50,619,097 | |||||||||||
|
| |||||||||||
Industrials - 2.7% | ||||||||||||
Aerospace & Defense - 0.6% | ||||||||||||
Korea Aerospace Industries Ltd. (South Korea)1 | 7,234 | 408,583 | ||||||||||
LIG Nex1 Co. Ltd. (South Korea)1 | 5,320 | 343,448 | ||||||||||
Safran S.A. (France)1 | 74,860 | 5,151,241 | ||||||||||
|
| |||||||||||
| 5,903,272 | ||||||||||||
|
| |||||||||||
Airlines - 0.1% | ||||||||||||
easyJet plc (United Kingdom)1 | 20,410 | 234,054 | ||||||||||
Ryanair Holdings plc - ADR (Ireland)* | 10,804 | 811,272 | ||||||||||
|
| |||||||||||
| 1,045,326 | ||||||||||||
|
| |||||||||||
Commercial Services & Supplies - 0.0%## | ||||||||||||
China Everbright International Ltd. (China)1 | 117,280 | 140,200 | ||||||||||
KEPCO Plant Service & Engineering Co. Ltd. (South Korea)1 | 2,970 | 142,377 | ||||||||||
|
| |||||||||||
| 282,577 | ||||||||||||
|
| |||||||||||
Industrial Conglomerates - 0.1% | ||||||||||||
Siemens AG (Germany)1 | 11,180 | 1,270,249 | ||||||||||
|
| |||||||||||
Machinery - 0.8% | ||||||||||||
Alstom S.A. (France)*1 | 15,460 | 415,438 | ||||||||||
ANDRITZ AG (Austria)1 | 8,680 | 453,839 | ||||||||||
FANUC Corp. (Japan)1 | 2,699 | 494,153 | ||||||||||
Flowserve Corp. | 95,500 | 4,044,425 | ||||||||||
GEA Group AG (Germany)1 | 24,940 | 965,977 | ||||||||||
SMC Corp. (Japan)1 | 2,800 | 811,651 | ||||||||||
Sulzer AG (Switzerland)1 | 1,430 | 140,828 | ||||||||||
The Weir Group plc (United Kingdom)1 | 5,350 | 111,135 | ||||||||||
|
| |||||||||||
| 7,437,446 | ||||||||||||
|
| |||||||||||
The accompanying notes are an integral part of the financial statements.
36
Investment Portfolio - October 31, 2016
| PRO-BLEND® MODERATE TERM SERIES | SHARES | VALUE (NOTE 2) | ||||||||||
COMMON STOCKS (continued) | ||||||||||||
Industrials (continued) | ||||||||||||
Professional Services - 0.9% | ||||||||||||
Applus Services S.A. (Spain)1 | 40,070 | $ | 384,471 | |||||||||
Bureau Veritas S.A. (France)1 | 17,580 | 332,037 | ||||||||||
Nielsen Holdings plc | 170,660 | 7,683,113 | ||||||||||
|
| |||||||||||
| 8,399,621 | ||||||||||||
|
| |||||||||||
Road & Rail - 0.2% | ||||||||||||
Genesee & Wyoming, Inc. - Class A* | 11,320 | 769,081 | ||||||||||
Kansas City Southern | 8,550 | 750,348 | ||||||||||
|
| |||||||||||
| 1,519,429 | ||||||||||||
|
| |||||||||||
Trading Companies & Distributors - 0.0%## | ||||||||||||
Brenntag AG (Germany)1 | 6,343 | 339,099 | ||||||||||
Howden Joinery Group plc (United Kingdom)1 | 10,800 | 49,455 | ||||||||||
|
| |||||||||||
| 388,554 | ||||||||||||
|
| |||||||||||
Transportation Infrastructure - 0.0%## | ||||||||||||
Aena S.A. (Spain)1,3 | 790 | 115,764 | ||||||||||
|
| |||||||||||
Total Industrials | 26,362,238 | |||||||||||
|
| |||||||||||
Information Technology - 13.7% | ||||||||||||
Electronic Equipment, Instruments & Components - 0.2% | ||||||||||||
Hitachi Ltd. (Japan)1 | 155,660 | 829,807 | ||||||||||
Keyence Corp. (Japan)1 | 1,203 | 881,909 | ||||||||||
|
| |||||||||||
| 1,711,716 | ||||||||||||
|
| |||||||||||
Internet Software & Services - 3.4% | ||||||||||||
Alibaba Group Holding Ltd. - ADR (China)* | 7,880 | 801,317 | ||||||||||
Alphabet, Inc. - Class A*2 | 7,150 | 5,790,785 | ||||||||||
Alphabet, Inc. - Class C* | 9,950 | 7,806,173 | ||||||||||
Baidu, Inc. - ADR (China)* | 3,370 | 596,018 | ||||||||||
Benefitfocus, Inc.* | 13,690 | 444,925 | ||||||||||
Facebook, Inc. - Class A* | 113,990 | 14,931,551 | ||||||||||
Just Eat plc (United Kingdom)*1 | 8,720 | 59,901 | ||||||||||
Match Group, Inc.* | 33,710 | 608,803 | ||||||||||
MercadoLibre, Inc. (Argentina) | 3,790 | 636,758 | ||||||||||
MiX Telematics Ltd. - ADR (South Africa) | 30,760 | 193,480 | ||||||||||
Q2 Holdings, Inc.* | 20,920 | 587,852 | ||||||||||
Tencent Holdings Ltd. - Class H (China)1 | 32,300 | 856,025 | ||||||||||
|
| |||||||||||
| 33,313,588 | ||||||||||||
|
| |||||||||||
IT Services - 3.0% | ||||||||||||
Amdocs Ltd. - ADR | 7,460 | 436,037 | ||||||||||
FleetCor Technologies, Inc.* | 3,060 | 536,418 | ||||||||||
InterXion Holding N.V. - ADR (Netherlands)* | 7,060 | 262,844 | ||||||||||
MasterCard, Inc. - Class A | 131,260 | 14,047,446 | ||||||||||
PayPal Holdings, Inc.* | 140,930 | 5,871,144 | ||||||||||
Visa, Inc. - Class A2 | 94,810 | 7,822,773 | ||||||||||
|
| |||||||||||
| 28,976,662 | ||||||||||||
|
| |||||||||||
Semiconductors & Semiconductor Equipment - 1.8% | ||||||||||||
QUALCOMM, Inc. | 118,100 | 8,115,832 | ||||||||||
Skyworks Solutions, Inc. | 117,310 | 9,025,831 | ||||||||||
|
| |||||||||||
| 17,141,663 | ||||||||||||
|
| |||||||||||
Software - 3.9% | ||||||||||||
Electronic Arts, Inc.* | 156,150 | 12,260,898 | ||||||||||
Microsoft Corp. | 129,370 | 7,751,850 | ||||||||||
Paylocity Holding Corp.* | 12,950 | 563,196 | ||||||||||
SAP SE (Germany)1 | 3,620 | 318,921 | ||||||||||
ServiceNow, Inc.* | 176,940 | 15,554,796 | ||||||||||
TOTVS S.A. (Brazil) | 44,590 | 405,110 | ||||||||||
The Ultimate Software Group, Inc.* | 3,310 | 698,377 | ||||||||||
|
| |||||||||||
| 37,553,148 | ||||||||||||
|
| |||||||||||
Technology Hardware, Storage & Peripherals - 1.4% | ||||||||||||
Apple, Inc. | 111,440 | 12,652,898 | ||||||||||
Samsung Electronics Co. Ltd. (South Korea)1 | 840 | 1,201,476 | ||||||||||
|
| |||||||||||
| 13,854,374 | ||||||||||||
|
| |||||||||||
Total Information Technology | 132,551,151 | |||||||||||
|
| |||||||||||
Materials - 3.3% | ||||||||||||
Chemicals - 2.4% | ||||||||||||
Akzo Nobel N.V. (Netherlands)1 | 2,610 | 168,636 | ||||||||||
Ashland Global Holdings, Inc. | 70,410 | 7,866,909 | ||||||||||
Givaudan S.A. (Switzerland)1 | 230 | 444,836 | ||||||||||
Monsanto Co. | 142,860 | 14,396,003 | ||||||||||
Sociedad Quimica y Minera de Chile S.A. - ADR (Chile) | 10,910 | 319,227 | ||||||||||
Solvay S.A. (Belgium)1 | 510 | 58,504 | ||||||||||
Symrise AG (Germany)1 | 3,350 | 230,063 | ||||||||||
|
| |||||||||||
| 23,484,178 | ||||||||||||
|
| |||||||||||
Metals & Mining - 0.9% | ||||||||||||
Alumina Ltd. (Australia)1 | 105,362 | 126,632 | ||||||||||
Arconic, Inc. | 275,843 | 7,922,211 | ||||||||||
Norsk Hydro ASA (Norway)1 | 30,828 | 137,824 | ||||||||||
|
| |||||||||||
| 8,186,667 | ||||||||||||
|
| |||||||||||
Total Materials | 31,670,845 | |||||||||||
|
| |||||||||||
Real Estate - 2.4% | ||||||||||||
Equity Real Estate Investment Trusts (REITS) - 2.1% | ||||||||||||
Agree Realty Corp. | 7,270 | 351,505 | ||||||||||
Alexandria Real Estate Equities, Inc. | 3,130 | 337,445 | ||||||||||
The accompanying notes are an integral part of the financial statements.
37
Investment Portfolio - October 31, 2016
| PRO-BLEND® MODERATE TERM SERIES | SHARES | VALUE (NOTE 2) | ||||||||||
COMMON STOCKS (continued) | ||||||||||||
Real Estate (continued) | ||||||||||||
Equity Real Estate Investment Trusts (REITS) (continued) | ||||||||||||
alstria office REIT AG (Germany)1 | 42,410 | $ | 547,059 | |||||||||
American Campus Communities, Inc. | 5,020 | 261,592 | ||||||||||
American Homes 4 Rent - Class A | 13,320 | 281,185 | ||||||||||
Apartment Investment & Management Co. - Class A | 7,610 | 335,373 | ||||||||||
AvalonBay Communities, Inc. | 2,610 | 446,780 | ||||||||||
Axiare Patrimonio SOCIMI S.A. (Spain)1 | 6,410 | 91,069 | ||||||||||
Boston Properties, Inc. | 1,740 | 209,635 | ||||||||||
Brandywine Realty Trust | 15,320 | 237,460 | ||||||||||
Brixmor Property Group, Inc. | 6,240 | 158,621 | ||||||||||
CatchMark Timber Trust, Inc. - Class A | 15,240 | 160,630 | ||||||||||
Chesapeake Lodging Trust | 11,590 | 251,619 | ||||||||||
Colony Starwood Homes | 8,500 | 246,585 | ||||||||||
Columbia Property Trust, Inc. | 6,430 | 135,544 | ||||||||||
Community Healthcare Trust, Inc. | 17,560 | 392,993 | ||||||||||
CoreSite Realty Corp. | 1,420 | 104,711 | ||||||||||
Crown Castle International Corp. | 1,710 | 155,593 | ||||||||||
CubeSmart | 14,510 | 378,276 | ||||||||||
DDR Corp. | 18,060 | 276,137 | ||||||||||
Digital Realty Trust, Inc. | 2,840 | 265,341 | ||||||||||
Douglas Emmett, Inc. | 8,560 | 312,440 | ||||||||||
Education Realty Trust, Inc. | 5,363 | 228,410 | ||||||||||
Equinix, Inc. | 1,120 | 400,154 | ||||||||||
Equity LifeStyle Properties, Inc. | 2,490 | 188,842 | ||||||||||
Equity One, Inc. | 9,270 | 264,195 | ||||||||||
Equity Residential | 6,450 | 398,288 | ||||||||||
Extra Space Storage, Inc. | 2,680 | 196,042 | ||||||||||
Fibra Shop Portafolios Inmobiliarios S.A.P.I. de C.V. (Mexico) | 110,644 | 93,662 | ||||||||||
Forest City Realty Trust, Inc. - Class A | 17,650 | 381,064 | ||||||||||
General Growth Properties, Inc. | 9,510 | 237,274 | ||||||||||
Global Medical REIT, Inc. | 12,470 | 121,582 | ||||||||||
Healthcare Trust of America, Inc. - Class A | 7,040 | 215,424 | ||||||||||
Hibernia REIT plc (Ireland) | 37,371 | 52,634 | ||||||||||
Host Hotels & Resorts, Inc. | 8,930 | 138,236 | ||||||||||
Klepierre (France)1 | 5,210 | 212,922 | ||||||||||
Lamar Advertising Co. - Class A | 4,010 | 254,434 | ||||||||||
LaSalle Hotel Properties | 5,710 | 135,612 | ||||||||||
Life Storage, Inc. | 3,370 | 271,790 | ||||||||||
Mid-America Apartment Communities, Inc. | 2,480 | 230,020 | ||||||||||
NorthStar Realty Finance Corp. | 15,310 | 222,301 | ||||||||||
Outfront Media, Inc. | 12,877 | 276,984 | ||||||||||
Pennsylvania Real Estate Investment Trust | 13,340 | 260,263 | ||||||||||
Physicians Realty Trust | 19,930 | 394,016 | ||||||||||
Potlatch Corp. | 6,820 | 261,888 | ||||||||||
Prologis, Inc. | 10,820 | 564,371 | ||||||||||
Public Storage | 1,300 | 277,836 | ||||||||||
Retail Properties of America, Inc. - Class A | 9,990 | 155,544 | ||||||||||
Rexford Industrial Realty, Inc. | 15,050 | 316,953 | ||||||||||
Senior Housing Properties Trust | 7,390 | 157,185 | ||||||||||
Simon Property Group, Inc. | 4,590 | 853,556 | ||||||||||
Spirit Realty Capital, Inc. | 21,030 | 250,467 | ||||||||||
STORE Capital Corp. | 10,600 | 289,274 | ||||||||||
Sun Communities, Inc. | 2,280 | 175,400 | ||||||||||
Tanger Factory Outlet Centers, Inc. | 6,990 | 243,252 | ||||||||||
Taubman Centers, Inc. | 2,830 | 205,062 | ||||||||||
Terreno Realty Corp. | 11,390 | 297,279 | ||||||||||
UDR, Inc. | 4,350 | 152,120 | ||||||||||
Urban Edge Properties | 9,110 | 235,129 | ||||||||||
Ventas, Inc. | 4,160 | 281,840 | ||||||||||
Vornado Realty Trust | 2,100 | 194,838 | ||||||||||
Welltower, Inc. | 3,740 | 256,302 | ||||||||||
Weyerhaeuser Co. | 154,352 | 4,619,755 | ||||||||||
|
| |||||||||||
| 20,899,793 | ||||||||||||
|
| |||||||||||
Real Estate Management & Development - 0.3% | ||||||||||||
CBRE Group, Inc. - Class A* | 3,340 | 86,038 | ||||||||||
First Capital Realty, Inc. (Canada) | 7,130 | 113,704 | ||||||||||
Realogy Holdings Corp. | 109,090 | 2,497,070 | ||||||||||
|
| |||||||||||
| 2,696,812 | ||||||||||||
|
| |||||||||||
Total Real Estate | 23,596,605 | |||||||||||
|
| |||||||||||
Telecommunication Services - 0.3% | ||||||||||||
Diversified Telecommunication Services - 0.2% | ||||||||||||
SBA Communications Corp. - Class A* | 5,610 | 635,501 | ||||||||||
Telefonica S.A. - ADR (Spain) | 42,360 | 429,530 | ||||||||||
Zayo Group Holdings, Inc.* | 33,270 | 1,070,629 | ||||||||||
|
| |||||||||||
| 2,135,660 | ||||||||||||
|
| |||||||||||
Wireless Telecommunication Services - 0.1% | ||||||||||||
America Movil S.A.B. de C.V. - Class L - ADR (Mexico) | 51,673 | 678,983 | ||||||||||
China Mobile Ltd. - Class H (China)1 | 19,420 | 222,483 | ||||||||||
|
| |||||||||||
| 901,466 | ||||||||||||
|
| |||||||||||
Total Telecommunication Services | 3,037,126 | |||||||||||
|
| |||||||||||
Utilities - 0.0%## | ||||||||||||
Water Utilities - 0.0%## | ||||||||||||
CT Environmental Group Ltd. (China)1 | 613,660 | 172,162 | ||||||||||
|
| |||||||||||
TOTAL COMMON STOCKS | ||||||||||||
(Identified Cost $390,361,442) | 422,013,507 | |||||||||||
|
| |||||||||||
The accompanying notes are an integral part of the financial statements.
38
Investment Portfolio - October 31, 2016
| PRO-BLEND® MODERATE TERM SERIES | PRINCIPAL AMOUNT 4 | VALUE (NOTE 2) | ||||||||||
CORPORATE BONDS - 18.8% | ||||||||||||
Non-Convertible Corporate Bonds - 18.8% | ||||||||||||
Consumer Discretionary - 1.5% | ||||||||||||
Auto Components - 0.3% | ||||||||||||
Dana Financing Luxembourg S.A.R.L.3, 6.50%, 6/1/2026 | 230,000 | $ | 244,662 | |||||||||
Magna International, Inc. (Canada), 4.15%, 10/1/2025 | 2,150,000 | 2,329,796 | ||||||||||
|
| |||||||||||
| 2,574,458 | ||||||||||||
|
| |||||||||||
Household Durables - 0.6% | ||||||||||||
Brookfield Residential Properties, Inc. - Brookfield Residential US Corp. (Canada)3, 6.125%, 7/1/2022 | 505,000 | 512,575 | ||||||||||
Lennar Corp., 12.25%, 6/1/2017 | 830,000 | 876,688 | ||||||||||
Meritage Homes Corp., 7.15%, 4/15/2020 | 120,000 | 133,200 | ||||||||||
Meritage Homes Corp., 7.00%, 4/1/2022 | 230,000 | 256,680 | ||||||||||
NVR, Inc., 3.95%, 9/15/2022 | 3,248,000 | 3,422,541 | ||||||||||
TRI Pointe Group, Inc. - TRI Pointe Homes, Inc., 4.375%, 6/15/2019 | 245,000 | 250,512 | ||||||||||
Weekley Homes LLC - Weekley Finance Corp., 6.00%, 2/1/2023 | 280,000 | 254,800 | ||||||||||
|
| |||||||||||
| 5,706,996 | ||||||||||||
|
| |||||||||||
Internet & Direct Marketing Retail - 0.4% | ||||||||||||
The Priceline Group, Inc., 3.60%, 6/1/2026 | 3,600,000 | 3,732,527 | ||||||||||
|
| |||||||||||
Media - 0.1% | ||||||||||||
Sirius XM Radio, Inc.3, 5.375%, 4/15/2025 | 370,000 | 377,363 | ||||||||||
VTR Finance B.V. (Chile)3, 6.875%, 1/15/2024 | 485,000 | 507,431 | ||||||||||
|
| |||||||||||
| 884,794 | ||||||||||||
|
| |||||||||||
Multiline Retail - 0.1% | ||||||||||||
Dollar General Corp., 3.25%, 4/15/2023 | 1,480,000 | 1,513,063 | ||||||||||
|
| |||||||||||
Total Consumer Discretionary | 14,411,838 | |||||||||||
|
| |||||||||||
Consumer Staples - 1.4% | ||||||||||||
Beverages - 0.6% | ||||||||||||
Anheuser-Busch InBev Worldwide, Inc. (Belgium), 7.75%, 1/15/2019 | 1,770,000 | 2,000,985 | ||||||||||
Anheuser-Busch InBev Worldwide, Inc. (Belgium), 8.20%, 1/15/2039 | 1,280,000 | 2,022,740 | ||||||||||
PepsiCo, Inc., 3.10%, 7/17/2022 | 1,935,000 | 2,041,984 | ||||||||||
|
| |||||||||||
| 6,065,709 | ||||||||||||
|
| |||||||||||
Food & Staples Retailing - 0.7% | ||||||||||||
C&S Group Enterprises LLC3, 5.375%, 7/15/2022 | 525,000 | 509,250 | ||||||||||
CVS Health Corp., 3.50%, 7/20/2022 | 2,870,000 | 3,032,307 | ||||||||||
The Kroger Co., 2.60%, 2/1/2021 | 2,545,000 | 2,593,976 | ||||||||||
|
| |||||||||||
| 6,135,533 | ||||||||||||
|
| |||||||||||
Food Products - 0.1% | ||||||||||||
Pinnacle Operating Corp.3, 9.00%, 11/15/2020 . | 1,255,000 | 778,100 | ||||||||||
|
| |||||||||||
Household Products - 0.0%## | ||||||||||||
HRG Group, Inc., 7.75%, 1/15/2022 | 235,000 | 244,988 | ||||||||||
|
| |||||||||||
Total Consumer Staples | 13,224,330 | |||||||||||
|
| |||||||||||
Energy - 3.2% | ||||||||||||
Energy Equipment & Services - 0.7% | ||||||||||||
Ensco plc, 5.20%, 3/15/2025 | 1,465,000 | 1,191,690 | ||||||||||
McDermott International, Inc.3, 8.00%, 5/1/2021 | 450,000 | 436,500 | ||||||||||
Pride International, Inc., 8.50%, 6/15/2019 | 700,000 | 761,250 | ||||||||||
Schlumberger Holdings Corp.3, 3.625%, 12/21/2022 | 3,885,000 | 4,152,766 | ||||||||||
|
| |||||||||||
| 6,542,206 | ||||||||||||
|
| |||||||||||
Oil, Gas & Consumable Fuels - 2.5% | ||||||||||||
BP Capital Markets plc (United Kingdom), 3.535%, 11/4/2024 | 3,890,000 | 4,069,399 | ||||||||||
Cheniere Corpus Christi Holdings, LLC3, 7.00%, 6/30/2024 | 355,000 | 376,300 | ||||||||||
Chevron Corp., 1.79%, 11/16/2018 | 2,020,000 | 2,037,227 | ||||||||||
Columbia Pipeline Group, Inc., 4.50%, 6/1/2025 | 1,940,000 | 2,096,230 | ||||||||||
ConocoPhillips Co., 3.35%, 5/15/2025 | 2,660,000 | 2,704,965 | ||||||||||
Crestwood Midstream Partners LP - Crestwood Midstream Finance Corp., 6.125%, 3/1/2022 | 230,000 | 235,175 | ||||||||||
Enviva Partners LP - Enviva Partners Finance Corp.3, 8.50%, 11/1/2021 | 370,000 | 378,325 | ||||||||||
Hilcorp Energy I LP - Hilcorp Finance Co.3, 5.75%, 10/1/2025 | 195,000 | 195,488 | ||||||||||
Kinder Morgan Energy Partners LP, 4.30%, 5/1/2024 | 5,420,000 | 5,602,730 | ||||||||||
Kinder Morgan, Inc.3, 5.625%, 11/15/2023 | 1,950,000 | 2,157,384 | ||||||||||
NGL Energy Partners LP - NGL Energy Finance Corp.3, 7.50%, 11/1/2023 | 240,000 | 240,600 | ||||||||||
Oasis Petroleum, Inc., 6.875%, 1/15/2023 | 65,000 | 63,700 | ||||||||||
PBF Holding Co. LLC - PBF Finance Corp.3, 7.00%, 11/15/2023 | 255,000 | 235,875 | ||||||||||
Petroleos Mexicanos (Mexico), 4.50%, 1/23/2026 | 2,135,000 | 2,062,410 | ||||||||||
Sabine Pass Liquefaction LLC, 5.625%, 2/1/2021 | 360,000 | 378,900 | ||||||||||
Tallgrass Energy Partners LP - Tallgrass Energy Finance Corp.3, 5.50%, 9/15/2024 | 365,000 | 363,175 | ||||||||||
The accompanying notes are an integral part of the financial statements.
39
Investment Portfolio - October 31, 2016
| PRO-BLEND® MODERATE TERM SERIES | PRINCIPAL AMOUNT 4 | VALUE (NOTE 2) | ||||||||||||||
CORPORATE BONDS (continued) | ||||||||||||||||
Non-Convertible Corporate Bonds (continued) | ||||||||||||||||
Energy (continued) | ||||||||||||||||
Oil, Gas & Consumable Fuels (continued) | ||||||||||||||||
TransCanada PipeLines Ltd. (Canada), 3.75%, 10/16/2023 | 900,000 | $ | 957,384 | |||||||||||||
|
| |||||||||||||||
| 24,155,267 | ||||||||||||||||
|
| |||||||||||||||
Total Energy | 30,697,473 | |||||||||||||||
|
| |||||||||||||||
Financials - 5.8% | ||||||||||||||||
Banks - 2.9% | ||||||||||||||||
Bank of America Corp., 5.70%, 5/2/2017 | 1,971,000 | 2,013,672 | ||||||||||||||
Bank of America Corp., 4.00%, 1/22/2025 | 3,030,000 | 3,115,425 | ||||||||||||||
Barclays Bank plc (United Kingdom)3, 10.179%, 6/12/2021 | 1,600,000 | 2,023,094 | ||||||||||||||
Citigroup, Inc., 3.875%, 3/26/2025 | 4,065,000 | 4,157,506 | ||||||||||||||
Commonwealth Bank of Australia (Australia), 5.75%, 1/25/2017 | AUD | 390,000 | 299,176 | |||||||||||||
Intesa Sanpaolo S.p.A. (Italy), 3.875%, 1/15/2019 | 1,970,000 | 2,026,833 | ||||||||||||||
Intesa Sanpaolo S.p.A. (Italy)3, 6.50%, 2/24/2021 | 1,780,000 | 1,996,968 | ||||||||||||||
JPMorgan Chase & Co., 4.95%, 3/25/2020 | 3,690,000 | 4,039,484 | ||||||||||||||
Lloyds Bank plc (United Kingdom)3,5,6, 12.00% | 280,000 | 380,800 | ||||||||||||||
Lloyds Banking Group plc (United Kingdom)3, 4.582%, 12/10/2025 | 4,071,000 | 4,136,800 | ||||||||||||||
Popular, Inc., 7.00%, 7/1/2019 | 550,000 | 569,938 | ||||||||||||||
Royal Bank of Canada (Canada), 3.77%, 3/30/2018 | CAD | 450,000 | 347,939 | |||||||||||||
Santander Bank N.A., 8.75%, 5/30/2018 | 1,250,000 | 1,360,896 | ||||||||||||||
Santander Holdings USA, Inc., 2.65%, 4/17/2020 | 1,385,000 | 1,383,965 | ||||||||||||||
Westpac Banking Corp. (Australia), 5.75%, 2/6/2017 | AUD | 400,000 | 307,195 | |||||||||||||
|
| |||||||||||||||
| 28,159,691 | ||||||||||||||||
|
| |||||||||||||||
Capital Markets - 1.2% | ||||||||||||||||
The Goldman Sachs Group, Inc.7, 2.429%, 11/29/2023 | 4,080,000 | 4,140,580 | ||||||||||||||
The Goldman Sachs Group, Inc., 4.25%, 10/21/2025 | 1,995,000 | 2,087,317 | ||||||||||||||
Morgan Stanley, 5.00%, 11/24/2025 | 2,815,000 | 3,113,691 | ||||||||||||||
TD Ameritrade Holding Corp., 2.95%, 4/1/2022 | 1,980,000 | 2,046,819 | ||||||||||||||
|
| |||||||||||||||
| 11,388,407 | ||||||||||||||||
|
| |||||||||||||||
Consumer Finance - 0.1% | ||||||||||||||||
Navient Corp., 6.125%, 3/25/2024 | 740,000 | 677,100 | ||||||||||||||
|
| |||||||||||||||
Diversified Financial Services - 0.0%## | ||||||||||||||||
Horizon Pharma, Inc., 6.625%, 5/1/2023 | 355,000 | 335,031 | ||||||||||||||
Jefferies Finance LLC - JFIN Co-Issuer Corp.3, 7.375%, 4/1/2020 | 265,000 | 263,012 | ||||||||||||||
|
| |||||||||||||||
| 598,043 | ||||||||||||||||
|
| |||||||||||||||
Insurance - 1.4% | ||||||||||||||||
American International Group, Inc., 4.125%, 2/15/2024 | 2,900,000 | 3,117,416 | ||||||||||||||
Assured Guaranty US Holdings, Inc., 5.00%, 7/1/2024 | 7,385,000 | 8,193,154 | ||||||||||||||
Prudential Financial, Inc.8, 5.875%, 9/15/2042 | 1,890,000 | 2,069,550 | ||||||||||||||
|
| |||||||||||||||
| 13,380,120 | ||||||||||||||||
|
| |||||||||||||||
Thrifts & Mortgage Finance - 0.2% | ||||||||||||||||
Ladder Capital Finance Holdings LLLP - Ladder Capital Finance Corp., 7.375%, 10/1/2017 | 1,455,000 | 1,475,006 | ||||||||||||||
Ladder Capital Finance Holdings LLLP - Ladder Capital Finance Corp.3, 5.875%, 8/1/2021 | 535,000 | 508,250 | ||||||||||||||
|
| |||||||||||||||
| 1,983,256 | ||||||||||||||||
|
| |||||||||||||||
Total Financials | 56,186,617 | |||||||||||||||
|
| |||||||||||||||
Health Care - 0.4% | ||||||||||||||||
Biotechnology - 0.2% | ||||||||||||||||
AbbVie, Inc., 1.80%, 5/14/2018 | 2,030,000 | 2,036,384 | ||||||||||||||
AMAG Pharmaceuticals, Inc.3, 7.875%, 9/1/2023 | 435,000 | 407,812 | ||||||||||||||
|
| |||||||||||||||
| 2,444,196 | ||||||||||||||||
|
| |||||||||||||||
Health Care Providers & Services - 0.1% | ||||||||||||||||
HCA, Inc., 7.50%, 2/15/2022 | 315,000 | 358,470 | ||||||||||||||
LifePoint Health, Inc.3, 5.375%, 5/1/2024 | 240,000 | 238,512 | ||||||||||||||
Tenet Healthcare Corp., 8.125%, 4/1/2022 | 310,000 | 303,025 | ||||||||||||||
|
| |||||||||||||||
| 900,007 | ||||||||||||||||
|
| |||||||||||||||
Pharmaceuticals - 0.1% | ||||||||||||||||
Concordia International Corp. (Canada)3, 7.00%, 4/15/2023 | 475,000 | 273,125 | ||||||||||||||
Mallinckrodt International Finance S.A. - Mallinckrodt CB LLC3, 5.625%, 10/15/2023 | . | 375,000 | 352,500 | |||||||||||||
|
| |||||||||||||||
| 625,625 | ||||||||||||||||
|
| |||||||||||||||
Total Health Care | 3,969,828 | |||||||||||||||
|
| |||||||||||||||
Industrials - 2.1% | ||||||||||||||||
Aerospace & Defense - 0.0%## | ||||||||||||||||
DigitalGlobe, Inc.3, 5.25%, 2/1/2021 | 430,000 | 433,225 | ||||||||||||||
|
| |||||||||||||||
The accompanying notes are an integral part of the financial statements.
40
Investment Portfolio - October 31, 2016
| PRO-BLEND® MODERATE TERM SERIES | PRINCIPAL AMOUNT 4 | VALUE (NOTE 2) | ||||||||||||||
CORPORATE BONDS (continued) | ||||||||||||||||
Non-Convertible Corporate Bonds (continued) | ||||||||||||||||
Industrials (continued) | ||||||||||||||||
Air Freight & Logistics - 0.0%## | ||||||||||||||||
Neovia Logistics Intermediate Holdings LLC - Logistics Intermediate Finance Corp.3,9, | 679,668 | $ | 416,297 | |||||||||||||
|
| |||||||||||||||
Airlines - 0.5% | ||||||||||||||||
Allegiant Travel Co., 5.50%, 7/15/2019. | 365,000 | 379,144 | ||||||||||||||
American Airlines Pass-Through Trust, Series 2013-2, Class A, 4.95%, 1/15/2023 | 1,762,046 | 1,922,833 | ||||||||||||||
Southwest Airlines Co., 2.75%, 11/6/2019 | 1,425,000 | 1,467,284 | ||||||||||||||
Southwest Airlines Co., 2.65%, 11/5/2020 | 740,000 | 756,840 | ||||||||||||||
|
| |||||||||||||||
| 4,526,101 | ||||||||||||||||
|
| |||||||||||||||
Commercial Services & Supplies - 0.1% | ||||||||||||||||
Constellis Holdings LLC - Constellis | ||||||||||||||||
Finance Corp.3, 9.75%, 5/15/2020 | 265,000 | 268,975 | ||||||||||||||
Herc Rentals, Inc.3, 7.50%, 6/1/2022 | 245,000 | 245,000 | ||||||||||||||
|
| |||||||||||||||
| 513,975 | ||||||||||||||||
|
| |||||||||||||||
Construction & Engineering - 0.2% | ||||||||||||||||
Fluor Corp., 3.50%, 12/15/2024 | 1,920,000 | 2,024,304 | ||||||||||||||
|
| |||||||||||||||
Industrial Conglomerates - 0.7% | ||||||||||||||||
General Electric Co.7, 1.261%, 5/5/2026 | 2,310,000 | 2,241,111 | ||||||||||||||
Siemens Financieringsmaatschappij N.V. (Germany)3, 2.90%, 5/27/2022 | 3,880,000 | 4,029,473 | ||||||||||||||
|
| |||||||||||||||
| 6,270,584 | ||||||||||||||||
|
| |||||||||||||||
Machinery - 0.1% | ||||||||||||||||
Case New Holland Industrial, Inc. (United Kingdom), 7.875%, 12/1/2017 | 399,000 | 422,441 | ||||||||||||||
CNH Industrial N.V. (United Kingdom), 4.50%, 8/15/2023 | 260,000 | 261,300 | ||||||||||||||
Shape Technologies Group, Inc.3, 7.625%, 2/1/2020 | 250,000 | 253,750 | ||||||||||||||
Xerium Technologies, Inc.3, 9.50%, 8/15/2021 | 245,000 | 248,675 | ||||||||||||||
|
| |||||||||||||||
| 1,186,166 | ||||||||||||||||
|
| |||||||||||||||
Trading Companies & Distributors - 0.5% | ||||||||||||||||
Air Lease Corp., 3.375%, 6/1/2021 | 4,000,000 | 4,115,584 | ||||||||||||||
Aircastle Ltd., 5.50%, 2/15/2022 | 235,000 | 252,038 | ||||||||||||||
Fly Leasing Ltd. (Ireland), 6.375%, 10/15/2021 | 565,000 | 577,712 | ||||||||||||||
International Lease Finance Corp., 6.25%, 5/15/2019 | 230,000 | 248,688 | ||||||||||||||
|
| |||||||||||||||
| 5,194,022 | ||||||||||||||||
|
| |||||||||||||||
Total Industrials | 20,564,674 | |||||||||||||||
|
| |||||||||||||||
Information Technology - 1.3% | ||||||||||||||||
Internet Software & Services - 0.3% eBay, Inc., 2.50%, 3/9/2018 | 3,010,000 | 3,047,303 | ||||||||||||||
VeriSign, Inc., 5.25%, 4/1/2025 | 180,000 | 189,900 | ||||||||||||||
|
| |||||||||||||||
| 3,237,203 | ||||||||||||||||
|
| |||||||||||||||
IT Services - 0.5% | ||||||||||||||||
Automatic Data Processing, Inc., 2.25%, 9/15/2020 | 1,965,000 | 2,015,019 | ||||||||||||||
Visa, Inc., 2.80%, 12/14/2022 | 2,940,000 | 3,057,382 | ||||||||||||||
|
| |||||||||||||||
| 5,072,401 | ||||||||||||||||
|
| |||||||||||||||
Semiconductors & Semiconductor Equipment - 0.4% | ||||||||||||||||
Intel Corp., 2.45%, 7/29/2020 | 1,970,000 | 2,029,764 | ||||||||||||||
QUALCOMM, Inc., 3.00%, 5/20/2022 | 1,960,000 | 2,042,894 | ||||||||||||||
|
| |||||||||||||||
| 4,072,658 | ||||||||||||||||
|
| |||||||||||||||
Technology Hardware, Storage & Peripherals - 0.1% | ||||||||||||||||
Diebold, Inc.3, 8.50%, 4/15/2024 | 380,000 | 402,705 | ||||||||||||||
Western Digital Corp.3, 10.50%, 4/1/2024 | 230,000 | 265,650 | ||||||||||||||
|
| |||||||||||||||
| 668,355 | ||||||||||||||||
|
| |||||||||||||||
Total Information Technology | 13,050,617 | |||||||||||||||
|
| |||||||||||||||
Materials - 0.8% | ||||||||||||||||
Chemicals - 0.3% | ||||||||||||||||
Consolidated Energy Finance S.A. (Trinidad-Tobago)3, 6.75%, 10/15/2019 | . | 380,000 | 380,000 | |||||||||||||
The Dow Chemical Co., 8.55%, 5/15/2019 | 1,725,000 | 2,009,951 | ||||||||||||||
Solvay Finance America LLC (Belgium)3, 3.40%, 12/3/2020 | 859,000 | 894,191 | ||||||||||||||
|
| |||||||||||||||
| 3,284,142 | ||||||||||||||||
|
| |||||||||||||||
Containers & Packaging - 0.0%## | ||||||||||||||||
Ardagh Packaging Finance plc - Ardagh Holdings USA, Inc. (Ireland)3, 7.25%, 5/15/2024 | 240,000 | 253,200 | ||||||||||||||
|
| |||||||||||||||
Metals & Mining - 0.3% | ||||||||||||||||
Arconic, Inc., 5.87%, 2/23/2022 | 350,000 | 374,220 | ||||||||||||||
BHP Billiton Finance USA Ltd. (Australia), 3.85%, 9/30/2023 | 1,750,000 | 1,898,486 | ||||||||||||||
Kinross Gold Corp. (Canada), 5.125%, 9/1/2021 | 95,000 | 98,800 | ||||||||||||||
SunCoke Energy Partners LP - SunCoke Energy Partners Finance Corp.3, 7.375%, 2/1/2020 | 380,000 | 365,750 | ||||||||||||||
Techniplas LLC3, 10.00%, 5/1/2020 | 315,000 | 266,962 | ||||||||||||||
|
| |||||||||||||||
| 3,004,218 | ||||||||||||||||
|
| |||||||||||||||
The accompanying notes are an integral part of the financial statements.
41
Investment Portfolio - October 31, 2016
| PRO-BLEND® MODERATE TERM SERIES | PRINCIPAL AMOUNT 4 | VALUE (NOTE 2) | ||||||||||
CORPORATE BONDS (continued) | ||||||||||||
Non-Convertible Corporate Bonds (continued) | ||||||||||||
Materials (continued) | ||||||||||||
Paper & Forest Products - 0.2% | ||||||||||||
Domtar Corp., 4.40%, 4/1/2022 | 1,425,000 | $ | 1,493,661 | |||||||||
|
| |||||||||||
Total Materials. | 8,035,221 | |||||||||||
|
| |||||||||||
Real Estate - 0.9% | ||||||||||||
Equity Real Estate Investment Trusts (REITS) - 0.8% | ||||||||||||
American Tower Corp., 3.30%, 2/15/2021 | 3,950,000 | 4,102,877 | ||||||||||
Greystar Real Estate Partners LLC3, 8.25%, 12/1/2022 | 360,000 | 391,500 | ||||||||||
GTP Acquisition Partners I LLC3, 2.35%, 6/15/2020 | 681,000 | 678,330 | ||||||||||
MPT Operating Partnership LP - MPT Finance Corp., 5.25%, 8/1/2026 | 240,000 | 244,800 | ||||||||||
Sixsigma Networks Mexico S.A. de C.V. (Mexico)3, 8.25%, 11/7/2021 | 420,000 | 410,550 | ||||||||||
Welltower, Inc., 4.95%, 1/15/2021 | 1,860,000 | 2,047,756 | ||||||||||
|
| |||||||||||
| 7,875,813 | ||||||||||||
|
| |||||||||||
Real Estate Management & Development - 0.1% | ||||||||||||
Forestar USA Real Estate Group, Inc.3, 8.50%, 6/1/2022 | 615,000 | 635,372 | ||||||||||
Rialto Holdings LLC - Rialto Corp.3, 7.00%, 12/1/2018 | 375,000 | 379,688 | ||||||||||
|
| |||||||||||
| 1,015,060 | ||||||||||||
|
| |||||||||||
Total Real Estate | 8,890,873 | |||||||||||
|
| |||||||||||
Telecommunication Services - 1.3% | ||||||||||||
Diversified Telecommunication Services - 1.1% | ||||||||||||
AT&T, Inc., 5.20%, 3/15/2020 | 3,675,000 | 4,047,965 | ||||||||||
CenturyLink, Inc., 7.50%, 4/1/2024 | 350,000 | 364,438 | ||||||||||
Frontier Communications Corp., 11.00%, 9/15/2025 | 585,000 | 598,982 | ||||||||||
Hughes Satellite Systems Corp.3, 6.625%, 8/1/2026 | 380,000 | 376,200 | ||||||||||
Inmarsat Finance plc (United Kingdom)3, 4.875%, 5/15/2022 | 655,000 | 617,730 | ||||||||||
Qualitytech LP - QTS Finance Corp., 5.875%, 8/1/2022 | 490,000 | 503,475 | ||||||||||
Verizon Communications, Inc., 4.15%, 3/15/2024 | 3,730,000 | 4,041,761 | ||||||||||
|
| |||||||||||
| 10,550,551 | ||||||||||||
|
| |||||||||||
Wireless Telecommunication Services - 0.2% | ||||||||||||
Altice Financing S.A. (Luxembourg)3, 6.625%, 2/15/2023 | 505,000 | 520,150 | ||||||||||
SBA Tower Trust3 , 3.598%, 4/15/2018 | 1,110,000 | 1,114,006 | ||||||||||
|
| |||||||||||
| 1,634,156 | ||||||||||||
|
| |||||||||||
Total Telecommunication Services | 12,184,707 | |||||||||||
|
| |||||||||||
PRINCIPAL SHARES | VALUE (NOTE 2) | |||||||||||
Utilities - 0.1% | ||||||||||||
Independent Power and Renewable Electricity Producers - 0.1% | ||||||||||||
Atlantica Yield plc (Spain)3, 7.00%, 11/15/2019 | 645,000 | 656,288 | ||||||||||
Terraform Global Operating LLC3, 13.75%, 8/15/2022 | 375,000 | 390,000 | ||||||||||
|
| |||||||||||
Total Utilities | 1,046,288 | |||||||||||
|
| |||||||||||
TOTAL CORPORATE BONDS | ||||||||||||
(Identified Cost $180,054,604) | 182,262,466 | |||||||||||
|
| |||||||||||
MUTUAL FUNDS - 0.0%## | ||||||||||||
iShares MSCI India ETF | 6,240 | 181,209 | ||||||||||
iShares Russell Mid-Cap Growth ETF | 3,410 | 318,426 | ||||||||||
|
| |||||||||||
TOTAL MUTUAL FUNDS | ||||||||||||
(Identified Cost $488,733) | 499,635 | |||||||||||
|
| |||||||||||
U.S. TREASURY SECURITIES - 15.1% | ||||||||||||
U.S. Treasury Bonds - 2.6% | ||||||||||||
U.S. Treasury Bond, 4.75%, 2/15/2037 | 10,400,000 | 14,575,839 | ||||||||||
U.S. Treasury Inflation Indexed Bond, 0.75%, 2/15/2042 | 11,053,487 | 11,122,483 | ||||||||||
|
| |||||||||||
Total U.S. Treasury Bonds | ||||||||||||
(Identified Cost $24,990,248) | 25,698,322 | |||||||||||
|
| |||||||||||
U.S. Treasury Notes - 12.5% | ||||||||||||
U.S. Treasury Inflation Indexed Note, 0.125%, 4/15/2017 | 18,890,004 | 18,926,159 | ||||||||||
U.S. Treasury Inflation Indexed Note, 0.125%, 4/15/2020 | 18,804,088 | 19,161,723 | ||||||||||
U.S. Treasury Inflation Indexed Note, 0.125%, 1/15/2023 | 10,803,359 | 10,958,139 | ||||||||||
U.S. Treasury Note, 0.75%, 4/15/2018 | 20,401,000 | 20,388,249 | ||||||||||
U.S. Treasury Note, 1.375%, 4/30/2020 | 18,739,000 | 18,905,159 | ||||||||||
U.S. Treasury Note, 1.125%, 7/31/2021 | 16,260,000 | 16,113,920 | ||||||||||
U.S. Treasury Note, 1.75%, 4/30/2022 | 15,994,000 | 16,252,031 | ||||||||||
|
| |||||||||||
Total U.S. Treasury Notes | ||||||||||||
(Identified Cost $120,101,243) | 120,705,380 | |||||||||||
|
| |||||||||||
TOTAL U.S. TREASURY SECURITIES | ||||||||||||
(Identified Cost $145,091,491) | 146,403,702 | |||||||||||
|
| |||||||||||
ASSET-BACKED SECURITIES - 3.0% | ||||||||||||
Alterna Funding I LLC, Series 2014-1A, Class NOTE3, 1.639%, 2/15/2021 | 528,514 | 515,301 | ||||||||||
BMW Vehicle Owner Trust, Series 2016-A, Class A3, 1.16%, 11/25/2020 | 2,600,000 | 2,596,357 | ||||||||||
CarMax Auto Owner Trust, Series 2016-4, Class A2, 1.21%, 11/15/2019 | 3,400,000 | 3,398,698 | ||||||||||
The accompanying notes are an integral part of the financial statements.
42
Investment Portfolio - October 31, 2016
| PRO-BLEND® MODERATE TERM SERIES | PRINCIPAL AMOUNT 4 | VALUE (NOTE 2) | ||||||||||
ASSET-BACKED SECURITIES (continued) | ||||||||||||
Cazenovia Creek Funding I LLC, Series 2015-1A, Class A3, 2.00%, 12/10/2023 | 948,465 | $ | 941,945 | |||||||||
Colony American Homes, Series 2015-1A, Class A3,7, 1.735%, 7/17/2032 | 1,295,219 | 1,297,568 | ||||||||||
Discover Card Execution Note Trust, Series 2014-A5, Class A, 1.39%, 4/15/2020 | 3,415,000 | 3,423,218 | ||||||||||
Enterprise Fleet Financing LLC, Series 2014-2, Class A23, 1.05%, 3/20/2020 | 682,154 | 681,124 | ||||||||||
Enterprise Fleet Financing LLC, Series 2015-2, Class A23, 1.59%, 2/22/2021 | 2,641,139 | 2,644,557 | ||||||||||
FDIC Trust, Series 2011-R1, Class A3, 2.672%, 7/25/2026 | 479,699 | 487,005 | ||||||||||
FNA Trust, Series 2014-1A, Class A3, 1.296%, 12/10/2022 | 236,849 | 234,480 | ||||||||||
Home Partners of America Trust, Series 2016-1, Class A3,7, 2.185%, 3/17/2033 | 1,034,315 | 1,045,513 | ||||||||||
Honda Auto Receivables Owner Trust, Series 2016-4, Class A2, 1.04%, 4/18/2019 | 3,900,000 | 3,898,624 | ||||||||||
Invitation Homes Trust, Series 2015-SFR3, Class A3,7, 1.835%, 8/17/2032 | 2,467,302 | 2,477,370 | ||||||||||
NextGear Floorplan Master Owner Trust, Series 2014-1A, Class A3, 1.92%, 10/15/2019 | 1,400,000 | 1,398,383 | ||||||||||
Starwood Retail Property Trust, Series 2014-STAR, Class A3,7, 1.744%, 11/15/2027 | 2,116,000 | 2,097,448 | ||||||||||
Tax Ease Funding LLC, Series 2016-1A, Class A3, 3.131%, 6/15/2028 | 679,907 | 678,289 | ||||||||||
Tricon American Homes Trust, Series 2016-SFR1, Class A3, 2.589%, 11/17/2033 | 1,420,000 | 1,417,606 | ||||||||||
|
| |||||||||||
TOTAL ASSET-BACKED SECURITIES | 29,233,486 | |||||||||||
|
| |||||||||||
COMMERCIAL MORTGAGE-BACKED SECURITIES - 4.5% | ||||||||||||
Americold LLC Trust, Series 2010-ARTA, Class A13, 3.847%, 1/14/2029 | 201,652 | 210,161 | ||||||||||
Banc of America Commercial Mortgage Trust, Series 2006-3, Class A47, 5.889%, 7/10/2044 | 30,480 | 30,435 | ||||||||||
BWAY Mortgage Trust, Series 2015-1740, Class A3, 2.917%, 1/13/2035 | 3,350,000 | 3,369,056 | ||||||||||
Credit Suisse Mortgage Capital Trust, Series 2013-IVR3, Class A13,7, 2.50%, 5/25/2043 | 1,541,657 | 1,517,568 | ||||||||||
Credit Suisse Mortgage Capital Trust, Series 2013-TH1, Class A13,7, 2.13%, 2/25/2043 | 1,187,232 | 1,149,111 | ||||||||||
DB-UBS Mortgage Trust, Series 2011-LC1A, Class A13, 3.742%, 11/10/2046 | 5,997 | 6,016 | ||||||||||
Freddie Mac Multifamily Structured Pass-Through Certificates, Series K009, | 17,910,915 | 704,714 | ||||||||||
Freddie Mac Multifamily Structured Pass-Through Certificates, Series K014, | 8,485,851 | 388,757 | ||||||||||
Freddie Mac Multifamily Structured Pass-Through Certificates, Series K016, | 5,716,953 | 361,360 | ||||||||||
Freddie Mac Multifamily Structured Pass-Through Certificates, Series K017, | 8,540,626 | 489,169 | ||||||||||
Freddie Mac Multifamily Structured Pass-Through Certificates, Series K021, | 12,349,238 | 846,860 | ||||||||||
Freddie Mac Multifamily Structured Pass-Through Certificates, Series K030, | 63,981,952 | 762,838 | ||||||||||
Freddie Mac Multifamily Structured Pass-Through Certificates, Series K032, | 40,553,544 | 284,167 | ||||||||||
Freddie Mac Multifamily Structured Pass-Through Certificates, Series K706, | 8,377,643 | 214,303 | ||||||||||
FREMF Mortgage Trust, Series 2011-K701, Class B3,7, 4.435%, 7/25/2048 | 750,000 | 763,701 | ||||||||||
FREMF Mortgage Trust, Series 2011-K702, Class B3,7, 4.931%, 4/25/2044 | 885,000 | 917,227 | ||||||||||
FREMF Mortgage Trust, Series 2013-K28, Class X2A (IO)3, 0.10%, 6/25/2046 | 160,094,324 | 813,904 | ||||||||||
FREMF Mortgage Trust, Series 2013-K502, Class B3,7, 2.609%, 3/25/2045 | 2,135,000 | 2,138,598 | ||||||||||
FREMF Mortgage Trust, Series 2013-K712, Class B3,7, 3.48%, 5/25/2045 | 885,000 | 906,537 | ||||||||||
FREMF Mortgage Trust, Series 2014-K37, Class B3,7, 4.713%, 1/25/2047 | 1,977,000 | 2,136,753 | ||||||||||
GAHR Commercial Mortgage Trust, Series 2015-NRF, Class BFX3,7, 3.495%, 12/15/2034 | 2,300,000 | 2,359,515 | ||||||||||
GAHR Commercial Mortgage Trust, Series 2015-NRF, Class DFX3,7, 3.495%, 12/15/2034 | 1,000,000 | 1,006,509 | ||||||||||
GS Mortgage Securities Trust, Series 2010-C2, Class A13, 3.849%, 12/10/2043 . | 127,566 | 132,755 | ||||||||||
The accompanying notes are an integral part of the financial statements.
43
Investment Portfolio - October 31, 2016
| PRO-BLEND® MODERATE TERM SERIES | PRINCIPAL AMOUNT 4 | VALUE (NOTE 2) | ||||||||||||||
COMMERCIAL MORTGAGE-BACKED SECURITIES (continued) | ||||||||||||||||
JP Morgan Chase Commercial Mortgage Securities Trust, Series 2006-LDP9, | 1,220,405 | $ | 1,218,773 | |||||||||||||
JP Morgan Mortgage Trust, Series 2013-1, Class 1A23,7, 3.00%, 3/25/2043 | 879,039 | 883,108 | ||||||||||||||
JP Morgan Mortgage Trust, Series 2013-2, Class A23,7, 3.50%, 5/25/2043 | 1,030,841 | 1,061,605 | ||||||||||||||
JP Morgan Mortgage Trust, Series 2014-2, Class 1A13,7, 3.00%, 6/25/2029 | 1,322,101 | 1,357,115 | ||||||||||||||
Motel 6 Trust, Series 2015-MTL6, Class B3, 3.298%, 2/5/2030 | 2,100,000 | 2,103,435 | ||||||||||||||
New Residential Mortgage Loan Trust, Series 2014-3A, Class AFX33,7, 3.75%, 11/25/2054 | 1,284,509 | 1,324,733 | ||||||||||||||
New Residential Mortgage Loan Trust, Series 2015-2A, Class A13,7, 3.75%, 8/25/2055 | 1,526,937 | 1,584,228 | ||||||||||||||
OBP Depositor LLC Trust, Series 2010-OBP, Class A3, 4.646%, 7/15/2045 | 115,000 | 125,191 | ||||||||||||||
SCG Trust, Series 2013-SRP1, Class AJ3,7, 2.485%, 11/15/2026 | 3,550,000 | 3,461,734 | ||||||||||||||
Sequoia Mortgage Trust, Series 2013-2, Class A7, 1.874%, 2/25/2043 | 1,032,338 | 1,012,014 | ||||||||||||||
Sequoia Mortgage Trust, Series 2013-7, Class A27, 3.00%, 6/25/2043 | 899,019 | 908,126 | ||||||||||||||
Sequoia Mortgage Trust, Series 2013-8, Class A17, 3.00%, 6/25/2043 | 1,260,717 | 1,272,412 | ||||||||||||||
Vornado DP LLC Trust, Series 2010-VNO, Class A2FX3, 4.004%, 9/13/2028 | 350,000 | 374,726 | ||||||||||||||
Wachovia Bank Commercial Mortgage Trust, Series 2006-C26, Class A37, 6.011%, 6/15/2045 | 23,037 | 23,026 | ||||||||||||||
Wells Fargo Commercial Mortgage Trust, Series 2010-C1, Class A23, 4.393%, 11/15/2043 | 545,000 | 590,834 | ||||||||||||||
WF-RBS Commercial Mortgage Trust, Series 2013-C11, Class A2, 2.029%, 3/15/2045 | 1,254,655 | 1,261,843 | ||||||||||||||
WinWater Mortgage Loan Trust, Series 2015-1, Class A13,7, 3.50%, 1/20/2045 | 1,556,372 | 1,590,995 | ||||||||||||||
WinWater Mortgage Loan Trust, Series 2015-3, Class A53,7, 3.50%, 3/20/2045 | 1,523,671 | 1,554,610 | ||||||||||||||
|
| |||||||||||||||
TOTAL COMMERCIAL MORTGAGE-BACKED SECURITIES | 43,218,522 | |||||||||||||||
|
| |||||||||||||||
FOREIGN GOVERNMENT BONDS - 2.1% | ||||||||||||||||
Bonos de la Tesoreria de la Republica en pesos (Chile), 6.00%, 1/1/2018 | CLP | 790,000,000 | 1,242,537 | |||||||||||||
Brazilian Government International Bond (Brazil), 8.875%, 10/14/2019 | 400,000 | 471,000 | ||||||||||||||
Canada Housing Trust No. 1 (Canada)3, 4.10%, 12/15/2018 | CAD | 390,000 | 311,247 | |||||||||||||
Canadian Government Bond (Canada), 1.50%, 9/1/2017 | CAD | 160,000 | 120,207 | |||||||||||||
Canadian Government Bond (Canada), 2.75%, 6/1/2022 | CAD | 500,000 | 412,931 | |||||||||||||
Export-Import Bank of Korea (South Korea), 2.625%, 12/30/2020 | 9,100,000 | 9,315,606 | ||||||||||||||
Korea Treasury Bond (South Korea), 2.00%, 12/10/2017 | KRW | 480,000,000 | 421,977 | |||||||||||||
Mexican Government Bond (Mexico), 7.25%, 12/15/2016 | MXN | 6,000,000 | 318,326 | |||||||||||||
Mexican Government Bond (Mexico), 5.00%, 6/15/2017 | MXN | 9,500,000 | 502,407 | |||||||||||||
Mexican Government Bond (Mexico), 8.00%, 6/11/2020 | MXN | 9,900,000 | 560,508 | |||||||||||||
Mexican Government Bond (Mexico), 6.50%, 6/10/2021 | MXN | 4,000,000 | 216,295 | |||||||||||||
Mexican Government Bond (Mexico), 6.50%, 6/9/2022 | MXN | 6,500,000 | 351,874 | |||||||||||||
Mexican Government Bond (Mexico), 7.75%, 5/29/2031 | MXN | 1,250,000 | 73,037 | |||||||||||||
Norway Government Bond (Norway)3, 4.25%, 5/19/2017 | NOK | 1,610,000 | 198,699 | |||||||||||||
Singapore Government Bond (Singapore), 2.50%, 6/1/2019 | SGD | 855,000 | 637,908 | |||||||||||||
Svensk Exportkredit AB (Sweden), 1.125%, 8/28/2019 | 3,700,000 | 3,679,236 | ||||||||||||||
United Kingdom Gilt (United Kingdom), 1.00%, 9/7/2017 | GBP | 380,000 | 468,223 | |||||||||||||
United Kingdom Gilt (United Kingdom), 5.00%, 3/7/2018 | GBP | 475,000 | 618,715 | |||||||||||||
|
| |||||||||||||||
TOTAL FOREIGN GOVERNMENT BONDS | 19,920,733 | |||||||||||||||
|
| |||||||||||||||
U.S. GOVERNMENT AGENCIES - 12.1% | ||||||||||||||||
Mortgage-Backed Securities - 10.1% | ||||||||||||||||
Fannie Mae, Pool #888468, 5.50%, 9/1/2021 | 552,372 | 587,558 | ||||||||||||||
Fannie Mae, Pool #995233, 5.50%, 10/1/2021 | 37,219 | 39,257 | ||||||||||||||
Fannie Mae, Pool #888017, 6.00%, 11/1/2021 | 54,585 | 58,678 | ||||||||||||||
Fannie Mae, Pool #995329, 5.50%, 12/1/2021 | 380,622 | 405,120 | ||||||||||||||
Fannie Mae, Pool #888136, 6.00%, 12/1/2021 | 68,065 | 73,282 | ||||||||||||||
Fannie Mae, Pool #888810, 5.50%, 11/1/2022 | 661,512 | 704,490 | ||||||||||||||
Fannie Mae, Pool #AD0462, 5.50%, 10/1/2024 | 44,045 | 48,015 | ||||||||||||||
The accompanying notes are an integral part of the financial statements.
44
Investment Portfolio - October 31, 2016
| PRO-BLEND® MODERATE TERM SERIES | PRINCIPAL AMOUNT 4 | VALUE (NOTE 2) | ||||||||||
U.S. GOVERNMENT AGENCIES (continued) | ||||||||||||
Mortgage-Backed Securities (continued) | ||||||||||||
Fannie Mae, Pool #MA1834, 4.50%, 2/1/2034 | 1,085,952 | $ | 1,195,341 | |||||||||
Fannie Mae, Pool #MA1890, 4.00%, 5/1/2034 | 1,115,662 | 1,204,690 | ||||||||||
Fannie Mae, Pool #MA1903, 4.50%, 5/1/2034 | 871,502 | 958,811 | ||||||||||
Fannie Mae, Pool #AS3677, 4.00%, 10/1/2034 | 1,432,774 | 1,533,438 | ||||||||||
Fannie Mae, Pool #MA2177, 4.00%, 2/1/2035 | 1,858,447 | 2,010,027 | ||||||||||
Fannie Mae, Pool #AZ3376, 4.00%, 7/1/2035 | 3,626,447 | 3,922,286 | ||||||||||
Fannie Mae, Pool #745418, 5.50%, 4/1/2036 | 964,214 | 1,093,949 | ||||||||||
Fannie Mae, Pool #888021, 6.00%, 12/1/2036 | 141,492 | 162,268 | ||||||||||
Fannie Mae, Pool #995050, 6.00%, 9/1/2037 | 314,533 | 360,929 | ||||||||||
Fannie Mae, Pool #AB8161, 6.00%, 12/1/2037 | 1,149,047 | 1,316,386 | ||||||||||
Fannie Mae, Pool #933731, 5.50%, 4/1/2038 | 516,334 | 583,756 | ||||||||||
Fannie Mae, Pool #889576, 6.00%, 4/1/2038 | 670,187 | 768,657 | ||||||||||
Fannie Mae, Pool #889624, 5.50%, 5/1/2038 | 645,327 | 731,330 | ||||||||||
Fannie Mae, Pool #889579, 6.00%, 5/1/2038 | 600,242 | 688,751 | ||||||||||
Fannie Mae, Pool #889575, 6.00%, 6/1/2038 | 411,790 | 471,835 | ||||||||||
Fannie Mae, Pool #995196, 6.00%, 7/1/2038 | 1,823,538 | 2,092,557 | ||||||||||
Fannie Mae, Pool #AD0119, 6.00%, 7/1/2038 | 389,874 | 446,277 | ||||||||||
Fannie Mae, Pool #AD0207, 6.00%, 10/1/2038 | 236,391 | 271,183 | ||||||||||
Fannie Mae, Pool #AD0220, 6.00%, 10/1/2038 | 80,053 | 91,868 | ||||||||||
Fannie Mae, Pool #AD0527, 5.50%, 6/1/2039 | 211,240 | 238,856 | ||||||||||
Fannie Mae, Pool #MA0258, 4.50%, 12/1/2039 | 1,502,582 | 1,642,836 | ||||||||||
Fannie Mae, Pool #890326, 5.50%, 1/1/2040 | 1,622,687 | 1,837,715 | ||||||||||
Fannie Mae, Pool #AL1595, 6.00%, 1/1/2040 | 1,051,581 | 1,205,443 | ||||||||||
Fannie Mae, Pool #AE0061, 6.00%, 2/1/2040 | 861,931 | 988,593 | ||||||||||
Fannie Mae, Pool #AL0152, 6.00%, 6/1/2040 | 1,390,930 | 1,595,871 | ||||||||||
Fannie Mae, Pool #AL2581, 6.00%, 6/1/2040 | 902,623 | 1,034,625 | ||||||||||
Fannie Mae, Pool #AE0951, 4.50%, 2/1/2041 | 961,065 | 1,051,617 | ||||||||||
Fannie Mae, Pool #AL0241, 4.00%, 4/1/2041 | 1,464,227 | 1,572,878 | ||||||||||
Fannie Mae, Pool #AH9054, 4.50%, 4/1/2041 | 415,347 | 454,288 | ||||||||||
Fannie Mae, Pool #AI2468, 4.50%, 5/1/2041 | 340,137 | 372,990 | ||||||||||
Fannie Mae, Pool #AL0160, 4.50%, 5/1/2041 | 1,007,888 | 1,104,781 | ||||||||||
Fannie Mae, Pool #AI5172, 4.00%, 8/1/2041 | 1,121,880 | 1,204,970 | ||||||||||
Fannie Mae, Pool #AL1410, 4.50%, 12/1/2041 | 2,750,833 | 3,015,956 | ||||||||||
Fannie Mae, Pool #AK4940, 3.50%, 3/1/2042 | 1,273,629 | 1,342,045 | ||||||||||
Fannie Mae, Pool #AL7068, 4.50%, 9/1/2042 | 2,940,070 | 3,210,139 | ||||||||||
Fannie Mae, Pool #AL7729, 4.00%, 6/1/2043 | 1,422,310 | 1,527,056 | ||||||||||
Fannie Mae, Pool #AL7767, 4.50%, 6/1/2044 | 2,804,995 | 3,066,050 | ||||||||||
Fannie Mae, Pool #AX5234, 4.50%, 11/1/2044 | 4,242,430 | 4,638,961 | ||||||||||
Fannie Mae, Pool #AZ3627, 4.00%, 11/1/2045 | 689,261 | 738,121 | ||||||||||
Fannie Mae, Pool #BA3890, 4.00%, 11/1/2045 | 879,844 | 942,282 | ||||||||||
Fannie Mae, Pool #BA3034, 4.00%, 12/1/2045 | 455,538 | 487,969 | ||||||||||
Fannie Mae, Pool #AZ5009, 4.00%, 1/1/2046 | 757,991 | 811,762 | ||||||||||
Fannie Mae, Pool #BC3490, 3.50%, 2/1/2046 | 3,153,155 | 3,310,514 | ||||||||||
Fannie Mae, Pool #BC6764, 3.50%, 4/1/2046 | 1,890,693 | 1,985,287 | ||||||||||
Fannie Mae, Pool #BD1381, 3.50%, 6/1/2046 | 994,307 | 1,044,111 | ||||||||||
Fannie Mae, Pool #AS7568, 4.50%, 7/1/2046 | 2,458,198 | 2,695,102 | ||||||||||
Fannie Mae, Pool #AL8674, 5.655%, 1/1/2049 | 3,138,087 | 3,555,749 | ||||||||||
Freddie Mac, Pool #G11850, 5.50%, 7/1/2020 | 174,227 | 182,218 | ||||||||||
Freddie Mac, Pool #G12610, 6.00%, 3/1/2022 | 69,973 | 75,596 | ||||||||||
Freddie Mac, Pool #G12655, 6.00%, 5/1/2022 | 49,900 | 54,025 | ||||||||||
Freddie Mac, Pool #G12988, 6.00%, 1/1/2023 | 37,554 | 40,776 | ||||||||||
Freddie Mac, Pool #G13078, 6.00%, 3/1/2023 | 67,169 | 72,731 | ||||||||||
Freddie Mac, Pool #G13331, 5.50%, 10/1/2023 | 29,502 | 31,773 | ||||||||||
Freddie Mac, Pool #C91754, 4.50%, 3/1/2034 | 1,060,616 | 1,167,248 | ||||||||||
Freddie Mac, Pool #C91762, 4.50%, 5/1/2034 | 1,389,282 | 1,527,538 | ||||||||||
Freddie Mac, Pool #C91788, 4.00%, 10/1/2034 | 1,326,126 | 1,434,721 | ||||||||||
The accompanying notes are an integral part of the financial statements.
45
Investment Portfolio - October 31, 2016
| PRO-BLEND® MODERATE TERM SERIES | PRINCIPAL AMOUNT 4 | VALUE (NOTE 2) | ||||||||||
U.S. GOVERNMENT AGENCIES (continued) | ||||||||||||
Mortgage-Backed Securities (continued) | ||||||||||||
Freddie Mac, Pool #C91850, 4.00%, 9/1/2035 | 2,102,643 | $ | 2,271,868 | |||||||||
Freddie Mac, Pool #C91854, 4.00%, 10/1/2035 | 1,547,680 | 1,676,041 | ||||||||||
Freddie Mac, Pool #G03332, 6.00%, 10/1/2037 | 88,278 | 101,144 | ||||||||||
Freddie Mac, Pool #G03696, 5.50%, 1/1/2038 | 176,981 | 200,550 | ||||||||||
Freddie Mac, Pool #G03781, 6.00%, 1/1/2038 | 366,620 | 420,352 | ||||||||||
Freddie Mac, Pool #G03926, 6.00%, 2/1/2038 | 421,488 | 482,793 | ||||||||||
Freddie Mac, Pool #G04264, 5.50%, 4/1/2038 | 736,472 | 830,333 | ||||||||||
Freddie Mac, Pool #G04731, 5.50%, 4/1/2038 | 420,295 | 477,155 | ||||||||||
Freddie Mac, Pool #G08273, 5.50%, 6/1/2038 | 507,462 | 574,875 | ||||||||||
Freddie Mac, Pool #G05956, 5.50%, 7/1/2038 | 579,960 | 657,232 | ||||||||||
Freddie Mac, Pool #G05671, 5.50%, 8/1/2038 | 309,421 | 350,551 | ||||||||||
Freddie Mac, Pool #G05409, 5.50%, 3/1/2039 | 570,350 | 646,289 | ||||||||||
Freddie Mac, Pool #A86522, 4.50%, 5/1/2039 | 1,260,498 | 1,379,431 | ||||||||||
Freddie Mac, Pool #G05923, 5.50%, 2/1/2040 | 220,005 | 249,666 | ||||||||||
Freddie Mac, Pool #G05900, 6.00%, 3/1/2040 | 300,697 | 343,739 | ||||||||||
Freddie Mac, Pool #G05906, 6.00%, 4/1/2040 | 233,420 | 267,999 | ||||||||||
Freddie Mac, Pool #A92889, 4.50%, 7/1/2040 | 3,041,924 | 3,328,790 | ||||||||||
Freddie Mac, Pool #G07589, 5.50%, 6/1/2041 | 672,659 | 761,705 | ||||||||||
Freddie Mac, Pool #Q17719, 3.50%, 4/1/2043 | 1,643,319 | 1,730,179 | ||||||||||
Freddie Mac, Pool #G08672, 4.00%, 10/1/2045 | 975,181 | 1,042,655 | ||||||||||
Freddie Mac, Pool #Q37592, 4.00%, 12/1/2045 | 2,857,815 | 3,081,296 | ||||||||||
Freddie Mac, Pool #Q37892, 4.00%, 12/1/2045 | 1,747,727 | 1,869,276 | ||||||||||
Freddie Mac, Pool #Q42596, 3.50%, 8/1/2046 | 2,079,856 | 2,188,454 | ||||||||||
Ginnie Mae, Pool #263096, 9.50%, 3/15/2020 | 756 | 759 | ||||||||||
|
| |||||||||||
Total Mortgage-Backed Securities | 98,017,064 | |||||||||||
|
| |||||||||||
Other Agencies - 2.0% | ||||||||||||
Fannie Mae, 2.625%, 9/6/2024 (Identified Cost $19,923,003) | 18,566,000 | 19,578,757 | ||||||||||
|
| |||||||||||
TOTAL U.S. GOVERNMENT AGENCIES | 117,595,821 | |||||||||||
|
| |||||||||||
SHARES/ CONTRACTS | VALUE (NOTE 2) | |||||||||||
SHORT-TERM INVESTMENT - 0.7% | ||||||||||||
Dreyfus Government Cash Management10, 0.28%, (Identified Cost $6,455,176) | 6,455,176 | 6,455,176 | ||||||||||
|
| |||||||||||
TOTAL INVESTMENTS - 99.9% | 967,603,048 | |||||||||||
OTHER ASSETS, LESS LIABILITIES - 0.1% | 1,158,388 | |||||||||||
|
| |||||||||||
NET ASSETS - 100% | $ | 968,761,436 | ||||||||||
|
| |||||||||||
CALL OPTIONS WRITTEN - 0.0%## | ||||||||||||
Liberty Global plc - Class A, Strike $35, Expiring November 18, 2016, (Premiums Received $22,136) | 561 | $ | (16,830 | ) | ||||||||
|
| |||||||||||
PUT OPTIONS WRITTEN - 0.0%## | ||||||||||||
Facebook, Inc. - Class A, Strike $120, Expiring November 4, 2016, | 149 | (5,960 | ) | |||||||||
The Priceline Group, Inc., Strike $1,330, Expiring November 11, 2016, | 13 | (8,580 | ) | |||||||||
Skyworks Solutions, Inc., Strike $70, Expiring November 4, 2016, | 258 | (11,610 | ) | |||||||||
|
| |||||||||||
TOTAL PUT OPTIONS WRITTEN | $ | (26,150 | ) | |||||||||
|
| |||||||||||
The accompanying notes are an integral part of the financial statements.
46
Investment Portfolio - October 31, 2016
ADR - American Depositary Receipt
AUD - Australian Dollar
CAD - Canadian Dollar
CLP - Chilean Peso
ETF - Exchange-traded fund
GBP - British Pound
IO - Interest only
KRW - South Korean Won
MXN - Mexican Peso
No. - Number
NOK - Norwegian Krone
SGD - Singapore Dollar
##Less than 0.1%.
*Non-income producing security.
1A factor from a third party vendor was applied to determine the security’s fair value following the close of local trading.
2A portion of this security is designated with the broker as collateral for options contracts written. As of October 31, 2016, the total value of such securities was $17,910,418.
3Restricted securities - Investment in securities that are restricted as to public resale under the Securities Act of 1933, as amended. These securities have been sold under Rule 144A and have been determined to be liquid. These securities amount to $87,520,856 or 9.0%, of the Series’ net assets as of October 31, 2016 (see Note 2 to the financial statements).
4Amount is stated in USD unless otherwise noted.
5Security is perpetual in nature and has no stated maturity date.
6The rate shown is a fixed rate as of October 31, 2016; the rate becomes floating, based on LIBOR plus a spread, in December 2024.
7The coupon rate is floating and is the effective rate as of October 31, 2016.
8The rate shown is a fixed rate as of October 31, 2016; the rate becomes floating, based on LIBOR plus a spread, in September 2022.
9Represents a Payment-In-Kind bond.
10Rate shown is the current yield as of October 31, 2016.
The Global Industry Classification Standard (GICS) was developed by and is the exclusive property and a service mark of MSCI Inc. (MSCI) and Standard &Poor, a division of The McGraw-Hill Companies, Inc. (S&P), and is licensed for use by Manning & Napier when referencing GICS sectors. Neither MSCI, S&P, nor any third party involved in making or compiling the GICS or any GICS classifications makes any express or implied warranties or representations with respect to such standard or classification, nor shall any such party have any liability therefrom.
The accompanying notes are an integral part of the financial statements.
47
Statement of Assets and Liabilities - Pro-Blend® Moderate Term Series
October 31, 2016
ASSETS: | ||||
Investments, at value (identified cost $931,574,272) (Note 2) | $ | 967,603,048 | ||
Interest receivable | 3,353,635 | |||
Receivable for securities sold | 2,654,822 | |||
Receivable for fund shares sold | 458,328 | |||
Foreign tax reclaims receivable | 368,191 | |||
Dividends receivable | 293,751 | |||
Prepaid expenses | 24,959 | |||
|
| |||
TOTAL ASSETS | 974,756,734 | |||
|
| |||
LIABILITIES: | ||||
Accrued management fees (Note 3) | 626,883 | |||
Accrued distribution and service (Rule 12b-1) fees (Class C) (Class R) (Note 3) | 123,952 | |||
Accrued shareholder services fees (Class S) (Note 3) | 110,147 | |||
Accrued fund accounting and administration fees (Note 3) | 42,929 | |||
Accrued transfer agent fees (Note 3) | 24,263 | |||
Accrued Directors’ fees (Note 3) | 497 | |||
Accrued Chief Compliance Officer service fees (Note 3) | 353 | |||
Options written, at value (premiums received $79,426) (Note 2) | 42,980 | |||
Accrued foreign capital gains tax (Note 2) | 178 | |||
Payable for fund shares repurchased | 3,709,546 | |||
Payable for securities purchased | 1,198,910 | |||
Other payables and accrued expenses | 114,660 | |||
|
| |||
TOTAL LIABILITIES | 5,995,298 | |||
|
| |||
TOTAL NET ASSETS | $ | 968,761,436 | ||
|
| |||
NET ASSETS CONSIST OF: | ||||
Capital stock | $ | 828,433 | ||
Additional paid-in-capital | 913,683,131 | |||
Undistributed net investment income | 3,744,257 | |||
Accumulated net realized gain on investments, foreign currency and translation of other assets and liabilities | 14,485,191 | |||
Net unrealized appreciation (depreciation) on investments (net of foreign capital gains tax of $178), foreign currency and translation of other assets and liabilities | 36,020,424 | |||
|
| |||
TOTAL NET ASSETS | $ | 968,761,436 | ||
|
| |||
The accompanying notes are an integral part of the financial statements.
48
Statement of Assets and Liabilities - Pro-Blend® Moderate Term Series
October 31, 2016
NET ASSET VALUE, OFFERING PRICE AND REDEMPTION PRICE PER SHARE - Class S | $ | 13.37 | ||
|
| |||
NET ASSET VALUE, OFFERING PRICE AND REDEMPTION PRICE PER SHARE - Class I | $ | 10.20 | ||
|
| |||
NET ASSET VALUE, OFFERING PRICE AND REDEMPTION PRICE PER SHARE - Class C | $ | 10.29 | ||
|
| |||
NET ASSET VALUE, OFFERING PRICE AND REDEMPTION PRICE PER SHARE - Class R | $ | 10.68 | ||
|
| |||
The accompanying notes are an integral part of the financial statements.
49
Statement of Operations - Pro-Blend® Moderate Term Series
For the Year Ended October 31, 2016
INVESTMENT INCOME: | ||||
Interest | $ | 18,915,802 | ||
Dividends (net of foreign taxes withheld, $185,766) | 7,351,481 | |||
|
| |||
Total Investment Income | 26,267,283 | |||
|
| |||
EXPENSES: | ||||
Management fees (Note 3) | 9,616,840 | |||
Shareholder services fees (Class S) (Note 3) | 1,422,695 | |||
Distribution and service (Rule 12b-1) fees (Class C) (Note 3) | 1,352,656 | |||
Fund accounting and administration fees (Note 3) | 258,808 | |||
Distribution and service (Rule 12b-1) fees (Class R) (Note 3) | 178,106 | |||
Transfer agent fees (Note 3) | 159,268 | |||
Directors’ fees (Note 3) | 100,730 | |||
Chief Compliance Officer service fees (Note 3) | 3,727 | |||
Custodian fees | 97,762 | |||
Miscellaneous | 303,415 | |||
|
| |||
Total Expenses | 13,494,007 | |||
|
| |||
NET INVESTMENT INCOME | 12,773,276 | |||
|
| |||
REALIZED AND UNREALIZED GAIN (LOSS) ON INVESTMENTS AND FOREIGN CURRENCY: | ||||
Net realized gain (loss) on- | ||||
Investments | 23,566,907 | |||
Futures contracts | (9,912,872 | ) | ||
Options written | 758,997 | |||
Foreign currency and translation of other assets and liabilities | (1,970,777 | ) | ||
|
| |||
| 12,442,255 | ||||
|
| |||
Net change in unrealized appreciation (depreciation) on- | ||||
Investments (net of decrease in accrued foreign capital gains tax of $604) | 200,981 | |||
Futures contracts | 1,250,569 | |||
Options written | 36,446 | |||
Foreign currency and translation of other assets and liabilities | (2,302 | ) | ||
|
| |||
| 1,485,694 | ||||
|
| |||
NET REALIZED AND UNREALIZED GAIN (LOSS) ON INVESTMENTS AND FOREIGN CURRENCY | 13,927,949 | |||
|
| |||
NET INCREASE IN NET ASSETS RESULTING FROM OPERATIONS | $ | 26,701,225 | ||
|
| |||
The accompanying notes are an integral part of the financial statements.
50
Statements of Changes in Net Assets - Pro-Blend® Moderate Term Series
FOR THE YEAR ENDED 10/31/16 | FOR THE YEAR ENDED 10/31/15 | |||||||
INCREASE (DECREASE) IN NET ASSETS: | ||||||||
OPERATIONS: | ||||||||
Net investment income | $ | 12,773,276 | $ | 18,743,885 | ||||
Net realized gain on investments and foreign currency | 12,442,255 | 5,837,309 | ||||||
Net change in unrealized appreciation (depreciation) on investments and foreign currency | 1,485,694 | (57,677,527 | ) | |||||
|
|
|
| |||||
Net increase (decrease) from operations | 26,701,225 | (33,096,333 | ) | |||||
|
|
|
| |||||
DISTRIBUTIONS TO SHAREHOLDERS (Note 8): | ||||||||
From net investment income (Class S) | (4,729,271 | ) | (6,361,974 | ) | ||||
From net investment income (Class I) | (9,622,576 | ) | (10,068,499 | ) | ||||
From net investment income (Class C) | (429,546 | ) | (598,118 | ) | ||||
From net investment income (Class R) | (270,283 | ) | (414,173 | ) | ||||
From net realized gain on investments (Class S) | (1,848,286 | ) | (53,056,681 | ) | ||||
From net realized gain on investments (Class I) | (2,787,665 | ) | (62,123,946 | ) | ||||
From net realized gain on investments (Class C) | (532,912 | ) | (12,982,360 | ) | ||||
From net realized gain on investments (Class R) | (137,520 | ) | (4,081,502 | ) | ||||
|
|
|
| |||||
Total distributions to shareholders | (20,358,059 | ) | (149,687,253 | ) | ||||
|
|
|
| |||||
CAPITAL STOCK ISSUED AND REPURCHASED: | ||||||||
Net increase (decrease) from capital share transactions (Note 5) | (649,253,761 | ) | 88,498,622 | |||||
|
|
|
| |||||
Net decrease in net assets | (642,910,595 | ) | (94,284,964 | ) | ||||
NET ASSETS: | ||||||||
Beginning of year | 1,611,672,031 | 1,705,956,995 | ||||||
|
|
|
| |||||
End of year (including undistributed net investment income of $3,744,257 and $8,229,281,respectively) | $ | 968,761,436 | $ | 1,611,672,031 | ||||
|
|
|
| |||||
The accompanying notes are an integral part of the financial statements.
51
Financial Highlights - Pro-Blend® Moderate Term Series - Class S
| FOR THE YEARS ENDED | ||||||||||||||||||||
| 10/31/16 | 10/31/15 | 10/31/14 | 10/31/13 | 10/31/12 | ||||||||||||||||
Per share data (for a share outstanding throughout each year): | ||||||||||||||||||||
Net asset value - Beginning of year | $ | 13.15 | $ | 14.53 | $ | 14.52 | $ | 13.28 | $ | 12.92 | ||||||||||
|
|
|
|
|
|
|
|
|
| |||||||||||
Income (loss) from investment operations: | ||||||||||||||||||||
Net investment income1 | 0.13 | 0.15 | 0.16 | 0.14 | 0.17 | |||||||||||||||
Net realized and unrealized gain (loss) on investments | 0.23 | (0.44 | ) | 0.59 | 1.55 | 0.77 | ||||||||||||||
|
|
|
|
|
|
|
|
|
| |||||||||||
Total from investment operations | 0.36 | (0.29 | ) | 0.75 | 1.69 | 0.94 | ||||||||||||||
|
|
|
|
|
|
|
|
|
| |||||||||||
Less distributions to shareholders: | ||||||||||||||||||||
From net investment income | (0.10 | ) | (0.12 | ) | (0.12 | ) | (0.13 | ) | (0.20 | ) | ||||||||||
From net realized gain on investments | (0.04 | ) | (0.97 | ) | (0.62 | ) | (0.32 | ) | (0.38 | ) | ||||||||||
|
|
|
|
|
|
|
|
|
| |||||||||||
Total distributions to shareholders | (0.14 | ) | (1.09 | ) | (0.74 | ) | (0.45 | ) | (0.58 | ) | ||||||||||
|
|
|
|
|
|
|
|
|
| |||||||||||
Net asset value - End of year | $ | 13.37 | $ | 13.15 | $ | 14.53 | $ | 14.52 | $ | 13.28 | ||||||||||
|
|
|
|
|
|
|
|
|
| |||||||||||
Net assets - End of year (000’s omitted) | $ | 511,577 | $ | 683,089 | $ | 788,276 | $ | 793,812 | $ | 707,222 | ||||||||||
|
|
|
|
|
|
|
|
|
| |||||||||||
Total return2 | 2.77 | % | (1.99 | %) | 5.47 | % | 13.07 | % | 7.73 | % | ||||||||||
Ratios (to average net assets)/Supplemental Data: | ||||||||||||||||||||
Expenses | 1.07 | % | 1.06 | % | 1.06 | % | 1.06 | % | 1.07 | % | ||||||||||
Net investment income | 0.97 | % | 1.08 | % | 1.12 | % | 1.04 | % | 1.34 | % | ||||||||||
Series portfolio turnover | 67 | % | 56 | % | 53 | % | 52 | % | 47 | % | ||||||||||
1Calculated based on average shares outstanding during the years.
2Represents aggregate total return for the years indicated, and assumes reinvestment of all distributions.
The accompanying notes are an integral part of the financial statements.
52
Financial Highlights - Pro-Blend® Moderate Term Series - Class I
| FOR THE YEARS ENDED | ||||||||||||||||||||
| 10/31/16 | 10/31/15 | 10/31/14 | 10/31/13 | 10/31/12 | ||||||||||||||||
Per share data (for a share outstanding throughout each year): | ||||||||||||||||||||
Net asset value - Beginning of year | $ | 10.07 | $ | 11.40 | $ | 11.56 | $ | 10.67 | $ | 10.50 | ||||||||||
|
|
|
|
|
|
|
|
|
| |||||||||||
Income (loss) from investment operations: | ||||||||||||||||||||
Net investment income1 | 0.12 | 0.14 | 0.16 | 0.14 | 0.16 | |||||||||||||||
Net realized and unrealized gain (loss) on investments | 0.18 | (0.35 | ) | 0.46 | 1.23 | 0.62 | ||||||||||||||
|
|
|
|
|
|
|
|
|
| |||||||||||
Total from investment operations | 0.30 | (0.21 | ) | 0.62 | 1.37 | 0.78 | ||||||||||||||
|
|
|
|
|
|
|
|
|
| |||||||||||
Less distributions to shareholders: | ||||||||||||||||||||
From net investment income | (0.13 | ) | (0.15 | ) | (0.16 | ) | (0.16 | ) | (0.23 | ) | ||||||||||
From net realized gain on investments | (0.04 | ) | (0.97 | ) | (0.62 | ) | (0.32 | ) | (0.38 | ) | ||||||||||
|
|
|
|
|
|
|
|
|
| |||||||||||
Total distributions to shareholders | (0.17 | ) | (1.12 | ) | (0.78 | ) | (0.48 | ) | (0.61 | ) | ||||||||||
|
|
|
|
|
|
|
|
|
| |||||||||||
Net asset value - End of year | $ | 10.20 | $ | 10.07 | $ | 11.40 | $ | 11.56 | $ | 10.67 | ||||||||||
|
|
|
|
|
|
|
|
|
| |||||||||||
Net assets - End of year (000’s omitted) | $ | 299,009 | $ | 740,524 | $ | 719,847 | $ | 614,016 | $ | 496,286 | ||||||||||
|
|
|
|
|
|
|
|
|
| |||||||||||
Total return2 | 3.08 | % | (1.76 | %) | 5.73 | % | 13.34 | % | 8.06 | % | ||||||||||
Ratios (to average net assets)/Supplemental Data: | ||||||||||||||||||||
Expenses | 0.82 | % | 0.81 | % | 0.81 | % | 0.81 | % | 0.82 | % | ||||||||||
Net investment income | 1.24 | % | 1.33 | % | 1.37 | % | 1.28 | % | 1.57 | % | ||||||||||
Series portfolio turnover | 67 | % | 56 | % | 53 | % | 52 | % | 47 | % | ||||||||||
1Calculated based on average shares outstanding during the years.
2Represents aggregate total return for the years indicated, and assumes reinvestment of all distributions.
The accompanying notes are an integral part of the financial statements.
53
Financial Highlights - Pro-Blend® Moderate Term Series - Class C
| FOR THE YEARS ENDED | ||||||||||||||||||||
| 10/31/16 | 10/31/15 | 10/31/14 | 10/31/13 | 10/31/12 | ||||||||||||||||
Per share data (for a share outstanding throughout each year): | ||||||||||||||||||||
Net asset value - Beginning of year | $ | 10.16 | $ | 11.49 | $ | 11.65 | $ | 10.75 | $ | 10.58 | ||||||||||
|
|
|
|
|
|
|
|
|
| |||||||||||
Income (loss) from investment operations: | ||||||||||||||||||||
Net investment income1 | 0.02 | 0.03 | 0.04 | 0.03 | 0.06 | |||||||||||||||
Net realized and unrealized gain (loss) on investments | 0.18 | (0.35 | ) | 0.47 | 1.25 | 0.62 | ||||||||||||||
|
|
|
|
|
|
|
|
|
| |||||||||||
Total from investment operations | 0.20 | (0.32 | ) | 0.51 | 1.28 | 0.68 | ||||||||||||||
|
|
|
|
|
|
|
|
|
| |||||||||||
Less distributions to shareholders: | ||||||||||||||||||||
From net investment income | (0.03 | ) | (0.04 | ) | (0.05 | ) | (0.06 | ) | (0.13 | ) | ||||||||||
From net realized gain on investments | (0.04 | ) | (0.97 | ) | (0.62 | ) | (0.32 | ) | (0.38 | ) | ||||||||||
|
|
|
|
|
|
|
|
|
| |||||||||||
Total distributions to shareholders | (0.07 | ) | (1.01 | ) | (0.67 | ) | (0.38 | ) | (0.51 | ) | ||||||||||
|
|
|
|
|
|
|
|
|
| |||||||||||
Net asset value - End of year | $ | 10.29 | $ | 10.16 | $ | 11.49 | $ | 11.65 | $ | 10.75 | ||||||||||
|
|
|
|
|
|
|
|
|
| |||||||||||
Net assets - End of year (000’s omitted) | $ | 128,677 | $ | 148,143 | $ | 150,654 | $ | 112,601 | $ | 81,457 | ||||||||||
|
|
|
|
|
|
|
|
|
| |||||||||||
Total return2 | 1.98 | % | (2.77 | %) | 4.69 | % | 12.27 | % | 6.94 | % | ||||||||||
Ratios (to average net assets)/Supplemental Data: | ||||||||||||||||||||
Expenses | 1.82 | % | 1.81 | % | 1.81 | % | 1.81 | % | 1.82 | % | ||||||||||
Net investment income | 0.22 | % | 0.33 | % | 0.37 | % | 0.29 | % | 0.57 | % | ||||||||||
Series portfolio turnover | 67 | % | 56 | % | 53 | % | 52 | % | 47 | % | ||||||||||
1Calculated based on average shares outstanding during the years.
2Represents aggregate total return for the years indicated, and assumes reinvestment of all distributions.
The accompanying notes are an integral part of the financial statements.
54
Financial Highlights - Pro-Blend® Moderate Term Series - Class R
| FOR THE YEARS ENDED | ||||||||||||||||||||
| 10/31/16 | 10/31/15 | 10/31/14 | 10/31/13 | 10/31/12 | ||||||||||||||||
Per share data (for a share outstanding throughout each year): | ||||||||||||||||||||
Net asset value - Beginning of year | $ | 10.53 | $ | 11.87 | $ | 12.00 | $ | 11.06 | $ | 10.88 | ||||||||||
|
|
|
|
|
|
|
|
|
| |||||||||||
Income (loss) from investment operations: | ||||||||||||||||||||
Net investment income1 | 0.07 | 0.09 | 0.10 | 0.09 | 0.11 | |||||||||||||||
Net realized and unrealized gain (loss) on investments | 0.20 | (0.36 | ) | 0.49 | 1.28 | 0.65 | ||||||||||||||
|
|
|
|
|
|
|
|
|
| |||||||||||
Total from investment operations | 0.27 | (0.27 | ) | 0.59 | 1.37 | 0.76 | ||||||||||||||
|
|
|
|
|
|
|
|
|
| |||||||||||
Less distributions to shareholders: | ||||||||||||||||||||
From net investment income | (0.08 | ) | (0.10 | ) | (0.10 | ) | (0.11 | ) | (0.20 | ) | ||||||||||
From net realized gain on investments | (0.04 | ) | (0.97 | ) | (0.62 | ) | (0.32 | ) | (0.38 | ) | ||||||||||
|
|
|
|
|
|
|
|
|
| |||||||||||
Total distributions to shareholders | (0.12 | ) | (1.07 | ) | (0.72 | ) | (0.43 | ) | (0.58 | ) | ||||||||||
|
|
|
|
|
|
|
|
|
| |||||||||||
Net asset value - End of year | $ | 10.68 | $ | 10.53 | $ | 11.87 | $ | 12.00 | $ | 11.06 | ||||||||||
|
|
|
|
|
|
|
|
|
| |||||||||||
Net assets - End of year (000’s omitted) | $ | 29,499 | $ | 39,917 | $ | 47,180 | $ | 50,280 | $ | 39,999 | ||||||||||
|
|
|
|
|
|
|
|
|
| |||||||||||
Total return2 | 2.55 | % | (2.30 | %) | 5.24 | % | 12.77 | % | 7.48 | % | ||||||||||
Ratios (to average net assets)/Supplemental Data: | ||||||||||||||||||||
Expenses | 1.32 | % | 1.31 | % | 1.31 | % | 1.31 | % | 1.33 | % | ||||||||||
Net investment income | 0.72 | % | 0.83 | % | 0.87 | % | 0.80 | % | 1.04 | % | ||||||||||
Series portfolio turnover | 67 | % | 56 | % | 53 | % | 52 | % | 47 | % | ||||||||||
1Calculated based on average shares outstanding during the years.
2Represents aggregate total return for the years indicated, and assumes reinvestment of all distributions.
The accompanying notes are an integral part of the financial statements.
55
Performance Update as of October 31, 2016 - Pro-Blend® Extended Term Series
(unaudited)
| AVERAGE ANNUAL TOTAL RETURNS AS OF OCTOBER 31, 2016 | ||||||||||||||||
ONE YEAR1 | FIVE YEAR | TEN YEAR | SINCE INCEPTION2 | |||||||||||||
Manning & Napier Fund, Inc. - Pro-Blend® Extended Term Series - Class S3 | 3.23 | % | 6.60 | % | 4.72 | % | 8.10 | % | ||||||||
Manning & Napier Fund, Inc. - Pro-Blend® Extended Term Series - Class I3,4 | 3.52 | % | 6.87 | % | 4.94 | % | 8.20 | % | ||||||||
Manning & Napier Fund, Inc. - Pro-Blend® Extended Term Series - Class C3,5 | 2.53 | % | 5.82 | % | 3.96 | % | 7.35 | % | ||||||||
Manning & Napier Fund, Inc. - Pro-Blend® Extended Term Series - Class R3,5 | 2.93 | % | 6.33 | % | 4.45 | % | 7.87 | % | ||||||||
Bloomberg Barclays U.S. Aggregate Bond Index6 | 4.37 | % | 2.90 | % | 4.64 | % | 5.44 | % | ||||||||
40/15/45 Blended Index7 | 3.86 | % | 7.28 | % | 5.42 | % | 7.12 | % | ||||||||
The following graph compares the value of a $10,000 investment in the Manning & Napier Fund, Inc. - Pro-Blend® Extended Term Series - Class S for the ten years ended October 31, 2016 to the Bloomberg Barclays U.S. Aggregate Bond Index and the 40/15/45 Blended Index.

1The returns shown are based on net asset values calculated for shareholder transactions and may differ from the returns shown in the financial highlights, which reflect adjustments made to the net asset values in accordance with accounting principles generally accepted in the United States of America.
2Performance numbers for the Series are calculated from October 12, 1993, the Class S inception date. The Bloomberg Barclays U.S. Aggregate Bond Index only publishes month-end numbers; therefore, performance numbers for the Indices are calculated from October 31, 1993.
3The Series’ performance does not reflect the deduction of taxes that a shareholder would pay on fund distributions or the redemption of shares. The Series’ performance is historical and may not be indicative of future results. The performance returns shown are inclusive of the net expense ratio of the Series. For the year ended October 31, 2016, this net expense ratio was 1.07% for Class S, 0.82% for Class I, 1.82% for Class C and 1.32% for Class R. The gross expense ratio, which does not account for any voluntary or contractual waivers currently in effect, was 1.07% for Class S, 0.82% for Class I, 1.82% for Class C and 1.32% for Class R for the year ended October 31, 2016.
4For the periods through the inception of Class I on March 28, 2008, performance is based on the hypothetical performance of Class S shares. Because Class I shares invest in the same portfolio of securities as Class S, performance will only be different to the extent that the Class S shares have a higher expense ratio.
5For periods through the inception of Class C on January 4, 2010, and Class R on June 30, 2010, the performance figures are hypothetical and reflect the performance of the Manning & Napier Fund, Inc. - Pro-Blend® Extended Term Series - Class S adjusted for expense differences.
6The Bloomberg Barclays U.S. Aggregate Bond Index is an unmanaged, market-value weighted index of U.S. domestic investment-grade debt issues, including government, corporate, asset-backed, and mortgage-backed securities, with maturities of one year or more. Index returns do not reflect any fees or expenses. Index returns provided by Interactive Data.
56
Performance Update as of October 31, 2016 - Pro-Blend® Extended Term Series
(unaudited)
7The 40/15/45 Blended Index is 40% Russell 3000® Index (Russell 3000), 15% MSCI ACWI ex USA Index (ACWIxUS), and 45% Bloomberg Barclays U.S. Aggregate Bond Index (BAB). Russell 3000 is an unmanaged index that consists of 3,000 of the largest U.S. companies based on total market capitalization. Index returns are based on a market capitalization weighted average of relative price changes of the component stocks plus dividends whose reinvestments are compounded daily. Index returns provided by Bloomberg. ACWIxUS is a free float-adjusted market capitalization index that is designed to measure equity market performance in the global developed and emerging markets and consists of 45 developed and emerging market country indices outside the U.S. The Index is denominated in U.S. dollars. The Index returns assume daily investment of gross dividends (which do not account for applicable dividend taxation) prior to 12/31/1998, as net returns were not available. Subsequent to 12/31/1998, the Index returns are net of withholding taxes. They assume daily reinvestment of net dividends thus accounting for any applicable dividend taxation. Index returns provided by Bloomberg. BAB is an unmanaged, market value-weighted index of U.S. domestic investment-grade debt issues, including government, corporate, asset-backed and mortgage-backed securities with maturities of one year or more. Index returns provided by Interactive Data. The returns of the indices do not reflect any fees or expenses. Returns provided are calculated monthly using a blended allocation. Because the Series’ asset allocation will vary over time, the composition of the Series’ portfolio may not match the composition of the comparative Indices. Mid-month performance may not be available for all indices within the blended index. Where applicable, performance for those indices is included from the first of the month following the corresponding Series’ inception date.
57
Shareholder Expense Example - Pro-Blend® Extended Term Series
(unaudited)
As a shareholder of the Series, you incur ongoing costs, including management fees, shareholder service fees and other Series expenses. This example is intended to help you understand your ongoing costs (in dollars) of investing in the Series and to compare these costs with the ongoing costs of investing in other mutual funds.
The example is based on an investment of $1,000 invested in each class at the beginning of the period and held for the entire period (May 1, 2016 to October 31, 2016).
Actual Expenses
The Actual lines of the table below provide information about actual account values and actual expenses. You may use the information in these lines, together with the amount you invested, to estimate the expenses that you paid over the period. Simply divide your account value by $1,000 (for example, an $8,600 account value divided by $1,000 = 8.6), then multiply the result by the number in the Actual line for the Class in which you have invested under the heading entitled “Expenses Paid During Period” to estimate the expenses you paid on your account during this period.
Hypothetical Example for Comparison Purposes
The Hypothetical lines of each class in the table below provide information about hypothetical account values and hypothetical expenses based on the Class’ actual expense ratio and an assumed rate of return of 5% per year before expenses, which is not the Class’ actual return. The hypothetical account values and expenses may not be used to estimate the actual ending account balance or expenses you paid during the period. You may use this information to compare the ongoing costs of investing in a class of the Series and other funds. To do so, compare this 5% hypothetical example for the Class in which you have invested with the 5% hypothetical examples that appear in the shareholder reports of the other funds.
Please note that the expenses shown in the table are meant to highlight your ongoing costs only and do not reflect any transaction costs such as sales charges (loads), redemption fees, or exchange fees that you may incur in other mutual funds. Therefore, the second line of the table is useful in comparing ongoing costs only, and will not help you determine the relative total costs of owning different funds.
BEGINNING ACCOUNT VALUE 5/1/16 | ENDING ACCOUNT VALUE 10/31/16 | EXPENSES PAID 5/1/16-10/31/16* | ANNUALIZED EXPENSE RATIO | |||||
Class S | ||||||||
Actual | $1,000.00 | $1,029.20 | $5.46 | 1.07% | ||||
Hypothetical (5% return before expenses) | $1,000.00 | $1,019.76 | $5.43 | 1.07% | ||||
Class I | ||||||||
Actual | $1,000.00 | $1,030.20 | $4.13 | 0.81% | ||||
Hypothetical (5% return before expenses) | $1,000.00 | $1,021.06 | $4.12 | 0.81% | ||||
Class C | ||||||||
Actual | $1,000.00 | $1,024.80 | $9.26 | 1.82% | ||||
Hypothetical (5% return before expenses) | $1,000.00 | $1,015.99 | $9.22 | 1.82% | ||||
Class R | ||||||||
Actual | $1,000.00 | $1,027.70 | $6.68 | 1.31% | ||||
Hypothetical (5% return before expenses) | $1,000.00 | $1,018.55 | $6.65 | 1.31% |
*Expenses are equal to the Class’ annualized expense ratio (for the six-month period), multiplied by the average account value over the period, multiplied by 184/366 to reflect the one-half year period. Expenses are based on the most recent fiscal half year; therefore, the expense ratios stated above may differ from the expense ratios stated in the financial highlights, which are based on one-year data.
58
Portfolio Composition - Pro-Blend® Extended Term Series
As of October 31, 2016 (unaudited)
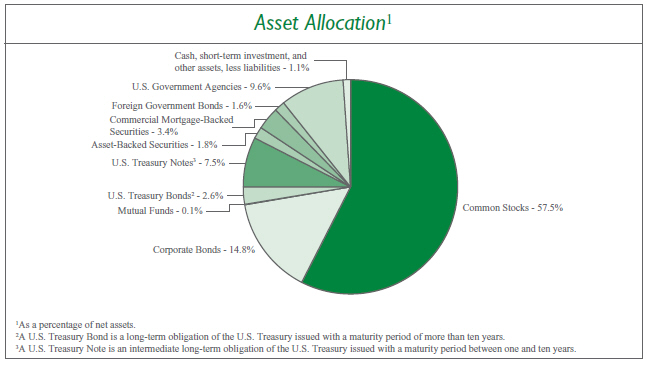
Sector Allocation4 |
| |||
Information Technology | 19.0% | |||
Consumer Discretionary | 14.0% | |||
Health Care | 7.5% | |||
Consumer Staples | 6.4% | |||
Industrials | 5.4% | |||
Materials | 5.2% | |||
Financials | 5.1% | |||
Energy | 4.7% | |||
Real Estate | 3.7% | |||
Telecommunication Services | 1.4% | |||
Utilities | 0.1% | |||
| 4Including common stocks and corporate bonds, as a percentage of total investments. | ||||
| Top Ten Stock Holdings5 | ||||
Cerner Corp. | 2.3% | |||
Facebook, Inc. - Class A | 2.1% | |||
ServiceNow, Inc. | 2.0% | |||
MasterCard, Inc. - Class A | 2.0% | |||
Monsanto Co. | 1.9% | |||
Apple, Inc. | 1.7% | |||
Electronic Arts, Inc. | 1.7% | |||
The Priceline Group, Inc. | 1.6% | |||
Medtronic plc | 1.6% | |||
Amazon.com, Inc. | 1.5% | |||
| 5As a percentage of total investments. | ||||
59
Investment Portfolio - October 31, 2016
| PRO-BLEND® EXTENDED TERM SERIES | SHARES | VALUE (NOTE 2) | ||||||||||
COMMON STOCKS - 57.5% | ||||||||||||
Consumer Discretionary - 12.8% | ||||||||||||
Diversified Consumer Services - 0.2% | ||||||||||||
Fu Shou Yuan International Group | ||||||||||||
Ltd. (China)1 | 2,042,000 | $ | 1,196,193 | |||||||||
Kroton Educacional S.A. (Brazil) | 95,124 | 473,534 | ||||||||||
|
| |||||||||||
| 1,669,727 | ||||||||||||
|
| |||||||||||
Hotels, Restaurants & Leisure - 1.1% | ||||||||||||
Accor S.A. (France)1 | 17,600 | 667,859 | ||||||||||
Yum! Brands, Inc. | 127,150 | 10,970,502 | ||||||||||
|
| |||||||||||
| 11,638,361 | ||||||||||||
|
| |||||||||||
Household Durables - 0.0%## | ||||||||||||
LGI Homes, Inc.* | 6,990 | 208,022 | ||||||||||
|
| |||||||||||
Internet & Direct Marketing Retail - 4.2% | ||||||||||||
Amazon.com, Inc.* | 20,540 | 16,222,903 | ||||||||||
ASOS plc (United Kingdom)*1 | 13,160 | 844,792 | ||||||||||
Expedia, Inc. | 8,690 | 1,123,009 | ||||||||||
The Priceline Group, Inc.* | 11,720 | 17,277,976 | ||||||||||
Rakuten, Inc. (Japan)1 | 138,010 | 1,591,070 | ||||||||||
TripAdvisor, Inc.*2 | 96,510 | 6,222,965 | ||||||||||
Zalando SE (Germany)*1,3 | 20,020 | 880,377 | ||||||||||
|
| |||||||||||
| 44,163,092 | ||||||||||||
|
| |||||||||||
Leisure Products - 0.1% | ||||||||||||
Shimano, Inc. (Japan)1 | 4,700 | 803,604 | ||||||||||
|
| |||||||||||
Media - 5.1% | ||||||||||||
Global Mediacom Tbk PT (Indonesia)1 | 3,486,270 | 226,864 | ||||||||||
ITV plc (United Kingdom)1 | 1,501,980 | 3,131,264 | ||||||||||
Liberty Global plc - Class A - ADR (United Kingdom)* | 363,681 | 11,856,001 | ||||||||||
Surya Citra Media Tbk PT (Indonesia)1 | 2,354,150 | 478,106 | ||||||||||
Time Warner, Inc. | 165,550 | 14,732,294 | ||||||||||
Tribune Media Co. - Class A | 277,470 | 9,045,522 | ||||||||||
Twenty-First Century Fox, Inc. - Class A | 549,980 | 14,447,975 | ||||||||||
|
| |||||||||||
| 53,918,026 | ||||||||||||
|
| |||||||||||
Specialty Retail - 0.8% | ||||||||||||
Advance Auto Parts, Inc. | 12,120 | 1,697,770 | ||||||||||
Kingfisher plc (United Kingdom)1 | 1,420,140 | 6,273,383 | ||||||||||
Monro Muffler Brake, Inc. | 14,360 | 789,800 | ||||||||||
Mr Price Group Ltd. (South Africa)1 | 19,220 | 218,964 | ||||||||||
|
| |||||||||||
| 8,979,917 | ||||||||||||
|
| |||||||||||
Textiles, Apparel & Luxury Goods - 1.3% | ||||||||||||
ANTA Sports Products Ltd. (China)1 . | 230,000 | 663,279 | ||||||||||
Kering (France)1 | 5,010 | 1,111,570 | ||||||||||
lululemon athletica, Inc.* | 213,019 | 12,195,338 | ||||||||||
|
| |||||||||||
| 13,970,187 | ||||||||||||
|
| |||||||||||
Total Consumer Discretionary | 135,350,936 | |||||||||||
|
| |||||||||||
Consumer Staples - 5.2% | ||||||||||||
Beverages - 3.2% | ||||||||||||
Ambev S.A. - ADR (Brazil) | 2,299,965 | 13,569,793 | ||||||||||
Anheuser-Busch InBev S.A./N.V. (Belgium)1 | 78,134 | 8,967,462 | ||||||||||
Cia Cervecerias Unidas S.A. - ADR (Chile) | 26,690 | 573,835 | ||||||||||
Diageo plc (United Kingdom)1 | 390,270 | 10,387,680 | ||||||||||
Fomento Economico Mexicano S.A.B. de C.V. - ADR (Mexico) | 2,750 | 263,092 | ||||||||||
Treasury Wine Estates Ltd. (Australia)1 | 54,539 | 444,619 | ||||||||||
|
| |||||||||||
| 34,206,481 | ||||||||||||
|
| |||||||||||
Food & Staples Retailing - 0.1% | ||||||||||||
Dairy Farm International Holdings | ||||||||||||
Ltd. (Hong Kong)1 | 158,120 | 1,118,040 | ||||||||||
Tesco plc (United Kingdom)*1 | 71,472 | 184,090 | ||||||||||
|
| |||||||||||
| 1,302,130 | ||||||||||||
|
| |||||||||||
Food Products - 0.7% | ||||||||||||
Adecoagro S.A. (Argentina)* | 127,930 | 1,407,230 | ||||||||||
BRF S.A. (Brazil) | 25,450 | 425,602 | ||||||||||
BRF S.A. - ADR (Brazil) | 13,460 | 225,051 | ||||||||||
Danone S.A. (France)1 | 11,910 | 826,061 | ||||||||||
Gruma S.A.B de C.V. - Class B (Mexico) | 18,600 | 258,556 | ||||||||||
Nestle S.A. (Switzerland)1 | 15,016 | 1,088,869 | ||||||||||
Sao Martinho S.A. (Brazil) | 55,670 | 1,112,877 | ||||||||||
Suedzucker AG (Germany)1 | 17,317 | 444,227 | ||||||||||
Tiger Brands Ltd. (South Africa)1 | 15,590 | 443,948 | ||||||||||
Universal Robina Corp. (Philippines)1 | 348,070 | 1,307,971 | ||||||||||
|
| |||||||||||
| 7,540,392 | ||||||||||||
|
| |||||||||||
Personal Products - 1.0% | ||||||||||||
Beiersdorf AG (Germany)1 | 1,970 | 173,675 | ||||||||||
Unilever plc - ADR (United Kingdom) | 251,279 | 10,470,796 | ||||||||||
|
| |||||||||||
| 10,644,471 | ||||||||||||
|
| |||||||||||
Tobacco - 0.2% | ||||||||||||
Gudang Garam Tbk PT (Indonesia)1 | 150,140 | 781,182 | ||||||||||
Japan Tobacco, Inc. (Japan)1 | 14,300 | 543,688 | ||||||||||
The accompanying notes are an integral part of the financial statements.
60
Investment Portfolio - October 31, 2016
| PRO-BLEND® EXTENDED TERM SERIES | SHARES | VALUE (NOTE 2) | ||||||||||
COMMON STOCKS (continued) | ||||||||||||
Consumer Staples (continued) | ||||||||||||
Tobacco (continued) | ||||||||||||
KT&G Corp. (South Korea)1 | 2,630 | $ | 259,397 | |||||||||
|
| |||||||||||
| 1,584,267 | ||||||||||||
|
| |||||||||||
Total Consumer Staples | 55,277,741 | |||||||||||
|
| |||||||||||
Energy - 2.1% | ||||||||||||
Energy Equipment & Services - 1.1% | ||||||||||||
Schlumberger Ltd | 151,441 | 11,847,229 | ||||||||||
|
| |||||||||||
Oil, Gas & Consumable Fuels - 1.0% | ||||||||||||
Cameco Corp. (Canada) | 50,796 | 391,129 | ||||||||||
Cosan S.A. Industria e Comercio (Brazil) | 25,440 | 340,395 | ||||||||||
Galp Energia SGPS S.A. (Portugal)1 | 88,920 | 1,205,608 | ||||||||||
Range Resources Corp. | 232,680 | 7,862,257 | ||||||||||
Royal Dutch Shell plc - Class B (Netherlands)1 | 7,519 | 193,935 | ||||||||||
|
| |||||||||||
| 9,993,324 | ||||||||||||
|
| |||||||||||
Total Energy | 21,840,553 | |||||||||||
|
| |||||||||||
Financials - 1.0% | ||||||||||||
Banks - 0.0%## | ||||||||||||
ICICI Bank Ltd. - ADR (India) | 47,750 | 395,848 | ||||||||||
|
| |||||||||||
Capital Markets - 1.0% | ||||||||||||
BlackRock, Inc. | 29,660 | 10,121,178 | ||||||||||
JSE Ltd. (South Africa)1 | 22,040 | 256,769 | ||||||||||
|
| |||||||||||
| 10,377,947 | ||||||||||||
|
| |||||||||||
Total Financials | 10,773,795 | |||||||||||
|
| |||||||||||
Health Care - 7.1% | ||||||||||||
Biotechnology - 0.4% | ||||||||||||
Alexion Pharmaceuticals, Inc.* | 6,850 | 893,925 | ||||||||||
BioMarin Pharmaceutical, Inc.* | 9,150 | 736,758 | ||||||||||
China Biologic Products, Inc. (China)* | 4,550 | 537,400 | ||||||||||
Incyte Corp. Ltd.* | 7,280 | 633,142 | ||||||||||
Seattle Genetics, Inc.* | 13,810 | 713,977 | ||||||||||
Vertex Pharmaceuticals, Inc.* | 9,160 | 694,878 | ||||||||||
|
| |||||||||||
| 4,210,080 | ||||||||||||
|
| |||||||||||
Health Care Equipment & Supplies - 1.6% | ||||||||||||
Essilor International S.A. (France)1 | 5,320 | 597,829 | ||||||||||
Medtronic plc | 201,510 | 16,527,850 | ||||||||||
|
| |||||||||||
| 17,125,679 | ||||||||||||
|
| |||||||||||
Health Care Providers & Services - 1.1% | ||||||||||||
Acadia Healthcare Co., Inc.* | 23,760 | 854,410 | ||||||||||
Brookdale Senior Living, Inc.* | 6,360 | 91,775 | ||||||||||
DaVita, Inc.* | 18,990 | 1,113,194 | ||||||||||
Express Scripts Holding Co.*2 | 111,600 | 7,521,840 | ||||||||||
Fresenius Medical Care AG & Co. KGaA (Germany)1 | 5,660 | 461,033 | ||||||||||
Fresenius Medical Care AG & Co. KGaA - ADR (Germany) | 18,130 | 735,715 | ||||||||||
KPJ Healthcare Berhad (Malaysia)1 | 359,110 | 359,538 | ||||||||||
Odontoprev S.A. (Brazil) | 84,680 | 318,346 | ||||||||||
Siloam International Hospitals Tbk PT (Indonesia)*1 | 529,800 | 421,266 | ||||||||||
|
| |||||||||||
| 11,877,117 | ||||||||||||
|
| |||||||||||
Health Care Technology - 2.3% | ||||||||||||
Cerner Corp.* | 409,400 | 23,982,652 | ||||||||||
|
| |||||||||||
Life Sciences Tools & Services - 0.1% | ||||||||||||
QIAGEN N.V.*1 | 6,700 | 163,866 | ||||||||||
QIAGEN N.V.* | 9,760 | 237,949 | ||||||||||
|
| |||||||||||
| 401,815 | ||||||||||||
|
| |||||||||||
Pharmaceuticals - 1.6% | ||||||||||||
AstraZeneca plc - ADR (United Kingdom) | 26,520 | 751,046 | ||||||||||
Genomma Lab Internacional S.A.B.de C.V. - Class B (Mexico)* | 201,340 | 241,595 | ||||||||||
GlaxoSmithKline plc (United Kingdom)1 | 14,495 | 286,340 | ||||||||||
Johnson & Johnson2 | 125,690 | 14,578,783 | ||||||||||
Novartis AG - ADR (Switzerland) | 13,480 | 957,350 | ||||||||||
Perrigo Co. plc | 4,570 | 380,178 | ||||||||||
|
| |||||||||||
| 17,195,292 | ||||||||||||
|
| |||||||||||
Total Health Care | 74,792,635 | |||||||||||
|
| |||||||||||
Industrials - 3.6% | ||||||||||||
Aerospace & Defense - 0.8% | ||||||||||||
Korea Aerospace Industries Ltd. (South Korea)1 | 10,358 | 585,030 | ||||||||||
LIG Nex1 Co. Ltd. (South Korea)1 | 7,800 | 503,551 | ||||||||||
Safran S.A. (France)1 | 111,010 | 7,638,783 | ||||||||||
|
| |||||||||||
| 8,727,364 | ||||||||||||
|
| |||||||||||
Airlines - 0.1% | ||||||||||||
easyJet plc (United Kingdom)1 | 29,730 | 340,932 | ||||||||||
Ryanair Holdings plc - ADR (Ireland)* | 14,956 | 1,123,046 | ||||||||||
|
| |||||||||||
| 1,463,978 | ||||||||||||
|
| |||||||||||
Commercial Services & Supplies - 0.0%## | ||||||||||||
China Everbright International Ltd. (China)1 | 207,000 | 247,454 | ||||||||||
The accompanying notes are an integral part of the financial statements.
61
Investment Portfolio - October 31, 2016
| PRO-BLEND® EXTENDED TERM SERIES | SHARES | VALUE (NOTE 2) | ||||||||||
COMMON STOCKS (continued) | ||||||||||||
Industrials (continued) | ||||||||||||
Commercial Services & Supplies (continued) | ||||||||||||
KEPCO Plant Service & Engineering | ||||||||||||
Co. Ltd. (South Korea)1 | 3,960 | $ | 189,836 | |||||||||
|
| |||||||||||
| 437,290 | ||||||||||||
|
| |||||||||||
Industrial Conglomerates - 0.2% | ||||||||||||
Siemens AG (Germany)1 | 15,250 | 1,732,674 | ||||||||||
|
| |||||||||||
Machinery - 1.0% | ||||||||||||
Alstom S.A. (France)*1 | 25,650 | 689,262 | ||||||||||
ANDRITZ AG (Austria)1 | 14,320 | 748,730 | ||||||||||
FANUC Corp. (Japan)1 | 3,470 | 635,314 | ||||||||||
Flowserve Corp. | 136,830 | 5,794,750 | ||||||||||
GEA Group AG (Germany)1 | 34,870 | 1,350,586 | ||||||||||
SMC Corp. (Japan)1 | 3,600 | 1,043,551 | ||||||||||
Sulzer AG (Switzerland)1 | 2,060 | 202,871 | ||||||||||
The Weir Group plc (United Kingdom)1 | 7,670 | 159,328 | ||||||||||
|
| |||||||||||
| 10,624,392 | ||||||||||||
|
| |||||||||||
Professional Services - 1.2% | ||||||||||||
Applus Services S.A. (Spain)1 | 50,690 | 486,369 | ||||||||||
Bureau Veritas S.A. (France)1 | 22,840 | 431,384 | ||||||||||
Nielsen Holdings plc | 248,410 | 11,183,418 | ||||||||||
|
| |||||||||||
| 12,101,171 | ||||||||||||
|
| |||||||||||
Road & Rail - 0.2% | ||||||||||||
Genesee & Wyoming, Inc. - Class A* | 16,630 | 1,129,842 | ||||||||||
Kansas City Southern | 12,510 | 1,097,878 | ||||||||||
|
| |||||||||||
| 2,227,720 | ||||||||||||
|
| |||||||||||
Trading Companies & Distributors - 0.1% | ||||||||||||
Brenntag AG (Germany)1 | 9,297 | 497,022 | ||||||||||
Howden Joinery Group plc (United Kingdom)1 | 15,780 | 72,259 | ||||||||||
|
| |||||||||||
| 569,281 | ||||||||||||
|
| |||||||||||
Transportation Infrastructure - 0.0%## | ||||||||||||
Aena S.A. (Spain)1,3 | 1,130 | 165,586 | ||||||||||
|
| |||||||||||
Total Industrials | 38,049,456 | |||||||||||
|
| |||||||||||
Information Technology - 18.1% | ||||||||||||
Electronic Equipment, Instruments & Components - 0.3% | ||||||||||||
Hitachi Ltd. (Japan)1 | 244,000 | 1,300,738 | ||||||||||
Keyence Corp. (Japan)1 | 1,709 | 1,252,853 | ||||||||||
|
| |||||||||||
| 2,553,591 | ||||||||||||
|
| |||||||||||
Internet Software & Services - 4.6% | ||||||||||||
Alibaba Group Holding Ltd. - ADR (China)* | 11,580 | 1,177,570 | ||||||||||
Alphabet, Inc. - Class A*2 | 10,690 | 8,657,831 | ||||||||||
Alphabet, Inc. - Class C* | 14,640 | 11,485,666 | ||||||||||
Baidu, Inc. - ADR (China)* | 4,990 | 882,531 | ||||||||||
Benefitfocus, Inc.* | 20,010 | 650,325 | ||||||||||
Facebook, Inc. - Class A* | 166,510 | 21,811,145 | ||||||||||
Just Eat plc (United Kingdom)*1 | 12,500 | 85,867 | ||||||||||
Match Group, Inc.* | 50,300 | 908,418 | ||||||||||
MercadoLibre, Inc. (Argentina) | 5,660 | 950,937 | ||||||||||
MiX Telematics Ltd. - ADR (South Africa) | 46,320 | 291,353 | ||||||||||
Q2 Holdings, Inc.* | 30,590 | 859,579 | ||||||||||
Tencent Holdings Ltd. - Class H (China)1 | 47,600 | 1,261,511 | ||||||||||
|
| |||||||||||
| 49,022,733 | ||||||||||||
|
| |||||||||||
IT Services - 4.0% | ||||||||||||
Amdocs Ltd. - ADR | 9,810 | 573,394 | ||||||||||
FleetCor Technologies, Inc.* | 4,470 | 783,591 | ||||||||||
InterXion Holding N.V. - ADR (Netherlands)* | 8,450 | 314,594 | ||||||||||
MasterCard, Inc. - Class A | 193,150 | 20,670,913 | ||||||||||
PayPal Holdings, Inc.* | 191,790 | 7,989,971 | ||||||||||
Visa, Inc. - Class A2 | 139,700 | 11,526,647 | ||||||||||
|
| |||||||||||
| 41,859,110 | ||||||||||||
|
| |||||||||||
Semiconductors & Semiconductor Equipment - 2.3% | �� | |||||||||||
QUALCOMM, Inc. | 164,550 | 11,307,876 | ||||||||||
Skyworks Solutions, Inc. | 172,460 | 13,269,072 | ||||||||||
|
| |||||||||||
| 24,576,948 | ||||||||||||
|
| |||||||||||
Software - 5.0% | ||||||||||||
Electronic Arts, Inc.* | 229,890 | 18,050,963 | ||||||||||
Microsoft Corp. | 187,870 | 11,257,170 | ||||||||||
Paylocity Holding Corp.* | 18,930 | 823,266 | ||||||||||
SAP SE (Germany)1 | 5,150 | 453,714 | ||||||||||
ServiceNow, Inc.* | 239,220 | 21,029,830 | ||||||||||
TOTVS S.A. (Brazil) | 59,978 | 544,913 | ||||||||||
The Ultimate Software Group, Inc.* | 4,840 | 1,021,192 | ||||||||||
|
| |||||||||||
| 53,181,048 | ||||||||||||
|
| |||||||||||
Technology Hardware, Storage & Peripherals - 1.9% | ||||||||||||
Apple, Inc. | 159,040 | 18,057,402 | ||||||||||
Samsung Electronics Co. Ltd. (South Korea)1 | 1,210 | 1,730,697 | ||||||||||
|
| |||||||||||
| 19,788,099 | ||||||||||||
|
| |||||||||||
Total Information Technology | 190,981,529 | |||||||||||
|
| |||||||||||
The accompanying notes are an integral part of the financial statements.
62
Investment Portfolio - October 31, 2016
| PRO-BLEND® EXTENDED TERM SERIES | SHARES | VALUE (NOTE 2) | ||||||||||
COMMON STOCKS (continued) | ||||||||||||
Materials - 4.3% | ||||||||||||
Chemicals - 3.2% | ||||||||||||
Akzo Nobel N.V. (Netherlands)1 | 3,840 | $ | 248,108 | |||||||||
Ashland Global Holdings, Inc. | 101,040 | 11,289,199 | ||||||||||
Givaudan S.A. (Switzerland)1 | 300 | 580,220 | ||||||||||
Monsanto Co. | 202,030 | 20,358,563 | ||||||||||
Sociedad Quimica y Minera de Chile S.A. - ADR (Chile) | 15,140 | 442,996 | ||||||||||
Solvay S.A. (Belgium)1 | 730 | 83,741 | ||||||||||
Symrise AG (Germany)1 | 4,760 | 326,896 | ||||||||||
|
| |||||||||||
| 33,329,723 | ||||||||||||
|
| |||||||||||
Metals & Mining - 1.1% | ||||||||||||
Alumina Ltd. (Australia)1 | 149,111 | 179,212 | ||||||||||
Arconic, Inc. | 411,666 | 11,823,048 | ||||||||||
Norsk Hydro ASA (Norway)1 | 41,144 | 183,944 | ||||||||||
|
| |||||||||||
| 12,186,204 | ||||||||||||
|
| |||||||||||
Total Materials | 45,515,927 | |||||||||||
|
| |||||||||||
Real Estate - 2.9% | ||||||||||||
Equity Real Estate Investment Trusts (REITS) - 2.5% | ||||||||||||
Agree Realty Corp. | 8,800 | 425,480 | ||||||||||
Alexandria Real Estate Equities, Inc. | 3,850 | 415,068 | ||||||||||
alstria office REIT AG (Germany)1 | 57,300 | 739,129 | ||||||||||
American Campus Communities, Inc. | 5,970 | 311,097 | ||||||||||
American Homes 4 Rent - Class A | 16,130 | 340,504 | ||||||||||
Apartment Investment & Management Co. - Class A | 9,010 | 397,071 | ||||||||||
AvalonBay Communities, Inc. | 3,120 | 534,082 | ||||||||||
Axiare Patrimonio SOCIMI S.A. (Spain)1 | 8,070 | 114,653 | ||||||||||
Boston Properties, Inc. | 2,190 | 263,851 | ||||||||||
Brandywine Realty Trust | 19,320 | 299,460 | ||||||||||
Brixmor Property Group, Inc. | 7,540 | 191,667 | ||||||||||
CatchMark Timber Trust, Inc. - Class A | 18,960 | 199,838 | ||||||||||
Chesapeake Lodging Trust | 14,470 | 314,144 | ||||||||||
Colony Starwood Homes | 10,220 | 296,482 | ||||||||||
Columbia Property Trust, Inc. | 7,890 | 166,321 | ||||||||||
Community Healthcare Trust, Inc. | 22,670 | 507,355 | ||||||||||
CoreSite Realty Corp. | 1,790 | 131,995 | ||||||||||
Crown Castle International Corp. | 2,090 | 190,169 | ||||||||||
CubeSmart | 18,250 | 475,777 | ||||||||||
DDR Corp. | 21,750 | 332,557 | ||||||||||
Digital Realty Trust, Inc. | 3,580 | 334,479 | ||||||||||
Douglas Emmett, Inc. | 10,380 | 378,870 | ||||||||||
Education Realty Trust, Inc. | 6,526 | 277,942 | ||||||||||
Equinix, Inc. | 1,420 | 507,338 | ||||||||||
Equity LifeStyle Properties, Inc. | 3,010 | 228,278 | ||||||||||
Equity One, Inc. | 11,170 | 318,345 | ||||||||||
Equity Residential | 7,940 | 490,295 | ||||||||||
Extra Space Storage, Inc. | 3,280 | 239,932 | ||||||||||
Fibra Shop Portafolios Inmobiliarios S.A.P.I. de C.V. (Mexico) | 134,967 | 114,252 | ||||||||||
Forest City Realty Trust, Inc. - Class A | 22,140 | 478,003 | ||||||||||
General Growth Properties, Inc. | 11,860 | 295,907 | ||||||||||
Global Medical REIT, Inc. | 15,760 | 153,660 | ||||||||||
Healthcare Trust of America, Inc. - Class A | 8,330 | 254,898 | ||||||||||
Host Hotels & Resorts, Inc. | 11,010 | 170,435 | ||||||||||
Klepierre (France)1 | 6,350 | 259,512 | ||||||||||
Lamar Advertising Co. - Class A | 5,020 | 318,519 | ||||||||||
LaSalle Hotel Properties | 7,160 | 170,050 | ||||||||||
Life Storage, Inc. | 4,240 | 341,956 | ||||||||||
Mid-America Apartment Communities, Inc. | 3,040 | 281,960 | ||||||||||
NorthStar Realty Finance Corp. | 18,580 | 269,782 | ||||||||||
Outfront Media, Inc. | 16,195 | 348,354 | ||||||||||
Pennsylvania Real Estate Investment Trust | 15,980 | 311,770 | ||||||||||
Physicians Realty Trust | 24,130 | 477,050 | ||||||||||
Potlatch Corp. | 8,600 | 330,240 | ||||||||||
Prologis, Inc. | 13,050 | 680,688 | ||||||||||
Public Storage | 1,630 | 348,364 | ||||||||||
Retail Properties of America, Inc. - Class A | 12,010 | 186,996 | ||||||||||
Rexford Industrial Realty, Inc. | 18,060 | 380,344 | ||||||||||
Senior Housing Properties Trust | 9,310 | 198,024 | ||||||||||
Simon Property Group, Inc. | 5,580 | 1,037,657 | ||||||||||
Spirit Realty Capital, Inc. | 25,630 | 305,253 | ||||||||||
STORE Capital Corp. | 12,720 | 347,129 | ||||||||||
Sun Communities, Inc. | 2,860 | 220,020 | ||||||||||
Tanger Factory Outlet Centers, Inc. | 8,520 | 296,496 | ||||||||||
Taubman Centers, Inc. | 3,340 | 242,016 | ||||||||||
Terreno Realty Corp. | 13,720 | 358,092 | ||||||||||
UDR, Inc. | 5,240 | 183,243 | ||||||||||
Urban Edge Properties | 11,000 | 283,910 | ||||||||||
Ventas, Inc. | 4,970 | 336,718 | ||||||||||
Vornado Realty Trust | 2,640 | 244,939 | ||||||||||
Welltower, Inc. | 4,520 | 309,756 | ||||||||||
Weyerhaeuser Co. | 224,535 | 6,720,333 | ||||||||||
|
| |||||||||||
| 26,678,505 | ||||||||||||
|
| |||||||||||
The accompanying notes are an integral part of the financial statements.
63
Investment Portfolio - October 31, 2016
| PRO-BLEND® EXTENDED TERM SERIES | SHARES/ PRINCIPAL AMOUNT4 | VALUE (NOTE 2) | ||||||||||
COMMON STOCKS (continued) |
| |||||||||||
Real Estate (continued) | ||||||||||||
Real Estate Management & Development - 0.4% | ||||||||||||
CBRE Group, Inc. - Class A* | 4,330 | $ | 111,541 | |||||||||
First Capital Realty, Inc. (Canada) | 8,690 | 138,581 | ||||||||||
Realogy Holdings Corp. | 155,710 | 3,564,202 | ||||||||||
|
| |||||||||||
| 3,814,324 | ||||||||||||
|
| |||||||||||
Total Real Estate | 30,492,829 | |||||||||||
|
| |||||||||||
Telecommunication Services - 0.4% | ||||||||||||
Diversified Telecommunication Services - 0.3% | ||||||||||||
SBA Communications Corp. - Class A* | 8,250 | 934,560 | ||||||||||
Telefonica S.A. - ADR (Spain) | 67,286 | 682,280 | ||||||||||
Zayo Group Holdings, Inc.* | 48,910 | 1,573,924 | ||||||||||
|
| |||||||||||
| 3,190,764 | ||||||||||||
|
| |||||||||||
Wireless Telecommunication Services - 0.1% | ||||||||||||
America Movil S.A.B. de C.V. - Class L - ADR (Mexico) | 79,189 | 1,040,543 | ||||||||||
China Mobile Ltd. - Class H (China)1 | 29,210 | 334,641 | ||||||||||
|
| |||||||||||
| 1,375,184 | ||||||||||||
|
| |||||||||||
Total Telecommunication Services | 4,565,948 | |||||||||||
|
| |||||||||||
Utilities - 0.0%## | ||||||||||||
Water Utilities - 0.0%## | ||||||||||||
CT Environmental Group Ltd. (China)1 | 768,000 | 215,462 | ||||||||||
|
| |||||||||||
TOTAL COMMON STOCKS | 607,856,811 | |||||||||||
|
| |||||||||||
CORPORATE BONDS - 14.8% | ||||||||||||
Non-Convertible Corporate Bonds - 14.8% | ||||||||||||
Consumer Discretionary - 1.1% | ||||||||||||
Auto Components - 0.2% | ||||||||||||
Dana Financing Luxembourg S.A.R.L.3, 6.50%, 6/1/2026 | 205,000 | 218,069 | ||||||||||
Magna International, Inc. (Canada), 4.15%, 10/1/2025 | 2,000,000 | 2,167,252 | ||||||||||
|
| |||||||||||
| 2,385,321 | ||||||||||||
|
| |||||||||||
Household Durables - 0.4% | ||||||||||||
Brookfield Residential Properties, Inc. - Brookfield Residential US Corp. (Canada)3, 6.125%, 7/1/2022 | 555,000 | 563,325 | ||||||||||
Lennar Corp., 12.25%, 6/1/2017 | 740,000 | 781,625 | ||||||||||
Meritage Homes Corp., 7.15%, 4/15/2020 | 135,000 | 149,850 | ||||||||||
Meritage Homes Corp., 7.00%, 4/1/2022 | 250,000 | 279,000 | ||||||||||
NVR, Inc., 3.95%, 9/15/2022 | 1,700,000 | 1,791,355 | ||||||||||
TRI Pointe Group, Inc. - TRI Pointe Homes, Inc., 4.375%, 6/15/2019 | 270,000 | 276,075 | ||||||||||
Weekley Homes LLC - Weekley Finance Corp., 6.00%, 2/1/2023 | 310,000 | 282,100 | ||||||||||
|
| |||||||||||
| 4,123,330 | ||||||||||||
|
| |||||||||||
Internet & Direct Marketing Retail - 0.3% | ||||||||||||
The Priceline Group, Inc., 3.60%, 6/1/2026 | 2,950,000 | 3,058,598 | ||||||||||
|
| |||||||||||
Media - 0.1% | ||||||||||||
Sirius XM Radio, Inc.3, 5.375%, 4/15/2025 | 405,000 | 413,060 | ||||||||||
VTR Finance B.V. (Chile)3, 6.875%, 1/15/2024 | 530,000 | 554,512 | ||||||||||
|
| |||||||||||
| 967,572 | ||||||||||||
|
| |||||||||||
Multiline Retail - 0.1% | ||||||||||||
Dollar General Corp., 3.25%, 4/15/2023 | 1,345,000 | 1,375,047 | ||||||||||
|
| |||||||||||
Total Consumer Discretionary | 11,909,868 | |||||||||||
|
| |||||||||||
Consumer Staples - 1.1% | ||||||||||||
Beverages - 0.5% | ||||||||||||
Anheuser-Busch InBev Worldwide, Inc. (Belgium), 7.75%, 1/15/2019 | 1,590,000 | 1,797,495 | ||||||||||
Anheuser-Busch InBev Worldwide, Inc. (Belgium), 8.20%, 1/15/2039 | 1,220,000 | 1,927,925 | ||||||||||
PepsiCo, Inc., 3.10%, 7/17/2022 | 1,740,000 | 1,836,203 | ||||||||||
|
| |||||||||||
| 5,561,623 | ||||||||||||
|
| |||||||||||
Food & Staples Retailing - 0.5% | ||||||||||||
C&S Group Enterprises LLC3, 5.375%, 7/15/2022 | 580,000 | 562,600 | ||||||||||
CVS Health Corp., 3.50%, 7/20/2022 | 2,610,000 | 2,757,603 | ||||||||||
The Kroger Co., 2.60%, 2/1/2021 | 1,800,000 | 1,834,639 | ||||||||||
|
| |||||||||||
| 5,154,842 | ||||||||||||
|
| |||||||||||
Food Products - 0.1% | ||||||||||||
Pinnacle Operating Corp.3, 9.00%, 11/15/2020 | 1,285,000 | 796,700 | ||||||||||
|
| |||||||||||
Household Products - 0.0%## | ||||||||||||
HRG Group, Inc., 7.75%, 1/15/2022 | 265,000 | 276,262 | ||||||||||
|
| |||||||||||
Total Consumer Staples | 11,789,427 | |||||||||||
|
| |||||||||||
Energy - 2.7% | ||||||||||||
Energy Equipment & Services - 0.7% | ||||||||||||
Ensco plc, 5.20%, 3/15/2025 | 2,195,000 | 1,785,501 | ||||||||||
The accompanying notes are an integral part of the financial statements.
64
Investment Portfolio - October 31, 2016
| PRO-BLEND® EXTENDED TERM SERIES | PRINCIPAL AMOUNT4 | VALUE (NOTE 2) | ||||||||||
CORPORATE BONDS (continued) | ||||||||||||
Non-Convertible Corporate Bonds (continued) | ||||||||||||
Energy (continued) | ||||||||||||
Energy Equipment & Services (continued) | ||||||||||||
McDermott International, Inc.3, 8.00%, 5/1/2021 | 500,000 | $ | 485,000 | |||||||||
Pride International, Inc., 8.50%, 6/15/2019 | 600,000 | 652,500 | ||||||||||
Schlumberger Holdings Corp.3, 3.625%, 12/21/2022 | 3,570,000 | 3,816,055 | ||||||||||
|
| |||||||||||
| 6,739,056 | ||||||||||||
|
| |||||||||||
Oil, Gas & Consumable Fuels - 2.0% | ||||||||||||
BP Capital Markets plc (United Kingdom), 3.535%, 11/4/2024 | 3,580,000 | 3,745,102 | ||||||||||
Cheniere Corpus Christi Holdings, LLC3, 7.00%, 6/30/2024 | 390,000 | 413,400 | ||||||||||
Chevron Corp., 1.79%, 11/16/2018 | 1,835,000 | 1,850,649 | ||||||||||
Columbia Pipeline Group, Inc., 4.50%, 6/1/2025 | 1,820,000 | 1,966,566 | ||||||||||
ConocoPhillips Co., 3.35%, 5/15/2025 | 1,880,000 | 1,911,780 | ||||||||||
Crestwood Midstream Partners LP - Crestwood Midstream Finance Corp., 6.125%, 3/1/2022 | 250,000 | 255,625 | ||||||||||
Enviva Partners LP - Enviva Partners Finance Corp.3, 8.50%, 11/1/2021 | 400,000 | 409,000 | ||||||||||
Hilcorp Energy I LP - Hilcorp Finance Co.3, 5.75%, 10/1/2025 | 215,000 | 215,537 | ||||||||||
Kinder Morgan Energy Partners LP, 4.30%, 5/1/2024 | 3,850,000 | 3,979,799 | ||||||||||
Kinder Morgan, Inc.3, 5.625%, 11/15/2023 | 1,820,000 | 2,013,559 | ||||||||||
NGL Energy Partners LP - NGL Energy Finance Corp.3, 7.50%, 11/1/2023 | 265,000 | 265,662 | ||||||||||
Oasis Petroleum, Inc., 6.875%, 1/15/2023 | 70,000 | 68,600 | ||||||||||
PBF Holding Co. LLC - PBF Finance Corp.3, 7.00%, 11/15/2023 | 455,000 | 420,875 | ||||||||||
Petroleos Mexicanos (Mexico), 4.50%, 1/23/2026 | 1,935,000 | 1,869,210 | ||||||||||
Sabine Pass Liquefaction LLC, 5.625%, 2/1/2021 | 400,000 | 421,000 | ||||||||||
Tallgrass Energy Partners LP - Tallgrass Energy Finance Corp.3, 5.50%, 9/15/2024 | 400,000 | 398,000 | ||||||||||
TransCanada PipeLines Ltd. (Canada), 3.75%, 10/16/2023 | 990,000 | 1,053,122 | ||||||||||
|
| |||||||||||
| 21,257,486 | ||||||||||||
|
| |||||||||||
| Total Energy | 27,996,542 | |||||||||||
|
| |||||||||||
| Financials - 4.0% | ||||||||||||
Banks - 2.3% | ||||||||||||
Bank of America Corp., 5.70%, 5/2/2017 | 1,780,000 | 1,818,537 | ||||||||||
Bank of America Corp., 4.00%, 1/22/2025 | 2,780,000 | 2,858,377 | ||||||||||
Barclays Bank plc (United Kingdom)3, 10.179%, 6/12/2021 | 1,460,000 | 1,846,074 | ||||||||||
Citigroup, Inc., 3.875%, 3/26/2025 | 3,745,000 | 3,830,225 | ||||||||||
Commonwealth Bank of Australia (Australia), 5.75%, 1/25/2017 | AUD | 380,000 | 291,505 | |||||||||
Intesa Sanpaolo S.p.A. (Italy), 3.875%, 1/15/2019 | 1,790,000 | 1,841,640 | ||||||||||
Intesa Sanpaolo S.p.A. (Italy)3, 6.50%, 2/24/2021 | 1,620,000 | 1,817,465 | ||||||||||
JPMorgan Chase & Co., 4.95%, 3/25/2020 | 3,370,000 | 3,689,176 | ||||||||||
Lloyds Bank plc (United Kingdom)3,5,6, 12.00% | 305,000 | 414,800 | ||||||||||
Lloyds Banking Group plc (United Kingdom)3, 4.582%, 12/10/2025 | 3,705,000 | 3,764,884 | ||||||||||
Popular, Inc., 7.00%, 7/1/2019 | 610,000 | 632,112 | ||||||||||
Royal Bank of Canada (Canada), 3.77%, 3/30/2018 | CAD | 445,000 | 344,073 | |||||||||
Santander Holdings USA, Inc., 2.65%, 4/17/2020 | 1,265,000 | 1,264,055 | ||||||||||
Westpac Banking Corp. (Australia), 5.75%, 2/6/2017 | AUD | 400,000 | 307,195 | |||||||||
|
| |||||||||||
| 24,720,118 | ||||||||||||
|
| |||||||||||
Capital Markets - 1.0% | ||||||||||||
The Goldman Sachs Group, Inc.7, 2.429%, 11/29/2023 | 3,690,000 | 3,744,789 | ||||||||||
The Goldman Sachs Group, Inc., 4.25%, 10/21/2025 | 1,815,000 | 1,898,987 | ||||||||||
Morgan Stanley, 5.00%, 11/24/2025 | 2,570,000 | 2,842,695 | ||||||||||
TD Ameritrade Holding Corp., 2.95%, 4/1/2022 | 1,800,000 | 1,860,745 | ||||||||||
|
| |||||||||||
| 10,347,216 | ||||||||||||
|
| |||||||||||
Consumer Finance - 0.1% | ||||||||||||
Navient Corp., 6.125%, 3/25/2024 | 1,185,000 | 1,084,275 | ||||||||||
|
| |||||||||||
Diversified Financial Services - 0.1% | ||||||||||||
Horizon Pharma, Inc., 6.625%, 5/1/2023 | 410,000 | 386,937 | ||||||||||
Jefferies Finance LLC - JFIN Co-Issuer Corp.3, 7.375%, 4/1/2020 | 290,000 | 287,825 | ||||||||||
|
| |||||||||||
| 674,762 | ||||||||||||
|
| |||||||||||
The accompanying notes are an integral part of the financial statements.
65
Investment Portfolio - October 31, 2016
| PRO-BLEND® EXTENDED TERM SERIES | PRINCIPAL AMOUNT 4 | VALUE (NOTE 2) | ||||||||||
CORPORATE BONDS (continued) | ||||||||||||
Non-Convertible Corporate Bonds (continued) | ||||||||||||
Financials (continued) | ||||||||||||
Insurance - 0.4% | ||||||||||||
American International Group, Inc., 4.125%, 2/15/2024 | 1,059,000 | $ | 1,138,394 | |||||||||
Assured Guaranty US Holdings, Inc., 5.00%, 7/1/2024 | 2,624,000 | 2,911,150 | ||||||||||
|
| |||||||||||
| 4,049,544 | ||||||||||||
|
| |||||||||||
Thrifts & Mortgage Finance - 0.1% | ||||||||||||
Ladder Capital Finance Holdings LLLP - Ladder Capital Finance Corp., 7.375%, 10/1/2017 | 1,080,000 | 1,094,850 | ||||||||||
Ladder Capital Finance Holdings LLLP - Ladder Capital Finance Corp.3, 5.875%, 8/1/2021 | 590,000 | 560,500 | ||||||||||
|
| |||||||||||
| 1,655,350 | ||||||||||||
|
| |||||||||||
| Total Financials | 42,531,265 | |||||||||||
|
| |||||||||||
| Health Care - 0.4% | ||||||||||||
Biotechnology - 0.2% | ||||||||||||
AbbVie, Inc., 1.80%, 5/14/2018 | 1,840,000 | 1,845,787 | ||||||||||
AMAG Pharmaceuticals, Inc.3, 7.875%, 9/1/2023 | 470,000 | 440,625 | ||||||||||
|
| |||||||||||
| 2,286,412 | ||||||||||||
|
| |||||||||||
Health Care Providers & Services - 0.1% | ||||||||||||
HCA, Inc., 7.50%, 2/15/2022 | 350,000 | 398,300 | ||||||||||
LifePoint Health, Inc.3, 5.375%, 5/1/2024 | 265,000 | 263,357 | ||||||||||
Tenet Healthcare Corp., 8.125%, 4/1/2022 | 345,000 | 337,238 | ||||||||||
|
| |||||||||||
| 998,895 | ||||||||||||
|
| |||||||||||
Pharmaceuticals - 0.1% | ||||||||||||
Concordia International Corp. (Canada)3, 7.00%, 4/15/2023 | 530,000 | 304,750 | ||||||||||
Mallinckrodt International Finance S.A. - Mallinckrodt CB LLC3, 5.625%, 10/15/2023 | 476,000 | 447,440 | ||||||||||
|
| |||||||||||
| 752,190 | ||||||||||||
|
| |||||||||||
| Total Health Care | 4,037,497 | |||||||||||
|
| |||||||||||
| Industrials - 1.8% | ||||||||||||
Aerospace & Defense - 0.0%## | ||||||||||||
DigitalGlobe, Inc.3, 5.25%, 2/1/2021 | 470,000 | 473,525 | ||||||||||
|
| |||||||||||
Air Freight & Logistics - 0.0%## | ||||||||||||
Neovia Logistics Intermediate Holdings LLC - Logistics Intermediate Finance Corp.3,8, 10.00%, 2/15/2018 | 647,002 | 396,289 | ||||||||||
|
| |||||||||||
Airlines - 0.3% | ||||||||||||
Allegiant Travel Co., 5.50%, 7/15/2019 | 400,000 | 415,500 | ||||||||||
American Airlines Pass-Through Trust, Series 2013-2, Class A, 4.95%, 1/15/2023 | 1,150,724 | 1,255,728 | ||||||||||
Southwest Airlines Co., 2.75%, 11/6/2019 | 1,295,000 | 1,333,427 | ||||||||||
Southwest Airlines Co., 2.65%, 11/5/2020 | 670,000 | 685,247 | ||||||||||
|
| |||||||||||
| 3,689,902 | ||||||||||||
|
| |||||||||||
Commercial Services & Supplies - 0.1% | ||||||||||||
Constellis Holdings LLC - Constellis Finance Corp.3, 9.75%, 5/15/2020 . | 290,000 | 294,350 | ||||||||||
Herc Rentals, Inc.3, 7.50%, 6/1/2022 | 270,000 | 270,000 | ||||||||||
|
| |||||||||||
| 564,350 | ||||||||||||
|
| |||||||||||
Construction & Engineering - 0.2% | ||||||||||||
Fluor Corp., 3.50%, 12/15/2024 | 1,790,000 | 1,887,242 | ||||||||||
|
| |||||||||||
Industrial Conglomerates - 0.6% | ||||||||||||
General Electric Co.7, 1.261%, 5/5/2026 | 2,295,000 | 2,226,559 | ||||||||||
Siemens Financieringsmaatschappij N.V. (Germany)3, 2.90%, 5/27/2022 | 3,550,000 | 3,686,760 | ||||||||||
|
| |||||||||||
| 5,913,319 | ||||||||||||
|
| |||||||||||
Machinery - 0.1% | ||||||||||||
Case New Holland Industrial, Inc. (United Kingdom), 7.875%, 12/1/2017 | 358,000 | 379,032 | ||||||||||
CNH Industrial N.V. (United Kingdom), 4.50%, 8/15/2023 | 280,000 | 281,400 | ||||||||||
Shape Technologies Group, Inc.3, 7.625%, 2/1/2020 | 275,000 | 279,125 | ||||||||||
Xerium Technologies, Inc.3, 9.50%, 8/15/2021 | 270,000 | 274,050 | ||||||||||
|
| |||||||||||
| 1,213,607 | ||||||||||||
|
| |||||||||||
Trading Companies & Distributors - 0.5% | ||||||||||||
Air Lease Corp., 3.375%, 6/1/2021 | 3,715,000 | 3,822,349 | ||||||||||
Aircastle Ltd., 5.50%, 2/15/2022 | 255,000 | 273,487 | ||||||||||
Fly Leasing Ltd. (Ireland), 6.375%, 10/15/2021 | 620,000 | 633,950 | ||||||||||
International Lease Finance Corp., 6.25%, 5/15/2019 | 255,000 | 275,719 | ||||||||||
|
| |||||||||||
| 5,005,505 | ||||||||||||
|
| |||||||||||
| Total Industrials | 19,143,739 | |||||||||||
|
| |||||||||||
The accompanying notes are an integral part of the financial statements.
66
Investment Portfolio - October 31, 2016
| PRO-BLEND® EXTENDED TERM SERIES | PRINCIPAL AMOUNT 4 | VALUE (NOTE 2) | ||||||||||
CORPORATE BONDS (continued) | ||||||||||||
Non-Convertible Corporate Bonds (continued) | ||||||||||||
Information Technology - 0.9% | ||||||||||||
Internet Software & Services - 0.0%## | ||||||||||||
VeriSign, Inc., 5.25%, 4/1/2025 | 200,000 | $ | 211,000 | |||||||||
|
| |||||||||||
IT Services - 0.4% | ||||||||||||
Automatic Data Processing, Inc., 2.25%, 9/15/2020 | 1,795,000 | 1,840,692 | ||||||||||
Visa, Inc., 2.80%, 12/14/2022 | 2,670,000 | 2,776,602 | ||||||||||
|
| |||||||||||
| 4,617,294 | ||||||||||||
|
| |||||||||||
Semiconductors & Semiconductor Equipment - 0.4% | ||||||||||||
Intel Corp., 2.45%, 7/29/2020 | 1,795,000 | 1,849,455 | ||||||||||
QUALCOMM, Inc., 3.00%, 5/20/2022 | 1,780,000 | 1,855,282 | ||||||||||
|
| |||||||||||
| 3,704,737 | ||||||||||||
|
| |||||||||||
Technology Hardware, Storage & Peripherals - 0.1% | ||||||||||||
Diebold, Inc.3, 8.50%, 4/15/2024 | 415,000 | 439,796 | ||||||||||
Western Digital Corp.3, 10.50%, 4/1/2024 | 250,000 | 288,750 | ||||||||||
|
| |||||||||||
| 728,546 | ||||||||||||
|
| |||||||||||
| Total Information Technology | 9,261,577 | |||||||||||
|
| |||||||||||
| Materials - 0.8% | ||||||||||||
Chemicals - 0.4% | ||||||||||||
Consolidated Energy Finance S.A. (Trinidad-Tobago)3, 6.75%, 10/15/2019 | 425,000 | 425,000 | ||||||||||
The Dow Chemical Co., 8.55%, 5/15/2019 | 1,560,000 | 1,817,695 | ||||||||||
Solvay Finance America LLC (Belgium)3, 3.40%, 12/3/2020 | 1,800,000 | 1,873,740 | ||||||||||
|
| |||||||||||
| 4,116,435 | ||||||||||||
|
| |||||||||||
Containers & Packaging - 0.0%## | ||||||||||||
Ardagh Packaging Finance plc - Ardagh Holdings USA, Inc. (Ireland)3, 7.25%, 5/15/2024 | 265,000 | 279,575 | ||||||||||
|
| |||||||||||
Metals & Mining - 0.3% | ||||||||||||
Arconic, Inc., 5.87%, 2/23/2022 | 385,000 | 411,642 | ||||||||||
BHP Billiton Finance USA Ltd. (Australia), 3.85%, 9/30/2023 | 1,425,000 | 1,545,910 | ||||||||||
Kinross Gold Corp. (Canada), 5.125%, 9/1/2021 | 110,000 | 114,400 | ||||||||||
SunCoke Energy Partners LP - SunCoke Energy Partners Finance Corp.3, 7.375%, 2/1/2020 | 420,000 | 404,250 | ||||||||||
Techniplas LLC3, 10.00%, 5/1/2020 | 350,000 | 296,625 | ||||||||||
|
| |||||||||||
| 2,772,827 | ||||||||||||
|
| |||||||||||
Paper & Forest Products - 0.1% | ||||||||||||
Domtar Corp., 4.40%, 4/1/2022 | 1,470,000 | 1,540,829 | ||||||||||
|
| |||||||||||
| Total Materials | 8,709,666 | |||||||||||
|
| |||||||||||
| Real Estate - 0.9% | ||||||||||||
Equity Real Estate Investment Trusts (REITS) - 0.8% | ||||||||||||
American Tower Corp., 3.30%, 2/15/2021 | 3,620,000 | 3,760,105 | ||||||||||
Greystar Real Estate Partners LLC3, 8.25%, 12/1/2022 | 395,000 | 429,562 | ||||||||||
GTP Acquisition Partners I LLC3, 2.35%, 6/15/2020 | 1,150,000 | 1,145,492 | ||||||||||
MPT Operating Partnership LP - MPT Finance Corp., 5.25%, 8/1/2026 | 265,000 | 270,300 | ||||||||||
Sixsigma Networks Mexico S.A. de C.V. (Mexico)3, 8.25%, 11/7/2021 | 430,000 | 420,325 | ||||||||||
Welltower, Inc., 4.95%, 1/15/2021 | 1,705,000 | 1,877,110 | ||||||||||
|
| |||||||||||
| 7,902,894 | ||||||||||||
|
| |||||||||||
Real Estate Management & Development - 0.1% | ||||||||||||
Forestar USA Real Estate Group, Inc.3, 8.50%, 6/1/2022 | 530,000 | 547,556 | ||||||||||
Rialto Holdings LLC - Rialto Corp.3, 7.00%, 12/1/2018 | 410,000 | 415,125 | ||||||||||
|
| |||||||||||
| 962,681 | ||||||||||||
|
| |||||||||||
| Total Real Estate | 8,865,575 | |||||||||||
|
| |||||||||||
| Telecommunication Services - 1.0% | ||||||||||||
Diversified Telecommunication Services - 1.0% | ||||||||||||
AT&T, Inc., 5.20%, 3/15/2020 | 3,335,000 | 3,673,459 | ||||||||||
CenturyLink, Inc., 7.50%, 4/1/2024 | 385,000 | 400,881 | ||||||||||
Frontier Communications Corp., 11.00%, 9/15/2025 | 645,000 | 660,416 | ||||||||||
Hughes Satellite Systems Corp.3, 6.625%, 8/1/2026 | 420,000 | 415,800 | ||||||||||
Inmarsat Finance plc (United Kingdom)3, 4.875%, 5/15/2022 | 720,000 | 679,032 | ||||||||||
Qualitytech LP - QTS Finance Corp., 5.875%, 8/1/2022 | 540,000 | 554,850 | ||||||||||
Verizon Communications, Inc., 4.15%, 3/15/2024 | 3,430,000 | 3,716,686 | ||||||||||
|
| |||||||||||
| 10,101,124 | ||||||||||||
|
| |||||||||||
Wireless Telecommunication Services - 0.0%## | ||||||||||||
Altice Financing S.A. (Luxembourg)3, 6.625%, 2/15/2023 | 550,000 | 566,500 | ||||||||||
|
| |||||||||||
| Total Telecommunication Services | 10,667,624 | |||||||||||
|
| |||||||||||
The accompanying notes are an integral part of the financial statements.
67
Investment Portfolio - October 31, 2016
| PRO-BLEND® EXTENDED TERM SERIES | PRINCIPAL AMOUNT4/ | VALUE (NOTE 2) | ||||||||||
CORPORATE BONDS (continued) | ||||||||||||
Non-Convertible Corporate Bonds (continued) | ||||||||||||
Utilities - 0.1% | ||||||||||||
Independent Power and Renewable Electricity Producers - 0.1% | ||||||||||||
Atlantica Yield plc (Spain)3, 7.00%, 11/15/2019 | 710,000 | $ | 722,425 | |||||||||
Terraform Global Operating LLC3, 13.75%, 8/15/2022 | 410,000 | 426,400 | ||||||||||
|
| |||||||||||
| Total Utilities | 1,148,825 | |||||||||||
|
| |||||||||||
| TOTAL CORPORATE BONDS | ||||||||||||
(Identified Cost $154,597,103) | 156,061,605 | |||||||||||
|
| |||||||||||
MUTUAL FUNDS - 0.1% | ||||||||||||
iShares MSCI India ETF | 8,840 | 256,713 | ||||||||||
iShares Russell Mid-Cap Growth ETF | 5,110 | 477,172 | ||||||||||
|
| |||||||||||
TOTAL MUTUAL FUNDS | ||||||||||||
(Identified Cost $718,299) | 733,885 | |||||||||||
|
| |||||||||||
U.S. TREASURY SECURITIES - 10.1% | ||||||||||||
| U.S. Treasury Bonds - 2.6% | ||||||||||||
U.S. Treasury Bond, 4.75%, 2/15/2037 | 11,600,000 | 16,257,667 | ||||||||||
U.S. Treasury Inflation Indexed Bond, 0.75%, 2/15/2042 | 11,405,237 | 11,476,428 | ||||||||||
|
| |||||||||||
| Total U.S. Treasury Bonds | ||||||||||||
(Identified Cost $27,026,987) | 27,734,095 | |||||||||||
|
| |||||||||||
| U.S. Treasury Notes - 7.5% | ||||||||||||
U.S. Treasury Inflation Indexed Note, 0.125%, 4/15/2020 | 10,599,412 | 10,801,002 | ||||||||||
U.S. Treasury Inflation Indexed Note, 0.125%, 1/15/2023 | 10,887,879 | 11,043,870 | ||||||||||
U.S. Treasury Note, 0.75%, 4/15/2018 | 12,559,000 | 12,551,151 | ||||||||||
U.S. Treasury Note, 1.375%, 4/30/2020 | 12,484,000 | 12,594,696 | ||||||||||
U.S. Treasury Note, 1.75%, 4/30/2022 | 12,414,000 | 12,614,275 | ||||||||||
U.S. Treasury Note, 2.00%, 7/31/2022 | 19,288,000 | 19,837,264 | ||||||||||
|
| |||||||||||
| Total U.S. Treasury Notes | ||||||||||||
(Identified Cost $79,230,876) | 79,442,258 | |||||||||||
|
| |||||||||||
| TOTAL U.S. TREASURY SECURITIES | ||||||||||||
(Identified Cost $106,257,863) | 107,176,353 | |||||||||||
|
| |||||||||||
| ASSET-BACKED SECURITIES - 1.8% | ||||||||||||
CarMax Auto Owner Trust, Series 2016-4, Class A2, 1.21%, 11/15/2019 | 2,700,000 | 2,698,966 | ||||||||||
Cazenovia Creek Funding I LLC, Series 2015-1A, Class A3, 2.00%, 12/10/2023 | 708,492 | 703,621 | ||||||||||
Discover Card Execution Note Trust, Series 2014-A5, Class A, 1.39%, 4/15/2020 | 2,700,000 | 2,706,497 | ||||||||||
Enterprise Fleet Financing LLC, Series 2014-2, Class A23, 1.05%, 3/20/2020 | 530,565 | 529,763 | ||||||||||
Enterprise Fleet Financing LLC, Series 2015-2, Class A23, 1.59%, 2/22/2021 | 2,056,316 | 2,058,976 | ||||||||||
FDIC Trust, Series 2011-R1, Class A3, 2.672%, 7/25/2026 | 504,042 | 511,718 | ||||||||||
FNA Trust, Series 2014-1A, Class A3, 1.296%, 12/10/2022 | 473,698 | 468,961 | ||||||||||
Home Partners of America Trust, Series 2016-1, Class A3,7, 2.185%, 3/17/2033 | 785,724 | 794,231 | ||||||||||
Honda Auto Receivables Owner Trust, Series 2016-4, Class A2, 1.04%, 4/18/2019 | 2,800,000 | 2,799,012 | ||||||||||
Invitation Homes Trust, Series 2015-SFR3, Class A3,7, 1.835%, 8/17/2032 | 1,579,073 | 1,585,517 | ||||||||||
NextGear Floorplan Master Owner Trust, Series 2014-1A, Class A3, 1.92%, 10/15/2019 | 1,200,000 | 1,198,614 | ||||||||||
Starwood Retail Property Trust, Series 2014-STAR, Class A3,7, 1.744%, 11/15/2027 | 1,500,000 | 1,486,849 | ||||||||||
Tax Ease Funding LLC, Series 2016-1A, Class A3, 3.131%, 6/15/2028 | 597,625 | 596,204 | ||||||||||
Tricon American Homes Trust, Series 2016-SFR1, Class A3, 2.589%, 11/17/2033 | 1,200,000 | 1,197,977 | ||||||||||
|
| |||||||||||
| TOTAL ASSET-BACKED SECURITIES | ||||||||||||
(Identified Cost $19,330,425) | 19,336,906 | |||||||||||
|
| |||||||||||
The accompanying notes are an integral part of the financial statements.
68
Investment Portfolio - October 31, 2016
| PRO-BLEND® EXTENDED TERM SERIES | PRINCIPAL AMOUNT 4 | VALUE (NOTE 2) | ||||||||||
COMMERCIAL MORTGAGE-BACKED SECURITIES - 3.4% | ||||||||||||
Americold LLC Trust, Series 2010-ARTA, Class A13, 3.847%, 1/14/2029 | 153,061 | $ | 159,520 | |||||||||
BWAY Mortgage Trust, Series 2015-1740, Class A3, 2.917%, 1/13/2035 | 3,300,000 | 3,318,771 | ||||||||||
Credit Suisse Mortgage Capital Trust, Series 2013-IVR3, Class A13,7, 2.50%, 5/25/2043 | 1,035,165 | 1,018,991 | ||||||||||
Credit Suisse Mortgage Capital Trust, Series 2013-TH1, Class A13,7, 2.13%, 2/25/2043 | 793,363 | 767,889 | ||||||||||
DB-UBS Mortgage Trust, Series 2011-LC1A, Class A13, 3.742%, 11/10/2046 | 3,728 | 3,740 | ||||||||||
Freddie Mac Multifamily Structured Pass-Through Certificates, Series K009, Class X1 (IO)7, 1.575%, 9/25/2045 | 9,185,085 | 361,392 | ||||||||||
Freddie Mac Multifamily Structured Pass-Through Certificates, Series K014, Class X1 (IO)7, 1.377%, 4/25/2021 | 9,725,077 | 445,529 | ||||||||||
Freddie Mac Multifamily Structured Pass-Through Certificates, Series K016, Class X1 (IO)7, 1.698%, 10/25/2021 | 4,181,074 | 264,279 | ||||||||||
Freddie Mac Multifamily Structured Pass-Through Certificates, Series K017, Class X1 (IO)7, 1.519%, 12/25/2021 | 23,543,013 | 1,348,438 | ||||||||||
Freddie Mac Multifamily Structured Pass-Through Certificates, Series K021, Class X1 (IO)7, 1.615%, 6/25/2022 | 11,461,103 | 785,956 | ||||||||||
Freddie Mac Multifamily Structured Pass-Through Certificates, Series K030, Class X1 (IO)7, 0.327%, 4/25/2023 | 46,022,492 | 548,712 | ||||||||||
Freddie Mac Multifamily Structured Pass-Through Certificates, Series K032, Class X1 (IO)7, 0.23%, 5/25/2023 | 29,658,699 | 207,825 | ||||||||||
Freddie Mac Multifamily Structured Pass-Through Certificates, Series K706, Class X1 (IO)7, 1.686%, 10/25/2018 | 5,704,040 | 145,911 | ||||||||||
Freddie Mac Multifamily Structured Pass-Through Certificates, Series K-P01, Class A2, 1.72%, 1/25/2019 | 1,325,000 | 1,335,244 | ||||||||||
FREMF Mortgage Trust, Series 2011-K701, Class B3,7, 4.435%, 7/25/2048 | 550,000 | 560,047 | ||||||||||
FREMF Mortgage Trust, Series 2011-K702, Class B3,7, 4.931%, 4/25/2044 | 675,000 | 699,580 | ||||||||||
FREMF Mortgage Trust, Series 2013-K28, Class X2A (IO)3, 0.10%, 6/25/2046 | 82,099,653 | 417,386 | ||||||||||
FREMF Mortgage Trust, Series 2013-K712, Class B3,7, 3.48%, 5/25/2045 | 1,050,000 | 1,075,553 | ||||||||||
FREMF Mortgage Trust, Series 2014-K41, Class B3,7, 3.961%, 11/25/2047 | 1,800,000 | 1,844,392 | ||||||||||
FREMF Mortgage Trust, Series 2014-K715, Class B3,7, 4.121%, 2/25/2046 | 1,750,000 | 1,832,862 | ||||||||||
GAHR Commercial Mortgage Trust, Series 2015-NRF, Class BFX3,7, 3.495%, 12/15/2034 | 2,100,000 | 2,154,339 | ||||||||||
GS Mortgage Securities Trust, Series 2010-C2, Class A13, 3.849%, 12/10/2043 | 88,999 | 92,619 | ||||||||||
JP Morgan Chase Commercial Mortgage Securities Trust, Series 2006-LDP9, Class A3, 5.336%, 5/15/2047 | 757,724 | 756,711 | ||||||||||
JP Morgan Mortgage Trust, Series 2013-1, Class 1A23,7, 3.00%, 3/25/2043 | 587,415 | 590,134 | ||||||||||
JP Morgan Mortgage Trust, Series 2013-2, Class A23,7, 3.50%, 5/25/2043 | 693,835 | 714,542 | ||||||||||
JP Morgan Mortgage Trust, Series 2014-2, Class 1A13,7, 3.00%, 6/25/2029 | 1,115,025 | 1,144,555 | ||||||||||
LSTAR Commercial Mortgage Trust, Series 2014-2, Class A23, 2.767%, 1/20/2041 | 1,092,093 | 1,096,074 | ||||||||||
Motel 6 Trust, Series 2015-MTL6, Class B3, 3.298%, 2/5/2030 | 1,220,000 | 1,221,996 | ||||||||||
New Residential Mortgage Loan Trust, Series 2014-3A, Class AFX33,7, 3.75%, 11/25/2054 | 976,002 | 1,006,566 | ||||||||||
New Residential Mortgage Loan Trust, Series 2015-2A, Class A13,7, 3.75%, 8/25/2055 | 1,366,207 | 1,417,467 | ||||||||||
OBP Depositor LLC Trust, Series 2010-OBP, Class A3, 4.646%, 7/15/2045 | 115,000 | 125,191 | ||||||||||
SCG Trust, Series 2013-SRP1, Class AJ3,7, 2.485%, 11/15/2026 | 2,600,000 | 2,535,355 | ||||||||||
Sequoia Mortgage Trust, Series 2013-2, Class A7, 1.874%, 2/25/2043 | 776,484 | 761,198 | ||||||||||
The accompanying notes are an integral part of the financial statements.
69
Investment Portfolio - October 31, 2016
| PRO-BLEND® EXTENDED TERM SERIES | PRINCIPAL AMOUNT4 | VALUE (NOTE 2) | ||||||||||
COMMERCIAL MORTGAGE-BACKED SECURITIES (continued) | ||||||||||||
Sequoia Mortgage Trust, Series 2013-7, Class A27, 3.00%, 6/25/2043 | 602,675 | $ | 608,781 | |||||||||
Sequoia Mortgage Trust, Series 2013-8, Class A17, 3.00%, 6/25/2043 | 858,650 | 866,616 | ||||||||||
Vornado DP LLC Trust, Series 2010-VNO, Class A2FX3, 4.004%, 9/13/2028 | 350,000 | 374,726 | ||||||||||
Wachovia Bank Commercial Mortgage Trust, Series 2006-C26, Class A37, 6.011%, 6/15/2045 | 20,327 | 20,317 | ||||||||||
Wells Fargo Commercial Mortgage Trust, Series 2010-C1, Class A23, 4.393%, 11/15/2043 | 600,000 | 650,460 | ||||||||||
WF-RBS Commercial Mortgage Trust, Series 2013-C11, Class A2, 2.029%, 3/15/2045 | 942,600 | 948,000 | ||||||||||
WinWater Mortgage Loan Trust, Series 2015-1, Class A13,7, 3.50%, 1/20/2045 | 1,017,628 | 1,040,266 | ||||||||||
WinWater Mortgage Loan Trust, Series 2015-3, Class A53,7, 3.50%, 3/20/2045 | 1,015,781 | 1,036,406 | ||||||||||
|
| |||||||||||
TOTAL COMMERCIAL MORTGAGE-BACKED SECURITIES |
| |||||||||||
(Identified Cost $35,460,412) | 36,304,336 | |||||||||||
|
| |||||||||||
FOREIGN GOVERNMENT BONDS - 1.6% |
| |||||||||||
Bonos de la Tesoreria de la Republica en pesos (Chile), 6.00%, 1/1/2018 | CLP | 805,000,000 | 1,266,130 | |||||||||
Brazilian Government International Bond (Brazil), 8.875%, 10/14/2019 | 500,000 | 588,750 | ||||||||||
Canada Housing Trust No. 1 (Canada)3, 4.10%, 12/15/2018 | CAD | 385,000 | 307,256 | |||||||||
Canadian Government Bond (Canada), 1.50%, 9/1/2017 | CAD | 160,000 | 120,207 | |||||||||
Canadian Government Bond (Canada), 2.75%, 6/1/2022 | CAD | 460,000 | 379,897 | |||||||||
Export-Import Bank of Korea (South Korea), 2.625%, 12/30/2020 | 6,425,000 | 6,577,227 | ||||||||||
Korea Treasury Bond (South Korea), 2.00%, 12/10/2017 | KRW | 470,000,000 | 413,186 | |||||||||
Mexican Government Bond (Mexico), 7.25%, 12/15/2016 | MXN | 5,945,000 | 315,408 | |||||||||
Mexican Government Bond (Mexico), 5.00%, 6/15/2017 | MXN | 9,500,000 | 502,407 | |||||||||
Mexican Government Bond (Mexico), 8.00%, 6/11/2020 | MXN | 9,400,000 | 532,199 | |||||||||
Mexican Government Bond (Mexico), 6.50%, 6/10/2021 | MXN | 4,000,000 | 216,295 | |||||||||
Mexican Government Bond (Mexico), 6.50%, 6/9/2022 | MXN | 6,500,000 | 351,875 | |||||||||
Mexican Government Bond (Mexico), 7.75%, 5/29/2031 | MXN | 1,250,000 | 73,037 | |||||||||
Norway Government Bond (Norway)3, 4.25%, 5/19/2017 | NOK | 1,600,000 | 197,464 | |||||||||
Singapore Government Bond (Singapore), 2.50%, 6/1/2019 | SGD | 845,000 | 630,447 | |||||||||
Svensk Exportkredit AB (Sweden), 1.125%, 8/28/2019 | 2,800,000 | 2,784,286 | ||||||||||
United Kingdom Gilt (United Kingdom), 1.00%, 9/7/2017 | GBP | 375,000 | 462,063 | |||||||||
United Kingdom Gilt (United Kingdom), 5.00%, 3/7/2018 | GBP | 475,000 | 618,715 | |||||||||
|
| |||||||||||
TOTAL FOREIGN GOVERNMENT BONDS | ||||||||||||
(Identified Cost $18,015,270) | 16,336,849 | |||||||||||
|
| |||||||||||
U.S. GOVERNMENT AGENCIES - 9.6% | ||||||||||||
Mortgage-Backed Securities - 8.6% | ||||||||||||
Fannie Mae, Pool #888468, 5.50%, 9/1/2021 | 402,866 | 428,529 | ||||||||||
Fannie Mae, Pool #995233, 5.50%, 10/1/2021 | 26,984 | 28,461 | ||||||||||
Fannie Mae, Pool #888017, 6.00%, 11/1/2021 | 39,800 | 42,784 | ||||||||||
Fannie Mae, Pool #995329, 5.50%, 12/1/2021 | 277,607 | 295,475 | ||||||||||
Fannie Mae, Pool #888136, 6.00%, 12/1/2021 | 49,735 | 53,547 | ||||||||||
Fannie Mae, Pool #888810, 5.50%, 11/1/2022 | 482,623 | 513,978 | ||||||||||
Fannie Mae, Pool #990895, 5.50%, 10/1/2023 | 40,675 | 44,208 | ||||||||||
Fannie Mae, Pool #AD0462, 5.50%, 10/1/2024 | 32,104 | 34,998 | ||||||||||
Fannie Mae, Pool #MA1834, 4.50%, 2/1/2034 | 1,389,119 | 1,529,046 | ||||||||||
Fannie Mae, Pool #MA1890, 4.00%, 5/1/2034 | 1,181,289 | 1,275,555 | ||||||||||
Fannie Mae, Pool #MA1903, 4.50%, 5/1/2034 | 620,025 | 682,140 | ||||||||||
Fannie Mae, Pool #AS3677, 4.00%, 10/1/2034 | 1,042,017 | 1,115,227 | ||||||||||
Fannie Mae, Pool #MA2177, 4.00%, 2/1/2035 | 1,571,742 | 1,699,937 | ||||||||||
Fannie Mae, Pool #MA2198, 3.50%, 3/1/2035 | 3,145,842 | 3,327,883 | ||||||||||
Fannie Mae, Pool #AY8263, 3.00%, 5/1/2035 | 2,705,774 | 2,798,672 | ||||||||||
The accompanying notes are an integral part of the financial statements.
70
Investment Portfolio - October 31, 2016
| PRO-BLEND® EXTENDED TERM SERIES | PRINCIPAL AMOUNT 4 | VALUE (NOTE 2) | ||||||||||
U.S. GOVERNMENT AGENCIES (continued) | ||||||||||||
Mortgage-Backed Securities (continued) | ||||||||||||
Fannie Mae, Pool #888021, 6.00%, 12/1/2036 | 70,746 | $ | 81,134 | |||||||||
Fannie Mae, Pool #909786, 5.50%, 3/1/2037 | 178,140 | 200,913 | ||||||||||
Fannie Mae, Pool #995050, 6.00%, 9/1/2037 | 209,629 | 240,551 | ||||||||||
Fannie Mae, Pool #AB8161, 6.00%, 12/1/2037 | 765,813 | 877,340 | ||||||||||
Fannie Mae, Pool #933731, 5.50%, 4/1/2038 | 660,483 | 746,727 | ||||||||||
Fannie Mae, Pool #889576, 6.00%, 4/1/2038 | 446,664 | 512,292 | ||||||||||
Fannie Mae, Pool #889624, 5.50%, 5/1/2038 | 825,487 | 935,500 | ||||||||||
Fannie Mae, Pool #889579, 6.00%, 5/1/2038 | 400,047 | 459,037 | ||||||||||
Fannie Mae, Pool #995196, 6.00%, 7/1/2038 | 23,330 | 26,772 | ||||||||||
Fannie Mae, Pool #AD0119, 6.00%, 7/1/2038 | 259,842 | 297,433 | ||||||||||
Fannie Mae, Pool #AD0207, 6.00%, 10/1/2038 | 1,348,923 | 1,547,459 | ||||||||||
Fannie Mae, Pool #AD0220, 6.00%, 10/1/2038 | 38,795 | 44,521 | ||||||||||
Fannie Mae, Pool #890294, 5.50%, 1/1/2039 | 1,519,020 | 1,719,877 | ||||||||||
Fannie Mae, Pool #AD0307, 5.50%, 1/1/2039 | 845,612 | 957,094 | ||||||||||
Fannie Mae, Pool #AD0527, 5.50%, 6/1/2039 | 135,841 | 153,600 | ||||||||||
Fannie Mae, Pool #MA0258, 4.50%, 12/1/2039 | 1,014,243 | 1,108,914 | ||||||||||
Fannie Mae, Pool #890326, 5.50%, 1/1/2040 | 1,201,298 | 1,360,486 | ||||||||||
Fannie Mae, Pool #AL1595, 6.00%, 1/1/2040 | 700,854 | 803,400 | ||||||||||
Fannie Mae, Pool #AE0061, 6.00%, 2/1/2040 | 768,858 | 881,843 | ||||||||||
Fannie Mae, Pool #AL0152, 6.00%, 6/1/2040 | 927,022 | 1,063,611 | ||||||||||
Fannie Mae, Pool #AL2581, 6.00%, 6/1/2040 | 601,577 | 689,553 | ||||||||||
Fannie Mae, Pool #890519, 6.00%, 10/1/2040 | 1,383,409 | 1,587,352 | ||||||||||
Fannie Mae, Pool #AE0951, 4.50%, 2/1/2041 | 636,919 | 696,929 | ||||||||||
Fannie Mae, Pool #AL0241, 4.00%, 4/1/2041 | 1,403,218 | 1,507,341 | ||||||||||
Fannie Mae, Pool #AH9054, 4.50%, 4/1/2041 | 276,898 | 302,859 | ||||||||||
Fannie Mae, Pool #AI2468, 4.50%, 5/1/2041 | 225,439 | 247,214 | ||||||||||
Fannie Mae, Pool #AL0160, 4.50%, 5/1/2041 | 655,127 | 718,108 | ||||||||||
Fannie Mae, Pool #AI5172, 4.00%, 8/1/2041 | 1,065,625 | 1,144,549 | ||||||||||
Fannie Mae, Pool #AJ1415, 4.50%, 9/1/2041 | 153,140 | 167,608 | ||||||||||
Fannie Mae, Pool #AL1410, 4.50%, 12/1/2041 | 2,612,865 | 2,864,691 | ||||||||||
Fannie Mae, Pool #AK4940, 3.50%, 3/1/2042 | 772,169 | 813,648 | ||||||||||
Fannie Mae, Pool #AL7729, 4.00%, 6/1/2043 | 1,343,292 | 1,442,220 | ||||||||||
Fannie Mae, Pool #AL7767, 4.50%, 6/1/2044 | 2,664,355 | 2,912,321 | ||||||||||
Fannie Mae, Pool #AL6294, 4.50%, 11/1/2044 | 2,482,977 | 2,719,328 | ||||||||||
Fannie Mae, Pool #AX5234, 4.50%, 11/1/2044 | 2,176,298 | 2,379,712 | ||||||||||
Fannie Mae, Pool #AS4103, 4.50%, 12/1/2044 | 1,556,859 | 1,722,897 | ||||||||||
Fannie Mae, Pool #AZ3627, 4.00%, 11/1/2045 | 654,798 | 701,215 | ||||||||||
Fannie Mae, Pool #BA3890, 4.00%, 11/1/2045 | 837,339 | 896,762 | ||||||||||
Fannie Mae, Pool #BA6762, 4.00%, 12/1/2045 | 647,180 | 692,905 | ||||||||||
Fannie Mae, Pool #BC3490, 3.50%, 2/1/2046 | 2,866,505 | 3,009,558 | ||||||||||
Fannie Mae, Pool #BC6764, 3.50%, 4/1/2046 | 945,346 | 992,643 | ||||||||||
Fannie Mae, Pool #AL8674, 5.655%, 1/1/2049 | 2,853,657 | 3,233,463 | ||||||||||
Freddie Mac, Pool #G11850, 5.50%, 7/1/2020 | 127,056 | 132,883 | ||||||||||
Freddie Mac, Pool #G12610, 6.00%, 3/1/2022 | 51,026 | 55,126 | ||||||||||
Freddie Mac, Pool #G12655, 6.00%, 5/1/2022 | 36,396 | 39,404 | ||||||||||
Freddie Mac, Pool #G12988, 6.00%, 1/1/2023 | 27,386 | 29,736 | ||||||||||
Freddie Mac, Pool #G13078, 6.00%, 3/1/2023 | 48,969 | 53,024 | ||||||||||
Freddie Mac, Pool #G13331, 5.50%, 10/1/2023 | 19,993 | 21,532 | ||||||||||
Freddie Mac, Pool #C91754, 4.50%, 3/1/2034 | 787,614 | 866,799 | ||||||||||
Freddie Mac, Pool #C91762, 4.50%, 5/1/2034 | 988,399 | 1,086,761 | ||||||||||
The accompanying notes are an integral part of the financial statements.
71
Investment Portfolio - October 31, 2016
| PRO-BLEND® EXTENDED TERM SERIES | PRINCIPAL AMOUNT 4/ SHARES/ CONTRACTS | VALUE (NOTE 2) | ||||||||||
U.S. GOVERNMENT AGENCIES (continued) | ||||||||||||
Mortgage-Backed Securities (continued) | ||||||||||||
Freddie Mac, Pool #C91766, 4.50%, 5/1/2034 | 605,278 | $ | 660,962 | |||||||||
Freddie Mac, Pool #C91771, 4.50%, 6/1/2034 | 802,034 | 887,090 | ||||||||||
Freddie Mac, Pool #C91780, 4.50%, 7/1/2034 | 933,114 | 1,026,541 | ||||||||||
Freddie Mac, Pool #K92054, 4.00%, 10/1/2034 | 804,028 | 870,050 | ||||||||||
Freddie Mac, Pool #C91850, 4.00%, 9/1/2035 | 2,757,247 | 2,979,155 | ||||||||||
Freddie Mac, Pool #G03332, 6.00%, 10/1/2037 | 79,450 | 91,029 | ||||||||||
Freddie Mac, Pool #G03696, 5.50%, 1/1/2038 | 166,056 | 188,170 | ||||||||||
Freddie Mac, Pool #G03926, 6.00%, 2/1/2038 | 210,744 | 241,397 | ||||||||||
Freddie Mac, Pool #G04264, 5.50%, 4/1/2038 | 490,841 | 553,398 | ||||||||||
Freddie Mac, Pool #G04731, 5.50%, 4/1/2038 | 317,405 | 360,346 | ||||||||||
Freddie Mac, Pool #G08273, 5.50%, 6/1/2038 | 383,233 | 434,142 | ||||||||||
Freddie Mac, Pool #G04601, 5.50%, 7/1/2038 | 1,160,139 | 1,319,175 | ||||||||||
Freddie Mac, Pool #G05956, 5.50%, 7/1/2038 | 741,871 | 840,716 | ||||||||||
Freddie Mac, Pool #G04587, 5.50%, 8/1/2038 | 1,105,489 | 1,249,807 | ||||||||||
Freddie Mac, Pool #G05671, 5.50%, 8/1/2038 | 290,643 | 329,278 | ||||||||||
Freddie Mac, Pool #G06172, 5.50%, 12/1/2038 | 547,143 | 620,023 | ||||||||||
Freddie Mac, Pool #G05409, 5.50%, 3/1/2039 | 380,125 | 430,736 | ||||||||||
Freddie Mac, Pool #A86522, 4.50%, 5/1/2039 | 832,174 | 910,692 | ||||||||||
Freddie Mac, Pool #A89760, 4.50%, 12/1/2039 | 146,184 | 159,783 | ||||||||||
Freddie Mac, Pool #G06021, 5.50%, 1/1/2040 | 174,792 | 198,097 | ||||||||||
Freddie Mac, Pool #G05923, 5.50%, 2/1/2040 | 110,002 | 124,833 | ||||||||||
Freddie Mac, Pool #G05900, 6.00%, 3/1/2040 | 271,196 | 310,015 | ||||||||||
Freddie Mac, Pool #G05906, 6.00%, 4/1/2040 | 215,465 | 247,383 | ||||||||||
Freddie Mac, Pool #A92889, 4.50%, 7/1/2040 | 2,888,684 | 3,161,099 | ||||||||||
Freddie Mac, Pool #G07589, 5.50%, 6/1/2041 | 1,792,969 | 2,030,321 | ||||||||||
Freddie Mac, Pool #Q17719, 3.50%, 4/1/2043 | 1,150,323 | 1,211,125 | ||||||||||
Freddie Mac, Pool #Q28831, 4.50%, 10/1/2044 | 524,935 | 573,447 | ||||||||||
Freddie Mac, Pool #G08669, 4.00%, 9/1/2045 | 1,553,734 | 1,660,982 | ||||||||||
Freddie Mac, Pool #G08672, 4.00%, 10/1/2045 | 3,231,321 | 3,454,901 | ||||||||||
Freddie Mac, Pool #Q37892, 4.00%, 12/1/2045 | 1,655,741 | 1,770,893 | ||||||||||
|
| |||||||||||
| Total Mortgage-Backed Securities | ||||||||||||
(Identified Cost $88,482,357) | 90,512,671 | |||||||||||
|
| |||||||||||
| Other Agencies - 1.0% | ||||||||||||
Fannie Mae, 2.625%, 9/6/2024 | ||||||||||||
(Identified Cost $10,650,638) | 9,926,000 | 10,467,453 | ||||||||||
|
| |||||||||||
| TOTAL U.S. GOVERNMENT AGENCIES | ||||||||||||
(Identified Cost $99,132,995) | 100,980,124 | |||||||||||
|
| |||||||||||
| SHORT-TERM INVESTMENT - 0.7% | ||||||||||||
Dreyfus Government Cash Management9, 0.28%, | ||||||||||||
(Identified Cost $7,806,402) | 7,806,402 | 7,806,402 | ||||||||||
|
| |||||||||||
| TOTAL INVESTMENTS - 99.6% | ||||||||||||
(Identified Cost $1,002,068,613) | 1,052,593,271 | |||||||||||
| OTHER ASSETS, LESS LIABILITIES - 0.4% | 3,923,033 | |||||||||||
|
| |||||||||||
| NET ASSETS - 100% | $ | 1,056,516,304 | ||||||||||
|
| |||||||||||
| CALL OPTIONS WRITTEN - 0.0%## | ||||||||||||
Liberty Global plc - Class A, Strike $35, Expiring November 18, 2016, | ||||||||||||
(Premiums Received $33,382) | 846 | $ | (25,380 | ) | ||||||||
|
| |||||||||||
| PUT OPTIONS WRITTEN - 0.0%## | ||||||||||||
Facebook, Inc. - Class A, Strike $120, Expiring November 4, 2016, | 224 | (8,960 | ) | |||||||||
The Priceline Group, Inc., Strike $1,330, Expiring November 11, 2016, | 19 | (12,540 | ) | |||||||||
Skyworks Solutions, Inc., Strike $70, Expiring November 4, 2016, | 387 | (17,415 | ) | |||||||||
|
| |||||||||||
| TOTAL PUT OPTIONS WRITTEN | ||||||||||||
(Premiums Received $85,198) | $ | (38,915 | ) | |||||||||
|
| |||||||||||
The accompanying notes are an integral part of the financial statements.
72
Investment Portfolio - October 31, 2016
ADR - American Depositary Receipt
AUD - Australian Dollar
CAD - Canadian Dollar
CLP - Chilean Peso
ETF - Exchange-traded fund
GBP - British Pound
IO - Interest only
KRW - South Korean Won
MXN - Mexican Peso
No. - Number
NOK - Norwegian Krone
SGD - Singapore Dollar
##Less than 0.1%.
* Non-income producing security.
1 A factor from a third party vendor was applied to determine the security’s fair value following the close of local trading.
2 A portion of this security is designated with the broker as collateral for options contracts written. As of October 31, 2016, the total value of such securities was $25,246,733.
3 Restricted securities - Investment in securities that are restricted as to public resale under the Securities Act of 1933, as amended. These securities have been sold under Rule 144A and have been determined to be liquid. These securities amount to $76,725,669 or 7.3%, of the Series’ net assets as of October 31, 2016 (see Note 2 to the financial statements).
4 Amount is stated in USD unless otherwise noted.
5 Security is perpetual in nature and has no stated maturity date.
6 The rate shown is a fixed rate as of October 31, 2016; the rate becomes floating, based on LIBOR plus a spread, in December 2024.
7 The coupon rate is floating and is the effective rate as of October 31, 2016.
8 Represents a Payment-In-Kind bond.
9 Rate shown is the current yield as of October 31, 2016.
The Global Industry Classification Standard (GICS) was developed by and is the exclusive property and a service mark of MSCI Inc. (MSCI) and Standard & Poor’s, a division of The McGraw-Hill Companies, Inc. (S&P), and is licensed for use by Manning & Napier when referencing GICS sectors. Neither MSCI, S&P, nor any third party involved in making or compiling the GICS or any GICS classifications makes any express or implied warranties or representations with respect to such standard or classification, nor shall any such party have any liability therefrom.
The accompanying notes are an integral part of the financial statements.
73
Statement of Assets and Liabilities - Pro-Blend® Extended Term Series
October 31, 2016
ASSETS: | ||||
Investments, at value (identified cost $1,002,068,613) (Note 2) | $ | 1,052,593,271 | ||
Receivable for securities sold | 8,654,329 | |||
Interest receivable | 3,005,614 | |||
Foreign tax reclaims receivable | 530,295 | |||
Dividends receivable | 419,896 | |||
Receivable for fund shares sold | 282,321 | |||
Prepaid and other expenses | 19,832 | |||
|
| |||
TOTAL ASSETS | 1,065,505,558 | |||
|
| |||
LIABILITIES: | ||||
Accrued management fees (Note 3) | 690,988 | |||
Accrued distribution and service (Rule 12b-1) fees (Class C) (Class R) (Note 3) | 137,476 | |||
Accrued shareholder services fees (Class S) (Note 3) | 109,354 | |||
Accrued fund accounting and administration fees (Note 3) | 43,997 | |||
Accrued transfer agent fees (Note 3) | 30,828 | |||
Accrued Directors’ fees (Note 3) | 522 | |||
Accrued Chief Compliance Officer service fees (Note 3) | 353 | |||
Options written, at value (premiums received $118,580) (Note 2) | 64,295 | |||
Accrued foreign capital gains tax (Note 2) | 174 | |||
Payable for securities purchased | 4,196,386 | |||
Payable for fund shares repurchased | 3,615,430 | |||
Other payables and accrued expenses | 99,451 | |||
|
| |||
TOTAL LIABILITIES | 8,989,254 | |||
|
| |||
TOTAL NET ASSETS | $ | 1,056,516,304 | ||
|
| |||
NET ASSETS CONSIST OF: | ||||
Capital stock | $ | 872,050 | ||
Additional paid-in-capital | 990,329,200 | |||
Undistributed net investment income | 3,183,057 | |||
Accumulated net realized gain on investments, foreign currency and translation of other assets and liabilities | 11,607,781 | |||
Net unrealized appreciation on investments (net of foreign capital gains tax of $174), foreign currency and translation of other assets and liabilities | 50,524,216 | |||
|
| |||
TOTAL NET ASSETS | $ | 1,056,516,304 | ||
|
| |||
The accompanying notes are an integral part of the financial statements.
74
Statement of Assets and Liabilities - Pro-Blend® Extended Term Series
October 31, 2016
NET ASSET VALUE, OFFERING PRICE AND REDEMPTION PRICE PER SHARE - Class S | $ | 16.62 | ||
|
| |||
NET ASSET VALUE, OFFERING PRICE AND REDEMPTION PRICE PER SHARE - Class I | $ | 9.53 | ||
|
| |||
NET ASSET VALUE, OFFERING PRICE AND REDEMPTION PRICE PER SHARE - Class C | $ | 10.19 | ||
|
| |||
NET ASSET VALUE, OFFERING PRICE AND REDEMPTION PRICE PER SHARE - Class R | $ | 10.88 | ||
|
| |||
The accompanying notes are an integral part of the financial statements.
75
Statement of Operations - Pro-Blend® Extended Term Series
For the Year Ended October 31, 2016
INVESTMENT INCOME: | ||||
Interest | $ | 14,824,023 | ||
Dividends (net of foreign taxes withheld, $237,762) | 9,381,817 | |||
|
| |||
Total Investment Income | 24,205,840 | |||
|
| |||
EXPENSES: | ||||
Management fees (Note 3) | 9,387,296 | |||
Distribution and service (Rule 12b-1) fees (Class C) (Note 3) | 1,549,008 | |||
Distribution and service (Rule 12b-1) fees (Class R) (Note 3) | 169,741 | |||
Shareholder services fees (Class S) (Note 3) | 1,442,862 | |||
Fund accounting and administration fees (Note 3) | 251,422 | |||
Transfer agent fees (Note 3) | 200,490 | |||
Directors’ fees (Note 3) | 98,345 | |||
Chief Compliance Officer service fees (Note 3) | 3,727 | |||
Custodian fees | 88,667 | |||
Miscellaneous | 234,777 | |||
|
| |||
Total Expenses | 13,426,335 | |||
|
| |||
NET INVESTMENT INCOME | 10,779,505 | |||
|
| |||
REALIZED AND UNREALIZED GAIN (LOSS) ON INVESTMENTS AND FOREIGN CURRENCY: | ||||
Net realized gain (loss) on- | ||||
Investments | 17,506,545 | |||
Futures contracts | (6,570,099 | ) | ||
Options written | 1,041,842 | |||
Foreign currency and translation of other assets and liabilities | (1,955,530 | ) | ||
|
| |||
| 10,022,758 | ||||
|
| |||
Net change in unrealized appreciation (depreciation) on- | ||||
Investments (net of decrease in accrued foreign capital gains tax of $592) | 11,177,049 | |||
Futures contracts | 838,256 | |||
Options written | 54,285 | |||
Foreign currency and translation of other assets and liabilities | (1,376 | ) | ||
|
| |||
| 12,068,214 | ||||
|
| |||
NET REALIZED AND UNREALIZED GAIN (LOSS) ON INVESTMENTS AND FOREIGN CURRENCY | 22,090,972 | |||
|
| |||
NET INCREASE IN NET ASSETS RESULTING FROM OPERATIONS | $ | 32,870,477 | ||
|
| |||
The accompanying notes are an integral part of the financial statements.
76
Statements of Changes in Net Assets - Pro-Blend® Extended Term Series
FOR THE YEAR ENDED 10/31/16 | FOR THE YEAR ENDED 10/31/15 | |||||||
INCREASE (DECREASE) IN NET ASSETS: | ||||||||
OPERATIONS: | ||||||||
Net investment income | $ | 10,779,505 | $ | 15,880,780 | ||||
Net realized gain on investments and foreign currency | 10,022,758 | 25,447,039 | ||||||
Net change in unrealized appreciation (depreciation) on investments and foreign currency | 12,068,214 | (74,601,726 | ) | |||||
|
|
|
| |||||
Net increase (decrease) from operations | 32,870,477 | (33,273,907 | ) | |||||
|
|
|
| |||||
DISTRIBUTIONS TO SHAREHOLDERS (Note 8): | ||||||||
From net investment income (Class S) | (3,603,129 | ) | (5,232,086 | ) | ||||
From net investment income (Class I) | (7,296,287 | ) | (9,395,801 | ) | ||||
From net investment income (Class C) | (518,657 | ) | (660,165 | ) | ||||
From net investment income (Class R) | (236,226 | ) | (510,084 | ) | ||||
From net realized gain on investments (Class S) | (9,325,002 | ) | (63,495,422 | ) | ||||
From net realized gain on investments (Class I) | (12,363,383 | ) | (81,338,580 | ) | ||||
From net realized gain on investments (Class C) | (3,605,757 | ) | (18,859,983 | ) | ||||
From net realized gain on investments (Class R) | (789,144 | ) | (7,014,868 | ) | ||||
|
|
|
| |||||
Total distributions to shareholders | (37,737,585 | ) | (186,506,989 | ) | ||||
|
|
|
| |||||
CAPITAL STOCK ISSUED AND REPURCHASED: | ||||||||
Net decrease from capital share transactions (Note 5) | (409,275,083 | ) | (70,659,450 | ) | ||||
|
|
|
| |||||
Net decrease in net assets | (414,142,191 | ) | (290,440,346 | ) | ||||
NET ASSETS: | ||||||||
Beginning of year | 1,470,658,495 | 1,761,098,841 | ||||||
|
|
|
| |||||
End of year (including undistributed net investment income of $3,183,057 and | $ | 1,056,516,304 | $ | 1,470,658,495 | ||||
|
|
|
| |||||
The accompanying notes are an integral part of the financial statements.
77
Financial Highlights - Pro-Blend® Extended Term Series - Class S
| FOR THE YEARS ENDED | ||||||||||||||||||||
| 10/31/16 | 10/31/15 | 10/31/14 | 10/31/13 | 10/31/12 | ||||||||||||||||
Per share data (for a share outstanding throughout each year): | ||||||||||||||||||||
Net asset value - Beginning of year | $ | 16.42 | $ | 18.28 | $ | 18.10 | $ | 16.01 | $ | 15.46 | ||||||||||
|
|
|
|
|
|
|
|
|
| |||||||||||
Income (loss) from investment operations: | ||||||||||||||||||||
Net investment income1 | 0.14 | 0.16 | 0.19 | 0.17 | 0.19 | |||||||||||||||
Net realized and unrealized gain (loss) on investments | 0.37 | (0.56 | ) | 1.02 | 2.56 | 1.01 | ||||||||||||||
|
|
|
|
|
|
|
|
|
| |||||||||||
Total from investment operations | 0.51 | (0.40 | ) | 1.21 | 2.73 | 1.20 | ||||||||||||||
|
|
|
|
|
|
|
|
|
| |||||||||||
Less distributions to shareholders: | ||||||||||||||||||||
From net investment income | (0.09 | ) | (0.11 | ) | (0.13 | ) | (0.14 | ) | (0.19 | ) | ||||||||||
From net realized gain on investments | (0.22 | ) | (1.35 | ) | (0.90 | ) | (0.50 | ) | (0.46 | ) | ||||||||||
|
|
|
|
|
|
|
|
|
| |||||||||||
Total distributions to shareholders | (0.31 | ) | (1.46 | ) | (1.03 | ) | (0.64 | ) | (0.65 | ) | ||||||||||
|
|
|
|
|
|
|
|
|
| |||||||||||
Net asset value - End of year | $ | 16.62 | $ | 16.42 | $ | 18.28 | $ | 18.10 | $ | 16.01 | ||||||||||
|
|
|
|
|
|
|
|
|
| |||||||||||
Net assets - End of year (000’s omitted) | $ | 498,344 | $ | 718,811 | $ | 872,014 | $ | 820,370 | $ | 792,804 | ||||||||||
|
|
|
|
|
|
|
|
|
| |||||||||||
Total return2 | 3.23 | % | (2.16 | %) | 7.08 | % | 17.56 | % | 8.26 | % | ||||||||||
Ratios (to average net assets)/Supplemental Data: | ||||||||||||||||||||
Expenses | 1.07 | % | 1.07 | % | 1.06 | % | 1.06 | % | 1.07 | % | ||||||||||
Net investment income | 0.86 | % | 0.96 | % | 1.04 | % | 1.03 | % | 1.20 | % | ||||||||||
Series portfolio turnover | 63 | % | 66 | % | 65 | % | 64 | % | 58 | % | ||||||||||
1Calculated based on average shares outstanding during the years.
2Represents aggregate total return for the years indicated, and assumes reinvestment of all distributions.
The accompanying notes are an integral part of the financial statements.
78
Financial Highlights - Pro-Blend® Extended Term Series - Class I
| FOR THE YEARS ENDED | ||||||||||||||||||||
| 10/31/16 | 10/31/15 | 10/31/14 | 10/31/13 | 10/31/12 | ||||||||||||||||
Per share data (for a share outstanding throughout each year): | ||||||||||||||||||||
Net asset value - Beginning of year | $ | 9.57 | $ | 11.30 | $ | 11.60 | $ | 10.50 | $ | 10.38 | ||||||||||
|
|
|
|
|
|
|
|
|
| |||||||||||
Income (loss) from investment operations: | ||||||||||||||||||||
Net investment income1 | 0.10 | 0.12 | 0.15 | 0.14 | 0.15 | |||||||||||||||
Net realized and unrealized gain (loss) on investments | 0.21 | (0.34 | ) | 0.62 | 1.64 | 0.66 | ||||||||||||||
|
|
|
|
|
|
|
|
|
| |||||||||||
Total from investment operations | 0.31 | (0.22 | ) | 0.77 | 1.78 | 0.81 | ||||||||||||||
|
|
|
|
|
|
|
|
|
| |||||||||||
Less distributions to shareholders: | ||||||||||||||||||||
From net investment income | (0.13 | ) | (0.16 | ) | (0.17 | ) | (0.18 | ) | (0.23 | ) | ||||||||||
From net realized gain on investments | (0.22 | ) | (1.35 | ) | (0.90 | ) | (0.50 | ) | (0.46 | ) | ||||||||||
|
|
|
|
|
|
|
|
|
| |||||||||||
Total distributions to shareholders | (0.35 | ) | (1.51 | ) | (1.07 | ) | (0.68 | ) | (0.69 | ) | ||||||||||
|
|
|
|
|
|
|
|
|
| |||||||||||
Net asset value - End of year | $ | 9.53 | $ | 9.57 | $ | 11.30 | $ | 11.60 | $ | 10.50 | ||||||||||
|
|
|
|
|
|
|
|
|
| |||||||||||
Net assets - End of year (000’s omitted) | $ | 386,926 | $ | 545,570 | $ | 659,331 | $ | 547,522 | $ | 429,157 | ||||||||||
|
|
|
|
|
|
|
|
|
| |||||||||||
Total return2 | 3.52 | % | (1.91 | %) | 7.32 | % | 17.80 | % | 8.60 | % | ||||||||||
Ratios (to average net assets)/Supplemental Data: | ||||||||||||||||||||
Expenses | 0.82 | % | 0.82 | % | 0.81 | % | 0.81 | % | 0.82 | % | ||||||||||
Net investment income | 1.12 | % | 1.22 | % | 1.29 | % | 1.27 | % | 1.45 | % | ||||||||||
Series portfolio turnover | 63 | % | 66 | % | 65 | % | 64 | % | 58 | % | ||||||||||
1Calculated based on average shares outstanding during the years.
2Represents aggregate total return for the years indicated, and assumes reinvestment of all distributions.
The accompanying notes are an integral part of the financial statements.
79
Financial Highlights - Pro-Blend® Extended Term Series - Class C
| FOR THE YEARS ENDED | ||||||||||||||||||||
| 10/31/16 | 10/31/15 | 10/31/14 | 10/31/13 | 10/31/12 | ||||||||||||||||
Per share data (for a share outstanding throughout each year): | ||||||||||||||||||||
Net asset value - Beginning of year | $ | 10.21 | $ | 11.95 | $ | 12.21 | $ | 11.02 | $ | 10.86 | ||||||||||
|
|
|
|
|
|
|
|
|
| |||||||||||
Income (loss) from investment operations: | ||||||||||||||||||||
Net investment income1 | 0.01 | 0.02 | 0.03 | 0.03 | 0.05 | |||||||||||||||
Net realized and unrealized gain (loss) on investments | 0.22 | (0.36 | ) | 0.67 | 1.73 | 0.70 | ||||||||||||||
|
|
|
|
|
|
|
|
|
| |||||||||||
Total from investment operations | 0.23 | (0.34 | ) | 0.70 | 1.76 | 0.75 | ||||||||||||||
|
|
|
|
|
|
|
|
|
| |||||||||||
Less distributions to shareholders: | ||||||||||||||||||||
From net investment income | (0.03 | ) | (0.05 | ) | (0.06 | ) | (0.07 | ) | (0.13 | ) | ||||||||||
From net realized gain on investments | (0.22 | ) | (1.35 | ) | (0.90 | ) | (0.50 | ) | (0.46 | ) | ||||||||||
|
|
|
|
|
|
|
|
|
| |||||||||||
Total distributions to shareholders | (0.25 | ) | (1.40 | ) | (0.96 | ) | (0.57 | ) | (0.59 | ) | ||||||||||
|
|
|
|
|
|
|
|
|
| |||||||||||
Net asset value - End of year | $ | 10.19 | $ | 10.21 | $ | 11.95 | $ | 12.21 | $ | 11.02 | ||||||||||
|
|
|
|
|
|
|
|
|
| |||||||||||
Net assets - End of year (000’s omitted) | $ | 146,554 | $ | 165,898 | $ | 164,191 | $ | 124,854 | $ | 85,588 | ||||||||||
|
|
|
|
|
|
|
|
|
| |||||||||||
Total return2 | 2.43 | % | (2.91 | %) | 6.28 | % | 16.65 | % | 7.51 | % | ||||||||||
Ratios (to average net assets)/Supplemental Data: | ||||||||||||||||||||
Expenses | 1.82 | % | 1.82 | % | 1.81 | % | 1.81 | % | 1.82 | % | ||||||||||
Net investment income | 0.11 | % | 0.21 | % | 0.29 | % | 0.27 | % | 0.44 | % | ||||||||||
Series portfolio turnover | 63 | % | 66 | % | 65 | % | 64 | % | 58 | % | ||||||||||
1Calculated based on average shares outstanding during the years.
2Represents aggregate total return for the years indicated, and assumes reinvestment of all distributions.
The accompanying notes are an integral part of the financial statements.
80
Financial Highlights - Pro-Blend® Extended Term Series - Class R
| FOR THE YEARS ENDED | ||||||||||||||||||||
| 10/31/16 | 10/31/15 | 10/31/14 | 10/31/13 | 10/31/12 | ||||||||||||||||
Per share data (for a share outstanding throughout each year): | ||||||||||||||||||||
Net asset value - Beginning of year | $ | 10.87 | $ | 12.62 | $ | 12.83 | $ | 11.54 | $ | 11.36 | ||||||||||
|
|
|
|
|
|
|
|
|
| |||||||||||
Income (loss) from investment operations: | ||||||||||||||||||||
Net investment income1 | 0.06 | 0.08 | 0.10 | 0.09 | 0.10 | |||||||||||||||
Net realized and unrealized gain (loss) on investments | 0.24 | (0.38 | ) | 0.70 | 1.82 | 0.74 | ||||||||||||||
|
|
|
|
|
|
|
|
|
| |||||||||||
Total from investment operations | 0.30 | (0.30 | ) | 0.80 | 1.91 | 0.84 | ||||||||||||||
|
|
|
|
|
|
|
|
|
| |||||||||||
Less distributions to shareholders: | ||||||||||||||||||||
From net investment income | (0.07 | ) | (0.10 | ) | (0.11 | ) | (0.12 | ) | (0.20 | ) | ||||||||||
From net realized gain on investments | (0.22 | ) | (1.35 | ) | (0.90 | ) | (0.50 | ) | (0.46 | ) | ||||||||||
|
|
|
|
|
|
|
|
|
| |||||||||||
Total distributions to shareholders | (0.29 | ) | (1.45 | ) | (1.01 | ) | (0.62 | ) | (0.66 | ) | ||||||||||
|
|
|
|
|
|
|
|
|
| |||||||||||
Net asset value - End of year | $ | 10.88 | $ | 10.87 | $ | 12.62 | $ | 12.83 | $ | 11.54 | ||||||||||
|
|
|
|
|
|
|
|
|
| |||||||||||
Net assets - End of year (000’s omitted) | $ | 24,692 | $ | 40,379 | $ | 65,563 | $ | 58,700 | $ | 38,261 | ||||||||||
|
|
|
|
|
|
|
|
|
| |||||||||||
Total return2 | 2.93 | % | (2.39 | %) | 6.81 | % | 17.28 | % | 8.03 | % | ||||||||||
Ratios (to average net assets)/Supplemental Data: | ||||||||||||||||||||
Expenses | 1.32 | % | 1.32 | % | 1.31 | % | 1.31 | % | 1.33 | % | ||||||||||
Net investment income | 0.61 | % | 0.71 | % | 0.79 | % | 0.77 | % | 0.90 | % | ||||||||||
Series portfolio turnover | 63 | % | 66 | % | 65 | % | 64 | % | 58 | % | ||||||||||
1Calculated based on average shares outstanding during the years.
2Represents aggregate total return for the years indicated, and assumes reinvestment of all distributions.
The accompanying notes are an integral part of the financial statements.
81
Performance Update as of October 31, 2016 - Pro-Blend® Maximum Term Series
(unaudited)
| AVERAGE ANNUAL TOTAL RETURNS AS OF OCTOBER 31, 2016 | ||||||||||||||||
ONE YEAR1 | FIVE YEAR | TEN YEAR | SINCE INCEPTION2 | |||||||||||||
Manning & Napier Fund, Inc. - Pro-Blend® Maximum Term Series - Class S3 | 3.45 | % | 8.69 | % | 4.71 | % | 8.59 | % | ||||||||
Manning & Napier Fund, Inc. - Pro-Blend® Maximum Term Series - Class I3,4 | 3.79 | % | 8.98 | % | 4.93 | % | 8.70 | % | ||||||||
Manning & Napier Fund, Inc. - Pro-Blend® Maximum Term Series - Class C3,5 | 2.62 | % | 7.88 | % | 3.93 | % | 7.84 | % | ||||||||
Manning & Napier Fund, Inc. - Pro-Blend® Maximum Term Series - Class R3,5 | 3.26 | % | 8.44 | % | 4.47 | % | 8.38 | % | ||||||||
Russell 3000® Index6 | 4.24 | % | 13.35 | % | 6.76 | % | 8.44 | % | ||||||||
65/20/15 Blended Index7 | 3.55 | % | 9.88 | % | 5.64 | % | 7.50 | % | ||||||||
The following graph compares the value of a $10,000 investment in the Manning & Napier Fund, Inc. - Pro-Blend® Maximum Term Series - Class S for the ten years ended October 31, 2016 to the Russell 3000® Index and the 65/20/15 Blended Index.

1The returns shown are based on net asset values calculated for shareholder transactions and may differ from the returns shown in the financial highlights, which reflect adjustments made to the net asset values in accordance with accounting principles generally accepted in the United States of America.
2Performance numbers for the Series and Indices are calculated from November 1, 1995, the Class S inception date.
3The Series’ performance does not reflect the deduction of taxes that a shareholder would pay on fund distributions or the redemption of shares. The Series’ performance is historical and may not be indicative of future results. The performance returns shown are inclusive of the net expense ratio of the Series. For the year ended October 31, 2016, this net expense ratio was 1.08% for Class S, 0.83% for Class I, 1.83% for Class C and 1.33% for Class R. The gross expense ratio, which does not account for any voluntary or contractual waivers currently in effect, was 1.08% for Class S, 0.83% for Class I, 1.83% for Class C and 1.33% for Class R for the year ended October 31, 2016.
4For the periods through the inception of Class I on March 28, 2008, performance is based on the hypothetical performance of Class S shares. Because Class I shares invest in the same portfolio of securities as Class S, performance will only be different to the extent that the Class S shares have a higher expense ratio.
5For periods through the inception of Class C on January 4, 2010 and Class R on June 30, 2010, the performance figures are hypothetical and reflect the performance of the Manning & Napier Fund, Inc. - Pro-Blend® Maximum Term Series - Class S adjusted for expense differences.
6The Russell 3000® Index is an unmanaged index that consists of 3,000 of the largest U.S. companies based on total market capitalization. The Index returns are based on a market capitalization-weighted average of relative price changes of the component stocks plus dividends whose reinvestments are compounded daily. The Index returns do not reflect any fees or expenses. Index returns provided by Bloomberg.
82
Performance Update as of October 31, 2016 - Pro-Blend® Maximum Term Series
(unaudited)
7The 65/20/15 Blended Index is 65% Russell 3000® Index (Russell 3000), 20% MSCI ACWI ex USA Index (ACWIxUS), and 15% Bloomberg Barclays U.S. Aggregate Bond Index (BAB). Russell 3000 is an unmanaged index that consists of 3,000 of the largest U.S. companies based on total market capitalization. The Index returns are based on a market capitalization-weighted average of relative price changes of the component stocks plus dividends whose reinvestments are compounded daily. Index returns provided by Bloomberg. ACWIxUS is a free float-adjusted market capitalization index that is designed to measure equity market performance in the global developed and emerging markets and consists of 45 developed and emerging market country indices outside the U.S. The Index is denominated in U.S. dollars. The Index returns assume daily investment of gross dividends (which do not account for applicable dividend taxation) prior to 12/31/1998, as net returns were not available. Subsequent to 12/31/1998, the Index returns are net of withholding taxes. They assume daily reinvestment of net dividends thus accounting for any applicable dividend taxation. Index returns provided by Bloomberg. BAB is an unmanaged, market value-weighted index of U.S. domestic investment-grade debt issues, including government, corporate, asset-backed, and mortgage-backed securities with maturities of one year or more. Index returns provided by Interactive Data. The returns of the indices do not reflect any fees or expenses. Returns provided are calculated monthly using a blended allocation. Because the Series’ asset allocation will vary over time, the composition of the Series’ portfolio may not match the composition of the comparative Indices.
83
Shareholder Expense Example - Pro-Blend® Maximum Term Series
(unaudited)
As a shareholder of the Series, you incur ongoing costs, including management fees, shareholder service fees and other Series expenses. This example is intended to help you understand your ongoing costs (in dollars) of investing in the Series and to compare these costs with the ongoing costs of investing in other mutual funds.
The example is based on an investment of $1,000 invested in each class at the beginning of the period and held for the entire period (May 1, 2016 to October 31, 2016).
Actual Expenses
The Actual lines of the table below provide information about actual account values and actual expenses. You may use the information in these lines, together with the amount you invested, to estimate the expenses that you paid over the period. Simply divide your account value by $1,000 (for example, an $8,600 account value divided by $1,000 = 8.6), then multiply the result by the number in the Actual line for the Class in which you have invested under the heading entitled “Expenses Paid During Period” to estimate the expenses you paid on your account during this period.
Hypothetical Example for Comparison Purposes
The Hypothetical lines of each class in the table below provide information about hypothetical account values and hypothetical expenses based on the Class’ actual expense ratio and an assumed rate of return of 5% per year before expenses, which is not the Class’ actual return. The hypothetical account values and expenses may not be used to estimate the actual ending account balance or expenses you paid during the period. You may use this information to compare the ongoing costs of investing in a class of the Series and other funds. To do so, compare this 5% hypothetical example for the Class in which you have invested with the 5% hypothetical examples that appear in the shareholder reports of the other funds.
Please note that the expenses shown in the table are meant to highlight your ongoing costs only and do not reflect any transaction costs such as sales charges (loads), redemption fees, or exchange fees that you may incur in other mutual funds. Therefore, the second line of the table is useful in comparing ongoing costs only, and will not help you determine the relative total costs of owning different funds.
| BEGINNING ACCOUNT VALUE 5/1/16 | ENDING ACCOUNT VALUE 10/31/16 | EXPENSES PAID DURING PERIOD 5/1/16-10/31/16* | ANNUALIZED EXPENSE RATIO | |||||
Class S | ||||||||
Actual | $1,000.00 | $1,021.90 | $5.49 | 1.08% | ||||
Hypothetical (5% return before expenses) | $1,000.00 | $1,019.71 | $5.48 | 1.08% | ||||
Class I | ||||||||
Actual | $1,000.00 | $1,022.20 | $4.22 | 0.83% | ||||
Hypothetical (5% return before expenses) | $1,000.00 | $1,020.96 | $4.22 | 0.83% | ||||
Class C | ||||||||
Actual | $1,000.00 | $1,017.30 | $9.28 | 1.83% | ||||
Hypothetical (5% return before expenses) | $1,000.00 | $1,015.94 | $9.27 | 1.83% | ||||
Class R | ||||||||
Actual | $1,000.00 | $1,020.60 | $6.76 | 1.33% | ||||
Hypothetical (5% return before expenses) | $1,000.00 | $1,018.45 | $6.75 | 1.33% |
*Expenses are equal to the Class’ annualized expense ratio (for the six-month period), multiplied by the average account value over the period, multiplied by 184/366 to reflect the one-half year period. Expenses are based on the most recent fiscal half year; therefore, the expense ratios stated above may differ from the expense ratios stated in the financial highlights, which are based on one-year data.
84
Portfolio Composition - Pro-Blend® Maximum Term Series
As of October 31, 2016 (unaudited)
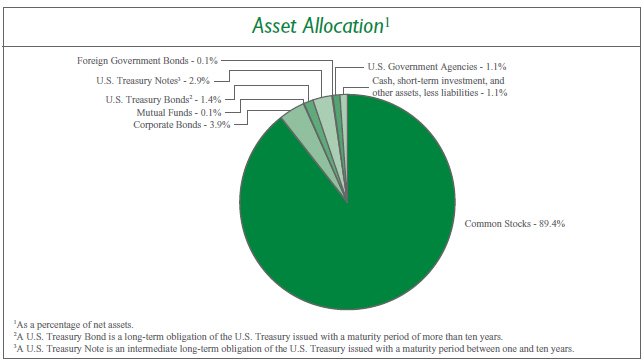
Sector Allocation4 |
| |||
Information Technology | 23.6% | |||
Health Care | 18.8% | |||
Consumer Discretionary | 17.6% | |||
Consumer Staples | 10.7% | |||
Industrials | 5.5% | |||
Materials | 4.9% | |||
Financials | 3.6% | |||
Energy | 3.4% | |||
Real Estate | 3.1% | |||
Telecommunication Services | 2.4% | |||
Utilities | 0.1% | |||
| 4Including common stocks and corporate bonds, as a percentage of total investments. | ||||
Top Ten Stock Holdings5 |
| |||
The Priceline Group, Inc. | 2.5% | |||
Facebook, Inc. - Class A | 2.4% | |||
Apple, Inc. | 2.4% | |||
Cerner Corp. | 2.3% | |||
MasterCard, Inc. - Class A | 2.3% | |||
Monsanto Co. | 2.3% | |||
Amazon.com, Inc. | 2.2% | |||
Perrigo Co. plc | 1.8% | |||
Intuitive Surgical, Inc. | 1.8% | |||
Skyworks Solutions, Inc. | 1.7% | |||
| 5As a percentage of total investments. | ||||
85
Investment Portfolio - October 31, 2016
| PRO-BLEND® MAXIMUM TERM SERIES | SHARES | VALUE (NOTE 2) | ||||||||||
COMMON STOCKS - 89.4% | ||||||||||||
Consumer Discretionary - 17.2% | ||||||||||||
Diversified Consumer Services - 1.0% | ||||||||||||
Fu Shou Yuan International Group Ltd. (China)1 | 1,471,000 | $ | 861,704 | |||||||||
Houghton Mifflin Harcourt Co.* | 469,593 | 5,940,351 | ||||||||||
Kroton Educacional S.A. (Brazil) | 70,682 | 351,860 | ||||||||||
|
| |||||||||||
| 7,153,915 | ||||||||||||
|
| |||||||||||
Hotels, Restaurants & Leisure - 1.0% | ||||||||||||
Accor S.A. (France)1 | 11,910 | 451,943 | ||||||||||
Yum! Brands, Inc. | 79,730 | 6,879,104 | ||||||||||
|
| |||||||||||
| 7,331,047 | ||||||||||||
|
| |||||||||||
Household Durables - 0.0%## | ||||||||||||
LGI Homes, Inc.* | 2,590 | 77,078 | ||||||||||
|
| |||||||||||
Internet & Direct Marketing Retail - 6.1% | ||||||||||||
Amazon.com, Inc.* | 20,380 | 16,096,531 | ||||||||||
ASOS plc (United Kingdom)*1 | 10,510 | 674,678 | ||||||||||
Expedia, Inc. | 6,730 | 869,718 | ||||||||||
The Priceline Group, Inc.* | 12,560 | 18,516,329 | ||||||||||
Rakuten, Inc. (Japan)1 | 107,310 | 1,237,140 | ||||||||||
TripAdvisor, Inc.* | 117,130 | 7,552,542 | ||||||||||
Zalando SE (Germany)*1,2 | 15,160 | 666,659 | ||||||||||
|
| |||||||||||
| �� | 45,613,597 | |||||||||||
|
| |||||||||||
Leisure Products - 0.1% | ||||||||||||
Shimano, Inc. (Japan)1 | 3,400 | 581,331 | ||||||||||
|
| |||||||||||
Media - 6.2% | ||||||||||||
Global Mediacom Tbk PT (Indonesia)1 | 2,506,940 | 163,135 | ||||||||||
ITV plc (United Kingdom)1 | 1,809,660 | 3,772,702 | ||||||||||
Liberty Global plc - Class A - ADR (United Kingdom)* | 247,897 | 8,081,442 | ||||||||||
Surya Citra Media Tbk PT (Indonesia)1 | 1,873,200 | 380,429 | ||||||||||
Time Warner, Inc. | 108,090 | 9,618,929 | ||||||||||
Tribune Media Co. - Class A | 384,780 | 12,543,828 | ||||||||||
Twenty-First Century Fox, Inc. - Class A | 456,740 | 11,998,560 | ||||||||||
|
| |||||||||||
| 46,559,025 | ||||||||||||
|
| |||||||||||
Specialty Retail - 1.3% | ||||||||||||
Advance Auto Parts, Inc. | 9,590 | 1,343,367 | ||||||||||
Kingfisher plc (United Kingdom)1 | 1,740,500 | 7,688,554 | ||||||||||
Monro Muffler Brake, Inc. | 11,250 | 618,750 | ||||||||||
Mr Price Group Ltd. (South Africa)1 | 14,510 | 165,306 | ||||||||||
|
| |||||||||||
| 9,815,977 | ||||||||||||
|
| |||||||||||
Textiles, Apparel & Luxury Goods - 1.5% | ||||||||||||
ANTA Sports Products Ltd. (China)1 | 173,000 | 498,901 | ||||||||||
Kering (France)1 | 3,595 | 797,623 | ||||||||||
lululemon athletica, Inc.* | 173,626 | 9,940,088 | ||||||||||
|
| |||||||||||
| 11,236,612 | ||||||||||||
|
| |||||||||||
Total Consumer Discretionary | 128,368,582 | |||||||||||
|
| |||||||||||
Consumer Staples - 10.4% | ||||||||||||
Beverages - 5.8% | ||||||||||||
Ambev S.A. - ADR (Brazil) | 2,119,814 | 12,506,902 | ||||||||||
Anheuser-Busch InBev S.A./N.V. (Belgium)1 | 91,248 | 10,472,560 | ||||||||||
Cia Cervecerias Unidas S.A. - ADR (Chile) | 17,290 | 371,735 | ||||||||||
The Coca-Cola Co. | 192,880 | 8,178,112 | ||||||||||
Diageo plc (United Kingdom)1 | 420,440 | 11,190,704 | ||||||||||
Fomento Economico Mexicano S.A.B.de C.V. - ADR (Mexico) | 1,840 | 176,033 | ||||||||||
Treasury Wine Estates Ltd. (Australia)1 | 40,289 | 328,451 | ||||||||||
|
| |||||||||||
| 43,224,497 | ||||||||||||
|
| |||||||||||
Food & Staples Retailing - 0.8% | ||||||||||||
Dairy Farm International Holdings Ltd. (Hong Kong)1 | 114,410 | 808,974 | ||||||||||
Sprouts Farmers Market, Inc.* | 240,770 | 5,333,056 | ||||||||||
Tesco plc (United Kingdom)*1 | 54,233 | 139,688 | ||||||||||
|
| |||||||||||
| 6,281,718 | ||||||||||||
|
| |||||||||||
Food Products - 1.6% | ||||||||||||
Adecoagro S.A. (Argentina)* | 96,230 | 1,058,530 | ||||||||||
BRF S.A. (Brazil) | 19,580 | 327,437 | ||||||||||
BRF S.A. - ADR (Brazil) | 10,050 | 168,036 | ||||||||||
Danone S.A. (France)1 | 8,813 | 611,258 | ||||||||||
Gruma S.A.B de C.V. - Class B (Mexico) | 12,620 | 175,429 | ||||||||||
Nestle S.A. (Switzerland)1 | 101,827 | 7,383,874 | ||||||||||
Sao Martinho S.A. (Brazil) | 39,290 | 785,431 | ||||||||||
Suedzucker AG (Germany)1 | 12,792 | 328,149 | ||||||||||
Tiger Brands Ltd. (South Africa)1 | 11,210 | 319,221 | ||||||||||
Universal Robina Corp. (Philippines)1 | 257,360 | 967,102 | ||||||||||
|
| |||||||||||
| 12,124,467 | ||||||||||||
|
| |||||||||||
Personal Products - 2.0% | ||||||||||||
Beiersdorf AG (Germany)1 | 77,790 | 6,857,973 | ||||||||||
Unilever plc - ADR (United Kingdom) | 185,870 | 7,745,203 | ||||||||||
|
| |||||||||||
| 14,603,176 | ||||||||||||
|
| |||||||||||
Tobacco - 0.2% | ||||||||||||
Gudang Garam Tbk PT (Indonesia)1 | 113,270 | 589,346 | ||||||||||
Japan Tobacco, Inc. (Japan)1 | 10,800 | 410,617 | ||||||||||
The accompanying notes are an integral part of the financial statements.
86
Investment Portfolio - October 31, 2016
| PRO-BLEND® MAXIMUM TERM SERIES | SHARES | VALUE (NOTE 2) | ||||||||||
COMMON STOCKS (continued) | ||||||||||||
Consumer Staples (continued) | ||||||||||||
Tobacco (continued) | ||||||||||||
KT&G Corp. (South Korea)1 | 1,960 | $ | 193,315 | |||||||||
|
| |||||||||||
| 1,193,278 | ||||||||||||
|
| |||||||||||
Total Consumer Staples | 77,427,136 | |||||||||||
|
| |||||||||||
Energy - 2.9% | ||||||||||||
Energy Equipment & Services - 1.7% | ||||||||||||
Schlumberger Ltd. | 163,448 | 12,786,537 | ||||||||||
|
| |||||||||||
Oil, Gas & Consumable Fuels - 1.2% | ||||||||||||
Cameco Corp. (Canada) | 32,685 | 251,674 | ||||||||||
Cosan S.A. Industria e Comercio (Brazil) | 17,250 | 230,811 | ||||||||||
Galp Energia SGPS S.A. (Portugal)1 | 61,000 | 827,059 | ||||||||||
Range Resources Corp. | 197,330 | 6,667,781 | ||||||||||
Royal Dutch Shell plc - Class B (Netherlands)1 | 17,214 | 443,994 | ||||||||||
|
| |||||||||||
| 8,421,319 | ||||||||||||
|
| |||||||||||
Total Energy | 21,207,856 | |||||||||||
|
| |||||||||||
Financials - 2.4% | ||||||||||||
Banks - 0.0%## | ||||||||||||
ICICI Bank Ltd. - ADR (India) | 33,350 | 276,472 | ||||||||||
|
| |||||||||||
Capital Markets - 0.9% | ||||||||||||
BlackRock, Inc. | 19,630 | 6,698,541 | ||||||||||
JSE Ltd. (South Africa)1 | 16,280 | 189,664 | ||||||||||
|
| |||||||||||
| 6,888,205 | ||||||||||||
|
| |||||||||||
Consumer Finance - 1.5% | ||||||||||||
SLM Corp.* | 755,150 | 5,323,808 | ||||||||||
Synchrony Financial | 192,230 | 5,495,856 | ||||||||||
|
| |||||||||||
| 10,819,664 | ||||||||||||
|
| |||||||||||
Total Financials | 17,984,341 | |||||||||||
|
| |||||||||||
Health Care - 18.6% | ||||||||||||
Biotechnology - 0.9% | ||||||||||||
Alexion Pharmaceuticals, Inc.* | 5,370 | 700,785 | ||||||||||
BioMarin Pharmaceutical, Inc.* | 7,170 | 577,328 | ||||||||||
China Biologic Products, Inc. (China)* | 3,410 | 402,755 | ||||||||||
Incyte Corp. Ltd.* | 5,470 | 475,726 | ||||||||||
Seattle Genetics, Inc.* | 10,960 | 566,632 | ||||||||||
Vertex Pharmaceuticals, Inc.* | 56,820 | 4,310,365 | ||||||||||
|
| |||||||||||
| 7,033,591 | ||||||||||||
|
| |||||||||||
Health Care Equipment & Supplies - 4.5% | ||||||||||||
The Cooper Companies, Inc. | 44,720 | 7,872,509 | ||||||||||
Essilor International S.A. (France)1 | 3,920 | 440,506 | ||||||||||
Intuitive Surgical, Inc.* | 19,550 | 13,139,164 | ||||||||||
Medtronic plc | 144,080 | 11,817,442 | ||||||||||
|
| |||||||||||
| 33,269,621 | ||||||||||||
|
| |||||||||||
Health Care Providers & Services - 3.8% | ||||||||||||
Acadia Healthcare Co., Inc.* | 17,900 | 643,684 | ||||||||||
Brookdale Senior Living, Inc.* | 2,450 | 35,354 | ||||||||||
DaVita, Inc.* | 111,420 | 6,531,440 | ||||||||||
Express Scripts Holding Co.* | 182,640 | 12,309,936 | ||||||||||
Fresenius Medical Care AG & Co. KGaA (Germany)1 | 86,518 | 7,047,282 | ||||||||||
Fresenius Medical Care AG & Co. KGaA - ADR (Germany) | 15,410 | 625,338 | ||||||||||
KPJ Healthcare Berhad (Malaysia)1 | 258,230 | 258,538 | ||||||||||
Odontoprev S.A. (Brazil) | 62,060 | 233,308 | ||||||||||
Siloam International Hospitals Tbk PT (Indonesia)*1 | 390,700 | 310,662 | ||||||||||
|
| |||||||||||
| 27,995,542 | ||||||||||||
|
| |||||||||||
Health Care Technology - 2.3% | ||||||||||||
Cerner Corp.* | 294,620 | 17,258,840 | ||||||||||
|
| |||||||||||
Life Sciences Tools & Services - 2.1% | ||||||||||||
QIAGEN N.V.* | 329,330 | 8,029,065 | ||||||||||
QIAGEN N.V.*1 | 5,360 | 131,093 | ||||||||||
Thermo Fisher Scientific, Inc. | 52,170 | 7,670,555 | ||||||||||
|
| |||||||||||
| 15,830,713 | ||||||||||||
|
| |||||||||||
Pharmaceuticals - 5.0% | ||||||||||||
AstraZeneca plc - ADR (United Kingdom) | 20,520 | 581,126 | ||||||||||
Bristol-Myers Squibb Co. | 72,520 | 3,691,993 | ||||||||||
Genomma Lab Internacional S.A.B. de C.V. - Class B (Mexico)* | 148,780 | 178,527 | ||||||||||
GlaxoSmithKline plc (United Kingdom)1 | 10,705 | 211,471 | ||||||||||
Johnson & Johnson | 98,520 | 11,427,335 | ||||||||||
Novartis AG - ADR (Switzerland) | 107,770 | 7,653,825 | ||||||||||
Perrigo Co. plc | 161,950 | 13,472,620 | ||||||||||
|
| |||||||||||
| 37,216,897 | ||||||||||||
|
| |||||||||||
Total Health Care. | 138,605,204 | |||||||||||
|
| |||||||||||
Industrials - 5.1% | ||||||||||||
Aerospace & Defense - 1.0% | ||||||||||||
Korea Aerospace Industries Ltd. (South Korea)1 | 7,778 | 439,309 | ||||||||||
LIG Nex1 Co. Ltd. (South Korea)1 | 5,780 | 373,144 | ||||||||||
Safran S.A. (France)1 | 94,770 | 6,521,282 | ||||||||||
|
| |||||||||||
| 7,333,735 | ||||||||||||
|
| |||||||||||
Airlines - 0.1% | ||||||||||||
easyJet plc (United Kingdom)1 | 22,010 | 252,402 | ||||||||||
Ryanair Holdings plc - ADR (Ireland)* | 11,140 | 836,503 | ||||||||||
|
| |||||||||||
| 1,088,905 | ||||||||||||
|
| |||||||||||
The accompanying notes are an integral part of the financial statements.
87
Investment Portfolio - October 31, 2016
| PRO-BLEND® MAXIMUM TERM SERIES | SHARES | VALUE (NOTE 2) | ||||||||||
COMMON STOCKS (continued) | ||||||||||||
Industrials (continued) | ||||||||||||
Building Products - 0.6% | ||||||||||||
Masco Corp. | 154,920 | $ | 4,783,930 | |||||||||
|
| |||||||||||
Commercial Services & Supplies - 0.0%## | ||||||||||||
China Everbright International Ltd. (China)1 | 159,000 | 190,074 | ||||||||||
KEPCO Plant Service & Engineering Co. Ltd. (South Korea)1 | 2,920 | 139,980 | ||||||||||
|
| |||||||||||
| 330,054 | ||||||||||||
|
| |||||||||||
Industrial Conglomerates - 0.2% | ||||||||||||
Siemens AG (Germany)1 | 11,230 | 1,275,930 | ||||||||||
|
| |||||||||||
Machinery - 1.8% | ||||||||||||
Alstom S.A. (France)*1 | 19,050 | 511,908 | ||||||||||
ANDRITZ AG (Austria)1 | 11,040 | 577,233 | ||||||||||
FANUC Corp. (Japan)1 | 2,491 | 456,071 | ||||||||||
Flowserve Corp. | 227,480 | 9,633,778 | ||||||||||
GEA Group AG (Germany)1 | 26,140 | 1,012,456 | ||||||||||
SMC Corp. (Japan)1 | 2,700 | 782,663 | ||||||||||
Sulzer AG (Switzerland)1 | 1,680 | 165,448 | ||||||||||
The Weir Group plc (United Kingdom)1 | 5,550 | 115,289 | ||||||||||
|
| |||||||||||
| 13,254,846 | ||||||||||||
|
| |||||||||||
Professional Services - 1.1% | ||||||||||||
Applus Services S.A. (Spain)1 | 41,180 | 395,121 | ||||||||||
Bureau Veritas S.A. (France)1 | 17,140 | 323,727 | ||||||||||
Nielsen Holdings plc | 159,890 | 7,198,248 | ||||||||||
|
| |||||||||||
| 7,917,096 | ||||||||||||
|
| |||||||||||
Road & Rail - 0.2% | ||||||||||||
Genesee & Wyoming, Inc. - Class A* | 13,040 | 885,938 | ||||||||||
Kansas City Southern | 9,650 | 846,884 | ||||||||||
|
| |||||||||||
| 1,732,822 | ||||||||||||
|
| |||||||||||
Trading Companies & Distributors - 0.1% | ||||||||||||
Brenntag AG (Germany)1 | 6,762 | 361,499 | ||||||||||
Howden Joinery Group plc (United Kingdom)1 | 11,520 | 52,752 | ||||||||||
|
| |||||||||||
| 414,251 | ||||||||||||
|
| |||||||||||
Transportation Infrastructure - 0.0%## | ||||||||||||
Aena S.A. (Spain)1,2 | 850 | 124,556 | ||||||||||
|
| |||||||||||
Total Industrials | 38,256,125 | |||||||||||
|
| |||||||||||
Information Technology - 23.1% | ||||||||||||
Electronic Equipment, Instruments & Components - 1.4% | ||||||||||||
FLIR Systems, Inc. | 273,870 | 9,015,800 | ||||||||||
Hitachi Ltd. (Japan)1 | 175,000 | 932,907 | ||||||||||
Keyence Corp. (Japan)1 | 1,246 | 913,432 | ||||||||||
|
| |||||||||||
| 10,862,139 | ||||||||||||
|
| |||||||||||
Internet Software & Services - 6.4% | ||||||||||||
Alibaba Group Holding Ltd. - ADR (China)* | 8,490 | 863,348 | ||||||||||
Alphabet, Inc. - Class A* | 10,500 | 8,503,950 | ||||||||||
Alphabet, Inc. - Class C* | 11,320 | 8,880,993 | ||||||||||
Baidu, Inc. - ADR (China)* | 3,670 | 649,076 | ||||||||||
Benefitfocus, Inc.* | 15,600 | 507,000 | ||||||||||
Facebook, Inc. - Class A* | 137,000 | 17,945,630 | ||||||||||
Just Eat plc (United Kingdom)*1 | 9,410 | 64,641 | ||||||||||
Match Group, Inc.* | 37,850 | 683,571 | ||||||||||
MercadoLibre, Inc. (Argentina) | 4,260 | 715,723 | ||||||||||
MiX Telematics Ltd. - ADR (South Africa) | 33,310 | 209,520 | ||||||||||
Q2 Holdings, Inc.* | 23,850 | 670,185 | ||||||||||
Tencent Holdings Ltd. - Class H (China)1 | 293,300 | 7,773,135 | ||||||||||
|
| |||||||||||
| 47,466,772 | ||||||||||||
|
| |||||||||||
IT Services - 5.6% | ||||||||||||
Amdocs Ltd. - ADR | 135,785 | 7,936,633 | ||||||||||
FleetCor Technologies, Inc.* | 3,490 | 611,797 | ||||||||||
InterXion Holding N.V. - ADR (Netherlands)* | 3,320 | 123,604 | ||||||||||
MasterCard, Inc. - Class A | 157,940 | 16,902,739 | ||||||||||
PayPal Holdings, Inc.* | 195,510 | 8,144,947 | ||||||||||
Visa, Inc. - Class A | 98,980 | 8,166,840 | ||||||||||
|
| |||||||||||
| 41,886,560 | ||||||||||||
|
| |||||||||||
Semiconductors & Semiconductor Equipment - 3.3% | ||||||||||||
QUALCOMM, Inc. | 167,530 | 11,512,662 | ||||||||||
Skyworks Solutions, Inc. | 166,390 | 12,802,047 | ||||||||||
|
| |||||||||||
| 24,314,709 | ||||||||||||
|
| |||||||||||
Software - 3.9% | ||||||||||||
Electronic Arts, Inc.* | 85,360 | 6,702,467 | ||||||||||
Microsoft Corp. | 142,320 | 8,527,814 | ||||||||||
Paylocity Holding Corp.* | 14,590 | 634,519 | ||||||||||
SAP SE (Germany)1 | 3,770 | 332,136 | ||||||||||
ServiceNow, Inc.* | 134,660 | 11,837,961 | ||||||||||
TOTVS S.A. (Brazil) | 47,879 | 434,991 | ||||||||||
The Ultimate Software Group, Inc.* | 3,590 | 757,454 | ||||||||||
|
| |||||||||||
| 29,227,342 | ||||||||||||
|
| |||||||||||
Technology Hardware, Storage & Peripherals - 2.5% | ||||||||||||
Apple, Inc. | 154,150 | 17,502,191 | ||||||||||
Samsung Electronics Co. Ltd. (South Korea)1 | 890 | 1,272,992 | ||||||||||
|
| |||||||||||
| 18,775,183 | ||||||||||||
|
| |||||||||||
Total Information Technology | 172,532,705 | |||||||||||
|
| |||||||||||
The accompanying notes are an integral part of the financial statements.
88
Investment Portfolio - October 31, 2016
| PRO-BLEND® MAXIMUM TERM SERIES | SHARES | VALUE (NOTE 2) | ||||||||||
COMMON STOCKS (continued) | ||||||||||||
Materials - 4.7% | ||||||||||||
Chemicals - 3.4% | ||||||||||||
Akzo Nobel N.V. (Netherlands)1 | 2,810 | $ | 181,558 | |||||||||
Ashland Global Holdings, Inc. | 64,710 | 7,230,048 | ||||||||||
Givaudan S.A. (Switzerland)1 | 220 | 425,495 | ||||||||||
Monsanto Co. | 166,670 | 16,795,336 | ||||||||||
Sociedad Quimica y Minera de Chile S.A. - ADR (Chile) | 11,100 | 324,786 | ||||||||||
Solvay S.A. (Belgium)1 | 550 | 63,093 | ||||||||||
Symrise AG (Germany)1 | 3,490 | 239,678 | ||||||||||
|
| |||||||||||
| 25,259,994 | ||||||||||||
|
| |||||||||||
Metals & Mining - 1.3% | ||||||||||||
Alumina Ltd. (Australia)1 | 94,794 | 113,931 | ||||||||||
Arconic, Inc. | 341,836 | 9,817,530 | ||||||||||
Norsk Hydro ASA (Norway)1 | 31,093 | 139,009 | ||||||||||
|
| |||||||||||
| 10,070,470 | ||||||||||||
|
| |||||||||||
Total Materials. | 35,330,464 | |||||||||||
|
| |||||||||||
Real Estate - 2.9% | ||||||||||||
Equity Real Estate Investment Trusts (REITS) - 2.4% | ||||||||||||
Agree Realty Corp. | 3,500 | 169,225 | ||||||||||
Alexandria Real Estate Equities, Inc. | 1,530 | 164,949 | ||||||||||
alstria office REIT AG (Germany)1 | 43,080 | 555,701 | ||||||||||
American Campus Communities, Inc. | 2,450 | 127,669 | ||||||||||
American Homes 4 Rent - Class A | 6,370 | 134,471 | ||||||||||
Apartment Investment & Management Co. - Class A | 3,590 | 158,211 | ||||||||||
AvalonBay Communities, Inc. | 1,240 | 212,263 | ||||||||||
Axiare Patrimonio SOCIMI S.A. (Spain)1 | 3,070 | 43,616 | ||||||||||
Boston Properties, Inc. | 840 | 101,203 | ||||||||||
Brandywine Realty Trust | 7,350 | 113,925 | ||||||||||
Brixmor Property Group, Inc. | 3,140 | 79,819 | ||||||||||
CatchMark Timber Trust, Inc. - Class A | 7,350 | 77,469 | ||||||||||
Chesapeake Lodging Trust | 5,690 | 123,530 | ||||||||||
Colony Starwood Homes | 4,050 | 117,490 | ||||||||||
Columbia Property Trust, Inc. | 3,160 | 66,613 | ||||||||||
Community Healthcare Trust, Inc. | 8,660 | 193,811 | ||||||||||
CoreSite Realty Corp. | 690 | 50,881 | ||||||||||
Crown Castle International Corp. | 830 | 75,522 | ||||||||||
CubeSmart | 6,950 | 181,186 | ||||||||||
DDR Corp. | 8,660 | 132,411 | ||||||||||
Digital Realty Trust, Inc. | 1,360 | 127,065 | ||||||||||
Douglas Emmett, Inc. | 4,120 | 150,380 | ||||||||||
Education Realty Trust, Inc. | 2,606 | 110,990 | ||||||||||
Equinix, Inc. | 540 | 192,931 | ||||||||||
Equity LifeStyle Properties, Inc. | 1,210 | 91,766 | ||||||||||
Equity One, Inc. | 4,460 | 127,110 | ||||||||||
Equity Residential | 3,080 | 190,190 | ||||||||||
Extra Space Storage, Inc. | 1,230 | 89,974 | ||||||||||
Fibra Shop Portafolios Inmobiliarios S.A.P.I. de C.V. (Mexico) | 52,406 | 44,363 | ||||||||||
Forest City Realty Trust, Inc. - Class A | 8,390 | 181,140 | ||||||||||
General Growth Properties, Inc. | 4,660 | 116,267 | ||||||||||
Global Medical REIT, Inc. | 5,980 | 58,305 | ||||||||||
Healthcare Trust of America, Inc. - Class A | 3,250 | 99,450 | ||||||||||
Host Hotels & Resorts, Inc. | 4,330 | 67,028 | ||||||||||
Klepierre (France)1 | 2,800 | 114,430 | ||||||||||
Lamar Advertising Co. - Class A | 1,900 | 120,555 | ||||||||||
LaSalle Hotel Properties | 2,720 | 64,600 | ||||||||||
Life Storage, Inc. | 1,660 | 133,879 | ||||||||||
Mid-America Apartment Communities, Inc. | 1,190 | 110,372 | ||||||||||
NorthStar Realty Finance Corp. | 7,480 | 108,610 | ||||||||||
Outfront Media, Inc. | 6,230 | 134,007 | ||||||||||
Pennsylvania Real Estate Investment Trust | 6,330 | 123,498 | ||||||||||
Physicians Realty Trust | 9,720 | 192,164 | ||||||||||
Potlatch Corp. | 3,270 | 125,568 | ||||||||||
Prologis, Inc. | 5,310 | 276,970 | ||||||||||
Public Storage | 620 | 132,506 | ||||||||||
Retail Properties of America, Inc. - Class A | 4,820 | 75,047 | ||||||||||
Rexford Industrial Realty, Inc. | 7,360 | 155,002 | ||||||||||
Senior Housing Properties Trust | 3,540 | 75,296 | ||||||||||
Simon Property Group, Inc. | 2,230 | 414,691 | ||||||||||
Spirit Realty Capital, Inc. | 10,220 | 121,720 | ||||||||||
STORE Capital Corp. | 5,070 | 138,360 | ||||||||||
Sun Communities, Inc. | 1,080 | 83,084 | ||||||||||
Tanger Factory Outlet Centers, Inc. | 3,380 | 117,624 | ||||||||||
Taubman Centers, Inc. | 1,370 | 99,270 | ||||||||||
Terreno Realty Corp. | 5,650 | 147,465 | ||||||||||
UDR, Inc. | 2,100 | 73,437 | ||||||||||
Urban Edge Properties | 4,260 | 109,951 | ||||||||||
Ventas, Inc. | 2,010 | 136,178 | ||||||||||
Vornado Realty Trust | 1,010 | 93,708 | ||||||||||
Welltower, Inc. | 1,820 | 124,725 | ||||||||||
Weyerhaeuser Co. | 330,362 | 9,887,735 | ||||||||||
|
| |||||||||||
| 18,017,376 | ||||||||||||
|
| |||||||||||
Real Estate Management & Development - 0.5% | ||||||||||||
CBRE Group, Inc. - Class A* | 1,710 | 44,050 | ||||||||||
First Capital Realty, Inc. (Canada) | 3,480 | 55,496 | ||||||||||
Realogy Holdings Corp. | 144,010 | 3,296,389 | ||||||||||
|
| |||||||||||
| 3,395,935 | ||||||||||||
|
| |||||||||||
Total Real Estate | 21,413,311 | |||||||||||
|
| |||||||||||
The accompanying notes are an integral part of the financial statements.
89
Investment Portfolio - October 31, 2016
| PRO-BLEND® MAXIMUM TERM SERIES | SHARES/ PRINCIPAL AMOUNT3 | VALUE (NOTE 2) | ||||||||||
COMMON STOCKS (continued) | ||||||||||||
Telecommunication Services - 2.1% | ||||||||||||
Diversified Telecommunication Services - 2.0% | ||||||||||||
Level 3 Communications, Inc.* | 107,800 | $ | 6,052,970 | |||||||||
SBA Communications Corp. - Class A* | 6,260 | 709,133 | ||||||||||
Telefonica S.A. - ADR (Spain) | 63,493 | 643,819 | ||||||||||
Zayo Group Holdings, Inc.* | 220,920 | 7,109,206 | ||||||||||
|
| |||||||||||
| 14,515,128 | ||||||||||||
|
| |||||||||||
Wireless Telecommunication Services - 0.1% | ||||||||||||
America Movil S.A.B. de C.V. - Class L - ADR (Mexico) | 51,290 | 673,951 | ||||||||||
China Mobile Ltd. - Class H (China)1 | 21,000 | 240,584 | ||||||||||
|
| |||||||||||
| 914,535 | ||||||||||||
|
| |||||||||||
Total Telecommunication Services | 15,429,663 | |||||||||||
|
| |||||||||||
Utilities - 0.0%## | ||||||||||||
Water Utilities - 0.0%## | ||||||||||||
CT Environmental Group Ltd. (China)1 | 598,000 | 167,769 | ||||||||||
|
| |||||||||||
TOTAL COMMON STOCKS | 666,723,156 | |||||||||||
|
| |||||||||||
CORPORATE BONDS - 3.9% | ||||||||||||
Non-Convertible Corporate Bonds - 3.9% | ||||||||||||
Consumer Discretionary - 0.3% | ||||||||||||
Auto Components - 0.1% | ||||||||||||
Dana Financing Luxembourg S.A.R.L.2, 6.50%, 6/1/2026 | 50,000 | 53,187 | ||||||||||
Magna International, Inc. (Canada), 4.15%, 10/1/2025 | 565,000 | 612,249 | ||||||||||
|
| |||||||||||
| 665,436 | ||||||||||||
|
| |||||||||||
Household Durables - 0.1% | ||||||||||||
Brookfield Residential Properties, Inc. - Brookfield Residential US Corp. (Canada)2, 6.125%, 7/1/2022 | 200,000 | 203,000 | ||||||||||
Lennar Corp., 12.25%, 6/1/2017 | 165,000 | 174,281 | ||||||||||
Meritage Homes Corp., 7.15%, 4/15/2020 | 50,000 | 55,500 | ||||||||||
Meritage Homes Corp., 7.00%, 4/1/2022 | 90,000 | 100,440 | ||||||||||
TRI Pointe Group, Inc. - TRI Pointe Homes, Inc., 4.375%, 6/15/2019 | 95,000 | 97,138 | ||||||||||
Weekley Homes LLC - Weekley Finance Corp., 6.00%, 2/1/2023 | 110,000 | 100,100 | ||||||||||
|
| |||||||||||
| 730,459 | ||||||||||||
|
| |||||||||||
Media - 0.1% | ||||||||||||
Comcast Corp., 3.20%, 7/15/2036 | 300,000 | 285,815 | ||||||||||
Sirius XM Radio, Inc.2, 5.375%, 4/15/2025 | 150,000 | 152,985 | ||||||||||
VTR Finance B.V. (Chile)2, 6.875%, 1/15/2024 | 200,000 | 209,250 | ||||||||||
|
| |||||||||||
| 648,050 | ||||||||||||
|
| |||||||||||
Multiline Retail - 0.0%## | ||||||||||||
Dollar General Corp., 3.25%, 4/15/2023 | 300,000 | 306,702 | ||||||||||
|
| |||||||||||
Total Consumer Discretionary | 2,350,647 | |||||||||||
|
| |||||||||||
Consumer Staples - 0.3% | ||||||||||||
Beverages - 0.1% | ||||||||||||
Anheuser-Busch InBev Worldwide, Inc. (Belgium), 7.75%, 1/15/2019 | 375,000 | 423,938 | ||||||||||
Anheuser-Busch InBev Worldwide, Inc. (Belgium), 8.20%, 1/15/2039 | 200,000 | 316,053 | ||||||||||
PepsiCo, Inc., 3.10%, 7/17/2022 | 150,000 | 158,293 | ||||||||||
|
| |||||||||||
| 898,284 | ||||||||||||
|
| |||||||||||
Food & Staples Retailing - 0.1% | ||||||||||||
C&S Group Enterprises LLC2, 5.375%, 7/15/2022 | 210,000 | 203,700 | ||||||||||
CVS Health Corp., 3.50%, 7/20/2022 | 400,000 | 422,621 | ||||||||||
The Kroger Co., 2.60%, 2/1/2021 | 300,000 | 305,773 | ||||||||||
|
| |||||||||||
| 932,094 | ||||||||||||
|
| |||||||||||
Food Products - 0.1% | ||||||||||||
Pinnacle Operating Corp.2, 9.00%, 11/15/2020 | 425,000 | 263,500 | ||||||||||
|
| |||||||||||
Household Products - 0.0%## | ||||||||||||
HRG Group, Inc., 7.75%, 1/15/2022 | 95,000 | 99,038 | ||||||||||
|
| |||||||||||
Total Consumer Staples | 2,192,916 | |||||||||||
|
| |||||||||||
Energy - 0.6% | ||||||||||||
Energy Equipment & Services - 0.2% | ||||||||||||
Ensco plc, 5.20%, 3/15/2025 | 400,000 | 325,376 | ||||||||||
McDermott International, Inc.2, 8.00%, 5/1/2021 | 175,000 | 169,750 | ||||||||||
Schlumberger Holdings Corp.2, 3.625%, 12/21/2022 | 540,000 | 577,218 | ||||||||||
|
| |||||||||||
| 1,072,344 | ||||||||||||
|
| |||||||||||
Oil, Gas & Consumable Fuels - 0.4% | ||||||||||||
BP Capital Markets plc (United Kingdom), 3.535%, 11/4/2024 | 600,000 | 627,671 | ||||||||||
Cheniere Corpus Christi Holdings, LLC2, 7.00%, 6/30/2024 | 170,000 | 180,200 | ||||||||||
Chevron Corp., 1.79%, 11/16/2018 | 300,000 | 302,558 | ||||||||||
Columbia Pipeline Group, Inc., 4.50%, 6/1/2025 | 180,000 | 194,496 | ||||||||||
Crestwood Midstream Partners LP - Crestwood Midstream Finance Corp., 6.125%, 3/1/2022 | 90,000 | 92,025 | ||||||||||
Enviva Partners LP - Enviva Partners Finance Corp.2, 8.50%, 11/1/2021 | 145,000 | 148,263 | ||||||||||
Hilcorp Energy I LP - Hilcorp Finance Co.2, 5.75%, 10/1/2025 | 75,000 | 75,188 | ||||||||||
The accompanying notes are an integral part of the financial statements.
90
Investment Portfolio - October 31, 2016
| PRO-BLEND® MAXIMUM TERM SERIES | PRINCIPAL AMOUNT3 | VALUE (NOTE 2) | ||||||||||
CORPORATE BONDS (continued) | ||||||||||||
Non-Convertible Corporate Bonds (continued) | ||||||||||||
Energy (continued) | ||||||||||||
Oil, Gas & Consumable Fuels (continued) | ||||||||||||
Kinder Morgan Energy Partners LP, 4.30%, 5/1/2024 | 600,000 | $ | 620,228 | |||||||||
NGL Energy Partners LP - NGL Energy Finance Corp.2, 7.50%, 11/1/2023 | 95,000 | 95,238 | ||||||||||
Oasis Petroleum, Inc., 6.875%, 1/15/2023 | 25,000 | 24,500 | ||||||||||
PBF Holding Co. LLC - PBF Finance Corp.2, 7.00%, 11/15/2023 | 105,000 | 97,125 | ||||||||||
Petroleos Mexicanos (Mexico), 4.50%, 1/23/2026 | 300,000 | 289,800 | ||||||||||
Sabine Pass Liquefaction LLC, 5.625%, 2/1/2021 | 140,000 | 147,350 | ||||||||||
Tallgrass Energy Partners LP - Tallgrass Energy Finance Corp.2, 5.50%, 9/15/2024 | 140,000 | 139,300 | ||||||||||
|
| |||||||||||
| 3,033,942 | ||||||||||||
|
| |||||||||||
Total Energy | 4,106,286 | |||||||||||
|
| |||||||||||
Financials - 1.2% | ||||||||||||
Banks - 0.5% | ||||||||||||
Bank of America Corp., 4.00%, 1/22/2025 | 400,000 | 411,277 | ||||||||||
Barclays Bank plc (United Kingdom)2, 10.179%, 6/12/2021 | 200,000 | 252,887 | ||||||||||
Citigroup, Inc., 3.875%, 3/26/2025 | 600,000 | 613,654 | ||||||||||
Intesa Sanpaolo S.p.A. (Italy), 3.875%, 1/15/2019 | 390,000 | 401,251 | ||||||||||
Intesa Sanpaolo S.p.A. (Italy)2, 6.50%, 2/24/2021 | 300,000 | 336,568 | ||||||||||
JPMorgan Chase & Co., 4.95%, 3/25/2020 | 500,000 | 547,356 | ||||||||||
Lloyds Bank plc (United Kingdom)2,4,5, 12.00%, | 110,000 | 149,600 | ||||||||||
Lloyds Banking Group plc (United Kingdom)2, 4.582%, 12/10/2025 | 591,000 | 600,552 | ||||||||||
Popular, Inc., 7.00%, 7/1/2019 | 215,000 | 222,794 | ||||||||||
Santander Bank N.A., 8.75%, 5/30/2018 | 200,000 | 217,743 | ||||||||||
|
| |||||||||||
| 3,753,682 | ||||||||||||
|
| |||||||||||
Capital Markets - 0.3% | ||||||||||||
The Goldman Sachs Group, Inc.6, 2.429%, 11/29/2023 | 580,000 | 588,612 | ||||||||||
The Goldman Sachs Group, Inc., 4.25%, 10/21/2025 | 300,000 | 313,882 | ||||||||||
Morgan Stanley, 2.125%, 4/25/2018 | 490,000 | 493,582 | ||||||||||
Morgan Stanley, 5.00%, 11/24/2025 | 400,000 | 442,443 | ||||||||||
|
| |||||||||||
| 1,838,519 | ||||||||||||
|
| |||||||||||
Consumer Finance - 0.0%## | ||||||||||||
Navient Corp., 6.125%, 3/25/2024 | 345,000 | 315,675 | ||||||||||
|
| |||||||||||
Diversified Financial Services - 0.1% | ||||||||||||
Horizon Pharma, Inc., 6.625%, 5/1/2023 | 180,000 | 169,875 | ||||||||||
Jefferies Finance LLC - JFIN Co-Issuer Corp.2, 7.375%, 4/1/2020 | 160,000 | 158,800 | ||||||||||
|
| |||||||||||
| 328,675 | ||||||||||||
|
| |||||||||||
Insurance - 0.2% | ||||||||||||
American International Group, Inc., 4.125%, 2/15/2024 | 400,000 | 429,988 | ||||||||||
Assured Guaranty US Holdings, Inc., 5.00%, 7/1/2024 | 950,000 | 1,053,960 | ||||||||||
Prudential Financial, Inc.7, 5.875%, 9/15/2042 | 300,000 | 328,500 | ||||||||||
|
| |||||||||||
| 1,812,448 | ||||||||||||
|
| |||||||||||
Thrifts & Mortgage Finance - 0.1% | ||||||||||||
Ladder Capital Finance Holdings LLLP - Ladder Capital Finance Corp., 7.375%, 10/1/2017 | 425,000 | 430,844 | ||||||||||
Ladder Capital Finance Holdings LLLP - Ladder Capital Finance Corp.2, 5.875%, 8/1/2021 | 210,000 | 199,500 | ||||||||||
|
| |||||||||||
| 630,344 | ||||||||||||
|
| |||||||||||
Total Financials | 8,679,343 | |||||||||||
|
| |||||||||||
Health Care - 0.1% | ||||||||||||
Biotechnology - 0.1% | ||||||||||||
AbbVie, Inc., 1.80%, 5/14/2018 | 300,000 | 300,944 | ||||||||||
AMAG Pharmaceuticals, Inc.2, 7.875%, 9/1/2023 | 210,000 | 196,875 | ||||||||||
|
| |||||||||||
| 497,819 | ||||||||||||
|
| |||||||||||
Health Care Providers & Services - 0.0%## | ||||||||||||
HCA, Inc., 7.50%, 2/15/2022 | 120,000 | 136,560 | ||||||||||
LifePoint Health, Inc.2, 5.375%, 5/1/2024 | 90,000 | 89,442 | ||||||||||
Tenet Healthcare Corp., 8.125%, 4/1/2022 | 120,000 | 117,300 | ||||||||||
|
| |||||||||||
| 343,302 | ||||||||||||
|
| |||||||||||
Pharmaceuticals - 0.0%## | ||||||||||||
Concordia International Corp. (Canada)2, 7.00%, 4/15/2023 | 185,000 | 106,375 | ||||||||||
Mallinckrodt International Finance S.A. - Mallinckrodt CB LLC2, 5.625%, 10/15/2023 | 150,000 | 141,000 | ||||||||||
|
| |||||||||||
| 247,375 | ||||||||||||
|
| |||||||||||
Total Health Care | 1,088,496 | |||||||||||
|
| |||||||||||
Industrials - 0.4% | ||||||||||||
Aerospace & Defense - 0.0%## | ||||||||||||
DigitalGlobe, Inc.2, 5.25%, 2/1/2021 | 165,000 | 166,238 | ||||||||||
|
| |||||||||||
The accompanying notes are an integral part of the financial statements.
91
Investment Portfolio - October 31, 2016
| PRO-BLEND® MAXIMUM TERM SERIES | PRINCIPAL AMOUNT3 | VALUE (NOTE 2) | ||||||||||
CORPORATE BONDS (continued) | ||||||||||||
Non-Convertible Corporate Bonds (continued) | ||||||||||||
Industrials (continued) | ||||||||||||
Airlines - 0.0%## | ||||||||||||
Allegiant Travel Co., 5.50%, 7/15/2019 | 145,000 | $ | 150,619 | |||||||||
|
| |||||||||||
Commercial Services & Supplies - 0.0%## | ||||||||||||
Constellis Holdings LLC - Constellis | ||||||||||||
Finance Corp.2, 9.75%, 5/15/2020 | 105,000 | 106,575 | ||||||||||
Herc Rentals, Inc.2, 7.50%, 6/1/2022 | 95,000 | 95,000 | ||||||||||
|
| |||||||||||
| 201,575 | ||||||||||||
|
| |||||||||||
Construction & Engineering - 0.0%## | ||||||||||||
Fluor Corp., 3.50%, 12/15/2024 | 300,000 | 316,298 | ||||||||||
|
| |||||||||||
Industrial Conglomerates - 0.1% | ||||||||||||
Siemens Financieringsmaatschappij N.V. (Germany)2, 2.90%, 5/27/2022 | 600,000 | 623,114 | ||||||||||
|
| |||||||||||
Machinery - 0.1% | ||||||||||||
Case New Holland Industrial, Inc. (United Kingdom), 7.875%, 12/1/2017 | 81,000 | 85,759 | ||||||||||
CNH Industrial N.V. (United Kingdom), 4.50%, 8/15/2023 | 105,000 | 105,525 | ||||||||||
Shape Technologies Group, Inc.2, 7.625%, 2/1/2020 | 100,000 | 101,500 | ||||||||||
Xerium Technologies, Inc.2, 9.50%, 8/15/2021 | 95,000 | 96,425 | ||||||||||
|
| |||||||||||
| 389,209 | ||||||||||||
|
| |||||||||||
Trading Companies & Distributors - 0.2% | ||||||||||||
Air Lease Corp., 3.375%, 6/1/2021 | 530,000 | 545,315 | ||||||||||
Aircastle Ltd., 5.50%, 2/15/2022 | 90,000 | 96,525 | ||||||||||
Fly Leasing Ltd. (Ireland), 6.375%, 10/15/2021 | 320,000 | 327,200 | ||||||||||
International Lease Finance Corp., 6.25%, 5/15/2019 | 90,000 | 97,311 | ||||||||||
|
| |||||||||||
| 1,066,351 | ||||||||||||
|
| |||||||||||
Total Industrials | 2,913,404 | |||||||||||
|
| |||||||||||
Information Technology - 0.3% | ||||||||||||
Internet Software & Services - 0.0%## eBay, Inc., 2.50%, 3/9/2018 | 400,000 | 404,957 | ||||||||||
VeriSign, Inc., 5.25%, 4/1/2025 | 75,000 | 79,125 | ||||||||||
|
| |||||||||||
| 484,082 | ||||||||||||
|
| |||||||||||
IT Services - 0.1% | ||||||||||||
Automatic Data Processing, Inc., 2.25%, 9/15/2020 | 300,000 | 307,637 | ||||||||||
Visa, Inc., 2.80%, 12/14/2022 | 400,000 | 415,970 | ||||||||||
|
| |||||||||||
| 723,607 | ||||||||||||
|
| |||||||||||
Semiconductors & Semiconductor Equipment - 0.1% | ||||||||||||
Intel Corp., 2.45%, 7/29/2020 | 300,000 | 309,101 | ||||||||||
QUALCOMM, Inc., 3.00%, 5/20/2022 | 300,000 | 312,688 | ||||||||||
|
| |||||||||||
| 621,789 | ||||||||||||
|
| |||||||||||
Technology Hardware, Storage & Peripherals - 0.1% | ||||||||||||
Diebold, Inc.2, 8.50%, 4/15/2024 | 145,000 | 153,664 | ||||||||||
Hewlett Packard Enterprise Co.2, 2.70%, 10/5/2017 | 300,000 | 303,799 | ||||||||||
Western Digital Corp.2, 10.50%, 4/1/2024 | 90,000 | 103,950 | ||||||||||
|
| |||||||||||
| 561,413 | ||||||||||||
|
| |||||||||||
Total Information Technology | 2,390,891 | |||||||||||
|
| |||||||||||
Materials - 0.2% | ||||||||||||
Chemicals - 0.1% | ||||||||||||
Consolidated Energy Finance S.A. (Trinidad-Tobago)2, 6.75%, 10/15/2019 | 95,000 | 95,000 | ||||||||||
The Dow Chemical Co., 8.55%, 5/15/2019 | 300,000 | 349,557 | ||||||||||
|
| |||||||||||
| 444,557 | ||||||||||||
|
| |||||||||||
Metals & Mining - 0.1% | ||||||||||||
Arconic, Inc., 5.87%, 2/23/2022 | 215,000 | 229,878 | ||||||||||
BHP Billiton Finance USA Ltd. (Australia), 3.85%, 9/30/2023 | 300,000 | 325,455 | ||||||||||
Kinross Gold Corp. (Canada), 5.125%, 9/1/2021 | 40,000 | 41,600 | ||||||||||
SunCoke Energy Partners LP - SunCoke Energy Partners Finance Corp.2, 7.375%, 2/1/2020 | 150,000 | 144,375 | ||||||||||
Techniplas LLC2, 10.00%, 5/1/2020 | 125,000 | 105,937 | ||||||||||
|
| |||||||||||
| 847,245 | ||||||||||||
|
| |||||||||||
Total Materials. | 1,291,802 | |||||||||||
|
| |||||||||||
Real Estate - 0.2% | ||||||||||||
Equity Real Estate Investment Trusts (REITS) - 0.2% | ||||||||||||
American Tower Corp., 3.30%, 2/15/2021 | 600,000 | 623,222 | ||||||||||
Crown Castle Towers LLC2, 6.113%, 1/15/2020 | 200,000 | 220,659 | ||||||||||
Crown Castle Towers LLC2, 3.222%, 5/15/2022 | 100,000 | 103,315 | ||||||||||
Greystar Real Estate Partners LLC2, 8.25%, 12/1/2022 | 140,000 | 152,250 | ||||||||||
MPT Operating Partnership LP - MPT Finance Corp., 5.25%, 8/1/2026 | 95,000 | 96,900 | ||||||||||
Sixsigma Networks Mexico S.A. de C.V. (Mexico)2, 8.25%, 11/7/2021 | 210,000 | 205,275 | ||||||||||
|
| |||||||||||
| 1,401,621 | ||||||||||||
|
| |||||||||||
Real Estate Management & Development - 0.0%## | ||||||||||||
Forestar USA Real Estate Group, Inc.2, 8.50%, 6/1/2022 | 205,000 | 211,791 | ||||||||||
Rialto Holdings LLC - Rialto Corp.2, 7.00%, 12/1/2018 | 145,000 | 146,812 | ||||||||||
|
| |||||||||||
| 358,603 | ||||||||||||
|
| |||||||||||
The accompanying notes are an integral part of the financial statements.
92
Investment Portfolio - October 31, 2016
| PRO-BLEND® MAXIMUM TERM SERIES | PRINCIPAL AMOUNT 3/ SHARES | VALUE (NOTE 2) | ||||||||||
CORPORATE BONDS (continued) | ||||||||||||
Non-Convertible Corporate Bonds (continued) | ||||||||||||
Real Estate (continued) | ||||||||||||
Real Estate Management & Development (continued) | ||||||||||||
Total Real Estate | $ | 1,760,224 | ||||||||||
|
| |||||||||||
Telecommunication Services - 0.3% | ||||||||||||
Diversified Telecommunication Services - 0.3% | ||||||||||||
AT&T, Inc., 5.20%, 3/15/2020 | 500,000 | 550,742 | ||||||||||
CenturyLink, Inc., 7.50%, 4/1/2024 | 135,000 | 140,569 | ||||||||||
Frontier Communications Corp., 11.00%, 9/15/2025 | 230,000 | 235,497 | ||||||||||
Hughes Satellite Systems Corp.2, 6.625%, 8/1/2026 | 155,000 | 153,450 | ||||||||||
Inmarsat Finance plc (United Kingdom)2, 4.875%, 5/15/2022 | 255,000 | 240,490 | ||||||||||
Qualitytech LP - QTS Finance Corp., 5.875%, 8/1/2022 | 190,000 | 195,225 | ||||||||||
Verizon Communications, Inc., 4.15%, 3/15/2024 | 500,000 | 541,791 | ||||||||||
|
| |||||||||||
| 2,057,764 | ||||||||||||
|
| |||||||||||
Wireless Telecommunication Services - 0.0%## | ||||||||||||
Altice Financing S.A. (Luxembourg)2, 6.625%, 2/15/2023 | 235,000 | 242,050 | ||||||||||
|
| |||||||||||
Total Telecommunication Services | 2,299,814 | |||||||||||
|
| |||||||||||
Utilities - 0.0%## | ||||||||||||
Independent Power and Renewable Electricity Producers - 0.0%## | ||||||||||||
Atlantica Yield plc (Spain)2, 7.00%, 11/15/2019 | 215,000 | 218,762 | ||||||||||
Terraform Global Operating LLC2, 13.75%, 8/15/2022 | 145,000 | 150,800 | ||||||||||
|
| |||||||||||
Total Utilities | 369,562 | |||||||||||
|
| |||||||||||
TOTAL CORPORATE BONDS | 29,443,385 | |||||||||||
|
| |||||||||||
MUTUAL FUNDS - 0.1% | ||||||||||||
iShares MSCI India ETF | 6,650 | 193,116 | ||||||||||
iShares Russell Mid-Cap Growth ETF | 3,850 | 359,513 | ||||||||||
|
| |||||||||||
TOTAL MUTUAL FUNDS | 552,629 | |||||||||||
|
| |||||||||||
U.S. TREASURY SECURITIES - 4.3% | ||||||||||||
U.S. Treasury Bonds - 1.4% | ||||||||||||
U.S. Treasury Bond, 4.75%, 2/15/2037 | 4,100,000 | 5,746,244 | ||||||||||
U.S. Treasury Inflation Indexed Bond, 0.75%, 2/15/2042 | 4,460,833 | 4,488,678 | ||||||||||
|
| |||||||||||
Total U.S. Treasury Bonds | 10,234,922 | |||||||||||
|
| |||||||||||
U.S. Treasury Notes - 2.9% | ||||||||||||
U.S. Treasury Inflation Indexed Note, 0.125%, 4/15/2020 | 4,052,251 | 4,129,320 | ||||||||||
U.S. Treasury Inflation Indexed Note, 0.125%, 1/15/2023 | 4,121,667 | 4,180,718 | ||||||||||
U.S. Treasury Note, 0.75%, 4/15/2018 | 8,000,000 | 7,995,000 | ||||||||||
U.S. Treasury Note, 2.00%, 7/31/2022 | 5,500,000 | 5,656,624 | ||||||||||
|
| |||||||||||
Total U.S. Treasury Notes | 21,961,662 | |||||||||||
|
| |||||||||||
TOTAL U.S. TREASURY SECURITIES | 32,196,584 | |||||||||||
|
| |||||||||||
FOREIGN GOVERNMENT BONDS - 0.1% | ||||||||||||
Export-Import Bank of Korea (South Korea), 2.625%, 12/30/2020 (Identified Cost $799,157) | 800,000 | 818,955 | ||||||||||
|
| |||||||||||
U.S. GOVERNMENT AGENCIES - 1.1% | ||||||||||||
Other Agencies - 1.1% | ||||||||||||
Fannie Mae, 2.625%, 9/6/2024 (Identified Cost $8,587,336) | 8,000,000 | 8,436,392 | ||||||||||
|
| |||||||||||
SHORT-TERM INVESTMENT - 0.6% | ||||||||||||
Dreyfus Government Cash Management8, 0.28%, (Identified Cost $4,247,632) | 4,247,632 | 4,247,632 | ||||||||||
|
| |||||||||||
TOTAL INVESTMENTS - 99.5% (Identified Cost $705,096,059) | 742,418,733 | |||||||||||
OTHER ASSETS, LESS LIABILITIES - 0.5% | 3,560,528 | |||||||||||
|
| |||||||||||
NET ASSETS - 100% | $ | 745,979,261 | ||||||||||
|
| |||||||||||
ADR - American Depositary Receipt
ETF - Exchange-traded fund
##Less than 0.1%.
The accompanying notes are an integral part of the financial statements.
93
Investment Portfolio - October 31, 2016
*Non-income producing security.
1A factor from a third party vendor was applied to determine the security’s fair value following the close of local trading.
2Restricted securities - Investment in securities that are restricted as to public resale under the Securities Act of 1933, as amended. These securities have been sold under Rule 144A and have been determined to be liquid. These securities amount to $9,731,950 or 1.3%, of the Series’ net assets as of October 31, 2016 (see Note 2 to the financial statements).
3Amount is stated in USD unless otherwise noted.
4Security is perpetual in nature and has no stated maturity date.
5The rate shown is a fixed rate as of October 31, 2016; the rate becomes floating, based on LIBOR plus a spread, in December 2024.
6The coupon rate is floating and is the effective rate as of October 31, 2016.
7The rate shown is a fixed rate as of October 31, 2016; the rate becomes floating, based on LIBOR plus a spread, in September 2022.
8Rate shown is the current yield as of October 31, 2016.
The Global Industry Classification Standard (GICS) was developed by and is the exclusive property and a service mark of MSCI Inc. (MSCI) and Standard & Poor’s, a division of The McGraw-Hill Companies, Inc. (S&P), and is licensed for use by Manning & Napier when referencing GICS sectors. Neither MSCI, S&P, nor any third party involved in making or compiling the GICS or any GICS classifications makes any express or implied warranties or representations with respect to such standard or classification, nor shall any such party have any liability therefrom.
The accompanying notes are an integral part of the financial statements.
94
Statement of Assets and Liabilities - Pro-Blend® Maximum Term Series
October 31, 2016
ASSETS: | ||||
Investments, at value (identified cost $705,096,059) (Note 2) | $ | 742,418,733 | ||
Receivable for securities sold | 18,481,820 | |||
Foreign tax reclaims receivable | 554,043 | |||
Interest receivable | 518,473 | |||
Dividends receivable | 411,311 | |||
Receivable for fund shares sold | 333,633 | |||
Prepaid expenses | 19,169 | |||
|
| |||
TOTAL ASSETS | 762,737,182 | |||
|
| |||
LIABILITIES: | ||||
Accrued management fees (Note 3) | 488,343 | |||
Accrued shareholder services fees (Class S) (Note 3) | 80,585 | |||
Accrued distribution and service (Rule 12b-1) fees (Class C) (Class R)(Note 3) | 57,579 | |||
Accrued transfer agent fees (Note 3) | 31,153 | |||
Accrued fund accounting and administration fees (Note 3) | 24,562 | |||
Accrued Chief Compliance Officer service fees (Note 3) | 353 | |||
Accrued Directors’ fees (Note 3) | 309 | |||
Payable for securities purchased | 13,915,216 | |||
Payable for fund shares repurchased | 2,071,984 | |||
Other payables and accrued expenses | 87,837 | |||
|
| |||
TOTAL LIABILITIES | 16,757,921 | |||
|
| |||
TOTAL NET ASSETS | $ | 745,979,261 | ||
|
| |||
NET ASSETS CONSIST OF: | ||||
Capital stock | $ | 561,347 | ||
Additional paid-in-capital | 691,521,424 | |||
Distributions in excess of net investment income | (1,884 | ) | ||
Accumulated net realized gain on investments, foreign currency and translation of other assets and liabilities | 16,614,200 | |||
Net unrealized appreciation (depreciation) on investments, foreign currency and translation of other assets and liabilities | 37,284,174 | |||
|
| |||
TOTAL NET ASSETS | $ | 745,979,261 | ||
|
| |||
The accompanying notes are an integral part of the financial statements.
95
Statement of Assets and Liabilities - Pro-Blend® Maximum Term Series
October 31, 2016
NET ASSET VALUE, OFFERING PRICE AND REDEMPTION PRICE PER SHARE - Class S | $ | 18.71 | ||
|
| |||
NET ASSET VALUE, OFFERING PRICE AND REDEMPTION PRICE PER SHARE - Class I | $ | 10.19 | ||
|
| |||
NET ASSET VALUE, OFFERING PRICE AND REDEMPTION PRICE PER SHARE - Class C | $ | 10.68 | ||
|
| |||
NET ASSET VALUE, OFFERING PRICE AND REDEMPTION PRICE PER SHARE - Class R | $ | 12.48 | ||
|
| |||
The accompanying notes are an integral part of the financial statements.
96
Statement of Operations - Pro-Blend® Maximum Term Series
For the Year Ended October 31, 2016
INVESTMENT INCOME: | ||||
Dividends (net of foreign taxes withheld, $349,583) | $ | 8,560,300 | ||
Interest | 1,834,747 | |||
| �� |
|
| ||
Total Investment Income | 10,395,047 | |||
|
| |||
EXPENSES: | ||||
Management fees (Note 3) | 6,321,120 | |||
Shareholder services fees (Class S) (Note 3) | 1,048,839 | |||
Distribution and service (Rule 12b-1) fees (Class C) (Note 3) | 559,947 | |||
Transfer agent fees (Note 3) | 204,804 | |||
Fund accounting and administration fees (Note 3) | 156,380 | |||
Distribution and service (Rule 12b-1) fees (Class R) (Note 3) | 131,626 | |||
Directors’ fees (Note 3) | 56,415 | |||
Chief Compliance Officer service fees (Note 3) | 3,727 | |||
Custodian fees | 60,635 | |||
Miscellaneous | 220,253 | |||
|
| |||
Total Expenses | 8,763,746 | |||
|
| |||
NET INVESTMENT INCOME | 1,631,301 | |||
|
| |||
REALIZED AND UNREALIZED GAIN (LOSS) ON INVESTMENTS AND FOREIGN CURRENCY: | ||||
Net realized gain (loss) on- | ||||
Investments | 18,738,027 | |||
Foreign currency and translation of other assets and liabilities | (25,183 | ) | ||
|
| |||
| 18,712,844 | ||||
|
| |||
Net change in unrealized appreciation (depreciation) on- | ||||
Investments | 3,771,326 | |||
Foreign currency and translation of other assets and liabilities | 11,253 | |||
|
| |||
| 3,782,579 | ||||
|
| |||
NET REALIZED AND UNREALIZED GAIN (LOSS) ON INVESTMENTS AND FOREIGN CURRENCY | 22,495,423 | |||
|
| |||
NET INCREASE IN NET ASSETS RESULTING FROM OPERATIONS | $ | 24,126,724 | ||
|
| |||
The accompanying notes are an integral part of the financial statements.
97
Statements of Changes in Net Assets - Pro-Blend® Maximum Term Series
FOR THE 10/31/16 | FOR THE 10/31/15 | |||||||
INCREASE (DECREASE) IN NET ASSETS: | ||||||||
OPERATIONS: | ||||||||
Net investment income | $ | 1,631,301 | $ | 5,574,556 | ||||
Net realized gain on investments and foreign currency | 18,712,844 | 13,402,528 | ||||||
Net change in unrealized appreciation (depreciation) on investments and foreign currency | 3,782,579 | (38,604,536 | ) | |||||
|
|
|
| |||||
Net increase (decrease) from operations | 24,126,724 | (19,627,452 | ) | |||||
|
|
|
| |||||
DISTRIBUTIONS TO SHAREHOLDERS (Note 8): | ||||||||
From net investment income (Class S) | (504,835 | ) | (1,565,296 | ) | ||||
From net investment income (Class I) | (2,578,578 | ) | (4,370,824 | ) | ||||
From net investment income (Class C) | — | (4,395 | ) | |||||
From net investment income (Class R) | (2,397 | ) | (107,400 | ) | ||||
From net realized gain on investments (Class S) | (4,922,030 | ) | (58,346,182 | ) | ||||
From net realized gain on investments (Class I) | (7,283,833 | ) | (85,929,472 | ) | ||||
From net realized gain on investments (Class C) | (1,010,562 | ) | (9,020,752 | ) | ||||
From net realized gain on investments (Class R) | (432,975 | ) | (5,307,582 | ) | ||||
|
|
|
| |||||
Total distributions to shareholders | (16,735,210 | ) | (164,651,903 | ) | ||||
|
|
|
| |||||
CAPITAL STOCK ISSUED AND REPURCHASED: | ||||||||
Net decrease from capital share transactions (Note 5) | (244,745,906 | ) | (28,777,851 | ) | ||||
|
|
|
| |||||
Net decrease in net assets | (237,354,392 | ) | (213,057,206 | ) | ||||
NET ASSETS: | ||||||||
Beginning of year | 983,333,653 | 1,196,390,859 | ||||||
|
|
|
| |||||
End of year (including distributions in excess of net investment income of $1,884 and undistributed net investment income $1,418,185, respectively) | $ | 745,979,261 | $ | 983,333,653 | ||||
|
|
|
| |||||
The accompanying notes are an integral part of the financial statements.
98
Financial Highlights - Pro-Blend® Maximum Term Series - Class S
| FOR THE YEARS ENDED | ||||||||||||||||||||
| 10/31/16 | 10/31/15 | 10/31/14 | 10/31/13 | 10/31/12 | ||||||||||||||||
Per share data (for a share outstanding throughout each year): | ||||||||||||||||||||
Net asset value - Beginning of year | $ | 18.30 | $ | 20.86 | $ | 21.01 | $ | 17.00 | $ | 15.66 | ||||||||||
|
|
|
|
|
|
|
|
|
| |||||||||||
Income from investment operations: | ||||||||||||||||||||
Net investment income1 | 0.03 | 0.09 | 0.09 | 0.08 | 0.06 | |||||||||||||||
Net realized and unrealized gain (loss) on investments | 0.59 | (0.54 | ) | 1.60 | 4.29 | 1.35 | ||||||||||||||
|
|
|
|
|
|
|
|
|
| |||||||||||
Total from investment operations | 0.62 | (0.45 | ) | 1.69 | 4.37 | 1.41 | ||||||||||||||
|
|
|
|
|
|
|
|
|
| |||||||||||
Less distributions to shareholders: | ||||||||||||||||||||
From net investment income | (0.02 | ) | (0.05 | ) | (0.04 | ) | (0.04 | ) | (0.07 | ) | ||||||||||
From net realized gain on investments | (0.19 | ) | (2.06 | ) | (1.80 | ) | (0.32 | ) | — | |||||||||||
|
|
|
|
|
|
|
|
|
| |||||||||||
Total distributions to shareholders | (0.21 | ) | (2.11 | ) | (1.84 | ) | (0.36 | ) | (0.07 | ) | ||||||||||
|
|
|
|
|
|
|
|
|
| |||||||||||
Net asset value - End of year | $ | 18.71 | $ | 18.30 | $ | 20.86 | $ | 21.01 | $ | 17.00 | ||||||||||
|
|
|
|
|
|
|
|
|
| |||||||||||
Net assets - End of year (000’s omitted) | $ | 367,227 | $ | 503,378 | $ | 597,578 | $ | 530,510 | $ | 467,244 | ||||||||||
|
|
|
|
|
|
|
|
|
| |||||||||||
Total return2 | 3.45 | % | (2.03 | %) | 8.80 | % | 26.13 | % | 9.04 | % | ||||||||||
Ratios (to average net assets)/Supplemental Data: | ||||||||||||||||||||
Expenses | 1.08 | % | 1.08 | % | 1.07 | % | 1.07 | % | 1.09 | % | ||||||||||
Net investment income | 0.15 | % | 0.45 | % | 0.45 | % | 0.43 | % | 0.36 | % | ||||||||||
Series portfolio turnover | 49 | % | 59 | % | 74 | % | 67 | % | 64 | % | ||||||||||
1Calculated based on average shares outstanding during the years.
2Represents aggregate total return for the years indicated, and assumes reinvestment of all distributions.
The accompanying notes are an integral part of the financial statements.
99
Financial Highlights - Pro-Blend® Maximum Term Series - Class I
| FOR THE YEARS ENDED | ||||||||||||||||||||
| 10/31/16 | 10/31/15 | 10/31/14 | 10/31/13 | 10/31/12 | ||||||||||||||||
Per share data (for a share outstanding throughout each year): | ||||||||||||||||||||
Net asset value - Beginning of year | $ | 10.09 | $ | 12.51 | $ | 13.35 | $ | 10.95 | $ | 10.12 | ||||||||||
|
|
|
|
|
|
|
|
|
| |||||||||||
Income from investment operations: | ||||||||||||||||||||
Net investment income1 | 0.04 | 0.08 | 0.09 | 0.08 | 0.06 | |||||||||||||||
Net realized and unrealized gain (loss) on investments | 0.32 | (0.33 | ) | 0.96 | 2.72 | 0.88 | ||||||||||||||
|
|
|
|
|
|
|
|
|
| |||||||||||
Total from investment operations | 0.36 | (0.25 | ) | 1.05 | 2.80 | 0.94 | ||||||||||||||
|
|
|
|
|
|
|
|
|
| |||||||||||
Less distributions to shareholders: | ||||||||||||||||||||
From net investment income | (0.07 | ) | (0.11 | ) | (0.09 | ) | (0.08 | ) | (0.11 | ) | ||||||||||
From net realized gain on investments | (0.19 | ) | (2.06 | ) | (1.80 | ) | (0.32 | ) | — | |||||||||||
|
|
|
|
|
|
|
|
|
| |||||||||||
Total distributions to shareholders | (0.26 | ) | (2.17 | ) | (1.89 | ) | (0.40 | ) | (0.11 | ) | ||||||||||
|
|
|
|
|
|
|
|
|
| |||||||||||
Net asset value - End of year | $ | 10.19 | $ | 10.09 | $ | 12.51 | $ | 13.35 | $ | 10.95 | ||||||||||
|
|
|
|
|
|
|
|
|
| |||||||||||
Net assets - End of year (000’s omitted) | $ | 301,846 | $ | 390,931 | $ | 504,866 | $ | 418,785 | $ | 320,999 | ||||||||||
|
|
|
|
|
|
|
|
|
| |||||||||||
Total return2 | 3.69 | % | (1.82 | %) | 9.10 | % | 26.35 | % | 9.42 | % | ||||||||||
Ratios (to average net assets)/Supplemental Data: | ||||||||||||||||||||
Expenses | 0.83 | % | 0.83 | % | 0.82 | % | 0.82 | % | 0.84 | % | ||||||||||
Net investment income | 0.40 | % | 0.71 | % | 0.70 | % | 0.66 | % | 0.57 | % | ||||||||||
Series portfolio turnover | 49 | % | 59 | % | 74 | % | 67 | % | 64 | % | ||||||||||
1Calculated based on average shares outstanding during the years.
2Represents aggregate total return for the years indicated, and assumes reinvestment of all distributions.
The accompanying notes are an integral part of the financial statements.
100
Financial Highlights - Pro-Blend® Maximum Term Series - Class C
| FOR THE YEARS ENDED | ||||||||||||||||||||
| 10/31/16 | 10/31/15 | 10/31/14 | 10/31/13 | 10/31/12 | ||||||||||||||||
Per share data (for a share outstanding throughout each year): | ||||||||||||||||||||
Net asset value - Beginning of year | $ | 10.60 | $ | 13.03 | $ | 13.86 | $ | 11.38 | $ | 10.52 | ||||||||||
|
|
|
|
|
|
|
|
|
| |||||||||||
Income (loss) from investment operations: | ||||||||||||||||||||
Net investment loss1 | (0.06 | ) | (0.03 | ) | (0.04 | ) | (0.04 | ) | (0.04 | ) | ||||||||||
Net realized and unrealized gain (loss) on investments | 0.33 | (0.34 | ) | 1.01 | 2.84 | 0.91 | ||||||||||||||
|
|
|
|
|
|
|
|
|
| |||||||||||
Total from investment operations | 0.27 | (0.37 | ) | 0.97 | 2.80 | 0.87 | ||||||||||||||
|
|
|
|
|
|
|
|
|
| |||||||||||
Less distributions to shareholders: | ||||||||||||||||||||
From net investment income | — | (0.00 | )2 | (0.00 | )2 | — | (0.01 | ) | ||||||||||||
From net realized gain on investments | (0.19 | ) | (2.06 | ) | (1.80 | ) | (0.32 | ) | — | |||||||||||
|
|
|
|
|
|
|
|
|
| |||||||||||
Total distributions to shareholders | (0.19 | ) | (2.06 | ) | (1.80 | ) | (0.32 | ) | (0.01 | ) | ||||||||||
|
|
|
|
|
|
|
|
|
| |||||||||||
Net asset value - End of year | $ | 10.68 | $ | 10.60 | $ | 13.03 | $ | 13.86 | $ | 11.38 | ||||||||||
|
|
|
|
|
|
|
|
|
| |||||||||||
Net assets - End of year (000’s omitted) | $ | 54,753 | $ | 57,507 | $ | 55,781 | $ | 36,989 | $ | 23,045 | ||||||||||
|
|
|
|
|
|
|
|
|
| |||||||||||
Total return3 | 2.62 | % | (2.76 | %) | 8.06 | % | 25.17 | % | 8.27 | % | ||||||||||
Ratios (to average net assets)/Supplemental Data: | ||||||||||||||||||||
Expenses | 1.83 | % | 1.83 | % | 1.82 | % | 1.82 | % | 1.84 | % | ||||||||||
Net investment loss | (0.61 | %) | (0.30 | %) | (0.30 | %) | (0.35 | %) | (0.40 | %) | ||||||||||
Series portfolio turnover | 49 | % | 59 | % | 74 | % | 67 | % | 64 | % | ||||||||||
1Calculated based on average shares outstanding during the years.
2Less than $0.01.
3Represents aggregate total return for the years indicated, and assumes reinvestment of all distributions.
The accompanying notes are an integral part of the financial statements.
101
Financial Highlights - Pro-Blend® Maximum Term Series - Class R
| FOR THE YEARS ENDED | ||||||||||||||||||||
| 10/31/16 | 10/31/15 | 10/31/14 | 10/31/13 | 10/31/12 | ||||||||||||||||
Per share data (for a share outstanding throughout | ||||||||||||||||||||
Net asset value - Beginning of year | $ | 12.28 | $ | 14.73 | $ | 15.39 | $ | 12.56 | $ | 11.63 | ||||||||||
|
|
|
|
|
|
|
|
|
| |||||||||||
Income (loss) from investment operations: | ||||||||||||||||||||
Net investment income1 | (0.01 | ) | 0.03 | 0.03 | 0.02 | 0.00 | 2 | |||||||||||||
Net realized and unrealized gain (loss) on investments | 0.40 | (0.38 | ) | 1.13 | 3.15 | 1.00 | ||||||||||||||
|
|
|
|
|
|
|
|
|
| |||||||||||
Total from investment operations | 0.39 | (0.35 | ) | 1.16 | 3.17 | 1.00 | ||||||||||||||
|
|
|
|
|
|
|
|
|
| |||||||||||
Less distributions to shareholders: | ||||||||||||||||||||
From net investment income | (0.00 | )2 | (0.04 | ) | (0.02 | ) | (0.02 | ) | (0.07 | ) | ||||||||||
From net realized gain on investments | (0.19 | ) | (2.06 | ) | (1.80 | ) | (0.32 | ) | — | |||||||||||
|
|
|
|
|
|
|
|
|
| |||||||||||
Total distributions to shareholders | (0.19 | ) | (2.10 | ) | (1.82 | ) | (0.34 | ) | (0.07 | ) | ||||||||||
|
|
|
|
|
|
|
|
|
| |||||||||||
Net asset value - End of year | $ | 12.48 | $ | 12.28 | $ | 14.73 | $ | 15.39 | $ | 12.56 | ||||||||||
|
|
|
|
|
|
|
|
|
| |||||||||||
Net assets - End of year (000’s omitted) | $ | 22,153 | $ | 31,517 | $ | 38,166 | $ | 33,162 | $ | 17,520 | ||||||||||
|
|
|
|
|
|
|
|
|
| |||||||||||
Total return3 | 3.26 | % | (2.28 | %) | 8.53 | % | 25.81 | % | 8.72 | % | ||||||||||
Ratios (to average net assets)/Supplemental Data: | ||||||||||||||||||||
Expenses | 1.33 | % | 1.33 | % | 1.32 | % | 1.32 | % | 1.34 | % | ||||||||||
Net investment income (loss) | (0.10 | %) | 0.20 | % | 0.20 | % | 0.14 | % | 0.02 | % | ||||||||||
Series portfolio turnover | 49 | % | 59 | % | 74 | % | 67 | % | 64 | % | ||||||||||
1Calculated based on average shares outstanding during the years.
2Less than $0.01.
3Represents aggregate total return for the years indicated, and assumes reinvestment of all distributions.
The accompanying notes are an integral part of the financial statements.
102
Notes to Financial Statements
| 1. | Organization |
Pro-Blend® Conservative Term Series, Pro-Blend® Moderate Term Series, Pro-Blend® Extended Term Series and Pro-Blend® Maximum Term Series (each the “Series”) are no-load diversified series of Manning & Napier Fund, Inc. (the “Fund”). The Fund is organized in Maryland and is registered under the Investment Company Act of 1940 (the “1940 Act”), as amended, as an open-end management investment company.
The Series are asset allocation funds. Each invests in a combination of stocks, bonds and cash and is managed according to specific objectives. The objectives are as follows: Pro-Blend® Conservative Term Series - primary objective is preservation of capital; secondary objective is to provide income and long-term growth of capital. Pro-Blend® Moderate Term Series - equal emphasis on long-term growth of capital and preservation of capital. Pro-Blend® Extended Term Series - primary objective is long-term growth of capital; secondary objective is preservation of capital. Pro-Blend® Maximum Term Series - primary objective is long-term growth of capital.
Each Series is authorized to issue four classes of shares (Class C, R, I and S). Each class of shares is substantially the same, except that class-specific distribution and shareholder servicing expenses are borne by the specific class of shares to which they relate.
The Fund’s Advisor is Manning & Napier Advisors, LLC (the “Advisor”). Shares of each Series are offered to investors and employees of the Advisor and its affiliates. The total authorized capital stock of the Fund consists of 15 billion shares of common stock each having a par value of $0.01. As of October 31, 2016, 10.5 billion shares have been designated in total among 40 series, of which 162.5 million have been designated as Pro-Blend® Conservative Term Series Class S common stock, 75 million have been designated as Pro-Blend® Conservative Term Series Class I common stock, 125 million each have been designated as Class S common stock and Class I common stock for Pro-Blend® Moderate Term Series, 125 million each have been designated as Class S common stock for Pro-Blend® Extended Term Series and Pro-Blend® Maximum Term Series, 200 million each have been designated as Class I common stock for Pro-Blend® Extended Term Series and Pro-Blend® Maximum Term Series, 25 million each have been designated as Class C common stock for Pro-Blend® Conservative Term Series, Pro-Blend® Moderate Term Series, Pro-Blend® Extended Term Series and Pro-Blend® Maximum Term Series and 52.5 million each have been designated as Class R common stock for Pro-Blend® Conservative Term Series, Pro-Blend® Moderate Term Series, Pro-Blend® Extended Term Series and Pro-Blend® Maximum Term Series.
| 2. | Significant Accounting Policies |
The following is a summary of significant accounting policies followed by the Series. Each Series is an investment company and, accordingly, follows the investment company accounting and reporting guidance of the Financial Accounting Standards Board Accounting Standards Codification Topic 946 - Investment Companies, which is part of accounting principles generally accepted in the United States of America (“GAAP”).
Security Valuation
Portfolio securities, including domestic equities, foreign equities, warrants and options, listed on an exchange other than the NASDAQ Stock Market are valued at the latest quoted sales price of the exchange on which the security is primarily traded. Securities not traded on valuation date or securities not listed on an exchange are valued at the latest quoted bid price provided by the Fund’s pricing service. Securities listed on the NASDAQ Stock Market are valued in accordance with the NASDAQ Official Closing Price.
Debt securities, including government bonds, foreign bonds, asset-backed securities, structured notes, supranational obligations, sovereign bonds, corporate bonds and mortgage-backed securities will normally be valued on the basis of evaluated bid prices provided directly by an independent pricing service. The pricing services use multiple valuation techniques to determine fair value. In instances where sufficient market activity exists, the pricing services may utilize a market-based approach through which quotes from market makers are used to determine fair value. In instances where sufficient market activity may not exist or is limited, the pricing services also utilize proprietary valuation models which may consider market characteristics such as benchmark yield curves, option-adjusted spreads, credit spreads, estimated defaulted rates, coupon rates, anticipated timing of principal repayments, underlying collateral and other unique security features in order to estimate the relevant cash flows,
103
Notes to Financial Statements (continued)
| 2. | Significant Accounting Policies (continued) |
Security Valuation (continued)
which are then discounted to calculate the fair value. Certain investments in securities held by the Series may be valued on a basis of a price provided directly by a principal market maker. These prices may differ from the value that would have been used had a broader market for securities existed.
Short-term investments that mature in sixty days or less may be valued at amortized cost, which approximates fair value. Investments in open-end investment companies are valued at their net asset value per share on valuation date.
Volume and level of activity in established markets for an asset or liability are evaluated to determine whether recent transactions and quoted prices are determinative of fair value. Where there have been significant decreases in volume and level of activity, further analysis and adjustment may be necessary to estimate fair value. The Series measure fair value in these instances by the use of inputs and valuation techniques which may be based upon current market prices of securities that are comparable in coupon, rating, maturity and industry and/or expectation of future cash flows. As a result of trading in relatively thin markets and/or markets that experience significant volatility, the prices used by the Series to value these securities may differ from the value that would be realized if these securities were sold, and the differences could be material.
Securities for which representative valuations or prices are not available from the Series’ pricing service may be valued at fair value as determined in good faith by the Advisor under procedures approved by and under the general supervision and responsibility of the Fund’s Board of Directors (the “Board”). Due to the inherent uncertainty of valuations of such securities, the fair value may differ significantly from the values that would have been used had a ready market for such securities existed. If trading or events occurring after the close of the principal market in which securities are traded are expected to materially affect the value of those securities, then they may be valued at their fair value, taking this trading or these events into account. In accordance with the procedures approved by the Board, the values of certain securities trading outside the U.S. were adjusted following the close of local trading using a factor from a third party vendor. The third party vendor uses statistical analyses and quantitative models, which consider among other things subsequent movement and changes in the prices of indices, securities and exchange rates in other markets, to determine the factors which are used to adjust local market prices. The value of securities used for net asset value calculation under these procedures may differ from published prices for the same securities. It is the Fund’s policy to classify each foreign equity security where a factor from a third party vendor is provided as a Level 2 security.
Various inputs are used in determining the value of the Series’ assets or liabilities carried at fair value. These inputs are summarized in three broad levels. Level 1 includes quoted prices in active markets for identical assets and liabilities. Level 2 includes other significant observable inputs (including quoted prices for similar securities, interest rates, prepayment speeds, credit risk, etc.). Level 3 includes significant unobservable inputs (including the Series’ own assumptions in determining the fair value of investments). A financial instruments’ level within the fair value hierarchy is based on the lowest level of any input both individually and in aggregate that is significant to their fair value measure. The inputs or methodology used for valuing securities are not necessarily an indication of the risk associated with investing in those securities.
104
Notes to Financial Statements (continued)
| 2. | Significant Accounting Policies (continued) |
Security Valuation (continued)
The following is a summary of the valuation levels used for major security types as of October 31, 2016 in valuing the Series’ assets or liabilities carried at fair value:
| PRO-BLEND® CONSERVATIVE TERM SERIES | ||||||||||||||||
| DESCRIPTION | TOTAL | LEVEL 1 | LEVEL 2 | LEVEL 3 | ||||||||||||
Assets: | ||||||||||||||||
Equity securities: | ||||||||||||||||
Consumer Discretionary | $ | 66,624,621 | $ | 61,821,876 | $ | 4,802,745 | $ | — | ||||||||
Consumer Staples | 31,286,172 | 21,901,372 | 9,384,800 | — | ||||||||||||
Energy | 18,619,871 | 18,144,748 | 475,123 | — | ||||||||||||
Financials | 20,301,595 | 20,301,595 | — | — | ||||||||||||
Health Care | 45,897,035 | 44,571,749 | 1,325,286 | — | ||||||||||||
Industrials | 31,835,606 | 28,353,048 | 3,482,558 | — | ||||||||||||
Information Technology | 103,332,734 | 103,332,734 | — | — | ||||||||||||
Materials | 30,931,576 | 30,063,845 | 867,731 | — | ||||||||||||
Real Estate | 31,187,334 | 30,820,205 | 367,129 | — | ||||||||||||
Telecommunication Services | 1,346,800 | 1,346,800 | — | — | ||||||||||||
Utilities | 1,465,655 | 1,465,655 | — | — | ||||||||||||
Debt securities: | ||||||||||||||||
U.S. Treasury and other U.S. Government agencies | 392,510,958 | — | 392,510,958 | — | ||||||||||||
Corporate debt: | ||||||||||||||||
Consumer Discretionary | 17,735,527 | — | 17,735,527 | — | ||||||||||||
Consumer Staples | 17,362,895 | — | 17,362,895 | — | ||||||||||||
Energy | 40,505,293 | — | 40,505,293 | — | ||||||||||||
Financials | 79,466,818 | — | 79,466,818 | — | ||||||||||||
Health Care | 5,286,175 | — | 5,286,175 | — | ||||||||||||
Industrials | 26,964,420 | — | 26,964,420 | — | ||||||||||||
Information Technology | 21,078,164 | — | 21,078,164 | — | ||||||||||||
Materials | 12,121,984 | — | 12,121,984 | — | ||||||||||||
Real Estate | 16,046,169 | — | 16,046,169 | — | ||||||||||||
Telecommunication Services | 16,240,115 | — | 16,240,115 | — | ||||||||||||
Utilities | 1,226,150 | — | 1,226,150 | — | ||||||||||||
Asset-backed securities | 25,850,403 | — | 25,850,403 | — | ||||||||||||
Commercial mortgage-backed securities | 69,699,858 | — | 69,699,858 | — | ||||||||||||
Foreign government bonds | 23,531,227 | — | 23,531,227 | — | ||||||||||||
Mutual funds | 10,721,834 | 10,721,834 | — | — | ||||||||||||
|
|
|
|
|
|
|
| |||||||||
Total assets | 1,159,176,989 | 372,845,461 | 786,331,528 | — | ||||||||||||
|
|
|
|
|
|
|
| |||||||||
Liabilities: | ||||||||||||||||
Other financial instruments*: | ||||||||||||||||
Equity contracts | (31,340 | ) | (31,340 | ) | — | — | ||||||||||
|
|
|
|
|
|
|
| |||||||||
Total liabilities | (31,340 | ) | (31,340 | ) | — | — | ||||||||||
|
|
|
|
|
|
|
| |||||||||
Total | $ | 1,159,145,649 | $ | 372,814,121 | $ | 786,331,528 | $ | — | ||||||||
|
|
|
|
|
|
|
| |||||||||
| PRO-BLEND® MODERATE TERM SERIES | ||||||||||||||||
| DESCRIPTION | TOTAL | LEVEL 1 | LEVEL 2 | LEVEL 3 | ||||||||||||
Assets: | ||||||||||||||||
Equity securities: | ||||||||||||||||
Consumer Discretionary | $ | 92,977,811 | $ | 80,089,139 | $ | 12,888,672 | $ | — | ||||||||
Consumer Staples | 38,393,226 | 20,044,370 | 18,348,856 | — | ||||||||||||
Energy | 15,097,606 | 14,018,086 | 1,079,520 | — | ||||||||||||
Financials | 7,535,640 | 7,343,413 | 192,227 | — | ||||||||||||
105
Notes to Financial Statements (continued)
| 2. | Significant Accounting Policies (continued) |
Security Valuation (continued)
| PRO-BLEND® MODERATE TERM SERIES | ||||||||||||||||
| DESCRIPTION | TOTAL | LEVEL 1 | LEVEL 2 | LEVEL 3 | ||||||||||||
Health Care | $ | 50,619,097 | $ | 49,023,664 | $ | 1,595,433 | $ | — | ||||||||
Industrials | 26,362,238 | 14,058,239 | 12,303,999 | — | ||||||||||||
Information Technology | 132,551,151 | 128,403,112 | 4,148,039 | — | ||||||||||||
Materials | 31,670,845 | 30,504,350 | 1,166,495 | — | ||||||||||||
Real Estate | 23,596,605 | 22,745,555 | 851,050 | — | ||||||||||||
Telecommunication Services | 3,037,126 | 2,814,643 | 222,483 | — | ||||||||||||
Utilities | 172,162 | — | 172,162 | — | ||||||||||||
Debt securities: | ||||||||||||||||
U.S. Treasury and other U.S. | ||||||||||||||||
Government agencies | 263,999,523 | — | 263,999,523 | — | ||||||||||||
Corporate debt: | ||||||||||||||||
Consumer Discretionary | 14,411,838 | — | 14,411,838 | — | ||||||||||||
Consumer Staples | 13,224,330 | — | 13,224,330 | — | ||||||||||||
Energy | 30,697,473 | — | 30,697,473 | — | ||||||||||||
Financials | 56,186,617 | — | 56,186,617 | — | ||||||||||||
Health Care | 3,969,828 | — | 3,969,828 | — | ||||||||||||
Industrials | 20,564,674 | — | 20,564,674 | — | ||||||||||||
Information Technology | 13,050,617 | — | 13,050,617 | — | ||||||||||||
Materials | 8,035,221 | — | 8,035,221 | — | ||||||||||||
Real Estate | 8,890,873 | — | 8,890,873 | — | ||||||||||||
Telecommunication Services | 12,184,707 | — | 12,184,707 | — | ||||||||||||
Utilities | 1,046,288 | — | 1,046,288 | — | ||||||||||||
Asset-backed securities | 29,233,486 | — | 29,233,486 | — | ||||||||||||
Commercial mortgage-backed securities | 43,218,522 | — | 43,218,522 | — | ||||||||||||
Foreign government bonds | 19,920,733 | — | 19,920,733 | — | ||||||||||||
Mutual funds | 6,954,811 | 6,954,811 | — | — | ||||||||||||
|
|
|
|
|
|
|
| |||||||||
Total assets | 967,603,048 | 375,999,382 | 591,603,666 | — | ||||||||||||
|
|
|
|
|
|
|
| |||||||||
Liabilities: | ||||||||||||||||
Other financial instruments*: | ||||||||||||||||
Equity contracts | (42,980 | ) | (42,980 | ) | — | — | ||||||||||
|
|
|
|
|
|
|
| |||||||||
Total liabilities | (42,980 | ) | (42,980 | ) | — | — | ||||||||||
|
|
|
|
|
|
|
| |||||||||
Total | $ | 967,560,068 | $ | 375,956,402 | $ | 591,603,666 | $ | — | ||||||||
|
|
|
|
|
|
|
| |||||||||
| PRO-BLEND® EXTENDED TERM SERIES | ||||||||||||||||
| DESCRIPTION | TOTAL | LEVEL 1 | LEVEL 2 | LEVEL 3 | ||||||||||||
Assets: | ||||||||||||||||
Equity securities: | ||||||||||||||||
Consumer Discretionary | $ | 135,350,936 | $ | 117,263,611 | $ | 18,087,325 | $ | — | ||||||||
Consumer Staples | 55,277,741 | 28,306,832 | 26,970,909 | — | ||||||||||||
Energy | 21,840,553 | 20,441,010 | 1,399,543 | — | ||||||||||||
Financials | 10,773,795 | 10,517,026 | 256,769 | — | ||||||||||||
Health Care | 74,792,635 | 72,502,763 | 2,289,872 | — | ||||||||||||
Industrials | 38,049,456 | 20,328,934 | 17,720,522 | — | ||||||||||||
Information Technology | 190,981,529 | 184,896,149 | 6,085,380 | — | ||||||||||||
Materials | 45,515,927 | 43,913,806 | 1,602,121 | — | ||||||||||||
Real Estate | 30,492,829 | 29,379,535 | 1,113,294 | — | ||||||||||||
Telecommunication Services | 4,565,948 | 4,231,307 | 334,641 | — | ||||||||||||
Utilities | 215,462 | — | 215,462 | — | ||||||||||||
106
Notes to Financial Statements (continued)
| 2. | Significant Accounting Policies (continued) |
Security Valuation (continued)
| PRO-BLEND® EXTENDED TERM SERIES | ||||||||||||||||
| DESCRIPTION | TOTAL | LEVEL 1 | LEVEL 2 | LEVEL 3 | ||||||||||||
Debt securities: | ||||||||||||||||
U.S. Treasury and other U.S. | ||||||||||||||||
Government agencies | $ | 208,156,477 | $ | — | $ | 208,156,477 | $ | — | ||||||||
Corporate debt: | ||||||||||||||||
Consumer Discretionary | 11,909,868 | — | 11,909,868 | — | ||||||||||||
Consumer Staples | 11,789,427 | — | 11,789,427 | — | ||||||||||||
Energy | 27,996,542 | — | 27,996,542 | — | ||||||||||||
Financials | 42,531,265 | — | 42,531,265 | — | ||||||||||||
Health Care | 4,037,497 | — | 4,037,497 | — | ||||||||||||
Industrials | 19,143,739 | — | 19,143,739 | — | ||||||||||||
Information Technology | 9,261,577 | — | 9,261,577 | — | ||||||||||||
Materials | 8,709,666 | — | 8,709,666 | — | ||||||||||||
Real Estate | 8,865,575 | — | 8,865,575 | — | ||||||||||||
Telecommunication Services | 10,667,624 | — | 10,667,624 | — | ||||||||||||
Utilities | 1,148,825 | — | 1,148,825 | — | ||||||||||||
Asset-backed securities | 19,336,906 | — | 19,336,906 | — | ||||||||||||
Commercial mortgage-backed securities | 36,304,336 | — | 36,304,336 | — | ||||||||||||
Foreign government bonds | 16,336,849 | — | 16,336,849 | — | ||||||||||||
Mutual funds | 8,540,287 | 8,540,287 | — | — | ||||||||||||
|
|
|
|
|
|
|
| |||||||||
Total assets | 1,052,593,271 | 540,321,260 | 512,272,011 | — | ||||||||||||
|
|
|
|
|
|
|
| |||||||||
Liabilities: | ||||||||||||||||
Other financial instruments* | ||||||||||||||||
Equity contracts | (64,295 | ) | (64,295 | ) | — | — | ||||||||||
|
|
|
|
|
|
|
| |||||||||
Total liabilities | (64,295 | ) | (64,295 | ) | — | — | ||||||||||
|
|
|
|
|
|
|
| |||||||||
Total | $ | 1,052,528,976 | $ | 540,256,965 | $ | 512,272,011 | $ | — | ||||||||
|
|
|
|
|
|
|
| |||||||||
| PRO-BLEND® MAXIMUM TERM SERIES | ||||||||||||||||
| DESCRIPTION | TOTAL | LEVEL 1 | LEVEL 2 | LEVEL 3 | ||||||||||||
Assets: | ||||||||||||||||
Equity securities: | ||||||||||||||||
Consumer Discretionary | $ | 128,368,582 | $ | 110,428,477 | $ | 17,940,105 | $ | — | ||||||||
Consumer Staples | 77,427,136 | 36,825,904 | 40,601,232 | — | ||||||||||||
Energy | 21,207,856 | 19,936,803 | 1,271,053 | — | ||||||||||||
Financials | 17,984,341 | 17,794,677 | 189,664 | — | ||||||||||||
Health Care | 138,605,204 | 130,205,652 | 8,399,552 | — | ||||||||||||
Industrials | 38,256,125 | 24,185,281 | 14,070,844 | — | ||||||||||||
Information Technology | 172,532,705 | 161,243,462 | 11,289,243 | — | ||||||||||||
Materials | 35,330,464 | 34,167,700 | 1,162,764 | — | ||||||||||||
Real Estate | 21,413,311 | 20,699,564 | 713,747 | — | ||||||||||||
Telecommunication Services | 15,429,663 | 15,189,079 | 240,584 | — | ||||||||||||
Utilities | 167,769 | — | 167,769 | — | ||||||||||||
Debt securities: | ||||||||||||||||
U.S. Treasury and other U.S. | ||||||||||||||||
Government agencies | 40,632,976 | — | 40,632,976 | — | ||||||||||||
Corporate debt: | ||||||||||||||||
Consumer Discretionary | 2,350,647 | — | 2,350,647 | — | ||||||||||||
Consumer Staples | 2,192,916 | — | 2,192,916 | — | ||||||||||||
Energy | 4,106,286 | — | 4,106,286 | — | ||||||||||||
Financials | 8,679,343 | — | 8,679,343 | — | ||||||||||||
Health Care | 1,088,496 | — | 1,088,496 | — | ||||||||||||
107
Notes to Financial Statements (continued)
| 2. | Significant Accounting Policies (continued) |
Security Valuation (continued)
| PRO-BLEND® MAXIMUM TERM SERIES | ||||||||||||||||
| DESCRIPTION | TOTAL | LEVEL 1 | LEVEL 2 | LEVEL 3 | ||||||||||||
Industrials | $ | 2,913,404 | $ | — | $ | 2,913,404 | $ | — | ||||||||
Information Technology | 2,390,891 | — | 2,390,891 | — | ||||||||||||
Materials | 1,291,802 | — | 1,291,802 | — | ||||||||||||
Real Estate | 1,760,224 | — | 1,760,224 | — | ||||||||||||
Telecommunication Services | 2,299,814 | — | 2,299,814 | — | ||||||||||||
Utilities | 369,562 | — | 369,562 | — | ||||||||||||
Foreign government bonds | 818,955 | — | 818,955 | — | ||||||||||||
Mutual funds | 4,800,261 | 4,800,261 | — | — | ||||||||||||
|
|
|
|
|
|
|
| |||||||||
Total assets | $ | 742,418,733 | $ | 575,476,860 | $ | 166,941,873 | $ | — | ||||||||
|
|
|
|
|
|
|
| |||||||||
Please see the Investment Portfolio for each of the Series for foreign securities where a factor from a third party vendor was applied to determine the securities’ fair value following the close of local trading. Such securities are included in Level 2 in the table above.
There were no Level 3 securities held by any of the Pro-Blend® Series as of October 31, 2015 or October 31, 2016.
*Other financial instruments are exchange traded options (Level 1).
The Fund’s policy is to recognize transfers in and transfers out of the valuation levels as of the beginning of the reporting period. There were no significant transfers between Level 1 and Level 2 during the year ended October 31, 2016.
New Accounting Guidance
In October 2016, the Securities and Exchange Commission (SEC) issued a new rule, Investment Company Reporting Modernization, which, among other provisions, amends Regulation S-X to require standardized, enhanced disclosures, particularly related to derivatives, in investment company financial statements. Compliance with the guidance is required for financial statements filed with the SEC on or after August 1, 2017; adoption will have no effect on the Fund’s net assets or results of operations.
Security Transactions, Investment Income and Expenses
Security transactions are accounted for on trade date. Dividend income is recorded on the ex-dividend date, except that if the ex-dividend date has passed, certain dividends from foreign securities are recorded as soon as the Series is informed of the ex-dividend date. Non-cash dividends, if any, are recorded at the fair value of the securities received. Interest income, including amortization of premium and accretion of discounts using the effective interest method, is earned from settlement date and accrued daily.
Expenses are recorded on an accrual basis. Most expenses of the Fund can be attributed to a specific series. Expenses which cannot be directly attributed are apportioned among the series in the Fund in such a manner as deemed equitable by the Fund’s Board, taking into consideration, among other things, the nature and type of expense.
Income, expenses (other than class specific expenses), and realized and unrealized gains and losses are prorated among the classes based on the relative net assets of each class. Class specific expenses are directly charged to that Class.
The Series use the identified cost method for determining realized gain or loss on investments for both financial statement and federal income tax reporting purposes.
Foreign Currency Translation
The books and records of the Series are maintained in U.S. dollars. Foreign currencies, investments and other assets and liabilities are translated into U.S. dollars at the current exchange rates. Purchases and sales of investment securities and
108
Notes to Financial Statements (continued)
| 2. | Significant Accounting Policies (continued) |
Foreign Currency Translation (continued)
income and expenses are translated on the respective dates of such transactions. The Series do not isolate realized and unrealized gains and losses attributable to changes in the exchange rates from gains and losses that arise from changes in the fair value of investments. Such fluctuations are included with net realized and unrealized gain or loss on investments. Net realized foreign currency gains and losses represent foreign currency gains and losses between trade date and settlement date on securities transactions, gains and losses on disposition of foreign currencies and the difference between the amount of income and foreign withholding taxes recorded on the books of the Series and the amounts actually received or paid.
Option Contracts
The Series may write (sell) or buy call or put options on securities and other financial instruments. When a Series writes a call, the Series gives the purchaser the right to buy the underlying security from the Series at the price specified in the option contract (the “exercise price”) at any time during the option period. When a Series writes a put option, the Series gives the purchaser the right to sell to the Series the underlying security at the exercise price at any time during the option period. The Series will only write options on a “covered basis.” This means that the Series will own the underlying security when the Series writes a call or the Series will put aside cash, U.S. Government securities, or other liquid assets in an amount not less than the exercise price at all times the put option is outstanding.
When a Series writes an option, an amount equal to the premium received is reflected as a liability and is subsequently marked-to-market to reflect the current market value of the option. The Series, as a writer of an option, has no control over whether the underlying security or financial instrument may be sold (call) or purchased (put) and, as a result, bears the market risk of an unfavorable change in the price of the security or financial instrument underlying the written option. There is a risk that the Series may not be able to enter into a closing transaction because of an illiquid market.
Each Series may also purchase options in an attempt to hedge against fluctuations in the value of its portfolio and to protect against declines in the value of the securities. The premium paid by a Series for the purchase of an option is reflected as an investment and subsequently marked-to-market to reflect the current market value of the option. The risk associated with purchasing options is limited to the premium paid.
When a security is purchased or sold through an exercise of an option, the related premium paid (or received) is added to (or deducted from) the basis of the security acquired or deducted from (or added to) the proceeds of the security sold. When an option expires (or a Series enters into a closing transaction), the Series realizes a gain or loss on the option to the extent of the premium received or paid (or gain or loss to the extent the cost of the closing transaction exceeds the premium paid or received).
The measurement of the risks associated with option contracts is meaningful only when all related and offsetting transactions are considered. The counterparty for the Series’ written options contracts outstanding during the year ended October 31, 2016 is Pershing LLC, a BNY Mellon Company.
Futures
Each Series may purchase or sell exchange-traded futures contracts, which are contracts that obligate the Series to make or take delivery of a financial instrument or the cash value of a security index at a specified future date at a specified price. The Series may use futures contracts to manage exposure to the stock and bond markets or changes in interest rates and currency values, or for gaining exposure to markets. Risks of entering into futures contracts include the possibility that there may be an illiquid market at the time the Adviser to the Series may be attempting to sell some or all the Series holdings or that a change in the value of the contract may not correlate with changes in the value of the underlying securities. Upon entering into a futures contract, a Series is required to deposit either cash or securities (initial margin). Subsequent payments (variation margin) are made or received by the Series, generally on a daily basis. The variation margin payments are equal to the daily changes in the contract value and are recorded as unrealized gains or losses. The Series recognize a realized gain or loss when the contract is closed or expires.
109
Notes to Financial Statements (continued)
| 2. | Significant Accounting Policies (continued) |
Futures (continued)
Futures transactions involve minimal counterparty risk since futures contracts are guaranteed against default by the exchange on which they trade. The Series’ futures contracts are not subject to master netting arrangements (the right to close out all transactions traded with a counterparty, and net amounts owed or due across transactions). At October 31, 2016, the Series did not hold any futures contracts.
The following table presents the present value of derivatives held at October 31, 2016 as reflected on the Statement of Assets and Liabilities, and the effect of the derivative instruments on the Statement of Operations:
| PRO-BLEND® CONSERVATIVE TERM SERIES | ||||||
| STATEMENT OF ASSETS AND LIABILITIES | ||||||
Derivative | Liabilities Location | |||||
Equity contracts | Options written, at value | $ | (31,340 | ) | ||
| STATEMENT OF OPERATIONS | ||||||
Derivative | Location of Gain or (Loss) on Derivatives | | Realized Gain (Loss) on Derivatives | | ||
Interest rate contracts | Net realized gain (loss) on futures contracts | $ | (10,954,642) | |||
Equity contracts | Net realized gain (loss) on options written | $ | 506,836 | |||
Derivative | Location of Appreciation (Depreciation) on Derivatives | | Unrealized Appreciation (Depreciation) on Derivatives | | ||
Interest rate contracts | Net change in unrealized appreciation (depreciation) on futures contracts | $ | 1,416,619 | |||
Equity contracts | Net change in unrealized appreciation (depreciation) on options written | $ | 26,350 | |||
| PRO-BLEND® MODERATE TERM SERIES | ||||||
| STATEMENT OF ASSETS AND LIABILITIES | ||||||
Derivative | Liabilities Location | |||||
Equity contracts | Options written, at value | $ | (42,980 | ) | ||
| STATEMENT OF OPERATIONS | ||||||
Derivative | Location of Gain or (Loss) on Derivatives | | Realized Gain (Loss) on Derivatives | | ||
Interest rate contracts | Net realized gain (loss) on futures contracts | $ | (9,912,872) | |||
Equity contracts | Net realized gain (loss) on options written | $ | 758,997 | |||
Derivative | Location of Appreciation (Depreciation) on Derivatives | | Unrealized Appreciation (Depreciation) on Derivatives | | ||
Interest rate contracts | Net change in unrealized appreciation (depreciation) on futures contracts | $ | 1,250,569 | |||
Equity contracts | Net change in unrealized appreciation (depreciation) on options written | $ | 36,446 | |||
110
Notes to Financial Statements (continued)
| 2. | Significant Accounting Policies (continued) |
| PRO-BLEND® EXTENDED TERM SERIES | ||||||
| STATEMENT OF ASSETS AND LIABILITIES | ||||||
Derivative | Liabilities Location | |||||
Equity contracts | Options written, at value | $ | (64,295 | ) | ||
| STATEMENT OF OPERATIONS | ||||||
Derivative | Location of Gain or (Loss) on Derivatives |
| Realized Gain (Loss) on Derivatives |
| ||
Interest rate contracts | Net realized gain (loss) on futures contracts | $ | (6,570,099) | |||
Equity contracts | Net realized gain (loss) on options written | $ | 1,041,842 | |||
Derivative | Location of Appreciation (Depreciation) on Derivatives | | Unrealized Appreciation (Depreciation) on Derivatives | | ||
Interest rate contracts | Net change in unrealized appreciation (depreciation) on futures contracts | $ | 838,256 | |||
Equity contracts | Net change in unrealized appreciation (depreciation) on options written | $ | 54,285 | |||
The average month-end balances for the year ended October 31, 2016, the period in which such derivatives were outstanding, were as follows:
| PRO-BLEND® CONSERVATIVE TERM SERIES | PRO-BLEND® MODERATE TERM SERIES | PRO-BLEND® EXTENDED TERM SERIES | ||||||||||
Futures Contracts: |
| |||||||||||
Average number of contracts purchased | 2,202 | 2,006 | 1,318 | |||||||||
Average number of contracts sold | 5,783 | 5,269 | 3,460 | |||||||||
Average notional value of contracts purchased | $ | 497,587,964 | $ | 453,358,482 | $ | 297,819,886 | ||||||
Average notional value of contracts sold | $ | 1,236,754,500 | $ | 1,126,765,017 | $ | 740,010,541 | ||||||
Options: |
| |||||||||||
Average number of option contracts written | 1,692 | 2,530 | 3,603 | |||||||||
Average notional value of option contracts written | $ | 10,598,456 | $ | 16,480,588 | $ | 23,102,313 | ||||||
Written Option Rollforward
Transactions in options written for the year ended October 31, 2016, were as follows:
| PRO-BLEND® CONSERVATIVE TERM SERIES: | CALLS | PUTS | ||||||||||||||
| CONTRACTS | PREMIUMS RECEIVED | CONTRACTS | PREMIUMS RECEIVED | |||||||||||||
Outstanding options, beginning of year | — | — | — | — | ||||||||||||
Options written | 7,854 | $ | 497,831 | 14,709 | $ | 802,445 | ||||||||||
Options exercised | (2,513 | ) | (176,681 | ) | (613 | ) | (42,197 | ) | ||||||||
Options expired | (2,586 | ) | (73,413 | ) | (3,829 | ) | (168,005 | ) | ||||||||
Options closed | (2,340 | ) | (231,362 | ) | (9,958 | ) | (550,928 | ) | ||||||||
|
|
|
|
|
|
|
| |||||||||
Outstanding options, end of year | 415 | $ | 16,375 | 309 | $ | 41,315 | ||||||||||
|
|
|
|
|
|
|
| |||||||||
111
Notes to Financial Statements (continued)
| 2. | Significant Accounting Policies (continued) |
Written Option Rollforward (continued)
| PRO-BLEND® MODERATE TERM SERIES: | CALLS | PUTS | ||||||||||||||
| CONTRACTS | PREMIUMS RECEIVED | CONTRACTS | PREMIUMS RECEIVED | |||||||||||||
Outstanding options, beginning of year | — | — | — | — | ||||||||||||
Options written | 12,037 | $ | 782,520 | 22,844 | $ | 1,269,685 | ||||||||||
Options exercised | (4,623 | ) | (328,916 | ) | (1,206 | ) | (83,017 | ) | ||||||||
Options expired | (3,548 | ) | (99,009 | ) | (6,103 | ) | (265,302 | ) | ||||||||
Options closed | (3,305 | ) | (332,459 | ) | (15,115 | ) | (864,076 | ) | ||||||||
|
|
|
|
|
|
|
| |||||||||
Outstanding options, end of year | 561 | $ | 22,136 | 420 | $ | 57,290 | ||||||||||
|
|
|
|
|
|
|
| |||||||||
| PRO-BLEND® EXTENDED TERM SERIES: | CALLS | PUTS | ||||||||||||||
| CONTRACTS | PREMIUMS RECEIVED | CONTRACTS | PREMIUMS RECEIVED | |||||||||||||
Outstanding options, beginning of year | — | — | — | — | ||||||||||||
Options written | 16,889 | $ | 1,084,607 | 31,875 | $ | 1,758,208 | ||||||||||
Options exercised | (6,203 | ) | (438,507 | ) | (1,462 | ) | (100,640 | ) | ||||||||
Options expired | (4,963 | ) | (126,802 | ) | (8,359 | ) | (366,640 | ) | ||||||||
Options closed | (4,877 | ) | (485,916 | ) | (21,424 | ) | (1,205,730 | ) | ||||||||
|
|
|
|
|
|
|
| |||||||||
Outstanding options, end of year | 846 | $ | 33,382 | 630 | $ | 85,198 | ||||||||||
|
|
|
|
|
|
|
| |||||||||
Inflation-Indexed Bonds
Each Series may invest in inflation-indexed bonds. Inflation-indexed bonds are fixed income securities whose principal value is periodically adjusted according to the rate of inflation. If the index measuring inflation rises or falls, the principal value of inflation-indexed bonds will be adjusted upward or downward, and consequently the interest payable on these securities (calculated with respect to a larger or smaller principal amount) will be increased or reduced, respectively. Any upward or downward adjustment in the principal amount of an inflation-indexed bond will be included as interest income in the Statements of Operations, even though investors do not receive their principal until maturity. Repayment of the original bond principal upon maturity (as adjusted for inflation) is guaranteed in the case of U.S. Treasury inflation-indexed bonds. For bonds that do not provide a similar guarantee, the adjusted principal value of the bond repaid at maturity may be less than the original principal.
Securities Purchased on a When-Issued Basis or Forward Commitment
Each Series may purchase securities on a when-issued basis or forward commitment. These transactions involve a commitment by the Fund to purchase securities for a predetermined price with payment and delivery taking place beyond the customary settlement period. When such purchases are outstanding, the Fund will designate liquid assets in an amount sufficient to meet the purchase price. When purchasing a security on a delayed delivery basis, the Fund assumes the rights and risks of ownership of the security, including the risk of price and yield fluctuations, and take such fluctuations into account when determining their net asset value. The Fund may sell the when-issued securities before they are delivered, which may result in a capital gain or loss.
In connection with their ability to purchase or sell securities on a forward commitment basis, the Fund may enter into forward roll transactions principally using To Be Announced (TBA) securities. Forward roll transactions require the sale of securities for delivery in the current month, and a simultaneous agreement to repurchase substantially similar (same type, coupon and maturity) securities on a specified future date. Risks of entering into forward roll transactions include the potential inability of the counterparty to meet the terms of the agreement; the potential of the Fund to receive inferior securities at redelivery as compared to the securities sold to the counterparty; counterparty credit risk; and the potential pay down speed variance between the mortgage-backed pools. During the roll period, the Fund forgoes principal and interest paid on the securities. The Fund accounts for such dollar rolls as purchases and sales. No such investments were held by the Fund on October 31, 2016.
112
Notes to Financial Statements (continued)
| 2. | Significant Accounting Policies (continued) |
Interest Only Securities
The Series may invest in stripped mortgage-backed securities issued by the U.S. government, its agencies and instrumentalities. Stripped mortgage-backed securities are usually structured with two classes that receive different proportions of the interest and principal distributions on a pool of mortgage assets. In certain cases, one class will receive all of the interest (the interest-only or “IO” class), while the other class will receive all of the principal (the principal-only or “PO” class). The yield to maturity on IOs is sensitive to the rate of principal repayments (including prepayments) on the related underlying mortgage assets, and principal payments may have a material effect on yield to maturity. If the underlying mortgage assets experience greater than anticipated prepayments of principal, a Series may not fully recoup its initial investment in IOs.
Restricted Securities
Restricted securities are purchased in private placement transactions, are not registered under the Securities Act of 1933, as amended, and may have contractual restrictions on resale. Information regarding restricted securities is included at the end of each applicable Series’ Investment Portfolio.
Federal Taxes
Each Series’ policy is to comply with the provisions of the Internal Revenue Code applicable to regulated investment companies. The Series are not subject to federal income tax or excise tax to the extent that each Series distributes to shareholders each year its taxable income, including any net realized gains on investments, in accordance with requirements of the Internal Revenue Code. Accordingly, no provision for federal income tax or excise tax has been made in the financial statements.
Management evaluates its tax positions to determine if the tax positions taken meet the minimum recognition threshold in connection with accounting for uncertainties in income tax positions taken or expected to be taken for the purposes of measuring and recognizing tax liabilities in the financial statements. Recognition of tax benefits of an uncertain tax position is required only when the position is “more likely than not” to be sustained assuming examination by taxing authorities. At October 31, 2016, the Series have recorded no liability for net unrecognized tax benefits relating to uncertain income tax positions taken or expected to be taken in future tax returns.
The Series file income tax returns in the U.S. federal jurisdiction, various states and foreign jurisdictions, as required. No income tax returns are currently under investigation. The statute of limitations on the Series’ tax returns remains open for the years ended October 31, 2013 through October 31, 2016. The Fund is not aware of any tax positions for which it is reasonably possible that the total amounts of unrecognized tax benefits will significantly change in the next twelve months.
Foreign Taxes
Based on the Series’ understanding of the tax rules and rates related to income, gains and currency purchase/repatriation transactions for foreign jurisdictions in which they invest, the Series will provide for foreign taxes, and where appropriate, deferred foreign tax.
Distributions of Income and Gains
Distributions to shareholders of net investment income are made semi-annually. Distributions of net realized gains are made annually. An additional distribution may be necessary to avoid taxation of a Series. Distributions are recorded on the ex-dividend date.
Indemnifications
The Fund’s organizational documents provide former and current directors and officers with a limited indemnification against liabilities arising in connection with the performance of their duties to the Fund. In the normal course of business, the Fund may also enter into contracts that provide general indemnifications. The Fund’s maximum exposure under these arrangements is unknown as this would be dependent on future claims that may be made against the Fund. The risk of material loss from such claims is considered remote.
Other
The preparation of financial statements in conformity with GAAP requires management to make estimates and assumptions that affect the reported amounts of assets and liabilities and the disclosure of contingent assets and liabilities at the date of the
113
Notes to Financial Statements (continued)
| 2. | Significant Accounting Policies (continued) |
Other (continued)
financial statements and the reported amounts of income and expenses during the reporting period. Actual results could differ from those estimates.
| 3. | Transactions with Affiliates |
The Fund has an Investment Advisory Agreement (the “Agreement”) with the Advisor, for which each Series pays a fee, computed daily and payable monthly, at an annual rate of 0.60% for Pro-Blend® Conservative Term Series and 0.75% for Pro-Blend® Moderate Term Series, Pro-Blend® Extended Term Series and Pro-Blend® Maximum Term Series, of the Series’ average daily net assets.
Under the Agreement, personnel of the Advisor provide the Series with advice and assistance in the choice of investments and the execution of securities transactions, and otherwise maintain the Series’ organization. The Advisor also provides the Fund with necessary office space and fund administration and support services. The salaries of all officers of the Fund (except a percentage of the Fund’s Chief Compliance Officer’s salary, which is paid by the Fund), and of all Directors who are “affiliated persons” of the Fund, or of the Advisor, and all personnel of the Fund, or of the Advisor, performing services relating to research, statistical and investment activities, are paid by the Advisor. Each “non-affiliated” Director receives an annual stipend, which is allocated among all the active series of the Fund. In addition, these Directors also receive a fee per Board meeting attended plus a fee for each committee meeting attended and are reimbursed for travel and other out-of-pocket expenses incurred by them in connection with attending such meetings. The Fund also has an Audit Committee Chair, who receives an additional annual stipend for this role.
Class S shares of each Series are subject to a shareholder services fee in accordance with a shareholder services plan adopted by the Fund’s Board. The shareholder services fee is intended to compensate financial intermediaries, including affiliates of the Fund, in connection with the provision of direct client service, personal services, maintenance of shareholder accounts and reporting services. For these services, Class S of each Series pays a fee, computed daily and payable monthly, at an annual rate of 0.20% for Pro-Blend® Conservative Term Series Class S and 0.25% for Pro-Blend® Moderate Term Series Class S, Pro-Blend® Extended Term Series Class S and Pro-Blend® Maximum Term Series Class S, of the Class’ average daily net assets. The Fund has a Shareholder Services Agreement with the Advisor, for which the Advisor receives the shareholder services fee as stated above.
The Advisor has contractually agreed, until at least February 28, 2017, to waive its management fee and, if necessary, pay other operating expenses of the Series in order to maintain total direct annual fund operating expenses for the Series, exclusive of shareholder services fees and distribution and service fees (12b-1), at no more than the amounts presented in the following table, of average daily net assets each year.
| SERIES/CLASS | EXPENSE LIMIT | |||
Pro-Blend® Conservative Term Series | 0.70 | % | ||
Pro-Blend® Moderate Term Series | 0.85 | % | ||
Pro-Blend® Extended Term Series | 0.85 | % | ||
Pro-Blend® Maximum Term Series | 0.85 | % | ||
The Advisor is not eligible to recoup any expenses that have been waived or reimbursed in prior years.
Manning & Napier Investor Services, Inc., a registered broker-dealer affiliate of the Advisor, acts as distributor for the Fund’s shares. Each Series compensates the distributor for distributing and servicing the Series’ Class C and Class R shares pursuant to a distribution plan adopted under Rule 12b-1 of the 1940 Act, regardless of expenses actually incurred. Under the agreement, each Series pays distribution and services fees to the distributor at an annual rate of 1.00% of average daily net assets attributable to Class C shares and an annual rate of 0.50% of daily net assets attributable to Class R shares. There are no distribution and services fees on the Class S or Class I shares of each Series. The fees are accrued daily and paid monthly.
114
Notes to Financial Statements (continued)
| 3. | Transactions with Affiliates (continued) |
Pursuant to a master services agreement dated November 1, 2014, the Fund pays the Advisor an annual fee related to fund accounting and administration of 0.0085% on the first $25 billion of average daily net assets (excluding Target Series and Strategic Income Series); 0.0075% on the next $15 billion of average daily net assets (excluding Target Series and Strategic Income Series); and 0.0065% of the average daily net assets in excess of $40 billion (excluding Target Series and Strategic Income Series); plus a base fee of $30,400 per series. Transfer agent fees are charged to the Fund on a per account basis. Additionally, certain transaction and out-of-pocket expenses, including charges for reporting relating to the Fund’s compliance program, are charged. The Advisor has agreements with BNY Mellon Investment Servicing (U.S.) Inc. (“BNY”) under which BNY serves as sub-accountant services agent and sub-transfer agent.
Expenses not directly attributable to a series are allocated based on each series’ relative net assets or number of accounts, depending on the expense.
| 4. | Purchases and Sales of Securities |
For the year ended October 31, 2016, purchases and sales of securities, other than short-term securities, were as follows:
| SERIES | PURCHASES OTHER ISSUERS | GOVERNMENT | SALES OTHER ISSUERS | GOVERNMENT | ||||||||||||
Pro-Blend® Conservative Term Series | $ | 376,397,183 | $ | 400,039,802 | $ | 791,025,609 | $ | 152,381,622 | ||||||||
Pro-Blend® Moderate Term Series | 418,239,541 | 393,672,366 | 912,061,247 | 389,746,292 | ||||||||||||
Pro-Blend® Extended Term Series | 428,979,082 | 326,112,923 | 830,286,210 | 272,538,505 | ||||||||||||
Pro-Blend® Maximum Term Series | 327,777,843 | 74,168,320 | 568,479,150 | 56,111,595 | ||||||||||||
| 5. | Capital Stock Transactions |
Transactions in Class S, Class I, Class C and Class R shares:
| PRO-BLEND® CONSERVATIVE | FOR THE YEAR ENDED 10/31/16 | FOR THE YEAR ENDED 10/31/15 | ||||||||||||||
| TERM SERIES CLASS S: | SHARES | AMOUNT | SHARES | AMOUNT | ||||||||||||
Sold | 8,137,879 | $ | 105,720,605 | 18,315,666 | $ | 248,325,020 | ||||||||||
Reinvested | 911,739 | 11,734,285 | 4,681,003 | 61,749,359 | ||||||||||||
Repurchased | (24,175,034 | ) | (314,759,139 | ) | (33,267,040 | ) | (444,599,445 | ) | ||||||||
|
|
|
|
|
|
|
| |||||||||
Total | (15,125,416 | ) | $ | (197,304,249 | ) | (10,270,371 | ) | $ | (134,525,066 | ) | ||||||
|
|
|
|
|
|
|
| |||||||||
| PRO-BLEND® CONSERVATIVE | FOR THE YEAR ENDED 10/31/16 | FOR THE YEAR ENDED 10/31/15 | ||||||||||||||
| TERM SERIES CLASS I: | SHARES | AMOUNT | SHARES | AMOUNT | ||||||||||||
Sold | 7,100,011 | $ | 71,403,391 | 17,143,856 | $ | 177,419,658 | ||||||||||
Reinvested | 439,714 | 4,382,195 | 1,644,746 | 16,875,127 | ||||||||||||
Repurchased | (11,174,099 | ) | (112,468,497 | ) | (18,583,815 | ) | (191,941,015 | ) | ||||||||
|
|
|
|
|
|
|
| |||||||||
Total | (3,634,374 | ) | $ | (36,682,911 | ) | 204,787 | $ | 2,353,770 | ||||||||
|
|
|
|
|
|
|
| |||||||||
| PRO-BLEND® CONSERVATIVE | FOR THE YEAR ENDED 10/31/16 | FOR THE YEAR ENDED 10/31/15 | ||||||||||||||
| TERM SERIES CLASS C: | SHARES | AMOUNT | SHARES | AMOUNT | ||||||||||||
Sold | 2,177,798 | $ | 21,116,472 | 3,722,908 | $ | 37,470,118 | ||||||||||
Reinvested | 161,781 | 1,548,910 | 942,738 | 9,318,432 | ||||||||||||
Repurchased | (3,550,180 | ) | (34,497,672 | ) | (3,585,928 | ) | (35,861,902 | ) | ||||||||
|
|
|
|
|
|
|
| |||||||||
Total | (1,210,601 | ) | $ | (11,832,290 | ) | 1,079,718 | $ | 10,926,648 | ||||||||
|
|
|
|
|
|
|
| |||||||||
115
Notes to Financial Statements (continued)
| 5. | Capital Stock Transactions (continued) |
| PRO-BLEND® CONSERVATIVE | FOR THE YEAR ENDED 10/31/16 | FOR THE YEAR ENDED 10/31/15 | ||||||||||||||
| TERM SERIES CLASS R: | SHARES | AMOUNT | SHARES | AMOUNT | ||||||||||||
Sold | 463,382 | $ | 4,508,100 | 1,906,014 | $ | 19,558,088 | ||||||||||
Reinvested | 75,394 | 718,758 | 460,981 | 4,548,790 | ||||||||||||
Repurchased | (4,257,298 | ) | (40,644,504 | ) | (2,225,645 | ) | (22,250,689 | ) | ||||||||
|
|
|
|
|
|
|
| |||||||||
Total | (3,718,522 | ) | $ | (35,417,646 | ) | 141,350 | $ | 1,856,189 | ||||||||
|
|
|
|
|
|
|
| |||||||||
| PRO-BLEND® MODERATE | FOR THE YEAR ENDED 10/31/16 | FOR THE YEAR ENDED 10/31/15 | ||||||||||||||
| TERM SERIES CLASS S: | SHARES | AMOUNT | SHARES | AMOUNT | ||||||||||||
Sold | 11,782,569 | $ | 148,005,042 | 9,841,016 | $ | 133,659,387 | ||||||||||
Reinvested | 504,854 | 6,470,329 | 4,436,588 | 58,393,337 | ||||||||||||
Repurchased | (25,984,722 | ) | (331,641,148 | ) | (16,561,522 | ) | (222,988,894 | ) | ||||||||
|
|
|
|
|
|
|
| |||||||||
Total | (13,697,299 | ) | $ | (177,165,777 | ) | (2,283,918 | ) | $ | (30,936,170 | ) | ||||||
|
|
|
|
|
|
|
| |||||||||
| PRO-BLEND® MODERATE | FOR THE YEAR ENDED 10/31/16 | FOR THE YEAR ENDED 10/31/15 | ||||||||||||||
| TERM SERIES CLASS I: | SHARES | AMOUNT | SHARES | AMOUNT | ||||||||||||
Sold | 12,184,271 | $ | 120,189,097 | 22,942,326 | $ | 236,826,733 | ||||||||||
Reinvested | 1,031,526 | 10,090,970 | 5,791,706 | 58,397,631 | ||||||||||||
Repurchased | (57,444,748 | ) | (570,637,608 | ) | (18,328,886 | ) | (189,315,552 | ) | ||||||||
|
|
|
|
|
|
|
| |||||||||
Total | (44,228,951 | ) | $ | (440,357,541 | ) | 10,405,146 | $ | 105,908,812 | ||||||||
|
|
|
|
|
|
|
| |||||||||
| PRO-BLEND® MODERATE | FOR THE YEAR ENDED 10/31/16 | FOR THE YEAR ENDED 10/31/15 | ||||||||||||||
| TERM SERIES CLASS C: | SHARES | AMOUNT | SHARES | AMOUNT | ||||||||||||
Sold | 1,552,417 | $ | 15,565,660 | 3,438,701 | $ | 36,255,557 | ||||||||||
Reinvested | 96,547 | 953,121 | 1,314,238 | 13,421,637 | ||||||||||||
Repurchased | (3,731,569 | ) | (37,443,441 | ) | (3,283,675 | ) | (34,368,725 | ) | ||||||||
|
|
|
|
|
|
|
| |||||||||
Total | (2,082,605 | ) | $ | (20,924,660 | ) | 1,469,264 | $ | 15,308,469 | ||||||||
|
|
|
|
|
|
|
| |||||||||
| PRO-BLEND® MODERATE | FOR THE YEAR ENDED 10/31/16 | FOR THE YEAR ENDED 10/31/15 | ||||||||||||||
| TERM SERIES CLASS R: | SHARES | AMOUNT | SHARES | AMOUNT | ||||||||||||
Sold | 591,654 | $ | 6,162,155 | 1,147,914 | $ | 12,691,399 | ||||||||||
Reinvested | 39,632 | 406,221 | 425,292 | 4,494,502 | ||||||||||||
Repurchased | (1,659,349 | ) | (17,374,159 | ) | (1,757,868 | ) | (18,968,390 | ) | ||||||||
|
|
|
|
|
|
|
| |||||||||
Total | (1,028,063 | ) | $ | (10,805,783 | ) | (184,662 | ) | $ | (1,782,489 | ) | ||||||
|
|
|
|
|
|
|
| |||||||||
| PRO-BLEND® EXTENDED | FOR THE YEAR ENDED 10/31/16 | FOR THE YEAR ENDED 10/31/15 | ||||||||||||||
| TERM SERIES CLASS S: | SHARES | AMOUNT | SHARES | AMOUNT | ||||||||||||
Sold | 3,508,597 | $ | 56,162,543 | 7,974,818 | $ | 135,252,614 | ||||||||||
Reinvested | 813,262 | 12,791,402 | 4,108,042 | 67,311,568 | ||||||||||||
Repurchased | (18,119,243 | ) | (288,294,721 | ) | (16,011,485 | ) | (271,259,879 | ) | ||||||||
|
|
|
|
|
|
|
| |||||||||
Total | (13,797,384 | ) | $ | (219,340,776 | ) | (3,928,625 | ) | $ | (68,695,697 | ) | ||||||
|
|
|
|
|
|
|
| |||||||||
116
Notes to Financial Statements (continued)
| 5. | Capital Stock Transactions (continued) |
| PRO-BLEND® EXTENDED | FOR THE YEAR ENDED 10/31/16 | FOR THE YEAR ENDED 10/31/15 | ||||||||||||||
| TERM SERIES CLASS I: | SHARES | AMOUNT | SHARES | AMOUNT | ||||||||||||
Sold | 15,549,258 | $ | 139,601,163 | 21,641,197 | $ | 215,491,078 | ||||||||||
Reinvested | 1,212,119 | 10,957,758 | 5,366,866 | 51,371,465 | ||||||||||||
Repurchased | (33,161,451 | ) | (306,200,411 | ) | (28,360,442 | ) | (278,327,588 | ) | ||||||||
|
|
|
|
|
|
|
| |||||||||
Total | (16,400,074 | ) | $ | (155,641,490 | ) | (1,352,379 | ) | $ | (11,465,045 | ) | ||||||
|
|
|
|
|
|
|
| |||||||||
| PRO-BLEND® EXTENDED | FOR THE YEAR ENDED 10/31/16 | FOR THE YEAR ENDED 10/31/15 | ||||||||||||||
| TERM SERIES CLASS C: | SHARES | AMOUNT | SHARES | AMOUNT | ||||||||||||
Sold | 1,781,008 | $ | 17,596,311 | 3,680,325 | $ | 39,002,273 | ||||||||||
Reinvested | 423,056 | 4,097,847 | 1,889,213 | 19,333,856 | ||||||||||||
Repurchased | (4,078,435 | ) | (40,452,206 | ) | (3,063,806 | ) | (32,280,717 | ) | ||||||||
|
|
|
|
|
|
|
| |||||||||
Total | (1,874,371 | ) | $ | (18,758,048 | ) | 2,505,732 | $ | 26,055,412 | ||||||||
|
|
|
|
|
|
|
| |||||||||
| PRO-BLEND® EXTENDED | FOR THE YEAR ENDED 10/31/16 | FOR THE YEAR ENDED 10/31/15 | ||||||||||||||
| TERM SERIES CLASS R: | SHARES | AMOUNT | SHARES | AMOUNT | ||||||||||||
Sold | 479,395 | $ | 5,008,522 | 867,631 | $ | 9,809,946 | ||||||||||
Reinvested | 99,071 | 1,022,269 | 691,037 | 7,510,814 | ||||||||||||
Repurchased | (2,025,605 | ) | (21,565,560 | ) | (3,038,935 | ) | (33,874,880 | ) | ||||||||
|
|
|
|
|
|
|
| |||||||||
Total | (1,447,139 | ) | $ | (15,534,769 | ) | (1,480,267 | ) | $ | (16,554,120 | ) | ||||||
|
|
|
|
|
|
|
| |||||||||
| PRO-BLEND® MAXIMUM | FOR THE YEAR ENDED 10/31/16 | FOR THE YEAR ENDED 10/31/15 | ||||||||||||||
| TERM SERIES CLASS S: | SHARES | AMOUNT | SHARES | AMOUNT | ||||||||||||
Sold | 1,928,894 | $ | 34,381,606 | 4,819,223 | $ | 91,999,830 | ||||||||||
Reinvested | 304,037 | 5,358,978 | 3,256,309 | 58,952,533 | ||||||||||||
Repurchased | (10,119,249 | ) | (181,878,418 | ) | (9,214,146 | ) | (174,772,430 | ) | ||||||||
|
|
|
|
|
|
|
| |||||||||
Total | (7,886,318 | ) | $ | (142,137,834 | ) | (1,138,614 | ) | $ | (23,820,067 | ) | ||||||
|
|
|
|
|
|
|
| |||||||||
| PRO-BLEND® MAXIMUM | FOR THE YEAR ENDED 10/31/16 | FOR THE YEAR ENDED 10/31/15 | ||||||||||||||
| TERM SERIES CLASS I: | SHARES | AMOUNT | SHARES | AMOUNT | ||||||||||||
Sold | 8,025,547 | $ | 78,995,481 | 16,974,904 | $ | 179,969,886 | ||||||||||
Reinvested | 559,592 | 5,385,479 | 4,503,671 | 45,052,153 | ||||||||||||
Repurchased | (17,718,494 | ) | (173,868,245 | ) | (23,099,621 | ) | (241,883,377 | ) | ||||||||
|
|
|
|
|
|
|
| |||||||||
Total | (9,133,355 | ) | $ | (89,487,285 | ) | (1,621,046 | ) | $ | (16,861,338 | ) | ||||||
|
|
|
|
|
|
|
| |||||||||
| PRO-BLEND® MAXIMUM | FOR THE YEAR ENDED 10/31/16 | FOR THE YEAR ENDED 10/31/15 | ||||||||||||||
| TERM SERIES CLASS C: | SHARES | AMOUNT | SHARES | AMOUNT | ||||||||||||
Sold | 848,247 | $ | 8,735,126 | 1,365,586 | $ | 15,240,945 | ||||||||||
Reinvested | 99,480 | 1,005,922 | 842,671 | 8,874,715 | ||||||||||||
Repurchased | (1,250,355 | ) | (13,054,979 | ) | (1,062,866 | ) | (11,715,030 | ) | ||||||||
|
|
|
|
|
|
|
| |||||||||
Total | (302,628 | ) | $ | (3,313,931 | ) | 1,145,391 | $ | 12,400,630 | ||||||||
|
|
|
|
|
|
|
| |||||||||
117
Notes to Financial Statements (continued)
| 5. | Capital Stock Transactions (continued) |
| PRO-BLEND® MAXIMUM | FOR THE YEAR ENDED 10/31/16 | FOR THE YEAR ENDED 10/31/15 | ||||||||||||||
| TERM SERIES CLASS R: | SHARES | AMOUNT | SHARES | AMOUNT | ||||||||||||
Sold | 398,944 | $ | 4,781,313 | 775,959 | $ | 9,983,439 | ||||||||||
Reinvested | 37,016 | 435,094 | 443,767 | 5,404,603 | ||||||||||||
Repurchased | (1,226,472 | ) | (15,023,263 | ) | (1,244,285 | ) | (15,885,118 | ) | ||||||||
|
|
|
|
|
|
|
| |||||||||
Total | (790,512 | ) | $ | (9,806,856 | ) | (24,559 | ) | $ | (497,076 | ) | ||||||
|
|
|
|
|
|
|
| |||||||||
At October 31, 2016, one shareholder owned 10.2% of Pro-Blend® Moderate Term Series. The Target 2020 Series, another series of the Fund, owned 10.8% of Pro-Blend Moderate® Term Series. The Target 2030 Series, another series of the Fund, owned 10.7% shares of Pro-Blend Extended® Term Series. Investment activities of these shareholders may have a material effect on the respective Series.
| 6. | Financial Instruments and Loan Assignments |
The Series may trade in instruments including written and purchased options, forward foreign currency exchange contracts and futures contracts and other derivatives in the normal course of investing activities to assist in managing exposure to various market risks. The Series may be subject to various elements of risk which may involve, to a varying degree, elements of risk in excess of the amounts recognized for financial statement purposes. These risks include: the risk that changes in the value of a derivative may not correlate perfectly with the underlying asset, rate or index; counterparty credit risk related to over the counter derivative counterparties’ failure to perform under contract terms; liquidity risk related to the lack of a liquid market for these contracts allowing the fund to close out its position(s); and documentation risk relating to disagreement over contract terms. At October 31, 2016, Pro-Blend® Conservative Term Series, Pro-Blend® Moderate Term Series and Pro-Blend® Extended Term Series invested in options contracts (equity risk).
The Series may invest in a loan assignment of all or a portion of the loans. The Series has direct rights against the borrower on a loan when it purchases an assignment; however, the Series’ rights may be more limited than the lender from which it acquired the assignment and the Series may be able to enforce its rights only through an administrative agent. Loan assignments are vulnerable to market conditions and may become illiquid due to economic conditions or other events may reduce the demand for loan assignments and certain loan assignments which were liquid when purchased may become illiquid. At October 31, 2016, the Series did not hold any loan assignments.
| 7. | Foreign Securities |
Investing in securities of foreign companies and foreign governments involves special risks and considerations not typically associated with investing in securities of domestic companies and the U.S. Government. These risks include revaluation of currencies and future adverse political and economic developments. Moreover, securities of foreign companies and foreign governments and their markets may be less liquid and their prices more volatile than those of comparable domestic companies and the U.S. Government.
| 8. | Federal Income Tax Information |
The amount and characterization of certain income and capital gains to be distributed are determined in accordance with federal income tax regulations, which may differ from GAAP. These differences are primarily due to differing book and tax treatments in the timing of the recognition on net investment income or gains and losses, including foreign currency gains and losses, losses deferred due to wash sales, investments in passive foreign investment companies (PFICs), real estate investment trusts and the realization for tax purposes of unrealized gains/losses on certain futures. Each Series may periodically make reclassifications among its capital accounts to reflect income and gains available for distribution (or available capital loss carryovers) under income tax regulations, without impacting the Series’ net asset value. For the fiscal year ended October 31, 2016, $1,524,816, $2,206,624 and $2,291,385 was reclassified within the capital accounts from Undistributed Net Investment Income to Accumulated Net Realized Gain on Investments for Pro-Blend® Conservative Term Series, Pro-Blend® Moderate Term Series
118
Notes to Financial Statements (continued)
| 8. | Federal Income Tax Information (continued) |
and Pro-Blend® Extended Term Series. For the fiscal year ended October 31, 2016, amounts were reclassified within the capital accounts to increase Additional Paid in Capital by $591,808, increase Distributions in Excess of Net Investment Income by $34,440 and decrease Accumulated Net Realized Gain on Investments by $626,248 for Pro-Blend® Maximum Term Series. Any such reclassifications are not reflected in the financial highlights.
The tax character of distributions paid were as follows:
PRO-BLEND® CONSERVATIVE TERM SERIES | PRO-BLEND® MODERATE TERM SERIES | |||||||||||||||
| FOR THE YEAR ENDED 10/31/16 | FOR THE YEAR ENDED 10/31/15 | FOR THE YEAR ENDED 10/31/16 | FOR THE YEAR ENDED 10/31/15 | |||||||||||||
Ordinary income | $ | 20,987,785 | $ | 38,358,300 | $ | 15,051,676 | $ | 35,643,078 | ||||||||
Long-term capital gains | — | 67,058,671 | 5,306,383 | 114,044,175 | ||||||||||||
PRO-BLEND® EXTENDED TERM SERIES | PRO-BLEND® MAXIMUM TERM SERIES | |||||||||||||||
| FOR THE YEAR ENDED 10/31/16 | FOR THE YEAR ENDED 10/31/15 | FOR THE YEAR ENDED 10/31/16 | FOR THE YEAR ENDED 10/31/15 | |||||||||||||
Ordinary income | $ | 11,654,299 | $ | 44,669,202 | $ | 3,085,810 | $ | 52,054,188 | ||||||||
Long-term capital gains | 26,083,286 | 141,837,787 | 13,649,400 | 112,597,715 | ||||||||||||
At October 31, 2016, the tax basis of components of distributable earnings and the net unrealized appreciation based on the identified cost of investments for federal income tax purposes were as follows:
| PRO-BLEND® CONSERVATIVE TERM SERIES | PRO-BLEND® MODERATE TERM SERIES | PRO-BLEND® TERM SERIES | PRO-BLEND® TERM SERIES | |||||||||||||
Cost for federal income tax purposes | $ | 1,128,011,765 | $ | 932,939,113 | $ | 1,003,573,315 | $ | 708,615,499 | ||||||||
Unrealized appreciation | 55,042,141 | 62,333,409 | 85,796,865 | 81,902,518 | ||||||||||||
Unrealized depreciation | (23,876,917 | ) | (27,669,474 | ) | (36,776,909 | ) | (48,099,284 | ) | ||||||||
|
|
|
|
|
|
|
| |||||||||
Net unrealized appreciation | $ | 31,165,224 | $ | 34,663,935 | $ | 49,019,956 | $ | 33,803,234 | ||||||||
|
|
|
|
|
|
|
| |||||||||
Undistributed ordinary income | $ | 6,944,013 | $ | 5,903,665 | $ | 7,228,511 | $ | 4,172,263 | ||||||||
Undistributed long-term gains | $ | 2,013,703 | $ | 13,690,624 | $ | 9,067,029 | $ | 15,959,493 | ||||||||
As of October 31, 2016, the capital loss carryover utilized in the current year was $6,968,352 for Pro-Blend® Conservative Term Series.
119
Report of Independent Registered Public Accounting Firm
To the Board of Directors of Manning & Napier Fund, Inc. and Shareholders of
Pro-Blend® Conservative Term Series, Pro-Blend® Moderate Term Series,
Pro-Blend® Extended Term Series and Pro-Blend® Maximum Term Series:
In our opinion, the accompanying statements of assets and liabilities, including the investment portfolios, and the related statements of operations and of changes in net assets and the financial highlights present fairly, in all material respects, the financial position of the Pro-Blend® Conservative Term Series, Pro-Blend® Moderate Term Series, Pro-Blend® Extended Term Series and Pro-Blend® Maximum Term Series (each a series of Manning & Napier Fund, Inc., hereafter collectively referred to as the “Series”) as of October 31, 2016, the results of each of their operations for the year then ended, the changes in each of their net assets for each of the two years in the period then ended and the financial highlights for each of the five years in the period then ended, in conformity with accounting principles generally accepted in the United States of America. These financial statements and financial highlights (hereafter referred to as “financial statements”) are the responsibility of the Series’ management. Our responsibility is to express an opinion on these financial statements based on our audits. We conducted our audits of these financial statements in accordance with the standards of the Public Company Accounting Oversight Board (United States). Those standards require that we plan and perform the audit to obtain reasonable assurance about whether the financial statements are free of material misstatement. An audit includes examining, on a test basis, evidence supporting the amounts and disclosures in the financial statements, assessing the accounting principles used and significant estimates made by management, and evaluating the overall financial statement presentation. We believe that our audits, which included confirmation of securities as of October 31, 2016 by correspondence with the custodian and brokers, provide a reasonable basis for our opinion.

New York, New York
December 16, 2016
120
Supplemental Tax Information
(unaudited)
All reportings are based on financial information available as of the date of this annual report and, accordingly, are subject to change.
For federal income tax purposes, each of the Series reports for the current fiscal year the amount disclosed below or, if different, the maximum amount allowable under the tax law as qualified dividend income (“QDI”).
| Series | QDI | |||
Pro-Blend® Conservative Term Series | $7,215,156 | |||
Pro-Blend® Moderate Term Series | 6,672,299 | |||
Pro-Blend® Extended Term Series | 8,586,230 | |||
Pro-Blend® Maximum Term Series | 8,644,852 | |||
For corporate shareholders, the percentage of investment income (dividend income plus short-term gain, if any) that qualifies for the dividends received deduction (DRD) for the current fiscal year is as follows:
| Series | DRD% | |||
Pro-Blend® Conservative Term Series | 29.66% | |||
Pro-Blend® Moderate Term Series | 31.44% | |||
Pro-Blend® Extended Term Series | 45.21% | |||
Pro-Blend® Maximum Term Series | 81.25% | |||
The Series designate Long-Term Capital Gain dividends pursuant to Section 852(b)(3) of the Code for the fiscal year ended October 31, 2016 as follows:
| Series | ||||
Pro-Blend® Conservative Term Series | $2,114,388 | |||
Pro-Blend® Moderate Term Series | 14,584,484 | |||
Pro-Blend® Extended Term Series | 9,527,369 | |||
Pro-Blend® Maximum Term Series | 16,757,469 | |||
121
Directors’ and Officers’ Information
(unaudited)
The Statement of Additional Information provides additional information about the Fund’s directors and officers and can be obtained without charge by calling 1-800-466-3863, at www.manningnapieradvisors.com, or on the EDGAR Database on the SEC Internet web site (http:// www.sec.gov). The following chart shows certain information about the Fund’s officers and directors, including their principal occupations during the last five years. Unless specific dates are provided, the individuals have held the listed positions for longer than five years.
Interested Director/Officer
Name: | Michele T. Mosca* | |
| Address: | 290 Woodcliff Drive Fairport, NY 14450 | |
| Age: | 44 | |
| Current Position(s) Held with Fund: | Principal Executive Officer, President, Chairman & Director | |
| Term of Office1 & Length of Time Served: | Indefinite – Chairman and Director since August 2016 | |
| Principal Occupation(s) During Past 5 Years: | Managing Director, Funds Group (2009-present)- Manning & Napier Advisors, LLC; President, Director (2015-present) - Manning & Napier Investor Services, Inc.; Chief Executive Officer, President (2016-present) - Rainier Investment Management Mutual Funds Holds or has held one or more of the following titles for various subsidiaries and affiliates: President, Director | |
| Number of Portfolios Overseen within Fund Complex: | 40 | |
| Other Directorships Held Outside Fund Complex: | Trustee - Rainier Investment Management Mutual Funds (six portfolios) (2016- present) | |
| Independent Directors | ||
| Name: | Stephen B. Ashley | |
| Address: | 290 Woodcliff Drive | |
| Fairport, NY 14450 | ||
| Age: | 76 | |
| Current Position(s) Held with Fund: | Director, Audit Committee Member, Governance & Nominating Committee Member | |
| Term of Office & Length of Time Served: | Indefinite - Since 1996 | |
| Principal Occupation(s) During Past 5 Years: | Chairman, Director & Chief Executive Officer (1997 to present)- The Ashley Group (property management and investment). Director (1995-2008) and Chairman (non-executive) (2004-2008) - Fannie Mae (mortgage) | |
| Number of Portfolios Overseen within Fund Complex: | 40 | |
| Other Directorships Held Outside Fund Complex: | Fannie Mae (mortgage) (1995-2008) | |
| The Ashley Group (property management and investment) (1995-2008) Genesee Corporation (holding company) (1987-2007) | ||
| Name: | Paul A. Brooke | |
| Address: | 290 Woodcliff Drive Fairport, NY 14450 | |
| Age: | 70 | |
| Current Position(s) Held with Fund: | Director, Audit Committee Member, Governance & Nominating Committee Member | |
| Term of Office & Length of Time Served: | Indefinite - Since 2007 | |
| Principal Occupation(s) During Past 5 Years: | Chairman & CEO (2005-2009)- Ithaka Acquisition Corporation (investments); Chairman (2007-2009)- Alsius Corporation (investments); Managing Member (1991-present)- PMSV Holdings LLC(investments); Managing Member (2010-present)- Venbio (investments). | |
| Number of Portfolios Overseen within Fund Complex: | 40 | |
| Other Directorships Held Outside Fund Complex: | Incyte Corp. (biotech) (2000-present) ViroPharma, Inc. (speciality pharmaceuticals) (2000-2014) HLTH Corp (WebMD) (information) (2000-2010) Cheyne Capital International (investment) (2000-present) GMP Companies (investment) (2000-2011) Cytos Biotechnology Ltd (biotechnology) (2012-present) | |
122
Directors’ and Officers’ Information
(unaudited)
| Independent | Directors (continued) |
| Name: | Peter L. Faber | |
| Address: | 290 Woodcliff Drive | |
| Fairport, NY 14450 | ||
| Age: | 78 | |
| Current Position(s) Held with Fund: | Director, Governance & Nominating Committee Member | |
| Term of Office & Length of Time Served: | Indefinite - Since 1987 | |
| Principal Occupation(s) During Past 5 Years: | Senior Counsel (2006-2012), Partner (1995-2006 & 2013-present)- McDermott, Will & Emery LLP (law firm) | |
| Number of Portfolios Overseen within Fund Complex: | 40 | |
| Other Directorships Held Outside Fund Complex: | Boston Early Music Festival (non-profit) (2007-present) Amherst Early Music, Inc. (non-profit) (2009-present) Gotham Early Music Scene, Inc. (non-profit) (2009-present) Partnership for New York City, Inc. (non-profit) (1989-2010) New York Collegium (non-profit) (2004-2011) | |
| Name: | Harris H. Rusitzky | |
| Address: | 290 Woodcliff Drive | |
| Fairport, NY 14450 | ||
| Age: | 81 | |
| Current Position(s) Held with Fund: | Director, Audit Committee Member, Governance & Nominating Committee Member | |
| Term of Office & Length of Time Served: | Indefinite - Since 1985 | |
| Principal Occupation(s) During Past 5 Years: | President (1994-present)- The Greening Group (business consultants); | |
| Partner (2006-present)- The Restaurant Group (restaurants) | ||
| Number of Portfolios Overseen within Fund Complex: | 40 | |
| Other Directorships Held Outside Fund Complex: | Rochester Institute of Technology (university) (1972-present) Culinary Institute of America (non-profit college) (1985-present) George Eastman House (museum) (1988-present) National Restaurant Association (restaurant trade organization) (1978-present) | |
| Name: | Chester N. Watson | |
| Address: | 290 Woodcliff Drive | |
| Fairport, NY 14450 | ||
| Age: | 66 | |
| Current Position(s) Held with Fund: | Director, Audit Committee Chairman, Governance & Nominating Committee Member | |
| Term of Office & Length of Time Served: | Indefinite - Since 2012 | |
| Principal Occupation(s) During Past 5 Years: | General Auditor (2003-2011)- General Motors Company (auto manufacturer) | |
| Number of Portfolios Overseen within Fund Complex: | 40 | |
| Other Directorships Held Outside Fund Complex: | Rochester Institute of Technology (university) (2005-present) | |
| Officers | ||
| Name: | Jeffrey S. Coons, Ph.D., CFA® | |
| Address: | 290 Woodcliff Drive | |
| Fairport, NY 14450 | ||
| Age: | 53 | |
| Current Position(s) Held with Fund: | Vice President | |
| Term of Office1 & Length of Time Served: | Since 2004 | |
| Principal Occupation(s) During Past 5 Years: | President since 2010, Co-Director of Research (2002-2015) - Manning & Napier Advisors, LLC | |
| Holds one or more of the following titles for various subsidiaries and affiliates: President, Director, Treasurer or Senior Trust Officer. | ||
| Number of Portfolios Overseen within Fund Complex: | 40 | |
| Other Directorships Held Outside Fund Complex: | N/A | |
123
Directors’ and Officers’ Information
(unaudited)
Officers (continued)
| Name: | Elizabeth Craig | |
| Address: | 290 Woodcliff Drive | |
| Fairport, NY 14450 | ||
| Age: | 29 | |
| Current Position(s) Held with Fund: | Corporate Secretary | |
| Term of Office1 & Length of Time Served: | Since 2016 | |
| Principal Occupation(s) During Past 5 Years: | Fund Administration Manager since 2015; Mutual Fund Compliance Specialist (2009-2015) - Manning & Napier Advisors, LLC; Assistant Corporate Secretary (2011-2016)- Manning & Napier Fund, Inc. | |
| Number of Portfolios Overseen within Fund Complex: | 40 | |
| Other Directorships Held Outside Fund Complex: | N/A | |
| Name: | Christine Glavin | |
| Address: | 290 Woodcliff Drive Fairport, NY 14450 | |
| Age: | 50 | |
| Current Position(s) Held with Fund: | Principal Financial Officer, Chief Financial Officer | |
| Term of Office1 & Length of Time Served: | Principal Financial Officer (2002-present); Chief Financial Officer (2001-present) | |
| Principal Occupation(s) During Past 5 Years: | Director of Fund Reporting (2011-present); Fund Reporting Manager (1997-2011)- Manning & Napier Advisors, LLC; Assistant Treasurer (2008-present)- Exeter Trust Company | |
| Number of Portfolios Overseen within Fund Complex: | 40 | |
| Other Directorships Held Outside Fund Complex: | N/A | |
| Name: | Jodi L. Hedberg | |
| Address: | 290 Woodcliff Drive Fairport, NY 14450 | |
| Age: | 48 | |
| Current Position(s) Held with Fund: | Chief Compliance Officer, Anti-Money Laundering Compliance Officer | |
| Term of Office1 & Length of Time Served: | Chief Compliance Officer (2004-present); Anti-Money Laundering Compliance Officer (2002-present); Corporate Secretary (1997-2016) | |
| Principal Occupation(s) During Past 5 Years: | Director of Compliance (2005-present); Compliance Manager (1995-2005) - Manning & Napier Advisors, LLC and affiliates; Corporate Secretary- Manning & Napier Investor Services, Inc. since 2006 | |
| Number of Portfolios Overseen within Fund Complex: | 40 | |
| Other Directorships Held Outside Fund Complex: | N/A | |
| Name: | Amy Williams | |
| Address: | 290 Woodcliff Drive | |
| Fairport, NY 14450 | ||
| Age: | 54 | |
| Current Position(s) Held with Fund: | Assistant Corporate Secretary | |
| Term of Office1 & Length of Time Served: | Since 2016 | |
| Principal Occupation(s) During Past 5 Years: | Director of Fund Documentation (1992-present) – Manning & Napier Advisors, LLC Holds one or more of the following titles for various affiliates; Director | |
| Number of Portfolios Overseen within Fund Complex: | 40 | |
| Other Directorships Held Outside Fund Complex: | N/A | |
| Name: | Richard Yates | |
| Address: | 290 Woodcliff Drive Fairport, NY 14450 | |
| Age: | 51 | |
| Current Position(s) Held with Fund: | Chief Legal Officer | |
| Term of Office1 & Length of Time Served: | Chief Legal Officer since 2004 | |
| Principal Occupation(s) During Past 5 Years: | Counsel- Manning & Napier Advisors, LLC and affiliates (2000-present); Holds one or more of the following titles for various affiliates; Director or Corporate Secretary | |
| Number of Portfolios Overseen within Fund Complex: | 40 | |
| Other Directorships Held Outside Fund Complex: | N/A |
*Interested Director, within the meaning of the Investment Company Act of 1940 by reason of her position with the Fund’s investment advisor. Ms. Mosca serves as the Managing Director of the Funds Group for Manning & Napier Advisors, LLC.
1The term of office of all officers shall be one year and until their respective successors are chosen and qualified, or his or her earlier resignation or removal as provided in the Fund’s By-Laws.
124
{This page intentionally left blank}
125
Literature Requests
(unaudited)
Proxy Voting Policies and Procedures
A description of the policies and procedures that the Fund uses to determine how to vote proxies relating to portfolio securities is available, without charge, upon request:
| By phone | 1-800-466-3863 | |||
| On the Securities and Exchange | ||||
| Commission’s (SEC) web site | http://www.sec.gov |
Proxy Voting Record
Information regarding how the Fund voted proxies relating to portfolio securities during the most recent 12-month period ended June 30th is available, without charge, upon request:
| By phone | 1-800-466-3863 | |||
| On the SEC’s web site | http://www.sec.gov |
Quarterly Portfolio Holdings
The Series’ complete schedule of portfolio holdings for the 1st and 3rd quarters of each fiscal year are provided on Form N-Q, and are available, without charge, upon request:
| By phone | 1-800-466-3863 | |||
| On the SEC’s web site | http://www.sec.gov |
The Series’ Form N-Q may be reviewed and copied at the SEC’s Public Reference Room in Washington, D.C. Information on the operation of the Public Reference Room may be obtained by calling 1-800-SEC-0330.
Prospectus and Statement of Additional Information (SAI)
For more information about any of the Manning & Napier Fund, Inc. Series, you may obtain a prospectus and SAI at www.manning-napier.com or by calling (800) 466-3863. Before investing, carefully consider the objectives, risks, charges and expenses of the investment and read the prospectus carefully as it contains this and other information about the investment company. In addition, this information can be found on the SEC’s web site, http://www.sec.gov.
Additional information available at www.manning-napier.com
1. Fund Holdings - Month-End
2. Fund Holdings - Quarter-End
3. Shareholder Report - Annual
4. Shareholder Report - Semi-Annual
The Fund also offers electronic notification or “e-delivery” when certain documents are available on-line to be downloaded or reviewed. Direct shareholders can elect to receive electronic notification when shareholder reports, prospectus updates, and/or quarterly statements are available. If you do not currently have on-line access to your account, you can establish access by going to www.manning-napier.com, click on “Login” in the top corner of the page, and follow the prompts to self-enroll. Once enrolled, you can set your electronic notification preferences by clicking on the Account Options tab located within the green toolbar and then select E-Delivery Option. Should you have any questions on either how to establish on-line access or how to update your account settings, please contact Investor Services at 1-800-466-3863.
The Manning & Napier Fund, Inc. is managed by Manning & Napier Advisors, LLC. Manning & Napier Investor Services, Inc., an affiliate of Manning & Napier Advisors, LLC, is the distributor of the Fund shares.
MNPRO-10/16-AR

Quality Equity Series
Management Discussion and Analysis
(unaudited)
Dear Shareholders:
U.S. and international equity markets delivered positive returns during the past year. Emerging market equities were the notable outperformers, driven by investors’ search for yield and their increased appetite for riskier assets. Abating unease related to Chinese growth, a relatively stable U.S. dollar, the year-to-date upturn in commodity prices, and increased liquidity amid generally easy policy across the globe also provided tailwinds for emerging market assets. Defensive sectors outperformed cyclicals for most of the period, since defensive securities tend to benefit from low interest rate environments and yield is a big component of total return. But the trend reversed amid a mid-year rotation away from crowded defensive sectors into cyclical stocks, and investors have since shown a preference for growth over yield.
Meanwhile, U.S. and global economic growth continued at a slow pace. Although various asset classes performed positively, the year was punctuated by bouts of market volatility. Ongoing concern regarding the price of oil and other commodities, speculation surrounding the trajectory of global economic growth and central bank policy, and political uncertainty — including the unexpected Brexit vote — fueled investor unease and served as volatility catalysts. Going forward, we anticipate an increased likelihood of further gyrations in financial markets as U.S. and global economic growth continues at a muted pace.
Enclosed, we highlight how we are positioned amid the current economic environment, and provide our outlook of what to expect in financial markets. We hope that you find this information to be helpful.
As always, we appreciate your business.
Sincerely,
Manning & Napier Advisors, LLC
1
Quality Equity Series
Fund Commentary
(unaudited)
Investment Objective
Using a disciplined screening process combined with fundamental analysis, the Series seeks to maximize long-term growth by investing in companies with quality characteristics. The Series first uses a disciplined screening process to identify companies with characteristics that are consistent with stable businesses and then conducts fundamental analyses of the identified companies. The Series primarily invests in stocks of large- and mid-size companies with strong competitive positions, high free cash flow yields, and consistent financial characteristics in order to build a concentrated portfolio of high-quality stocks.
Performance Commentary
Developed equity markets generally delivered positive absolute returns for the twelve-month period ended October 31, 2016. The MSCI World (World) Index returned 1.18%. The Quality Equity Series delivered positive absolute returns, but underperformed the World Index on a relative basis.
The total effect of Health Care — including stock selection and an overweight compared to the benchmark — was a major detractor from relative performance during the past year. Individual holdings in the Series including pharmaceutical distributor McKesson (2.04%*) and pharmacy benefit manager (PBM) Express Scripts (2.49%*) challenged relative returns. One of the factors that weighed on the Health Care sector was general concern regarding drug pricing due to pre-election rhetoric. This headwind has largely abated following the election given easing concerns about government involvement in drug pricing amid a Republican election sweep.
Regarding McKesson specifically, we believe the company can help control the rise of health care costs, a theme we are pursuing within the Series. By virtue of its infrastructure and scale, McKesson is able to transport drugs cheaper than other companies, which helps keep down overall health care costs. Similarly, Express Scripts’ strong market share and scale creates a sustainable competitive advantage as it is able to more effectively negotiate for lower prices from drug companies and, in turn, offer more competitive pricing to customers. We remain positive about the longer-term story and business model of PBMs overall.
Offsetting a portion of the relative performance headwind was equity selection in Consumer Discretionary and Information
Technology, which aided relative returns. The Series’ underweight to Financials and overweight to Consumer Staples compared to the benchmark aided relative returns as well.
Within the Series, we are focused on identifying and investing in attractively valued companies with secular (i.e., long-term) tailwinds and strong market positions. These companies are typically leaders in their respective industry and possess strong competitive positions underscored by a sustainable competitive advantage. Some of the key traits we look for include a leading and/or growing share of the business’ target market, a strong position in an expanding industry, differentiated product/service offerings, and pricing power. These companies have the scale, experience, and financial strength to largely control their own destiny, and are also cash generative with high free cash flow yield. They have a track record of providing growth for investors while affording a greater degree of management against downside risk than the broader equity market, thereby providing investors with some stability.
As we look toward 2017, we expect global economic growth to persist at a slow pace. Broadly speaking, valuations in the developed world are on the expensive side of neutral. This backdrop suggests muted long-term returns going forward, so we are targeting companies exposed to secular (i.e., long-term) growth trends in an effort to generate above market returns. We continue to anticipate gyrations in equity markets due to catalysts such as the potential for global growth to deviate from expectations, diverging central bank policies, commodity price pressures, and geopolitical risks. However, our indicators point to volatility still being a buying opportunity and do not suggest capital risk is a significant near-term concern. In this environment, an active, flexible, and selective approach can help avoid overvalued areas of the market, tactics that Manning & Napier has employed for over 45 years as an active investment manager.
Please see page 4 for additional performance information as of October 31, 2016.
2
Quality Equity Series
Fund Commentary
(unaudited)
Performance Commentary (continued)
Performance data quoted represents past performance and does not guarantee future results. The investment return and principal value of an investment will fluctuate, so that an investor’s shares, when redeemed, may be worth more or less than their original cost. Current performance may be higher or lower than that quoted; investors can obtain the most recent month-end performance at www.manning-napier.com or by calling (800) 466-3863.
Performance for the Quality Equity Series Class S shares is provided above. Performance for the Quality Equity Series Class I shares may be higher or lower based on the Class’ underlying expenses.
*Represents the percent of the Series’ holdings as of 10/31/2016. Calculations are based on a portfolio that excludes cash. Investments will change over time.
All investments involve risks, including possible loss of principal. As with any stock fund, the value of your investment will fluctuate in response to stock market movements. Investing in the Series will also involve a number of other risks, including issuer-specific risk, mid-cap risk, and the risk that the investment approach may not be successful. Funds that invest in foreign countries may be subject to fluctuating currency values, different accounting standards, and economic and political instability. The value of the Series may be affected by changes in exchange rates between foreign currencies and the U.S. dollar.
3
Quality Equity Series
Performance Update as of October 31, 2016
(unaudited)
AVERAGE ANNUAL TOTAL RETURNS AS OF OCTOBER 31, 2016 | ||||||||
ONE YEAR1 | TOTAL RETURN SINCE INCEPTION2 | |||||||
Manning & Napier Fund, Inc. - Quality Equity Series - Class S3 | 0.31 | % | -0.70 | % | ||||
Manning & Napier Fund, Inc. - Quality Equity Series - Class I3 | 0.55 | % | -0.46 | % | ||||
MSCI World Index4 | 1.18 | % | -1.66 | % | ||||
The following graph compares the value of a $10,000 investment in the Manning & Napier Fund, Inc. - Quality Equity Series - Class S from its inception2 (June 1, 2015) to present (October 31, 2016) to the MSCI World Index.
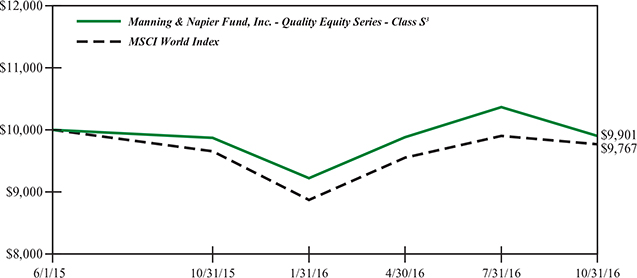
1 The returns shown are based on net asset values calculated for shareholder transactions and may differ from the returns shown in the financial highlights, which reflect adjustments made to the net asset values in accordance with accounting principles generally accepted in the United States of America.
2 Performance numbers for the Series and the Index are calculated from June 1, 2015, the Series’ inception date.
3 The Series’ performance does not reflect the deduction of taxes that a shareholder would pay on fund distributions or the redemption of shares. The Series’ performance is historical and may not be indicative of future results. The performance returns shown are inclusive of the net expense ratio of the Series. For the year end October 31, 2016, this annualized net expense ratio was 0.95% for Class S and 0.70% for Class I. The annualized gross expense ratio, which does not account for any voluntary or contractual waivers currently in effect, was 8.53% for Class S and 8.28% for Class I for the year ended October 31, 2016.
4 The MSCI World Index is a free float-adjusted market capitalization index that is designed to measure global developed market equity performance and consists of 23 developed market country indices. The Index returns do not reflect any fees or expenses. The Index is denominated in U.S. dollars. The Index returns are net of withholding taxes. They assume daily reinvestment of net dividends thus accounting for any applicable dividend taxation. Index returns provided by Bloomberg.
4
Quality Equity Series
Shareholder Expense Example
(unaudited)
As a shareholder of the Series, you incur ongoing costs, including management fees, shareholder service fees and other Series expenses. This example is intended to help you understand your ongoing costs (in dollars) of investing in the Series and to compare these costs with the ongoing costs of investing in other mutual funds.
The example is based on an investment of $1,000 invested at the beginning of the period and held for the entire period (May 1, 2016 to October 31, 2016).
Actual Expenses
The Actual lines of the table below provide information about actual account values and actual expenses. You may use the information in this line, together with the amount you invested, to estimate the expenses that you paid over the period. Simply divide your account value by $1,000 (for example, an $8,600 account value divided by $1,000 = 8.6), then multiply the result by the number in the Actual line for the Class in which you have invested under the heading entitled “Expenses Paid During Period” to estimate the expenses you paid on your account during this period.
Hypothetical Example for Comparison Purposes
The Hypothetical lines of each Class in the table below provide information about hypothetical account values and hypothetical expenses based on the Class’ actual expense ratio and an assumed rate of return of 5% per year before expenses, which is not the Class’ actual return. The hypothetical account values and expenses may not be used to estimate the actual ending account balance or expenses you paid during the period. You may use this information to compare the ongoing costs of investing in the Series and other funds. To do so, compare this 5% hypothetical example for the class in which you have invested with the 5% hypothetical examples that appear in the shareholder reports of the other funds.
Please note that the expenses shown in the table are meant to highlight your ongoing costs only and do not reflect any transaction costs, such as sales charges (loads), redemptions fees, or exchange fees that you may incur in other mutual funds. Therefore, the second line of the table is useful in comparing ongoing costs only, and will not help you determine the relative total costs of owning different funds.
| BEGINNING ACCOUNT VALUE 5/1/16 | ENDING ACCOUNT VALUE 10/31/16 | EXPENSES PAID DURING PERIOD 5/1/16-10/31/16* | ANNUALIZED EXPENSE RATIO | |||||
Class S | ||||||||
Actual | $1,000.00 | $1,002.00 | $4.78 | 0.95% | ||||
Hypothetical (5% return before expenses) | $1,000.00 | $1,020.36 | $4.82 | 0.95% | ||||
Class I | ||||||||
Actual | $1,000.00 | $1,003.10 | $3.52 | 0.70% | ||||
Hypothetical (5% return before expenses) | $1,000.00 | $1,021.62 | $3.56 | 0.70% |
*Expenses are equal to the Class’ annualized expense ratio (for the six-month period), multiplied by the average account value over the period, multiplied by 184/366 to reflect the one-half year period. Expenses are based on the most recent fiscal half year; therefore, the expense ratios stated above may differ from the expense ratios stated in the financial highlights, which are based on one-year data. The Class’ total return would have been lower had certain expenses not been waived during the period.
5
Quality Equity Series
Portfolio Composition as of October 31, 2016
(unaudited)
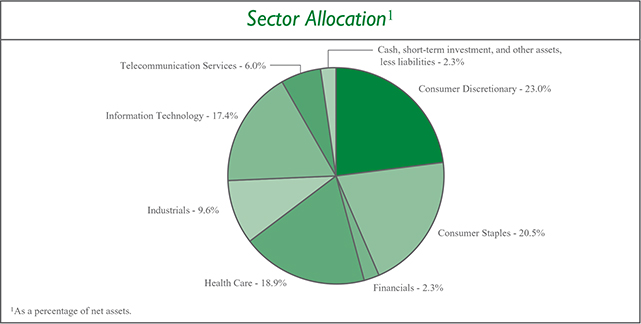
6
Quality Equity Series
Investment Portfolio - October 31, 2016
| SHARES | VALUE (NOTE 2) | |||||||
COMMON STOCKS - 97.7% | ||||||||
Consumer Discretionary - 23.0% | ||||||||
Internet & Direct Marketing Retail - 3.1% | ||||||||
The Priceline Group, Inc.* | 40 | $ | 58,969 | |||||
|
| |||||||
Media - 6.3% | ||||||||
Discovery Communications, Inc. - Class A* | 2,380 | 62,142 | ||||||
WPP plc (United Kingdom)1 | 2,720 | 59,060 | ||||||
|
| |||||||
| 121,202 | ||||||||
|
| |||||||
Multiline Retail - 3.4% | ||||||||
Dollar General Corp. | 930 | 64,254 | ||||||
|
| |||||||
Specialty Retail - 2.5% | ||||||||
Kingfisher plc (United Kingdom)1 | 11,010 | 48,636 | ||||||
|
| |||||||
Textiles, Apparel & Luxury Goods - 7.7% | ||||||||
Kering (France)1 | 310 | 68,780 | ||||||
LVMH Moet Hennessy Louis Vuitton SE (France)1 | 330 | 60,080 | ||||||
NIKE, Inc. - Class B | 370 | 18,567 | ||||||
|
| |||||||
| 147,427 | ||||||||
|
| |||||||
Total Consumer Discretionary | 440,488 | |||||||
|
| |||||||
Consumer Staples - 20.5% | ||||||||
Beverages - 8.2% | ||||||||
Diageo plc (United Kingdom)1 | 2,180 | 58,024 | ||||||
PepsiCo, Inc. | 460 | 49,312 | ||||||
Pernod Ricard S.A. (France)1 | 410 | 48,759 | ||||||
|
| |||||||
| 156,095 | ||||||||
|
| |||||||
Food & Staples Retailing - 2.9% | ||||||||
CVS Health Corp. | 670 | 56,347 | ||||||
|
| |||||||
Food Products - 3.4% | ||||||||
Mead Johnson Nutrition Co. | 610 | 45,610 | ||||||
Nestle S.A. (Switzerland)1 | 260 | 18,854 | ||||||
|
| |||||||
| 64,464 | ||||||||
|
| |||||||
Personal Products - 6.0% | ||||||||
Beiersdorf AG (Germany)1 | 440 | 38,790 | ||||||
L’Oreal S.A. (France)1 | 320 | 57,331 | ||||||
Unilever N.V. (United Kingdom)1 | 460 | 19,240 | ||||||
|
| |||||||
| 115,361 | ||||||||
|
| |||||||
Total Consumer Staples | 392,267 | |||||||
|
| |||||||
Financials - 2.3% | ||||||||
Capital Markets - 2.3% | ||||||||
The Charles Schwab Corp. | 1,370 | 43,429 | ||||||
|
| |||||||
The accompanying notes are an integral part of the financial statements.
7
Quality Equity Series
Investment Portfolio - October 31, 2016
| SHARES | VALUE (NOTE 2) | |||||||
COMMON STOCKS (continued) | ||||||||
Health Care - 18.9% | ||||||||
Health Care Equipment & Supplies - 3.0% | ||||||||
Medtronic plc | 700 | $ | 57,414 | |||||
|
| |||||||
Health Care Providers & Services - 5.7% | ||||||||
AmerisourceBergen Corp. | 360 | 25,315 | ||||||
Express Scripts Holding Co.* | 690 | 46,506 | ||||||
McKesson Corp. | 300 | 38,151 | ||||||
|
| |||||||
| 109,972 | ||||||||
|
| |||||||
Pharmaceuticals - 10.2% | ||||||||
Allergan plc* | 80 | 16,715 | ||||||
Johnson & Johnson | 250 | 28,998 | ||||||
Novartis AG (Switzerland)1 | 840 | 59,613 | ||||||
Perrigo Co. plc | 330 | 27,453 | ||||||
Roche Holding AG (Switzerland)1 | 270 | 62,014 | ||||||
|
| |||||||
| 194,793 | ||||||||
|
| |||||||
Total Health Care | 362,179 | |||||||
|
| |||||||
Industrials - 9.6% | ||||||||
Machinery - 3.0% | ||||||||
Flowserve Corp. | 1,340 | 56,749 | ||||||
|
| |||||||
Professional Services - 6.6% | ||||||||
Experian plc (Ireland)1 | 3,010 | 57,866 | ||||||
Nielsen Holdings plc | 1,540 | 69,331 | ||||||
|
| |||||||
| 127,197 | ||||||||
|
| |||||||
Total Industrials | 183,946 | |||||||
|
| |||||||
Information Technology - 17.4% | ||||||||
Communications Equipment - 2.6% | ||||||||
Cisco Systems, Inc. | 1,620 | 49,702 | ||||||
|
| |||||||
IT Services - 4.7% | ||||||||
MasterCard, Inc. - Class A | 420 | 44,948 | ||||||
Visa, Inc. - Class A | 530 | 43,730 | ||||||
|
| |||||||
| 88,678 | ||||||||
|
| |||||||
Semiconductors & Semiconductor Equipment - 2.3% | ||||||||
QUALCOMM, Inc. | 640 | 43,981 | ||||||
|
| |||||||
Software - 7.8% | ||||||||
Microsoft Corp. | 1,020 | 61,118 | ||||||
Oracle Corp. | 1,790 | 68,772 | ||||||
SAP SE (Germany)1 | 220 | 19,382 | ||||||
|
| |||||||
| 149,272 | ||||||||
|
| |||||||
Total Information Technology | 331,633 | |||||||
|
| |||||||
The accompanying notes are an integral part of the financial statements.
8
Quality Equity Series
Investment Portfolio - October 31, 2016
| SHARES | VALUE (NOTE 2) | |||||||
COMMON STOCKS (continued) | ||||||||
Telecommunication Services - 6.0% | ||||||||
Diversified Telecommunication Services - 6.0% | ||||||||
BT Group plc (United Kingdom)1 | 8,450 | $ | 38,786 | |||||
Singapore Telecommunications Ltd. (Singapore)1 | 13,930 | 38,822 | ||||||
Telenor ASA (Norway)1 | 2,330 | 37,058 | ||||||
|
| |||||||
Total Telecommunication Services | 114,666 | |||||||
|
| |||||||
TOTAL COMMON STOCKS | 1,868,608 | |||||||
|
| |||||||
SHORT-TERM INVESTMENT - 2.0% | ||||||||
Dreyfus Government Cash Management2, 0.28% | ||||||||
(Identified Cost $39,081) | 39,081 | 39,081 | ||||||
|
| |||||||
TOTAL INVESTMENTS - 99.7% | ||||||||
(Identified Cost $1,917,876) | 1,907,689 | |||||||
OTHER ASSETS, LESS LIABILITIES - 0.3% | 5,074 | |||||||
|
| |||||||
NET ASSETS - 100% | $ | 1,912,763 | ||||||
|
| |||||||
* Non-income producing security.
1 A factor from a third party vendor was applied to determine the security’s fair value following the close of local trading.
2 Rate shown is the current yield as of October 31, 2016.
The Global Industry Classification Standard (GICS) was developed by and is the exclusive property and a service mark of MSCI Inc. (MSCI) and Standard & Poor’s, a division of The McGraw-Hill Companies, Inc. (S&P), and is licensed for use by Manning & Napier when referencing GICS sectors. Neither MSCI, S&P, nor any third party involved in making or compiling the GICS or any GICS classifications makes any express or implied warranties or representations with respect to such standard or classification, nor shall any such party have any liability therefrom.
The accompanying notes are an integral part of the financial statements.
9
Quality Equity Series
Statement of Assets & Liabilities
October 31, 2016
| ASSETS: | ||||
Investments, at value (identified cost $1,917,876) (Note 2) | $ | 1,907,689 | ||
Receivable for securities sold | 21,022 | |||
Receivable for fund shares sold | 14,600 | |||
Receivable from investment advisor | 13,597 | |||
Dividends receivable | 2,143 | |||
Foreign tax reclaims receivable | 523 | |||
Prepaid expenses | 10,902 | |||
|
| |||
TOTAL ASSETS | 1,970,476 | |||
|
| |||
LIABILITIES: | ||||
Accrued fund accounting and administration fees (Note 3) | 7,721 | |||
Accrued Chief Compliance Officer service fees (Note 3) | 353 | |||
Accrued shareholder services fees (Class S) (Note 3) | 275 | |||
Accrued transfer agent fees (Note 3) | 145 | |||
Accrued Directors’ fees (Note 3) | 3 | |||
Payable for securities purchased | 19,294 | |||
Audit fees payable | 28,787 | |||
Other payables and accrued expenses | 1,135 | |||
|
| |||
TOTAL LIABILITIES | 57,713 | |||
|
| |||
TOTAL NET ASSETS | $ | 1,912,763 | ||
|
| |||
NET ASSETS CONSIST OF: | ||||
Capital stock | $ | 1,942 | ||
Additional paid-in-capital | 1,921,533 | |||
Undistributed net investment income | 14,501 | |||
Accumulated net realized loss on investments, foreign currency and translation of other assets and liabilities | (14,991 | ) | ||
Net unrealized depreciation on investments, foreign currency and translation of other assets and liabilities | (10,222 | ) | ||
|
| |||
TOTAL NET ASSETS | $ | 1,912,763 | ||
|
| |||
NET ASSET VALUE, OFFERING PRICE AND REDEMPTION PRICE PER SHARE - Class S ($1,416,218/143,844 shares) | $ | 9.85 | ||
|
| |||
NET ASSET VALUE, OFFERING PRICE AND REDEMPTION PRICE PER SHARE - Class I | $ | 9.87 | ||
|
| |||
The accompanying notes are an integral part of the financial statements.
10
Quality Equity Series
Statement of Operations
For the Year Ended October 31, 2016
INVESTMENT INCOME: | ||||
Dividends (net of foreign taxes withheld, $2,117) | $ | 29,879 | ||
|
| |||
EXPENSES: | ||||
Fund accounting and administration fees (Note 3) | 46,261 | |||
Management fees (Note 3) | 7,921 | |||
Chief Compliance Officer service fees (Note 3) | 3,727 | |||
Shareholder services fees (Class S)(Note 3) | 2,370 | |||
Transfer agent fees (Note 3) | 520 | |||
Directors’ fees (Note 3) | 494 | |||
Audit fees | 36,554 | |||
Registration fees | 7,030 | |||
Custodian fees | 4,169 | |||
Printing and postage fees | 8,253 | |||
Miscellaneous | 4,371 | |||
|
| |||
Total Expenses | 121,670 | |||
Less reduction of expenses (Note 3) | (109,220 | ) | ||
|
| |||
Net Expenses | 12,450 | |||
|
| |||
NET INVESTMENT INCOME | 17,429 | |||
|
| |||
REALIZED AND UNREALIZED GAIN ON INVESTMENTS AND FOREIGN CURRENCY: | ||||
Net realized loss on- | ||||
Investments | (1,760 | ) | ||
Foreign currency and translation of other assets and liabilities | (188 | ) | ||
|
| |||
| (1,948 | ) | |||
|
| |||
Net change in unrealized appreciation (depreciation) on- | ||||
Investments | (12,344 | ) | ||
Foreign currency and translation of other assets and liabilities | (41 | ) | ||
|
| |||
| (12,385 | ) | |||
|
| |||
NET REALIZED AND UNREALIZED GAIN (LOSS) ON INVESTMENTS AND FOREIGN CURRENCY | (14,333 | ) | ||
|
| |||
NET INCREASE IN NET ASSETS RESULTING FROM OPERATIONS | $ | 3,096 | ||
|
| |||
The accompanying notes are an integral part of the financial statements.
11
Quality Equity Series
Statements of Changes in Net Assets
| FOR THE YEAR ENDED 10/31/16 | FOR THE PERIOD 6/1/15* TO 10/31/15 | |||||||
INCREASE (DECREASE) IN NET ASSETS: | ||||||||
OPERATIONS: | ||||||||
Net investment income | $ | 17,429 | $ | 4,306 | ||||
Net realized gain (loss) on investments and foreign currency | (1,948 | ) | (13,523 | ) | ||||
Net change in unrealized appreciation (depreciation) on investments and foreign currency | (12,385 | ) | 2,163 | |||||
|
|
|
| |||||
Net decrease from operations | 3,096 | (7,054 | ) | |||||
|
|
|
| |||||
DISTRIBUTIONS TO SHAREHOLDERS (Note 8): | ||||||||
From net investment income (Class S) | (3,654 | ) | — | |||||
From net investment income (Class I) | (3,100 | ) | — | |||||
|
|
|
| |||||
Total distributions to shareholders | (6,754 | ) | — | |||||
|
|
|
| |||||
CAPITAL STOCK ISSUED AND REPURCHASED: | ||||||||
Net increase from capital share transactions (Note 5) | 689,076 | 1,234,399 | ||||||
|
|
|
| |||||
Net increase in net assets | 685,418 | 1,227,345 | ||||||
NET ASSETS: | ||||||||
Beginning of Period | 1,227,345 | — | ||||||
|
|
|
| |||||
End of Period (including undistributed net investment income of $14,501 and | $ | 1,912,763 | $ | 1,227,345 | ||||
|
|
|
| |||||
*Commencement of operations.
The accompanying notes are an integral part of the financial statements.
12
Quality Equity Series
Financial Highlights - Class S
| FOR THE YEAR ENDED 10/31/16 | FOR THE PERIOD 6/01/151 TO 10/31/15 | |||||||
Per share data (for a share outstanding throughout each period): | ||||||||
Net asset value - Beginning of period | $ | 9.87 | $ | 10.00 | ||||
|
|
|
| |||||
Income (loss) from investment operations: | ||||||||
Net investment income2 | 0.11 | 0.03 | ||||||
Net realized and unrealized loss on investments | (0.08 | ) | (0.16 | ) | ||||
|
|
|
| |||||
Total from investment operations | 0.03 | (0.13 | ) | |||||
|
|
|
| |||||
Less distributions to shareholders: | ||||||||
From net investment income | (0.05 | ) | — | |||||
|
|
|
| |||||
Net asset value - End of period | $ | 9.85 | $ | 9.87 | ||||
|
|
|
| |||||
Net assets - End of period (000’s omitted) | $ | 1,416 | $ | 733 | ||||
|
|
|
| |||||
Total return3 | 0.31 | % | (1.30 | %) | ||||
Ratios (to average net assets)/Supplemental Data: | ||||||||
Expenses* | 0.95 | % | 0.95 | %4 | ||||
Net investment income | 1.11 | % | 0.81 | %4 | ||||
Portfolio turnover | 43 | % | 26 | % | ||||
* The investment advisor did not impose all or a portion of its management and/or other fees, and in some periods may have paid a portion of the Series’ expenses. If these expenses had been incurred by the Class, the expense ratio (to average net assets) would have increased by the following amount:
|
| |||||||
| 7.58 | % | 14.21 | %4 | |||||
1 Commencement of operations.
2 Calculated based on average shares outstanding during the periods.
3 Represents aggregate total return for the periods indicated, and assumes reinvestment of all distributions. Total return would have been lower had certain expenses not been reimbursed during the periods. Periods less than one year are not annualized.
4 Annualized.
The accompanying notes are an integral part of the financial statements.
13
Quality Equity Series
Financial Highlights - Class I
| FOR THE YEAR ENDED 10/31/16 | FOR THE PERIOD 6/01/151 TO 10/31/15 | |||||||
Per share data (for a share outstanding throughout each period): | ||||||||
Net asset value - Beginning of period | $ | 9.88 | $ | 10.00 | ||||
|
|
|
| |||||
Income (loss) from investment operations: | ||||||||
Net investment income2 | 0.14 | 0.04 | ||||||
Net realized and unrealized loss on investments | (0.09 | ) | (0.16 | ) | ||||
|
|
|
| |||||
Total from investment operations | 0.05 | (0.12 | ) | |||||
|
|
|
| |||||
Less distributions to shareholders: | ||||||||
From net investment income | (0.06 | ) | — | |||||
|
|
|
| |||||
Net asset value - End of period | $ | 9.87 | $ | 9.88 | ||||
|
|
|
| |||||
Net assets - End of period (000’s omitted) | $ | 497 | $ | 494 | ||||
|
|
|
| |||||
Total return3 | 0.55 | % | (1.20 | %) | ||||
Ratios (to average net assets)/Supplemental Data: | ||||||||
Expenses* | 0.70 | % | 0.70 | %4 | ||||
Net investment income | 1.41 | % | 1.07 | %4 | ||||
Portfolio turnover | 43 | % | 26 | % | ||||
* The investment advisor did not impose all or a portion of its management and/or other fees, and in some periods may have paid a portion of the Series’ expenses. If these expenses had been incurred by the Class, the expense ratio (to average net assets) would have increased by the following amount:
|
| |||||||
| 7.58 | % | 14.21 | %4 | |||||
1 Commencement of operations.
2 Calculated based on average shares outstanding during the periods.
3 Represents aggregate total return for the periods indicated, and assumes reinvestment of all distributions. Total return would have been lower had certain expenses not been reimbursed during the periods. Periods less than one year are not annualized.
4 Annualized.
The accompanying notes are an integral part of the financial statements.
14
Quality Equity Series
Notes to Financial Statements
| 1. | Organization |
Quality Equity Series (the “Series”) is a no-load diversified series of Manning & Napier Fund, Inc. (the “Fund”). The Fund is organized in Maryland and is registered under the Investment Company Act of 1940, as amended, as an open-end management investment company.
The Series’ primary investment objective is to provide long-term growth.
The Fund’s advisor is Manning & Napier Advisors, LLC (the “Advisor”). Shares of the Series are offered to investors, clients and employees of the Advisor and its affiliates. The Series is authorized to issue two classes of shares (Class S and Class I). Each class of shares is substantially the same, except that Class S shares bear shareholder services fees. The total authorized capital stock of the Fund consists of 15 billion shares of common stock each having a par value of $0.01. As of October 31, 2016, 10.5 billion shares have been designated in total among 40 series, of which 100 million have been designated as Quality Equity Series Class S common stock, and 100 million have been designated as Quality Equity Series Class I common stock.
| 2. | Significant Accounting Policies |
The following is a summary of significant accounting policies followed by the Series. The Series is an investment company and, accordingly, follows the investment company accounting and reporting guidance of the Financial Accounting Standards Board Accounting Standards Codification Topic 946 - Investment Companies, which is part of accounting principles generally accepted in the United States of America (“GAAP”).
Security Valuation
Portfolio securities, including domestic equities, foreign equities, warrants and options, listed on an exchange other than the NASDAQ Stock Market are valued at the latest quoted sales price of the exchange on which the security is primarily traded. Securities not traded on valuation date or securities not listed on an exchange are valued at the latest quoted bid price provided by the Fund’s pricing service. Securities listed on the NASDAQ Stock Market are valued in accordance with the NASDAQ Official Closing Price.
Short-term investments that mature in sixty days or less may be valued at amortized cost, which approximates fair value. Investments in open-end investment companies are valued at their net asset value per share on valuation date.
Volume and level of activity in established markets for an asset or liability are evaluated to determine whether recent transactions and quoted prices are determinative of fair value. Where there have been significant decreases in volume and level of activity, further analysis and adjustment may be necessary to estimate fair value. The Series measures fair value in these instances by the use of inputs and valuation techniques which may be based upon current market prices of securities that are comparable in coupon, rating, maturity and industry and/or expectation of future cash flows. As a result of trading in relatively thin markets and/or markets that experience significant volatility, the prices used by the Series to value these securities may differ from the value that would be realized if these securities were sold, and the differences could be material.
Securities for which representative valuations or prices are not available from the Series’ pricing service may be valued at fair value as determined in good faith by the Advisor under procedures approved by and under the general supervision and responsibility of the Fund’s Board of Directors (the “Board”). Due to the inherent uncertainty of valuations of such securities, the fair value may differ significantly from the values that would have been used had a ready market for such securities existed. If trading or events occurring after the close of the principal market in which securities are traded are expected to materially affect the value of those securities, then they may be valued at their fair value, taking this trading or these events into account. In accordance with the procedures approved by the Board, the values of certain securities trading outside the U.S. were adjusted following the close of local trading using a factor from a third party vendor. The third party vendor uses statistical analyses and quantitative models, which consider among other things subsequent movement and changes in the prices of indices, securities and exchange rates in other markets, to determine the factors which are used to adjust local market prices. The value of securities used for net asset value calculation under these procedures may differ from published prices for the same securities. It is the Fund’s policy to classify each foreign equity security where a factor from a third party vendor is provided as a Level 2 security.
15
Quality Equity Series
Notes to Financial Statements (continued)
| 2. | Significant Accounting Policies (continued) |
Security Valuation (continued)
Various inputs are used in determining the value of the Series’ assets or liabilities carried at fair value. These inputs are summarized in three broad levels. Level 1 includes quoted prices in active markets for identical assets and liabilities. Level 2 includes other significant observable inputs (including quoted prices for similar securities, interest rates, prepayment speeds, credit risk, etc.). Level 3 includes significant unobservable inputs (including the Series’ own assumptions in determining the fair value of investments). A financial instrument’s level within the fair value hierarchy is based on the lowest level of any input both individually and in aggregate that is significant to the fair value measurement. The inputs or methodology used for valuing securities are not necessarily an indication of the risk associated with investing in those securities.
The following is a summary of the valuation levels used for major security types as of October 31, 2016 in valuing the Series’ assets or liabilities carried at fair value:
| DESCRIPTION | TOTAL | LEVEL 1 | LEVEL 2 | LEVEL 3 | ||||||||||||
Assets: | ||||||||||||||||
Equity securities: | ||||||||||||||||
Consumer Discretionary | $ | 440,488 | $ | 203,932 | $ | 236,556 | $ | — | ||||||||
Consumer Staples | 392,267 | 151,269 | 240,998 | — | ||||||||||||
Financials | 43,429 | 43,429 | — | — | ||||||||||||
Health Care | 362,179 | 240,552 | 121,627 | — | ||||||||||||
Industrials | 183,946 | 126,080 | 57,866 | — | ||||||||||||
Information Technology | 331,633 | 312,251 | 19,382 | — | ||||||||||||
Telecommunication Services | 114,666 | — | 114,666 | — | ||||||||||||
Mutual fund | 39,081 | 39,081 | — | — | ||||||||||||
|
|
|
|
|
|
|
| |||||||||
Total assets | $ | 1,907,689 | $ | 1,116,594 | $ | 791,095 | $ | — | ||||||||
|
|
|
|
|
|
|
| |||||||||
Please see the Investment Portfolio for foreign securities where a factor from a third party vendor was applied to determine the securities’ fair value following the close of local trading. Such securities are included in Level 2 in the table above.
There were no Level 3 securities held by the Series as of October 31, 2015 or October 31, 2016.
The Fund’s policy is to recognize transfers in and transfers out of the valuation levels as of the beginning of the reporting period. There were no transfers between Level 1 and Level 2 during the year ended October 31, 2016.
New Accounting Guidance
In October 2016, the Securities and Exchange Commission (SEC) issued a new rule, Investment Company Reporting Modernization, which, among other provisions, amends Regulation S-X to require standardized, enhanced disclosures, particularly related to derivatives, in investment company financial statements. Compliance with the guidance is required for financial statements filed with the SEC on or after August 1, 2017; adoption will have no effect on the Fund’s net assets or results of operations.
Security Transactions, Investment Income and Expenses
Security transactions are accounted for on trade date. Dividend income is recorded on the ex-dividend date, except that if the ex-dividend date has passed, certain dividends from foreign securities are recorded as soon as the Series is informed of the ex-dividend date. Non-cash dividends, if any, are recorded at the fair value of the securities received. Interest income, including amortization of premium and accretion of discounts using the effective interest method, is earned from settlement date and accrued daily.
Expenses are recorded on an accrual basis. Most expenses of the Fund can be attributed to a specific series. Expenses which cannot be directly attributed are apportioned among the series in the Fund in such a manner as deemed equitable by the Fund’s Board, taking into consideration, among other things, the nature and type of expense. Income, expenses (other than shareholder services fees), and realized and unrealized gains and losses are prorated among the classes based on the relative net assets of each class. Class specific expenses are directly charged to that class.
16
Quality Equity Series
Notes to Financial Statements (continued)
| 2. | Significant Accounting Policies (continued) |
Security Transactions, Investment Income and Expenses (continued)
The Series uses the identified cost method for determining realized gain or loss on investments for both financial statement and federal income tax reporting purposes.
Foreign Currency Translation
The books and records of the Series are maintained in U.S. dollars. Foreign currencies, investments and other assets and liabilities are translated into U.S. dollars at the current exchange rates. Purchases and sales of investment securities and income and expenses are translated on the respective dates of such transactions. The Series does not isolate realized and unrealized gains and losses attributable to changes in the exchange rates from gains and losses that arise from changes in the fair value of investments. Such fluctuations are included with net realized and unrealized gain or loss on investments. Net realized foreign currency gains and losses represent foreign currency gains and losses between trade date and settlement date on securities transactions, gains and losses on disposition of foreign currencies and the difference between the amount of income and foreign withholding taxes recorded on the books of the Series and the amounts actually received or paid.
Federal Taxes
The Series’ policy is to comply with the provisions of the Internal Revenue Code applicable to regulated investment companies. The Series is not subject to federal income tax or excise tax to the extent that the Series distributes to shareholders each year its taxable income, including any net realized gains on investments, in accordance with requirements of the Internal Revenue Code. Accordingly, no provision for federal income tax or excise tax has been made in the financial statements.
Management evaluates its tax positions to determine if the tax positions taken meet the minimum recognition threshold in connection with accounting for uncertainties in income tax positions taken or expected to be taken for the purposes of measuring and recognizing tax liabilities in the financial statements. Recognition of tax benefits of an uncertain tax position is required only when the position is “more likely than not” to be sustained assuming examination by taxing authorities. At October 31, 2016, the Series has recorded no liability for net unrecognized tax benefits relating to uncertain income tax positions taken or expected to be taken in future tax returns.
The Series files income tax returns in the U.S. federal jurisdiction, various states and foreign jurisdictions, as required. No income tax returns are currently under investigation. The statute of limitations on the Series’ tax returns remains open for the period ended October 31, 2015 through the year ended October 31, 2016. The Series is not aware of any tax positions for which it is reasonably possible that the total amounts of unrecognized tax benefits will significantly change in the next twelve months.
Foreign Taxes
Based on the Series’ understanding of the tax rules and rates related to income, gains and currency purchase/repatriation transactions for foreign jurisdictions in which it invests, the Series will provide for foreign taxes, and where appropriate, deferred foreign tax.
Distributions of Income and Gains
Distributions to shareholders of net investment income and net realized gains are made annually. An additional distribution may be necessary to avoid taxation of the Series. Distributions are recorded on the ex-dividend date.
Indemnifications
The Fund’s organizational documents provide former and current directors and officers with a limited indemnification against liabilities arising in connection with the performance of their duties to the Fund. In the normal course of business, the Fund may also enter into contracts that provide general indemnifications. The Fund’s maximum exposure under these arrangements is unknown as this would be dependent on future claims that may be made against the Fund. The risk of material loss from such claims is considered remote.
Other
The preparation of financial statements in conformity with GAAP requires management to make estimates and assumptions that affect the reported amounts of assets and liabilities and the disclosure of contingent assets and liabilities at the date of the
17
Quality Equity Series
Notes to Financial Statements (continued)
| 2. | Significant Accounting Policies (continued) |
Other (continued)
financial statements and the reported amounts of income and expenses during the reporting period. Actual results could differ from those estimates.
| 3. | Transactions with Affiliates |
The Fund has an Investment Advisory Agreement (the “Agreement”) with the Advisor for which the Series pays a fee, computed daily and payable monthly, at an annual rate of 0.55% of the Series’ average daily net assets.
Under the Agreement, personnel of the Advisor provide the Series with advice and assistance in the choice of investments and the execution of securities transactions, and otherwise maintain the Series’ organization. The Advisor also provides the Fund with necessary office space and fund administration and support services. The salaries of all officers of the Fund (except a percentage of the Fund’s Chief Compliance Officer’s salary, which is paid by the Fund), and of all Directors who are “affiliated persons” of the Fund, or of the Advisor, and all personnel of the Fund, or of the Advisor, performing services relating to research, statistical and investment activities, are paid by the Advisor. Each “non-affiliated” Director receives an annual stipend, which is allocated among all the active series of the Fund. In addition, these Directors also receive a fee per Board meeting attended plus a fee for each committee meeting attended and are reimbursed for travel and other out-of-pocket expenses incurred by them in connection with attending such meetings. The Fund also has an Audit Committee Chair, who receives an additional annual stipend for this role.
The Class S shares of the Series are subject to a shareholder services fee in accordance with a shareholder services plan adopted by the Fund’s Board. The shareholder services fee is intended to compensate financial intermediaries, including affiliates of the Fund, in connection with the provision of direct client service, personal services, maintenance of shareholder accounts and reporting services. For these services, Class S of the Series pays a fee, computed daily and payable monthly, at an annual rate of 0.25% of the average daily net assets of Class S. The Fund has a Shareholder Services Agreement with the Advisor, for which the Advisor receives the shareholder services fee as stated above.
The Advisor has contractually agreed, until at least February 28, 2017, to waive its fee and, if necessary, pay other operating expenses of the Series in order to maintain total direct annual fund operating expenses for the Series exclusive of each share class’ shareholder services fee, at no more than 0.70% of average daily net assets. Accordingly, the Advisor waived fees of $109,220 for the year ended October 31, 2016, which is included as a reduction of expenses on the Statement of Operations. The Advisor is not eligible to recoup any expenses that have been waived or reimbursed in prior years.
Manning & Napier Investor Services, Inc., a registered broker-dealer affiliate of the Advisor, acts as distributor for the Fund’s shares. The services of Manning & Napier Investor Services, Inc. are provided at no additional cost to the Series.
Pursuant to a master services agreement dated November 1, 2014, the Fund pays the Advisor an annual fee related to fund accounting and administration of 0.0085% on the first $25 billion of average daily net assets (excluding Target Series and Strategic Income Series); 0.0075% on the next $15 billion of average daily net assets (excluding Target Series and Strategic Income Series); and 0.0065% of the average daily net assets in excess of $40 billion (excluding Target Series and Strategic Income Series); plus a base fee of $30,400 per series. Transfer agent fees are charged to the Fund on a per account basis. Additionally, certain transaction and out-of-pocket expenses, including charges for reporting relating to the Fund’s compliance program, are charged. The Advisor has agreements with BNY Mellon Investment Servicing (U.S.) Inc. (“BNY”) under which BNY serves as sub-accountant services agent and sub-transfer agent.
Expenses not directly attributable to a series are allocated based on each series’ relative net assets or number of accounts, depending on the expense.
| 4. | Purchases and Sales of Securities |
For the year ended October 31, 2016, purchases and sales of securities, other than U.S. Government securities and short-term securities, were $1,285,086 and $622,891, respectively. There were no purchases or sales of U.S. Government securities.
18
Quality Equity Series
Notes to Financial Statements (continued)
| 5. | Capital Stock Transactions |
Transactions in shares of Class S and Class I of Quality Equity Series were:
| CLASS S: | FOR THE YEAR ENDED 10/31/16 | FOR THE PERIOD 6/1/15* TO 10/31/15 | ||||||||||||||
| SHARES | AMOUNT | SHARES | AMOUNT | |||||||||||||
Sold | 78,329 | $ | 771,528 | 74,251 | $ | 734,399 | ||||||||||
Reinvested | 385 | 3,654 | — | — | ||||||||||||
Repurchased | (9,121 | ) | (89,206 | ) | — | — | ||||||||||
|
|
|
|
|
|
|
| |||||||||
Total | 69,593 | $ | 685,976 | 74,251 | $ | 734,399 | ||||||||||
|
|
|
|
|
|
|
| |||||||||
| CLASS I: | FOR THE YEAR ENDED 10/31/16 | FOR THE PERIOD 6/1/15* TO 10/31/15 | ||||||||||||||
| SHARES | AMOUNT | SHARES | AMOUNT | |||||||||||||
Sold | — | — | 50,000 | $ | 500,000 | |||||||||||
Reinvested | 326 | $ | 3,100 | — | — | |||||||||||
Repurchased | — | — | — | — | ||||||||||||
|
|
|
|
|
|
|
| |||||||||
Total | 326 | $ | 3,100 | 50,000 | $ | 500,000 | ||||||||||
|
|
|
|
|
|
|
| |||||||||
* Commencement of operations.
At October 31, 2016, one shareholder account owned 10.3% of the Series. In addition, the Advisor and its affiliates owned 51.9% of the Series.
| 6. | Financial Instruments |
The Series may trade in instruments including written and purchased options, forward foreign currency exchange contracts and futures contracts and other derivatives in the normal course of investing activities to assist in managing exposure to various market risks. The Series may be subject to various elements of risk, which may involve, to a varying degree, elements of risk in excess of the amounts recognized for financial statement purposes. These risks include: the risk that changes in the value of a derivative may not correlate perfectly with the underlying asset, rate or index; counterparty credit risk related to over the counter derivative counterparties’ failure to perform under contract terms; liquidity risk related to the lack of a liquid market for these contracts allowing the fund to close out its position(s); and documentation risk relating to disagreement over contract terms. No such investments were held by the Series as of October 31, 2016.
| 7. | Foreign Securities |
Investing in securities of foreign companies and foreign governments involves special risks and considerations not typically associated with investing in securities of domestic companies and the U.S. Government. These risks include revaluation of currencies and future adverse political and economic developments. Moreover, securities of foreign companies and foreign governments and their markets may be less liquid and their prices more volatile than those of comparable domestic companies and the U.S. Government.
| 8. | Federal Income Tax Information |
The amount and characterization of certain income and capital gains to be distributed are determined in accordance with federal income tax regulations, which may differ from GAAP. These differences are primarily due to differing book and tax treatments in the timing of the recognition of net investment income or gains and losses, including losses deferred due to wash sales and foreign currency gains and losses. The Series may periodically make reclassifications among its capital accounts to reflect income and gains available for distribution (or available capital loss carryovers) under income tax regulations, without impacting the Series’ net asset value. For the year ended October 31, 2016, amounts were reclassified within the capital accounts to decrease Undistributed Net Investment Income by $451 and decrease Accumulated Net Realized Loss on Investments by $451. Any such reclassifications are not reflected in the financial highlights.
19
Quality Equity Series
Notes to Financial Statements (continued)
| 8. | Federal Income Tax Information (continued) |
The tax character of distributions paid were as follows:
| FOR THE YEAR ENDED 10/31/16 | FOR THE PERIOD 6/1/15 (COMMENCEMENT OF OPERATIONS) TO 10/31/15 | |||||||
Ordinary income | $ | 6,754 | $ | — | ||||
At October 31, 2016, the tax basis of components of distributable earnings and the net unrealized depreciation based on identified cost of investments for federal tax purposes were as follows:
Cost for federal income tax purposes | $ | 1,942,569 | ||
Unrealized appreciation | 92,525 | |||
Unrealized depreciation | (127,405 | ) | ||
|
| |||
Net unrealized depreciation | $ | (34,880 | ) | |
|
| |||
Undistributed ordinary income | $ | 14,501 | ||
Undistributed long-term capital gains | $ | 9,702 |
As of October 31, 2016, the capital loss carryover utilized in the current year was $10,766.
20
Quality Equity Series
Report of Independent Registered Public Accounting Firm
To the Board of Directors of Manning & Napier Fund, Inc. and Shareholders of Quality Equity Series:
In our opinion, the accompanying statement of assets and liabilities, including the investment portfolio, and the related statements of operations and of changes in net assets and the financial highlights present fairly, in all material respects, the financial position of the Quality Equity Series (a series of Manning & Napier Fund, Inc., hereafter referred to as the “Series”) as of October 31, 2016, the results of its operations for the year then ended, and the changes in its net assets and the financial highlights for the year then ended and for the period June 1, 2015 (commencement of operations) through October 31, 2015, in conformity with accounting principles generally accepted in the United States of America. These financial statements and financial highlights (hereafter referred to as “financial statements”) are the responsibility of the Series’ management. Our responsibility is to express an opinion on these financial statements based on our audits. We conducted our audits of these financial statements in accordance with the standards of the Public Company Accounting Oversight Board (United States). Those standards require that we plan and perform the audit to obtain reasonable assurance about whether the financial statements are free of material misstatement. An audit includes examining, on a test basis, evidence supporting the amounts and disclosures in the financial statements, assessing the accounting principles used and significant estimates made by management, and evaluating the overall financial statement presentation. We believe that our audits, which included confirmation of securities as of October 31, 2016 by correspondence with the custodian and brokers, provide a reasonable basis for our opinion.

New York, New York
December 16, 2016
21
Quality Equity Series
Supplemental Tax Information
(unaudited)
All reportings are based on financial information available as of the date of this annual report and, accordingly are subject to change.
For federal income tax purposes, the Series reports for the current fiscal year $13,732 or, if different, the maximum amount allowable under the tax law as qualified dividend income.
For corporate shareholders, the percentage of investment income (dividend income plus short-term gains, if any) that qualifies for the dividends received deduction for the current fiscal year is 92.99%.
The Series designates $10,187 as Long-Term Capital Gain dividends pursuant to Section 852(b) of the Code for the fiscal year ended October 31, 2016.
22
Quality Equity Series
Directors’ and Officers’ Information
(unaudited)
The Statement of Additional Information provides additional information about the Fund’s directors and officers and can be obtained without charge by calling 1-800-466-3863, at www.manningnapieradvisors.com, or on the EDGAR Database on the SEC Internet web site (http:// www.sec.gov). The following chart shows certain information about the Fund’s officers and directors, including their principal occupations during the last five years. Unless specific dates are provided, the individuals have held the listed positions for longer than five years.
| Interested Director/Officer | ||
| Name: | Michele T. Mosca* | |
| Address: | 290 Woodcliff Drive | |
| Fairport, NY 14450 | ||
| Age: | 44 | |
| Current Position(s) Held with Fund: | Principal Executive Officer, President, Chairman & Director | |
| Term of Office1 & Length of Time Served: | Indefinite – Chairman and Director since August 2016 | |
| Principal Occupation(s) During Past 5 Years: | Managing Director, Funds Group (2009-present)- Manning & Napier Advisors, LLC; President, Director (2015-present) - Manning & Napier Investor Services, Inc.; Chief Executive Officer, President (2016-present) - Rainier Investment Management Mutual Funds Holds or has held one or more of the following titles for various subsidiaries and affiliates: President, Director | |
| Number of Portfolios Overseen within Fund Complex: | 40 | |
| Other Directorships Held Outside Fund Complex: | Trustee - Rainier Investment Management Mutual Funds (six portfolios) (2016- present) | |
| Independent Directors | ||
| Name: | Stephen B. Ashley | |
| Address: | 290 Woodcliff Drive | |
| Fairport, NY 14450 | ||
| Age: | 76 | |
| Current Position(s) Held with Fund: | Director, Audit Committee Member, Governance & Nominating Committee Member | |
| Term of Office & Length of Time Served: | Indefinite - Since 1996 | |
| Principal Occupation(s) During Past 5 Years: | Chairman, Director & Chief Executive Officer (1997 to present)- The Ashley Group (property management and investment). Director (1995-2008) and Chairman (non-executive)(2004-2008) - Fannie Mae (mortgage) | |
| Number of Portfolios Overseen within Fund Complex: | 40 | |
| Other Directorships Held Outside Fund Complex: | Fannie Mae (mortgage)(1995-2008) | |
| The Ashley Group (property management and investment)(1995-2008) Genesee Corporation (holding company)(1987-2007) | ||
| Name: | Paul A. Brooke | |
| Address: | 290 Woodcliff Drive | |
| Fairport, NY 14450 | ||
| Age: | 70 | |
| Current Position(s) Held with Fund: | Director, Audit Committee Member, Governance & Nominating Committee Member | |
| Term of Office & Length of Time Served: | Indefinite - Since 2007 | |
| Principal Occupation(s) During Past 5 Years: | Chairman & CEO (2005-2009) - Ithaka Acquisition Corporation (investments); Chairman (2007-2009) - Alsius Corporation (investments); Managing Member (1991-present) - PMSV Holdings LLC (investments); Managing Member (2010-present)- Venbio (investments). | |
| Number of Portfolios Overseen within Fund Complex: | 40 | |
| Other Directorships Held Outside Fund Complex: | Incyte Corp. (biotech) (2000-present) ViroPharma, Inc. (speciality pharmaceuticals) (2000-2014) HLTH Corp (WebMD) (information) (2000-2010) Cheyne Capital International (investment) (2000-present) GMP Companies (investment) (2000-2011) Cytos Biotechnology Ltd (biotechnology) (2012-present) | |
23
Quality Equity Series
Directors’ and Officers’ Information
(unaudited)
| Independent Directors (continued) | ||
| Name: | Peter L. Faber | |
| Address: | 290 Woodcliff Drive | |
| Fairport, NY 14450 | ||
| Age: | 78 | |
| Current Position(s) Held with Fund: | Director, Governance & Nominating Committee Member | |
| Term of Office & Length of Time Served: | Indefinite - Since 1987 | |
| Principal Occupation(s) During Past 5 Years: | Senior Counsel (2006-2012), Partner (1995-2006 & 2013-present)- McDermott, Will & Emery LLP (law firm) | |
| Number of Portfolios Overseen within Fund Complex: | 40 | |
| Other Directorships Held Outside Fund Complex: | Boston Early Music Festival (non-profit) (2007-present) Amherst Early Music, Inc. (non-profit) (2009-present) Gotham Early Music Scene, Inc. (non-profit) (2009-present) Partnership for New York City, Inc. (non-profit) (1989-2010) New York Collegium (non-profit) (2004-2011) | |
| Name: | Harris H. Rusitzky | |
| Address: | 290 Woodcliff Drive | |
| Fairport, NY 14450 | ||
| Age: | 81 | |
| Current Position(s) Held with Fund: | Director, Audit Committee Member, Governance & Nominating Committee Member | |
| Term of Office & Length of Time Served: | Indefinite - Since 1985 | |
| Principal Occupation(s) During Past 5 Years: | President (1994-present)- The Greening Group (business consultants); | |
| Partner (2006-present)- The Restaurant Group (restaurants) | ||
| Number of Portfolios Overseen within Fund Complex: | 40 | |
| Other Directorships Held Outside Fund Complex: | Rochester Institute of Technology (university) (1972-present) Culinary Institute of America (non-profit college) (1985-present) George Eastman House (museum) (1988-present) National Restaurant Association (restaurant trade organization) (1978-present) | |
| Name: | Chester N. Watson | |
| Address: | 290 Woodcliff Drive | |
| Fairport, NY 14450 | ||
| Age: | 66 | |
| Current Position(s) Held with Fund: | Director, Audit Committee Chairman, Governance & Nominating Committee Member | |
| Term of Office & Length of Time Served: | Indefinite - Since 2012 | |
| Principal Occupation(s) During Past 5 Years: | General Auditor (2003-2011)- General Motors Company (auto manufacturer) | |
| Number of Portfolios Overseen within Fund Complex: | 40 | |
| Other Directorships Held Outside Fund Complex: | Rochester Institute of Technology (university) (2005-present) | |
| Officers | ||
| Name: | Jeffrey S. Coons, Ph.D., CFA® | |
| Address: | 290 Woodcliff Drive | |
| Fairport, NY 14450 | ||
| Age: | 53 | |
| Current Position(s) Held with Fund: | Vice President | |
| Term of Office1 & Length of Time Served: | Since 2004 | |
| Principal Occupation(s) During Past 5 Years: | President since 2010, Co-Director of Research (2002-2015) - Manning & Napier Advisors, LLC | |
| Holds one or more of the following titles for various subsidiaries and affiliates: President, Director, Treasurer or Senior Trust Officer. | ||
| Number of Portfolios Overseen within Fund Complex: | 40 | |
| Other Directorships Held Outside Fund Complex: | N/A | |
24
Quality Equity Series
Directors’ and Officers’ Information
(unaudited)
| Officers (continued) | ||
| Name: | Elizabeth Craig | |
| Address: | 290 Woodcliff Drive | |
| Fairport, NY 14450 | ||
| Age: | 29 | |
| Current Position(s) Held with Fund: | Corporate Secretary | |
| Term of Office1 & Length of Time Served: | Since 2016 | |
| Principal Occupation(s) During Past 5 Years: | Fund Administration Manager since 2015; Mutual Fund Compliance Specialist (2009-2015) - Manning & Napier Advisors, LLC; Assistant Corporate Secretary (2011-2016)- Manning & Napier Fund, Inc. | |
| Number of Portfolios Overseen within Fund Complex: | 40 | |
| Other Directorships Held Outside Fund Complex: | N/A | |
| Name: | Christine Glavin | |
| Address: | 290 Woodcliff Drive | |
| Fairport, NY 14450 | ||
| Age: | 50 | |
| Current Position(s) Held with Fund: | Principal Financial Officer, Chief Financial Officer | |
| Term of Office1 & Length of Time Served: | Principal Financial Officer (2002-present); Chief Financial Officer (2001-present) | |
| Principal Occupation(s) During Past 5 Years: | Director of Fund Reporting (2011-present); Fund Reporting Manager (1997-2011)- Manning & Napier Advisors, LLC; Assistant Treasurer (2008-present)- Exeter Trust Company | |
| Number of Portfolios Overseen within Fund Complex: | 40 | |
| Other Directorships Held Outside Fund Complex: | N/A |
| Name: | Jodi L. Hedberg | |
| Address: | 290 Woodcliff Drive | |
| Fairport, NY 14450 | ||
| Age: | 48 | |
| Current Position(s) Held with Fund: | Chief Compliance Officer, Anti-Money Laundering Compliance Officer | |
| Term of Office1 & Length of Time Served: | Chief Compliance Officer (2004-present); Anti-Money Laundering Compliance Officer (2002-present); Corporate Secretary (1997-2016) | |
| Principal Occupation(s) During Past 5 Years: | Director of Compliance (2005-present); Compliance Manager (1995-2005) - Manning & Napier Advisors, LLC and affiliates; Corporate Secretary- Manning & Napier Investor Services, Inc. since 2006 | |
| Number of Portfolios Overseen within Fund Complex: | 40 | |
| Other Directorships Held Outside Fund Complex: | N/A |
| Name: | Amy Williams | |
| Address: | 290 Woodcliff Drive | |
| Fairport, NY 14450 | ||
| Age: | 54 | |
| Current Position(s) Held with Fund: | Assistant Corporate Secretary | |
| Term of Office1 & Length of Time Served: | Since 2016 | |
| Principal Occupation(s) During Past 5 Years: | Director of Fund Documentation (1992-present) – Manning & Napier Advisors, LLC Holds one or more of the following titles for various affiliates; Director | |
| Number of Portfolios Overseen within Fund Complex: | 40 | |
| Other Directorships Held Outside Fund Complex: | N/A |
| Name: | Richard Yates | |
| Address: | 290 Woodcliff Drive | |
| Fairport, NY 14450 | ||
| Age: | 51 | |
| Current Position(s) Held with Fund: | Chief Legal Officer | |
| Term of Office1 & Length of Time Served: | Chief Legal Officer since 2004 | |
| Principal Occupation(s) During Past 5 Years: | Counsel- Manning & Napier Advisors, LLC and affiliates (2000-present); Holds one or more of the following titles for various affiliates; Director or Corporate Secretary | |
| Number of Portfolios Overseen within Fund Complex: | 40 | |
| Other Directorships Held Outside Fund Complex: | N/A |
*Interested Director, within the meaning of the Investment Company Act of 1940 by reason of her position with the Fund’s investment advisor. Ms. Mosca serves as the Managing Director of the Funds Group for Manning & Napier Advisors, LLC.
1The term of office of all officers shall be one year and until their respective successors are chosen and qualified, or his or her earlier resignation or removal as provided in the Fund’s By-Laws.
25
{This page intentionally left blank}
26
Quality Equity Series
Literature Requests
(unaudited)
Proxy Voting Policies and Procedures
A description of the policies and procedures that the Fund uses to determine how to vote proxies relating to portfolio securities is available, without charge, upon request:
| By phone | 1-800-466-3863 | |||
| On the Securities and Exchange | ||||
| Commission’s (SEC) web site | http://www.sec.gov |
Proxy Voting Record
Information regarding how the Fund voted proxies relating to portfolio securities during the most recent 12-month period ended June 30th is available, without charge, upon request:
| By phone | 1-800-466-3863 | |||
| On the SEC’s web site | http://www.sec.gov |
Quarterly Portfolio Holdings
The Series’ complete schedule of portfolio holdings for the 1st and 3rd quarters of each fiscal year are provided on Form N-Q, and are available, without charge, upon request:
| By phone | 1-800-466-3863 | |||
| On the SEC’s web site | http://www.sec.gov |
The Series’ Form N-Q may be reviewed and copied at the SEC’s Public Reference Room in Washington, D.C. Information on the operation of the Public Reference Room may be obtained by calling 1-800-SEC-0330.
Prospectus and Statement of Additional Information (SAI)
For more information about any of the Manning & Napier Fund, Inc. Series, you may obtain a prospectus and SAI at www.manning-napier.com or by calling (800) 466-3863. Before investing, carefully consider the objectives, risks, charges and expenses of the investment and read the prospectus carefully as it contains this and other information about the investment company. In addition, this information can be found on the SEC’s web site, http://www.sec.gov.
Additional information available at www.manning-napier.com
1. Fund Holdings - Month-End
2. Fund Holdings - Quarter-End
3. Shareholder Report - Annual
4. Shareholder Report - Semi-Annual
The Fund also offers electronic notification or “e-delivery” when certain documents are available on-line to be downloaded or reviewed. Direct shareholders can elect to receive electronic notification when shareholder reports, prospectus updates, and/or statements are available. If you do not currently have on-line access to your account, you can establish access by going to www.manning-napier.com, click on “Login” in the top corner of the page, and follow the prompts to self-enroll. Once enrolled, you can set your electronic notification preferences by clicking on the Account Options tab located within the green toolbar and then select E-Delivery Option. Should you have any questions on either how to establish on-line access or how to update your account settings, please contact Investor Services at 1-800-466-3863.
The Manning & Napier Fund, Inc. is managed by Manning & Napier Advisors, LLC. Manning & Napier Investor Services, Inc., an affiliate of Manning & Napier Advisors, LLC, is the distributor of the Fund shares.
MNQEQ-10/16-AR
ITEM 2: CODE OF ETHICS
| (a) | The registrant has adopted a code of ethics that applies to its principal executive officer, principal financial officer and principal accounting officer. A copy of the registrant’s code of ethics is filed herewith as Exhibit 12(a)(1). |
| (b) | During the period covered by this report, no amendments were made to the provisions of the code of ethics adopted in 2 (a) above. |
| (c) | During the period covered by this report, no implicit or explicit waivers to the provisions of the code of ethics adopted in 2 (a) above were granted. |
| (d) | Not applicable to the registrant due to the response given in 2 (c) above. |
ITEM 3: AUDIT COMMITTEE FINANCIAL EXPERT
All of the members of the Audit committee have been determined by the Registrant’s Board of Directors to be Audit Committee Financial Experts as defined in this item. The current members of the Audit Committee are: Stephen B. Ashley, Paul A. Brooke, Harris H. Rusitzky, and Chester N. Watson. All Audit Committee members are independent under applicable rules. This designation will not increase the designee’s duties, obligations or liability as compared to their duties, obligations and liability as a member of the Audit Committee and of the Board.
ITEM 4: PRINCIPAL ACCOUNTANT FEES AND SERVICES
Principal Accountant Fees and Services
Aggregate fees for professional services rendered for the Manning & Napier Fund, Inc. (Pro-Blend® Conservative Term Series, Pro-Blend® Moderate Term Series, Pro-Blend® Extended Term Series, Pro-Blend® Maximum Term Series, Tax Managed Series, Equity Series, Overseas Series, Disciplined Value Series, Quality Equity Series, Target Income Series, Target 2015 Series, Target 2020 Series, Target 2025 Series, Target 2030 Series, Target 2035 Series, Target 2040 Series, Target 2045 Series, Target 2050 Series, Target 2055 Series, and Target 2060 Series collectively the “Fund”) by PricewaterhouseCoopers LLP (“PwC”) as of and for the years ended October 31, 2016 and 2015 were:
| 2016 | 2015 | |||||||
Audit Fees (a) | $ | 452,868 | $ | 459,979 | ||||
Audit Related Fees (b) | $0 | $0 | ||||||
Tax Fees (c) | $ | 134,680 | $ | 140,150 | ||||
All Other Fees (d) | $0 | $0 | ||||||
| $ | 587,548 | $ | 600,129 | |||||
| (a) | Audit Fees |
These fees relate to professional services rendered by PwC for the audit of the Fund’s annual financial statements or services normally provided by the accountant in connection with statutory and regulatory filing or engagements. These services include the audits of the financial statements of the Fund, issuance of consents, income tax provision procedures and assistance with review of documents filed with the SEC.
| (b) | Audit-Related Fees |
These fees relate to assurance and related services by PwC that are reasonably related to the performance of the audit of the Fund’s financial statements and are not reported under “Audit Fees” above.
| (c) | Tax Fees |
These fees relate to professional services rendered by PwC for tax compliance, tax advice and tax planning. The tax services provided by PwC related to the review of the Fund’s federal and state income tax returns, excise tax calculations and returns, a review of the Fund’s calculations of capital gain and income distributions, and additional tax research for compliance purposes.
| (d) | All Other Fees |
These fees relate to products and services provided by PwC other than those reported above under “Audit Fees,” “Audit-Related Fees,” and “Tax Fees” above.
There were no amounts that were approved by the Audit Committee pursuant to the de minimus exception (Rule 2-01(c)(7) of Regulation S-X) for the fiscal years ended October 31, 2016 and 2015.
Non-Audit Services to the Fund’s Service Affiliates that were Pre-Approved by the Fund’s Audit Committee
The Fund’s Audit Committee is required to pre-approve non-audit services which meet both the following criteria:
| i) | Directly relate to the Fund’s operations and financial reporting; and |
| ii) | Rendered by PwC to the Fund’s advisor, Manning & Napier Advisors, LLC, and entities in a control relationship with the advisor (“service affiliate”) that provide ongoing services to the Fund. For purposes of disclosure, Manning & Napier Investor Services, Inc. is considered to be a service affiliate. |
| 2016 | 2015 | |||||||
Audit Related Fees | $1,944 | $1,944 | ||||||
Tax Fees | $0 | $0 | ||||||
| $1,944 | $1,944 | |||||||
The Audit Related fees for the years ended October 31, 2016 and 2015 were for a license for proprietary authoritative financial reporting and assurance literature library software.
There were no amounts that were approved by the Audit Committee pursuant to the de minimus exception (Rule 2-01(c)(7) of Regulation S-X) for the fiscal years ended October 31, 2016 and 2015.
Aggregate Fees
Aggregate fees billed to the Fund for non-audit services for 2016 and 2015 were $587,548 and $600,129, respectively. Aggregate fees billed to the Fund’s advisor and service affiliates for non-audit services were $1,944 and $1,944, respectively. These amounts include fees for non-audit services required to be pre-approved and fees for non-audit services that did not require pre-approval since they did not relate to the Fund’s operations and financial reporting.
The Fund’s Audit Committee has considered whether the provisions for non-audit services to the Fund’s advisor and service affiliates, which did not require pre-approval, are compatible with maintaining PwC’s independence.
ITEM 5: AUDIT COMMITTEE OF LISTED REGISTRANTS
Not applicable.
ITEM 6: INVESTMENTS
| (a) | See Investment Portfolios under Item 1 on this Form N-CSR. |
| (b) | Not applicable. |
| ITEM 7: | DISCLOSURE OF PROXY VOTING POLICIES AND PROCEDURES FOR CLOSED- END MANAGEMENT INVESTMENT COMPANIES |
Not applicable.
| ITEM 8: | PORTFOLIO MANAGERS OF CLOSED-END MANAGEMENT INVESTMENT COMPANIES |
Not applicable.
| ITEM 9: | PURCHASES OF EQUITY SECURITIES BY CLOSED-END MANAGEMENT INVESTMENT COMPANY AND AFFILIATED PURCHASERS |
Not applicable.
| ITEM 10: | SUBMISSION OF MATTERS TO A VOTE OF SECURITY HOLDERS |
There have been no material changes to the procedure by which shareholders may recommend nominees to the registrant’s board of directors.
| ITEM 11: | CONTROLS AND PROCEDURES |
(a) Based on their evaluation of the Funds’ disclosure controls and procedures, as of a date within 90 days of the filing date, the Funds’ Principal Executive Officer and Principal Financial Officer have concluded that the Funds’ disclosure controls and procedures are: (i) reasonably designed to ensure that information required to be disclosed in this report is appropriately communicated to the Funds’ officers to allow timely decisions regarding disclosures required in this report; (ii) reasonably designed to ensure that information required to be disclosed in this report is recorded, processed, summarized and reported in a timely manner; and (iii) are effective in achieving the goals described in (i) and (ii) above.
(b) During the second fiscal quarter of the period covered by this report, there have been no changes in the Funds’ internal control over financial reporting that the above officers believe to have materially affected, or to be reasonably likely to materially affect, the Funds’ internal control over financial reporting.
| ITEM 12: | EXHIBITS |
| (a)(1) | Code of ethics that is subject to the disclosure of Item 2 above. |
| (a)(2) | Separate certifications for the Registrant’s principal executive officer and principal financial officer, as required by Section 302 of the Sarbanes-Oxley Act of 2002 and Rule 30a-2(a) under the Investment Company Act of 1940, are attached as EX-99.CERT. |
| (a)(3) | Not applicable. |
| (b) | A certification of the Registrant’s principal executive officer and principal financial officer, as required by 18 U.S.C Section 1350, as adopted pursuant to Section 906 of the Sarbanes-Oxley Act of 2002, and Rule 30a-2(b) under the Investment Company Act of 1940, is attached as EX- 99.906CERT. The certification furnished pursuant to this paragraph is not deemed to be “filed” for purposes of Section 18 of the Securities Exchange Act of 1934, or otherwise subject to the liability of that section. Such certification is not deemed to be incorporated by reference into any filing under the Securities Act of 1933 or the Securities Exchange Act of 1934, except to the extent that the Registrant specifically incorporates them by reference. |
| (12.other) | Not applicable. |
SIGNATURES
Pursuant to the requirements of the Securities Exchange Act of 1934 and the Investment Company Act of 1940, the registrant has duly caused this report to be signed on its behalf by the undersigned, thereunto duly authorized.
Manning & Napier Fund, Inc.
| /s/ Michele T. Mosca | ||
| Michele T. Mosca | ||
| President & Principal Executive Officer of Manning & Napier Fund, Inc. | ||
| Date 12/13/2016 | ||
Pursuant to the requirements of the Securities Exchange Act of 1934 and the Investment Company Act of 1940, this report has been signed below by the following persons on behalf of the registrant and in the capacities and on the dates indicated.
| /s/ Michele T. Mosca | ||
| Michele T. Mosca | ||
| President & Principal Executive Officer of Manning & Napier Fund, Inc. | ||
| Date 12/13/2016 | ||
| /s/ Christine Glavin | ||
| Christine Glavin | ||
| Chief Financial Officer & Principal Financial Officer of Manning & Napier Fund, Inc. | ||
| Date 12/13/2016 | ||